UNITED STATES
SECURITIES AND EXCHANGE COMMISSION
Washington, D.C. 20549
FORM N-CSR
CERTIFIED SHAREHOLDER REPORT OF REGISTERED MANAGEMENT INVESTMENT COMPANIES
Investment Company Act file number: 811-08629
HARTFORD SERIES FUND, INC.
(Exact name of registrant as specified in charter)
P.O. Box 2999, Hartford, Connecticut 06104-2999
(Address of Principal Executive Offices) (Zip Code)
Edward P. Macdonald, Esquire
Hartford Funds Management Company, LLC
5 Radnor Corporate Center, Suite 300
100 Matsonford Road
Radnor, PA 19087
(Name and Address of Agent for Service)
Registrant’s telephone number, including area code: (860) 843-9934
Date of fiscal year end: December 31st
Date of reporting period: January 1, 2013 to June 30, 2013
Form N-CSR is to be used by management investment companies to file reports with the Commission not later than 10 days after the transmission to stockholders of any report that is required to be transmitted to stockholders under Rule 30e-1 under the Investment Company Act of 1940 (17 CFR 270.30e-1). The Commission may use the information provided on Form N-CSR in its regulatory, disclosure review, inspection, and policymaking roles.
A registrant is required to disclose the information specified by Form N-CSR, and the Commission will make this information public. A registrant is not required to respond to the collection of information contained in Form N-CSR unless the Form displays a currently valid Office of Management and Budget ("OMB") control number. Please direct comments concerning the accuracy of the information collection burden estimate and any suggestions for reducing the burden to Secretary, Securities and Exchange Commission, 100 F Street, NE, Washington, DC 20549. The OMB has reviewed this collection of information under the clearance requirements of 44 U.S.C. § 3507.
Item 1. Reports to Stockholders.
HARTFORDFUNDS
 | HARTFORD SERIES FUND, INC.
2013 Semi Annual Report
|

A MESSAGE FROM THE PRESIDENT
Dear Fellow Shareholders:
I want to take this opportunity to say thank you for investing in the Hartford HLS Funds.
Market Review
During the first half of the year, stocks rose steadily. U.S. equities (as represented by the S&P 500 Index1) posted a strong gain of 10.61% during the first quarter, on their way to an all-time high. During the second quarter, investors persevered through volatility surrounding rumors of the rollback of the U.S. Federal Reserve’s quantitative easing (QE) program later this year, and the S&P 500 Index rose 2.91%. That brought the market’s rise to 13.82% for the first half of 2013. The rumors about QE’s end sent bond yields and mortgage rates upward, but that wasn’t enough to dissuade investors from pushing equities into positive territory.
Because of QE, some have expressed concerns regarding the recent market rally. But a more careful examination of economic data reveals a strong foundation. Consumer balance sheets have improved since the financial crisis, with consumer debt as a percentage of income falling steadily. Housing continued its dogged recovery, fueled by population growth and pent-up demand. In fact, it’s substantive economic improvements that have moved Federal Reserve Chairman Ben Bernanke to consider removing the “training wheels” of QE, which we think should be viewed as a vote of confidence in the U.S. economy going forward.
As the U.S. outlook continues to improve, concerns do remain in the global economy. Emerging markets have lagged due to social unrest and rising inflation. Slowing growth in China is clouding global growth forecasts, but it’s important to remember that China still boasts 7.5% annual GDP growth.
It’s important to stay abreast of domestic and international economic developments while balancing your individual investment goals. Meeting with your financial advisor on a regular basis to examine your current investment strategy can help you determine whether you are on the right track:
| • | Is your portfolio fully diversified with an appropriate mix of stocks and bonds? |
| • | Is your fixed-income portfolio positioned to take advantage of opportunities across the credit spectrum and fulfill your income needs? |
| • | Is your portfolio still in line with your risk tolerance and investment time horizon? |
Your financial professional can help you choose options within our fund family to navigate today’s markets with confidence.
Thank you again for investing with the Hartford HLS Funds.

James Davey
President
Hartford HLS Funds
1 The S&P 500 Index is a market capitalization-weighted price index composed of 500 widely held common stocks.
Table of Contents
This report is prepared for the general information of contract owners and is not an offer of contracts. It should not be used in connection with any offer, except in conjunction with the appropriate product prospectus which contains all pertinent product information including the applicable sales, administrative and other charges.
| American Funds Asset Allocation HLS Fund inception 4/30/2008 | |
| (advised by Hartford Funds Management Company, LLC) | |
| Investment Goal: Seeks high total return (including income and capital gains) consistent with preservation of capital over the long term. |
Performance Overview 4/30/08 - 6/30/13
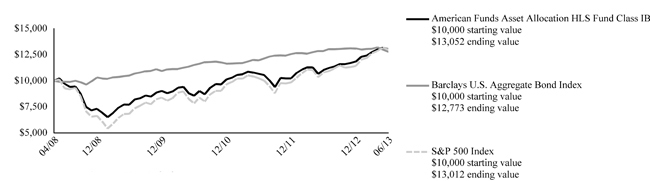
The chart above represents the hypothetical growth of a $10,000 investment in Class IB.
| Average Annual Total Returns (as of 6/30/13) |
| 6 Month† | 1 Year | 5 Years | Since Inception▲ | |||||||||||||
| American Funds Asset Allocation HLS Fund IB | 10.11% | 18.37% | 6.06% | 5.29% | ||||||||||||
| Barclays U.S. Aggregate Bond Index | -2.44% | -0.69% | 5.19% | 4.85% | ||||||||||||
| S&P 500 Index | 13.82% | 20.58% | 7.00% | 5.23% | ||||||||||||
| † | Not Annualized |
| ▲ | Inception: 04/30/2008 |
PERFORMANCE DATA QUOTED REPRESENTS PAST PERFORMANCE AND DOES NOT GUARANTEE FUTURE RESULTS. The investment return and principal value of the investment will fluctuate so that investors’ shares, when redeemed, may be worth more or less than their original cost. Current performance may be lower or higher than the performance data quoted. To obtain performance data current to the most recent month-end, please visit our website www.hartfordfunds.com.
Total returns presented above were calculated using the Fund’s net asset value available to shareholders for sale or redemption of Fund shares on June 30, 2013, which may exclude investment transactions as of this date. All share class returns assume the reinvestment of all distributions at net asset value and the deduction of all fund expenses.
Barclays U.S. Aggregate Bond Index represents the U.S. investment-grade fixed-rate bond market. This index is unmanaged, and its results include reinvested dividends and/or distributions, but do not reflect the effect of sales charges, commissions, expenses or taxes.
S&P 500 Index is a market capitalization-weighted price index composed of 500 widely held common stocks.
You cannot invest directly in an index.
As of the Fund’s current prospectus dated May 1, 2013, the net total annual operating expense ratio for Class IB shares was 0.86% and the gross total annual operating expense ratio for Class IB shares was 1.26%. Actual expenses may be higher. Please see the accompanying Financial Highlights for expense ratios for the six-month period ended June 30, 2013.
Net operating expenses are the expenses paid to own the Fund. If the net operating expenses shown are lower than the gross operating expenses, then the net operating expenses reflect contractual fee waivers and expense reimbursements that may not be renewed. Contractual waivers or reimbursements remain in effect for as long as the Fund is a part of a master-feeder fund structure unless terminated or changed by the Fund or its Board of Directors if the fund structure changes. For more information about the fee arrangement and expiration dates, please see the expense table in the prospectus.
Gross operating expenses shown are before management fee waivers or expense caps. Performance information may reflect historical or current expense waivers or reimbursements, without which, performance would have been lower. For more information on fee waivers and/or expense reimbursements, please see the expense table in the prospectus.
The chart and table do not reflect the deductions of taxes, sales charges or other fees which may be applied at the variable life insurance, variable annuity or qualified retirement plan product level. Any such additional sales charges or other fees or expenses would lower the contract’s or plan’s performance.
All investments are subject to risk including the possible loss of principal. For a discussion of the Fund’s risks, please see the Principal Risks section. For more detailed information on the risks associated with an investment in the Fund, please see the prospectus.
How did the Fund perform?
The Class IB Shares of the American Funds Asset Allocation HLS Fund returned 10.11% for the six-month period ended June 30, 2013, versus the returns of 13.82% for the S&P 500 Index and -2.44% for the Barclays U.S. Aggregate Bond Index. The Fund outperformed the 6.60% average return of the Lipper Mixed Asset Target Allocation Growth Funds Variable Products-Underlying Funds peer group, a group of funds with investment strategies similar to those of the Fund.
The performance of the American Funds Asset Allocation HLS Fund is directly related to the performance of the American Funds Insurance Series – Asset Allocation Fund Class 1, in which the Fund invests. The financial statements of the American Funds Insurance Series – Asset Allocation Fund Class 1, including the Schedule of Investments, are provided in the accompanying report and should be read in conjunction with the American Funds Asset Allocation HLS Fund’s financial statements.
| 2 |
| American Funds Blue Chip Income and Growth HLS Fund inception 4/30/2008 | |
| (advised by Hartford Funds Management Company, LLC) | |
| Investment Goal: Seeks to produce income exceeding the average yield on U.S. stocks generally and to provide an opportunity for growth of principal consistent with sound common stock investing. |
Performance Overview 4/30/08 - 6/30/13
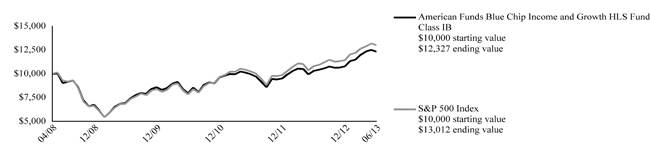
The chart above represents the hypothetical growth of a $10,000 investment in Class IB.
Average Annual Total Returns (as of 6/30/13)
| 6 Month† | 1 Year | 5 years | Since Inception▲ | |||||||||||||
| American Funds Blue Chip Income and Growth HLS Fund IB | 14.29% | 19.79% | 6.47% | 4.13% | ||||||||||||
| S&P 500 Index | 13.82% | 20.58% | 7.00% | 5.23% | ||||||||||||
| † | Not Annualized |
| ▲ | Inception: 04/30/2008 |
PERFORMANCE DATA QUOTED REPRESENTS PAST PERFORMANCE AND DOES NOT GUARANTEE FUTURE RESULTS. The investment return and principal value of the investment will fluctuate so that investors’ shares, when redeemed, may be worth more or less than their original cost. Current performance may be lower or higher than the performance data quoted. To obtain performance data current to the most recent month-end, please visit our website www.hartfordfunds.com.
Total returns presented above were calculated using the Fund’s net asset value available to shareholders for sale or redemption of Fund shares on June 30, 2013, which may exclude investment transactions as of this date. All share class returns assume the reinvestment of all distributions at net asset value and the deduction of all fund expenses.
S&P 500 Index is a market capitalization-weighted price index composed of 500 widely held common stocks.
You cannot invest directly in an index.
As of the Fund's current prospectus dated May 1, 2013, the net total annual operating expense ratio for Class IB shares was 1.00% and the gross total annual operating expense ratio for Class IB shares was 1.50%. Actual expenses may be higher. Please see the accompanying Financial Highlights for expense ratios for the six-month period ended June 30, 2013.
Net operating expenses are the expenses paid to own the Fund. If the net operating expenses shown are lower than the gross operating expenses, then the net operating expenses reflect contractual fee waivers and expense reimbursements that may not be renewed. Contractual waivers or reimbursements remain in effect for as long as the Fund is a part of a master-feeder fund structure unless terminated or changed by the Fund or its Board of Directors if the fund structure changes. For more information about the fee arrangement and expiration dates, please see the expense table in the prospectus.
Gross operating expenses shown are before management fee waivers or expense caps. Performance information may reflect historical or current expense waivers or reimbursements, without which, performance would have been lower. For more information on fee waivers and/or expense reimbursements, please see the expense table in the prospectus.
The chart and table do not reflect the deductions of taxes, sales charges or other fees which may be applied at the variable life insurance, variable annuity or qualified retirement plan product level. Any such additional sales charges or other fees or expenses would lower the contract’s or plan’s performance.
All investments are subject to risk including the possible loss of principal. For a discussion of the Fund’s risks, please see the Principal Risks section. For more detailed information on the risks associated with an investment in the Fund, please see the prospectus.
How did the Fund perform?
The Class IB Shares of the American Funds Blue Chip Income and Growth HLS Fund returned 14.29% for the six-month period ended June 30, 2013, versus the return of 13.82% for the S&P 500 Index. The Fund outperformed the 13.60% average return of the Lipper Large-Cap Core Funds Variable Products-Underlying Funds peer group, a group of funds with investment strategies similar to those of the Fund.
The performance of the American Funds Blue Chip Income and Growth HLS Fund is directly related to the performance of the American Funds Insurance Series – Blue Chip Income and Growth Fund Class 1, in which the Fund invests. The financial statements of the American Funds Insurance Series – Blue Chip Income and Growth Fund Class 1, including the Schedule of Investments, are provided in the accompanying report and should be read in conjunction with the American Funds Blue Chip Income and Growth HLS Fund’s financial statements.
| 3 |
| American Funds Bond HLS Fund inception 4/30/2008 | |
| (advised by Hartford Funds Management Company, LLC) | |
| Investment Goal: Seeks to maximize current income and preservation of capital. |
Performance Overview 4/30/08 - 6/30/13
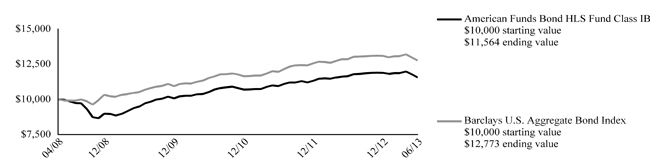
The chart above represents the hypothetical growth of a $10,000 investment in Class IB.
Average Annual Total Returns (as of 6/30/13)
| 6 Month† | 1 Year | 5 years | Since Inception▲ | |||||||||||||
| American Funds Bond HLS Fund IB | -2.74% | -0.74% | 3.21% | 2.85% | ||||||||||||
| Barclays U.S. Aggregate Bond Index | -2.44% | -0.69% | 5.19% | 4.85% | ||||||||||||
| † | Not Annualized |
| ▲ | Inception: 04/30/2008 |
PERFORMANCE DATA QUOTED REPRESENTS PAST PERFORMANCE AND DOES NOT GUARANTEE FUTURE RESULTS. The investment return and principal value of the investment will fluctuate so that investors’ shares, when redeemed, may be worth more or less than their original cost. Current performance may be lower or higher than the performance data quoted. To obtain performance data current to the most recent month-end, please visit our website www.hartfordfunds.com.
Total returns presented above were calculated using the Fund’s net asset value available to shareholders for sale or redemption of Fund shares on June 30, 2013, which may exclude investment transactions as of this date. All share class returns assume the reinvestment of all distributions at net asset value and the deduction of all fund expenses.
Barclays U.S. Aggregate Bond Index represents the U.S. investment-grade fixed-rate bond market. This index is unmanaged, and its results include reinvested dividends and/or distributions, but do not reflect the effect of sales charges, commissions, expenses or taxes.
You cannot invest directly in an index.
As of the Fund's current prospectus dated May 1, 2013, the net total annual operating expense ratio for Class IB shares was 0.93% and the gross total annual operating expense ratio for Class IB shares was 1.18%. Actual expenses may be higher. Please see the accompanying Financial Highlights for expense ratios for the six-month period ended June 30, 2013.
Net operating expenses are the expenses paid to own the Fund. If the net operating expenses shown are lower than the gross operating expenses, then the net operating expenses reflect contractual fee waivers and expense reimbursements that may not be renewed. Contractual waivers or reimbursements remain in effect for as long as the Fund is a part of a master-feeder fund structure unless terminated or changed by the Fund or its Board of Directors if the fund structure changes. For more information about the fee arrangement and expiration dates, please see the expense table in the prospectus.
Gross operating expenses shown are before management fee waivers or expense caps. Performance information may reflect historical or current expense waivers or reimbursements, without which, performance would have been lower. For more information on fee waivers and/or expense reimbursements, please see the expense table in the prospectus.
The chart and table do not reflect the deductions of taxes, sales charges or other fees which may be applied at the variable life insurance, variable annuity or qualified retirement plan product level. Any such additional sales charges or other fees or expenses would lower the contract’s or plan’s performance.
All investments are subject to risk including the possible loss of principal. For a discussion of the Fund’s risks, please see the Principal Risks section. For more detailed information on the risks associated with an investment in the Fund, please see the prospectus.
How did the Fund perform?
The Class IB Shares of the American Funds Bond HLS Fund returned -2.74% for the six-month period ended June 30, 2013, versus the return of -2.44% for the Barclays U.S. Aggregate Bond Index. The Fund underperformed the -2.55% average return of the Lipper Intermediate Investment Grade Debt Funds Variable Products-Underlying Funds peer group, a group of funds with investment strategies similar to those of the Fund.
The performance of the American Funds Bond HLS Fund is directly related to the performance of the American Funds Insurance Series – Bond Fund Class 1, in which the Fund invests. The financial statements of the American Funds Insurance Series – Bond Fund Class 1, including the Schedule of Investments, are provided in the accompanying report and should be read in conjunction with the American Funds Bond HLS Fund’s financial statements.
| 4 |
| American Funds Global Bond HLS Fund inception 4/30/2008 | |
| (advised by Hartford Funds Management Company, LLC) | |
| Investment Goal: Seeks a high level of total return over the long term. |
Performance Overview 4/30/08 - 6/30/13
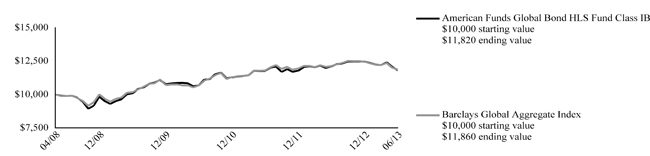
The chart above represents the hypothetical growth of a $10,000 investment in Class IB.
Average Annual Total Returns (as of 6/30/13)
| 6 Month† | 1 Year | 5 years | Since Inception▲ | |||||||||||||
| American Funds Global Bond HLS Fund IB | -5.22% | -2.34% | 3.64% | 3.29% | ||||||||||||
| Barclays Global Aggregate Index | -4.82% | -2.18% | 3.68% | 3.35% | ||||||||||||
| † | Not Annualized |
| ▲ | Inception: 04/30/2008 |
PERFORMANCE DATA QUOTED REPRESENTS PAST PERFORMANCE AND DOES NOT GUARANTEE FUTURE RESULTS. The investment return and principal value of the investment will fluctuate so that investors’ shares, when redeemed, may be worth more or less than their original cost. Current performance may be lower or higher than the performance data quoted. To obtain performance data current to the most recent month-end, please visit our website www.hartfordfunds.com.
Total returns presented above were calculated using the Fund’s net asset value available to shareholders for sale or redemption of Fund shares on June 30, 2013, which may exclude investment transactions as of this date. All share class returns assume the reinvestment of all distributions at net asset value and the deduction of all fund expenses.
Barclays Global Aggregate Index represents the global investment-grade fixed-income markets. This index is unmanaged and its results include reinvested dividends and/or distributions, but do not reflect the effect of sales charges, commissions, expenses or taxes.
You cannot invest directly in an index.
As of the Fund's current prospectus dated May 1, 2013, the net total annual operating expense ratio for Class IB shares was 1.13% and the gross total annual operating expense ratio for Class IB shares was 1.63%. Actual expenses may be higher. Please see the accompanying Financial Highlights for expense ratios for the six-month period ended June 30, 2013.
Net operating expenses are the expenses paid to own the Fund. If the net operating expenses shown are lower than the gross operating expenses, then the net operating expenses reflect contractual fee waivers and expense reimbursements that may not be renewed. Contractual waivers or reimbursements remain in effect for as long as the Fund is a part of a master-feeder fund structure unless terminated or changed by the Fund or its Board of Directors if the fund structure changes. For more information about the fee arrangement and expiration dates, please see the expense table in the prospectus.
Gross operating expenses shown are before management fee waivers or expense caps. Performance information may reflect historical or current expense waivers or reimbursements, without which, performance would have been lower. For more information on fee waivers and/or expense reimbursements, please see the expense table in the prospectus.
The chart and table do not reflect the deductions of taxes, sales charges or other fees which may be applied at the variable life insurance, variable annuity or qualified retirement plan product level. Any such additional sales charges or other fees or expenses would lower the contract’s or plan’s performance.
All investments are subject to risk including the possible loss of principal. For a discussion of the Fund’s risks, please see the Principal Risks section. For more detailed information on the risks associated with an investment in the Fund, please see the prospectus.
How did the Fund perform?
The Class IB Shares of the American Funds Global Bond HLS Fund returned -5.22% for the six-month period ended June 30, 2013, versus the return of -4.82% for the Barclays Global Aggregate Index. The Fund underperformed the -4.62% average return of the Lipper Global Income Funds Variable Products-Underlying Funds peer group, a group of funds with investment strategies similar to those of the Fund.
The performance of the American Funds Global Bond HLS Fund is directly related to the performance of the American Funds Insurance Series – Global Bond Fund Class 1, in which the Fund invests. The financial statements of the American Funds Insurance Series – Global Bond Fund Class 1, including the Schedule of Investments, are provided in the accompanying report and should be read in conjunction with the American Funds Global Bond HLS Fund’s financial statements.
| 5 |
| American Funds Global Growth and Income HLS Fund inception 4/30/2008 | |
| (advised by Hartford Funds Management Company, LLC) | |
| Investment Goal: Seeks growth of capital over time and current income. |
Performance Overview 4/30/08 - 6/30/13
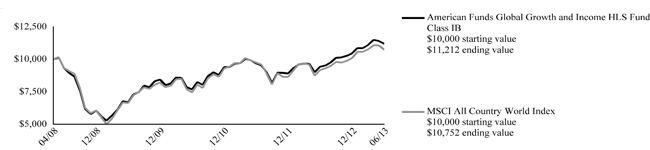
The chart above represents the hypothetical growth of a $10,000 investment in Class IB.
Average Annual Total Returns (as of 6/30/13)
| 6 Month† | 1 Year | 5 years | Since Inception▲ | |||||||||||||
| American Funds Global Growth and Income HLS Fund IB | 7.20% | 19.10% | 3.73% | 2.24% | ||||||||||||
| MSCI All Country World Index | 6.38% | 17.21% | 2.86% | 1.41% | ||||||||||||
| † | Not Annualized |
| ▲ | Inception: 04/30/2008 |
PERFORMANCE DATA QUOTED REPRESENTS PAST PERFORMANCE AND DOES NOT GUARANTEE FUTURE RESULTS. The investment return and principal value of the investment will fluctuate so that investors’ shares, when redeemed, may be worth more or less than their original cost. Current performance may be lower or higher than the performance data quoted. To obtain performance data current to the most recent month-end, please visit our website www.hartfordfunds.com.
Total returns presented above were calculated using the Fund’s net asset value available to shareholders for sale or redemption of Fund shares on June 30, 2013, which may exclude investment transactions as of this date. All share class returns assume the reinvestment of all distributions at net asset value and the deduction of all fund expenses.
MSCI All Country World Index is a free float-adjusted market capitalization index that is designed to measure equity market performance in the global developed and emerging markets, consisting of more than 40 developed and emerging market country indices. This index is unmanaged, and its results include reinvested dividends and/or distributions, but do not reflect the effect of sales charges, commissions, expenses or taxes.
You cannot invest directly in an index.
As of the Fund's current prospectus dated May 1, 2013, the net total annual operating expense ratio for Class IB shares was 1.17% and the gross total annual operating expense ratio for Class IB shares was 1.72%. Actual expenses may be higher. Please see the accompanying Financial Highlights for expense ratios for the six-month period ended June 30, 2013.
Net operating expenses are the expenses paid to own the Fund. If the net operating expenses shown are lower than the gross operating expenses, then the net operating expenses reflect contractual fee waivers and expense reimbursements that may not be renewed. Contractual waivers or reimbursements remain in effect for as long as the Fund is a part of a master-feeder fund structure unless terminated or changed by the Fund or its Board of Directors if the fund structure changes. For more information about the fee arrangement and expiration dates, please see the expense table in the prospectus.
Gross operating expenses shown are before management fee waivers or expense caps. Performance information may reflect historical or current expense waivers or reimbursements, without which, performance would have been lower. For more information on fee waivers and/or expense reimbursements, please see the expense table in the prospectus.
The chart and table do not reflect the deductions of taxes, sales charges or other fees which may be applied at the variable life insurance, variable annuity or qualified retirement plan product level. Any such additional sales charges or other fees or expenses would lower the contract’s or plan’s performance.
All investments are subject to risk including the possible loss of principal. For a discussion of the Fund’s risks, please see the Principal Risks section. For more detailed information on the risks associated with an investment in the Fund, please see the prospectus.
How did the Fund perform?
The Class IB Shares of the American Funds Global Growth and Income HLS Fund returned 7.20% for the six-month period ended June 30, 2013, versus the return of 6.38% for the MSCI All Country World Index. The Fund underperformed the 7.31% average return of the Lipper Global Growth Funds Variable Products-Underlying Funds peer group, a group of funds with investment strategies similar to those of the Fund.
The performance of the American Funds Global Growth and Income HLS Fund is directly related to the performance of the American Funds Insurance Series – Global Growth and Income Fund Class 1, in which the Fund invests. The financial statements of the American Funds Insurance Series – Global Growth and Income Fund Class 1, including the Schedule of Investments, are provided in the accompanying report and should be read in conjunction with the American Funds Global Growth and Income HLS Fund’s financial statements.
| 6 |
| American Funds Global Growth HLS Fund inception 4/30/2008 | |
| (advised by Hartford Funds Management Company, LLC) | |
| Investment Goal: Seeks long-term growth of capital. |
Performance Overview 4/30/08 - 6/30/13
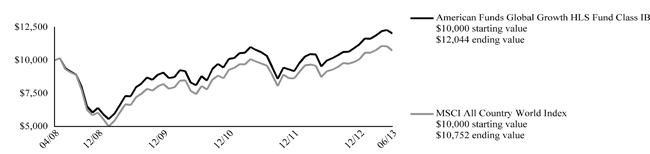
The chart above represents the hypothetical growth of a $10,000 investment in Class IB.
Average Annual Total Returns (as of 6/30/13)
| 6 Month† | 1 Year | 5 years | Since Inception▲ | |||||||||||||
| American Funds Global Growth HLS Fund IB | 7.29% | 20.53% | 5.09% | 3.66% | ||||||||||||
| MSCI All Country World Index | 6.38% | 17.21% | 2.86% | 1.41% | ||||||||||||
| † | Not Annualized |
| ▲ | Inception: 04/30/2008 |
PERFORMANCE DATA QUOTED REPRESENTS PAST PERFORMANCE AND DOES NOT GUARANTEE FUTURE RESULTS. The investment return and principal value of the investment will fluctuate so that investors’ shares, when redeemed, may be worth more or less than their original cost. Current performance may be lower or higher than the performance data quoted. To obtain performance data current to the most recent month-end, please visit our website www.hartfordfunds.com.
Total returns presented above were calculated using the Fund’s net asset value available to shareholders for sale or redemption of Fund shares on June 30, 2013, which may exclude investment transactions as of this date. All share class returns assume the reinvestment of all distributions at net asset value and the deduction of all fund expenses.
MSCI All Country World Index is a free float-adjusted market capitalization index that is designed to measure equity market performance in the global developed and emerging markets, consisting of more than 40 developed and emerging market country indices. This index is unmanaged, and its results include reinvested dividends and/or distributions, but do not reflect the effect of sales charges, commissions, expenses or taxes.
You cannot invest directly in an index.
As of the Fund's current prospectus dated May 1, 2013, the net total annual operating expense ratio for Class IB shares was 1.14% and the gross total annual operating expense ratio for Class IB shares was 1.89%. Actual expenses may be higher. Please see the accompanying Financial Highlights for expense ratios for the six-month period ended June 30, 2013.
Net operating expenses are the expenses paid to own the Fund. If the net operating expenses shown are lower than the gross operating expenses, then the net operating expenses reflect contractual fee waivers and expense reimbursements that may not be renewed. Contractual waivers or reimbursements remain in effect for as long as the Fund is a part of a master-feeder fund structure unless terminated or changed by the Fund or its Board of Directors if the fund structure changes. For more information about the fee arrangement and expiration dates, please see the expense table in the prospectus.
Gross operating expenses shown are before management fee waivers or expense caps. Performance information may reflect historical or current expense waivers or reimbursements, without which, performance would have been lower. For more information on fee waivers and/or expense reimbursements, please see the expense table in the prospectus.
The chart and table do not reflect the deductions of taxes, sales charges or other fees which may be applied at the variable life insurance, variable annuity or qualified retirement plan product level. Any such additional sales charges or other fees or expenses would lower the contract’s or plan’s performance.
All investments are subject to risk including the possible loss of principal. For a discussion of the Fund’s risks, please see the Principal Risks section. For more detailed information on the risks associated with an investment in the Fund, please see the prospectus.
How did the Fund perform?
The Class IB Shares of the American Funds Global Growth HLS Fund returned 7.29% for the six-month period ended June 30, 2013, versus the return of 6.38% for the MSCI All Country World Index. The Fund underperformed the 8.05% average return of the Lipper Global Core Funds Variable Products-Underlying Funds peer group, a group of funds with investment strategies similar to those of the Fund.
The performance of the American Funds Global Growth HLS Fund is directly related to the performance of the American Funds Insurance Series – Global Growth Fund Class 1, in which the Fund invests. The financial statements of the American Funds Insurance Series – Global Growth Fund Class 1, including the Schedule of Investments, are provided in the accompanying report and should be read in conjunction with the American Funds Global Growth HLS Fund’s financial statements.
| 7 |
| American Funds Global Small Capitalization HLS Fund inception 4/30/2008 | |
| (advised by Hartford Funds Management Company, LLC) | |
Investment Goal: Seeks growth of capital over time. |
Performance Overview 4/30/08 - 6/30/13
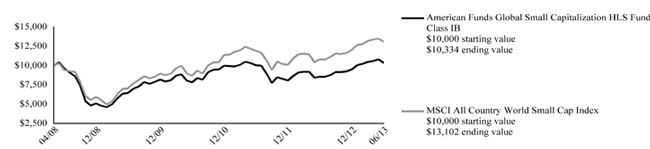
The chart above represents the hypothetical growth of a $10,000 investment in Class IB.
Average Annual Total Returns (as of 6/30/13)
| 6 Month† | 1 Year | 5 years | Since Inception▲ | |||||||||||||
| American Funds Global Small Capitalization HLS Fund IB | 8.78% | 20.85% | 1.44% | 0.64% | ||||||||||||
| MSCI All Country World Small Cap Index | 9.02% | 21.22% | 6.79% | 5.37% | ||||||||||||
| † | Not Annualized |
| ▲ | Inception: 04/30/2008 |
PERFORMANCE DATA QUOTED REPRESENTS PAST PERFORMANCE AND DOES NOT GUARANTEE FUTURE RESULTS. The investment return and principal value of the investment will fluctuate so that investors’ shares, when redeemed, may be worth more or less than their original cost. Current performance may be lower or higher than the performance data quoted. To obtain performance data current to the most recent month-end, please visit our website www.hartfordfunds.com.
Total returns presented above were calculated using the Fund’s net asset value available to shareholders for sale or redemption of Fund shares on June 30, 2013, which may exclude investment transactions as of this date. All share class returns assume the reinvestment of all distributions at net asset value and the deduction of all fund expenses.
MSCI All Country World Small Cap Index is a free float-adjusted market capitalization-weighted index that is designed to measure equity market performance of smaller capitalization companies in both developed and emerging markets. This index is unmanaged and its results include reinvested dividends and/or distributions, but do not reflect the effect of sales charges, commissions, expenses or taxes.
You cannot invest directly in an index.
As of the Fund's current prospectus dated May 1, 2013, the net total annual operating expense ratio for Class IB shares was 1.31% and the gross total annual operating expense ratio for Class IB shares was 1.86%. Actual expenses may be higher. Please see the accompanying Financial Highlights for expense ratios for the six-month period ended June 30, 2013.
Net operating expenses are the expenses paid to own the Fund. If the net operating expenses shown are lower than the gross operating expenses, then the net operating expenses reflect contractual fee waivers and expense reimbursements that may not be renewed. Contractual waivers or reimbursements remain in effect for as long as the Fund is a part of a master-feeder fund structure unless terminated or changed by the Fund or its Board of Directors if the fund structure changes. For more information about the fee arrangement and expiration dates, please see the expense table in the prospectus.
Gross operating expenses shown are before management fee waivers or expense caps. Performance information may reflect historical or current expense waivers or reimbursements, without which, performance would have been lower. For more information on fee waivers and/or expense reimbursements, please see the expense table in the prospectus.
The chart and table do not reflect the deductions of taxes, sales charges or other fees which may be applied at the variable life insurance, variable annuity or qualified retirement plan product level. Any such additional sales charges or other fees or expenses would lower the contract’s or plan’s performance.
All investments are subject to risk including the possible loss of principal. For a discussion of the Fund’s risks, please see the Principal Risks section. For more detailed information on the risks associated with an investment in the Fund, please see the prospectus.
How did the Fund perform?
The Class IB Shares of the American Funds Global Small Capitalization HLS Fund returned 8.78% for the six-month period ended June 30, 2013, versus the return of 9.02% for the MSCI All Country World Small Cap Index. The Fund outperformed the 7.31% average return of the Lipper Global Growth Funds Variable Products-Underlying Funds peer group, a group of funds with investment strategies similar to those of the Fund.
The performance of the American Funds Global Small Capitalization HLS Fund is directly related to the performance of the American Funds Insurance Series – Global Small Capitalization Fund Class 1, in which the Fund invests. The financial statements of the American Funds Insurance Series – Global Small Capitalization Fund Class 1, including the Schedule of Investments, are provided in the accompanying report and should be read in conjunction with the American Funds Global Small Capitalization HLS Fund’s financial statements.
| 8 |
| American Funds Growth HLS Fund inception 4/30/2008 | |
| (advised by Hartford Funds Management Company, LLC) | |
| Investment Goal: Seeks growth of capital. |
Performance Overview 4/30/08 - 6/30/13
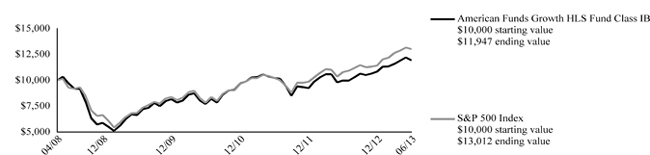
The chart above represents the hypothetical growth of a $10,000 investment in Class IB.
Average Annual Total Returns (as of 6/30/13)
| 6 Month† | 1 Year | 5 years | Since Inception▲ | |||||||||||||
| American Funds Growth HLS Fund IB | 10.04% | 19.74% | 4.25% | 3.50% | ||||||||||||
| S&P 500 Index | 13.82% | 20.58% | 7.00% | 5.23% | ||||||||||||
| † | Not Annualized |
| ▲ | Inception: 04/30/2008 |
PERFORMANCE DATA QUOTED REPRESENTS PAST PERFORMANCE AND DOES NOT GUARANTEE FUTURE RESULTS. The investment return and principal value of the investment will fluctuate so that investors’ shares, when redeemed, may be worth more or less than their original cost. Current performance may be lower or higher than the performance data quoted. To obtain performance data current to the most recent month-end, please visit our website www.hartfordfunds.com.
Total returns presented above were calculated using the Fund’s net asset value available to shareholders for sale or redemption of Fund shares on June 30, 2013, which may exclude investment transactions as of this date. All share class returns assume the reinvestment of all distributions at net asset value and the deduction of all fund expenses.
S&P 500 Index is a market capitalization-weighted price index composed of 500 widely held common stocks.
You cannot invest directly in an index.
As of the Fund's current prospectus dated May 1, 2013, the net total annual operating expense ratio for Class IB shares was 0.89% and the gross total annual operating expense ratio for Class IB shares was 1.39%. Actual expenses may be higher. Please see the accompanying Financial Highlights for expense ratios for the six-month period ended June 30, 2013.
Net operating expenses are the expenses paid to own the Fund. If the net operating expenses shown are lower than the gross operating expenses, then the net operating expenses reflect contractual fee waivers and expense reimbursements that may not be renewed. Contractual waivers or reimbursements remain in effect for as long as the Fund is a part of a master-feeder fund structure unless terminated or changed by the Fund or its Board of Directors if the fund structure changes. For more information about the fee arrangement and expiration dates, please see the expense table in the prospectus.
Gross operating expenses shown are before management fee waivers or expense caps. Performance information may reflect historical or current expense waivers or reimbursements, without which, performance would have been lower. For more information on fee waivers and/or expense reimbursements, please see the expense table in the prospectus.
The chart and table do not reflect the deductions of taxes, sales charges or other fees which may be applied at the variable life insurance, variable annuity or qualified retirement plan product level. Any such additional sales charges or other fees or expenses would lower the contract’s or plan’s performance.
All investments are subject to risk including the possible loss of principal. For a discussion of the Fund’s risks, please see the Principal Risks section. For more detailed information on the risks associated with an investment in the Fund, please see the prospectus.
How did the Fund perform?
The Class IB Shares of the American Funds Growth HLS Fund returned 10.04% for the six-month period ended June 30, 2013, versus the return of 13.82% for the S&P 500 Index. The Fund underperformed the 10.54% average return of the Lipper Large-Cap Growth Funds Variable Products-Underlying Funds peer group, a group of funds with investment strategies similar to those of the Fund.
The performance of the American Funds Growth HLS Fund is directly related to the performance of the American Funds Insurance Series – Growth Fund Class 1, in which the Fund invests. The financial statements of the American Funds Insurance Series – Growth Fund Class 1, including the Schedule of Investments, are provided in the accompanying report and should be read in conjunction with the American Funds Growth HLS Fund’s financial statements.
| 9 |
| American Funds Growth-Income HLS Fund inception 4/30/2008 | |
| (advised by Hartford Funds Management Company, LLC) | |
| Investment Goal: Seeks long-term growth of capital and income over time. |
Performance Overview 4/30/08 - 6/30/13
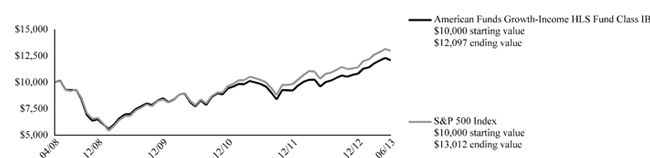
The chart above represents the hypothetical growth of a $10,000 investment in Class IB.
Average Annual Total Returns (as of 6/30/13)
| 6 Month† | 1 Year | 5 years | Since Inception▲ | |||||||||||||
| American Funds Growth-Income HLS Fund IB | 11.58% | 20.72% | 5.37% | 3.75% | ||||||||||||
| S&P 500 Index | 13.82% | 20.58% | 7.00% | 5.23% | ||||||||||||
| † | Not Annualized |
| ▲ | Inception: 04/30/2008 |
PERFORMANCE DATA QUOTED REPRESENTS PAST PERFORMANCE AND DOES NOT GUARANTEE FUTURE RESULTS. The investment return and principal value of the investment will fluctuate so that investors’ shares, when redeemed, may be worth more or less than their original cost. Current performance may be lower or higher than the performance data quoted. To obtain performance data current to the most recent month-end, please visit our website www.hartfordfunds.com.
Total returns presented above were calculated using the Fund’s net asset value available to shareholders for sale or redemption of Fund shares on June 30, 2013, which may exclude investment transactions as of this date. All share class returns assume the reinvestment of all distributions at net asset value and the deduction of all fund expenses.
S&P 500 Index is a market capitalization-weighted price index composed of 500 widely held common stocks.
You cannot invest directly in an index.
As of the Fund's current prospectus dated May 1, 2013, the net total annual operating expense ratio for Class IB shares was 0.83% and the gross total annual operating expense ratio for Class IB shares was 1.28%. Actual expenses may be higher. Please see the accompanying Financial Highlights for expense ratios for the six-month period ended June 30, 2013.
Net operating expenses are the expenses paid to own the Fund. If the net operating expenses shown are lower than the gross operating expenses, then the net operating expenses reflect contractual fee waivers and expense reimbursements that may not be renewed. Contractual waivers or reimbursements remain in effect for as long as the Fund is a part of a master-feeder fund structure unless terminated or changed by the Fund or its Board of Directors if the fund structure changes. For more information about the fee arrangement and expiration dates, please see the expense table in the prospectus.
Gross operating expenses shown are before management fee waivers or expense caps. Performance information may reflect historical or current expense waivers or reimbursements, without which, performance would have been lower. For more information on fee waivers and/or expense reimbursements, please see the expense table in the prospectus.
The chart and table do not reflect the deductions of taxes, sales charges or other fees which may be applied at the variable life insurance, variable annuity or qualified retirement plan product level. Any such additional sales charges or other fees or expenses would lower the contract’s or plan’s performance.
All investments are subject to risk including the possible loss of principal. For a discussion of the Fund’s risks, please see the Principal Risks section. For more detailed information on the risks associated with an investment in the Fund, please see the prospectus.
How did the Fund perform?
The Class IB Shares of the American Funds Growth-Income HLS Fund returned 11.58% for the six-month period ended June 30, 2013, versus the return of 13.82% for the S&P 500 Index. The Fund underperformed the 13.60% average return of the Lipper Large-Cap Core Funds Variable Products-Underlying Funds peer group, a group of funds with investment strategies similar to those of the Fund.
The performance of the American Funds Growth-Income HLS Fund is directly related to the performance of the American Funds Insurance Series – Growth-Income Fund Class 1, in which the Fund invests. The financial statements of the American Funds Insurance Series – Growth-Income Fund Class 1, including the Schedule of Investments, are provided in the accompanying report and should be read in conjunction with the American Funds Growth-Income HLS Fund’s financial statements.
| 10 |
American Funds International HLS Fund inception 4/30/2008 | |
| (advised by Hartford Funds Management Company, LLC) | |
| Investment Goal: Seeks long-term growth of capital over time. | |
Performance Overview 4/30/08 - 6/30/13
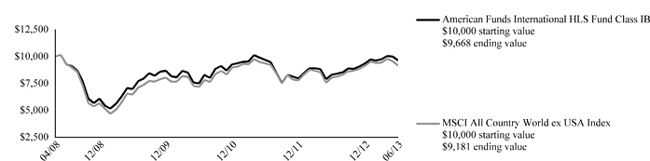
The chart above represents the hypothetical growth of a $10,000 investment in Class IB.
Average Annual Total Returns (as of 6/30/13)
| 6 Month† | 1 Year | 5 years | Since Inception▲ | |||||||||||||
| American Funds International HLS Fund IB | 3.14% | 16.28% | 0.78% | -0.65% | ||||||||||||
| MSCI All Country World ex USA Index | 0.27% | 14.14% | -0.34% | -1.64% | ||||||||||||
| † | Not Annualized |
| ▲ | Inception: 04/30/2008 |
PERFORMANCE DATA QUOTED REPRESENTS PAST PERFORMANCE AND DOES NOT GUARANTEE FUTURE RESULTS. The investment return and principal value of the investment will fluctuate so that investors’ shares, when redeemed, may be worth more or less than their original cost. Current performance may be lower or higher than the performance data quoted. To obtain performance data current to the most recent month-end, please visit our website www.hartfordfunds.com.
Total returns presented above were calculated using the Fund’s net asset value available to shareholders for sale or redemption of Fund shares on June 30, 2013, which may exclude investment transactions as of this date. All share class returns assume the reinvestment of all distributions at net asset value and the deduction of all fund expenses.
MSCI All Country World ex USA Index is a broad-based, unmanaged, market capitalization weighted, total return index that measures the performance of both developed and emerging stock markets, excluding the U.S. The index is calculated to exclude companies and share classes which cannot be freely purchased by foreigners.
You cannot invest directly in an index.
As of the Fund's current prospectus dated May 1, 2013, the net total annual operating expense ratio for Class IB shares was 1.08% and the gross total annual operating expense ratio for Class IB shares was 1.68%. Actual expenses may be higher. Please see the accompanying Financial Highlights for expense ratios for the six-month period ended June 30, 2013.
Net operating expenses are the expenses paid to own the Fund. If the net operating expenses shown are lower than the gross operating expenses, then the net operating expenses reflect contractual fee waivers and expense reimbursements that may not be renewed. Contractual waivers or reimbursements remain in effect for as long as the Fund is a part of a master-feeder fund structure unless terminated or changed by the Fund or its Board of Directors if the fund structure changes. For more information about the fee arrangement and expiration dates, please see the expense table in the prospectus.
Gross operating expenses shown are before management fee waivers or expense caps. Performance information may reflect historical or current expense waivers or reimbursements, without which, performance would have been lower. For more information on fee waivers and/or expense reimbursements, please see the expense table in the prospectus.
The chart and table do not reflect the deductions of taxes, sales charges or other fees which may be applied at the variable life insurance, variable annuity or qualified retirement plan product level. Any such additional sales charges or other fees or expenses would lower the contract’s or plan’s performance.
All investments are subject to risk including the possible loss of principal. For a discussion of the Fund’s risks, please see the Principal Risks section. For more detailed information on the risks associated with an investment in the Fund, please see the prospectus.
How did the Fund perform?
The Class IB Shares of the American Funds International HLS Fund returned 3.14% for the six-month period ended June 30, 2013, versus the return of 0.27% for the MSCI All Country World ex USA Index. The Fund underperformed the 3.18% average return of the Lipper International Core Funds Variable Products-Underlying Funds peer group, a group of funds with investment strategies similar to those of the Fund.
The performance of the American Funds International HLS Fund is directly related to the performance of the American Funds Insurance Series – International Fund Class 1, in which the Fund invests. The financial statements of the American Funds Insurance Series – International Fund Class 1, including the Schedule of Investments, are provided in the accompanying report and should be read in conjunction with the American Funds International HLS Fund’s financial statements.
| 11 |
American Funds New World HLS Fund inception 4/30/2008 | |
| (advised by Hartford Funds Management Company, LLC) | |
| Investment Goal: Seeks long-term capital appreciation. | |
Performance Overview 4/30/08 - 6/30/13
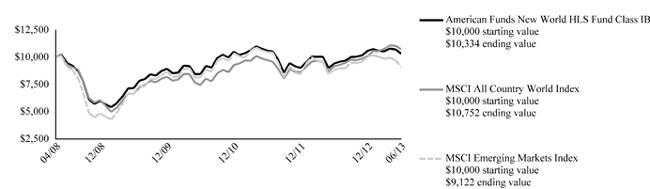
The chart above represents the hypothetical growth of a $10,000 investment in Class IB.
Average Annual Total Returns (as of 6/30/13)
| 6 Month† | 1 Year | 5 years | Since Inception▲ | |||||||||||||
| American Funds New World HLS Fund IB | -2.54% | 9.51% | 1.65% | 0.64% | ||||||||||||
| MSCI All Country World Index | 6.38% | 17.21% | 2.86% | 1.41% | ||||||||||||
| MSCI Emerging Markets Index | -9.40% | 3.23% | -0.11% | -1.76% | ||||||||||||
| † | Not Annualized |
| ▲ | Inception: 04/30/2008 |
PERFORMANCE DATA QUOTED REPRESENTS PAST PERFORMANCE AND DOES NOT GUARANTEE FUTURE RESULTS. The investment return and principal value of the investment will fluctuate so that investors’ shares, when redeemed, may be worth more or less than their original cost. Current performance may be lower or higher than the performance data quoted. To obtain performance data current to the most recent month-end, please visit our website www.hartfordfunds.com.
Total returns presented above were calculated using the Fund’s net asset value available to shareholders for sale or redemption of Fund shares on June 30, 2013, which may exclude investment transactions as of this date. All share class returns assume the reinvestment of all distributions at net asset value and the deduction of all fund expenses.
MSCI All Country World Index is a free float-adjusted market capitalization index that is designed to measure equity market performance in the global developed and emerging markets, consisting of more than 40 developed and emerging market country indices. This index is unmanaged, and its results include reinvested dividends and/or distributions, but do not reflect the effect of sales charges, commissions, expenses or taxes.
MSCI Emerging Markets Index is a free float-adjusted market capitalization-weighted index that is designed to measure equity market performance in the global emerging markets, consisting of 24 emerging market country indices. This index is unmanaged and its results include reinvested dividends and/or distributions, but do not reflect the effect of sales charges, commissions, expenses or taxes.
You cannot invest directly in an index.
As of the Fund's current prospectus dated May 1, 2013, the net total annual operating expense ratio for Class IB shares was 1.35% and the gross total annual operating expense ratio for Class IB shares was 2.20%. Actual expenses may be higher. Please see the accompanying Financial Highlights for expense ratios for the six-month period ended June 30, 2013.
Net operating expenses are the expenses paid to own the Fund. If the net operating expenses shown are lower than the gross operating expenses, then the net operating expenses reflect contractual fee waivers and expense reimbursements that may not be renewed. Contractual waivers or reimbursements remain in effect for as long as the Fund is a part of a master-feeder fund structure unless terminated or changed by the Fund or its Board of Directors if the fund structure changes. For more information about the fee arrangement and expiration dates, please see the expense table in the prospectus.
Gross operating expenses shown are before management fee waivers or expense caps. Performance information may reflect historical or current expense waivers or reimbursements, without which, performance would have been lower. For more information on fee waivers and/or expense reimbursements, please see the expense table in the prospectus.
The chart and table do not reflect the deductions of taxes, sales charges or other fees which may be applied at the variable life insurance, variable annuity or qualified retirement plan product level. Any such additional sales charges or other fees or expenses would lower the contract’s or plan’s performance.
All investments are subject to risk including the possible loss of principal. For a discussion of the Fund’s risks, please see the Principal Risks section. For more detailed information on the risks associated with an investment in the Fund, please see the prospectus.
How did the Fund perform?
The Class IB Shares of the American Funds New World HLS Fund returned -2.54% for the six-month period ended June 30, 2013, versus the returns of 6.38% for the MSCI All Country World Index and -9.40% for the MSCI Emerging Markets Index. The Fund outperformed the -8.44% average return of the Lipper Emerging Markets Funds Variable Products-Underlying Funds peer group, a group of funds with investment strategies similar to those of the Fund.
The performance of the American Funds New World HLS Fund is directly related to the performance of the American Funds Insurance Series – New World Fund Class 1, in which the Fund invests. The financial statements of the American Funds Insurance Series – New World Fund Class 1, including the Schedule of Investments, are provided in the accompanying report and should be read in conjunction with the American Funds New World HLS Fund’s financial statements.
| 12 |
| American Funds Asset Allocation HLS Fund |
| Schedule of Investments |
| June 30, 2013 (Unaudited) |
| (000’s Omitted) |
| Shares | Market Value ╪ | |||||||||||
| INVESTMENT COMPANIES - 100.0% | ||||||||||||
| 4,030 | American Funds Insurance Series - Asset Allocation Fund Class 1 | $ | 81,698 | |||||||||
| Total investment companies | ||||||||||||
| (cost $65,001) | $ | 81,698 | ||||||||||
| Total investments | ||||||||||||
| (cost $65,001) ▲ | 100.0 | % | $ | 81,698 | ||||||||
| Other assets and liabilities | — | % | (12 | ) | ||||||||
| Total net assets | 100.0 | % | $ | 81,686 | ||||||||
| Note: | Percentage of investments as shown is the ratio of the total market value to total net assets. |
| ▲ | At June 30, 2013, the cost of securities for federal income tax purposes was $66,832 and the aggregate gross unrealized appreciation and depreciation based on that cost were: |
| Unrealized Appreciation | $ | 14,866 | ||
| Unrealized Depreciation | — | |||
| Net Unrealized Appreciation | $ | 14,866 |
| ╪ | See Significant Accounting Policies of accompanying Notes to Financial Statements regarding valuation of securities. |
| At June 30, 2013, the investment valuation hierarchy levels were: | ||||
| Assets: | ||||
| Investment in Securities - Level 1 | $ | 81,698 | ||
| Total | $ | 81,698 | ||
| American Funds Blue Chip Income and Growth HLS Fund |
| Schedule of Investments |
| June 30, 2013 (Unaudited) |
| (000’s Omitted) |
| Shares | Market Value ╪ | |||||||||||
| INVESTMENT COMPANIES - 100.0% | ||||||||||||
| 3,757 | American Funds Insurance Series - Blue Chip Income and Growth Fund Class 1 | $ | 43,097 | |||||||||
| Total investment companies | ||||||||||||
| (cost $32,776) | $ | 43,097 | ||||||||||
| Total investments | ||||||||||||
| (cost $32,776) ▲ | 100.0 | % | $ | 43,097 | ||||||||
| Other assets and liabilities | — | % | (11 | ) | ||||||||
| Total net assets | 100.0 | % | $ | 43,086 | ||||||||
| Note: | Percentage of investments as shown is the ratio of the total market value to total net assets. |
| ▲ | At June 30, 2013, the cost of securities for federal income tax purposes was $33,775 and the aggregate gross unrealized appreciation and depreciation based on that cost were: |
| Unrealized Appreciation | $ | 9,322 | ||
| Unrealized Depreciation | — | |||
| Net Unrealized Appreciation | $ | 9,322 |
| ╪ | See Significant Accounting Policies of accompanying Notes to Financial Statements regarding valuation of securities. |
| At June 30, 2013, the investment valuation hierarchy levels were: | ||||
| Assets: | ||||
| Investment in Securities - Level 1 | $ | 43,097 | ||
| Total | $ | 43,097 | ||
The accompanying notes are an integral part of these financial statements.
| 13 |
| American Funds Bond HLS Fund |
| Schedule of Investments |
| June 30, 2013 (Unaudited) |
| (000’s Omitted) |
| Shares | Market Value ╪ | |||||||||||
| INVESTMENT COMPANIES - 100.0% | ||||||||||||
17,580 | American Funds Insurance Series - Bond Fund Class 1 | $ | 190,570 | |||||||||
| Total investment companies | ||||||||||||
(cost $188,701) | $ | 190,570 | ||||||||||
| Total investments | ||||||||||||
| (cost $188,701) ▲ | 100.0 | % | $ | 190,570 | ||||||||
| Other assets and liabilities | — | % | (31 | ) | ||||||||
| Total net assets | 100.0 | % | $ | 190,539 | ||||||||
| Note: | Percentage of investments as shown is the ratio of the total market value to total net assets. |
| ▲ | At June 30, 2013, the cost of securities for federal income tax purposes was $189,538 and the aggregate gross unrealized appreciation and depreciation based on that cost were: |
| Unrealized Appreciation | $ | 1,032 | ||
| Unrealized Depreciation | — | |||
| Net Unrealized Appreciation | $ | 1,032 |
| ╪ | See Significant Accounting Policies of accompanying Notes to Financial Statements regarding valuation of securities. |
| At June 30, 2013, the investment valuation hierarchy levels were: | ||||
| Assets: | ||||
| Investment in Securities - Level 1 | $ | 190,570 | ||
| Total | $ | 190,570 | ||
| American Funds Global Bond HLS Fund |
| Schedule of Investments |
| June 30, 2013 (Unaudited) |
| (000’s Omitted) |
| Shares | Market Value ╪ | |||||||||||
| INVESTMENT COMPANIES - 100.0% | ||||||||||||
2,598 | American Funds Insurance Series - Global Bond Fund Class 1 | $ | 30,053 | |||||||||
| Total investment companies | ||||||||||||
(cost $31,125) | $ | 30,053 | ||||||||||
| Total investments | ||||||||||||
| �� | (cost $31,125) ▲ | 100.0 | % | $ | 30,053 | |||||||
| Other assets and liabilities | — | % | (11 | ) | ||||||||
| Total net assets | 100.0 | % | $ | 30,042 | ||||||||
| Note: | Percentage of investments as shown is the ratio of the total market value to total net assets. |
| ▲ | At June 30, 2013, the cost of securities for federal income tax purposes was $31,177 and the aggregate gross unrealized appreciation and depreciation based on that cost were: |
| Unrealized Appreciation | $ | — | ||
| Unrealized Depreciation | (1,124 | ) | ||
| Net Unrealized Depreciation | $ | (1,124 | ) |
| ╪ | See Significant Accounting Policies of accompanying Notes to Financial Statements regarding valuation of securities. |
| At June 30, 2013, the investment valuation hierarchy levels were: | ||||
| Assets: | ||||
| Investment in Securities - Level 1 | $ | 30,053 | ||
| Total | $ | 30,053 | ||
The accompanying notes are an integral part of these financial statements.
| 14 |
| American Funds Global Growth and Income HLS Fund |
| Schedule of Investments |
| June 30, 2013 (Unaudited) |
| (000’s Omitted) |
| Shares | Market Value ╪ | |||||||||||
| INVESTMENT COMPANIES - 100.0% | ||||||||||||
6,297 | American Funds Insurance Series - Global Growth and Income Fund Class 1 | $ | 71,035 | |||||||||
| Total investment companies | ||||||||||||
(cost $47,979) | $ | 71,035 | ||||||||||
| Total investments | ||||||||||||
| (cost $47,979) ▲ | 100.0 | % | $ | 71,035 | ||||||||
| Other assets and liabilities | — | % | (15 | ) | ||||||||
| Total net assets | 100.0 | % | $ | 71,020 | ||||||||
| Note: | Percentage of investments as shown is the ratio of the total market value to total net assets. |
| ▲ | At June 30, 2013, the cost of securities for federal income tax purposes was $49,874 and the aggregate gross unrealized appreciation and depreciation based on that cost were: |
| Unrealized Appreciation | $ | 21,161 | ||
| Unrealized Depreciation | — | |||
| Net Unrealized Appreciation | $ | 21,161 |
| ╪ | See Significant Accounting Policies of accompanying Notes to Financial Statements regarding valuation of securities. |
| At June 30, 2013, the investment valuation hierarchy levels were: | ||||
| Assets: | ||||
| Investment in Securities - Level 1 | $ | 71,035 | ||
| Total | $ | 71,035 | ||
| American Funds Global Growth HLS Fund |
| Schedule of Investments |
| June 30, 2013 (Unaudited) |
| (000’s Omitted) |
| Shares | Market Value ╪ | |||||||||||
| INVESTMENT COMPANIES - 100.0% | ||||||||||||
1,098 | American Funds Insurance Series - Global Growth Fund Class 1 | $ | 27,762 | |||||||||
| Total investment companies | ||||||||||||
(cost $19,412) | $ | 27,762 | ||||||||||
| Total investments | ||||||||||||
| (cost $19,412) ▲ | 100.0 | % | $ | 27,762 | ||||||||
| Other assets and liabilities | — | % | (9 | ) | ||||||||
| Total net assets | 100.0 | % | $ | 27,753 | ||||||||
| Note: | Percentage of investments as shown is the ratio of the total market value to total net assets. |
| ▲ | At June 30, 2013, the cost of securities for federal income tax purposes was $21,003 and the aggregate gross unrealized appreciation and depreciation based on that cost were: |
| Unrealized Appreciation | $ | 6,759 | ||
| Unrealized Depreciation | — | |||
| Net Unrealized Appreciation | $ | 6,759 |
| ╪ | See Significant Accounting Policies of accompanying Notes to Financial Statements regarding valuation of securities. |
| At June 30, 2013, the investment valuation hierarchy levels were: | ||||
| Assets: | ||||
| Investment in Securities - Level 1 | $ | 27,762 | ||
| Total | $ | 27,762 | ||
The accompanying notes are an integral part of these financial statements.
| 15 |
| American Funds Global Small Capitalization HLS Fund |
| Schedule of Investments |
| June 30, 2013 (Unaudited) |
| (000’s Omitted) |
| Shares | Market Value ╪ | |||||||||||
| INVESTMENT COMPANIES - 100.0% | ||||||||||||
2,488 | American Funds Insurance Series - Global Small Capitalization Fund Class 1 | $ | 54,206 | |||||||||
| Total investment companies | ||||||||||||
(cost $42,583) | $ | 54,206 | ||||||||||
| Total investments | ||||||||||||
| (cost $42,583) ▲ | 100.0 | % | $ | 54,206 | ||||||||
| Other assets and liabilities | — | % | (15 | ) | ||||||||
| Total net assets | 100.0 | % | $ | 54,191 | ||||||||
| Note: | Percentage of investments as shown is the ratio of the total market value to total net assets. |
| ▲ | At June 30, 2013, the cost of securities for federal income tax purposes was $44,984 and the aggregate gross unrealized appreciation and depreciation based on that cost were: |
| Unrealized Appreciation | $ | 9,222 | ||
| Unrealized Depreciation | — | |||
| Net Unrealized Appreciation | $ | 9,222 |
| ╪ | See Significant Accounting Policies of accompanying Notes to Financial Statements regarding valuation of securities. |
| At June 30, 2013, the investment valuation hierarchy levels were: | ||||
| Assets: | ||||
| Investment in Securities - Level 1 | $ | 54,206 | ||
| Total | $ | 54,206 | ||
| American Funds Growth HLS Fund |
| Schedule of Investments |
| June 30, 2013 (Unaudited) |
| (000’s Omitted) |
| Shares | Market Value ╪ | |||||||||||
| INVESTMENT COMPANIES - 100.0% | ||||||||||||
5,235 | American Funds Insurance Series - Growth Fund Class 1 | $ | 350,213 | |||||||||
| Total investment companies | ||||||||||||
(cost $207,882) | $ | 350,213 | ||||||||||
| Total investments | ||||||||||||
| (cost $207,882) ▲ | 100.0 | % | $ | 350,213 | ||||||||
| Other assets and liabilities | — | % | (49 | ) | ||||||||
| Total net assets | 100.0 | % | $ | 350,164 | ||||||||
| Note: | Percentage of investments as shown is the ratio of the total market value to total net assets. |
| ▲ | At June 30, 2013, the cost of securities for federal income tax purposes was $217,026 and the aggregate gross unrealized appreciation and depreciation based on that cost were: |
| Unrealized Appreciation | $ | 133,187 | ||
| Unrealized Depreciation | — | |||
| Net Unrealized Appreciation | $ | 133,187 |
| ╪ | See Significant Accounting Policies of accompanying Notes to Financial Statements regarding valuation of securities. |
| At June 30, 2013, the investment valuation hierarchy levels were: | ||||
| Assets: | ||||
| Investment in Securities - Level 1 | $ | 350,213 | ||
| Total | $ | 350,213 | ||
The accompanying notes are an integral part of these financial statements.
| 16 |
| American Funds Growth-Income HLS Fund |
| Schedule of Investments |
| June 30, 2013 (Unaudited) |
| (000’s Omitted) |
| Shares | Market Value ╪ | |||||||||||
| INVESTMENT COMPANIES - 100.0% | ||||||||||||
4,570 | American Funds Insurance Series - Growth-Income Fund Class 1 | $ | 196,071 | |||||||||
| Total investment companies | ||||||||||||
(cost $127,112) | $ | 196,071 | ||||||||||
| Total investments | ||||||||||||
| (cost $127,112) ▲ | 100.0 | % | $ | 196,071 | ||||||||
| Other assets and liabilities | — | % | (26 | ) | ||||||||
| Total net assets | 100.0 | % | $ | 196,045 | ||||||||
| Note: | Percentage of investments as shown is the ratio of the total market value to total net assets. |
| ▲ | At June 30, 2013, the cost of securities for federal income tax purposes was $130,982 and the aggregate gross unrealized appreciation and depreciation based on that cost were: |
| Unrealized Appreciation | $ | 65,089 | ||
| Unrealized Depreciation | — | |||
| Net Unrealized Appreciation | $ | 65,089 |
| ╪ | See Significant Accounting Policies of accompanying Notes to Financial Statements regarding valuation of securities. |
| At June 30, 2013, the investment valuation hierarchy levels were: | ||||
| Assets: | ||||
| Investment in Securities - Level 1 | $ | 196,071 | ||
| Total | $ | 196,071 | ||
| American Funds International HLS Fund |
| Schedule of Investments |
| June 30, 2013 (Unaudited) |
| (000’s Omitted) |
| Shares | Market Value ╪ | |||||||||||
| INVESTMENT COMPANIES - 100.0% | ||||||||||||
12,021 | American Funds Insurance Series - International Fund Class 1 | $ | 218,908 | |||||||||
| Total investment companies | ||||||||||||
(cost $179,088) | $ | 218,908 | ||||||||||
| Total investments | ||||||||||||
| (cost $179,088) ▲ | 100.0 | % | $ | 218,908 | ||||||||
| Other assets and liabilities | — | % | (37 | ) | ||||||||
| Total net assets | 100.0 | % | $ | 218,871 | ||||||||
| Note: | Percentage of investments as shown is the ratio of the total market value to total net assets. |
| ▲ | At June 30, 2013, the cost of securities for federal income tax purposes was $185,117 and the aggregate gross unrealized appreciation and depreciation based on that cost were: |
| Unrealized Appreciation | $ | 33,791 | ||
| Unrealized Depreciation | — | |||
| Net Unrealized Appreciation | $ | 33,791 |
| ╪ | See Significant Accounting Policies of accompanying Notes to Financial Statements regarding valuation of securities. |
| At June 30, 2013, the investment valuation hierarchy levels were: | ||||
| Assets: | ||||
| Investment in Securities - Level 1 | $ | 218,908 | ||
| Total | $ | 218,908 | ||
The accompanying notes are an integral part of these financial statements.
| 17 |
| American Funds New World HLS Fund |
| Schedule of Investments |
| June 30, 2013 (Unaudited) |
| (000’s Omitted) |
| Shares | Market Value ╪ | |||||||||||
| INVESTMENT COMPANIES - 100.0% | ||||||||||||
1,962 | American Funds Insurance Series - New World Fund Class 1 | $ | 43,610 | |||||||||
| Total investment companies | ||||||||||||
(cost $38,892) | $ | 43,610 | ||||||||||
| Total investments | ||||||||||||
| (cost $38,892) ▲ | 100.0 | % | $ | 43,610 | ||||||||
| Other assets and liabilities | — | % | (14 | ) | ||||||||
| Total net assets | 100.0 | % | $ | 43,596 | ||||||||
| Note: | Percentage of investments as shown is the ratio of the total market value to total net assets. |
| ▲ | At June 30, 2013, the cost of securities for federal income tax purposes was $40,917 and the aggregate gross unrealized appreciation and depreciation based on that cost were: |
| Unrealized Appreciation | $ | 2,693 | ||
| Unrealized Depreciation | — | |||
| Net Unrealized Appreciation | $ | 2,693 |
| ╪ | See Significant Accounting Policies of accompanying Notes to Financial Statements regarding valuation of securities. |
| At June 30, 2013, the investment valuation hierarchy levels were: | ||||
| Assets: | ||||
| Investment in Securities - Level 1 | $ | 43,610 | ||
| Total | $ | 43,610 | ||
The accompanying notes are an integral part of these financial statements.
| 18 |
[This page is intentionally left blank]
| 19 |
| Hartford Series Fund, Inc. |
| Statements of Assets and Liabilities |
| June 30, 2013 (Unaudited) |
| (000’s Omitted) |
| American Funds Asset Allocation HLS Fund | American Funds Blue Chip Income and Growth HLS Fund | American Funds Bond HLS Fund | ||||||||||
| Assets: | ||||||||||||
| Investments in underlying funds, at market value @ | $ | 81,698 | $ | 43,097 | $ | 190,570 | ||||||
| Receivables: | ||||||||||||
| Investment securities sold | — | — | 2,309 | |||||||||
| Fund shares sold | 12,058 | 19 | 316 | |||||||||
| Other assets | 5 | 4 | 8 | |||||||||
| Total assets | 93,761 | 43,120 | 193,203 | |||||||||
| Liabilities: | ||||||||||||
| Payables: | ||||||||||||
| Investment securities purchased | 12,042 | 13 | — | |||||||||
| Fund shares redeemed | 14 | 5 | 2,619 | |||||||||
| Investment management fees | 7 | 5 | 16 | |||||||||
| Distribution fees | 3 | 2 | 8 | |||||||||
| Accrued expenses | 9 | 9 | 21 | |||||||||
| Total liabilities | 12,075 | 34 | 2,664 | |||||||||
| Net assets | $ | 81,686 | $ | 43,086 | $ | 190,539 | ||||||
| Summary of Net Assets: | ||||||||||||
| Capital stock and paid-in-capital | $ | 58,376 | $ | 27,676 | $ | 174,352 | ||||||
| Undistributed net investment income | 1,127 | 692 | 4,607 | |||||||||
| Accumulated net realized gain | 5,486 | 4,397 | 9,711 | |||||||||
| Unrealized appreciation (depreciation) of investments | 16,697 | 10,321 | 1,869 | |||||||||
| Net assets | $ | 81,686 | $ | 43,086 | $ | 190,539 | ||||||
| Shares authorized | 200,000 | 200,000 | 200,000 | |||||||||
| Par value | $ | 0.001 | $ | 0.001 | $ | 0.001 | ||||||
| Class IB: Net asset value per share | $ | 12.16 | $ | 11.55 | $ | 10.23 | ||||||
| Shares outstanding | 6,719 | 3,729 | 18,626 | |||||||||
| Net assets | $ | 81,686 | $ | 43,086 | $ | 190,539 | ||||||
| @ Cost of underlying funds | $ | 65,001 | $ | 32,776 | $ | 188,701 | ||||||
The accompanying notes are an integral part of these financial statements.
| 20 |
| American Funds Global Bond HLS Fund | American Funds Global Growth and Income HLS Fund | American Funds Global Growth HLS Fund | American Funds Global Small Capitalization HLS Fund | American Funds Growth HLS Fund | American Funds Growth-Income HLS Fund | American Funds International HLS Fund | American Funds New World HLS Fund | |||||||||||||||||||||||
| $ | 30,053 | $ | 71,035 | $ | 27,762 | $ | 54,206 | $ | 350,213 | $ | 196,071 | $ | 218,908 | $ | 43,610 | |||||||||||||||
| 85 | 148 | — | — | 78 | — | 253 | 138 | |||||||||||||||||||||||
| 8 | 11 | 12 | 160 | 302 | 116 | 24 | 17 | |||||||||||||||||||||||
| 3 | 6 | 4 | 5 | 29 | 15 | 21 | 6 | |||||||||||||||||||||||
| 30,149 | 71,200 | 27,778 | 54,371 | 350,622 | 196,202 | 219,206 | 43,771 | |||||||||||||||||||||||
| — | — | 10 | 42 | — | 36 | — | — | |||||||||||||||||||||||
| 93 | 157 | 1 | 117 | 370 | 74 | 271 | 154 | |||||||||||||||||||||||
| 4 | 9 | 5 | 7 | 43 | 23 | 30 | 8 | |||||||||||||||||||||||
| 1 | 3 | 1 | 2 | 14 | 8 | 9 | 2 | |||||||||||||||||||||||
| 9 | 11 | 8 | 12 | 31 | 16 | 25 | 11 | |||||||||||||||||||||||
| 107 | 180 | 25 | 180 | 458 | 157 | 335 | 175 | |||||||||||||||||||||||
| $ | 30,042 | $ | 71,020 | $ | 27,753 | $ | 54,191 | $ | 350,164 | $ | 196,045 | $ | 218,871 | $ | 43,596 | |||||||||||||||
| $ | 27,274 | $ | 42,994 | $ | 17,292 | $ | 35,363 | $ | 193,221 | $ | 120,542 | $ | 171,590 | $ | 32,033 | |||||||||||||||
| 785 | 1,856 | 166 | 906 | 2,283 | 2,510 | 2,847 | 345 | |||||||||||||||||||||||
| 3,055 | 3,114 | 1,945 | 6,299 | 12,329 | 4,034 | 4,614 | 6,500 | |||||||||||||||||||||||
| (1,072 | ) | 23,056 | 8,350 | 11,623 | 142,331 | 68,959 | 39,820 | 4,718 | ||||||||||||||||||||||
| $ | 30,042 | $ | 71,020 | $ | 27,753 | $ | 54,191 | $ | 350,164 | $ | 196,045 | $ | 218,871 | $ | 43,596 | |||||||||||||||
| 200,000 | 200,000 | 200,000 | 200,000 | 200,000 | 200,000 | 200,000 | 200,000 | |||||||||||||||||||||||
| $ | 0.001 | $ | 0.001 | $ | 0.001 | $ | 0.001 | $ | 0.001 | $ | 0.001 | $ | 0.001 | $ | 0.001 | |||||||||||||||
| $ | 10.52 | $ | 10.27 | $ | 11.22 | $ | 9.01 | $ | 11.50 | $ | 11.38 | $ | 9.01 | $ | 9.22 | |||||||||||||||
| 2,855 | 6,917 | 2,474 | 6,012 | 30,439 | 17,224 | 24,303 | 4,728 | |||||||||||||||||||||||
| $ | 30,042 | $ | 71,020 | $ | 27,753 | $ | 54,191 | $ | 350,164 | $ | 196,045 | $ | 218,871 | $ | 43,596 | |||||||||||||||
| $ | 31,125 | $ | 47,979 | $ | 19,412 | $ | 42,583 | $ | 207,882 | $ | 127,112 | $ | 179,088 | $ | 38,892 | |||||||||||||||
The accompanying notes are an integral part of these financial statements.
| 21 |
| Hartford Series Fund, Inc. |
| Statements of Operations |
| For the Six-Month Period Ended June 30, 2013 (Unaudited) |
| (000’s Omitted) |
| American Funds Asset Allocation HLS Fund | American Funds Blue Chip Income and Growth HLS Fund | American Funds Bond HLS Fund | ||||||||||
| Investment Income: | ||||||||||||
| Dividends from underlying funds | $ | 274 | $ | 185 | $ | 817 | ||||||
| Total investment income | 274 | 185 | 817 | |||||||||
| Expenses: | ||||||||||||
| Investment management fees | 226 | 162 | 486 | |||||||||
| Distribution fees - Class IB | 87 | 54 | 243 | |||||||||
| Custodian fees | — | — | — | |||||||||
| Accounting services fees | 3 | 2 | 10 | |||||||||
| Board of Directors' fees | 1 | 1 | 3 | |||||||||
| Audit fees | 5 | 5 | 6 | |||||||||
| Other expenses | 6 | 5 | 19 | |||||||||
| Total expenses (before waivers) | 328 | 229 | 767 | |||||||||
| Expense waivers | (139 | ) | (108 | ) | (243 | ) | ||||||
| Total waivers | (139 | ) | (108 | ) | (243 | ) | ||||||
| Total expenses, net | 189 | 121 | 524 | |||||||||
| Net Investment Income (Loss) | 85 | 64 | 293 | |||||||||
| Net Realized Gain on Investments: | ||||||||||||
| Capital gain distribution received from underlying funds | — | — | 2,112 | |||||||||
| Net realized gain on investments in underlying funds | 2,814 | 2,594 | 2,440 | |||||||||
| Net Realized Gain on Investments | 2,814 | 2,594 | 4,552 | |||||||||
| Net Changes in Unrealized Appreciation of Investments: | ||||||||||||
| Net unrealized appreciation (depreciation) of investments in underlying funds | 3,699 | 2,997 | (10,190 | ) | ||||||||
| Net Gain (Loss) on Investments | 6,513 | 5,591 | (5,638 | ) | ||||||||
| Net Increase (Decrease) in Net Assets Resulting from Operations | $ | 6,598 | $ | 5,655 | $ | (5,345 | ) | |||||
The accompanying notes are an integral part of these financial statements.
| 22 |
| American Funds Global Bond HLS Fund | American Funds Global Growth and Income HLS Fund | American Funds Global Growth HLS Fund | American Funds Global Small Capitalization HLS Fund | American Funds Growth HLS Fund | American Funds Growth-Income HLS Fund | American Funds International HLS Fund | American Funds New World HLS Fund | |||||||||||||||||||||||
| $ | — | $ | 466 | $ | 103 | $ | 502 | $ | 1,531 | $ | 691 | $ | 915 | $ | 159 | |||||||||||||||
| — | 466 | 103 | 502 | 1,531 | 691 | 915 | 159 | |||||||||||||||||||||||
| 133 | 302 | 146 | 222 | 1,304 | 679 | 957 | 270 | |||||||||||||||||||||||
| 45 | 94 | 36 | 69 | 435 | 243 | 282 | 61 | |||||||||||||||||||||||
| — | — | — | — | — | — | — | — | |||||||||||||||||||||||
| 2 | 4 | 1 | 3 | 17 | 10 | 11 | 3 | |||||||||||||||||||||||
| 1 | 1 | 1 | 1 | 5 | 2 | 3 | 1 | |||||||||||||||||||||||
| 5 | 5 | 5 | 5 | 6 | 6 | 6 | 5 | |||||||||||||||||||||||
| 5 | 8 | 4 | 8 | 35 | 16 | 27 | 8 | |||||||||||||||||||||||
| 191 | 414 | 193 | 308 | 1,802 | 956 | 1,286 | 348 | |||||||||||||||||||||||
| (89 | ) | (207 | ) | (109 | ) | (152 | ) | (869 | ) | (437 | ) | (675 | ) | (209 | ) | |||||||||||||||
| (89 | ) | (207 | ) | (109 | ) | (152 | ) | (869 | ) | (437 | ) | (675 | ) | (209 | ) | |||||||||||||||
| 102 | 207 | 84 | 156 | 933 | 519 | 611 | 139 | |||||||||||||||||||||||
| (102 | ) | 259 | 19 | 346 | 598 | 172 | 304 | 20 | ||||||||||||||||||||||
| 397 | — | — | — | — | — | — | 214 | |||||||||||||||||||||||
| 990 | 4,022 | 1,797 | 3,107 | 10,725 | 5,544 | 6,411 | 3,405 | |||||||||||||||||||||||
| 1,387 | 4,022 | 1,797 | 3,107 | 10,725 | 5,544 | 6,411 | 3,619 | |||||||||||||||||||||||
| (3,147 | ) | 1,040 | 254 | 1,272 | 21,886 | 15,415 | 510 | (4,783 | ) | |||||||||||||||||||||
| (1,760 | ) | 5,062 | 2,051 | 4,379 | 32,611 | 20,959 | 6,921 | (1,164 | ) | |||||||||||||||||||||
| $ | (1,862 | ) | $ | 5,321 | $ | 2,070 | $ | 4,725 | $ | 33,209 | $ | 21,131 | $ | 7,225 | $ | (1,144 | ) | |||||||||||||
The accompanying notes are an integral part of these financial statements.
| 23 |
| Hartford Series Fund, Inc. |
| Statements of Changes in Net Assets |
| (000’s Omitted) |
| American Funds Asset Allocation HLS Fund | American Funds Blue Chip Income and Growth HLS Fund | |||||||||||||||
| For the Six-Month Period Ended June 30, 2013 (Unaudited) | For the Year Ended December 31, 2012 | For the Six-Month Period Ended June 30, 2013 (Unaudited) | For the Year Ended December 31, 2012 | |||||||||||||
| Operations: | ||||||||||||||||
| Net investment income (loss) | $ | 85 | $ | 1,042 | $ | 64 | $ | 628 | ||||||||
| Net realized gain on investments | 2,814 | 4,503 | 2,594 | 2,809 | ||||||||||||
| Net unrealized appreciation (depreciation) of investments | 3,699 | 4,256 | 2,997 | 1,230 | ||||||||||||
| Net Increase (Decrease) in Net assets Resulting from Operations | 6,598 | 9,801 | 5,655 | 4,667 | ||||||||||||
| Distributions to Shareholders: | ||||||||||||||||
| From net investment income | ||||||||||||||||
| Class IB | — | (1,026 | ) | — | (467 | ) | ||||||||||
| From net realized gain on investments | ||||||||||||||||
| Class IB | — | (140 | ) | — | (266 | ) | ||||||||||
| Total distributions | — | (1,166 | ) | — | (733 | ) | ||||||||||
| Capital Share Transactions: | ||||||||||||||||
| Class IB | ||||||||||||||||
| Sold | 19,163 | 10,741 | 5,233 | 14,324 | ||||||||||||
| Issued on reinvestment of distributions | — | 1,166 | — | 733 | ||||||||||||
| Redeemed | (8,691 | ) | (20,282 | ) | (7,722 | ) | (11,496 | ) | ||||||||
| Net increase (decrease) from capital share transactions | 10,472 | (8,375 | ) | (2,489 | ) | 3,561 | ||||||||||
| Net increase (decrease) in net assets | 17,070 | 260 | 3,166 | 7,495 | ||||||||||||
| Net Assets: | ||||||||||||||||
| Beginning of period | 64,616 | 64,356 | 39,920 | 32,425 | ||||||||||||
| End of period | $ | 81,686 | $ | 64,616 | $ | 43,086 | $ | 39,920 | ||||||||
| Undistributed (distribution in excess of) net investment income | $ | 1,127 | $ | 1,042 | $ | 692 | $ | 628 | ||||||||
| Shares: | ||||||||||||||||
| Class IB | ||||||||||||||||
| Sold | 1,593 | 1,021 | 464 | 1,460 | ||||||||||||
| Issued on reinvestment of distributions | — | 109 | — | 73 | ||||||||||||
| Redeemed | (726 | ) | (1,912 | ) | (684 | ) | (1,160 | ) | ||||||||
| Total share activity | 867 | (782 | ) | (220 | ) | 373 | ||||||||||
The accompanying notes are an integral part of these financial statements.
| 24 |
| American Funds Bond HLS Fund | American Funds Global Bond HLS Fund | American Funds Global Growth and Income HLS Fund | American Funds Global Growth HLS Fund | |||||||||||||||||||||||||||
| For the Six-Month Period Ended June 30, 2013 (Unaudited) | For the Year Ended December 31, 2012 | For the Six-Month Period Ended June 30, 2013 (Unaudited) | For the Year Ended December 31, 2012 | For the Six-Month Period Ended June 30, 2013 (Unaudited) | For the Year Ended December 31, 2012 | For the Six-Month Period Ended June 30, 2013 (Unaudited) | For the Year Ended December 31, 2012 | |||||||||||||||||||||||
| $ | 293 | $ | 4,314 | $ | (102 | ) | $ | 706 | $ | 259 | $ | 1,598 | $ | 19 | $ | 147 | ||||||||||||||
| 4,552 | 6,087 | 1,387 | 2,000 | 4,022 | 2,782 | 1,797 | 1,741 | |||||||||||||||||||||||
| (10,190 | ) | (428 | ) | (3,147 | ) | (311 | ) | 1,040 | 7,964 | 254 | 4,172 | |||||||||||||||||||
| (5,345 | ) | 9,973 | (1,862 | ) | 2,395 | 5,321 | 12,344 | 2,070 | 6,060 | |||||||||||||||||||||
| — | (5,360 | ) | — | (1,092 | ) | — | (1,976 | ) | — | (313 | ) | |||||||||||||||||||
| — | (4,400 | ) | — | (825 | ) | — | — | — | (324 | ) | ||||||||||||||||||||
| — | (9,760 | ) | — | (1,917 | ) | — | (1,976 | ) | — | (637 | ) | |||||||||||||||||||
| 19,721 | 33,978 | 2,061 | 3,834 | 1,697 | 4,117 | 1,387 | 2,125 | |||||||||||||||||||||||
| — | 9,760 | — | 1,917 | — | 1,976 | — | 637 | |||||||||||||||||||||||
| (22,845 | ) | (43,146 | ) | (8,350 | ) | (12,388 | ) | (10,925 | ) | (20,173 | ) | (4,759 | ) | (8,449 | ) | |||||||||||||||
| (3,124 | ) | 592 | (6,289 | ) | (6,637 | ) | (9,228 | ) | (14,080 | ) | (3,372 | ) | (5,687 | ) | ||||||||||||||||
| (8,469 | ) | 805 | (8,151 | ) | (6,159 | ) | (3,907 | ) | (3,712 | ) | (1,302 | ) | (264 | ) | ||||||||||||||||
| 199,008 | 198,203 | 38,193 | 44,352 | 74,927 | 78,639 | 29,055 | 29,319 | |||||||||||||||||||||||
| $ | 190,539 | $ | 199,008 | $ | 30,042 | $ | 38,193 | $ | 71,020 | $ | 74,927 | $ | 27,753 | $ | 29,055 | |||||||||||||||
| $ | 4,607 | $ | 4,314 | $ | 785 | $ | 887 | $ | 1,856 | $ | 1,597 | $ | 166 | $ | 147 | |||||||||||||||
| 1,892 | 3,188 | 188 | 342 | 168 | 452 | 125 | 219 | |||||||||||||||||||||||
| — | 943 | — | 177 | — | 221 | — | 65 | |||||||||||||||||||||||
| (2,186 | ) | (4,046 | ) | (773 | ) | (1,105 | ) | (1,074 | ) | (2,235 | ) | (430 | ) | (861 | ) | |||||||||||||||
| (294 | ) | 85 | (585 | ) | (586 | ) | (906 | ) | (1,562 | ) | (305 | ) | (577 | ) | ||||||||||||||||
The accompanying notes are an integral part of these financial statements.
| 25 |
| Hartford Series Fund, Inc. |
| Statements of Changes in Net Assets – (continued) |
| (000’s Omitted) |
| American Funds Global Small Capitalization HLS Fund | American Funds Growth HLS Fund | |||||||||||||||
| For the Six-Month Period Ended June 30, 2013 (Unaudited) | For the Year Ended December 31, 2012 | For the Six-Month Period Ended June 30, 2013 (Unaudited) | For the Year Ended December 31, 2012 | |||||||||||||
| Operations: | ||||||||||||||||
| Net investment income | $ | 346 | $ | 560 | $ | 598 | $ | 1,686 | ||||||||
| Net realized gain on investments | 3,107 | 5,606 | 10,725 | 10,749 | ||||||||||||
| Net unrealized appreciation (depreciation) of investments | 1,272 | 3,066 | 21,886 | 41,625 | ||||||||||||
| Net Increase (Decrease) in Net assets Resulting from Operations | 4,725 | 9,232 | 33,209 | 54,060 | ||||||||||||
| Distributions to Shareholders: | ||||||||||||||||
| From net investment income | ||||||||||||||||
| Class IB | — | (648 | ) | — | (1,117 | ) | ||||||||||
| From net realized gain on investments | ||||||||||||||||
| Class IB | — | (4,957 | ) | — | (975 | ) | ||||||||||
| Total distributions | — | (5,605 | ) | — | (2,092 | ) | ||||||||||
| Capital Share Transactions: | ||||||||||||||||
| Class IB | ||||||||||||||||
| Sold | 2,789 | 3,154 | 18,955 | 33,586 | ||||||||||||
| Issued on reinvestment of distributions | — | 5,605 | — | 2,092 | ||||||||||||
| Redeemed | (7,204 | ) | (14,163 | ) | (35,889 | ) | (71,725 | ) | ||||||||
| Net decrease from capital share transactions | (4,415 | ) | (5,404 | ) | (16,934 | ) | (36,047 | ) | ||||||||
| Net increase (decrease) in net assets | 310 | (1,777 | ) | 16,275 | 15,921 | |||||||||||
| Net Assets: | ||||||||||||||||
| Beginning of period | 53,881 | 55,658 | 333,889 | 317,968 | ||||||||||||
| End of period | $ | 54,191 | $ | 53,881 | $ | 350,164 | $ | 333,889 | ||||||||
| Undistributed (distribution in excess of) net investment income | $ | 906 | $ | 560 | $ | 2,283 | $ | 1,685 | ||||||||
| Shares: | ||||||||||||||||
| Class IB | ||||||||||||||||
| Sold | 310 | 379 | 1,690 | 3,394 | ||||||||||||
| Issued on reinvestment of distributions | — | 731 | — | 210 | ||||||||||||
| Redeemed | (801 | ) | (1,717 | ) | (3,188 | ) | (7,202 | ) | ||||||||
| Total share activity | (491 | ) | (607 | ) | (1,498 | ) | (3,598 | ) | ||||||||
The accompanying notes are an integral part of these financial statements.
| 26 |
| American Funds Growth-Income HLS Fund | American Funds International HLS Fund | American Funds New World HLS Fund | ||||||||||||||||||||
| For the Six-Month Period Ended June 30, 2013 (Unaudited) | For the Year Ended December 31, 2012 | For the Six-Month Period Ended June 30, 2013 (Unaudited) | For the Year Ended December 31, 2012 | For the Six-Month Period Ended June 30, 2013 (Unaudited) | For the Year Ended December 31, 2012 | |||||||||||||||||
| $ | 172 | $ | 2,338 | $ | 304 | $ | 2,543 | $ | 20 | $ | 325 | |||||||||||
| 5,544 | 3,072 | 6,411 | 4,308 | 3,619 | 4,944 | |||||||||||||||||
| 15,415 | 22,943 | 510 | 28,881 | (4,783 | ) | 3,202 | ||||||||||||||||
| 21,131 | 28,353 | 7,225 | 35,732 | (1,144 | ) | 8,471 | ||||||||||||||||
| — | (2,243 | ) | — | (3,474 | ) | — | (835 | ) | ||||||||||||||
| — | — | — | — | — | (2,795 | ) | ||||||||||||||||
| — | (2,243 | ) | — | (3,474 | ) | — | (3,630 | ) | ||||||||||||||
| 14,580 | 25,921 | 10,163 | 20,802 | 2,469 | 6,030 | |||||||||||||||||
| — | 2,243 | — | 3,474 | — | 3,630 | |||||||||||||||||
| (22,886 | ) | (41,113 | ) | (23,815 | ) | (39,635 | ) | (9,426 | ) | (15,373 | ) | |||||||||||
| (8,306 | ) | (12,949 | ) | (13,652 | ) | (15,359 | ) | (6,957 | ) | (5,713 | ) | |||||||||||
| 12,825 | 13,161 | (6,427 | ) | 16,899 | (8,101 | ) | (872 | ) | ||||||||||||||
| 183,220 | 170,059 | 225,298 | 208,399 | 51,697 | 52,569 | |||||||||||||||||
| $ | 196,045 | $ | 183,220 | $ | 218,871 | $ | 225,298 | $ | 43,596 | $ | 51,697 | |||||||||||
| $ | 2,510 | $ | 2,338 | $ | 2,847 | $ | 2,543 | $ | 345 | $ | 325 | |||||||||||
| 1,316 | 2,678 | 1,122 | 2,601 | 259 | 658 | |||||||||||||||||
| — | 226 | — | 432 | — | 417 | |||||||||||||||||
| (2,054 | ) | (4,240 | ) | (2,622 | ) | (4,853 | ) | (995 | ) | (1,684 | ) | |||||||||||
| (738 | ) | (1,336 | ) | (1,500 | ) | (1,820 | ) | (736 | ) | (609 | ) | |||||||||||
The accompanying notes are an integral part of these financial statements.
| 27 |
| Hartford Series Fund, Inc. |
| Notes to Financial Statements |
| June 30, 2013 (Unaudited) |
| (000’s Omitted) |
| 1. | Organization: |
The Hartford HLS Funds serve as underlying investment options for certain variable annuity and variable life insurance separate accounts of Hartford Life Insurance Company (“HLIC”) and its affiliates and certain qualified retirement plans. Certain Hartford HLS Funds may also serve as underlying investment options for certain variable annuity and variable life separate accounts of other insurance companies. Owners of variable annuity contracts and policyholders of variable life insurance contracts may choose the funds permitted in the variable insurance contract prospectus. In addition, participants in certain qualified retirement plans may choose the funds if permitted by their plans.
Hartford Series Fund, Inc. (the “Company”) is an open-end management investment company comprised of thirty portfolios, eleven portfolios of which are included in these financial statements (each a “Fund” or together the “Funds”). These eleven portfolios of the Company are American Funds Asset Allocation HLS Fund, American Funds Blue Chip Income and Growth HLS Fund, American Funds Bond HLS Fund, American Funds Global Bond HLS Fund, American Funds Global Growth and Income HLS Fund, American Funds Global Growth HLS Fund, American Funds Global Small Capitalization HLS Fund, American Funds Growth HLS Fund, American Funds Growth-Income HLS Fund, American Funds International HLS Fund and American Funds New World HLS Fund.
The Company is organized under the laws of the State of Maryland and is registered with the Securities and Exchange Commission (“SEC”) under the Investment Company Act of 1940, as amended (“1940 Act”). Each Fund is organized as a diversified open-end management investment company, except for American Funds Global Bond HLS Fund, which is non-diversified.
Each Fund operates in the manner of a fund of funds, investing in shares of underlying mutual funds (the “Underlying Funds”). Each Underlying Fund is offered by American Funds Insurance Series, and is a registered open-end investment company. The Funds and their related Underlying Funds are listed below:
| Fund | Underlying Fund | |
| American Funds Asset Allocation HLS Fund | Asset Allocation Fund Class 1 | |
| American Funds Blue Chip Income and Growth HLS Fund | Blue Chip Income and Growth Fund Class 1 | |
| American Funds Bond HLS Fund | Bond Fund Class 1 | |
| American Funds Global Bond HLS Fund | Global Bond Fund Class 1 | |
| American Funds Global Growth and Income HLS Fund | Global Growth and Income Fund Class 1 | |
| American Funds Global Growth HLS Fund | Global Growth Fund Class 1 | |
| American Funds Global Small Capitalization HLS Fund | Global Small Capitalization Fund Class 1 | |
| American Funds Growth HLS Fund | Growth Fund Class 1 | |
| American Funds Growth-Income HLS Fund | Growth-Income Fund Class 1 | |
| American Funds International HLS Fund | International Fund Class 1 | |
| American Funds New World HLS Fund | New World Fund Class 1 |
The Underlying Funds’ accounting policies are outlined in the Underlying Funds’ shareholder report, which accompanies this report.
Class IB shares of the Funds are offered at the per share net asset value (“NAV”) without a sales charge and are subject to distribution fees charged pursuant to a Distribution and Service Plan. The Distribution and Service Plan has been adopted in accordance with Rule 12b-1 under the 1940 Act.
| 2. | Significant Accounting Policies: |
The following is a summary of significant accounting policies of the Funds in the preparation of their financial statements, which are in accordance with the United States Generally Accepted Accounting Principles (“U.S. GAAP”). The preparation of financial statements in accordance with U.S. GAAP may require management to make estimates and assumptions that
| 28 |
affect the reported amounts of assets and liabilities and disclosure of contingent assets and liabilities at the date of the financial statements and the reported amounts of increases and decreases in net assets from operations during the reporting period. Actual results could differ from those estimates.
| a) | Determination of Net Asset Value – The NAV of each class of the Funds’ shares is determined as of the close of regular trading (normally 4:00 p.m. Eastern Time) (the “NYSE Close”) on each day that the New York Stock Exchange (the “Exchange”) is open (“Valuation Date”). Information that becomes known to the Funds after the NAV has been calculated on a particular day will not generally be used to retroactively adjust the NAV determined earlier that day. |
| b) | Investment Valuation – Investments in the Underlying Funds are valued at the respective NAV of each Underlying Fund as determined as of the NYSE Close on Valuation Date. Valuation of investments held by the Underlying Funds is discussed in Notes to Financial Statements of the Underlying Funds, which are included in the Underlying Funds’ shareholder report, accompanying this report. |
U.S. GAAP defines fair value as the price that the Fund would receive to sell an asset or pay to transfer a liability in an orderly transaction between market participants. The U.S. GAAP fair value measurement standards require disclosure of a fair value hierarchy for each major category of assets and liabilities. Various inputs are used in determining the fair value of each Fund’s investments. These inputs are summarized into three broad hierarchy levels. This hierarchy is based on whether the valuation inputs are observable or unobservable. These levels are:
| · | Level 1 – Quoted prices in active markets for identical investments. |
| · | Level 2 – Observable inputs other than Level 1 prices, such as quoted prices for similar investments; quoted prices in markets that are not active; or other inputs that are observable or can be corroborated by observable market data. |
| · | Level 3 – Significant unobservable inputs that are supported by limited or no market activity. Level 3 may include financial instruments whose values are determined using indicative market quotes or require significant management judgment or estimation. |
Valuation levels are not necessarily indicative of the risk associated with investing in such securities. Individual securities within any of the above mentioned asset classes may be assigned a different hierarchical level than those presented above, as individual circumstances dictate.
During the six-month period ended June 30, 2013, the Funds held no Level 3 securities, therefore no reconciliations of Level 3 securities are presented.
For additional information, refer to the investment valuation hierarchy level summary which follows the Schedule of Investments for each Fund.
For purposes of reporting transfers between different hierarchy levels, both transfers in and out of each level, as applicable, are shown as if they occurred at the beginning of the period. During the six-month period ended June 30, 2013, there were no transfers between different hierarchy levels.
| c) | Investment Transactions and Investment Income – Investment transactions are recorded as of the trade date (the date the order to buy or sell is executed) for financial reporting purposes. Realized gains and losses are determined on the basis of identified cost. |
Income and capital gain distributions from the Underlying Funds are accrued on the ex-dividend date.
| d) | Fund Share Valuation and Dividend Distributions to Shareholders – Orders for the Funds’ shares are executed in accordance with the investment instructions of the contract holders. The NAV of each Fund’s shares is determined as of |
| 29 |
| Hartford Series Fund, Inc. |
| Notes to Financial Statements – (continued) |
| June 30, 2013 (Unaudited) |
| (000’s Omitted) |
the close of each business day of the Exchange. The NAV is determined for each Fund by dividing the Fund’s net assets by the number of shares outstanding. Orders for the purchase of a Fund’s shares received by an insurance company prior to the close of the Exchange on any day on which the Exchange is open for business are priced at the NAV determined as of the close of the Exchange. Orders received by an insurance company after the close of the Exchange, or on a day on which the Exchange and/or the Fund is not open for business, are priced at the next determined NAV.
Dividends are declared pursuant to a policy adopted by the Company’s Board of Directors based upon the investment performance of the Funds. The policy of all the Funds is to pay dividends from net investment income and realized capital gains, if any, at least once a year.
Distributions from net investment income, realized capital gains and capital are determined in accordance with federal income tax regulations, which may differ from U.S. GAAP with respect to character and timing. These differences may include but are not limited to losses deferred due to wash sale adjustments and short-term capital gain adjustments. Permanent book and federal income tax basis differences relating to shareholder distributions will result in reclassifications to certain of the Funds’ capital accounts (see Federal Income Taxes: Reclassification of Capital Accounts note).
| 3. | Principal Risks: |
| a) | Market Risks – The Funds are exposed to the risks of the Underlying Funds in direct proportion to the amount of assets each Fund allocates to each Underlying Fund. The market values of the Underlying Funds may decline due to general market conditions which are not specifically related to a particular fund, such as real or perceived adverse economic conditions or adverse investor sentiment generally. |
| 4. | Federal Income Taxes: |
| a) | Federal Income Taxes – For federal income tax purposes, the Funds intend to continue to qualify as Regulated Investment Companies (“RIC”) under Subchapter M of the Internal Revenue Code (“IRC”) by distributing substantially all of their taxable net investment income and net realized capital gains to their shareholders and otherwise complying with the requirements of the IRC. The Funds have distributed substantially all of their income and capital gains in the prior year and each Fund intends to distribute substantially all of its income and gains prior to the next fiscal year end. Accordingly, no provision for federal income or excise taxes has been made in the accompanying financial statements. Distributions from short-term capital gains are treated as ordinary income distributions for federal income tax purposes. |
| b) | Net Investment Income (Loss), Net Realized Gains (Losses), and Distributions – Net investment income (loss) and net realized gains (losses) may differ for financial statement and tax purposes primarily because of losses deferred due to wash sale adjustments and short-term capital gain adjustments. The character of distributions made during the year from net investment income or net realized gains may differ from their ultimate characterization for federal income tax purposes. Also, due to the timing of dividend distributions, the fiscal year in which amounts are distributed may differ from the year that the net investment income (loss) or net realized gains (losses) were recorded by a Fund. |
| 30 |
| c) | Distributions and Components of Distributable Earnings – The tax character of distributions paid by the Funds for the periods indicated is as follows (as adjusted for dividends payable, if applicable): |
| For the Year Ended December 31, 2012 | For the Year Ended December 31, 2011 | |||||||||||||||||||||||
| Ordinary Income | Long- Term Capital Gains(a) | Tax return of capital | Ordinary Income | Long- Term Capital Gains(a) | Tax return of capital | |||||||||||||||||||
| American Funds Asset Allocation HLS Fund | $ | 1,026 | $ | 140 | $ | — | $ | 863 | $ | 5 | $ | — | ||||||||||||
| American Funds Blue Chip Income and Growth HLS Fund | 467 | 266 | — | 8 | — | — | ||||||||||||||||||
| American Funds Bond HLS Fund | 5,360 | 4,400 | — | 5,572 | 62 | — | ||||||||||||||||||
| American Funds Global Bond HLS Fund | 1,092 | 825 | — | 962 | 316 | — | ||||||||||||||||||
| American Funds Global Growth and Income HLS Fund | 1,976 | — | — | 1,921 | — | — | ||||||||||||||||||
| American Funds Global Growth HLS Fund | 313 | 324 | — | 363 | — | — | ||||||||||||||||||
| American Funds Global Small Capitalization HLS Fund | 648 | 4,957 | — | 866 | 360 | — | ||||||||||||||||||
| American Funds Growth HLS Fund | 1,117 | 975 | — | 10 | — | — | ||||||||||||||||||
| American Funds Growth-Income HLS Fund | 2,243 | — | — | 2 | — | — | ||||||||||||||||||
| American Funds International HLS Fund | 3,474 | — | — | 3,792 | — | — | ||||||||||||||||||
| American Funds New World HLS Fund | 835 | 2,795 | — | 797 | — | — | ||||||||||||||||||
| (a) | The Funds designate these distributions as long-term capital dividends per IRC code Sec. 852(b) (3) (C). |
As of December 31, 2012, the components of distributable earnings (deficit) on a tax basis were as follows:
| Undistributed Ordinary Income | Undistributed Long-Term Capital Gain | Accumulated Capital and Other Losses | Unrealized Appreciation (Depreciation)@ | Total Accumulated Earnings (Deficit) | ||||||||||||||||
| American Funds Asset Allocation HLS Fund | $ | 1,042 | $ | 4,503 | $ | – | $ | 11,167 | $ | 16,712 | ||||||||||
| American Funds Blue Chip Income and Growth HLS Fund | 628 | 2,802 | – | 6,325 | 9,755 | |||||||||||||||
| American Funds Bond HLS Fund | 4,314 | 5,996 | – | 11,222 | 21,532 | |||||||||||||||
| American Funds Global Bond HLS Fund | 887 | 1,720 | – | 2,023 | 4,630 | |||||||||||||||
| American Funds Global Growth and Income HLS Fund | 1,597 | 987 | – | 20,121 | 22,705 | |||||||||||||||
| American Funds Global Growth HLS Fund | 147 | 1,739 | – | 6,505 | 8,391 | |||||||||||||||
| American Funds Global Small Capitalization HLS Fund | 560 | 5,593 | – | 7,950 | 14,103 | |||||||||||||||
| American Funds Growth HLS Fund | 1,685 | 10,748 | – | 111,301 | 123,734 | |||||||||||||||
| American Funds Growth-Income HLS Fund | 2,338 | 2,360 | – | 49,674 | 54,372 | |||||||||||||||
| American Funds International HLS Fund | 2,543 | 4,232 | – | 33,281 | 40,056 | |||||||||||||||
| American Funds New World HLS Fund | 324 | 4,907 | – | 7,476 | 12,707 | |||||||||||||||
| @ | The difference between book-basis and tax-basis unrealized appreciation (depreciation) is attributable primarily to the tax deferral of wash sale losses. |
| d) | Reclassification of Capital Accounts – The Funds may record reclassifications in their capital accounts. These reclassifications have no impact on the total net assets of the Funds. The reclassifications are a result of permanent differences between U.S. GAAP and tax accounting for items such as net operating losses that reduce distribution requirements. Adjustments are made to reflect the impact these items have on current and future distributions to shareholders. Therefore, the source of a Fund’s distributable income may be shown in the accompanying Statement of |
| 31 |
| Hartford Series Fund, Inc. |
| Notes to Financial Statements – (continued) |
| June 30, 2013 (Unaudited) |
| (000’s Omitted) |
Assets and Liabilities as from net investment income, from net realized gains on investments or from capital depending on the type of book and tax differences that exist. For the year ended December 31, 2012, the Funds recorded the following reclassifications to increase (decrease) the accounts listed below.
| Net Investment Income | Net Realized Gain (Loss) | Paid-in- Capital | ||||||||||
| American Funds Global Bond HLS Fund | $ | 182 | $ | (182 | ) | $ | – | |||||
| e) | Capital Loss Carryforward – On December 22, 2010, the Regulated Investment Company Modernization Act of 2010 (the “Act”) was enacted, which made changes to the capital loss carryforward rules. The changes are effective for taxable years beginning after the date of enactment. Under the Act, funds are permitted to carry forward capital losses for an unlimited period. However, any losses incurred during those future taxable years will be required to be utilized prior to the losses incurred in pre-enactment taxable years, which carry an expiration date. As a result of this ordering rule, pre-enactment capital loss carryforwards may be more likely to expire unused. Additionally, post-enactment capital loss carryforwards retain their character as either short-term or long-term capital losses rather than being considered all short-term as permitted under prior regulation. |
The Funds had no capital loss carryforward for U.S. federal income tax purposes as of December 31, 2012.
During the year ended December 31, 2012, the following Funds utilized prior year capital loss carryforwards:
| Amount | ||||
| American Funds Global Growth and Income HLS Fund | $ | 1,801 | ||
| American Funds Growth-Income HLS Fund | 782 | |||
| American Funds International HLS Fund | 304 | |||
| f) | Accounting for Uncertainty in Income Taxes – The Funds have adopted financial reporting rules that require the Funds to analyze all open tax years, as defined by the Statute of Limitations, for all major jurisdictions. Generally, tax authorities can examine all tax returns filed for the last three years. The Funds do not have an examination in progress. |
The Funds have reviewed all open tax years and major jurisdictions and concluded that these financial reporting rules have no effect on the Funds’ financial positions or results of operations. There is no tax liability resulting from unrecognized tax benefits relating to uncertain income tax positions taken or expected to be taken on the tax returns for the fiscal year-end December 31, 2012. The Funds are also not aware of any tax positions for which it is reasonably possible that the total amounts of unrecognized tax benefits will significantly change in the next twelve months.
| 5. | Expenses: |
| a) | Investment Management Agreement – Hartford Funds Management Company, LLC (“HFMC”), an indirect wholly owned subsidiary of The Hartford Financial Services Group, Inc. (“The Hartford”), serves as investment manager to the Funds pursuant to an Investment Management Agreement with the Company. The investment manager has overall investment supervisory responsibility for each Fund. In addition, the investment manager provides administrative personnel, services, equipment, facilities and office space for proper operation of the Funds. |
| 32 |
The schedule below reflects the rates of compensation as a percentage of each Fund’s average daily net assets paid to the investment manager for investment management services rendered during the six-month period ended June 30, 2013. The rates are accrued daily and paid monthly:
| Fund | Annual Rate* | |||
| American Funds Asset Allocation HLS Fund | 0.65 | % | ||
| American Funds Blue Chip Income and Growth HLS Fund | 0.75 | % | ||
| American Funds Bond HLS Fund | 0.50 | % | ||
| American Funds Global Bond HLS Fund | 0.75 | % | ||
| American Funds Global Growth and Income HLS Fund | 0.80 | % | ||
| American Funds Global Growth HLS Fund | 1.00 | % | ||
| American Funds Global Small Capitalization HLS Fund | 0.80 | % | ||
| American Funds Growth HLS Fund | 0.75 | % | ||
| American Funds Growth-Income HLS Fund | 0.70 | % | ||
| American Funds International HLS Fund | 0.85 | % | ||
| American Funds New World HLS Fund | 1.10 | % | ||
| * | The investment manager has entered into an agreement under which it will waive a portion of its investment management fee with respect to each Fund for as long as that Fund is invested in its corresponding Underlying Fund. The net investment management fee under the agreement with the investment manager, after giving effect to the waiver, is 0.25% of the average daily net assets for each Fund. |
| b) | Accounting Services Agreement – Pursuant to the Fund Accounting Agreement between HFMC and the Company, on behalf of the Funds, HFMC provides accounting services to the Funds and receives monthly compensation of 0.01% of each Fund’s average daily net assets. These fees are accrued daily and paid monthly. |
| c) | Other Related Party Transactions – Certain officers of the Funds are directors and/or officers of the investment manager and/or The Hartford or its subsidiaries. For the six-month period ended June 30, 2013, a portion of the Funds’ Chief Compliance Officer’s salary was paid by all the investment companies in the Hartford fund complex. The portion allocated to the Funds was in the amount of $1. These fees are accrued daily and paid monthly. |
| d) | Operating Expenses – Allocable expenses incurred by the Company are allocated to each Fund in proportion to the average daily net assets of each Fund, except where allocation of certain expenses is more fairly made directly to the Fund. |
| e) | Distribution Plan for Class IB shares – Hartford Funds Distributors, LLC (“HFD”) (formerly known as Hartford Investment Financial Services, LLC), a wholly owned, ultimate subsidiary of The Hartford, serves as the Funds’ principal underwriter and distributor. The Company, on behalf of the Funds, has adopted a Distribution Plan pursuant to Rule 12b-1 of the 1940 Act to compensate the distributor, HFD, from assets attributable to the Class IB shares for services rendered and expenses borne in connection with activities primarily intended to result in the sale of the Class IB shares, subject to the review and approval of the Company’s Board of Directors. |
The Distribution Plan provides that each Fund may pay annually up to 0.25% of the average daily net assets of each Fund attributable to its Class IB shares for activities primarily intended to result in the sale of Class IB shares. The Board has the authority to suspend or reduce these payments at any point in time. Under the terms of the Distribution Plan and the principal underwriting agreement, each Fund is authorized to make payments monthly to the distributor that may be used to pay or compensate entities providing distribution and shareholder servicing with respect to the Class IB shares for such entities’ fees or expenses incurred or paid in that regard. These fees are accrued daily and paid monthly.
| 33 |
| Hartford Series Fund, Inc. |
| Notes to Financial Statements – (continued) |
| June 30, 2013 (Unaudited) |
| (000’s Omitted) |
| 6. | Investment Transactions: |
For the six-month period ended June 30, 2013, aggregate purchases and sales of investments in underlying funds (excluding short-term investments) were as follows:
| Cost of Purchases Excluding U.S. Government Obligations | Sales Proceeds Excluding U.S. Government Obligations | |||||||
| American Funds Asset Allocation HLS Fund | $ | 17,579 | $ | 7,021 | ||||
| American Funds Blue Chip Income and Growth HLS Fund | 3,212 | 5,634 | ||||||
| American Funds Bond HLS Fund | 17,825 | 18,541 | ||||||
| American Funds Global Bond HLS Fund | 1,635 | 7,626 | ||||||
| American Funds Global Growth and Income HLS Fund | 880 | 9,847 | ||||||
| American Funds Global Growth HLS Fund | 562 | 3,913 | ||||||
| American Funds Global Small Capitalization HLS Fund | 1,856 | 5,920 | ||||||
| American Funds Growth HLS Fund | 6,293 | 22,624 | ||||||
| American Funds Growth-Income HLS Fund | 5,798 | 13,931 | ||||||
| American Funds International HLS Fund | 4,596 | 17,938 | ||||||
| American Funds New World HLS Fund | 1,222 | 7,940 | ||||||
| 7. | Line of Credit: |
The Funds, along with several other Hartford funds, participate in a $500 million committed revolving line of credit facility. The facility is to be used for temporary or emergency purposes. Under the arrangement, a fund is required to own securities having a market value in excess of 300% of the total bank borrowings. The interest rate on borrowings varies depending on the nature of the loan. The facility also requires a fee to be paid based on the amount of the commitment. This commitment fee is allocated to all the funds participating in the line of credit based on the average net assets of the funds. During the six-month period ended June 30, 2013, the Funds did not have any borrowings under this facility.
| 8. | Indemnifications: |
Under the Company’s organizational documents, the Company shall indemnify its officers and directors to the full extent required or permitted under Maryland General Corporation Law and the federal securities laws. In addition, the Company, on behalf of the Funds, may enter into contracts that contain a variety of indemnifications. The Company’s maximum exposure under these arrangements is unknown. However, as of the date of these financial statements the Company has not had prior claims or losses pursuant to these contracts and expects the risk of loss to be remote.
| 9. | Pending Legal Proceedings: |
On February 25, 2011, Jennifer L. Kasilag, Louis Mellinger, Judith M. Menendez, Jacqueline M. Robinson, and Linda A. Russell filed a derivative lawsuit against Hartford Investment Financial Services, LLC (“HIFSCO”)(now known as Hartford Funds Distributors, LLC) on behalf of six Hartford retail mutual funds in the United States District Court for the District of New Jersey, alleging that HIFSCO received excessive advisory and distribution fees in violation of its statutory fiduciary duty under Section 36(b) of the 1940 Act when serving as investment manager and principal underwriter, respectively, to the Hartford retail mutual funds. HIFSCO moved to dismiss and, in September 2011, the motion was granted in part and denied in part, with leave to amend the complaint. In November 2011, plaintiffs filed an amended complaint on behalf of certain Hartford retail mutual funds, The Hartford Global Health Fund (now known as The Hartford Healthcare Fund), The Hartford Conservative Allocation Fund, The Hartford Growth Opportunities Fund, The Hartford Inflation Plus Fund, The Hartford Advisers Fund (now known as The Hartford Balanced Fund), and The Hartford Capital Appreciation Fund. Plaintiffs seek to rescind the investment management agreements and distribution plans between HIFSCO and these funds and to recover the total fees charged thereunder or, in the alternative, to recover any improper compensation HIFSCO received, in addition to lost earnings. HIFSCO filed a partial motion to dismiss the amended complaint and, in December 2012, the court dismissed
| 34 |
without prejudice the claims regarding distribution fees and denied the motion with respect to the advisory fees claims. HIFSCO disputes the allegations and intends to defend vigorously.
This action concerns the activities of HIFSCO in its capacity as investment manager and principal underwriter to the Hartford retail mutual funds and does not concern HIFSCO’s activities in its capacity as principal underwriter to the HLS funds. For this reason, no accrual for litigation relating to this matter has been recorded in the financial statements of the Fund.
| 35 |
| Hartford Series Fund, Inc. |
| Financial Highlights |
─ Selected Per-Share Data(A) ─ | ─ Ratios and Supplemental Data ─ | |||||||||||||||||||||||||||||||||||||||||||||||||||||||
Class | Net Asset | Net | Net | Total from | Dividends | Distributions | Total | Net | Total | Net | Ratio of | Ratio of | Ratio of | Portfolio | ||||||||||||||||||||||||||||||||||||||||||
| American Funds Asset Allocation HLS Fund | ||||||||||||||||||||||||||||||||||||||||||||||||||||||||
| For the Six-Month Period Ended June 30, 2013(D) (Unaudited) | ||||||||||||||||||||||||||||||||||||||||||||||||||||||||
| IB | $ | 11.04 | $ | 0.01 | $ | 1.11 | $ | 1.12 | $ | – | $ | – | $ | – | $ | 12.16 | 10.11 | %(E) | $ | 81,686 | 0.95 | %(F) | 0.55 | %(F) | 0.24 | %(F) | 10 | % | ||||||||||||||||||||||||||||
| For the Year Ended December 31, 2012 | ||||||||||||||||||||||||||||||||||||||||||||||||||||||||
| IB | 9.70 | 0.19 | 1.34 | 1.53 | (0.17 | ) | (0.02 | ) | (0.19 | ) | 11.04 | 15.80 | 64,616 | 0.95 | 0.55 | 1.56 | 14 | |||||||||||||||||||||||||||||||||||||||
| For the Year Ended December 31, 2011 | ||||||||||||||||||||||||||||||||||||||||||||||||||||||||
| IB | 9.74 | 0.14 | (0.05 | ) | 0.09 | (0.13 | ) | – | (0.13 | ) | 9.70 | 1.02 | 64,356 | 0.95 | 0.55 | 1.61 | 9 | |||||||||||||||||||||||||||||||||||||||
| For the Year Ended December 31, 2010 | ||||||||||||||||||||||||||||||||||||||||||||||||||||||||
| IB | 8.85 | 0.14 | 0.91 | 1.05 | (0.16 | ) | – | (0.16 | ) | 9.74 | 12.13 | 58,326 | 0.95 | 0.55 | 1.73 | 11 | ||||||||||||||||||||||||||||||||||||||||
| For the Year Ended December 31, 2009(D) | ||||||||||||||||||||||||||||||||||||||||||||||||||||||||
| IB | 7.31 | 0.18 | 1.53 | 1.71 | (0.14 | ) | (0.03 | ) | (0.17 | ) | 8.85 | 23.59 | 48,568 | 0.95 | 0.55 | 2.33 | 8 | |||||||||||||||||||||||||||||||||||||||
| From (commencement of operations) April 30, 2008 through December 31, 2008 | ||||||||||||||||||||||||||||||||||||||||||||||||||||||||
| IB | 10.00 | 0.19 | (2.88 | ) | (2.69 | ) | – | – | – | 7.31 | (26.88 | )(E) | 26,312 | 0.99 | (F) | 0.59 | (F) | 8.02 | (F) | – | ||||||||||||||||||||||||||||||||||||
| American Funds Blue Chip Income and Growth HLS Fund | ||||||||||||||||||||||||||||||||||||||||||||||||||||||||
| For the Six-Month Period Ended June 30, 2013 (Unaudited) | ||||||||||||||||||||||||||||||||||||||||||||||||||||||||
| IB | 10.11 | 0.03 | 1.41 | 1.44 | – | – | – | 11.55 | 14.29 | (E) | 43,086 | 1.06 | (F) | 0.56 | (F) | 0.30 | (F) | 7 | ||||||||||||||||||||||||||||||||||||||
| For the Year Ended December 31, 2012 | ||||||||||||||||||||||||||||||||||||||||||||||||||||||||
| IB | 9.07 | 0.15 | 1.07 | 1.22 | (0.12 | ) | (0.06 | ) | (0.18 | ) | 10.11 | 13.53 | 39,920 | 1.07 | 0.57 | 1.67 | 23 | |||||||||||||||||||||||||||||||||||||||
| For the Year Ended December 31, 2011 | ||||||||||||||||||||||||||||||||||||||||||||||||||||||||
| IB | 9.18 | 0.13 | (0.24 | ) | (0.11 | ) | – | – | – | 9.07 | (1.19 | ) | 32,425 | 1.07 | 0.57 | 1.44 | 14 | |||||||||||||||||||||||||||||||||||||||
| For the Year Ended December 31, 2010 | ||||||||||||||||||||||||||||||||||||||||||||||||||||||||
| IB | 8.44 | 0.12 | 0.86 | 0.98 | (0.24 | ) | – | (0.24 | ) | 9.18 | 11.98 | 34,030 | 1.07 | 0.57 | 1.48 | 11 | ||||||||||||||||||||||||||||||||||||||||
| For the Year Ended December 31, 2009(D) | ||||||||||||||||||||||||||||||||||||||||||||||||||||||||
| IB | 6.74 | 0.15 | 1.68 | 1.83 | (0.09 | ) | (0.04 | ) | (0.13 | ) | 8.44 | 27.46 | 29,030 | 1.07 | 0.57 | 2.06 | 6 | |||||||||||||||||||||||||||||||||||||||
| From (commencement of operations) April 30, 2008 through December 31, 2008 | ||||||||||||||||||||||||||||||||||||||||||||||||||||||||
| IB | 10.00 | 0.14 | (3.40 | ) | (3.26 | ) | – | – | – | 6.74 | (32.64 | )(E) | 13,182 | 1.17 | (F) | 0.67 | (F) | 6.79 | (F) | 3 | ||||||||||||||||||||||||||||||||||||
| American Funds Bond HLS Fund | ||||||||||||||||||||||||||||||||||||||||||||||||||||||||
| For the Six-Month Period Ended June 30, 2013 (Unaudited) | ||||||||||||||||||||||||||||||||||||||||||||||||||||||||
| IB | 10.52 | 0.02 | (0.31 | ) | (0.29 | ) | – | – | – | 10.23 | (2.74 | )(E) | 190,539 | 0.79 | (F) | 0.54 | (F) | 0.30 | (F) | 9 | ||||||||||||||||||||||||||||||||||||
| For the Year Ended December 31, 2012 | ||||||||||||||||||||||||||||||||||||||||||||||||||||||||
| IB | 10.52 | 0.23 | 0.29 | 0.52 | (0.29 | ) | (0.23 | ) | (0.52 | ) | 10.52 | 5.01 | 199,008 | 0.79 | 0.54 | 2.13 | 15 | |||||||||||||||||||||||||||||||||||||||
| For the Year Ended December 31, 2011 | ||||||||||||||||||||||||||||||||||||||||||||||||||||||||
| IB | 10.21 | 0.29 | 0.30 | 0.59 | (0.28 | ) | – | (0.28 | ) | 10.52 | 5.84 | 198,203 | 0.79 | 0.54 | 2.57 | 15 | ||||||||||||||||||||||||||||||||||||||||
| For the Year Ended December 31, 2010 | ||||||||||||||||||||||||||||||||||||||||||||||||||||||||
| IB | 9.84 | 0.26 | 0.35 | 0.61 | (0.24 | ) | – | (0.24 | ) | 10.21 | 6.15 | 206,360 | 0.80 | 0.55 | 2.75 | 13 | ||||||||||||||||||||||||||||||||||||||||
| For the Year Ended December 31, 2009(D) | ||||||||||||||||||||||||||||||||||||||||||||||||||||||||
| IB | 8.98 | 0.35 | 0.74 | 1.09 | (0.23 | ) | – | (0.23 | ) | 9.84 | 12.23 | 181,550 | 0.78 | 0.53 | 3.75 | 2 | ||||||||||||||||||||||||||||||||||||||||
| From (commencement of operations) April 30, 2008 through December 31, 2008 | ||||||||||||||||||||||||||||||||||||||||||||||||||||||||
| IB | 10.00 | 0.44 | (1.46 | ) | (1.02 | ) | – | – | – | 8.98 | (10.21 | )(E) | 67,597 | 0.80 | (F) | 0.55 | (F) | 16.32 | (F) | 5 | ||||||||||||||||||||||||||||||||||||
| 36 |
| Hartford Series Fund, Inc. |
| Financial Highlights – (continued) |
─ Selected Per-Share Data(A) ─ | ─ Ratios and Supplemental Data ─ | |||||||||||||||||||||||||||||||||||||||||||||||||||||||
Class | Net Asset | Net | Net | Total from | Dividends | Distributions | Total | Net | Total | Net | Ratio of | Ratio of | Ratio of | Portfolio | ||||||||||||||||||||||||||||||||||||||||||
| American Funds Global Bond HLS Fund | ||||||||||||||||||||||||||||||||||||||||||||||||||||||||
| For the Six-Month Period Ended June 30, 2013(D) (Unaudited) | ||||||||||||||||||||||||||||||||||||||||||||||||||||||||
| IB | $ | 11.10 | $ | (0.03 | ) | $ | (0.55 | ) | $ | (0.58 | ) | $ | – | $ | – | $ | – | $ | 10.52 | (5.22 | )%(E) | $ | 30,042 | 1.07 | %(F) | 0.57 | %(F) | (0.57 | )%(F) | 5 | % | |||||||||||||||||||||||||
| For the Year Ended December 31, 2012 | ||||||||||||||||||||||||||||||||||||||||||||||||||||||||
| IB | 11.02 | 0.24 | 0.38 | 0.62 | (0.31 | ) | (0.23 | ) | (0.54 | ) | 11.10 | 5.83 | 38,193 | 1.07 | 0.57 | 1.69 | 8 | |||||||||||||||||||||||||||||||||||||||
| For the Year Ended December 31, 2011 | ||||||||||||||||||||||||||||||||||||||||||||||||||||||||
| IB | 10.86 | 0.23 | 0.24 | 0.47 | (0.23 | ) | (0.08 | ) | (0.31 | ) | 11.02 | 4.28 | 44,352 | 1.06 | 0.56 | 2.56 | 16 | |||||||||||||||||||||||||||||||||||||||
| For the Year Ended December 31, 2010 | ||||||||||||||||||||||||||||||||||||||||||||||||||||||||
| IB | 10.47 | 0.27 | 0.24 | 0.51 | (0.11 | ) | (0.01 | ) | (0.12 | ) | 10.86 | 4.85 | 38,654 | 1.07 | 0.57 | 2.49 | 17 | |||||||||||||||||||||||||||||||||||||||
| For the Year Ended December 31, 2009(D) | ||||||||||||||||||||||||||||||||||||||||||||||||||||||||
| IB | 9.85 | 0.13 | 0.79 | 0.92 | (0.30 | ) | – | (0.30 | ) | 10.47 | 9.43 | 38,533 | 1.06 | 0.56 | 1.29 | 5 | ||||||||||||||||||||||||||||||||||||||||
| From (commencement of operations) April 30, 2008 through December 31, 2008 | ||||||||||||||||||||||||||||||||||||||||||||||||||||||||
| IB | 10.00 | 0.42 | (0.57 | ) | (0.15 | ) | – | – | – | 9.85 | (1.51 | )(E) | 22,386 | 1.10 | (F) | 0.60 | (F) | 13.11 | (F) | 42 | ||||||||||||||||||||||||||||||||||||
| American Funds Global Growth and Income HLS Fund | ||||||||||||||||||||||||||||||||||||||||||||||||||||||||
| For the Six-Month Period Ended June 30, 2013(D) (Unaudited) | ||||||||||||||||||||||||||||||||||||||||||||||||||||||||
| IB | 9.58 | 0.03 | 0.66 | 0.69 | – | – | – | 10.27 | 7.20 | (E) | 71,020 | 1.10 | (F) | 0.55 | (F) | 0.69 | (F) | 1 | ||||||||||||||||||||||||||||||||||||||
| For the Year Ended December 31, 2012 | ||||||||||||||||||||||||||||||||||||||||||||||||||||||||
| IB | 8.38 | 0.23 | 1.20 | 1.43 | (0.23 | ) | – | (0.23 | ) | 9.58 | 17.30 | 74,927 | 1.10 | 0.55 | 2.05 | 5 | ||||||||||||||||||||||||||||||||||||||||
| For the Year Ended December 31, 2011 | ||||||||||||||||||||||||||||||||||||||||||||||||||||||||
| IB | 9.06 | 0.22 | (0.70 | ) | (0.48 | ) | (0.20 | ) | – | (0.20 | ) | 8.38 | (5.19 | ) | 78,639 | 1.09 | 0.54 | 2.30 | 5 | |||||||||||||||||||||||||||||||||||||
| For the Year Ended December 31, 2010 | ||||||||||||||||||||||||||||||||||||||||||||||||||||||||
| IB | 8.30 | 0.20 | 0.72 | 0.92 | (0.16 | ) | – | (0.16 | ) | 9.06 | 11.41 | 91,254 | 1.10 | 0.55 | 2.25 | 8 | ||||||||||||||||||||||||||||||||||||||||
| For the Year Ended December 31, 2009(D) | ||||||||||||||||||||||||||||||||||||||||||||||||||||||||
| IB | 6.06 | 0.16 | 2.21 | 2.37 | (0.13 | ) | – | (0.13 | ) | 8.30 | 39.37 | 88,762 | 1.09 | 0.54 | 2.39 | 3 | ||||||||||||||||||||||||||||||||||||||||
| From (commencement of operations) April 30, 2008 through December 31, 2008 | ||||||||||||||||||||||||||||||||||||||||||||||||||||||||
| IB | 10.00 | 0.17 | (4.11 | ) | (3.94 | ) | – | – | – | 6.06 | (39.43 | )(E) | 44,065 | 1.11 | (F) | 0.56 | (F) | 8.24 | (F) | – | ||||||||||||||||||||||||||||||||||||
| American Funds Global Growth HLS Fund | ||||||||||||||||||||||||||||||||||||||||||||||||||||||||
| For the Six-Month Period Ended June 30, 2013 (Unaudited) | ||||||||||||||||||||||||||||||||||||||||||||||||||||||||
| IB | 10.45 | 0.01 | 0.76 | 0.77 | – | – | – | 11.22 | 7.29 | (E) | 27,753 | 1.33 | (F) | 0.58 | (F) | 0.13 | (F) | 2 | ||||||||||||||||||||||||||||||||||||||
| For the Year Ended December 31, 2012 | ||||||||||||||||||||||||||||||||||||||||||||||||||||||||
| IB | 8.74 | 0.06 | 1.86 | 1.92 | (0.10 | ) | (0.11 | ) | (0.21 | ) | 10.45 | 22.19 | 29,055 | 1.33 | 0.58 | 0.48 | 4 | |||||||||||||||||||||||||||||||||||||||
| For the Year Ended December 31, 2011 | ||||||||||||||||||||||||||||||||||||||||||||||||||||||||
| IB | 9.74 | 0.10 | (0.99 | ) | (0.89 | ) | (0.11 | ) | – | (0.11 | ) | 8.74 | (9.18 | ) | 29,319 | 1.32 | 0.57 | 0.95 | 11 | |||||||||||||||||||||||||||||||||||||
| For the Year Ended December 31, 2010 | ||||||||||||||||||||||||||||||||||||||||||||||||||||||||
| IB | 8.83 | 0.10 | 0.89 | 0.99 | (0.08 | ) | – | (0.08 | ) | 9.74 | 11.41 | 34,245 | 1.32 | 0.57 | 1.17 | 11 | ||||||||||||||||||||||||||||||||||||||||
| For the Year Ended December 31, 2009(D) | ||||||||||||||||||||||||||||||||||||||||||||||||||||||||
| IB | 6.40 | 0.09 | 2.57 | 2.66 | (0.12 | ) | (0.11 | ) | (0.23 | ) | 8.83 | 41.78 | 30,457 | 1.32 | 0.57 | 1.24 | 12 | |||||||||||||||||||||||||||||||||||||||
| From (commencement of operations) April 30, 2008 through December 31, 2008 | ||||||||||||||||||||||||||||||||||||||||||||||||||||||||
| IB | 10.00 | 0.15 | (3.75 | ) | (3.60 | ) | – | – | – | 6.40 | (35.95 | )(E) | 15,490 | 1.37 | (F) | 0.62 | (F) | 5.68 | (F) | – | ||||||||||||||||||||||||||||||||||||
| 37 |
| Hartford Series Fund, Inc. |
| Financial Highlights – (continued) |
─ Selected Per-Share Data(A) ─ | ─ Ratios and Supplemental Data ─ | |||||||||||||||||||||||||||||||||||||||||||||||||||||||
Class | Net Asset | Net | Net | Total from | Dividends | Distributions | Total | Net | Total | Net | Ratio of | Ratio of | Ratio of | Portfolio | ||||||||||||||||||||||||||||||||||||||||||
| American Funds Global Small Capitalization HLS Fund | ||||||||||||||||||||||||||||||||||||||||||||||||||||||||
| For the Six-Month Period Ended June 30, 2013 (Unaudited) | ||||||||||||||||||||||||||||||||||||||||||||||||||||||||
| IB | $ | 8.29 | $ | 0.06 | $ | 0.66 | $ | 0.72 | $ | – | $ | – | $ | – | $ | 9.01 | 8.78 | %(D) | $ | 54,191 | 1.11 | %(E) | 0.56 | %(E) | 1.25 | %(E) | 3 | % | ||||||||||||||||||||||||||||
| For the Year Ended December 31, 2012 | ||||||||||||||||||||||||||||||||||||||||||||||||||||||||
| IB | 7.83 | 0.10 | 1.23 | 1.33 | (0.10 | ) | (0.77 | ) | (0.87 | ) | 8.29 | 17.85 | 53,881 | 1.11 | 0.56 | 0.99 | 4 | |||||||||||||||||||||||||||||||||||||||
| For the Year Ended December 31, 2011 | ||||||||||||||||||||||||||||||||||||||||||||||||||||||||
| IB | 9.92 | 0.10 | (2.01 | ) | (1.91 | ) | (0.13 | ) | (0.05 | ) | (0.18 | ) | 7.83 | (19.40 | ) | 55,658 | 1.11 | 0.56 | 0.98 | 11 | ||||||||||||||||||||||||||||||||||||
| For the Year Ended December 31, 2010 | ||||||||||||||||||||||||||||||||||||||||||||||||||||||||
| IB | 8.13 | 0.11 | 1.68 | 1.79 | – | – | – | 9.92 | 22.06 | 74,999 | 1.12 | 0.57 | 1.35 | 16 | ||||||||||||||||||||||||||||||||||||||||||
| For the Year Ended December 31, 2009(F) | ||||||||||||||||||||||||||||||||||||||||||||||||||||||||
| IB | 5.10 | – | 3.08 | 3.08 | – | (0.05 | ) | (0.05 | ) | 8.13 | 60.77 | 61,519 | 1.10 | 0.55 | 0.02 | 10 | ||||||||||||||||||||||||||||||||||||||||
| From (commencement of operations) April 30, 2008 through December 31, 2008 | ||||||||||||||||||||||||||||||||||||||||||||||||||||||||
| IB | 10.00 | (0.01 | ) | (4.89 | ) | (4.90 | ) | – | – | – | 5.10 | (49.04 | )(D) | 19,807 | 1.16 | (E) | 0.61 | (E) | (0.62 | )(E) | – | |||||||||||||||||||||||||||||||||||
| American Funds Growth HLS Fund | ||||||||||||||||||||||||||||||||||||||||||||||||||||||||
| For the Six-Month Period Ended June 30, 2013 (Unaudited) | ||||||||||||||||||||||||||||||||||||||||||||||||||||||||
| IB | 10.45 | 0.02 | 1.03 | 1.05 | – | – | – | 11.50 | 10.04 | (D) | 350,164 | 1.04 | (E) | 0.54 | (E) | 0.34 | (E) | 2 | ||||||||||||||||||||||||||||||||||||||
| For the Year Ended December 31, 2012 | ||||||||||||||||||||||||||||||||||||||||||||||||||||||||
| IB | 8.95 | 0.05 | 1.51 | 1.56 | (0.03 | ) | (0.03 | ) | (0.06 | ) | 10.45 | 17.56 | 333,889 | 1.04 | 0.54 | 0.50 | 4 | |||||||||||||||||||||||||||||||||||||||
| For the Year Ended December 31, 2011 | ||||||||||||||||||||||||||||||||||||||||||||||||||||||||
| IB | 9.38 | 0.03 | (0.46 | ) | (0.43 | ) | – | – | – | 8.95 | (4.57 | ) | 317,968 | 1.04 | 0.54 | 0.33 | 5 | |||||||||||||||||||||||||||||||||||||||
| For the Year Ended December 31, 2010 | ||||||||||||||||||||||||||||||||||||||||||||||||||||||||
| IB | 7.96 | 0.04 | 1.42 | 1.46 | (0.04 | ) | – | (0.04 | ) | 9.38 | 18.36 | 356,162 | 1.05 | 0.55 | 0.43 | 7 | ||||||||||||||||||||||||||||||||||||||||
| For the Year Ended December 31, 2009(F) | ||||||||||||||||||||||||||||||||||||||||||||||||||||||||
| IB | 5.81 | 0.03 | 2.22 | 2.25 | (0.03 | ) | (0.07 | ) | (0.10 | ) | 7.96 | 39.02 | 296,659 | 1.03 | 0.53 | 0.47 | 3 | |||||||||||||||||||||||||||||||||||||||
| From (commencement of operations) April 30, 2008 through December 31, 2008 | ||||||||||||||||||||||||||||||||||||||||||||||||||||||||
| IB | 10.00 | 0.07 | (4.18 | ) | (4.11 | ) | (0.08 | ) | – | (0.08 | ) | 5.81 | (41.18 | )(D) | 122,888 | 1.03 | (E) | 0.53 | (E) | 3.39 | (E) | – | ||||||||||||||||||||||||||||||||||
| American Funds Growth-Income HLS Fund | ||||||||||||||||||||||||||||||||||||||||||||||||||||||||
| For the Six-Month Period Ended June 30, 2013(F) (Unaudited) | ||||||||||||||||||||||||||||||||||||||||||||||||||||||||
| IB | 10.20 | 0.01 | 1.17 | 1.18 | – | – | – | 11.38 | 11.58 | (D) | 196,045 | 0.99 | (E) | 0.54 | (E) | 0.18 | (E) | 3 | ||||||||||||||||||||||||||||||||||||||
| For the Year Ended December 31, 2012 | ||||||||||||||||||||||||||||||||||||||||||||||||||||||||
| IB | 8.81 | 0.13 | 1.38 | 1.51 | (0.12 | ) | – | (0.12 | ) | 10.20 | 17.16 | 183,220 | 0.99 | 0.54 | 1.29 | 9 | ||||||||||||||||||||||||||||||||||||||||
| For the Year Ended December 31, 2011 | ||||||||||||||||||||||||||||||||||||||||||||||||||||||||
| IB | 9.00 | 0.12 | (0.31 | ) | (0.19 | ) | – | – | – | 8.81 | (2.12 | ) | 170,059 | 0.98 | 0.53 | 1.26 | 5 | |||||||||||||||||||||||||||||||||||||||
| For the Year Ended December 31, 2010 | ||||||||||||||||||||||||||||||||||||||||||||||||||||||||
| IB | 8.20 | 0.10 | 0.81 | 0.91 | (0.11 | ) | – | (0.11 | ) | 9.00 | 11.11 | 185,836 | 0.99 | 0.54 | 1.19 | 8 | ||||||||||||||||||||||||||||||||||||||||
| For the Year Ended December 31, 2009(F) | ||||||||||||||||||||||||||||||||||||||||||||||||||||||||
| IB | 6.39 | 0.11 | 1.86 | 1.97 | (0.11 | ) | (0.05 | ) | (0.16 | ) | 8.20 | 30.85 | 168,690 | 0.98 | 0.53 | 1.56 | 1 | |||||||||||||||||||||||||||||||||||||||
| From (commencement of operations) April 30, 2008 through December 31, 2008 | ||||||||||||||||||||||||||||||||||||||||||||||||||||||||
| IB | 10.00 | 0.13 | (3.63 | ) | (3.50 | ) | (0.11 | ) | – | (0.11 | ) | 6.39 | (34.98 | )(D) | 74,039 | 0.99 | (E) | 0.54 | (E) | 5.87 | (E) | – | ||||||||||||||||||||||||||||||||||
| 38 |
─ Selected Per-Share Data(A) ─ | ─ Ratios and Supplemental Data ─ | |||||||||||||||||||||||||||||||||||||||||||||||||||||||
Class | Net Asset | Net | Net | Total from | Dividends | Distributions | Total | Net | Total | Net | Ratio of | Ratio of | Ratio of | Portfolio | ||||||||||||||||||||||||||||||||||||||||||
| American Funds International HLS Fund | ||||||||||||||||||||||||||||||||||||||||||||||||||||||||
| For the Six-Month Period Ended June 30, 2013 (Unaudited) | ||||||||||||||||||||||||||||||||||||||||||||||||||||||||
| IB | $ | 8.73 | $ | 0.02 | $ | 0.26 | $ | 0.28 | $ | – | $ | – | $ | – | $ | 9.01 | 3.14 | %(D) | $ | 218,871 | 1.14 | %(E) | 0.54 | %(E) | 0.27 | %(E) | 2 | % | ||||||||||||||||||||||||||||
| For the Year Ended December 31, 2012 | ||||||||||||||||||||||||||||||||||||||||||||||||||||||||
| IB | 7.54 | 0.10 | 1.22 | 1.32 | (0.13 | ) | – | (0.13 | ) | 8.73 | 17.58 | 225,298 | 1.14 | 0.54 | 1.15 | 7 | ||||||||||||||||||||||||||||||||||||||||
| For the Year Ended December 31, 2011 | ||||||||||||||||||||||||||||||||||||||||||||||||||||||||
| IB | 8.96 | 0.13 | (1.40 | ) | (1.27 | ) | (0.15 | ) | – | (0.15 | ) | 7.54 | (14.23 | ) | 208,399 | 1.14 | 0.54 | 1.52 | 9 | |||||||||||||||||||||||||||||||||||||
| For the Year Ended December 31, 2010 | ||||||||||||||||||||||||||||||||||||||||||||||||||||||||
| IB | 8.50 | 0.13 | 0.44 | 0.57 | (0.08 | ) | (0.03 | ) | (0.11 | ) | 8.96 | 6.92 | 235,702 | 1.16 | 0.56 | 1.78 | 7 | |||||||||||||||||||||||||||||||||||||||
| For the Year Ended December 31, 2009(F) | ||||||||||||||||||||||||||||||||||||||||||||||||||||||||
| IB | 6.09 | 0.11 | 2.48 | 2.59 | (0.11 | ) | (0.07 | ) | (0.18 | ) | 8.50 | 42.75 | 197,258 | 1.13 | 0.53 | 1.53 | 7 | |||||||||||||||||||||||||||||||||||||||
| From (commencement of operations) April 30, 2008 through December 31, 2008 | ||||||||||||||||||||||||||||||||||||||||||||||||||||||||
| IB | 10.00 | 0.16 | (4.07 | ) | (3.91 | ) | – | – | – | 6.09 | (39.10 | )(D) | 78,825 | 1.14 | (E) | 0.54 | (E) | 8.05 | (E) | – | ||||||||||||||||||||||||||||||||||||
| American Funds New World HLS Fund | ||||||||||||||||||||||||||||||||||||||||||||||||||||||||
| For the Six-Month Period Ended June 30, 2013 (Unaudited) | ||||||||||||||||||||||||||||||||||||||||||||||||||||||||
| IB | 9.46 | 0.01 | (0.25 | ) | (0.24 | ) | – | – | – | 9.22 | (2.54 | )(D) | 43,596 | 1.42 | (E) | 0.57 | (E) | 0.08 | (E) | 2 | ||||||||||||||||||||||||||||||||||||
| For the Year Ended December 31, 2012 | ||||||||||||||||||||||||||||||||||||||||||||||||||||||||
| IB | 8.66 | 0.07 | 1.38 | 1.45 | (0.15 | ) | (0.50 | ) | (0.65 | ) | 9.46 | 17.47 | 51,697 | 1.41 | 0.56 | 0.61 | 8 | |||||||||||||||||||||||||||||||||||||||
| For the Year Ended December 31, 2011 | ||||||||||||||||||||||||||||||||||||||||||||||||||||||||
| IB | 10.24 | 0.15 | (1.60 | ) | (1.45 | ) | (0.13 | ) | – | (0.13 | ) | 8.66 | (14.23 | ) | 52,569 | 1.41 | 0.56 | 1.33 | 9 | |||||||||||||||||||||||||||||||||||||
| For the Year Ended December 31, 2010 | ||||||||||||||||||||||||||||||||||||||||||||||||||||||||
| IB | 8.80 | 0.11 | 1.42 | 1.53 | (0.09 | ) | – | (0.09 | ) | 10.24 | 17.54 | 72,257 | 1.42 | 0.57 | 1.30 | 12 | ||||||||||||||||||||||||||||||||||||||||
| For the Year Ended December 31, 2009(F) | ||||||||||||||||||||||||||||||||||||||||||||||||||||||||
| IB | 6.00 | 0.10 | 2.84 | 2.94 | (0.08 | ) | (0.06 | ) | (0.14 | ) | 8.80 | 49.14 | 58,578 | 1.40 | 0.55 | 1.44 | 8 | |||||||||||||||||||||||||||||||||||||||
| From (commencement of operations) April 30, 2008 through December 31, 2008 | ||||||||||||||||||||||||||||||||||||||||||||||||||||||||
| IB | 10.00 | 0.11 | (4.11 | ) | (4.00 | ) | – | – | – | 6.00 | (39.97 | )(D) | 23,933 | 1.44 | (E) | 0.59 | (E) | 5.06 | (E) | 1 | ||||||||||||||||||||||||||||||||||||
| (A) | Information presented relates to a share outstanding throughout the indicated period. | |
| (B) | The figures do not include sales charges or other fees which may be applied at the variable life insurance, variable annuity or qualified retirement plan product level. Any such additional sales charges or other fees would lower the Fund's performance. | |
| (C) | Ratios do not include expenses of the Underlying Funds. | |
| (D) | Per share amounts have been calculated using the average shares method. | |
| (E) | Not annualized. | |
| (F) | Annualized. |
| 39 |
| Hartford Series Fund, Inc. |
| Directors and Officers (Unaudited) |
The Board of Directors of the Company appoints officers who are responsible for the day-to-day operations of the Funds and who execute policies formulated by the Directors. Each director serves until his or her death, resignation, or retirement or until the next annual meeting of shareholders is held or until his or her successor is elected and qualifies.
Directors and officers who are employed by or who have a financial interest in The Hartford are considered “interested” persons of the Funds pursuant to the 1940 Act. Each officer and two of the Company’s directors, as noted in the chart below, are “interested” persons of the Funds. Each director serves as a director for The Hartford Mutual Funds, Inc., The Hartford Mutual Funds II, Inc., Hartford Series Fund, Inc., Hartford HLS Series Fund II, Inc., and as a trustee for The Hartford Alternative Strategies Fund, which, as of June 30, 2013, collectively consist of 90 funds. Correspondence may be sent to directors and officers c/o Hartford Mutual Funds, P.O. Box 2999, Hartford, Connecticut 06104-2999, except that correspondence to Mr. Annoni, Mr. Dressen, Ms. Fagely and Ms. Quade may be sent to 500 Bielenberg Drive, Woodbury, Minnesota 55125 and correspondence to Mr. Davey and Mr. Melcher may be sent to 5 Radnor Corporate Center, Suite 300, 100 Matsonford Road, Radnor, Pennsylvania 19087.
The table below sets forth, for each director and officer, his or her name, year of birth, current position with the Company and date first elected or appointed to Hartford Series Fund, Inc. (“HSF”), and Hartford HLS Series Fund II, Inc. (“HSF2”), principal occupation, and, for directors, other directorships held. The Funds’ statement of additional information contains further information on the directors and is available free of charge by calling 1-800-862-6668 or writing to Hartford HLS Funds, c/o Hartford Life Insurance Company, Hartford Life and Annuity Insurance Company, P.O. Box 14293, Lexington, KY 40512-4293.
Information on the aggregate remuneration paid to the directors of the Company can be found in the Statement of Operations herein. The Funds pay to The Hartford a portion of the Chief Compliance Officer’s compensation, but do not pay salaries or compensation to any of their other officers or directors who are employed by The Hartford.
Non-Interested Directors
Lynn S. Birdsong (1946) Director since 2003, Co-Chairman of the Investment Committee
Mr. Birdsong is a private investor. Mr. Birdsong currently serves as a Director of the Sovereign High Yield Investment Company (April 2010 to current). Mr. Birdsong currently serves as an Independent Director of Nomura Partners Funds, Inc. (formerly, The Japan Fund) (March 2003 to current). From 1979 to 2002, Mr. Birdsong was a managing director of Zurich Scudder Investments, an investment management firm. During his employment with Scudder, Mr. Birdsong was an Interested Director of The Japan Fund. Since 1981, Mr. Birdsong has been a partner in Birdsong Company, an advertising specialty firm.
Robert M. Gavin, Jr. (1940) Director since 2002 (HSF) and 1986 (HSF2), Chairman of the Board since 2004
Dr. Gavin is an educational consultant. Prior to September 1, 2001, he was President of Cranbrook Education Community and prior to July 1996, he was President of Macalester College, St. Paul, Minnesota.
Duane E. Hill (1945) Director since 2001 (HSF) and 2002 (HSF2), Chairman of the Nominating Committee
Mr. Hill is Partner of TSG Ventures L.P., a private equity investment company. Mr. Hill is a former partner of TSG Capital Group, a private equity investment firm that served as sponsor and lead investor in leveraged buyouts of middle market companies.
Sandra S. Jaffee (1941) Director since 2005
Ms. Jaffee is the founder and Chief Executive Officer of a private company, Homeworks Concierge, LLC, which provides residential property management services in Westchester County, New York (January 2012 to present). Ms. Jaffee served as Chairman (2008 to 2009) and Chief Executive Officer of Fortent (formerly Searchspace Group), a leading provider of compliance/regulatory technology to financial institutions from August 2005 to August 2009. Ms. Jaffee currently serves as a member of the Board of Directors of Broadridge Financial Solutions as well as a Trustee of Muhlenberg College.
William P. Johnston (1944) Director since 2005, Chairman of the Compliance Committee
In February 2008, Mr. Johnston was elected to the Board of Directors of HCR-ManorCare, Inc. In August 2007, Mr. Johnston was elected to the Board of Directors of LifeCare Holdings, Inc. In July 2006, Mr. Johnston was elected to the Board of Directors of MultiPlan, Inc. and served as a director (July 2006 to August 2010). In June 2006, Mr. Johnston was appointed as Senior Advisor to The Carlyle Group, a global private equity and alternative asset investment firm. In May 2006, Mr. Johnston was elected to the Supervisory Board of Fresenius Medical Care AG & Co. KGaA, after its acquisition of Renal Care Group, Inc. in March 2006.
| 40 |
Phillip O. Peterson (1944) Director since 2002 (HSF) and 2000 (HSF2), Chairman of the Audit Committee
Mr. Peterson is a mutual fund industry consultant. He was a partner of KPMG LLP (an accounting firm) until July 1999. Mr. Peterson joined William Blair Funds in February 2007 as a member of the Board of Trustees. Mr. Peterson also joined the Board of Trustees of Symetra Variable Mutual Funds Trust as a trustee in February 2012.
Lemma W. Senbet (1946) Director since 2005
Dr. Senbet is the William E. Mayer Chair Professor of Finance and Director, Center for Financial Policy, at the University of Maryland, Robert H. Smith School of Business. He was chair of the Finance Department from 1998 to 2006. Previously he was a chaired professor of finance at the University of Wisconsin-Madison. Also, he was director of the Fortis Funds from March 2000 to July 2002. Dr. Senbet served the finance profession in various capacities, including as director of the American Finance Association and President of the Western Finance Association. In 2006, Dr. Senbet was inducted Fellow of Financial Management Association International for his career-long distinguished scholarship and professional service.
Interested Directors and Officers
James E. Davey (1964) Director since 2012, President and Chief Executive Officer since 2010
Mr. Davey serves as Executive Vice President of Hartford Life Insurance Company (“HLIC”) and The Hartford Financial Services Group, Inc. Additionally, Mr. Davey serves as Chairman of the Board and Manager of Hartford Funds Distributors, LLC (“HFD”) and Hartford Administrative Services Company (“HASCO”). Mr. Davey also serves as Manager, President and Chairman of the Board for Hartford Funds Management Company, LLC (“HFMC”). Mr. Davey joined The Hartford in 2002.
Lowndes A. Smith (1939) Director since 1996 (HSF) and 2002 (HSF2), Co-Chairman of the Investment Committee
Mr. Smith served as Vice Chairman of The Hartford from February 1997 to January 2002, as President and Chief Executive Officer of Hartford Life, Inc. from February 1997 to January 2002, and as President and Chief Operating Officer of The Hartford Life Insurance Companies from January 1989 to January 2002. Mr. Smith serves as a Director of White Mountains Insurance Group, Ltd., One Beacon Insurance and Symetra Financial and as Managing Director of Whittington Gray Associates.
Other Officers
Mark A. Annoni (1964) Vice President, Controller and Treasurer since 2012
Mr. Annoni serves as the Assistant Vice President of HLIC (February 2004 to present). Mr. Annoni joined The Hartford in April 2001 as part of The Hartford’s acquisition of Fortis Financial Group (“Fortis”). Prior to joining The Hartford, Mr. Annoni served as Manager of Mutual Fund Accounting at Fortis (July 1997 to April 2001).
Michael R. Dressen (1963) AML Compliance Officer since 2011
Mr. Dressen currently serves as Assistant Vice President of HLIC. He also serves as Chief Compliance Officer and AML Compliance Officer of HASCO and as AML Officer of HFD. Mr. Dressen joined The Hartford in 2005 from State Farm Insurance Companies where he held various positions related to mutual funds, variable products, and property casualty insurance.
Tamara L. Fagely (1958) Vice President since 2002 (HSF) and 1993 (HSF2)
Currently, Ms. Fagely is President and a Director of HASCO, Chief Administrative Officer and Manager of HFMC and a Vice President of HLIC. Ms. Fagely served as a Vice President of HASCO (1998-2013) and Chief Financial Officer of HASCO (2006-2013). She served as Assistant Vice President of HLIC from December 2001 through March 2005. In addition, Ms. Fagely is Manager and Chief Operating Officer of HFD.
Edward P. Macdonald (1967) Vice President, Secretary and Chief Legal Officer since 2005
Mr. Macdonald serves as Vice President of HLIC and Vice President, Chief Legal Officer and Secretary of HFD and HASCO. Mr. Macdonald also serves as Manager, Vice President, Chief Legal Officer and Secretary of HFMC. Mr. Macdonald joined The Hartford in 2005.
| 41 |
| Hartford Series Fund, Inc. |
| Directors and Officers (Unaudited) – (continued) |
Joseph G. Melcher (1973) Vice President and Chief Compliance Officer since 2013(1)
Mr. Melcher currently serves as Vice President of HFMC and HFD. Mr. Melcher joined The Hartford in 2012 from Touchstone Investments, a member of the Western & Southern Financial Group, where he held the position of Vice President and Chief Compliance Officer from 2010 through 2012 and Assistant Vice President, Compliance from 2005 to 2010.
(1) Mr. Melcher was named Vice President and Chief Compliance Officer of HSF and HSF2 on February 6, 2013. Prior to February 6, 2013, Colleen Pernerewski served as Chief Compliance Officer of HSF and HSF2.
Vernon J. Meyer (1964) Vice President since 2006
Mr. Meyer serves as Senior Vice President of HLIC. He also serves as Senior Vice President of HFMC and HFD. Mr. Meyer joined The Hartford in 2004.
Laura S. Quade (1969) Vice President since 2012
Ms. Quade currently serves as Vice President of HASCO and is a Director of Mutual Fund Service Operations. She also serves as Director, Enterprise Operations of HFD and HLIC. Ms. Quade joined The Hartford in 2001 as part of The Hartford’s acquisition of Fortis.
Elizabeth L. Schroeder (1966) Vice President since 2010(2)
Ms. Schroeder currently serves as Assistant Vice President of HLIC. Ms. Schroeder joined HLIC in 1991. She is also an Assistant Vice President of HFMC and HASCO.
(2) Ms. Schroeder served as Vice President of HSF and HSF2 until August 7, 2013.
Martin Swanson (1962) Vice President since 2010
Mr. Swanson is a Vice President of HLIC. Mr. Swanson also serves as Chief Marketing Officer for HFD. Prior to joining HLIC in 1998, Mr. Swanson was a Vice President at PaineWebber, Inc.
HOW TO OBTAIN A COPY OF THE FUND’S PROXY VOTING POLICIES AND VOTING RECORDS (UNAUDITED)
A description of the policies and procedures that the Funds use to determine how to vote proxies relating to portfolio securities and information about how the Fund voted proxies relating to portfolio securities during the most recent twelve-month period ended June 30 are available (1) without charge, upon request, by calling 800-862-6668 and (2) on the SEC’s website at http://www.sec.gov.
QUARTERLY PORTFOLIO HOLDINGS INFORMATION (UNAUDITED)
The Funds file a complete schedule of portfolio holdings with the SEC for the first and third quarters of each fiscal year on Form N-Q. The Funds’ Forms are available (1) without charge, upon request, by calling 800-862-6668 and (2) on the SEC’s website at http://www.sec.gov. The Form N-Q may be reviewed and copied at the SEC’s Public Reference Room in Washington, DC. Information on the operation of the Public Reference Room may be obtained by calling 1-800-SEC-0330.
| 42 |
| Hartford Series Fund, Inc. |
| Expense Example (Unaudited) |
Your Fund's Expenses
As a shareholder of a Fund, you incur two types of costs: (1) transaction costs and (2) ongoing costs including investment management fees, distribution fees, and other fund expenses. This example is intended to help you understand your ongoing costs (in dollars) of investing in a Fund and to compare these costs with the ongoing costs of investing in other mutual funds. The example is based on an investment of $1,000 invested at the beginning of the period and held for the period of December 31, 2012 through June 30, 2013.
Actual Expenses
The first set of columns of the table below provides information about actual account values and actual expenses. You may use the information in this column, together with the amount you invested, to estimate the expenses that you paid over the period. Simply divide your account value by $1,000 (for example, an $8,600 account value divided by $1,000 = 8.6), then multiply the result by the number in the line under the heading entitled “Expenses Paid During Period” to estimate the expenses you paid on your account during this period.
Hypothetical Example for Comparison Purposes
The second set of columns of the table below provides information about hypothetical account values and hypothetical expenses based on a Fund’s actual expense ratio and an assumed rate of return of 5% per year before expenses, which is not the Fund’s actual return. The hypothetical account values and expenses may not be used to estimate the actual ending account balance or expenses you paid for the period. You may use this information to compare the ongoing costs of investing in a Fund and other funds. To do so, compare this 5% hypothetical example with the 5% hypothetical examples that appear in the shareholder reports of the other funds.
Please note that the expenses shown in the table are meant to highlight your ongoing costs only and do not reflect any transactional costs, such as sales charges (loads) and CDSC. Therefore, the second set of columns of the table is useful in comparing ongoing costs only, and will not help you determine the relative total costs of owning different funds. In addition, if these transactional costs were included, your costs would be higher. Expenses are equal to the Fund's annualized expense ratios multiplied by average account value over the period, multiplied by 181/365 (to reflect the one-half year period).
Beginning | Ending | Expenses paid | Beginning | Ending | Expenses paid | Annualized | Days in | Days | ||||||||||||||||||||||||||||
| American Funds Asset Allocation HLS Fund | ||||||||||||||||||||||||||||||||||||
| Class IB | $ | 1,000.00 | $ | 1,101.10 | $ | 2.87 | $ | 1,000.00 | $ | 1,022.07 | $ | 2.76 | 0.55 | % | 181 | 365 | ||||||||||||||||||||
| American Funds Blue Chip Income and Growth HLS Fund | ||||||||||||||||||||||||||||||||||||
| Class IB | $ | 1,000.00 | $ | 1,142.90 | $ | 2.98 | $ | 1,000.00 | $ | 1,022.02 | $ | 2.81 | 0.56 | % | 181 | 365 | ||||||||||||||||||||
| American Funds Bond HLS Fund | ||||||||||||||||||||||||||||||||||||
| Class IB | $ | 1,000.00 | $ | 972.60 | $ | 2.64 | $ | 1,000.00 | $ | 1,022.12 | $ | 2.71 | 0.54 | % | 181 | 365 | ||||||||||||||||||||
| American Funds Global Bond HLS Fund | ||||||||||||||||||||||||||||||||||||
| Class IB | $ | 1,000.00 | $ | 947.80 | $ | 2.75 | $ | 1,000.00 | $ | 1,021.97 | $ | 2.86 | 0.57 | % | 181 | 365 | ||||||||||||||||||||
| American Funds Global Growth and Income HLS Fund | ||||||||||||||||||||||||||||||||||||
| Class IB | $ | 1,000.00 | $ | 1,072.00 | $ | 2.83 | $ | 1,000.00 | $ | 1,022.07 | $ | 2.76 | 0.55 | % | 181 | 365 | ||||||||||||||||||||
| American Funds Global Growth HLS Fund | ||||||||||||||||||||||||||||||||||||
| Class IB | $ | 1,000.00 | $ | 1,072.90 | $ | 2.98 | $ | 1,000.00 | $ | 1,021.92 | $ | 2.91 | 0.58 | % | 181 | 365 | ||||||||||||||||||||
| American Funds Global Small Capitalization HLS Fund | ||||||||||||||||||||||||||||||||||||
| Class IB | $ | 1,000.00 | $ | 1,087.80 | $ | 2.90 | $ | 1,000.00 | $ | 1,022.02 | $ | 2.81 | 0.56 | % | 181 | 365 | ||||||||||||||||||||
| American Funds Growth HLS Fund | ||||||||||||||||||||||||||||||||||||
| Class IB | $ | 1,000.00 | $ | 1,100.40 | $ | 2.81 | $ | 1,000.00 | $ | 1,022.12 | $ | 2.71 | 0.54 | % | 181 | 365 | ||||||||||||||||||||
| American Funds Growth-Income HLS Fund | ||||||||||||||||||||||||||||||||||||
| Class IB | $ | 1,000.00 | $ | 1,115.80 | $ | 2.83 | $ | 1,000.00 | $ | 1,022.12 | $ | 2.71 | 0.54 | % | 181 | 365 | ||||||||||||||||||||
| American Funds International HLS Fund | ||||||||||||||||||||||||||||||||||||
| Class IB | $ | 1,000.00 | $ | 1,031.40 | $ | 2.72 | $ | 1,000.00 | $ | 1,022.12 | $ | 2.71 | 0.54 | % | 181 | 365 | ||||||||||||||||||||
| American Funds New World HLS Fund | ||||||||||||||||||||||||||||||||||||
| Class IB | $ | 1,000.00 | $ | 974.60 | $ | 2.79 | $ | 1,000.00 | $ | 1,021.97 | $ | 2.86 | 0.57 | % | 181 | 365 | ||||||||||||||||||||
| * | The annualized expense ratios for the Funds do not include expenses of the American Funds Insurance Series Underlying Funds (see Note 1 in the Notes to Financial Statements) in which the Funds invest. |
| 43 |
| Hartford Series Fund, Inc. |
| Principal Risks (Unaudited) |
The principal risks of investing in the Funds are described below. Each Fund is exposed to these risks through its investment in the corresponding Underlying Fund.
American Funds Asset Allocation HLS Fund 1,2,3,6,8,9,10,11,12
American Funds Blue Chip Income and Growth HLS Fund 4,6,7,9,11,12
American Funds Bond HLS Fund 2,3,6,8,9,10,11,12,13,16
American Funds Global Bond HLS Fund 2,3,5,6,8,9,10,11,12,14
American Global Growth and Income HLS Fund 4,5,6,7,9,11,12
American Funds Global Growth HLS Fund 5,6,7,9,11,12
American Funds Global Small Capitalization HLS Fund 5,6,7,9,11,12,15
American Funds Growth HLS Fund 6,7,9,11,12
American Funds Growth-Income HLS Fund 4,6,7,9,11,12
American Funds International HLS Fund 5,6,7,9,11,12
American Funds New World HLS Fund 2,3,5,6,7,8,9,10,11,12,15
| 1. | Asset Allocation Risk - The risk that if the strategy of the Underlying Fund’s investment adviser for allocating assets among different asset classes does not work as intended, the Fund may not achieve its objective or may underperform other funds with similar investment strategies. |
| 2. | Call Risk - Call risk is the risk that an issuer, especially during a period of falling interest rates, may redeem a security by repaying it early, which may reduce the Fund’s income if the proceeds are reinvested at lower interest rates. |
| 3. | Credit Risk - Credit risk is the risk that the issuer of a security or other instrument will not be able to make principal and interest payments when due. Changes in an issuer’s credit rating or the market’s perception of an issuer’s creditworthiness may also affect the value of the Fund’s investment in that issuer. The degree of credit risk depends on both the financial condition of the issuer and the terms of the obligation. |
| 4. | Dividend Paying Security Investment Risk - Securities that pay high dividends as a group can fall out of favor with the market, causing the Fund during such periods to underperform funds that do not focus on dividends. The Fund’s focus on dividend paying investments may cause the Fund’s share price and total return to fluctuate more than the share price and total return of funds that do not focus their investments on dividend paying securities. In addition, income provided by the Fund may be affected by changes in the dividend policies of the companies in which the Fund invests and the capital resources available for such payments at such companies. |
| 5. | Emerging Markets Risk - The risks related to investing in foreign securities are generally greater with respect to securities of companies that conduct their principal business activities in emerging markets or whose securities are traded principally on exchanges in emerging markets. The risks of investing in emerging markets include risks of illiquidity, increased price volatility, smaller market capitalizations, less government regulation, less extensive and less frequent accounting, financial and other reporting requirements, risk of loss resulting from problems in share registration and custody and substantial economic and political disruptions. |
| 6. | Foreign Investments Risk - Investments in foreign securities may be riskier than investments in U.S. securities. Differences between the U.S. and foreign regulatory regimes and securities markets, including the less stringent investor protection and disclosure standards of some foreign markets, as well as political and economic developments in foreign countries and regions, may affect the value of the Fund’s investments in foreign securities. Changes in currency exchange rates may also adversely affect the Fund’s foreign investments. |
| 44 |
| 7. | Growth Orientation Risk - The price of a growth company’s stock may decrease, or it may not increase to the level that the Underlying Fund’s investment adviser had anticipated. In addition, growth stocks may be more volatile than other stocks because they are more sensitive to investors’ perceptions of the issuing company’s growth potential. Also, the growth investing style may over time go in and out of favor. At times when the investing style used by the Underlying Fund is out of favor, the Underlying Fund may underperform other equity funds that use different investing styles. |
| 8. | Interest Rate Risk - The risk that your investment may go down in value when interest rates rise, because when interest rates rise, the prices of bonds and fixed rate loans fall. Generally, the longer the maturity of a bond or fixed rate loan, the more sensitive it is to this risk. Falling interest rates also create the potential for a decline in the Fund’s income. These risks are greater during periods of rising inflation. |
| 9. | Investment Strategy Risk - The investment strategy of the Underlying Fund’s investment adviser will influence performance significantly. If the strategy of the Underlying Fund’s investment adviser does not perform as expected, the Fund could underperform its peers or lose money. There is no guarantee that the Underlying Fund’s investment objective will be achieved. |
| 10. | Junk Bond Risk - Investments rated below investment grade (also referred to as “junk bonds”) are considered to be speculative and are subject to heightened credit risk, which may make the Fund more sensitive to adverse developments in the U.S. and abroad. Lower rated debt securities generally involve greater risk of default or price changes due to changes in the issuer’s creditworthiness than higher rated debt securities. The market prices of these securities may fluctuate more than higher quality securities and may decline significantly in periods of general economic difficulty. There may be little trading in the secondary market for particular debt securities, which may make them more difficult to value or sell. |
| 11. | Master-Feeder Structure Risk - Because it invests in the Underlying Fund, the Fund is also subject to risks related to the master-feeder structure. Other “feeder” funds may also invest in an Underlying Fund. As shareholders of an Underlying Fund, feeder funds, including the Fund, vote on matters pertaining to their respective Underlying Fund. Feeder funds with a greater pro rata ownership in an Underlying Fund could have effective voting control of the operations of the Underlying Fund. Also, a large-scale redemption by another feeder fund may increase the proportionate share of the costs of an Underlying Fund borne by the remaining feeder fund shareholders, including the applicable fund. |
| 12. | Market Risk - Market risk is the risk that one or more markets in which the Fund invests will go down in value, including the possibility that the markets will go down sharply and unpredictably. Securities may decline in value due to the activities and financial prospects of individual companies or to general market and economic movements and trends. |
| 13. | Mortgage- and Asset-Backed Securities Risk - Mortgage- and asset-backed securities represent interests in “pools” of mortgages or other assets, including consumer loans or receivables held in trust. Mortgage-backed securities are subject to credit risk, interest rate risk, “prepayment risk” (the risk that borrowers will repay a loan more quickly in periods of falling interest rates) and “extension risk” (the risk that borrowers will repay a loan more slowly in periods of rising interest rates). If the Fund invests in mortgage-backed or asset-backed securities that are subordinated to other interests in the same mortgage pool, the Fund may only receive payments after the pool’s obligations to other investors have been satisfied. An unexpectedly high rate of defaults on the mortgages held by a mortgage pool may limit substantially the pool’s ability to make payments of principal or interest to the Fund, reducing the values of those securities or in some cases rendering them worthless. The risk of such defaults is generally higher in the case of mortgage pools that include so-called “subprime” mortgages. |
| 14. | Non-Diversification Risk - The Underlying Fund is non-diversified, which means it is permitted to invest more of its assets in fewer issuers than a “diversified” fund. Thus, the Fund may be more exposed to the risks associated with and developments affecting an individual issuer than a fund that invests more widely. The Fund may also be subject to greater market fluctuation and price volatility than a more broadly diversified Fund. |
| 45 |
| Hartford Series Fund, Inc |
| Principal Risks (Unaudited) ─ (continued) |
| 15. | Small Cap Stock Risk – Small capitalization stocks may be more risky than stocks of larger companies. Historically, small market capitalization stocks and stocks of recently organized companies are subject to increased price volatility due to: |
| · | less certain growth prospects |
| · | lower degree of liquidity in the markets for such stocks |
| · | thin trading that could result in the stocks being sold at a discount or in small lots over an extended period of time |
| · | limited product lines, markets or financial resources |
| · | dependence on a few key management personnel |
| · | increased susceptibility to losses and bankruptcy increased transaction costs |
| 16. | U.S. Government Securities Risk - Treasury obligations may differ in their interest rates, maturities, times of issuance and other characteristics. Obligations of U.S. Government agencies and authorities are supported by varying degrees of credit but generally are not backed by the full faith and credit of the U.S. Government. No assurance can be given that the U.S. Government will provide financial support to its agencies and authorities if it is not obligated by law to do so. In addition, the value of U.S. Government securities may be affected by changes in the credit rating of the U.S. Government. |
| 46 |
HARTFORD HLS FUNDS
c/o The Hartford Wealth Management - Global Annuities
P.O. Box 14293
Lexington, KY 40512-4293
HARTFORDFUNDS
hartfordfunds.com
Hartford Series Fund, Inc. is underwritten and distributed by Hartford Funds Distributors, LLC.
Hartford Series Fund, Inc. inception dates range from 1977 to date. Hartford Series Fund, Inc. is not a subsidiary of The Hartford Financial Services Group, Inc. ("The Hartford") but is underwritten, distributed by and advised by subsidiaries of The Hartford. Investments in Hartford Series Fund, Inc. are not guaranteed by The Hartford or any other entity.
You should carefully consider investment objectives, risks, and charges and expenses of Hartford HLS Funds before investing. This and other information can be found in the Fund’s prospectus or summary prospectus, which can be obtained by calling 800-862-6668. Please read them carefully before you invest or send money.
AFHLSSAR-13 8-13 113558-1 Printed in U.S.A ©2013 The Hartford, Hartford, CT 06115
HARTFORDFUNDS
| HARTFORD BALANCED HLS FUND
2013 Semi Annual Report
|
A MESSAGE FROM THE PRESIDENT
Dear Fellow Shareholders:
I want to take this opportunity to say thank you for investing in the Hartford HLS Funds.
Market Review
During the first half of the year, stocks rose steadily. U.S. equities (as represented by the S&P 500 Index1) posted a strong gain of 10.61% during the first quarter, on their way to an all-time high. During the second quarter, investors persevered through volatility surrounding rumors of the rollback of the U.S. Federal Reserve’s quantitative easing (QE) program later this year, and the S&P 500 Index rose 2.91%. That brought the market’s rise to 13.82% for the first half of 2013. The rumors about QE’s end sent bond yields and mortgage rates upward, but that wasn’t enough to dissuade investors from pushing equities into positive territory.
Because of QE, some have expressed concerns regarding the recent market rally. But a more careful examination of economic data reveals a strong foundation. Consumer balance sheets have improved since the financial crisis, with consumer debt as a percentage of income falling steadily. Housing continued its dogged recovery, fueled by population growth and pent-up demand. In fact, it’s substantive economic improvements that have moved Federal Reserve Chairman Ben Bernanke to consider removing the “training wheels” of QE, which we think should be viewed as a vote of confidence in the U.S. economy going forward.
As the U.S. outlook continues to improve, concerns do remain in the global economy. Emerging markets have lagged due to social unrest and rising inflation. Slowing growth in China is clouding global growth forecasts, but it’s important to remember that China still boasts 7.5% annual GDP growth.
It’s important to stay abreast of domestic and international economic developments while balancing your individual investment goals. Meeting with your financial advisor on a regular basis to examine your current investment strategy can help you determine whether you are on the right track:
| • | Is your portfolio fully diversified with an appropriate mix of stocks and bonds? |
| • | Is your fixed-income portfolio positioned to take advantage of opportunities across the credit spectrum and fulfill your income needs? |
| • | Is your portfolio still in line with your risk tolerance and investment time horizon? |
Your financial professional can help you choose options within our fund family to navigate today’s markets with confidence.
Thank you again for investing with the Hartford HLS Funds.
James Davey
President
Hartford HLS Funds
1 The S&P 500 Index is a market capitalization-weighted price index composed of 500 widely held common stocks.
Table of Contents
This report is prepared for the general information of contract owners and qualified retirement plan participants. It is not an offer of contracts or of qualified retirement plans. It should not be used in connection with any offer, except in conjunction with the appropriate product prospectus which contains all pertinent information including the applicable sales, administrative and other charges.
The views expressed in the Fund’s Manager Discussion under ‘‘Why did the Fund perform this way?’’ and ‘‘What is the outlook?’’ are views of the Fund’s sub-adviser and portfolio management team through the end of the period and are subject to change based on market and other conditions. The Fund’s Manager Discussion is for informational purposes only and does not represent an offer, recommendation or solicitation to buy, hold or sell any security. The specific securities identified and described, if any, do not represent all of the securities purchased or sold and you should not assume that investments in the securities identified and discussed will be profitable.
| Hartford Balanced HLS Fund inception 03/31/1983 |
| (sub-advised by Wellington Management Company, LLP) |
| Investment objective – Seeks long-term total return. |
Performance Overview 6/30/03 - 6/30/13
The chart above represents the hypothetical growth of a $10,000 investment in Class IA. Growth results in classes other than Class IA will vary from what is seen above due to differences in the expenses charged to those share classes.
| Average Annual Total Returns (as of 6/30/13) |
| 6 Month† | 1 Year | 5 Years | 10 Years | |||||||||||||
| Balanced IA | 9.71% | 15.89% | 6.68% | 6.08% | ||||||||||||
| Balanced IB | 9.57% | 15.60% | 6.41% | 5.81% | ||||||||||||
| Balanced HLS Fund Blended Index | 7.14% | 11.76% | 6.50% | 6.20% | ||||||||||||
| Barclays Government/Credit Bond Index | -2.67% | -0.61% | 5.29% | 4.43% | ||||||||||||
| S&P 500 Index | 13.82% | 20.58% | 7.00% | 7.29% | ||||||||||||
| † | Not Annualized |
PERFORMANCE DATA QUOTED REPRESENTS PAST PERFORMANCE AND DOES NOT GUARANTEE FUTURE RESULTS. The investment return and principal value of the investment will fluctuate so that investors’ shares, when redeemed, may be worth more or less than their original cost. Current performance may be lower or higher than the performance data quoted. To obtain performance data current to the most recent month-end, please visit our website www.hartfordfunds.com.
Total returns presented above were calculated using the Fund’s net asset value available to shareholders for sale or redemption of Fund shares on June 30, 2013, which may exclude investment transactions as of this date. All share class returns assume the reinvestment of all distributions at net asset value and the deduction of all fund expenses.
Balanced HLS Fund Blended Index is a blended index comprised of the following indices: S&P 500 (60%), Barclays Government/Credit Bond (35%) and 90-day Treasury Bill (5%).
Barclays Government/Credit Bond Index is an unmanaged, market-value-weighted index of all debt obligations of the U.S. Treasury and U.S. Government agencies (excluding mortgaged-backed securities) and of all publicly-issued fixed-rate, nonconvertible, investment grade domestic corporate debt.
S&P 500 Index is a market capitalization-weighted price index composed of 500 widely held common stocks.
You cannot invest directly in an index.
As of the Fund’s current prospectus dated May 1, 2013, the total annual operating expense ratios for Class IA and Class IB shares were 0.65% and 0.90%, respectively. Actual expenses may be higher. Please see the accompanying Financial Highlights for expense ratios for the six-month period ended June 30, 2013.
All investments are subject to risk including the possible loss of principal. For a discussion of the Fund’s risks, please see the Principal Risks section. For more detailed information on the risks associated with an investment in the Fund, please see the prospectus.
The chart and table do not reflect the deductions of taxes, sales charges or other fees which may be applied at the variable life insurance, variable annuity or qualified retirement plan product level. Any such additional sales charges or other fees or expenses would lower the contract’s or plan’s performance.
| 2 |
| Hartford Balanced HLS Fund |
| Manager Discussion |
| June 30, 2013 (Unaudited) |
| Portfolio Managers | |
| John C. Keogh | Karen H. Grimes, CFA |
| Senior Vice President and Fixed Income Portfolio Manager | Senior Vice President and Equity Portfolio Manager |
How did the Fund perform?
The Class IA shares of the Hartford Balanced HLS Fund returned 9.71% for the six-month period ended June 30, 2013, outperforming its benchmark, 60% S&P 500 Index, 35% Barclays Government/Credit Bond Index, and 5% Treasury Bills, which returned 7.14% for the same period. The Fund also outperformed the 6.60% average return of the Variable Products-Underlying Funds Lipper Mixed-Asset Target Allocation Growth Funds peer group, a group of funds that hold between 60%-80% in equity securities, with the remainder invested in bonds, cash, and cash equivalents.
Why did the Fund perform this way?
U.S. equities (+13.8%), as measured by the S&P 500 Index, gained during the six-month period, reaching an all-time high in May. The rally began on the first trading day of the year after a last-minute compromise by the U.S. Congress averted the fiscal cliff. Optimism surrounding the fiscal reprieve was furthered during the first half of the period by better-than-expected corporate earnings, a robust housing market, and a gradually improving employment picture. In the second half of the period, an equity market rally throughout April and the first part of May paused following comments by Federal Reserve (Fed) Chairman Ben Bernanke that suggested the Fed might begin to slow quantitative easing (QE) sooner than investors anticipated. The Federal Open Market Committee’s June statement emphasized that the tapering schedule would depend on improving economic indicators.
U.S. economic data signaled that the economy remains on a moderate growth path, underpinned by the housing and labor markets. The residential real estate recovery continued to pick up steam as home sales rose; house prices saw their greatest annual gain in seven years, according to data from S&P/Case-Shiller. Rising home values and equity-market gains helped boost consumer confidence and prop up consumption. However, manufacturing activity contracted and growth in the services sector slowed.
The Treasury yield curve steepened as the 10-year Treasury yield surged 0.73% to end the period at 2.49%, the highest level since August 2011. Major fixed income sectors, with the exception of high yield, posted negative absolute returns driven by rising rates and underperformed Treasuries on a duration-adjusted basis during the 6-month period. Duration is a measure of the sensitivity of an asset of portfolio’s price to nominal interest rate movement. The Barclays Government/Credit Bond Index returned -2.67% for the period.
The Fund has three primary levers to generate investment performance: equity investments, fixed income investments, and asset allocation among stocks, bonds, and cash. During the period, the equity portion and fixed income portion of the Fund outperformed their respective benchmarks. Asset allocation contributed positively to benchmark-relative results as the Fund was generally overweight (i.e. the Fund’s position was greater than the benchmark position) equities and underweight fixed income and cash relative to the benchmark.
Equity outperformance versus the benchmark was driven by security selection, which was strongest in Financials, Industrials, and Information Technology. This was partially offset by weaker selection in Energy. Sector positioning, which is a result of bottom-up security selection (i.e. stock by stock fundamental research), contributed positively to relative performance due to an overweight to Health Care.
Top contributors to relative performance of the equity portion of the Fund during the period were Vertex Pharmaceutical (Health Care), Celgene (Health Care) and Allstar Co. (Consumer Discretionary). Shares of Vertex Pharmaceuticals, a biotech firm with a focus on cancer and neurodegenerative diseases, surged during the period after positive data for an important phase 2 clinical study increased investors’ confidence in the firm’s cystic fibrosis franchise. Celgene, a global biopharmaceutical company engaged in the discovery, development, and commercialization of therapies designed to treat cancer and immune-inflammatory related diseases, saw shares rise on strong long term guidance in the first quarter and a positive update on a greatly anticipated clinical study. Allstar Co. operates a chain of sporting good stores in the south and southwest United States. This is a private placement investment; the company had increased gross margins and incrementally positive sales compared to prior periods. JPMorgan (financials) and Cisco Systems (Information Technology) also contributed positively to the Fund’s returns on an absolute basis (i.e. total return).
Stocks that detracted the most from relative returns in the equity portion of the Fund during the period were Statoil (Energy), Maxim Integrated Products (Industrials), and UCB
| 3 |
| Hartford Balanced HLS Fund |
| Manager Discussion – (continued) |
| June 30, 2013 (Unaudited) |
(Health Care). Shares of Statoil, a Norway-based integrated energy company primarily engaged in oil and gas exploration and production, fell after reported adjusted first-quarter earnings missed consensus expectations. While production volume was in-line with consensus estimates, the mix was weaker than expected due to results from lower margin international gas volumes. Maxim Integrated Products is an international supplier of analog and mixed signal semiconductors based in the U.S. Although earnings for the most recent quarter came in above consensus, the stock underperformed as the company's forward earnings guidance was below consensus. Shares of UCB, a Belgium-based biopharmaceutical and specialty chemical company, fell after first quarter sales came in below consensus expectations, causing weakness in the stock despite management’s reiteration of its long term guidance. Apple (Information Technology) and EMC (Information Technology) also detracted from the Fund’s returns on an absolute basis.
The fixed income portion of the Fund outperformed its benchmark during the period. Security selection within the investment grade corporate bond sector was the main driver of the outperformance. Within investment grade corporates, security selection was strongest in Financials and Utilities. Our short duration positioning relative to the benchmark in May and June was also additive to relative performance when interest rates rose.
What is the outlook?
In the equity portion of the Fund, we are starting to see stock prices reflect underlying company and industry fundamentals. Momentum is still in play, but to a much lesser degree as market extremes have diminished; it feels like less of a macro-driven environment. In this environment, we believe that only those attractively valued companies with strong market positions and high quality management teams will be the best performers. Our investment approach seeks to uncover exactly this combination. The change in the Fed’s rhetoric and the political and market turmoil in several emerging markets represents a serious challenge. What we believe we are left with is a world in which growth will be moderate (a long held view), and less skewed to emerging markets. Critically, we believe this means that in looking at developed markets, investors can shift their gaze from expensive ‘safety’ and capital preservation to other more attractively valued opportunities.
At the end of the period, our largest overweights relative to the benchmark in the equity portion of the Fund were in the Health Care and Information Technology sectors. Our largest underweights were Consumer Staples and Telecommunication Services.
Within the fixed income portion of the Fund, we ended the quarter positioned with a neutral duration posture while maintaining our curve flattening bias. We continue to be positioned with a modest underweight to the Government sector, as we believe that there are more compelling opportunities in other sectors such as agency Mortgage-Backed Securities (MBS). Within investment grade corporates, we continue to focus on financials and communications issuers. Financial companies have de-levered significantly, and we believe that communications issuers have solid balance sheets. We also maintained an overweight to taxable municipals.
The equity and fixed income managers will continue to work collaboratively to make decisions regarding portfolio weights in stocks, bonds, and cash. As of June 30, 2013, the Fund’s equity exposure was at 69% compared to 60% in its benchmark and at the upper end of the Fund’s 50-70% range.
| 4 |
| Diversification by Industry | ||||
| as of June 30, 2013 | ||||
| Industry (Sector) | Percentage of Net Assets | |||
| Equity Securities | ||||
| Automobiles and Components (Consumer Discretionary) | 0.7 | % | ||
| Banks (Financials) | 3.9 | |||
| Capital Goods (Industrials) | 5.6 | |||
| Consumer Durables and Apparel (Consumer Discretionary) | 0.7 | |||
| Diversified Financials (Financials) | 6.6 | |||
| Energy (Energy) | 7.2 | |||
| Food and Staples Retailing (Consumer Staples) | 1.0 | |||
| Food, Beverage and Tobacco (Consumer Staples) | 3.5 | |||
| Health Care Equipment and Services (Health Care) | 2.7 | |||
| Insurance (Financials) | 2.4 | |||
| Materials (Materials) | 2.4 | |||
| Media (Consumer Discretionary) | 2.8 | |||
| Pharmaceuticals, Biotechnology and Life Sciences (Health Care) | 9.2 | |||
| Retailing (Consumer Discretionary) | 4.2 | |||
| Semiconductors and Semiconductor Equipment (Information Technology) | 3.3 | |||
| Software and Services (Information Technology) | 5.6 | |||
| Technology Hardware and Equipment (Information Technology) | 5.3 | |||
| Telecommunication Services (Services) | 0.4 | |||
| Transportation (Industrials) | 0.6 | |||
| Utilities (Utilities) | 1.2 | |||
| Total | 69.3 | % | ||
| Fixed Income Securities | ||||
| Air Transportation (Transportation) | 0.3 | % | ||
| Arts, Entertainment and Recreation (Services) | 0.8 | |||
| Beverage and Tobacco Product Manufacturing (Consumer Staples) | 0.5 | |||
| Computer and Electronic Product Manufacturing (Technology) | 0.1 | |||
| Couriers and Messengers (Services) | 0.0 | |||
| Finance and Insurance (Finance) | 5.5 | |||
| Food Manufacturing (Consumer Staples) | 0.5 | |||
| General Obligations (General Obligations) | 0.2 | |||
| Health Care and Social Assistance (Health Care) | 0.3 | |||
| Health Care/Services (Health Care/Services) | 0.1 | |||
| Higher Education (Univ., Dorms, etc.) (Higher Education (Univ., Dorms, etc.)) | 0.0 | |||
| Information (Technology) | 0.4 | |||
| Mining (Basic Materials) | 0.1 | |||
| Miscellaneous Manufacturing (Capital Goods) | 0.0 | |||
| Motor Vehicle and Parts Manufacturing (Consumer Cyclical) | 0.2 | |||
| Petroleum and Coal Products Manufacturing (Energy) | 0.5 | |||
| Pipeline Transportation (Utilities) | 0.2 | |||
| Real Estate, Rental and Leasing (Finance) | 0.2 | |||
| Refunded (Refunded) | 0.1 | |||
| Retail Trade (Consumer Cyclical) | 0.2 | |||
| Soap, Cleaning Compound and Toilet Manufacturing (Consumer Staples) | 0.4 | |||
| Tax Allocation (Tax Allocation) | 0.1 | |||
| Transportation (Transportation) | 0.4 | |||
| Transportation Equipment Manufacturing (Transportation) | 0.0 | |||
| Utilities (Utilities) | 0.4 | |||
| Wholesale Trade (Consumer Cyclical) | 0.0 | |||
| Total | 11.5 | % | ||
| U.S. Government Agencies | 1.2 | |||
| U.S. Government Securities | 15.8 | |||
| Short-Term Investments | 2.8 | |||
| Other Assets and Liabilities | (0.6 | ) | ||
| Total | 100.0 | % | ||
| Distribution by Credit Quality | ||||
| as of June 30, 2013 | ||||
| Credit Rating * | Percentage of Net Assets | |||
| Aaa / AAA | 0.3 | % | ||
| Aa / AA | 1.7 | |||
| A | 4.5 | |||
| Baa / BBB | 4.3 | |||
| Ba / BB | 0.2 | |||
| Unrated | 0.5 | |||
| U.S. Government Agencies and Securities | 17.0 | |||
| Non-Debt Securities and Other Short-Term Instruments | 72.1 | |||
| Other Assets & Liabilities | (0.6 | ) | ||
| Total | 100.0 | % | ||
| * | Does not apply to the Fund itself. Based upon Moody’s and S&P long-term credit ratings for the Fund’s holdings as of the date noted. If Moody's and S&P assign different ratings to a holding, the lower rating is used. "Unrated" includes fixed-income securities (other than cash-like short-term instruments and U.S. Government securities) for which Moody’s and S&P have not issued long-term credit ratings. |
| 5 |
| Hartford Balanced HLS Fund |
| Schedule of Investments |
| June 30, 2013 (Unaudited) |
| (000’s Omitted) |
| Shares or Principal Amount | Market Value ╪ | |||||||
COMMON STOCKS - 69.3% | ||||||||
| Automobiles and Components - 0.7% | ||||||||
| 1,511 | Ford Motor Co. | $ | 23,382 | |||||
| Banks - 3.9% | ||||||||
| 564 | BB&T Corp. | 19,116 | ||||||
| 532 | PNC Financial Services Group, Inc. | 38,758 | ||||||
| 1,621 | Wells Fargo & Co. | 66,917 | ||||||
| 124,791 | ||||||||
| Capital Goods - 5.6% | ||||||||
| 384 | 3M Co. | 41,999 | ||||||
| 303 | Boeing Co. | 30,989 | ||||||
| 496 | Ingersoll-Rand plc | 27,560 | ||||||
| 604 | PACCAR, Inc. | 32,407 | ||||||
| 313 | Stanley Black & Decker, Inc. | 24,205 | ||||||
| 241 | United Technologies Corp. | 22,416 | ||||||
| 179,576 | ||||||||
| Consumer Durables and Apparel - 0.7% | ||||||||
| 171 | Coach, Inc. | 9,769 | ||||||
| 98 | PVH Corp. | 12,243 | ||||||
| 22,012 | ||||||||
| Diversified Financials - 6.6% | ||||||||
| 191 | Ameriprise Financial, Inc. | 15,468 | ||||||
| 120 | BlackRock, Inc. | 30,747 | ||||||
| 874 | Citigroup, Inc. | 41,914 | ||||||
| 159 | Goldman Sachs Group, Inc. | 24,105 | ||||||
| 790 | Invesco Ltd. | 25,111 | ||||||
| 1,395 | JP Morgan Chase & Co. | 73,667 | ||||||
| 211,012 | ||||||||
| Energy - 7.2% | ||||||||
| 351 | Anadarko Petroleum Corp. | 30,124 | ||||||
| 450 | BP plc ADR | 18,801 | ||||||
| 288 | Chevron Corp. | 34,050 | ||||||
| 94 | EOG Resources, Inc. | 12,329 | ||||||
| 509 | Exxon Mobil Corp. | 46,009 | ||||||
| 560 | Halliburton Co. | 23,355 | ||||||
| 288 | Noble Corp. | 10,836 | ||||||
| 254 | Occidental Petroleum Corp. | 22,686 | ||||||
| 363 | Southwestern Energy Co. ● | 13,259 | ||||||
| 848 | Statoilhydro ASA ADR | 17,540 | ||||||
| 228,989 | ||||||||
| Food and Staples Retailing - 1.0% | ||||||||
| 559 | CVS Caremark Corp. | 31,953 | ||||||
| Food, Beverage and Tobacco - 3.5% | ||||||||
| 454 | General Mills, Inc. | 22,025 | ||||||
| 192 | Kraft Foods Group, Inc. | 10,751 | ||||||
| 411 | PepsiCo, Inc. | 33,648 | ||||||
| 242 | Philip Morris International, Inc. | 20,993 | ||||||
| 633 | Unilever N.V. NY Shares ADR | 24,885 | ||||||
| 112,302 | ||||||||
| Health Care Equipment and Services - 2.7% | ||||||||
| 395 | Baxter International, Inc. | 27,336 | ||||||
| 443 | Covidien plc | 27,842 | ||||||
| 463 | UnitedHealth Group, Inc. | 30,298 | ||||||
| 85,476 | ||||||||
| Insurance - 2.4% | ||||||||
| 564 | American International Group, Inc. ● | 25,189 | ||||||
| 852 | Marsh & McLennan Cos., Inc. | 33,992 | ||||||
| 550 | Unum Group | 16,159 | ||||||
| 75,340 | ||||||||
| Materials - 2.4% | ||||||||
| 626 | Dow Chemical Co. | 20,143 | ||||||
| 514 | International Paper Co. | 22,776 | ||||||
| 347 | Mosaic Co. | 18,673 | ||||||
| 320 | Nucor Corp. | 13,850 | ||||||
| 75,442 | ||||||||
| Media - 2.8% | ||||||||
| 299 | CBS Corp. Class B | 14,620 | ||||||
| 622 | Comcast Corp. Class A | 26,065 | ||||||
| 589 | Thomson Reuters Corp. | 19,171 | ||||||
| 457 | Walt Disney Co. | 28,881 | ||||||
| 88,737 | ||||||||
| Pharmaceuticals, Biotechnology and Life Sciences - 9.2% | ||||||||
| 480 | Agilent Technologies, Inc. | 20,546 | ||||||
| 228 | Amgen, Inc. | 22,485 | ||||||
| 203 | Celgene Corp. ● | 23,740 | ||||||
| 1,069 | Daiichi Sankyo Co., Ltd. | 17,806 | ||||||
| 317 | Gilead Sciences, Inc. ● | 16,208 | ||||||
| 147 | Johnson & Johnson | 12,594 | ||||||
| 1,139 | Merck & Co., Inc. | 52,928 | ||||||
| 974 | Pfizer, Inc. | 27,270 | ||||||
| 143 | Roche Holding AG | 35,531 | ||||||
| 485 | UCB S.A. | 26,031 | ||||||
| 354 | Vertex Pharmaceuticals, Inc. ● | 28,295 | ||||||
| 307 | Zoetis, Inc. | 9,479 | ||||||
| 292,913 | ||||||||
| Retailing - 4.2% | ||||||||
| 11,702 | Allstar Co. ⌂●† | 24,269 | ||||||
| 51 | AutoZone, Inc. ● | 21,808 | ||||||
| 11,241 | Buck Holdings L.P. ⌂●† | 3,413 | ||||||
| 370 | Kohl's Corp. | 18,674 | ||||||
| 1,085 | Lowe's Cos., Inc. | 44,375 | ||||||
| 325 | Nordstrom, Inc. | 19,481 | ||||||
| 132,020 | ||||||||
| Semiconductors and Semiconductor Equipment - 3.3% | ||||||||
| 603 | Analog Devices, Inc. | 27,164 | ||||||
| 1,197 | Intel Corp. | 28,998 | ||||||
| 849 | Maxim Integrated Products, Inc. | 23,589 | ||||||
| 597 | Xilinx, Inc. | 23,631 | ||||||
| 103,382 | ||||||||
| Software and Services - 5.6% | ||||||||
| 353 | Accenture plc | 25,389 | ||||||
| 352 | Automatic Data Processing, Inc. | 24,249 | ||||||
| 501 | eBay, Inc. ● | 25,925 | ||||||
| 52 | Google, Inc. ● | 46,026 | ||||||
| 1,400 | Microsoft Corp. | 48,326 | ||||||
| 348 | Symantec Corp. | 7,824 | ||||||
| 177,739 | ||||||||
| Technology Hardware and Equipment - 5.3% | ||||||||
| 141 | Apple, Inc. | 55,895 | ||||||
| 2,744 | Cisco Systems, Inc. | 66,697 | ||||||
| 1,468 | EMC Corp. | 34,666 | ||||||
| 198 | Qualcomm, Inc. | 12,067 | ||||||
| 169,325 | ||||||||
| Telecommunication Services - 0.4% | ||||||||
| 423 | Vodafone Group plc ADR | 12,150 | ||||||
| Transportation - 0.6% | ||||||||
| 204 | FedEx Corp. | 20,126 | ||||||
The accompanying notes are an integral part of these financial statements.
| 6 |
| Shares or Principal Amount | Market Value ╪ | |||||||
COMMON STOCKS - 69.3% - (continued) | ||||||||
| Utilities - 1.2% | ||||||||
| 474 | NextEra Energy, Inc. | $ | 38,653 | |||||
| Total common stocks | ||||||||
| (cost $1,658,031) | $ | 2,205,320 | ||||||
ASSET & COMMERCIAL MORTGAGE BACKED SECURITIES - 0.1% | ||||||||
| Finance and Insurance - 0.1% | ||||||||
| Ally Master Owner Trust | ||||||||
| $ | 4,885 | 1.54%, 09/15/2019 | $ | 4,785 | ||||
| Goldman Sachs Mortgage Securities Corp. II | ||||||||
| 110 | 2.79%, 03/06/2020 ■Δ | 110 | ||||||
| New Century Home Equity Loan Trust | ||||||||
| 8 | 0.48%, 03/25/2035 Δ | 8 | ||||||
| 4,903 | ||||||||
| Total asset & commercial mortgage backed securities | ||||||||
| (cost $5,001) | $ | 4,903 | ||||||
CORPORATE BONDS - 10.5% | ||||||||
| Air Transportation - 0.3% | ||||||||
| Continental Airlines, Inc. | ||||||||
| $ | 3,632 | 5.98%, 04/19/2022 | $ | 4,031 | ||||
| Southwest Airlines Co. | ||||||||
| 2,700 | 5.75%, 12/15/2016 | 2,995 | ||||||
| 2,768 | 6.15%, 08/01/2022 | 3,266 | ||||||
| 10,292 | ||||||||
| Arts, Entertainment and Recreation - 0.8% | ||||||||
| CBS Corp. | ||||||||
| 6,860 | 3.38%, 03/01/2022 | 6,613 | ||||||
| 575 | 5.75%, 04/15/2020 | 652 | ||||||
| Comcast Corp. | ||||||||
| 1,000 | 4.50%, 01/15/2043 | 955 | ||||||
| 1,740 | 4.65%, 07/15/2042 | 1,668 | ||||||
| 4,500 | 5.90%, 03/15/2016 | 5,066 | ||||||
| DirecTV Holdings LLC | ||||||||
| 3,310 | 6.38%, 03/01/2041 | 3,459 | ||||||
| Discovery Communications, Inc. | ||||||||
| 280 | 3.25%, 04/01/2023 | 263 | ||||||
| 325 | 4.88%, 04/01/2043 | 300 | ||||||
| 250 | 4.95%, 05/15/2042 | 234 | ||||||
| News America, Inc. | ||||||||
| 1,275 | 4.50%, 02/15/2021 | 1,366 | ||||||
| Time Warner Cable, Inc. | ||||||||
| 4,120 | 5.85%, 05/01/2017 | 4,540 | ||||||
| Viacom, Inc. | ||||||||
| 835 | 3.88%, 12/15/2021 | 846 | ||||||
| 25,962 | ||||||||
| Beverage and Tobacco Product Manufacturing - 0.5% | ||||||||
| Altria Group, Inc. | ||||||||
| 2,050 | 4.50%, 05/02/2043 | 1,823 | ||||||
| 2,445 | 4.75%, 05/05/2021 | 2,619 | ||||||
| Anheuser-Busch InBev Worldwide, Inc. | ||||||||
| 3,205 | 7.75%, 01/15/2019 | 4,054 | ||||||
| BAT International Finance plc | ||||||||
| 2,775 | 3.25%, 06/07/2022 ■ | 2,716 | ||||||
| Coca-Cola Co. | ||||||||
| 500 | 3.30%, 09/01/2021 | 511 | ||||||
| Diageo Capital plc | ||||||||
| 1,925 | 2.63%, 04/29/2023 | 1,791 | ||||||
| Molson Coors Brewing Co. | ||||||||
| 60 | 2.00%, 05/01/2017 | 60 | ||||||
| 765 | 3.50%, 05/01/2022 | 751 | ||||||
| 495 | 5.00%, 05/01/2042 | 475 | ||||||
| Philip Morris International, Inc. | ||||||||
| 270 | 5.65%, 05/16/2018 | 311 | ||||||
| 15,111 | ||||||||
| Computer and Electronic Product Manufacturing - 0.1% | ||||||||
| Apple, Inc. | ||||||||
| 1,930 | 2.40%, 05/03/2023 | 1,790 | ||||||
| 685 | 3.85%, 05/04/2043 | 608 | ||||||
| 2,398 | ||||||||
| Couriers and Messengers - 0.0% | ||||||||
| FedEx Corp. | ||||||||
| 270 | 2.63%, 08/01/2022 | 251 | ||||||
| 405 | 2.70%, 04/15/2023 | 373 | ||||||
| 624 | ||||||||
| Finance and Insurance - 5.4% | ||||||||
| ACE INA Holdings, Inc. | ||||||||
| 700 | 5.88%, 06/15/2014 | 733 | ||||||
| American Express Centurion Bank | ||||||||
| 6,350 | 6.00%, 09/13/2017 | 7,297 | ||||||
| Bank of America Corp. | ||||||||
| 4,500 | 5.00%, 05/13/2021 | 4,798 | ||||||
| 200 | 7.38%, 05/15/2014 | 211 | ||||||
| Barclays Bank plc | ||||||||
| 2,150 | 2.38%, 01/13/2014 | 2,168 | ||||||
| BP Capital Markets plc | ||||||||
| 2,850 | 4.75%, 03/10/2019 | 3,165 | ||||||
| Brandywine Operating Partnership | ||||||||
| 2,010 | 6.00%, 04/01/2016 | 2,207 | ||||||
| Capital One Financial Corp. | ||||||||
| 2,460 | 2.15%, 03/23/2015 | 2,499 | ||||||
| CDP Financial, Inc. | ||||||||
| 3,475 | 4.40%, 11/25/2019 ■ | 3,823 | ||||||
| Citigroup, Inc. | ||||||||
| 3,000 | 5.85%, 08/02/2016 | 3,355 | ||||||
| 2,700 | 6.13%, 05/15/2018 | 3,091 | ||||||
| 1,700 | 6.88%, 03/05/2038 | 2,061 | ||||||
| 520 | 8.13%, 07/15/2039 | 687 | ||||||
| Credit Agricole S.A. | ||||||||
| 3,950 | 3.50%, 04/13/2015 ■ | 4,086 | ||||||
| Discover Financial Services, Inc. | ||||||||
| 3,620 | 6.45%, 06/12/2017 | 4,112 | ||||||
| Eaton Vance Corp. | ||||||||
| 3,305 | 6.50%, 10/02/2017 | 3,804 | ||||||
| Everest Reinsurance Holdings, Inc. | ||||||||
| 4,525 | 5.40%, 10/15/2014 | 4,682 | ||||||
| Ford Motor Credit Co. LLC | ||||||||
| 2,665 | 3.00%, 06/12/2017 | 2,671 | ||||||
| General Electric Capital Corp. | ||||||||
| 4,300 | 4.38%, 09/16/2020 | 4,552 | ||||||
| 5,000 | 5.88%, 01/14/2038 | 5,504 | ||||||
| Goldman Sachs Group, Inc. | ||||||||
| 6,000 | 5.63%, 01/15/2017 | 6,503 | ||||||
| 1,700 | 6.15%, 04/01/2018 | 1,916 | ||||||
| 2,590 | 6.25%, 02/01/2041 | 2,929 | ||||||
The accompanying notes are an integral part of these financial statements.
| 7 |
| Hartford Balanced HLS Fund |
| Schedule of Investments – (continued) |
| June 30, 2013 (Unaudited) |
| (000’s Omitted) |
| Shares or Principal Amount | Market Value ╪ | |||||||
CORPORATE BONDS - 10.5% - (continued) | ||||||||
| Finance and Insurance - 5.4% - (continued) | ||||||||
| HCP, Inc. | ||||||||
| $ | 2,030 | 6.00%, 01/30/2017 | $ | 2,277 | ||||
| HSBC Holdings plc | ||||||||
| 3,010 | 6.10%, 01/14/2042 | 3,502 | ||||||
| ING Bank N.V. | ||||||||
| 5,200 | 3.75%, 03/07/2017 ■ | 5,442 | ||||||
| Jackson National Life Insurance Co. | ||||||||
| 6,250 | 8.15%, 03/15/2027 ■ | 7,775 | ||||||
| JP Morgan Chase & Co. | ||||||||
| 2,240 | 3.25%, 09/23/2022 | 2,127 | ||||||
| 2,000 | 4.95%, 03/25/2020 | 2,184 | ||||||
| 6,035 | 5.13%, 09/15/2014 | 6,332 | ||||||
| 1,080 | 5.40%, 01/06/2042 | 1,142 | ||||||
| Loews Corp. | ||||||||
| 835 | 2.63%, 05/15/2023 | 759 | ||||||
| Merrill Lynch & Co., Inc. | ||||||||
| 1,000 | 6.40%, 08/28/2017 | 1,129 | ||||||
| 6,000 | 6.88%, 04/25/2018 | 6,906 | ||||||
| Morgan Stanley | ||||||||
| 250 | 5.63%, 09/23/2019 | 269 | ||||||
| National City Corp. | ||||||||
| 4,250 | 6.88%, 05/15/2019 | 5,084 | ||||||
| Nordea Bank AB | ||||||||
| 1,790 | 3.70%, 11/13/2014 ■ | 1,856 | ||||||
| Postal Square L.P. | ||||||||
| 12,788 | 8.95%, 06/15/2022 | 16,899 | ||||||
| Prudential Financial, Inc. | ||||||||
| 3,000 | 5.50%, 03/15/2016 | 3,313 | ||||||
| Rabobank Netherlands | ||||||||
| 3,900 | 3.20%, 03/11/2015 ■ | 4,044 | ||||||
| Republic New York Capital I | ||||||||
| 500 | 7.75%, 11/15/2026 | 507 | ||||||
| Southern Capital Corp. | ||||||||
| 49 | 5.70%, 06/30/2022 ■ | 51 | ||||||
| Sovereign Bancorp, Inc. | ||||||||
| 4,795 | 8.75%, 05/30/2018 | 5,798 | ||||||
| Svenska Handelsbanken AB | ||||||||
| 2,900 | 4.88%, 06/10/2014 ■ | 3,010 | ||||||
| UBS AG Stamford | ||||||||
| 235 | 5.88%, 12/20/2017 | 270 | ||||||
| Wachovia Corp. | ||||||||
| 10,000 | 5.25%, 08/01/2014 | 10,445 | ||||||
| 1,000 | 5.75%, 06/15/2017 | 1,135 | ||||||
| WEA Finance LLC | ||||||||
| 1,450 | 7.13%, 04/15/2018 ■ | 1,721 | ||||||
| Wellpoint, Inc. | ||||||||
| 421 | 3.30%, 01/15/2023 | 401 | ||||||
| 171,232 | ||||||||
| Food Manufacturing - 0.5% | ||||||||
| ConAgra Foods, Inc. | ||||||||
| 265 | 1.90%, 01/25/2018 | 260 | ||||||
| 235 | 3.20%, 01/25/2023 | 225 | ||||||
| Kellogg Co. | ||||||||
| 3,900 | 4.00%, 12/15/2020 | 4,106 | ||||||
| Kraft Foods Group, Inc. | ||||||||
| 555 | 2.25%, 06/05/2017 | 559 | ||||||
| 535 | 3.50%, 06/06/2022 | 530 | ||||||
| 605 | 5.00%, 06/04/2042 | 613 | ||||||
| 285 | 5.38%, 02/10/2020 | 319 | ||||||
| Mondelez International, Inc. | ||||||||
| 3,800 | 4.13%, 02/09/2016 | 4,062 | ||||||
| Wrigley Jr., William Co. | ||||||||
| 3,900 | 3.70%, 06/30/2014 ■ | 4,003 | ||||||
| 14,677 | ||||||||
| Health Care and Social Assistance - 0.3% | ||||||||
| Amgen, Inc. | ||||||||
| 3,300 | 5.15%, 11/15/2041 | 3,287 | ||||||
| GlaxoSmithKline Capital, Inc. | ||||||||
| 2,370 | 2.80%, 03/18/2023 | 2,255 | ||||||
| Kaiser Foundation Hospitals | ||||||||
| 326 | 3.50%, 04/01/2022 | 322 | ||||||
| 640 | 4.88%, 04/01/2042 | 636 | ||||||
| McKesson Corp. | ||||||||
| 100 | 2.85%, 03/15/2023 | 94 | ||||||
| Merck & Co., Inc. | ||||||||
| 1,640 | 2.80%, 05/18/2023 | 1,552 | ||||||
| 630 | 4.15%, 05/18/2043 | 600 | ||||||
| Zoetis, Inc. | ||||||||
| 150 | 3.25%, 02/01/2023 ■ | 143 | ||||||
| 180 | 4.70%, 02/01/2043 ■ | 168 | ||||||
| 9,057 | ||||||||
| Information - 0.4% | ||||||||
| America Movil S.A.B. de C.V. | ||||||||
| 635 | 3.13%, 07/16/2022 | 585 | ||||||
| 530 | 4.38%, 07/16/2042 | 452 | ||||||
| AT&T, Inc. | ||||||||
| 2,510 | 6.80%, 05/15/2036 | 2,954 | ||||||
| BellSouth Telecommunications, Inc. | ||||||||
| 650 | 7.00%, 12/01/2095 | 709 | ||||||
| Cox Communications, Inc. | ||||||||
| 1,325 | 4.50%, 06/30/2043 ■ | 1,141 | ||||||
| 255 | 4.70%, 12/15/2042 ■ | 226 | ||||||
| France Telecom S.A. | ||||||||
| 1,300 | 4.13%, 09/14/2021 | 1,313 | ||||||
| SBA Tower Trust | ||||||||
| 2,035 | 4.25%, 04/15/2015 ■Δ | 2,106 | ||||||
| Verizon Communications, Inc. | ||||||||
| 2,415 | 3.50%, 11/01/2021 | 2,426 | ||||||
| 715 | 4.75%, 11/01/2041 | 680 | ||||||
| 12,592 | ||||||||
| Mining - 0.1% | ||||||||
| Barrick Gold Corp. | ||||||||
| 500 | 4.10%, 05/01/2023 ■ | 417 | ||||||
| Rio Tinto Finance USA Ltd. | ||||||||
| 1,175 | 1.38%, 06/17/2016 | 1,168 | ||||||
| 1,175 | 2.25%, 12/14/2018 | 1,142 | ||||||
| 2,727 | ||||||||
| Miscellaneous Manufacturing - 0.0% | ||||||||
| United Technologies Corp. | ||||||||
| 365 | 3.10%, 06/01/2022 | 361 | ||||||
| Motor Vehicle and Parts Manufacturing - 0.2% | ||||||||
| Daimler Finance NA LLC | ||||||||
| 5,600 | 2.63%, 09/15/2016 ■ | 5,748 | ||||||
| Petroleum and Coal Products Manufacturing - 0.5% | ||||||||
| Atmos Energy Corp. | ||||||||
| 5,875 | 6.35%, 06/15/2017 | 6,845 | ||||||
The accompanying notes are an integral part of these financial statements.
| 8 |
| Shares or Principal Amount | Market Value ╪ | |||||||
CORPORATE BONDS - 10.5% - (continued) | ||||||||
| Petroleum and Coal Products Manufacturing - 0.5% - (continued) | ||||||||
| EnCana Corp. | ||||||||
| $ | 305 | 5.90%, 12/01/2017 | $ | 346 | ||||
| Gazprom Neft OAO via GPN Capital S.A. | ||||||||
| 1,100 | 4.38%, 09/19/2022 ■ | 1,008 | ||||||
| Motiva Enterprises LLC | ||||||||
| 420 | 5.75%, 01/15/2020 ■ | 479 | ||||||
| Ras Laffan Liquefied Natural Gas Co., Ltd. | ||||||||
| 1,200 | 5.50%, 09/30/2014 ■ | 1,254 | ||||||
| Shell International Finance B.V. | ||||||||
| 6,400 | 4.38%, 03/25/2020 | 7,114 | ||||||
| 17,046 | ||||||||
| Pipeline Transportation - 0.2% | ||||||||
| Kinder Morgan Energy Partners L.P. | ||||||||
| 5,000 | 6.95%, 01/15/2038 | 5,912 | ||||||
| Real Estate, Rental and Leasing - 0.2% | ||||||||
| ERAC USA Finance Co. | ||||||||
| 1,121 | 2.25%, 01/10/2014 ■ | 1,129 | ||||||
| 340 | 2.75%, 03/15/2017 ■ | 347 | ||||||
| 1,800 | 4.50%, 08/16/2021 ■ | 1,882 | ||||||
| 1,500 | 5.63%, 03/15/2042 ■ | 1,506 | ||||||
| 4,864 | ||||||||
| Retail Trade - 0.2% | ||||||||
| Amazon.com, Inc. | ||||||||
| 1,550 | 2.50%, 11/29/2022 | 1,407 | ||||||
| AutoZone, Inc. | ||||||||
| 900 | 3.13%, 07/15/2023 | 841 | ||||||
| 1,908 | 3.70%, 04/15/2022 | 1,855 | ||||||
| Lowe's Cos., Inc. | ||||||||
| 3,400 | 4.63%, 04/15/2020 | 3,752 | ||||||
| 7,855 | ||||||||
| Soap, Cleaning Compound and Toilet Manufacturing - 0.4% | ||||||||
| Procter & Gamble Co. | ||||||||
| 8,976 | 9.36%, 01/01/2021 | 11,653 | ||||||
| Transportation Equipment Manufacturing - 0.0% | ||||||||
| Kansas City Southern de Mexico S.A. de C.V. | ||||||||
| 175 | 2.35%, 05/15/2020 ■ | 169 | ||||||
| Utilities - 0.4% | ||||||||
| Consolidated Edison Co. of NY | ||||||||
| 4,605 | 5.30%, 12/01/2016 | 5,202 | ||||||
| Indianapolis Power and Light | ||||||||
| 3,750 | 6.60%, 06/01/2037 ■ | 4,589 | ||||||
| Southern California Edison Co. | ||||||||
| 4,000 | 5.55%, 01/15/2037 | 4,551 | ||||||
| 14,342 | ||||||||
| Wholesale Trade - 0.0% | ||||||||
| Heineken N.V. | ||||||||
| 1,330 | 2.75%, 04/01/2023 ■ | 1,219 | ||||||
| 50 | 4.00%, 10/01/2042 ■ | 43 | ||||||
| 1,262 | ||||||||
| Total corporate bonds | ||||||||
| (cost $308,490) | $ | 333,884 | ||||||
MUNICIPAL BONDS - 0.9% | ||||||||
| General Obligations - 0.2% | ||||||||
| California State GO, Taxable, | ||||||||
| 1,235 | 7.55%, 04/01/2039 | 1,654 | ||||||
| Chicago, IL, Metropolitan Water Reclamation GO, | ||||||||
| 685 | 5.72%, 12/01/2038 | 798 | ||||||
| Los Angeles, CA, USD GO, | ||||||||
| 4,300 | 5.75%, 07/01/2034 | 4,627 | ||||||
| 7,079 | ||||||||
| Health Care/Services - 0.1% | ||||||||
| University of California, Regents MedCenter Pooled Rev, | ||||||||
| 1,935 | 6.58%, 05/15/2049 | 2,295 | ||||||
| Higher Education (Univ., Dorms, etc.) - 0.0% | ||||||||
| University of California, Build America Bonds Rev, | ||||||||
| 1,960 | 5.77%, 05/15/2043 | 2,158 | ||||||
| Refunded - 0.1% | ||||||||
| Irvine Ranch, CA, Water Dist Joint Powers Agency, | ||||||||
| 2,870 | 2.61%, 03/15/2014 | 2,911 | ||||||
| Tax Allocation - 0.1% | ||||||||
| Dallas, TX, Area Rapid Transit Sales Tax Rev, | ||||||||
| 2,200 | 6.00%, 12/01/2044 | 2,649 | ||||||
| Transportation - 0.4% | ||||||||
| Bay Area, CA, Toll Auth Bridge Rev, | ||||||||
| 3,100 | 6.26%, 04/01/2049 | 3,598 | ||||||
| Illinois State Toll Highway Auth, Taxable Rev, | ||||||||
| 1,875 | 6.18%, 01/01/2034 | 2,194 | ||||||
| Maryland State Transportation Auth, | ||||||||
| 1,350 | 5.89%, 07/01/2043 | 1,495 | ||||||
| New York and New Jersey PA, Taxable Rev, | ||||||||
| 975 | 5.86%, 12/01/2024 | 1,118 | ||||||
| 570 | 6.04%, 12/01/2029 | 650 | ||||||
| North Texas Tollway Auth Rev, | ||||||||
| 3,400 | 6.72%, 01/01/2049 | 4,006 | ||||||
| 13,061 | ||||||||
| Total municipal bonds | ||||||||
| (cost $26,787) | $ | 30,153 | ||||||
U.S. GOVERNMENT AGENCIES - 1.2% | ||||||||
| FHLMC - 0.3% | ||||||||
| $ | 128 | 2.29%, 04/01/2029 Δ | $ | 133 | ||||
| 54 | 4.00%, 03/01/2041 | 56 | ||||||
| 4,563 | 5.00%, 07/01/2028 - 05/01/2041 | 4,889 | ||||||
| 4,312 | 5.50%, 12/01/2036 - 09/01/2040 | 4,646 | ||||||
| 9,724 | ||||||||
| FNMA - 0.6% | ||||||||
| 9,000 | 3.00%, 07/15/2028 ☼ | 9,257 | ||||||
| 7,500 | 3.50%, 07/15/2043 ☼ | 7,614 | ||||||
| 186 | 4.85%, 02/01/2014 | 187 | ||||||
| 181 | 5.00%, 02/01/2019 - 04/01/2019 | 195 | ||||||
| 635 | 5.09%, 12/01/2013 | 638 | ||||||
| 1 | 6.50%, 11/01/2013 | 1 | ||||||
The accompanying notes are an integral part of these financial statements.
| 9 |
| Hartford Balanced HLS Fund |
| Schedule of Investments – (continued) |
| June 30, 2013 (Unaudited) |
| (000’s Omitted) |
Shares or Principal Amount | Market Value ╪ | |||||||||||
U.S. GOVERNMENT AGENCIES - 1.2% - (continued) | ||||||||||||
| FNMA - 0.6% - (continued) | ||||||||||||
| $ | 1 | 7.00%, 02/01/2029 | $ | 1 | ||||||||
| 17,893 | ||||||||||||
| GNMA - 0.3% | ||||||||||||
| 2,938 | 6.00%, 06/15/2024 - 06/15/2035 | 3,290 | ||||||||||
| 992 | 6.50%, 03/15/2026 - 02/15/2035 | 1,101 | ||||||||||
| 4,307 | 7.00%, 11/15/2031 - 11/15/2033 | 4,992 | ||||||||||
| 208 | 7.50%, 09/16/2035 | 242 | ||||||||||
| 833 | 8.00%, 09/15/2026 - 02/15/2031 | 919 | ||||||||||
| 27 | 9.00%, 07/20/2016 - 06/15/2022 | 27 | ||||||||||
| 10,571 | ||||||||||||
| Total U.S. government agencies | ||||||||||||
| (cost $37,375) | $ | 38,188 | ||||||||||
| U.S. GOVERNMENT SECURITIES - 15.8% | ||||||||||||
| Other Direct Federal Obligations - 1.3% | ||||||||||||
| FFC - 0.5% | ||||||||||||
| $ | 17,617 | 4.40%, 12/06/2013 - 12/27/2013 ○ | $ | 17,566 | ||||||||
| Tennessee Valley Authority - 0.8% | ||||||||||||
| 22,300 | 4.38%, 06/15/2015 | 23,965 | ||||||||||
| 41,531 | ||||||||||||
| U.S. Treasury Securities - 14.5% | ||||||||||||
| U.S. Treasury Bonds - 2.4% | ||||||||||||
| 8,300 | 2.88%, 05/15/2043 | 7,345 | ||||||||||
| 21,412 | 3.13%, 02/15/2043 | 19,986 | ||||||||||
| 22,000 | 4.38%, 02/15/2038 | 25,761 | ||||||||||
| 18,000 | 6.00%, 02/15/2026 ╦‡ | 24,165 | ||||||||||
| 77,257 | ||||||||||||
| U.S. Treasury Notes - 12.1% | ||||||||||||
| 64,100 | 0.13%, 04/30/2015 | 63,857 | ||||||||||
| 35,520 | 0.25%, 02/28/2015 - 05/31/2015 | 35,490 | ||||||||||
| 8,300 | 0.63%, 05/31/2017 | 8,168 | ||||||||||
| 5,343 | 0.88%, 01/31/2017 | 5,335 | ||||||||||
| 11,800 | 1.00%, 09/30/2016 - 05/31/2018 | 11,713 | ||||||||||
| 113,200 | 1.25%, 10/31/2015 | 115,287 | ||||||||||
| 28,700 | 1.50%, 06/30/2016 | 29,393 | ||||||||||
| 39,000 | 1.75%, 05/15/2023 | 36,526 | ||||||||||
| 5,300 | 2.00%, 04/30/2016 | 5,504 | ||||||||||
| 23,000 | 2.75%, 02/15/2019 | 24,480 | ||||||||||
| 18,935 | 3.50%, 05/15/2020 | 20,948 | ||||||||||
| 24,575 | 3.88%, 05/15/2018 | 27,532 | ||||||||||
| 384,233 | ||||||||||||
| 461,490 | ||||||||||||
| Total U.S. government securities | ||||||||||||
| (cost $485,829) | $ | 503,021 | ||||||||||
| Total long-term investments | ||||||||||||
| (cost $2,521,513) | $ | 3,115,469 | ||||||||||
SHORT-TERM INVESTMENTS - 2.8% | ||||||||||||
Repurchase Agreements - 2.8% | ||||||||||||
| Bank of America Merrill Lynch TriParty Repurchase Agreement (maturing on 07/01/2013 in the amount of $325, collateralized by GNMA 3.00%, 2042, value of $331) | ||||||||||||
| $ | 325 | 0.13%, 6/28/2013 | $ | 325 | ||||||||
| Bank of Montreal TriParty Repurchase Agreement (maturing on 07/01/2013 in the amount of $6,915, collateralized by FHLMC 4.00% - 5.00%, 2023 - 2025, FNMA 2.00% - 5.00%, 2022 - 2042, GNMA 2.00% - 5.00%, 2041 - 2043, value of $7,035) | ||||||||||||
| 6,915 | 0.15%, 6/28/2013 | 6,915 | ||||||||||
| Bank of Montreal TriParty Repurchase Agreement (maturing on 07/01/2013 in the amount of $13,435, collateralized by FHLB 0.38%, 2015, FHLMC 0.38%, 2014, FNMA 0.50% - 5.50%, 2015 - 2042, value of $13,672) | ||||||||||||
| 13,435 | 0.12%, 6/28/2013 | 13,435 | ||||||||||
| Barclays Capital TriParty Repurchase Agreement (maturing on 07/01/2013 in the amount of $9,310, collateralized by U.S. Treasury Note 3.13%, 2021, value of $9,463) | ||||||||||||
| 9,310 | 0.10%, 6/28/2013 | 9,310 | ||||||||||
| Citigroup Global Markets, Inc. TriParty Repurchase Agreement (maturing on 07/01/2013 in the amount of $27,435, collateralized by U.S. Treasury Bill 0.85%, 2013, U.S. Treasury Note 0.63% - 3.25%, 2013 - 2018, value of $27,848) | ||||||||||||
| 27,435 | 0.10%, 6/28/2013 | 27,435 | ||||||||||
| Deutsche Bank Securities TriParty Repurchase Agreement (maturing on 07/01/2013 in the amount of $325, collateralized by FNMA 4.50%, 2035, value of $331) | ||||||||||||
| 325 | 0.25%, 6/28/2013 | 325 | ||||||||||
| RBS Securities, Inc. TriParty Repurchase Agreement (maturing on 07/01/2013 in the amount of $11,002, collateralized by U.S. Treasury Note 1.00% - 2.63%, 2014 - 2020, value of $11,223) | ||||||||||||
| 11,002 | 0.10%, 6/28/2013 | 11,002 | ||||||||||
| TD Securities TriParty Repurchase Agreement (maturing on 07/01/2013 in the amount of $19,403, collateralized by FHLMC 3.50% - 4.00%, 2042, FNMA 3.50% - 4.50%, 2041 - 2042, value of $19,733) | ||||||||||||
| 19,403 | 0.12%, 6/28/2013 | 19,403 | ||||||||||
| UBS Securities, Inc. Repurchase Agreement (maturing on 07/01/2013 in the amount of $280, collateralized by U.S. Treasury Note 0.63%, 2014, value of $286) | ||||||||||||
| 280 | 0.09%, 6/28/2013 | 280 | ||||||||||
| 88,430 | ||||||||||||
| Total short-term investments | ||||||||||||
| (cost $88,430) | $ | 88,430 | ||||||||||
| Total investments | ||||||||||||
| (cost $2,609,943) ▲ | 100.6 | % | $ | 3,203,899 | ||||||||
| Other assets and liabilities | (0.6 | )% | (19,880 | ) | ||||||||
| Total net assets | 100.0 | % | $ | 3,184,019 | ||||||||
The accompanying notes are an integral part of these financial statements.
| 10 |
| Note: | Percentage of investments as shown is the ratio of the total market value to total net assets. |
| Prices of foreign equities that are principally traded on certain foreign markets may be adjusted daily pursuant to a fair value pricing service approved by the Board of Directors in order to reflect an adjustment for factors occurring after the close of certain foreign markets but before the close of the New York Stock Exchange. |
| ▲ | At June 30, 2013, the cost of securities for federal income tax purposes was $2,630,037 and the aggregate gross unrealized appreciation and depreciation based on that cost were: |
| Unrealized Appreciation | $ | 614,691 | ||
| Unrealized Depreciation | (40,829 | ) | ||
| Net Unrealized Appreciation | $ | 573,862 |
| † | These securities were valued in good faith at fair value as determined under policies and procedures established by and under the supervision of the Company's Board of Directors. At June 30, 2013, the aggregate value of these securities was $27,682, which represents 0.9% of total net assets. This amount excludes securities that are principally traded in certain foreign markets and whose prices are adjusted pursuant to a third party pricing service methodology approved by the Board of Directors. |
| ● | Non-income producing. |
| Δ | Variable rate securities; the rate reported is the coupon rate in effect at June 30, 2013. |
| ○ | The interest rate disclosed for these securities represents the effective yield on the date of the acquisition. |
| ■ | Securities issued within terms of a private placement memorandum, exempt from registration under Rule 144A under the Securities Act of 1933, as amended, and may be sold only to qualified institutional buyers. Unless otherwise indicated, these holdings are determined to be liquid. At June 30, 2013, the aggregate value of these securities was $62,211, which represents 2.0% of total net assets. |
| ⌂ | The following securities are considered illiquid. Illiquid securities are often purchased in private placement transactions, are often not registered under the Securities Act of 1933 and may have contractual restrictions on resale. A security may also be considered illiquid if the security lacks a readily available market or if its valuation has not changed for a certain period of time. |
| Period Acquired | Shares/ Par | Security | Cost Basis | |||||||
| 08/2011 | 11,702 | Allstar Co. | $ | 6,915 | ||||||
| 06/2007 | 11,241 | Buck Holdings L.P. | 758 | |||||||
At June 30, 2013, the aggregate value of these securities was $27,682, which represents 0.9% of total net assets.
| ☼ | This security, or a portion of this security, was purchased on a when-issued, delayed-delivery or delayed-draw basis. The cost of these securities was $17,113 at June 30, 2013. |
| ‡ | This security, or a portion of this security, has been segregated to cover funding requirements on investment transactions settling in the future. |
| ╦ | This security, or a portion of this security, has been pledged as collateral in connection with swap contracts. |
| Securities Sold Short Outstanding at June 30, 2013 | ||||||||||||||
| Description | Principal Amount | Maturity Date | Market Value ╪ | Unrealized Appreciation/ Depreciation | ||||||||||
| FHLMC TBA, 5.50% | $ | 3,100 | 07/15/2043 | $ | 3,335 | $ | (6 | ) | ||||||
| At June 30, 2013, the aggregate value of these securities represents 0.1% of total net assets. |
The accompanying notes are an integral part of these financial statements.
| 11 |
| Hartford Balanced HLS Fund |
| Schedule of Investments – (continued) |
| June 30, 2013 (Unaudited) |
| (000’s Omitted) |
| Credit Default Swap Contracts Outstanding at June 30, 2013 | ||||||||||||||||||||||||
| Reference Entity | Counterparty | Notional Amount (a) | (Pay)/Receive Fixed Rate | Expiration Date | Upfront Premiums Paid/ (Received) | Market Value ╪ | Unrealized Appreciation/ (Depreciation) | |||||||||||||||||
| Credit default swaps on traded indices: | ||||||||||||||||||||||||
| Sell protection: | ||||||||||||||||||||||||
| CMBX.NA.AAA.6 | DEUT | $ | 1,815 | 0.50 | % | 05/11/63 | $ | (88 | ) | $ | (102 | ) | $ | (14 | ) | |||||||||
| CMBX.NA.AAA.6 | MSC | 1,170 | 0.50 | % | 05/11/63 | (56 | ) | (65 | ) | (9 | ) | |||||||||||||
| Total | $ | (144 | ) | $ | (167 | ) | $ | (23 | ) | |||||||||||||||
| (a) | The maximum potential amount the Fund could be required to pay as a seller of credit protection or receive as a buyer of credit protection if a credit event occurs as defined under the terms of that particular swap agreement. Notional shown in U.S. dollars unless otherwise noted. |
| ╪ | See Significant Accounting Policies of accompanying Notes to Financial Statements regarding valuation of securities. |
| GLOSSARY: (abbreviations used in preceding Schedule of Investments) | ||
| Counterparty Abbreviations: | ||
| DEUT | Deutsche Bank Securities, Inc. | |
| MSC | Morgan Stanley | |
| Index Abbreviations: | ||
| CMBX.NA | Markit Commercial Mortgage Backed North American | |
| Municipal Bond Abbreviations: | ||
| GO | General Obligation | |
| PA | Port Authority | |
| Rev | Revenue | |
| USD | United School District | |
| Other Abbreviations: | ||
| ADR | American Depositary Receipt | |
| FFC | Federal Financing Corp. | |
| FHLB | Federal Home Loan Bank | |
| FHLMC | Federal Home Loan Mortgage Corp. | |
| FNMA | Federal National Mortgage Association | |
| GNMA | Government National Mortgage Association | |
The accompanying notes are an integral part of these financial statements.
| 12 |
| Hartford Balanced HLS Fund |
| Investment Valuation Hierarchy Level Summary |
| June 30, 2013 (Unaudited) |
| (000’s Omitted) |
| Total | Level 1 ♦ | Level 2 ♦ | Level 3 | |||||||||||||
| Assets: | ||||||||||||||||
| Asset & Commercial Mortgage Backed Securities | $ | 4,903 | $ | – | $ | 4,895 | $ | 8 | ||||||||
| Common Stocks ‡ | 2,205,320 | 2,098,270 | 79,368 | 27,682 | ||||||||||||
| Corporate Bonds | 333,884 | – | 309,637 | 24,247 | ||||||||||||
| Municipal Bonds | 30,153 | – | 30,153 | – | ||||||||||||
| U.S. Government Agencies | 38,188 | – | 38,188 | – | ||||||||||||
| U.S. Government Securities | 503,021 | 53,795 | 449,226 | – | ||||||||||||
| Short-Term Investments | 88,430 | – | 88,430 | – | ||||||||||||
| Total | $ | 3,203,899 | $ | 2,152,065 | $ | 999,897 | $ | 51,937 | ||||||||
| Liabilities: | ||||||||||||||||
| Securities Sold Short | $ | 3,335 | $ | – | $ | 3,335 | $ | – | ||||||||
| Total | $ | 3,335 | $ | – | $ | 3,335 | $ | – | ||||||||
| Credit Default Swaps * | 23 | – | 23 | – | ||||||||||||
| Total | $ | 23 | $ | – | $ | 23 | $ | – | ||||||||
| ♦ | For the six-month period ended June 30, 2013, there were no transfers between Level 1 and Level 2. |
| ‡ | The Fund has all or primarily all of the equity securities categorized in a particular level. Refer to the Schedule of Investments for further industry breakout. |
| * | Derivative instruments not reflected in the Schedule of Investments are valued at the unrealized appreciation/depreciation on the investments. |
| Following is a reconciliation of Level 3 assets for which significant unobservable inputs were used to determine fair value: |
Balance as | Realized | Change in | Net | Purchases | Sales | Transfers | Transfers | Balance as | ||||||||||||||||||||||||||||
| Assets: | ||||||||||||||||||||||||||||||||||||
| Asset & Commercial Mortgage Backed Securities | $ | 8 | $ | — | $ — | * | $ | — | $ | — | $ | — | $ | — | $ | — | $ | 8 | ||||||||||||||||||
| Common Stocks | 24,542 | 5,109 | 4,380 | † | — | — | (6,349 | ) | — | — | 27,682 | |||||||||||||||||||||||||
| Corporate Bonds | 25,415 | (49 | ) | (468 | )‡ | (52 | ) | — | (599 | ) | — | — | 24,247 | |||||||||||||||||||||||
| Total | $ | 49,965 | $ | 5,060 | $ | 3,912 | $ | (52 | ) | $ | — | $ | (6,948 | ) | $ | — | $ | — | $ | 51,937 | ||||||||||||||||
| * | Change in unrealized appreciation (depreciation) in the current period relating to assets still held at June 30, 2013 rounds to zero. |
| † | Change in unrealized appreciation (depreciation) in the current period relating to assets still held at June 30, 2013 was $4,380. |
| ‡ | Change in unrealized appreciation (depreciation) in the current period relating to assets still held at June 30, 2013 was $(468). |
The accompanying notes are an integral part of these financial statements.
| 13 |
| Hartford Balanced HLS Fund |
| Statement of Assets and Liabilities |
| June 30, 2013 (Unaudited) |
| (000’s Omitted) |
| Assets: | ||||
| Investments in securities, at market value (cost $2,609,943) | $ | 3,203,899 | ||
| Cash | 289 | |||
| Receivables: | ||||
| Investment securities sold | 21,244 | |||
| Fund shares sold | 188 | |||
| Dividends and interest | 9,670 | |||
| Other assets | — | |||
| Total assets | 3,235,290 | |||
| Liabilities: | ||||
| Unrealized depreciation on swap contracts | 23 | |||
| Securities sold short, at market value (proceeds $3,329) | 3,335 | |||
| Payables: | ||||
| Investment securities purchased | 42,868 | |||
| Fund shares redeemed | 4,365 | |||
| Investment management fees | 321 | |||
| Distribution fees | 16 | |||
| Accrued expenses | 199 | |||
| Swap premiums received | 144 | |||
| Total liabilities | 51,271 | |||
| Net assets | $ | 3,184,019 | ||
| Summary of Net Assets: | ||||
| Capital stock and paid-in-capital | $ | 3,400,570 | ||
| Undistributed net investment income | 29,515 | |||
| Accumulated net realized loss | (840,002 | ) | ||
| Unrealized appreciation of investments and the translations of assets and liabilities denominated in foreign currency | 593,936 | |||
| Net assets | $ | 3,184,019 | ||
| Shares authorized | 9,500,000 | |||
| Par value | $ | 0.001 | ||
| Class IA: Net asset value per share | $ | 23.07 | ||
| Shares outstanding | 120,552 | |||
| Net assets | $ | 2,781,460 | ||
| Class IB: Net asset value per share | $ | 23.34 | ||
| Shares outstanding | 17,245 | |||
| Net assets | $ | 402,559 |
The accompanying notes are an integral part of these financial statements.
| 14 |
| Hartford Balanced HLS Fund |
| Statement of Operations |
| For the Six-Month Period Ended June 30, 2013 (Unaudited) |
| (000’s Omitted) |
| Investment Income: | ||||
| Dividends | $ | 25,842 | ||
| Interest | 14,585 | |||
| Less: Foreign tax withheld | (592 | ) | ||
| Total investment income, net | 39,835 | |||
| Expenses: | ||||
| Investment management fees | 9,893 | |||
| Distribution fees - Class IB | 513 | |||
| Custodian fees | 10 | |||
| Accounting services fees | 258 | |||
| Board of Directors' fees | 43 | |||
| Audit fees | 16 | |||
| Other expenses | 258 | |||
| Total expenses (before fees paid indirectly) | 10,991 | |||
| Commission recapture | (7 | ) | ||
| Custodian fee offset | — | |||
| Total fees paid indirectly | (7 | ) | ||
| Total expenses, net | 10,984 | |||
| Net Investment Income | 28,851 | |||
| Net Realized Gain on Investments, Other Financial Instruments and Foreign Currency Transactions: | ||||
| Net realized gain on investments | 105,634 | |||
| Net realized loss on securities sold short | (5 | ) | ||
| Net realized gain on swap contracts | 1 | |||
| Net realized gain on foreign currency contracts | 52 | |||
| Net realized loss on other foreign currency transactions | (63 | ) | ||
| Net Realized Gain on Investments, Other Financial Instruments and Foreign Currency Transactions | 105,619 | |||
| Net Changes in Unrealized Appreciation of Investments, Other Financial Instruments and Foreign Currency Transactions: | ||||
| Net unrealized appreciation of investments | 165,510 | |||
| Net unrealized appreciation of securities sold short | 7 | |||
| Net unrealized depreciation of swap contracts | (23 | ) | ||
| Net unrealized depreciation on translation of other assets and liabilities in foreign currencies | (11 | ) | ||
| Net Changes in Unrealized Appreciation of Investments, Other Financial Instruments and Foreign Currency Transactions | 165,483 | |||
| Net Gain on Investments, Other Financial Instruments and Foreign Currency Transactions | 271,102 | |||
| Net Increase in Net Assets Resulting from Operations | $ | 299,953 |
The accompanying notes are an integral part of these financial statements.
| 15 |
| Hartford Balanced HLS Fund |
| Statement of Changes in Net Assets |
| (000’s Omitted) |
| For the Six-Month Period Ended June 30, 2013 (Unaudited) | For the Year Ended December 31, 2012 | |||||||
| Operations: | ||||||||
| Net investment income | $ | 28,851 | $ | 65,371 | ||||
| Net realized gain on investments, other financial instruments and foreign currency transactions | 105,619 | 166,748 | ||||||
| Net unrealized appreciation of investments, other financial instruments and foreign currency transactions | 165,483 | 152,137 | ||||||
| Net Increase in Net Assets Resulting from Operations | 299,953 | 384,256 | ||||||
| Distributions to Shareholders: | ||||||||
| From net investment income | ||||||||
| Class IA | — | (82,214 | ) | |||||
| Class IB | — | (10,942 | ) | |||||
| Total distributions | — | (93,156 | ) | |||||
| Capital Share Transactions: | ||||||||
| Class IA | ||||||||
| Sold | 36,979 | 50,211 | ||||||
| Issued on reinvestment of distributions | — | 82,214 | ||||||
| Redeemed | (271,761 | ) | (589,901 | ) | ||||
| Total capital share transactions | (234,782 | ) | (457,476 | ) | ||||
| Class IB | ||||||||
| Sold | 15,427 | 19,586 | ||||||
| Issued on reinvestment of distributions | — | 10,942 | ||||||
| Redeemed | (56,849 | ) | (118,840 | ) | ||||
| Total capital share transactions | (41,422 | ) | (88,312 | ) | ||||
| Net decrease from capital share transactions | (276,204 | ) | (545,788 | ) | ||||
| Net Increase (Decrease) in Net Assets | 23,749 | (254,688 | ) | |||||
| Net Assets: | ||||||||
| Beginning of period | 3,160,270 | 3,414,958 | ||||||
| End of period | $ | 3,184,019 | $ | 3,160,270 | ||||
| Undistributed (distribution in excess of) | ||||||||
| net investment income | $ | 29,515 | $ | 664 | ||||
| Shares: | ||||||||
| Class IA | ||||||||
| Sold | 1,644 | 2,405 | ||||||
| Issued on reinvestment of distributions | — | 3,914 | ||||||
| Redeemed | (12,048 | ) | (28,367 | ) | ||||
| Total share activity | (10,404 | ) | (22,048 | ) | ||||
| Class IB | ||||||||
| Sold | 673 | 928 | ||||||
| Issued on reinvestment of distributions | — | 514 | ||||||
| Redeemed | (2,492 | ) | (5,664 | ) | ||||
| Total share activity | (1,819 | ) | (4,222 | ) | ||||
The accompanying notes are an integral part of these financial statements.
| 16 |
| Hartford Balanced HLS Fund |
| Notes to Financial Statements |
| June 30, 2013 (Unaudited) |
| (000’s Omitted) |
| 1. | Organization: |
Hartford Balanced HLS Fund (the “Fund”) serves as an underlying investment option for certain variable annuity and variable life insurance separate accounts of Hartford Life Insurance Company (“HLIC”) and its affiliates and certain qualified retirement plans. The Fund may also serve as an underlying investment option for certain variable annuity and variable life separate accounts of other insurance companies. Owners of variable annuity contracts and policyholders of variable life insurance contracts may choose the funds permitted in the variable insurance contract prospectus. In addition, participants in certain qualified retirement plans may choose the Fund if permitted by their plans.
Hartford Series Fund, Inc. (the “Company”) is an open-end registered management investment company comprised of thirty portfolios. Financial statements for the Fund, a series of the Company, are included in this report.
The Company is organized under the laws of the State of Maryland and is registered with the Securities and Exchange Commission (“SEC”) under the Investment Company Act of 1940, as amended (“1940 Act”). The Fund is a diversified open-end management investment company.
The Fund is divided into Class IA and Class IB shares. Each class is offered at the per share net asset value (“NAV”) without a sales charge and is subject to the same expenses, except that the Class IB shares are subject to distribution and service fees charged pursuant to a Distribution Plan adopted in accordance with Rule 12b-1 under the 1940 Act.
| 2. | Significant Accounting Policies: |
The following is a summary of significant accounting policies of the Fund in the preparation of its financial statements, which are in accordance with the United States Generally Accepted Accounting Principles (“U.S. GAAP”). The preparation of financial statements in accordance with U.S. GAAP may require management to make estimates and assumptions that affect the reported amounts of assets and liabilities and disclosure of contingent assets and liabilities at the date of the financial statements and the reported amounts of increases and decreases in net assets from operations during the reporting period. Actual results could differ from those estimates.
| a) | Determination of Net Asset Value – The NAV of each class of the Fund’s shares is determined as of the close of regular trading (normally 4:00 p.m. Eastern Time) (the “NYSE Close”) on each day that the New York Stock Exchange (the “Exchange”) is open (“Valuation Date”). Information that becomes known to the Fund after the NAV has been calculated on a particular day will not generally be used to retroactively adjust the NAV determined earlier that day. |
| b) | Investment Valuation and Fair Value Measurements – For purposes of calculating the NAV, portfolio investments and other assets held by the Fund's portfolio for which market quotes are readily available are valued at market value. Market value is generally determined on the basis of last reported sales prices or official close price. If no sales are reported, market value is based on quotes obtained from a quotation reporting system, established market makers, or independent pricing services. If market prices are not readily available or are deemed unreliable, the Fund will use the fair value of the investment as determined in good faith under policies and procedures established by and under the supervision of the Company’s Board of Directors. Market quotes are considered not readily available where there is an absence of current or reliable market-based data (e.g., trade information or indicative market quotes), including where events occur after the close of the relevant market, but prior to the NYSE Close that materially affect the values of the Fund’s portfolio investments or assets. In addition, market quotes are considered not readily available when, due to extraordinary circumstances, the exchanges or markets on which the investments trade do not open for trading for the entire day and no other market prices are available. In addition, prices of foreign equities that are principally traded on certain foreign markets may be adjusted daily pursuant to a fair value pricing service approved by the Board of Directors in order to reflect an adjustment for the factors occurring after the close of certain foreign markets but before the NYSE Close. Investments that are primarily traded on foreign markets may trade on days that are not business days of the Fund. The value of the foreign investments in which the Fund invests may change on days when a shareholder will not be able to |
| 17 |
| Hartford Balanced HLS Fund |
Notes to Financial Statements – (continued) |
| June 30, 2013 (Unaudited) |
| (000’s Omitted) |
purchase or redeem shares of the Fund. Fair value pricing is subjective in nature and the use of fair value pricing by the Fund may cause the NAV of its shares to differ significantly from the NAV that would have been calculated using market prices at the close of the exchange on which a portfolio investment is primarily traded. There can be no assurance that the Fund could obtain the fair market value assigned to an investment if the Fund were to sell the investment at approximately the time at which the Fund determines its NAV.
Fixed income investments (other than short term obligations) and non-exchange traded derivatives held by the Fund are normally valued on the basis of quotes obtained from brokers and dealers or independent pricing services in accordance with procedures established by the Company’s Board of Directors. Prices obtained from independent pricing services use information provided by market makers or estimates of market values through accepted market modeling and trading and pricing conventions. Inputs to the models may include, but are not limited to, prepayment speeds, pricing spread, yield, trade information, dealer quotes, market color, cash flow models and the bond’s terms and conditions. Generally, the Fund may use fair valuation in regard to fixed income investments when the Fund holds defaulted or distressed investments or investments in a company in which a reorganization is pending. Short-term investments maturing in 60 days or less are generally valued at amortized cost, if their original term to maturity was 60 days or less, or by amortizing their value on the 61st day prior to maturity, if the original term to maturity exceeded 60 days.
Investments valued in currencies other than U.S. dollars are converted to U.S. dollars using exchange rates obtained from independent pricing services for calculation of the NAV. As a result, the NAV of the Fund’s shares may be affected by changes in the value of currencies in relation to the U.S. dollar. The value of investments traded in markets outside the United States or denominated in currencies other than the U.S. dollar may be affected significantly on a day that the NYSE is closed and the market value may change on days when an investor is not able to purchase, redeem or exchange shares of the Fund.
Foreign currency contracts represent agreements to exchange currencies on specific future dates at predetermined rates. Foreign currency contracts are valued using foreign currency exchange rates and forward rates as provided by an independent pricing service on the Valuation Date.
Financial instruments for which prices are not available from an independent pricing service may be valued using market quotations obtained from one or more dealers that make markets in the respective financial instrument in accordance with procedures established by the Company’s Board of Directors.
U.S. GAAP defines fair value as the price that the Fund would receive to sell an asset or pay to transfer a liability in an orderly transaction between market participants. The U.S. GAAP fair value measurement standards require disclosure of a fair value hierarchy for each major category of assets and liabilities. Various inputs are used in determining the fair value of the Fund’s investments. These inputs are summarized into three broad hierarchy levels. This hierarchy is based on whether the valuation inputs are observable or unobservable. These levels are:
| · | Level 1 – Quoted prices in active markets for identical investments. Level 1 may include exchange traded instruments, such as domestic equities, some foreign equities, options, futures, mutual funds, exchange traded funds, rights and warrants. |
| · | Level 2 – Observable inputs other than Level 1 prices, such as quoted prices for similar investments; quoted prices in markets that are not active; or other inputs that are observable or can be corroborated by observable market data. Level 2 may include debt investments that are traded less frequently than exchange traded instruments and which are valued using independent pricing services; foreign equities, which are principally traded on certain foreign markets and are adjusted daily pursuant to a fair value pricing service in order to reflect an adjustment for the factors occurring after the close of certain foreign markets but before the NYSE Close; and short-term investments, which are valued at amortized cost. |
| · | Level 3 – Significant unobservable inputs that are supported by limited or no market activity. Level 3 may include financial instruments whose values are determined using indicative market quotes or require significant |
| 18 |
management judgment or estimation. These unobservable valuation inputs may include estimates for current yields, maturity/duration, prepayment speed, and indicative market quotes for comparable investments along with other assumptions relating to credit quality, collateral value, complexity of the investment structure, general market conditions and liquidity. This category may include investments where trading has been halted or there are certain restrictions on trading. While these investments are priced using unobservable inputs, the valuation of these investments reflects the best available data and management believes the prices are a reasonable representation of exit price.
The Board of Directors of the Company generally reviews and approves the “Procedures for Valuation of Portfolio Securities” on an annual basis. These procedures define how investments are to be valued, including the formation and activities of a Valuation Committee. The Valuation Committee is responsible for determining in good faith the fair value of investments when the value cannot be obtained from primary pricing services or alternative sources or if the valuation of an investment as provided by the primary pricing service or alternative source is believed not to reflect the investment’s fair value as of the Valuation Date. Members of the Valuation Committee include the Fund’s Treasurer or designee, a Vice President of the Fund with legal expertise or designee, and a Vice President of the investment manager or designee. In addition, the Fund’s Chief Compliance Officer shall designate a member of the compliance group to attend Valuation Committee meetings as a non-voting resource, to monitor for and provide guidance with respect to compliance with these procedures. Two members of the Valuation Committee or their designees, representing different departments, shall constitute a quorum for purposes of permitting the Valuation Committee to take action. The Valuation Committee will consider all relevant factors in determining an investment’s fair value, and may seek the advice of the Fund’s sub-adviser, knowledgeable brokers, and legal counsel in making such determination. The Valuation Committee reports to the Audit Committee of the Company’s Board of Directors. The Audit Committee receives quarterly written reports which include details of all fair-valued investments, including the reason for the fair valuation, and an indication, when possible, of the accuracy of the valuation by disclosing the next available reliable public price quotation or the disposition price of such investments (the “look-back” test). The Board of Directors then must consider for ratification all of the fair value determinations made during the previous quarter.
Valuation levels are not necessarily indicative of the risk associated with investing in such investments. Individual investments within any of the above mentioned asset classes may be assigned a different hierarchical level than those presented above, as individual circumstances dictate.
For additional information, refer to the Investment Valuation Hierarchy Level Summary and the Level 3 roll-forward reconciliation, if applicable, which follow the Schedule of Investments.
For purposes of reporting transfers between different hierarchy levels, both transfers in and out of each level, as applicable, are shown as if they occurred at the beginning of the period.
| c) | Investment Transactions and Investment Income – Investment transactions are recorded as of the trade date (the date the order to buy or sell is executed) for financial reporting purposes. Investments purchased or sold on a when-issued or delayed-delivery basis may be settled a month or more after the trade date. Realized gains and losses are determined on the basis of identified cost. |
Dividend income from domestic securities is accrued on the ex-dividend date. In general, dividend income from foreign securities is recorded on the ex-date; however, dividend notifications in certain foreign jurisdictions may not be available in a timely manner and as a result, the Fund will record the dividend as soon as the relevant details (i.e., rate per share, payment date, shareholders of record, etc.) are publicly available. Interest income, including amortization of premium and accretion of discounts, is accrued on a daily basis. Paydown gains and losses on mortgage-related and other asset-backed securities are included in interest income in the Statement of Operations, as applicable.
| 19 |
| Hartford Balanced HLS Fund |
Notes to Financial Statements – (continued) |
| June 30, 2013 (Unaudited) |
| (000’s Omitted) |
| d) | Foreign Currency Transactions – Assets and liabilities denominated in currencies other than U.S. dollars are translated into U.S. dollars at the exchange rates in effect on the valuation date. Purchases and sales of investments, income, and expenses are translated into U.S. dollars at the exchange rates on the dates of such transactions. |
The Fund does not isolate that portion of portfolio investment valuation resulting from fluctuations in the foreign currency exchange rates from the fluctuations arising from changes in the market prices of investments held. Exchange rate fluctuations are included with the net realized and unrealized gain or loss on investments in the accompanying financial statements.
Net realized foreign exchange gains or losses arise from sales of foreign currencies and the difference between asset and liability amounts initially stated in foreign currencies and the U.S. dollar value of the amounts actually received or paid. Net unrealized foreign exchange gains or losses arise from changes in the value of other assets and liabilities at the end of the reporting period, resulting from changes in the exchange rates.
| e) | Joint Trading Account – The Fund may invest cash balances into a joint trading account that may be invested in one or more repurchase agreements. |
| f) | Fund Share Valuation and Dividend Distributions to Shareholders – Orders for the Fund’s shares are executed in accordance with the investment instructions of the contract holders and plan participants. The NAV of the Fund’s shares is determined as of the close of business on each business day of the Exchange. The NAV is determined separately for each class of shares of the Fund by dividing the Fund’s net assets attributable to that class by the number of shares of the class outstanding. Each class of shares offered by the Fund has equal rights as to assets and voting privileges (except that shareholders of a class have exclusive voting rights regarding any matter relating solely to that class of shares). Income and non-class specific expenses are allocated daily to each class on the basis of the relative net assets of the class. Realized and unrealized capital gains and losses are allocated daily based on the relative net assets of each class of shares of the Fund. |
Orders for the purchase of the Fund’s shares received prior to the close of the Exchange on any day the Exchange is open for business are priced at the NAV determined as of the close of the Exchange. Orders received after the close of the Exchange, or on a day on which the Exchange and/or the Fund is not open for business, are priced at the next determined NAV.
Dividends are declared pursuant to a policy adopted by the Company’s Board of Directors based upon the investment performance of the Fund. The policy of the Fund is to pay dividends from net investment income and realized capital gains, if any, at least once a year.
Distributions from net investment income, net realized capital gains and capital are determined in accordance with federal income tax regulations, which may differ from U.S. GAAP with respect to character and timing. These differences may include but are not limited to losses deferred due to wash sale adjustments, foreign currency gains and losses, adjustments related to Passive Foreign Investment Companies (“PFICs”), Real Estate Investment Trusts (“REITs”), Regulated Investment Companies (“RICs”), certain derivatives and partnerships. Permanent book and federal income tax basis differences relating to shareholder distributions will result in reclassifications to certain of the Fund’s capital accounts (see Federal Income Taxes: Reclassification of Capital Accounts note).
| 3. | Securities and Other Investments: |
| a) | Repurchase Agreements – A repurchase agreement is an agreement by which a counterparty agrees to sell an investment and agrees to repurchase the investment sold from the buyer at a mutually agreed upon time and price. During the period of the repurchase agreement, the counterparty will deposit cash and or securities in a third party custodial account to serve as collateral. At the time the Fund enters into a repurchase agreement, the value of the underlying collateral, |
| 20 |
including accrued interest, will be equal to or exceed the value of the repurchase agreement. Repurchase agreements expose the Fund to counterparty risk - that is, the risk that the counterparty will not fulfill its obligations. To minimize counterparty risk, the investments that serve to collateralize the repurchase agreement are held by the Fund’s custodian in book entry or physical form in the custodial account of the Fund or in a third party custodial account. Repurchase agreements are valued at cost plus accrued interest, which approximates fair value. Repurchase agreements have master netting agreements which allow the Fund to offset amounts owed to a counterparty with amounts owed by the counterparty, including any collateral. The Fund, as shown on the Schedule of Investments, had outstanding repurchase agreements as of June 30, 2013.
| b) | Illiquid and Restricted Investments – The Fund is permitted to invest up to 15% of its net assets in illiquid investments. Illiquid investments are those that may not be sold or disposed of in the ordinary course of business within seven days, at approximately the price used to determine the Fund’s NAV. The Fund may not be able to sell illiquid investments when its sub-adviser considers it desirable to do so or may have to sell such investments at a price that is lower than the price that could be obtained if the investments were more liquid. A sale of illiquid investments may require more time and may result in higher dealer discounts and other selling expenses than does the sale of those that are liquid. Illiquid investments also may be more difficult to value due to the unavailability of reliable market quotations for such investments, and an investment in them may have an adverse impact on the Fund’s NAV. The Fund may also purchase certain restricted investments that can only be resold to certain qualified investors and may be determined to be liquid pursuant to policies and guidelines established by the Company’s Board of Directors. The Fund, as shown on the Schedule of Investments, had illiquid and/or restricted investments as of June 30, 2013. |
| c) | Investments Purchased on a When-Issued or Delayed-Delivery Basis – Delivery and payment for investments that have been purchased by the Fund on a forward commitment, or when-issued or delayed-delivery basis, take place beyond the customary settlement period. A fund may dispose of or renegotiate a delayed-delivery transaction after it is entered into, and may sell delayed-delivery investments before they are delivered, which may result in a realized gain or loss. During this period, such investments are subject to market fluctuations, and the Fund identifies investments segregated in its records with a value at least equal to the amount of the commitment. The Fund, as shown on the Schedule of Investments, had when-issued or delayed-delivery investments as of June 30, 2013. |
In connection with the Fund’s ability to purchase investments on a when-issued or forward commitment basis, the Fund may enter into to-be announced (“TBA”) commitments. TBA commitments are forward agreements for the purchase or sale of mortgage-backed securities for a fixed price, with payment and delivery on an agreed-upon future settlement date. The specific securities to be delivered are not identified at the trade date; however, delivered securities must meet specified terms, including issuer, rate and mortgage terms. Although the Fund may enter into TBA commitments with the intention of acquiring or delivering securities for its portfolio, the Fund can extend the settlement date, roll the transaction, or dispose of a commitment prior to settlement if deemed appropriate to do so. If the TBA commitment is closed through the acquisition of an offsetting TBA commitment, the Fund realizes a gain or loss. In a TBA roll transaction, the Fund generally purchases or sells the initial TBA commitment prior to the agreed upon settlement date and enters into a new TBA commitment for future delivery or receipt of the mortgage-backed securities. TBA commitments involve a risk of loss if the value of the security to be purchased or sold declines or increases, respectively, prior to settlement date.
The Fund may enter into “dollar rolls” in which the Fund sells securities and contracts with the same counterparty to repurchase substantially similar securities (for example, same issuer, coupon and maturity) on a specified future date at an agreed upon price. The Fund gives up the right to receive interest paid on the investments sold. The Fund would benefit to the extent of any differences between the price received for the security and the lower forward price for the future purchase. Dollar rolls involve the risk that the market value of the securities that the Fund is required to purchase may decline below the agreed upon repurchase price of those securities. The Fund records dollar roll transactions as purchases and sales and realizes gains and losses on these transactions. These transactions are excluded from the Fund’s portfolio turnover rate. The Fund had open dollar roll transactions as of June 30, 2013.
| 21 |
| Hartford Balanced HLS Fund |
| Notes to Financial Statements – (continued) |
| June 30, 2013 (Unaudited) |
| (000’s Omitted) |
| d) | Mortgage Related and Other Asset Backed Securities – The Fund may invest in mortgage related and other asset backed securities. These securities include mortgage pass-through securities, collateralized mortgage obligations, commercial mortgage backed securities, stripped mortgage backed securities, asset backed securities, collateralized debt obligations and other securities that directly or indirectly represent a participation in, or are secured by and payable from, mortgage loans on real property. Mortgage related securities are created from pools of residential or commercial mortgage loans, including mortgage loans made by savings and loan institutions, mortgage bankers, commercial banks and others. Asset backed securities are created from many types of assets, including auto loans, credit card receivables, home equity loans, and student loans. These securities provide a monthly payment that consists of both interest and principal payments. Interest payments may be determined by fixed or adjustable rates. The rate of pre-payments on underlying mortgages will affect the price and volatility of a mortgage related security, and may have the effect of shortening or extending the effective duration of the security relative to what was anticipated at the time of purchase. The timely payment of principal and interest of certain mortgage related securities is guaranteed by the full faith and credit of the United States Government. Mortgage related and other asset backed securities created and guaranteed by non-governmental issuers, including government-sponsored corporations, may be supported by various forms of insurance or guarantees, but there can be no assurance that the private insurers or guarantors can meet their obligations under the insurance policies or guarantee arrangements. The Fund, as shown on the Schedule of Investments, had mortgage related and other asset backed securities as of June 30, 2013. |
| 4. | Financial Derivative Instruments: |
The following disclosures contain information on how and why the Fund uses derivative instruments, the credit-risk-related contingent features in certain derivative instruments, and how derivative instruments affect the Fund’s financial position and results of operations. The location and fair value amounts of these instruments on the Statement of Assets and Liabilities and the realized gains and losses and changes in unrealized gains and losses on the Statement of Operations, each categorized by type of derivative contract, are included in the following Additional Derivative Instrument Information footnote. The derivative instruments outstanding as of period-end are disclosed in the notes to or within the Schedule of Investments for purchased options, if applicable. The amounts of realized gains and losses and changes in unrealized gains and losses on derivative instruments during the period are disclosed in the Statement of Operations.
| a) | Foreign Currency Contracts – The Fund may enter into foreign currency contracts that obligate the Fund to purchase or sell currencies at specified future dates. Foreign currency contracts are used to hedge the currency exposure associated with some or all of the Fund’s investments and/or as part of an investment strategy. Foreign currency contracts are marked to market daily and the change in value is recorded by the Fund as an unrealized gain or loss. The Fund will record a realized gain or loss when the foreign currency contract is settled. |
Foreign currency contracts involve elements of market risk in excess of the amounts reflected in the Statement of Assets and Liabilities. In addition, risks may arise upon entering into these contracts from the potential inability of the counterparties to meet the terms of the contracts and from unanticipated movements in the value of the foreign currencies relative to the U.S. dollar. The Fund had no outstanding foreign currency contracts as of June 30, 2013.
| b) | Swap Contracts – The Fund may invest in swap contracts. Swap contracts are privately negotiated agreements between the Fund and a counterparty to exchange or swap investment cash flows, assets, foreign currencies or market-linked returns at specified future intervals. The Fund may enter into credit default, total return, cross-currency, interest rate, inflation and other forms of swap contracts to manage its exposure to credit, currency, interest rate, commodity and inflation risk. Swap contracts are also used to gain exposure to certain markets. In connection with these contracts, investments or cash may be identified as collateral in accordance with the terms of the respective swap contracts to provide assets of value and recourse in the event of default or bankruptcy/insolvency. Swaps are valued based on custom valuations furnished by an independent pricing service. Swaps for which prices are not available from an independent pricing service are valued in accordance with procedures established by the Company’s Board of Directors, and the change in value, if any, is recorded as an unrealized gain or loss on the Statement of Assets and Liabilities. Payments |
| 22 |
received or made at the beginning of the measurement period are reflected as such on the Statement of Assets and Liabilities and represent payments made or received upon entering into the swap contract to compensate for differences between the stated terms of the swap contract and prevailing market conditions (credit spreads, currency exchange rates, interest rates, and other relevant factors). These upfront payments are recorded as realized gains or losses on the Statement of Operations upon termination or maturity of the swap. A liquidation payment received or made at the termination of the swap and net periodic payments received or paid by the Fund are recorded as realized gains or losses on the Statement of Operations. Entering into these contracts involves, to varying degrees, elements of credit and market risk in excess of the amounts recognized on the Statement of Assets and Liabilities. Such risks involve the possibility that there will be no liquid market for these contracts, that the counterparty to the contracts may default on its obligation to perform or disagree as to the meaning of contractual terms in the contracts, and that there may be unfavorable changes in interest rates. The Fund’s maximum risk of loss from counterparty credit risk is the discounted net value of the cash flows to be received from the counterparty over the contract’s remaining life, to the extent that amount is positive. The risk is mitigated by having a master netting arrangement between the Fund and the counterparty, which allows for the netting of payments made or received (although such amounts are presented on a gross basis within the Statement of Assets and Liabilities, as applicable) as well as the posting of collateral to the Fund to cover the Fund’s exposure to the counterparty.
Credit Default Swap Contracts – The credit default swap market allows the Fund to manage its exposure to the market or certain sectors of the market, to reduce its risk exposure to defaults of corporate and sovereign issuers, or to create exposure to corporate or sovereign issuers to which it is not otherwise exposed. Certain credit default swaps involve the exchange of a fixed rate premium for protection against the loss in value of an underlying investment or index in the event of a credit event, such as payment default or bankruptcy.
Under a credit default swap contract, one party acts as guarantor by receiving the fixed periodic payment in exchange for the commitment to purchase the underlying investment at par if the defined credit event occurs. Upon the occurrence of a defined credit event, the difference between the value of the reference obligation and the swap’s notional amount is recorded as realized gain or loss on swap transactions in the Statement of Operations. A “buyer” of credit protection agrees to pay a counterparty to assume the credit risk of an issuer upon the occurrence of certain events. The “seller” of the protection receives periodic payments and agrees to assume the credit risk of an issuer upon the occurrence of certain events. Although specified events are contract specific, credit events are generally defined as bankruptcy, failure to pay, restructuring, obligation acceleration, obligation default, or repudiation/moratorium. A “seller’s” exposure is limited to the total notional amount of the credit default swap contract. These potential amounts would be partially offset by any recovery values of the respective referenced obligations or upfront payments received upon entering into the contract.
Implied credit spreads, represented in absolute terms, utilized in determining the market value of credit default swap contracts on corporate issues, sovereign government issues or U.S. municipal issues as of period-end are disclosed in the notes to the Schedule of Investments, as applicable, and serve as an indicator of the current status of the payment/performance risk and represent the likelihood or risk of default for the credit derivative. The implied credit spread of a particular referenced entity reflects the cost of buying/selling protection and may include upfront payments required to be made to enter into the contract. Wider credit spreads represent a deterioration of the referenced entity’s soundness and a greater likelihood or risk of default or other credit event occurring as defined under the terms of the contract. For credit default swap contracts on asset-backed securities and credit indices, the quoted market prices and resulting values serve as the indicator of the current status of the payment/performance risk. Increasing market values, in absolute terms when compared to the notional amount of the swap, represent a deterioration of the referenced equity’s credit soundness and a greater likelihood or risk of default or other credit event occurring as defined under the terms of the contract. The Fund, as shown on the Schedule of Investments, had outstanding credit default swaps as of June 30, 2013.
| 23 |
| Hartford Balanced HLS Fund |
| Notes to Financial Statements – (continued) |
| June 30, 2013 (Unaudited) |
| (000’s Omitted) |
| c) | Additional Derivative Instrument Information: |
Fair Value of Derivative Instruments on the Statement of Assets and Liabilities as of June 30, 2013:
| Risk Exposure Category | ||||||||||||||||||||||||||||
| Interest Rate Contracts | Foreign Exchange Contracts | Credit Contracts | Equity Contracts | Commodity Contracts | Other Contracts | Total | ||||||||||||||||||||||
| Liabilities: | ||||||||||||||||||||||||||||
| Unrealized depreciation on swap contracts | $ | — | $ | — | $ | 23 | $ | — | $ | — | $ | — | $ | 23 | ||||||||||||||
| Total | $ | — | $ | — | $ | 23 | $ | — | $ | — | $ | — | $ | 23 | ||||||||||||||
The volume of derivatives that is presented in the Schedule of Investments is consistent with the derivative activity during the six-month period ended June 30, 2013.
The Effect of Derivative Instruments on the Statement of Operations for the six-month period ended June 30, 2013:
| Risk Exposure Category | ||||||||||||||||||||||||||||
| Interest Rate Contracts | Foreign Exchange Contracts | Credit Contracts | Equity Contracts | Commodity Contracts | Other Contracts | Total | ||||||||||||||||||||||
| Realized Gain on Derivatives Recognized as a Result of Operations: | ||||||||||||||||||||||||||||
| Net realized gain on swap contracts | $ | — | $ | — | $ | 1 | $ | — | $ | — | $ | — | $ | 1 | ||||||||||||||
| Net realized gain on foreign currency contracts | — | 52 | — | — | — | — | 52 | |||||||||||||||||||||
| Total | $ | — | $ | 52 | $ | 1 | $ | — | $ | — | $ | — | $ | 53 | ||||||||||||||
| Net Change in Unrealized Appreciation (Depreciation) on Derivatives Recognized as a Result of Operations: | ||||||||||||||||||||||||||||
| Net change in unrealized depreciation of swap contracts | $ | — | $ | — | $ | (23 | ) | $ | — | $ | — | $ | — | $ | (23 | ) | ||||||||||||
| Total | $ | — | $ | — | $ | (23 | ) | $ | — | $ | — | $ | — | $ | (23 | ) | ||||||||||||
| d) | Balance Sheet Offsetting Information: |
Set forth below are tables which disclose both gross information and net information about instruments and transactions eligible for offset in the financial statements, and instruments and transactions that are subject to a master netting agreement, as well as amounts related to margin, reflected as financial collateral (including cash collateral), held at clearing brokers, counterparties, and the Fund’s custodian. The master netting agreements allow the clearing brokers to net any collateral held in or on behalf of the Fund, or liabilities or payment obligations of the clearing brokers to the Fund, against any liabilities or payment obligations of the Fund to the clearing brokers. The Fund is required to deposit financial collateral (including cash collateral) at the Fund’s custodian on behalf of clearing brokers and counterparties to continually meet the original and maintenance requirements established by the clearing brokers and counterparties. Such requirements are specific to the respective clearing broker or counterparty.
Offsetting of Financial Assets and Derivative Assets as of June 30, 2013:
| Description | Gross Amounts of Recognized Assets | Gross Amounts Offset in Statement of Assets and Liabilities | Net Amounts of Assets Presented in Statement of Assets and Liabilities | Financial Instruments with Allowable Netting | Collateral Received | Net Amount (not less than 0) | ||||||||||||||||||
| Repurchase Agreements | $ | 88,430 | $ | — | $ | 88,430 | $ | — | $ | (89,922 | ) | $ | — | |||||||||||
| Total subject to a master netting or similar arrangement | $ | 88,430 | $ | — | $ | 88,430 | $ | — | $ | (88,922 | ) | $ | — | |||||||||||
| 24 |
Offsetting of Financial Liabilities and Derivative Liabilities as of June 30, 2013:
| Description | Gross Amounts of Recognized Liabilities | Gross Amounts Offset in Statement of Assets and Liabilities | Net Amounts of Assets Presented in Statement of Assets and Liabilities | Financial Instruments with Allowable Netting | Collateral Pledged | Net Amount (not less than 0) | ||||||||||||||||||
| Swap contracts at market value | $ | 167 | $ | — | $ | 167 | $ | — | $ | — | $ | 167 | ||||||||||||
| Total subject to a master netting or similar arrangement | $ | 167 | $ | — | $ | 167 | $ | — | $ | — | $ | 167 | ||||||||||||
| 5. | Principal Risks: |
| a) | Credit and Counterparty Risks – Credit risk depends largely on the perceived financial health of bond issuers. In general, the credit rating is inversely related to the credit risk of the issuer. Higher rated bonds generally are deemed to have less credit risk, while lower or unrated bonds are deemed to have higher risk of default. The share price, yield and total return of a fund that holds securities with higher credit risk may be more volatile than those of a fund that holds bonds with lower credit risk. Similar to credit risk, the Fund may be exposed to counterparty risk, or the risk that an institution or other entity with which the Fund has unsettled or open transactions will default. |
| b) | Market Risks – The Fund’s investments expose the Fund to various risks including, but not limited to, interest rate, prepayment, extension, foreign currency, and equity risks. Interest rate risk is the risk that fixed income securities will decline in value because of changes in interest rates. As nominal interest rates rise, the values of certain fixed income securities held by the Fund are likely to decrease. A nominal interest rate can be described as the sum of a real interest rate and an expected inflation rate. Fixed income securities with longer durations tend to be more sensitive to changes in interest rates, usually making them more volatile than securities with shorter durations. Duration is useful primarily as a measure of the sensitivity of a fixed income security’s market price to interest rate (i.e., yield) movements. In addition, securities are subject to extension risk. Rising interest rates may cause prepayments to occur at a slower than expected rate, thereby effectively lengthening the maturity of the security and making the security more sensitive to interest rate changes. Prepayment and extension risk are major risks of mortgage backed securities and certain asset backed securities. For certain asset backed securities, the actual maturity may be less than the stated maturity shown in the Schedule of Investments, if applicable. As a result, the timing of income recognition relating to these securities may vary based upon the actual maturity. If the Fund invests directly in foreign currencies or in securities that trade in, and receive revenues in, foreign currencies, or in derivatives that provide exposure to foreign currencies, it will be subject to the risk that those currencies will decline in value relative to the base currency of the Fund, or, in the case of hedging positions, that the Fund’s base currency will decline in value relative to the currency being hedged. Currency rates in foreign countries may fluctuate significantly over short periods of time for a number of reasons, including changes in interest rates, intervention (or the failure to intervene) by U.S. or foreign governments, central banks or supranational entities, such as the International Monetary Fund, or by the imposition of currency controls or other political developments in the United States or abroad. As a result, the Fund’s investments in foreign currency denominated securities may reduce the returns of the Fund. The market values of equity securities, such as common stocks and preferred stocks, or equity related investments, such as futures and options, may decline due to general market conditions which are not specifically related to a particular company, such as real or perceived adverse economic conditions, changes in the general outlook for corporate earnings, changes in interest or currency rates or adverse investor sentiment generally. The market value of equity securities may also decline due to factors which affect a particular industry or industries, such as labor shortages or increased production costs and competitive conditions within an industry. Equity securities and equity related investments generally have greater market price volatility than fixed income securities. |
| 6. | Federal Income Taxes: |
| a) | Federal Income Taxes – For federal income tax purposes, the Fund intends to continue to qualify as a RIC under Subchapter M of the Internal Revenue Code (“IRC”) by distributing substantially all of its taxable net investment income and net realized capital gains to its shareholders and otherwise complying with the requirements of the IRC. The Fund |
| 25 |
| Hartford Balanced HLS Fund |
| Notes to Financial Statements – (continued) |
| June 30, 2013 (Unaudited) |
| (000’s Omitted) |
has distributed substantially all of its income and capital gains in prior years, if applicable, and intends to distribute substantially all of its income and capital gains prior to the next fiscal year-end. Accordingly, no provision for federal income or excise taxes has been made in the accompanying financial statements. Distributions from short-term capital gains are treated as ordinary income distributions for federal income tax purposes.
| b) | Net Investment Income (Loss), Net Realized Gains (Losses), and Distributions – Net investment income (loss) and net realized gains (losses) may differ for financial statement and tax purposes primarily because of losses deferred due to wash sale adjustments, foreign currency gains and losses, adjustments related to PFICs, REITs, RICs, certain derivatives and partnerships. The character of distributions made during the year from net investment income or net realized gains may differ from their ultimate characterization for federal income tax purposes. Also, due to the timing of dividend distributions, the fiscal year in which amounts are distributed may differ from the year that the income or realized gains (losses) were recorded by the Fund. |
| c) | Distributions and Components of Distributable Earnings – The tax character of distributions paid by the Fund for the periods indicated is as follows (as adjusted for dividends payable, if applicable): |
| For the Year Ended December 31, 2012 | For the Year Ended December 31, 2011 | |||||||
| Ordinary Income | $ | 93,156 | $ | 57,855 | ||||
As of December 31, 2012, the Fund’s components of distributable earnings (deficit) on a tax basis were as follows:
| Amount | ||||
| Undistributed Ordinary Income | $ | 664 | ||
| Accumulated Capital and Other Losses* | (925,527 | ) | ||
| Unrealized Appreciation† | 408,359 | |||
| Total Accumulated Deficit | $ | (516,504 | ) | |
| * | The Fund has capital loss carryforwards that are identified in the Capital Loss Carryforward note that follows. | |
| † | Differences between book-basis and tax-basis unrealized appreciation (depreciation) may be attributable to the losses deferred due to wash sale adjustments, foreign currency gains and losses, adjustments related to PFICs, REITs, RICs, certain derivatives and partnerships. |
| d) | Reclassification of Capital Accounts – The Fund may record reclassifications in its capital accounts. These reclassifications have no impact on the total net assets of the Fund. The reclassifications are a result of permanent differences between U.S. GAAP and tax accounting for such items as foreign currency, PFICs, expiration or utilization of capital loss carryforwards or net operating losses. Adjustments are made to reflect the impact these items have on current and future distributions to shareholders. Therefore, the source of the Fund’s distributions may be shown in the accompanying Statement of Changes in Net Assets as from undistributed net investment income, from accumulated net realized gains on investments or from capital depending on the type of book and tax differences that exist. For the year ended December 31, 2012, the Fund recorded reclassifications to increase (decrease) the accounts listed below: |
| Amount | ||||
| Undistributed Net Investment Income | $ | 344 | ||
| Accumulated Net Realized Gain (Loss) | (344 | ) | ||
| e) | Capital Loss Carryforward – On December 22, 2010, the Regulated Investment Company Modernization Act of 2010 (the “Act”) was enacted, which made changes to the capital loss carryforward rules. The changes are effective for taxable years beginning after the date of enactment. Under the Act, funds are permitted to carry forward capital losses for an |
| 26 |
unlimited period. However, any losses incurred during those future taxable years will be required to be utilized prior to the losses incurred in pre-enactment taxable years, which carry an expiration date. As a result of this ordering rule, pre-enactment capital loss carryforwards may be more likely to expire unused. Additionally, post-enactment capital loss carryforwards retain their character as either short-term or long-term capital losses rather than being considered all short-term as permitted under prior regulation.
At December 31, 2012 (tax-year-end), the Fund had capital loss carryforwards for U.S. federal income tax purposes as follows:
| Year of Expiration | Amount | |||
| 2017 | $ | 925,527 | ||
| Total | $ | 925,527 | ||
During the year ended December 31, 2012, the Fund utilized $155,644 of prior year capital loss carryforwards.
| f) | Accounting for Uncertainty in Income Taxes – The Fund has adopted financial reporting rules that require the Fund to analyze all open tax years, as defined by the statute of limitations, for all major jurisdictions. Generally, tax authorities can examine all tax returns filed for the last three years. The Fund does not have an examination in progress. |
The Fund has reviewed all open tax years and major jurisdictions and concluded that these financial reporting rules had no effect on the Fund’s financial position or results of operations. There is no tax liability resulting from unrecognized tax benefits relating to uncertain income tax positions taken or expected to be taken on the tax return for the fiscal year ended December 31, 2012. The Fund is also not aware of any tax positions for which it is reasonably possible that the total amounts of unrecognized tax benefits will significantly change in the next twelve months.
| 7. | Expenses: |
| a) | Investment Management Agreement – Hartford Funds Management Company, LLC (“HFMC”), an indirect wholly owned subsidiary of The Hartford Financial Services Group, Inc. (“The Hartford”), serves as investment manager to the Fund pursuant to an Investment Management Agreement with the Company. The investment manager has overall investment supervisory responsibility for the Fund. In addition, the investment manager provides administrative personnel, services, equipment, facilities and office space for proper operation of the Fund. The investment manager has contracted with Wellington Management Company, LLP (“Wellington Management”) under a sub-advisory agreement for the provision of day-to-day investment management services to the Fund in accordance with the Fund’s investment objective and policies. The Fund pays a fee to the investment manager, a portion of which may be used to compensate Wellington Management. |
The schedule below reflects the rates of compensation paid to HFMC for investment management services rendered as of June 30, 2013; the rates are accrued daily and paid monthly.
| Average Daily Net Assets | Annual Fee | |||
| On first $250 million | 0.6800% | |||
| On next $250 million | 0.6550% | |||
| On next $500 million | 0.6450% | |||
| On next $4 billion | 0.5950% | |||
| On next $5 billion | 0.5925% | |||
| Over $10 billion | 0.5900% | |||
| 27 |
| Hartford Balanced HLS Fund |
| Notes to Financial Statements – (continued) |
| June 30, 2013 (Unaudited) |
| (000’s Omitted) |
| b) | Accounting Services Agreement – Pursuant to the Fund Accounting Agreement between HFMC and the Company, on behalf of the Fund, HFMC provides accounting services to the Fund and receives monthly compensation based on the Fund’s average daily net assets at the rates set forth below. The Fund’s accounting services fees are accrued daily and paid monthly. |
| Average Daily Net Assets | Annual Fee | |||
| On first $5 billion | 0.016% | |||
| On next $5 billion | 0.014% | |||
| Over $10 billion | 0.012% | |||
| c) | Operating Expenses – Allocable expenses incurred by the Company are allocated to each Fund and allocated to classes within a Fund in proportion to the average daily net assets of the Fund and each class, except where allocation of certain expenses is more fairly made directly to the Fund or to specific classes within a Fund. |
| d) | Fees Paid Indirectly – The Company, on behalf of the Fund, has entered into agreements with State Street Global Markets, LLC and Russell Implementation Services, Inc. to partially recapture non-discounted trade commissions. Such rebates are used to pay a portion of the Fund’s expenses. In addition, the Fund’s custodian banks have agreed to reduce its fees when the Fund maintains cash on deposit in a non-interest-bearing custody account. For the six-month period ended June 30, 2013, these amounts, if any, are included in the Statement of Operations. |
The ratio of expenses to average net assets in the accompanying financial highlights excludes the reduction in expenses related to fees paid indirectly. The annualized expense ratio for the period listed below reflecting the reduction for fees paid indirectly is as follows:
| Annualized Six- Month Period Ended June 30, 2013 | ||||
| Class IA | 0.65 | % | ||
| Class IB | 0.90 | |||
| e) | Distribution Plan for Class IB shares – The Company, on behalf of the Fund, has adopted a Distribution Plan pursuant to Rule 12b-1 of the 1940 Act to compensate the distributor, Hartford Funds Distributors, LLC (“HFD”), (formerly known as Hartford Investment Financial Services, LLC), an indirect wholly owned subsidiary of The Hartford, from assets attributable to the Class IB shares for services rendered and expenses borne in connection with activities primarily intended to result in the sale of the Class IB shares, subject to the review and approval of the Company’s Board of Directors. |
The Distribution Plan provides that the Fund may pay annually up to 0.25% of the average daily net assets of the Fund attributable to its Class IB shares for activities primarily intended to result in the sale of Class IB shares. The Board has the authority to suspend or reduce these payments at any point in time. Under the terms of the Distribution Plan and the principal underwriting agreement, the Fund is authorized to make payments monthly to the distributor that may be used to pay or compensate entities providing distribution and shareholder servicing with respect to the Class IB shares for such entities’ fees or expenses incurred or paid in that regard. These fees are accrued daily and paid monthly.
| f) | Other Related Party Transactions – Certain officers of the Fund are directors and/or officers of the investment manager and/or The Hartford or its subsidiaries. For the six-month period ended June 30, 2013, a portion of the Fund’s Chief Compliance Officer’s salary was paid by all the investment companies in the Hartford fund complex. The portion allocated to the Fund was in the amount of $2. These fees are accrued daily and paid monthly. |
| 28 |
| 8. | Investment Transactions: |
For the six-month period ended June 30, 2013, the Fund's aggregate purchases and sales of investment securities (excluding short-term investments) were as follows:
| Amount | ||||
| Cost of Purchases Excluding U.S. Government Obligations | $ | 304,089 | ||
| Sales Proceeds Excluding U.S. Government Obligations | 624,144 | |||
| Cost of Purchases for U.S. Government Obligations | 270,638 | |||
| Sales Proceeds for U.S. Government Obligations | 218,863 | |||
| 9. | Line of Credit: |
The Fund is one of several Hartford funds that participate in a $500 million committed revolving line of credit facility. The facility is to be used for temporary or emergency purposes. Under the arrangement, the funds are required to own securities having a market value in excess of 300% of the total bank borrowings. The interest rate on borrowings varies depending on the nature of the loan. The facility also requires a fee to be paid based on the amount of the commitment. This commitment fee is allocated to all of the funds participating in the line of credit based on the average net assets of the funds. During the six-month period ended June 30, 2013, the Fund did not have any borrowings under this facility.
| 10. | Industry Classifications: |
Other than the industry classifications “Other Investment Pools and Funds” and “Exchange Traded Funds,” equity industry classifications used in this report are the Global Industry Classification Standard, which was developed by and is the exclusive property and service mark of MSCI, Inc. and Standard & Poor’s.
| 11. | Indemnifications: |
Under the Company’s organizational documents, the Company shall indemnify its officers and directors to the full extent required or permitted under Maryland General Corporation Law and the federal securities laws. In addition, the Company, on behalf of the Fund, may enter into contracts that contain a variety of indemnifications. The Company’s maximum exposure under these arrangements is unknown. However, as of the date of these financial statements, the Company has not had prior claims or losses pursuant to these contracts and expects the risk of loss to be remote.
| 12. | Pending Legal Proceedings: |
On February 25, 2011, Jennifer L. Kasilag, Louis Mellinger, Judith M. Menendez, Jacqueline M. Robinson, and Linda A. Russell filed a derivative lawsuit against Hartford Investment Financial Services, LLC (“HIFSCO”)(now known as Hartford Funds Distributors, LLC) on behalf of six Hartford retail mutual funds in the United States District Court for the District of New Jersey, alleging that HIFSCO received excessive advisory and distribution fees in violation of its statutory fiduciary duty under Section 36(b) of the 1940 Act when serving as investment manager and principal underwriter, respectively, to the Hartford retail mutual funds. HIFSCO moved to dismiss and, in September 2011, the motion was granted in part and denied in part, with leave to amend the complaint. In November 2011, plaintiffs filed an amended complaint on behalf of certain Hartford retail mutual funds, The Hartford Global Health Fund (now known as The Hartford Healthcare Fund), The Hartford Conservative Allocation Fund, The Hartford Growth Opportunities Fund, The Hartford Inflation Plus Fund, The Hartford Advisers Fund (now known as The Hartford Balanced Fund), and The Hartford Capital Appreciation Fund. Plaintiffs seek to rescind the investment management agreements and distribution plans between HIFSCO and these funds and to recover the total fees charged thereunder or, in the alternative, to recover any improper compensation HIFSCO received, in addition to lost earnings. HIFSCO filed a partial motion to dismiss the amended complaint and, in December 2012, the court dismissed without prejudice the claims regarding distribution fees and denied the motion with respect to the advisory fees claims. HIFSCO disputes the allegations and intends to defend vigorously.
This action concerns the activities of HIFSCO in its capacity as investment manager and principal underwriter to the Hartford retail mutual funds and does not concern HIFSCO’s activities in its capacity as principal underwriter to the HLS funds. For this reason, no accrual for litigation relating to this matter has been recorded in the financial statements of the Fund.
| 29 |
| Hartford Balanced HLS Fund |
| Financial Highlights |
| – Selected Per-Share Data – (A) |
| Class | Net Asset Value at Beginning of Period | Net Investment Income (Loss) | Net Realized and Unrealized Gain (Loss) on Investments | Total from Investment Operations | Dividends from Net Investment Income | Distributions from Realized Capital Gains | Distributions from Capital | Total Distributions | Net Asset Value at End of Period | |||||||||||||||||||||||||||
| For the Six-Month Period Ended June 30, 2013 (Unaudited) | ||||||||||||||||||||||||||||||||||||
| IA | $ | 21.03 | $ | 0.21 | $ | 1.83 | $ | 2.04 | $ | – | $ | – | $ | – | $ | – | $ | 23.07 | ||||||||||||||||||
| IB | 21.30 | 0.19 | 1.85 | 2.04 | – | – | – | – | 23.34 | |||||||||||||||||||||||||||
| For the Year Ended December 31, 2012 | ||||||||||||||||||||||||||||||||||||
| IA | 19.34 | 0.47 | 1.85 | 2.32 | (0.63 | ) | – | – | (0.63 | ) | 21.03 | |||||||||||||||||||||||||
| IB | 19.58 | 0.43 | 1.86 | 2.29 | (0.57 | ) | – | – | (0.57 | ) | 21.30 | |||||||||||||||||||||||||
| For the Year Ended December 31, 2011 | ||||||||||||||||||||||||||||||||||||
| IA | 19.32 | 0.41 | (0.06 | ) | 0.35 | (0.33 | ) | – | – | (0.33 | ) | 19.34 | ||||||||||||||||||||||||
| IB | 19.55 | 0.36 | (0.05 | ) | 0.31 | (0.28 | ) | – | – | (0.28 | ) | 19.58 | ||||||||||||||||||||||||
| For the Year Ended December 31, 2010 (G) | ||||||||||||||||||||||||||||||||||||
| IA | 17.47 | 0.30 | 1.82 | 2.12 | (0.27 | ) | – | – | (0.27 | ) | 19.32 | |||||||||||||||||||||||||
| IB | 17.68 | 0.26 | 1.83 | 2.09 | (0.22 | ) | – | – | (0.22 | ) | 19.55 | |||||||||||||||||||||||||
| For the Year Ended December 31, 2009 | ||||||||||||||||||||||||||||||||||||
| IA | 13.69 | 0.36 | 3.78 | 4.14 | (0.36 | ) | – | – | (0.36 | ) | 17.47 | |||||||||||||||||||||||||
| IB | 13.85 | 0.32 | 3.83 | 4.15 | (0.32 | ) | – | – | (0.32 | ) | 17.68 | |||||||||||||||||||||||||
| For the Year Ended December 31, 2008 | ||||||||||||||||||||||||||||||||||||
| IA | 20.97 | 0.50 | (7.09 | ) | (6.59 | ) | (0.58 | ) | (0.11 | ) | – | (0.69 | ) | 13.69 | ||||||||||||||||||||||
| IB | 21.18 | 0.47 | (7.17 | ) | (6.70 | ) | (0.52 | ) | (0.11 | ) | – | (0.63 | ) | 13.85 | ||||||||||||||||||||||
| (A) | Information presented relates to a share outstanding throughout the indicated period. |
| (B) | The figures do not include sales charges or other fees which may be applied at the variable life insurance, variable annuity or qualified retirement plan product level. Any such additional sales charges or other fees would lower the Fund's performance. |
| (C) | Ratios do not reflect reductions for fees paid indirectly. Please see Fees Paid Indirectly in the Notes to Financial Statements. |
| (D) | Portfolio turnover rate is calculated on the basis of the Fund as a whole without distinguishing between the classes of shares issued. |
| (E) | Not annualized. |
| (F) | Annualized. |
| (G) | Per share amounts have been calculated using the average shares method. |
| (H) | During the year ended December 31, 2010, the Fund incurred $204.5 million in purchases associated with the transition of assets from Hartford Global Advisers HLS Fund, which merged into the Fund on March 19, 2010. These purchases were excluded from the portfolio turnover calculation. |
| 30 |
| - Ratios and Supplemental Data - |
| Total Return(B) | Net Assets at End of Period | Ratio of Expenses to Average Net Assets Before Waivers(C) | Ratio of Expenses to Average Net Assets After Waivers(C) | Ratio of Net Investment Income (Loss) to Average Net Assets | Portfolio Turnover Rate(D) | |||||||||||||||||
| 9.71 | %(E) | $ | 2,781,460 | 0.65 | %(F) | 0.65 | %(F) | 1.82 | %(F) | 13 | % | |||||||||||
| 9.57 | (E) | 402,559 | 0.90 | (F) | 0.90 | (F) | 1.57 | (F) | – | |||||||||||||
| 12.02 | 2,754,114 | 0.65 | 0.65 | 1.98 | 28 | |||||||||||||||||
| 11.74 | 406,156 | 0.90 | 0.90 | 1.73 | – | |||||||||||||||||
| 1.86 | 2,959,019 | 0.64 | 0.64 | 1.84 | 34 | |||||||||||||||||
| 1.61 | 455,939 | 0.89 | 0.89 | 1.59 | – | |||||||||||||||||
| 12.14 | 3,539,983 | 0.65 | 0.65 | 1.68 | 65 | (H) | ||||||||||||||||
| 11.86 | 556,169 | 0.90 | 0.90 | 1.43 | – | |||||||||||||||||
| 30.29 | 3,607,929 | 0.65 | 0.65 | 2.15 | 73 | |||||||||||||||||
| 29.96 | 578,338 | 0.90 | 0.90 | 1.90 | – | |||||||||||||||||
| (31.64 | ) | 3,404,626 | 0.63 | 0.63 | 2.43 | 76 | ||||||||||||||||
| (31.81 | ) | 548,899 | 0.88 | 0.88 | 2.18 | – | ||||||||||||||||
| 31 |
| Hartford Balanced HLS Fund |
| Directors and Officers (Unaudited) |
The Board of Directors of the Company appoints officers who are responsible for the day-to-day operations of the Fund and who execute policies formulated by the Directors. Each director serves until his or her death, resignation, or retirement or until the next annual meeting of shareholders is held or until his or her successor is elected and qualifies.
Directors and officers who are employed by or who have a financial interest in The Hartford are considered “interested” persons of the Fund pursuant to the 1940 Act. Each officer and two of the Company’s directors, as noted in the chart below, are “interested” persons of the Fund. Each director serves as a director for The Hartford Mutual Funds, Inc., The Hartford Mutual Funds II, Inc., Hartford Series Fund, Inc., Hartford HLS Series Fund II, Inc., and as a trustee for The Hartford Alternative Strategies Fund, which, as of June 30, 2013, collectively consist of 90 funds. Correspondence may be sent to directors and officers c/o Hartford Mutual Funds, P.O. Box 2999, Hartford, Connecticut 06104-2999, except that correspondence to Mr. Annoni, Mr. Dressen, Ms. Fagely and Ms. Quade may be sent to 500 Bielenberg Drive, Woodbury, Minnesota 55125 and correspondence to Mr. Davey and Mr. Melcher may be sent to 5 Radnor Corporate Center, Suite 300, 100 Matsonford Road, Radnor, Pennsylvania 19087.
The table below sets forth, for each director and officer, his or her name, year of birth, current position with the Company and date first elected or appointed to Hartford Series Fund, Inc. (“HSF”), and Hartford HLS Series Fund II, Inc. (“HSF2”), principal occupation, and, for directors, other directorships held. The Fund’s statement of additional information contains further information on the directors and is available free of charge by calling 1-800-862-6668 or writing to Hartford HLS Funds, c/o Hartford Life Insurance Company, Hartford Life and Annuity Insurance Company, P.O. Box 14293, Lexington, KY 40512-4293.
Information on the aggregate remuneration paid to the directors of the Company can be found in the Statement of Operations herein. The Fund pays to The Hartford a portion of the Chief Compliance Officer’s compensation, but does not pay salaries or compensation to any of their other officers or directors who are employed by The Hartford.
Non-Interested Directors
Lynn S. Birdsong (1946) Director since 2003, Co-Chairman of the Investment Committee
Mr. Birdsong is a private investor. Mr. Birdsong currently serves as a Director of the Sovereign High Yield Investment Company (April 2010 to current). Mr. Birdsong currently serves as an Independent Director of Nomura Partners Funds, Inc. (formerly, The Japan Fund) (March 2003 to current). From 1979 to 2002, Mr. Birdsong was a managing director of Zurich Scudder Investments, an investment management firm. During his employment with Scudder, Mr. Birdsong was an Interested Director of The Japan Fund. Since 1981, Mr. Birdsong has been a partner in Birdsong Company, an advertising specialty firm.
Robert M. Gavin, Jr. (1940) Director since 2002 (HSF) and 1986 (HSF2), Chairman of the Board since 2004
Dr. Gavin is an educational consultant. Prior to September 1, 2001, he was President of Cranbrook Education Community and prior to July 1996, he was President of Macalester College, St. Paul, Minnesota.
Duane E. Hill (1945) Director since 2001 (HSF) and 2002 (HSF2), Chairman of the Nominating Committee
Mr. Hill is Partner of TSG Ventures L.P., a private equity investment company. Mr. Hill is a former partner of TSG Capital Group, a private equity investment firm that served as sponsor and lead investor in leveraged buyouts of middle market companies.
Sandra S. Jaffee (1941) Director since 2005
Ms. Jaffee is the founder and Chief Executive Officer of a private company, Homeworks Concierge, LLC, which provides residential property management services in Westchester County, New York (January 2012 to present). Ms. Jaffee served as Chairman (2008 to 2009) and Chief Executive Officer of Fortent (formerly Searchspace Group), a leading provider of compliance/regulatory technology to financial institutions from August 2005 to August 2009. Ms. Jaffee currently serves as a member of the Board of Directors of Broadridge Financial Solutions as well as a Trustee of Muhlenberg College.
William P. Johnston (1944) Director since 2005, Chairman of the Compliance Committee
In February 2008, Mr. Johnston was elected to the Board of Directors of HCR-ManorCare, Inc. In August 2007, Mr. Johnston was elected to the Board of Directors of LifeCare Holdings, Inc. In July 2006, Mr. Johnston was elected to the Board of Directors of MultiPlan, Inc. and served as a director (July 2006 to August 2010). In June 2006, Mr. Johnston was appointed as Senior Advisor to The Carlyle Group, a global private equity and alternative asset investment firm. In May 2006, Mr. Johnston was elected to the Supervisory Board of Fresenius Medical Care AG & Co. KGaA, after its acquisition of Renal Care Group, Inc. in March 2006.
| 32 |
Phillip O. Peterson (1944) Director since 2002 (HSF) and 2000 (HSF2), Chairman of the Audit Committee
Mr. Peterson is a mutual fund industry consultant. He was a partner of KPMG LLP (an accounting firm) until July 1999. Mr. Peterson joined William Blair Funds in February 2007 as a member of the Board of Trustees. Mr. Peterson also joined the Board of Trustees of Symetra Variable Mutual Funds Trust as a trustee in February 2012.
Lemma W. Senbet (1946) Director since 2005
Dr. Senbet is the William E. Mayer Chair Professor of Finance and Director, Center for Financial Policy, at the University of Maryland, Robert H. Smith School of Business. He was chair of the Finance Department from 1998 to 2006. Previously he was a chaired professor of finance at the University of Wisconsin-Madison. Also, he was director of the Fortis Funds from March 2000 to July 2002. Dr. Senbet served the finance profession in various capacities, including as director of the American Finance Association and President of the Western Finance Association. In 2006, Dr. Senbet was inducted Fellow of Financial Management Association International for his career-long distinguished scholarship and professional service.
Interested Directors and Officers
James E. Davey (1964) Director since 2012, President and Chief Executive Officer since 2010
Mr. Davey serves as Executive Vice President of Hartford Life Insurance Company (“HLIC”) and The Hartford Financial Services Group, Inc. Additionally, Mr. Davey serves as Chairman of the Board and Manager of Hartford Funds Distributors, LLC (“HFD”) and Hartford Administrative Services Company (“HASCO”). Mr. Davey also serves as Manager, President and Chairman of the Board for Hartford Funds Management Company, LLC (“HFMC”). Mr. Davey joined The Hartford in 2002.
Lowndes A. Smith (1939) Director since 1996 (HSF) and 2002 (HSF2), Co-Chairman of the Investment Committee
Mr. Smith served as Vice Chairman of The Hartford from February 1997 to January 2002, as President and Chief Executive Officer of Hartford Life, Inc. from February 1997 to January 2002, and as President and Chief Operating Officer of The Hartford Life Insurance Companies from January 1989 to January 2002. Mr. Smith serves as a Director of White Mountains Insurance Group, Ltd., One Beacon Insurance and Symetra Financial and as Managing Director of Whittington Gray Associates.
Other Officers
Mark A. Annoni (1964) Vice President, Controller and Treasurer since 2012
Mr. Annoni serves as the Assistant Vice President of HLIC (February 2004 to present). Mr. Annoni joined The Hartford in April 2001 as part of The Hartford’s acquisition of Fortis Financial Group (“Fortis”). Prior to joining The Hartford, Mr. Annoni served as Manager of Mutual Fund Accounting at Fortis (July 1997 to April 2001).
Michael R. Dressen (1963) AML Compliance Officer since 2011
Mr. Dressen currently serves as Assistant Vice President of HLIC. He also serves as Chief Compliance Officer and AML Compliance Officer of HASCO and as AML Officer of HFD. Mr. Dressen joined The Hartford in 2005 from State Farm Insurance Companies where he held various positions related to mutual funds, variable products, and property casualty insurance.
Tamara L. Fagely (1958) Vice President since 2002 (HSF) and 1993 (HSF2)
Currently, Ms. Fagely is President and a Director of HASCO, Chief Administrative Officer and Manager of HFMC and a Vice President of HLIC. Ms. Fagely served as a Vice President of HASCO (1998-2013) and Chief Financial Officer of HASCO (2006-2013). She served as Assistant Vice President of HLIC from December 2001 through March 2005. In addition, Ms. Fagely is Manager and Chief Operating Officer of HFD.
Edward P. Macdonald (1967) Vice President, Secretary and Chief Legal Officer since 2005
Mr. Macdonald serves as Vice President of HLIC and Vice President, Chief Legal Officer and Secretary of HFD and HASCO. Mr. Macdonald also serves as Manager, Vice President, Chief Legal Officer and Secretary of HFMC. Mr. Macdonald joined The Hartford in 2005.
Joseph G. Melcher (1973) Vice President and Chief Compliance Officer since 2013(1)
Mr. Melcher currently serves as Vice President of HFMC and HFD. Mr. Melcher joined The Hartford in 2012 from Touchstone Investments, a member of the Western & Southern Financial Group, where he held the position of Vice President and Chief Compliance Officer from 2010 through 2012 and Assistant Vice President, Compliance from 2005 to 2010.
| (1) | Mr. Melcher was named Vice President and Chief Compliance Officer of HSF and HSF2 on February 6, 2013. Prior to February 6, 2013, Colleen Pernerewski served as Chief Compliance Officer of HSF and HSF2. |
| 33 |
| Hartford Balanced HLS Fund |
| Directors and Officers (Unaudited) – (continued) |
Vernon J. Meyer (1964) Vice President since 2006
Mr. Meyer serves as Senior Vice President of HLIC. He also serves as Senior Vice President of HFMC and HFD. Mr. Meyer joined The Hartford in 2004.
Laura S. Quade (1969) Vice President since 2012
Ms. Quade currently serves as Vice President of HASCO and is a Director of Mutual Fund Service Operations. She also serves as Director, Enterprise Operations of HFD and HLIC. Ms. Quade joined The Hartford in 2001 as part of The Hartford’s acquisition of Fortis.
Elizabeth L. Schroeder (1966) Vice President since 2010(2)
Ms. Schroeder currently serves as Assistant Vice President of HLIC. Ms. Schroeder joined HLIC in 1991. She is also an Assistant Vice President of HFMC and HASCO.
(2) Ms. Schroeder served as Vice President of HSF and HSF2 until August 7, 2013.
Martin Swanson (1962) Vice President since 2010
Mr. Swanson is a Vice President of HLIC. Mr. Swanson also serves as Chief Marketing Officer for HFD. Prior to joining HLIC in 1998, Mr. Swanson was a Vice President at PaineWebber, Inc.
HOW TO OBTAIN A COPY OF THE FUND’S PROXY VOTING POLICIES AND VOTING RECORDS (UNAUDITED)
A description of the policies and procedures that the Fund uses to determine how to vote proxies relating to portfolio securities and information about how the Fund voted proxies relating to portfolio securities during the most recent twelve-month period ended June 30 are available (1) without charge, upon request, by calling 800-862-6668 and (2) on the SEC’s website at http://www.sec.gov.
QUARTERLY PORTFOLIO HOLDINGS INFORMATION (UNAUDITED)
The Fund files a complete schedule of portfolio holdings with the SEC for the first and third quarters of each fiscal year on Form N-Q. The Fund’s Forms are available (1) without charge, upon request, by calling 800-862-6668 and (2) on the SEC’s website at http://www.sec.gov. The Form N-Q may be reviewed and copied at the SEC’s Public Reference Room in Washington, DC. Information on the operation of the Public Reference Room may be obtained by calling 1-800-SEC-0330.
| 34 |
| Hartford Balanced HLS Fund |
| Expense Example (Unaudited) |
Your Fund's Expenses
As a shareholder of the Fund, you incur two types of costs: (1) transaction costs and (2) ongoing costs including investment management fees, distribution fees, if any, and other fund expenses. This example is intended to help you understand your ongoing costs (in dollars) of investing in the Fund and to compare these costs with the ongoing costs of investing in other mutual funds. The example is based on an investment of $1,000 invested at the beginning of the period and held for the period of December 31, 2012 through June 30, 2013.
Actual Expenses
The first set of columns of the table below provides information about actual account values and actual expenses. You may use the information in this column, together with the amount you invested, to estimate the expenses that you paid over the period. Simply divide your account value by $1,000 (for example, an $8,600 account value divided by $1,000 = 8.6), then multiply the result by the number in the line under the heading entitled “Expenses Paid During Period” to estimate the expenses you paid on your account during this period.
Hypothetical Example for Comparison Purposes
The second set of columns of the table below provides information about hypothetical account values and hypothetical expenses based on the Fund’s actual expense ratio and an assumed rate of return of 5% per year before expenses, which is not the Fund’s actual return. The hypothetical account values and expenses may not be used to estimate the actual ending account balance or expenses you paid for the period. You may use this information to compare the ongoing costs of investing in the Fund and other funds. To do so, compare this 5% hypothetical example with the 5% hypothetical examples that appear in the shareholder reports of the other funds.
Please note that the expenses shown in the table are meant to highlight your ongoing costs only and do not reflect any transactional costs, such as sales charges (loads) and CDSC. Therefore, the second set of columns of the table is useful in comparing ongoing costs only, and will not help you determine the relative total costs of owning different funds. In addition, if these transactional costs were included, your costs would be higher. Expenses are equal to the Fund's annualized expense ratios multiplied by average account value over the period, multiplied by 181/365 (to reflect the one-half year period).
| Actual return | Hypothetical (5% return before expenses) | ||||||||||||||||||||||||||||||||
| Beginning Account Value December 31, 2012 | Ending Account Value | Expenses paid during the period | Beginning Account Value December 31, 2012 | Ending Account Value June 30, 2013 | Expenses paid during the period | Annualized expense ratio | Days in the current 1/2 year | Days in the full year | |||||||||||||||||||||||||
| Class IA | $ | 1,000.00 | $ | 1,097.10 | $ | 3.38 | $ | 1,000.00 | $ | 1,021.57 | $ | 3.26 | 0.65 | % | 181 | 365 | |||||||||||||||||
| Class IB | $ | 1,000.00 | $ | 1,095.70 | $ | 4.68 | $ | 1,000.00 | $ | 1,020.33 | $ | 4.51 | 0.90 | % | 181 | 365 | |||||||||||||||||
| 35 |
| Hartford Balanced HLS Fund |
| Principal Risks (Unaudited) |
The principal risks of investing in the Fund are described below.
Market, Selection, and Strategy Risk: The Fund’s share price may fluctuate due to market risk and/or security selections that may underperform the market or relevant benchmarks. If the sub-adviser’s investment strategy does not perform as expected, the Fund could underperform its peers or lose money. There is no guarantee the Fund will achieve its stated objective.
Asset Allocation Strategy Risk: The portfolio managers’ asset allocation strategy may not always work as intended, and asset allocation does not guarantee better performance or reduce the risk of investment loss.
Fixed Income Risk: The Fund is subject to interest rate risk (the risk that the value of an investment decreases when interest rates rise) and credit risk (the risk that the issuing company of a security is unable to pay interest and principal when due) and call risk (the risk that an investment may be redeemed early).
Mortgage-Backed Securities Risk: Mortgage-backed securities are subject to interest rate risk, credit risk, prepayment risk, extension risk, and the risk that an investment’s value may be reduced or become worthless if it receives interest or income payments only after other investments in the same pool.
| 36 |
HARTFORD HLS FUNDS
c/o The Hartford Wealth Management - Global Annuities
P.O. Box 14293
Lexington, KY 40512-4293
HARTFORDFUNDS
hartfordfunds.com
Hartford Series Fund, Inc. is underwritten and distributed by Hartford Funds Distributors, LLC.
Hartford Series Fund, Inc. inception dates range from 1977 to date. Hartford Series Fund, Inc. is not a subsidiary of The Hartford Financial Services Group, Inc. ("The Hartford") but is underwritten, distributed by and advised by subsidiaries of The Hartford. Investments in Hartford Series Fund, Inc. are not guaranteed by The Hartford or any other entity.
You should carefully consider investment objectives, risks, and charges and expenses of Hartford HLS Funds before investing. This and other information can be found in the Fund’s prospectus or summary prospectus, which can be obtained by calling 800-862-6668. Please read them carefully before you invest or send money.
HLSSAR-B13 8-13 114608 Printed in U.S.A ©2013 The Hartford, Hartford, CT 06115
HARTFORDFUNDS
| HARTFORD CAPITAL
APPRECIATION HLS FUND
2013 Semi Annual Report
|
A MESSAGE FROM THE PRESIDENT
Dear Fellow Shareholders:
I want to take this opportunity to say thank you for investing in the Hartford HLS Funds.
Market Review
During the first half of the year, stocks rose steadily. U.S. equities (as represented by the S&P 500 Index1) posted a strong gain of 10.61% during the first quarter, on their way to an all-time high. During the second quarter, investors persevered through volatility surrounding rumors of the rollback of the U.S. Federal Reserve’s quantitative easing (QE) program later this year, and the S&P 500 Index rose 2.91%. That brought the market’s rise to 13.82% for the first half of 2013. The rumors about QE’s end sent bond yields and mortgage rates upward, but that wasn’t enough to dissuade investors from pushing equities into positive territory.
Because of QE, some have expressed concerns regarding the recent market rally. But a more careful examination of economic data reveals a strong foundation. Consumer balance sheets have improved since the financial crisis, with consumer debt as a percentage of income falling steadily. Housing continued its dogged recovery, fueled by population growth and pent-up demand. In fact, it’s substantive economic improvements that have moved Federal Reserve Chairman Ben Bernanke to consider removing the “training wheels” of QE, which we think should be viewed as a vote of confidence in the U.S. economy going forward.
As the U.S. outlook continues to improve, concerns do remain in the global economy. Emerging markets have lagged due to social unrest and rising inflation. Slowing growth in China is clouding global growth forecasts, but it’s important to remember that China still boasts 7.5% annual GDP growth.
It’s important to stay abreast of domestic and international economic developments while balancing your individual investment goals. Meeting with your financial advisor on a regular basis to examine your current investment strategy can help you determine whether you are on the right track:
| • | Is your portfolio fully diversified with an appropriate mix of stocks and bonds? |
| • | Is your fixed-income portfolio positioned to take advantage of opportunities across the credit spectrum and fulfill your income needs? |
| • | Is your portfolio still in line with your risk tolerance and investment time horizon? |
Your financial professional can help you choose options within our fund family to navigate today’s markets with confidence.
Thank you again for investing with the Hartford HLS Funds.
James Davey
President
Hartford HLS Funds
1 The S&P 500 Index is a market capitalization-weighted price index composed of 500 widely held common stocks.
Hartford Capital Appreciation HLS Fund
Table of Contents
This report is prepared for the general information of contract owners and qualified retirement plan participants. It is not an offer of contracts or of qualified retirement plans. It should not be used in connection with any offer, except in conjunction with the appropriate product prospectus which contains all pertinent information including the applicable sales, administrative and other charges.
The views expressed in the Fund’s Manager Discussion under ‘‘Why did the Fund perform this way?’’ and ‘‘What is the outlook?’’ are views of the Fund’s sub-adviser and portfolio management team through the end of the period and are subject to change based on market and other conditions. The Fund’s Manager Discussion is for informational purposes only and does not represent an offer, recommendation or solicitation to buy, hold or sell any security. The specific securities identified and described, if any, do not represent all of the securities purchased or sold and you should not assume that investments in the securities identified and discussed will be profitable.
| Hartford Capital Appreciation HLS Fund inception 04/02/1984 |
| (sub-advised by Wellington Management Company, LLP) |
| Investment objective – Seeks growth of capital. |
Performance Overview 6/30/03 - 6/30/13
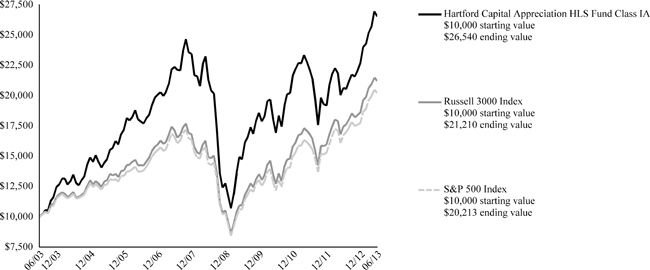
The chart above represents the hypothetical growth of a $10,000 investment in Class IA. Growth results in classes other than Class IA will vary from what is seen above due to differences in the expenses charged to those share classes.
Average Annual Total Returns (as of 6/30/13)
| 6 Month† | 1 Year | 5 Years | 10 Years | |||||||||||||
| Capital Appreciation IA | 16.91% | 28.57% | 4.46% | 10.25% | ||||||||||||
| Capital Appreciation IB | 16.75% | 28.24% | 4.20% | 9.98% | ||||||||||||
| Russell 3000 Index | 14.06% | 21.46% | 7.25% | 7.81% | ||||||||||||
| S&P 500 Index | 13.82% | 20.58% | 7.00% | 7.29% | ||||||||||||
| † | Not Annualized |
PERFORMANCE DATA QUOTED REPRESENTS PAST PERFORMANCE AND DOES NOT GUARANTEE FUTURE RESULTS. The investment return and principal value of the investment will fluctuate so that investors’ shares, when redeemed, may be worth more or less than their original cost. Current performance may be lower or higher than the performance data quoted. To obtain performance data current to the most recent month-end, please visit our website www.hartfordfunds.com.
Total returns presented above were calculated using the Fund's net asset value available to shareholders for sale or redemption of Fund shares on June 30, 2013, which may exclude investment transactions as of this date. All share class returns assume the reinvestment of all distributions at net asset value and the deduction of all fund expenses.
Russell 3000 Index is an unmanaged index that measures the performance of the 3,000 largest U.S. companies based on total market capitalization.
S&P 500 Index is a market capitalization-weighted price index composed of 500 widely held common stocks.
You cannot invest directly in an index.
As of the Fund’s current prospectus dated May 1, 2013, the total annual operating expense ratios for Class IA and Class IB shares were 0.67% and 0.92%, respectively. Actual expenses may be higher. Please see the accompanying Financial Highlights for expense ratios for the six-month period ended June 30, 2013.
All investments are subject to risk including the possible loss of principal. For a discussion of the Fund’s risks, please see the Principal Risks section. For more detailed information on the risks associated with an investment in the Fund, please see the prospectus.
The chart and table do not reflect the deductions of taxes, sales charges or other fees which may be applied at the variable life insurance, variable annuity or qualified retirement plan product level. Any such additional sales charges or other fees or expenses would lower the contract’s or plan’s performance.
| 2 |
| Hartford Capital Appreciation HLS Fund |
| Manager Discussion |
| June 30, 2013 (Unaudited) |
| Portfolio Managers | ||
| Saul J. Pannell, CFA | Kent M. Stahl, CFA | Peter I. Higgins, CFA |
| Senior Vice President and Equity Portfolio Manager | Senior Vice President and Director, Investments and Risk Managment | Senior Vice President and Equity Portfolio Manager |
| Paul E. Marrkand, CFA | Nicolas M. Choumenkovitch | Donald J. Kilbride |
| Senior Vice President and Equity Portfolio Manager | Senior Vice President and Equity Portfolio Manager | Senior Vice President and Equity Portfolio Manager |
| Stephen Mortimer | David W. Palmer, CFA | Francis J. Boggan, CFA |
| Senior Vice President and Equity Portfolio Manager | Senior Vice President and Equity Portfolio Manager | Senior Vice President and Equity Portfolio Manager |
| Gregg R. Thomas, CFA* | ||
| Vice President and Director, Risk Management | ||
| *Appointed as a Portfolio Manager for the Fund as of 2013. | ||
How did the Fund perform?
The Class IA shares of the Hartford Capital Appreciation HLS Fund returned 16.91% for the six-month period ended June 30, 2013, outperforming its benchmark, the Russell 3000 Index, which returned 14.06% for the same period. The Fund also outperformed the 10.99% average return of the Variable Products-Underlying Funds Lipper Multi-Cap Core Funds peer group, a group of funds with investment strategies similar to those of the Fund.
Why did the Fund perform this way?
U.S. equities (+14%), as measured by the Russell 3000 Index, gained during the six-month period. The rally began on the first trading day of the year after a last-minute compromise by the U.S. Congress averted the fiscal cliff. Optimism surrounding the fiscal reprieve was furthered during the first half of the period by better-than-expected corporate earnings, a robust housing market, and a gradually improving employment picture. In the second half of the period, a market rally throughout April and the first part of May paused following comments by Federal Reserve (Fed) Chairman Ben Bernanke that suggested the Fed might begin to slow quantitative easing (QE) sooner than investors anticipated. The Federal Open Market Committee’s June statement emphasized that the tapering schedule would depend on improving economic indicators. A strong housing market, positive consumer confidence trends, and a steadily healing labor market lent support to the thesis that underlying fundamentals were solid. Following an initially dramatic negative response to the Fed’s announcement and an increase in lending rates in China, U.S. markets moved higher into the end of the period.
Within the Russell 3000 Index, Consumer Discretionary (+20%), Health Care (+20%) and Financials (+18%) posted the strongest gains. Materials (+2%), Information Technology (+7%) and Energy (+10%) lagged on a relative basis.
The Fund outperformed its benchmark due primarily to strong stock selection in the Information Technology, Financials, and Industrials sectors. Stock selection was weaker within the Materials and Energy sectors. Sector allocation, a residual of our bottom-up security selection process, also contributed to relative performance primarily as a result of an overweight (i.e. the Fund’s sector position was greater than the benchmark position) to Consumer Discretionary.
The top contributors to relative performance included Apple (Information Technology), Best Buy (Consumer Discretionary) and MBIA Insurance (Financials). Apple is a U.S.-based designer, manufacturer, and retailer of a range of personal electronic products. Shares of Apple declined during the period as a result of weaker guidance and slowing growth. Our underweight position in the security contributed to benchmark-relative performance. Shares of U.S.-based electronics retailer Best Buy climbed during the period in part due to an announcement that it would divest its interest in a European joint venture (JV) to its partner in the JV, Carphone Warehouse. U.S.-based insurance company MBIA Insurance outperformed after reporting positive earnings results and announcing the settlement of the legal action previously brought against the company by Aurelius Capital Master. Hertz Global (Industrials) and Gilead Sciences (Health Care) were also top contributors to absolute performance (i.e. total return).
The largest detractors from relative returns were Barrick Gold (Materials), JC Penney (Consumer Discretionary), and AuRico Gold (Materials). Barrick Gold, a Canadian based gold exploration and mining company, saw shares decline as
| 3 |
| Hartford Capital Appreciation HLS Fund |
| Manager Discussion – (continued) |
| June 30, 2013 (Unaudited) |
the spot price of gold continued to deteriorate and miners continued to reduce earnings forecasts. Shares of department store operator JC Penney fell as a result of soft earnings attributed to both slow same store sales and a decline in gross margins. Shares of Canadian-based gold producer AuRico Gold underperformed during the period as gold equities experienced broad declines. Apple (Information Technology) was also a large detractor from absolute performance.
What is the outlook?
Looking forward to the third quarter, we believe that we are in a limbo period in which investors are unsure of both the timing and magnitude of future interest rate increases. Our view is that although uncertainty among investors is causing some consternation in the markets, the environment will normalize as rates moderate over the next several months. We don’t anticipate a material increase in rates from current levels during the year. We believe that the current environment is conducive to stock picking. While we felt valuations were overpriced without being backed up by fundamentals last year at this time, we now believe that fundamentals are improving. We are finding compelling opportunities to invest in companies that we believe have strong fundamentals and we believe are trading at reasonable valuations. Given our unconstrained approach, we continue to look for compelling opportunities for capital appreciation across the market cap spectrum, and remain focused on company specifics, which we believe should continue to drive the portfolio’s overall positioning.
As a result of our bottom-up investment process, at the end of the period the Fund was most overweight the Consumer Discretionary, Information Technology, and Industrials sectors relative to the benchmark. The Fund was most underweight the Financials, Consumer Staples and Utilities sectors at the end of the period relative to the benchmark.
Diversification by Industry
as of June 30, 2013
| Industry (Sector) | Percentage of Net Assets | |||
| Equity Securities | ||||
| Automobiles and Components (Consumer Discretionary) | 4.3 | % | ||
| Banks (Financials) | 2.9 | |||
| Capital Goods (Industrials) | 6.8 | |||
| Commercial and Professional Services (Industrials) | 0.8 | |||
| Consumer Durables and Apparel (Consumer Discretionary) | 1.3 | |||
| Consumer Services (Consumer Discretionary) | 2.2 | |||
| Diversified Financials (Financials) | 6.6 | |||
| Energy (Energy) | 8.5 | |||
| Food and Staples Retailing (Consumer Staples) | 2.5 | |||
| Food, Beverage and Tobacco (Consumer Staples) | 3.6 | |||
| Health Care Equipment and Services (Health Care) | 2.9 | |||
| Household and Personal Products (Consumer Staples) | 0.6 | |||
| Insurance (Financials) | 4.7 | |||
| Materials (Materials) | 3.5 | |||
| Media (Consumer Discretionary) | 3.0 | |||
| Pharmaceuticals, Biotechnology and Life Sciences (Health Care) | 10.4 | |||
| Real Estate (Financials) | 0.6 | |||
| Retailing (Consumer Discretionary) | 7.6 | |||
| Semiconductors and Semiconductor Equipment (Information Technology) | 4.7 | |||
| Software and Services (Information Technology) | 9.2 | |||
| Technology Hardware and Equipment (Information Technology) | 5.2 | |||
| Telecommunication Services (Services) | 0.9 | |||
| Transportation (Industrials) | 5.4 | |||
| Utilities (Utilities) | 1.5 | |||
| Total | 99.7 | % | ||
| Short-Term Investments | 1.9 | |||
| Other Assets and Liabilities | (1.6 | ) | ||
| Total | 100.0 | % | ||
| 4 |
| Hartford Capital Appreciation HLS Fund |
| Schedule of Investments |
| June 30, 2013 (Unaudited) |
| (000’s Omitted) |
| Shares or Principal Amount | Market Value ╪ | |||||||
| COMMON STOCKS - 99.5% | ||||||||
| Automobiles and Components - 4.3% | ||||||||
| 125 | Allison Transmission Holdings, Inc. | $ | 2,885 | |||||
| 344 | Dana Holding Corp. | 6,629 | ||||||
| 65 | Delphi Automotive plc | 3,269 | ||||||
| 8,558 | Ford Motor Co. | 132,394 | ||||||
| 249 | General Motors Co. ● | 8,279 | ||||||
| 2,794 | Goodyear (The) Tire & Rubber Co. ● | 42,724 | ||||||
| 209 | Harley-Davidson, Inc. | 11,483 | ||||||
| 172 | Hyundai Motor Co., Ltd. | 33,676 | ||||||
| 1,720 | Isuzu Motors Ltd. | 11,758 | ||||||
| 283 | Tenneco Automotive, Inc. ● | 12,820 | ||||||
| 775 | TRW Automotive Holdings Corp. ● | 51,496 | ||||||
| 317,413 | ||||||||
| Banks - 2.9% | ||||||||
| 10,194 | Mitsubishi UFJ Financial Group, Inc. | 62,954 | ||||||
| 677 | Oversea-Chinese Banking Corp., Ltd. | 5,321 | ||||||
| 1,037 | PNC Financial Services Group, Inc. | 75,605 | ||||||
| 1,687 | Wells Fargo & Co. | 69,611 | ||||||
| 213,491 | ||||||||
| Capital Goods - 6.8% | ||||||||
| 140 | 3M Co. | 15,287 | ||||||
| 208 | AGCO Corp. | 10,459 | ||||||
| 246 | AMETEK, Inc. | 10,414 | ||||||
| 292 | Armstrong World Industries, Inc. ● | 13,934 | ||||||
| 157 | Assa Abloy Ab | 6,145 | ||||||
| 1,445 | BAE Systems plc | 8,417 | ||||||
| 275 | Belden, Inc. | 13,714 | ||||||
| 43 | Boeing Co. | 4,401 | ||||||
| 464 | Cummins, Inc. | 50,336 | ||||||
| 88 | Dover Corp. | 6,811 | ||||||
| 196 | Eaton Corp. plc | 12,892 | ||||||
| 4 | Esterline Technologies Corp. ● | 304 | ||||||
| 195 | Flowserve Corp. | 10,544 | ||||||
| 276 | HD Supply Holdings, Inc. ●☼ | 5,178 | ||||||
| 20 | Honeywell International, Inc. | 1,601 | ||||||
| 165 | Illinois Tool Works, Inc. | 11,420 | ||||||
| 2,490 | Itochu Corp. | 28,794 | ||||||
| 1,829 | KBR, Inc. | 59,456 | ||||||
| 124 | Lockheed Martin Corp. | 13,502 | ||||||
| 159 | Northrop Grumman Corp. | 13,127 | ||||||
| 254 | Owens Corning, Inc. ● | 9,931 | ||||||
| 80 | Parker-Hannifin Corp. | 7,665 | ||||||
| 193 | Polypore International, Inc. ● | 7,782 | ||||||
| 416 | Rexel S.A. | 9,366 | ||||||
| 2,278 | Rolls-Royce Holdings plc | 39,232 | ||||||
| 872 | Safran S.A. | 45,531 | ||||||
| 118 | Schneider Electric S.A. | 8,564 | ||||||
| 82 | Siemens AG | 8,343 | ||||||
| 264 | SKF AB Class B | 6,177 | ||||||
| 118 | Stanley Black & Decker, Inc. | 9,137 | ||||||
| 213 | Textron, Inc. | 5,549 | ||||||
| 218 | Titan International, Inc. | 3,678 | ||||||
| 61 | TransDigm Group, Inc. | 9,532 | ||||||
| 137 | United Technologies Corp. | 12,742 | ||||||
| 350 | WESCO International, Inc. ● | 23,802 | ||||||
| 503,767 | ||||||||
| Commercial and Professional Services - 0.8% | ||||||||
| 228 | Edenred | 6,969 | ||||||
| 304 | Herman Miller, Inc. | 8,237 | ||||||
| 51 | IHS, Inc. ● | 5,349 | ||||||
| 209 | Knoll, Inc. | 2,967 | ||||||
| 1,037 | Nielsen Holdings N.V. | 34,834 | ||||||
| 103 | Wageworks, Inc. ● | 3,531 | ||||||
| 61,887 | ||||||||
| Consumer Durables and Apparel - 1.3% | ||||||||
| 78 | Coach, Inc. | 4,431 | ||||||
| 578 | D.R. Horton, Inc. | 12,307 | ||||||
| 53 | De'Longhi S.p.A. | 821 | ||||||
| 710 | Fifth & Pacific Cos., Inc. ● | 15,852 | ||||||
| 95 | Fossil Group, Inc. ● | 9,799 | ||||||
| 293 | Mattel, Inc. | 13,271 | ||||||
| 173 | PVH Corp. | 21,584 | ||||||
| 207 | Tempur Sealy International, Inc. ● | 9,095 | ||||||
| 376 | Vera Bradley, Inc. ● | 8,149 | ||||||
| 45 | Whirlpool Corp. | 5,132 | ||||||
| 100,441 | ||||||||
| Consumer Services - 2.2% | ||||||||
| 87 | American Public Education, Inc. ● | 3,222 | ||||||
| 251 | Bloomin' Brands, Inc. ● | 6,233 | ||||||
| 60 | Buffalo Wild Wings, Inc. ● | 5,841 | ||||||
| 325 | Burger King Worldwide, Inc. | 6,336 | ||||||
| 923 | Compass Group plc | 11,793 | ||||||
| 114 | DeVry, Inc. | 3,535 | ||||||
| 256 | Dunkin' Brands Group, Inc. | 10,953 | ||||||
| 435 | Grand Canyon Education, Inc. ● | 14,010 | ||||||
| 117 | ITT Educational Services, Inc. ● | 2,843 | ||||||
| 86 | Life Time Fitness, Inc. ● | 4,330 | ||||||
| 217 | Melco PBL Entertainment Ltd. ADR ● | 4,852 | ||||||
| 2,420 | MGM China Holdings Ltd. | 6,423 | ||||||
| 27 | Penn National Gaming, Inc. ● | 1,438 | ||||||
| 178 | Starbucks Corp. | 11,638 | ||||||
| 216 | Tim Hortons, Inc. | 11,706 | ||||||
| 904 | Wyndham Worldwide Corp. | 51,758 | ||||||
| 880 | Wynn Macau Ltd. | 2,366 | ||||||
| 110 | Yum! Brands, Inc. | 7,641 | ||||||
| 166,918 | ||||||||
| Diversified Financials - 6.6% | ||||||||
| 544 | Ameriprise Financial, Inc. | 43,990 | ||||||
| 221 | Banca Generali S.p.A. | 4,775 | ||||||
| 1,224 | Bank of America Corp. | 15,747 | ||||||
| 206 | BlackRock, Inc. | 52,947 | ||||||
| 1,218 | Citigroup, Inc. | 58,406 | ||||||
| 433 | Credit Suisse Group AG | 11,459 | ||||||
| 1,538 | E*Trade Financial Corp. ● | 19,469 | ||||||
| 321 | IntercontinentalExchange, Inc. ● | 57,118 | ||||||
| 210 | Invesco Ltd. | 6,682 | ||||||
| 3,021 | JP Morgan Chase & Co. | 159,489 | ||||||
| 540 | Julius Baer Group Ltd. | 21,089 | ||||||
| 186 | LPL Financial Holdings, Inc. | 7,017 | ||||||
| 19 | Partners Group | 5,138 | ||||||
| 396 | Platform Acquisition Holdings Ltd. ● | 4,241 | ||||||
| 75 | Solar Cayman Ltd. ⌂■●† | 5 | ||||||
| 389 | Waddell & Reed Financial, Inc. Class A | 16,935 | ||||||
| 342 | Wisdomtree Investment, Inc. ● | 3,955 | ||||||
| 488,462 | ||||||||
| Energy - 8.5% | ||||||||
| 511 | Anadarko Petroleum Corp. | 43,902 | ||||||
| 234 | Atwood Oceanics, Inc. ● | 12,181 | ||||||
| 595 | Baker Hughes, Inc. | 27,465 | ||||||
The accompanying notes are an integral part of these financial statements.
| 5 |
| Hartford Capital Appreciation HLS Fund |
| Schedule of Investments – (continued) |
| June 30, 2013 (Unaudited) |
| (000’s Omitted) |
| Shares or Principal Amount | Market Value ╪ | |||||||
| COMMON STOCKS - 99.5% - (continued) | ||||||||
| Energy - 8.5% - (continued) | ||||||||
| 4,178 | BG Group plc | $ | 71,002 | |||||
| 1,357 | BP plc | 9,415 | ||||||
| 1,362 | BP plc ADR | 56,830 | ||||||
| 76 | Cabot Oil & Gas Corp. | 5,395 | ||||||
| 168 | Cameron International Corp. ● | 10,279 | ||||||
| 408 | Canadian Natural Resources Ltd. ADR | 11,522 | ||||||
| 1,556 | Chesapeake Energy Corp. | 31,715 | ||||||
| 126 | Chevron Corp. | 14,863 | ||||||
| 1,880 | Cobalt International Energy, Inc. ● | 49,953 | ||||||
| 125 | Continental Resources, Inc. ● | 10,723 | ||||||
| 65 | Diamond Offshore Drilling, Inc. | 4,492 | ||||||
| 104 | Exxon Mobil Corp. | 9,387 | ||||||
| 1,161 | Halliburton Co. | 48,428 | ||||||
| 4,665 | JX Holdings, Inc. | 22,526 | ||||||
| 3,260 | Karoon Gas Australia Ltd. ● | 15,170 | ||||||
| 438 | Kior, Inc. ● | 2,504 | ||||||
| 1,264 | McDermott International, Inc. ● | 10,343 | ||||||
| 159 | National Oilwell Varco, Inc. | 10,974 | ||||||
| 218 | Newfield Exploration Co. ● | 5,219 | ||||||
| 222 | Occidental Petroleum Corp. | 19,835 | ||||||
| 259 | Petroleo Brasileiro S.A. ADR | 3,480 | ||||||
| 221 | Pioneer Natural Resources Co. | 32,020 | ||||||
| 347 | QEP Resources, Inc. | 9,650 | ||||||
| 107 | Royal Dutch Shell plc ADR | 7,064 | ||||||
| 572 | Southwestern Energy Co. ● | 20,886 | ||||||
| 249 | Statoil ASA | 5,143 | ||||||
| 269 | Suncor Energy, Inc. | 7,939 | ||||||
| 243 | Superior Energy Services, Inc. ● | 6,311 | ||||||
| 105 | TGS Nopec Geophysical Co. ASA | 3,053 | ||||||
| 114 | Transocean, Inc. | 5,447 | ||||||
| 508 | Trican Well Service Ltd. ☼ | 6,757 | ||||||
| 146 | Valero Energy Corp. | 5,079 | ||||||
| 256 | Whiting Petroleum Corp. ● | 11,792 | ||||||
| 628,744 | ||||||||
| Food and Staples Retailing - 2.5% | ||||||||
| 1,512 | CVS Caremark Corp. | 86,454 | ||||||
| 157 | FamilyMart Co., Ltd. | 6,699 | ||||||
| 1,795 | Kroger (The) Co. | 61,999 | ||||||
| 171 | Seven & I Holdings Co., Ltd. | 6,270 | ||||||
| 1,274 | Tesco plc | 6,416 | ||||||
| 185 | Wal-Mart Stores, Inc. | 13,796 | ||||||
| 113 | Whole Foods Market, Inc. | 5,831 | ||||||
| 187,465 | ||||||||
| Food, Beverage and Tobacco - 3.6% | ||||||||
| 662 | Anheuser-Busch InBev N.V. | 59,606 | ||||||
| 131 | Anheuser-Busch InBev N.V. ADR | 11,795 | ||||||
| 162 | British American Tobacco plc | 8,285 | ||||||
| 267 | Coca-Cola Co. | 10,723 | ||||||
| 66 | Diageo plc ADR | 7,583 | ||||||
| 238 | Green Mountain Coffee Roasters, Inc. ● | 17,855 | ||||||
| 96 | Groupe Danone | 7,195 | ||||||
| 43 | Hillshire (The) Brands Co. | 1,426 | ||||||
| 362 | Imperial Tobacco Group plc | 12,553 | ||||||
| 335 | Kraft Foods Group, Inc. | 18,692 | ||||||
| 31,747 | LT Group, Inc. | 16,580 | ||||||
| 784 | Maple Leaf Foods, Inc. w/ Rights | 10,904 | ||||||
| 182 | Molson Coors Brewing Co. | 8,698 | ||||||
| 258 | Monster Beverage Corp. ● | 15,662 | ||||||
| 66 | Nutreco Holding N.V. | 2,775 | ||||||
| 321 | PepsiCo, Inc. | 26,291 | ||||||
| 244 | Philip Morris International, Inc. | 21,163 | ||||||
| 267 | Unilever N.V. NY Shares ADR | 10,500 | ||||||
| 268,286 | ||||||||
| Health Care Equipment and Services - 2.9% | ||||||||
| 92 | Aetna, Inc. | 5,836 | ||||||
| 3,118 | Boston Scientific Corp. ● | 28,905 | ||||||
| 705 | Cardinal Health, Inc. | 33,289 | ||||||
| 9,120 | CareView Communications, Inc. ● | 5,016 | ||||||
| 160 | Catamaran Corp. ● | 7,771 | ||||||
| 22 | Cie Generale d'Optique Essilor International S.A. | 2,310 | ||||||
| 148 | CIGNA Corp. | 10,698 | ||||||
| 446 | Covidien plc | 28,014 | ||||||
| 21 | Heartware International, Inc. ● | 1,991 | ||||||
| 981 | Hologic, Inc. ● | 18,927 | ||||||
| 774 | Medtronic, Inc. | 39,813 | ||||||
| 247 | St. Jude Medical, Inc. | 11,264 | ||||||
| 68 | Team Health Holdings ● | 2,799 | ||||||
| 297 | UnitedHealth Group, Inc. | 19,469 | ||||||
| 216,102 | ||||||||
| Household and Personal Products - 0.6% | ||||||||
| 295 | Coty, Inc. ● | 5,062 | ||||||
| 172 | Estee Lauder Co., Inc. | 11,280 | ||||||
| 70 | Reckitt Benckiser Group plc | 4,956 | ||||||
| 904 | Svenska Cellulosa Ab B Shares | 22,680 | ||||||
| 43,978 | ||||||||
| Insurance - 4.7% | ||||||||
| 218 | ACE Ltd. | 19,524 | ||||||
| 390 | Aflac, Inc. ‡ | 22,642 | ||||||
| 3,159 | AIA Group Ltd. | 13,308 | ||||||
| 2,756 | American International Group, Inc. ● | 123,208 | ||||||
| 77 | Aon plc | 4,972 | ||||||
| 553 | Assured Guaranty Ltd. | 12,193 | ||||||
| 551 | AXA S.A. | 10,857 | ||||||
| 1,646 | China Pacific Insurance Co., Ltd. | 5,218 | ||||||
| 400 | Fidelity National Financial, Inc. | 9,524 | ||||||
| 344 | Lincoln National Corp. | 12,535 | ||||||
| 426 | Marsh & McLennan Cos., Inc. | 17,014 | ||||||
| 432 | MetLife, Inc. | 19,767 | ||||||
| 151 | Principal Financial Group, Inc. | 5,661 | ||||||
| 198 | Reinsurance Group of America, Inc. | 13,704 | ||||||
| 177 | Swiss Re Ltd. | 13,193 | ||||||
| 570 | T&D Holdings, Inc. | 7,625 | ||||||
| 353 | Tokio Marine Holdings, Inc. | 11,136 | ||||||
| 257 | Unum Group | 7,559 | ||||||
| 352 | XL Group plc | 10,662 | ||||||
| 25 | Zurich Financial Services AG | 6,423 | ||||||
| 346,725 | ||||||||
| Materials - 3.5% | ||||||||
| 118 | Agnico-Eagle Mines Ltd. | 3,263 | ||||||
| 99 | Air Liquide | 12,267 | ||||||
| 193 | Akzo Nobel N.V. | 10,877 | ||||||
| 836 | Allied Nevada Gold Corp. ● | 5,416 | ||||||
| 3,149 | AuRico Gold, Inc. | 13,760 | ||||||
| 3,582 | Barrick Gold Corp. | 56,387 | ||||||
| 365 | Cabot Corp. | 13,659 | ||||||
| 1,822 | Continental Gold Ltd. ● | 5,716 | ||||||
| 63 | Crown Holdings, Inc. ● | 2,600 | ||||||
The accompanying notes are an integral part of these financial statements.
| 6 |
| Shares or Principal Amount | Market Value ╪ | |||||||
| COMMON STOCKS - 99.5% - (continued) | ||||||||
| Materials - 3.5% - (continued) | ||||||||
| 492 | Dow Chemical Co. | $ | 15,813 | |||||
| 3,000 | Glencore Xstrata plc | 12,419 | ||||||
| 412 | International Paper Co. | 18,269 | ||||||
| 278 | JSR Corp. | 5,629 | ||||||
| 279 | Louisiana-Pacific Corp. ● | 4,126 | ||||||
| 261 | Methanex Corp. ADR | 11,178 | ||||||
| 7,696 | Mitsui Chemicals, Inc. | 17,325 | ||||||
| 1,290 | Molycorp, Inc. ● | 7,997 | ||||||
| 34 | Monsanto Co. | 3,315 | ||||||
| 177 | Mosaic Co. | 9,546 | ||||||
| 368 | Norbord, Inc. | 10,638 | ||||||
| 145 | Reliance Steel & Aluminum | 9,521 | ||||||
| 82 | Rock Tenn Co. Class A | 8,163 | ||||||
| 161 | SunCoke Energy, Inc. ● | 2,253 | ||||||
| 260,137 | ||||||||
| Media - 2.8% | ||||||||
| 206 | CBS Corp. Class B | 10,069 | ||||||
| 145 | Comcast Corp. Class A | 6,063 | ||||||
| 30 | Harvey Weinstein Co. Holdings Class A-1 ⌂●†∞ | — | ||||||
| 25 | Imax Corp. ● | 614 | ||||||
| 2,355 | Interpublic Group of Cos., Inc. | 34,265 | ||||||
| 540 | Omnicom Group, Inc. | 33,946 | ||||||
| 716 | Pandora Media, Inc. ● | 13,175 | ||||||
| 92 | Publicis Groupe | 6,520 | ||||||
| 115 | Time Warner Cable, Inc. | 12,902 | ||||||
| 1,073 | Time Warner, Inc. | 62,033 | ||||||
| 204 | Walt Disney Co. | 12,861 | ||||||
| 1,076 | WPP plc | 18,397 | ||||||
| 210,845 | ||||||||
| Pharmaceuticals, Biotechnology and Life Sciences - 10.4% | ||||||||
| 42 | Actavis, Inc. ● | 5,333 | ||||||
| 95 | Actelion Ltd. | 5,702 | ||||||
| 132 | Agilent Technologies, Inc. | 5,664 | ||||||
| 188 | Alkermes plc ● | 5,403 | ||||||
| 637 | Almirall S.A. | 8,098 | ||||||
| 235 | Amgen, Inc. | 23,141 | ||||||
| 2,337 | Arena Pharmaceuticals, Inc. ● | 17,998 | ||||||
| 103 | AstraZeneca plc | 4,849 | ||||||
| 1,232 | AVANIR Pharmeceuticals, Inc. ● | 5,669 | ||||||
| 28 | Biogen Idec, Inc. ● | 6,132 | ||||||
| 1,676 | Bristol-Myers Squibb Co. | 74,890 | ||||||
| 122 | Bruker Corp. ● | 1,975 | ||||||
| 247 | Celgene Corp. ● | 28,905 | ||||||
| 71 | Covance, Inc. ● | 5,439 | ||||||
| 480 | Daiichi Sankyo Co., Ltd. | 7,994 | ||||||
| 51 | Eli Lilly & Co. | 2,522 | ||||||
| 2,372 | Gilead Sciences, Inc. ● | 121,480 | ||||||
| 435 | Johnson & Johnson | 37,371 | ||||||
| 2,095 | Merck & Co., Inc. | 97,305 | ||||||
| 100 | Novartis AG ADR | 7,047 | ||||||
| 68 | Onyx Pharmaceuticals, Inc. ● | 5,906 | ||||||
| 419 | Pfizer, Inc. | 11,745 | ||||||
| 49 | Regeneron Pharmaceuticals, Inc. ● | 11,120 | ||||||
| 246 | Roche Holding AG | 61,167 | ||||||
| 55 | Salix Pharmaceuticals Ltd. ● | 3,654 | ||||||
| 3,555 | Teva Pharmaceutical Industries Ltd. ADR | 139,361 | ||||||
| 3,994 | TherapeuticsMD, Inc. ● | 12,100 | ||||||
| 429 | Vertex Pharmaceuticals, Inc. ● | 34,260 | ||||||
| 453 | WuXi PharmaTech Cayman, Inc. ● | 9,513 | ||||||
| 411 | Zoetis, Inc. | 12,692 | ||||||
| 774,435 | ||||||||
| Real Estate - 0.6% | ||||||||
| 92 | AvalonBay Communities, Inc. REIT | 12,374 | ||||||
| 59 | Boston Properties, Inc. REIT | 6,209 | ||||||
| 348 | Host Hotels & Resorts, Inc. REIT | 5,866 | ||||||
| 152 | Realogy Holdings Corp. ● | 7,278 | ||||||
| 33 | Unibail Rodamco REIT | 7,715 | ||||||
| 191 | Weyerhaeuser Co. REIT | 5,427 | ||||||
| 32 | Zillow, Inc. ● | 1,813 | ||||||
| 46,682 | ||||||||
| Retailing - 7.6% | ||||||||
| 116 | Abercrombie & Fitch Co. Class A | 5,241 | ||||||
| 353 | Aeropostale, Inc. ● | 4,871 | ||||||
| 8,452 | Allstar Co. ⌂●† | 17,528 | ||||||
| 19 | Amazon.com, Inc. ● | 5,309 | ||||||
| 658 | Ascena Retail Group, Inc. ● | 11,478 | ||||||
| 117 | AutoZone, Inc. ● | 49,487 | ||||||
| 3,484 | Best Buy Co., Inc. | 95,222 | ||||||
| 29,055 | Buck Holdings L.P. ⌂●† | 8,822 | ||||||
| 177 | Buckle (The), Inc. | 9,222 | ||||||
| 160 | Chico's FAS, Inc. | 2,724 | ||||||
| 145 | Dick's Sporting Goods, Inc. | 7,238 | ||||||
| 192 | Dollar Tree, Inc. ● | 9,739 | ||||||
| 84 | Dollarama, Inc. | 5,851 | ||||||
| 69 | DSW, Inc. | 5,061 | ||||||
| 34 | Dufry Group ● | 4,152 | ||||||
| 344 | Five Below, Inc. ● | 12,644 | ||||||
| 181 | Francescas Holding Corp. ● | 5,019 | ||||||
| 476 | GameStop Corp. Class A | 19,990 | ||||||
| 146 | Gap, Inc. | 6,072 | ||||||
| 106 | GNC Holdings, Inc. | 4,668 | ||||||
| 1,129 | Groupon, Inc. ● | 9,596 | ||||||
| 76 | HomeAway, Inc. ● | 2,472 | ||||||
| 12,299 | Intime Department Store Group Co., Ltd. | 11,911 | ||||||
| 1,076 | Liberty Media - Interactive A ● | 24,754 | ||||||
| 331 | LKQ Corp. ● | 8,523 | ||||||
| 1,460 | Lowe's Cos., Inc. | 59,712 | ||||||
| 893 | Marks & Spencer Group plc | 5,843 | ||||||
| 123 | Men's Wearhouse, Inc. | 4,644 | ||||||
| 23 | Netflix, Inc. ● | 4,954 | ||||||
| 221 | Pier 1 Imports, Inc. | 5,201 | ||||||
| 56 | Priceline.com, Inc. ● | 46,252 | ||||||
| 535 | Rakuten, Inc. | 6,330 | ||||||
| 76 | Sears Hometown and Outlet Stores, Inc. ● | 3,301 | ||||||
| 489 | Start Today Co., Ltd. | 9,575 | ||||||
| 251 | Target Corp. | 17,278 | ||||||
| 876 | TJX Cos., Inc. | 43,874 | ||||||
| 105 | TripAdvisor, Inc. ● | 6,365 | ||||||
| 81 | Urban Outfitters, Inc. ● | 3,257 | ||||||
| 564,180 | ||||||||
| Semiconductors and Semiconductor Equipment - 4.7% | ||||||||
| 220 | Altera Corp. | 7,253 | ||||||
| 312 | Analog Devices, Inc. | 14,072 | ||||||
| 238 | ASML Holding N.V. | 18,826 | ||||||
| 518 | Broadcom Corp. Class A | 17,493 | ||||||
| 2,084 | GT Advanced Technologies, Inc. ● | 8,648 | ||||||
| 3,688 | Intel Corp. | 89,325 | ||||||
| 393 | Maxim Integrated Products, Inc. | 10,915 | ||||||
The accompanying notes are an integral part of these financial statements.
| 7 |
| Hartford Capital Appreciation HLS Fund |
| Schedule of Investments – (continued) |
| June 30, 2013 (Unaudited) |
| (000’s Omitted) |
| Shares or Principal Amount | Market Value ╪ | |||||||
| COMMON STOCKS - 99.5% - (continued) | ||||||||
| Semiconductors and Semiconductor Equipment - 4.7% - (continued) | ||||||||
| 4,378 | Micron Technology, Inc. ● | $ | 62,731 | |||||
| 594 | NXP Semiconductors N.V. ● | 18,416 | ||||||
| 10 | Samsung Electronics Co., Ltd. | 11,674 | ||||||
| 606 | Skyworks Solutions, Inc. ● | 13,261 | ||||||
| 3,227 | SunEdison, Inc. ● | 26,364 | ||||||
| 1,676 | Teradyne, Inc. ● | 29,446 | ||||||
| 506 | Xilinx, Inc. | 20,057 | ||||||
| 348,481 | ||||||||
| Software and Services - 9.2% | ||||||||
| 89 | Accenture plc | 6,426 | ||||||
| 596 | Activision Blizzard, Inc. | 8,504 | ||||||
| 972 | Akamai Technologies, Inc. ● | 41,339 | ||||||
| 914 | Amadeus IT Holding S.A. Class A | 29,265 | ||||||
| 233 | Autodesk, Inc. ● | 7,921 | ||||||
| 190 | Automatic Data Processing, Inc. | 13,080 | ||||||
| 80 | BMC Software, Inc. ● | 3,622 | ||||||
| 370 | Booz Allen Hamilton Holding Corp. | 6,438 | ||||||
| 519 | Cadence Design Systems, Inc. ● | 7,508 | ||||||
| 493 | Check Point Software Technologies Ltd. ADR ● | 24,476 | ||||||
| 196 | Citrix Systems, Inc. ● | 11,837 | ||||||
| 116 | Cognizant Technology Solutions Corp. ● | 7,244 | ||||||
| 105 | Concur Technologies, Inc. ● | 8,535 | ||||||
| 40 | Cornerstone OnDemand, Inc. ● | 1,719 | ||||||
| 252 | DeNa Co., Ltd. | 4,941 | ||||||
| 218 | Dropbox, Inc. ⌂●† | 1,986 | ||||||
| 305 | eBay, Inc. ● | 15,780 | ||||||
| 188 | Facebook, Inc. ● | 4,682 | ||||||
| 1,821 | Genpact Ltd. | 35,035 | ||||||
| 254 | Global Payments, Inc. | 11,761 | ||||||
| 71 | Google, Inc. ● | 62,504 | ||||||
| 503 | IAC/InterActiveCorp. | 23,935 | ||||||
| 704 | iGate Corp. ● | 11,568 | ||||||
| 106 | Imperva, Inc. ● | 4,757 | ||||||
| 204 | Kakaku.com, Inc. | 6,230 | ||||||
| 62 | LinkedIn Corp. Class A ● | 11,104 | ||||||
| 4,067 | Microsoft Corp. | 140,445 | ||||||
| 76 | Open Text Corp. | 5,211 | ||||||
| 1,148 | Oracle Corp. | 35,263 | ||||||
| 99 | Red Hat, Inc. ● | 4,723 | ||||||
| 327 | ServiceNow, Inc. ● | 13,219 | ||||||
| 61 | Symantec Corp. | 1,366 | ||||||
| 135 | Teradata Corp. ● | 6,767 | ||||||
| 160 | Trulia, Inc. ● | 4,985 | ||||||
| 24 | Visa, Inc. | 4,438 | ||||||
| 82 | VMware, Inc. ● | 5,466 | ||||||
| 585 | Web.com Group, Inc. ● | 14,981 | ||||||
| 303 | Western Union Co. | 5,190 | ||||||
| 30 | Workday, Inc. Class A ● | 1,905 | ||||||
| 2,583 | Yahoo!, Inc. ● | 64,855 | ||||||
| 1,463 | Zynga, Inc. ● | 4,066 | ||||||
| 685,077 | ||||||||
| Technology Hardware and Equipment - 5.2% | ||||||||
| 4,453 | Alcatel - Lucent ADR ● | 8,104 | ||||||
| 67 | Apple, Inc. | 26,507 | ||||||
| 6,205 | Cisco Systems, Inc. | 150,855 | ||||||
| 2,574 | EMC Corp. | 60,806 | ||||||
| 429 | Hewlett-Packard Co. | 10,647 | ||||||
| 1,815 | JDS Uniphase Corp. ● | 26,096 | ||||||
| 564 | Juniper Networks, Inc. ● | 10,891 | ||||||
| 11,344 | Lenovo Group Ltd. | 10,210 | ||||||
| 197 | Motorola Solutions, Inc. | 11,361 | ||||||
| 183 | National Instruments Corp. | 5,110 | ||||||
| 279 | NetApp, Inc. ● | 10,539 | ||||||
| 310 | QLogic Corp. ● | 2,962 | ||||||
| 1,981 | Quanta Computer, Inc. | 4,261 | ||||||
| 735 | SanDisk Corp. ● | 44,895 | ||||||
| 12 | Seagate Technology plc | 548 | ||||||
| 383,792 | ||||||||
| Telecommunication Services - 0.9% | ||||||||
| 461 | Hellenic Telecommunications Organization S.A. | 3,604 | ||||||
| 686 | Intelsat S.A. ● | 13,728 | ||||||
| 3,116 | Portugal Telecom SGPS S.A. | 12,124 | ||||||
| 95 | SoftBank Corp. | 5,522 | ||||||
| 307 | Telenor ASA | 6,101 | ||||||
| 365 | T-Mobile US, Inc. | 9,055 | ||||||
| 143 | Verizon Communications, Inc. | 7,179 | ||||||
| 2,450 | Vodafone Group plc | 7,020 | ||||||
| 222 | Vodafone Group plc ADR | 6,384 | ||||||
| 70,717 | ||||||||
| Transportation - 5.4% | ||||||||
| 2,919 | AirAsia X Berhad ●☼ | 1,155 | ||||||
| 232 | C.H. Robinson Worldwide, Inc. | 13,048 | ||||||
| 84 | Canadian National Railway Co. | 8,159 | ||||||
| 1,649 | Delta Air Lines, Inc. ● | 30,862 | ||||||
| 91 | FedEx Corp. | 8,971 | ||||||
| 5,073 | Hertz Global Holdings, Inc. ● | 125,818 | ||||||
| 5,343 | JetBlue Airways Corp. ● | 33,658 | ||||||
| 122 | Kansas City Southern | 12,962 | ||||||
| 596 | Knight Transportation, Inc. | 10,021 | ||||||
| 87 | Union Pacific Corp. | 13,345 | ||||||
| 3,040 | United Continental Holdings, Inc. ● | 95,133 | ||||||
| 530 | United Parcel Service, Inc. Class B | 45,804 | ||||||
| 398,936 | ||||||||
| Utilities - 1.5% | ||||||||
| 546 | Calpine Corp. ● | 11,591 | ||||||
| 7,339 | China Longyuan Power Group Corp. | 7,546 | ||||||
| 276 | Companhia Energetica de Minas Gerais ADR | 2,479 | ||||||
| 162 | Entergy Corp. | 11,293 | ||||||
| 346 | National Grid plc | 3,926 | ||||||
| 1,280 | NRG Energy, Inc. | 34,171 | ||||||
| 1,633 | Snam S.p.A. | 7,436 | ||||||
| 342 | UGI Corp. | 13,368 | ||||||
| 730 | Xcel Energy, Inc. | 20,689 | ||||||
| 112,499 | ||||||||
| Total common stocks | ||||||||
| (cost $6,484,218) | $ | 7,399,460 | ||||||
PREFERRED STOCKS - 0.2% | ||||||||
| Media - 0.2% | ||||||||
| 388 | ProSieben Sat.1 Media AG | $ | 16,642 | |||||
| Total preferred stocks | ||||||||
| (cost $15,512) | $ | 16,642 | ||||||
The accompanying notes are an integral part of these financial statements.
| 8 |
| Shares or Principal Amount | Market Value ╪ | |||||||||
| WARRANTS - 0.0% | ||||||||||
| Pharmaceuticals, Biotechnology and Life Sciences - 0.0% | ||||||||||
| 510 | Novavax, Inc. ⌂● | $ | — | |||||||
| Telecommunication Services - 0.0% | ||||||||||
| 396 | Platform Acquisition ⌂ | — | ||||||||
| Total warrants | ||||||||||
| (cost $4) | $ | — | ||||||||
| Total long-term investments (cost $6,499,734) | $ | 7,416,102 | ||||||||
| SHORT-TERM INVESTMENTS - 1.9% | ||||||||||
| Repurchase Agreements - 1.9% | ||||||||||
| Bank of America Merrill Lynch TriParty Repurchase Agreement (maturing on 07/01/2013 in the amount of $527, collateralized by GNMA 3.00%, 2042, value of $536) | ||||||||||
| $ | 527 | 0.13%, 6/28/2013 | $ | 527 | ||||||
| Bank of Montreal TriParty Repurchase Agreement (maturing on 07/01/2013 in the amount of $21,764, collateralized by FHLB 0.38%, 2015, FHLMC 0.38%, 2014, FNMA 0.50% - 5.50%, 2015 - 2042, value of $22,149) | ||||||||||
| 21,764 | 0.12%, 6/28/2013 | 21,764 | ||||||||
| Bank of Montreal TriParty Repurchase Agreement (maturing on 07/01/2013 in the amount of $11,203, collateralized by FHLMC 4.00% - 5.00%, 2023 - 2025, FNMA 2.00% - 5.00%, 2022 - 2042, GNMA 2.00% - 5.00%, 2041 - 2043, value of $11,397) | ||||||||||
| 11,203 | 0.15%, 6/28/2013 | 11,203 | ||||||||
| Barclays Capital TriParty Repurchase Agreement (maturing on 07/01/2013 in the amount of $15,082, collateralized by U.S. Treasury Note 3.13%, 2021, value of $15,331) | ||||||||||
| 15,082 | 0.10%, 6/28/2013 | 15,082 | ||||||||
| Citigroup Global Markets, Inc. TriParty Repurchase Agreement (maturing on 07/01/2013 in the amount of $44,445, collateralized by U.S. Treasury Bill 0.85%, 2013, U.S. Treasury Note 0.63% - 3.25%, 2013 - 2018, value of $45,114) | ||||||||||
| 44,445 | 0.10%, 6/28/2013 | 44,445 | ||||||||
| Deutsche Bank Securities TriParty Repurchase Agreement (maturing on 07/01/2013 in the amount of $527, collateralized by FNMA 4.50%, 2035, value of $536) | ||||||||||
| 527 | 0.25%, 6/28/2013 | 527 | ||||||||
| RBS Securities, Inc. TriParty Repurchase Agreement (maturing on 07/01/2013 in the amount of $17,824, collateralized by U.S. Treasury Note 1.00% - 2.63%, 2014 - 2020, value of $18,181) | ||||||||||
| 17,824 | 0.10%, 6/28/2013 | 17,824 | ||||||||
| TD Securities TriParty Repurchase Agreement (maturing on 07/01/2013 in the amount of $31,432, collateralized by FHLMC 3.50% - 4.00%, 2042, FNMA 3.50% - 4.50%, 2041 - 2042, value of $31,968) | ||||||||||
| 31,432 | 0.12%, 6/28/2013 | 31,432 | ||||||||
| UBS Securities, Inc. Repurchase Agreement (maturing on 07/01/2013 in the amount of $454, collateralized by U.S. Treasury Note 0.63%, 2014, value of $463) | ||||||||||
| 454 | 0.09%, 6/28/2013 | 454 | ||||||||
| 143,258 | ||||||||||
| Total short-term investments | ||||||||||
| (cost $143,258) | $ | 143,258 | ||||||||
| Total investments | ||||||||||
| (cost $6,642,992) ▲ | 101.6 | % | $ | 7,559,360 | ||||||
| Other assets and liabilities | (1.6 | )% | (121,851 | ) | ||||||
| Total net assets | 100.0 | % | $ | 7,437,509 | ||||||
The accompanying notes are an integral part of these financial statements.
| 9 |
| Hartford Capital Appreciation HLS Fund |
Schedule of Investments – (continued)
June 30, 2013 (Unaudited)
(000’s Omitted)
| Note: | Percentage of investments as shown is the ratio of the total market value to total net assets. |
| Prices of foreign equities that are principally traded on certain foreign markets may be adjusted daily pursuant to a fair value pricing service approved by the Board of Directors in order to reflect an adjustment for factors occurring after the close of certain foreign markets but before the close of the New York Stock Exchange. |
| ▲ | At June 30, 2013, the cost of securities for federal income tax purposes was $6,813,450 and the aggregate gross unrealized appreciation and depreciation based on that cost were: |
| Unrealized Appreciation | $ | 1,128,932 | ||
| Unrealized Depreciation | (383,022 | ) | ||
| Net Unrealized Appreciation | $ | 745,910 |
| † | These securities were valued in good faith at fair value as determined under policies and procedures established by and under the supervision of the Company's Board of Directors. At June 30, 2013, the aggregate value of these securities was $28,341, which represents 0.4% of total net assets. This amount excludes securities that are principally traded in certain foreign markets and whose prices are adjusted pursuant to a third party pricing service methodology approved by the Board of Directors. |
| ● | Non-income producing. |
| ■ | Securities issued within terms of a private placement memorandum, exempt from registration under Rule 144A under the Securities Act of 1933, as amended, and may be sold only to qualified institutional buyers. Unless otherwise indicated, these holdings are determined to be liquid. At June 30, 2013, the aggregate value of these securities was $5, which rounds to zero percent of total net assets. |
| ∞ | Securities exempt from registration under Regulation D of the Securities Act of 1933. The Fund may only be able to resell these securities if they are subsequently registered or if an exemption from registration under the federal and state securities laws is available. Unless otherwise indicated, these holdings are determined to be liquid. At June 30, 2013, the aggregate value and percentage of net assets of these securities rounds to zero. |
| ⌂ | The following securities are considered illiquid. Illiquid securities are often purchased in private placement transactions, are often not registered under the Securities Act of 1933 and may have contractual restrictions on resale. A security may also be considered illiquid if the security lacks a readily available market or if its valuation has not changed for a certain period of time. |
| Period Acquired | Shares/ Par | Security | Cost Basis | |||||||
| 08/2011 | 8,452 | Allstar Co. | $ | 4,994 | ||||||
| 06/2007 | 29,055 | Buck Holdings L.P. | 1,942 | |||||||
| 05/2012 | 218 | Dropbox, Inc. | 1,972 | |||||||
| 10/2005 | 30 | Harvey Weinstein Co. Holdings Class A-1 - Reg D | 27,951 | |||||||
| 07/2008 | 510 | Novavax, Inc. Warrants | – | |||||||
| 05/2013 | 396 | Platform Acquisition Warrants | 4 | |||||||
| 03/2007 | 75 | Solar Cayman Ltd. - 144A | 22 | |||||||
At June 30, 2013, the aggregate value of these securities was $28,341, which represents 0.4% of total net assets.
| ☼ | This security, or a portion of this security, was purchased on a when-issued, delayed-delivery or delayed-draw basis. The cost of these securities was $6,095 at June 30, 2013. |
| ‡ | This security, or a portion of this security, has been segregated to cover funding requirements on investment transactions settling in the future. |
The accompanying notes are an integral part of these financial statements.
| 10 |
Foreign Currency Contracts Outstanding at June 30, 2013
| Currency | Buy / Sell | Delivery Date | Counterparty | Contract Amount | Market Value ╪ | Unrealized Appreciation/ (Depreciation) | ||||||||||||
| AUD | Sell | 07/01/2013 | CBA | $ | 1,083 | $ | 1,062 | $ | 21 | |||||||||
| AUD | Sell | 07/02/2013 | DEUT | 870 | 855 | 15 | ||||||||||||
| AUD | Sell | 07/03/2013 | NAB | 833 | 824 | 9 | ||||||||||||
| CAD | Buy | 07/03/2013 | BCLY | 27 | 27 | – | ||||||||||||
| CHF | Buy | 07/01/2013 | BCLY | 255 | 255 | – | ||||||||||||
| CHF | Buy | 07/02/2013 | UBS | 2 | 2 | – | ||||||||||||
| CHF | Buy | 07/03/2013 | UBS | 219 | 219 | – | ||||||||||||
| CHF | Sell | 07/03/2013 | UBS | 128 | 128 | – | ||||||||||||
| EUR | Buy | 07/01/2013 | DEUT | 292 | 292 | – | ||||||||||||
| EUR | Buy | 07/02/2013 | DEUT | 1,849 | 1,846 | (3 | ) | |||||||||||
| EUR | Buy | 07/03/2013 | HSBC | 175 | 175 | – | ||||||||||||
| EUR | Sell | 07/03/2013 | HSBC | 63 | 63 | – | ||||||||||||
| GBP | Buy | 07/01/2013 | BCLY | 6,142 | 6,096 | (46 | ) | |||||||||||
| GBP | Buy | 07/03/2013 | BCLY | 4,010 | 4,010 | – | ||||||||||||
| GBP | Buy | 07/02/2013 | UBS | 4,593 | 4,581 | (12 | ) | |||||||||||
| GBP | Sell | 07/01/2013 | NAB | 1,518 | 1,507 | 11 | ||||||||||||
| HKD | Buy | 07/02/2013 | DEUT | 7,230 | 7,231 | 1 | ||||||||||||
| HKD | Buy | 07/03/2013 | JPM | 340 | 340 | – | ||||||||||||
| HKD | Sell | 07/02/2013 | DEUT | 509 | 509 | – | ||||||||||||
| HKD | Sell | 07/03/2013 | JPM | 1,912 | 1,912 | – | ||||||||||||
| JPY | Buy | 07/02/2013 | BCLY | 1,028 | 1,017 | (11 | ) | |||||||||||
| JPY | Buy | 12/12/2013 | CBK | 45,614 | 45,506 | (108 | ) | |||||||||||
| JPY | Buy | 12/12/2013 | CSFB | 37,182 | 35,298 | (1,884 | ) | |||||||||||
| JPY | Buy | 07/03/2013 | DEUT | 2,752 | 2,748 | (4 | ) | |||||||||||
| JPY | Buy | 07/01/2013 | JPM | 508 | 499 | (9 | ) | |||||||||||
| JPY | Buy | 12/12/2013 | UBS | 9,336 | 8,781 | (555 | ) | |||||||||||
| JPY | Sell | 07/02/2013 | BCLY | 3,150 | 3,116 | 34 | ||||||||||||
| JPY | Sell | 12/12/2013 | BCLY | 51,668 | 44,952 | 6,716 | ||||||||||||
| JPY | Sell | 12/12/2013 | CSFB | 24,581 | 21,424 | 3,157 | ||||||||||||
| JPY | Sell | 07/03/2013 | DEUT | 7,101 | 7,091 | 10 | ||||||||||||
| JPY | Sell | 12/12/2013 | DEUT | 36,088 | 29,862 | 6,226 | ||||||||||||
| JPY | Sell | 12/12/2013 | GSC | 24,599 | 21,424 | 3,175 | ||||||||||||
| JPY | Sell | 07/01/2013 | JPM | 4,084 | 4,015 | 69 | ||||||||||||
| JPY | Sell | 12/12/2013 | MSC | 36,063 | 29,862 | 6,201 | ||||||||||||
| JPY | Sell | 12/12/2013 | UBS | 9,267 | 8,647 | 620 | ||||||||||||
| MYR | Buy | 07/08/2013 | JPM | 1,145 | 1,166 | 21 | ||||||||||||
| NOK | Buy | 07/02/2013 | JPM | 258 | 257 | (1 | ) | |||||||||||
| NOK | Buy | 07/03/2013 | JPM | 258 | 258 | – | ||||||||||||
| SEK | Buy | 07/03/2013 | JPM | 441 | 441 | – | ||||||||||||
| SEK | Sell | 07/01/2013 | UBS | 578 | 580 | (2 | ) | |||||||||||
| SGD | Sell | 07/02/2013 | BCLY | 519 | 518 | 1 | ||||||||||||
| SGD | Sell | 07/03/2013 | DEUT | 1,538 | 1,535 | 3 | ||||||||||||
| $ | 23,655 | |||||||||||||||||
| ╪ | See Significant Accounting Policies of accompanying Notes to Financial Statements regarding valuation of securities. |
The accompanying notes are an integral part of these financial statements.
| 11 |
| Hartford Capital Appreciation HLS Fund |
Schedule of Investments – (continued)
June 30, 2013 (Unaudited)
(000’s Omitted)
| GLOSSARY: (abbreviations used in preceding Schedule of Investments) | |
| Counterparty Abbreviations: | |
| BCLY | Barclays |
| CBA | Commonwealth Bank of Australia |
| CBK | Citibank NA |
| CSFB | Credit Suisse First Boston Corp. |
| DEUT | Deutsche Bank Securities, Inc. |
| GSC | Goldman Sachs & Co. |
| HSBC | HSBC Bank USA |
| JPM | JP Morgan Chase & Co. |
| MSC | Morgan Stanley |
| NAB | National Australia Bank |
| UBS | UBS AG |
| Currency Abbreviations: | |
| AUD | Australian Dollar |
| CAD | Canadian Dollar |
| CHF | Swiss Franc |
| EUR | EURO |
| GBP | British Pound |
| HKD | Hong Kong Dollar |
| JPY | Japanese Yen |
| MYR | Malaysian Ringgit |
| NOK | Norwegian Krone |
| SEK | Swedish Krona |
| SGD | Singapore Dollar |
| Other Abbreviations: | |
| ADR | American Depositary Receipt |
| FHLB | Federal Home Loan Bank |
| FHLMC | Federal Home Loan Mortgage Corp. |
| FNMA | Federal National Mortgage Association |
| GNMA | Government National Mortgage Association |
| REIT | Real Estate Investment Trust |
The accompanying notes are an integral part of these financial statements.
| 12 |
| Hartford Capital Appreciation HLS Fund |
Investment Valuation Hierarchy Level Summary
June 30, 2013 (Unaudited)
(000’s Omitted)
| Total | Level 1 ♦ | Level 2 ♦ | Level 3 | |||||||||||||
| Assets: | ||||||||||||||||
| Common Stocks | ||||||||||||||||
| Automobiles and Components | $ | 317,413 | $ | 271,979 | $ | 45,434 | $ | – | ||||||||
| Banks | 213,491 | 145,216 | 68,275 | – | ||||||||||||
| Capital Goods | 503,767 | 343,198 | 160,569 | – | ||||||||||||
| Commercial and Professional Services | 61,887 | 54,918 | 6,969 | – | ||||||||||||
| Consumer Durables and Apparel | 100,441 | 99,620 | 821 | – | ||||||||||||
| Consumer Services | 166,918 | 146,336 | 20,582 | – | ||||||||||||
| Diversified Financials | 488,462 | 445,996 | 42,461 | 5 | ||||||||||||
| Energy | 628,744 | 502,435 | 126,309 | – | ||||||||||||
| Food and Staples Retailing | 187,465 | 168,080 | 19,385 | – | ||||||||||||
| Food, Beverage and Tobacco | 268,286 | 161,292 | 106,994 | – | ||||||||||||
| Health Care Equipment and Services | 216,102 | 213,792 | 2,310 | – | ||||||||||||
| Household and Personal Products | 43,978 | 16,342 | 27,636 | – | ||||||||||||
| Insurance | 346,725 | 278,965 | 67,760 | – | ||||||||||||
| Materials | 260,137 | 201,620 | 58,517 | – | ||||||||||||
| Media | 210,845 | 185,928 | 24,917 | – | ||||||||||||
| Pharmaceuticals, Biotechnology and Life Sciences | 774,435 | 686,625 | 87,810 | – | ||||||||||||
| Real Estate | 46,682 | 38,967 | 7,715 | – | ||||||||||||
| Retailing | 564,180 | 500,019 | 37,811 | 26,350 | ||||||||||||
| Semiconductors and Semiconductor Equipment | 348,481 | 336,807 | 11,674 | – | ||||||||||||
| Software and Services | 685,077 | 642,655 | 40,436 | 1,986 | ||||||||||||
| Technology Hardware and Equipment | 383,792 | 369,321 | 14,471 | – | ||||||||||||
| Telecommunication Services | 70,717 | 36,346 | 34,371 | – | ||||||||||||
| Transportation | 398,936 | 397,781 | – | 1,155 | ||||||||||||
| Utilities | 112,499 | 93,591 | 18,908 | – | ||||||||||||
| Total | 7,399,460 | 6,337,829 | 1,032,135 | 29,496 | ||||||||||||
| Preferred Stocks | 16,642 | – | 16,642 | – | ||||||||||||
| Warrants | – | – | – | – | ||||||||||||
| Short-Term Investments | 143,258 | – | 143,258 | – | ||||||||||||
| Total | $ | 7,559,360 | $ | 6,337,829 | $ | 1,192,035 | $ | 29,496 | ||||||||
| Foreign Currency Contracts* | 26,290 | – | 26,290 | – | ||||||||||||
| Total | $ | 26,290 | $ | – | $ | 26,290 | $ | – | ||||||||
| Liabilities: | ||||||||||||||||
| Foreign Currency Contracts* | 2,635 | – | 2,635 | – | ||||||||||||
| Total | $ | 2,635 | $ | – | $ | 2,635 | $ | – | ||||||||
| ♦ | For the six-month period ended June 30, 2013, investments valued at $16,496 were transferred from Level 1 to Level 2, and investments valued at $16,367 were transferred from Level 2 to Level 1. Investments are transferred between Level 1 and Level 2 for a variety of reasons including, but not limited to: |
| 1) | Foreign equities for which a fair value price is more representative of exit value than the local market close (transfer into Level 2). Foreign equities for which the local market close is more representative of exit value (transfer into Level 1). |
| 2) | U.S. Treasury securities that no longer represent the most recent issue (transfer into Level 2). |
| 3) | Equity investments with no observable trading but a bid or close price is used (transfer into Level 2). Equity investments using observable quoted prices in an active market (transfer into Level 1). |
| * | Derivative instruments not reflected in the Schedule of Investments are valued at the unrealized appreciation/depreciation on the investments. |
| Following is a reconciliation of Level 3 assets for which significant unobservable inputs were used to determine fair value: |
| Balance as of December 31, 2012 | Realized Gain (Loss) | Change in Unrealized Appreciation (Depreciation) | Net Amortization | Purchases | Sales | Transfers Into Level 3 | Transfers Out of Level 3 | Balance as of June 30, 2013 | ||||||||||||||||||||||||||||
| Assets: | ||||||||||||||||||||||||||||||||||||
| Common Stocks | $ | 34,559 | $ | 13,204 | $ | (3,006 | )* | $ | — | $ | 1,150 | $ | (16,411 | ) | $ | — | $ | — | $ | 29,496 | ||||||||||||||||
| Total | $ | 34,559 | $ | 13,204 | $ | (3,006 | ) | $ | — | $ | 1,150 | $ | (16,411 | ) | $ | — | $ | — | $ | 29,496 | ||||||||||||||||
| * | Change in unrealized appreciation (depreciation) in the current period relating to assets still held at June 30, 2013 was $(3,006). |
The accompanying notes are an integral part of these financial statements.
| 13 |
| Hartford Capital Appreciation HLS Fund |
Statement of Assets and Liabilities
June 30, 2013 (Unaudited)
(000’s Omitted)
| Assets: | ||||
| Investments in securities, at market value (cost $6,642,992) | $ | 7,559,360 | ||
| Foreign currency on deposit with custodian (cost $458) | 457 | |||
| Unrealized appreciation on foreign currency contracts | 26,290 | |||
| Receivables: | ||||
| Investment securities sold | 110,988 | |||
| Fund shares sold | 1,346 | |||
| Dividends and interest | 8,250 | |||
| Total assets | 7,706,691 | |||
| Liabilities: | ||||
| Unrealized depreciation on foreign currency contracts | 2,635 | |||
| Bank overdraft | 249 | |||
| Payables: | ||||
| Investment securities purchased | 114,292 | |||
| Fund shares redeemed | 150,839 | |||
| Investment management fees | 782 | |||
| Distribution fees | 37 | |||
| Accrued expenses | 348 | |||
| Total liabilities | 269,182 | |||
| Net assets | $ | 7,437,509 | ||
| Summary of Net Assets: | ||||
| Capital stock and paid-in-capital | $ | 6,233,883 | ||
| Undistributed net investment income | 36,855 | |||
| Accumulated net realized gain | 226,867 | |||
| Unrealized appreciation of investments and the translations of assets and liabilities denominated in foreign currency | 939,904 | |||
| Net assets | $ | 7,437,509 | ||
| Shares authorized | 5,000,000 | |||
| Par value | $ | 0.001 | ||
| Class IA: Net asset value per share | $ | 50.71 | ||
| Shares outstanding | 128,752 | |||
| Net assets | $ | 6,528,610 | ||
| Class IB: Net asset value per share | $ | 50.26 | ||
| Shares outstanding | 18,085 | |||
| Net assets | $ | 908,899 |
The accompanying notes are an integral part of these financial statements.
| 14 |
| Hartford Capital Appreciation HLS Fund |
Statement of Operations
For the Six-Month Period Ended June 30, 2013 (Unaudited)
(000’s Omitted)
| Investment Income: | ||||
| Dividends | $ | 70,001 | ||
| Interest | 65 | |||
| Less: Foreign tax withheld | (2,754 | ) | ||
| Total investment income, net | 67,312 | |||
| Expenses: | ||||
| Investment management fees | 25,913 | |||
| Transfer agent fees | 3 | |||
| Distribution fees - Class IB | 1,131 | |||
| Custodian fees | 93 | |||
| Accounting services fees | 708 | |||
| Board of Directors' fees | 100 | |||
| Audit fees | 42 | |||
| Other expenses | 542 | |||
| Total expenses (before fees paid indirectly) | 28,532 | |||
| Commission recapture | (225 | ) | ||
| Custodian fee offset | — | |||
| Total fees paid indirectly | (225 | ) | ||
| Total expenses, net | 28,307 | |||
| Net Investment Income | 39,005 | |||
| Net Realized Gain on Investments, Other Financial Instruments and Foreign Currency Transactions: | ||||
| Net realized gain on investments | 833,709 | |||
| Net realized loss on purchased options | (205 | ) | ||
| Net realized gain on futures | 194 | |||
| Net realized gain on foreign currency contracts | 590 | |||
| Net realized loss on other foreign currency transactions | (828 | ) | ||
| Net Realized Gain on Investments, Other Financial Instruments and Foreign Currency Transactions | 833,460 | |||
| Net Changes in Unrealized Appreciation of Investments and Foreign Currency Transactions: | ||||
| Net unrealized appreciation of investments | 411,363 | |||
| Net unrealized appreciation of foreign currency contracts | 19,938 | |||
| Net unrealized depreciation on translation of other assets and liabilities in foreign currencies | (111 | ) | ||
| Net Changes in Unrealized Appreciation of Investments and Foreign Currency Transactions | 431,190 | |||
| Net Gain on Investments, Other Financial Instruments and Foreign Currency Transactions | 1,264,650 | |||
| Net Increase in Net Assets Resulting from Operations | $ | 1,303,655 |
The accompanying notes are an integral part of these financial statements.
| 15 |
| Hartford Capital Appreciation HLS Fund |
Statement of Changes in Net Assets
(000’s Omitted)
| For the Six-Month Period Ended June 30, 2013 (Unaudited) | For the Year Ended December 31, 2012 | |||||||
| Operations: | ||||||||
| Net investment income | $ | 39,005 | $ | 111,091 | ||||
| Net realized gain on investments, other financial instruments and foreign currency transactions | 833,460 | 526,059 | ||||||
| Net unrealized appreciation of investments and foreign currency transactions | 431,190 | 921,257 | ||||||
| Net Increase in Net Assets Resulting from Operations | 1,303,655 | 1,558,407 | ||||||
| Distributions to Shareholders: | ||||||||
| From net investment income | ||||||||
| Class IA | — | (113,065 | ) | |||||
| Class IB | — | (10,365 | ) | |||||
| Total distributions | — | (123,430 | ) | |||||
| Capital Share Transactions: | ||||||||
| Class IA | ||||||||
| Sold | 89,828 | 251,349 | ||||||
| Issued on reinvestment of distributions | — | 113,065 | ||||||
| Redeemed | (2,475,401 | ) | (2,056,141 | ) | ||||
| Total capital share transactions | (2,385,573 | ) | (1,691,727 | ) | ||||
| Class IB | ||||||||
| Sold | 36,690 | 60,463 | ||||||
| Issued on reinvestment of distributions | — | 10,365 | ||||||
| Redeemed | (142,573 | ) | (460,000 | ) | ||||
| Total capital share transactions | (105,883 | ) | (389,172 | ) | ||||
| Net decrease from capital share transactions | (2,491,456 | ) | (2,080,899 | ) | ||||
| Net Decrease in Net Assets | (1,187,801 | ) | (645,922 | ) | ||||
| Net Assets: | ||||||||
| Beginning of period | 8,625,310 | 9,271,232 | ||||||
| End of period | $ | 7,437,509 | $ | 8,625,310 | ||||
| Undistributed (distribution in excess of) net investment income | $ | 36,855 | $ | (2,150 | ) | |||
| Shares: | ||||||||
| Class IA | ||||||||
| Sold | 1,843 | 6,122 | ||||||
| Issued on reinvestment of distributions | — | 2,632 | ||||||
| Redeemed | (51,792 | ) | (49,673 | ) | ||||
| Total share activity | (49,949 | ) | (40,919 | ) | ||||
| Class IB | ||||||||
| Sold | 764 | 1,472 | ||||||
| Issued on reinvestment of distributions | — | 243 | ||||||
| Redeemed | (2,991 | ) | (11,267 | ) | ||||
| Total share activity | (2,227 | ) | (9,552 | ) | ||||
The accompanying notes are an integral part of these financial statements.
| 16 |
| Hartford Capital Appreciation HLS Fund |
Notes to Financial Statements
June 30, 2013 (Unaudited)
(000’s Omitted)
| 1. | Organization: |
Hartford Capital Appreciation HLS Fund (the “Fund”) serves as an underlying investment option for certain variable annuity and variable life insurance separate accounts of Hartford Life Insurance Company (“HLIC”) and its affiliates and certain qualified retirement plans. The Fund may also serve as an underlying investment option for certain variable annuity and variable life separate accounts of other insurance companies. Owners of variable annuity contracts and policyholders of variable life insurance contracts may choose the funds permitted in the variable insurance contract prospectus. In addition, participants in certain qualified retirement plans may choose the Fund if permitted by their plans.
Hartford Series Fund, Inc. (the “Company”) is an open-end registered management investment company comprised of thirty portfolios. Financial statements for the Fund, a series of the Company, are included in this report.
The Company is organized under the laws of the State of Maryland and is registered with the Securities and Exchange Commission (“SEC”) under the Investment Company Act of 1940, as amended (“1940 Act”). The Fund is a diversified open-end management investment company.
The Fund is divided into Class IA and Class IB shares. Each class is offered at the per share net asset value (“NAV”) without a sales charge and is subject to the same expenses, except that the Class IB shares are subject to distribution and service fees charged pursuant to a Distribution Plan adopted in accordance with Rule 12b-1 under the 1940 Act.
| 2. | Significant Accounting Policies: |
The following is a summary of significant accounting policies of the Fund in the preparation of its financial statements, which are in accordance with the United States Generally Accepted Accounting Principles (“U.S. GAAP”). The preparation of financial statements in accordance with U.S. GAAP may require management to make estimates and assumptions that affect the reported amounts of assets and liabilities and disclosure of contingent assets and liabilities at the date of the financial statements and the reported amounts of increases and decreases in net assets from operations during the reporting period. Actual results could differ from those estimates.
| a) | Determination of Net Asset Value – The NAV of each class of the Fund’s shares is determined as of the close of regular trading (normally 4:00 p.m. Eastern Time) (the “NYSE Close”) on each day that the New York Stock Exchange (the “Exchange”) is open (“Valuation Date”). Information that becomes known to the Fund after the NAV has been calculated on a particular day will not generally be used to retroactively adjust the NAV determined earlier that day. |
| b) | Investment Valuation and Fair Value Measurements – For purposes of calculating the NAV, portfolio investments and other assets held by the Fund's portfolio for which market quotes are readily available are valued at market value. Market value is generally determined on the basis of last reported sales prices or official close price. If no sales are reported, market value is based on quotes obtained from a quotation reporting system, established market makers, or independent pricing services. If market prices are not readily available or are deemed unreliable, the Fund will use the fair value of the investment as determined in good faith under policies and procedures established by and under the supervision of the Company’s Board of Directors. Market quotes are considered not readily available where there is an absence of current or reliable market-based data (e.g., trade information or indicative market quotes), including where events occur after the close of the relevant market, but prior to the NYSE Close that materially affect the values of the Fund’s portfolio investments or assets. In addition, market quotes are considered not readily available when, due to extraordinary circumstances, the exchanges or markets on which the investments trade do not open for trading for the entire day and no other market prices are available. In addition, prices of foreign equities that are principally traded on certain foreign markets may be adjusted daily pursuant to a fair value pricing service approved by the Board of Directors in order to reflect an adjustment for the factors occurring after the close of certain foreign markets but before the NYSE Close. Investments that are primarily traded on foreign markets may trade on days that are not business days of the Fund. The value of the foreign investments in which the Fund invests may change on days when a shareholder will not be able to purchase or redeem shares of the Fund. Fair value pricing is subjective in nature and the use of fair |
| 17 |
| Hartford Capital Appreciation HLS Fund |
| Notes to Financial Statements – (continued) |
| June 30, 2013 (Unaudited) |
| (000’s Omitted) |
value pricing by the Fund may cause the NAV of its shares to differ significantly from the NAV that would have been calculated using market prices at the close of the exchange on which a portfolio investment is primarily traded. There can be no assurance that the Fund could obtain the fair market value assigned to an investment if the Fund were to sell the investment at approximately the time at which the Fund determines its NAV.
Fixed income investments (other than short term obligations) and non-exchange traded derivatives held by the Fund are normally valued on the basis of quotes obtained from brokers and dealers or independent pricing services in accordance with procedures established by the Company’s Board of Directors. Prices obtained from independent pricing services use information provided by market makers or estimates of market values through accepted market modeling and trading and pricing conventions. Inputs to the models may include, but are not limited to, prepayment speeds, pricing spread, yield, trade information, dealer quotes, market color, cash flow models and the bond’s terms and conditions. Generally, the Fund may use fair valuation in regard to fixed income investments when the Fund holds defaulted or distressed investments or investments in a company in which a reorganization is pending. Short-term investments maturing in 60 days or less are generally valued at amortized cost, if their original term to maturity was 60 days or less, or by amortizing their value on the 61st day prior to maturity, if the original term to maturity exceeded 60 days.
Exchange traded options, futures and options on futures are valued at the settlement price determined by the relevant exchange as of the NYSE Close. In the case of OTC options and such instruments that do not trade on an exchange, values may be supplied by a pricing service using a formula or other objective method that may take into consideration the style, direction, expiration, strike price, notional value and volatility or other special adjustments.
Investments valued in currencies other than U.S. dollars are converted to U.S. dollars using exchange rates obtained from independent pricing services for calculation of the NAV. As a result, the NAV of the Fund’s shares may be affected by changes in the value of currencies in relation to the U.S. dollar. The value of investments traded in markets outside the United States or denominated in currencies other than the U.S. dollar may be affected significantly on a day that the NYSE is closed and the market value may change on days when an investor is not able to purchase, redeem or exchange shares of the Fund.
Foreign currency contracts represent agreements to exchange currencies on specific future dates at predetermined rates. Foreign currency contracts are valued using foreign currency exchange rates and forward rates as provided by an independent pricing service on the Valuation Date.
Financial instruments for which prices are not available from an independent pricing service may be valued using market quotations obtained from one or more dealers that make markets in the respective financial instrument in accordance with procedures established by the Company’s Board of Directors.
U.S. GAAP defines fair value as the price that the Fund would receive to sell an asset or pay to transfer a liability in an orderly transaction between market participants. The U.S. GAAP fair value measurement standards require disclosure of a fair value hierarchy for each major category of assets and liabilities. Various inputs are used in determining the fair value of the Fund’s investments. These inputs are summarized into three broad hierarchy levels. This hierarchy is based on whether the valuation inputs are observable or unobservable. These levels are:
| · | Level 1 – Quoted prices in active markets for identical investments. Level 1 may include exchange traded instruments, such as domestic equities, some foreign equities, options, futures, mutual funds, exchange traded funds, rights and warrants. |
| · | Level 2 – Observable inputs other than Level 1 prices, such as quoted prices for similar investments; quoted prices in markets that are not active; or other inputs that are observable or can be corroborated by observable market data. Level 2 may include debt investments that are traded less frequently than exchange traded instruments and which are valued using independent pricing services; foreign equities, which are principally traded on certain foreign markets and are adjusted daily pursuant to a fair value pricing service in order to |
| 18 |
reflect an adjustment for the factors occurring after the close of certain foreign markets but before the NYSE Close; and short-term investments, which are valued at amortized cost.
| · | Level 3 – Significant unobservable inputs that are supported by limited or no market activity. Level 3 may include financial instruments whose values are determined using indicative market quotes or require significant management judgment or estimation. These unobservable valuation inputs may include estimates for current yields, maturity/duration, prepayment speed, and indicative market quotes for comparable investments along with other assumptions relating to credit quality, collateral value, complexity of the investment structure, general market conditions and liquidity. This category may include investments where trading has been halted or there are certain restrictions on trading. While these investments are priced using unobservable inputs, the valuation of these investments reflects the best available data and management believes the prices are a reasonable representation of exit price. |
The Board of Directors of the Company generally reviews and approves the “Procedures for Valuation of Portfolio Securities” on an annual basis. These procedures define how investments are to be valued, including the formation and activities of a Valuation Committee. The Valuation Committee is responsible for determining in good faith the fair value of investments when the value cannot be obtained from primary pricing services or alternative sources or if the valuation of an investment as provided by the primary pricing service or alternative source is believed not to reflect the investment’s fair value as of the Valuation Date. Members of the Valuation Committee include the Fund’s Treasurer or designee, a Vice President of the Fund with legal expertise or designee, and a Vice President of the investment manager or designee. In addition, the Fund’s Chief Compliance Officer shall designate a member of the compliance group to attend Valuation Committee meetings as a non-voting resource, to monitor for and provide guidance with respect to compliance with these procedures. Two members of the Valuation Committee or their designees, representing different departments, shall constitute a quorum for purposes of permitting the Valuation Committee to take action. The Valuation Committee will consider all relevant factors in determining an investment’s fair value, and may seek the advice of the Fund’s sub-adviser, knowledgeable brokers, and legal counsel in making such determination. The Valuation Committee reports to the Audit Committee of the Company’s Board of Directors. The Audit Committee receives quarterly written reports which include details of all fair-valued investments, including the reason for the fair valuation, and an indication, when possible, of the accuracy of the valuation by disclosing the next available reliable public price quotation or the disposition price of such investments (the “look-back” test). The Board of Directors then must consider for ratification all of the fair value determinations made during the previous quarter.
Valuation levels are not necessarily indicative of the risk associated with investing in such investments. Individual investments within any of the above mentioned asset classes may be assigned a different hierarchical level than those presented above, as individual circumstances dictate.
For additional information, refer to the Investment Valuation Hierarchy Level Summary and the Level 3 roll-forward reconciliation, if applicable, which follow the Schedule of Investments.
For purposes of reporting transfers between different hierarchy levels, both transfers in and out of each level, as applicable, are shown as if they occurred at the beginning of the period.
| c) | Investment Transactions and Investment Income – Investment transactions are recorded as of the trade date (the date the order to buy or sell is executed) for financial reporting purposes. Investments purchased or sold on a when-issued or delayed-delivery basis may be settled a month or more after the trade date. Realized gains and losses are determined on the basis of identified cost. |
Dividend income from domestic securities is accrued on the ex-dividend date. In general, dividend income from foreign securities is recorded on the ex-date; however, dividend notifications in certain foreign jurisdictions may not be available in a timely manner and as a result, the Fund will record the dividend as soon as the relevant details (i.e., rate
| 19 |
| Hartford Capital Appreciation HLS Fund |
| Notes to Financial Statements – (continued) |
| June 30, 2013 (Unaudited) |
| (000’s Omitted) |
per share, payment date, shareholders of record, etc.) are publicly available. Interest income, including amortization of premium and accretion of discounts, is accrued on a daily basis.
| d) | Foreign Currency Transactions – Assets and liabilities denominated in currencies other than U.S. dollars are translated into U.S. dollars at the exchange rates in effect on the valuation date. Purchases and sales of investments, income, and expenses are translated into U.S. dollars at the exchange rates on the dates of such transactions. |
The Fund does not isolate that portion of portfolio investment valuation resulting from fluctuations in the foreign currency exchange rates from the fluctuations arising from changes in the market prices of investments held. Exchange rate fluctuations are included with the net realized and unrealized gain or loss on investments in the accompanying financial statements.
Net realized foreign exchange gains or losses arise from sales of foreign currencies and the difference between asset and liability amounts initially stated in foreign currencies and the U.S. dollar value of the amounts actually received or paid. Net unrealized foreign exchange gains or losses arise from changes in the value of other assets and liabilities at the end of the reporting period, resulting from changes in the exchange rates.
| e) | Joint Trading Account – The Fund may invest cash balances into a joint trading account that may be invested in one or more repurchase agreements. |
| f) | Fund Share Valuation and Dividend Distributions to Shareholders – Orders for the Fund’s shares are executed in accordance with the investment instructions of the contract holders and plan participants. The NAV of the Fund’s shares is determined as of the close of business on each business day of the Exchange. The NAV is determined separately for each class of shares of the Fund by dividing the Fund’s net assets attributable to that class by the number of shares of the class outstanding. Each class of shares offered by the Fund has equal rights as to assets and voting privileges (except that shareholders of a class have exclusive voting rights regarding any matter relating solely to that class of shares). Income and non-class specific expenses are allocated daily to each class on the basis of the relative net assets of the class. Realized and unrealized capital gains and losses are allocated daily based on the relative net assets of each class of shares of the Fund. |
Orders for the purchase of the Fund’s shares received prior to the close of the Exchange on any day the Exchange is open for business are priced at the NAV determined as of the close of the Exchange. Orders received after the close of the Exchange, or on a day on which the Exchange and/or the Fund is not open for business, are priced at the next determined NAV.
Dividends are declared pursuant to a policy adopted by the Company’s Board of Directors based upon the investment performance of the Fund. The policy of the Fund is to pay dividends from net investment income and realized capital gains, if any, at least once a year.
Distributions from net investment income, net realized capital gains and capital are determined in accordance with federal income tax regulations, which may differ from U.S. GAAP with respect to character and timing. These differences may include but are not limited to losses deferred due to wash sale adjustments, foreign currency gains and losses, adjustments related to Passive Foreign Investment Companies (“PFICs”), Real Estate Investment Trusts (“REITs”), Regulated Investment Companies (“RICs”), certain derivatives and partnerships. Permanent book and federal income tax basis differences relating to shareholder distributions will result in reclassifications to certain of the Fund’s capital accounts (see Federal Income Taxes: Reclassification of Capital Accounts note).
| 3. | Securities and Other Investments: |
| a) | Repurchase Agreements – A repurchase agreement is an agreement by which a counterparty agrees to sell an investment and agrees to repurchase the investment sold from the buyer at a mutually agreed upon time and price. During the period of the repurchase agreement, the counterparty will deposit cash and or securities in a third party |
| 20 |
custodial account to serve as collateral. At the time the Fund enters into a repurchase agreement, the value of the underlying collateral, including accrued interest, will be equal to or exceed the value of the repurchase agreement. Repurchase agreements expose the Fund to counterparty risk - that is, the risk that the counterparty will not fulfill its obligations. To minimize counterparty risk, the investments that serve to collateralize the repurchase agreement are held by the Fund’s custodian in book entry or physical form in the custodial account of the Fund or in a third party custodial account. Repurchase agreements are valued at cost plus accrued interest, which approximates fair value. Repurchase agreements have master netting agreements which allow the Fund to offset amounts owed to a counterparty with amounts owed by the counterparty, including any collateral. The Fund, as shown on the Schedule of Investments, had outstanding repurchase agreements as of June 30, 2013.
| b) | Illiquid and Restricted Investments – The Fund is permitted to invest up to 15% of its net assets in illiquid investments. Illiquid investments are those that may not be sold or disposed of in the ordinary course of business within seven days, at approximately the price used to determine the Fund’s NAV. The Fund may not be able to sell illiquid investments when its sub-adviser considers it desirable to do so or may have to sell such investments at a price that is lower than the price that could be obtained if the investments were more liquid. A sale of illiquid investments may require more time and may result in higher dealer discounts and other selling expenses than does the sale of those that are liquid. Illiquid investments also may be more difficult to value due to the unavailability of reliable market quotations for such investments, and an investment in them may have an adverse impact on the Fund’s NAV. The Fund may also purchase certain restricted investments that can only be resold to certain qualified investors and may be determined to be liquid pursuant to policies and guidelines established by the Company’s Board of Directors. The Fund, as shown on the Schedule of Investments, had illiquid and/or restricted investments as of June 30, 2013. |
| c) | Investments Purchased on a When-Issued or Delayed-Delivery Basis – Delivery and payment for investments that have been purchased by the Fund on a forward commitment, or when-issued or delayed-delivery basis, take place beyond the customary settlement period. A fund may dispose of or renegotiate a delayed-delivery transaction after it is entered into, and may sell delayed-delivery investments before they are delivered, which may result in a realized gain or loss. During this period, such investments are subject to market fluctuations, and the Fund identifies investments segregated in its records with a value at least equal to the amount of the commitment. The Fund, as shown on the Schedule of Investments, had when-issued or delayed-delivery investments as of June 30, 2013. |
| 4. | Financial Derivative Instruments: |
The following disclosures contain information on how and why the Fund uses derivative instruments, the credit-risk-related contingent features in certain derivative instruments, and how derivative instruments affect the Fund’s financial position and results of operations. The location and fair value amounts of these instruments on the Statement of Assets and Liabilities and the realized gains and losses and changes in unrealized gains and losses on the Statement of Operations, each categorized by type of derivative contract, are included in the following Additional Derivative Instrument Information footnote. The derivative instruments outstanding as of period-end are disclosed in the notes to or within the Schedule of Investments for purchased options, if applicable. The amounts of realized gains and losses and changes in unrealized gains and losses on derivative instruments during the period are disclosed in the Statement of Operations.
| a) | Foreign Currency Contracts – The Fund may enter into foreign currency contracts that obligate the Fund to purchase or sell currencies at specified future dates. Foreign currency contracts are used to hedge the currency exposure associated with some or all of the Fund’s investments and/or as part of an investment strategy. Foreign currency contracts are marked to market daily and the change in value is recorded by the Fund as an unrealized gain or loss. The Fund will record a realized gain or loss when the foreign currency contract is settled. |
Foreign currency contracts involve elements of market risk in excess of the amounts reflected in the Statement of Assets and Liabilities. In addition, risks may arise upon entering into these contracts from the potential inability of the counterparties to meet the terms of the contracts and from unanticipated movements in the value of the foreign
| 21 |
| Hartford Capital Appreciation HLS Fund |
| Notes to Financial Statements – (continued) |
| June 30, 2013 (Unaudited) |
| (000’s Omitted) |
currencies relative to the U.S. dollar. The Fund had outstanding foreign currency contracts as shown on the Schedule of Investments as of June 30, 2013.
| b) | Options Contracts – An option contract is a contract sold by one party to another party that offers the buyer the right, but not the obligation, to buy (call) or sell (put) an investment or other financial asset at an agreed-upon price during a specific period of time or on a specific date. The Fund may write (sell) covered call and put options on futures, swaps (“swaptions”), securities, commodities or currencies. “Covered” means that so long as the Fund is obligated as the writer of an option, it will own either the underlying investments or currency or an option to purchase the same underlying investments or currency having an expiration date of the covered option and an exercise price equal to or less than the exercise price of the covered option, or will pledge cash or other liquid investments having a value equal to or greater than the fluctuating market value of the option investment or currency. Writing put options increases the Fund’s exposure to the underlying instrument. Writing call options decreases the Fund’s exposure to the underlying instrument. Premiums received from writing options that expire are treated as realized gains. Premiums received from writing options that are exercised or closed are added to the proceeds or offset amounts paid on the underlying futures, swap, investment or currency transaction to determine the realized gain or loss. The Fund as a writer of an option has no control over whether the underlying instrument may be sold (call) or purchased (put) and as a result bears the market risk of an unfavorable change in the price of the instrument underlying the written option. There is the risk the Fund may not be able to enter into a closing transaction because of an illiquid market. The Fund may also purchase put and call options. Purchasing call options increases the Fund’s exposure to the underlying instrument. Purchasing put options decreases the Fund’s exposure to the underlying instrument. The Fund pays a premium, which is included on the Fund’s Statement of Assets and Liabilities as an investment and is subsequently marked to market to reflect the current value of the option. Premiums paid for purchasing options that expire are treated as realized losses. Certain options may be purchased with premiums to be determined on a future date. The premiums for these options are based upon implied volatility parameters at specified terms. The risk associated with purchasing put and call options is generally limited to the premium paid. Premiums paid for purchasing options that are exercised or closed are added to the amounts paid or offset against the proceeds on the underlying investment transaction to determine the realized gain or loss. Entering into over-the-counter options also exposes the Fund to counterparty risk. Counterparty risk is the possibility that the counterparty to the agreements may default on its obligation to perform or disagree as to the meaning of the contractual terms in the agreements. As of June 30, 2013 the Fund had no outstanding purchased options or written options contracts. There were no transactions involving written options contracts during the six-month period ended June 30, 2013. |
| c) | Additional Derivative Instrument Information: |
Fair Value of Derivative Instruments on the Statement of Assets and Liabilities as of June 30, 2013:
| Risk Exposure Category | ||||||||||||||||||||||||||||
| Interest Rate Contracts | Foreign Exchange Contracts | Credit Contracts | Equity Contracts | Commodity Contracts | Other Contracts | Total | ||||||||||||||||||||||
| Assets: | ||||||||||||||||||||||||||||
| Unrealized appreciation on foreign currency contracts | $ | — | $ | 26,290 | $ | — | $ | — | $ | — | $ | — | $ | 26,290 | ||||||||||||||
| Total | $ | — | $ | 26,290 | $ | — | $ | — | $ | — | $ | — | $ | 26,290 | ||||||||||||||
| Liabilities: | ||||||||||||||||||||||||||||
| Unrealized depreciation on foreign currency contracts | $ | — | $ | 2,635 | $ | — | $ | — | $ | — | $ | — | $ | 2,635 | ||||||||||||||
| Total | $ | — | $ | 2,635 | $ | — | $ | — | $ | — | $ | — | $ | 2,635 | ||||||||||||||
The volume of derivatives that is presented in the Schedule of Investments is consistent with the derivative activity during the six-month period ended June 30, 2013.
| 22 |
The Effect of Derivative Instruments on the Statement of Operations for the six-month period ended June 30, 2013:
| Risk Exposure Category | ||||||||||||||||||||||||||||
| Interest Rate Contracts | Foreign Exchange Contracts | Credit Contracts | Equity Contracts | Commodity Contracts | Other Contracts | Total | ||||||||||||||||||||||
| Realized Gain (Loss) on Derivatives Recognized as a Result of Operations: | ||||||||||||||||||||||||||||
| Net realized loss on purchased options | $ | — | $ | — | $ | — | $ | (205 | ) | $ | — | $ | — | $ | (205 | ) | ||||||||||||
| Net realized gain on futures | — | — | — | 194 | — | — | 194 | |||||||||||||||||||||
| Net realized gain on foreign currency contracts | — | 590 | — | — | — | — | 590 | |||||||||||||||||||||
| Total | $ | — | $ | 590 | $ | — | $ | (11 | ) | $ | — | $ | — | $ | 579 | |||||||||||||
| Net Change in Unrealized Appreciation (Depreciation) on Derivatives Recognized as a Result of Operations: | ||||||||||||||||||||||||||||
| Net change in unrealized appreciation of foreign currency contracts | $ | — | $ | 19,938 | $ | — | $ | — | $ | — | $ | — | $ | 19,938 | ||||||||||||||
| Total | $ | — | $ | 19,938 | $ | — | $ | — | $ | — | $ | — | $ | 19,938 | ||||||||||||||
| d) | Balance Sheet Offsetting Information: |
Set forth below are tables which disclose both gross information and net information about instruments and transactions eligible for offset in the financial statements, and instruments and transactions that are subject to a master netting agreement, as well as amounts related to margin, reflected as financial collateral (including cash collateral), held at clearing brokers, counterparties, and the Fund’s custodian. The master netting agreements allow the clearing brokers to net any collateral held in or on behalf of the Fund, or liabilities or payment obligations of the clearing brokers to the Fund, against any liabilities or payment obligations of the Fund to the clearing brokers. The Fund is required to deposit financial collateral (including cash collateral) at the Fund’s custodian on behalf of clearing brokers and counterparties to continually meet the original and maintenance requirements established by the clearing brokers and counterparties. Such requirements are specific to the respective clearing broker or counterparty.
Offsetting of Financial Assets and Derivative Assets as of June 30, 2013:
| Description | Gross Amounts of Recognized Assets | Gross Amounts Offset in Statement of Assets and Liabilities | Net Amounts of Assets Presented in Statement of Assets and Liabilities |
Financial Instruments with Allowable Netting | Collateral Received | Net Amount (not less than 0) | ||||||||||||||||||
| Repurchase Agreements | $ | 143,258 | $ | — | $ | 143,258 | $ | — | $ | (145,675 | ) | $ | — | |||||||||||
| Unrealized appreciation on foreign currency contracts | 26,290 | — | 26,290 | (2,527 | ) | — | 23,763 | |||||||||||||||||
| Total subject to a master netting or similar arrangement | $ | 169,548 | $ | — | $ | 169,548 | $ | (2,527 | ) | $ | (145,675 | ) | $ | 23,763 | ||||||||||
Offsetting of Financial Liabilities and Derivative Liabilities as of June 30, 2013:
| Description | Gross Amounts of Recognized Liabilities | Gross Amounts Offset in Statement of Assets and Liabilities | Net Amounts of Assets Presented in Statement of Assets and Liabilities | Financial Instruments with Allowable Netting | Collateral Pledged | Net Amount (not less than 0) | ||||||||||||||||||
| Unrealized depreciation on foreign currency contracts | $ | 2,635 | $ | — | $ | 2,635 | $ | (2,527 | ) | $ | — | $ | 108 | |||||||||||
| Total subject to a master netting or similar arrangement | $ | 2,635 | $ | — | $ | 2,635 | $ | (2,527 | ) | $ | — | $ | 108 | |||||||||||
| 23 |
| Hartford Capital Appreciation HLS Fund |
| Notes to Financial Statements – (continued) |
| June 30, 2013 (Unaudited) |
| (000’s Omitted) |
| 5. | Principal Risks: |
| a) | Credit and Counterparty Risks – Credit risk depends largely on the perceived financial health of bond issuers. In general, the credit rating is inversely related to the credit risk of the issuer. Higher rated bonds generally are deemed to have less credit risk, while lower or unrated bonds are deemed to have higher risk of default. The share price, yield and total return of a fund that holds securities with higher credit risk may be more volatile than those of a fund that holds bonds with lower credit risk. Similar to credit risk, the Fund may be exposed to counterparty risk, or the risk that an institution or other entity with which the Fund has unsettled or open transactions will default. |
| b) | Market Risks – The Fund’s investments expose the Fund to various risks including, but not limited to, interest rate, prepayment, extension, foreign currency, and equity risks. Interest rate risk is the risk that fixed income securities will decline in value because of changes in interest rates. As nominal interest rates rise, the values of certain fixed income securities held by the Fund are likely to decrease. A nominal interest rate can be described as the sum of a real interest rate and an expected inflation rate. Fixed income securities with longer durations tend to be more sensitive to changes in interest rates, usually making them more volatile than securities with shorter durations. Duration is useful primarily as a measure of the sensitivity of a fixed income security’s market price to interest rate (i.e., yield) movements. In addition, securities are subject to extension risk. Rising interest rates may cause prepayments to occur at a slower than expected rate, thereby effectively lengthening the maturity of the security and making the security more sensitive to interest rate changes. Prepayment and extension risk are major risks of mortgage backed securities and certain asset backed securities. For certain asset backed securities, the actual maturity may be less than the stated maturity shown in the Schedule of Investments, if applicable. As a result, the timing of income recognition relating to these securities may vary based upon the actual maturity. If the Fund invests directly in foreign currencies or in securities that trade in, and receive revenues in, foreign currencies, or in derivatives that provide exposure to foreign currencies, it will be subject to the risk that those currencies will decline in value relative to the base currency of the Fund, or, in the case of hedging positions, that the Fund’s base currency will decline in value relative to the currency being hedged. Currency rates in foreign countries may fluctuate significantly over short periods of time for a number of reasons, including changes in interest rates, intervention (or the failure to intervene) by U.S. or foreign governments, central banks or supranational entities, such as the International Monetary Fund, or by the imposition of currency controls or other political developments in the United States or abroad. As a result, the Fund’s investments in foreign currency denominated securities may reduce the returns of the Fund. The market values of equity securities, such as common stocks and preferred stocks, or equity related investments, such as futures and options, may decline due to general market conditions which are not specifically related to a particular company, such as real or perceived adverse economic conditions, changes in the general outlook for corporate earnings, changes in interest or currency rates or adverse investor sentiment generally. The market value of equity securities may also decline due to factors which affect a particular industry or industries, such as labor shortages or increased production costs and competitive conditions within an industry. Equity securities and equity related investments generally have greater market price volatility than fixed income securities. |
| 6. | Federal Income Taxes: |
| a) | Federal Income Taxes – For federal income tax purposes, the Fund intends to continue to qualify as a RIC under Subchapter M of the Internal Revenue Code (“IRC”) by distributing substantially all of its taxable net investment income and net realized capital gains to its shareholders and otherwise complying with the requirements of the IRC. The Fund has distributed substantially all of its income and capital gains in prior years, if applicable, and intends to distribute substantially all of its income and capital gains prior to the next fiscal year-end. Accordingly, no provision for federal income or excise taxes has been made in the accompanying financial statements. Distributions from short-term capital gains are treated as ordinary income distributions for federal income tax purposes. |
| b) | Net Investment Income (Loss), Net Realized Gains (Losses), and Distributions – Net investment income (loss) and net realized gains (losses) may differ for financial statement and tax purposes primarily because of losses deferred due to wash sale adjustments, foreign currency gains and losses, adjustments related to PFICs, REITs, RICs, certain derivatives and partnerships. The character of distributions made during the year from net investment income or net |
| 24 |
realized gains may differ from their ultimate characterization for federal income tax purposes. Also, due to the timing of dividend distributions, the fiscal year in which amounts are distributed may differ from the year that the income or realized gains (losses) were recorded by the Fund.
| c) | Distributions and Components of Distributable Earnings – The tax character of distributions paid by the Fund for the periods indicated is as follows (as adjusted for dividends payable, if applicable): |
| For the Year Ended December 31, 2012 | For the Year Ended December 31, 2011 | |||||||
| Ordinary Income | $ | 123,430 | $ | 78,001 | ||||
As of December 31, 2012, the Fund’s components of distributable earnings (deficit) on a tax basis were as follows:
| Amount | ||||
| Undistributed Ordinary Income | $ | 742 | ||
| Accumulated Capital and Other Losses* | (435,312 | ) | ||
| Unrealized Appreciation † | 334,541 | |||
| Total Accumulated Deficit | $ | (100,029 | ) | |
| * | The Fund has capital loss carryforwards that are identified in the Capital Loss Carryforward note that follows. |
| † | Differences between book-basis and tax-basis unrealized appreciation (depreciation) may be attributable to the losses deferred due to wash sale adjustments, foreign currency gains and losses, adjustments related to PFICs, REITs, RICs, certain derivatives and partnerships. |
| d) | Reclassification of Capital Accounts – The Fund may record reclassifications in its capital accounts. These reclassifications have no impact on the total net assets of the Fund. The reclassifications are a result of permanent differences between U.S. GAAP and tax accounting for such items as foreign currency, PFICs, expiration or utilization of capital loss carryforwards or net operating losses. Adjustments are made to reflect the impact these items have on current and future distributions to shareholders. Therefore, the source of the Fund’s distributions may be shown in the accompanying Statement of Changes in Net Assets as from undistributed net investment income, from accumulated net realized gains on investments or from capital depending on the type of book and tax differences that exist. For the year ended December 31, 2012, the Fund recorded reclassifications to increase (decrease) the accounts listed below: |
| Amount | ||||
| Undistributed Net Investment Income | $ | 4,227 | ||
| Accumulated Net Realized Gain (Loss) | (1,176 | ) | ||
| Capital Stock and Paid-in-Capital | (3,051 | ) | ||
| e) | Capital Loss Carryforward – On December 22, 2010, the Regulated Investment Company Modernization Act of 2010 (the “Act”) was enacted, which made changes to the capital loss carryforward rules. The changes are effective for taxable years beginning after the date of enactment. Under the Act, funds are permitted to carry forward capital losses for an unlimited period. However, any losses incurred during those future taxable years will be required to be utilized prior to the losses incurred in pre-enactment taxable years, which carry an expiration date. As a result of this ordering rule, pre-enactment capital loss carryforwards may be more likely to expire unused. Additionally, post-enactment capital loss carryforwards retain their character as either short-term or long-term capital losses rather than being considered all short-term as permitted under prior regulation. |
| 25 |
| Hartford Capital Appreciation HLS Fund |
| Notes to Financial Statements – (continued) |
| June 30, 2013 (Unaudited) |
| (000’s Omitted) |
At December 31, 2012 (tax-year-end), the Fund had capital loss carryforwards for U.S. federal income tax purposes as follows:
| Year of Expiration | Amount | |||
| 2017 | $ | 435,312 | ||
| Total | $ | 435,312 | ||
During the year ended December 31, 2012, the Fund utilized $431,146 of prior year capital loss carryforwards.
| f) | Accounting for Uncertainty in Income Taxes – The Fund has adopted financial reporting rules that require the Fund to analyze all open tax years, as defined by the statute of limitations, for all major jurisdictions. Generally, tax authorities can examine all tax returns filed for the last three years. The Fund does not have an examination in progress. |
The Fund has reviewed all open tax years and major jurisdictions and concluded that these financial reporting rules had no effect on the Fund’s financial position or results of operations. There is no tax liability resulting from unrecognized tax benefits relating to uncertain income tax positions taken or expected to be taken on the tax return for the fiscal year ended December 31, 2012. The Fund is also not aware of any tax positions for which it is reasonably possible that the total amounts of unrecognized tax benefits will significantly change in the next twelve months.
| 7. | Expenses: |
| a) | Investment Management Agreement – Hartford Funds Management Company, LLC (“HFMC”), an indirect wholly owned subsidiary of The Hartford Financial Services Group, Inc. (“The Hartford”), serves as investment manager to the Fund pursuant to an Investment Management Agreement with the Company. The investment manager has overall investment supervisory responsibility for the Fund. In addition, the investment manager provides administrative personnel, services, equipment, facilities and office space for proper operation of the Fund. The investment manager has contracted with Wellington Management Company, LLP (“Wellington Management”) under a sub-advisory agreement for the provision of day-to-day investment management services to the Fund in accordance with the Fund’s investment objective and policies. The Fund pays a fee to the investment manager, a portion of which may be used to compensate Wellington Management. |
The schedule below reflects the rates of compensation paid to HFMC for investment management services rendered as of June 30, 2013; the rates are accrued daily and paid monthly.
| Average Daily Net Assets | Annual Fee | |||
| On first $250 million | 0.7750% | |||
| On next $250 million | 0.7250% | |||
| On next $500 million | 0.6750% | |||
| On next $1.5 billion | 0.6250% | |||
| On next $2.5 billion | 0.6200% | |||
| On next $5 billion | 0.6150% | |||
| Over $10 billion | 0.6100% | |||
| 26 |
| b) | Accounting Services Agreement – Pursuant to the Fund Accounting Agreement between HFMC and the Company, on behalf of the Fund, HFMC provides accounting services to the Fund and receives monthly compensation based on the Fund’s average daily net assets at the rates set forth below. The Fund’s accounting services fees are accrued daily and paid monthly. |
| Average Daily Net Assets | Annual Fee | |||
| On first $5 billion | 0.018% | |||
| On next $5 billion | 0.016% | |||
| Over $10 billion | 0.014% | |||
| c) | Operating Expenses – Allocable expenses incurred by the Company are allocated to each Fund and allocated to classes within a Fund in proportion to the average daily net assets of the Fund and each class, except where allocation of certain expenses is more fairly made directly to the Fund or to specific classes within a Fund. |
| d) | Fees Paid Indirectly – The Company, on behalf of the Fund, has entered into agreements with State Street Global Markets, LLC and Russell Implementation Services, Inc. to partially recapture non-discounted trade commissions. Such rebates are used to pay a portion of the Fund’s expenses. In addition, the Fund’s custodian banks have agreed to reduce its fees when the Fund maintains cash on deposit in a non-interest-bearing custody account. For the six-month period ended June 30, 2013, these amounts, if any, are included in the Statement of Operations. |
The ratio of expenses to average net assets in the accompanying financial highlights excludes the reduction in expenses related to fees paid indirectly. The annualized expense ratio for the period listed below reflecting the reduction for fees paid indirectly is as follows:
| Annualized Six- Month Period Ended June 30, 2013 | ||||
| Class IA | 0.66 | % | ||
| Class IB | 0.91 | |||
| e) | Distribution Plan for Class IB shares – The Company, on behalf of the Fund, has adopted a Distribution Plan pursuant to Rule 12b-1 of the 1940 Act to compensate the distributor, Hartford Funds Distributors, LLC (“HFD”), (formerly known as Hartford Investment Financial Services, LLC), an indirect wholly owned subsidiary of The Hartford, from assets attributable to the Class IB shares for services rendered and expenses borne in connection with activities primarily intended to result in the sale of the Class IB shares, subject to the review and approval of the Company’s Board of Directors. |
The Distribution Plan provides that the Fund may pay annually up to 0.25% of the average daily net assets of the Fund attributable to its Class IB shares for activities primarily intended to result in the sale of Class IB shares. The Board has the authority to suspend or reduce these payments at any point in time. Under the terms of the Distribution Plan and the principal underwriting agreement, the Fund is authorized to make payments monthly to the distributor that may be used to pay or compensate entities providing distribution and shareholder servicing with respect to the Class IB shares for such entities’ fees or expenses incurred or paid in that regard. These fees are accrued daily and paid monthly.
| f) | Other Related Party Transactions – Certain officers of the Fund are directors and/or officers of the investment manager and/or The Hartford or its subsidiaries. For the six-month period ended June 30, 2013, a portion of the Fund’s Chief Compliance Officer’s salary was paid by all the investment companies in the Hartford fund complex. The portion allocated to the Fund was in the amount of $4. Hartford Administrative Services Company (“HASCO”), an indirect wholly owned subsidiary of The Hartford, provides transfer agent services to the Fund. HASCO was compensated on a per account basis for providing such services. The amount paid to HASCO can be found in the Statement of Operations. These fees are accrued daily and paid monthly. |
| 27 |
| Hartford Capital Appreciation HLS Fund |
| Notes to Financial Statements – (continued) |
| June 30, 2013 (Unaudited) |
| (000’s Omitted) |
| g) | Payment from Affiliate – In July of 2007, The Hartford entered into a settlement with the Attorneys General of the states of New York, Connecticut and Illinois relating to market timing and the company's individual variable annuity contracts in which certain payments would be made directly to the variable annuity contract holders. The distribution plan provided that unclaimed money from the settlement would be distributed to certain HLS Funds that are investment options through a Hartford individual variable annuity contract. The unclaimed money was distributed to the Fund on September 18, 2009. |
The total return in the accompanying financial highlights includes a payment from an affiliate. Had the payment from the affiliate been excluded, the impact and total return for the period listed below would have been as follows:
| For the Year Ended December 31, 2009 | ||||||||
| Class IA | Class IB | |||||||
| Impact from Payment from Affiliate for Attorneys General Settlement | — | % | — | % | ||||
| Total Return Excluding Payment from Affiliate | 45.66 | % | 45.30 | % | ||||
| 8. | Investment Transactions: |
For the six-month period ended June 30, 2013, the Fund's aggregate purchases and sales of investment securities (excluding short-term investments) were as follows:
| Amount | ||||
| Cost of Purchases Excluding U.S. Government Obligations | $ | 3,925,592 | ||
| Sales Proceeds Excluding U.S. Government Obligations | 6,229,508 | |||
| 9. | Line of Credit: |
The Fund is one of several Hartford funds that participate in a $500 million committed revolving line of credit facility. The facility is to be used for temporary or emergency purposes. Under the arrangement, the funds are required to own securities having a market value in excess of 300% of the total bank borrowings. The interest rate on borrowings varies depending on the nature of the loan. The facility also requires a fee to be paid based on the amount of the commitment. This commitment fee is allocated to all of the funds participating in the line of credit based on the average net assets of the funds. During the six-month period ended June 30, 2013, the Fund did not have any borrowings under this facility.
| 10. | Industry Classifications: |
Other than the industry classifications “Other Investment Pools and Funds” and “Exchange Traded Funds,” equity industry classifications used in this report are the Global Industry Classification Standard, which was developed by and is the exclusive property and service mark of MSCI, Inc. and Standard & Poor’s.
| 11. | Indemnifications: |
Under the Company’s organizational documents, the Company shall indemnify its officers and directors to the full extent required or permitted under Maryland General Corporation Law and the federal securities laws. In addition, the Company, on behalf of the Fund, may enter into contracts that contain a variety of indemnifications. The Company’s maximum exposure under these arrangements is unknown. However, as of the date of these financial statements, the Company has not had prior claims or losses pursuant to these contracts and expects the risk of loss to be remote.
| 28 |
| 12. | Pending Legal Proceedings: |
On February 25, 2011, Jennifer L. Kasilag, Louis Mellinger, Judith M. Menendez, Jacqueline M. Robinson, and Linda A. Russell filed a derivative lawsuit against Hartford Investment Financial Services, LLC (“HIFSCO”)(now known as Hartford Funds Distributors, LLC) on behalf of six Hartford retail mutual funds in the United States District Court for the District of New Jersey, alleging that HIFSCO received excessive advisory and distribution fees in violation of its statutory fiduciary duty under Section 36(b) of the 1940 Act when serving as investment manager and principal underwriter, respectively, to the Hartford retail mutual funds. HIFSCO moved to dismiss and, in September 2011, the motion was granted in part and denied in part, with leave to amend the complaint. In November 2011, plaintiffs filed an amended complaint on behalf of certain Hartford retail mutual funds, The Hartford Global Health Fund (now known as The Hartford Healthcare Fund), The Hartford Conservative Allocation Fund, The Hartford Growth Opportunities Fund, The Hartford Inflation Plus Fund, The Hartford Advisers Fund (now known as The Hartford Balanced Fund), and The Hartford Capital Appreciation Fund. Plaintiffs seek to rescind the investment management agreements and distribution plans between HIFSCO and these funds and to recover the total fees charged thereunder or, in the alternative, to recover any improper compensation HIFSCO received, in addition to lost earnings. HIFSCO filed a partial motion to dismiss the amended complaint and, in December 2012, the court dismissed without prejudice the claims regarding distribution fees and denied the motion with respect to the advisory fees claims. HIFSCO disputes the allegations and intends to defend vigorously.
This action concerns the activities of HIFSCO in its capacity as investment manager and principal underwriter to the Hartford retail mutual funds and does not concern HIFSCO’s activities in its capacity as principal underwriter to the HLS funds. For this reason, no accrual for litigation relating to this matter has been recorded in the financial statements of the Fund.
| 29 |
Hartford Capital Appreciation HLS Fund
Financial Highlights
– Selected Per-Share Data (A) –
| Class | Net Asset Value at Beginning of Period | Net Investment Income (Loss) | Net Realized and Unrealized Gain (Loss) on Investments | Total from Investment Operations | Dividends from Net Investment Income | Distributions from Realized Capital Gains | Distributions from Capital | Total Distributions | Net Asset Value at End of Period | |||||||||||||||||||||||||||
| For the Six-Month Period Ended June 30, 2013 (Unaudited) | ||||||||||||||||||||||||||||||||||||
| IA | $ | 43.37 | $ | 0.27 | $ | 7.07 | $ | 7.34 | $ | – | $ | – | $ | – | $ | – | $ | 50.71 | ||||||||||||||||||
| IB | 43.05 | 0.18 | 7.03 | 7.21 | – | – | – | – | 50.26 | |||||||||||||||||||||||||||
| For the Year Ended December 31, 2012 | ||||||||||||||||||||||||||||||||||||
| IA | 37.20 | 0.57 | 6.24 | 6.81 | (0.64 | ) | – | – | (0.64 | ) | 43.37 | |||||||||||||||||||||||||
| IB | 36.90 | 0.52 | 6.14 | 6.66 | (0.51 | ) | – | – | (0.51 | ) | 43.05 | |||||||||||||||||||||||||
| For the Year Ended December 31, 2011 | ||||||||||||||||||||||||||||||||||||
| IA | 42.36 | 0.37 | (5.20 | ) | (4.83 | ) | (0.33 | ) | – | – | (0.33 | ) | 37.20 | |||||||||||||||||||||||
| IB | 42.00 | 0.32 | (5.20 | ) | (4.88 | ) | (0.22 | ) | – | – | (0.22 | ) | 36.90 | |||||||||||||||||||||||
| For the Year Ended December 31, 2010 | ||||||||||||||||||||||||||||||||||||
| IA | 36.63 | 0.30 | 5.72 | 6.02 | (0.26 | ) | – | (0.03 | ) | (0.29 | ) | 42.36 | ||||||||||||||||||||||||
| IB | 36.32 | 0.21 | 5.66 | 5.87 | (0.16 | ) | – | (0.03 | ) | (0.19 | ) | 42.00 | ||||||||||||||||||||||||
| For the Year Ended December 31, 2009 | ||||||||||||||||||||||||||||||||||||
| IA | 25.34 | 0.31 | 11.27 | 11.58 | (0.29 | ) | – | – | (0.29 | ) | 36.63 | |||||||||||||||||||||||||
| IB | 25.14 | 0.25 | 11.14 | 11.39 | (0.21 | ) | – | – | (0.21 | ) | 36.32 | |||||||||||||||||||||||||
| For the Year Ended December 31, 2008 | ||||||||||||||||||||||||||||||||||||
| IA | 52.46 | 0.46 | (22.58 | ) | (22.12 | ) | (0.50 | )(H) | (4.28 | ) | (0.22 | )(H) | (5.00 | ) | 25.34 | |||||||||||||||||||||
| IB | 52.01 | 0.39 | (22.37 | ) | (21.98 | ) | (0.39 | )(H) | (4.28 | ) | (0.22 | )(H) | (4.89 | ) | 25.14 | |||||||||||||||||||||
| (A) | Information presented relates to a share outstanding throughout the indicated period. |
| (B) | The figures do not include sales charges or other fees which may be applied at the variable life insurance, variable annuity or qualified retirement plan product level. Any such additional sales charges or other fees would lower the Fund's performance. |
| (C) | Ratios do not reflect reductions for fees paid indirectly. Please see Fees Paid Indirectly in the Notes to Financial Statements. |
| (D) | Portfolio turnover rate is calculated on the basis of the Fund as a whole without distinguishing between the classes of shares issued. |
| (E) | Not annualized. |
| (F) | Annualized. |
| (G) | Total return without the inclusion of the Payment from (to) Affiliate can be found in Expenses in the accompanying Notes to Financial Statements. |
| (H) | In 2009, the Fund amended its 2008 federal tax return in order to change an election relating to the recognition and classification of certain net realized losses and ordinary income items. As a result, a portion of the distributions that were made by the Fund during 2008 were reclassified as return of capital. This reclassification had no impact on the total net assets or net asset value of the Fund. |
| 30 |
| - Ratios and Supplemental Data - |
| Total Return(B) | Net Assets at End of Period | Ratio of Expenses to Average Net Assets Before Waivers(C) | Ratio of Expenses to Average Net Assets After Waivers(C) | Ratio of Net Investment Income (Loss) to Average Net Assets | Portfolio Turnover Rate(D) | |||||||||||||||||
| 16.91 | %(E) | $ | 6,528,610 | 0.67 | %(F) | 0.67 | %(F) | 0.98 | %(F) | 48 | % | |||||||||||
| 16.75 | (E) | 908,899 | 0.92 | (F) | 0.92 | (F) | 0.73 | (F) | – | |||||||||||||
| 18.34 | 7,750,924 | 0.67 | 0.67 | 1.24 | 142 | |||||||||||||||||
| 18.04 | 874,386 | 0.92 | 0.92 | 0.99 | – | |||||||||||||||||
| (11.41 | ) | 8,169,178 | 0.67 | 0.67 | 0.95 | 113 | ||||||||||||||||
| (11.62 | ) | 1,102,054 | 0.92 | 0.92 | 0.71 | – | ||||||||||||||||
| �� | ||||||||||||||||||||||
| 16.50 | 8,889,906 | 0.67 | 0.67 | 0.77 | 95 | |||||||||||||||||
| 16.21 | 1,522,218 | 0.92 | 0.92 | 0.52 | – | |||||||||||||||||
| 45.67 | (G) | 8,410,214 | 0.68 | 0.68 | 1.03 | 128 | ||||||||||||||||
| 45.30 | (G) | 1,595,912 | 0.93 | 0.93 | 0.79 | – | ||||||||||||||||
| (45.59 | ) | 6,017,984 | 0.67 | 0.67 | 1.12 | 131 | ||||||||||||||||
| (45.73 | ) | 1,295,065 | 0.92 | 0.92 | 0.87 | – | ||||||||||||||||
| 31 |
Hartford Capital Appreciation HLS Fund
| Directors and Officers (Unaudited) |
The Board of Directors of the Company appoints officers who are responsible for the day-to-day operations of the Fund and who execute policies formulated by the Directors. Each director serves until his or her death, resignation, or retirement or until the next annual meeting of shareholders is held or until his or her successor is elected and qualifies.
Directors and officers who are employed by or who have a financial interest in The Hartford are considered “interested” persons of the Fund pursuant to the 1940 Act. Each officer and two of the Company’s directors, as noted in the chart below, are “interested” persons of the Fund. Each director serves as a director for The Hartford Mutual Funds, Inc., The Hartford Mutual Funds II, Inc., Hartford Series Fund, Inc., Hartford HLS Series Fund II, Inc., and as a trustee for The Hartford Alternative Strategies Fund, which, as of June 30, 2013, collectively consist of 90 funds. Correspondence may be sent to directors and officers c/o Hartford Mutual Funds, P.O. Box 2999, Hartford, Connecticut 06104-2999, except that correspondence to Mr. Annoni, Mr. Dressen, Ms. Fagely and Ms. Quade may be sent to 500 Bielenberg Drive, Woodbury, Minnesota 55125 and correspondence to Mr. Davey and Mr. Melcher may be sent to 5 Radnor Corporate Center, Suite 300, 100 Matsonford Road, Radnor, Pennsylvania 19087.
The table below sets forth, for each director and officer, his or her name, year of birth, current position with the Company and date first elected or appointed to Hartford Series Fund, Inc. (“HSF”), and Hartford HLS Series Fund II, Inc. (“HSF2”), principal occupation, and, for directors, other directorships held. The Fund’s statement of additional information contains further information on the directors and is available free of charge by calling 1-800-862-6668 or writing to Hartford HLS Funds, c/o Hartford Life Insurance Company, Hartford Life and Annuity Insurance Company, P.O. Box 14293, Lexington, KY 40512-4293.
Information on the aggregate remuneration paid to the directors of the Company can be found in the Statement of Operations herein. The Fund pays to The Hartford a portion of the Chief Compliance Officer’s compensation, but does not pay salaries or compensation to any of their other officers or directors who are employed by The Hartford.
Non-Interested Directors
Lynn S. Birdsong (1946) Director since 2003, Co-Chairman of the Investment Committee
Mr. Birdsong is a private investor. Mr. Birdsong currently serves as a Director of the Sovereign High Yield Investment Company (April 2010 to current). Mr. Birdsong currently serves as an Independent Director of Nomura Partners Funds, Inc. (formerly, The Japan Fund) (March 2003 to current). From 1979 to 2002, Mr. Birdsong was a managing director of Zurich Scudder Investments, an investment management firm. During his employment with Scudder, Mr. Birdsong was an Interested Director of The Japan Fund. Since 1981, Mr. Birdsong has been a partner in Birdsong Company, an advertising specialty firm.
Robert M. Gavin, Jr. (1940) Director since 2002 (HSF) and 1986 (HSF2), Chairman of the Board since 2004
Dr. Gavin is an educational consultant. Prior to September 1, 2001, he was President of Cranbrook Education Community and prior to July 1996, he was President of Macalester College, St. Paul, Minnesota.
Duane E. Hill (1945) Director since 2001 (HSF) and 2002 (HSF2), Chairman of the Nominating Committee
Mr. Hill is Partner of TSG Ventures L.P., a private equity investment company. Mr. Hill is a former partner of TSG Capital Group, a private equity investment firm that served as sponsor and lead investor in leveraged buyouts of middle market companies.
Sandra S. Jaffee (1941) Director since 2005
Ms. Jaffee is the founder and Chief Executive Officer of a private company, Homeworks Concierge, LLC, which provides residential property management services in Westchester County, New York (January 2012 to present). Ms. Jaffee served as Chairman (2008 to 2009) and Chief Executive Officer of Fortent (formerly Searchspace Group), a leading provider of compliance/regulatory technology to financial institutions from August 2005 to August 2009. Ms. Jaffee currently serves as a member of the Board of Directors of Broadridge Financial Solutions as well as a Trustee of Muhlenberg College.
William P. Johnston (1944) Director since 2005, Chairman of the Compliance Committee
In February 2008, Mr. Johnston was elected to the Board of Directors of HCR-ManorCare, Inc. In August 2007, Mr. Johnston was elected to the Board of Directors of LifeCare Holdings, Inc. In July 2006, Mr. Johnston was elected to the Board of Directors of MultiPlan, Inc. and served as a director (July 2006 to August 2010). In June 2006, Mr. Johnston was appointed as Senior Advisor to The Carlyle Group, a global private equity and alternative asset investment firm. In May 2006, Mr. Johnston was elected to the Supervisory Board of Fresenius Medical Care AG & Co. KGaA, after its acquisition of Renal Care Group, Inc. in March 2006.
| 32 |
Phillip O. Peterson (1944) Director since 2002 (HSF) and 2000 (HSF2), Chairman of the Audit Committee
Mr. Peterson is a mutual fund industry consultant. He was a partner of KPMG LLP (an accounting firm) until July 1999. Mr. Peterson joined William Blair Funds in February 2007 as a member of the Board of Trustees. Mr. Peterson also joined the Board of Trustees of Symetra Variable Mutual Funds Trust as a trustee in February 2012.
Lemma W. Senbet (1946) Director since 2005
Dr. Senbet is the William E. Mayer Chair Professor of Finance and Director, Center for Financial Policy, at the University of Maryland, Robert H. Smith School of Business. He was chair of the Finance Department from 1998 to 2006. Previously he was a chaired professor of finance at the University of Wisconsin-Madison. Also, he was director of the Fortis Funds from March 2000 to July 2002. Dr. Senbet served the finance profession in various capacities, including as director of the American Finance Association and President of the Western Finance Association. In 2006, Dr. Senbet was inducted Fellow of Financial Management Association International for his career-long distinguished scholarship and professional service.
Interested Directors and Officers
James E. Davey (1964) Director since 2012, President and Chief Executive Officer since 2010
Mr. Davey serves as Executive Vice President of Hartford Life Insurance Company (“HLIC”) and The Hartford Financial Services Group, Inc. Additionally, Mr. Davey serves as Chairman of the Board and Manager of Hartford Funds Distributors, LLC (“HFD”) and Hartford Administrative Services Company (“HASCO”). Mr. Davey also serves as Manager, President and Chairman of the Board for Hartford Funds Management Company, LLC (“HFMC”). Mr. Davey joined The Hartford in 2002.
Lowndes A. Smith (1939) Director since 1996 (HSF) and 2002 (HSF2), Co-Chairman of the Investment Committee
Mr. Smith served as Vice Chairman of The Hartford from February 1997 to January 2002, as President and Chief Executive Officer of Hartford Life, Inc. from February 1997 to January 2002, and as President and Chief Operating Officer of The Hartford Life Insurance Companies from January 1989 to January 2002. Mr. Smith serves as a Director of White Mountains Insurance Group, Ltd., One Beacon Insurance and Symetra Financial and as Managing Director of Whittington Gray Associates.
Other Officers
Mark A. Annoni (1964) Vice President, Controller and Treasurer since 2012
Mr. Annoni serves as the Assistant Vice President of HLIC (February 2004 to present). Mr. Annoni joined The Hartford in April 2001 as part of The Hartford’s acquisition of Fortis Financial Group (“Fortis”). Prior to joining The Hartford, Mr. Annoni served as Manager of Mutual Fund Accounting at Fortis (July 1997 to April 2001).
Michael R. Dressen (1963) AML Compliance Officer since 2011
Mr. Dressen currently serves as Assistant Vice President of HLIC. He also serves as Chief Compliance Officer and AML Compliance Officer of HASCO and as AML Officer of HFD. Mr. Dressen joined The Hartford in 2005 from State Farm Insurance Companies where he held various positions related to mutual funds, variable products, and property casualty insurance.
Tamara L. Fagely (1958) Vice President since 2002 (HSF) and 1993 (HSF2)
Currently, Ms. Fagely is President and a Director of HASCO, Chief Administrative Officer and Manager of HFMC and a Vice President of HLIC. Ms. Fagely served as a Vice President of HASCO (1998-2013) and Chief Financial Officer of HASCO (2006-2013). She served as Assistant Vice President of HLIC from December 2001 through March 2005. In addition, Ms. Fagely is Manager and Chief Operating Officer of HFD.
Edward P. Macdonald (1967) Vice President, Secretary and Chief Legal Officer since 2005
Mr. Macdonald serves as Vice President of HLIC and Vice President, Chief Legal Officer and Secretary of HFD and HASCO. Mr. Macdonald also serves as Manager, Vice President, Chief Legal Officer and Secretary of HFMC. Mr. Macdonald joined The Hartford in 2005.
Joseph G. Melcher (1973) Vice President and Chief Compliance Officer since 2013(1)
Mr. Melcher currently serves as Vice President of HFMC and HFD. Mr. Melcher joined The Hartford in 2012 from Touchstone Investments, a member of the Western & Southern Financial Group, where he held the position of Vice President and Chief Compliance Officer from 2010 through 2012 and Assistant Vice President, Compliance from 2005 to 2010.
(1) Mr. Melcher was named Vice President and Chief Compliance Officer of HSF and HSF2 on February 6, 2013. Prior to February 6, 2013, Colleen Pernerewski served as Chief Compliance Officer of HSF and HSF2.
| 33 |
Hartford Capital Appreciation HLS Fund
Directors and Officers (Unaudited) – (continued)
Vernon J. Meyer (1964) Vice President since 2006
Mr. Meyer serves as Senior Vice President of HLIC. He also serves as Senior Vice President of HFMC and HFD. Mr. Meyer joined The Hartford in 2004.
Laura S. Quade (1969) Vice President since 2012
Ms. Quade currently serves as Vice President of HASCO and is a Director of Mutual Fund Service Operations. She also serves as Director, Enterprise Operations of HFD and HLIC. Ms. Quade joined The Hartford in 2001 as part of The Hartford’s acquisition of Fortis.
Elizabeth L. Schroeder (1966) Vice President since 2010(2)
Ms. Schroeder currently serves as Assistant Vice President of HLIC. Ms. Schroeder joined HLIC in 1991. She is also an Assistant Vice President of HFMC and HASCO.
(2) Ms. Schroeder served as Vice President of HSF and HSF2 until August 7, 2013.
Martin Swanson (1962) Vice President since 2010
Mr. Swanson is a Vice President of HLIC. Mr. Swanson also serves as Chief Marketing Officer for HFD. Prior to joining HLIC in 1998, Mr. Swanson was a Vice President at PaineWebber, Inc.
HOW TO OBTAIN A COPY OF THE FUND’S PROXY VOTING POLICIES AND VOTING RECORDS (UNAUDITED)
A description of the policies and procedures that the Fund uses to determine how to vote proxies relating to portfolio securities and information about how the Fund voted proxies relating to portfolio securities during the most recent twelve-month period ended June 30 are available (1) without charge, upon request, by calling 800-862-6668 and (2) on the SEC’s website at http://www.sec.gov.
QUARTERLY PORTFOLIO HOLDINGS INFORMATION (UNAUDITED)
The Fund files a complete schedule of portfolio holdings with the SEC for the first and third quarters of each fiscal year on Form N-Q. The Fund’s Forms are available (1) without charge, upon request, by calling 800-862-6668 and (2) on the SEC’s website at http://www.sec.gov. The Form N-Q may be reviewed and copied at the SEC’s Public Reference Room in Washington, DC. Information on the operation of the Public Reference Room may be obtained by calling 1-800-SEC-0330.
| 34 |
Hartford Capital Appreciation HLS Fund
Expense Example (Unaudited)
Your Fund's Expenses
As a shareholder of the Fund, you incur two types of costs: (1) transaction costs and (2) ongoing costs including investment management fees, distribution fees, if any, and other fund expenses. This example is intended to help you understand your ongoing costs (in dollars) of investing in the Fund and to compare these costs with the ongoing costs of investing in other mutual funds. The example is based on an investment of $1,000 invested at the beginning of the period and held for the period of December 31, 2012 through June 30, 2013.
Actual Expenses
The first set of columns of the table below provides information about actual account values and actual expenses. You may use the information in this column, together with the amount you invested, to estimate the expenses that you paid over the period. Simply divide your account value by $1,000 (for example, an $8,600 account value divided by $1,000 = 8.6), then multiply the result by the number in the line under the heading entitled “Expenses Paid During Period” to estimate the expenses you paid on your account during this period.
Hypothetical Example for Comparison Purposes
The second set of columns of the table below provides information about hypothetical account values and hypothetical expenses based on the Fund’s actual expense ratio and an assumed rate of return of 5% per year before expenses, which is not the Fund’s actual return. The hypothetical account values and expenses may not be used to estimate the actual ending account balance or expenses you paid for the period. You may use this information to compare the ongoing costs of investing in the Fund and other funds. To do so, compare this 5% hypothetical example with the 5% hypothetical examples that appear in the shareholder reports of the other funds.
Please note that the expenses shown in the table are meant to highlight your ongoing costs only and do not reflect any transactional costs, such as sales charges (loads) and CDSC. Therefore, the second set of columns of the table is useful in comparing ongoing costs only, and will not help you determine the relative total costs of owning different funds. In addition, if these transactional costs were included, your costs would be higher. Expenses are equal to the Fund's annualized expense ratios multiplied by average account value over the period, multiplied by 181/365 (to reflect the one-half year period).
| Actual return | Hypothetical (5% return before expenses) | |||||||||||||||||||||||||||||||||
| Beginning Account Value December 31, 2012 | Ending Account Value June 30, 2013 | Expenses paid during the period December 31, 2012 through June 30, 2013 | Beginning Account Value December 31, 2012 | Ending Account Value June 30, 2013 | Expenses paid during the period December 31, 2012 through June 30, 2013 | Annualized expense ratio | Days in the current 1/2 year | Days in the full year | ||||||||||||||||||||||||||
| Class IA | $ | 1,000.00 | $ | 1,169.10 | $ | 3.60 | $ | 1,000.00 | $ | 1,021.47 | $ | 3.36 | 0.67 | % | 181 | 365 | ||||||||||||||||||
| Class IB | $ | 1,000.00 | $ | 1,167.50 | $ | 4.94 | $ | 1,000.00 | $ | 1,020.23 | $ | 4.61 | 0.92 | % | 181 | 365 | ||||||||||||||||||
| 35 |
Hartford Capital Appreciation HLS Fund
Principal Risks (Unaudited)
The principal risks of investing in the Fund are described below.
Market, Selection, and Strategy Risk: The Fund’s share price may fluctuate due to market risk and/or security selections that may underperform the market or relevant benchmarks. If the sub-adviser’s investment strategy does not perform as expected, the Fund could underperform its peers or lose money. There is no guarantee the Fund will achieve its stated objectives.
Small/Mid-Cap Stock Risk: Small- and mid-cap stocks are generally more volatile and risky and may be less liquid than large-cap stocks because they may have limited operating histories, narrow product lines, and focus on niche markets.
Foreign Investment & Emerging Markets Risk: Foreign investments can be riskier than U.S. investments. Potential risks include currency risk that may result from unfavorable exchange rates, liquidity risk if decreased demand for a security makes it difficult to sell at the desired price, and risks that stem from substantially lower trading volume on foreign markets. These risks are generally greater for investments in emerging markets, which are also subject to greater price volatility, and custodial and regulatory risks.
Asset-Allocation Strategy Risk: The portfolio managers’ asset allocation strategy may not always work as intended, and asset allocation does not guarantee better performance or reduce the risk of investment loss.
Active Trading Risk: Actively trading investments may result in higher costs (thus affecting performance).
| 36 |
HARTFORD HLS FUNDS
c/o The Hartford Wealth Management - Global Annuities
P.O. Box 14293
Lexington, KY 40512-4293
HARTFORDFUNDS
hartfordfunds.com
Hartford Series Fund, Inc. is underwritten and distributed by Hartford Funds Distributors, LLC.
Hartford Series Fund, Inc. inception dates range from 1977 to date. Hartford Series Fund, Inc. is not a subsidiary of The Hartford Financial Services Group, Inc. ("The Hartford") but is underwritten, distributed by and advised by subsidiaries of The Hartford. Investments in Hartford Series Fund, Inc. are not guaranteed by The Hartford or any other entity.
You should carefully consider investment objectives, risks, and charges and expenses of Hartford HLS Funds before investing. This and other information can be found in the Fund’s prospectus or summary prospectus, which can be obtained by calling 800-862-6668. Please read them carefully before you invest or send money.
HLSSAR-CA13 8-13 114609 Printed in U.S.A ©2013 The Hartford, Hartford, CT 06115
HARTFORDFUNDS
| HARTFORD DISCIPLINED EQUITY
HLS FUND
2013 Semi Annual Report
|
A MESSAGE FROM THE PRESIDENT
Dear Fellow Shareholders:
I want to take this opportunity to say thank you for investing in the Hartford HLS Funds.
Market Review
During the first half of the year, stocks rose steadily. U.S. equities (as represented by the S&P 500 Index1) posted a strong gain of 10.61% during the first quarter, on their way to an all-time high. During the second quarter, investors persevered through volatility surrounding rumors of the rollback of the U.S. Federal Reserve’s quantitative easing (QE) program later this year, and the S&P 500 Index rose 2.91%. That brought the market’s rise to 13.82% for the first half of 2013. The rumors about QE’s end sent bond yields and mortgage rates upward, but that wasn’t enough to dissuade investors from pushing equities into positive territory.
Because of QE, some have expressed concerns regarding the recent market rally. But a more careful examination of economic data reveals a strong foundation. Consumer balance sheets have improved since the financial crisis, with consumer debt as a percentage of income falling steadily. Housing continued its dogged recovery, fueled by population growth and pent-up demand. In fact, it’s substantive economic improvements that have moved Federal Reserve Chairman Ben Bernanke to consider removing the “training wheels” of QE, which we think should be viewed as a vote of confidence in the U.S. economy going forward.
As the U.S. outlook continues to improve, concerns do remain in the global economy. Emerging markets have lagged due to social unrest and rising inflation. Slowing growth in China is clouding global growth forecasts, but it’s important to remember that China still boasts 7.5% annual GDP growth.
It’s important to stay abreast of domestic and international economic developments while balancing your individual investment goals. Meeting with your financial advisor on a regular basis to examine your current investment strategy can help you determine whether you are on the right track:
| • | Is your portfolio fully diversified with an appropriate mix of stocks and bonds? |
| • | Is your fixed-income portfolio positioned to take advantage of opportunities across the credit spectrum and fulfill your income needs? |
| • | Is your portfolio still in line with your risk tolerance and investment time horizon? |
Your financial professional can help you choose options within our fund family to navigate today’s markets with confidence.
Thank you again for investing with the Hartford HLS Funds.
James Davey
President
Hartford HLS Funds
1 The S&P 500 Index is a market capitalization-weighted price index composed of 500 widely held common stocks.
Hartford Disciplined Equity HLS Fund
Table of Contents
This report is prepared for the general information of contract owners and qualified retirement plan participants. It is not an offer of contracts or of qualified retirement plans. It should not be used in connection with any offer, except in conjunction with the appropriate product prospectus which contains all pertinent information including the applicable sales, administrative and other charges.
The views expressed in the Fund’s Manager Discussion under ‘‘Why did the Fund perform this way?’’ and ‘‘What is the outlook?’’ are views of the Fund’s sub-adviser and portfolio management team through the end of the period and are subject to change based on market and other conditions. The Fund’s Manager Discussion is for informational purposes only and does not represent an offer, recommendation or solicitation to buy, hold or sell any security. The specific securities identified and described, if any, do not represent all of the securities purchased or sold and you should not assume that investments in the securities identified and discussed will be profitable.
| Hartford Disciplined Equity HLS Fund inception 05/29/1998 |
| (sub-advised by Wellington Management Company, LLP) |
| Investment objective – Seeks growth of capital. |
Performance Overview 6/30/03 - 6/30/13
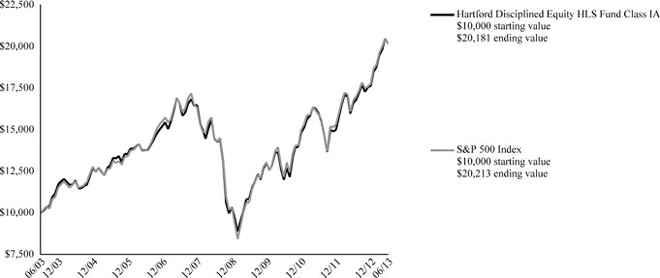
The chart above represents the hypothetical growth of a $10,000 investment in Class IA. Growth results in classes other than Class IA will vary from what is seen above due to differences in the expenses charged to those share classes.
| Average Annual Total Returns (as of 6/30/13) |
| 6 Month† | 1 Year | 5 Years | 10 Years | |||||
| Disciplined Equity IA | 14.45% | 21.58% | 6.89% | 7.27% | ||||
| Disciplined Equity IB | 14.31% | 21.28% | 6.62% | 7.01% | ||||
| S&P 500 Index | 13.82% | 20.58% | 7.00% | 7.29% |
| † | Not Annualized |
PERFORMANCE DATA QUOTED REPRESENTS PAST PERFORMANCE AND DOES NOT GUARANTEE FUTURE RESULTS. The investment return and principal value of the investment will fluctuate so that investors’ shares, when redeemed, may be worth more or less than their original cost. Current performance may be lower or higher than the performance data quoted. To obtain performance data current to the most recent month-end, please visit our website www.hartfordfunds.com.
Total returns presented above were calculated using the Fund’s net asset value available to shareholders for sale or redemption of Fund shares on June 30, 2013, which may exclude investment transactions as of this date. All share class returns assume the reinvestment of all distributions at net asset value and the deduction of all fund expenses.
S&P 500 Index is a market capitalization-weighted price index composed of 500 widely held common stocks.
You cannot invest directly in an index.
As of the Fund’s current prospectus dated May 1, 2013, the total annual operating expense ratios for Class IA and Class IB shares were 0.75% and 1.00%, respectively. Actual expenses may be higher. Please see the accompanying Financial Highlights for expense ratios for the six-month period ended June 30, 2013.
The chart and table do not reflect the deductions of taxes, sales charges or other fees which may be applied at the variable life insurance, variable annuity or qualified retirement plan product level. Any such additional sales charges or other fees or expenses would lower the contract’s or plan’s performance.
All investments are subject to risk including the possible loss of principal. For a discussion of the Fund’s risks, please see the Principal Risks section. For more detailed information on the risks associated with an investment in the Fund, please see the prospectus.
| 2 |
| Hartford Disciplined Equity HLS Fund |
| Manager Discussion |
| June 30, 2013 (Unaudited) |
| Portfolio Manager |
| Mammen Chally, CFA |
| Vice President and Equity Portfolio Manager |
How did the Fund perform?
The Class IA shares of the Hartford Disciplined Equity HLS Fund returned 14.45% for the six-month period ended June 30, 2013, outperforming its benchmark, the S&P 500 Index, which returned 13.82% for the same period. The Fund also outperformed the 13.60% average return of the Variable Products-Underlying Funds Lipper Large-Cap Core Funds peer group, a group of funds with investment strategies similar to those of the Fund.
Why did the Fund perform this way?
U.S. equities (+13.8%), as measured by the S&P 500 Index, gained during the six-month period, reaching an all-time high in May. The rally began on the first trading day of the year after a last-minute compromise by the U.S. Congress averted the fiscal cliff. Optimism surrounding the fiscal reprieve was furthered during the first half of the period by better-than-expected corporate earnings, a robust housing market, and a gradually improving employment picture. In the second half of the period, a market rally throughout April and the first part of May paused following comments by Federal Reserve (Fed) Chairman Ben Bernanke that suggested the Fed might begin to slow quantitative easing (QE) sooner than investors anticipated. The Federal Open Market Committee’s June statement emphasized that the tapering schedule would depend on improving economic indicators. A strong housing market, positive consumer confidence trends, and a steadily healing labor market lent support to the thesis that underlying fundamentals were solid. Following an initially dramatic negative response to the Fed’s announcement and an increase in lending rates in China, U.S. markets moved higher into the end of the period.
Overall equity market performance was positive for the period across all market capitalizations: large cap equities (+14%), mid caps (+15%), and small caps (+16%) all rose as represented by the S&P 500, S&P Midcap 400, and Russell 2000 Indices, respectively. During the six-month period all ten sectors within the S&P 500 Index posted positive returns, led by Health Care (+20%), Consumer Discretionary (+20%), and Financials (+20%).
The Fund outperformed its benchmark due to positive stock selection, which was strongest in Industrials, Financials, and Consumer Staples. This was partially offset by weaker security selection in Information Technology, Materials, and Consumer Discretionary. Allocation among sectors contributed to relative performance.
The largest contributors to benchmark-relative performance were Apple (Information Technology), Actavis (Health Care), and Towers Watson (Industrials). Shares of Apple, a designer, manufacturer, and retailer of a range of personal electronic products, declined on weaker guidance and slowing growth. We were underweight the shares, which positively contributed to relative performance. Shares of a specialty pharmaceutical company Actavis rose after Valeant Pharmaceuticals initiated merger discussions with the company. Management rejected the offer but completed a merger agreement with Warner-Chilcott. Shares of Towers Watson, a global professional services company, outperformed after the firm posted better-than-expected quarterly earnings and management offered solid guidance for the 2013 fiscal year. Top contributors to absolute performance (i.e. total return) also included Gilead Sciences (Health Care) and Wells Fargo (Financials).
The largest detractors from benchmark-relative performance were Microsoft (Information Technology), Teradata (Information Technology), and Oracle (Information Technology). Shares of Microsoft, a U.S.-based technology company, moved higher after the company posted better-than-expected quarterly earnings. The enterprise business continued to deliver strong results, more than offsetting the sluggish consumer business. We were underweight the shares, which detracted from relative performance. Shares of Teradata, a U.S.-based provider of analytic data and business applications, fell amid investors’ fears of increasing competition and declining pricing power. Oracle is a global provider of enterprise database software, hardware and services. A return to growth in their hardware division following the acquisition of Sun Microsystems is taking longer than originally expected. This delay, combined with weakness in public sector spending on Information Technology, has led to poor stock performance. Apple (Information Technology) and Newmont Mining (Materials) also detracted on an absolute basis.
What is the outlook?
We believe the global economy is gradually normalizing. While there are fears among market participants about the Fed reducing its quantitative easing measures, we are not overly concerned as we view this action as a shift from a “surge” in liquidity to becoming a source of steady liquidity. We believe the U.S. economy remains poised for a continued modest
| 3 |
| Hartford Disciplined Equity HLS Fund |
| Manager Discussion – (continued) |
| June 30, 2013 (Unaudited) |
recovery as consumer spending is still buoyed by household balance sheet and steady job gains. However, we believe the U.S. is still not creating jobs fast enough and a large part of the reduction in the unemployment rate is due to people dropping out of the labor force. Housing remains in a solid uptrend and we believe the shortage of inventory should boost prices further in the near term.
We believe Europe is gradually healing with growth likely to remain subpar but with the downside risks abating. In China, the transition from an infrastructure, heavy investment spending economy to a more diversified economy has been uneven, but we believe their policy makers have the tools to manage the transition. In our view, China should maintain above average growth. In Japan, we believe that the liquidity boost from accommodative monetary policy and growth recovery should add to the overall world economic recovery.
We seek to identify investment opportunities that have the following characteristics on a relative basis: incrementally improving quality, improving fundamentals, and attractive valuation. Disciplined portfolio construction allows us to assess risk, weight individual positions accordingly, and in the process build a portfolio that focuses largely on stock selection as a way to seek to generate benchmark relative outperformance. We seek to avoid surprises from unintended, uncompensated “risks”.
At the end of the period, our largest overweights (i.e. the Fund’s sector position was greater than the benchmark position) were to Health Care, Industrials, and Consumer Staples, while we remained underweight Financials, Energy, and Telecommunication Services, relative to the benchmark.
Diversification by Industry
as of June 30, 2013
| Industry (Sector) | Percentage of Net Assets | |||
| Banks (Financials) | 4.1 | % | ||
| Capital Goods (Industrials) | 7.5 | |||
| Commercial and Professional Services (Industrials) | 2.9 | |||
| Consumer Durables and Apparel (Consumer Discretionary) | 1.3 | |||
| Consumer Services (Consumer Discretionary) | 1.6 | |||
| Diversified Financials (Financials) | 6.2 | |||
| Energy (Energy) | 8.8 | |||
| Food and Staples Retailing (Consumer Staples) | 4.0 | |||
| Food, Beverage and Tobacco (Consumer Staples) | 6.4 | |||
| Health Care Equipment and Services (Health Care) | 4.1 | |||
| Household and Personal Products (Consumer Staples) | 0.6 | |||
| Insurance (Financials) | 4.2 | |||
| Materials (Materials) | 2.2 | |||
| Media (Consumer Discretionary) | 2.5 | |||
| Pharmaceuticals, Biotechnology and Life Sciences (Health Care) | 13.3 | |||
| Retailing (Consumer Discretionary) | 6.3 | |||
| Software and Services (Information Technology) | 13.0 | |||
| Technology Hardware and Equipment (Information Technology) | 3.9 | |||
| Telecommunication Services (Services) | 1.5 | |||
| Transportation (Industrials) | 0.6 | |||
| Utilities (Utilities) | 3.7 | |||
| Short-Term Investments | 0.0 | |||
| Other Assets and Liabilities | 1.3 | |||
| Total | 100.0 | % | ||
| 4 |
| Hartford Disciplined Equity HLS Fund |
| Schedule of Investments |
| June 30, 2013 (Unaudited) |
| (000’s Omitted) |
| Shares or Principal Amount | Market Value ╪ | |||||||
| COMMON STOCKS - 98.7% | ||||||||
| Banks - 4.1% | ||||||||
| 189 | PNC Financial Services Group, Inc. | $ | 13,748 | |||||
| 452 | Wells Fargo & Co. | 18,637 | ||||||
| 184 | Zions Bancorporation | 5,300 | ||||||
| 37,685 | ||||||||
| Capital Goods - 7.5% | ||||||||
| 170 | AMETEK, Inc. | 7,181 | ||||||
| 102 | Boeing Co. | 10,447 | ||||||
| 117 | Dover Corp. | 9,048 | ||||||
| 127 | Eaton Corp. plc | 8,327 | ||||||
| 146 | Illinois Tool Works, Inc. | 10,114 | ||||||
| 56 | TransDigm Group, Inc. | 8,751 | ||||||
| 166 | United Technologies Corp. | 15,409 | ||||||
| 69,277 | ||||||||
| Commercial and Professional Services - 2.9% | ||||||||
| 150 | Equifax, Inc. ● | 8,839 | ||||||
| 47 | Quintiles Transnational Holdings ● | 2,005 | ||||||
| 130 | Towers Watson & Co. | 10,652 | ||||||
| 86 | Verisk Analytics, Inc. ● | 5,120 | ||||||
| 26,616 | ||||||||
| Consumer Durables and Apparel - 1.3% | ||||||||
| 94 | PVH Corp. | 11,793 | ||||||
| Consumer Services - 1.6% | ||||||||
| 151 | McDonald's Corp. | 14,910 | ||||||
| Diversified Financials - 6.2% | ||||||||
| 110 | Ameriprise Financial, Inc. | 8,857 | ||||||
| 34 | BlackRock, Inc. | 8,633 | ||||||
| 297 | Citigroup, Inc. | 14,231 | ||||||
| 341 | JP Morgan Chase & Co. | 18,024 | ||||||
| 295 | Morgan Stanley | 7,200 | ||||||
| 56,945 | ||||||||
| Energy - 8.8% | ||||||||
| 137 | Anadarko Petroleum Corp. | 11,766 | ||||||
| 262 | Chesapeake Energy Corp. | 5,342 | ||||||
| 167 | Chevron Corp. | 19,706 | ||||||
| 226 | Cobalt International Energy, Inc. ● | 6,004 | ||||||
| 168 | Exxon Mobil Corp. | 15,214 | ||||||
| 154 | Halliburton Co. | 6,443 | ||||||
| 89 | National Oilwell Varco, Inc. | 6,130 | ||||||
| 185 | Newfield Exploration Co. ● | 4,428 | ||||||
| 105 | Phillips 66 | 6,170 | ||||||
| 81,203 | ||||||||
| Food and Staples Retailing - 4.0% | ||||||||
| 106 | Costco Wholesale Corp. | 11,682 | ||||||
| 237 | CVS Caremark Corp. | 13,542 | ||||||
| 265 | Walgreen Co. | 11,702 | ||||||
| 36,926 | ||||||||
| Food, Beverage and Tobacco - 6.4% | ||||||||
| 285 | Altria Group, Inc. | 9,959 | ||||||
| 138 | Constellation Brands, Inc. Class A ● | 7,175 | ||||||
| 170 | Hillshire (The) Brands Co. | 5,636 | ||||||
| 116 | Lorillard, Inc. | 5,072 | ||||||
| 164 | Monster Beverage Corp. ●Θ | 9,954 | ||||||
| 61 | PepsiCo, Inc. | 5,028 | ||||||
| 184 | Philip Morris International, Inc. | 15,915 | ||||||
| 58,739 | ||||||||
| Health Care Equipment and Services - 4.1% | ||||||||
| 117 | Covidien plc | 7,366 | ||||||
| 92 | McKesson Corp. | 10,581 | ||||||
| 202 | UnitedHealth Group, Inc. | 13,255 | ||||||
| 89 | Zimmer Holdings, Inc. | 6,681 | ||||||
| 37,883 | ||||||||
| Household and Personal Products - 0.6% | ||||||||
| 327 | Coty, Inc. ● | 5,619 | ||||||
| Insurance - 4.2% | ||||||||
| 89 | ACE Ltd. | 7,982 | ||||||
| 237 | American International Group, Inc. ● | 10,614 | ||||||
| 187 | Aon plc | 12,034 | ||||||
| 110 | Prudential Financial, Inc. | 8,041 | ||||||
| 38,671 | ||||||||
| Materials - 2.2% | ||||||||
| 152 | Crown Holdings, Inc. ● | 6,271 | ||||||
| 272 | Dow Chemical Co. | 8,751 | ||||||
| 30 | Sherwin-Williams Co. | 5,236 | ||||||
| 20,258 | ||||||||
| Media - 2.5% | ||||||||
| 257 | Time Warner, Inc. | 14,863 | ||||||
| 123 | Viacom, Inc. Class B | 8,389 | ||||||
| 23,252 | ||||||||
| Pharmaceuticals, Biotechnology and Life Sciences - 13.3% | ||||||||
| 97 | Actavis, Inc. ● | 12,227 | ||||||
| 92 | Amgen, Inc. | 9,036 | ||||||
| 42 | Biogen Idec, Inc. ● | 9,004 | ||||||
| 110 | Bristol-Myers Squibb Co. | 4,921 | ||||||
| 133 | Cubist Pharmaceuticals, Inc. ● | 6,427 | ||||||
| 233 | Eli Lilly & Co. | 11,442 | ||||||
| 273 | Forest Laboratories, Inc. ● | 11,174 | ||||||
| 309 | Gilead Sciences, Inc. ● | 15,833 | ||||||
| 445 | Merck & Co., Inc. | 20,671 | ||||||
| 362 | Pfizer, Inc. | 10,132 | ||||||
| 22 | Regeneron Pharmaceuticals, Inc. ● | 4,860 | ||||||
| 104 | Salix Pharmaceuticals Ltd. ● | 6,879 | ||||||
| 122,606 | ||||||||
| Retailing - 6.3% | ||||||||
| 44 | Amazon.com, Inc. ● | 12,277 | ||||||
| 219 | Dollar Tree, Inc. ● | 11,120 | ||||||
| 339 | Lowe's Cos., Inc. | 13,870 | ||||||
| 133 | Ross Stores, Inc. | 8,587 | ||||||
| 234 | TJX Cos., Inc. | 11,692 | ||||||
| 57,546 | ||||||||
| Software and Services - 13.0% | ||||||||
| 172 | Accenture plc | 12,351 | ||||||
| 179 | Automatic Data Processing, Inc. | 12,338 | ||||||
| 83 | Cognizant Technology Solutions Corp. ● | 5,195 | ||||||
| 144 | eBay, Inc. ● | 7,464 | ||||||
| 435 | Genpact Ltd. | 8,362 | ||||||
| 19 | Google, Inc. ● | 16,798 | ||||||
| 164 | Intuit, Inc. | 10,012 | ||||||
| 15 | Mastercard, Inc. | 8,870 | ||||||
| 140 | Microsoft Corp. | 4,819 | ||||||
| 476 | Oracle Corp. | 14,614 | ||||||
| 106 | Teradata Corp. ● | 5,305 | ||||||
| 162 | VeriSign, Inc. ● | 7,233 | ||||||
The accompanying notes are an integral part of these financial statements.
| 5 |
| Hartford Disciplined Equity HLS Fund |
| Schedule of Investments – (continued) |
| June 30, 2013 (Unaudited) |
| (000’s Omitted) |
| Shares or Principal Amount | Market Value ╪ | |||||||
| COMMON STOCKS - 98.7% - (continued) | ||||||||
| Software and Services - 13.0% - (continued) | ||||||||
| 250 | Yahoo!, Inc. ● | $ | 6,281 | |||||
| 119,642 | ||||||||
| Technology Hardware and Equipment - 3.9% | ||||||||
| 34 | Apple, Inc. | 13,378 | ||||||
| 593 | Cisco Systems, Inc. | 14,412 | ||||||
| 331 | EMC Corp. | 7,820 | ||||||
| 35,610 | ||||||||
| Telecommunication Services - 1.5% | ||||||||
| 395 | AT&T, Inc. | 13,966 | ||||||
| Transportation - 0.6% | ||||||||
| 216 | Hertz Global Holdings, Inc. ● | 5,348 | ||||||
| Utilities - 3.7% | ||||||||
| 192 | American Electric Power Co., Inc. | 8,591 | ||||||
| 86 | NextEra Energy, Inc. | 7,015 | ||||||
| 103 | NRG Energy, Inc. | 2,762 | ||||||
| 82 | Pinnacle West Capital Corp. | 4,547 | ||||||
| 382 | Xcel Energy, Inc. | 10,832 | ||||||
| 33,747 | ||||||||
| Total common stocks | ||||||||
| (cost $666,270) | $ | 908,242 | ||||||
| Total long-term investments | ||||||||
| (cost $666,270) | $ | 908,242 | ||||||
| SHORT-TERM INVESTMENTS - 0.0% | ||||||||||||
| Repurchase Agreements - 0.0% | ||||||||||||
| Bank of America Merrill Lynch TriParty Repurchase Agreement (maturing on 07/01/2013 in the amount of $-, collateralized by GNMA 3.00%, 2042, value of $-) | ||||||||||||
| $ | — | 0.13%, 6/28/2013 | $ | — | ||||||||
| Bank of Montreal TriParty Repurchase Agreement (maturing on 07/01/2013 in the amount of $-, collateralized by FHLMC 4.00% - 5.00%, 2023 - 2025, FNMA 2.00% - 5.00%, 2022 - 2042, GNMA 2.00% - 5.00%, 2041 - 2043, value of $-) | ||||||||||||
| — | 0.15%, 6/28/2013 | — | ||||||||||
| Bank of Montreal TriParty Repurchase Agreement (maturing on 07/01/2013 in the amount of $-, collateralized by FHLB 0.38%, 2015, FHLMC 0.38%, 2014, FNMA 0.50% - 5.50%, 2015 - 2042, value of $-) | ||||||||||||
| — | 0.12%, 6/28/2013 | — | ||||||||||
| Barclays Capital TriParty Repurchase Agreement (maturing on 07/01/2013 in the amount of $-, collateralized by U.S. Treasury Note 3.13%, 2021, value of $-) | ||||||||||||
| — | 0.10%, 6/28/2013 | — | ||||||||||
| Citigroup Global Markets, Inc. TriParty Repurchase Agreement (maturing on 07/01/2013 in the amount of $1, collateralized by U.S. Treasury Bill 0.85%, 2013, U.S. Treasury Note 0.63% - 3.25%, 2013 - 2018, value of $1) | ||||||||||||
| 1 | 0.10%, 6/28/2013 | 1 | ||||||||||
| Deutsche Bank Securities TriParty Repurchase Agreement (maturing on 07/01/2013 in the amount of $-, collateralized by FNMA 4.50%, 2035, value of $-) | ||||||||||||
| — | 0.25%, 6/28/2013 | — | ||||||||||
| RBS Securities, Inc. TriParty Repurchase Agreement (maturing on 07/01/2013 in the amount of $-, collateralized by U.S. Treasury Note 1.00% - 2.63%, 2014 - 2020, value of $-) | ||||||||||||
| — | 0.10%, 6/28/2013 | — | ||||||||||
| TD Securities TriParty Repurchase Agreement (maturing on 07/01/2013 in the amount of $1, collateralized by FHLMC 3.50% - 4.00%, 2042, FNMA 3.50% - 4.50%, 2041 - 2042, value of $1) | ||||||||||||
| 1 | 0.12%, 6/28/2013 | 1 | ||||||||||
| UBS Securities, Inc. Repurchase Agreement (maturing on 07/01/2013 in the amount of $-, collateralized by U.S. Treasury Note 0.63%, 2014, value of $-) | ||||||||||||
| — | 0.09%, 6/28/2013 | — | ||||||||||
| 2 | ||||||||||||
| Total short-term investments | ||||||||||||
| (cost $2) | $ | 2 | ||||||||||
| Total investments | ||||||||||||
| (cost $666,272) ▲ | 98.7 | % | $ | 908,244 | ||||||||
| Other assets and liabilities | 1.3 | % | 12,186 | |||||||||
| Total net assets | 100.0 | % | $ | 920,430 | ||||||||
The accompanying notes are an integral part of these financial statements.
| 6 |
| Note: | Percentage of investments as shown is the ratio of the total market value to total net assets. |
| ▲ | At June 30, 2013, the cost of securities for federal income tax purposes was $666,988 and the aggregate gross unrealized appreciation and depreciation based on that cost were: |
| Unrealized Appreciation | $ | 247,449 | ||
| Unrealized Depreciation | (6,193 | ) | ||
| Net Unrealized Appreciation | $ | 241,256 |
| ● | Non-income producing. |
| Θ | At June 30, 2013, this security, or a portion of this security, is designated to cover written call options in the table below: |
Written Call Options Outstanding at June 30, 2013
| Description | Option Type | Exercise Price/ Rate | Expiration Date | Number of Contracts* | Market Value ╪ | Premiums Received | Unrealized Appreciation (Depreciation) | |||||||||||||||||
| Monster Beverage Corp. Option | Equity | $ | 65.00 | 07/22/2013 | 174 | $ | 9 | $ | 17 | $ | 8 | |||||||||||||
* The number of contracts does not omit 000's. Number of contracts shown in U.S. dollars unless otherwise noted.
Written Put Option Contracts Outstanding at June 30, 2013
| Description | Option Type | Exercise Price/ Rate | Expiration Date | Number of Contracts* | Market Value ╪ | Premiums Received | Unrealized Appreciation (Depreciation) | |||||||||||||||||
| Cognizant Technology Solutions Corp. Option | Equity | $ | 60.00 | 07/22/2013 | 125 | $ | 11 | $ | 18 | $ | 7 | |||||||||||||
| Phillips 66 Option | Equity | $ | 55.00 | 07/22/2013 | 149 | 8 | 9 | 1 | ||||||||||||||||
| Regeneron Pharmaceuticals, Inc. Option | Equity | $ | 200.00 | 07/22/2013 | 40 | 7 | 11 | 4 | ||||||||||||||||
| Yahoo!, Inc. Option | Equity | $ | 23.00 | 07/22/2013 | 361 | 8 | 8 | – | ||||||||||||||||
| $ | 34 | $ | 46 | $ | 12 | |||||||||||||||||||
| * | The number of contracts does not omit 000's. Number of contracts shown in U.S. dollars unless otherwise noted. |
Cash of $2,923 was pledged as collateral for open written put option contracts at June 30, 2013.
| ╪ | See Significant Accounting Policies of accompanying Notes to Financial Statements regarding valuation of securities. |
| GLOSSARY: (abbreviations used in preceding Schedule of Investments) | |
| Other Abbreviations: | |
| FHLB | Federal Home Loan Bank |
| FHLMC | Federal Home Loan Mortgage Corp. |
| FNMA | Federal National Mortgage Association |
| GNMA | Government National Mortgage Association |
The accompanying notes are an integral part of these financial statements.
| 7 |
Hartford Disciplined Equity HLS Fund
Investment Valuation Hierarchy Level Summary
June 30, 2013 (Unaudited)
(000’s Omitted)
| Total | Level 1 ♦ | Level 2 ♦ | Level 3 | |||||||||||||
| Assets: | ||||||||||||||||
| Common Stocks ‡ | $ | 908,242 | $ | 908,242 | $ | – | $ | – | ||||||||
| Short-Term Investments | 2 | – | 2 | – | ||||||||||||
| Total | $ | 908,244 | $ | 908,242 | $ | 2 | $ | – | ||||||||
| Written Options * | 20 | 20 | – | – | ||||||||||||
| Total | $ | 20 | $ | 20 | $ | – | $ | – | ||||||||
| Liabilities: | ||||||||||||||||
| Written Options * | – | – | – | – | ||||||||||||
| Total | $ | – | $ | – | $ | – | $ | – | ||||||||
| ♦ | For the six-month period ended June 30, 2013, there were no transfers between Level 1 and Level 2. |
| ‡ | The Fund has all or primarily all of the equity securities categorized in a particular level. Refer to the Schedule of Investments for further industry breakout. |
| * | Derivative instruments not reflected in the Schedule of Investments are valued at the unrealized appreciation/depreciation on the investments. |
The accompanying notes are an integral part of these financial statements.
| 8 |
Hartford Disciplined Equity HLS Fund
Statement of Assets and Liabilities
June 30, 2013 (Unaudited)
(000’s Omitted)
| Assets: | ||||
| Investments in securities, at market value (cost $666,272) | $ | 908,244 | ||
| Cash | 2,924 | * | ||
| Receivables: | ||||
| Investment securities sold | 11,990 | |||
| Fund shares sold | 272 | |||
| Dividends and interest | 947 | |||
| Total assets | 924,377 | |||
| Liabilities: | ||||
| Payables: | ||||
| Investment securities purchased | 2,956 | |||
| Fund shares redeemed | 771 | |||
| Investment management fees | 108 | |||
| Distribution fees | 5 | |||
| Accrued expenses | 64 | |||
| Written options (proceeds $63) | 43 | |||
| Total liabilities | 3,947 | |||
| Net assets | $ | 920,430 | ||
| Summary of Net Assets: | ||||
| Capital stock and paid-in-capital | $ | 747,440 | ||
| Undistributed net investment income | 4,601 | |||
| Accumulated net realized loss | (73,603 | ) | ||
| Unrealized appreciation of investments | 241,992 | |||
| Net assets | $ | 920,430 | ||
| Shares authorized | 3,500,000 | |||
| Par value | $ | 0.001 | ||
| Class IA: Net asset value per share | $ | 15.61 | ||
| Shares outstanding | 51,502 | |||
| Net assets | $ | 804,207 | ||
| Class IB: Net asset value per share | $ | 15.52 | ||
| Shares outstanding | 7,488 | |||
| Net assets | $ | 116,223 |
| * | Cash of $2,923 was designated to cover open put options written at June 30, 2013. |
The accompanying notes are an integral part of these financial statements.
| 9 |
Hartford Disciplined Equity HLS Fund
Statement of Operations
For the Six-Month Period Ended June 30, 2013 (Unaudited)
(000’s Omitted)
| Investment Income: | ||||
| Dividends | $ | 8,295 | ||
| Interest | 3 | |||
| Total investment income, net | 8,298 | |||
| Expenses: | ||||
| Investment management fees | 3,378 | |||
| Distribution fees - Class IB | 149 | |||
| Custodian fees | 4 | |||
| Accounting services fees | 57 | |||
| Board of Directors' fees | 13 | |||
| Audit fees | 8 | |||
| Other expenses | 92 | |||
| Total expenses (before fees paid indirectly) | 3,701 | |||
| Commission recapture | (4 | ) | ||
| Total fees paid indirectly | (4 | ) | ||
| Total expenses, net | 3,697 | |||
| Net Investment Income | 4,601 | |||
| Net Realized Gain on Investments and Other Financial Instruments: | ||||
| Net realized gain on investments | 67,544 | |||
| Net realized gain on written options | 343 | |||
| Net Realized Gain on Investments and Other Financial Instruments | 67,887 | |||
| Net Changes in Unrealized Appreciation of Investments and Other Financial Instruments: | ||||
| Net unrealized appreciation of investments | 55,840 | |||
| Net unrealized depreciation of written options | (10 | ) | ||
| Net Changes in Unrealized Appreciation of Investments and Other Financial Instruments | 55,830 | |||
| Net Gain on Investments and Other Financial Instruments | 123,717 | |||
| Net Increase in Net Assets Resulting from Operations | $ | 128,318 |
The accompanying notes are an integral part of these financial statements.
| 10 |
Hartford Disciplined Equity HLS Fund
Statement of Changes in Net Assets
(000’s Omitted)
| For the Six-Month Period Ended June 30, 2013 (Unaudited) | For the Year Ended December 31, 2012 | |||||||
| Operations: | ||||||||
| Net investment income | $ | 4,601 | $ | 13,907 | ||||
| Net realized gain on investments and other financial instruments | 67,887 | 95,446 | ||||||
| Net unrealized appreciation of investments and other financial instruments | 55,830 | 52,037 | ||||||
| Net Increase in Net Assets Resulting from Operations | 128,318 | 161,390 | ||||||
| Distributions to Shareholders: | ||||||||
| From net investment income | ||||||||
| Class IA | — | (12,461 | ) | |||||
| Class IB | — | (1,507 | ) | |||||
| Total distributions | — | (13,968 | ) | |||||
| Capital Share Transactions: | ||||||||
| Class IA | ||||||||
| Sold | 30,767 | 32,537 | ||||||
| Issued on reinvestment of distributions | — | 12,461 | ||||||
| Redeemed | (136,974 | ) | (227,233 | ) | ||||
| Total capital share transactions | (106,207 | ) | (182,235 | ) | ||||
| Class IB | ||||||||
| Sold | 5,231 | 9,132 | ||||||
| Issued on reinvestment of distributions | — | 1,507 | ||||||
| Redeemed | (21,173 | ) | (43,293 | ) | ||||
| Total capital share transactions | (15,942 | ) | (32,654 | ) | ||||
| Net decrease from capital share transactions | (122,149 | ) | (214,889 | ) | ||||
| Net Increase (Decrease) in Net Assets | 6,169 | (67,467 | ) | |||||
| Net Assets: | ||||||||
| Beginning of period | 914,261 | 981,728 | ||||||
| End of period | $ | 920,430 | $ | 914,261 | ||||
| Undistributed (distribution in excess of) net investment income | $ | 4,601 | $ | — | ||||
| Shares: | ||||||||
| Class IA | ||||||||
| Sold | 2,076 | 2,498 | ||||||
| Issued on reinvestment of distributions | — | 918 | ||||||
| Redeemed | (9,076 | ) | (17,242 | ) | ||||
| Total share activity | (7,000 | ) | (13,826 | ) | ||||
| Class IB | ||||||||
| Sold | 351 | 705 | ||||||
| Issued on reinvestment of distributions | — | 111 | ||||||
| Redeemed | (1,414 | ) | (3,301 | ) | ||||
| Total share activity | (1,063 | ) | (2,485 | ) | ||||
The accompanying notes are an integral part of these financial statements.
| 11 |
Hartford Disciplined Equity HLS Fund
Notes to Financial Statements
June 30, 2013 (Unaudited)
(000’s Omitted)
| 1. | Organization: |
Hartford Disciplined Equity HLS Fund (the “Fund”) serves as an underlying investment option for certain variable annuity and variable life insurance separate accounts of Hartford Life Insurance Company (“HLIC”) and its affiliates and certain qualified retirement plans. The Fund may also serve as an underlying investment option for certain variable annuity and variable life separate accounts of other insurance companies. Owners of variable annuity contracts and policyholders of variable life insurance contracts may choose the funds permitted in the variable insurance contract prospectus. In addition, participants in certain qualified retirement plans may choose the Fund if permitted by their plans.
Hartford Series Fund, Inc. (the “Company”) is an open-end registered management investment company comprised of thirty portfolios. Financial statements for the Fund, a series of the Company, are included in this report.
The Company is organized under the laws of the State of Maryland and is registered with the Securities and Exchange Commission (“SEC”) under the Investment Company Act of 1940, as amended (“1940 Act”). The Fund is a diversified open-end management investment company.
The Fund is divided into Class IA and Class IB shares. Each class is offered at the per share net asset value (“NAV”) without a sales charge and is subject to the same expenses, except that the Class IB shares are subject to distribution and service fees charged pursuant to a Distribution Plan adopted in accordance with Rule 12b-1 under the 1940 Act.
| 2. | Significant Accounting Policies: |
The following is a summary of significant accounting policies of the Fund in the preparation of its financial statements, which are in accordance with the United States Generally Accepted Accounting Principles (“U.S. GAAP”). The preparation of financial statements in accordance with U.S. GAAP may require management to make estimates and assumptions that affect the reported amounts of assets and liabilities and disclosure of contingent assets and liabilities at the date of the financial statements and the reported amounts of increases and decreases in net assets from operations during the reporting period. Actual results could differ from those estimates.
| a) | Determination of Net Asset Value – The NAV of each class of the Fund’s shares is determined as of the close of regular trading (normally 4:00 p.m. Eastern Time) (the “NYSE Close”) on each day that the New York Stock Exchange (the “Exchange”) is open (“Valuation Date”). Information that becomes known to the Fund after the NAV has been calculated on a particular day will not generally be used to retroactively adjust the NAV determined earlier that day. |
| b) | Investment Valuation and Fair Value Measurements – For purposes of calculating the NAV, portfolio investments and other assets held by the Fund's portfolio for which market quotes are readily available are valued at market value. Market value is generally determined on the basis of last reported sales prices or official close price. If no sales are reported, market value is based on quotes obtained from a quotation reporting system, established market makers, or independent pricing services. If market prices are not readily available or are deemed unreliable, the Fund will use the fair value of the investment as determined in good faith under policies and procedures established by and under the supervision of the Company’s Board of Directors. Market quotes are considered not readily available where there is an absence of current or reliable market-based data (e.g., trade information or indicative market quotes), including where events occur after the close of the relevant market, but prior to the NYSE Close that materially affect the values of the Fund’s portfolio investments or assets. In addition, market quotes are considered not readily available when, due to extraordinary circumstances, the exchanges or markets on which the investments trade do not open for trading for the entire day and no other market prices are available. In addition, prices of foreign equities that are principally traded on certain foreign markets may be adjusted daily pursuant to a fair value pricing service approved by the Board of Directors in order to reflect an adjustment for the factors occurring after the close of certain foreign markets but before the NYSE Close. Investments that are primarily traded on foreign markets may trade on days that are not business days of the Fund. The value of the foreign investments in which the Fund invests may change on days when a shareholder will not be able to purchase or redeem shares of the Fund. Fair value pricing is subjective in nature and the use of fair value pricing by the |
| 12 |
Fund may cause the NAV of its shares to differ significantly from the NAV that would have been calculated using market prices at the close of the exchange on which a portfolio investment is primarily traded. There can be no assurance that the Fund could obtain the fair market value assigned to an investment if the Fund were to sell the investment at approximately the time at which the Fund determines its NAV.
Exchange traded options, futures and options on futures are valued at the settlement price determined by the relevant exchange as of the NYSE Close. In the case of OTC options and such instruments that do not trade on an exchange, values may be supplied by a pricing service using a formula or other objective method that may take into consideration the style, direction, expiration, strike price, notional value and volatility or other special adjustments.
Financial instruments for which prices are not available from an independent pricing service may be valued using market quotations obtained from one or more dealers that make markets in the respective financial instrument in accordance with procedures established by the Company’s Board of Directors.
U.S. GAAP defines fair value as the price that the Fund would receive to sell an asset or pay to transfer a liability in an orderly transaction between market participants. The U.S. GAAP fair value measurement standards require disclosure of a fair value hierarchy for each major category of assets and liabilities. Various inputs are used in determining the fair value of the Fund’s investments. These inputs are summarized into three broad hierarchy levels. This hierarchy is based on whether the valuation inputs are observable or unobservable. These levels are:
| · | Level 1 – Quoted prices in active markets for identical investments. Level 1 may include exchange traded instruments, such as domestic equities, some foreign equities, options, futures, mutual funds, exchange traded funds, rights and warrants. |
| · | Level 2 – Observable inputs other than Level 1 prices, such as quoted prices for similar investments; quoted prices in markets that are not active; or other inputs that are observable or can be corroborated by observable market data. Level 2 may include debt investments that are traded less frequently than exchange traded instruments and which are valued using independent pricing services; foreign equities, which are principally traded on certain foreign markets and are adjusted daily pursuant to a fair value pricing service in order to reflect an adjustment for the factors occurring after the close of certain foreign markets but before the NYSE Close; and short-term investments, which are valued at amortized cost. |
| · | Level 3 – Significant unobservable inputs that are supported by limited or no market activity. Level 3 may include financial instruments whose values are determined using indicative market quotes or require significant management judgment or estimation. These unobservable valuation inputs may include estimates for current yields, maturity/duration, prepayment speed, and indicative market quotes for comparable investments along with other assumptions relating to credit quality, collateral value, complexity of the investment structure, general market conditions and liquidity. This category may include investments where trading has been halted or there are certain restrictions on trading. While these investments are priced using unobservable inputs, the valuation of these investments reflects the best available data and management believes the prices are a reasonable representation of exit price. |
The Board of Directors of the Company generally reviews and approves the “Procedures for Valuation of Portfolio Securities” on an annual basis. These procedures define how investments are to be valued, including the formation and activities of a Valuation Committee. The Valuation Committee is responsible for determining in good faith the fair value of investments when the value cannot be obtained from primary pricing services or alternative sources or if the valuation of an investment as provided by the primary pricing service or alternative source is believed not to reflect the investment’s fair value as of the Valuation Date. Members of the Valuation Committee include the Fund’s Treasurer or designee, a Vice President of the Fund with legal expertise or designee, and a Vice President of the investment manager or designee. In addition, the Fund’s Chief Compliance Officer shall designate a member of the compliance group to attend Valuation Committee meetings as a non-voting resource, to monitor for and provide guidance with respect to compliance with these procedures. Two members of the Valuation Committee or their designees, representing different departments, shall
| 13 |
Hartford Disciplined Equity HLS Fund
Notes to Financial Statements – (continued)
June 30, 2013 (Unaudited)
(000’s Omitted)
constitute a quorum for purposes of permitting the Valuation Committee to take action. The Valuation Committee will consider all relevant factors in determining an investment’s fair value, and may seek the advice of the Fund’s sub-adviser, knowledgeable brokers, and legal counsel in making such determination. The Valuation Committee reports to the Audit Committee of the Company’s Board of Directors. The Audit Committee receives quarterly written reports which include details of all fair-valued investments, including the reason for the fair valuation, and an indication, when possible, of the accuracy of the valuation by disclosing the next available reliable public price quotation or the disposition price of such investments (the “look-back” test). The Board of Directors then must consider for ratification all of the fair value determinations made during the previous quarter.
Valuation levels are not necessarily indicative of the risk associated with investing in such investments. Individual investments within any of the above mentioned asset classes may be assigned a different hierarchical level than those presented above, as individual circumstances dictate.
For additional information, refer to the Investment Valuation Hierarchy Level Summary and the Level 3 roll-forward reconciliation, if applicable, which follow the Schedule of Investments.
For purposes of reporting transfers between different hierarchy levels, both transfers in and out of each level, as applicable, are shown as if they occurred at the beginning of the period.
| c) | Investment Transactions and Investment Income – Investment transactions are recorded as of the trade date (the date the order to buy or sell is executed) for financial reporting purposes. Investments purchased or sold on a when-issued or delayed-delivery basis may be settled a month or more after the trade date. Realized gains and losses are determined on the basis of identified cost. |
Dividend income from domestic securities is accrued on the ex-dividend date. In general, dividend income from foreign securities is recorded on the ex-date; however, dividend notifications in certain foreign jurisdictions may not be available in a timely manner and as a result, the Fund will record the dividend as soon as the relevant details (i.e., rate per share, payment date, shareholders of record, etc.) are publicly available. Interest income, including amortization of premium and accretion of discounts, is accrued on a daily basis.
| d) | Joint Trading Account – The Fund may invest cash balances into a joint trading account that may be invested in one or more repurchase agreements. |
| e) | Fund Share Valuation and Dividend Distributions to Shareholders – Orders for the Fund’s shares are executed in accordance with the investment instructions of the contract holders and plan participants. The NAV of the Fund’s shares is determined as of the close of business on each business day of the Exchange. The NAV is determined separately for each class of shares of the Fund by dividing the Fund’s net assets attributable to that class by the number of shares of the class outstanding. Each class of shares offered by the Fund has equal rights as to assets and voting privileges (except that shareholders of a class have exclusive voting rights regarding any matter relating solely to that class of shares). Income and non-class specific expenses are allocated daily to each class on the basis of the relative net assets of the class. Realized and unrealized capital gains and losses are allocated daily based on the relative net assets of each class of shares of the Fund. |
Orders for the purchase of the Fund’s shares received prior to the close of the Exchange on any day the Exchange is open for business are priced at the NAV determined as of the close of the Exchange. Orders received after the close of the Exchange, or on a day on which the Exchange and/or the Fund is not open for business, are priced at the next determined NAV.
| 14 |
Dividends are declared pursuant to a policy adopted by the Company’s Board of Directors based upon the investment performance of the Fund. The policy of the Fund is to pay dividends from net investment income and realized capital gains, if any, at least once a year.
Distributions from net investment income, net realized capital gains and capital are determined in accordance with federal income tax regulations, which may differ from U.S. GAAP with respect to character and timing. These differences may include but are not limited to losses deferred due to wash sale adjustments, foreign currency gains and losses, adjustments related to Passive Foreign Investment Companies (“PFICs”), Real Estate Investment Trusts (“REITs”), Regulated Investment Companies (“RICs”), certain derivatives and partnerships. Permanent book and federal income tax basis differences relating to shareholder distributions will result in reclassifications to certain of the Fund’s capital accounts (see Federal Income Taxes: Reclassification of Capital Accounts note).
| 3. | Securities and Other Investments: |
| a) | Repurchase Agreements – A repurchase agreement is an agreement by which a counterparty agrees to sell an investment and agrees to repurchase the investment sold from the buyer at a mutually agreed upon time and price. During the period of the repurchase agreement, the counterparty will deposit cash and or securities in a third party custodial account to serve as collateral. At the time the Fund enters into a repurchase agreement, the value of the underlying collateral, including accrued interest, will be equal to or exceed the value of the repurchase agreement. Repurchase agreements expose the Fund to counterparty risk - that is, the risk that the counterparty will not fulfill its obligations. To minimize counterparty risk, the investments that serve to collateralize the repurchase agreement are held by the Fund’s custodian in book entry or physical form in the custodial account of the Fund or in a third party custodial account. Repurchase agreements are valued at cost plus accrued interest, which approximates fair value. Repurchase agreements have master netting agreements which allow the Fund to offset amounts owed to a counterparty with amounts owed by the counterparty, including any collateral. The Fund, as shown on the Schedule of Investments, had outstanding repurchase agreements as of June 30, 2013. |
| 4. | Financial Derivative Instruments: |
The following disclosures contain information on how and why the Fund uses derivative instruments, the credit-risk-related contingent features in certain derivative instruments, and how derivative instruments affect the Fund’s financial position and results of operations. The location and fair value amounts of these instruments on the Statement of Assets and Liabilities and the realized gains and losses and changes in unrealized gains and losses on the Statement of Operations, each categorized by type of derivative contract, are included in the following Additional Derivative Instrument Information footnote. The derivative instruments outstanding as of period-end are disclosed in the notes to or within the Schedule of Investments for purchased options, if applicable. The amounts of realized gains and losses and changes in unrealized gains and losses on derivative instruments during the period are disclosed in the Statement of Operations.
| a) | Options Contracts – An option contract is a contract sold by one party to another party that offers the buyer the right, but not the obligation, to buy (call) or sell (put) an investment or other financial asset at an agreed-upon price during a specific period of time or on a specific date. The Fund may write (sell) covered call and put options on futures, swaps (“swaptions”), securities, commodities or currencies. “Covered” means that so long as the Fund is obligated as the writer of an option, it will own either the underlying investments or currency or an option to purchase the same underlying investments or currency having an expiration date of the covered option and an exercise price equal to or less than the exercise price of the covered option, or will pledge cash or other liquid investments having a value equal to or greater than the fluctuating market value of the option investment or currency. Writing put options increases the Fund’s exposure to the underlying instrument. Writing call options decreases the Fund’s exposure to the underlying instrument. Premiums received from writing options that expire are treated as realized gains. Premiums received from writing options that are exercised or closed are added to the proceeds or offset amounts paid on the underlying futures, swap, investment or currency transaction to determine the realized gain or loss. The Fund as a writer of an option has no |
| 15 |
Hartford Disciplined Equity HLS Fund
Notes to Financial Statements – (continued)
June 30, 2013 (Unaudited)
(000’s Omitted)
control over whether the underlying instrument may be sold (call) or purchased (put) and as a result bears the market risk of an unfavorable change in the price of the instrument underlying the written option. There is the risk the Fund may not be able to enter into a closing transaction because of an illiquid market. The Fund may also purchase put and call options. Purchasing call options increases the Fund’s exposure to the underlying instrument. Purchasing put options decreases the Fund’s exposure to the underlying instrument. The Fund pays a premium, which is included on the Fund’s Statement of Assets and Liabilities as an investment and is subsequently marked to market to reflect the current value of the option. Premiums paid for purchasing options that expire are treated as realized losses. Certain options may be purchased with premiums to be determined on a future date. The premiums for these options are based upon implied volatility parameters at specified terms. The risk associated with purchasing put and call options is generally limited to the premium paid. Premiums paid for purchasing options that are exercised or closed are added to the amounts paid or offset against the proceeds on the underlying investment transaction to determine the realized gain or loss. Entering into over-the-counter options also exposes the Fund to counterparty risk. Counterparty risk is the possibility that the counterparty to the agreements may default on its obligation to perform or disagree as to the meaning of the contractual terms in the agreements. The Fund had no outstanding purchased options contracts as of June 30, 2013. The Fund, as shown on the Schedule of Investments, had outstanding written options contracts as of June 30, 2013. Transactions involving written options contracts during the six-month period ended June 30, 2013, are summarized below:
| Options Contract Activity During the Six-month Period Ended June 30, 2013 | ||||||||
| Call Options Written During the Period | Number of Contracts* | Premium Amounts | ||||||
| Beginning of the period | 1,364 | $ | 80 | |||||
| Written | 3,487 | 227 | ||||||
| Expired | (2,588 | ) | (194 | ) | ||||
| Closed | (1,052 | ) | (48 | ) | ||||
| Exercised | (1,037 | ) | (48 | ) | ||||
| End of period | 174 | $ | 17 | |||||
| Put Options Written During the Period | Number of Contracts* | Premium Amounts | ||||||
| Beginning of the period | 755 | $ | 58 | |||||
| Written | 6,434 | 368 | ||||||
| Expired | (4,579 | ) | (255 | ) | ||||
| Closed | (1,935 | ) | (125 | ) | ||||
| Exercised | — | — | ||||||
| End of period | 675 | $ | 46 | |||||
* The number of contracts does not omit 000's.
| b) | Additional Derivative Instrument Information: |
| Fair Value of Derivative Instruments on the Statement of Assets and Liabilities as of June 30, 2013: |
| Risk Exposure Category | ||||||||||||||||||||||||||||
| Interest Rate Contracts | Foreign Exchange Contracts | Credit Contracts | Equity Contracts | Commodity Contracts | Other Contracts | Total | ||||||||||||||||||||||
| Liabilities: | ||||||||||||||||||||||||||||
| Written options, market value | $ | — | $ | — | $ | — | $ | 43 | $ | — | $ | — | $ | 43 | ||||||||||||||
| Total | $ | — | $ | — | $ | — | $ | 43 | $ | — | $ | — | $ | 43 | ||||||||||||||
The volume of derivatives that is presented in the Schedule of Investments is consistent with the derivative activity during the six-month period ended June 30, 2013.
| 16 |
The Effect of Derivative Instruments on the Statement of Operations for the six-month period ended June 30, 2013:
| Risk Exposure Category | ||||||||||||||||||||||||||||
| Interest Rate Contracts | Foreign Exchange Contracts | Credit Contracts | Equity Contracts | Commodity Contracts | Other Contracts | Total | ||||||||||||||||||||||
| Realized Gain on Derivatives Recognized as a Result of Operations: | ||||||||||||||||||||||||||||
| Net realized gain on written options | $ | — | $ | — | $ | — | $ | 343 | $ | — | $ | — | $ | 343 | ||||||||||||||
| Total | $ | — | $ | — | $ | — | $ | 343 | $ | — | $ | — | $ | 343 | ||||||||||||||
| Net Change in Unrealized Appreciation (Depreciation) on Derivatives Recognized as a Result of Operations: | ||||||||||||||||||||||||||||
| Net change in unrealized depreciation of written options | $ | — | $ | — | $ | — | $ | (10 | ) | $ | — | $ | — | $ | (10 | ) | ||||||||||||
| Total | $ | — | $ | — | $ | — | $ | (10 | ) | $ | — | $ | — | $ | (10 | ) | ||||||||||||
| c) | Balance Sheet Offsetting Information: |
Set forth below are tables which disclose both gross information and net information about instruments and transactions eligible for offset in the financial statements, and instruments and transactions that are subject to a master netting agreement, as well as amounts related to margin, reflected as financial collateral (including cash collateral), held at clearing brokers, counterparties, and the Fund’s custodian. The master netting agreements allow the clearing brokers to net any collateral held in or on behalf of the Fund, or liabilities or payment obligations of the clearing brokers to the Fund, against any liabilities or payment obligations of the Fund to the clearing brokers. The Fund is required to deposit financial collateral (including cash collateral) at the Fund’s custodian on behalf of clearing brokers and counterparties to continually meet the original and maintenance requirements established by the clearing brokers and counterparties. Such requirements are specific to the respective clearing broker or counterparty.
Offsetting of Financial Assets and Derivative Assets as of June 30, 2013:
| Description | Gross Amounts of Recognized Assets | Gross Amounts Offset in Statement of Assets and Liabilities | Net Amounts of Assets Presented in Statement of Assets and Liabilities | Financial Instruments with Allowable Netting | Collateral Received | Net Amount (not less than 0) | ||||||||||||||||||
| Repurchase Agreements | $ | 2 | $ | — | $ | 2 | $ | — | $ | (2 | ) | $ | — | |||||||||||
| Total subject to a master netting or similar arrangement | $ | 2 | $ | — | $ | 2 | $ | — | $ | (2 | ) | $ | — | |||||||||||
Offsetting of Financial Liabilities and Derivative Liabilities as of June 30, 2013:
| Description | Gross Amounts of Recognized Liabilities | Gross Amounts Offset in Statement of Assets and Liabilities | Net Amounts of Assets Presented in Statement of Assets and Liabilities | Financial Instruments with Allowable Netting | Collateral Pledged | Net Amount (not less than 0) | ||||||||||||||||||
| Written options at market value | $ | 43 | $ | — | $ | 43 | $ | — | $ | (2,923 | ) | $ | — | |||||||||||
| Total subject to a master netting or similar arrangement | $ | 43 | $ | — | $ | 43 | $ | — | $ | (2,923 | ) | $ | — | |||||||||||
| 5. | Principal Risks: |
| a) | Counterparty Risk – The Fund may be exposed to counterparty risk, or the risk that an institution or other entity with which the Fund has unsettled or open transactions will default. |
| b) | Market Risks – The market values of equity securities, such as common stocks and preferred stocks, or equity related investments, such as futures and options, may decline due to general market conditions which are not specifically related to a particular company, such as real or perceived adverse economic conditions, changes in the general outlook for |
| 17 |
Hartford Disciplined Equity HLS Fund
Notes to Financial Statements – (continued)
June 30, 2013 (Unaudited)
(000’s Omitted)
corporate earnings, changes in interest or currency rates or adverse investor sentiment generally. The market value of equity securities may also decline due to factors which affect a particular industry or industries, such as labor shortages or increased production costs and competitive conditions within an industry. Equity securities and equity related investments generally have greater market price volatility than fixed income securities.
| 6. | Federal Income Taxes: |
| a) | Federal Income Taxes – For federal income tax purposes, the Fund intends to continue to qualify as a RIC under Subchapter M of the Internal Revenue Code (“IRC”) by distributing substantially all of its taxable net investment income and net realized capital gains to its shareholders and otherwise complying with the requirements of the IRC. The Fund has distributed substantially all of its income and capital gains in prior years, if applicable, and intends to distribute substantially all of its income and capital gains prior to the next fiscal year-end. Accordingly, no provision for federal income or excise taxes has been made in the accompanying financial statements. Distributions from short-term capital gains are treated as ordinary income distributions for federal income tax purposes. |
| b) | Net Investment Income (Loss), Net Realized Gains (Losses), and Distributions – Net investment income (loss) and net realized gains (losses) may differ for financial statement and tax purposes primarily because of losses deferred due to wash sale adjustments, foreign currency gains and losses, adjustments related to PFICs, REITs, RICs, certain derivatives and partnerships. The character of distributions made during the year from net investment income or net realized gains may differ from their ultimate characterization for federal income tax purposes. Also, due to the timing of dividend distributions, the fiscal year in which amounts are distributed may differ from the year that the income or realized gains (losses) were recorded by the Fund. |
| c) | Distributions and Components of Distributable Earnings – The tax character of distributions paid by the Fund for the periods indicated is as follows (as adjusted for dividends payable, if applicable): |
| For the Year Ended December 31, 2012 | For the Year Ended December 31, 2011 | |||||||
| Ordinary Income | $ | 13,968 | $ | 11,639 | ||||
As of December 31, 2012, the Fund’s components of distributable earnings (deficit) on a tax basis were as follows:
| Amount | ||||
| Accumulated Capital and Other Losses* | $ | (140,775 | ) | |
| Unrealized Appreciation† | 185,447 | |||
| Total Accumulated Earnings | $ | 44,672 | ||
| * | The Fund has capital loss carryforwards that are identified in the Capital Loss Carryforward note that follows. | |
| † | Differences between book-basis and tax-basis unrealized appreciation (depreciation) may be attributable to the losses deferred due to wash sale adjustments, foreign currency gains and losses, adjustments related to PFICs, REITs, RICs, certain derivatives and partnerships. |
| 18 |
| d) | Reclassification of Capital Accounts – The Fund may record reclassifications in its capital accounts. These reclassifications have no impact on the total net assets of the Fund. The reclassifications are a result of permanent differences between U.S. GAAP and tax accounting for such items as foreign currency, PFICs, expiration or utilization of capital loss carryforwards or net operating losses. Adjustments are made to reflect the impact these items have on current and future distributions to shareholders. Therefore, the source of the Fund’s distributions may be shown in the accompanying Statement of Changes in Net Assets as from undistributed net investment income, from accumulated net realized gains on investments or from capital depending on the type of book and tax differences that exist. For the year ended December 31, 2012, the Fund recorded reclassifications to increase (decrease) the accounts listed below: |
| Amount | ||||
| Undistributed Net Investment Income | $ | (622 | ) | |
| Accumulated Net Realized Gain (Loss) | 1,028 | |||
| Capital Stock and Paid-in-Capital | (406 | ) | ||
| e) | Capital Loss Carryforward – On December 22, 2010, the Regulated Investment Company Modernization Act of 2010 (the “Act”) was enacted, which made changes to the capital loss carryforward rules. The changes are effective for taxable years beginning after the date of enactment. Under the Act, funds are permitted to carry forward capital losses for an unlimited period. However, any losses incurred during those future taxable years will be required to be utilized prior to the losses incurred in pre-enactment taxable years, which carry an expiration date. As a result of this ordering rule, pre-enactment capital loss carryforwards may be more likely to expire unused. Additionally, post-enactment capital loss carryforwards retain their character as either short-term or long-term capital losses rather than being considered all short-term as permitted under prior regulation. |
At December 31, 2012 (tax-year-end), the Fund had capital loss carryforwards for U.S. federal income tax purposes as follows:
| Year of Expiration | Amount | |||
| 2017 | $ | 140,775 | ||
| Total | $ | 140,775 | ||
During the year ended December 31, 2012, the Fund utilized $96,131 of prior year capital loss carryforwards.
| f) | Accounting for Uncertainty in Income Taxes – The Fund has adopted financial reporting rules that require the Fund to analyze all open tax years, as defined by the statute of limitations, for all major jurisdictions. Generally, tax authorities can examine all tax returns filed for the last three years. The Fund does not have an examination in progress. |
The Fund has reviewed all open tax years and major jurisdictions and concluded that these financial reporting rules had no effect on the Fund’s financial position or results of operations. There is no tax liability resulting from unrecognized tax benefits relating to uncertain income tax positions taken or expected to be taken on the tax return for the fiscal year ended December 31, 2012. The Fund is also not aware of any tax positions for which it is reasonably possible that the total amounts of unrecognized tax benefits will significantly change in the next twelve months.
| 7. | Expenses: |
| a) | Investment Management Agreement – Hartford Funds Management Company, LLC (“HFMC”), an indirect wholly owned subsidiary of The Hartford Financial Services Group, Inc. (“The Hartford”), serves as investment manager to the Fund pursuant to an Investment Management Agreement with the Company. The investment manager has overall investment supervisory responsibility for the Fund. In addition, the investment manager provides administrative personnel, services, equipment, facilities and office space for proper operation of the Fund. The investment manager has contracted with Wellington Management Company, LLP (“Wellington Management”) under a sub-advisory agreement for the provision of day-to-day investment management services to the Fund in accordance with the Fund’s investment |
| 19 |
Hartford Disciplined Equity HLS Fund
Notes to Financial Statements – (continued)
June 30, 2013 (Unaudited)
(000’s Omitted)
objective and policies. The Fund pays a fee to the investment manager, a portion of which may be used to compensate Wellington Management.
The schedule below reflects the rates of compensation paid to HFMC for investment management services rendered as of June 30, 2013; the rates are accrued daily and paid monthly.
| Average Daily Net Assets | Annual Fee | |||
| On first $250 million | 0.7750 | % | ||
| On next $250 million | 0.7250 | % | ||
| On next $500 million | 0.6750 | % | ||
| On next $4 billion | 0.6250 | % | ||
| On next $5 billion | 0.6225 | % | ||
| Over $10 billion | 0.6200 | % | ||
| b) | Accounting Services Agreement – Pursuant to the Fund Accounting Agreement between HFMC and the Company, on behalf of the Fund, HFMC provides accounting services to the Fund and receives monthly compensation based on the Fund’s average daily net assets at the rates set forth below. The Fund’s accounting services fees are accrued daily and paid monthly. |
| Average Daily Net Assets | Annual Fee | |||
| On first $5 billion | 0.012 | % | ||
| Over $5 billion | 0.010 | % | ||
| c) | Operating Expenses – Allocable expenses incurred by the Company are allocated to each Fund and allocated to classes within a Fund in proportion to the average daily net assets of the Fund and each class, except where allocation of certain expenses is more fairly made directly to the Fund or to specific classes within a Fund. |
| d) | Fees Paid Indirectly – The Company, on behalf of the Fund, has entered into agreements with State Street Global Markets, LLC and Russell Implementation Services, Inc. to partially recapture non-discounted trade commissions. Such rebates are used to pay a portion of the Fund’s expenses. In addition, the Fund’s custodian banks have agreed to reduce its fees when the Fund maintains cash on deposit in a non-interest-bearing custody account. For the six-month period ended June 30, 2013, these amounts, if any, are included in the Statement of Operations. |
The ratio of expenses to average net assets in the accompanying financial highlights excludes the reduction in expenses related to fees paid indirectly. The annualized expense ratio for the period listed below reflecting the reduction for fees paid indirectly is as follows:
| Annualized Six- Month Period Ended June 30, 2013 | ||||
| Class IA | 0.75 | % | ||
| Class IB | 1.00 | |||
| e) | Distribution Plan for Class IB shares – The Company, on behalf of the Fund, has adopted a Distribution Plan pursuant to Rule 12b-1 of the 1940 Act to compensate the distributor, Hartford Funds Distributors, LLC (“HFD”), (formerly known as Hartford Investment Financial Services, LLC), an indirect wholly owned subsidiary of The Hartford, from assets attributable to the Class IB shares for services rendered and expenses borne in connection with activities primarily |
| 20 |
intended to result in the sale of the Class IB shares, subject to the review and approval of the Company’s Board of Directors.
The Distribution Plan provides that the Fund may pay annually up to 0.25% of the average daily net assets of the Fund attributable to its Class IB shares for activities primarily intended to result in the sale of Class IB shares. The Board has the authority to suspend or reduce these payments at any point in time. Under the terms of the Distribution Plan and the principal underwriting agreement, the Fund is authorized to make payments monthly to the distributor that may be used to pay or compensate entities providing distribution and shareholder servicing with respect to the Class IB shares for such entities’ fees or expenses incurred or paid in that regard. These fees are accrued daily and paid monthly.
| f) | Other Related Party Transactions – Certain officers of the Fund are directors and/or officers of the investment manager and/or The Hartford or its subsidiaries. For the six-month period ended June 30, 2013, a portion of the Fund’s Chief Compliance Officer’s salary was paid by all the investment companies in the Hartford fund complex. The portion allocated to the Fund rounds to zero. These fees are accrued daily and paid monthly. |
| g) | Payment from Affiliate – In July of 2007, The Hartford entered into a settlement with the Attorneys General of the states of New York, Connecticut and Illinois relating to market timing and the company's individual variable annuity contracts in which certain payments would be made directly to the variable annuity contract holders. The distribution plan provided that unclaimed money from the settlement would be distributed to certain HLS Funds that are investment options through a Hartford individual variable annuity contract. The unclaimed money was distributed to the Fund on September 18, 2009. |
The total return in the accompanying financial highlights includes a payment from an affiliate. Had the payment from the affiliate been excluded, the impact and total return for the period listed below would have been as follows:
| For the Year Ended December 31, 2009 | ||||||||
| Class IA | Class IB | |||||||
| Impact from Payment from Affiliate for Attorneys General Settlement | 0.01 | % | 0.01 | % | ||||
| Total Return Excluding Payment from Affiliate | 25.64 | % | 25.32 | % | ||||
| 8. | Investment Transactions: |
For the six-month period ended June 30, 2013, the Fund's aggregate purchases and sales of investment securities (excluding short-term investments) were as follows:
| Amount | ||||
| Cost of Purchases Excluding U.S. Government Obligations | $ | 132,603 | ||
| Sales Proceeds Excluding U.S. Government Obligations | 253,311 | |||
| 9. | Line of Credit: |
The Fund is one of several Hartford funds that participate in a $500 million committed revolving line of credit facility. The facility is to be used for temporary or emergency purposes. Under the arrangement, the funds are required to own securities having a market value in excess of 300% of the total bank borrowings. The interest rate on borrowings varies depending on the nature of the loan. The facility also requires a fee to be paid based on the amount of the commitment. This commitment fee is allocated to all of the funds participating in the line of credit based on the average net assets of the funds. During the six-month period ended June 30, 2013, the Fund did not have any borrowings under this facility.
| 21 |
Hartford Disciplined Equity HLS Fund
Notes to Financial Statements – (continued)
June 30, 2013 (Unaudited)
(000’s Omitted)
| 10. | Industry Classifications: |
Other than the industry classifications “Other Investment Pools and Funds” and “Exchange Traded Funds,” equity industry classifications used in this report are the Global Industry Classification Standard, which was developed by and is the exclusive property and service mark of MSCI, Inc. and Standard & Poor’s.
| 11. | Indemnifications: |
Under the Company’s organizational documents, the Company shall indemnify its officers and directors to the full extent required or permitted under Maryland General Corporation Law and the federal securities laws. In addition, the Company, on behalf of the Fund, may enter into contracts that contain a variety of indemnifications. The Company’s maximum exposure under these arrangements is unknown. However, as of the date of these financial statements, the Company has not had prior claims or losses pursuant to these contracts and expects the risk of loss to be remote.
| 12. | Pending Legal Proceedings: |
On February 25, 2011, Jennifer L. Kasilag, Louis Mellinger, Judith M. Menendez, Jacqueline M. Robinson, and Linda A. Russell filed a derivative lawsuit against Hartford Investment Financial Services, LLC (“HIFSCO”)(now known as Hartford Funds Distributors, LLC) on behalf of six Hartford retail mutual funds in the United States District Court for the District of New Jersey, alleging that HIFSCO received excessive advisory and distribution fees in violation of its statutory fiduciary duty under Section 36(b) of the 1940 Act when serving as investment manager and principal underwriter, respectively, to the Hartford retail mutual funds. HIFSCO moved to dismiss and, in September 2011, the motion was granted in part and denied in part, with leave to amend the complaint. In November 2011, plaintiffs filed an amended complaint on behalf of certain Hartford retail mutual funds, The Hartford Global Health Fund (now known as The Hartford Healthcare Fund), The Hartford Conservative Allocation Fund, The Hartford Growth Opportunities Fund, The Hartford Inflation Plus Fund, The Hartford Advisers Fund (now known as The Hartford Balanced Fund), and The Hartford Capital Appreciation Fund. Plaintiffs seek to rescind the investment management agreements and distribution plans between HIFSCO and these funds and to recover the total fees charged thereunder or, in the alternative, to recover any improper compensation HIFSCO received, in addition to lost earnings. HIFSCO filed a partial motion to dismiss the amended complaint and, in December 2012, the court dismissed without prejudice the claims regarding distribution fees and denied the motion with respect to the advisory fees claims. HIFSCO disputes the allegations and intends to defend vigorously.
This action concerns the activities of HIFSCO in its capacity as investment manager and principal underwriter to the Hartford retail mutual funds and does not concern HIFSCO’s activities in its capacity as principal underwriter to the HLS funds. For this reason, no accrual for litigation relating to this matter has been recorded in the financial statements of the Fund.
| 22 |
[This page intentionally left blank]
| 23 |
Hartford Disciplined Equity HLS Fund
Financial Highlights
- Selected Per-Share Data (A) -
Class | Net Asset Value at Beginning of Period | Net Investment Income (Loss) | Net Realized and Unrealized Gain (Loss) on Investments | Total from Investment Operations | Dividends from Net Investment Income | Distributions from Realized Capital Gains | Distributions from Capital | Total Distributions | Net Asset Value at End of Period | |||||||||||||||||||||||||||
| For the Six-Month Period Ended June 30, 2013 (Unaudited) | ||||||||||||||||||||||||||||||||||||
| IA | $ | 13.64 | $ | 0.08 | $ | 1.89 | $ | 1.97 | $ | – | $ | – | $ | – | $ | – | $ | 15.61 | ||||||||||||||||||
| IB | 13.58 | 0.06 | 1.88 | 1.94 | – | – | – | – | 15.52 | |||||||||||||||||||||||||||
| For the Year Ended December 31, 2012 | ||||||||||||||||||||||||||||||||||||
| IA | 11.78 | 0.22 | 1.86 | 2.08 | (0.22 | ) | – | – | (0.22 | ) | 13.64 | |||||||||||||||||||||||||
| IB | 11.73 | 0.18 | 1.85 | 2.03 | (0.18 | ) | – | – | (0.18 | ) | 13.58 | |||||||||||||||||||||||||
| For the Year Ended December 31, 2011 | ||||||||||||||||||||||||||||||||||||
| IA | 11.79 | 0.14 | (0.01 | ) | 0.13 | (0.14 | ) | – | – | (0.14 | ) | 11.78 | ||||||||||||||||||||||||
| IB | 11.73 | 0.11 | – | 0.11 | (0.11 | ) | – | – | (0.11 | ) | 11.73 | |||||||||||||||||||||||||
| For the Year Ended December 31, 2010 | ||||||||||||||||||||||||||||||||||||
| IA | 10.47 | 0.15 | 1.32 | 1.47 | (0.15 | ) | – | – | (0.15 | ) | 11.79 | |||||||||||||||||||||||||
| IB | 10.42 | 0.13 | 1.30 | 1.43 | (0.12 | ) | – | – | (0.12 | ) | 11.73 | |||||||||||||||||||||||||
| For the Year Ended December 31, 2009 | ||||||||||||||||||||||||||||||||||||
| IA | 8.46 | 0.15 | 2.01 | 2.16 | (0.15 | ) | – | – | (0.15 | ) | 10.47 | |||||||||||||||||||||||||
| IB | 8.41 | 0.13 | 2.00 | 2.13 | (0.12 | ) | – | – | (0.12 | ) | 10.42 | |||||||||||||||||||||||||
| For the Year Ended December 31, 2008 | ||||||||||||||||||||||||||||||||||||
| IA | 15.05 | 0.14 | (5.37 | ) | (5.23 | ) | (0.14 | ) | (1.22 | ) | – | (1.36 | ) | 8.46 | ||||||||||||||||||||||
| IB | 14.97 | 0.12 | (5.35 | ) | (5.23 | ) | (0.11 | ) | (1.22 | ) | – | (1.33 | ) | 8.41 | ||||||||||||||||||||||
| (A) | Information presented relates to a share outstanding throughout the indicated period. |
| (B) | The figures do not include sales charges or other fees which may be applied at the variable life insurance, variable annuity or qualified retirement plan product level. Any such additional sales charges or other fees would lower the Fund's performance. |
| (C) | Ratios do not reflect reductions for fees paid indirectly. Please see Fees Paid Indirectly in the Notes to Financial Statements. |
| (D) | Portfolio turnover rate is calculated on the basis of the Fund as a whole without distinguishing between the classes of shares issued. |
| (E) | Not annualized. |
| (F) | Annualized. |
| (G) | Total return without the inclusion of the Payment from (to) Affiliate can be found in Expenses in the accompanying Notes to Financial Statements. |
| 24 |
- Ratios and Supplemental Data -
| Total Return(B) | Net Assets at End of Period | Ratio of Expenses to Average Net Assets Before Waivers(C) | Ratio of Expenses to Average Net Assets After Waivers(C) | Ratio of Net Investment Income (Loss) to Average Net Assets | Portfolio Turnover Rate(D) | |||||||||||||||||
| 14.45 | %(E) | $ | 804,207 | 0.75 | %(F) | 0.75 | %(F) | 1.00 | %(F) | 14 | % | |||||||||||
| 14.31 | (E) | 116,223 | 1.00 | (F) | 1.00 | (F) | 0.75 | (F) | – | |||||||||||||
| 17.62 | 798,148 | 0.75 | 0.75 | 1.45 | 34 | |||||||||||||||||
| 17.33 | 116,113 | 1.00 | 1.00 | 1.20 | – | |||||||||||||||||
| 1.15 | 852,312 | 0.74 | 0.74 | 1.06 | 44 | |||||||||||||||||
| 0.90 | 129,416 | 0.99 | 0.99 | 0.81 | – | |||||||||||||||||
| 14.04 | 1,022,321 | 0.75 | 0.75 | 1.35 | 44 | |||||||||||||||||
| 13.76 | 159,898 | 1.00 | 1.00 | 1.10 | – | |||||||||||||||||
| 25.65 | (G) | 1,008,875 | 0.75 | 0.75 | 1.56 | 59 | ||||||||||||||||
| 25.33 | (G) | 173,063 | 1.00 | 1.00 | 1.31 | – | ||||||||||||||||
| (37.27 | ) | 868,799 | 0.71 | 0.71 | 1.14 | 73 | ||||||||||||||||
| (37.43 | ) | 165,848 | 0.96 | 0.96 | 0.89 | – | ||||||||||||||||
| 25 |
Hartford Disciplined Equity HLS Fund
Directors and Officers (Unaudited)
The Board of Directors of the Company appoints officers who are responsible for the day-to-day operations of the Fund and who execute policies formulated by the Directors. Each director serves until his or her death, resignation, or retirement or until the next annual meeting of shareholders is held or until his or her successor is elected and qualifies.
Directors and officers who are employed by or who have a financial interest in The Hartford are considered “interested” persons of the Fund pursuant to the 1940 Act. Each officer and two of the Company’s directors, as noted in the chart below, are “interested” persons of the Fund. Each director serves as a director for The Hartford Mutual Funds, Inc., The Hartford Mutual Funds II, Inc., Hartford Series Fund, Inc., Hartford HLS Series Fund II, Inc., and as a trustee for The Hartford Alternative Strategies Fund, which, as of June 30, 2013, collectively consist of 90 funds. Correspondence may be sent to directors and officers c/o Hartford Mutual Funds, P.O. Box 2999, Hartford, Connecticut 06104-2999, except that correspondence to Mr. Annoni, Mr. Dressen, Ms. Fagely and Ms. Quade may be sent to 500 Bielenberg Drive, Woodbury, Minnesota 55125 and correspondence to Mr. Davey and Mr. Melcher may be sent to 5 Radnor Corporate Center, Suite 300, 100 Matsonford Road, Radnor, Pennsylvania 19087.
The table below sets forth, for each director and officer, his or her name, year of birth, current position with the Company and date first elected or appointed to Hartford Series Fund, Inc. (“HSF”), and Hartford HLS Series Fund II, Inc. (“HSF2”), principal occupation, and, for directors, other directorships held. The Fund’s statement of additional information contains further information on the directors and is available free of charge by calling 1-800-862-6668 or writing to Hartford HLS Funds, c/o Hartford Life Insurance Company, Hartford Life and Annuity Insurance Company, P.O. Box 14293, Lexington, KY 40512-4293.
Information on the aggregate remuneration paid to the directors of the Company can be found in the Statement of Operations herein. The Fund pays to The Hartford a portion of the Chief Compliance Officer’s compensation, but does not pay salaries or compensation to any of their other officers or directors who are employed by The Hartford.
Non-Interested Directors
Lynn S. Birdsong (1946) Director since 2003, Co-Chairman of the Investment Committee
Mr. Birdsong is a private investor. Mr. Birdsong currently serves as a Director of the Sovereign High Yield Investment Company (April 2010 to current). Mr. Birdsong currently serves as an Independent Director of Nomura Partners Funds, Inc. (formerly, The Japan Fund) (March 2003 to current). From 1979 to 2002, Mr. Birdsong was a managing director of Zurich Scudder Investments, an investment management firm. During his employment with Scudder, Mr. Birdsong was an Interested Director of The Japan Fund. Since 1981, Mr. Birdsong has been a partner in Birdsong Company, an advertising specialty firm.
Robert M. Gavin, Jr. (1940) Director since 2002 (HSF) and 1986 (HSF2), Chairman of the Board since 2004
Dr. Gavin is an educational consultant. Prior to September 1, 2001, he was President of Cranbrook Education Community and prior to July 1996, he was President of Macalester College, St. Paul, Minnesota.
Duane E. Hill (1945) Director since 2001 (HSF) and 2002 (HSF2), Chairman of the Nominating Committee
Mr. Hill is Partner of TSG Ventures L.P., a private equity investment company. Mr. Hill is a former partner of TSG Capital Group, a private equity investment firm that served as sponsor and lead investor in leveraged buyouts of middle market companies.
Sandra S. Jaffee (1941) Director since 2005
Ms. Jaffee is the founder and Chief Executive Officer of a private company, Homeworks Concierge, LLC, which provides residential property management services in Westchester County, New York (January 2012 to present). Ms. Jaffee served as Chairman (2008 to 2009) and Chief Executive Officer of Fortent (formerly Searchspace Group), a leading provider of compliance/regulatory technology to financial institutions from August 2005 to August 2009. Ms. Jaffee currently serves as a member of the Board of Directors of Broadridge Financial Solutions as well as a Trustee of Muhlenberg College.
William P. Johnston (1944) Director since 2005, Chairman of the Compliance Committee
In February 2008, Mr. Johnston was elected to the Board of Directors of HCR-ManorCare, Inc. In August 2007, Mr. Johnston was elected to the Board of Directors of LifeCare Holdings, Inc. In July 2006, Mr. Johnston was elected to the Board of Directors of MultiPlan, Inc. and served as a director (July 2006 to August 2010). In June 2006, Mr. Johnston was appointed as Senior Advisor to The Carlyle Group, a global private equity and alternative asset investment firm. In May 2006, Mr. Johnston was elected to the Supervisory Board of Fresenius Medical Care AG & Co. KGaA, after its acquisition of Renal Care Group, Inc. in March 2006.
| 26 |
Phillip O. Peterson (1944) Director since 2002 (HSF) and 2000 (HSF2), Chairman of the Audit Committee
Mr. Peterson is a mutual fund industry consultant. He was a partner of KPMG LLP (an accounting firm) until July 1999. Mr. Peterson joined William Blair Funds in February 2007 as a member of the Board of Trustees. Mr. Peterson also joined the Board of Trustees of Symetra Variable Mutual Funds Trust as a trustee in February 2012.
Lemma W. Senbet (1946) Director since 2005
Dr. Senbet is the William E. Mayer Chair Professor of Finance and Director, Center for Financial Policy, at the University of Maryland, Robert H. Smith School of Business. He was chair of the Finance Department from 1998 to 2006. Previously he was a chaired professor of finance at the University of Wisconsin-Madison. Also, he was director of the Fortis Funds from March 2000 to July 2002. Dr. Senbet served the finance profession in various capacities, including as director of the American Finance Association and President of the Western Finance Association. In 2006, Dr. Senbet was inducted Fellow of Financial Management Association International for his career-long distinguished scholarship and professional service.
Interested Directors and Officers
James E. Davey (1964) Director since 2012, President and Chief Executive Officer since 2010
Mr. Davey serves as Executive Vice President of Hartford Life Insurance Company (“HLIC”) and The Hartford Financial Services Group, Inc. Additionally, Mr. Davey serves as Chairman of the Board and Manager of Hartford Funds Distributors, LLC (“HFD”) and Hartford Administrative Services Company (“HASCO”). Mr. Davey also serves as Manager, President and Chairman of the Board for Hartford Funds Management Company, LLC (“HFMC”). Mr. Davey joined The Hartford in 2002.
Lowndes A. Smith (1939) Director since 1996 (HSF) and 2002 (HSF2), Co-Chairman of the Investment Committee
Mr. Smith served as Vice Chairman of The Hartford from February 1997 to January 2002, as President and Chief Executive Officer of Hartford Life, Inc. from February 1997 to January 2002, and as President and Chief Operating Officer of The Hartford Life Insurance Companies from January 1989 to January 2002. Mr. Smith serves as a Director of White Mountains Insurance Group, Ltd., One Beacon Insurance and Symetra Financial and as Managing Director of Whittington Gray Associates.
Other Officers
Mark A. Annoni (1964) Vice President, Controller and Treasurer since 2012
Mr. Annoni serves as the Assistant Vice President of HLIC (February 2004 to present). Mr. Annoni joined The Hartford in April 2001 as part of The Hartford’s acquisition of Fortis Financial Group (“Fortis”). Prior to joining The Hartford, Mr. Annoni served as Manager of Mutual Fund Accounting at Fortis (July 1997 to April 2001).
Michael R. Dressen (1963) AML Compliance Officer since 2011
Mr. Dressen currently serves as Assistant Vice President of HLIC. He also serves as Chief Compliance Officer and AML Compliance Officer of HASCO and as AML Officer of HFD. Mr. Dressen joined The Hartford in 2005 from State Farm Insurance Companies where he held various positions related to mutual funds, variable products, and property casualty insurance.
Tamara L. Fagely (1958) Vice President since 2002 (HSF) and 1993 (HSF2)
Currently, Ms. Fagely is President and a Director of HASCO, Chief Administrative Officer and Manager of HFMC and a Vice President of HLIC. Ms. Fagely served as a Vice President of HASCO (1998-2013) and Chief Financial Officer of HASCO (2006-2013). She served as Assistant Vice President of HLIC from December 2001 through March 2005. In addition, Ms. Fagely is Manager and Chief Operating Officer of HFD.
Edward P. Macdonald (1967) Vice President, Secretary and Chief Legal Officer since 2005
Mr. Macdonald serves as Vice President of HLIC and Vice President, Chief Legal Officer and Secretary of HFD and HASCO. Mr. Macdonald also serves as Manager, Vice President, Chief Legal Officer and Secretary of HFMC. Mr. Macdonald joined The Hartford in 2005.
| 27 |
Hartford Disciplined Equity HLS Fund
Directors and Officers (Unaudited) – (continued)
Joseph G. Melcher (1973) Vice President and Chief Compliance Officer since 2013(1)
Mr. Melcher currently serves as Vice President of HFMC and HFD. Mr. Melcher joined The Hartford in 2012 from Touchstone Investments, a member of the Western & Southern Financial Group, where he held the position of Vice President and Chief Compliance Officer from 2010 through 2012 and Assistant Vice President, Compliance from 2005 to 2010.
(1) Mr. Melcher was named Vice President and Chief Compliance Officer of HSF and HSF2 on February 6, 2013. Prior to February 6, 2013, Colleen Pernerewski served as Chief Compliance Officer of HSF and HSF2.
Vernon J. Meyer (1964) Vice President since 2006
Mr. Meyer serves as Senior Vice President of HLIC. He also serves as Senior Vice President of HFMC and HFD. Mr. Meyer joined The Hartford in 2004.
Laura S. Quade (1969) Vice President since 2012
Ms. Quade currently serves as Vice President of HASCO and is a Director of Mutual Fund Service Operations. She also serves as Director, Enterprise Operations of HFD and HLIC. Ms. Quade joined The Hartford in 2001 as part of The Hartford’s acquisition of Fortis.
Elizabeth L. Schroeder (1966) Vice President since 2010(2)
Ms. Schroeder currently serves as Assistant Vice President of HLIC. Ms. Schroeder joined HLIC in 1991. She is also an Assistant Vice President of HFMC and HASCO.
(2) Ms. Schroeder served as Vice President of HSF and HSF2 until August 7, 2013.
Martin Swanson (1962) Vice President since 2010
Mr. Swanson is a Vice President of HLIC. Mr. Swanson also serves as Chief Marketing Officer for HFD. Prior to joining HLIC in 1998, Mr. Swanson was a Vice President at PaineWebber, Inc.
HOW TO OBTAIN A COPY OF THE FUND’S PROXY VOTING POLICIES AND VOTING RECORDS (UNAUDITED)
A description of the policies and procedures that the Fund uses to determine how to vote proxies relating to portfolio securities and information about how the Fund voted proxies relating to portfolio securities during the most recent twelve-month period ended June 30 are available (1) without charge, upon request, by calling 800-862-6668 and (2) on the SEC’s website at http://www.sec.gov.
QUARTERLY PORTFOLIO HOLDINGS INFORMATION (UNAUDITED)
The Fund files a complete schedule of portfolio holdings with the SEC for the first and third quarters of each fiscal year on Form N-Q. The Fund’s Forms are available (1) without charge, upon request, by calling 800-862-6668 and (2) on the SEC’s website at http://www.sec.gov. The Form N-Q may be reviewed and copied at the SEC’s Public Reference Room in Washington, DC. Information on the operation of the Public Reference Room may be obtained by calling 1-800-SEC-0330.
| 28 |
Hartford Disciplined Equity HLS Fund
Expense Example (Unaudited)
Your Fund's Expenses
As a shareholder of the Fund, you incur two types of costs: (1) transaction costs and (2) ongoing costs including investment management fees, distribution fees, if any, and other fund expenses. This example is intended to help you understand your ongoing costs (in dollars) of investing in the Fund and to compare these costs with the ongoing costs of investing in other mutual funds. The example is based on an investment of $1,000 invested at the beginning of the period and held for the period of December 31, 2012 through June 30, 2013.
Actual Expenses
The first set of columns of the table below provides information about actual account values and actual expenses. You may use the information in this column, together with the amount you invested, to estimate the expenses that you paid over the period. Simply divide your account value by $1,000 (for example, an $8,600 account value divided by $1,000 = 8.6), then multiply the result by the number in the line under the heading entitled “Expenses Paid During Period” to estimate the expenses you paid on your account during this period.
Hypothetical Example for Comparison Purposes
The second set of columns of the table below provides information about hypothetical account values and hypothetical expenses based on the Fund’s actual expense ratio and an assumed rate of return of 5% per year before expenses, which is not the Fund’s actual return. The hypothetical account values and expenses may not be used to estimate the actual ending account balance or expenses you paid for the period. You may use this information to compare the ongoing costs of investing in the Fund and other funds. To do so, compare this 5% hypothetical example with the 5% hypothetical examples that appear in the shareholder reports of the other funds.
Please note that the expenses shown in the table are meant to highlight your ongoing costs only and do not reflect any transactional costs, such as sales charges (loads) and CDSC. Therefore, the second set of columns of the table is useful in comparing ongoing costs only, and will not help you determine the relative total costs of owning different funds. In addition, if these transactional costs were included, your costs would be higher. Expenses are equal to the Fund's annualized expense ratios multiplied by average account value over the period, multiplied by 181/365 (to reflect the one-half year period).
| Actual return | Hypothetical (5% return before expenses) | |||||||||||||||||||||||||||||||||||
| Beginning Account Value December 31, 2012 | Ending Account Value June 30, 2013 | Expenses paid during the period December 31, 2012 through June 30, 2013 | Beginning Account Value December 31, 2012 | Ending Account Value June 30, 2013 | Expenses paid during the period December 31, 2012 through June 30, 2013 | Annualized expense ratio | Days in the current 1/2 year | Days in the full year | ||||||||||||||||||||||||||||
| Class IA | $ | 1,000.00 | $ | 1,144.50 | $ | 3.99 | $ | 1,000.00 | $ | 1,021.08 | $ | 3.76 | 0.75 | % | 181 | 365 | ||||||||||||||||||||
| Class IB | $ | 1,000.00 | $ | 1,143.10 | $ | 5.31 | $ | 1,000.00 | $ | 1,019.84 | $ | 5.01 | 1.00 | % | 181 | 365 | ||||||||||||||||||||
| 29 |
Hartford Disciplined Equity HLS Fund
Principal Risks (Unaudited)
The principal risks of investing in the Fund are described below.
Market, Selection, and Strategy Risk: The Fund’s share price may fluctuate due to market risk and/or security selections that may underperform the market or relevant benchmarks. If the sub-adviser’s investment strategy does not perform as expected, the Fund could underperform its peers or lose money. There is no guarantee the Fund will achieve its stated objective.
Foreign Investment Risk: Foreign investments can be riskier than U.S. investments. Potential risks include currency risk that may result from unfavorable exchange rates, liquidity risk if decreased demand for a security makes it difficult to sell at the desired price, and risks that stem from substantially lower trading volume on foreign markets.
Quantitative Analysis Risk: The Fund uses quantitative analysis in its securities selection; securities selected by this method may perform differently from the broader stock market.
Active Trading Risk: Actively trading investments may result in higher costs (thus affecting performance).
| 30 |
HARTFORD HLS FUNDS
c/o The Hartford Wealth Management - Global Annuities
P.O. Box 14293
Lexington, KY 40512-4293
HARTFORDFUNDS
hartfordfunds.com
Hartford Series Fund, Inc. is underwritten and distributed by Hartford Funds Distributors, LLC.
Hartford Series Fund, Inc. inception dates range from 1977 to date. Hartford Series Fund, Inc. is not a subsidiary of The Hartford Financial Services Group, Inc. ("The Hartford") but is underwritten, distributed by and advised by subsidiaries of The Hartford. Investments in Hartford Series Fund, Inc. are not guaranteed by The Hartford or any other entity.
You should carefully consider investment objectives, risks, and charges and expenses of Hartford HLS Funds before investing. This and other information can be found in the Fund’s prospectus or summary prospectus, which can be obtained by calling 800-862-6668. Please read them carefully before you invest or send money.
HLSSAR-DE13 8-13 114610 Printed in U.S.A ©2013 The Hartford, Hartford, CT 06115
HARTFORDFUNDS
| HARTFORD DIVIDEND AND
GROWTH HLS FUND
2013 Semi Annual Report
|
A MESSAGE FROM THE PRESIDENT
Dear Fellow Shareholders:
I want to take this opportunity to say thank you for investing in the Hartford HLS Funds.
Market Review
During the first half of the year, stocks rose steadily. U.S. equities (as represented by the S&P 500 Index1) posted a strong gain of 10.61% during the first quarter, on their way to an all-time high. During the second quarter, investors persevered through volatility surrounding rumors of the rollback of the U.S. Federal Reserve’s quantitative easing (QE) program later this year, and the S&P 500 Index rose 2.91%. That brought the market’s rise to 13.82% for the first half of 2013. The rumors about QE’s end sent bond yields and mortgage rates upward, but that wasn’t enough to dissuade investors from pushing equities into positive territory.
Because of QE, some have expressed concerns regarding the recent market rally. But a more careful examination of economic data reveals a strong foundation. Consumer balance sheets have improved since the financial crisis, with consumer debt as a percentage of income falling steadily. Housing continued its dogged recovery, fueled by population growth and pent-up demand. In fact, it’s substantive economic improvements that have moved Federal Reserve Chairman Ben Bernanke to consider removing the “training wheels” of QE, which we think should be viewed as a vote of confidence in the U.S. economy going forward.
As the U.S. outlook continues to improve, concerns do remain in the global economy. Emerging markets have lagged due to social unrest and rising inflation. Slowing growth in China is clouding global growth forecasts, but it’s important to remember that China still boasts 7.5% annual GDP growth.
It’s important to stay abreast of domestic and international economic developments while balancing your individual investment goals. Meeting with your financial advisor on a regular basis to examine your current investment strategy can help you determine whether you are on the right track:
| • | Is your portfolio fully diversified with an appropriate mix of stocks and bonds? |
| • | Is your fixed-income portfolio positioned to take advantage of opportunities across the credit spectrum and fulfill your income needs? |
| • | Is your portfolio still in line with your risk tolerance and investment time horizon? |
Your financial professional can help you choose options within our fund family to navigate today’s markets with confidence.
Thank you again for investing with the Hartford HLS Funds.
James Davey
President
Hartford HLS Funds
1 The S&P 500 Index is a market capitalization-weighted price index composed of 500 widely held common stocks.
Hartford Dividend and Growth HLS Fund
Table of Contents
This report is prepared for the general information of contract owners and qualified retirement plan participants. It is not an offer of contracts or of qualified retirement plans. It should not be used in connection with any offer, except in conjunction with the appropriate product prospectus which contains all pertinent information including the applicable sales, administrative and other charges.
The views expressed in the Fund’s Manager Discussion under ‘‘Why did the Fund perform this way?’’ and ‘‘What is the outlook?’’ are views of the Fund’s sub-adviser and portfolio management team through the end of the period and are subject to change based on market and other conditions. The Fund’s Manager Discussion is for informational purposes only and does not represent an offer, recommendation or solicitation to buy, hold or sell any security. The specific securities identified and described, if any, do not represent all of the securities purchased or sold and you should not assume that investments in the securities identified and discussed will be profitable.
Hartford Dividend and Growth HLS Fund inception 03/09/1994
(sub-advised by Wellington Management Company, LLP)
Investment objective – Seeks a high level of current income consistent with growth of capital.
Performance Overview 6/30/03 - 6/30/13

The chart above represents the hypothetical growth of a $10,000 investment in Class IA. Growth results in classes other than Class IA will vary from what is seen above due to differences in the expenses charged to those share classes.
Average Annual Total Returns (as of 6/30/13)
| 6 Month† | 1 Year | 5 Years | 10 Years | |||||||||||||
| Dividend and Growth IA | 15.20% | 21.91% | 6.80% | 8.60% | ||||||||||||
| Dividend and Growth IB | 15.06% | 21.60% | 6.53% | 8.33% | ||||||||||||
| Russell 1000 Value Index | 15.90% | 25.32% | 6.67% | 7.79% | ||||||||||||
| S&P 500 Index | 13.82% | 20.58% | 7.00% | 7.29% | ||||||||||||
| † | Not Annualized |
PERFORMANCE DATA QUOTED REPRESENTS PAST PERFORMANCE AND DOES NOT GUARANTEE FUTURE RESULTS. The investment return and principal value of the investment will fluctuate so that investors’ shares, when redeemed, may be worth more or less than their original cost. Current performance may be lower or higher than the performance data quoted. To obtain performance data current to the most recent month-end, please visit our website www.hartfordfunds.com.
Total returns presented above were calculated using the Fund’s net asset value available to shareholders for sale or redemption of Fund shares on June 30, 2013, which may exclude investment transactions as of this date. All share class returns assume the reinvestment of all distributions at net asset value and the deduction of all fund expenses.
Russell 1000 Value Index is an unmanaged index measuring the performance of those Russell 1000 Index companies with lower price-to-book ratios and lower forecasted growth values. The Russell 1000 Index is an unmanaged index that measures the performance of the 1,000 largest companies in the Russell 3000 Index, which measures the performance of the 3,000 largest U.S. companies, based on total market capitalizations.
S&P 500 Index is a market capitalization-weighted price index composed of 500 widely held common stocks.
You cannot invest directly in an index.
As of the Fund’s current prospectus dated May 1, 2013, the total annual operating expense ratios for Class IA and Class IB shares were 0.67% and 0.92%, respectively. Actual expenses may be higher. Please see the accompanying Financial Highlights for expense ratios for the six-month period ended June 30, 2013.
The chart and table do not reflect the deductions of taxes, sales charges or other fees which may be applied at the variable life insurance, variable annuity or qualified retirement plan product level. Any such additional sales charges or other fees or expenses would lower the contract’s or plan’s performance.
All investments are subject to risk including the possible loss of principal. For a discussion of the Fund’s risks, please see the Principal Risks section. For more detailed information on the risks associated with an investment in the Fund, please see the prospectus.
| 2 |
| Hartford Dividend and Growth HLS Fund |
| Manager Discussion |
| June 30, 2013 (Unaudited) |
| Portfolio Managers | ||
| Edward P. Bousa, CFA | Donald J. Kilbride | Matthew G. Baker |
| Senior Vice President and Equity Portfolio Manager | Senior Vice President and Equity Portfolio Manager | Senior Vice President and Equity Portfolio Manager |
How did the Fund perform?
The Class IA shares of the Hartford Dividend and Growth HLS Fund returned 15.20% for the six-month period ended June 30, 2013, outperforming its benchmark, the S&P 500 Index, which returned 13.82% for the same period. The Fund outperformed the 13.63% average return of the Variable Products-Underlying Funds Lipper Equity Income Funds peer group, a group of funds with investment strategies similar to those of the Fund.
Why did the Fund perform this way?
U.S. equities (+13.8%), as measured by the S&P 500 Index, gained during the six-month period, reaching an all-time high in May. The rally began on the first trading day of the year after a last-minute compromise by the U.S. Congress averted the fiscal cliff. Optimism surrounding the fiscal reprieve was furthered during the first half of the period by better-than-expected corporate earnings, a robust housing market, and a gradually improving employment picture. In the second half of the period, a market rally throughout April and the first part of May paused following comments by Federal Reserve (Fed) Chairman Ben Bernanke that suggested the Fed might begin to slow quantitative easing (QE) sooner than investors anticipated. The Federal Open Market Committee’s June statement emphasized that the tapering schedule would depend on improving economic indicators. A strong housing market, positive consumer confidence trends, and a steadily healing labor market lent support to the thesis that underlying fundamentals were solid. Following an initially dramatic negative response to the Fed’s announcement and an increase in lending rates in China, U.S. markets moved higher into the end of the period.
Overall equity market performance was positive for the period across all market capitalizations: large cap equities (+14%), small caps (+16%), and mid caps (+15%) all rose as represented by the S&P 500, Russell 2000, and S&P 400 MidCap Indices, respectively. During the six-month period all ten sectors within the S&P 500 Index posted positive returns, led by Health Care (+20%), Consumer Discretionary (+20%), and Financials (+20%).
The Fund’s outperformance relative to the S&P 500 was driven by positive stock selection, particularly within Information Technology, Financials, and Industrials. This was partially offset by weaker selection in Health Care, Materials, and Energy. Sector allocation also positively contributed to relative results, in part by our underweight (i.e. the Fund’s sector position was less than the benchmark position) to Information Technology and overweight to Health Care. A modest cash position detracted in an upward trending market.
The Fund’s top contributors to benchmark-relative performance during the period were Apple (Information Technology), Prudential (Financials), and Wells Fargo (Financials). Shares of Apple, a designer, manufacturer, and retailer of a range of personal electronic products, declined on weaker guidance and slowing growth. We were underweight the shares which positively contributed to relative performance. Shares of Prudential, an insurance services firm, increased on strong and improved quality of earnings, driven by higher stock prices and higher long term interests rates. Shares of Wells Fargo, a diversified financial services company, rose due to better-than-expected earnings and the market’s positive outlook for bank results in a rising interest rate environment. JPMorgan Chase (Financials), Microsoft (Information Technology), and Johnson & Johnson (Health Care) were among the top contributors to absolute performance (i.e. total return).
The Fund’s top detractors from benchmark-relative returns were Barrick Gold (Materials), Pfizer (Health Care), and Eli Lilly (Health Care). Shares of Barrick Gold, a Canada-based gold exploration and mining company, fell due to the sharp decline in gold prices and poor execution on the development of an important new gold mine. Pfizer, a U.S.-based pharmaceutical company, detracted from relative performance as shares increased only modestly relative to the benchmark. Pfizer’s earnings growth has flattened as the company's restructuring is largely over. Eli Lilly, a U.S.-based global pharmaceutical company, underperformed as foreign exchange, weakness in the animal health division, and disappointing pipeline developments (Alzheimer’s) weighed on the stock. Apple (Information Technology) and EMC Corp (Information Technology) also detracted from absolute returns.
| 3 |
| Hartford Dividend and Growth HLS Fund |
| Manager Discussion – (continued) |
| June 30, 2013 (Unaudited) |
What is the outlook?
We believe the global economy is gradually normalizing. While there are fears among market participants about the Fed reducing its quantitative easing measures, we are not overly concerned as we view this action as a shift from a “surge” in liquidity to becoming a source of steady liquidity. We believe the U.S. economy remains poised for a continued modest recovery as consumer spending is still buoyed by household balance sheet and steady job gains. However, we believe the U.S. is still not creating jobs fast enough and a large part of the reduction in the unemployment rate is due to people dropping out of the labor force. We believe housing remains in a solid uptrend and we believe the shortage of inventory should boost prices further in the near term. In the medium-term, we continue to expect U.S. Gross Domestic Product growth in the 1.5 – 2% range.
We believe Europe is gradually healing with growth likely to remain subpar but with the downside risks abating. In China, the transition from an infrastructure, heavy investment spending economy to a more diversified economy has been uneven, but we believe their policy makers have the tools to manage the transition. In our view, China should maintain above average growth. In Japan, we believe that the liquidity boost from accommodative monetary policy and growth recovery should add to the overall world economic recovery.
At the end of the period, our largest overweights were to Financials, Health Care, and Industrials, while we remained underweight to Information Technology, Consumer Staples, and Consumer Discretionary, relative to the benchmark.
Diversification by Industry
as of June 30, 2013
| Industry (Sector) | Percentage of Net Assets | |||
| Automobiles and Components (Consumer Discretionary) | 1.2 | % | ||
| Banks (Financials) | 7.0 | |||
| Capital Goods (Industrials) | 7.0 | |||
| Commercial and Professional Services (Industrials) | 0.7 | |||
| Diversified Financials (Financials) | 7.5 | |||
| Energy (Energy) | 10.9 | |||
| Food and Staples Retailing (Consumer Staples) | 1.5 | |||
| Food, Beverage and Tobacco (Consumer Staples) | 4.5 | |||
| Health Care Equipment and Services (Health Care) | 3.6 | |||
| Household and Personal Products (Consumer Staples) | 1.5 | |||
| Insurance (Financials) | 6.0 | |||
| Materials (Materials) | 1.7 | |||
| Media (Consumer Discretionary) | 6.0 | |||
| Pharmaceuticals, Biotechnology and Life Sciences (Health Care) | 12.3 | |||
| Retailing (Consumer Discretionary) | 2.4 | |||
| Semiconductors and Semiconductor Equipment (Information Technology) | 2.5 | |||
| Software and Services (Information Technology) | 7.5 | |||
| Technology Hardware and Equipment (Information Technology) | 4.2 | |||
| Telecommunication Services (Services) | 2.7 | |||
| Transportation (Industrials) | 3.5 | |||
| Utilities (Utilities) | 4.0 | |||
| Short-Term Investments | 1.6 | |||
| Other Assets and Liabilities | 0.2 | |||
| Total | 100.0 | % | ||
| 4 |
| Hartford Dividend and Growth HLS Fund |
| Schedule of Investments |
| June 30, 2013 (Unaudited) |
| (000’s Omitted) |
| Shares or Principal Amount | Market Value ╪ | |||||||
COMMON STOCKS - 98.2% | ||||||||
| Automobiles and Components - 1.2% | ||||||||
| 3,176 | Ford Motor Co. | $ | 49,127 | |||||
| 75 | Johnson Controls, Inc. | 2,693 | ||||||
| 51,820 | ||||||||
| Banks - 7.0% | ||||||||
| 1,181 | PNC Financial Services Group, Inc. | 86,149 | ||||||
| 799 | US Bancorp | 28,873 | ||||||
| 4,633 | Wells Fargo & Co. | 191,205 | ||||||
| 306,227 | ||||||||
| Capital Goods - 7.0% | ||||||||
| 306 | Boeing Co. | 31,389 | ||||||
| 385 | Deere & Co. | 31,289 | ||||||
| 651 | Eaton Corp. plc | 42,859 | ||||||
| 2,527 | General Electric Co. | 58,608 | ||||||
| 703 | Honeywell International, Inc. | 55,790 | ||||||
| 717 | Raytheon Co. | 47,419 | ||||||
| 259 | Siemens AG ADR | 26,273 | ||||||
| 506 | Textron, Inc. | 13,183 | ||||||
| 306,810 | ||||||||
| Commercial and Professional Services - 0.7% | ||||||||
| 527 | Equifax, Inc. ● | 31,039 | ||||||
| Diversified Financials - 7.5% | ||||||||
| 604 | Ameriprise Financial, Inc. | 48,855 | ||||||
| 1,715 | Bank of America Corp. | 22,051 | ||||||
| 227 | BlackRock, Inc. | 58,258 | ||||||
| 811 | Citigroup, Inc. | 38,893 | ||||||
| 2,639 | JP Morgan Chase & Co. | 139,295 | ||||||
| 862 | Morgan Stanley | 21,051 | ||||||
| 328,403 | ||||||||
| Energy - 10.9% | ||||||||
| 906 | Anadarko Petroleum Corp. | 77,857 | ||||||
| 809 | Baker Hughes, Inc. | 37,336 | ||||||
| 1,103 | BP plc ADR | 46,025 | ||||||
| 949 | Cameco Corp. | 19,606 | ||||||
| 783 | Chevron Corp. | 92,704 | ||||||
| 847 | EnCana Corp. ADR | 14,345 | ||||||
| 1,374 | Exxon Mobil Corp. | 124,129 | ||||||
| 484 | Halliburton Co. | 20,210 | ||||||
| 254 | Occidental Petroleum Corp. | 22,686 | ||||||
| 854 | Suncor Energy, Inc. | 25,199 | ||||||
| 480,097 | ||||||||
| Food and Staples Retailing - 1.5% | ||||||||
| 1,134 | CVS Caremark Corp. | 64,855 | ||||||
| Food, Beverage and Tobacco - 4.5% | ||||||||
| 498 | General Mills, Inc. | 24,188 | ||||||
| 558 | Kraft Foods Group, Inc. | 31,167 | ||||||
| 655 | PepsiCo, Inc. | 53,590 | ||||||
| 586 | Philip Morris International, Inc. | 50,735 | ||||||
| 981 | Unilever N.V. Class NY ADR | 38,557 | ||||||
| 198,237 | ||||||||
| Health Care Equipment and Services - 3.6% | ||||||||
| 1,193 | Cardinal Health, Inc. | 56,294 | ||||||
| 1,341 | Medtronic, Inc. | 69,011 | ||||||
| 502 | UnitedHealth Group, Inc. | 32,852 | ||||||
| 158,157 | ||||||||
| Household and Personal Products - 1.5% | ||||||||
| 853 | Procter & Gamble Co. | 65,701 | ||||||
| Insurance - 6.0% | ||||||||
| 848 | ACE Ltd. | 75,896 | ||||||
| 440 | American International Group, Inc. ● | 19,646 | ||||||
| 606 | Marsh & McLennan Cos., Inc. | 24,199 | ||||||
| 729 | MetLife, Inc. | 33,341 | ||||||
| 1,046 | Principal Financial Group, Inc. | 39,176 | ||||||
| 1,016 | Prudential Financial, Inc. | 74,162 | ||||||
| 266,420 | ||||||||
| Materials - 1.7% | ||||||||
| 966 | Barrick Gold Corp. | 15,210 | ||||||
| 1,851 | Dow Chemical Co. | 59,547 | ||||||
| 74,757 | ||||||||
| Media - 6.0% | ||||||||
| 2,004 | Comcast Corp. Class A | 83,948 | ||||||
| 499 | Omnicom Group, Inc. | 31,357 | ||||||
| 261 | Time Warner Cable, Inc. | 29,400 | ||||||
| 1,096 | Time Warner, Inc. | 63,365 | ||||||
| 864 | Walt Disney Co. | 54,539 | ||||||
| 262,609 | ||||||||
| Pharmaceuticals, Biotechnology and Life Sciences - 12.3% | ||||||||
| 1,003 | AstraZeneca plc ADR | 47,428 | ||||||
| 856 | Bristol-Myers Squibb Co. | 38,259 | ||||||
| 1,384 | Eli Lilly & Co. | 67,960 | ||||||
| 1,174 | Johnson & Johnson | 100,794 | ||||||
| 2,890 | Merck & Co., Inc. | 134,247 | ||||||
| 2,994 | Pfizer, Inc. | 83,868 | ||||||
| 984 | Teva Pharmaceutical Industries Ltd. ADR | 38,571 | ||||||
| 944 | Zoetis, Inc. | 29,151 | ||||||
| 540,278 | ||||||||
| Retailing - 2.4% | ||||||||
| 1,402 | Lowe's Co., Inc. | 57,341 | ||||||
| 707 | Target Corp. | 48,660 | ||||||
| 106,001 | ||||||||
| Semiconductors and Semiconductor Equipment - 2.5% | ||||||||
| 2,488 | Intel Corp. | 60,260 | ||||||
| 1,405 | Texas Instruments, Inc. | 48,999 | ||||||
| 109,259 | ||||||||
| Software and Services - 7.5% | ||||||||
| 235 | Accenture plc | 16,900 | ||||||
| 528 | Automatic Data Processing, Inc. | 36,337 | ||||||
| 551 | eBay, Inc. ● | 28,516 | ||||||
| 506 | IBM Corp. | 96,755 | ||||||
| 3,138 | Microsoft Corp. | 108,340 | ||||||
| 674 | Oracle Corp. | 20,695 | ||||||
| 935 | Yahoo!, Inc. ● | 23,485 | ||||||
| 331,028 | ||||||||
| Technology Hardware and Equipment - 4.2% | ||||||||
| 81 | Apple, Inc. | 31,912 | ||||||
| 3,104 | Cisco Systems, Inc. | 75,456 | ||||||
| 1,901 | Corning, Inc. | 27,056 | ||||||
| 2,080 | EMC Corp. | 49,135 | ||||||
| 183,559 | ||||||||
| Telecommunication Services - 2.7% | ||||||||
| 2,406 | Verizon Communications, Inc. | 121,143 | ||||||
| Transportation - 3.5% | ||||||||
| 834 | CSX Corp. | 19,337 | ||||||
| 1,548 | Delta Air Lines, Inc. ● | 28,971 | ||||||
| 435 | FedEx Corp. | 42,845 | ||||||
The accompanying notes are an integral part of these financial statements.
| 5 |
| Hartford Dividend and Growth HLS Fund |
| Schedule of Investments – (continued) |
| June 30, 2013 (Unaudited) |
| (000’s Omitted) |
| Shares or Principal Amount | Market Value ╪ | ||||||||||
| COMMON STOCKS - 98.2% - (continued) | |||||||||||
| Transportation - 3.5% - (continued) | |||||||||||
| 707 | United Parcel Service, Inc. Class B | $ | 61,155 | ||||||||
| 152,308 | |||||||||||
| Utilities - 4.0% | |||||||||||
| 943 | Dominion Resources, Inc. | 53,559 | |||||||||
| 292 | Edison International | 14,061 | |||||||||
| 1,101 | Exelon Corp. | 34,001 | |||||||||
| 648 | NextEra Energy, Inc. | 52,760 | |||||||||
| 809 | Xcel Energy, Inc. | 22,927 | |||||||||
| 177,308 | |||||||||||
| Total common stocks | |||||||||||
| (cost $3,186,477) | $ | 4,316,016 | |||||||||
| Total long-term investments | |||||||||||
| (cost $3,186,477) | $ | 4,316,016 | |||||||||
| SHORT-TERM INVESTMENTS - 1.6% | |||||||||||
| Repurchase Agreements - 1.6% | |||||||||||
| Bank of America Merrill Lynch TriParty Repurchase Agreement (maturing on 07/01/2013 in the amount of $256, collateralized by GNMA 3.00%, 2042, value of $261) | |||||||||||
| $ | 256 | 0.13%, 6/28/2013 | $ | 256 | |||||||
| Bank of Montreal TriParty Repurchase Agreement (maturing on 07/01/2013 in the amount of $5,451, collateralized by FHLMC 4.00% - 5.00%, 2023 - 2025, FNMA 2.00% - 5.00%, 2022 - 2042, GNMA 2.00% - 5.00%, 2041 - 2043, value of $5,545) | |||||||||||
| 5,451 | 0.15%, 6/28/2013 | 5,451 | |||||||||
| Bank of Montreal TriParty Repurchase Agreement (maturing on 07/01/2013 in the amount of $10,590, collateralized by FHLB 0.38%, 2015, FHLMC 0.38%, 2014, FNMA 0.50% - 5.50%, 2015 - 2042, value of $10,776) | |||||||||||
| 10,590 | 0.12%, 6/28/2013 | 10,590 | |||||||||
| Barclays Capital TriParty Repurchase Agreement (maturing on 07/01/2013 in the amount of $7,338, collateralized by U.S. Treasury Note 3.13%, 2021, value of $7,459) | |||||||||||
| 7,338 | 0.10%, 6/28/2013 | 7,338 | |||||||||
| Citigroup Global Markets, Inc. TriParty Repurchase Agreement (maturing on 07/01/2013 in the amount of $21,625, collateralized by U.S. Treasury Bill 0.85%, 2013, U.S. Treasury Note 0.63% - 3.25%, 2013 - 2018, value of $21,950) | |||||||||||
| 21,625 | 0.10%, 6/28/2013 | 21,625 | |||||||||
| Deutsche Bank Securities TriParty Repurchase Agreement (maturing on 07/01/2013 in the amount of $256, collateralized by FNMA 4.50%, 2035, value of $261) | |||||||||||
| 256 | 0.25%, 6/28/2013 | 256 | |||||||||
| RBS Securities, Inc. TriParty Repurchase Agreement (maturing on 07/01/2013 in the amount of $8,672, collateralized by U.S. Treasury Note 1.00% - 2.63%, 2014 - 2020, value of $8,846) | |||||||||||
| 8,672 | 0.10%, 6/28/2013 | 8,672 | |||||||||
| TD Securities TriParty Repurchase Agreement (maturing on 07/01/2013 in the amount of $15,293, collateralized by FHLMC 3.50% - 4.00%, 2042, FNMA 3.50% - 4.50%, 2041 - 2042, value of $15,554) | |||||||||||
| 15,293 | 0.12%, 6/28/2013 | 15,293 | |||||||||
| UBS Securities, Inc. Repurchase Agreement (maturing on 07/01/2013 in the amount of $221, collateralized by U.S. Treasury Note 0.63%, 2014, value of $225) | |||||||||||
| 221 | 0.09%, 6/28/2013 | 221 | |||||||||
| 69,702 | |||||||||||
| Total short-term investments | |||||||||||
| (cost $69,702) | $ | 69,702 | |||||||||
| Total investments | |||||||||||
| (cost $3,256,179) ▲ | 99.8 | % | $ | 4,385,718 | |||||||
| Other assets and liabilities | 0.2 | % | 9,029 | ||||||||
| Total net assets | 100.0 | % | $ | 4,394,747 | |||||||
The accompanying notes are an integral part of these financial statements.
| 6 |
| Note: | Percentage of investments as shown is the ratio of the total market value to total net assets. |
| ▲ | At June 30, 2013, the cost of securities for federal income tax purposes was $3,265,673 and the aggregate gross unrealized appreciation and depreciation based on that cost were: |
| Unrealized Appreciation | $ | 1,176,825 | ||
| Unrealized Depreciation | (56,780 | ) | ||
| Net Unrealized Appreciation | $ | 1,120,045 |
| ● | Non-income producing. |
| ╪ | See Significant Accounting Policies of accompanying Notes to Financial Statements regarding valuation of securities. |
| GLOSSARY: (abbreviations used in preceding Schedule of Investments) | ||
| Other Abbreviations: | ||
| ADR | American Depositary Receipt | |
| FHLB | Federal Home Loan Bank | |
| FHLMC | Federal Home Loan Mortgage Corp. | |
| FNMA | Federal National Mortgage Association | |
| GNMA | Government National Mortgage Association | |
The accompanying notes are an integral part of these financial statements.
| 7 |
| Hartford Dividend and Growth HLS Fund |
| Investment Valuation Hierarchy Level Summary |
| June 30, 2013 (Unaudited) |
| (000’s Omitted) |
| Total | Level 1 ♦ | Level 2 ♦ | Level 3 | |||||||||||||
| Assets: | ||||||||||||||||
| Common Stocks ‡ | $ | 4,316,016 | $ | 4,316,016 | $ | – | $ | – | ||||||||
| Short-Term Investments | 69,702 | – | 69,702 | – | ||||||||||||
| Total | $ | 4,385,718 | $ | 4,316,016 | $ | 69,702 | $ | – | ||||||||
| ♦ | For the six-month period ended June 30, 2013, there were no transfers between Level 1 and Level 2. |
| ‡ | The Fund has all or primarily all of the equity securities categorized in a particular level. Refer to the Schedule of Investments for further industry breakout. |
The accompanying notes are an integral part of these financial statements.
| 8 |
Hartford Dividend and Growth HLS Fund
Statement of Assets and Liabilities
June 30, 2013 (Unaudited)
(000’s Omitted)
| Assets: | ||||
| Investments in securities, at market value (cost $3,256,179) | $ | 4,385,718 | ||
| Cash | 1 | |||
| Receivables: | ||||
| Investment securities sold | 14,632 | |||
| Fund shares sold | 642 | |||
| Dividends and interest | 5,246 | |||
| Other assets | — | |||
| Total assets | 4,406,239 | |||
| Liabilities: | ||||
| Payables: | ||||
| Investment securities purchased | 4,136 | |||
| Fund shares redeemed | 6,682 | |||
| Investment management fees | 463 | |||
| Distribution fees | 25 | |||
| Accrued expenses | 186 | |||
| Total liabilities | 11,492 | |||
| Net assets | $ | 4,394,747 | ||
| Summary of Net Assets: | ||||
| Capital stock and paid-in-capital | $ | 2,899,359 | ||
| Undistributed net investment income | 42,444 | |||
| Accumulated net realized gain | 323,405 | |||
| Unrealized appreciation of investments and the translations of assets and liabilities denominated in foreign currency | 1,129,539 | |||
| Net assets | $ | 4,394,747 | ||
| Shares authorized | 4,000,000 | |||
| Par value | $ | 0.001 | ||
| Class IA: Net asset value per share | $ | 24.72 | ||
| Shares outstanding | 153,175 | |||
| Net assets | $ | 3,787,110 | ||
| Class IB: Net asset value per share | $ | 24.65 | ||
| Shares outstanding | 24,654 | |||
| Net assets | $ | 607,637 |
The accompanying notes are an integral part of these financial statements.
| 9 |
Hartford Dividend and Growth HLS Fund
Statement of Operations
For the Six-Month Period Ended June 30, 2013 (Unaudited)
(000’s Omitted)
| Investment Income: | ||||
| Dividends | $ | 56,895 | ||
| Interest | 29 | |||
| Less: Foreign tax withheld | (464 | ) | ||
| Total investment income, net | 56,460 | |||
| Expenses: | ||||
| Investment management fees | 14,203 | |||
| Transfer agent fees | 2 | |||
| Distribution fees - Class IB | 764 | |||
| Custodian fees | 8 | |||
| Accounting services fees | 265 | |||
| Board of Directors' fees | 57 | |||
| Audit fees | 26 | |||
| Other expenses | 262 | |||
| Total expenses (before fees paid indirectly) | 15,587 | |||
| Commission recapture | (12 | ) | ||
| Total fees paid indirectly | (12 | ) | ||
| Total expenses, net | 15,575 | |||
| Net Investment Income | 40,885 | |||
| Net Realized Gain on Investments and Foreign Currency Transactions: | ||||
| Net realized gain on investments | 237,944 | |||
| Net realized gain on foreign currency contracts | — | |||
| Net realized loss on other foreign currency transactions | (2 | ) | ||
| Net Realized Gain on Investments and Foreign Currency Transactions | 237,942 | |||
| Net Changes in Unrealized Appreciation of Investments and Foreign Currency Transactions: | ||||
| Net unrealized appreciation of investments | 346,139 | |||
| Net unrealized appreciation on translation of other assets and liabilities in foreign currencies | — | |||
| Net Changes in Unrealized Appreciation of Investments and Foreign Currency Transactions | 346,139 | |||
| Net Gain on Investments and Foreign Currency Transactions | 584,081 | |||
| Net Increase in Net Assets Resulting from Operations | $ | 624,966 |
The accompanying notes are an integral part of these financial statements.
| 10 |
Hartford Dividend and Growth HLS Fund
Statement of Changes in Net Assets
(000’s Omitted)
| For the Six-Month Period Ended June 30, 2013 (Unaudited) | For the Year Ended December 31, 2012 | |||||||
| Operations: | ||||||||
| Net investment income | $ | 40,885 | $ | 93,878 | ||||
| Net realized gain on investments and foreign currency transactions | 237,942 | 237,302 | ||||||
| Net unrealized appreciation of investments | 346,139 | 243,080 | ||||||
| Net Increase in Net Assets Resulting from Operations | 624,966 | 574,260 | ||||||
| Distributions to Shareholders: | ||||||||
| From net investment income | ||||||||
| Class IA | — | (83,992 | ) | |||||
| Class IB | — | (12,015 | ) | |||||
| Total distributions | — | (96,007 | ) | |||||
| Capital Share Transactions: | ||||||||
| Class IA | ||||||||
| Sold | 78,761 | 108,142 | ||||||
| Issued on reinvestment of distributions | — | 83,992 | ||||||
| Redeemed | (488,821 | ) | (794,723 | ) | ||||
| Total capital share transactions | (410,060 | ) | (602,589 | ) | ||||
| Class IB | ||||||||
| Sold | 29,548 | 52,210 | ||||||
| Issued on reinvestment of distributions | — | 12,015 | ||||||
| Redeemed | (96,977 | ) | (202,695 | ) | ||||
| Total capital share transactions | (67,429 | ) | (138,470 | ) | ||||
| Net decrease from capital share transactions | (477,489 | ) | (741,059 | ) | ||||
| Net Increase (Decrease) in Net Assets | 147,477 | (262,806 | ) | |||||
| Net Assets: | ||||||||
| Beginning of period | 4,247,270 | 4,510,076 | ||||||
| End of period | $ | 4,394,747 | $ | 4,247,270 | ||||
| Undistributed (distribution in excess of) net investment income | $ | 42,444 | $ | 1,559 | ||||
| Shares: | ||||||||
| Class IA | ||||||||
| Sold | 3,279 | 5,191 | ||||||
| Issued on reinvestment of distributions | — | 3,923 | ||||||
| Redeemed | (20,552 | ) | (37,859 | ) | ||||
| Total share activity | (17,273 | ) | (28,745 | ) | ||||
| Class IB | ||||||||
| Sold | 1,242 | 2,507 | ||||||
| Issued on reinvestment of distributions | — | 562 | ||||||
| Redeemed | (4,094 | ) | (9,685 | ) | ||||
| Total share activity | (2,852 | ) | (6,616 | ) | ||||
The accompanying notes are an integral part of these financial statements.
| 11 |
Hartford Dividend and Growth HLS Fund
Notes to Financial Statements
June 30, 2013 (Unaudited)
(000’s Omitted)
| 1. | Organization: |
Hartford Dividend and Growth HLS Fund (the “Fund”) serves as an underlying investment option for certain variable annuity and variable life insurance separate accounts of Hartford Life Insurance Company (“HLIC”) and its affiliates and certain qualified retirement plans. The Fund may also serve as an underlying investment option for certain variable annuity and variable life separate accounts of other insurance companies. Owners of variable annuity contracts and policyholders of variable life insurance contracts may choose the funds permitted in the variable insurance contract prospectus. In addition, participants in certain qualified retirement plans may choose the Fund if permitted by their plans.
Hartford Series Fund, Inc. (the “Company”) is an open-end registered management investment company comprised of thirty portfolios. Financial statements for the Fund, a series of the Company, are included in this report.
The Company is organized under the laws of the State of Maryland and is registered with the Securities and Exchange Commission (“SEC”) under the Investment Company Act of 1940, as amended (“1940 Act”). The Fund is a diversified open-end management investment company.
The Fund is divided into Class IA and Class IB shares. Each class is offered at the per share net asset value (“NAV”) without a sales charge and is subject to the same expenses, except that the Class IB shares are subject to distribution and service fees charged pursuant to a Distribution Plan adopted in accordance with Rule 12b-1 under the 1940 Act.
| 2. | Significant Accounting Policies: |
The following is a summary of significant accounting policies of the Fund in the preparation of its financial statements, which are in accordance with the United States Generally Accepted Accounting Principles (“U.S. GAAP”). The preparation of financial statements in accordance with U.S. GAAP may require management to make estimates and assumptions that affect the reported amounts of assets and liabilities and disclosure of contingent assets and liabilities at the date of the financial statements and the reported amounts of increases and decreases in net assets from operations during the reporting period. Actual results could differ from those estimates.
| a) | Determination of Net Asset Value – The NAV of each class of the Fund’s shares is determined as of the close of regular trading (normally 4:00 p.m. Eastern Time) (the “NYSE Close”) on each day that the New York Stock Exchange (the “Exchange”) is open (“Valuation Date”). Information that becomes known to the Fund after the NAV has been calculated on a particular day will not generally be used to retroactively adjust the NAV determined earlier that day. |
| b) | Investment Valuation and Fair Value Measurements – For purposes of calculating the NAV, portfolio investments and other assets held by the Fund's portfolio for which market quotes are readily available are valued at market value. Market value is generally determined on the basis of last reported sales prices or official close price. If no sales are reported, market value is based on quotes obtained from a quotation reporting system, established market makers, or independent pricing services. If market prices are not readily available or are deemed unreliable, the Fund will use the fair value of the investment as determined in good faith under policies and procedures established by and under the supervision of the Company’s Board of Directors. Market quotes are considered not readily available where there is an absence of current or reliable market-based data (e.g., trade information or indicative market quotes), including where events occur after the close of the relevant market, but prior to the NYSE Close that materially affect the values of the Fund’s portfolio investments or assets. In addition, market quotes are considered not readily available when, due to extraordinary circumstances, the exchanges or markets on which the investments trade do not open for trading for the entire day and no other market prices are available. In addition, prices of foreign equities that are principally traded on certain foreign markets may be adjusted daily pursuant to a fair value pricing service approved by the Board of Directors in order to reflect an adjustment for the factors occurring after the close of certain foreign markets but before the NYSE Close. Investments that are primarily traded on foreign markets may trade on days that are not business days of the Fund. |
| 12 |
The value of the foreign investments in which the Fund invests may change on days when a shareholder will not be able to purchase or redeem shares of the Fund. Fair value pricing is subjective in nature and the use of fair value pricing by the Fund may cause the NAV of its shares to differ significantly from the NAV that would have been calculated using market prices at the close of the exchange on which a portfolio investment is primarily traded. There can be no assurance that the Fund could obtain the fair market value assigned to an investment if the Fund were to sell the investment at approximately the time at which the Fund determines its NAV.
Investments valued in currencies other than U.S. dollars are converted to U.S. dollars using exchange rates obtained from independent pricing services for calculation of the NAV. As a result, the NAV of the Fund’s shares may be affected by changes in the value of currencies in relation to the U.S. dollar. The value of investments traded in markets outside the United States or denominated in currencies other than the U.S. dollar may be affected significantly on a day that the NYSE is closed and the market value may change on days when an investor is not able to purchase, redeem or exchange shares of the Fund.
Financial instruments for which prices are not available from an independent pricing service may be valued using market quotations obtained from one or more dealers that make markets in the respective financial instrument in accordance with procedures established by the Company’s Board of Directors.
U.S. GAAP defines fair value as the price that the Fund would receive to sell an asset or pay to transfer a liability in an orderly transaction between market participants. The U.S. GAAP fair value measurement standards require disclosure of a fair value hierarchy for each major category of assets and liabilities. Various inputs are used in determining the fair value of the Fund’s investments. These inputs are summarized into three broad hierarchy levels. This hierarchy is based on whether the valuation inputs are observable or unobservable. These levels are:
| · | Level 1 – Quoted prices in active markets for identical investments. Level 1 may include exchange traded instruments, such as domestic equities, some foreign equities, options, futures, mutual funds, exchange traded funds, rights and warrants. |
| · | Level 2 – Observable inputs other than Level 1 prices, such as quoted prices for similar investments; quoted prices in markets that are not active; or other inputs that are observable or can be corroborated by observable market data. Level 2 may include debt investments that are traded less frequently than exchange traded instruments and which are valued using independent pricing services; foreign equities, which are principally traded on certain foreign markets and are adjusted daily pursuant to a fair value pricing service in order to reflect an adjustment for the factors occurring after the close of certain foreign markets but before the NYSE Close; and short-term investments, which are valued at amortized cost. |
| · | Level 3 – Significant unobservable inputs that are supported by limited or no market activity. Level 3 may include financial instruments whose values are determined using indicative market quotes or require significant management judgment or estimation. These unobservable valuation inputs may include estimates for current yields, maturity/duration, prepayment speed, and indicative market quotes for comparable investments along with other assumptions relating to credit quality, collateral value, complexity of the investment structure, general market conditions and liquidity. This category may include investments where trading has been halted or there are certain restrictions on trading. While these investments are priced using unobservable inputs, the valuation of these investments reflects the best available data and management believes the prices are a reasonable representation of exit price. |
The Board of Directors of the Company generally reviews and approves the “Procedures for Valuation of Portfolio Securities” on an annual basis. These procedures define how investments are to be valued, including the formation and activities of a Valuation Committee. The Valuation Committee is responsible for determining in good faith the fair value of investments when the value cannot be obtained from primary pricing services or alternative sources or if the valuation of an investment as provided by the primary pricing service or alternative source is believed not to reflect the investment’s fair value as of the Valuation Date. Members of the Valuation Committee include the Fund’s Treasurer or designee, a Vice President of the Fund with legal expertise or
| 13 |
| Hartford Dividend and Growth HLS Fund |
| Notes to Financial Statements – (continued) |
| June 30, 2013 (Unaudited) |
| (000’s Omitted) |
designee, and a Vice President of the investment manager or designee. In addition, the Fund’s Chief Compliance Officer shall designate a member of the compliance group to attend Valuation Committee meetings as a non-voting resource, to monitor for and provide guidance with respect to compliance with these procedures. Two members of the Valuation Committee or their designees, representing different departments, shall constitute a quorum for purposes of permitting the Valuation Committee to take action. The Valuation Committee will consider all relevant factors in determining an investment’s fair value, and may seek the advice of the Fund’s sub-adviser, knowledgeable brokers, and legal counsel in making such determination. The Valuation Committee reports to the Audit Committee of the Company’s Board of Directors. The Audit Committee receives quarterly written reports which include details of all fair-valued investments, including the reason for the fair valuation, and an indication, when possible, of the accuracy of the valuation by disclosing the next available reliable public price quotation or the disposition price of such investments (the “look-back” test). The Board of Directors then must consider for ratification all of the fair value determinations made during the previous quarter.
Valuation levels are not necessarily indicative of the risk associated with investing in such investments. Individual investments within any of the above mentioned asset classes may be assigned a different hierarchical level than those presented above, as individual circumstances dictate.
For additional information, refer to the Investment Valuation Hierarchy Level Summary and the Level 3 roll-forward reconciliation, if applicable, which follow the Schedule of Investments.
For purposes of reporting transfers between different hierarchy levels, both transfers in and out of each level, as applicable, are shown as if they occurred at the beginning of the period.
| c) | Investment Transactions and Investment Income – Investment transactions are recorded as of the trade date (the date the order to buy or sell is executed) for financial reporting purposes. Investments purchased or sold on a when-issued or delayed-delivery basis may be settled a month or more after the trade date. Realized gains and losses are determined on the basis of identified cost. |
Dividend income from domestic securities is accrued on the ex-dividend date. In general, dividend income from foreign securities is recorded on the ex-date; however, dividend notifications in certain foreign jurisdictions may not be available in a timely manner and as a result, the Fund will record the dividend as soon as the relevant details (i.e., rate per share, payment date, shareholders of record, etc.) are publicly available. Interest income, including amortization of premium and accretion of discounts, is accrued on a daily basis.
| d) | Foreign Currency Transactions – Assets and liabilities denominated in currencies other than U.S. dollars are translated into U.S. dollars at the exchange rates in effect on the valuation date. Purchases and sales of investments, income, and expenses are translated into U.S. dollars at the exchange rates on the dates of such transactions. |
The Fund does not isolate that portion of portfolio investment valuation resulting from fluctuations in the foreign currency exchange rates from the fluctuations arising from changes in the market prices of investments held. Exchange rate fluctuations are included with the net realized and unrealized gain or loss on investments in the accompanying financial statements.
Net realized foreign exchange gains or losses arise from sales of foreign currencies and the difference between asset and liability amounts initially stated in foreign currencies and the U.S. dollar value of the amounts actually received or paid. Net unrealized foreign exchange gains or losses arise from changes in the value of other assets and liabilities at the end of the reporting period, resulting from changes in the exchange rates.
| e) | Joint Trading Account – The Fund may invest cash balances into a joint trading account that may be invested in one or more repurchase agreements. |
| 14 |
| f) | Fund Share Valuation and Dividend Distributions to Shareholders – Orders for the Fund’s shares are executed in accordance with the investment instructions of the contract holders and plan participants. The NAV of the Fund’s shares is determined as of the close of business on each business day of the Exchange. The NAV is determined separately for each class of shares of the Fund by dividing the Fund’s net assets attributable to that class by the number of shares of the class outstanding. Each class of shares offered by the Fund has equal rights as to assets and voting privileges (except that shareholders of a class have exclusive voting rights regarding any matter relating solely to that class of shares). Income and non-class specific expenses are allocated daily to each class on the basis of the relative net assets of the class. Realized and unrealized capital gains and losses are allocated daily based on the relative net assets of each class of shares of the Fund. |
Orders for the purchase of the Fund’s shares received prior to the close of the Exchange on any day the Exchange is open for business are priced at the NAV determined as of the close of the Exchange. Orders received after the close of the Exchange, or on a day on which the Exchange and/or the Fund is not open for business, are priced at the next determined NAV.
Dividends are declared pursuant to a policy adopted by the Company’s Board of Directors based upon the investment performance of the Fund. The policy of the Fund is to pay dividends from net investment income and realized capital gains, if any, at least once a year.
Distributions from net investment income, net realized capital gains and capital are determined in accordance with federal income tax regulations, which may differ from U.S. GAAP with respect to character and timing. These differences may include but are not limited to losses deferred due to wash sale adjustments, foreign currency gains and losses, adjustments related to Passive Foreign Investment Companies (“PFICs”), Real Estate Investment Trusts (“REITs”), Regulated Investment Companies (“RICs”), certain derivatives and partnerships. Permanent book and federal income tax basis differences relating to shareholder distributions will result in reclassifications to certain of the Fund’s capital accounts (see Federal Income Taxes: Reclassification of Capital Accounts note).
| 3. | Securities and Other Investments: |
| a) | Repurchase Agreements – A repurchase agreement is an agreement by which a counterparty agrees to sell an investment and agrees to repurchase the investment sold from the buyer at a mutually agreed upon time and price. During the period of the repurchase agreement, the counterparty will deposit cash and or securities in a third party custodial account to serve as collateral. At the time the Fund enters into a repurchase agreement, the value of the underlying collateral, including accrued interest, will be equal to or exceed the value of the repurchase agreement. Repurchase agreements expose the Fund to counterparty risk - that is, the risk that the counterparty will not fulfill its obligations. To minimize counterparty risk, the investments that serve to collateralize the repurchase agreement are held by the Fund’s custodian in book entry or physical form in the custodial account of the Fund or in a third party custodial account. Repurchase agreements are valued at cost plus accrued interest, which approximates fair value. Repurchase agreements have master netting agreements which allow the Fund to offset amounts owed to a counterparty with amounts owed by the counterparty, including any collateral. The Fund, as shown on the Schedule of Investments, had outstanding repurchase agreements as of June 30, 2013. |
| 4. | Principal Risks: |
| a) | Counterparty Risk – The Fund may be exposed to counterparty risk, or the risk that an institution or other entity with which the Fund has unsettled or open transactions will default. |
| b) | Market Risks – If the Fund invests directly in foreign currencies or in securities that trade in, and receive revenues in, foreign currencies, or in derivatives that provide exposure to foreign currencies, it will be subject to the risk that those currencies will decline in value relative to the base currency of the Fund, or, in the case of hedging positions, that the Fund’s base currency will decline in value relative to the currency being hedged. Currency rates in foreign countries may |
| 15 |
| Hartford Dividend and Growth HLS Fund |
| Notes to Financial Statements – (continued) |
| June 30, 2013 (Unaudited) |
| (000’s Omitted) |
fluctuate significantly over short periods of time for a number of reasons, including changes in interest rates, intervention (or the failure to intervene) by U.S. or foreign governments, central banks or supranational entities, such as the International Monetary Fund, or by the imposition of currency controls or other political developments in the United States or abroad. As a result, the Fund’s investments in foreign currency denominated securities may reduce the returns of the Fund. The market values of equity securities, such as common stocks and preferred stocks, or equity related investments, such as futures and options, may decline due to general market conditions which are not specifically related to a particular company, such as real or perceived adverse economic conditions, changes in the general outlook for corporate earnings, changes in interest or currency rates or adverse investor sentiment generally. The market value of equity securities may also decline due to factors which affect a particular industry or industries, such as labor shortages or increased production costs and competitive conditions within an industry. Equity securities and equity related investments generally have greater market price volatility than fixed income securities.
| 5. | Federal Income Taxes: |
| a) | Federal Income Taxes – For federal income tax purposes, the Fund intends to continue to qualify as a RIC under Subchapter M of the Internal Revenue Code (“IRC”) by distributing substantially all of its taxable net investment income and net realized capital gains to its shareholders and otherwise complying with the requirements of the IRC. The Fund has distributed substantially all of its income and capital gains in prior years, if applicable, and intends to distribute substantially all of its income and capital gains prior to the next fiscal year-end. Accordingly, no provision for federal income or excise taxes has been made in the accompanying financial statements. Distributions from short-term capital gains are treated as ordinary income distributions for federal income tax purposes. |
| b) | Net Investment Income (Loss), Net Realized Gains (Losses), and Distributions – Net investment income (loss) and net realized gains (losses) may differ for financial statement and tax purposes primarily because of losses deferred due to wash sale adjustments, foreign currency gains and losses, adjustments related to PFICs, REITs, RICs, certain derivatives and partnerships. The character of distributions made during the year from net investment income or net realized gains may differ from their ultimate characterization for federal income tax purposes. Also, due to the timing of dividend distributions, the fiscal year in which amounts are distributed may differ from the year that the income or realized gains (losses) were recorded by the Fund. |
| c) | Distributions and Components of Distributable Earnings – The tax character of distributions paid by the Fund for the periods indicated is as follows (as adjusted for dividends payable, if applicable): |
| For the Year Ended December 31, 2012 | For the Year Ended December 31, 2011 | |||||||
| Ordinary Income | $ | 96,007 | $ | 93,438 | ||||
As of December 31, 2012, the Fund’s components of distributable earnings (deficit) on a tax basis were as follows:
| Amount | ||||
| Undistributed Ordinary Income | $ | 1,559 | ||
| Undistributed Long-Term Capital Gain | 94,957 | |||
| Unrealized Appreciation* | 773,906 | |||
| Total Accumulated Earnings | $ | 870,422 | ||
| * | Differences between book-basis and tax-basis unrealized appreciation (depreciation) may be attributable to the losses deferred due to wash sale adjustments, foreign currency gains and losses, adjustments related to PFICs, REITs, RICs, certain derivatives and partnerships. |
| 16 |
| d) | Reclassification of Capital Accounts – The Fund may record reclassifications in its capital accounts. These reclassifications have no impact on the total net assets of the Fund. The reclassifications are a result of permanent differences between U.S. GAAP and tax accounting for such items as foreign currency, PFICs, expiration or utilization of capital loss carryforwards or net operating losses. Adjustments are made to reflect the impact these items have on current and future distributions to shareholders. Therefore, the source of the Fund’s distributions may be shown in the accompanying Statement of Changes in Net Assets as from undistributed net investment income, from accumulated net realized gains on investments or from capital depending on the type of book and tax differences that exist. For the year ended December 31, 2012, the Fund recorded reclassifications to increase (decrease) the accounts listed below: |
| Amount | ||||
| Undistributed Net Investment Income | $ | (362 | ) | |
| Accumulated Net Realized Gain (Loss) | 362 | |||
| e) | Capital Loss Carryforward – On December 22, 2010, the Regulated Investment Company Modernization Act of 2010 (the “Act”) was enacted, which made changes to the capital loss carryforward rules. The changes are effective for taxable years beginning after the date of enactment. Under the Act, funds are permitted to carry forward capital losses for an unlimited period. However, any losses incurred during those future taxable years will be required to be utilized prior to the losses incurred in pre-enactment taxable years, which carry an expiration date. As a result of this ordering rule, pre-enactment capital loss carryforwards may be more likely to expire unused. Additionally, post-enactment capital loss carryforwards retain their character as either short-term or long-term capital losses rather than being considered all short-term as permitted under prior regulation. |
The Fund had no capital loss carryforward for U.S. federal income tax purposes as of December 31, 2012.
During the year ended December 31, 2012, the Fund utilized $139,514 of prior year capital loss carryforwards.
| f) | Accounting for Uncertainty in Income Taxes – The Fund has adopted financial reporting rules that require the Fund to analyze all open tax years, as defined by the statute of limitations, for all major jurisdictions. Generally, tax authorities can examine all tax returns filed for the last three years. The Fund does not have an examination in progress. |
The Fund has reviewed all open tax years and major jurisdictions and concluded that these financial reporting rules had no effect on the Fund’s financial position or results of operations. There is no tax liability resulting from unrecognized tax benefits relating to uncertain income tax positions taken or expected to be taken on the tax return for the fiscal year ended December 31, 2012. The Fund is also not aware of any tax positions for which it is reasonably possible that the total amounts of unrecognized tax benefits will significantly change in the next twelve months.
| 6. | Expenses: |
| a) | Investment Management Agreement – Hartford Funds Management Company, LLC (“HFMC”), an indirect wholly owned subsidiary of The Hartford Financial Services Group, Inc. (“The Hartford”), serves as investment manager to the Fund pursuant to an Investment Management Agreement with the Company. The investment manager has overall investment supervisory responsibility for the Fund. In addition, the investment manager provides administrative personnel, services, equipment, facilities and office space for proper operation of the Fund. The investment manager has contracted with Wellington Management Company, LLP (“Wellington Management”) under a sub-advisory agreement for the provision of day-to-day investment management services to the Fund in accordance with the Fund’s investment objective and policies. The Fund pays a fee to the investment manager, a portion of which may be used to compensate Wellington Management. |
| 17 |
| Hartford Dividend and Growth HLS Fund |
| Notes to Financial Statements – (continued) |
| June 30, 2013 (Unaudited) |
| (000’s Omitted) |
The schedule below reflects the rates of compensation paid to HFMC for investment management services rendered as of June 30, 2013; the rates are accrued daily and paid monthly.
| Average Daily Net Assets | Annual Fee | |||
| On first $250 million | 0.7750 | % | ||
| On next $250 million | 0.7250 | % | ||
| On next $500 million | 0.6750 | % | ||
| On next $1.5 billion | 0.6250 | % | ||
| On next $2.5 billion | 0.6200 | % | ||
| On next $5 billion | 0.6150 | % | ||
| Over $10 billion | 0.6100 | % | ||
| b) | Accounting Services Agreement – Pursuant to the Fund Accounting Agreement between HFMC and the Company, on behalf of the Fund, HFMC provides accounting services to the Fund and receives monthly compensation based on the Fund’s average daily net assets at the rates set forth below. The Fund’s accounting services fees are accrued daily and paid monthly. |
| Average Daily Net Assets | Annual Fee | |||
| On first $5 billion | 0.012 | % | ||
| Over $5 billion | 0.010 | % | ||
| c) | Operating Expenses – Allocable expenses incurred by the Company are allocated to each Fund and allocated to classes within a Fund in proportion to the average daily net assets of the Fund and each class, except where allocation of certain expenses is more fairly made directly to the Fund or to specific classes within a Fund. |
| d) | Fees Paid Indirectly – The Company, on behalf of the Fund, has entered into agreements with State Street Global Markets, LLC and Russell Implementation Services, Inc. to partially recapture non-discounted trade commissions. Such rebates are used to pay a portion of the Fund’s expenses. In addition, the Fund’s custodian banks have agreed to reduce its fees when the Fund maintains cash on deposit in a non-interest-bearing custody account. For the six-month period ended June 30, 2013, these amounts, if any, are included in the Statement of Operations. |
The ratio of expenses to average net assets in the accompanying financial highlights excludes the reduction in expenses related to fees paid indirectly. The annualized expense ratio for the period listed below reflecting the reduction for fees paid indirectly is as follows:
| Annualized Six- Month Period Ended June 30, 2013 | ||||
| Class IA | 0.67 | % | ||
| Class IB | 0.92 | |||
| e) | Distribution Plan for Class IB shares – The Company, on behalf of the Fund, has adopted a Distribution Plan pursuant to Rule 12b-1 of the 1940 Act to compensate the distributor, Hartford Funds Distributors, LLC (“HFD”), (formerly known as Hartford Investment Financial Services, LLC), an indirect wholly owned subsidiary of The Hartford, from assets attributable to the Class IB shares for services rendered and expenses borne in connection with activities primarily intended to result in the sale of the Class IB shares, subject to the review and approval of the Company’s Board of Directors. |
The Distribution Plan provides that the Fund may pay annually up to 0.25% of the average daily net assets of the Fund attributable to its Class IB shares for activities primarily intended to result in the sale of Class IB shares. The Board has
| 18 |
the authority to suspend or reduce these payments at any point in time. Under the terms of the Distribution Plan and the principal underwriting agreement, the Fund is authorized to make payments monthly to the distributor that may be used to pay or compensate entities providing distribution and shareholder servicing with respect to the Class IB shares for such entities’ fees or expenses incurred or paid in that regard. These fees are accrued daily and paid monthly.
| f) | Other Related Party Transactions – Certain officers of the Fund are directors and/or officers of the investment manager and/or The Hartford or its subsidiaries. For the six-month period ended June 30, 2013, a portion of the Fund’s Chief Compliance Officer’s salary was paid by all the investment companies in the Hartford fund complex. The portion allocated to the Fund was in the amount of $2. Hartford Administrative Services Company (“HASCO”), an indirect wholly owned subsidiary of The Hartford, provides transfer agent services to the Fund. HASCO was compensated on a per account basis for providing such services. The amount paid to HASCO can be found in the Statement of Operations. These fees are accrued daily and paid monthly. |
| g) | Payment from Affiliate – In July of 2007, The Hartford entered into a settlement with the Attorneys General of the states of New York, Connecticut and Illinois relating to market timing and the company's individual variable annuity contracts in which certain payments would be made directly to the variable annuity contract holders. The distribution plan provided that unclaimed money from the settlement would be distributed to certain HLS Funds that are investment options through a Hartford individual variable annuity contract. The unclaimed money was distributed to the Fund on September 18, 2009. |
The total return in the accompanying financial highlights includes a payment from an affiliate. Had the payment from the affiliate been excluded, the impact and total return for the period listed below would have been as follows:
| For the Year Ended December 31, 2009 | ||||||||
| Class IA | Class IB | |||||||
| Impact from Payment from Affiliate for Attorneys General Settlement | — | % | — | % | ||||
| Total Return Excluding Payment from Affiliate | 24.67 | % | 24.36 | % | ||||
| 7. | Investment Transactions: |
For the six-month period ended June 30, 2013, the Fund's aggregate purchases and sales of investment securities (excluding short-term investments) were as follows:
| Amount | ||||
| Cost of Purchases Excluding U.S. Government Obligations | $ | 544,254 | ||
| Sales Proceeds Excluding U.S. Government Obligations | 1,000,460 | |||
| 8. | Line of Credit: |
The Fund is one of several Hartford funds that participate in a $500 million committed revolving line of credit facility. The facility is to be used for temporary or emergency purposes. Under the arrangement, the funds are required to own securities having a market value in excess of 300% of the total bank borrowings. The interest rate on borrowings varies depending on the nature of the loan. The facility also requires a fee to be paid based on the amount of the commitment. This commitment fee is allocated to all of the funds participating in the line of credit based on the average net assets of the funds. During the six-month period ended June 30, 2013, the Fund did not have any borrowings under this facility.
| 19 |
| Hartford Dividend and Growth HLS Fund |
| Notes to Financial Statements – (continued) |
| June 30, 2013 (Unaudited) |
| (000’s Omitted) |
| 9. | Industry Classifications: |
Other than the industry classifications “Other Investment Pools and Funds” and “Exchange Traded Funds,” equity industry classifications used in this report are the Global Industry Classification Standard, which was developed by and is the exclusive property and service mark of MSCI, Inc. and Standard & Poor’s.
| 10. | Indemnifications: |
Under the Company’s organizational documents, the Company shall indemnify its officers and directors to the full extent required or permitted under Maryland General Corporation Law and the federal securities laws. In addition, the Company, on behalf of the Fund, may enter into contracts that contain a variety of indemnifications. The Company’s maximum exposure under these arrangements is unknown. However, as of the date of these financial statements, the Company has not had prior claims or losses pursuant to these contracts and expects the risk of loss to be remote.
| 11. | Pending Legal Proceedings: |
On February 25, 2011, Jennifer L. Kasilag, Louis Mellinger, Judith M. Menendez, Jacqueline M. Robinson, and Linda A. Russell filed a derivative lawsuit against Hartford Investment Financial Services, LLC (“HIFSCO”)(now known as Hartford Funds Distributors, LLC) on behalf of six Hartford retail mutual funds in the United States District Court for the District of New Jersey, alleging that HIFSCO received excessive advisory and distribution fees in violation of its statutory fiduciary duty under Section 36(b) of the 1940 Act when serving as investment manager and principal underwriter, respectively, to the Hartford retail mutual funds. HIFSCO moved to dismiss and, in September 2011, the motion was granted in part and denied in part, with leave to amend the complaint. In November 2011, plaintiffs filed an amended complaint on behalf of certain Hartford retail mutual funds, The Hartford Global Health Fund (now known as The Hartford Healthcare Fund), The Hartford Conservative Allocation Fund, The Hartford Growth Opportunities Fund, The Hartford Inflation Plus Fund, The Hartford Advisers Fund (now known as The Hartford Balanced Fund), and The Hartford Capital Appreciation Fund. Plaintiffs seek to rescind the investment management agreements and distribution plans between HIFSCO and these funds and to recover the total fees charged thereunder or, in the alternative, to recover any improper compensation HIFSCO received, in addition to lost earnings. HIFSCO filed a partial motion to dismiss the amended complaint and, in December 2012, the court dismissed without prejudice the claims regarding distribution fees and denied the motion with respect to the advisory fees claims. HIFSCO disputes the allegations and intends to defend vigorously.
This action concerns the activities of HIFSCO in its capacity as investment manager and principal underwriter to the Hartford retail mutual funds and does not concern HIFSCO’s activities in its capacity as principal underwriter to the HLS funds. For this reason, no accrual for litigation relating to this matter has been recorded in the financial statements of the Fund.
| 20 |
[This page intentionally left blank]
| 21 |
Hartford Dividend and Growth HLS Fund
Financial Highlights
- Selected Per-Share Data (A) -
| Class | Net Asset Value at Beginning of | Net Investment Income (Loss) | Net Realized and Unrealized Gain (Loss) on Investments | Total from Investment Operations | Dividends from Net Investment Income | Distributions from Realized Capital Gains | Distributions from Capital | Total Distributions | Net Asset Value at End of Period | |||||||||||||||||||||||||||
| For the Six-Month Period Ended June 30, 2013 (Unaudited) | ||||||||||||||||||||||||||||||||||||
| IA | $ | 21.46 | $ | 0.24 | $ | 3.02 | $ | 3.26 | $ | – | $ | – | $ | – | $ | – | $ | 24.72 | ||||||||||||||||||
| IB | 21.42 | 0.20 | 3.03 | 3.23 | – | – | – | – | 24.65 | |||||||||||||||||||||||||||
| For the Year Ended December 31, 2012 | ||||||||||||||||||||||||||||||||||||
| IA | 19.34 | 0.49 | 2.13 | 2.62 | (0.50 | ) | – | – | (0.50 | ) | 21.46 | |||||||||||||||||||||||||
| IB | 19.30 | 0.45 | 2.11 | 2.56 | (0.44 | ) | – | – | (0.44 | ) | 21.42 | |||||||||||||||||||||||||
| For the Year Ended December 31, 2011 | ||||||||||||||||||||||||||||||||||||
| IA | 19.50 | 0.42 | (0.16 | ) | 0.26 | (0.42 | ) | – | – | (0.42 | ) | 19.34 | ||||||||||||||||||||||||
| IB | 19.46 | 0.36 | (0.16 | ) | 0.20 | (0.36 | ) | – | – | (0.36 | ) | 19.30 | ||||||||||||||||||||||||
| For the Year Ended December 31, 2010 | ||||||||||||||||||||||||||||||||||||
| IA | 17.55 | 0.35 | 1.96 | 2.31 | (0.36 | ) | – | – | (0.36 | ) | 19.50 | |||||||||||||||||||||||||
| IB | 17.51 | 0.32 | 1.94 | 2.26 | (0.31 | ) | – | – | (0.31 | ) | 19.46 | |||||||||||||||||||||||||
| For the Year Ended December 31, 2009 | ||||||||||||||||||||||||||||||||||||
| IA | 14.37 | 0.35 | 3.19 | 3.54 | (0.36 | ) | – | – | (0.36 | ) | 17.55 | |||||||||||||||||||||||||
| IB | 14.34 | 0.33 | 3.16 | 3.49 | (0.32 | ) | – | – | (0.32 | ) | 17.51 | |||||||||||||||||||||||||
| For the Year Ended December 31, 2008 | ||||||||||||||||||||||||||||||||||||
| IA | 22.35 | 0.44 | (7.57 | ) | (7.13 | ) | (0.44 | ) | (0.41 | ) | – | (0.85 | ) | 14.37 | ||||||||||||||||||||||
| IB | 22.28 | 0.42 | (7.56 | ) | (7.14 | ) | (0.39 | ) | (0.41 | ) | – | (0.80 | ) | 14.34 | ||||||||||||||||||||||
| (A) | Information presented relates to a share outstanding throughout the indicated period. |
| (B) | The figures do not include sales charges or other fees which may be applied at the variable life insurance, variable annuity or qualified retirement plan product level. Any such additional sales charges or other fees would lower the Fund's performance. |
| (C) | Ratios do not reflect reductions for fees paid indirectly. Please see Fees Paid Indirectly in the Notes to Financial Statements. |
| (D) | Portfolio turnover rate is calculated on the basis of the Fund as a whole without distinguishing between the classes of shares issued. |
| (E) | Not annualized. |
| (F) | Annualized. |
| (G) | Total return without the inclusion of the Payment from (to) Affiliate can be found in Expenses in the accompanying Notes to Financial Statements. |
| 22 |
- Ratios and Supplemental Data -
| Total Return(B) | Net Assets at End of Period | Ratio of Expenses to Average Net Assets Before Waivers(C) | Ratio of Expenses to Average Net Assets After Waivers(C) | Ratio of Net Investment Income (Loss) to Average Net Assets | Portfolio Turnover Rate(D) | |||||||||||||||||
| 15.20 | %(E) | $ | 3,787,110 | 0.67 | %(F) | 0.67 | %(F) | 1.88 | %(F) | 13 | % | |||||||||||
| 15.06 | (E) | 607,637 | 0.92 | (F) | 0.92 | (F) | 1.64 | (F) | – | |||||||||||||
| 13.59 | 3,658,076 | 0.67 | 0.67 | 2.13 | 20 | |||||||||||||||||
| 13.31 | 589,194 | 0.92 | 0.92 | 1.88 | – | |||||||||||||||||
| 1.32 | 3,851,657 | 0.67 | 0.67 | 1.98 | 24 | |||||||||||||||||
| 1.06 | 658,419 | 0.92 | 0.92 | 1.73 | – | |||||||||||||||||
| 13.21 | 4,409,787 | 0.68 | 0.68 | 1.87 | 32 | |||||||||||||||||
| 12.93 | 756,001 | 0.93 | 0.93 | 1.62 | – | |||||||||||||||||
| 24.68 | (G) | 4,247,031 | 0.69 | 0.69 | 2.24 | 34 | ||||||||||||||||
| 24.36 | (G) | 815,752 | 0.94 | 0.94 | 2.00 | – | ||||||||||||||||
| (32.43 | ) | 3,628,793 | 0.67 | 0.67 | 2.20 | 41 | ||||||||||||||||
| (32.60 | ) | 776,959 | 0.92 | 0.92 | 1.95 | – | ||||||||||||||||
| 23 |
Hartford Dividend and Growth HLS Fund
Directors and Officers (Unaudited)
The Board of Directors of the Company appoints officers who are responsible for the day-to-day operations of the Fund and who execute policies formulated by the Directors. Each director serves until his or her death, resignation, or retirement or until the next annual meeting of shareholders is held or until his or her successor is elected and qualifies.
Directors and officers who are employed by or who have a financial interest in The Hartford are considered “interested” persons of the Fund pursuant to the 1940 Act. Each officer and two of the Company’s directors, as noted in the chart below, are “interested” persons of the Fund. Each director serves as a director for The Hartford Mutual Funds, Inc., The Hartford Mutual Funds II, Inc., Hartford Series Fund, Inc., Hartford HLS Series Fund II, Inc., and as a trustee for The Hartford Alternative Strategies Fund, which, as of June 30, 2013, collectively consist of 90 funds. Correspondence may be sent to directors and officers c/o Hartford Mutual Funds, P.O. Box 2999, Hartford, Connecticut 06104-2999, except that correspondence to Mr. Annoni, Mr. Dressen, Ms. Fagely and Ms. Quade may be sent to 500 Bielenberg Drive, Woodbury, Minnesota 55125 and correspondence to Mr. Davey and Mr. Melcher may be sent to 5 Radnor Corporate Center, Suite 300, 100 Matsonford Road, Radnor, Pennsylvania 19087.
The table below sets forth, for each director and officer, his or her name, year of birth, current position with the Company and date first elected or appointed to Hartford Series Fund, Inc. (“HSF”), and Hartford HLS Series Fund II, Inc. (“HSF2”), principal occupation, and, for directors, other directorships held. The Fund’s statement of additional information contains further information on the directors and is available free of charge by calling 1-800-862-6668 or writing to Hartford HLS Funds, c/o Hartford Life Insurance Company, Hartford Life and Annuity Insurance Company, P.O. Box 14293, Lexington, KY 40512-4293.
Information on the aggregate remuneration paid to the directors of the Company can be found in the Statement of Operations herein. The Fund pays to The Hartford a portion of the Chief Compliance Officer’s compensation, but does not pay salaries or compensation to any of their other officers or directors who are employed by The Hartford.
Non-Interested Directors
Lynn S. Birdsong (1946) Director since 2003, Co-Chairman of the Investment Committee
Mr. Birdsong is a private investor. Mr. Birdsong currently serves as a Director of the Sovereign High Yield Investment Company (April 2010 to current). Mr. Birdsong currently serves as an Independent Director of Nomura Partners Funds, Inc. (formerly, The Japan Fund) (March 2003 to current). From 1979 to 2002, Mr. Birdsong was a managing director of Zurich Scudder Investments, an investment management firm. During his employment with Scudder, Mr. Birdsong was an Interested Director of The Japan Fund. Since 1981, Mr. Birdsong has been a partner in Birdsong Company, an advertising specialty firm.
Robert M. Gavin, Jr. (1940) Director since 2002 (HSF) and 1986 (HSF2), Chairman of the Board since 2004
Dr. Gavin is an educational consultant. Prior to September 1, 2001, he was President of Cranbrook Education Community and prior to July 1996, he was President of Macalester College, St. Paul, Minnesota.
Duane E. Hill (1945) Director since 2001 (HSF) and 2002 (HSF2), Chairman of the Nominating Committee
Mr. Hill is Partner of TSG Ventures L.P., a private equity investment company. Mr. Hill is a former partner of TSG Capital Group, a private equity investment firm that served as sponsor and lead investor in leveraged buyouts of middle market companies.
Sandra S. Jaffee (1941) Director since 2005
Ms. Jaffee is the founder and Chief Executive Officer of a private company, Homeworks Concierge, LLC, which provides residential property management services in Westchester County, New York (January 2012 to present). Ms. Jaffee served as Chairman (2008 to 2009) and Chief Executive Officer of Fortent (formerly Searchspace Group), a leading provider of compliance/regulatory technology to financial institutions from August 2005 to August 2009. Ms. Jaffee currently serves as a member of the Board of Directors of Broadridge Financial Solutions as well as a Trustee of Muhlenberg College.
William P. Johnston (1944) Director since 2005, Chairman of the Compliance Committee
In February 2008, Mr. Johnston was elected to the Board of Directors of HCR-ManorCare, Inc. In August 2007, Mr. Johnston was elected to the Board of Directors of LifeCare Holdings, Inc. In July 2006, Mr. Johnston was elected to the Board of Directors of MultiPlan, Inc. and served as a director (July 2006 to August 2010). In June 2006, Mr. Johnston was appointed as Senior Advisor to The Carlyle Group, a global private equity and alternative asset investment firm. In May 2006, Mr. Johnston was elected to the Supervisory Board of Fresenius Medical Care AG & Co. KGaA, after its acquisition of Renal Care Group, Inc. in March 2006.
| 24 |
Phillip O. Peterson (1944) Director since 2002 (HSF) and 2000 (HSF2), Chairman of the Audit Committee
Mr. Peterson is a mutual fund industry consultant. He was a partner of KPMG LLP (an accounting firm) until July 1999. Mr. Peterson joined William Blair Funds in February 2007 as a member of the Board of Trustees. Mr. Peterson also joined the Board of Trustees of Symetra Variable Mutual Funds Trust as a trustee in February 2012.
Lemma W. Senbet (1946) Director since 2005
Dr. Senbet is the William E. Mayer Chair Professor of Finance and Director, Center for Financial Policy, at the University of Maryland, Robert H. Smith School of Business. He was chair of the Finance Department from 1998 to 2006. Previously he was a chaired professor of finance at the University of Wisconsin-Madison. Also, he was director of the Fortis Funds from March 2000 to July 2002. Dr. Senbet served the finance profession in various capacities, including as director of the American Finance Association and President of the Western Finance Association. In 2006, Dr. Senbet was inducted Fellow of Financial Management Association International for his career-long distinguished scholarship and professional service.
Interested Directors and Officers
James E. Davey (1964) Director since 2012, President and Chief Executive Officer since 2010
Mr. Davey serves as Executive Vice President of Hartford Life Insurance Company (“HLIC”) and The Hartford Financial Services Group, Inc. Additionally, Mr. Davey serves as Chairman of the Board and Manager of Hartford Funds Distributors, LLC (“HFD”) and Hartford Administrative Services Company (“HASCO”). Mr. Davey also serves as Manager, President and Chairman of the Board for Hartford Funds Management Company, LLC (“HFMC”). Mr. Davey joined The Hartford in 2002.
Lowndes A. Smith (1939) Director since 1996 (HSF) and 2002 (HSF2), Co-Chairman of the Investment Committee
Mr. Smith served as Vice Chairman of The Hartford from February 1997 to January 2002, as President and Chief Executive Officer of Hartford Life, Inc. from February 1997 to January 2002, and as President and Chief Operating Officer of The Hartford Life Insurance Companies from January 1989 to January 2002. Mr. Smith serves as a Director of White Mountains Insurance Group, Ltd., One Beacon Insurance and Symetra Financial and as Managing Director of Whittington Gray Associates.
Other Officers
Mark A. Annoni (1964) Vice President, Controller and Treasurer since 2012
Mr. Annoni serves as the Assistant Vice President of HLIC (February 2004 to present). Mr. Annoni joined The Hartford in April 2001 as part of The Hartford’s acquisition of Fortis Financial Group (“Fortis”). Prior to joining The Hartford, Mr. Annoni served as Manager of Mutual Fund Accounting at Fortis (July 1997 to April 2001).
Michael R. Dressen (1963) AML Compliance Officer since 2011
Mr. Dressen currently serves as Assistant Vice President of HLIC. He also serves as Chief Compliance Officer and AML Compliance Officer of HASCO and as AML Officer of HFD. Mr. Dressen joined The Hartford in 2005 from State Farm Insurance Companies where he held various positions related to mutual funds, variable products, and property casualty insurance.
Tamara L. Fagely (1958) Vice President since 2002 (HSF) and 1993 (HSF2)
Currently, Ms. Fagely is President and a Director of HASCO, Chief Administrative Officer and Manager of HFMC and a Vice President of HLIC. Ms. Fagely served as a Vice President of HASCO (1998-2013) and Chief Financial Officer of HASCO (2006-2013). She served as Assistant Vice President of HLIC from December 2001 through March 2005. In addition, Ms. Fagely is Manager and Chief Operating Officer of HFD.
Edward P. Macdonald (1967) Vice President, Secretary and Chief Legal Officer since 2005
Mr. Macdonald serves as Vice President of HLIC and Vice President, Chief Legal Officer and Secretary of HFD and HASCO. Mr. Macdonald also serves as Manager, Vice President, Chief Legal Officer and Secretary of HFMC. Mr. Macdonald joined The Hartford in 2005.
Joseph G. Melcher (1973) Vice President and Chief Compliance Officer since 2013(1)
Mr. Melcher currently serves as Vice President of HFMC and HFD. Mr. Melcher joined The Hartford in 2012 from Touchstone Investments, a member of the Western & Southern Financial Group, where he held the position of Vice President and Chief Compliance Officer from 2010 through 2012 and Assistant Vice President, Compliance from 2005 to 2010.
| (1) | Mr. Melcher was named Vice President and Chief Compliance Officer of HSF and HSF2 on February 6, 2013. Prior to February 6, 2013, Colleen Pernerewski served as Chief Compliance Officer of HSF and HSF2. |
| 25 |
Hartford Dividend and Growth HLS Fund
Directors and Officers (Unaudited) – (continued)
Vernon J. Meyer (1964) Vice President since 2006
Mr. Meyer serves as Senior Vice President of HLIC. He also serves as Senior Vice President of HFMC and HFD. Mr. Meyer joined The Hartford in 2004.
Laura S. Quade (1969) Vice President since 2012
Ms. Quade currently serves as Vice President of HASCO and is a Director of Mutual Fund Service Operations. She also serves as Director, Enterprise Operations of HFD and HLIC. Ms. Quade joined The Hartford in 2001 as part of The Hartford’s acquisition of Fortis.
Elizabeth L. Schroeder (1966) Vice President since 2010(2)
Ms. Schroeder currently serves as Assistant Vice President of HLIC. Ms. Schroeder joined HLIC in 1991. She is also an Assistant Vice President of HFMC and HASCO.
| (2) | Ms. Schroeder served as Vice President of HSF and HSF2 until August 7, 2013. |
Martin Swanson (1962) Vice President since 2010
Mr. Swanson is a Vice President of HLIC. Mr. Swanson also serves as Chief Marketing Officer for HFD. Prior to joining HLIC in 1998, Mr. Swanson was a Vice President at PaineWebber, Inc.
HOW TO OBTAIN A COPY OF THE FUND’S PROXY VOTING POLICIES AND VOTING RECORDS (UNAUDITED)
A description of the policies and procedures that the Fund uses to determine how to vote proxies relating to portfolio securities and information about how the Fund voted proxies relating to portfolio securities during the most recent twelve-month period ended June 30 are available (1) without charge, upon request, by calling 800-862-6668 and (2) on the SEC’s website at http://www.sec.gov.
QUARTERLY PORTFOLIO HOLDINGS INFORMATION (UNAUDITED)
The Fund files a complete schedule of portfolio holdings with the SEC for the first and third quarters of each fiscal year on Form N-Q. The Fund’s Forms are available (1) without charge, upon request, by calling 800-862-6668 and (2) on the SEC’s website at http://www.sec.gov. The Form N-Q may be reviewed and copied at the SEC’s Public Reference Room in Washington, DC. Information on the operation of the Public Reference Room may be obtained by calling 1-800-SEC-0330.
| 26 |
Hartford Dividend and Growth HLS Fund
Expense Example (Unaudited)
Your Fund's Expenses
As a shareholder of the Fund, you incur two types of costs: (1) transaction costs and (2) ongoing costs including investment management fees, distribution fees, if any, and other fund expenses. This example is intended to help you understand your ongoing costs (in dollars) of investing in the Fund and to compare these costs with the ongoing costs of investing in other mutual funds. The example is based on an investment of $1,000 invested at the beginning of the period and held for the period of December 31, 2012 through June 30, 2013.
Actual Expenses
The first set of columns of the table below provides information about actual account values and actual expenses. You may use the information in this column, together with the amount you invested, to estimate the expenses that you paid over the period. Simply divide your account value by $1,000 (for example, an $8,600 account value divided by $1,000 = 8.6), then multiply the result by the number in the line under the heading entitled “Expenses Paid During Period” to estimate the expenses you paid on your account during this period.
Hypothetical Example for Comparison Purposes
The second set of columns of the table below provides information about hypothetical account values and hypothetical expenses based on the Fund’s actual expense ratio and an assumed rate of return of 5% per year before expenses, which is not the Fund’s actual return. The hypothetical account values and expenses may not be used to estimate the actual ending account balance or expenses you paid for the period. You may use this information to compare the ongoing costs of investing in the Fund and other funds. To do so, compare this 5% hypothetical example with the 5% hypothetical examples that appear in the shareholder reports of the other funds.
Please note that the expenses shown in the table are meant to highlight your ongoing costs only and do not reflect any transactional costs, such as sales charges (loads) and CDSC. Therefore, the second set of columns of the table is useful in comparing ongoing costs only, and will not help you determine the relative total costs of owning different funds. In addition, if these transactional costs were included, your costs would be higher. Expenses are equal to the Fund's annualized expense ratios multiplied by average account value over the period, multiplied by 181/365 (to reflect the one-half year period).
| Actual return | Hypothetical (5% return before expenses) | |||||||||||||||||||||||||||||||||
| Beginning Account Value December 31, 2012 | Ending Account Value June 30, 2013 | Expenses paid during the period December 31, 2012 through June 30, 2013 | Beginning Account Value December 31, 2012 | Ending Account Value June 30, 2013 | Expenses paid during the period December 31, 2012 through June 30, 2013 | Annualized expense ratio | Days in the current 1/2 year | Days in the full year | ||||||||||||||||||||||||||
| Class IA | $ | 1,000.00 | $ | 1,152.00 | $ | 3.57 | $ | 1,000.00 | $ | 1,021.47 | $ | 3.36 | 0.67 | % | 181 | 365 | ||||||||||||||||||
| Class IB | $ | 1,000.00 | $ | 1,150.60 | $ | 4.91 | $ | 1,000.00 | $ | 1,020.23 | $ | 4.61 | 0.92 | % | 181 | 365 | ||||||||||||||||||
| 27 |
Hartford Dividend and Growth HLS Fund
Principal Risks (Unaudited)
The principal risks of investing in the Fund are described below.
Market, Selection, and Strategy Risk: The Fund’s share price may fluctuate due to market risk and/or security selections that may underperform the market or relevant benchmarks. If the sub-adviser’s investment strategy does not perform as expected, the Fund could underperform its peers or lose money. There is no guarantee the Fund will achieve its stated objective.
Foreign Investment Risk: Foreign investments can be riskier than U.S. investments. Potential risks include currency risk that may result from unfavorable exchange rates, liquidity risk if decreased demand for a security makes it difficult to sell at the desired price, and risks that stem from substantially lower trading volume on foreign markets.
Dividend Paying Security Investment Risk: Dividends are not guaranteed and are subject to change. Dividend paying securities as a group can fall out of favor with the market, causing the Fund to underperform.
| 28 |
HARTFORD HLS FUNDS
c/o The Hartford Wealth Management - Global Annuities
P.O. Box 14293
Lexington, KY 40512-4293
HARTFORDFUNDS
hartfordfunds.com
Hartford Series Fund, Inc. is underwritten and distributed by Hartford Funds Distributors, LLC.
Hartford Series Fund, Inc. inception dates range from 1977 to date. Hartford Series Fund, Inc. is not a subsidiary of The Hartford Financial Services Group, Inc. ("The Hartford") but is underwritten, distributed by and advised by subsidiaries of The Hartford. Investments in Hartford Series Fund, Inc. are not guaranteed by The Hartford or any other entity.
You should carefully consider investment objectives, risks, and charges and expenses of Hartford HLS Funds before investing. This and other information can be found in the Fund’s prospectus or summary prospectus, which can be obtained by calling 800-862-6668. Please read them carefully before you invest or send money.
HLSSAR-DG13 8-13 113538-1 Printed in U.S.A ©2013 The Hartford, Hartford, CT 06115
HARTFORDFUNDS
| HARTFORD GLOBAL GROWTH
HLS FUND
2013 Semi Annual Report
|
A MESSAGE FROM THE PRESIDENT
Dear Fellow Shareholders:
I want to take this opportunity to say thank you for investing in the Hartford HLS Funds.
Market Review
During the first half of the year, stocks rose steadily. U.S. equities (as represented by the S&P 500 Index1) posted a strong gain of 10.61% during the first quarter, on their way to an all-time high. During the second quarter, investors persevered through volatility surrounding rumors of the rollback of the U.S. Federal Reserve’s quantitative easing (QE) program later this year, and the S&P 500 Index rose 2.91%. That brought the market’s rise to 13.82% for the first half of 2013. The rumors about QE’s end sent bond yields and mortgage rates upward, but that wasn’t enough to dissuade investors from pushing equities into positive territory.
Because of QE, some have expressed concerns regarding the recent market rally. But a more careful examination of economic data reveals a strong foundation. Consumer balance sheets have improved since the financial crisis, with consumer debt as a percentage of income falling steadily. Housing continued its dogged recovery, fueled by population growth and pent-up demand. In fact, it’s substantive economic improvements that have moved Federal Reserve Chairman Ben Bernanke to consider removing the “training wheels” of QE, which we think should be viewed as a vote of confidence in the U.S. economy going forward.
As the U.S. outlook continues to improve, concerns do remain in the global economy. Emerging markets have lagged due to social unrest and rising inflation. Slowing growth in China is clouding global growth forecasts, but it’s important to remember that China still boasts 7.5% annual GDP growth.
It’s important to stay abreast of domestic and international economic developments while balancing your individual investment goals. Meeting with your financial advisor on a regular basis to examine your current investment strategy can help you determine whether you are on the right track:
| • | Is your portfolio fully diversified with an appropriate mix of stocks and bonds? |
| • | Is your fixed-income portfolio positioned to take advantage of opportunities across the credit spectrum and fulfill your income needs? |
| • | Is your portfolio still in line with your risk tolerance and investment time horizon? |
Your financial professional can help you choose options within our fund family to navigate today’s markets with confidence.
Thank you again for investing with the Hartford HLS Funds.
James Davey
President
Hartford HLS Funds
1 The S&P 500 Index is a market capitalization-weighted price index composed of 500 widely held common stocks.
Hartford Global Growth HLS Fund
Table of Contents
This report is prepared for the general information of contract owners and qualified retirement plan participants. It is not an offer of contracts or of qualified retirement plans. It should not be used in connection with any offer, except in conjunction with the appropriate product prospectus which contains all pertinent information including the applicable sales, administrative and other charges.
The views expressed in the Fund’s Manager Discussion under ‘‘Why did the Fund perform this way?’’ and ‘‘What is the outlook?’’ are views of the Fund’s sub-adviser and portfolio management team through the end of the period and are subject to change based on market and other conditions. The Fund’s Manager Discussion is for informational purposes only and does not represent an offer, recommendation or solicitation to buy, hold or sell any security. The specific securities identified and described, if any, do not represent all of the securities purchased or sold and you should not assume that investments in the securities identified and discussed will be profitable.
| Hartford Global Growth HLS Fund inception 09/30/1998 |
| (sub-advised by Wellington Management Company, LLP) |
| Investment objective – Seeks growth of capital. |
Performance Overview 6/30/03 - 6/30/13
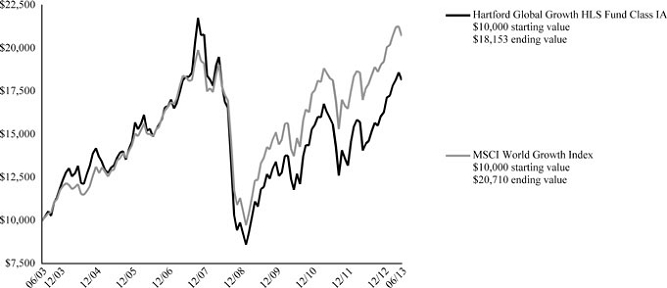
The chart above represents the hypothetical growth of a $10,000 investment in Class IA. Growth results in classes other than Class IA will vary from what is seen above due to differences in the expenses charged to those share classes.
Average Annual Total Returns (as of 6/30/13)
| 6 Month† | 1 Year | 5 Years | 10 Years | |
| Global Growth IA | 11.46% | 25.44% | 0.27% | 6.14% |
| Global Growth IB | 11.32% | 25.12% | 0.02% | 5.88% |
| MSCI World Growth Index | 7.72% | 17.12% | 3.06% | 7.55% |
| † | Not Annualized |
PERFORMANCE DATA QUOTED REPRESENTS PAST PERFORMANCE AND DOES NOT GUARANTEE FUTURE RESULTS. The investment return and principal value of the investment will fluctuate so that investors’ shares, when redeemed, may be worth more or less than their original cost. Current performance may be lower or higher than the performance data quoted. To obtain performance data current to the most recent month-end, please visit our website www.hartfordfunds.com.
Total returns presented above were calculated using the Fund's net asset value available to shareholders for sale or redemption of Fund shares on June 30, 2013, which may exclude investment transactions as of this date. All share class returns assume the reinvestment of all distributions at net asset value and the deduction of all fund expenses.
MSCI World Growth Index is a broad-based unmanaged market capitalization-weighted total return index which measures the performance of growth securities in 23 developed-country global equity markets including the United States, Canada, Europe, Australia, New Zealand and the Far East.
You cannot invest directly in an index.
As of the Fund’s current prospectus dated May 1, 2013, the total annual operating expense ratios for Class IA and Class IB shares were 0.82% and 1.07%, respectively. Actual expenses may be higher. Please see the accompanying Financial Highlights for expense ratios for the six-month period ended June 30, 2013.
The chart and table do not reflect the deductions of taxes, sales charges or other fees which may be applied at the variable life insurance, variable annuity or qualified retirement plan product level. Any such additional sales charges or other fees or expenses would lower the contract’s or plan’s performance.
All investments are subject to risk including the possible loss of principal. For a discussion of the Fund’s risks, please see the Principal Risks section. For more detailed information on the risks associated with an investment in the Fund, please see the prospectus.
| 2 |
| Hartford Global Growth HLS Fund |
| Manager Discussion |
| June 30, 2013 (Unaudited) |
| Portfolio Managers | |
| Matthew D. Hudson, CFA | John A. Boselli, CFA |
| Vice President and Equity Portfolio Manager | Director and Equity Portfolio Manager |
How did the Fund perform?
The Class IA shares of the Hartford Global Growth HLS Fund returned 11.46% for the six-month period ended June 30, 2013, outperforming its benchmark, the MSCI World Growth Index, which returned 7.72% for the same period. The Fund outperformed the 7.31% average return of the Variable Products-Underlying Funds Lipper Global Growth Funds peer group, a group of funds with investment strategies similar to those of the Fund.
Why did the Fund perform this way?
Global equities gained during the six-month period. Favorable global liquidity dynamics and accommodative monetary policy from central banks around the globe provided a tailwind for stocks, helping investors to look past slowing growth and an increase in lending rates in China. Following a dramatic shift in monetary policy by the Bank of Japan to more aggressive management of a 2% inflation target, Japanese equities soared. U.S. equities also outperformed global indexes, as the U.S. economy appeared relatively stable compared to other countries. Although investors initially reacted negatively to news in May that the Federal Reserve (Fed) might slow its bond-buying program sooner than expected, U.S. equities recovered toward the end of the quarter. Signs of strength in Germany and France partially offset concerns elsewhere in the eurozone. Ongoing European sovereign-debt issues weighed on investors in Greece and Spain. Political unrest in Turkey, Egypt, and Brazil contributed to declines in emerging markets.
For the annual period, Growth stocks (+7.7%) underperformed Value stocks (+9.9%) as measured by the MSCI World Growth Index and the MSCI World Value Indexes, respectively. Within the MSCI World Growth Index, nine of ten sectors posted positive returns. Telecommunication Services (+20%), Health Care (+18%) and Consumer Discretionary (+17%) gained the most, while the Materials (-11%), Information Technology (0%), and Energy (+3%) sectors lagged on a relative basis.
The Fund’s outperformance versus its benchmark was primarily due to strong security selection, particularly in the Information Technology, Health Care, and Industrials sectors. This more than offset unfavorable selection in Utilities and Telecommunication Services. Sector allocation, a residual of our bottom-up stock selection process, contributed to relative returns, primarily due to an underweight (i.e. the Fund’s sector position was less than the benchmark position) to the Materials and overweight to Health Care sectors.
Top contributors to relative performance included Apple (Information Technology), Gilead Sciences (Health Care), and Green Mountain Coffee (Consumer Staples). Shares of Apple, a designer, manufacturer, and retailer of a range of personal electronic products, declined on weaker guidance and slowing growth. We were underweight the shares which positively contributed to relative performance. Shares of Gilead Sciences, a biopharmaceutical company, moved steadily higher alongside positive news flow, including passing the first hurdle for the firm's hepatitis C single tablet regimen. Shares of Green Mountain Coffee, a U.S.-based provider of single-cup brewers and k-cups for coffee and other beverages, increased after the company reported fiscal second quarter results with earnings exceeding consensus expectations. In addition, plans for an expanded relationship with Starbucks and increased 2013 earnings guidance boosted the stock price. Top absolute performance (i.e. total return) contributors also included Roche (Health Care) and Google (Information Technology).
The top detractors from the Fund’s relative performance were Samsung (Information Technology), SABESP (Utilities), and Toyota (Consumer Discretionary). Shares of South Korea-based global electronics company, Samsung, declined due to competitive concerns regarding a weakening yen and political rhetoric from North Korea. Shares of SABESP, one of the Brazilian water utilities, declined as the market became concerned about the sustainability of tariffs in the wake of massive protests throughout Brazil. Shares of Toyota, a Japan-based company mainly engaged in the automobile business, rose as the company’s earnings results exceeded expectations helped by the new Abe administrations market-friendly policies and a weak yen, which supports the company’s large export business. We were underweight the shares which negatively contributed to relative performance. Top absolute detractors also included Apple (Information Technology).
What is the outlook?
Economic data continues to improve slowly across the world, driven mostly by quantitative easing. While excessive leverage in European banks and government balance sheets in the Western Hemisphere continue, the economic improvement
| 3 |
| Hartford Global Growth HLS Fund |
| Manager Discussion – (continued) |
| June 30, 2013 (Unaudited) |
has positive effects on earnings and stock prices. Global industrial confidence and capacity utilization have improved and consumer wealth is improving globally with recoveries in housing and stock markets. Continued quantitative easing and significant stimulus programs around the world have improved credit spreads and economic activity. As the economy recovers, our stock positions reflect improving cyclical fundamentals.
In Europe, the overall region remains fragile, and although conditions have not deteriorated, the economies continue to bump along the bottom. We believe Northern Europe continues to be more favorably positioned than Southern Europe, and smaller peripheral countries have showed some signs of a recovery from a deep trough. In other regions, Canada and Australia continue to be affected disproportionately by commodities, which have struggled in this low-growth environment.
In Japan, we believe the market has embraced ‘Abenomics’ (i.e. economic policies advocated by Shinzo Abe, the current Prime Minister of Japan), and the weakening yen will be beneficial to most companies’ earnings. We are closely monitoring the further execution of the Prime Minister’s plan, which we believe will be critical for sustained economic development. In China, economic recovery post the leadership transition has taken longer than we would have anticipated.
Our focus remains on stock selection that is driven by bottom-up, fundamental research, diligent meetings with the management of leading companies globally, and leveraging the deep research capabilities of our firm. As always, we seek to invest in companies with improving fundamentals and catalysts that we think will lead to accelerating earnings growth above consensus expectations.
At the end of the period, our largest overweights were to information technology, financials, and health care, while we remained underweight consumer staples, industrials, and energy, relative to the benchmark.
Diversification by Country
as of June 30, 2013
| Percentage of | ||||
| Country | Net Assets | |||
| Austria | 0.5 | % | ||
| Belgium | 2.2 | |||
| China | 1.7 | |||
| France | 4.0 | |||
| Germany | 2.5 | |||
| Hong Kong | 1.6 | |||
| Ireland | 1.6 | |||
| Italy | 0.4 | |||
| Japan | 3.7 | |||
| Jersey | 0.5 | |||
| Mexico | 1.2 | |||
| Netherlands | 2.5 | |||
| Norway | 0.6 | |||
| South Korea | 1.5 | |||
| Sweden | 1.0 | |||
| Switzerland | 6.2 | |||
| Taiwan | 1.1 | |||
| United Kingdom | 4.5 | |||
| United States | 60.9 | |||
| Short-Term Investments | 1.7 | |||
| Other Assets and Liabilities | 0.1 | |||
| Total | 100.0 | % | ||
| 4 |
| Hartford Global Growth HLS Fund |
| Schedule of Investments |
| June 30, 2013 (Unaudited) |
| (000’s Omitted) |
| Shares or Principal Amount | Market Value ╪ | |||||||
| COMMON STOCKS - 97.5% | ||||||||
| Automobiles and Components - 0.7% | ||||||||
| 273 | Nissan Motor Co., Ltd. | $ | 2,737 | |||||
| Banks - 2.3% | ||||||||
| 452 | Barclays Bank plc ADR | 1,925 | ||||||
| 50 | BNP Paribas | 2,723 | ||||||
| 75 | Erste Group Bank AG | 2,003 | ||||||
| 380 | Mitsubishi UFJ Financial Group, Inc. | 2,347 | ||||||
| 8,998 | ||||||||
| Capital Goods - 4.7% | ||||||||
| 20 | Boeing Co. | 2,090 | ||||||
| 30 | Honeywell International, Inc. | 2,352 | ||||||
| 23 | Parker-Hannifin Corp. | 2,148 | ||||||
| 145 | Rolls-Royce Holdings plc | 2,505 | ||||||
| 68 | Safran S.A. | 3,565 | ||||||
| 27 | Schneider Electric S.A. | 1,983 | ||||||
| 87 | SKF AB Class B | 2,048 | ||||||
| 10 | SMC Corp. of America | 2,007 | ||||||
| 18,698 | ||||||||
| Commercial and Professional Services - 1.8% | ||||||||
| 40 | Equifax, Inc. ● | 2,375 | ||||||
| 51 | Intertek Group plc | 2,259 | ||||||
| 1 | SGS S.A. | 2,534 | ||||||
| 7,168 | ||||||||
| Consumer Durables and Apparel - 1.5% | ||||||||
| 28 | Cie Financiere Richemont S.A. | 2,448 | ||||||
| 2 | NVR, Inc. ● | 1,796 | ||||||
| 185 | Prada S.p.A. | 1,671 | ||||||
| 5,915 | ||||||||
| Consumer Services - 3.4% | ||||||||
| 295 | Galaxy Entertainment Group Ltd. ● | 1,433 | ||||||
| 148 | MGM Resorts International ● | 2,182 | ||||||
| 29 | Paddy Power plc | 2,474 | ||||||
| 1,084 | Sands China Ltd. | 5,068 | ||||||
| 34 | Starbucks Corp. | 2,203 | ||||||
| 13,360 | ||||||||
| Diversified Financials - 10.4% | ||||||||
| 418 | Aberdeen Asset Management plc | 2,430 | ||||||
| 19 | Affiliated Managers Group, Inc. ● | 3,049 | ||||||
| 27 | American Express Co. | 2,014 | ||||||
| 38 | Ameriprise Financial, Inc. | 3,090 | ||||||
| 18 | BlackRock, Inc. | 4,571 | ||||||
| 64 | Discover Financial Services, Inc. | 3,042 | ||||||
| 21 | Franklin Resources, Inc. | 2,791 | ||||||
| 31 | IntercontinentalExchange, Inc. ● | 5,434 | ||||||
| 76 | JP Morgan Chase & Co. | 4,014 | ||||||
| 59 | Julius Baer Group Ltd. | 2,296 | ||||||
| 47 | Moody's Corp. | 2,837 | ||||||
| 12 | Partners Group | 3,178 | ||||||
| 95 | SEI Investments Co. | 2,687 | ||||||
| 41,433 | ||||||||
| Energy - 2.2% | ||||||||
| 26 | Anadarko Petroleum Corp. | 2,212 | ||||||
| 81 | Cobalt International Energy, Inc. ● | 2,160 | ||||||
| 16 | EOG Resources, Inc. | 2,049 | ||||||
| 34 | Schlumberger Ltd. | 2,466 | ||||||
| 8,887 | ||||||||
| Food and Staples Retailing - 2.0% | ||||||||
| 97 | CVS Caremark Corp. | 5,568 | ||||||
| 61 | Seven & I Holdings Co., Ltd. | 2,249 | ||||||
| 7,817 | ||||||||
| Food, Beverage and Tobacco - 7.9% | ||||||||
| 79 | Altria Group, Inc. | 2,770 | ||||||
| 74 | Anheuser-Busch InBev N.V. | 6,640 | ||||||
| 72 | British American Tobacco plc | 3,688 | ||||||
| 182 | Diageo Capital plc | 5,210 | ||||||
| 22 | Fomento Economico Mexicano S.A.B. de C.V. ADR | 2,234 | ||||||
| 45 | Green Mountain Coffee Roasters, Inc. ● | 3,356 | ||||||
| 32 | Heineken N.V. | 2,034 | ||||||
| 21 | Pernod-Ricard S.A. | 2,276 | ||||||
| 87 | Unilever N.V. | 3,406 | ||||||
| 31,614 | ||||||||
| Health Care Equipment and Services - 1.8% | ||||||||
| 32 | Aetna, Inc. | 2,047 | ||||||
| 50 | Medtronic, Inc. | 2,584 | ||||||
| 35 | Zimmer Holdings, Inc. | 2,593 | ||||||
| 7,224 | ||||||||
| Insurance - 2.0% | ||||||||
| 130 | American International Group, Inc. ● | 5,801 | ||||||
| 70 | Tokio Marine Holdings, Inc. | 2,199 | ||||||
| 8,000 | ||||||||
| Materials - 2.1% | ||||||||
| 229 | Cemex S.A.B. de C.V. ADR ● | 2,426 | ||||||
| 449 | Glencore Xstrata plc | 1,858 | ||||||
| 30 | HeidelbergCement AG | 2,007 | ||||||
| 231 | James Hardie Industries plc | 1,984 | ||||||
| 8,275 | ||||||||
| Media - 6.2% | ||||||||
| 57 | Comcast Corp. Class A | 2,405 | ||||||
| 47 | DirecTV ● | 2,896 | ||||||
| 186 | News Corp. Class A | 6,074 | ||||||
| 623 | Sirius XM Radio, Inc. w/ Rights | 2,086 | ||||||
| 28 | Time Warner Cable, Inc. | 3,118 | ||||||
| 52 | Viacom, Inc. Class B | 3,545 | ||||||
| 38 | Walt Disney Co. | 2,381 | ||||||
| 119 | WPP plc | 2,031 | ||||||
| 24,536 | ||||||||
| Pharmaceuticals, Biotechnology and Life Sciences - 14.0% | ||||||||
| 42 | Actelion Ltd. | 2,537 | ||||||
| 41 | Amgen, Inc. | 4,018 | ||||||
| 16 | Biogen Idec, Inc. ● | 3,379 | ||||||
| 49 | Bristol-Myers Squibb Co. | 2,199 | ||||||
| 50 | Celgene Corp. ● | 5,889 | ||||||
| 158 | Gilead Sciences, Inc. ● | 8,108 | ||||||
| 57 | Merck & Co., Inc. | 2,633 | ||||||
| 102 | Mylan, Inc. ● | 3,172 | ||||||
| 36 | Novartis AG | 2,532 | ||||||
| 12 | Regeneron Pharmaceuticals, Inc. ● | 2,635 | ||||||
| 37 | Roche Holding AG | 9,199 | ||||||
| 27 | Sanofi-Aventis S.A. | 2,794 | ||||||
| 30 | Thermo Fisher Scientific, Inc. | 2,539 | ||||||
| 41 | UCB S.A. | 2,212 | ||||||
| 26 | Vertex Pharmaceuticals, Inc. ● | 2,101 | ||||||
| 55,947 | ||||||||
| Real Estate - 0.6% | ||||||||
| 31 | American Tower Corp. REIT | 2,298 | ||||||
The accompanying notes are an integral part of these financial statements.
| 5 |
| Hartford Global Growth HLS Fund |
| Schedule of Investments – (continued) |
| June 30, 2013 (Unaudited) |
| (000’s Omitted) |
| Shares or Principal Amount | Market Value ╪ | |||||||
| COMMON STOCKS - 97.5% - (continued) | ||||||||
| Retailing - 5.6% | ||||||||
| 8 | Amazon.com, Inc. ● | $ | 2,285 | |||||
| 7 | AutoZone, Inc. ● | 3,170 | ||||||
| 72 | GameStop Corp. Class A | 3,005 | ||||||
| 170 | Lowe's Cos., Inc. | 6,961 | ||||||
| 8 | Priceline.com, Inc. ● | 6,965 | ||||||
| 22,386 | ||||||||
| Semiconductors and Semiconductor Equipment - 5.0% | ||||||||
| 56 | ASML Holding N.V. | 4,391 | ||||||
| 261 | Infineon Technologies AG | 2,187 | ||||||
| 66 | Maxim Integrated Products, Inc. | 1,831 | ||||||
| 147 | MediaTek, Inc. | 1,699 | ||||||
| 179 | Micron Technology, Inc. ● | 2,572 | ||||||
| 4 | Samsung Electronics Co., Ltd. | 4,576 | ||||||
| 738 | Taiwan Semiconductor Manufacturing Co., Ltd. | 2,672 | ||||||
| 19,928 | ||||||||
| Software and Services - 14.9% | ||||||||
| 46 | Accenture plc | 3,301 | ||||||
| 12 | Alliance Data Systems Corp. ● | 2,184 | ||||||
| 75 | Amdocs Ltd. | 2,771 | ||||||
| 37 | Citrix Systems, Inc. ● | 2,248 | ||||||
| 34 | Cognizant Technology Solutions Corp. ● | 2,123 | ||||||
| 20 | Dassault Systemes S.A. | 2,504 | ||||||
| 117 | eBay, Inc. ● | 6,036 | ||||||
| 89 | Facebook, Inc. ● | 2,213 | ||||||
| 11 | Google, Inc. ● | 9,921 | ||||||
| 17 | LinkedIn Corp. Class A ● | 2,999 | ||||||
| 7 | Mastercard, Inc. | 3,969 | ||||||
| 46 | Salesforce.com, Inc. ● | 1,754 | ||||||
| 42 | SAP AG | 3,092 | ||||||
| 35 | Splunk, Inc. ● | 1,639 | ||||||
| 56 | Tencent Holdings Ltd. | 2,179 | ||||||
| 42 | Teradata Corp. ● | 2,089 | ||||||
| 25 | Visa, Inc. | 4,497 | ||||||
| 153 | Yahoo!, Inc. ● | 3,842 | ||||||
| 59,361 | ||||||||
| Technology Hardware and Equipment - 5.5% | ||||||||
| 7 | Apple, Inc. | 2,822 | ||||||
| 102 | Cisco Systems, Inc. | 2,478 | ||||||
| 124 | EMC Corp. | 2,929 | ||||||
| 468 | Hitachi Ltd. | 2,999 | ||||||
| 138 | Juniper Networks, Inc. ● | 2,658 | ||||||
| 2,290 | Lenovo Group Ltd. | 2,061 | ||||||
| 135 | LG.Philips LCD Co., Ltd. | 1,597 | ||||||
| 42 | Motorola Solutions, Inc. | 2,396 | ||||||
| 160 | Telefonaktiebolaget LM Ericsson Class B | 1,815 | ||||||
| 21,755 | ||||||||
| Telecommunication Services - 1.2% | ||||||||
| 374 | Sprint Nextel Corp. ● | 2,626 | ||||||
| 112 | Telenor ASA | 2,232 | ||||||
| 4,858 | ||||||||
| Transportation - 1.1% | ||||||||
| 131 | Delta Air Lines, Inc. ● | 2,445 | ||||||
| 21 | FedEx Corp. | 2,038 | ||||||
| 4,483 | ||||||||
| Utilities - 0.6% | ||||||||
| 2,902 | Guangdong Investment Ltd. | 2,515 | ||||||
| Total common stocks | ||||||||
| (cost $315,514) | $ | 388,193 | ||||||
| PREFERRED STOCKS - 0.7% | ||||||||
| Media - 0.7% | ||||||||
| 64 | ProSieben Sat.1 Media AG | $ | 2,761 | |||||
| Total preferred stocks | ||||||||
| (cost $2,226) | $ | 2,761 | ||||||
| Total long-term investments | ||||||||
| (cost $317,740) | $ | 390,954 | ||||||
| SHORT-TERM INVESTMENTS - 1.7% | ||||||||
| Repurchase Agreements - 1.7% | ||||||||
| Bank of America Merrill Lynch TriParty Repurchase Agreement (maturing on 07/01/2013 in the amount of $25, collateralized by GNMA 3.00%, 2042, value of $26) | ||||||||
| $ | 25 | 0.13%, 6/28/2013 | $ | 25 | ||||
| Bank of Montreal TriParty Repurchase Agreement (maturing on 07/01/2013 in the amount of $536, collateralized by FHLMC 4.00% - 5.00%, 2023 - 2025, FNMA 2.00% - 5.00%, 2022 - 2042, GNMA 2.00% - 5.00%, 2041 - 2043, value of $545) | ||||||||
| 536 | 0.15%, 6/28/2013 | 536 | ||||||
| Bank of Montreal TriParty Repurchase Agreement (maturing on 07/01/2013 in the amount of $1,041, collateralized by FHLB 0.38%, 2015, FHLMC 0.38%, 2014, FNMA 0.50% - 5.50%, 2015 - 2042, value of $1,059) | ||||||||
| 1,040 | 0.12%, 6/28/2013 | 1,040 | ||||||
| Barclays Capital TriParty Repurchase Agreement (maturing on 07/01/2013 in the amount of $721, collateralized by U.S. Treasury Note 3.13%, 2021, value of $733) | ||||||||
| 721 | 0.10%, 6/28/2013 | 721 | ||||||
| Citigroup Global Markets, Inc. TriParty Repurchase Agreement (maturing on 07/01/2013 in the amount of $2,125, collateralized by U.S. Treasury Bill 0.85%, 2013, U.S. Treasury Note 0.63% - 3.25%, 2013 - 2018, value of $2,157) | ||||||||
| 2,125 | 0.10%, 6/28/2013 | 2,125 | ||||||
| Deutsche Bank Securities TriParty Repurchase Agreement (maturing on 07/01/2013 in the amount of $25, collateralized by FNMA 4.50%, 2035, value of $26) | ||||||||
| 25 | 0.25%, 6/28/2013 | 25 | ||||||
The accompanying notes are an integral part of these financial statements.
| 6 |
| Shares or Principal Amount | Market Value ╪ | |||||||||||
| SHORT-TERM INVESTMENTS - 1.7% - (continued) | ||||||||||||
| Repurchase Agreements - 1.7% - (continued) | ||||||||||||
| RBS Securities, Inc. TriParty Repurchase Agreement (maturing on 07/01/2013 in the amount of $852, collateralized by U.S. Treasury Note 1.00% - 2.63%, 2014 - 2020, value of $869) | ||||||||||||
| $ | 852 | 0.10%, 6/28/2013 | $ | 852 | ||||||||
| TD Securities TriParty Repurchase Agreement (maturing on 07/01/2013 in the amount of $1,503, collateralized by FHLMC 3.50% - 4.00%, 2042, FNMA 3.50% - 4.50%, 2041 - 2042, value of $1,528) | ||||||||||||
| 1,503 | 0.12%, 6/28/2013 | 1,503 | ||||||||||
| UBS Securities, Inc. Repurchase Agreement (maturing on 07/01/2013 in the amount of $22, collateralized by U.S. Treasury Note 0.63%, 2014, value of $22) | ||||||||||||
| 22 | 0.09%, 6/28/2013 | 22 | ||||||||||
| 6,849 | ||||||||||||
| Total short-term investments | ||||||||||||
| (cost $6,849) | $ | 6,849 | ||||||||||
| Total investments | ||||||||||||
| (cost $324,589) ▲ | 99.9 | % | $ | 397,803 | ||||||||
| Other assets and liabilities | 0.1 | % | 370 | |||||||||
| Total net assets | 100.0 | % | $ | 398,173 | ||||||||
| Note: | Percentage of investments as shown is the ratio of the total market value to total net assets. |
| Prices of foreign equities that are principally traded on certain foreign markets may be adjusted daily pursuant to a fair value pricing service approved by the Board of Directors in order to reflect an adjustment for factors occurring after the close of certain foreign markets but before the close of the New York Stock Exchange. |
| ▲ | At June 30, 2013, the cost of securities for federal income tax purposes was $326,266 and the aggregate gross unrealized appreciation and depreciation based on that cost were: |
| Unrealized Appreciation | $ | 80,111 | ||
| Unrealized Depreciation | (8,574 | ) | ||
| Net Unrealized Appreciation | $ | 71,537 |
| ● | Non-income producing. |
The accompanying notes are an integral part of these financial statements.
| 7 |
| Hartford Global Growth HLS Fund |
| Schedule of Investments – (continued) |
| June 30, 2013 (Unaudited) |
| (000’s Omitted) |
Foreign Currency Contracts Outstanding at June 30, 2013
| Currency | Buy / Sell | Delivery Date | Counterparty | Contract Amount | Market Value ╪ | Unrealized Appreciation/ (Depreciation) | ||||||||||||
| EUR | Buy | 07/01/2013 | DEUT | $ | 192 | $ | 192 | $ | – | |||||||||
| ╪ | See Significant Accounting Policies of accompanying Notes to Financial Statements regarding valuation of securities. |
| GLOSSARY: (abbreviations used in preceding Schedule of Investments) | |
| Counterparty Abbreviations: | |
| DEUT | Deutsche Bank Securities, Inc. |
| Currency Abbreviations: | |
| EUR | EURO |
| Other Abbreviations: | |
| ADR | American Depositary Receipt |
| FHLB | Federal Home Loan Bank |
| FHLMC | Federal Home Loan Mortgage Corp. |
| FNMA | Federal National Mortgage Association |
| GNMA | Government National Mortgage Association |
| REIT | Real Estate Investment Trust |
The accompanying notes are an integral part of these financial statements.
| 8 |
| Hartford Global Growth HLS Fund |
| Investment Valuation Hierarchy Level Summary |
| June 30, 2013 (Unaudited) |
| (000’s Omitted) |
| Total | Level 1 ♦ | Level 2 ♦ | Level 3 | |||||||||||||
| Assets: | ||||||||||||||||
| Common Stocks | ||||||||||||||||
| Automobiles and Components | $ | 2,737 | $ | – | $ | 2,737 | $ | – | ||||||||
| Banks | 8,998 | – | 8,998 | – | ||||||||||||
| Capital Goods | 18,698 | 6,590 | 12,108 | – | ||||||||||||
| Commercial and Professional Services | 7,168 | 2,375 | 4,793 | – | ||||||||||||
| Consumer Durables and Apparel | 5,915 | 1,796 | 4,119 | – | ||||||||||||
| Consumer Services | 13,360 | 6,859 | 6,501 | – | ||||||||||||
| Diversified Financials | 41,433 | 33,529 | 7,904 | – | ||||||||||||
| Energy | 8,887 | 8,887 | – | – | ||||||||||||
| Food and Staples Retailing | 7,817 | 5,568 | 2,249 | – | ||||||||||||
| Food, Beverage and Tobacco | 31,614 | 8,360 | 23,254 | – | ||||||||||||
| Health Care Equipment and Services | 7,224 | 7,224 | – | – | ||||||||||||
| Insurance | 8,000 | 5,801 | 2,199 | – | ||||||||||||
| Materials | 8,275 | 2,426 | 5,849 | – | ||||||||||||
| Media | 24,536 | 22,505 | 2,031 | – | ||||||||||||
| Pharmaceuticals, Biotechnology and Life Sciences | 55,947 | 36,673 | 19,274 | – | ||||||||||||
| Real Estate | 2,298 | 2,298 | – | – | ||||||||||||
| Retailing | 22,386 | 22,386 | – | – | ||||||||||||
| Semiconductors and Semiconductor Equipment | 19,928 | 4,403 | 15,525 | – | ||||||||||||
| Software and Services | 59,361 | 51,586 | 7,775 | – | ||||||||||||
| Technology Hardware and Equipment | 21,755 | 14,880 | 6,875 | – | ||||||||||||
| Telecommunication Services | 4,858 | 2,626 | 2,232 | – | ||||||||||||
| Transportation | 4,483 | 4,483 | – | – | ||||||||||||
| Utilities | 2,515 | – | 2,515 | – | ||||||||||||
| Total | 388,193 | 251,255 | 136,938 | – | ||||||||||||
| Preferred Stocks | 2,761 | – | 2,761 | – | ||||||||||||
| Short–Term Investments | 6,849 | – | 6,849 | – | ||||||||||||
| Total | $ | 397,803 | $ | 251,255 | $ | 146,548 | $ | – | ||||||||
| Foreign Currency Contracts* | – | – | – | – | ||||||||||||
| Total | $ | – | $ | – | $ | – | $ | – | ||||||||
| ♦ | For the six-month period ended June 30, 2013, there were no transfers between Level 1 and Level 2. |
| * | Derivative instruments not reflected in the Schedule of Investments are valued at the unrealized appreciation/depreciation on the investments. |
The accompanying notes are an integral part of these financial statements.
| 9 |
| Hartford Global Growth HLS Fund |
| Statement of Assets and Liabilities |
| June 30, 2013 (Unaudited) |
| (000’s Omitted) |
| Assets: | ||||
| Investments in securities, at market value (cost $324,589) | $ | 397,803 | ||
| Foreign currency on deposit with custodian (cost $38) | 38 | |||
| Unrealized appreciation on foreign currency contracts | — | |||
| Receivables: | ||||
| Investment securities sold | 727 | |||
| Fund shares sold | 81 | |||
| Dividends and interest | 751 | |||
| Total assets | 399,400 | |||
| Liabilities: | ||||
| Bank overdraft | 12 | |||
| Payables: | ||||
| Investment securities purchased | 616 | |||
| Fund shares redeemed | 481 | |||
| Investment management fees | 49 | |||
| Distribution fees | 3 | |||
| Accrued expenses | 66 | |||
| Total liabilities | 1,227 | |||
| Net assets | $ | 398,173 | ||
| Summary of Net Assets: | ||||
| Capital stock and paid-in-capital | $ | 412,522 | ||
| Undistributed net investment income | 4,480 | |||
| Accumulated net realized loss | (92,049 | ) | ||
| Unrealized appreciation of investments and the translations of assets and liabilities denominated in foreign currency | 73,220 | |||
| Net assets | $ | 398,173 | ||
| Shares authorized | 3,400,000 | |||
| Par value | $ | 0.001 | ||
| Class IA: Net asset value per share | $ | 18.40 | ||
| Shares outstanding | 17,526 | |||
| Net assets | $ | 322,391 | ||
| Class IB: Net asset value per share | $ | 18.24 | ||
| Shares outstanding | 4,155 | |||
| Net assets | $ | 75,782 |
The accompanying notes are an integral part of these financial statements.
| 10 |
| Hartford Global Growth HLS Fund |
| Statement of Operations |
| For the Six-Month Period Ended June 30, 2013 (Unaudited) |
| (000’s Omitted) |
| Investment Income: | ||||
| Dividends | $ | 3,704 | ||
| Interest | 3 | |||
| Less: Foreign tax withheld | (311 | ) | ||
| Total investment income, net | 3,396 | |||
| Expenses: | ||||
| Investment management fees | 1,543 | |||
| Transfer agent fees | — | |||
| Distribution fees - Class IB | 98 | |||
| Custodian fees | 13 | |||
| Accounting services fees | 29 | |||
| Board of Directors' fees | 6 | |||
| Audit fees | 7 | |||
| Other expenses | 72 | |||
| Total expenses (before fees paid indirectly) | 1,768 | |||
| Commission recapture | (2 | ) | ||
| Total fees paid indirectly | (2 | ) | ||
| Total expenses, net | 1,766 | |||
| Net Investment Income | 1,630 | |||
| Net Realized Gain on Investments and Foreign Currency Transactions: | ||||
| Net realized gain on investments | 32,160 | |||
| Net realized loss on foreign currency contracts | (231 | ) | ||
| Net realized gain on other foreign currency transactions | 182 | |||
| Net Realized Gain on Investments and Foreign Currency Transactions | 32,111 | |||
| Net Changes in Unrealized Appreciation of Investments and Foreign Currency Transactions: | ||||
| Net unrealized appreciation of investments | 10,723 | |||
| Net unrealized depreciation of foreign currency contracts | — | |||
| Net unrealized depreciation on translation of other assets and liabilities in foreign currencies | (9 | ) | ||
| Net Changes in Unrealized Appreciation of Investments and Foreign Currency Transactions | 10,714 | |||
| Net Gain on Investments and Foreign Currency Transactions | 42,825 | |||
| Net Increase in Net Assets Resulting from Operations | $ | 44,455 |
The accompanying notes are an integral part of these financial statements.
| 11 |
| Hartford Global Growth HLS Fund |
| Statement of Changes in Net Assets |
| (000’s Omitted) |
| For the Six-Month Period Ended June 30, 2013 (Unaudited) | For the Year Ended December 31, 2012 | |||||||
| Operations: | ||||||||
| Net investment income | $ | 1,630 | $ | 3,002 | ||||
| Net realized gain on investments and foreign currency transactions | 32,111 | 53,493 | ||||||
| Net unrealized appreciation of investments and foreign currency transactions | 10,714 | 36,058 | ||||||
| Net Increase in Net Assets Resulting from Operations | 44,455 | 92,553 | ||||||
| Distributions to Shareholders: | ||||||||
| From net investment income | ||||||||
| Class IA | — | (2,003 | ) | |||||
| Class IB | — | (201 | ) | |||||
| Total distributions | — | (2,204 | ) | |||||
| Capital Share Transactions: | ||||||||
| Class IA | ||||||||
| Sold | 7,870 | 18,835 | ||||||
| Issued on reinvestment of distributions | — | 2,003 | ||||||
| Redeemed | (42,810 | ) | (125,314 | ) | ||||
| Total capital share transactions | (34,940 | ) | (104,476 | ) | ||||
| Class IB | ||||||||
| Sold | 4,231 | 8,583 | ||||||
| Issued on reinvestment of distributions | — | 201 | ||||||
| Redeemed | (14,168 | ) | (31,213 | ) | ||||
| Total capital share transactions | (9,937 | ) | (22,429 | ) | ||||
| Net decrease from capital share transactions | (44,877 | ) | (126,905 | ) | ||||
| Net Decrease in Net Assets | (422 | ) | (36,556 | ) | ||||
| Net Assets: | ||||||||
| Beginning of period | 398,595 | 435,151 | ||||||
| End of period | $ | 398,173 | $ | 398,595 | ||||
| Undistributed (distribution in excess of) net investment income | $ | 4,480 | $ | 2,850 | ||||
| Shares: | ||||||||
| Class IA | ||||||||
| Sold | 438 | 1,247 | ||||||
| Issued on reinvestment of distributions | — | 129 | ||||||
| Redeemed | (2,385 | ) | (8,150 | ) | ||||
| Total share activity | (1,947 | ) | (6,774 | ) | ||||
| Class IB | ||||||||
| Sold | 235 | 574 | ||||||
| Issued on reinvestment of distributions | — | 13 | ||||||
| Redeemed | (794 | ) | (2,035 | ) | ||||
| Total share activity | (559 | ) | (1,448 | ) | ||||
The accompanying notes are an integral part of these financial statements.
| 12 |
| Hartford Global Growth HLS Fund |
| Notes to Financial Statements |
| June 30, 2013 (Unaudited) |
| (000’s Omitted) |
| 1. | Organization: |
Hartford Global Growth HLS Fund (the “Fund”) serves as an underlying investment option for certain variable annuity and variable life insurance separate accounts of Hartford Life Insurance Company (“HLIC”) and its affiliates and certain qualified retirement plans. The Fund may also serve as an underlying investment option for certain variable annuity and variable life separate accounts of other insurance companies. Owners of variable annuity contracts and policyholders of variable life insurance contracts may choose the funds permitted in the variable insurance contract prospectus. In addition, participants in certain qualified retirement plans may choose the Fund if permitted by their plans.
Hartford Series Fund, Inc. (the “Company”) is an open-end registered management investment company comprised of thirty portfolios. Financial statements for the Fund, a series of the Company, are included in this report.
The Company is organized under the laws of the State of Maryland and is registered with the Securities and Exchange Commission (“SEC”) under the Investment Company Act of 1940, as amended (“1940 Act”). The Fund’s portfolio managers are Matthew D. Hudson (51.13%) and John A. Boselli (48.87%). The Fund is a diversified open-end management investment company.
The Fund is divided into Class IA and Class IB shares. Each class is offered at the per share net asset value (“NAV”) without a sales charge and is subject to the same expenses, except that the Class IB shares are subject to distribution and service fees charged pursuant to a Distribution Plan adopted in accordance with Rule 12b-1 under the 1940 Act.
| 2. | Significant Accounting Policies: |
The following is a summary of significant accounting policies of the Fund in the preparation of its financial statements, which are in accordance with the United States Generally Accepted Accounting Principles (“U.S. GAAP”). The preparation of financial statements in accordance with U.S. GAAP may require management to make estimates and assumptions that affect the reported amounts of assets and liabilities and disclosure of contingent assets and liabilities at the date of the financial statements and the reported amounts of increases and decreases in net assets from operations during the reporting period. Actual results could differ from those estimates.
| a) | Determination of Net Asset Value – The NAV of each class of the Fund’s shares is determined as of the close of regular trading (normally 4:00 p.m. Eastern Time) (the “NYSE Close”) on each day that the New York Stock Exchange (the “Exchange”) is open (“Valuation Date”). Information that becomes known to the Fund after the NAV has been calculated on a particular day will not generally be used to retroactively adjust the NAV determined earlier that day. |
| b) | Investment Valuation and Fair Value Measurements – For purposes of calculating the NAV, portfolio investments and other assets held by the Fund's portfolio for which market quotes are readily available are valued at market value. Market value is generally determined on the basis of last reported sales prices or official close price. If no sales are reported, market value is based on quotes obtained from a quotation reporting system, established market makers, or independent pricing services. If market prices are not readily available or are deemed unreliable, the Fund will use the fair value of the investment as determined in good faith under policies and procedures established by and under the supervision of the Company’s Board of Directors. Market quotes are considered not readily available where there is an absence of current or reliable market-based data (e.g., trade information or indicative market quotes), including where events occur after the close of the relevant market, but prior to the NYSE Close that materially affect the values of the Fund’s portfolio investments or assets. In addition, market quotes are considered not readily available when, due to extraordinary circumstances, the exchanges or markets on which the investments trade do not open for trading for the entire day and no other market prices are available. In addition, prices of foreign equities that are principally traded on certain foreign markets may be adjusted daily pursuant to a fair value pricing service approved by the Board of Directors in order to reflect an adjustment for the factors occurring after the close of certain foreign markets but before the NYSE Close. Investments that are primarily traded on foreign markets may trade on days that are not business days of the Fund. The |
| 13 |
| Hartford Global Growth HLS Fund |
| Notes to Financial Statements – (continued) |
| June 30, 2013 (Unaudited) |
| (000’s Omitted) |
| value of the foreign investments in which the Fund invests may change on days when a shareholder will not be able to purchase or redeem shares of the Fund. Fair value pricing is subjective in nature and the use of fair value pricing by the Fund may cause the NAV of its shares to differ significantly from the NAV that would have been calculated using market prices at the close of the exchange on which a portfolio investment is primarily traded. There can be no assurance that the Fund could obtain the fair market value assigned to an investment if the Fund were to sell the investment at approximately the time at which the Fund determines its NAV. |
Investments valued in currencies other than U.S. dollars are converted to U.S. dollars using exchange rates obtained from independent pricing services for calculation of the NAV. As a result, the NAV of the Fund’s shares may be affected by changes in the value of currencies in relation to the U.S. dollar. The value of investments traded in markets outside the United States or denominated in currencies other than the U.S. dollar may be affected significantly on a day that the NYSE is closed and the market value may change on days when an investor is not able to purchase, redeem or exchange shares of the Fund.
Foreign currency contracts represent agreements to exchange currencies on specific future dates at predetermined rates. Foreign currency contracts are valued using foreign currency exchange rates and forward rates as provided by an independent pricing service on the Valuation Date.
Financial instruments for which prices are not available from an independent pricing service may be valued using market quotations obtained from one or more dealers that make markets in the respective financial instrument in accordance with procedures established by the Company’s Board of Directors.
U.S. GAAP defines fair value as the price that the Fund would receive to sell an asset or pay to transfer a liability in an orderly transaction between market participants. The U.S. GAAP fair value measurement standards require disclosure of a fair value hierarchy for each major category of assets and liabilities. Various inputs are used in determining the fair value of the Fund’s investments. These inputs are summarized into three broad hierarchy levels. This hierarchy is based on whether the valuation inputs are observable or unobservable. These levels are:
| · | Level 1 – Quoted prices in active markets for identical investments. Level 1 may include exchange traded instruments, such as domestic equities, some foreign equities, options, futures, mutual funds, exchange traded funds, rights and warrants. |
| · | Level 2 – Observable inputs other than Level 1 prices, such as quoted prices for similar investments; quoted prices in markets that are not active; or other inputs that are observable or can be corroborated by observable market data. Level 2 may include debt investments that are traded less frequently than exchange traded instruments and which are valued using independent pricing services; foreign equities, which are principally traded on certain foreign markets and are adjusted daily pursuant to a fair value pricing service in order to reflect an adjustment for the factors occurring after the close of certain foreign markets but before the NYSE Close; and short-term investments, which are valued at amortized cost. |
| · | Level 3 – Significant unobservable inputs that are supported by limited or no market activity. Level 3 may include financial instruments whose values are determined using indicative market quotes or require significant management judgment or estimation. These unobservable valuation inputs may include estimates for current yields, maturity/duration, prepayment speed, and indicative market quotes for comparable investments along with other assumptions relating to credit quality, collateral value, complexity of the investment structure, general market conditions and liquidity. This category may include investments where trading has been halted or there are certain restrictions on trading. While these investments are priced using unobservable inputs, the valuation of these investments reflects the best available data and management believes the prices are a reasonable representation of exit price. |
The Board of Directors of the Company generally reviews and approves the “Procedures for Valuation of Portfolio Securities” on an annual basis. These procedures define how investments are to be valued, including
| 14 |
the formation and activities of a Valuation Committee. The Valuation Committee is responsible for determining in good faith the fair value of investments when the value cannot be obtained from primary pricing services or alternative sources or if the valuation of an investment as provided by the primary pricing service or alternative source is believed not to reflect the investment’s fair value as of the Valuation Date. Members of the Valuation Committee include the Fund’s Treasurer or designee, a Vice President of the Fund with legal expertise or designee, and a Vice President of the investment manager or designee. In addition, the Fund’s Chief Compliance Officer shall designate a member of the compliance group to attend Valuation Committee meetings as a non-voting resource, to monitor for and provide guidance with respect to compliance with these procedures. Two members of the Valuation Committee or their designees, representing different departments, shall constitute a quorum for purposes of permitting the Valuation Committee to take action. The Valuation Committee will consider all relevant factors in determining an investment’s fair value, and may seek the advice of the Fund’s sub-adviser, knowledgeable brokers, and legal counsel in making such determination. The Valuation Committee reports to the Audit Committee of the Company’s Board of Directors. The Audit Committee receives quarterly written reports which include details of all fair-valued investments, including the reason for the fair valuation, and an indication, when possible, of the accuracy of the valuation by disclosing the next available reliable public price quotation or the disposition price of such investments (the “look-back” test). The Board of Directors then must consider for ratification all of the fair value determinations made during the previous quarter.
Valuation levels are not necessarily indicative of the risk associated with investing in such investments. Individual investments within any of the above mentioned asset classes may be assigned a different hierarchical level than those presented above, as individual circumstances dictate.
For additional information, refer to the Investment Valuation Hierarchy Level Summary and the Level 3 roll-forward reconciliation, if applicable, which follow the Schedule of Investments.
For purposes of reporting transfers between different hierarchy levels, both transfers in and out of each level, as applicable, are shown as if they occurred at the beginning of the period.
| c) | Investment Transactions and Investment Income – Investment transactions are recorded as of the trade date (the date the order to buy or sell is executed) for financial reporting purposes. Investments purchased or sold on a when-issued or delayed-delivery basis may be settled a month or more after the trade date. Realized gains and losses are determined on the basis of identified cost. |
Dividend income from domestic securities is accrued on the ex-dividend date. In general, dividend income from foreign securities is recorded on the ex-date; however, dividend notifications in certain foreign jurisdictions may not be available in a timely manner and as a result, the Fund will record the dividend as soon as the relevant details (i.e., rate per share, payment date, shareholders of record, etc.) are publicly available. Interest income, including amortization of premium and accretion of discounts, is accrued on a daily basis.
| d) | Foreign Currency Transactions – Assets and liabilities denominated in currencies other than U.S. dollars are translated into U.S. dollars at the exchange rates in effect on the valuation date. Purchases and sales of investments, income, and expenses are translated into U.S. dollars at the exchange rates on the dates of such transactions. |
The Fund does not isolate that portion of portfolio investment valuation resulting from fluctuations in the foreign currency exchange rates from the fluctuations arising from changes in the market prices of investments held. Exchange rate fluctuations are included with the net realized and unrealized gain or loss on investments in the accompanying financial statements.
Net realized foreign exchange gains or losses arise from sales of foreign currencies and the difference between asset and liability amounts initially stated in foreign currencies and the U.S. dollar value of the amounts actually received or paid.
| 15 |
| Hartford Global Growth HLS Fund |
| Notes to Financial Statements – (continued) |
| June 30, 2013 (Unaudited) |
| (000’s Omitted) |
Net unrealized foreign exchange gains or losses arise from changes in the value of other assets and liabilities at the end of the reporting period, resulting from changes in the exchange rates.
| e) | Joint Trading Account – The Fund may invest cash balances into a joint trading account that may be invested in one or more repurchase agreements. |
| f) | Fund Share Valuation and Dividend Distributions to Shareholders – Orders for the Fund’s shares are executed in accordance with the investment instructions of the contract holders and plan participants. The NAV of the Fund’s shares is determined as of the close of business on each business day of the Exchange. The NAV is determined separately for each class of shares of the Fund by dividing the Fund’s net assets attributable to that class by the number of shares of the class outstanding. Each class of shares offered by the Fund has equal rights as to assets and voting privileges (except that shareholders of a class have exclusive voting rights regarding any matter relating solely to that class of shares). Income and non-class specific expenses are allocated daily to each class on the basis of the relative net assets of the class. Realized and unrealized capital gains and losses are allocated daily based on the relative net assets of each class of shares of the Fund. |
Orders for the purchase of the Fund’s shares received prior to the close of the Exchange on any day the Exchange is open for business are priced at the NAV determined as of the close of the Exchange. Orders received after the close of the Exchange, or on a day on which the Exchange and/or the Fund is not open for business, are priced at the next determined NAV.
Dividends are declared pursuant to a policy adopted by the Company’s Board of Directors based upon the investment performance of the Fund. The policy of the Fund is to pay dividends from net investment income and realized capital gains, if any, at least once a year.
Distributions from net investment income, net realized capital gains and capital are determined in accordance with federal income tax regulations, which may differ from U.S. GAAP with respect to character and timing. These differences may include but are not limited to losses deferred due to wash sale adjustments, foreign currency gains and losses, adjustments related to Passive Foreign Investment Companies (“PFICs”), Real Estate Investment Trusts (“REITs”), Regulated Investment Companies (“RICs”), certain derivatives and partnerships. Permanent book and federal income tax basis differences relating to shareholder distributions will result in reclassifications to certain of the Fund’s capital accounts (see Federal Income Taxes: Reclassification of Capital Accounts note).
| 3. | Securities and Other Investments: |
| a) | Repurchase Agreements – A repurchase agreement is an agreement by which a counterparty agrees to sell an investment and agrees to repurchase the investment sold from the buyer at a mutually agreed upon time and price. During the period of the repurchase agreement, the counterparty will deposit cash and or securities in a third party custodial account to serve as collateral. At the time the Fund enters into a repurchase agreement, the value of the underlying collateral, including accrued interest, will be equal to or exceed the value of the repurchase agreement. Repurchase agreements expose the Fund to counterparty risk - that is, the risk that the counterparty will not fulfill its obligations. To minimize counterparty risk, the investments that serve to collateralize the repurchase agreement are held by the Fund’s custodian in book entry or physical form in the custodial account of the Fund or in a third party custodial account. Repurchase agreements are valued at cost plus accrued interest, which approximates fair value. Repurchase agreements have master netting agreements which allow the Fund to offset amounts owed to a counterparty with amounts owed by the counterparty, including any collateral. The Fund, as shown on the Schedule of Investments, had outstanding repurchase agreements as of June 30, 2013. |
| b) | Investments Purchased on a When-Issued or Delayed-Delivery Basis – Delivery and payment for investments that have been purchased by the Fund on a forward commitment, or when-issued or delayed-delivery basis, take place beyond the |
| 16 |
| customary settlement period. A fund may dispose of or renegotiate a delayed-delivery transaction after it is entered into, and may sell delayed-delivery investments before they are delivered, which may result in a realized gain or loss. During this period, such investments are subject to market fluctuations, and the Fund identifies investments segregated in its records with a value at least equal to the amount of the commitment. As of June 30, 2013, the Fund had no outstanding when-issued or delayed-delivery investments. |
| 4. | Financial Derivative Instruments: |
The following disclosures contain information on how and why the Fund uses derivative instruments, the credit-risk-related contingent features in certain derivative instruments, and how derivative instruments affect the Fund’s financial position and results of operations. The location and fair value amounts of these instruments on the Statement of Assets and Liabilities and the realized gains and losses and changes in unrealized gains and losses on the Statement of Operations, each categorized by type of derivative contract, are included in the following Additional Derivative Instrument Information footnote. The derivative instruments outstanding as of period-end are disclosed in the notes to or within the Schedule of Investments for purchased options, if applicable. The amounts of realized gains and losses and changes in unrealized gains and losses on derivative instruments during the period are disclosed in the Statement of Operations.
| a) | Foreign Currency Contracts – The Fund may enter into foreign currency contracts that obligate the Fund to purchase or sell currencies at specified future dates. Foreign currency contracts are used to hedge the currency exposure associated with some or all of the Fund’s investments and/or as part of an investment strategy. Foreign currency contracts are marked to market daily and the change in value is recorded by the Fund as an unrealized gain or loss. The Fund will record a realized gain or loss when the foreign currency contract is settled. |
Foreign currency contracts involve elements of market risk in excess of the amounts reflected in the Statement of Assets and Liabilities. In addition, risks may arise upon entering into these contracts from the potential inability of the counterparties to meet the terms of the contracts and from unanticipated movements in the value of the foreign currencies relative to the U.S. dollar. The Fund had outstanding foreign currency contracts as shown on the Schedule of Investments as of June 30, 2013.
| b) | Additional Derivative Instrument Information: |
| Fair Value of Derivative Instruments on the Statement of Assets and Liabilities as of June 30, 2013: |
| Risk Exposure Category | ||||||||||||||||||||||||||||
| Interest Rate Contracts | Foreign Exchange Contracts | Credit Contracts | Equity Contracts | Commodity Contracts | Other Contracts | Total | ||||||||||||||||||||||
| Assets: | ||||||||||||||||||||||||||||
| Unrealized appreciation on foreign currency contracts | $ | — | $ | — | $ | — | $ | — | $ | — | $ | — | $ | — | ||||||||||||||
| Total | $ | — | $ | — | $ | — | $ | — | $ | — | $ | — | $ | — | ||||||||||||||
The volume of derivative activity was minimal during the six-month period ended June 30, 2013.
| 17 |
| Hartford Global Growth HLS Fund |
| Notes to Financial Statements – (continued) |
| June 30, 2013 (Unaudited) |
| (000’s Omitted) |
The Effect of Derivative Instruments on the Statement of Operations for the six-month period ended June 30, 2013:
| Risk Exposure Category | ||||||||||||||||||||||||||||
| Interest Rate Contracts | Foreign Exchange Contracts | Credit Contracts | Equity Contracts | Commodity Contracts | Other Contracts | Total | ||||||||||||||||||||||
| Realized Loss on Derivatives Recognized as a Result of Operations: | ||||||||||||||||||||||||||||
| Net realized loss on foreign currency contracts | $ | — | $ | (231 | ) | $ | — | $ | — | $ | — | $ | — | $ | (231 | ) | ||||||||||||
| Total | $ | — | $ | (231 | ) | $ | — | $ | — | $ | — | $ | — | $ | (231 | ) | ||||||||||||
| Net Change in Unrealized Appreciation (Depreciation) on Derivatives Recognized as a Result of Operations: | ||||||||||||||||||||||||||||
| Net change in unrealized appreciation of foreign currency contracts | $ | — | $ | — | $ | — | $ | — | $ | — | $ | — | $ | — | ||||||||||||||
| Total | $ | — | $ | — | $ | — | $ | — | $ | — | $ | — | $ | — | ||||||||||||||
| c) | Balance Sheet Offsetting Information: |
Set forth below are tables which disclose both gross information and net information about instruments and transactions eligible for offset in the financial statements, and instruments and transactions that are subject to a master netting agreement, as well as amounts related to margin, reflected as financial collateral (including cash collateral), held at clearing brokers, counterparties, and the Fund’s custodian. The master netting agreements allow the clearing brokers to net any collateral held in or on behalf of the Fund, or liabilities or payment obligations of the clearing brokers to the Fund, against any liabilities or payment obligations of the Fund to the clearing brokers. The Fund is required to deposit financial collateral (including cash collateral) at the Fund’s custodian on behalf of clearing brokers and counterparties to continually meet the original and maintenance requirements established by the clearing brokers and counterparties. Such requirements are specific to the respective clearing broker or counterparty.
Offsetting of Financial Assets and Derivative Assets as of June 30, 2013:
| Description | Gross Amounts of Recognized Assets | Gross Amounts Offset in Statement of Assets and Liabilities | Net Amounts of Assets Presented in Statement of Assets and Liabilities | Financial Instruments with Allowable Netting | Collateral Received | Net Amount (not less than 0) | ||||||||||||||||||
| Repurchase Agreements | $ | 6,849 | $ | — | $ | 6,849 | $ | — | $ | (6,965 | ) | $ | — | |||||||||||
| Unrealized appreciation on foreign currency contracts | — | — | — | — | — | — | ||||||||||||||||||
| Total subject to a master netting or similar arrangement | $ | 6,849 | $ | — | $ | 6,849 | $ | — | $ | (6,965 | ) | $ | — | |||||||||||
| 5. | Principal Risks: |
| a) | Counterparty Risk – The Fund may be exposed to counterparty risk, or the risk that an institution or other entity with which the Fund has unsettled or open transactions will default. |
| b) | Market Risks – If the Fund invests directly in foreign currencies or in securities that trade in, and receive revenues in, foreign currencies, or in derivatives that provide exposure to foreign currencies, it will be subject to the risk that those currencies will decline in value relative to the base currency of the Fund, or, in the case of hedging positions, that the Fund’s base currency will decline in value relative to the currency being hedged. Currency rates in foreign countries may fluctuate significantly over short periods of time for a number of reasons, including changes in interest rates, intervention (or the failure to intervene) by U.S. or foreign governments, central banks or supranational entities, such as the International Monetary Fund, or by the imposition of currency controls or other political developments in the United States or abroad. As a result, the Fund’s investments in foreign currency denominated securities may reduce the returns |
| 18 |
| of the Fund. The market values of equity securities, such as common stocks and preferred stocks, or equity related investments, such as futures and options, may decline due to general market conditions which are not specifically related to a particular company, such as real or perceived adverse economic conditions, changes in the general outlook for corporate earnings, changes in interest or currency rates or adverse investor sentiment generally. The market value of equity securities may also decline due to factors which affect a particular industry or industries, such as labor shortages or increased production costs and competitive conditions within an industry. Equity securities and equity related investments generally have greater market price volatility than fixed income securities. |
| 6. | Federal Income Taxes: |
| a) | Federal Income Taxes – For federal income tax purposes, the Fund intends to continue to qualify as a RIC under Subchapter M of the Internal Revenue Code (“IRC”) by distributing substantially all of its taxable net investment income and net realized capital gains to its shareholders and otherwise complying with the requirements of the IRC. The Fund has distributed substantially all of its income and capital gains in prior years, if applicable, and intends to distribute substantially all of its income and capital gains prior to the next fiscal year-end. Accordingly, no provision for federal income or excise taxes has been made in the accompanying financial statements. Distributions from short-term capital gains are treated as ordinary income distributions for federal income tax purposes. |
| b) | Net Investment Income (Loss), Net Realized Gains (Losses), and Distributions – Net investment income (loss) and net realized gains (losses) may differ for financial statement and tax purposes primarily because of losses deferred due to wash sale adjustments, foreign currency gains and losses, adjustments related to PFICs, REITs, RICs, certain derivatives and partnerships. The character of distributions made during the year from net investment income or net realized gains may differ from their ultimate characterization for federal income tax purposes. Also, due to the timing of dividend distributions, the fiscal year in which amounts are distributed may differ from the year that the income or realized gains (losses) were recorded by the Fund. |
| c) | Distributions and Components of Distributable Earnings – The tax character of distributions paid by the Fund for the periods indicated is as follows (as adjusted for dividends payable, if applicable): |
| For the Year Ended December 31, 2012 | For the Year Ended December 31, 2011 | |||||||
| Ordinary Income | $ | 2,204 | $ | 149 | ||||
As of December 31, 2012, the Fund’s components of distributable earnings (deficit) on a tax basis were as follows:
| Amount | ||||
| Undistributed Ordinary Income | $ | 2,850 | ||
| Accumulated Capital and Other Losses* | (122,483 | ) | ||
| Unrealized Appreciation† | 60,829 | |||
| Total Accumulated Deficit | $ | (58,804 | ) | |
| * | The Fund has capital loss carryforwards that are identified in the Capital Loss Carryforward note that follows. |
| † | Differences between book-basis and tax-basis unrealized appreciation (depreciation) may be attributable to the losses deferred due to wash sale adjustments, foreign currency gains and losses, adjustments related to PFICs, REITs, RICs, certain derivatives and partnerships. |
| d) | Reclassification of Capital Accounts – The Fund may record reclassifications in its capital accounts. These reclassifications have no impact on the total net assets of the Fund. The reclassifications are a result of permanent differences between U.S. GAAP and tax accounting for such items as foreign currency, PFICs, expiration or utilization of capital loss carryforwards or net operating losses. Adjustments are made to reflect the impact these items have on |
| 19 |
| Hartford Global Growth HLS Fund |
| Notes to Financial Statements – (continued) |
| June 30, 2013 (Unaudited) |
| (000’s Omitted) |
| current and future distributions to shareholders. Therefore, the source of the Fund’s distributions may be shown in the accompanying Statement of Changes in Net Assets as from undistributed net investment income, from accumulated net realized gains on investments or from capital depending on the type of book and tax differences that exist. For the year ended December 31, 2012, the Fund recorded reclassifications to increase (decrease) the accounts listed below: |
| Amount | ||||
| Undistributed Net Investment Income | $ | (222 | ) | |
| Accumulated Net Realized Gain (Loss) | 222 | |||
| e) | Capital Loss Carryforward – On December 22, 2010, the Regulated Investment Company Modernization Act of 2010 (the “Act”) was enacted, which made changes to the capital loss carryforward rules. The changes are effective for taxable years beginning after the date of enactment. Under the Act, funds are permitted to carry forward capital losses for an unlimited period. However, any losses incurred during those future taxable years will be required to be utilized prior to the losses incurred in pre-enactment taxable years, which carry an expiration date. As a result of this ordering rule, pre-enactment capital loss carryforwards may be more likely to expire unused. Additionally, post-enactment capital loss carryforwards retain their character as either short-term or long-term capital losses rather than being considered all short-term as permitted under prior regulation. |
At December 31, 2012 (tax-year-end), the Fund had capital loss carryforwards for U.S. federal income tax purposes as follows:
| Year of Expiration | Amount | |||
| 2017 | $ | 122,483 | ||
| Total | $ | 122,483 | ||
| During the year ended December 31, 2012, the Fund utilized $54,451 of prior year capital loss carryforwards. |
| f) | Accounting for Uncertainty in Income Taxes – The Fund has adopted financial reporting rules that require the Fund to analyze all open tax years, as defined by the statute of limitations, for all major jurisdictions. Generally, tax authorities can examine all tax returns filed for the last three years. The Fund does not have an examination in progress. |
The Fund has reviewed all open tax years and major jurisdictions and concluded that these financial reporting rules had no effect on the Fund’s financial position or results of operations. There is no tax liability resulting from unrecognized tax benefits relating to uncertain income tax positions taken or expected to be taken on the tax return for the fiscal year ended December 31, 2012. The Fund is also not aware of any tax positions for which it is reasonably possible that the total amounts of unrecognized tax benefits will significantly change in the next twelve months.
| 7. | Expenses: |
| a) | Investment Management Agreement – Hartford Funds Management Company, LLC (“HFMC”), an indirect wholly owned subsidiary of The Hartford Financial Services Group, Inc. (“The Hartford”), serves as investment manager to the Fund pursuant to an Investment Management Agreement with the Company. The investment manager has overall investment supervisory responsibility for the Fund. In addition, the investment manager provides administrative personnel, services, equipment, facilities and office space for proper operation of the Fund. The investment manager has contracted with Wellington Management Company, LLP (“Wellington Management”) under a sub-advisory agreement for the provision of day-to-day investment management services to the Fund in accordance with the Fund’s investment objective and policies. The Fund pays a fee to the investment manager, a portion of which may be used to compensate Wellington Management. |
| 20 |
The schedule below reflects the rates of compensation paid to HFMC for investment management services rendered as of June 30, 2013; the rates are accrued daily and paid monthly.
| Average Daily Net Assets | Annual Fee | |||
| On first $250 million | 0.7750% | |||
| On next $250 million | 0.7250% | |||
| On next $500 million | 0.6750% | |||
| On next $4 billion | 0.6250% | |||
| On next $5 billion | 0.6225% | |||
| Over $10 billion | 0.6200% | |||
| b) | Accounting Services Agreement – Pursuant to the Fund Accounting Agreement between HFMC and the Company, on behalf of the Fund, HFMC provides accounting services to the Fund and receives monthly compensation based on the Fund’s average daily net assets at the rates set forth below. The Fund’s accounting services fees are accrued daily and paid monthly. |
| Average Daily Net Assets | Annual Fee | |||
| On first $5 billion | 0.014% | |||
| On next $5 billion | 0.012% | |||
| Over $10 billion | 0.010% | |||
| c) | Operating Expenses – Allocable expenses incurred by the Company are allocated to each Fund and allocated to classes within a Fund in proportion to the average daily net assets of the Fund and each class, except where allocation of certain expenses is more fairly made directly to the Fund or to specific classes within a Fund. |
| d) | Fees Paid Indirectly – The Company, on behalf of the Fund, has entered into agreements with State Street Global Markets, LLC and Russell Implementation Services, Inc. to partially recapture non-discounted trade commissions. Such rebates are used to pay a portion of the Fund’s expenses. In addition, the Fund’s custodian banks have agreed to reduce its fees when the Fund maintains cash on deposit in a non-interest-bearing custody account. For the six-month period ended June 30, 2013, these amounts, if any, are included in the Statement of Operations. |
The ratio of expenses to average net assets in the accompanying financial highlights excludes the reduction in expenses related to fees paid indirectly. The annualized expense ratio for the period listed below reflecting the reduction for fees paid indirectly is as follows:
| Annualized Six- Month Period Ended June 30, 2013 | ||||
| Class IA | 0.82 | % | ||
| Class IB | 1.07 | |||
| e) | Distribution Plan for Class IB shares – The Company, on behalf of the Fund, has adopted a Distribution Plan pursuant to Rule 12b-1 of the 1940 Act to compensate the distributor, Hartford Funds Distributors, LLC (“HFD”), (formerly known as Hartford Investment Financial Services, LLC), an indirect wholly owned subsidiary of The Hartford, from assets attributable to the Class IB shares for services rendered and expenses borne in connection with activities primarily intended to result in the sale of the Class IB shares, subject to the review and approval of the Company’s Board of Directors. |
The Distribution Plan provides that the Fund may pay annually up to 0.25% of the average daily net assets of the Fund attributable to its Class IB shares for activities primarily intended to result in the sale of Class IB shares. The Board has
| 21 |
| Hartford Global Growth HLS Fund |
| Notes to Financial Statements – (continued) |
| June 30, 2013 (Unaudited) |
| (000’s Omitted) |
the authority to suspend or reduce these payments at any point in time. Under the terms of the Distribution Plan and the principal underwriting agreement, the Fund is authorized to make payments monthly to the distributor that may be used to pay or compensate entities providing distribution and shareholder servicing with respect to the Class IB shares for such entities’ fees or expenses incurred or paid in that regard. These fees are accrued daily and paid monthly.
| f) | Other Related Party Transactions – Certain officers of the Fund are directors and/or officers of the investment manager and/or The Hartford or its subsidiaries. For the six-month period ended June 30, 2013, a portion of the Fund’s Chief Compliance Officer’s salary was paid by all the investment companies in the Hartford fund complex. The portion allocated to the Fund rounds to zero. Hartford Administrative Services Company ("HASCO"), an indirect wholly owned subsidiary of The Hartford, provides transfer agent services to the Fund. HASCO was compensated on a per account basis for providing such services. The amound paid to HASCO can be found in the Statement of Operations. These fees are accrued daily and paid monthly. |
| g) | Payment from Affiliate – In July of 2007, The Hartford entered into a settlement with the Attorneys General of the states of New York, Connecticut and Illinois relating to market timing and the company's individual variable annuity contracts in which certain payments would be made directly to the variable annuity contract holders. The distribution plan provided that unclaimed money from the settlement would be distributed to certain HLS Funds that are investment options through a Hartford individual variable annuity contract. The unclaimed money was distributed to the Fund on September 18, 2009. |
The total return in the accompanying financial highlights includes a payment from an affiliate. Had the payment from the affiliate been excluded, the impact and total return for the period listed below would have been as follows:
| For the Year Ended December 31, 2009 | ||||||||
| Class IA | Class IB | |||||||
| Impact from Payment from Affiliate for Attorneys General Settlement | 0.04 | % | 0.04 | % | ||||
| Total Return Excluding Payment from Affiliate | 35.59 | % | 35.26 | % | ||||
| 8. | Investment Transactions: |
For the six-month period ended June 30, 2013, the Fund's aggregate purchases and sales of investment securities (excluding short-term investments) were as follows:
| Amount | ||||
| Cost of Purchases Excluding U.S. Government Obligations | $ | 167,718 | ||
| Sales Proceeds Excluding U.S. Government Obligations | 211,907 | |||
| 9. | Line of Credit: |
The Fund is one of several Hartford funds that participate in a $500 million committed revolving line of credit facility. The facility is to be used for temporary or emergency purposes. Under the arrangement, the funds are required to own securities having a market value in excess of 300% of the total bank borrowings. The interest rate on borrowings varies depending on the nature of the loan. The facility also requires a fee to be paid based on the amount of the commitment. This commitment fee is allocated to all of the funds participating in the line of credit based on the average net assets of the funds. During the six-month period ended June 30, 2013, the Fund did not have any borrowings under this facility.
| 22 |
| 10. | Industry Classifications: |
Other than the industry classifications “Other Investment Pools and Funds” and “Exchange Traded Funds,” equity industry classifications used in this report are the Global Industry Classification Standard, which was developed by and is the exclusive property and service mark of MSCI, Inc. and Standard & Poor’s.
| 11. | Indemnifications: |
Under the Company’s organizational documents, the Company shall indemnify its officers and directors to the full extent required or permitted under Maryland General Corporation Law and the federal securities laws. In addition, the Company, on behalf of the Fund, may enter into contracts that contain a variety of indemnifications. The Company’s maximum exposure under these arrangements is unknown. However, as of the date of these financial statements, the Company has not had prior claims or losses pursuant to these contracts and expects the risk of loss to be remote.
| 12. | Pending Legal Proceedings: |
On February 25, 2011, Jennifer L. Kasilag, Louis Mellinger, Judith M. Menendez, Jacqueline M. Robinson, and Linda A. Russell filed a derivative lawsuit against Hartford Investment Financial Services, LLC (“HIFSCO”)(now known as Hartford Funds Distributors, LLC) on behalf of six Hartford retail mutual funds in the United States District Court for the District of New Jersey, alleging that HIFSCO received excessive advisory and distribution fees in violation of its statutory fiduciary duty under Section 36(b) of the 1940 Act when serving as investment manager and principal underwriter, respectively, to the Hartford retail mutual funds. HIFSCO moved to dismiss and, in September 2011, the motion was granted in part and denied in part, with leave to amend the complaint. In November 2011, plaintiffs filed an amended complaint on behalf of certain Hartford retail mutual funds, The Hartford Global Health Fund (now known as The Hartford Healthcare Fund), The Hartford Conservative Allocation Fund, The Hartford Growth Opportunities Fund, The Hartford Inflation Plus Fund, The Hartford Advisers Fund (now known as The Hartford Balanced Fund), and The Hartford Capital Appreciation Fund. Plaintiffs seek to rescind the investment management agreements and distribution plans between HIFSCO and these funds and to recover the total fees charged thereunder or, in the alternative, to recover any improper compensation HIFSCO received, in addition to lost earnings. HIFSCO filed a partial motion to dismiss the amended complaint and, in December 2012, the court dismissed without prejudice the claims regarding distribution fees and denied the motion with respect to the advisory fees claims. HIFSCO disputes the allegations and intends to defend vigorously.
This action concerns the activities of HIFSCO in its capacity as investment manager and principal underwriter to the Hartford retail mutual funds and does not concern HIFSCO’s activities in its capacity as principal underwriter to the HLS funds. For this reason, no accrual for litigation relating to this matter has been recorded in the financial statements of the Fund.
| 23 |
| Hartford Global Growth HLS Fund |
| Financial Highlights |
| - Selected Per-Share Data (A) - |
| Class | Net Asset Value at Beginning of Period | Net Investment Income (Loss) | Net Realized and Unrealized Gain (Loss) on Investments | Total from Investment Operations | Dividends from Net Investment Income | Distributions from Realized Capital Gains | Distributions from Capital | Total Distributions | Net Asset Value at End of Period | |||||||||||||||||||||||||||
| For the Six-Month Period Ended June 30, 2013 (Unaudited) | ||||||||||||||||||||||||||||||||||||
| IA | $ | 16.50 | $ | 0.09 | $ | 1.81 | $ | 1.90 | $ | – | $ | – | $ | – | $ | – | $ | 18.40 | ||||||||||||||||||
| IB | 16.38 | 0.07 | 1.79 | 1.86 | – | – | – | – | 18.24 | |||||||||||||||||||||||||||
| For the Year Ended December 31, 2012 | ||||||||||||||||||||||||||||||||||||
| IA | 13.45 | 0.14 | 3.00 | 3.14 | (0.09 | ) | – | – | (0.09 | ) | 16.50 | |||||||||||||||||||||||||
| IB | 13.34 | 0.09 | 2.99 | 3.08 | (0.04 | ) | – | – | (0.04 | ) | 16.38 | |||||||||||||||||||||||||
| For the Year Ended December 31, 2011 | ||||||||||||||||||||||||||||||||||||
| IA | 15.62 | 0.08 | (2.24 | ) | (2.16 | ) | (0.01 | ) | – | – | (0.01 | ) | 13.45 | |||||||||||||||||||||||
| IB | 15.53 | 0.04 | (2.23 | ) | (2.19 | ) | – | – | – | – | 13.34 | |||||||||||||||||||||||||
| For the Year Ended December 31, 2010 | ||||||||||||||||||||||||||||||||||||
| IA | 13.71 | 0.04 | 1.91 | 1.95 | (0.04 | ) | – | – | (0.04 | ) | 15.62 | |||||||||||||||||||||||||
| IB | 13.64 | – | 1.90 | 1.90 | (0.01 | ) | – | – | (0.01 | ) | 15.53 | |||||||||||||||||||||||||
| For the Year Ended December 31, 2009 | ||||||||||||||||||||||||||||||||||||
| IA | 10.17 | 0.08 | 3.55 | 3.63 | (0.09 | ) | – | – | (0.09 | ) | 13.71 | |||||||||||||||||||||||||
| IB | 10.12 | 0.05 | 3.53 | 3.58 | (0.06 | ) | – | – | (0.06 | ) | 13.64 | |||||||||||||||||||||||||
| For the Year Ended December 31, 2008 | ||||||||||||||||||||||||||||||||||||
| IA | 22.42 | 0.12 | (11.56 | ) | (11.44 | ) | (0.12 | ) | (0.69 | ) | – | (0.81 | ) | 10.17 | ||||||||||||||||||||||
| IB | 22.27 | 0.08 | (11.47 | ) | (11.39 | ) | (0.07 | ) | (0.69 | ) | – | (0.76 | ) | 10.12 | ||||||||||||||||||||||
| (A) | Information presented relates to a share outstanding throughout the indicated period. |
| (B) | The figures do not include sales charges or other fees which may be applied at the variable life insurance, variable annuity or qualified retirement plan product level. Any such additional sales charges or other fees would lower the Fund's performance. |
| (C) | Ratios do not reflect reductions for fees paid indirectly. Please see Fees Paid Indirectly in the Notes to Financial Statements. |
| (D) | Portfolio turnover rate is calculated on the basis of the Fund as a whole without distinguishing between the classes of shares issued. |
| (E) | Not annualized. |
| (F) | Annualized. |
| (G) | Total return without the inclusion of the Payment from (to) Affiliate can be found in Expenses in the accompanying Notes to Financial Statements. |
| 24 |
| - Ratios and Supplemental Data - |
| Total Return(B) | Net Assets at End of Period | Ratio of Expenses to Average Net Assets Before Waivers(C) | Ratio of Expenses to Average Net Assets After Waivers(C) | Ratio of Net Investment Income (Loss) to Average Net Assets | Portfolio Turnover Rate(D) | |||||||||||||||||
| 11.46 | %(E) | $ | 322,391 | 0.82 | %(F) | 0.82 | %(F) | 0.85 | %(F) | 42 | % | |||||||||||
| 11.32 | (E) | 75,782 | 1.07 | (F) | 1.07 | (F) | 0.59 | (F) | – | |||||||||||||
| 23.41 | 321,371 | 0.82 | 0.82 | 0.73 | 108 | |||||||||||||||||
| 23.10 | 77,224 | 1.07 | 1.07 | 0.47 | – | |||||||||||||||||
| (13.89 | ) | 352,947 | 0.80 | 0.80 | 0.46 | 57 | ||||||||||||||||
| (14.10 | ) | 82,204 | 1.05 | 1.05 | 0.22 | – | ||||||||||||||||
| 14.25 | 484,754 | 0.81 | 0.81 | 0.28 | 62 | |||||||||||||||||
| 13.96 | 118,824 | 1.06 | 1.06 | 0.03 | – | |||||||||||||||||
| 35.64 | (G) | 488,720 | 0.81 | 0.81 | 0.67 | 70 | ||||||||||||||||
| 35.31 | (G) | 126,320 | 1.06 | 1.06 | 0.42 | – | ||||||||||||||||
| (52.46 | ) | 419,183 | 0.75 | 0.75 | 0.67 | 76 | ||||||||||||||||
| (52.58 | ) | 112,226 | 1.00 | 1.00 | 0.42 | – | ||||||||||||||||
| 25 |
| Hartford Global Growth HLS Fund |
| Directors and Officers (Unaudited) |
The Board of Directors of the Company appoints officers who are responsible for the day-to-day operations of the Fund and who execute policies formulated by the Directors. Each director serves until his or her death, resignation, or retirement or until the next annual meeting of shareholders is held or until his or her successor is elected and qualifies.
Directors and officers who are employed by or who have a financial interest in The Hartford are considered “interested” persons of the Fund pursuant to the 1940 Act. Each officer and two of the Company’s directors, as noted in the chart below, are “interested” persons of the Fund. Each director serves as a director for The Hartford Mutual Funds, Inc., The Hartford Mutual Funds II, Inc., Hartford Series Fund, Inc., Hartford HLS Series Fund II, Inc., and as a trustee for The Hartford Alternative Strategies Fund, which, as of June 30, 2013, collectively consist of 90 funds. Correspondence may be sent to directors and officers c/o Hartford Mutual Funds, P.O. Box 2999, Hartford, Connecticut 06104-2999, except that correspondence to Mr. Annoni, Mr. Dressen, Ms. Fagely and Ms. Quade may be sent to 500 Bielenberg Drive, Woodbury, Minnesota 55125 and correspondence to Mr. Davey and Mr. Melcher may be sent to 5 Radnor Corporate Center, Suite 300, 100 Matsonford Road, Radnor, Pennsylvania 19087.
The table below sets forth, for each director and officer, his or her name, year of birth, current position with the Company and date first elected or appointed to Hartford Series Fund, Inc. (“HSF”), and Hartford HLS Series Fund II, Inc. (“HSF2”), principal occupation, and, for directors, other directorships held. The Fund’s statement of additional information contains further information on the directors and is available free of charge by calling 1-800-862-6668 or writing to Hartford HLS Funds, c/o Hartford Life Insurance Company, Hartford Life and Annuity Insurance Company, P.O. Box 14293, Lexington, KY 40512-4293.
Information on the aggregate remuneration paid to the directors of the Company can be found in the Statement of Operations herein. The Fund pays to The Hartford a portion of the Chief Compliance Officer’s compensation, but does not pay salaries or compensation to any of their other officers or directors who are employed by The Hartford.
Non-Interested Directors
Lynn S. Birdsong (1946) Director since 2003, Co-Chairman of the Investment Committee
Mr. Birdsong is a private investor. Mr. Birdsong currently serves as a Director of the Sovereign High Yield Investment Company (April 2010 to current). Mr. Birdsong currently serves as an Independent Director of Nomura Partners Funds, Inc. (formerly, The Japan Fund) (March 2003 to current). From 1979 to 2002, Mr. Birdsong was a managing director of Zurich Scudder Investments, an investment management firm. During his employment with Scudder, Mr. Birdsong was an Interested Director of The Japan Fund. Since 1981, Mr. Birdsong has been a partner in Birdsong Company, an advertising specialty firm.
Robert M. Gavin, Jr. (1940) Director since 2002 (HSF) and 1986 (HSF2), Chairman of the Board since 2004
Dr. Gavin is an educational consultant. Prior to September 1, 2001, he was President of Cranbrook Education Community and prior to July 1996, he was President of Macalester College, St. Paul, Minnesota.
Duane E. Hill (1945) Director since 2001 (HSF) and 2002 (HSF2), Chairman of the Nominating Committee
Mr. Hill is Partner of TSG Ventures L.P., a private equity investment company. Mr. Hill is a former partner of TSG Capital Group, a private equity investment firm that served as sponsor and lead investor in leveraged buyouts of middle market companies.
Sandra S. Jaffee (1941) Director since 2005
Ms. Jaffee is the founder and Chief Executive Officer of a private company, Homeworks Concierge, LLC, which provides residential property management services in Westchester County, New York (January 2012 to present). Ms. Jaffee served as Chairman (2008 to 2009) and Chief Executive Officer of Fortent (formerly Searchspace Group), a leading provider of compliance/regulatory technology to financial institutions from August 2005 to August 2009. Ms. Jaffee currently serves as a member of the Board of Directors of Broadridge Financial Solutions as well as a Trustee of Muhlenberg College.
William P. Johnston (1944) Director since 2005, Chairman of the Compliance Committee
In February 2008, Mr. Johnston was elected to the Board of Directors of HCR-ManorCare, Inc. In August 2007, Mr. Johnston was elected to the Board of Directors of LifeCare Holdings, Inc. In July 2006, Mr. Johnston was elected to the Board of Directors of MultiPlan, Inc. and served as a director (July 2006 to August 2010). In June 2006, Mr. Johnston was appointed as Senior Advisor to The Carlyle Group, a global private equity and alternative asset investment firm. In May 2006, Mr. Johnston was elected to the Supervisory Board of Fresenius Medical Care AG & Co. KGaA, after its acquisition of Renal Care Group, Inc. in March 2006.
| 26 |
Phillip O. Peterson (1944) Director since 2002 (HSF) and 2000 (HSF2), Chairman of the Audit Committee
Mr. Peterson is a mutual fund industry consultant. He was a partner of KPMG LLP (an accounting firm) until July 1999. Mr. Peterson joined William Blair Funds in February 2007 as a member of the Board of Trustees. Mr. Peterson also joined the Board of Trustees of Symetra Variable Mutual Funds Trust as a trustee in February 2012.
Lemma W. Senbet (1946) Director since 2005
Dr. Senbet is the William E. Mayer Chair Professor of Finance and Director, Center for Financial Policy, at the University of Maryland, Robert H. Smith School of Business. He was chair of the Finance Department from 1998 to 2006. Previously he was a chaired professor of finance at the University of Wisconsin-Madison. Also, he was director of the Fortis Funds from March 2000 to July 2002. Dr. Senbet served the finance profession in various capacities, including as director of the American Finance Association and President of the Western Finance Association. In 2006, Dr. Senbet was inducted Fellow of Financial Management Association International for his career-long distinguished scholarship and professional service.
Interested Directors and Officers
James E. Davey (1964) Director since 2012, President and Chief Executive Officer since 2010
Mr. Davey serves as Executive Vice President of Hartford Life Insurance Company (“HLIC”) and The Hartford Financial Services Group, Inc. Additionally, Mr. Davey serves as Chairman of the Board and Manager of Hartford Funds Distributors, LLC (“HFD”) and Hartford Administrative Services Company (“HASCO”). Mr. Davey also serves as Manager, President and Chairman of the Board for Hartford Funds Management Company, LLC (“HFMC”). Mr. Davey joined The Hartford in 2002.
Lowndes A. Smith (1939) Director since 1996 (HSF) and 2002 (HSF2), Co-Chairman of the Investment Committee
Mr. Smith served as Vice Chairman of The Hartford from February 1997 to January 2002, as President and Chief Executive Officer of Hartford Life, Inc. from February 1997 to January 2002, and as President and Chief Operating Officer of The Hartford Life Insurance Companies from January 1989 to January 2002. Mr. Smith serves as a Director of White Mountains Insurance Group, Ltd., One Beacon Insurance and Symetra Financial and as Managing Director of Whittington Gray Associates.
Other Officers
Mark A. Annoni (1964) Vice President, Controller and Treasurer since 2012
Mr. Annoni serves as the Assistant Vice President of HLIC (February 2004 to present). Mr. Annoni joined The Hartford in April 2001 as part of The Hartford’s acquisition of Fortis Financial Group (“Fortis”). Prior to joining The Hartford, Mr. Annoni served as Manager of Mutual Fund Accounting at Fortis (July 1997 to April 2001).
Michael R. Dressen (1963) AML Compliance Officer since 2011
Mr. Dressen currently serves as Assistant Vice President of HLIC. He also serves as Chief Compliance Officer and AML Compliance Officer of HASCO and as AML Officer of HFD. Mr. Dressen joined The Hartford in 2005 from State Farm Insurance Companies where he held various positions related to mutual funds, variable products, and property casualty insurance.
Tamara L. Fagely (1958) Vice President since 2002 (HSF) and 1993 (HSF2)
Currently, Ms. Fagely is President and a Director of HASCO, Chief Administrative Officer and Manager of HFMC and a Vice President of HLIC. Ms. Fagely served as a Vice President of HASCO (1998-2013) and Chief Financial Officer of HASCO (2006-2013). She served as Assistant Vice President of HLIC from December 2001 through March 2005. In addition, Ms. Fagely is Manager and Chief Operating Officer of HFD.
Edward P. Macdonald (1967) Vice President, Secretary and Chief Legal Officer since 2005
Mr. Macdonald serves as Vice President of HLIC and Vice President, Chief Legal Officer and Secretary of HFD and HASCO. Mr. Macdonald also serves as Manager, Vice President, Chief Legal Officer and Secretary of HFMC. Mr. Macdonald joined The Hartford in 2005.
| 27 |
| Hartford Global Growth HLS Fund |
| Directors and Officers (Unaudited) – (continued) |
Joseph G. Melcher (1973) Vice President and Chief Compliance Officer since 2013(1)
Mr. Melcher currently serves as Vice President of HFMC and HFD. Mr. Melcher joined The Hartford in 2012 from Touchstone Investments, a member of the Western & Southern Financial Group, where he held the position of Vice President and Chief Compliance Officer from 2010 through 2012 and Assistant Vice President, Compliance from 2005 to 2010.
(1) Mr. Melcher was named Vice President and Chief Compliance Officer of HSF and HSF2 on February 6, 2013. Prior to February 6, 2013, Colleen Pernerewski served as Chief Compliance Officer of HSF and HSF2.
Vernon J. Meyer (1964) Vice President since 2006
Mr. Meyer serves as Senior Vice President of HLIC. He also serves as Senior Vice President of HFMC and HFD. Mr. Meyer joined The Hartford in 2004.
Laura S. Quade (1969) Vice President since 2012
Ms. Quade currently serves as Vice President of HASCO and is a Director of Mutual Fund Service Operations. She also serves as Director, Enterprise Operations of HFD and HLIC. Ms. Quade joined The Hartford in 2001 as part of The Hartford’s acquisition of Fortis.
Elizabeth L. Schroeder (1966) Vice President since 2010(2)
Ms. Schroeder currently serves as Assistant Vice President of HLIC. Ms. Schroeder joined HLIC in 1991. She is also an Assistant Vice President of HFMC and HASCO.
(2) Ms. Schroeder served as Vice President of HSF and HSF2 until August 7, 2013.
Martin Swanson (1962) Vice President since 2010
Mr. Swanson is a Vice President of HLIC. Mr. Swanson also serves as Chief Marketing Officer for HFD. Prior to joining HLIC in 1998, Mr. Swanson was a Vice President at PaineWebber, Inc.
HOW TO OBTAIN A COPY OF THE FUND’S PROXY VOTING POLICIES AND VOTING RECORDS (UNAUDITED)
A description of the policies and procedures that the Fund uses to determine how to vote proxies relating to portfolio securities and information about how the Fund voted proxies relating to portfolio securities during the most recent twelve-month period ended June 30 are available (1) without charge, upon request, by calling 800-862-6668 and (2) on the SEC’s website at http://www.sec.gov.
QUARTERLY PORTFOLIO HOLDINGS INFORMATION (UNAUDITED)
The Fund files a complete schedule of portfolio holdings with the SEC for the first and third quarters of each fiscal year on Form N-Q. The Fund’s Forms are available (1) without charge, upon request, by calling 800-862-6668 and (2) on the SEC’s website at http://www.sec.gov. The Form N-Q may be reviewed and copied at the SEC’s Public Reference Room in Washington, DC. Information on the operation of the Public Reference Room may be obtained by calling 1-800-SEC-0330.
| 28 |
| Hartford Global Growth HLS Fund |
| Expense Example (Unaudited) |
Your Fund's Expenses
As a shareholder of the Fund, you incur two types of costs: (1) transaction costs and (2) ongoing costs including investment management fees, distribution fees, if any, and other fund expenses. This example is intended to help you understand your ongoing costs (in dollars) of investing in the Fund and to compare these costs with the ongoing costs of investing in other mutual funds. The example is based on an investment of $1,000 invested at the beginning of the period and held for the period of December 31, 2012 through June 30, 2013.
Actual Expenses
The first set of columns of the table below provides information about actual account values and actual expenses. You may use the information in this column, together with the amount you invested, to estimate the expenses that you paid over the period. Simply divide your account value by $1,000 (for example, an $8,600 account value divided by $1,000 = 8.6), then multiply the result by the number in the line under the heading entitled “Expenses Paid During Period” to estimate the expenses you paid on your account during this period.
Hypothetical Example for Comparison Purposes
The second set of columns of the table below provides information about hypothetical account values and hypothetical expenses based on the Fund’s actual expense ratio and an assumed rate of return of 5% per year before expenses, which is not the Fund’s actual return. The hypothetical account values and expenses may not be used to estimate the actual ending account balance or expenses you paid for the period. You may use this information to compare the ongoing costs of investing in the Fund and other funds. To do so, compare this 5% hypothetical example with the 5% hypothetical examples that appear in the shareholder reports of the other funds.
Please note that the expenses shown in the table are meant to highlight your ongoing costs only and do not reflect any transactional costs, such as sales charges (loads) and CDSC. Therefore, the second set of columns of the table is useful in comparing ongoing costs only, and will not help you determine the relative total costs of owning different funds. In addition, if these transactional costs were included, your costs would be higher. Expenses are equal to the Fund's annualized expense ratios multiplied by average account value over the period, multiplied by 181/365 (to reflect the one-half year period).
| Actual return | Hypothetical (5% return before expenses) | |||||||||||||||||||||||||||||||
| Beginning Account Value December 31, 2012 | Ending Account Value June 30, 2013 | Expenses paid during the period December 31, 2012 through June 30, 2013 | Beginning Account Value December 31, 2012 | Ending Account Value June 30, 2013 | Expenses paid during the period December 31, 2012 through June 30, 2013 | Annualized expense ratio | Days in the current 1/2 year | Days in the full year | ||||||||||||||||||||||||
| Class IA | $ | 1,000.00 | $ | 1,114.60 | $ | 4.30 | $ | 1,000.00 | $ | 1,020.73 | $ | 4.11 | 0.82 | % | 181 | 365 | ||||||||||||||||
| Class IB | $ | 1,000.00 | $ | 1,113.20 | $ | 5.61 | $ | 1,000.00 | $ | 1,019.49 | $ | 5.36 | 1.07 | % | 181 | 365 | ||||||||||||||||
| 29 |
| Hartford Global Growth HLS Fund |
| Principal Risks (Unaudited) |
The principal risks of investing in the Fund are described below.
Market, Selection, and Strategy Risk: The Fund’s share price may fluctuate due to market risk and/or security selections that may underperform the market or relevant benchmarks. If the sub-adviser’s investment strategy does not perform as expected, the Fund could underperform its peers or lose money. There is no guarantee the Fund will achieve its stated objective.
Foreign Investment and Emerging Markets Risk: Foreign investments can be riskier than U.S. investments. Potential risks include currency risk that may result from unfavorable exchange rates, liquidity risk if decreased demand for a security makes it difficult to sell at the desired price, and risks that stem from substantially lower trading volume on foreign markets. These risks are generally greater for investments in emerging markets, which are also subject to greater price volatility, and custodial and regulatory risks.
Growth Investing Risk: Growth investments can be volatile, and may fail to increase earnings or grow as quickly as anticipated. Growth-style investing falls in and out of favor, which may result in periods of underperformance.
Mid-cap Stock Risk: Mid-cap stocks are generally more volatile and risky and may be less liquid than large-cap stocks because they may have limited operating histories, narrow product lines, and focus on niche markets.
Active Trading Risk: Actively trading investments may result in higher costs (thus affecting performance).
| 30 |
HARTFORD HLS FUNDS
c/o The Hartford Wealth Management - Global Annuities
P.O. Box 14293
Lexington, KY 40512-4293
HARTFORDFUNDS
hartfordfunds.com
Hartford Series Fund, Inc. is underwritten and distributed by Hartford Funds Distributors, LLC.
Hartford Series Fund, Inc. inception dates range from 1977 to date. Hartford Series Fund, Inc. is not a subsidiary of The Hartford Financial Services Group, Inc. ("The Hartford") but is underwritten, distributed by and advised by subsidiaries of The Hartford. Investments in Hartford Series Fund, Inc. are not guaranteed by The Hartford or any other entity.
You should carefully consider investment objectives, risks, and charges and expenses of Hartford HLS Funds before investing. This and other information can be found in the Fund’s prospectus or summary prospectus, which can be obtained by calling 800-862-6668. Please read them carefully before you invest or send money.
HLSSAR-GG13 8-13 113539-1 Printed in U.S.A ©2013 The Hartford, Hartford, CT 06115
HARTFORDFUNDS
| HARTFORD GLOBAL RESEARCH
HLS FUND
2013 Semi Annual Report
|
A MESSAGE FROM THE PRESIDENT
Dear Fellow Shareholders:
I want to take this opportunity to say thank you for investing in the Hartford HLS Funds.
Market Review
During the first half of the year, stocks rose steadily. U.S. equities (as represented by the S&P 500 Index1) posted a strong gain of 10.61% during the first quarter, on their way to an all-time high. During the second quarter, investors persevered through volatility surrounding rumors of the rollback of the U.S. Federal Reserve’s quantitative easing (QE) program later this year, and the S&P 500 Index rose 2.91%. That brought the market’s rise to 13.82% for the first half of 2013. The rumors about QE’s end sent bond yields and mortgage rates upward, but that wasn’t enough to dissuade investors from pushing equities into positive territory.
Because of QE, some have expressed concerns regarding the recent market rally. But a more careful examination of economic data reveals a strong foundation. Consumer balance sheets have improved since the financial crisis, with consumer debt as a percentage of income falling steadily. Housing continued its dogged recovery, fueled by population growth and pent-up demand. In fact, it’s substantive economic improvements that have moved Federal Reserve Chairman Ben Bernanke to consider removing the “training wheels” of QE, which we think should be viewed as a vote of confidence in the U.S. economy going forward.
As the U.S. outlook continues to improve, concerns do remain in the global economy. Emerging markets have lagged due to social unrest and rising inflation. Slowing growth in China is clouding global growth forecasts, but it’s important to remember that China still boasts 7.5% annual GDP growth.
It’s important to stay abreast of domestic and international economic developments while balancing your individual investment goals. Meeting with your financial advisor on a regular basis to examine your current investment strategy can help you determine whether you are on the right track:
| • | Is your portfolio fully diversified with an appropriate mix of stocks and bonds? |
| • | Is your fixed-income portfolio positioned to take advantage of opportunities across the credit spectrum and fulfill your income needs? |
| • | Is your portfolio still in line with your risk tolerance and investment time horizon? |
Your financial professional can help you choose options within our fund family to navigate today’s markets with confidence.
Thank you again for investing with the Hartford HLS Funds.
James Davey
President
Hartford HLS Funds
1 The S&P 500 Index is a market capitalization-weighted price index composed of 500 widely held common stocks.
Hartford Global Research HLS Fund
Table of Contents
This report is prepared for the general information of contract owners and qualified retirement plan participants. It is not an offer of contracts or of qualified retirement plans. It should not be used in connection with any offer, except in conjunction with the appropriate product prospectus which contains all pertinent information including the applicable sales, administrative and other charges.
The views expressed in the Fund’s Manager Discussion under ‘‘Why did the Fund perform this way?’’ and ‘‘What is the outlook?’’ are views of the Fund’s sub-adviser and portfolio management team through the end of the period and are subject to change based on market and other conditions. The Fund’s Manager Discussion is for informational purposes only and does not represent an offer, recommendation or solicitation to buy, hold or sell any security. The specific securities identified and described, if any, do not represent all of the securities purchased or sold and you should not assume that investments in the securities identified and discussed will be profitable.
Hartford Global Research HLS Fund inception 01/31/2008
(sub-advised by Wellington Management Company, LLP)
| Investment objective – Seeks long-term capital appreciation. |
Performance Overview 1/31/08 - 6/30/13

The chart above represents the hypothetical growth of a $10,000 investment in Class IA. Growth results in classes other than Class IA will vary from what is seen above due to differences in the expenses charged to those share classes.
Average Annual Total Returns (as of 6/30/13)
| 6 Month† | 1 Year | 5 Years | Since Inception▲ | |||||||||||||
| Global Research IA | 8.50% | 19.35% | 4.05% | 3.32% | ||||||||||||
| Global Research IB | 8.34% | 19.03% | 3.79% | 3.06% | ||||||||||||
| MSCI All Country World Index | 6.38% | 17.21% | 2.86% | 2.17% | ||||||||||||
| † | Not Annualized |
| ▲ | Inception: 01/31/2008 |
PERFORMANCE DATA QUOTED REPRESENTS PAST PERFORMANCE AND DOES NOT GUARANTEE FUTURE RESULTS. The investment return and principal value of the investment will fluctuate so that investors’ shares, when redeemed, may be worth more or less than their original cost. Current performance may be lower or higher than the performance data quoted. To obtain performance data current to the most recent month-end, please visit our website www.hartfordfunds.com.
Total returns presented above were calculated using the Fund's net asset value available to shareholders for sale or redemption of Fund shares on June 30, 2013, which may exclude investment transactions as of this date. All share class returns assume the reinvestment of all distributions at net asset value and the deduction of all fund expenses.
MSCI All Country World Index is a free float-adjusted market capitalization index that measures equity market performance in the global developed and emerging markets, consisting of 45 developed and emerging market country indices. This index is unmanaged, and its results include reinvested dividends and/or distributions, but do not reflect the effect of sales charges, commissions, expenses or taxes.
You cannot invest directly in an index.
As of the Fund’s current prospectus dated May 1, 2013, the total annual operating expense ratios for Class IA and Class IB shares were 1.04% and 1.29%, respectively. Actual expenses may be higher. Please see the accompanying Financial Highlights for expense ratios for the six-month period ended June 30, 2013.
The chart and table do not reflect the deductions of taxes, sales charges or other fees which may be applied at the variable life insurance, variable annuity or qualified retirement plan product level. Any such additional sales charges or other fees or expenses would lower the contract’s or plan’s performance.
All investments are subject to risk including the possible loss of principal. For a discussion of the Fund’s risks, please see the Principal Risks section. For more detailed information on the risks associated with an investment in the Fund, please see the prospectus.
| 2 |
Hartford Global Research HLS Fund
Manager Discussion
| June 30, 2013 (Unaudited) |
| Portfolio Managers | ||
| Cheryl M. Duckworth, CFA | Mark D. Mandel, CFA* | |
| Senior Vice President and Associate Director of Global Industry Research | Director and Director of Global Industry Research |
* Mr. Mandel supervises a team of global industry analysts that manage the Fund. Mr. Mandel is not involved in day-to-day management of the Fund.
How did the Fund perform?
The Class IA shares of the Hartford Global Research HLS Fund returned 8.50% for the six-month period ended June 30, 2013, outperforming its benchmark, the MSCI All Country World Index, which returned 6.38% for the same period. The Fund also outperformed the 7.31% average return of the Variable Products-Underlying Funds Lipper Global Growth Funds peer group, a group of funds with investment strategies similar to those of the Fund.
Why did the Fund perform this way?
Global equities (+6.4%), as measured by the MSCI All Country World Index, gained during the six-month period. Favorable global liquidity dynamics and accommodative monetary policy from central banks around the globe provided a tailwind for stocks, helping investors to look past slowing growth and an increase in lending rates in China. Following a dramatic shift in monetary policy by the Bank of Japan to more aggressive management of a 2% inflation target, Japanese equities soared. U.S. equities also outperformed global indexes, as the U.S. economy appeared relatively stable compared to other countries. Although investors initially reacted negatively to news in May that the Federal Reserve (Fed) might slow its bond-buying program sooner than expected, U.S. equities recovered some of those losses toward the end of the quarter. Signs of strength in Germany and France partially offset concerns elsewhere in the eurozone. Ongoing European sovereign-debt issues weighed on investors in Greece and Spain. Political unrest in Turkey, Egypt, and Brazil contributed to declines in emerging markets.
Nine of the ten sectors in the MSCI All Country World Index rose during the period. Health Care (+18%), Consumer Discretionary (+15%), and Consumer Staples (+10%) rose the most while Materials (-14%) and Energy (+0.2%) lagged on a relative basis.
The Fund’s outperformance versus the benchmark was driven by positive security selection in nine of the ten sectors. Stock selection was strongest in Industrials, Materials, and Information Technology while selection in Telecommunication Services detracted from relative performance.
Top contributors to benchmark-relative performance during the period included Delta Airlines (Industrials), an underweight to Apple (Information Technology), and not owning BHP Billiton (Materials). Shares of Delta Air Lines, a U.S.-based air line carrier, rose during the first half of the period, benefitting from continued capacity discipline and industry consolidation; shares continued to rise in the latter half of the period after the company announced a strategy to return $1 billion capital to shareholders. Shares of consumer electronics manufacturer Apple fell during the period as investors feared that the stock may face near term pressure due to increasing competition, slowing growth rates, and compressing margins. Our underweight in the declining stock contributed to benchmark-relative performance. Not owning benchmark-component BHP Billiton, a U.K.-domiciled diversified metals and mining company with global operations, contributed positively to relative performance. BHP’s first half 2013 profits declined meaningfully from its first half 2012 results, raising investors’ concerns and sending the stock lower. The profit decline was due to costs remaining high and petroleum and copper operations missing targets. Top contributors to absolute performance (i.e. total return) also included Citigroup (Financials) and Bristol-Myers Squibb (Health Care).
The largest detractors from benchmark-relative returns were VeriFone Systems (Information Technology), Banco Santander Brasil (Financials), and Whitehaven Coal (Energy). VeriFone Systems, an electronic payment solution provider, underperformed during the period after the company lowered its earnings guidance citing weak macroeconomic conditions in Europe, lower revenue from Brazil-based business, and delays in customer projects. Shares of Banco Santander, a Brazil-based bank, fell during the period after the company underperformed and was forced to lay off employees. Shares of Whitehaven Coal, a company engaged in the development and operation of coal mines, declined during the period as a result of the weak metallurgical coal market and increasing coal supply. Top absolute detractors during the period included Rio Tinto (Materials) and Apple (Information Technology).
| 3 |
Hartford Global Research HLS Fund
Manager Discussion – (continued)
| June 30, 2013 (Unaudited) |
What is the outlook?
In Information Technology, we believe that the market has a negative view of stocks exposed to the PC (personal computer) business due to poor demand trends and execution challenges from the launch of Windows 8. In contrast to this view, we believe that improving world economic growth and the replacement cycle in the developed market will improve demand for PCs and related businesses in the value chain.
Within Industrials, we believe that commercial after-market aerospace suppliers are well-positioned to generate attractive growth. We also have a favorable view of select defense stocks with attractive capital allocation. Among transportation stocks, we believe our holdings in select U.S.-based companies should benefit from the steady economic recovery in the U.S.
Within Consumer Staples, we believe that many global and local tobacco companies continue to operate with competitive business models and generate strong results.
The Fund ended the period most overweight (i.e. the Fund’s sector position was greater than the benchmark position) the Consumer Discretionary, Consumer Staples, and Information Technology sectors and most underweight the Financials, Energy, and Telecommunication Services sectors relative to the MSCI All Country World Index. The Fund’s largest absolute weightings were in the Consumer Discretionary, Consumer Staples, and Information Technology sectors.
Diversification by Country
as of June 30, 2013
| Percentage of | ||||
| Country | Net Assets | |||
| Australia | 1.4 | % | ||
| Belgium | 1.4 | |||
| Brazil | 1.8 | |||
| Canada | 2.9 | |||
| China | 1.0 | |||
| Cyprus | 0.0 | |||
| Denmark | 0.4 | |||
| Finland | 0.1 | |||
| France | 2.5 | |||
| Germany | 1.8 | |||
| Greece | 0.0 | |||
| Hong Kong | 0.9 | |||
| India | 1.0 | |||
| Indonesia | 0.1 | |||
| Ireland | 0.8 | |||
| Israel | 0.6 | |||
| Italy | 0.4 | |||
| Japan | 4.2 | |||
| Luxembourg | 0.4 | |||
| Malaysia | 0.6 | |||
| Marshall Islands | 0.1 | |||
| Mexico | 0.0 | |||
| Netherlands | 1.4 | |||
| Norway | 1.4 | |||
| Papua New Guinea | 0.2 | |||
| Philippines | 0.1 | |||
| Poland | 0.2 | |||
| Portugal | 0.1 | |||
| Russia | 0.1 | |||
| Singapore | 0.1 | |||
| South Africa | 0.6 | |||
| South Korea | 1.8 | |||
| Spain | 0.6 | |||
| Sweden | 0.3 | |||
| Switzerland | 3.0 | |||
| Taiwan | 0.9 | |||
| Thailand | 0.0 | |||
| Turkey | 0.3 | |||
| United Kingdom | 5.8 | |||
| United States | 57.8 | |||
| Short-Term Investments | 1.6 | |||
| Other Assets and Liabilities | 1.3 | |||
| Total | 100.0 | % | ||
| 4 |
Hartford Global Research HLS Fund
Schedule of Investments
June 30, 2013 (Unaudited)
| (000’s Omitted) |
| Shares or Principal Amount | Market Value ╪ | |||||||
COMMON STOCKS - 96.6% | ||||||||
| Automobiles and Components - 1.8% | ||||||||
| 3 | Bayerische Motoren Werke (BMW) AG | $ | 245 | |||||
| 17 | Ford Motor Co. | 270 | ||||||
| 33 | Nissan Motor Co., Ltd. | 328 | ||||||
| 8 | Toyota Motor Corp. | 463 | ||||||
| 1,306 | ||||||||
| Banks - 6.8% | ||||||||
| 5 | Alior Bank S.A. ● | 135 | ||||||
| 38 | Banco ABC Brasil S.A. | 224 | ||||||
| 60 | Banco Santander Brasil S.A. | 371 | ||||||
| 8 | Bancorpsouth, Inc. | 143 | ||||||
| 5 | BNP Paribas | 257 | ||||||
| 4 | BOK Financial Corp. | 243 | ||||||
| 11 | BS Financial Group, Inc. | 143 | ||||||
| 5 | Canadian Imperial Bank of Commerce ☼ | 333 | ||||||
| 2 | Citizens & Northern Corp. | 29 | ||||||
| 4 | Concentradora Fibra Hotelera | 8 | ||||||
| — | ConnectOne Bancorp Inc. ● | 6 | ||||||
| 15 | DGB Financial Group, Inc. | 207 | ||||||
| 31 | DNB ASA | 445 | ||||||
| 411 | E.Sun Financial Holdings Co | 250 | ||||||
| 1 | Gronlandsbanken | 63 | ||||||
| 4 | Hana Financial Holdings | 103 | ||||||
| 4 | Home Capital Group, Inc. | 213 | ||||||
| 21 | Itau Unibanco Banco Multiplo S.A. ADR | 276 | ||||||
| 6 | KBC Groep N.V. | 220 | ||||||
| 5 | National Bank of Canada ☼ | 327 | ||||||
| 3 | Shinhan Financial Group Co., Ltd. | 107 | ||||||
| 30 | Spar Nord Bank A/S ● | 192 | ||||||
| 22 | Standard Chartered plc | 482 | ||||||
| 233 | Turkiye Sinai Kalkinma Bankasi A.S. | 231 | ||||||
| 5,008 | ||||||||
| Capital Goods - 7.0% | ||||||||
| 5 | AMETEK, Inc. | 214 | ||||||
| 16 | BAE Systems plc | 93 | ||||||
| 3 | Boeing Co. | 283 | ||||||
| 1 | Brenntag AG | 204 | ||||||
| 1 | Carlisle Cos., Inc. | 34 | ||||||
| 5 | Colfax Corp. ● | 248 | ||||||
| 2 | Compagnie De Saint-Gobain | 91 | ||||||
| 4 | Danaher Corp. | 235 | ||||||
| 1 | Dover Corp. | 41 | ||||||
| 2 | Eaton Corp. plc | 99 | ||||||
| 1 | European Aeronautic Defence & Space Co. N.V. | 68 | ||||||
| 19 | First Tractor Co. | 10 | ||||||
| 23 | General Electric Co. | 526 | ||||||
| 15 | GrafTech International Ltd. ● | 106 | ||||||
| 3 | Honeywell International, Inc. | 250 | ||||||
| 3 | IDEX Corp. | 156 | ||||||
| 4 | Illinois Tool Works, Inc. | 243 | ||||||
| 3 | Ingersoll-Rand plc | 149 | ||||||
| 5 | KBR, Inc. | 174 | ||||||
| 1 | Komatsu Ltd. | 26 | ||||||
| 1 | Leighton Holdings Ltd. | 10 | ||||||
| 1 | Lockheed Martin Corp. | 150 | ||||||
| 10 | Luxfer Holdings plc | 166 | ||||||
| — | Moog, Inc. Class A ● | 23 | ||||||
| 1 | Northrop Grumman Corp. | 68 | ||||||
| 4 | Pentair Ltd. | 236 | ||||||
| 2 | Raytheon Co. | 106 | ||||||
| 8 | Rexel S.A. | 182 | ||||||
| 9 | Rolls-Royce Holdings plc | 150 | ||||||
| 5 | Russel Metals, Inc. ☼ | 115 | ||||||
| 2 | Safran S.A. | 101 | ||||||
| 1 | Textron, Inc. | 37 | ||||||
| 4 | United Technologies Corp. | 328 | ||||||
| 3 | Vinci S.A. | 127 | ||||||
| 2 | WESCO International, Inc. ● | 117 | ||||||
| 5,166 | ||||||||
| Commercial and Professional Services - 0.4% | ||||||||
| 3 | Huron Consulting Group, Inc. ● | 134 | ||||||
| 3 | Nielsen Holdings N.V. | 115 | ||||||
| 1 | Quintiles Transnational Holdings ● | 43 | ||||||
| 7 | Transfield Services Ltd. | 5 | ||||||
| 297 | ||||||||
| Consumer Durables and Apparel - 2.2% | ||||||||
| 1 | Adidas AG | 134 | ||||||
| 4 | Brunello Cucinelli S.p.A. | 94 | ||||||
| 7 | Coway Co., Ltd. | 359 | ||||||
| 2 | Fifth & Pacific Cos., Inc. ● | 52 | ||||||
| 3 | iRobot Corp. ● | 130 | ||||||
| 1 | LVMH Moet Hennessy Louis Vuitton S.A. | 177 | ||||||
| 2 | Michael Kors Holdings Ltd. ● | 128 | ||||||
| 4 | NIKE, Inc. Class B | 267 | ||||||
| 1 | Persimmon plc | 11 | ||||||
| 1 | PVH Corp. | 89 | ||||||
| 75 | Samsonite International S.A. | 179 | ||||||
| 1,620 | ||||||||
| Consumer Services - 0.6% | ||||||||
| 3 | Carnival Corp. | 103 | ||||||
| 1 | Churchill Downs, Inc. | 46 | ||||||
| 1 | McDonald's Corp. | 57 | ||||||
| 30 | MGM China Holdings Ltd. | 80 | ||||||
| 2 | Norwegian Cruise Line Holdings Ltd. ● | 55 | ||||||
| 8 | Sands China Ltd. | 39 | ||||||
| — | Starwood Hotels & Resorts, Inc. | 22 | ||||||
| — | Whitbread plc | 15 | ||||||
| — | Wyndham Worldwide Corp. | 27 | ||||||
| 444 | ||||||||
| Diversified Financials - 4.0% | ||||||||
| 24 | CETIP S.A. - Mercados Organizado | 239 | ||||||
| 71 | Challenger Financial Services Group Ltd. | 257 | ||||||
| 16 | Citigroup, Inc. | 763 | ||||||
| 11 | EFG International AG ● | 135 | ||||||
| 1 | IntercontinentalExchange, Inc. ● | 124 | ||||||
| 8 | JP Morgan Chase & Co. | 397 | ||||||
| 10 | Julius Baer Group Ltd. | 406 | ||||||
| 36 | UBS AG | 616 | ||||||
| 2,937 | ||||||||
| Energy - 8.2% | ||||||||
| 3 | Anadarko Petroleum Corp. | 279 | ||||||
| 2 | Baker Hughes, Inc. | 92 | ||||||
| 47 | Beach Energy Ltd. | 49 | ||||||
| 25 | BG Group plc | 422 | ||||||
| 44 | BP plc | 302 | ||||||
| 5 | BP plc ADR | 215 | ||||||
| 11 | Buru Energy Ltd. ● | 12 | ||||||
| 21 | Cairn Energy plc ● | 80 | ||||||
The accompanying notes are an integral part of these financial statements.
| 5 |
Hartford Global Research HLS Fund
Schedule of Investments – (continued)
June 30, 2013 (Unaudited)
| (000’s Omitted) |
| Shares or Principal Amount | Market Value ╪ | |||||||
COMMON STOCKS - 96.6% - (continued) | ||||||||
| Energy - 8.2% - (continued) | ||||||||
| 4 | Canadian Natural Resources Ltd. ADR | $ | 104 | |||||
| 5 | Chevron Corp. | 534 | ||||||
| 78 | CNOOC Ltd. | 131 | ||||||
| 3 | Cobalt International Energy, Inc. ● | 91 | ||||||
| 2 | ConocoPhillips Holding Co. | 136 | ||||||
| 3 | Consol Energy, Inc. | 86 | ||||||
| 1 | Dril-Quip, Inc. ● | 98 | ||||||
| 3 | Enbridge, Inc. ☼ | 126 | ||||||
| 6 | EnCana Corp. ADR | 97 | ||||||
| 1 | EOG Resources, Inc. | 170 | ||||||
| 2 | Exxon Mobil Corp. | 186 | ||||||
| 7 | Galp Energia SGPS S.A. | 101 | ||||||
| 5 | Halliburton Co. | 219 | ||||||
| 5 | Imperial Oil Ltd. | 193 | ||||||
| 12 | JX Holdings, Inc. | 56 | ||||||
| 11 | Karoon Gas Australia Ltd. ● | 53 | ||||||
| 1 | Marathon Petroleum Corp. | 90 | ||||||
| 3 | MEG Energy Corp. ●☼ | 82 | ||||||
| 1 | National Oilwell Varco, Inc. | 67 | ||||||
| 103 | New Standard Energy Ltd. ● | 11 | ||||||
| 10 | OAO Rosneft Oil Co. GDR § | 67 | ||||||
| 3 | Ocean Rig UDW, Inc. ● | 58 | ||||||
| 13 | Oil Search Ltd. | 90 | ||||||
| 17 | Ophilr Energy plc ● | 94 | ||||||
| 4 | Patterson-UTI Energy, Inc. | 69 | ||||||
| 7 | Petroleo Brasileiro S.A. ADR | 87 | ||||||
| 4 | Phillips 66 | 209 | ||||||
| 1 | Pioneer Natural Resources Co. | 194 | ||||||
| 9 | Reliance Industries Ltd. | 124 | ||||||
| 6 | Repsol S.A. | 121 | ||||||
| 4 | Repsol S.A. Rights | 2 | ||||||
| 5 | Santos Ltd. | 57 | ||||||
| 1 | Schlumberger Ltd. | 107 | ||||||
| 3 | Southwestern Energy Co. ● | 119 | ||||||
| 8 | Statoil ASA | 160 | ||||||
| 3 | Superior Energy Services, Inc. ● | 71 | ||||||
| 1 | Tesoro Corp. | 78 | ||||||
| 7 | Tonengeneral Sekiyu KK | 68 | ||||||
| 1 | Tourmaline Oil Corp. ● | 51 | ||||||
| 6 | Trican Well Service Ltd. | 79 | ||||||
| 2 | Whiting Petroleum Corp. ● | 74 | ||||||
| 6,061 | ||||||||
| Food and Staples Retailing - 2.1% | ||||||||
| 7 | Carrefour S.A. | 190 | ||||||
| 2 | Costco Wholesale Corp. | 266 | ||||||
| 2 | CVS Caremark Corp. | 92 | ||||||
| 6 | Seven & I Holdings Co., Ltd. | 226 | ||||||
| 29 | Tesco plc | 148 | ||||||
| 8 | Walgreen Co. | 351 | ||||||
| 9 | Woolworths Ltd. | 255 | ||||||
| 1,528 | ||||||||
| Food, Beverage and Tobacco - 9.3% | ||||||||
| 25 | Altria Group, Inc. | 875 | ||||||
| 6 | Anheuser-Busch InBev N.V. | 519 | ||||||
| 18 | Coca-Cola Co. | 713 | ||||||
| 4 | Coca-Cola Enterprises, Inc. | 147 | ||||||
| 17 | Diageo Capital plc | 500 | ||||||
| 3 | Dr. Pepper Snapple Group | 156 | ||||||
| 2 | GLG Life Technology Corp. ● | 1 | ||||||
| 43 | ITC Ltd. | 236 | ||||||
| 4 | Kraft Foods Group, Inc. | 205 | ||||||
| 21 | Lorillard, Inc. | 935 | ||||||
| 14 | Mondelez International, Inc. | 400 | ||||||
| 12 | Nestle S.A. | 770 | ||||||
| 6 | New Britain Palm Oil Ltd. | 47 | ||||||
| 7 | PepsiCo, Inc. | 552 | ||||||
| 9 | Philip Morris International, Inc. | 780 | ||||||
| 6,836 | ||||||||
| Health Care Equipment and Services - 3.0% | ||||||||
| 2 | Abbott Laboratories | 54 | ||||||
| 1 | Aetna, Inc. | 94 | ||||||
| 2 | Al Noor Hospitals Group ● | 20 | ||||||
| 2 | Allscripts Healthcare Solutions, Inc. ● | 27 | ||||||
| 17 | Boston Scientific Corp. ● | 156 | ||||||
| 2 | Cardinal Health, Inc. | 82 | ||||||
| 2 | CIGNA Corp. | 179 | ||||||
| 3 | Covidien plc | 218 | ||||||
| 2 | HCA Holdings, Inc. | 82 | ||||||
| 3 | Health Management Associates, Inc. Class A ● | 51 | ||||||
| 3 | Hologic, Inc. ● | 53 | ||||||
| — | M3, Inc. | 110 | ||||||
| 2 | McKesson Corp. | 231 | ||||||
| 4 | Medtronic, Inc. | 181 | ||||||
| 5 | NMC Health plc | 20 | ||||||
| — | Qualicorp S.A. ● | 3 | ||||||
| 1 | Rhoen-Klinikum AG | 32 | ||||||
| 6 | Smith & Nephew plc | 70 | ||||||
| 1 | St. Jude Medical, Inc. | 59 | ||||||
| — | Straumann Holding AG | 26 | ||||||
| 3 | Stryker Corp. | 183 | ||||||
| 4 | UnitedHealth Group, Inc. | 277 | ||||||
| 1 | Zimmer Holdings, Inc. | 48 | ||||||
| 2,256 | ||||||||
| Household and Personal Products - 0.4% | ||||||||
| 2 | Beiersdorf AG | 155 | ||||||
| — | Coty, Inc. ● | 6 | ||||||
| 34 | Jyothy Laboratories Ltd. | 102 | ||||||
| 263 | ||||||||
| Insurance - 3.4% | ||||||||
| 4 | Ageas | 123 | ||||||
| 17 | AXA S.A. | 330 | ||||||
| 2 | Berkshire Hathaway, Inc. Class B ● | 239 | ||||||
| 13 | Delta Lloyd N.V. | 268 | ||||||
| 79 | Direct Line Insurance Group plc | 279 | ||||||
| 22 | Discovery Ltd. ☼ | 184 | ||||||
| 5 | Hanover Insurance Group, Inc. | 235 | ||||||
| 57 | RMI Holdings ☼ | 145 | ||||||
| 38 | Storebrand ASA | 182 | ||||||
| 5 | Unum Group | 147 | ||||||
| 13 | XL Group plc | 401 | ||||||
| 2,533 | ||||||||
| Materials - 5.0% | ||||||||
| 2 | Air Products & Chemicals, Inc. ‡ | 185 | ||||||
| 3 | Akzo Nobel N.V. | 153 | ||||||
| 10 | Allegheny Technologies, Inc. ‡ | 253 | ||||||
| 13 | ArcelorMittal ADR | 144 | ||||||
| 4 | Asahi Kasei Corp. | 25 | ||||||
| 11 | AuRico Gold, Inc. | 46 | ||||||
The accompanying notes are an integral part of these financial statements.
| 6 |
| Shares or Principal Amount | Market Value ╪ | |||||||
COMMON STOCKS - 96.6% - (continued) | ||||||||
| Materials - 5.0% - (continued) | ||||||||
| 5 | AZ Electronic Materials S.A. | $ | 24 | |||||
| 3 | Ball Corp. | 141 | ||||||
| 2 | BHP Billiton plc | 59 | ||||||
| 3 | Billerud | 26 | ||||||
| 1 | Cabot Corp. | 30 | ||||||
| 1 | Celanese Corp. | 66 | ||||||
| 54 | China Shanshui Cement Group | 24 | ||||||
| 4 | Constellium N.V. ● | 67 | ||||||
| 2 | Crown Holdings, Inc. ● | 73 | ||||||
| 4 | Dow Chemical Co. | 126 | ||||||
| 7 | EcoSynthetix, Inc. ● | 28 | ||||||
| 64 | Fosun International | 47 | ||||||
| 10 | Graphic Packaging Holding Co. ● | 80 | ||||||
| 2 | HeidelbergCement AG | 115 | ||||||
| 82 | Huabao International Holdings Ltd. | 36 | ||||||
| 6 | Indocement Tunggal Prakarsa Tbk PT | 14 | ||||||
| 2 | International Paper Co. | 97 | ||||||
| 2 | JSR Corp. | 38 | ||||||
| 2 | Lafarge S.A. | 100 | ||||||
| 1 | Lanxess | 43 | ||||||
| 3 | LyondellBasell Industries Class A | 198 | ||||||
| 1 | MeadWestvaco Corp. | 30 | ||||||
| 2 | Methanex Corp. ADR | 84 | ||||||
| 5 | Mitsubishi Chemical Holdings | 24 | ||||||
| 215 | Mongolian Mining Corp. ● | 40 | ||||||
| 1 | Monsanto Co. | 98 | ||||||
| 1 | Mosaic Co. | 49 | ||||||
| 15 | Nine Dragons Paper Holdings | 9 | ||||||
| 3 | Nippon Shokubai Co., Ltd. | 30 | ||||||
| 6 | NuFarm Ltd. | 25 | ||||||
| 5 | Omnova Solutions, Inc. ● | 38 | ||||||
| 4 | Owens-Illinois, Inc. ● | 101 | ||||||
| 53 | Platinum Group Metals Ltd. ●☼ | 46 | ||||||
| 5 | Rexam plc | 35 | ||||||
| 8 | Rio Tinto plc | 339 | ||||||
| 1 | Shin-Etsu Chemical Co., Ltd. | 69 | ||||||
| 9 | Smurfit Kappa Group plc | 148 | ||||||
| 8 | Synthomer plc | 23 | ||||||
| 2 | Tikkurila Oyj | 38 | ||||||
| 8 | Ube Industries Ltd. | 15 | ||||||
| 1 | Umicore S.A. | 44 | ||||||
| 5 | Universal Stainless & Alloy Products, Inc. ● | 157 | ||||||
| — | Westlake Chemical Corp. | 27 | ||||||
| 3,707 | ||||||||
| Media - 3.4% | ||||||||
| — | AMC Networks, Inc. Class A ● | 22 | ||||||
| 3 | Cablevision Systems Corp. | 54 | ||||||
| 1 | CBS Corp. Class B | 40 | ||||||
| 2 | Charter Communications, Inc. ● | 245 | ||||||
| 3 | Comcast Corp. Class A | 113 | ||||||
| 6 | Comcast Corp. Special Class A | 227 | ||||||
| 3 | DreamWorks Animation SKG, Inc. ● | 74 | ||||||
| — | Fuji Media Holdings, Inc. | 32 | ||||||
| 2 | Imax Corp. ● | 48 | ||||||
| 8 | Interpublic Group of Cos., Inc. | 115 | ||||||
| 2 | MDC Partners, Inc. Class A | 30 | ||||||
| 3 | Omnicom Group, Inc. | 182 | ||||||
| 3 | Pandora Media, Inc. ● | 58 | ||||||
| 4 | Reed Elsevier Capital, Inc. | 49 | ||||||
| 21 | Sirius XM Radio, Inc. w/ Rights | 71 | ||||||
| 3 | Thomson Reuters Corp. ☼ | 93 | ||||||
| 2 | Time Warner Cable, Inc. | 169 | ||||||
| 5 | Time Warner, Inc. | 278 | ||||||
| 2 | Tremor Video, Inc. ● | 13 | ||||||
| 2 | TV Asahi Corp. | 36 | ||||||
| 9 | Walt Disney Co. | 598 | ||||||
| 2,547 | ||||||||
| Pharmaceuticals, Biotechnology and Life Sciences - 7.7% | ||||||||
| 1 | Acorda Therapeutics, Inc. ● | 38 | ||||||
| 1 | Actavis, Inc. ●‡ | 115 | ||||||
| 1 | Actelion Ltd. | 44 | ||||||
| 2 | Agilent Technologies, Inc. | 85 | ||||||
| 2 | Algeta ASA ● | 67 | ||||||
| 6 | Alkermes plc ● | 172 | ||||||
| 3 | Almirall S.A. | 40 | ||||||
| 6 | Arena Pharmaceuticals, Inc. ● | 47 | ||||||
| 2 | Astellas Pharma, Inc. | 90 | ||||||
| 4 | AstraZeneca plc ADR | 171 | ||||||
| 2 | Auxilium Pharmaceuticals, Inc. ● | 39 | ||||||
| 1 | Biogen Idec, Inc. ● | 145 | ||||||
| 10 | Bristol-Myers Squibb Co. | 469 | ||||||
| 3 | Cadence Pharmaceuticals, Inc. ● | 19 | ||||||
| 1 | Covance, Inc. ● | 69 | ||||||
| 1 | Cubist Pharmaceuticals, Inc. ● | 52 | ||||||
| 7 | Daiichi Sankyo Co., Ltd. | 117 | ||||||
| 3 | Eisai Co., Ltd. | 109 | ||||||
| 18 | Elan Corp. plc ADR ● | 248 | ||||||
| 9 | Eli Lilly & Co. | 419 | ||||||
| 15 | Exelixis, Inc. ● | 67 | ||||||
| 5 | Forest Laboratories, Inc. ● | 193 | ||||||
| 6 | Gilead Sciences, Inc. ● | 330 | ||||||
| 2 | H. Lundbeck A/S | 41 | ||||||
| 2 | Immunogen, Inc. ● | 40 | ||||||
| 2 | Incyte Corp. ● | 36 | ||||||
| 1 | Infinity Pharmaceuticals, Inc. ● | 17 | ||||||
| 2 | Ironwood Pharmaceuticals, Inc. ● | 21 | ||||||
| 2 | Johnson & Johnson | 178 | ||||||
| 3 | Medicines Co. ● | 104 | ||||||
| 8 | Merck & Co., Inc. | 373 | ||||||
| 3 | Mylan, Inc. ● | 103 | ||||||
| 2 | NPS Pharmaceuticals, Inc. ● | 29 | ||||||
| 1 | Ono Pharmaceutical Co., Ltd. | 49 | ||||||
| 1 | Onyx Pharmaceuticals, Inc. ● | 100 | ||||||
| 2 | Regeneron Pharmaceuticals, Inc. ● | 393 | ||||||
| 5 | Rigel Pharmaceuticals, Inc. ● | 18 | ||||||
| 1 | Roche Holding AG | 173 | ||||||
| — | Salix Pharmaceuticals Ltd. ● | 12 | ||||||
| 2 | Seattle Genetics, Inc. ● | 66 | ||||||
| 11 | Shionogi & Co., Ltd. | 222 | ||||||
| 8 | Teva Pharmaceutical Industries Ltd. ADR | 316 | ||||||
| 2 | UCB S.A. | 118 | ||||||
| 1 | Vertex Pharmaceuticals, Inc. ● | 110 | ||||||
| 2 | Xenoport, Inc. ● | 10 | ||||||
| 5,674 | ||||||||
| Real Estate - 2.4% | ||||||||
| — | Acadia Realty Trust REIT | 9 | ||||||
| — | Alexander & Baldwin, Inc. ● | 15 | ||||||
| 1 | American Assets Trust, Inc. REIT | 22 | ||||||
| 2 | American Tower Corp. REIT | 133 | ||||||
| 9 | Ascendas REIT | 16 | ||||||
The accompanying notes are an integral part of these financial statements.
| 7 |
Hartford Global Research HLS Fund
Schedule of Investments – (continued)
June 30, 2013 (Unaudited)
| (000’s Omitted) |
| Shares or Principal Amount | Market Value ╪ | |||||||
COMMON STOCKS - 96.6% - (continued) | ||||||||
| Real Estate - 2.4% - (continued) | ||||||||
| 3 | Asesor De Activos Prisma SAP REIT | $ | 4 | |||||
| — | AvalonBay Communities, Inc. REIT | 63 | ||||||
| 222 | Bekasi Fajar Industrial Estate Tbk PT | 18 | ||||||
| 7 | Beni Stabili S.p.A. | 4 | ||||||
| 3 | Big Yellow Group REIT | 15 | ||||||
| — | Boston Properties, Inc. REIT | 36 | ||||||
| 1 | British Land Co. plc REIT | 4 | ||||||
| — | Camden Property Trust REIT | 28 | ||||||
| 2 | Corporacion Inmobiliaria Vesta S. de RL de C.V. | 4 | ||||||
| 1 | Cousins Properties, Inc. REIT | 6 | ||||||
| 1 | DDR Corp. REIT | 21 | ||||||
| 1 | Derwent London plc REIT | 38 | ||||||
| 25 | Dexus Property Group REIT | 24 | ||||||
| 1 | Douglas Emmett, Inc. REIT | 27 | ||||||
| — | EastGroup Properties, Inc. REIT | 19 | ||||||
| — | Education Realty Trust, Inc. REIT | 2 | ||||||
| — | Equity Lifestyle Properties, Inc. REIT | 27 | ||||||
| — | Essex Property Trust, Inc. REIT | 41 | ||||||
| 1 | EuroBank Properties REIT ● | 8 | ||||||
| — | Extra Space Storage, Inc. REIT | 18 | ||||||
| 4 | Fibra Uno Administracion S.A. REIT | 15 | ||||||
| 2 | Forest City Enterprises, Inc. Class A ● | 27 | ||||||
| 33 | Fortune REIT | 31 | ||||||
| 3 | General Growth Properties, Inc. REIT | 55 | ||||||
| 7 | Goodman Group REIT | 31 | ||||||
| 3 | Hammerson plc REIT | 24 | ||||||
| 1 | Health Care, Inc. REIT | 67 | ||||||
| 1 | Healthcare Trust of America, Inc. REIT | 11 | ||||||
| 2 | Host Hotels & Resorts, Inc. REIT | 26 | ||||||
| — | Icade REIT | 9 | ||||||
| — | Industrial & Infrastructure Fund Investment Corp. REIT | 29 | ||||||
| — | Japan Logistics Fund REIT | 37 | ||||||
| — | Kilroy Realty Corp. REIT | 19 | ||||||
| 11 | Link (The) REIT | 53 | ||||||
| 15 | Mirvac Group REIT | 22 | ||||||
| 2 | Mitsubishi Estate Co., Ltd. | 65 | ||||||
| 2 | Mitsui Fudosan Co., Ltd. | 66 | ||||||
| — | Ntt Urban Development Corp. | 40 | ||||||
| 358 | Pakuwon Jati TBK | 12 | ||||||
| — | Public Storage REIT | 48 | ||||||
| 1 | Rayonier, Inc. REIT | 29 | ||||||
| 53 | Robinsons Land Corp. | 25 | ||||||
| 1 | Simon Property Group, Inc. REIT | 99 | ||||||
| 11 | Sino Land Co., Ltd. | 15 | ||||||
| — | SL Green Realty Corp. REIT | 35 | ||||||
| 1 | Stag Industrial, Inc. REIT | 13 | ||||||
| 4 | Sun Hung Kai Properties Ltd. | 45 | ||||||
| 30 | Supalai Public Co., Ltd. ☼ | 17 | ||||||
| — | Taubman Centers, Inc. REIT | 29 | ||||||
| — | Unibail Rodamco REIT | 55 | ||||||
| 3 | Unite Group plc | 19 | ||||||
| — | Wereldhave N.V. REIT | 9 | ||||||
| 7 | Westfield Group REIT | 73 | ||||||
| 1 | Wihlborgs Fastigheter A.B. | 14 | ||||||
| 1,766 | ||||||||
| Retailing - 5.4% | ||||||||
| 3 | Amazon.com, Inc. ● | 940 | ||||||
| — | AutoZone, Inc. ● | 144 | ||||||
| 8 | Best Buy Co., Inc. | 208 | ||||||
| 2 | Dick's Sporting Goods, Inc. | 100 | ||||||
| 4 | Dollar Tree, Inc. ● | 203 | ||||||
| 1 | DSW, Inc. | 63 | ||||||
| 1 | Five Below, Inc. ● | 29 | ||||||
| 2 | GNC Holdings, Inc. | 80 | ||||||
| 4 | Hennes & Mauritz Ab | 133 | ||||||
| 2 | HSN, Inc. | 84 | ||||||
| 102 | Intime Department Store Group Co., Ltd. | 99 | ||||||
| 4 | Liberty Media - Interactive A ● | 95 | ||||||
| 14 | LightInTheBox Holdings Co., LTD ● | 186 | ||||||
| 15 | Lowe's Cos., Inc. | 620 | ||||||
| 30 | Marks & Spencer Group plc | 194 | ||||||
| 1 | Netflix, Inc. ● | 153 | ||||||
| 2 | Nordstrom, Inc. | 91 | ||||||
| 3 | Pier 1 Imports, Inc. | 59 | ||||||
| — | Priceline.com, Inc. ● | 274 | ||||||
| 9 | Rakuten, Inc. | 111 | ||||||
| 1 | Ryohin Keikaku Co., Ltd. | 91 | ||||||
| 2 | Urban Outfitters, Inc. ● | 69 | ||||||
| 4,026 | ||||||||
| Semiconductors and Semiconductor Equipment - 2.3% | ||||||||
| 4 | ASM Pacific Technology Ltd. | 48 | ||||||
| 1 | ASML Holding N.V. | 109 | ||||||
| 2 | Cypress Semiconductor Corp. | 19 | ||||||
| 2 | First Solar, Inc. ● | 75 | ||||||
| 3 | Hynix Semiconductor, Inc. | 94 | ||||||
| 21 | Intel Corp. | 519 | ||||||
| 2 | International Rectifier Corp. ● | 36 | ||||||
| 2 | Lam Research Corp. ● | 84 | ||||||
| 7 | NXP Semiconductors N.V. ● | 230 | ||||||
| 12 | RF Micro Devices, Inc. ● | 64 | ||||||
| — | Samsung Electronics Co., Ltd. | 206 | ||||||
| 1 | Silicon Laboratories, Inc. ● | 50 | ||||||
| 47 | Taiwan Semiconductor Manufacturing Co., Ltd. | 170 | ||||||
| 1,704 | ||||||||
| Software and Services - 7.2% | ||||||||
| 2 | Accenture plc | 177 | ||||||
| 9 | Activision Blizzard, Inc. ‡ | 131 | ||||||
| 2 | Akamai Technologies, Inc. ● | 93 | ||||||
| 1 | Alliance Data Systems Corp. ● | 190 | ||||||
| 3 | Autodesk, Inc. ● | 94 | ||||||
| 2 | Automatic Data Processing, Inc. | 155 | ||||||
| 9 | Cadence Design Systems, Inc. ● | 130 | ||||||
| 2 | Citrix Systems, Inc. ● | 147 | ||||||
| 2 | Cognizant Technology Solutions Corp. ● | 133 | ||||||
| 1 | CyrusOne, Inc. | 28 | ||||||
| 4 | Dropbox, Inc. ⌂●† | 38 | ||||||
| 10 | eBay, Inc. ● | 532 | ||||||
| — | Equinix, Inc. ● | 23 | ||||||
| 1 | Exlservice Holdings, Inc. ● | 38 | ||||||
| 8 | Facebook, Inc. ● | 206 | ||||||
| 10 | Genpact Ltd. | 186 | ||||||
| 1 | Google, Inc. ● | 484 | ||||||
| — | Heartland Payment Systems, Inc. | 11 | ||||||
| 22 | Higher One Holdings, Inc. ● | 255 | ||||||
| 1 | IBM Corp. | 244 | ||||||
The accompanying notes are an integral part of these financial statements.
| 8 |
| Shares or Principal Amount | Market Value ╪ | |||||||
COMMON STOCKS - 96.6% - (continued) | ||||||||
| Software and Services - 7.2% - (continued) | ||||||||
| 5 | Kakaku.com, Inc. | $ | 157 | |||||
| 1 | LinkedIn Corp. Class A ● | 231 | ||||||
| 10 | Microsoft Corp. | 360 | ||||||
| 4 | Pactera Technology International Ltd. ● | 29 | ||||||
| 3 | QLIK Technologies, Inc. ● | 71 | ||||||
| 4 | Teradata Corp. ● | 190 | ||||||
| 16 | VeriFone Systems, Inc. ● | 270 | ||||||
| 2 | Visa, Inc. | 358 | ||||||
| 13 | Yahoo!, Inc. ● | 331 | ||||||
| 5,292 | ||||||||
| Technology Hardware and Equipment - 3.5% | ||||||||
| 13 | AAC Technologies Holdings, Inc. | 75 | ||||||
| 10 | Advantech Co., Ltd. | 49 | ||||||
| 4 | Anritsu Corp. | 50 | ||||||
| 1 | Apple, Inc. | 419 | ||||||
| 1 | Arrow Electronics, Inc. ● | 48 | ||||||
| 5 | Asustek Computer, Inc. | 46 | ||||||
| 1 | Avnet, Inc. ● | 50 | ||||||
| 3 | Ciena Corp. ● | 62 | ||||||
| 17 | Cisco Systems, Inc. | 421 | ||||||
| 13 | Delta Electronics, Inc. | 58 | ||||||
| 13 | EMC Corp. | 306 | ||||||
| 16 | JDS Uniphase Corp. ● | 225 | ||||||
| 19 | Juniper Networks, Inc. ● | 365 | ||||||
| 1 | National Instruments Corp. | 21 | ||||||
| — | QIWI plc ADR | 8 | ||||||
| 1 | Rogers Corp. ● | 58 | ||||||
| 5 | Telefonaktiebolaget LM Ericsson ADR | 59 | ||||||
| 2 | TPK Holding Co., Ltd. ● | 38 | ||||||
| 2 | Trimble Navigation Ltd. ● | 47 | ||||||
| 7 | Wacom Co., Ltd. | 82 | ||||||
| 72 | WPG Holdings Co., Ltd. | 85 | ||||||
| 2,572 | ||||||||
| Telecommunication Services - 3.1% | ||||||||
| 46 | Axiata Group Berhad | 95 | ||||||
| 114 | Bezeq Israeli Telecommunication Corp., Ltd. | 152 | ||||||
| 32 | Bharti Airtel Ltd. | 158 | ||||||
| 24 | Bharti Infratel Ltd. | 62 | ||||||
| 73 | China Unicom Ltd. | 96 | ||||||
| 2 | Crown Castle International Corp. ● | 171 | ||||||
| 13 | Frontier Communications Co. | 51 | ||||||
| 2 | KDDI Corp. | 84 | ||||||
| 2 | KT Corp. ADR | 26 | ||||||
| 22 | Leap Wireless International, Inc. ● | 149 | ||||||
| 6 | MTN Group Ltd. ☼ | 104 | ||||||
| 6 | NII Holdings, Inc. Class B ● | 43 | ||||||
| 1 | P.T. Telekomunikasi Indonesia ADR | 58 | ||||||
| 1 | Philippine Long Distance Telephone Co. ADR | 65 | ||||||
| 2 | SBA Communications Corp. ● | 118 | ||||||
| 6 | SK Telecom Co., Ltd. ADR | 117 | ||||||
| 1 | SoftBank Corp. | 60 | ||||||
| 27 | Sprint Nextel Corp. ● | 189 | ||||||
| 10 | Telefonica S.A. ADR | 131 | ||||||
| 9 | Telenor ASA | 181 | ||||||
| 2 | T-Mobile US, Inc. | 39 | ||||||
| 4 | TW Telecom, Inc. ● | 121 | ||||||
| 2,270 | ||||||||
| Transportation - 3.4% | ||||||||
| 238 | AirAsia Berhad | 239 | ||||||
| 82 | AirAsia X Berhad ●☼ | 32 | ||||||
| 4 | Celadon Group, Inc. | 66 | ||||||
| 7 | Covenant Transport ● | 42 | ||||||
| 31 | Delta Air Lines, Inc. ● | 584 | ||||||
| 1 | DSV A/S | 19 | ||||||
| 3 | FedEx Corp. | 260 | ||||||
| — | Flughafen Zuerich AG | 55 | ||||||
| 1 | Genesee & Wyoming, Inc. Class A ● | 97 | ||||||
| 3 | Hertz Global Holdings, Inc. ● | 80 | ||||||
| 3 | J.B. Hunt Transport Services, Inc. | 183 | ||||||
| 1 | Kansas City Southern | 91 | ||||||
| 28 | Malaysia Airports Holdings BHD | 56 | ||||||
| 2 | Norfolk Southern Corp. | 178 | ||||||
| 19 | Transurban Group | 120 | ||||||
| 18 | US Airways Group, Inc. ● | 297 | ||||||
| 7 | Vitran Corp., Inc. ● | 46 | ||||||
| 3 | XPO Logistics, Inc. ● | 54 | ||||||
| 2,499 | ||||||||
| Utilities - 4.0% | ||||||||
| 2 | Alliant Energy Corp. | 87 | ||||||
| 3 | American Electric Power Co., Inc. | 115 | ||||||
| 6 | Calpine Corp. ● | 135 | ||||||
| 7 | Cheung Kong Infrastructure Holdings Ltd. | 43 | ||||||
| 7 | Cia de Saneamento Basico do Estado de Sao Paulo | 70 | ||||||
| 4 | Cia Paranaense de Energie | 43 | ||||||
| 5 | Duke Energy Corp. | 321 | ||||||
| 9 | E.On SE | 149 | ||||||
| 33 | Enel Green Power S.p.A. | 68 | ||||||
| 20 | Enel S.p.A. | 63 | ||||||
| 13 | ENN Energy Holdings Ltd. | 71 | ||||||
| 5 | GDF Suez | 104 | ||||||
| 101 | Guangdong Investment Ltd. | 88 | ||||||
| 16 | Iberdrola S.A. | 84 | ||||||
| — | Infraestructura Energetica Nova, S.A.B. de C.V. ● | 1 | ||||||
| 23 | National Grid plc | 260 | ||||||
| 6 | NextEra Energy, Inc. | 485 | ||||||
| 3 | Northeast Utilities | 123 | ||||||
| 19 | NTPC Ltd. | 47 | ||||||
| 2 | OGE Energy Corp. | 150 | ||||||
| 15 | Osaka Gas Co., Ltd. | 63 | ||||||
| 4 | PG&E Corp. | 187 | ||||||
| 1 | Red Electrica Corporacion S.A. | 33 | ||||||
| 11 | Snam S.p.A. | 50 | ||||||
| 6 | Suez Environment S.A. | 83 | ||||||
| 10 | Tokyo Gas Co., Ltd. | 53 | ||||||
| 2,976 | ||||||||
| Total common stocks | ||||||||
| (cost $64,629) | $ | 71,288 | ||||||
PREFERRED STOCKS - 0.4% | ||||||||
| Automobiles and Components - 0.3% | ||||||||
| 1 | Volkswagen AG N.V. | $ | 239 | |||||
The accompanying notes are an integral part of these financial statements.
| 9 |
Hartford Global Research HLS Fund
Schedule of Investments – (continued)
June 30, 2013 (Unaudited)
| (000’s Omitted) |
| Shares or Principal Amount | Market Value ╪ | |||||||||||
| PREFERRED STOCKS - 0.4% - (continued) | ||||||||||||
| Software and Services - 0.1% | ||||||||||||
| 7 | FireEye, Inc. Private Placement ⌂† | $ | 81 | |||||||||
| Total preferred stocks | ||||||||||||
| (cost $303) | $ | 320 | ||||||||||
| WARRANTS - 0.0% | ||||||||||||
| Telecommunication Services - 0.0% | ||||||||||||
| 1 | Micex AP Generis ⌂■ | $ | 2 | |||||||||
| Total warrants | ||||||||||||
| (cost $2) | $ | 2 | ||||||||||
| EXCHANGE TRADED FUNDS - 0.1% | ||||||||||||
| Other Investment Pools and Funds - 0.1% | ||||||||||||
| 1 | iShares S&P North American Technology Sector Index Fund | $ | 74 | |||||||||
| Total exchange traded funds | ||||||||||||
| (cost $73) | $ | 74 | ||||||||||
| Total long-term investments | ||||||||||||
| (cost $65,007) | $ | 71,684 | ||||||||||
| SHORT-TERM INVESTMENTS - 1.6% | ||||||||||||
| Repurchase Agreements - 1.6% | ||||||||||||
| Bank of America Merrill Lynch TriParty Repurchase Agreement (maturing on 07/01/2013 in the amount of $4, collateralized by GNMA 3.00%, 2042, value of $4) | ||||||||||||
| $ | 4 | 0.13%, 6/28/2013 | $ | 4 | ||||||||
| Bank of Montreal TriParty Repurchase Agreement (maturing on 07/01/2013 in the amount of $92, collateralized by FHLMC 4.00% - 5.00%, 2023 - 2025, FNMA 2.00% - 5.00%, 2022 - 2042, GNMA 2.00% - 5.00%, 2041 - 2043, value of $93) | ||||||||||||
| 92 | 0.15%, 6/28/2013 | 92 | ||||||||||
| Bank of Montreal TriParty Repurchase Agreement (maturing on 07/01/2013 in the amount of $178, collateralized by FHLB 0.38%, 2015, FHLMC 0.38%, 2014, FNMA 0.50% - 5.50%, 2015 - 2042, value of $181) | ||||||||||||
| 178 | 0.12%, 6/28/2013 | 178 | ||||||||||
| Barclays Capital TriParty Repurchase Agreement (maturing on 07/01/2013 in the amount of $123, collateralized by U.S. Treasury Note 3.13%, 2021, value of $125) | ||||||||||||
| 123 | 0.10%, 6/28/2013 | 123 | ||||||||||
| Citigroup Global Markets, Inc. TriParty Repurchase Agreement (maturing on 07/01/2013 in the amount of $364, collateralized by U.S. Treasury Bill 0.85%, 2013, U.S. Treasury Note 0.63% - 3.25%, 2013 - 2018, value of $369) | ||||||||||||
| 364 | 0.10%, 6/28/2013 | 364 | ||||||||||
| Deutsche Bank Securities TriParty Repurchase Agreement (maturing on 07/01/2013 in the amount of $4, collateralized by FNMA 4.50%, 2035, value of $4) | ||||||||||||
| 4 | 0.25%, 6/28/2013 | 4 | ||||||||||
| RBS Securities, Inc. TriParty Repurchase Agreement (maturing on 07/01/2013 in the amount of $146, collateralized by U.S. Treasury Note 1.00% - 2.63%, 2014 - 2020, value of $149) | ||||||||||||
| 146 | 0.10%, 6/28/2013 | 146 | ||||||||||
| TD Securities TriParty Repurchase Agreement (maturing on 07/01/2013 in the amount of $257, collateralized by FHLMC 3.50% - 4.00%, 2042, FNMA 3.50% - 4.50%, 2041 - 2042, value of $262) | ||||||||||||
| 257 | 0.12%, 6/28/2013 | 257 | ||||||||||
| UBS Securities, Inc. Repurchase Agreement (maturing on 07/01/2013 in the amount of $4, collateralized by U.S. Treasury Note 0.63%, 2014, value of $4) | ||||||||||||
| 4 | 0.09%, 6/28/2013 | 4 | ||||||||||
| 1,172 | ||||||||||||
| Total short-term investments | ||||||||||||
| (cost $1,172) | $ | 1,172 | ||||||||||
| Total investments | ||||||||||||
| (cost $66,179) ▲ | 98.7 | % | $ | 72,856 | ||||||||
| Other assets and liabilities | 1.3 | % | 959 | |||||||||
| Total net assets | 100.0 | % | $ | 73,815 | ||||||||
The accompanying notes are an integral part of these financial statements.
| 10 |
| Note: | Percentage of investments as shown is the ratio of the total market value to total net assets. |
| Prices of foreign equities that are principally traded on certain foreign markets may be adjusted daily pursuant to a fair value pricing service approved by the Board of Directors in order to reflect an adjustment for factors occurring after the close of certain foreign markets but before the close of the New York Stock Exchange. |
| ▲ | At June 30, 2013, the cost of securities for federal income tax purposes was $67,338 and the aggregate gross unrealized appreciation and depreciation based on that cost were: |
| Unrealized Appreciation | $ | 8,624 | ||
| Unrealized Depreciation | (3,106 | ) | ||
| Net Unrealized Appreciation | $ | 5,518 |
| † | These securities were valued in good faith at fair value as determined under policies and procedures established by and under the supervision of the Company's Board of Directors. At June 30, 2013, the aggregate value of these securities was $119, which represents 0.2% of total net assets. This amount excludes securities that are principally traded in certain foreign markets and whose prices are adjusted pursuant to a third party pricing service methodology approved by the Board of Directors. |
| ● | Non-income producing. |
| ■ | Securities issued within terms of a private placement memorandum, exempt from registration under Rule 144A under the Securities Act of 1933, as amended, and may be sold only to qualified institutional buyers. Unless otherwise indicated, these holdings are determined to be liquid. At June 30, 2013, the aggregate value of these securities was $2, which rounds to zero percent of total net assets. |
| § | These securities were sold to the Fund under Regulation S, rules governing offers and sales made outside the United States without registration under the Securities Act of 1933. The Fund may only be able to resell these securities in the United States if an exemption from registration under the federal and state securities laws is available, or the Fund may only be able to sell these securities outside of the United States (such as on a foreign exchange) to a non-U.S. person. Unless otherwise indicated, these holdings are determined to be liquid. At June 30, 2013, the aggregate value of these securities was $67, which represents 0.1% of total net assets. |
| ⌂ | The following securities are considered illiquid. Illiquid securities are often purchased in private placement transactions, are often not registered under the Securities Act of 1933 and may have contractual restrictions on resale. A security may also be considered illiquid if the security lacks a readily available market or if its valuation has not changed for a certain period of time. |
| Period Acquired | Shares/ Par | Security | Cost Basis | |||||||
| 05/2012 | 4 | Dropbox, Inc. | $ | 38 | ||||||
| 12/2012 | 7 | FireEye, Inc. Private Placement Preferred | 71 | |||||||
| 05/2013 | 1 | Micex AP Generis Warrants - 144A | 2 | |||||||
| At June 30, 2013, the aggregate value of these securities was $121, which represents 0.2% of total net assets. |
| ☼ | This security, or a portion of this security, was purchased on a when-issued, delayed-delivery or delayed-draw basis. The cost of these securities was $652 at June 30, 2013. |
| ‡ | This security, or a portion of this security, has been segregated to cover funding requirements on investment transactions settling in the future. |
Foreign Currency Contracts Outstanding at June 30, 2013
| Currency | Buy / Sell | Delivery Date | Counterparty | Contract Amount | Market Value ╪ | Unrealized Appreciation/ (Depreciation) | ||||||||||||
| AUD | Buy | 07/03/2013 | JPM | $ | 266 | $ | 264 | $ | (2 | ) | ||||||||
| AUD | Sell | 07/01/2013 | CBA | 27 | 26 | 1 | ||||||||||||
| AUD | Sell | 07/01/2013 | JPM | 177 | 176 | 1 | ||||||||||||
| CHF | Buy | 07/03/2013 | UBS | 525 | 525 | – | ||||||||||||
| CHF | Sell | 07/03/2013 | UBS | 319 | 319 | – | ||||||||||||
| DKK | Buy | 07/03/2013 | JPM | 105 | 105 | – | ||||||||||||
| EUR | Buy | 07/02/2013 | HSBC | 291 | 291 | – | ||||||||||||
| EUR | Buy | 07/03/2013 | HSBC | 880 | 880 | – | ||||||||||||
| EUR | Sell | 07/02/2013 | HSBC | 165 | 165 | – | ||||||||||||
| EUR | Sell | 07/03/2013 | HSBC | 1,308 | 1,308 | – | ||||||||||||
The accompanying notes are an integral part of these financial statements.
| 11 |
Hartford Global Research HLS Fund
Schedule of Investments – (continued)
June 30, 2013 (Unaudited)
| (000’s Omitted) |
Foreign Currency Contracts Outstanding at June 30, 2013 - (continued)
| Currency | Buy / Sell | Delivery Date | Counterparty | Contract Amount | Market Value ╪ | Unrealized Appreciation/ (Depreciation) | ||||||||||||
| GBP | Buy | 07/03/2013 | BCLY | $ | 507 | $ | 507 | $ | – | |||||||||
| GBP | Sell | 07/03/2013 | BCLY | 2,244 | 2,244 | – | ||||||||||||
| HKD | Buy | 07/03/2013 | JPM | 268 | 268 | – | ||||||||||||
| HKD | Sell | 07/03/2013 | JPM | 487 | 487 | – | ||||||||||||
| IDR | Buy | 07/01/2013 | JPM | 1 | 1 | – | ||||||||||||
| JPY | Buy | 07/01/2013 | DEUT | 395 | 389 | (6 | ) | |||||||||||
| JPY | Buy | 07/03/2013 | JPM | 509 | 508 | (1 | ) | |||||||||||
| JPY | Sell | 07/01/2013 | DEUT | 391 | 359 | 32 | ||||||||||||
| JPY | Sell | 07/01/2013 | DEUT | 30 | 30 | – | ||||||||||||
| JPY | Sell | 07/29/2013 | DEUT | 218 | 215 | 3 | ||||||||||||
| JPY | Sell | 12/20/2013 | DEUT | 153 | 151 | 2 | ||||||||||||
| JPY | Sell | 07/01/2013 | JPM | 38 | 37 | 1 | ||||||||||||
| JPY | Sell | 07/03/2013 | JPM | 1,590 | 1,588 | 2 | ||||||||||||
| MYR | Buy | 07/08/2013 | JPM | 32 | 33 | 1 | ||||||||||||
| NOK | Buy | 07/03/2013 | JPM | 322 | 322 | – | ||||||||||||
| NOK | Sell | 07/03/2013 | JPM | 127 | 127 | – | ||||||||||||
| PLN | Buy | 07/03/2013 | JPM | 53 | 53 | – | ||||||||||||
| PLN | Sell | 07/03/2013 | JPM | 16 | 16 | – | ||||||||||||
| SEK | Buy | 07/03/2013 | JPM | 27 | 27 | – | ||||||||||||
| SEK | Sell | 07/03/2013 | JPM | 76 | 76 | – | ||||||||||||
| SGD | Buy | 07/03/2013 | JPM | 11 | 11 | – | ||||||||||||
| SGD | Sell | 07/03/2013 | JPM | 165 | 165 | – | ||||||||||||
| TRY | Buy | 07/02/2013 | JPM | 85 | 85 | – | ||||||||||||
| ZAR | Buy | 07/05/2013 | JPM | 162 | 162 | – | ||||||||||||
| $ | 34 | |||||||||||||||||
| ╪ | See Significant Accounting Policies of accompanying Notes to Financial Statements regarding valuation of securities. |
| GLOSSARY: (abbreviations used in preceding Schedule of Investments) | |
| Counterparty Abbreviations: | |
| BCLY | Barclays |
| CBA | Commonwealth Bank of Australia |
| DEUT | Deutsche Bank Securities, Inc. |
| HSBC | HSBC Bank USA |
| JPM | JP Morgan Chase & Co. |
| UBS | UBS AG |
| Currency Abbreviations: | |
| AUD | Australian Dollar |
| CHF | Swiss Franc |
| DKK | Danish Krone |
| EUR | EURO |
| GBP | British Pound |
| HKD | Hong Kong Dollar |
| IDR | Indonesian New Rupiah |
| JPY | Japanese Yen |
| MYR | Malaysian Ringgit |
| NOK | Norwegian Krone |
| PLN | Polish New Zloty |
| SEK | Swedish Krona |
| SGD | Singapore Dollar |
| TRY | Turkish New Lira |
| ZAR | South African Rand |
| Index Abbreviations: | |
| S&P | Standard & Poors |
| Other Abbreviations: | |
| ADR | American Depositary Receipt |
| FHLB | Federal Home Loan Bank |
| FHLMC | Federal Home Loan Mortgage Corp. |
| FNMA | Federal National Mortgage Association |
| GDR | Global Depositary Receipt |
| GNMA | Government National Mortgage Association |
| REIT | Real Estate Investment Trust |
The accompanying notes are an integral part of these financial statements.
| 12 |
Hartford Global Research HLS Fund
Investment Valuation Hierarchy Level Summary
June 30, 2013 (Unaudited)
| (000’s Omitted) |
| Total | Level 1 ♦ | Level 2 ♦ | Level 3 | |||||||||||||
| Assets: | ||||||||||||||||
| Common Stocks | ||||||||||||||||
| Automobiles and Components | $ | 1,306 | $ | 270 | $ | 1,036 | $ | – | ||||||||
| Banks | 5,008 | 2,173 | 2,835 | – | ||||||||||||
| Capital Goods | 5,166 | 4,104 | 1,062 | – | ||||||||||||
| Commercial and Professional Services | 297 | 292 | 5 | – | ||||||||||||
| Consumer Durables and Apparel | 1,620 | 666 | 954 | – | ||||||||||||
| Consumer Services | 444 | 310 | 134 | – | ||||||||||||
| Diversified Financials | 2,937 | 1,523 | 1,414 | – | ||||||||||||
| Energy | 6,061 | 4,130 | 1,931 | – | ||||||||||||
| Food and Staples Retailing | 1,528 | 709 | 819 | – | ||||||||||||
| Food, Beverage and Tobacco | 6,836 | 4,764 | 2,072 | – | ||||||||||||
| Health Care Equipment and Services | 2,256 | 2,050 | 206 | – | ||||||||||||
| Household and Personal Products | 263 | 6 | 257 | – | ||||||||||||
| Insurance | 2,533 | 1,301 | 1,232 | – | ||||||||||||
| Materials | 3,707 | 2,164 | 1,543 | – | ||||||||||||
| Media | 2,547 | 2,430 | 117 | – | ||||||||||||
| Pharmaceuticals, Biotechnology and Life Sciences | 5,674 | 4,645 | 1,029 | – | ||||||||||||
| Real Estate | 1,766 | 960 | 806 | – | ||||||||||||
| Retailing | 4,026 | 3,398 | 628 | – | ||||||||||||
| Semiconductors and Semiconductor Equipment | 1,704 | 1,186 | 518 | – | ||||||||||||
| Software and Services | 5,292 | 5,097 | 157 | 38 | ||||||||||||
| Technology Hardware and Equipment | 2,572 | 2,089 | 483 | – | ||||||||||||
| Telecommunication Services | 2,270 | 1,278 | 992 | – | ||||||||||||
| Transportation | 2,499 | 2,034 | 433 | 32 | ||||||||||||
| Utilities | 2,976 | 1,717 | 1,259 | – | ||||||||||||
| Total | 71,288 | 49,296 | 21,922 | 70 | ||||||||||||
| Exchange Traded Funds | 74 | 74 | – | – | ||||||||||||
| Preferred Stocks | 320 | – | 239 | 81 | ||||||||||||
| Warrants | 2 | 2 | – | – | ||||||||||||
| Short-Term Investments | 1,172 | – | 1,172 | – | ||||||||||||
| Total | $ | 72,856 | $ | 49,372 | $ | 23,333 | $ | 151 | ||||||||
| Foreign Currency Contracts* | 43 | – | 43 | – | ||||||||||||
| Total | $ | 43 | $ | – | $ | 43 | $ | – | ||||||||
| Liabilities: | ||||||||||||||||
| Foreign Currency Contracts* | 9 | – | 9 | – | ||||||||||||
| Total | $ | 9 | $ | – | $ | 9 | $ | – | ||||||||
| ♦ | For the six-month period ended June 30, 2013, investments valued at $1,216 were transferred from Level 1 to Level 2, and investments valued at $49 were transferred from Level 2 to Level 1. Investments are transferred between Level 1 and Level 2 for a variety of reasons including, but not limited to: |
| 1) | Foreign equities for which a fair value price is more representative of exit value than the local market close (transfer into Level 2). Foreign equities for which the local market close is more representative of exit value (transfer into Level 1). | |
| 2) | U.S. Treasury securities that no longer represent the most recent issue (transfer into Level 2). | |
| 3) | Equity investments with no observable trading but a bid or close price is used (transfer into Level 2). Equity investments using observable quoted prices in an active market (transfer into Level 1). |
| * | Derivative instruments not reflected in the Schedule of Investments are valued at the unrealized appreciation/depreciation on the investments. |
The accompanying notes are an integral part of these financial statements.
| 13 |
Hartford Global Research HLS Fund
Investment Valuation Hierarchy Level Summary – (continued)
June 30, 2013 (Unaudited)
| (000’s Omitted) |
Following is a reconciliation of Level 3 assets for which significant unobservable inputs were used to determine fair value:
| Balance as of December 31, 2012 | Realized Gain (Loss) | Change in Unrealized Appreciation (Depreciation) | Net Amortization | Purchases | Sales | Transfers Into Level 3 * | Transfers Out of Level 3 * | Balance as of June 30, 2013 | ||||||||||||||||||||||||||||
| Assets: | ||||||||||||||||||||||||||||||||||||
| Common Stocks | $ | 37 | $ | — | $ | 2 | † | $ | — | $ | 33 | $ | (1 | ) | $ | — | $ | (1 | ) | $ | 70 | |||||||||||||||
| Preferred Stocks | 64 | — | 17 | ‡ | — | — | — | — | — | 81 | ||||||||||||||||||||||||||
| Total | $ | 101 | $ | — | $ | 19 | $ | — | $ | 33 | $ | (1 | ) | $ | — | $ | (1 | ) | $ | 151 | ||||||||||||||||
| * | Investments are transferred into and out of Level 3 for a variety of reasons including, but not limited to: |
| 1) | Investments where trading has been halted (transfer into Level 3) or investments where trading has resumed (transfer out of Level 3). | |
| 2) | Broker quoted investments (transfer into Level 3) or quoted prices in active markets (transfer out of Level 3). | |
| 3) | Investments that have certain restrictions on trading (transfer into Level 3) or investments where trading restrictions have expired (transfer out of Level 3). |
| † | Change in unrealized appreciation (depreciation) in the current period relating to assets still held at June 30, 2013 was $3. |
| ‡ | Change in unrealized appreciation (depreciation) in the current period relating to assets still held at June 30, 2013 was $17. |
The accompanying notes are an integral part of these financial statements.
| 14 |
Hartford Global Research HLS Fund
Statement of Assets and Liabilities
June 30, 2013 (Unaudited)
| (000’s Omitted) |
| Assets: | ||||
| Investments in securities, at market value (cost $66,179) | $ | 72,856 | ||
| Foreign currency on deposit with custodian (cost $10) | 10 | |||
| Unrealized appreciation on foreign currency contracts | 43 | |||
| Receivables: | ||||
| Investment securities sold | 15,280 | |||
| Fund shares sold | 65 | |||
| Dividends and interest | 161 | |||
| Total assets | 88,415 | |||
| Liabilities: | ||||
| Unrealized depreciation on foreign currency contracts | 9 | |||
| Bank overdraft | 7 | |||
| Payables: | ||||
| Investment securities purchased | 14,225 | |||
| Fund shares redeemed | 327 | |||
| Investment management fees | 11 | |||
| Distribution fees | 1 | |||
| Accrued expenses | 20 | |||
| Total liabilities | 14,600 | |||
| Net assets | $ | 73,815 | ||
| Summary of Net Assets: | ||||
| Capital stock and paid-in-capital | $ | 74,161 | ||
| Undistributed net investment income | 1,612 | |||
| Accumulated net realized loss | (8,666 | ) | ||
| Unrealized appreciation of investments and the translations of assets and liabilities denominated in foreign currency | 6,708 | |||
| Net assets | $ | 73,815 | ||
| Shares authorized | 800,000 | |||
| Par value | $ | 0.001 | ||
| Class IA: Net asset value per share | $ | 11.45 | ||
| Shares outstanding | 4,547 | |||
| Net assets | $ | 52,077 | ||
| Class IB: Net asset value per share | $ | 11.39 | ||
| Shares outstanding | 1,908 | |||
| Net assets | $ | 21,738 |
The accompanying notes are an integral part of these financial statements.
| 15 |
Hartford Global Research HLS Fund
Statement of Operations
For the Six-Month Period Ended June 30, 2013 (Unaudited)
| (000’s Omitted) |
| Investment Income: | ||||
| Dividends | $ | 1,051 | ||
| Interest | 1 | |||
| Less: Foreign tax withheld | (76 | ) | ||
| Total investment income, net | 976 | |||
| Expenses: | ||||
| Investment management fees | 348 | |||
| Distribution fees - Class IB | 29 | |||
| Custodian fees | 4 | |||
| Accounting services fees | 7 | |||
| Board of Directors' fees | 1 | |||
| Audit fees | 9 | |||
| Other expenses | 11 | |||
| Total expenses (before fees paid indirectly) | 409 | |||
| Commission recapture | (1 | ) | ||
| Total fees paid indirectly | (1 | ) | ||
| Total expenses, net | 408 | |||
| Net Investment Income | 568 | |||
| Net Realized Gain on Investments, Other Financial Instruments and Foreign Currency Transactions: | ||||
| Net realized gain on investments | 6,010 | |||
| Net realized gain on futures | 7 | |||
| Net realized gain on foreign currency contracts | 53 | |||
| Net realized gain on other foreign currency transactions | 8 | |||
| Net Realized Gain on Investments, Other Financial Instruments and Foreign Currency Transactions | 6,078 | |||
| Net Changes in Unrealized Depreciation of Investments and Foreign Currency Transactions: | ||||
| Net unrealized depreciation of investments | (262 | ) | ||
| Net unrealized depreciation of foreign currency contracts | (7 | ) | ||
| Net unrealized depreciation on translation of other assets and liabilities in foreign currencies | (4 | ) | ||
| Net Changes in Unrealized Depreciation of Investments and Foreign Currency Transactions | (273 | ) | ||
| Net Gain on Investments, Other Financial Instruments and Foreign Currency Transactions | 5,805 | |||
| Net Increase in Net Assets Resulting from Operations | $ | 6,373 |
The accompanying notes are an integral part of these financial statements.
| 16 |
Hartford Global Research HLS Fund
Statement of Changes in Net Assets
| (000’s Omitted) |
| For the Six-Month Period Ended June 30, 2013 (Unaudited) | For the Year Ended December 31, 2012 | |||||||
| Operations: | ||||||||
| Net investment income | $ | 568 | $ | 980 | ||||
| Net realized gain on investments, other financial instruments and foreign currency transactions | 6,078 | 3,819 | ||||||
| Net unrealized appreciation (depreciation) of investments and foreign currency transactions | (273 | ) | 8,656 | |||||
| Net Increase in Net Assets Resulting from Operations | 6,373 | 13,455 | ||||||
| Distributions to Shareholders: | ||||||||
| From net investment income | ||||||||
| Class IA | — | (627 | ) | |||||
| Class IB | — | (228 | ) | |||||
| Total distributions | — | (855 | ) | |||||
| Capital Share Transactions: | ||||||||
| Class IA | ||||||||
| Sold | 6,335 | 10,859 | ||||||
| Issued on reinvestment of distributions | — | 627 | ||||||
| Redeemed | (11,495 | ) | (20,019 | ) | ||||
| Total capital share transactions | (5,160 | ) | (8,533 | ) | ||||
| Class IB | ||||||||
| Sold | 2,819 | 5,524 | ||||||
| Issued on reinvestment of distributions | — | 228 | ||||||
| Redeemed | (6,111 | ) | (12,440 | ) | ||||
| Total capital share transactions | (3,292 | ) | (6,688 | ) | ||||
| Net decrease from capital share transactions | (8,452 | ) | (15,221 | ) | ||||
| Net Decrease in Net Assets | (2,079 | ) | (2,621 | ) | ||||
| Net Assets: | ||||||||
| Beginning of period | 75,894 | 78,515 | ||||||
| End of period | $ | 73,815 | $ | 75,894 | ||||
| Undistributed (distribution in excess of) net investment income | $ | 1,612 | $ | 1,044 | ||||
| Shares: | ||||||||
| Class IA | ||||||||
| Sold | 557 | 1,084 | ||||||
| Issued on reinvestment of distributions | — | 63 | ||||||
| Redeemed | (1,011 | ) | (1,997 | ) | ||||
| Total share activity | (454 | ) | (850 | ) | ||||
| Class IB | ||||||||
| Sold | 249 | 557 | ||||||
| Issued on reinvestment of distributions | — | 23 | ||||||
| Redeemed | (539 | ) | (1,249 | ) | ||||
| Total share activity | (290 | ) | (669 | ) | ||||
The accompanying notes are an integral part of these financial statements.
| 17 |
Hartford Global Research HLS Fund
Notes to Financial Statements
June 30, 2013 (Unaudited)
| (000’s Omitted) |
| 1. | Organization: |
Hartford Global Research HLS Fund (the “Fund”) serves as an underlying investment option for certain variable annuity and variable life insurance separate accounts of Hartford Life Insurance Company (“HLIC”) and its affiliates and certain qualified retirement plans. The Fund may also serve as an underlying investment option for certain variable annuity and variable life separate accounts of other insurance companies. Owners of variable annuity contracts and policyholders of variable life insurance contracts may choose the funds permitted in the variable insurance contract prospectus. In addition, participants in certain qualified retirement plans may choose the Fund if permitted by their plans.
Hartford Series Fund, Inc. (the “Company”) is an open-end registered management investment company comprised of thirty portfolios. Financial statements for the Fund, a series of the Company, are included in this report.
The Company is organized under the laws of the State of Maryland and is registered with the Securities and Exchange Commission (“SEC”) under the Investment Company Act of 1940, as amended (“1940 Act”). The Fund is a diversified open-end management investment company.
The Fund is divided into Class IA and Class IB shares. Each class is offered at the per share net asset value (“NAV”) without a sales charge and is subject to the same expenses, except that the Class IB shares are subject to distribution and service fees charged pursuant to a Distribution Plan adopted in accordance with Rule 12b-1 under the 1940 Act.
| 2. | Significant Accounting Policies: |
The following is a summary of significant accounting policies of the Fund in the preparation of its financial statements, which are in accordance with the United States Generally Accepted Accounting Principles (“U.S. GAAP”). The preparation of financial statements in accordance with U.S. GAAP may require management to make estimates and assumptions that affect the reported amounts of assets and liabilities and disclosure of contingent assets and liabilities at the date of the financial statements and the reported amounts of increases and decreases in net assets from operations during the reporting period. Actual results could differ from those estimates.
| a) | Determination of Net Asset Value – The NAV of each class of the Fund’s shares is determined as of the close of regular trading (normally 4:00 p.m. Eastern Time) (the “NYSE Close”) on each day that the New York Stock Exchange (the “Exchange”) is open (“Valuation Date”). Information that becomes known to the Fund after the NAV has been calculated on a particular day will not generally be used to retroactively adjust the NAV determined earlier that day. |
| b) | Investment Valuation and Fair Value Measurements – For purposes of calculating the NAV, portfolio investments and other assets held by the Fund's portfolio for which market quotes are readily available are valued at market value. Market value is generally determined on the basis of last reported sales prices or official close price. If no sales are reported, market value is based on quotes obtained from a quotation reporting system, established market makers, or independent pricing services. If market prices are not readily available or are deemed unreliable, the Fund will use the fair value of the investment as determined in good faith under policies and procedures established by and under the supervision of the Company’s Board of Directors. Market quotes are considered not readily available where there is an absence of current or reliable market-based data (e.g., trade information or indicative market quotes), including where events occur after the close of the relevant market, but prior to the NYSE Close that materially affect the values of the Fund’s portfolio investments or assets. In addition, market quotes are considered not readily available when, due to extraordinary circumstances, the exchanges or markets on which the investments trade do not open for trading for the entire day and no other market prices are available. In addition, prices of foreign equities that are principally traded on certain foreign markets may be adjusted daily pursuant to a fair value pricing service approved by the Board of Directors in order to reflect an adjustment for the factors occurring after the close of certain foreign markets but before the NYSE Close. Investments that are primarily traded on foreign markets may trade on days that are not business days of the Fund. The value of the foreign investments in which the Fund invests may change on days when a shareholder will not be able to |
| 18 |
purchase or redeem shares of the Fund. Fair value pricing is subjective in nature and the use of fair value pricing by the Fund may cause the NAV of its shares to differ significantly from the NAV that would have been calculated using market prices at the close of the exchange on which a portfolio investment is primarily traded. There can be no assurance that the Fund could obtain the fair market value assigned to an investment if the Fund were to sell the investment at approximately the time at which the Fund determines its NAV.
Fixed income investments (other than short term obligations) and non-exchange traded derivatives held by the Fund are normally valued on the basis of quotes obtained from brokers and dealers or independent pricing services in accordance with procedures established by the Company’s Board of Directors. Prices obtained from independent pricing services use information provided by market makers or estimates of market values through accepted market modeling and trading and pricing conventions. Inputs to the models may include, but are not limited to, prepayment speeds, pricing spread, yield, trade information, dealer quotes, market color, cash flow models and the bond’s terms and conditions. Generally, the Fund may use fair valuation in regard to fixed income investments when the Fund holds defaulted or distressed investments or investments in a company in which a reorganization is pending. Short-term investments maturing in 60 days or less are generally valued at amortized cost, if their original term to maturity was 60 days or less, or by amortizing their value on the 61st day prior to maturity, if the original term to maturity exceeded 60 days.
Exchange traded options, futures and options on futures are valued at the settlement price determined by the relevant exchange as of the NYSE Close. In the case of OTC options and such instruments that do not trade on an exchange, values may be supplied by a pricing service using a formula or other objective method that may take into consideration the style, direction, expiration, strike price, notional value and volatility or other special adjustments.
Investments valued in currencies other than U.S. dollars are converted to U.S. dollars using exchange rates obtained from independent pricing services for calculation of the NAV. As a result, the NAV of the Fund’s shares may be affected by changes in the value of currencies in relation to the U.S. dollar. The value of investments traded in markets outside the United States or denominated in currencies other than the U.S. dollar may be affected significantly on a day that the NYSE is closed and the market value may change on days when an investor is not able to purchase, redeem or exchange shares of the Fund.
Foreign currency contracts represent agreements to exchange currencies on specific future dates at predetermined rates. Foreign currency contracts are valued using foreign currency exchange rates and forward rates as provided by an independent pricing service on the Valuation Date.
Financial instruments for which prices are not available from an independent pricing service may be valued using market quotations obtained from one or more dealers that make markets in the respective financial instrument in accordance with procedures established by the Company’s Board of Directors.
U.S. GAAP defines fair value as the price that the Fund would receive to sell an asset or pay to transfer a liability in an orderly transaction between market participants. The U.S. GAAP fair value measurement standards require disclosure of a fair value hierarchy for each major category of assets and liabilities. Various inputs are used in determining the fair value of the Fund’s investments. These inputs are summarized into three broad hierarchy levels. This hierarchy is based on whether the valuation inputs are observable or unobservable. These levels are:
| · | Level 1 – Quoted prices in active markets for identical investments. Level 1 may include exchange traded instruments, such as domestic equities, some foreign equities, options, futures, mutual funds, exchange traded funds, rights and warrants. |
| · | Level 2 – Observable inputs other than Level 1 prices, such as quoted prices for similar investments; quoted prices in markets that are not active; or other inputs that are observable or can be corroborated by observable market data. Level 2 may include debt investments that are traded less frequently than exchange traded instruments and which are valued using independent pricing services; foreign equities, which are principally traded on certain foreign markets and are adjusted daily pursuant to a fair value pricing service in order to |
| 19 |
Hartford Global Research HLS Fund
Notes to Financial Statements – (continued)
June 30, 2013 (Unaudited)
| (000’s Omitted) |
reflect an adjustment for the factors occurring after the close of certain foreign markets but before the NYSE Close; and short-term investments, which are valued at amortized cost.
| · | Level 3 – Significant unobservable inputs that are supported by limited or no market activity. Level 3 may include financial instruments whose values are determined using indicative market quotes or require significant management judgment or estimation. These unobservable valuation inputs may include estimates for current yields, maturity/duration, prepayment speed, and indicative market quotes for comparable investments along with other assumptions relating to credit quality, collateral value, complexity of the investment structure, general market conditions and liquidity. This category may include investments where trading has been halted or there are certain restrictions on trading. While these investments are priced using unobservable inputs, the valuation of these investments reflects the best available data and management believes the prices are a reasonable representation of exit price. |
The Board of Directors of the Company generally reviews and approves the “Procedures for Valuation of Portfolio Securities” on an annual basis. These procedures define how investments are to be valued, including the formation and activities of a Valuation Committee. The Valuation Committee is responsible for determining in good faith the fair value of investments when the value cannot be obtained from primary pricing services or alternative sources or if the valuation of an investment as provided by the primary pricing service or alternative source is believed not to reflect the investment’s fair value as of the Valuation Date. Members of the Valuation Committee include the Fund’s Treasurer or designee, a Vice President of the Fund with legal expertise or designee, and a Vice President of the investment manager or designee. In addition, the Fund’s Chief Compliance Officer shall designate a member of the compliance group to attend Valuation Committee meetings as a non-voting resource, to monitor for and provide guidance with respect to compliance with these procedures. Two members of the Valuation Committee or their designees, representing different departments, shall constitute a quorum for purposes of permitting the Valuation Committee to take action. The Valuation Committee will consider all relevant factors in determining an investment’s fair value, and may seek the advice of the Fund’s sub-adviser, knowledgeable brokers, and legal counsel in making such determination. The Valuation Committee reports to the Audit Committee of the Company’s Board of Directors. The Audit Committee receives quarterly written reports which include details of all fair-valued investments, including the reason for the fair valuation, and an indication, when possible, of the accuracy of the valuation by disclosing the next available reliable public price quotation or the disposition price of such investments (the “look-back” test). The Board of Directors then must consider for ratification all of the fair value determinations made during the previous quarter.
Valuation levels are not necessarily indicative of the risk associated with investing in such investments. Individual investments within any of the above mentioned asset classes may be assigned a different hierarchical level than those presented above, as individual circumstances dictate.
For additional information, refer to the Investment Valuation Hierarchy Level Summary and the Level 3 roll-forward reconciliation, if applicable, which follow the Schedule of Investments.
For purposes of reporting transfers between different hierarchy levels, both transfers in and out of each level, as applicable, are shown as if they occurred at the beginning of the period.
| c) | Investment Transactions and Investment Income – Investment transactions are recorded as of the trade date (the date the order to buy or sell is executed) for financial reporting purposes. Investments purchased or sold on a when-issued or delayed-delivery basis may be settled a month or more after the trade date. Realized gains and losses are determined on the basis of identified cost. |
Dividend income from domestic securities is accrued on the ex-dividend date. In general, dividend income from foreign securities is recorded on the ex-date; however, dividend notifications in certain foreign jurisdictions may not be available in a timely manner and as a result, the Fund will record the dividend as soon as the relevant details (i.e., rate per share,
| 20 |
payment date, shareholders of record, etc.) are publicly available. Interest income, including amortization of premium and accretion of discounts, is accrued on a daily basis.
| d) | Foreign Currency Transactions – Assets and liabilities denominated in currencies other than U.S. dollars are translated into U.S. dollars at the exchange rates in effect on the valuation date. Purchases and sales of investments, income, and expenses are translated into U.S. dollars at the exchange rates on the dates of such transactions. |
The Fund does not isolate that portion of portfolio investment valuation resulting from fluctuations in the foreign currency exchange rates from the fluctuations arising from changes in the market prices of investments held. Exchange rate fluctuations are included with the net realized and unrealized gain or loss on investments in the accompanying financial statements.
Net realized foreign exchange gains or losses arise from sales of foreign currencies and the difference between asset and liability amounts initially stated in foreign currencies and the U.S. dollar value of the amounts actually received or paid. Net unrealized foreign exchange gains or losses arise from changes in the value of other assets and liabilities at the end of the reporting period, resulting from changes in the exchange rates.
| e) | Joint Trading Account – The Fund may invest cash balances into a joint trading account that may be invested in one or more repurchase agreements. |
| f) | Fund Share Valuation and Dividend Distributions to Shareholders – Orders for the Fund’s shares are executed in accordance with the investment instructions of the contract holders and plan participants. The NAV of the Fund’s shares is determined as of the close of business on each business day of the Exchange. The NAV is determined separately for each class of shares of the Fund by dividing the Fund’s net assets attributable to that class by the number of shares of the class outstanding. Each class of shares offered by the Fund has equal rights as to assets and voting privileges (except that shareholders of a class have exclusive voting rights regarding any matter relating solely to that class of shares). Income and non-class specific expenses are allocated daily to each class on the basis of the relative net assets of the class. Realized and unrealized capital gains and losses are allocated daily based on the relative net assets of each class of shares of the Fund. |
Orders for the purchase of the Fund’s shares received prior to the close of the Exchange on any day the Exchange is open for business are priced at the NAV determined as of the close of the Exchange. Orders received after the close of the Exchange, or on a day on which the Exchange and/or the Fund is not open for business, are priced at the next determined NAV.
Dividends are declared pursuant to a policy adopted by the Company’s Board of Directors based upon the investment performance of the Fund. The policy of the Fund is to pay dividends from net investment income and realized capital gains, if any, at least once a year.
Distributions from net investment income, net realized capital gains and capital are determined in accordance with federal income tax regulations, which may differ from U.S. GAAP with respect to character and timing. These differences may include but are not limited to losses deferred due to wash sale adjustments, foreign currency gains and losses, adjustments related to Passive Foreign Investment Companies (“PFICs”), Real Estate Investment Trusts (“REITs”), Regulated Investment Companies (“RICs”), certain derivatives and partnerships. Permanent book and federal income tax basis differences relating to shareholder distributions will result in reclassifications to certain of the Fund’s capital accounts (see Federal Income Taxes: Reclassification of Capital Accounts note).
| 3. | Securities and Other Investments: |
| a) | Repurchase Agreements – A repurchase agreement is an agreement by which a counterparty agrees to sell an investment and agrees to repurchase the investment sold from the buyer at a mutually agreed upon time and price. During the period |
| 21 |
Hartford Global Research HLS Fund
Notes to Financial Statements – (continued)
June 30, 2013 (Unaudited)
| (000’s Omitted) |
of the repurchase agreement, the counterparty will deposit cash and or securities in a third party custodial account to serve as collateral. At the time the Fund enters into a repurchase agreement, the value of the underlying collateral, including accrued interest, will be equal to or exceed the value of the repurchase agreement. Repurchase agreements expose the Fund to counterparty risk - that is, the risk that the counterparty will not fulfill its obligations. To minimize counterparty risk, the investments that serve to collateralize the repurchase agreement are held by the Fund’s custodian in book entry or physical form in the custodial account of the Fund or in a third party custodial account. Repurchase agreements are valued at cost plus accrued interest, which approximates fair value. Repurchase agreements have master netting agreements which allow the Fund to offset amounts owed to a counterparty with amounts owed by the counterparty, including any collateral. The Fund, as shown on the Schedule of Investments, had outstanding repurchase agreements as of June 30, 2013.
| b) | Illiquid and Restricted Investments – The Fund is permitted to invest up to 15% of its net assets in illiquid investments. Illiquid investments are those that may not be sold or disposed of in the ordinary course of business within seven days, at approximately the price used to determine the Fund’s NAV. The Fund may not be able to sell illiquid investments when its sub-adviser considers it desirable to do so or may have to sell such investments at a price that is lower than the price that could be obtained if the investments were more liquid. A sale of illiquid investments may require more time and may result in higher dealer discounts and other selling expenses than does the sale of those that are liquid. Illiquid investments also may be more difficult to value due to the unavailability of reliable market quotations for such investments, and an investment in them may have an adverse impact on the Fund’s NAV. The Fund may also purchase certain restricted investments that can only be resold to certain qualified investors and may be determined to be liquid pursuant to policies and guidelines established by the Company’s Board of Directors. The Fund, as shown on the Schedule of Investments, had illiquid and/or restricted investments as of June 30, 2013. |
| c) | Investments Purchased on a When-Issued or Delayed-Delivery Basis – Delivery and payment for investments that have been purchased by the Fund on a forward commitment, or when-issued or delayed-delivery basis, take place beyond the customary settlement period. A fund may dispose of or renegotiate a delayed-delivery transaction after it is entered into, and may sell delayed-delivery investments before they are delivered, which may result in a realized gain or loss. During this period, such investments are subject to market fluctuations, and the Fund identifies investments segregated in its records with a value at least equal to the amount of the commitment. The Fund, as shown on the Schedule of Investments, had when-issued or delayed-delivery investments as of June 30, 2013. |
| 4. | Financial Derivative Instruments: |
The following disclosures contain information on how and why the Fund uses derivative instruments, the credit-risk-related contingent features in certain derivative instruments, and how derivative instruments affect the Fund’s financial position and results of operations. The location and fair value amounts of these instruments on the Statement of Assets and Liabilities and the realized gains and losses and changes in unrealized gains and losses on the Statement of Operations, each categorized by type of derivative contract, are included in the following Additional Derivative Instrument Information footnote. The derivative instruments outstanding as of period-end are disclosed in the notes to or within the Schedule of Investments for purchased options, if applicable. The amounts of realized gains and losses and changes in unrealized gains and losses on derivative instruments during the period are disclosed in the Statement of Operations.
| a) | Foreign Currency Contracts – The Fund may enter into foreign currency contracts that obligate the Fund to purchase or sell currencies at specified future dates. Foreign currency contracts are used to hedge the currency exposure associated with some or all of the Fund’s investments and/or as part of an investment strategy. Foreign currency contracts are marked to market daily and the change in value is recorded by the Fund as an unrealized gain or loss. The Fund will record a realized gain or loss when the foreign currency contract is settled. |
Foreign currency contracts involve elements of market risk in excess of the amounts reflected in the Statement of Assets and Liabilities. In addition, risks may arise upon entering into these contracts from the potential inability of the
| 22 |
counterparties to meet the terms of the contracts and from unanticipated movements in the value of the foreign currencies relative to the U.S. dollar. The Fund had outstanding foreign currency contracts as shown on the Schedule of Investments as of June 30, 2013.
| b) | Futures Contracts – The Fund may enter into futures contracts. A futures contract is an agreement between two parties to buy or sell an asset at a set price on a future date. The Fund uses futures contracts to manage or obtain exposure to the investment markets, commodities, or movements in interest rates and currency values. The primary risks associated with the use of futures contracts are the imperfect correlation between the change in market value of the investments held by the Fund and the prices of futures contracts and the possibility of an illiquid market. Upon entering into a futures contract, the Fund is required to deposit with a futures commission merchant (“FCM”) an amount of cash or U.S. Government or Agency Obligations in accordance with the initial margin requirements of the broker or exchange. Futures contracts are marked to market daily at the most recent settlement price reported by an exchange on which, over time, they are traded most extensively, and an appropriate payable or receivable for the change in value (“variation margin”) is recorded by the Fund. Gains or losses are recognized but not considered realized until the contracts expire or are closed. Futures contracts involve, to varying degrees, risk of loss in excess of the variation margin disclosed on the Statement of Assets and Liabilities; however, the Fund seeks to reduce this risk through the use of an FCM. As of June 30, 2013, the Fund had no outstanding futures contracts. |
| c) | Additional Derivative Instrument Information: |
Fair Value of Derivative Instruments on the Statement of Assets and Liabilities as of June 30, 2013:
| Risk Exposure Category | ||||||||||||||||||||||||||||
| Interest Rate Contracts | Foreign Exchange Contracts | Credit Contracts | Equity Contracts | Commodity Contracts | Other Contracts | Total | ||||||||||||||||||||||
| Assets: | ||||||||||||||||||||||||||||
| Unrealized appreciation on foreign currency contracts | $ | — | $ | 43 | $ | — | $ | — | $ | — | $ | — | $ | 43 | ||||||||||||||
| Total | $ | — | $ | 43 | $ | — | $ | — | $ | — | $ | — | $ | 43 | ||||||||||||||
| Liabilities: | ||||||||||||||||||||||||||||
| Unrealized depreciation on foreign currency contracts | $ | — | $ | 9 | $ | — | $ | — | $ | — | $ | — | $ | 9 | ||||||||||||||
| Total | $ | — | $ | 9 | $ | — | $ | — | $ | — | $ | — | $ | 9 | ||||||||||||||
The ratio of foreign exchange contracts to net assets at June 30, 2013 was 13.43%, compared to the six-month period ended June 30, 2013, average ratio of foreign exchange contracts to net assets of 3.07%. The volume of other derivatives that are presented in the Schedule of Investments is consistent with the derivative activity during the six-month period ended June 30, 2013.
| 23 |
Hartford Global Research HLS Fund
Notes to Financial Statements – (continued)
June 30, 2013 (Unaudited)
| (000’s Omitted) |
The Effect of Derivative Instruments on the Statement of Operations for the six-month period ended June 30, 2013:
| Risk Exposure Category | ||||||||||||||||||||||||||||
| Interest Rate Contracts | Foreign Exchange Contracts | Credit Contracts | Equity Contracts | Commodity Contracts | Other Contracts | Total | ||||||||||||||||||||||
| Realized Gain on Derivatives Recognized as a Result of Operations: | ||||||||||||||||||||||||||||
| Net realized gain on futures | $ | — | $ | — | $ | — | $ | 7 | $ | — | $ | — | $ | 7 | ||||||||||||||
| Net realized gain on foreign currency contracts | — | 53 | — | — | — | — | 53 | |||||||||||||||||||||
| Total | $ | — | $ | 53 | $ | — | $ | 7 | $ | — | $ | — | $ | 60 | ||||||||||||||
| Net Change in Unrealized Appreciation (Depreciation) on Derivatives Recognized as a Result of Operations: | ||||||||||||||||||||||||||||
| Net change in unrealized depreciation of foreign currency contracts | $ | — | $ | (7 | ) | $ | — | $ | — | $ | — | $ | — | $ | (7 | ) | ||||||||||||
| Total | $ | — | $ | (7 | ) | $ | — | $ | — | $ | — | $ | — | $ | (7 | ) | ||||||||||||
| d) | Balance Sheet Offsetting Information: |
Set forth below are tables which disclose both gross information and net information about instruments and transactions eligible for offset in the financial statements, and instruments and transactions that are subject to a master netting agreement, as well as amounts related to margin, reflected as financial collateral (including cash collateral), held at clearing brokers, counterparties, and the Fund’s custodian. The master netting agreements allow the clearing brokers to net any collateral held in or on behalf of the Fund, or liabilities or payment obligations of the clearing brokers to the Fund, against any liabilities or payment obligations of the Fund to the clearing brokers. The Fund is required to deposit financial collateral (including cash collateral) at the Fund’s custodian on behalf of clearing brokers and counterparties to continually meet the original and maintenance requirements established by the clearing brokers and counterparties. Such requirements are specific to the respective clearing broker or counterparty.
Offsetting of Financial Assets and Derivative Assets as of June 30, 2013:
| Description | Gross Amounts of Recognized Assets | Gross Amounts Offset in Statement of Assets and Liabilities | Net Amounts of Assets Presented in Statement of Assets and Liabilities | Financial Instruments with Allowable Netting | Collateral Received | Net Amount (not less than 0) | ||||||||||||||||||
| Repurchase Agreements | $ | 1,172 | $ | — | $ | 1,172 | $ | — | $ | (1,191 | ) | $ | — | |||||||||||
| Unrealized appreciation on foreign currency contracts | 43 | — | 43 | (9 | ) | — | 34 | |||||||||||||||||
| Total subject to a master netting or similar arrangement | $ | 1,215 | $ | — | $ | 1,215 | $ | (9 | ) | $ | (1,191 | ) | $ | 34 | ||||||||||
Offsetting of Financial Liabilities and Derivative Liabilities as of June 30, 2013:
| Description | Gross Amounts of Recognized Liabilities | Gross Amounts Offset in Statement of Assets and Liabilities | Net Amounts of Assets Presented in Statement of Assets and Liabilities | Financial Instruments with Allowable Netting | Collateral Pledged | Net Amount (not less than 0) | ||||||||||||||||||
| Unrealized depreciation on foreign currency contracts | $ | 9 | $ | — | $ | 9 | $ | (9 | ) | $ | — | $ | — | |||||||||||
| Total subject to a master netting or similar arrangement | $ | 9 | $ | — | $ | 9 | $ | (9 | ) | $ | — | $ | — | |||||||||||
| 5. | Principal Risks: |
| a) | Counterparty Risk – The Fund may be exposed to counterparty risk, or the risk that an institution or other entity with which the Fund has unsettled or open transactions will default. |
| 24 |
| b) | Market Risks – If the Fund invests directly in foreign currencies or in securities that trade in, and receive revenues in, foreign currencies, or in derivatives that provide exposure to foreign currencies, it will be subject to the risk that those currencies will decline in value relative to the base currency of the Fund, or, in the case of hedging positions, that the Fund’s base currency will decline in value relative to the currency being hedged. Currency rates in foreign countries may fluctuate significantly over short periods of time for a number of reasons, including changes in interest rates, intervention (or the failure to intervene) by U.S. or foreign governments, central banks or supranational entities, such as the International Monetary Fund, or by the imposition of currency controls or other political developments in the United States or abroad. As a result, the Fund’s investments in foreign currency denominated securities may reduce the returns of the Fund. The market values of equity securities, such as common stocks and preferred stocks, or equity related investments, such as futures and options, may decline due to general market conditions which are not specifically related to a particular company, such as real or perceived adverse economic conditions, changes in the general outlook for corporate earnings, changes in interest or currency rates or adverse investor sentiment generally. The market value of equity securities may also decline due to factors which affect a particular industry or industries, such as labor shortages or increased production costs and competitive conditions within an industry. Equity securities and equity related investments generally have greater market price volatility than fixed income securities. |
| 6. | Federal Income Taxes: |
| a) | Federal Income Taxes – For federal income tax purposes, the Fund intends to continue to qualify as a RIC under Subchapter M of the Internal Revenue Code (“IRC”) by distributing substantially all of its taxable net investment income and net realized capital gains to its shareholders and otherwise complying with the requirements of the IRC. The Fund has distributed substantially all of its income and capital gains in prior years, if applicable, and intends to distribute substantially all of its income and capital gains prior to the next fiscal year-end. Accordingly, no provision for federal income or excise taxes has been made in the accompanying financial statements. Distributions from short-term capital gains are treated as ordinary income distributions for federal income tax purposes. |
| b) | Net Investment Income (Loss), Net Realized Gains (Losses), and Distributions – Net investment income (loss) and net realized gains (losses) may differ for financial statement and tax purposes primarily because of losses deferred due to wash sale adjustments, foreign currency gains and losses, adjustments related to PFICs, REITs, RICs, certain derivatives and partnerships. The character of distributions made during the year from net investment income or net realized gains may differ from their ultimate characterization for federal income tax purposes. Also, due to the timing of dividend distributions, the fiscal year in which amounts are distributed may differ from the year that the income or realized gains (losses) were recorded by the Fund. |
| c) | Distributions and Components of Distributable Earnings – The tax character of distributions paid by the Fund for the periods indicated is as follows (as adjusted for dividends payable, if applicable): |
| For the Year Ended December 31, 2012 | For the Year Ended December 31, 2011 | |||||||
| Ordinary Income | $ | 855 | $ | 13 | ||||
| 25 |
Hartford Global Research HLS Fund
Notes to Financial Statements – (continued)
June 30, 2013 (Unaudited)
| (000’s Omitted) |
As of December 31, 2012, the Fund’s components of distributable earnings (deficit) on a tax basis were as follows:
| Amount | ||||
| Undistributed Ordinary Income | $ | 1,099 | ||
| Accumulated Capital and Other Losses* | (13,597 | ) | ||
| Unrealized Appreciation† | 5,779 | |||
| Total Accumulated Deficit | $ | (6,719 | ) | |
| * | The Fund has capital loss carryforwards that are identified in the Capital Loss Carryforward note that follows. | |
| † | Differences between book-basis and tax-basis unrealized appreciation (depreciation) may be attributable to the losses deferred due to wash sale adjustments, foreign currency gains and losses, adjustments related to PFICs, REITs, RICs, certain derivatives and partnerships. |
| d) | Reclassification of Capital Accounts – The Fund may record reclassifications in its capital accounts. These reclassifications have no impact on the total net assets of the Fund. The reclassifications are a result of permanent differences between U.S. GAAP and tax accounting for such items as foreign currency, PFICs, expiration or utilization of capital loss carryforwards or net operating losses. Adjustments are made to reflect the impact these items have on current and future distributions to shareholders. Therefore, the source of the Fund’s distributions may be shown in the accompanying Statement of Changes in Net Assets as from undistributed net investment income, from accumulated net realized gains on investments or from capital depending on the type of book and tax differences that exist. For the year ended December 31, 2012, the Fund recorded reclassifications to increase (decrease) the accounts listed below: |
| Amount | ||||
| Undistributed Net Investment Income | $ | 91 | ||
| Accumulated Net Realized Gain (Loss) | (91 | ) | ||
| e) | Capital Loss Carryforward – On December 22, 2010, the Regulated Investment Company Modernization Act of 2010 (the “Act”) was enacted, which made changes to the capital loss carryforward rules. The changes are effective for taxable years beginning after the date of enactment. Under the Act, funds are permitted to carry forward capital losses for an unlimited period. However, any losses incurred during those future taxable years will be required to be utilized prior to the losses incurred in pre-enactment taxable years, which carry an expiration date. As a result of this ordering rule, pre-enactment capital loss carryforwards may be more likely to expire unused. Additionally, post-enactment capital loss carryforwards retain their character as either short-term or long-term capital losses rather than being considered all short-term as permitted under prior regulation. |
At December 31, 2012 (tax-year-end), the Fund had capital loss carryforwards for U.S. federal income tax purposes as follows:
| Year of Expiration | Amount | |||
| 2017 | $ | 13,597 | ||
| Total | $ | 13,597 | ||
During the year ended December 31, 2012, the Fund utilized $3,364 of prior year capital loss carryforwards.
| f) | Accounting for Uncertainty in Income Taxes – The Fund has adopted financial reporting rules that require the Fund to analyze all open tax years, as defined by the statute of limitations, for all major jurisdictions. Generally, tax authorities can examine all tax returns filed for the last three years. The Fund does not have an examination in progress. |
The Fund has reviewed all open tax years and major jurisdictions and concluded that these financial reporting rules had no effect on the Fund’s financial position or results of operations. There is no tax liability resulting from unrecognized
| 26 |
tax benefits relating to uncertain income tax positions taken or expected to be taken on the tax return for the fiscal year ended December 31, 2012. The Fund is also not aware of any tax positions for which it is reasonably possible that the total amounts of unrecognized tax benefits will significantly change in the next twelve months.
| 7. | Expenses: |
| a) | Investment Management Agreement – Hartford Funds Management Company, LLC (“HFMC”), an indirect wholly owned subsidiary of The Hartford Financial Services Group, Inc. (“The Hartford”), serves as investment manager to the Fund pursuant to an Investment Management Agreement with the Company. The investment manager has overall investment supervisory responsibility for the Fund. In addition, the investment manager provides administrative personnel, services, equipment, facilities and office space for proper operation of the Fund. The investment manager has contracted with Wellington Management Company, LLP (“Wellington Management”) under a sub-advisory agreement for the provision of day-to-day investment management services to the Fund in accordance with the Fund’s investment objective and policies. The Fund pays a fee to the investment manager, a portion of which may be used to compensate Wellington Management. |
The schedule below reflects the rates of compensation paid to HFMC for investment management services rendered as of June 30, 2013; the rates are accrued daily and paid monthly.
| Average Daily Net Assets | Annual Fee | |||
| On first $500 million | 0.9000% | |||
| On next $500 million | 0.8750% | |||
| On next $4 billion | 0.8500% | |||
| On next $5 billion | 0.8475% | |||
| Over $10 billion | 0.8450% | |||
| b) | Accounting Services Agreement – Pursuant to the Fund Accounting Agreement between HFMC and the Company, on behalf of the Fund, HFMC provides accounting services to the Fund and receives monthly compensation based on the Fund’s average daily net assets at the rates set forth below. The Fund’s accounting services fees are accrued daily and paid monthly. |
| Average Daily Net Assets | Annual Fee | |||
| On first $5 billion | 0.018% | |||
| On next $5 billion | 0.016% | |||
| Over $10 billion | 0.014% | |||
| c) | Operating Expenses – Allocable expenses incurred by the Company are allocated to each Fund and allocated to classes within a Fund in proportion to the average daily net assets of the Fund and each class, except where allocation of certain expenses is more fairly made directly to the Fund or to specific classes within a Fund. |
| d) | Fees Paid Indirectly – The Company, on behalf of the Fund, has entered into agreements with State Street Global Markets, LLC and Russell Implementation Services, Inc. to partially recapture non-discounted trade commissions. Such rebates are used to pay a portion of the Fund’s expenses. In addition, the Fund’s custodian banks have agreed to reduce its fees when the Fund maintains cash on deposit in a non-interest-bearing custody account. For the six-month period ended June 30, 2013, these amounts, if any, are included in the Statement of Operations. |
| 27 |
Hartford Global Research HLS Fund
Notes to Financial Statements – (continued)
June 30, 2013 (Unaudited)
| (000’s Omitted) |
The ratio of expenses to average net assets in the accompanying financial highlights excludes the reduction in expenses related to fees paid indirectly. The annualized expense ratio for the period listed below reflecting the reduction for fees paid indirectly is as follows:
| Annualized Six- Month Period Ended June 30, 2013 | ||||
| Class IA | 0.98 | % | ||
| Class IB | 1.23 | |||
| e) | Distribution Plan for Class IB shares – The Company, on behalf of the Fund, has adopted a Distribution Plan pursuant to Rule 12b-1 of the 1940 Act to compensate the distributor, Hartford Funds Distributors, LLC (“HFD”), (formerly known as Hartford Investment Financial Services, LLC), an indirect wholly owned subsidiary of The Hartford, from assets attributable to the Class IB shares for services rendered and expenses borne in connection with activities primarily intended to result in the sale of the Class IB shares, subject to the review and approval of the Company’s Board of Directors. |
The Distribution Plan provides that the Fund may pay annually up to 0.25% of the average daily net assets of the Fund attributable to its Class IB shares for activities primarily intended to result in the sale of Class IB shares. The Board has the authority to suspend or reduce these payments at any point in time. Under the terms of the Distribution Plan and the principal underwriting agreement, the Fund is authorized to make payments monthly to the distributor that may be used to pay or compensate entities providing distribution and shareholder servicing with respect to the Class IB shares for such entities’ fees or expenses incurred or paid in that regard. These fees are accrued daily and paid monthly.
| f) | Other Related Party Transactions – Certain officers of the Fund are directors and/or officers of the investment manager and/or The Hartford or its subsidiaries. For the six-month period ended June 30, 2013, a portion of the Fund’s Chief Compliance Officer’s salary was paid by all the investment companies in the Hartford fund complex. The portion allocated to the Fund rounds to zero. These fees are accrued daily and paid monthly. |
| g) | Payments from Affiliates – In July of 2007, The Hartford entered into a settlement with the Attorneys General of the states of New York, Connecticut and Illinois relating to market timing and the company's individual variable annuity contracts in which certain payments would be made directly to the variable annuity contract holders. The distribution plan provided that unclaimed money from the settlement would be distributed to certain HLS Funds that are investment options through a Hartford individual variable annuity contract. The unclaimed money was distributed to the Fund on September 18, 2009. |
The total return in the accompanying financial highlights includes payments from an affiliate. Had the payments from the affiliate been excluded, the impact and total return for the periods listed below would have been as follows:
| For the Year Ended December 31, 2009 | ||||||||
| Class IA | Class IB | |||||||
| Impact from Payment from Affiliate for Attorneys General Settlement | 0.02 | % | 0.02 | % | ||||
| Total Return Excluding Payment from Affiliate | 42.10 | % | 41.76 | % | ||||
| 28 |
| 8. | Investment Transactions: |
For the six-month period ended June 30, 2013, the Fund's aggregate purchases and sales of investment securities (excluding short-term investments) were as follows:
| Amount | ||||
| Cost of Purchases Excluding U.S. Government Obligations | $ | 43,782 | ||
| Sales Proceeds Excluding U.S. Government Obligations | 53,522 | |||
| 9. | Line of Credit: |
The Fund is one of several Hartford funds that participate in a $500 million committed revolving line of credit facility. The facility is to be used for temporary or emergency purposes. Under the arrangement, the funds are required to own securities having a market value in excess of 300% of the total bank borrowings. The interest rate on borrowings varies depending on the nature of the loan. The facility also requires a fee to be paid based on the amount of the commitment. This commitment fee is allocated to all of the funds participating in the line of credit based on the average net assets of the funds. During the six-month period ended June 30, 2013, the Fund did not have any borrowings under this facility.
| 10. | Industry Classifications: |
Other than the industry classifications “Other Investment Pools and Funds” and “Exchange Traded Funds,” equity industry classifications used in this report are the Global Industry Classification Standard, which was developed by and is the exclusive property and service mark of MSCI, Inc. and Standard & Poor’s.
| 11. | Indemnifications: |
Under the Company’s organizational documents, the Company shall indemnify its officers and directors to the full extent required or permitted under Maryland General Corporation Law and the federal securities laws. In addition, the Company, on behalf of the Fund, may enter into contracts that contain a variety of indemnifications. The Company’s maximum exposure under these arrangements is unknown. However, as of the date of these financial statements, the Company has not had prior claims or losses pursuant to these contracts and expects the risk of loss to be remote.
| 12. | Pending Legal Proceedings: |
On February 25, 2011, Jennifer L. Kasilag, Louis Mellinger, Judith M. Menendez, Jacqueline M. Robinson, and Linda A. Russell filed a derivative lawsuit against Hartford Investment Financial Services, LLC (“HIFSCO”)(now known as Hartford Funds Distributors, LLC) on behalf of six Hartford retail mutual funds in the United States District Court for the District of New Jersey, alleging that HIFSCO received excessive advisory and distribution fees in violation of its statutory fiduciary duty under Section 36(b) of the 1940 Act when serving as investment manager and principal underwriter, respectively, to the Hartford retail mutual funds. HIFSCO moved to dismiss and, in September 2011, the motion was granted in part and denied in part, with leave to amend the complaint. In November 2011, plaintiffs filed an amended complaint on behalf of certain Hartford retail mutual funds, The Hartford Global Health Fund (now known as The Hartford Healthcare Fund), The Hartford Conservative Allocation Fund, The Hartford Growth Opportunities Fund, The Hartford Inflation Plus Fund, The Hartford Advisers Fund (now known as The Hartford Balanced Fund), and The Hartford Capital Appreciation Fund. Plaintiffs seek to rescind the investment management agreements and distribution plans between HIFSCO and these funds and to recover the total fees charged thereunder or, in the alternative, to recover any improper compensation HIFSCO received, in addition to lost earnings. HIFSCO filed a partial motion to dismiss the amended complaint and, in December 2012, the court dismissed without prejudice the claims regarding distribution fees and denied the motion with respect to the advisory fees claims. HIFSCO disputes the allegations and intends to defend vigorously.
This action concerns the activities of HIFSCO in its capacity as investment manager and principal underwriter to the Hartford retail mutual funds and does not concern HIFSCO’s activities in its capacity as principal underwriter to the HLS funds. For this reason, no accrual for litigation relating to this matter has been recorded in the financial statements of the Fund.
| 29 |
Hartford Global Research HLS Fund
Financial Highlights
| - Selected Per-Share Data (A) - |
| Class | Net Asset Value at Beginning of Period | Net Investment Income (Loss) | Net Realized and Unrealized Gain (Loss) on Investments | Total from Investment Operations | Dividends from Net Investment Income | Distributions from Realized Capital Gains | Distributions from Capital | Total Distributions | Net Asset Value at End of Period | |||||||||||||||||||||||||||
| For the Six-Month Period Ended June 30, 2013 (Unaudited) | ||||||||||||||||||||||||||||||||||||
| IA | $ | 10.56 | $ | 0.11 | $ | 0.78 | $ | 0.89 | $ | – | $ | – | $ | – | $ | – | $ | 11.45 | ||||||||||||||||||
| IB | 10.52 | 0.10 | 0.77 | 0.87 | – | – | – | – | 11.39 | |||||||||||||||||||||||||||
| For the Year Ended December 31, 2012 | ||||||||||||||||||||||||||||||||||||
| IA | 9.02 | 0.15 | 1.51 | 1.66 | (0.12 | ) | – | – | (0.12 | ) | 10.56 | |||||||||||||||||||||||||
| IB | 8.98 | 0.13 | 1.50 | 1.63 | (0.09 | ) | – | – | (0.09 | ) | 10.52 | |||||||||||||||||||||||||
| For the Year Ended December 31, 2011 | ||||||||||||||||||||||||||||||||||||
| IA | 9.94 | 0.11 | (1.03 | ) | (0.92 | ) | – | – | – | – | 9.02 | |||||||||||||||||||||||||
| IB | 9.93 | 0.09 | (1.04 | ) | (0.95 | ) | – | – | – | – | 8.98 | |||||||||||||||||||||||||
| For the Year Ended December 31, 2010 | ||||||||||||||||||||||||||||||||||||
| IA | 8.67 | 0.10 | 1.28 | 1.38 | (0.11 | ) | – | – | (0.11 | ) | 9.94 | |||||||||||||||||||||||||
| IB | 8.66 | 0.08 | 1.28 | 1.36 | (0.09 | ) | – | – | (0.09 | ) | 9.93 | |||||||||||||||||||||||||
| For the Year Ended December 31, 2009 | ||||||||||||||||||||||||||||||||||||
| IA | 6.16 | 0.08 | 2.51 | 2.59 | (0.08 | ) | – | – | (0.08 | ) | 8.67 | |||||||||||||||||||||||||
| IB | 6.15 | 0.07 | 2.50 | 2.57 | (0.06 | ) | – | – | (0.06 | ) | 8.66 | |||||||||||||||||||||||||
| From January 31, 2008 (commencement of operations) through December 31, 2008 | ||||||||||||||||||||||||||||||||||||
| IA(H) | 10.00 | – | (3.78 | ) | (3.78 | ) | (0.05 | ) | – | (0.01 | ) | (0.06 | ) | 6.16 | ||||||||||||||||||||||
| IB(H) | 10.00 | (0.08 | ) | (3.72 | ) | (3.80 | ) | (0.04 | ) | – | (0.01 | ) | (0.05 | ) | 6.15 | |||||||||||||||||||||
| (A) | Information presented relates to a share outstanding throughout the indicated period. |
| (B) | The figures do not include sales charges or other fees which may be applied at the variable life insurance, variable annuity or qualified retirement plan product level. Any such additional sales charges or other fees would lower the Fund's performance. |
| (C) | Ratios do not reflect reductions for fees paid indirectly. Please see Fees Paid Indirectly in the Notes to Financial Statements. |
| (D) | Portfolio turnover rate is calculated on the basis of the Fund as a whole without distinguishing between the classes of shares issued. |
| (E) | Not annualized. |
| (F) | Annualized. |
| (G) | Total return without the inclusion of the Payment from (to) Affiliate can be found in Expenses in the accompanying Notes to Financial Statements. |
| (H) | Commenced operations on January 31, 2008. |
| (I) | During the year ended December 31, 2008, the Fund incurred $95.4 million in sales associated with the transition of assets from Hartford Global Communications HLS Fund, Hartford Global Financial Services HLS Fund and Hartford Global Technology HLS Fund, which merged into the Fund on August 22, 2008. These sales were excluded from the portfolio turnover rate calculation. |
| 30 |
| - Ratios and Supplemental Data - |
| Total Return(B) | Net Assets at End of Period | Ratio of Expenses to Average Net Assets Before Waivers(C) | Ratio of Expenses to Average Net Assets After Waivers(C) | Ratio of Net Investment Income (Loss) to Average Net Assets | Portfolio Turnover Rate(D) | |||||||||||||||||
| 8.50 | %(E) | $ | 52,077 | 0.98 | %(F) | 0.98 | %(F) | 1.55 | %(F) | 57 | % | |||||||||||
| 8.34 | (E) | 21,738 | 1.23 | (F) | 1.23 | (F) | 1.29 | (F) | – | |||||||||||||
| 18.39 | 52,785 | 1.04 | 1.04 | 1.28 | 85 | |||||||||||||||||
| 18.10 | 23,109 | 1.29 | 1.29 | 1.03 | – | |||||||||||||||||
| (9.28 | ) | 52,768 | 1.03 | 1.03 | 1.01 | 86 | ||||||||||||||||
| (9.51 | ) | 25,747 | 1.28 | 1.28 | 0.76 | – | ||||||||||||||||
| 16.01 | 69,740 | 1.01 | 0.98 | 1.03 | 92 | |||||||||||||||||
| 15.72 | 35,774 | 1.26 | 1.23 | 0.78 | – | |||||||||||||||||
| 42.13 | (G) | 67,012 | 1.16 | 1.06 | 1.17 | 124 | ||||||||||||||||
| 41.79 | (G) | 37,695 | 1.41 | 1.31 | 0.93 | – | ||||||||||||||||
| (37.87 | )(E) | 48,627 | 1.02 | (F) | 0.94 | (F) | 1.29 | (F) | 335 | (I) | ||||||||||||
| (38.01 | )(E) | 31,008 | 1.27 | (F) | 1.19 | (F) | 0.99 | (F) | – | |||||||||||||
| 31 |
Hartford Global Research HLS Fund
| Directors and Officers (Unaudited) |
The Board of Directors of the Company appoints officers who are responsible for the day-to-day operations of the Fund and who execute policies formulated by the Directors. Each director serves until his or her death, resignation, or retirement or until the next annual meeting of shareholders is held or until his or her successor is elected and qualifies.
Directors and officers who are employed by or who have a financial interest in The Hartford are considered “interested” persons of the Fund pursuant to the 1940 Act. Each officer and two of the Company’s directors, as noted in the chart below, are “interested” persons of the Fund. Each director serves as a director for The Hartford Mutual Funds, Inc., The Hartford Mutual Funds II, Inc., Hartford Series Fund, Inc., Hartford HLS Series Fund II, Inc., and as a trustee for The Hartford Alternative Strategies Fund, which, as of June 30, 2013, collectively consist of 90 funds. Correspondence may be sent to directors and officers c/o Hartford Mutual Funds, P.O. Box 2999, Hartford, Connecticut 06104-2999, except that correspondence to Mr. Annoni, Mr. Dressen, Ms. Fagely and Ms. Quade may be sent to 500 Bielenberg Drive, Woodbury, Minnesota 55125 and correspondence to Mr. Davey and Mr. Melcher may be sent to 5 Radnor Corporate Center, Suite 300, 100 Matsonford Road, Radnor, Pennsylvania 19087.
The table below sets forth, for each director and officer, his or her name, year of birth, current position with the Company and date first elected or appointed to Hartford Series Fund, Inc. (“HSF”), and Hartford HLS Series Fund II, Inc. (“HSF2”), principal occupation, and, for directors, other directorships held. The Fund’s statement of additional information contains further information on the directors and is available free of charge by calling 1-800-862-6668 or writing to Hartford HLS Funds, c/o Hartford Life Insurance Company, Hartford Life and Annuity Insurance Company, P.O. Box 14293, Lexington, KY 40512-4293.
Information on the aggregate remuneration paid to the directors of the Company can be found in the Statement of Operations herein. The Fund pays to The Hartford a portion of the Chief Compliance Officer’s compensation, but does not pay salaries or compensation to any of their other officers or directors who are employed by The Hartford.
Non-Interested Directors
Lynn S. Birdsong (1946) Director since 2003, Co-Chairman of the Investment Committee
Mr. Birdsong is a private investor. Mr. Birdsong currently serves as a Director of the Sovereign High Yield Investment Company (April 2010 to current). Mr. Birdsong currently serves as an Independent Director of Nomura Partners Funds, Inc. (formerly, The Japan Fund) (March 2003 to current). From 1979 to 2002, Mr. Birdsong was a managing director of Zurich Scudder Investments, an investment management firm. During his employment with Scudder, Mr. Birdsong was an Interested Director of The Japan Fund. Since 1981, Mr. Birdsong has been a partner in Birdsong Company, an advertising specialty firm.
Robert M. Gavin, Jr. (1940) Director since 2002 (HSF) and 1986 (HSF2), Chairman of the Board since 2004
Dr. Gavin is an educational consultant. Prior to September 1, 2001, he was President of Cranbrook Education Community and prior to July 1996, he was President of Macalester College, St. Paul, Minnesota.
Duane E. Hill (1945) Director since 2001 (HSF) and 2002 (HSF2), Chairman of the Nominating Committee
Mr. Hill is Partner of TSG Ventures L.P., a private equity investment company. Mr. Hill is a former partner of TSG Capital Group, a private equity investment firm that served as sponsor and lead investor in leveraged buyouts of middle market companies.
Sandra S. Jaffee (1941) Director since 2005
Ms. Jaffee is the founder and Chief Executive Officer of a private company, Homeworks Concierge, LLC, which provides residential property management services in Westchester County, New York (January 2012 to present). Ms. Jaffee served as Chairman (2008 to 2009) and Chief Executive Officer of Fortent (formerly Searchspace Group), a leading provider of compliance/regulatory technology to financial institutions from August 2005 to August 2009. Ms. Jaffee currently serves as a member of the Board of Directors of Broadridge Financial Solutions as well as a Trustee of Muhlenberg College.
William P. Johnston (1944) Director since 2005, Chairman of the Compliance Committee
In February 2008, Mr. Johnston was elected to the Board of Directors of HCR-ManorCare, Inc. In August 2007, Mr. Johnston was elected to the Board of Directors of LifeCare Holdings, Inc. In July 2006, Mr. Johnston was elected to the Board of Directors of MultiPlan, Inc. and served as a director (July 2006 to August 2010). In June 2006, Mr. Johnston was appointed as Senior Advisor to The Carlyle Group, a global private equity and alternative asset investment firm. In May 2006, Mr. Johnston was elected to the Supervisory Board of Fresenius Medical Care AG & Co. KGaA, after its acquisition of Renal Care Group, Inc. in March 2006.
| 32 |
Phillip O. Peterson (1944) Director since 2002 (HSF) and 2000 (HSF2), Chairman of the Audit Committee
Mr. Peterson is a mutual fund industry consultant. He was a partner of KPMG LLP (an accounting firm) until July 1999. Mr. Peterson joined William Blair Funds in February 2007 as a member of the Board of Trustees. Mr. Peterson also joined the Board of Trustees of Symetra Variable Mutual Funds Trust as a trustee in February 2012.
Lemma W. Senbet (1946) Director since 2005
Dr. Senbet is the William E. Mayer Chair Professor of Finance and Director, Center for Financial Policy, at the University of Maryland, Robert H. Smith School of Business. He was chair of the Finance Department from 1998 to 2006. Previously he was a chaired professor of finance at the University of Wisconsin-Madison. Also, he was director of the Fortis Funds from March 2000 to July 2002. Dr. Senbet served the finance profession in various capacities, including as director of the American Finance Association and President of the Western Finance Association. In 2006, Dr. Senbet was inducted Fellow of Financial Management Association International for his career-long distinguished scholarship and professional service.
Interested Directors and Officers
James E. Davey (1964) Director since 2012, President and Chief Executive Officer since 2010
Mr. Davey serves as Executive Vice President of Hartford Life Insurance Company (“HLIC”) and The Hartford Financial Services Group, Inc. Additionally, Mr. Davey serves as Chairman of the Board and Manager of Hartford Funds Distributors, LLC (“HFD”) and Hartford Administrative Services Company (“HASCO”). Mr. Davey also serves as Manager, President and Chairman of the Board for Hartford Funds Management Company, LLC (“HFMC”). Mr. Davey joined The Hartford in 2002.
Lowndes A. Smith (1939) Director since 1996 (HSF) and 2002 (HSF2), Co-Chairman of the Investment Committee
Mr. Smith served as Vice Chairman of The Hartford from February 1997 to January 2002, as President and Chief Executive Officer of Hartford Life, Inc. from February 1997 to January 2002, and as President and Chief Operating Officer of The Hartford Life Insurance Companies from January 1989 to January 2002. Mr. Smith serves as a Director of White Mountains Insurance Group, Ltd., One Beacon Insurance and Symetra Financial and as Managing Director of Whittington Gray Associates.
Other Officers
Mark A. Annoni (1964) Vice President, Controller and Treasurer since 2012
Mr. Annoni serves as the Assistant Vice President of HLIC (February 2004 to present). Mr. Annoni joined The Hartford in April 2001 as part of The Hartford’s acquisition of Fortis Financial Group (“Fortis”). Prior to joining The Hartford, Mr. Annoni served as Manager of Mutual Fund Accounting at Fortis (July 1997 to April 2001).
Michael R. Dressen (1963) AML Compliance Officer since 2011
Mr. Dressen currently serves as Assistant Vice President of HLIC. He also serves as Chief Compliance Officer and AML Compliance Officer of HASCO and as AML Officer of HFD. Mr. Dressen joined The Hartford in 2005 from State Farm Insurance Companies where he held various positions related to mutual funds, variable products, and property casualty insurance.
Tamara L. Fagely (1958) Vice President since 2002 (HSF) and 1993 (HSF2)
Currently, Ms. Fagely is President and a Director of HASCO, Chief Administrative Officer and Manager of HFMC and a Vice President of HLIC. Ms. Fagely served as a Vice President of HASCO (1998-2013) and Chief Financial Officer of HASCO (2006-2013). She served as Assistant Vice President of HLIC from December 2001 through March 2005. In addition, Ms. Fagely is Manager and Chief Operating Officer of HFD.
Edward P. Macdonald (1967) Vice President, Secretary and Chief Legal Officer since 2005
Mr. Macdonald serves as Vice President of HLIC and Vice President, Chief Legal Officer and Secretary of HFD and HASCO. Mr. Macdonald also serves as Manager, Vice President, Chief Legal Officer and Secretary of HFMC. Mr. Macdonald joined The Hartford in 2005.
Joseph G. Melcher (1973) Vice President and Chief Compliance Officer since 2013(1)
Mr. Melcher currently serves as Vice President of HFMC and HFD. Mr. Melcher joined The Hartford in 2012 from Touchstone Investments, a member of the Western & Southern Financial Group, where he held the position of Vice President and Chief Compliance Officer from 2010 through 2012 and Assistant Vice President, Compliance from 2005 to 2010.
| (1) | Mr. Melcher was named Vice President and Chief Compliance Officer of HSF and HSF2 on February 6, 2013. Prior to February 6, 2013, Colleen Pernerewski served as Chief Compliance Officer of HSF and HSF2. |
| 33 |
Hartford Global Research HLS Fund
| Directors and Officers (Unaudited) – (continued) |
Vernon J. Meyer (1964) Vice President since 2006
Mr. Meyer serves as Senior Vice President of HLIC. He also serves as Senior Vice President of HFMC and HFD. Mr. Meyer joined The Hartford in 2004.
Laura S. Quade (1969) Vice President since 2012
Ms. Quade currently serves as Vice President of HASCO and is a Director of Mutual Fund Service Operations. She also serves as Director, Enterprise Operations of HFD and HLIC. Ms. Quade joined The Hartford in 2001 as part of The Hartford’s acquisition of Fortis.
Elizabeth L. Schroeder (1966) Vice President since 2010(2)
Ms. Schroeder currently serves as Assistant Vice President of HLIC. Ms. Schroeder joined HLIC in 1991. She is also an Assistant Vice President of HFMC and HASCO.
(2) Ms. Schroeder served as Vice President of HSF and HSF2 until August 7, 2013.
Martin Swanson (1962) Vice President since 2010
Mr. Swanson is a Vice President of HLIC. Mr. Swanson also serves as Chief Marketing Officer for HFD. Prior to joining HLIC in 1998, Mr. Swanson was a Vice President at PaineWebber, Inc.
HOW TO OBTAIN A COPY OF THE FUND’S PROXY VOTING POLICIES AND VOTING RECORDS (UNAUDITED)
A description of the policies and procedures that the Fund uses to determine how to vote proxies relating to portfolio securities and information about how the Fund voted proxies relating to portfolio securities during the most recent twelve-month period ended June 30 are available (1) without charge, upon request, by calling 800-862-6668 and (2) on the SEC’s website at http://www.sec.gov.
QUARTERLY PORTFOLIO HOLDINGS INFORMATION (UNAUDITED)
The Fund files a complete schedule of portfolio holdings with the SEC for the first and third quarters of each fiscal year on Form N-Q. The Fund’s Forms are available (1) without charge, upon request, by calling 800-862-6668 and (2) on the SEC’s website at http://www.sec.gov. The Form N-Q may be reviewed and copied at the SEC’s Public Reference Room in Washington, DC. Information on the operation of the Public Reference Room may be obtained by calling 1-800-SEC-0330.
| 34 |
Hartford Global Research HLS Fund
| Expense Example (Unaudited) |
Your Fund's Expenses
As a shareholder of the Fund, you incur two types of costs: (1) transaction costs and (2) ongoing costs including investment management fees, distribution fees, if any, and other fund expenses. This example is intended to help you understand your ongoing costs (in dollars) of investing in a Fund and to compare these costs with the ongoing costs of investing in other mutual funds. The example is based on an investment of $1,000 invested at the beginning of the period and held for the period of December 31, 2012 through June 30, 2013.
Actual Expenses
The first set of columns of the table below provides information about actual account values and actual expenses. You may use the information in this column, together with the amount you invested, to estimate the expenses that you paid over the period. Simply divide your account value by $1,000 (for example, an $8,600 account value divided by $1,000 = 8.6), then multiply the result by the number in the line under the heading entitled “Expenses Paid During Period” to estimate the expenses you paid on your account during this period.
Hypothetical Example for Comparison Purposes
The second set of columns of the table below provides information about hypothetical account values and hypothetical expenses based on a Fund’s actual expense ratio and an assumed rate of return of 5% per year before expenses, which is not the Fund’s actual return. The hypothetical account values and expenses may not be used to estimate the actual ending account balance or expenses you paid for the period. You may use this information to compare the ongoing costs of investing in a Fund and other funds. To do so, compare this 5% hypothetical example with the 5% hypothetical examples that appear in the shareholder reports of the other funds.
Please note that the expenses shown in the table are meant to highlight your ongoing costs only and do not reflect any transactional costs, such as sales charges (loads) and CDSC. Therefore, the second set of columns of the table is useful in comparing ongoing costs only, and will not help you determine the relative total costs of owning different funds. In addition, if these transactional costs were included, your costs would be higher. Expenses are equal to the Fund's annualized expense ratios multiplied by average account value over the period, multiplied by 181/365 (to reflect the one-half year period).
| Actual return | Hypothetical (5% return before expenses) | |||||||||||||||||||||||||||||||
| Beginning Account Value December 31, 2012 | Ending Account Value June 30, 2013 | Expenses paid during the period December 31, 2012 through June 30, 2013 | Beginning Account Value December 31, 2012 | Ending Account Value June 30, 2013 | Expenses paid during the period December 31, 2012 through June 30, 2013 | Annualized expense ratio | Days in the current 1/2 year | Days in the full year | ||||||||||||||||||||||||
| Class IA | $ | 1,000.00 | $ | 1,085.00 | $ | 5.07 | $ | 1,000.00 | $ | 1,019.93 | $ | 4.91 | 0.98 | % | 181 | 365 | ||||||||||||||||
| Class IB | $ | 1,000.00 | $ | 1,083.40 | $ | 6.35 | $ | 1,000.00 | $ | 1,018.70 | $ | 6.16 | 1.23 | % | 181 | 365 | ||||||||||||||||
| 35 |
Hartford Global Research HLS Fund
| Principal Risks (Unaudited) |
The principal risks of investing in the Fund are described below.
Market, Selection, and Strategy Risk: The Fund’s share price may fluctuate due to market risk and/or security selections that may underperform the market or relevant benchmarks. If the sub-adviser’s investment strategy does not perform as expected, the Fund could underperform its peers or lose money. There is no guarantee the Fund will achieve its stated objective.
Foreign Investment and Emerging Markets Risk: Foreign investments can be riskier than U.S. investments. Potential risks include currency risk that may result from unfavorable exchange rates, liquidity risk if decreased demand for a security makes it difficult to sell at the desired price, and risks that stem from substantially lower trading volume on foreign markets. These risks are generally greater for investments in emerging markets, which are also subject to greater price volatility, and custodial and regulatory risks.
Small/Mid-cap Stock Risk: Small- and mid-cap stocks are generally more volatile and risky and may be less liquid than large-cap stocks because they may have limited operating histories, narrow product lines, and focus on niche markets.
Active Trading Risk: Actively trading investments may result in higher costs (thus affecting performance).
| 36 |
HARTFORD HLS FUNDS
c/o The Hartford Wealth Management - Global Annuities
P.O. Box 14293
Lexington, KY 40512-4293
HARTFORDFUNDS
hartfordfunds.com
Hartford Series Fund, Inc. is underwritten and distributed by Hartford Funds Distributors, LLC.
Hartford Series Fund, Inc. inception dates range from 1977 to date. Hartford Series Fund, Inc. is not a subsidiary of The Hartford Financial Services Group, Inc. ("The Hartford") but is underwritten, distributed by and advised by subsidiaries of The Hartford. Investments in Hartford Series Fund, Inc. are not guaranteed by The Hartford or any other entity.
You should carefully consider investment objectives, risks, and charges and expenses of Hartford HLS Funds before investing. This and other information can be found in the Fund’s prospectus or summary prospectus, which can be obtained by calling 800-862-6668. Please read them carefully before you invest or send money.
HLSSAR-GR13 8-13 113540-1 Printed in U.S.A ©2013 The Hartford, Hartford, CT 06115
HARTFORDFUNDS
| HARTFORD GROWTH HLS FUND
2013 Semi Annual Report
|
A MESSAGE FROM THE PRESIDENT
Dear Fellow Shareholders:
I want to take this opportunity to say thank you for investing in the Hartford HLS Funds.
Market Review
During the first half of the year, stocks rose steadily. U.S. equities (as represented by the S&P 500 Index1) posted a strong gain of 10.61% during the first quarter, on their way to an all-time high. During the second quarter, investors persevered through volatility surrounding rumors of the rollback of the U.S. Federal Reserve’s quantitative easing (QE) program later this year, and the S&P 500 Index rose 2.91%. That brought the market’s rise to 13.82% for the first half of 2013. The rumors about QE’s end sent bond yields and mortgage rates upward, but that wasn’t enough to dissuade investors from pushing equities into positive territory.
Because of QE, some have expressed concerns regarding the recent market rally. But a more careful examination of economic data reveals a strong foundation. Consumer balance sheets have improved since the financial crisis, with consumer debt as a percentage of income falling steadily. Housing continued its dogged recovery, fueled by population growth and pent-up demand. In fact, it’s substantive economic improvements that have moved Federal Reserve Chairman Ben Bernanke to consider removing the “training wheels” of QE, which we think should be viewed as a vote of confidence in the U.S. economy going forward.
As the U.S. outlook continues to improve, concerns do remain in the global economy. Emerging markets have lagged due to social unrest and rising inflation. Slowing growth in China is clouding global growth forecasts, but it’s important to remember that China still boasts 7.5% annual GDP growth.
It’s important to stay abreast of domestic and international economic developments while balancing your individual investment goals. Meeting with your financial advisor on a regular basis to examine your current investment strategy can help you determine whether you are on the right track:
| • | Is your portfolio fully diversified with an appropriate mix of stocks and bonds? |
| • | Is your fixed-income portfolio positioned to take advantage of opportunities across the credit spectrum and fulfill your income needs? |
| • | Is your portfolio still in line with your risk tolerance and investment time horizon? |
Your financial professional can help you choose options within our fund family to navigate today’s markets with confidence.
Thank you again for investing with the Hartford HLS Funds.
James Davey
President
Hartford HLS Funds
1 The S&P 500 Index is a market capitalization-weighted price index composed of 500 widely held common stocks.
Table of Contents
This report is prepared for the general information of contract owners and qualified retirement plan participants. It is not an offer of contracts or of qualified retirement plans. It should not be used in connection with any offer, except in conjunction with the appropriate product prospectus which contains all pertinent information including the applicable sales, administrative and other charges.
The views expressed in the Fund’s Manager Discussion under ‘‘Why did the Fund perform this way?’’ and ‘‘What is the outlook?’’ are views of the Fund’s sub-adviser and portfolio management team through the end of the period and are subject to change based on market and other conditions. The Fund’s Manager Discussion is for informational purposes only and does not represent an offer, recommendation or solicitation to buy, hold or sell any security. The specific securities identified and described, if any, do not represent all of the securities purchased or sold and you should not assume that investments in the securities identified and discussed will be profitable.
Hartford Growth HLS Fund inception 04/30/2002
(sub-advised by Wellington Management Company, LLP)
| Investment objective – Seeks long-term capital appreciation. |
Performance Overview 6/30/03 - 6/30/13
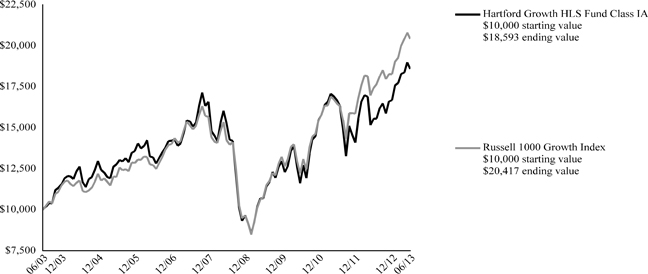
The chart above represents the hypothetical growth of a $10,000 investment in Class IA. Growth results in classes other than Class IA will vary from what is seen above due to differences in the expenses charged to those share classes.
Average Annual Total Returns (as of 6/30/13)
| 6 Month† | 1 Year | 5 Years | 10 Years | |||||||||||||
| Growth IA | 11.43% | 19.49% | 4.00% | 6.40% | ||||||||||||
| Growth IB | 11.29% | 19.19% | 3.74% | 6.13% | ||||||||||||
| Russell 1000 Growth Index | 11.80% | 17.07% | 7.47% | 7.40% | ||||||||||||
| † | Not Annualized |
PERFORMANCE DATA QUOTED REPRESENTS PAST PERFORMANCE AND DOES NOT GUARANTEE FUTURE RESULTS. The investment return and principal value of the investment will fluctuate so that investors’ shares, when redeemed, may be worth more or less than their original cost. Current performance may be lower or higher than the performance data quoted. To obtain performance data current to the most recent month-end, please visit our website www.hartfordfunds.com.
Total returns presented above were calculated using the Fund's net asset value available to shareholders for sale or redemption of Fund shares on June 30, 2013, which may exclude investment transactions as of this date. All share class returns assume the reinvestment of all distributions at net asset value and the deduction of all fund expenses.
Russell 1000 Growth Index is an unmanaged index which measures the performance of those Russell 1000 Index companies with higher price-to-book ratios and higher forecasted growth values. (The Russell 1000 Index is an unmanaged index that measures the performance of the 1,000 largest companies in the Russell 3000 Index, which measures the performance of the 3,000 largest U.S. companies based on total market capitalization.)
You cannot invest directly in an index.
As of the Fund’s current prospectus dated May 1, 2013, the total annual operating expense ratios for Class IA and Class IB shares were 0.83% and 1.08%, respectively. Actual expenses may be higher. Please see the accompanying Financial Highlights for expense ratios for the six-month period ended June 30, 2013.
The chart and table do not reflect the deductions of taxes, sales charges or other fees which may be applied at the variable life insurance, variable annuity or qualified retirement plan product level. Any such additional sales charges or other fees or expenses would lower the contract’s or plan’s performance.
All investments are subject to risk including the possible loss of principal. For a discussion of the Fund’s risks, please see the Principal Risks section. For more detailed information on the risks associated with an investment in the Fund, please see the prospectus.
| 2 |
| Hartford Growth HLS Fund |
| Manager Discussion |
| June 30, 2013 (Unaudited) |
| Portfolio Manager |
| Andrew J. Shilling, CFA |
| Senior Vice President and Equity Portfolio Manager |
How did the Fund perform?
The Class IA shares of the Hartford Growth HLS Fund returned 11.43% for the six-month period ended June 30, 2013, underperforming its benchmark, the Russell 1000 Growth Index, which returned 11.80% for the same period. The Fund also underperformed the 11.80% average return of the Variable Products-Underlying Funds Lipper Multi-Cap Growth Funds peer group, a group of funds with investment strategies similar to those of the Fund.
Why did the Fund perform this way?
U.S. equities (+13.8%), as measured by the S&P 500 Index, gained during the six-month period, reaching an all-time high in May. The rally began on the first trading day of the year after a last-minute compromise by the U.S. Congress averted the fiscal cliff. Optimism surrounding the fiscal reprieve was furthered during the first half of the period by better-than-expected corporate earnings, a robust housing market, and a gradually improving employment picture. In the second half of the period, a market rally throughout April and the first part of May paused following comments by Federal Reserve (Fed) Chairman Ben Bernanke that suggested the Fed might begin to slow quantitative easing (QE) sooner than investors anticipated. The Federal Open Market Committee’s June statement emphasized that the tapering schedule would depend on improving economic indicators. A strong housing market, positive consumer confidence trends, and a steadily healing labor market lent support to the thesis that underlying fundamentals were solid. Following an initially dramatic negative response to the Fed’s announcement and an increase in lending rates in China, U.S. markets moved higher into the end of the period.
All ten sectors of the Russell 1000 Growth Index had positive returns for the period. Health Care (+20.7%), Consumer Discretionary (+20.3%), and Telecommunication Services (+14.9%) performed the best, while Information Technology (+1.9%) and Utilities (+6.4) lagged on a relative basis. Growth stocks (+11.8%) underperformed Value stocks (+15.9%), as measured by the Russell 1000 Growth and Russell 1000 Value Indices, respectively.
The Fund’s relative performance benefited from strong security selection in Consumer Staples, Information Technology, and Industrials. However, this was outweighed by weaker security selection in Consumer Discretionary and Health Care, which detracted from relative returns. Sector allocation, which is a residual of bottom-up stock selection, contributed positively to relative performance. Positive effects from an overweight (i.e. the Fund’s sector position was greater than the benchmark position) to Consumer Discretionary was enough to offset the negative effects of the Fund’s overweight exposure to Information Technology and underweight exposure to Health Care. A modest cash position also detracted from performance in an upward-trending market.
Top detractors from benchmark relative performance during the period were Edwards Lifesciences (Health Care), Microsoft (Information Technology), and Cognizant Technology Solutions (Information Technology). Shares of Edwards Lifesciences, a medical device company specializing in heart valve technology and treatments for cardiovascular diseases, declined after it reported disappointing first quarter 2013 results due to poor transcatheter heart valve (THV) sales. Our underweight position in software and services company Microsoft detracted as shares moved higher during the period. The company posted better-than-expected quarterly earnings as the enterprise business continued to deliver strong results, more than offsetting the sluggish consumer business. Cognizant Technology Solutions, a U.S.-based provider of customized information technology, consulting, and business process outsourcing services, saw its shares decline despite solid quarterly results and positive guidance for 2013. The stock was under pressure due to uncertainty regarding how a proposed immigration bill will affect the company. Stocks that detracted most from absolute performance (i.e. total return) also included Apple (Information Technology) and Allergan (Health Care).
Green Mountain Coffee Roasters (Consumer Staples), Apple (Information Technology), and Gilead Sciences (Health Care) were the top contributors to relative performance during the period. Shares of Green Mountain Coffee Roasters, a provider of single-cup brewers and portion packs, outperformed during the period after the firm posted solid earnings. Investors also took solace from Starbucks' tepid sales results for its single serve Verismo machines. Our underweight in Apple contributed to relative performance as shares of the company fell when the company missed revenue expectations and issued disappointing earnings guidance. Shares of Gilead Sciences, a U.S.-based biopharmaceutical company, moved steadily higher alongside positive news flow, including passing the first hurdle for the firm's hepatitis C single tablet
| 3 |
| Hartford Growth HLS Fund |
| Manager Discussion – (continued) |
| June 30, 2013 (Unaudited) |
regimen. Top absolute contributors for the period also included Google (Information Technology).
What is the outlook?
We believe the global economy is gradually normalizing. While there are fears among market participants about the Fed reducing its quantitative easing measures, we are not overly concerned as we view this action as a shift from a “surge” in liquidity to becoming a source of steady liquidity. We believe that the U.S. economy remains poised for a continued modest recovery as consumer spending is still buoyed by household balance sheet and steady job gains. However, we believe the U.S. is still not creating jobs fast enough and a large part of the reduction in the unemployment rate is due to people dropping out of the labor force. Housing remains in a solid uptrend and we believe the shortage of inventory should boost prices further in the near term. With the Fed’s announcement that quantitative easing might end sooner than anticipated and with interest rates starting to increase, we believe that the U.S. economy will continue to slowly strengthen into the second half of 2013. At this point, we are cautiously optimistic and anticipate moderate growth within the U.S. going forward for 2013.
We believe Europe is gradually healing with growth likely to remain subpar but with the downside risks abating. In China, the transition from an infrastructure, heavy investment spending economy to a more diversified economy has been uneven, but we believe their policy makers have the tools to manage the transition. In our view, China should maintain above average growth. In Japan, we believe that the liquidity boost from accommodative monetary policy and growth recovery should add to the overall world economic recovery.
Our investment discipline is focused on finding proven companies with attractive valuations, solid fundamentals, and sustainable growth business models. At the end of the period, our largest overweights were to Consumer Discretionary and Information Technology, while we remained underweight Industrials and Consumer Staples, relative to the benchmark.
| Diversification by Industry | ||||
| as of June 30, 2013 | ||||
| Industry (Sector) | Percentage of Net Assets | |||
| Automobiles and Components (Consumer Discretionary) | 1.7 | % | ||
| Capital Goods (Industrials) | 5.4 | |||
| Commercial and Professional Services (Industrials) | 1.9 | |||
| Consumer Durables and Apparel (Consumer Discretionary) | 6.3 | |||
| Consumer Services (Consumer Discretionary) | 5.5 | |||
| Diversified Financials (Financials) | 4.5 | |||
| Energy (Energy) | 3.3 | |||
| Food and Staples Retailing (Consumer Staples) | 1.4 | |||
| Food, Beverage and Tobacco (Consumer Staples) | 6.1 | |||
| Health Care Equipment and Services (Health Care) | 2.4 | |||
| Materials (Materials) | 2.1 | |||
| Media (Consumer Discretionary) | 7.3 | |||
| Pharmaceuticals, Biotechnology and Life Sciences (Health Care) | 9.7 | |||
| Real Estate (Financials) | 0.8 | |||
| Retailing (Consumer Discretionary) | 11.2 | |||
| Semiconductors and Semiconductor Equipment (Information Technology) | 2.0 | |||
| Software and Services (Information Technology) | 21.7 | |||
| Technology Hardware and Equipment (Information Technology) | 4.7 | |||
| Transportation (Industrials) | 1.7 | |||
| Short-Term Investments | 0.1 | |||
| Other Assets and Liabilities | 0.2 | |||
| Total | 100.0 | % | ||
| 4 |
| Hartford Growth HLS Fund |
| Schedule of Investments |
| June 30, 2013 (Unaudited) |
| (000’s Omitted) |
| Shares or Principal Amount | Market Value ╪ | |||||||
| COMMON STOCKS - 99.7% | ||||||||
| Automobiles and Components - 1.7% | ||||||||
| 85 | Harley-Davidson, Inc. | $ | 4,687 | |||||
| Capital Goods - 5.4% | ||||||||
| 87 | AMETEK, Inc. | 3,676 | ||||||
| 24 | Cummins, Inc. | 2,640 | ||||||
| 52 | Eaton Corp. plc | 3,418 | ||||||
| 10 | Precision Castparts Corp. | 2,275 | ||||||
| 59 | Safran S.A. ADR | 3,094 | ||||||
| 15,103 | ||||||||
| Commercial and Professional Services - 1.9% | ||||||||
| 30 | IHS, Inc. ● | 3,133 | ||||||
| 64 | Nielsen Holdings N.V. | 2,137 | ||||||
| 5,270 | ||||||||
| Consumer Durables and Apparel - 6.3% | ||||||||
| 177 | D.R. Horton, Inc. | 3,775 | ||||||
| 89 | Lennar Corp. | 3,190 | ||||||
| 41 | Michael Kors Holdings Ltd. ● | 2,516 | ||||||
| 24 | PVH Corp. | 3,053 | ||||||
| 15 | Ralph Lauren Corp. | 2,681 | ||||||
| 43 | Under Armour, Inc. Class A ● | 2,562 | ||||||
| 17,777 | ||||||||
| Consumer Services - 5.5% | ||||||||
| 4 | Chipotle Mexican Grill, Inc. ● | 1,616 | ||||||
| 106 | Dunkin' Brands Group, Inc. | 4,543 | ||||||
| 59 | Starwood Hotels & Resorts, Inc. | 3,718 | ||||||
| 32 | Wyndham Worldwide Corp. | 1,813 | ||||||
| 14 | Wynn Resorts Ltd. | 1,748 | ||||||
| 30 | Yum! Brands, Inc. | 2,072 | ||||||
| 15,510 | ||||||||
| Diversified Financials - 4.5% | ||||||||
| 43 | American Express Co. | 3,200 | ||||||
| 13 | BlackRock, Inc. | 3,443 | ||||||
| 16 | IntercontinentalExchange, Inc. ● | 2,776 | ||||||
| 60 | JP Morgan Chase & Co. | 3,154 | ||||||
| 12,573 | ||||||||
| Energy - 3.3% | ||||||||
| 35 | Anadarko Petroleum Corp. | 2,970 | ||||||
| 30 | Cameron International Corp. ● | 1,850 | ||||||
| 96 | Cobalt International Energy, Inc. ● | 2,541 | ||||||
| 28 | National Oilwell Varco, Inc. | 1,911 | ||||||
| 9,272 | ||||||||
| Food and Staples Retailing - 1.4% | ||||||||
| 70 | CVS Caremark Corp. | 3,986 | ||||||
| Food, Beverage and Tobacco - 6.1% | ||||||||
| 39 | Anheuser-Busch InBev N.V. | 3,557 | ||||||
| 85 | Green Mountain Coffee Roasters, Inc. ● | 6,369 | ||||||
| 23 | Mead Johnson Nutrition Co. | 1,805 | ||||||
| 49 | Monster Beverage Corp. ● | 2,967 | ||||||
| 121 | Pernod-Ricard S.A. | 2,643 | ||||||
| 17,341 | ||||||||
| Health Care Equipment and Services - 2.4% | ||||||||
| 53 | Covidien plc | 3,341 | ||||||
| 108 | Hologic, Inc. ● | 2,087 | ||||||
| 3 | Intuitive Surgical, Inc. ● | 1,429 | ||||||
| 6,857 | ||||||||
| Materials - 2.1% | ||||||||
| 60 | Monsanto Co. | 5,882 | ||||||
| Media - 7.3% | ||||||||
| 102 | Comcast Corp. Class A | 4,265 | ||||||
| 110 | News Corp. Class A | 3,598 | ||||||
| 1,134 | Sirius XM Radio, Inc. w/ Rights | 3,798 | ||||||
| 67 | Time Warner, Inc. | 3,870 | ||||||
| 81 | Walt Disney Co. | 5,102 | ||||||
| 20,633 | ||||||||
| Pharmaceuticals, Biotechnology and Life Sciences - 9.7% | ||||||||
| 70 | Agilent Technologies, Inc. | 2,986 | ||||||
| 37 | Allergan, Inc. | 3,096 | ||||||
| 22 | Biogen Idec, Inc. ● | 4,839 | ||||||
| 92 | Bristol-Myers Squibb Co. | 4,099 | ||||||
| 144 | Gilead Sciences, Inc. ● | 7,350 | ||||||
| 13 | Regeneron Pharmaceuticals, Inc. ● | 2,982 | ||||||
| 23 | Vertex Pharmaceuticals, Inc. ● | 1,871 | ||||||
| 27,223 | ||||||||
| Real Estate - 0.8% | ||||||||
| 33 | American Tower Corp. REIT | 2,407 | ||||||
| Retailing - 11.2% | ||||||||
| 48 | Abercrombie & Fitch Co. Class A | 2,168 | ||||||
| 6 | Amazon.com, Inc. ● | 1,529 | ||||||
| 13 | AutoZone, Inc. ● | 5,516 | ||||||
| 53 | Dollar General Corp. ● | 2,669 | ||||||
| 60 | Family Dollar Stores, Inc. | 3,752 | ||||||
| 54 | Home Depot, Inc. | 4,168 | ||||||
| 170 | Lowe's Cos., Inc. | 6,947 | ||||||
| 6 | Priceline.com, Inc. ● | 4,814 | ||||||
| 31,563 | ||||||||
| Semiconductors and Semiconductor Equipment - 2.0% | ||||||||
| 120 | Altera Corp. | 3,970 | ||||||
| 47 | Broadcom Corp. Class A | 1,584 | ||||||
| 5,554 | ||||||||
| Software and Services - 21.7% | ||||||||
| 22 | Alliance Data Systems Corp. ● | 4,004 | ||||||
| 67 | Citrix Systems, Inc. ● | 4,012 | ||||||
| 63 | Cognizant Technology Solutions Corp. ● | 3,920 | ||||||
| 118 | eBay, Inc. ● | 6,087 | ||||||
| 142 | Facebook, Inc. ● | 3,536 | ||||||
| 13 | Google, Inc. ● | 11,322 | ||||||
| 22 | IBM Corp. | 4,119 | ||||||
| 18 | LinkedIn Corp. Class A ● | 3,257 | ||||||
| 8 | Mastercard, Inc. | 4,766 | ||||||
| 96 | Oracle Corp. | 2,946 | ||||||
| 73 | Salesforce.com, Inc. ● | 2,773 | ||||||
| 81 | ServiceNow, Inc. ● | 3,267 | ||||||
| 57 | Splunk, Inc. ● | 2,647 | ||||||
| 24 | Visa, Inc. | 4,346 | ||||||
| 61,002 | ||||||||
| Technology Hardware and Equipment - 4.7% | ||||||||
| 18 | Apple, Inc. | 7,001 | ||||||
| 128 | Cisco Systems, Inc. | 3,116 | ||||||
| 156 | Juniper Networks, Inc. ● | 3,020 | ||||||
| 13,137 | ||||||||
The accompanying notes are an integral part of these financial statements.
| 5 |
| Hartford Growth HLS Fund |
| Schedule of Investments – (continued) |
| June 30, 2013 (Unaudited) |
| (000’s Omitted) |
| Shares or Principal Amount | Market Value ╪ | |||||||||||
| COMMON STOCKS - 99.7% - (continued) | ||||||||||||
| Transportation - 1.7% | ||||||||||||
| 42 | J.B. Hunt Transport Services, Inc. | $ | 3,015 | |||||||||
| 17 | Kansas City Southern | 1,757 | ||||||||||
| 4,772 | ||||||||||||
| Total common stocks | ||||||||||||
| (cost $230,213) | $ | 280,549 | ||||||||||
| Total long-term investments | ||||||||||||
| (cost $230,213) | $ | 280,549 | ||||||||||
| SHORT-TERM INVESTMENTS - 0.1% | ||||||||||||
| Repurchase Agreements - 0.1% | ||||||||||||
| Bank of America Merrill Lynch TriParty Repurchase Agreement (maturing on 07/01/2013 in the amount of $1, collateralized by GNMA 3.00%, 2042, value of $1) | ||||||||||||
| $ | 1 | 0.13%, 6/28/2013 | $ | 1 | ||||||||
| Bank of Montreal TriParty Repurchase Agreement (maturing on 07/01/2013 in the amount of $17, collateralized by FHLMC 4.00% - 5.00%, 2023 - 2025, FNMA 2.00% - 5.00%, 2022 - 2042, GNMA 2.00% - 5.00%, 2041 - 2043, value of $17) | ||||||||||||
| 17 | 0.15%, 6/28/2013 | 17 | ||||||||||
| Bank of Montreal TriParty Repurchase Agreement (maturing on 07/01/2013 in the amount of $33, collateralized by FHLB 0.38%, 2015, FHLMC 0.38%, 2014, FNMA 0.50% - 5.50%, 2015 - 2042, value of $34) | ||||||||||||
| 33 | 0.12%, 6/28/2013 | 33 | ||||||||||
| Barclays Capital TriParty Repurchase Agreement (maturing on 07/01/2013 in the amount of $23, collateralized by U.S. Treasury Note 3.13%, 2021, value of $23) | ||||||||||||
| 23 | 0.10%, 6/28/2013 | 23 | ||||||||||
| Citigroup Global Markets, Inc. TriParty Repurchase Agreement (maturing on 07/01/2013 in the amount of $68, collateralized by U.S. Treasury Bill 0.85%, 2013, U.S. Treasury Note 0.63% - 3.25%, 2013 - 2018, value of $69) | ||||||||||||
| 68 | 0.10%, 6/28/2013 | 68 | ||||||||||
| Deutsche Bank Securities TriParty Repurchase Agreement (maturing on 07/01/2013 in the amount of $1, collateralized by FNMA 4.50%, 2035, value of $1) | ||||||||||||
| 1 | 0.25%, 6/28/2013 | 1 | ||||||||||
| RBS Securities, Inc. TriParty Repurchase Agreement (maturing on 07/01/2013 in the amount of $27, collateralized by U.S. Treasury Note 1.00% - 2.63%, 2014 - 2020, value of $28) | ||||||||||||
| 27 | 0.10%, 6/28/2013 | 27 | ||||||||||
| TD Securities TriParty Repurchase Agreement (maturing on 07/01/2013 in the amount of $48, collateralized by FHLMC 3.50% - 4.00%, 2042, FNMA 3.50% - 4.50%, 2041 - 2042, value of $49) | ||||||||||||
| 48 | 0.12%, 6/28/2013 | 48 | ||||||||||
| UBS Securities, Inc. Repurchase Agreement (maturing on 07/01/2013 in the amount of $1, collateralized by U.S. Treasury Note 0.63%, 2014, value of $1) | ||||||||||||
| 1 | 0.09%, 6/28/2013 | 1 | ||||||||||
| 219 | ||||||||||||
| Total short-term investments | ||||||||||||
| (cost $219) | $ | 219 | ||||||||||
| Total investments | ||||||||||||
| (cost $230,432) ▲ | 99.8 | % | $ | 280,768 | ||||||||
| Other assets and liabilities | 0.2 | % | 588 | |||||||||
| Total net assets | 100.0 | % | $ | 281,356 | ||||||||
The accompanying notes are an integral part of these financial statements.
| 6 |
| Note: | Percentage of investments as shown is the ratio of the total market value to total net assets. |
| ▲ | At June 30, 2013, the cost of securities for federal income tax purposes was $231,698 and the aggregate gross unrealized appreciation and depreciation based on that cost were: |
| Unrealized Appreciation | $ | 54,624 | ||
| Unrealized Depreciation | (5,554 | ) | ||
| Net Unrealized Appreciation | $ | 49,070 |
| ● | Non-income producing. |
| ╪ | See Significant Accounting Policies of accompanying Notes to Financial Statements regarding valuation of securities. |
| GLOSSARY: (abbreviations used in preceding Schedule of Investments) | ||
| Other Abbreviations: | ||
| ADR | American Depositary Receipt | |
| FHLB | Federal Home Loan Bank | |
| FHLMC | Federal Home Loan Mortgage Corp. | |
| FNMA | Federal National Mortgage Association | |
| GNMA | Government National Mortgage Association | |
| REIT | Real Estate Investment Trust | |
The accompanying notes are an integral part of these financial statements.
| 7 |
| Hartford Growth HLS Fund |
| Investment Valuation Hierarchy Level Summary |
| June 30, 2013 (Unaudited) |
| (000’s Omitted) |
| Total | Level 1 ♦ | Level 2 ♦ | Level 3 | |||||||||||||
| Assets: | ||||||||||||||||
| Common Stocks ‡ | $ | 280,549 | $ | 280,549 | $ | – | $ | – | ||||||||
| Short-Term Investments | 219 | – | 219 | – | ||||||||||||
| Total | $ | 280,768 | $ | 280,549 | $ | 219 | $ | – | ||||||||
| ♦ | For the six-month period ended June 30, 2013, there were no transfers between Level 1 and Level 2. |
| ‡ | The Fund has all or primarily all of the equity securities categorized in a particular level. Refer to the Schedule of Investments for further industry breakout. |
The accompanying notes are an integral part of these financial statements.
| 8 |
| Hartford Growth HLS Fund |
| Statement of Assets and Liabilities |
| June 30, 2013 (Unaudited) |
| (000’s Omitted) |
| Assets: | ||||
| Investments in securities, at market value (cost $230,432) | $ | 280,768 | ||
| Cash | 2 | |||
| Receivables: | ||||
| Investment securities sold | 2,525 | |||
| Fund shares sold | 297 | |||
| Dividends and interest | 118 | |||
| Total assets | 283,710 | |||
| Liabilities: | ||||
| Payables: | ||||
| Investment securities purchased | 1,987 | |||
| Fund shares redeemed | 297 | |||
| Investment management fees | 37 | |||
| Distribution fees | 3 | |||
| Accrued expenses | 30 | |||
| Total liabilities | 2,354 | |||
| Net assets | $ | 281,356 | ||
| Summary of Net Assets: | ||||
| Capital stock and paid-in-capital | $ | 220,507 | ||
| Undistributed net investment income | 74 | |||
| Accumulated net realized gain | 10,439 | |||
| Unrealized appreciation of investments | 50,336 | |||
| Net assets | $ | 281,356 | ||
| Shares authorized | 800,000 | |||
| Par value | $ | 0.001 | ||
| Class IA: Net asset value per share | $ | 14.41 | ||
| Shares outstanding | 15,020 | |||
| Net assets | $ | 216,451 | ||
| Class IB: Net asset value per share | $ | 14.10 | ||
| Shares outstanding | 4,604 | |||
| Net assets | $ | 64,905 |
The accompanying notes are an integral part of these financial statements.
| 9 |
| Hartford Growth HLS Fund |
| Statement of Operations |
| For the Six-Month Period Ended June 30, 2013 (Unaudited) |
| (000’s Omitted) |
| Investment Income: | ||||
| Dividends | $ | 1,351 | ||
| Interest | 1 | |||
| Less: Foreign tax withheld | (17 | ) | ||
| Total investment income, net | 1,335 | |||
| Expenses: | ||||
| Investment management fees | 1,211 | |||
| Transfer agent fees | 2 | |||
| Distribution fees - Class IB | 85 | |||
| Custodian fees | 3 | |||
| Accounting services fees | 15 | |||
| Board of Directors' fees | 5 | |||
| Audit fees | 6 | |||
| Other expenses | 42 | |||
| Total expenses (before fees paid indirectly) | 1,369 | |||
| Commission recapture | — | |||
| Total fees paid indirectly | — | |||
| Total expenses, net | 1,369 | |||
| Net Investment Loss | (34 | ) | ||
| Net Realized Gain on Investments: | ||||
| Net realized gain on investments | 22,478 | |||
| Net Realized Gain on Investments | 22,478 | |||
| Net Changes in Unrealized Appreciation of Investments: | ||||
| Net unrealized appreciation of investments | 11,546 | |||
| Net Changes in Unrealized Appreciation of Investments | 11,546 | |||
| Net Gain on Investments | 34,024 | |||
| Net Increase in Net Assets Resulting from Operations | $ | 33,990 |
The accompanying notes are an integral part of these financial statements.
| 10 |
| Hartford Growth HLS Fund |
| Statement of Changes in Net Assets |
| (000’s Omitted) |
| For the Six-Month Period Ended June 30, 2013 (Unaudited) | For the Year Ended December 31, 2012 | |||||||
| Operations: | ||||||||
| Net investment income (loss) | $ | (34 | ) | $ | 132 | |||
| Net realized gain on investments | 22,478 | 41,625 | ||||||
| Net unrealized appreciation of investments | 11,546 | 13,554 | ||||||
| Net Increase in Net Assets Resulting from Operations | 33,990 | 55,311 | ||||||
| Capital Share Transactions: | ||||||||
| Class IA | ||||||||
| Sold | 14,059 | 35,467 | ||||||
| Redeemed | (57,275 | ) | (88,213 | ) | ||||
| Total capital share transactions | (43,216 | ) | (52,746 | ) | ||||
| Class IB | ||||||||
| Sold | 4,164 | 7,707 | ||||||
| Redeemed | (14,074 | ) | (29,736 | ) | ||||
| Total capital share transactions | (9,910 | ) | (22,029 | ) | ||||
| Net decrease from capital share transactions | (53,126 | ) | (74,775 | ) | ||||
| Net Decrease in Net Assets | (19,136 | ) | (19,464 | ) | ||||
| Net Assets: | ||||||||
| Beginning of period | 300,492 | 319,956 | ||||||
| End of period | $ | 281,356 | $ | 300,492 | ||||
| Undistributed (distribution in excess of) net investment income | $ | 74 | $ | 108 | ||||
| Shares: | ||||||||
| Class IA | ||||||||
| Sold | 1,008 | 2,848 | ||||||
| Redeemed | (4,011 | ) | (7,121 | ) | ||||
| Total share activity | (3,003 | ) | (4,273 | ) | ||||
| Class IB | ||||||||
| Sold | 303 | 629 | ||||||
| Redeemed | (1,020 | ) | (2,436 | ) | ||||
| Total share activity | (717 | ) | (1,807 | ) | ||||
The accompanying notes are an integral part of these financial statements.
| 11 |
| Hartford Growth HLS Fund |
| Notes to Financial Statements |
| June 30, 2013 (Unaudited) |
| (000’s Omitted) |
| 1. | Organization: |
Hartford Growth HLS Fund (the “Fund”) serves as an underlying investment option for certain variable annuity and variable life insurance separate accounts of Hartford Life Insurance Company (“HLIC”) and its affiliates and certain qualified retirement plans. The Fund may also serve as an underlying investment option for certain variable annuity and variable life separate accounts of other insurance companies. Owners of variable annuity contracts and policyholders of variable life insurance contracts may choose the funds permitted in the variable insurance contract prospectus. In addition, participants in certain qualified retirement plans may choose the Fund if permitted by their plans.
Hartford Series Fund, Inc. (the “Company”) is an open-end registered management investment company comprised of thirty portfolios. Financial statements for the Fund, a series of the Company, are included in this report.
The Company is organized under the laws of the State of Maryland and is registered with the Securities and Exchange Commission (“SEC”) under the Investment Company Act of 1940, as amended (“1940 Act”). The Fund is a diversified open-end management investment company.
The Fund is divided into Class IA and Class IB shares. Each class is offered at the per share net asset value (“NAV”) without a sales charge and is subject to the same expenses, except that the Class IB shares are subject to distribution and service fees charged pursuant to a Distribution Plan adopted in accordance with Rule 12b-1 under the 1940 Act.
| 2. | Significant Accounting Policies: |
The following is a summary of significant accounting policies of the Fund in the preparation of its financial statements, which are in accordance with the United States Generally Accepted Accounting Principles (“U.S. GAAP”). The preparation of financial statements in accordance with U.S. GAAP may require management to make estimates and assumptions that affect the reported amounts of assets and liabilities and disclosure of contingent assets and liabilities at the date of the financial statements and the reported amounts of increases and decreases in net assets from operations during the reporting period. Actual results could differ from those estimates.
| a) | Determination of Net Asset Value – The NAV of each class of the Fund’s shares is determined as of the close of regular trading (normally 4:00 p.m. Eastern Time) (the “NYSE Close”) on each day that the New York Stock Exchange (the “Exchange”) is open (“Valuation Date”). Information that becomes known to the Fund after the NAV has been calculated on a particular day will not generally be used to retroactively adjust the NAV determined earlier that day. |
| b) | Investment Valuation and Fair Value Measurements – For purposes of calculating the NAV, portfolio investments and other assets held by the Fund's portfolio for which market quotes are readily available are valued at market value. Market value is generally determined on the basis of last reported sales prices or official close price. If no sales are reported, market value is based on quotes obtained from a quotation reporting system, established market makers, or independent pricing services. If market prices are not readily available or are deemed unreliable, the Fund will use the fair value of the investment as determined in good faith under policies and procedures established by and under the supervision of the Company’s Board of Directors. Market quotes are considered not readily available where there is an absence of current or reliable market-based data (e.g., trade information or indicative market quotes), including where events occur after the close of the relevant market, but prior to the NYSE Close that materially affect the values of the Fund’s portfolio investments or assets. In addition, market quotes are considered not readily available when, due to extraordinary circumstances, the exchanges or markets on which the investments trade do not open for trading for the entire day and no other market prices are available. In addition, prices of foreign equities that are principally traded on certain foreign markets may be adjusted daily pursuant to a fair value pricing service approved by the Board of Directors in order to reflect an adjustment for the factors occurring after the close of certain foreign markets but before the NYSE Close. Investments that are primarily traded on foreign markets may trade on days that are not business days of the Fund. The value of the foreign investments in which the Fund invests may change on days when a shareholder will not be able to purchase or redeem shares of the Fund. Fair value pricing is subjective in nature and the use of fair value pricing by the |
| 12 |
Fund may cause the NAV of its shares to differ significantly from the NAV that would have been calculated using market prices at the close of the exchange on which a portfolio investment is primarily traded. There can be no assurance that the Fund could obtain the fair market value assigned to an investment if the Fund were to sell the investment at approximately the time at which the Fund determines its NAV.
Financial instruments for which prices are not available from an independent pricing service may be valued using market quotations obtained from one or more dealers that make markets in the respective financial instrument in accordance with procedures established by the Company’s Board of Directors.
U.S. GAAP defines fair value as the price that the Fund would receive to sell an asset or pay to transfer a liability in an orderly transaction between market participants. The U.S. GAAP fair value measurement standards require disclosure of a fair value hierarchy for each major category of assets and liabilities. Various inputs are used in determining the fair value of the Fund’s investments. These inputs are summarized into three broad hierarchy levels. This hierarchy is based on whether the valuation inputs are observable or unobservable. These levels are:
| · | Level 1 – Quoted prices in active markets for identical investments. Level 1 may include exchange traded instruments, such as domestic equities, some foreign equities, options, futures, mutual funds, exchange traded funds, rights and warrants. |
| · | Level 2 – Observable inputs other than Level 1 prices, such as quoted prices for similar investments; quoted prices in markets that are not active; or other inputs that are observable or can be corroborated by observable market data. Level 2 may include debt investments that are traded less frequently than exchange traded instruments and which are valued using independent pricing services; foreign equities, which are principally traded on certain foreign markets and are adjusted daily pursuant to a fair value pricing service in order to reflect an adjustment for the factors occurring after the close of certain foreign markets but before the NYSE Close; and short-term investments, which are valued at amortized cost. |
| · | Level 3 – Significant unobservable inputs that are supported by limited or no market activity. Level 3 may include financial instruments whose values are determined using indicative market quotes or require significant management judgment or estimation. These unobservable valuation inputs may include estimates for current yields, maturity/duration, prepayment speed, and indicative market quotes for comparable investments along with other assumptions relating to credit quality, collateral value, complexity of the investment structure, general market conditions and liquidity. This category may include investments where trading has been halted or there are certain restrictions on trading. While these investments are priced using unobservable inputs, the valuation of these investments reflects the best available data and management believes the prices are a reasonable representation of exit price. |
The Board of Directors of the Company generally reviews and approves the “Procedures for Valuation of Portfolio Securities” on an annual basis. These procedures define how investments are to be valued, including the formation and activities of a Valuation Committee. The Valuation Committee is responsible for determining in good faith the fair value of investments when the value cannot be obtained from primary pricing services or alternative sources or if the valuation of an investment as provided by the primary pricing service or alternative source is believed not to reflect the investment’s fair value as of the Valuation Date. Members of the Valuation Committee include the Fund’s Treasurer or designee, a Vice President of the Fund with legal expertise or designee, and a Vice President of the investment manager or designee. In addition, the Fund’s Chief Compliance Officer shall designate a member of the compliance group to attend Valuation Committee meetings as a non-voting resource, to monitor for and provide guidance with respect to compliance with these procedures. Two members of the Valuation Committee or their designees, representing different departments, shall constitute a quorum for purposes of permitting the Valuation Committee to take action. The Valuation Committee will consider all relevant factors in determining an investment’s fair value, and may seek the advice of the Fund’s sub-adviser, knowledgeable brokers, and legal counsel in making such determination. The Valuation Committee reports to the Audit Committee of the Company’s Board of Directors. The Audit Committee receives quarterly written reports which include details of all fair-valued investments, including the reason for the fair valuation, and an indication, when possible, of the accuracy of the valuation by disclosing the
| 13 |
| Hartford Growth HLS Fund |
| Notes to Financial Statements – (continued) |
| June 30, 2013 (Unaudited) |
| (000’s Omitted) |
next available reliable public price quotation or the disposition price of such investments (the “look-back” test). The Board of Directors then must consider for ratification all of the fair value determinations made during the previous quarter.
Valuation levels are not necessarily indicative of the risk associated with investing in such investments. Individual investments within any of the above mentioned asset classes may be assigned a different hierarchical level than those presented above, as individual circumstances dictate.
For additional information, refer to the Investment Valuation Hierarchy Level Summary and the Level 3 roll-forward reconciliation, if applicable, which follow the Schedule of Investments.
For purposes of reporting transfers between different hierarchy levels, both transfers in and out of each level, as applicable, are shown as if they occurred at the beginning of the period.
| c) | Investment Transactions and Investment Income – Investment transactions are recorded as of the trade date (the date the order to buy or sell is executed) for financial reporting purposes. Investments purchased or sold on a when-issued or delayed-delivery basis may be settled a month or more after the trade date. Realized gains and losses are determined on the basis of identified cost. |
Dividend income from domestic securities is accrued on the ex-dividend date. In general, dividend income from foreign securities is recorded on the ex-date; however, dividend notifications in certain foreign jurisdictions may not be available in a timely manner and as a result, the Fund will record the dividend as soon as the relevant details (i.e., rate per share, payment date, shareholders of record, etc.) are publicly available. Interest income, including amortization of premium and accretion of discounts, is accrued on a daily basis.
| d) | Joint Trading Account – The Fund may invest cash balances into a joint trading account that may be invested in one or more repurchase agreements. |
| e) | Fund Share Valuation and Dividend Distributions to Shareholders – Orders for the Fund’s shares are executed in accordance with the investment instructions of the contract holders and plan participants. The NAV of the Fund’s shares is determined as of the close of business on each business day of the Exchange. The NAV is determined separately for each class of shares of the Fund by dividing the Fund’s net assets attributable to that class by the number of shares of the class outstanding. Each class of shares offered by the Fund has equal rights as to assets and voting privileges (except that shareholders of a class have exclusive voting rights regarding any matter relating solely to that class of shares). Income and non-class specific expenses are allocated daily to each class on the basis of the relative net assets of the class. Realized and unrealized capital gains and losses are allocated daily based on the relative net assets of each class of shares of the Fund. |
Orders for the purchase of the Fund’s shares received prior to the close of the Exchange on any day the Exchange is open for business are priced at the NAV determined as of the close of the Exchange. Orders received after the close of the Exchange, or on a day on which the Exchange and/or the Fund is not open for business, are priced at the next determined NAV.
Dividends are declared pursuant to a policy adopted by the Company’s Board of Directors based upon the investment performance of the Fund. The policy of the Fund is to pay dividends from net investment income and realized capital gains, if any, at least once a year.
Distributions from net investment income, net realized capital gains and capital are determined in accordance with federal income tax regulations, which may differ from U.S. GAAP with respect to character and timing. These differences may include but are not limited to losses deferred due to wash sale adjustments, foreign currency gains and losses, adjustments related to Passive Foreign Investment Companies (“PFICs”), Real Estate Investment Trusts
| 14 |
(“REITs”), Regulated Investment Companies (“RICs”), certain derivatives and partnerships. Permanent book and federal income tax basis differences relating to shareholder distributions will result in reclassifications to certain of the Fund’s capital accounts (see Federal Income Taxes: Reclassification of Capital Accounts note).
| 3. | Securities and Other Investments: |
| a) | Repurchase Agreements – A repurchase agreement is an agreement by which a counterparty agrees to sell an investment and agrees to repurchase the investment sold from the buyer at a mutually agreed upon time and price. During the period of the repurchase agreement, the counterparty will deposit cash and or securities in a third party custodial account to serve as collateral. At the time the Fund enters into a repurchase agreement, the value of the underlying collateral, including accrued interest, will be equal to or exceed the value of the repurchase agreement. Repurchase agreements expose the Fund to counterparty risk - that is, the risk that the counterparty will not fulfill its obligations. To minimize counterparty risk, the investments that serve to collateralize the repurchase agreement are held by the Fund’s custodian in book entry or physical form in the custodial account of the Fund or in a third party custodial account. Repurchase agreements are valued at cost plus accrued interest, which approximates fair value. Repurchase agreements have master netting agreements which allow the Fund to offset amounts owed to a counterparty with amounts owed by the counterparty, including any collateral. The Fund, as shown on the Schedule of Investments, had outstanding repurchase agreements as of June 30, 2013. |
| 4. | Principal Risks: |
| a) | Counterparty Risk – The Fund may be exposed to counterparty risk, or the risk that an institution or other entity with which the Fund has unsettled or open transactions will default. |
| b) | Market Risks – If the Fund invests directly in foreign currencies or in securities that trade in, and receive revenues in, foreign currencies, or in derivatives that provide exposure to foreign currencies, it will be subject to the risk that those currencies will decline in value relative to the base currency of the Fund, or, in the case of hedging positions, that the Fund’s base currency will decline in value relative to the currency being hedged. Currency rates in foreign countries may fluctuate significantly over short periods of time for a number of reasons, including changes in interest rates, intervention (or the failure to intervene) by U.S. or foreign governments, central banks or supranational entities, such as the International Monetary Fund, or by the imposition of currency controls or other political developments in the United States or abroad. As a result, the Fund’s investments in foreign currency denominated securities may reduce the returns of the Fund. The market values of equity securities, such as common stocks and preferred stocks, or equity related investments, such as futures and options, may decline due to general market conditions which are not specifically related to a particular company, such as real or perceived adverse economic conditions, changes in the general outlook for corporate earnings, changes in interest or currency rates or adverse investor sentiment generally. The market value of equity securities may also decline due to factors which affect a particular industry or industries, such as labor shortages or increased production costs and competitive conditions within an industry. Equity securities and equity related investments generally have greater market price volatility than fixed income securities. |
| 5. | Federal Income Taxes: |
| a) | Federal Income Taxes – For federal income tax purposes, the Fund intends to continue to qualify as a RIC under Subchapter M of the Internal Revenue Code (“IRC”) by distributing substantially all of its taxable net investment income and net realized capital gains to its shareholders and otherwise complying with the requirements of the IRC. The Fund has distributed substantially all of its income and capital gains in prior years, if applicable, and intends to distribute substantially all of its income and capital gains prior to the next fiscal year-end. Accordingly, no provision for federal income or excise taxes has been made in the accompanying financial statements. Distributions from short-term capital gains are treated as ordinary income distributions for federal income tax purposes. |
| b) | Net Investment Income (Loss), Net Realized Gains (Losses), and Distributions – Net investment income (loss) and net realized gains (losses) may differ for financial statement and tax purposes primarily because of losses deferred due to |
| 15 |
| Hartford Growth HLS Fund |
| Notes to Financial Statements – (continued) |
| June 30, 2013 (Unaudited) |
| (000’s Omitted) |
wash sale adjustments, foreign currency gains and losses, adjustments related to PFICs, REITs, RICs, certain derivatives and partnerships. The character of distributions made during the year from net investment income or net realized gains may differ from their ultimate characterization for federal income tax purposes. Also, due to the timing of dividend distributions, the fiscal year in which amounts are distributed may differ from the year that the income or realized gains (losses) were recorded by the Fund.
| c) | Distributions and Components of Distributable Earnings – The tax character of distributions paid by the Fund for the periods indicated is as follows (as adjusted for dividends payable, if applicable): |
| For the Year Ended December 31, 2012 | For the Year Ended December 31, 2011 | |||||||
| Ordinary Income | $ | — | $ | 460 | ||||
As of December 31, 2012, the Fund’s components of distributable earnings (deficit) on a tax basis were as follows:
| Amount | ||||
| Undistributed Ordinary Income | $ | 108 | ||
| Accumulated Capital and Other Losses* | (10,773 | ) | ||
| Unrealized Appreciation† | 37,524 | |||
| Total Accumulated Earnings | $ | 26,859 | ||
| * | The Fund has capital loss carryforwards that are identified in the Capital Loss Carryforward note that follows. |
| † | Differences between book-basis and tax-basis unrealized appreciation (depreciation) may be attributable to the losses deferred due to wash sale adjustments, foreign currency gains and losses, adjustments related to PFICs, REITs, RICs, certain derivatives and partnerships. |
| d) | Reclassification of Capital Accounts – The Fund may record reclassifications in its capital accounts. These reclassifications have no impact on the total net assets of the Fund. The reclassifications are a result of permanent differences between U.S. GAAP and tax accounting for such items as expiration or utilization of capital loss carryforwards or net operating losses. Adjustments are made to reflect the impact these items have on current and future distributions to shareholders. Therefore, the source of the Fund’s distributions may be shown in the accompanying Statement of Changes in Net Assets as from undistributed net investment income, from accumulated net realized gains on investments or from capital depending on the type of book and tax differences that exist. For the year ended December 31, 2012, the Fund recorded reclassifications to increase (decrease) the accounts listed below: |
| Amount | ||||
| Undistributed Net Investment Income | $ | (24 | ) | |
| Accumulated Net Realized Gain (Loss) | 300 | |||
| Capital Stock and Paid-in-Capital | (276 | ) | ||
| e) | Capital Loss Carryforward – On December 22, 2010, the Regulated Investment Company Modernization Act of 2010 (the “Act”) was enacted, which made changes to the capital loss carryforward rules. The changes are effective for taxable years beginning after the date of enactment. Under the Act, funds are permitted to carry forward capital losses for an unlimited period. However, any losses incurred during those future taxable years will be required to be utilized prior to the losses incurred in pre-enactment taxable years, which carry an expiration date. As a result of this ordering rule, pre-enactment capital loss carryforwards may be more likely to expire unused. Additionally, post-enactment capital loss carryforwards retain their character as either short-term or long-term capital losses rather than being considered all short-term as permitted under prior regulation. |
| 16 |
At December 31, 2012 (tax-year-end), the Fund had capital loss carryforwards for U.S. federal income tax purposes as follows:
| Year of Expiration | Amount | |||
| 2017 | $ | 10,773 | ||
| Total | $ | 10,773 | ||
During the year ended December 31, 2012, the Fund utilized $42,065 of prior year capital loss carryforwards.
| f) | Accounting for Uncertainty in Income Taxes – The Fund has adopted financial reporting rules that require the Fund to analyze all open tax years, as defined by the statute of limitations, for all major jurisdictions. Generally, tax authorities can examine all tax returns filed for the last three years. The Fund does not have an examination in progress. |
The Fund has reviewed all open tax years and major jurisdictions and concluded that these financial reporting rules had no effect on the Fund’s financial position or results of operations. There is no tax liability resulting from unrecognized tax benefits relating to uncertain income tax positions taken or expected to be taken on the tax return for the fiscal year ended December 31, 2012. The Fund is also not aware of any tax positions for which it is reasonably possible that the total amounts of unrecognized tax benefits will significantly change in the next twelve months.
| 6. | Expenses: |
| a) | Investment Management Agreement – Hartford Funds Management Company, LLC (“HFMC”), an indirect wholly owned subsidiary of The Hartford Financial Services Group, Inc. (“The Hartford”), serves as investment manager to the Fund pursuant to an Investment Management Agreement with the Company. The investment manager has overall investment supervisory responsibility for the Fund. In addition, the investment manager provides administrative personnel, services, equipment, facilities and office space for proper operation of the Fund. The investment manager has contracted with Wellington Management Company, LLP (“Wellington Management”) under a sub-advisory agreement for the provision of day-to-day investment management services to the Fund in accordance with the Fund’s investment objective and policies. The Fund pays a fee to the investment manager, a portion of which may be used to compensate Wellington Management. |
The schedule below reflects the rates of compensation paid to HFMC for investment management services rendered as of June 30, 2013; the rates are accrued daily and paid monthly.
| Average Daily Net Assets | Annual Fee | |||
| On first $250 million | 0.8000% | |||
| On next $250 million | 0.7500% | |||
| On next $500 million | 0.7000% | |||
| On next $4 billion | 0.6750% | |||
| On next $5 billion | 0.6725% | |||
| Over $10 billion | 0.6700% | |||
| b) | Accounting Services Agreement – Pursuant to the Fund Accounting Agreement between HFMC and the Company, on behalf of the Fund, HFMC provides accounting services to the Fund and receives monthly compensation based on the Fund’s average daily net assets at the rates set forth below. The Fund’s accounting services fees are accrued daily and paid monthly. |
| Average Daily Net Assets | Annual Fee | |||
| All Assets | 0.010% | |||
| 17 |
| Hartford Growth HLS Fund |
| Notes to Financial Statements – (continued) |
| June 30, 2013 (Unaudited) |
| (000’s Omitted) |
| c) | Operating Expenses – Allocable expenses incurred by the Company are allocated to each Fund and allocated to classes within a Fund in proportion to the average daily net assets of the Fund and each class, except where allocation of certain expenses is more fairly made directly to the Fund or to specific classes within a Fund. |
| d) | Fees Paid Indirectly – The Company, on behalf of the Fund, has entered into agreements with State Street Global Markets, LLC and Russell Implementation Services, Inc. to partially recapture non-discounted trade commissions. Such rebates are used to pay a portion of the Fund’s expenses. In addition, the Fund’s custodian banks have agreed to reduce its fees when the Fund maintains cash on deposit in a non-interest-bearing custody account. For the six-month period ended June 30, 2013, these amounts, if any, are included in the Statement of Operations. |
The ratio of expenses to average net assets in the accompanying financial highlights excludes the reduction in expenses related to fees paid indirectly. The annualized expense ratio for the period listed below reflecting the reduction for fees paid indirectly is as follows:
| Annualized Six- Month Period Ended June 30, 2013 | ||||
| Class IA | 0.84 | % | ||
| Class IB | 1.09 | |||
| e) | Distribution Plan for Class IB shares – The Company, on behalf of the Fund, has adopted a Distribution Plan pursuant to Rule 12b-1 of the 1940 Act to compensate the distributor, Hartford Funds Distributors, LLC (“HFD”), (formerly known as Hartford Investment Financial Services, LLC), an indirect wholly owned subsidiary of The Hartford, from assets attributable to the Class IB shares for services rendered and expenses borne in connection with activities primarily intended to result in the sale of the Class IB shares, subject to the review and approval of the Company’s Board of Directors. |
The Distribution Plan provides that the Fund may pay annually up to 0.25% of the average daily net assets of the Fund attributable to its Class IB shares for activities primarily intended to result in the sale of Class IB shares. The Board has the authority to suspend or reduce these payments at any point in time. Under the terms of the Distribution Plan and the principal underwriting agreement, the Fund is authorized to make payments monthly to the distributor that may be used to pay or compensate entities providing distribution and shareholder servicing with respect to the Class IB shares for such entities’ fees or expenses incurred or paid in that regard. These fees are accrued daily and paid monthly.
| f) | Other Related Party Transactions – Certain officers of the Fund are directors and/or officers of the investment manager and/or The Hartford or its subsidiaries. For the six-month period ended June 30, 2013, a portion of the Fund’s Chief Compliance Officer’s salary was paid by all the investment companies in the Hartford fund complex. The portion allocated to the Fund rounds to zero. Hartford Administrative Services Company (“HASCO”), an indirect wholly owned subsidiary of The Hartford, provides transfer agent services to the Fund. HASCO was compensated on a per account basis for providing such services. The amount paid to HASCO can be found in the Statement of Operations. These fees are accrued daily and paid monthly. |
| 7. | Investment Transactions: |
For the six-month period ended June 30, 2013, the Fund's aggregate purchases and sales of investment securities (excluding short-term investments) were as follows:
| Amount | ||||
| Cost of Purchases Excluding U.S. Government Obligations | $ | 81,527 | ||
| Sales Proceeds Excluding U.S. Government Obligations | 134,767 | |||
| 18 |
| 8. | Line of Credit: |
The Fund is one of several Hartford funds that participate in a $500 million committed revolving line of credit facility. The facility is to be used for temporary or emergency purposes. Under the arrangement, the funds are required to own securities having a market value in excess of 300% of the total bank borrowings. The interest rate on borrowings varies depending on the nature of the loan. The facility also requires a fee to be paid based on the amount of the commitment. This commitment fee is allocated to all of the funds participating in the line of credit based on the average net assets of the funds. During the six-month period ended June 30, 2013, the Fund did not have any borrowings under this facility.
| 9. | Industry Classifications: |
Other than the industry classifications “Other Investment Pools and Funds” and “Exchange Traded Funds,” equity industry classifications used in this report are the Global Industry Classification Standard, which was developed by and is the exclusive property and service mark of MSCI, Inc. and Standard & Poor’s.
| 10. | Indemnifications: |
Under the Company’s organizational documents, the Company shall indemnify its officers and directors to the full extent required or permitted under Maryland General Corporation Law and the federal securities laws. In addition, the Company, on behalf of the Fund, may enter into contracts that contain a variety of indemnifications. The Company’s maximum exposure under these arrangements is unknown. However, as of the date of these financial statements, the Company has not had prior claims or losses pursuant to these contracts and expects the risk of loss to be remote.
| 11. | Pending Legal Proceedings: |
On February 25, 2011, Jennifer L. Kasilag, Louis Mellinger, Judith M. Menendez, Jacqueline M. Robinson, and Linda A. Russell filed a derivative lawsuit against Hartford Investment Financial Services, LLC (“HIFSCO”)(now known as Hartford Funds Distributors, LLC) on behalf of six Hartford retail mutual funds in the United States District Court for the District of New Jersey, alleging that HIFSCO received excessive advisory and distribution fees in violation of its statutory fiduciary duty under Section 36(b) of the 1940 Act when serving as investment manager and principal underwriter, respectively, to the Hartford retail mutual funds. HIFSCO moved to dismiss and, in September 2011, the motion was granted in part and denied in part, with leave to amend the complaint. In November 2011, plaintiffs filed an amended complaint on behalf of certain Hartford retail mutual funds, The Hartford Global Health Fund (now known as The Hartford Healthcare Fund), The Hartford Conservative Allocation Fund, The Hartford Growth Opportunities Fund, The Hartford Inflation Plus Fund, The Hartford Advisers Fund (now known as The Hartford Balanced Fund), and The Hartford Capital Appreciation Fund. Plaintiffs seek to rescind the investment management agreements and distribution plans between HIFSCO and these funds and to recover the total fees charged thereunder or, in the alternative, to recover any improper compensation HIFSCO received, in addition to lost earnings. HIFSCO filed a partial motion to dismiss the amended complaint and, in December 2012, the court dismissed without prejudice the claims regarding distribution fees and denied the motion with respect to the advisory fees claims. HIFSCO disputes the allegations and intends to defend vigorously.
This action concerns the activities of HIFSCO in its capacity as investment manager and principal underwriter to the Hartford retail mutual funds and does not concern HIFSCO’s activities in its capacity as principal underwriter to the HLS funds. For this reason, no accrual for litigation relating to this matter has been recorded in the financial statements of the Fund.
| 19 |
| Hartford Growth HLS Fund |
| Financial Highlights |
| - Selected Per-Share Data (A) - |
| Class | Net Asset Value at Beginning of Period | Net Investment Income (Loss) | Net Realized and Unrealized Gain (Loss) on Investments | Total from Investment Operations | Dividends from Net Investment Income | Distributions from Realized Capital Gains | Distributions from Capital | Total Distributions | Net Asset Value at End of Period | |||||||||||||||||||||||||||
| For the Six-Month Period Ended June 30, 2013 (Unaudited) | ||||||||||||||||||||||||||||||||||||
| IA | $ | 12.93 | $ | 0.01 | $ | 1.47 | $ | 1.48 | $ | – | $ | – | $ | – | $ | – | $ | 14.41 | ||||||||||||||||||
| IB | 12.67 | (0.02 | ) | 1.45 | 1.43 | – | – | – | – | 14.10 | ||||||||||||||||||||||||||
| For the Year Ended December 31, 2012 | ||||||||||||||||||||||||||||||||||||
| IA | 10.92 | 0.01 | 2.00 | 2.01 | – | – | – | – | 12.93 | |||||||||||||||||||||||||||
| IB | 10.73 | (0.02 | ) | 1.96 | 1.94 | – | – | – | – | 12.67 | ||||||||||||||||||||||||||
| For the Year Ended December 31, 2011 | ||||||||||||||||||||||||||||||||||||
| IA | 12.02 | 0.01 | (1.09 | ) | (1.08 | ) | (0.02 | ) | – | – | (0.02 | ) | 10.92 | |||||||||||||||||||||||
| IB | 11.81 | (0.03 | ) | (1.05 | ) | (1.08 | ) | – | – | – | – | 10.73 | ||||||||||||||||||||||||
| For the Year Ended December 31, 2010 (G) | ||||||||||||||||||||||||||||||||||||
| IA | 10.07 | 0.02 | 1.93 | 1.95 | – | – | – | – | 12.02 | |||||||||||||||||||||||||||
| IB | 9.92 | – | 1.89 | 1.89 | – | – | – | – | 11.81 | |||||||||||||||||||||||||||
| For the Year Ended December 31, 2009 | ||||||||||||||||||||||||||||||||||||
| IA | 7.53 | 0.04 | 2.54 | 2.58 | (0.04 | ) | – | – | (0.04 | ) | 10.07 | |||||||||||||||||||||||||
| IB | 7.42 | 0.02 | 2.49 | 2.51 | (0.01 | ) | – | – | (0.01 | ) | 9.92 | |||||||||||||||||||||||||
| For the Year Ended December 31, 2008 | ||||||||||||||||||||||||||||||||||||
| IA | 13.39 | 0.03 | (5.47 | ) | (5.44 | ) | (0.03 | ) | (0.39 | ) | – | (0.42 | ) | 7.53 | ||||||||||||||||||||||
| IB | 13.18 | – | (5.37 | ) | (5.37 | ) | – | (0.39 | ) | – | (0.39 | ) | 7.42 | |||||||||||||||||||||||
| (A) | Information presented relates to a share outstanding throughout the indicated period. |
| (B) | The figures do not include sales charges or other fees which may be applied at the variable life insurance, variable annuity or qualified retirement plan product level. Any such additional sales charges or other fees would lower the Fund's performance. |
| (C) | Ratios do not reflect reductions for fees paid indirectly. Please see Fees Paid Indirectly in the Notes to Financial Statements. |
| (D) | Portfolio turnover rate is calculated on the basis of the Fund as a whole without distinguishing between the classes of shares issued. |
| (E) | Not annualized. |
| (F) | Annualized. |
| (G) | Per share amounts have been calculated using the average shares method. |
| (H) | During the year ended December 31, 2010, the Fund incurred $49.9 million in sales associated with the transition of assets from Hartford Fundamental Growth HLS Fund, which merged into the Fund on April 16, 2010. These sales were excluded from the portfolio turnover calculation. |
| 20 |
| - Ratios and Supplemental Data - |
| Total Return(B) | Net Assets at End of Period | Ratio of Expenses to Average Net Assets Before Waivers(C) | Ratio of Expenses to Average Net Assets After Waivers(C) | Ratio of Net Investment Income (Loss) to Average Net Assets | Portfolio Turnover Rate(D) | |||||||||||||||||
| 11.43 | %(E) | $ | 216,451 | 0.84 | %(F) | 0.84 | %(F) | 0.03 | %(F) | 27 | % | |||||||||||
| 11.29 | (E) | 64,905 | 1.09 | (F) | 1.09 | (F) | (0.22) | (F) | – | |||||||||||||
| 18.42 | 233,089 | 0.83 | 0.83 | 0.10 | 64 | |||||||||||||||||
| 18.12 | 67,403 | 1.08 | 1.08 | (0.16 | ) | – | ||||||||||||||||
| (8.95 | ) | 243,509 | 0.82 | 0.82 | 0.06 | 37 | ||||||||||||||||
| (9.18 | ) | 76,447 | 1.07 | 1.07 | (0.19 | ) | – | |||||||||||||||
| 19.37 | 317,464 | 0.84 | 0.84 | 0.21 | 74 | (H) | ||||||||||||||||
| 19.07 | 108,774 | 1.09 | 1.09 | (0.04 | ) | – | ||||||||||||||||
| 34.24 | 242,406 | 0.88 | 0.88 | 0.44 | 85 | |||||||||||||||||
| 33.90 | 86,556 | 1.13 | 1.13 | 0.20 | – | |||||||||||||||||
| (41.79 | ) | 203,993 | 0.84 | 0.84 | 0.27 | 93 | ||||||||||||||||
| (41.93 | ) | 81,720 | 1.09 | 1.09 | 0.02 | – | ||||||||||||||||
| 21 |
| Hartford Growth HLS Fund |
| Directors and Officers (Unaudited) |
The Board of Directors of the Company appoints officers who are responsible for the day-to-day operations of the Fund and who execute policies formulated by the Directors. Each director serves until his or her death, resignation, or retirement or until the next annual meeting of shareholders is held or until his or her successor is elected and qualifies.
Directors and officers who are employed by or who have a financial interest in The Hartford are considered “interested” persons of the Fund pursuant to the 1940 Act. Each officer and two of the Company’s directors, as noted in the chart below, are “interested” persons of the Fund. Each director serves as a director for The Hartford Mutual Funds, Inc., The Hartford Mutual Funds II, Inc., Hartford Series Fund, Inc., Hartford HLS Series Fund II, Inc., and as a trustee for The Hartford Alternative Strategies Fund, which, as of June 30, 2013, collectively consist of 90 funds. Correspondence may be sent to directors and officers c/o Hartford Mutual Funds, P.O. Box 2999, Hartford, Connecticut 06104-2999, except that correspondence to Mr. Annoni, Mr. Dressen, Ms. Fagely and Ms. Quade may be sent to 500 Bielenberg Drive, Woodbury, Minnesota 55125 and correspondence to Mr. Davey and Mr. Melcher may be sent to 5 Radnor Corporate Center, Suite 300, 100 Matsonford Road, Radnor, Pennsylvania 19087.
The table below sets forth, for each director and officer, his or her name, year of birth, current position with the Company and date first elected or appointed to Hartford Series Fund, Inc. (“HSF”), and Hartford HLS Series Fund II, Inc. (“HSF2”), principal occupation, and, for directors, other directorships held. The Fund’s statement of additional information contains further information on the directors and is available free of charge by calling 1-800-862-6668 or writing to Hartford HLS Funds, c/o Hartford Life Insurance Company, Hartford Life and Annuity Insurance Company, P.O. Box 14293, Lexington, KY 40512-4293.
Information on the aggregate remuneration paid to the directors of the Company can be found in the Statement of Operations herein. The Fund pays to The Hartford a portion of the Chief Compliance Officer’s compensation, but does not pay salaries or compensation to any of their other officers or directors who are employed by The Hartford.
Non-Interested Directors
Lynn S. Birdsong (1946) Director since 2003, Co-Chairman of the Investment Committee
Mr. Birdsong is a private investor. Mr. Birdsong currently serves as a Director of the Sovereign High Yield Investment Company (April 2010 to current). Mr. Birdsong currently serves as an Independent Director of Nomura Partners Funds, Inc. (formerly, The Japan Fund) (March 2003 to current). From 1979 to 2002, Mr. Birdsong was a managing director of Zurich Scudder Investments, an investment management firm. During his employment with Scudder, Mr. Birdsong was an Interested Director of The Japan Fund. Since 1981, Mr. Birdsong has been a partner in Birdsong Company, an advertising specialty firm.
Robert M. Gavin, Jr. (1940) Director since 2002 (HSF) and 1986 (HSF2), Chairman of the Board since 2004
Dr. Gavin is an educational consultant. Prior to September 1, 2001, he was President of Cranbrook Education Community and prior to July 1996, he was President of Macalester College, St. Paul, Minnesota.
Duane E. Hill (1945) Director since 2001 (HSF) and 2002 (HSF2), Chairman of the Nominating Committee
Mr. Hill is Partner of TSG Ventures L.P., a private equity investment company. Mr. Hill is a former partner of TSG Capital Group, a private equity investment firm that served as sponsor and lead investor in leveraged buyouts of middle market companies.
Sandra S. Jaffee (1941) Director since 2005
Ms. Jaffee is the founder and Chief Executive Officer of a private company, Homeworks Concierge, LLC, which provides residential property management services in Westchester County, New York (January 2012 to present). Ms. Jaffee served as Chairman (2008 to 2009) and Chief Executive Officer of Fortent (formerly Searchspace Group), a leading provider of compliance/regulatory technology to financial institutions from August 2005 to August 2009. Ms. Jaffee currently serves as a member of the Board of Directors of Broadridge Financial Solutions as well as a Trustee of Muhlenberg College.
William P. Johnston (1944) Director since 2005, Chairman of the Compliance Committee
In February 2008, Mr. Johnston was elected to the Board of Directors of HCR-ManorCare, Inc. In August 2007, Mr. Johnston was elected to the Board of Directors of LifeCare Holdings, Inc. In July 2006, Mr. Johnston was elected to the Board of Directors of MultiPlan, Inc. and served as a director (July 2006 to August 2010). In June 2006, Mr. Johnston was appointed as Senior Advisor to The Carlyle Group, a global private equity and alternative asset investment firm. In May 2006, Mr. Johnston was elected to the Supervisory Board of Fresenius Medical Care AG & Co. KGaA, after its acquisition of Renal Care Group, Inc. in March 2006.
| 22 |
Phillip O. Peterson (1944) Director since 2002 (HSF) and 2000 (HSF2), Chairman of the Audit Committee
Mr. Peterson is a mutual fund industry consultant. He was a partner of KPMG LLP (an accounting firm) until July 1999. Mr. Peterson joined William Blair Funds in February 2007 as a member of the Board of Trustees. Mr. Peterson also joined the Board of Trustees of Symetra Variable Mutual Funds Trust as a trustee in February 2012.
Lemma W. Senbet (1946) Director since 2005
Dr. Senbet is the William E. Mayer Chair Professor of Finance and Director, Center for Financial Policy, at the University of Maryland, Robert H. Smith School of Business. He was chair of the Finance Department from 1998 to 2006. Previously he was a chaired professor of finance at the University of Wisconsin-Madison. Also, he was director of the Fortis Funds from March 2000 to July 2002. Dr. Senbet served the finance profession in various capacities, including as director of the American Finance Association and President of the Western Finance Association. In 2006, Dr. Senbet was inducted Fellow of Financial Management Association International for his career-long distinguished scholarship and professional service.
Interested Directors and Officers
James E. Davey (1964) Director since 2012, President and Chief Executive Officer since 2010
Mr. Davey serves as Executive Vice President of Hartford Life Insurance Company (“HLIC”) and The Hartford Financial Services Group, Inc. Additionally, Mr. Davey serves as Chairman of the Board and Manager of Hartford Funds Distributors, LLC (“HFD”) and Hartford Administrative Services Company (“HASCO”). Mr. Davey also serves as Manager, President and Chairman of the Board for Hartford Funds Management Company, LLC (“HFMC”). Mr. Davey joined The Hartford in 2002.
Lowndes A. Smith (1939) Director since 1996 (HSF) and 2002 (HSF2), Co-Chairman of the Investment Committee
Mr. Smith served as Vice Chairman of The Hartford from February 1997 to January 2002, as President and Chief Executive Officer of Hartford Life, Inc. from February 1997 to January 2002, and as President and Chief Operating Officer of The Hartford Life Insurance Companies from January 1989 to January 2002. Mr. Smith serves as a Director of White Mountains Insurance Group, Ltd., One Beacon Insurance and Symetra Financial and as Managing Director of Whittington Gray Associates.
Other Officers
Mark A. Annoni (1964) Vice President, Controller and Treasurer since 2012
Mr. Annoni serves as the Assistant Vice President of HLIC (February 2004 to present). Mr. Annoni joined The Hartford in April 2001 as part of The Hartford’s acquisition of Fortis Financial Group (“Fortis”). Prior to joining The Hartford, Mr. Annoni served as Manager of Mutual Fund Accounting at Fortis (July 1997 to April 2001).
Michael R. Dressen (1963) AML Compliance Officer since 2011
Mr. Dressen currently serves as Assistant Vice President of HLIC. He also serves as Chief Compliance Officer and AML Compliance Officer of HASCO and as AML Officer of HFD. Mr. Dressen joined The Hartford in 2005 from State Farm Insurance Companies where he held various positions related to mutual funds, variable products, and property casualty insurance.
Tamara L. Fagely (1958) Vice President since 2002 (HSF) and 1993 (HSF2)
Currently, Ms. Fagely is President and a Director of HASCO, Chief Administrative Officer and Manager of HFMC and a Vice President of HLIC. Ms. Fagely served as a Vice President of HASCO (1998-2013) and Chief Financial Officer of HASCO (2006-2013). She served as Assistant Vice President of HLIC from December 2001 through March 2005. In addition, Ms. Fagely is Manager and Chief Operating Officer of HFD.
Edward P. Macdonald (1967) Vice President, Secretary and Chief Legal Officer since 2005
Mr. Macdonald serves as Vice President of HLIC and Vice President, Chief Legal Officer and Secretary of HFD and HASCO. Mr. Macdonald also serves as Manager, Vice President, Chief Legal Officer and Secretary of HFMC. Mr. Macdonald joined The Hartford in 2005.
Joseph G. Melcher (1973) Vice President and Chief Compliance Officer since 2013(1)
Mr. Melcher currently serves as Vice President of HFMC and HFD. Mr. Melcher joined The Hartford in 2012 from Touchstone Investments, a member of the Western & Southern Financial Group, where he held the position of Vice President and Chief Compliance Officer from 2010 through 2012 and Assistant Vice President, Compliance from 2005 to 2010.
| (1) | Mr. Melcher was named Vice President and Chief Compliance Officer of HSF and HSF2 on February 6, 2013. Prior to February 6, 2013, Colleen Pernerewski served as Chief Compliance Officer of HSF and HSF2. |
| 23 |
| Hartford Growth HLS Fund |
| Directors and Officers (Unaudited) – (continued) |
Vernon J. Meyer (1964) Vice President since 2006
Mr. Meyer serves as Senior Vice President of HLIC. He also serves as Senior Vice President of HFMC and HFD. Mr. Meyer joined The Hartford in 2004.
Laura S. Quade (1969) Vice President since 2012
Ms. Quade currently serves as Vice President of HASCO and is a Director of Mutual Fund Service Operations. She also serves as Director, Enterprise Operations of HFD and HLIC. Ms. Quade joined The Hartford in 2001 as part of The Hartford’s acquisition of Fortis.
Elizabeth L. Schroeder (1966) Vice President since 2010(2)
Ms. Schroeder currently serves as Assistant Vice President of HLIC. Ms. Schroeder joined HLIC in 1991. She is also an Assistant Vice President of HFMC and HASCO.
(2) Ms. Schroeder served as Vice President of HSF and HSF2 until August 7, 2013.
Martin Swanson (1962) Vice President since 2010
Mr. Swanson is a Vice President of HLIC. Mr. Swanson also serves as Chief Marketing Officer for HFD. Prior to joining HLIC in 1998, Mr. Swanson was a Vice President at PaineWebber, Inc.
HOW TO OBTAIN A COPY OF THE FUND’S PROXY VOTING POLICIES AND VOTING RECORDS (UNAUDITED)
A description of the policies and procedures that the Fund uses to determine how to vote proxies relating to portfolio securities and information about how the Fund voted proxies relating to portfolio securities during the most recent twelve-month period ended June 30 are available (1) without charge, upon request, by calling 800-862-6668 and (2) on the SEC’s website at http://www.sec.gov.
QUARTERLY PORTFOLIO HOLDINGS INFORMATION (UNAUDITED)
The Fund files a complete schedule of portfolio holdings with the SEC for the first and third quarters of each fiscal year on Form N-Q. The Fund’s Forms are available (1) without charge, upon request, by calling 800-862-6668 and (2) on the SEC’s website at http://www.sec.gov. The Form N-Q may be reviewed and copied at the SEC’s Public Reference Room in Washington, DC. Information on the operation of the Public Reference Room may be obtained by calling 1-800-SEC-0330.
| 24 |
| Hartford Growth HLS Fund |
| Expense Example (Unaudited) |
Your Fund's Expenses
As a shareholder of the Fund, you incur two types of costs: (1) transaction costs and (2) ongoing costs including investment management fees, distribution fees, if any, and other fund expenses. This example is intended to help you understand your ongoing costs (in dollars) of investing in the Fund and to compare these costs with the ongoing costs of investing in other mutual funds. The example is based on an investment of $1,000 invested at the beginning of the period and held for the period of December 31, 2012 through June 30, 2013.
Actual Expenses
The first set of columns of the table below provides information about actual account values and actual expenses. You may use the information in this column, together with the amount you invested, to estimate the expenses that you paid over the period. Simply divide your account value by $1,000 (for example, an $8,600 account value divided by $1,000 = 8.6), then multiply the result by the number in the line under the heading entitled “Expenses Paid During Period” to estimate the expenses you paid on your account during this period.
Hypothetical Example for Comparison Purposes
The second set of columns of the table below provides information about hypothetical account values and hypothetical expenses based on the Fund’s actual expense ratio and an assumed rate of return of 5% per year before expenses, which is not the Fund’s actual return. The hypothetical account values and expenses may not be used to estimate the actual ending account balance or expenses you paid for the period. You may use this information to compare the ongoing costs of investing in the Fund and other funds. To do so, compare this 5% hypothetical example with the 5% hypothetical examples that appear in the shareholder reports of the other funds.
Please note that the expenses shown in the table are meant to highlight your ongoing costs only and do not reflect any transactional costs, such as sales charges (loads) and CDSC. Therefore, the second set of columns of the table is useful in comparing ongoing costs only, and will not help you determine the relative total costs of owning different funds. In addition, if these transactional costs were included, your costs would be higher. Expenses are equal to the Fund's annualized expense ratios multiplied by average account value over the period, multiplied by 181/365 (to reflect the one-half year period).
| Actual return | Hypothetical (5% return before expenses) | |||||||||||||||||||||||||||||||
| Beginning Account Value December 31, 2012 | Ending Account Value June 30, 2013 | Expenses paid during the period December 31, 2012 through June 30, 2013 | Beginning Account Value December 31, 2012 | Ending Account Value June 30, 2013 | Expenses paid during the period December 31, 2012 through June 30, 2013 | Annualized expense ratio | Days in the current 1/2 year | Days in the full year | ||||||||||||||||||||||||
| Class IA | $ | 1,000.00 | $ | 1,114.30 | $ | 4.40 | $ | 1,000.00 | $ | 1,020.63 | $ | 4.21 | 0.84 | % | 181 | 365 | ||||||||||||||||
| Class IB | $ | 1,000.00 | $ | 1,112.90 | $ | 5.71 | $ | 1,000.00 | $ | 1,019.39 | $ | 5.46 | 1.09 | % | 181 | 365 | ||||||||||||||||
| 25 |
| Hartford Growth HLS Fund |
| Principal Risks (Unaudited) |
The principal risks of investing in the Fund are described below.
Market, Selection, and Strategy Risk: The Fund’s share price may fluctuate due to market risk and/or security selections that may underperform the market or relevant benchmarks. If the sub-adviser’s investment strategy does not perform as expected, the Fund could underperform its peers or lose money. There is no guarantee the Fund will achieve its stated objective.
Growth Investing Risk: Growth investments can be volatile, and may fail to increase earnings or grow as quickly as anticipated. Growth-style investing falls in and out of favor, which may result in periods of underperformance.
Foreign Investment Risk: Foreign investments can be riskier than U.S. investments. Potential risks include currency risk that may result from unfavorable exchange rates, liquidity risk if decreased demand for a security makes it difficult to sell at the desired price, and risks that stem from substantially lower trading volume on foreign markets.
| 26 |
HARTFORD HLS FUNDS
c/o The Hartford Wealth Management - Global Annuities
P.O. Box 14293
Lexington, KY 40512-4293
HARTFORDFUNDS
hartfordfunds.com
Hartford Series Fund, Inc. is underwritten and distributed by Hartford Funds Distributors, LLC.
Hartford Series Fund, Inc. inception dates range from 1977 to date. Hartford Series Fund, Inc. is not a subsidiary of The Hartford Financial Services Group, Inc. ("The Hartford") but is underwritten, distributed by and advised by subsidiaries of The Hartford. Investments in Hartford Series Fund, Inc. are not guaranteed by The Hartford or any other entity.
You should carefully consider investment objectives, risks, and charges and expenses of Hartford HLS Funds before investing. This and other information can be found in the Fund’s prospectus or summary prospectus, which can be obtained by calling 800-862-6668. Please read them carefully before you invest or send money.
HLSSAR-G13 8-13 113541-1 Printed in U.S.A ©2013 The Hartford, Hartford, CT 06115
HARTFORDFUNDS
| HARTFORD HEALTHCARE
HLS FUND
2013 Semi Annual Report
|
A MESSAGE FROM THE PRESIDENT
Dear Fellow Shareholders:
I want to take this opportunity to say thank you for investing in the Hartford HLS Funds.
Market Review
During the first half of the year, stocks rose steadily. U.S. equities (as represented by the S&P 500 Index1) posted a strong gain of 10.61% during the first quarter, on their way to an all-time high. During the second quarter, investors persevered through volatility surrounding rumors of the rollback of the U.S. Federal Reserve’s quantitative easing (QE) program later this year, and the S&P 500 Index rose 2.91%. That brought the market’s rise to 13.82% for the first half of 2013. The rumors about QE’s end sent bond yields and mortgage rates upward, but that wasn’t enough to dissuade investors from pushing equities into positive territory.
Because of QE, some have expressed concerns regarding the recent market rally. But a more careful examination of economic data reveals a strong foundation. Consumer balance sheets have improved since the financial crisis, with consumer debt as a percentage of income falling steadily. Housing continued its dogged recovery, fueled by population growth and pent-up demand. In fact, it’s substantive economic improvements that have moved Federal Reserve Chairman Ben Bernanke to consider removing the “training wheels” of QE, which we think should be viewed as a vote of confidence in the U.S. economy going forward.
As the U.S. outlook continues to improve, concerns do remain in the global economy. Emerging markets have lagged due to social unrest and rising inflation. Slowing growth in China is clouding global growth forecasts, but it’s important to remember that China still boasts 7.5% annual GDP growth.
It’s important to stay abreast of domestic and international economic developments while balancing your individual investment goals. Meeting with your financial advisor on a regular basis to examine your current investment strategy can help you determine whether you are on the right track:
| • | Is your portfolio fully diversified with an appropriate mix of stocks and bonds? |
| • | Is your fixed-income portfolio positioned to take advantage of opportunities across the credit spectrum and fulfill your income needs? |
| • | Is your portfolio still in line with your risk tolerance and investment time horizon? |
Your financial professional can help you choose options within our fund family to navigate today’s markets with confidence.
Thank you again for investing with the Hartford HLS Funds.
James Davey
President
Hartford HLS Funds
1 The S&P 500 Index is a market capitalization-weighted price index composed of 500 widely held common stocks.
Table of Contents
This report is prepared for the general information of contract owners and qualified retirement plan participants. It is not an offer of contracts or of qualified retirement plans. It should not be used in connection with any offer, except in conjunction with the appropriate product prospectus which contains all pertinent information including the applicable sales, administrative and other charges.
The views expressed in the Fund’s Manager Discussion under ‘‘Why did the Fund perform this way?’’ and ‘‘What is the outlook?’’ are views of the Fund’s sub-adviser and portfolio management team through the end of the period and are subject to change based on market and other conditions. The Fund’s Manager Discussion is for informational purposes only and does not represent an offer, recommendation or solicitation to buy, hold or sell any security. The specific securities identified and described, if any, do not represent all of the securities purchased or sold and you should not assume that investments in the securities identified and discussed will be profitable.
| Hartford Healthcare HLS Fund inception 05/01/2000 |
| (sub-advised by Wellington Management Company, LLP) |
| Investment objective – Seeks long-term capital appreciation. |
Performance Overview 6/30/03 - 6/30/13
The chart above represents the hypothetical growth of a $10,000 investment in Class IA. Growth results in classes other than Class IA will vary from what is seen above due to differences in the expenses charged to those share classes.
| Average Annual Total Returns (as of 6/30/13) |
| 6 Month† | 1 Year | 5 Years | 10 Years | |||||||||||||
| Healthcare IA | 22.17% | 26.49% | 11.33% | 10.17% | ||||||||||||
| Healthcare IB | 22.00% | 26.16% | 11.05% | 9.90% | ||||||||||||
| S&P 500 Index | 13.82% | 20.58% | 7.00% | 7.29% | ||||||||||||
| S&P North American Health Care Sector Index | 20.78% | 28.22% | 12.83% | 8.79% | ||||||||||||
| † | Not Annualized |
PERFORMANCE DATA QUOTED REPRESENTS PAST PERFORMANCE AND DOES NOT GUARANTEE FUTURE RESULTS. The investment return and principal value of the investment will fluctuate so that investors’ shares, when redeemed, may be worth more or less than their original cost. Current performance may be lower or higher than the performance data quoted. To obtain performance data current to the most recent month-end, please visit our website www.hartfordfunds.com.
| Total returns presented above were calculated using the Fund's net asset value available to shareholders for sale or redemption of Fund shares on June 30, 2013, which may exclude investment transactions as of this date. All share class returns assume the reinvestment of all distributions at net asset value and the deduction of all fund expenses. |
S&P 500 Index is a market capitalization-weighted price index composed of 500 widely held common stocks.
S&P North American Health Care Sector Index is a modified capitalization-weighted index based on United States headquartered health care companies. Stocks in the index are weighted such that each stock is no more than 7.5% of the market capitalization as of the most recent reconstitution date. The companies included in the index must be common stocks and be traded on the American Stock Exchange, Nasdaq or the New York Stock Exchange and meet certain established market capitalization levels.
You cannot invest directly in an index.
As of the Fund’s current prospectus dated May 1, 2013, the total annual operating expense ratios for Class IA and Class IB shares were 0.91% and 1.16%, respectively. Actual expenses may be higher. Please see the accompanying Financial Highlights for expense ratios for the six-month period ended June 30, 2013.
The chart and table do not reflect the deductions of taxes, sales charges or other fees which may be applied at the variable life insurance, variable annuity or qualified retirement plan product level. Any such additional sales charges or other fees or expenses would lower the contract’s or plan’s performance.
All investments are subject to risk including the possible loss of principal. For a discussion of the Fund’s risks, please see the Principal Risks section. For more detailed information on the risks associated with an investment in the Fund, please see the prospectus.
| 2 |
| Hartford Healthcare HLS Fund |
| Manager Discussion |
| June 30, 2013 (Unaudited) |
| Portfolio Managers | |||
| Ann C. Gallo | Jean M. Hynes, CFA | Robert L. Deresiewicz | Kirk J. Mayer, CFA |
Senior Vice President and Global Industry Analyst | Senior Vice President and Global Industry Analyst | Senior Vice President and Global Industry Analyst | Senior Vice President and Global Industry Analyst |
How did the Fund perform?
The Class IA shares of the Hartford Healthcare HLS Fund returned 22.17% for the six-month period ended June 30, 2013, outperforming its benchmark, the S&P North American Health Care Sector Index, which returned 20.78% for the same period. The Fund outperformed the 20.18% average return of the Variable Products-Underlying Funds Lipper Health and Biotechnology Funds peer group, a group of funds with investment strategies similar to those of the Fund.
Why did the Fund perform this way?
Health Care stocks (+21%) outperformed both the broader U.S. market (+14%) and the global equity market (+9%) during the period, as measured by the S&P North American Health Care Sector, S&P 500, and the MSCI World Indexes, respectively. Within the S&P North American Health Care Sector Index, all four sub-sectors posted positive returns. Specialty Pharmaceuticals/Biotechnology (+28%) gained the most while Health Services rose 22%, Major Pharmaceuticals rose 20%, and Medical Technology rose 13%.
The Fund outperformed its benchmark primarily due to strong security selection. Positive stock selection in Medical Technology and Health Services was the primary driver of the Fund’s relative outperformance, more than offsetting weak security selection in Specialty Pharmaceuticals/Biotechnology and Major Pharmaceuticals. Sector allocation had a neutral impact on relative performance with an underweight (i.e. the Fund’s position was less than the benchmark position) to Medical Technology and an overweight to Specialty Pharmaceuticals/Biotechnology helping relative performance.
Holdings of TESARO (Specialty Pharmaceuticals), Alkermes (Specialty Pharmaceuticals), and Boston Scientific (Medical Technology) contributed most to benchmark-relative results. Oncology-focused biopharmaceutical company TESARO saw shares rise as investors continued to gain confidence in their robust drug pipeline focused on cancer. Shares of drug developer Alkermes rose on the announcement of positive phase two test results from its depression drug. Shares of medical technology company Boston Scientific responded positively to management’s plans for longer-term growth presented during the first quarter. Top contributors to absolute performance (i.e. total return) during the period also included Gilead Sciences (Specialty Pharmaceuticals) and CIGNA (Health Services).
Holdings of Orthofix International (Medical Technology), Celgene (Specialty Pharmaceuticals), and Volcano (Medical Technology) detracted from benchmark-relative performance. Medical device company Orthofix International saw its shares trade lower following the release of earnings results below investor expectations. Not owning global biotechnology company Celgene hurt relative performance as the stock is a component of the benchmark and had strong performance during the period after the company reported better-than-expected long term guidance. Shares of Volcano Corporation, designer, manufacturer, and retailer of precision guided therapy tools, fell after management provided revenue and earnings guidance below expectations. Top detractors from absolute performance during the period also included Infinity Pharmaceutical (Specialty Pharmaceuticals) and Rigel Pharmaceutical (Specialty Pharmaceuticals).
What is the outlook?
While the U.S. elections and Fiscal Cliff are behind us, we continue to believe that further Medicare and Medicaid cuts are inevitable as the U.S. Congress seeks to avoid prolonged sequestration, address the debt ceiling limit, and fund appropriations. While painful, this approach will undoubtedly result in more targeted, thoughtful changes than the 2% across the board cut to Medicare reimbursement currently dictated by sequestration. As we have said in the past, while it is impossible at this point to predict the details, the outcome appears clear. The bar has been raised for companies seeking reimbursement for health care products and services in the U.S. and across the globe. Going forward, we believe success will accrue only to those companies able to offer a demonstrable improvement over current standards of care, or alternatively, to those companies able to offer an equivalent level of care but at lower cost. This is one of the key tenets upon which we have structured the Fund’s portfolio.
We continue to find attractive investments within the Pharmaceutical and Biotechnology sectors, despite recent strength. Pipelines of several major biopharmaceutical companies are meaningfully improved relative to where they have been in recent years, and investors have begun to look through the current period of patent expiries. Cost-cutting measures, strong growth in emerging markets, and the improving Food and Drug Administration posture are all also contributing to the favorable outlook. Japanese pharmaceutical
| 3 |
| Hartford Healthcare HLS Fund |
| Manager Discussion – (continued) |
| June 30, 2013 (Unaudited) |
companies remain attractive given their strong balance sheets and the value of their pipelines relative to the companies’ current market capitalizations.
Within Medical Technology, we continue to look for companies with underappreciated franchises or promising Research & Development projects. We continue to believe that cardiovascular disease represents one of the strongest areas for growth, with a large, under-penetrated market particularly for atrial fibrillation procedures. We believe longer-term prospects for the industry remain solid, as procedure volumes return to normal after the slowdown in 2010 - 2011 and emerging markets become more significant growth drivers.
Within Health Care Services, relative to recent years, the Fund’s holdings are more diversified among the various subsectors. Despite the near term uncertainty, we believe managed care companies are best positioned to address the cost issue longer term. While uncertainty regarding the implementation of Affordable Care Act (ACA) exchanges will overhang the group in the near/intermediate term, ultimately we believe that the impact of exchanges on the HMOs (health maintenance organization) will not be as bad as feared. We also believe drug distributors and drug stores, which we believe should continue to benefit from the ongoing conversion of approximately U.S. $100 billion of branded pharmaceuticals to generics over the next several years.
Internationally, we see a number of attractive opportunities in emerging market stocks. In addition to the burgeoning middle class, many emerging market countries are attempting to increase domestic spending on health care and are increasingly looking to the private sector to achieve this objective.
| Diversification by Industry | ||||
| as of June 30, 2013 | ||||
| Industry | Percentage of Net Assets | |||
| Biotechnology | 24.5 | % | ||
| Drug Retail | 3.9 | |||
| Health Care Distributors | 5.6 | |||
| Health Care Equipment | 19.4 | |||
| Health Care Facilities | 1.8 | |||
| Health Care Services | 0.2 | |||
| Health Care Supplies | 0.4 | |||
| Health Care Technology | 0.8 | |||
| Life Sciences Tools and Services | 3.2 | |||
| Managed Health Care | 10.3 | |||
| Pharmaceuticals | 27.5 | |||
| Research and Consulting Services | 1.6 | |||
| Short-Term Investments | 0.5 | |||
| Other Assets and Liabilities | 0.3 | |||
| Total | 100.0 | % | ||
| 4 |
| Hartford Healthcare HLS Fund |
| Schedule of Investments |
| June 30, 2013 (Unaudited) |
| (000’s Omitted) |
| Shares or Principal Amount | Market Value ╪ | |||||||
COMMON STOCKS - 99.2% | ||||||||
| Biotechnology - 24.5% | ||||||||
| 25 | Acorda Therapeutics, Inc. ● | $ | 808 | |||||
| 52 | Algeta ASA ● | 1,998 | ||||||
| 177 | Alkermes plc ● | 5,081 | ||||||
| 264 | Anacor Pharmaceuticals, Inc. ● | 1,478 | ||||||
| 146 | Arena Pharmaceuticals, Inc. ● | 1,122 | ||||||
| 11 | Biogen Idec, Inc. ● | 2,359 | ||||||
| 90 | Celldex Therapeutics, Inc. ● | 1,402 | ||||||
| 38 | Cubist Pharmaceuticals, Inc. ● | 1,845 | ||||||
| 364 | Elan Corp. plc ADR ● | 5,146 | ||||||
| 372 | Exelixis, Inc. ● | 1,687 | ||||||
| 243 | Gilead Sciences, Inc. ● | 12,465 | ||||||
| 75 | Incyte Corp. ● | 1,639 | ||||||
| 43 | Infinity Pharmaceuticals, Inc. ● | 691 | ||||||
| 102 | Ironwood Pharmaceuticals, Inc. ● | 1,013 | ||||||
| 70 | NPS Pharmaceuticals, Inc. ● | 1,049 | ||||||
| 27 | Onyx Pharmaceuticals, Inc. ● | 2,382 | ||||||
| 11 | Prosensa Holdings B.V. ● | 210 | ||||||
| 16 | Puma Biotechnology, Inc. ● | 723 | ||||||
| 27 | Regeneron Pharmaceuticals, Inc. ● | 6,072 | ||||||
| 262 | Rigel Pharmaceuticals, Inc. ● | 874 | ||||||
| 57 | Seattle Genetics, Inc. ● | 1,803 | ||||||
| 150 | Tesaro, Inc. ● | 4,914 | ||||||
| 41 | Vertex Pharmaceuticals, Inc. ● | 3,235 | ||||||
| 59,996 | ||||||||
| Drug Retail - 3.9% | ||||||||
| 83 | CVS Caremark Corp. | 4,731 | ||||||
| 110 | Walgreen Co. | 4,855 | ||||||
| 9,586 | ||||||||
| Health Care Distributors - 5.6% | ||||||||
| 90 | Cardinal Health, Inc. | 4,254 | ||||||
| 83 | McKesson Corp. | 9,497 | ||||||
| 13,751 | ||||||||
| Health Care Equipment - 19.4% | ||||||||
| 80 | Abbott Laboratories | 2,776 | ||||||
| 59 | ABIOMED, Inc. ● | 1,274 | ||||||
| 548 | Boston Scientific Corp. ● | 5,084 | ||||||
| 111 | Covidien plc | 6,961 | ||||||
| 126 | Globus Medical, Inc. ● | 2,120 | ||||||
| 47 | Heartware International, Inc. ● | 4,475 | ||||||
| 80 | Hologic, Inc. ● | 1,535 | ||||||
| 128 | Medtronic, Inc. | 6,593 | ||||||
| 105 | Orthofix International N.V. ● | 2,811 | ||||||
| 70 | St. Jude Medical, Inc. | 3,209 | ||||||
| 65 | Stryker Corp. | 4,211 | ||||||
| 138 | Tornier N.V. ● | 2,422 | ||||||
| 98 | Volcano Corp. ● | 1,775 | ||||||
| 28 | Zimmer Holdings, Inc. | 2,079 | ||||||
| 47,325 | ||||||||
| Health Care Facilities - 1.8% | ||||||||
| 62 | HCA Holdings, Inc. | 2,238 | ||||||
| 98 | Health Management Associates, Inc. Class A ● | 1,536 | ||||||
| 132 | NMC Health plc | 542 | ||||||
| 4,316 | ||||||||
| Health Care Services - 0.2% | ||||||||
| 63 | Al Noor Hospitals Group ● | 608 | ||||||
| Health Care Supplies - 0.4% | ||||||||
| 25 | Dentsply International, Inc. | 1,032 | ||||||
| Health Care Technology - 0.8% | ||||||||
| 155 | Allscripts Healthcare Solutions, Inc. ● | 2,003 | ||||||
| Life Sciences Tools and Services - 3.2% | ||||||||
| 78 | Agilent Technologies, Inc. | 3,340 | ||||||
| 39 | Covance, Inc. ● | 3,001 | ||||||
| 26 | MorphoSys AG ● | 1,447 | ||||||
| 7,788 | ||||||||
| Managed Health Care - 10.3% | ||||||||
| 75 | Aetna, Inc. | 4,781 | ||||||
| 109 | CIGNA Corp. | 7,935 | ||||||
| 73 | Qualicorp S.A. ● | 553 | ||||||
| 181 | UnitedHealth Group, Inc. | 11,875 | ||||||
| 25,144 | ||||||||
| Pharmaceuticals - 27.5% | ||||||||
| 32 | Actavis, Inc. ● | 4,036 | ||||||
| 40 | Almirall S.A. | 510 | ||||||
| 27 | Astellas Pharma, Inc. | 1,453 | ||||||
| 43 | AstraZeneca plc ADR | 2,048 | ||||||
| 235 | Bristol-Myers Squibb Co. | 10,480 | ||||||
| 78 | Cadence Pharmaceuticals, Inc. ● | 534 | ||||||
| 140 | Daiichi Sankyo Co., Ltd. | 2,330 | ||||||
| 43 | Dr. Reddy's Laboratories Ltd. ADR ● | 1,611 | ||||||
| 55 | Eisai Co., Ltd. | 2,236 | ||||||
| 105 | Eli Lilly & Co. | 5,137 | ||||||
| 138 | Forest Laboratories, Inc. ● | 5,669 | ||||||
| 24 | H. Lundbeck A/S | 424 | ||||||
| 44 | Johnson & Johnson | 3,818 | ||||||
| 99 | Medicines Co. ● | 3,046 | ||||||
| 112 | Merck & Co., Inc. | 5,181 | ||||||
| 92 | Mylan, Inc. ● | 2,863 | ||||||
| 17 | Ono Pharmaceutical Co., Ltd. | 1,123 | ||||||
| 78 | Optimer Pharmaceuticals, Inc. ● | 1,123 | ||||||
| 11 | Salix Pharmaceuticals Ltd. ● | 700 | ||||||
| 211 | Shionogi & Co., Ltd. | 4,393 | ||||||
| 139 | Teva Pharmaceutical Industries Ltd. ADR | 5,445 | ||||||
| 46 | UCB S.A. | 2,450 | ||||||
| 130 | Xenoport, Inc. ● | 642 | ||||||
| 67,252 | ||||||||
| Research and Consulting Services - 1.6% | ||||||||
| 90 | Quintiles Transnational Holdings ● | 3,809 | ||||||
| Total common stocks | ||||||||
| (cost $183,423) | $ | 242,610 | ||||||
| Total long-term investments (cost $183,423) | $ | 242,610 | ||||||
| SHORT-TERM INVESTMENTS - 0.5% | ||||||||
| Repurchase Agreements - 0.5% | ||||||||
| Bank of America Merrill Lynch TriParty Repurchase Agreement (maturing on 07/01/2013 in the amount of $5, collateralized by GNMA 3.00%, 2042, value of $5) | ||||||||
| $ | 5 | 0.13%, 6/28/2013 | $ | 5 | ||||
The accompanying notes are an integral part of these financial statements.
| 5 |
| Hartford Healthcare HLS Fund |
| Schedule of Investments – (continued) |
| June 30, 2013 (Unaudited) |
| (000’s Omitted) |
| Shares or Principal Amount | Market Value ╪ | |||||||||||
| SHORT-TERM INVESTMENTS - 0.5% - (continued) | ||||||||||||
| Repurchase Agreements - 0.5% - (continued) | ||||||||||||
| Bank of Montreal TriParty Repurchase Agreement (maturing on 07/01/2013 in the amount of $97, collateralized by FHLMC 4.00% - 5.00%, 2023 - 2025, FNMA 2.00% - 5.00%, 2022 - 2042, GNMA 2.00% - 5.00%, 2041 - 2043, value of $98) | ||||||||||||
| $ | 97 | 0.15%, 6/28/2013 | $ | 97 | ||||||||
| Bank of Montreal TriParty Repurchase Agreement (maturing on 07/01/2013 in the amount of $188, collateralized by FHLB 0.38%, 2015, FHLMC 0.38%, 2014, FNMA 0.50% - 5.50%, 2015 - 2042, value of $191) | ||||||||||||
| 188 | 0.12%, 6/28/2013 | 188 | ||||||||||
| Barclays Capital TriParty Repurchase Agreement (maturing on 07/01/2013 in the amount of $130, collateralized by U.S. Treasury Note 3.13%, 2021, value of $132) | ||||||||||||
| 130 | 0.10%, 6/28/2013 | 130 | ||||||||||
| Citigroup Global Markets, Inc. TriParty Repurchase Agreement (maturing on 07/01/2013 in the amount of $383, collateralized by U.S. Treasury Bill 0.85%, 2013, U.S. Treasury Note 0.63% - 3.25%, 2013 - 2018, value of $389) | ||||||||||||
| 383 | 0.10%, 6/28/2013 | 383 | ||||||||||
| Deutsche Bank Securities TriParty Repurchase Agreement (maturing on 07/01/2013 in the amount of $5, collateralized by FNMA 4.50%, 2035, value of $5) | ||||||||||||
| 4 | 0.25%, 6/28/2013 | 4 | ||||||||||
| RBS Securities, Inc. TriParty Repurchase Agreement (maturing on 07/01/2013 in the amount of $154, collateralized by U.S. Treasury Note 1.00% - 2.63%, 2014 - 2020, value of $157) | ||||||||||||
| 154 | 0.10%, 6/28/2013 | 154 | ||||||||||
| TD Securities TriParty Repurchase Agreement (maturing on 07/01/2013 in the amount of $271, collateralized by FHLMC 3.50% - 4.00%, 2042, FNMA 3.50% - 4.50%, 2041 - 2042, value of $276) | ||||||||||||
| 271 | 0.12%, 6/28/2013 | 271 | ||||||||||
| UBS Securities, Inc. Repurchase Agreement (maturing on 07/01/2013 in the amount of $4, collateralized by U.S. Treasury Note 0.63%, 2014, value of $4) | ||||||||||||
| 4 | 0.09%, 6/28/2013 | 4 | ||||||||||
| 1,236 | ||||||||||||
| Total short-term investments | ||||||||||||
| (cost $1,236) | $ | 1,236 | ||||||||||
| Total investments | ||||||||||||
| (cost $184,659) ▲ | 99.7 | % | $ | 243,846 | ||||||||
| Other assets and liabilities | 0.3 | % | 710 | |||||||||
| Total net assets | 100.0 | % | $ | 244,556 | ||||||||
The accompanying notes are an integral part of these financial statements.
| 6 |
| Note: | Percentage of investments as shown is the ratio of the total market value to total net assets. |
Prices of foreign equities that are principally traded on certain foreign markets may be adjusted daily pursuant to a fair value pricing service approved by the Board of Directors in order to reflect an adjustment for factors occurring after the close of certain foreign markets but before the close of the New York Stock Exchange.
| ▲ | At June 30, 2013, the cost of securities for federal income tax purposes was $185,828 and the aggregate gross unrealized appreciation and depreciation based on that cost were: |
| Unrealized Appreciation | $ | 65,396 | ||
| Unrealized Depreciation | (7,378 | ) | ||
| Net Unrealized Appreciation | $ | 58,018 |
| ● | Non-income producing. |
| Foreign Currency Contracts Outstanding at June 30, 2013 | ||||||||||||||||||
| Currency | Buy / Sell | Delivery Date | Counterparty | Contract Amount | Market Value ╪ | Unrealized Appreciation/ (Depreciation) | ||||||||||||
| JPY | Buy | 07/01/2013 | DEUT | $ | 4,891 | $ | 4,823 | $ | (68 | ) | ||||||||
| JPY | Sell | 07/01/2013 | DEUT | 5,256 | 4,823 | 433 | ||||||||||||
| JPY | Sell | 12/20/2013 | DEUT | 5,519 | 5,443 | 76 | ||||||||||||
| $ | 441 | |||||||||||||||||
| ╪ | See Significant Accounting Policies of accompanying Notes to Financial Statements regarding valuation of securities. |
| GLOSSARY: (abbreviations used in preceding Schedule of Investments) | ||
| Counterparty Abbreviations: | ||
| DEUT | Deutsche Bank Securities, Inc. | |
| Currency Abbreviations: | ||
| JPY | Japanese Yen | |
| Other Abbreviations: | ||
| ADR | American Depositary Receipt | |
| FHLB | Federal Home Loan Bank | |
| FHLMC | Federal Home Loan Mortgage Corp. | |
| FNMA | Federal National Mortgage Association | |
| GNMA | Government National Mortgage Association | |
The accompanying notes are an integral part of these financial statements.
| 7 |
| Hartford Healthcare HLS Fund |
| Investment Valuation Hierarchy Level Summary |
| June 30, 2013 (Unaudited) |
| (000’s Omitted) |
| Total | Level 1 ♦ | Level 2 ♦ | Level 3 | |||||||||||||
| Assets: | ||||||||||||||||
| Common Stocks ‡ | $ | 242,610 | $ | 224,670 | $ | 17,940 | $ | – | ||||||||
| Short-Term Investments | 1,236 | – | 1,236 | – | ||||||||||||
| Total | $ | 243,846 | $ | 224,670 | $ | 19,176 | $ | – | ||||||||
| Foreign Currency Contracts * | 509 | – | 509 | – | ||||||||||||
| Total | $ | 509 | $ | – | $ | 509 | $ | – | ||||||||
| Liabilities: | ||||||||||||||||
| Foreign Currency Contracts * | 68 | – | 68 | – | ||||||||||||
| Total | $ | 68 | $ | – | $ | 68 | $ | – | ||||||||
| ♦ | For the six-month period ended June 30, 2013, investments valued at $660 were transferred from Level 1 to Level 2, and investments valued at $423 were transferred from Level 2 to Level 1. Investments are transferred between Level 1 and Level 2 for a variety of reasons including, but not limited to: |
| 1) | Foreign equities for which a fair value price is more representative of exit value than the local market close (transfer into Level 2). Foreign equities for which the local market close is more representative of exit value (transfer into Level 1). |
| 2) | U.S. Treasury securities that no longer represent the most recent issue (transfer into Level 2). |
| 3) | Equity investments with no observable trading but a bid or close price is used (transfer into Level 2). Equity investments using observable quoted prices in an active market (transfer into Level 1). |
| ‡ | The Fund has all or primarily all of the equity securities categorized in a particular level. Refer to the Schedule of Investments for further industry breakout. |
| * | Derivative instruments not reflected in the Schedule of Investments are valued at the unrealized appreciation/depreciation on the investments. |
The accompanying notes are an integral part of these financial statements.
| 8 |
| Hartford Healthcare HLS Fund |
| Statement of Assets and Liabilities |
| June 30, 2013 (Unaudited) |
| (000’s Omitted) |
| Assets: | ||||
| Investments in securities, at market value (cost $184,659) | $ | 243,846 | ||
| Cash | — | |||
| Foreign currency on deposit with custodian (cost $—) | — | |||
| Unrealized appreciation on foreign currency contracts | 509 | |||
| Receivables: | ||||
| Investment securities sold | 332 | |||
| Fund shares sold | 101 | |||
| Dividends and interest | 183 | |||
| Other assets | — | |||
| Total assets | 244,971 | |||
| Liabilities: | ||||
| Unrealized depreciation on foreign currency contracts | 68 | |||
| Payables: | ||||
| Investment securities purchased | 142 | |||
| Fund shares redeemed | 149 | |||
| Investment management fees | 34 | |||
| Distribution fees | 2 | |||
| Accrued expenses | 20 | |||
| Total liabilities | 415 | |||
| Net assets | $ | 244,556 | ||
| Summary of Net Assets: | ||||
| Capital stock and paid-in-capital | $ | 161,263 | ||
| Undistributed net investment income | 1,343 | |||
| Accumulated net realized gain | 22,323 | |||
| Unrealized appreciation of investments and the translations of assets and liabilities denominated in foreign currency | 59,627 | |||
| Net assets | $ | 244,556 | ||
| Shares authorized | 800,000 | |||
| Par value | $ | 0.001 | ||
| Class IA: Net asset value per share | $ | 22.12 | ||
| Shares outstanding | 8,780 | |||
| Net assets | $ | 194,236 | ||
| Class IB: Net asset value per share | $ | 21.61 | ||
| Shares outstanding | 2,329 | |||
| Net assets | $ | 50,320 |
The accompanying notes are an integral part of these financial statements.
| 9 |
| Hartford Healthcare HLS Fund |
| Statement of Operations |
| For the Six-Month Period Ended June 30, 2013 (Unaudited) |
| (000’s Omitted) |
| Investment Income: | ||||
| Dividends | $ | 1,282 | ||
| Interest | 2 | |||
| Less: Foreign tax withheld | (38 | ) | ||
| Total investment income, net | 1,246 | |||
| Expenses: | ||||
| Investment management fees | 962 | |||
| Transfer agent fees | 2 | |||
| Distribution fees - Class IB | 61 | |||
| Custodian fees | 4 | |||
| Accounting services fees | 11 | |||
| Board of Directors' fees | 3 | |||
| Audit fees | 6 | |||
| Other expenses | 30 | |||
| Total expenses (before fees paid indirectly) | 1,079 | |||
| Commission recapture | (3 | ) | ||
| Total fees paid indirectly | (3 | ) | ||
| Total expenses, net | 1,076 | |||
| Net Investment Income | 170 | |||
| Net Realized Gain on Investments and Foreign Currency Transactions: | ||||
| Net realized gain on investments | 6,785 | |||
| Net realized gain on foreign currency contracts | 871 | |||
| Net realized loss on other foreign currency transactions | (10 | ) | ||
| Net Realized Gain on Investments and Foreign Currency Transactions | 7,646 | |||
| Net Changes in Unrealized Appreciation of Investments and Foreign Currency Transactions: | ||||
| Net unrealized appreciation of investments | 35,720 | |||
| Net unrealized depreciation of foreign currency contracts | (164 | ) | ||
| Net unrealized depreciation on translation of other assets and liabilities in foreign currencies | (1 | ) | ||
| Net Changes in Unrealized Appreciation of Investments and Foreign Currency Transactions | 35,555 | |||
| Net Gain on Investments and Foreign Currency Transactions | 43,201 | |||
| Net Increase in Net Assets Resulting from Operations | $ | 43,371 |
The accompanying notes are an integral part of these financial statements.
| 10 |
| Hartford Healthcare HLS Fund |
| Statement of Changes in Net Assets |
| (000’s Omitted) |
| For the Six-Month Period Ended June 30, 2013 (Unaudited) | For the Year Ended December 31, 2012 | |||||||
| Operations: | ||||||||
| Net investment income | $ | 170 | $ | 1,264 | ||||
| Net realized gain on investments and foreign currency transactions | 7,646 | 23,084 | ||||||
| Net unrealized appreciation of investments and foreign currency transactions | 35,555 | 12,872 | ||||||
| Net Increase in Net Assets Resulting from Operations | 43,371 | 37,220 | ||||||
| Distributions to Shareholders: | ||||||||
| From net investment income | ||||||||
| Class IA | — | (586 | ) | |||||
| Class IB | — | (64 | ) | |||||
| Total distributions | — | (650 | ) | |||||
| Capital Share Transactions: | ||||||||
| Class IA | ||||||||
| Sold | 30,679 | 27,494 | ||||||
| Issued on reinvestment of distributions | — | 586 | ||||||
| Redeemed | (19,982 | ) | (42,507 | ) | ||||
| Total capital share transactions | 10,697 | (14,427 | ) | |||||
| Class IB | ||||||||
| Sold | 5,382 | 7,528 | ||||||
| Issued on reinvestment of distributions | — | 64 | ||||||
| Redeemed | (10,001 | ) | (20,649 | ) | ||||
| Total capital share transactions | (4,619 | ) | (13,057 | ) | ||||
| Net increase (decrease) from capital share transactions | 6,078 | (27,484 | ) | |||||
| Net Increase in Net Assets | 49,449 | 9,086 | ||||||
| Net Assets: | ||||||||
| Beginning of period | 195,107 | 186,021 | ||||||
| End of period | $ | 244,556 | $ | 195,107 | ||||
| Undistributed (distribution in excess of) net investment income | $ | 1,343 | $ | 1,173 | ||||
| Shares: | ||||||||
| Class IA | ||||||||
| Sold | 1,464 | 1,592 | ||||||
| Issued on reinvestment of distributions | — | 34 | ||||||
| Redeemed | (957 | ) | (2,450 | ) | ||||
| Total share activity | 507 | (824 | ) | |||||
| Class IB | ||||||||
| Sold | 262 | 452 | ||||||
| Issued on reinvestment of distributions | — | 4 | ||||||
| Redeemed | (491 | ) | (1,218 | ) | ||||
| Total share activity | (229 | ) | (762 | ) | ||||
The accompanying notes are an integral part of these financial statements.
| 11 |
| Hartford Healthcare HLS Fund |
| Notes to Financial Statements |
| June 30, 2013 (Unaudited) |
| (000’s Omitted) |
| 1. | Organization: |
Hartford Healthcare HLS Fund (the “Fund”) serves as an underlying investment option for certain variable annuity and variable life insurance separate accounts of Hartford Life Insurance Company (“HLIC”) and its affiliates and certain qualified retirement plans. The Fund may also serve as an underlying investment option for certain variable annuity and variable life separate accounts of other insurance companies. Owners of variable annuity contracts and policyholders of variable life insurance contracts may choose the funds permitted in the variable insurance contract prospectus. In addition, participants in certain qualified retirement plans may choose the Fund if permitted by their plans.
Hartford Series Fund, Inc. (the “Company”) is an open-end registered management investment company comprised of thirty portfolios. Financial statements for the Fund, a series of the Company, are included in this report.
The Company is organized under the laws of the State of Maryland and is registered with the Securities and Exchange Commission (“SEC”) under the Investment Company Act of 1940, as amended (“1940 Act”). The Fund is a diversified open-end management investment company.
The Fund is divided into Class IA and Class IB shares. Each class is offered at the per share net asset value (“NAV”) without a sales charge and is subject to the same expenses, except that the Class IB shares are subject to distribution and service fees charged pursuant to a Distribution Plan adopted in accordance with Rule 12b-1 under the 1940 Act.
| 2. | Significant Accounting Policies: |
The following is a summary of significant accounting policies of the Fund in the preparation of its financial statements, which are in accordance with the United States Generally Accepted Accounting Principles (“U.S. GAAP”). The preparation of financial statements in accordance with U.S. GAAP may require management to make estimates and assumptions that affect the reported amounts of assets and liabilities and disclosure of contingent assets and liabilities at the date of the financial statements and the reported amounts of increases and decreases in net assets from operations during the reporting period. Actual results could differ from those estimates.
| a) | Determination of Net Asset Value – The NAV of each class of the Fund’s shares is determined as of the close of regular trading (normally 4:00 p.m. Eastern Time) (the “NYSE Close”) on each day that the New York Stock Exchange (the “Exchange”) is open (“Valuation Date”). Information that becomes known to the Fund after the NAV has been calculated on a particular day will not generally be used to retroactively adjust the NAV determined earlier that day. |
| b) | Investment Valuation and Fair Value Measurements – For purposes of calculating the NAV, portfolio investments and other assets held by the Fund's portfolio for which market quotes are readily available are valued at market value. Market value is generally determined on the basis of last reported sales prices or official close price. If no sales are reported, market value is based on quotes obtained from a quotation reporting system, established market makers, or independent pricing services. If market prices are not readily available or are deemed unreliable, the Fund will use the fair value of the investment as determined in good faith under policies and procedures established by and under the supervision of the Company’s Board of Directors. Market quotes are considered not readily available where there is an absence of current or reliable market-based data (e.g., trade information or indicative market quotes), including where events occur after the close of the relevant market, but prior to the NYSE Close that materially affect the values of the Fund’s portfolio investments or assets. In addition, market quotes are considered not readily available when, due to extraordinary circumstances, the exchanges or markets on which the investments trade do not open for trading for the entire day and no other market prices are available. In addition, prices of foreign equities that are principally traded on certain foreign markets may be adjusted daily pursuant to a fair value pricing service approved by the Board of Directors in order to reflect an adjustment for the factors occurring after the close of certain foreign markets but before the NYSE Close. Investments that are primarily traded on foreign markets may trade on days that are not business days of the Fund. The value of the foreign investments in which the Fund invests may change on days when a shareholder will not be able to purchase or redeem shares of the Fund. Fair value pricing is subjective in nature and the use of fair value pricing by the |
| 12 |
Fund may cause the NAV of its shares to differ significantly from the NAV that would have been calculated using market prices at the close of the exchange on which a portfolio investment is primarily traded. There can be no assurance that the Fund could obtain the fair market value assigned to an investment if the Fund were to sell the investment at approximately the time at which the Fund determines its NAV.
Investments valued in currencies other than U.S. dollars are converted to U.S. dollars using exchange rates obtained from independent pricing services for calculation of the NAV. As a result, the NAV of the Fund’s shares may be affected by changes in the value of currencies in relation to the U.S. dollar. The value of investments traded in markets outside the United States or denominated in currencies other than the U.S. dollar may be affected significantly on a day that the NYSE is closed and the market value may change on days when an investor is not able to purchase, redeem or exchange shares of the Fund.
Foreign currency contracts represent agreements to exchange currencies on specific future dates at predetermined rates. Foreign currency contracts are valued using foreign currency exchange rates and forward rates as provided by an independent pricing service on the Valuation Date.
Financial instruments for which prices are not available from an independent pricing service may be valued using market quotations obtained from one or more dealers that make markets in the respective financial instrument in accordance with procedures established by the Company’s Board of Directors.
U.S. GAAP defines fair value as the price that the Fund would receive to sell an asset or pay to transfer a liability in an orderly transaction between market participants. The U.S. GAAP fair value measurement standards require disclosure of a fair value hierarchy for each major category of assets and liabilities. Various inputs are used in determining the fair value of the Fund’s investments. These inputs are summarized into three broad hierarchy levels. This hierarchy is based on whether the valuation inputs are observable or unobservable. These levels are:
| · | Level 1 – Quoted prices in active markets for identical investments. Level 1 may include exchange traded instruments, such as domestic equities, some foreign equities, options, futures, mutual funds, exchange traded funds, rights and warrants. |
| · | Level 2 – Observable inputs other than Level 1 prices, such as quoted prices for similar investments; quoted prices in markets that are not active; or other inputs that are observable or can be corroborated by observable market data. Level 2 may include debt investments that are traded less frequently than exchange traded instruments and which are valued using independent pricing services; foreign equities, which are principally traded on certain foreign markets and are adjusted daily pursuant to a fair value pricing service in order to reflect an adjustment for the factors occurring after the close of certain foreign markets but before the NYSE Close; and short-term investments, which are valued at amortized cost. |
| · | Level 3 – Significant unobservable inputs that are supported by limited or no market activity. Level 3 may include financial instruments whose values are determined using indicative market quotes or require significant management judgment or estimation. These unobservable valuation inputs may include estimates for current yields, maturity/duration, prepayment speed, and indicative market quotes for comparable investments along with other assumptions relating to credit quality, collateral value, complexity of the investment structure, general market conditions and liquidity. This category may include investments where trading has been halted or there are certain restrictions on trading. While these investments are priced using unobservable inputs, the valuation of these investments reflects the best available data and management believes the prices are a reasonable representation of exit price. |
The Board of Directors of the Company generally reviews and approves the “Procedures for Valuation of Portfolio Securities” on an annual basis. These procedures define how investments are to be valued, including the formation and activities of a Valuation Committee. The Valuation Committee is responsible for determining in good faith the fair value of investments when the value cannot be obtained from primary pricing services or alternative sources or if the valuation of an investment as provided by the primary pricing service or alternative
| 13 |
| Hartford Healthcare HLS Fund |
| Notes to Financial Statements – (continued) |
| June 30, 2013 (Unaudited) |
| (000’s Omitted) |
source is believed not to reflect the investment’s fair value as of the Valuation Date. Members of the Valuation Committee include the Fund’s Treasurer or designee, a Vice President of the Fund with legal expertise or designee, and a Vice President of the investment manager or designee. In addition, the Fund’s Chief Compliance Officer shall designate a member of the compliance group to attend Valuation Committee meetings as a non-voting resource, to monitor for and provide guidance with respect to compliance with these procedures. Two members of the Valuation Committee or their designees, representing different departments, shall constitute a quorum for purposes of permitting the Valuation Committee to take action. The Valuation Committee will consider all relevant factors in determining an investment’s fair value, and may seek the advice of the Fund’s sub-adviser, knowledgeable brokers, and legal counsel in making such determination. The Valuation Committee reports to the Audit Committee of the Company’s Board of Directors. The Audit Committee receives quarterly written reports which include details of all fair-valued investments, including the reason for the fair valuation, and an indication, when possible, of the accuracy of the valuation by disclosing the next available reliable public price quotation or the disposition price of such investments (the “look-back” test). The Board of Directors then must consider for ratification all of the fair value determinations made during the previous quarter.
Valuation levels are not necessarily indicative of the risk associated with investing in such investments. Individual investments within any of the above mentioned asset classes may be assigned a different hierarchical level than those presented above, as individual circumstances dictate.
For additional information, refer to the Investment Valuation Hierarchy Level Summary and the Level 3 roll-forward reconciliation, if applicable, which follow the Schedule of Investments.
For purposes of reporting transfers between different hierarchy levels, both transfers in and out of each level, as applicable, are shown as if they occurred at the beginning of the period.
| c) | Investment Transactions and Investment Income – Investment transactions are recorded as of the trade date (the date the order to buy or sell is executed) for financial reporting purposes. Investments purchased or sold on a when-issued or delayed-delivery basis may be settled a month or more after the trade date. Realized gains and losses are determined on the basis of identified cost. |
Dividend income from domestic securities is accrued on the ex-dividend date. In general, dividend income from foreign securities is recorded on the ex-date; however, dividend notifications in certain foreign jurisdictions may not be available in a timely manner and as a result, the Fund will record the dividend as soon as the relevant details (i.e., rate per share, payment date, shareholders of record, etc.) are publicly available. Interest income, including amortization of premium and accretion of discounts, is accrued on a daily basis.
| d) | Foreign Currency Transactions – Assets and liabilities denominated in currencies other than U.S. dollars are translated into U.S. dollars at the exchange rates in effect on the valuation date. Purchases and sales of investments, income, and expenses are translated into U.S. dollars at the exchange rates on the dates of such transactions. |
The Fund does not isolate that portion of portfolio investment valuation resulting from fluctuations in the foreign currency exchange rates from the fluctuations arising from changes in the market prices of investments held. Exchange rate fluctuations are included with the net realized and unrealized gain or loss on investments in the accompanying financial statements.
Net realized foreign exchange gains or losses arise from sales of foreign currencies and the difference between asset and liability amounts initially stated in foreign currencies and the U.S. dollar value of the amounts actually received or paid. Net unrealized foreign exchange gains or losses arise from changes in the value of other assets and liabilities at the end of the reporting period, resulting from changes in the exchange rates.
| 14 |
| e) | Joint Trading Account – The Fund may invest cash balances into a joint trading account that may be invested in one or more repurchase agreements. |
| f) | Fund Share Valuation and Dividend Distributions to Shareholders – Orders for the Fund’s shares are executed in accordance with the investment instructions of the contract holders and plan participants. The NAV of the Fund’s shares is determined as of the close of business on each business day of the Exchange. The NAV is determined separately for each class of shares of the Fund by dividing the Fund’s net assets attributable to that class by the number of shares of the class outstanding. Each class of shares offered by the Fund has equal rights as to assets and voting privileges (except that shareholders of a class have exclusive voting rights regarding any matter relating solely to that class of shares). Income and non-class specific expenses are allocated daily to each class on the basis of the relative net assets of the class. Realized and unrealized capital gains and losses are allocated daily based on the relative net assets of each class of shares of the Fund. |
Orders for the purchase of the Fund’s shares received prior to the close of the Exchange on any day the Exchange is open for business are priced at the NAV determined as of the close of the Exchange. Orders received after the close of the Exchange, or on a day on which the Exchange and/or the Fund is not open for business, are priced at the next determined NAV.
Dividends are declared pursuant to a policy adopted by the Company’s Board of Directors based upon the investment performance of the Fund. The policy of the Fund is to pay dividends from net investment income and realized capital gains, if any, at least once a year.
Distributions from net investment income, net realized capital gains and capital are determined in accordance with federal income tax regulations, which may differ from U.S. GAAP with respect to character and timing. These differences may include but are not limited to losses deferred due to wash sale adjustments, foreign currency gains and losses, adjustments related to Passive Foreign Investment Companies (“PFICs”), Real Estate Investment Trusts (“REITs”), Regulated Investment Companies (“RICs”), certain derivatives and partnerships. Permanent book and federal income tax basis differences relating to shareholder distributions will result in reclassifications to certain of the Fund’s capital accounts (see Federal Income Taxes: Reclassification of Capital Accounts note).
| 3. | Securities and Other Investments: |
| a) | Repurchase Agreements – A repurchase agreement is an agreement by which a counterparty agrees to sell an investment and agrees to repurchase the investment sold from the buyer at a mutually agreed upon time and price. During the period of the repurchase agreement, the counterparty will deposit cash and or securities in a third party custodial account to serve as collateral. At the time the Fund enters into a repurchase agreement, the value of the underlying collateral, including accrued interest, will be equal to or exceed the value of the repurchase agreement. Repurchase agreements expose the Fund to counterparty risk - that is, the risk that the counterparty will not fulfill its obligations. To minimize counterparty risk, the investments that serve to collateralize the repurchase agreement are held by the Fund’s custodian in book entry or physical form in the custodial account of the Fund or in a third party custodial account. Repurchase agreements are valued at cost plus accrued interest, which approximates fair value. Repurchase agreements have master netting agreements which allow the Fund to offset amounts owed to a counterparty with amounts owed by the counterparty, including any collateral. The Fund, as shown on the Schedule of Investments, had outstanding repurchase agreements as of June 30, 2013. |
| b) | Investments Purchased on a When-Issued or Delayed-Delivery Basis – Delivery and payment for investments that have been purchased by the Fund on a forward commitment, or when-issued or delayed-delivery basis, take place beyond the customary settlement period. A fund may dispose of or renegotiate a delayed-delivery transaction after it is entered into, and may sell delayed-delivery investments before they are delivered, which may result in a realized gain or loss. During this period, such investments are subject to market fluctuations, and the Fund identifies investments segregated in its |
| 15 |
| Hartford Healthcare HLS Fund |
| Notes to Financial Statements – (continued) |
| June 30, 2013 (Unaudited) |
| (000’s Omitted) |
records with a value at least equal to the amount of the commitment. As of June 30, 2013, the Fund had no outstanding when-issued or delayed-delivery investments.
| 4. | Financial Derivative Instruments: |
The following disclosures contain information on how and why the Fund uses derivative instruments, the credit-risk-related contingent features in certain derivative instruments, and how derivative instruments affect the Fund’s financial position and results of operations. The location and fair value amounts of these instruments on the Statement of Assets and Liabilities and the realized gains and losses and changes in unrealized gains and losses on the Statement of Operations, each categorized by type of derivative contract, are included in the following Additional Derivative Instrument Information footnote. The derivative instruments outstanding as of period-end are disclosed in the notes to or within the Schedule of Investments for purchased options, if applicable. The amounts of realized gains and losses and changes in unrealized gains and losses on derivative instruments during the period are disclosed in the Statement of Operations.
| a) | Foreign Currency Contracts – The Fund may enter into foreign currency contracts that obligate the Fund to purchase or sell currencies at specified future dates. Foreign currency contracts are used to hedge the currency exposure associated with some or all of the Fund’s investments and/or as part of an investment strategy. Foreign currency contracts are marked to market daily and the change in value is recorded by the Fund as an unrealized gain or loss. The Fund will record a realized gain or loss when the foreign currency contract is settled. |
Foreign currency contracts involve elements of market risk in excess of the amounts reflected in the Statement of Assets and Liabilities. In addition, risks may arise upon entering into these contracts from the potential inability of the counterparties to meet the terms of the contracts and from unanticipated movements in the value of the foreign currencies relative to the U.S. dollar. The Fund had outstanding foreign currency contracts as shown on the Schedule of Investments as of June 30, 2013.
| b) | Additional Derivative Instrument Information: |
Fair Value of Derivative Instruments on the Statement of Assets and Liabilities as of June 30, 2013:
| Risk Exposure Category | ||||||||||||||||||||||||||||
| Interest Rate Contracts | Foreign Exchange Contracts | Credit Contracts | Equity Contracts | Commodity Contracts | Other Contracts | Total | ||||||||||||||||||||||
| Assets: | ||||||||||||||||||||||||||||
| Unrealized appreciation on foreign currency contracts | $ | — | $ | 509 | $ | — | $ | — | $ | — | $ | — | $ | 509 | ||||||||||||||
| Total | $ | — | $ | 509 | $ | — | $ | — | $ | — | $ | — | $ | 509 | ||||||||||||||
| Liabilities: | ||||||||||||||||||||||||||||
| Unrealized depreciation on foreign currency contracts | $ | — | $ | 68 | $ | — | $ | — | $ | — | $ | — | $ | 68 | ||||||||||||||
| Total | $ | — | $ | 68 | $ | — | $ | — | $ | — | $ | — | $ | 68 | ||||||||||||||
The volume of derivatives that is presented in the Schedule of Investments is consistent with the derivative activity during the six-month period ended June 30, 2013.
| 16 |
The Effect of Derivative Instruments on the Statement of Operations for the six-month period ended June 30, 2013:
| Risk Exposure Category | ||||||||||||||||||||||||||||
| Interest Rate Contracts | Foreign Exchange Contracts | Credit Contracts | Equity Contracts | Commodity Contracts | Other Contracts | Total | ||||||||||||||||||||||
| Realized Gain on Derivatives Recognized as a Result of Operations: | ||||||||||||||||||||||||||||
| Net realized gain on foreign currency contracts | $ | — | $ | 871 | $ | — | $ | — | $ | — | $ | — | $ | 871 | ||||||||||||||
| Total | $ | — | $ | 871 | $ | — | $ | — | $ | — | $ | — | $ | 871 | ||||||||||||||
| Net Change in Unrealized Appreciation (Depreciation) on Derivatives Recognized as a Result of Operations: | ||||||||||||||||||||||||||||
| Net change in unrealized depreciation of foreign currency contracts | $ | — | $ | (164 | ) | $ | — | $ | — | $ | — | $ | — | $ | (164 | ) | ||||||||||||
| Total | $ | — | $ | (164 | ) | $ | — | $ | — | $ | — | $ | — | $ | (164 | ) | ||||||||||||
| c) | Balance Sheet Offsetting Information: |
Set forth below are tables which disclose both gross information and net information about instruments and transactions eligible for offset in the financial statements, and instruments and transactions that are subject to a master netting agreement, as well as amounts related to margin, reflected as financial collateral (including cash collateral), held at clearing brokers, counterparties, and the Fund’s custodian. The master netting agreements allow the clearing brokers to net any collateral held in or on behalf of the Fund, or liabilities or payment obligations of the clearing brokers to the Fund, against any liabilities or payment obligations of the Fund to the clearing brokers. The Fund is required to deposit financial collateral (including cash collateral) at the Fund’s custodian on behalf of clearing brokers and counterparties to continually meet the original and maintenance requirements established by the clearing brokers and counterparties. Such requirements are specific to the respective clearing broker or counterparty.
Offsetting of Financial Assets and Derivative Assets as of June 30, 2013:
| Description | Gross Amounts of Recognized Assets | Gross Amounts Offset in Statement of Assets and Liabilities | Net Amounts of Assets Presented in Statement of Assets and Liabilities | Financial Instruments with Allowable Netting | Collateral Received | Net Amount (not less than 0) | ||||||||||||||||||
| Repurchase Agreements | $ | 1,236 | $ | — | $ | 1,236 | $ | — | $ | (1,257 | ) | $ | — | |||||||||||
| Unrealized appreciation on foreign currency contracts | 509 | — | 509 | (68 | ) | — | 441 | |||||||||||||||||
| Total subject to a master netting or similar arrangement | $ | 1,745 | $ | — | $ | 1,745 | $ | (68 | ) | $ | (1,257 | ) | $ | 441 | ||||||||||
Offsetting of Financial Liabilities and Derivative Liabilities as of June 30, 2013:
| Description | Gross Amounts of Recognized Liabilities | Gross Amounts Offset in Statement of Assets and Liabilities | Net Amounts of Assets Presented in Statement of Assets and Liabilities | Financial Instruments with Allowable Netting | Collateral Pledged | Net Amount (not less than 0) | ||||||||||||||||||
| Unrealized depreciation on foreign currency contracts | $ | 68 | $ | — | $ | 68 | $ | (68 | ) | $ | — | $ | — | |||||||||||
| Total subject to a master netting or similar arrangement | $ | 68 | $ | — | $ | 68 | $ | (68 | ) | $ | — | $ | — | |||||||||||
| 5. | Principal Risks: |
| a) | Counterparty Risk – The Fund may be exposed to counterparty risk, or the risk that an institution or other entity with which the Fund has unsettled or open transactions will default. |
| 17 |
| Hartford Healthcare HLS Fund |
| Notes to Financial Statements – (continued) |
| June 30, 2013 (Unaudited) |
| (000’s Omitted) |
| b) | Market Risks – If the Fund invests directly in foreign currencies or in securities that trade in, and receive revenues in, foreign currencies, or in derivatives that provide exposure to foreign currencies, it will be subject to the risk that those currencies will decline in value relative to the base currency of the Fund, or, in the case of hedging positions, that the Fund’s base currency will decline in value relative to the currency being hedged. Currency rates in foreign countries may fluctuate significantly over short periods of time for a number of reasons, including changes in interest rates, intervention (or the failure to intervene) by U.S. or foreign governments, central banks or supranational entities, such as the International Monetary Fund, or by the imposition of currency controls or other political developments in the United States or abroad. As a result, the Fund’s investments in foreign currency denominated securities may reduce the returns of the Fund. The market values of equity securities, such as common stocks and preferred stocks, or equity related investments, such as futures and options, may decline due to general market conditions which are not specifically related to a particular company, such as real or perceived adverse economic conditions, changes in the general outlook for corporate earnings, changes in interest or currency rates or adverse investor sentiment generally. The market value of equity securities may also decline due to factors which affect a particular industry or industries, such as labor shortages or increased production costs and competitive conditions within an industry. Equity securities and equity related investments generally have greater market price volatility than fixed income securities. |
| 6. | Federal Income Taxes: |
| a) | Federal Income Taxes – For federal income tax purposes, the Fund intends to continue to qualify as a RIC under Subchapter M of the Internal Revenue Code (“IRC”) by distributing substantially all of its taxable net investment income and net realized capital gains to its shareholders and otherwise complying with the requirements of the IRC. The Fund has distributed substantially all of its income and capital gains in prior years, if applicable, and intends to distribute substantially all of its income and capital gains prior to the next fiscal year-end. Accordingly, no provision for federal income or excise taxes has been made in the accompanying financial statements. Distributions from short-term capital gains are treated as ordinary income distributions for federal income tax purposes. |
| b) | Net Investment Income (Loss), Net Realized Gains (Losses), and Distributions – Net investment income (loss) and net realized gains (losses) may differ for financial statement and tax purposes primarily because of losses deferred due to wash sale adjustments, foreign currency gains and losses, adjustments related to PFICs, REITs, RICs, certain derivatives and partnerships. The character of distributions made during the year from net investment income or net realized gains may differ from their ultimate characterization for federal income tax purposes. Also, due to the timing of dividend distributions, the fiscal year in which amounts are distributed may differ from the year that the income or realized gains (losses) were recorded by the Fund. |
| c) | Distributions and Components of Distributable Earnings – The tax character of distributions paid by the Fund for the periods indicated is as follows (as adjusted for dividends payable, if applicable): |
| For the Year Ended December 31, 2012 | For the Year Ended December 31, 2011 | |||||||
| Ordinary Income | $ | 650 | $ | 68 | ||||
As of December 31, 2012, the Fund’s components of distributable earnings (deficit) on a tax basis were as follows:
| Amount | ||||
| Undistributed Ordinary Income | $ | 1,194 | ||
| Undistributed Long-Term Capital Gain | 16,430 | |||
| Unrealized Appreciation* | 22,298 | |||
| Total Accumulated Earnings | $ | 39,922 | ||
| * | Differences between book-basis and tax-basis unrealized appreciation (depreciation) may be attributable to the losses deferred due to wash sale adjustments, foreign currency gains and losses, adjustments related to PFICs, REITs, RICs, certain derivatives and partnerships. |
| 18 |
| d) | Reclassification of Capital Accounts – The Fund may record reclassifications in its capital accounts. These reclassifications have no impact on the total net assets of the Fund. The reclassifications are a result of permanent differences between U.S. GAAP and tax accounting for such items as foreign currency, PFICs, expiration or utilization of capital loss carryforwards or net operating losses. Adjustments are made to reflect the impact these items have on current and future distributions to shareholders. Therefore, the source of the Fund’s distributions may be shown in the accompanying Statement of Changes in Net Assets as from undistributed net investment income, from accumulated net realized gains on investments or from capital depending on the type of book and tax differences that exist. For the year ended December 31, 2012, the Fund recorded reclassifications to increase (decrease) the accounts listed below: |
| Amount | ||||
| Undistributed Net Investment Income | $ | (19 | ) | |
| Accumulated Net Realized Gain (Loss) | 19 | |||
| e) | Capital Loss Carryforward – On December 22, 2010, the Regulated Investment Company Modernization Act of 2010 (the “Act”) was enacted, which made changes to the capital loss carryforward rules. The changes are effective for taxable years beginning after the date of enactment. Under the Act, funds are permitted to carry forward capital losses for an unlimited period. However, any losses incurred during those future taxable years will be required to be utilized prior to the losses incurred in pre-enactment taxable years, which carry an expiration date. As a result of this ordering rule, pre-enactment capital loss carryforwards may be more likely to expire unused. Additionally, post-enactment capital loss carryforwards retain their character as either short-term or long-term capital losses rather than being considered all short-term as permitted under prior regulation. |
The Fund had no capital loss carryforward for U.S. federal income tax purposes as of December 31, 2012.
| During the year ended December 31, 2012, the Fund utilized $6,976 of prior year capital loss carryforwards. |
| f) | Accounting for Uncertainty in Income Taxes – The Fund has adopted financial reporting rules that require the Fund to analyze all open tax years, as defined by the statute of limitations, for all major jurisdictions. Generally, tax authorities can examine all tax returns filed for the last three years. The Fund does not have an examination in progress. |
The Fund has reviewed all open tax years and major jurisdictions and concluded that these financial reporting rules had no effect on the Fund’s financial position or results of operations. There is no tax liability resulting from unrecognized tax benefits relating to uncertain income tax positions taken or expected to be taken on the tax return for the fiscal year ended December 31, 2012. The Fund is also not aware of any tax positions for which it is reasonably possible that the total amounts of unrecognized tax benefits will significantly change in the next twelve months.
| 7. | Expenses: |
| a) | Investment Management Agreement – Hartford Funds Management Company, LLC (“HFMC”), an indirect wholly owned subsidiary of The Hartford Financial Services Group, Inc. (“The Hartford”), serves as investment manager to the Fund pursuant to an Investment Management Agreement with the Company. The investment manager has overall investment supervisory responsibility for the Fund. In addition, the investment manager provides administrative personnel, services, equipment, facilities and office space for proper operation of the Fund. The investment manager has contracted with Wellington Management Company, LLP (“Wellington Management”) under a sub-advisory agreement for the provision of day-to-day investment management services to the Fund in accordance with the Fund’s investment objective and policies. The Fund pays a fee to the investment manager, a portion of which may be used to compensate Wellington Management. |
| 19 |
| Hartford Healthcare HLS Fund |
| Notes to Financial Statements – (continued) |
| June 30, 2013 (Unaudited) |
| (000’s Omitted) |
The schedule below reflects the rates of compensation paid to HFMC for investment management services rendered as of June 30, 2013; the rates are accrued daily and paid monthly.
| Average Daily Net Assets | Annual Fee | |||
| On first $250 million | 0.8500% | |||
| On next $250 million | 0.8000% | |||
| On next $4.5 billion | 0.7500% | |||
| On next $5 billion | 0.7475% | |||
| Over $10 billion | 0.7450% | |||
| b) | Accounting Services Agreement – Pursuant to the Fund Accounting Agreement between HFMC and the Company, on behalf of the Fund, HFMC provides accounting services to the Fund and receives monthly compensation based on the Fund’s average daily net assets at the rates set forth below. The Fund’s accounting services fees are accrued daily and paid monthly. |
| Average Daily Net Assets | Annual Fee | |||
| All Assets | 0.010% | |||
| c) | Operating Expenses – Allocable expenses incurred by the Company are allocated to each Fund and allocated to classes within a Fund in proportion to the average daily net assets of the Fund and each class, except where allocation of certain expenses is more fairly made directly to the Fund or to specific classes within a Fund. |
| d) | Fees Paid Indirectly – The Company, on behalf of the Fund, has entered into agreements with State Street Global Markets, LLC and Russell Implementation Services, Inc. to partially recapture non-discounted trade commissions. Such rebates are used to pay a portion of the Fund’s expenses. In addition, the Fund’s custodian banks have agreed to reduce its fees when the Fund maintains cash on deposit in a non-interest-bearing custody account. For the six-month period ended June 30, 2013, these amounts, if any, are included in the Statement of Operations. |
The ratio of expenses to average net assets in the accompanying financial highlights excludes the reduction in expenses related to fees paid indirectly. The annualized expense ratio for the period listed below reflecting the reduction for fees paid indirectly is as follows:
| Annualized Six- Month Period Ended June 30, 2013 | ||||
| Class IA | 0.90 | % | ||
| Class IB | 1.15 | |||
| e) | Distribution Plan for Class IB shares – The Company, on behalf of the Fund, has adopted a Distribution Plan pursuant to Rule 12b-1 of the 1940 Act to compensate the distributor, Hartford Funds Distributors, LLC (“HFD”), (formerly known as Hartford Investment Financial Services, LLC), an indirect wholly owned subsidiary of The Hartford, from assets attributable to the Class IB shares for services rendered and expenses borne in connection with activities primarily intended to result in the sale of the Class IB shares, subject to the review and approval of the Company’s Board of Directors. |
The Distribution Plan provides that the Fund may pay annually up to 0.25% of the average daily net assets of the Fund attributable to its Class IB shares for activities primarily intended to result in the sale of Class IB shares. The Board has the authority to suspend or reduce these payments at any point in time. Under the terms of the Distribution Plan and the principal underwriting agreement, the Fund is authorized to make payments monthly to the distributor that may be used
| 20 |
to pay or compensate entities providing distribution and shareholder servicing with respect to the Class IB shares for such entities’ fees or expenses incurred or paid in that regard. These fees are accrued daily and paid monthly.
| f) | Other Related Party Transactions – Certain officers of the Fund are directors and/or officers of the investment manager and/or The Hartford or its subsidiaries. For the six-month period ended June 30, 2013, a portion of the Fund’s Chief Compliance Officer’s salary was paid by all the investment companies in the Hartford fund complex. The portion allocated to the Fund rounds to zero. Hartford Administrative Services Company (“HASCO”), an indirect wholly owned subsidiary of The Hartford, provides transfer agent services to the Fund. HASCO was compensated on a per account basis for providing such services. The amount paid to HASCO can be found in the Statement of Operations. These fees are accrued daily and paid monthly. |
| g) | Payment from Affiliate – In July of 2007, The Hartford entered into a settlement with the Attorneys General of the states of New York, Connecticut and Illinois relating to market timing and the company's individual variable annuity contracts in which certain payments would be made directly to the variable annuity contract holders. The distribution plan provided that unclaimed money from the settlement would be distributed to certain HLS Funds that are investment options through a Hartford individual variable annuity contract. The unclaimed money was distributed to the Fund on September 18, 2009. |
The total return in the accompanying financial highlights includes a payment from an affiliate. Had the payment from the affiliate been excluded, the impact and total return for the period listed below would have been as follows:
| For the Year Ended December 31, 2009 | ||||||||
| Class IA | Class IB | |||||||
| Impact from Payment from Affiliate for Attorneys General Settlement | 0.01 | % | 0.01 | % | ||||
| Total Return Excluding Payment from Affiliate | 22.70 | % | 22.39 | % | ||||
| 8. | Investment Transactions: |
For the six-month period ended June 30, 2013, the Fund's aggregate purchases and sales of investment securities (excluding short-term investments) were as follows:
| Amount | ||||
| Cost of Purchases Excluding U.S. Government Obligations | $ | 37,906 | ||
| Sales Proceeds Excluding U.S. Government Obligations | 31,823 | |||
| 9. | Line of Credit: |
The Fund is one of several Hartford funds that participate in a $500 million committed revolving line of credit facility. The facility is to be used for temporary or emergency purposes. Under the arrangement, the funds are required to own securities having a market value in excess of 300% of the total bank borrowings. The interest rate on borrowings varies depending on the nature of the loan. The facility also requires a fee to be paid based on the amount of the commitment. This commitment fee is allocated to all of the funds participating in the line of credit based on the average net assets of the funds. During the six-month period ended June 30, 2013, the Fund did not have any borrowings under this facility.
| 10. | Industry Classifications: |
Other than the industry classifications “Other Investment Pools and Funds” and “Exchange Traded Funds,” equity industry classifications used in this report are the Global Industry Classification Standard, which was developed by and is the exclusive property and service mark of MSCI, Inc. and Standard & Poor’s.
| 21 |
| Hartford Healthcare HLS Fund |
| Notes to Financial Statements – (continued) |
| June 30, 2013 (Unaudited) |
| (000’s Omitted) |
| 11. | Indemnifications: |
Under the Company’s organizational documents, the Company shall indemnify its officers and directors to the full extent required or permitted under Maryland General Corporation Law and the federal securities laws. In addition, the Company, on behalf of the Fund, may enter into contracts that contain a variety of indemnifications. The Company’s maximum exposure under these arrangements is unknown. However, as of the date of these financial statements, the Company has not had prior claims or losses pursuant to these contracts and expects the risk of loss to be remote.
| 12. | Pending Legal Proceedings: |
On February 25, 2011, Jennifer L. Kasilag, Louis Mellinger, Judith M. Menendez, Jacqueline M. Robinson, and Linda A. Russell filed a derivative lawsuit against Hartford Investment Financial Services, LLC (“HIFSCO”)(now known as Hartford Funds Distributors, LLC) on behalf of six Hartford retail mutual funds in the United States District Court for the District of New Jersey, alleging that HIFSCO received excessive advisory and distribution fees in violation of its statutory fiduciary duty under Section 36(b) of the 1940 Act when serving as investment manager and principal underwriter, respectively, to the Hartford retail mutual funds. HIFSCO moved to dismiss and, in September 2011, the motion was granted in part and denied in part, with leave to amend the complaint. In November 2011, plaintiffs filed an amended complaint on behalf of certain Hartford retail mutual funds, The Hartford Global Health Fund (now known as The Hartford Healthcare Fund), The Hartford Conservative Allocation Fund, The Hartford Growth Opportunities Fund, The Hartford Inflation Plus Fund, The Hartford Advisers Fund (now known as The Hartford Balanced Fund), and The Hartford Capital Appreciation Fund. Plaintiffs seek to rescind the investment management agreements and distribution plans between HIFSCO and these funds and to recover the total fees charged thereunder or, in the alternative, to recover any improper compensation HIFSCO received, in addition to lost earnings. HIFSCO filed a partial motion to dismiss the amended complaint and, in December 2012, the court dismissed without prejudice the claims regarding distribution fees and denied the motion with respect to the advisory fees claims. HIFSCO disputes the allegations and intends to defend vigorously.
This action concerns the activities of HIFSCO in its capacity as investment manager and principal underwriter to the Hartford retail mutual funds and does not concern HIFSCO’s activities in its capacity as principal underwriter to the HLS funds. For this reason, no accrual for litigation relating to this matter has been recorded in the financial statements of the Fund.
| 22 |
[This page intentionally left blank]
| 23 |
| Hartford Healthcare HLS Fund |
| Financial Highlights |
| – Selected Per-Share Data – (A) |
Class | Net Asset Value at | Net Investment | Net Realized and | Total from | Dividends from Net | Distributions from | Distributions from | Total Distributions | Net Asset Value at | |||||||||||||||||||||||||||
| For the Six-Month Period Ended June 30, 2013 (Unaudited) | ||||||||||||||||||||||||||||||||||||
| IA | $ | 18.11 | $ | 0.01 | $ | 4.00 | $ | 4.01 | $ | – | $ | – | $ | – | $ | – | $ | 22.12 | ||||||||||||||||||
| IB | 17.71 | – | 3.90 | 3.90 | – | – | – | – | 21.61 | |||||||||||||||||||||||||||
| For the Year Ended December 31, 2012 | ||||||||||||||||||||||||||||||||||||
| IA | 15.07 | 0.13 | 2.98 | 3.11 | (0.07 | ) | – | – | (0.07 | ) | 18.11 | |||||||||||||||||||||||||
| IB | 14.74 | 0.09 | 2.90 | 2.99 | (0.02 | ) | – | – | (0.02 | ) | 17.71 | |||||||||||||||||||||||||
| For the Year Ended December 31, 2011 | ||||||||||||||||||||||||||||||||||||
| IA | 13.89 | 0.06 | 1.13 | 1.19 | (0.01 | ) | – | – | (0.01 | ) | 15.07 | |||||||||||||||||||||||||
| IB | 13.61 | 0.02 | 1.11 | 1.13 | – | – | – | – | 14.74 | |||||||||||||||||||||||||||
| For the Year Ended December 31, 2010 | ||||||||||||||||||||||||||||||||||||
| IA | 12.99 | 0.08 | 0.84 | 0.92 | (0.02 | ) | – | – | (0.02 | ) | 13.89 | |||||||||||||||||||||||||
| IB | 12.74 | 0.04 | 0.83 | 0.87 | – | – | – | – | 13.61 | |||||||||||||||||||||||||||
| For the Year Ended December 31, 2009 | ||||||||||||||||||||||||||||||||||||
| IA | 10.66 | 0.07 | 2.35 | 2.42 | (0.07 | ) | (0.02 | ) | – | (0.09 | ) | 12.99 | ||||||||||||||||||||||||
| IB | 10.46 | 0.03 | 2.31 | 2.34 | (0.04 | ) | (0.02 | ) | – | (0.06 | ) | 12.74 | ||||||||||||||||||||||||
| For the Year Ended December 31, 2008 | ||||||||||||||||||||||||||||||||||||
| IA | 15.39 | 0.06 | (3.99 | ) | (3.93 | ) | (0.06 | ) | (0.74 | ) | – | (0.80 | ) | 10.66 | ||||||||||||||||||||||
| IB | 15.11 | 0.02 | (3.91 | ) | (3.89 | ) | (0.02 | ) | (0.74 | ) | – | (0.76 | ) | 10.46 | ||||||||||||||||||||||
| (A) | Information presented relates to a share outstanding throughout the indicated period. |
| (B) | The figures do not include sales charges or other fees which may be applied at the variable life insurance, variable annuity or qualified retirement plan product level. Any such additional sales charges or other fees would lower the Fund's performance. |
| (C) | Ratios do not reflect reductions for fees paid indirectly. Please see Fees Paid Indirectly in the Notes to Financial Statements. |
| (D) | Portfolio turnover rate is calculated on the basis of the Fund as a whole without distinguishing between the classes of shares issued. |
| (E) | Not annualized. |
| (F) | Annualized. |
| (G) | Total return without the inclusion of the Payment from (to) Affiliate can be found in Expenses in the accompanying Notes to Financial Statements. |
| 24 |
| – Ratios and Supplemental Data – |
| Total Return(B) | Net Assets at End of Period | Ratio of Expenses to Average Net Assets Before Waivers(C) | Ratio of Expenses to Average Net Assets After Waivers(C) | Ratio of Net Investment Income (Loss) to Average Net Assets | Portfolio Turnover Rate(D) | |||||||||||||||||
| 22.17 | %(E) | $ | 194,236 | 0.90 | %(F) | 0.90 | %(F) | 0.20 | %(F) | 14 | % | |||||||||||
| 22.00 | (E) | 50,320 | 1.15 | (F) | 1.15 | (F) | (0.04 | )(F) | – | |||||||||||||
| 20.62 | 149,801 | 0.91 | 0.91 | 0.69 | 46 | |||||||||||||||||
| 20.32 | 45,306 | 1.16 | 1.16 | 0.43 | – | |||||||||||||||||
| 8.54 | 137,088 | 0.91 | 0.91 | 0.33 | 45 | |||||||||||||||||
| 8.27 | 48,933 | 1.16 | 1.16 | 0.08 | – | |||||||||||||||||
| 7.10 | 137,454 | 0.90 | 0.90 | 0.55 | 32 | |||||||||||||||||
| 6.84 | 54,753 | 1.15 | 1.15 | 0.30 | – | |||||||||||||||||
| 22.72 | (G) | 154,216 | 0.91 | 0.91 | 0.51 | 73 | ||||||||||||||||
| 22.41 | (G) | 63,065 | 1.16 | 1.16 | 0.26 | – | ||||||||||||||||
| (25.56 | ) | 179,087 | 0.88 | 0.88 | 0.42 | 57 | ||||||||||||||||
| (25.75 | ) | 62,080 | 1.13 | 1.13 | 0.17 | – | ||||||||||||||||
| 25 |
| Hartford Healthcare HLS Fund |
| Directors and Officers (Unaudited) |
The Board of Directors of the Company appoints officers who are responsible for the day-to-day operations of the Fund and who execute policies formulated by the Directors. Each director serves until his or her death, resignation, or retirement or until the next annual meeting of shareholders is held or until his or her successor is elected and qualifies.
Directors and officers who are employed by or who have a financial interest in The Hartford are considered “interested” persons of the Fund pursuant to the 1940 Act. Each officer and two of the Company’s directors, as noted in the chart below, are “interested” persons of the Fund. Each director serves as a director for The Hartford Mutual Funds, Inc., The Hartford Mutual Funds II, Inc., Hartford Series Fund, Inc., Hartford HLS Series Fund II, Inc., and as a trustee for The Hartford Alternative Strategies Fund, which, as of June 30, 2013, collectively consist of 90 funds. Correspondence may be sent to directors and officers c/o Hartford Mutual Funds, P.O. Box 2999, Hartford, Connecticut 06104-2999, except that correspondence to Mr. Annoni, Mr. Dressen, Ms. Fagely and Ms. Quade may be sent to 500 Bielenberg Drive, Woodbury, Minnesota 55125 and correspondence to Mr. Davey and Mr. Melcher may be sent to 5 Radnor Corporate Center, Suite 300, 100 Matsonford Road, Radnor, Pennsylvania 19087.
The table below sets forth, for each director and officer, his or her name, year of birth, current position with the Company and date first elected or appointed to Hartford Series Fund, Inc. (“HSF”), and Hartford HLS Series Fund II, Inc. (“HSF2”), principal occupation, and, for directors, other directorships held. The Fund’s statement of additional information contains further information on the directors and is available free of charge by calling 1-800-862-6668 or writing to Hartford HLS Funds, c/o Hartford Life Insurance Company, Hartford Life and Annuity Insurance Company, P.O. Box 14293, Lexington, KY 40512-4293.
Information on the aggregate remuneration paid to the directors of the Company can be found in the Statement of Operations herein. The Fund pays to The Hartford a portion of the Chief Compliance Officer’s compensation, but does not pay salaries or compensation to any of their other officers or directors who are employed by The Hartford.
Non-Interested Directors
Lynn S. Birdsong (1946) Director since 2003, Co-Chairman of the Investment Committee
Mr. Birdsong is a private investor. Mr. Birdsong currently serves as a Director of the Sovereign High Yield Investment Company (April 2010 to current). Mr. Birdsong currently serves as an Independent Director of Nomura Partners Funds, Inc. (formerly, The Japan Fund) (March 2003 to current). From 1979 to 2002, Mr. Birdsong was a managing director of Zurich Scudder Investments, an investment management firm. During his employment with Scudder, Mr. Birdsong was an Interested Director of The Japan Fund. Since 1981, Mr. Birdsong has been a partner in Birdsong Company, an advertising specialty firm.
Robert M. Gavin, Jr. (1940) Director since 2002 (HSF) and 1986 (HSF2), Chairman of the Board since 2004
Dr. Gavin is an educational consultant. Prior to September 1, 2001, he was President of Cranbrook Education Community and prior to July 1996, he was President of Macalester College, St. Paul, Minnesota.
Duane E. Hill (1945) Director since 2001 (HSF) and 2002 (HSF2), Chairman of the Nominating Committee
Mr. Hill is Partner of TSG Ventures L.P., a private equity investment company. Mr. Hill is a former partner of TSG Capital Group, a private equity investment firm that served as sponsor and lead investor in leveraged buyouts of middle market companies.
Sandra S. Jaffee (1941) Director since 2005
Ms. Jaffee is the founder and Chief Executive Officer of a private company, Homeworks Concierge, LLC, which provides residential property management services in Westchester County, New York (January 2012 to present). Ms. Jaffee served as Chairman (2008 to 2009) and Chief Executive Officer of Fortent (formerly Searchspace Group), a leading provider of compliance/regulatory technology to financial institutions from August 2005 to August 2009. Ms. Jaffee currently serves as a member of the Board of Directors of Broadridge Financial Solutions as well as a Trustee of Muhlenberg College.
William P. Johnston (1944) Director since 2005, Chairman of the Compliance Committee
In February 2008, Mr. Johnston was elected to the Board of Directors of HCR-ManorCare, Inc. In August 2007, Mr. Johnston was elected to the Board of Directors of LifeCare Holdings, Inc. In July 2006, Mr. Johnston was elected to the Board of Directors of MultiPlan, Inc. and served as a director (July 2006 to August 2010). In June 2006, Mr. Johnston was appointed as Senior Advisor to The Carlyle Group, a global private equity and alternative asset investment firm. In May 2006, Mr. Johnston was elected to the Supervisory Board of Fresenius Medical Care AG & Co. KGaA, after its acquisition of Renal Care Group, Inc. in March 2006.
| 26 |
Phillip O. Peterson (1944) Director since 2002 (HSF) and 2000 (HSF2), Chairman of the Audit Committee
Mr. Peterson is a mutual fund industry consultant. He was a partner of KPMG LLP (an accounting firm) until July 1999. Mr. Peterson joined William Blair Funds in February 2007 as a member of the Board of Trustees. Mr. Peterson also joined the Board of Trustees of Symetra Variable Mutual Funds Trust as a trustee in February 2012.
Lemma W. Senbet (1946) Director since 2005
Dr. Senbet is the William E. Mayer Chair Professor of Finance and Director, Center for Financial Policy, at the University of Maryland, Robert H. Smith School of Business. He was chair of the Finance Department from 1998 to 2006. Previously he was a chaired professor of finance at the University of Wisconsin-Madison. Also, he was director of the Fortis Funds from March 2000 to July 2002. Dr. Senbet served the finance profession in various capacities, including as director of the American Finance Association and President of the Western Finance Association. In 2006, Dr. Senbet was inducted Fellow of Financial Management Association International for his career-long distinguished scholarship and professional service.
Interested Directors and Officers
James E. Davey (1964) Director since 2012, President and Chief Executive Officer since 2010
Mr. Davey serves as Executive Vice President of Hartford Life Insurance Company (“HLIC”) and The Hartford Financial Services Group, Inc. Additionally, Mr. Davey serves as Chairman of the Board and Manager of Hartford Funds Distributors, LLC (“HFD”) and Hartford Administrative Services Company (“HASCO”). Mr. Davey also serves as Manager, President and Chairman of the Board for Hartford Funds Management Company, LLC (“HFMC”). Mr. Davey joined The Hartford in 2002.
Lowndes A. Smith (1939) Director since 1996 (HSF) and 2002 (HSF2), Co-Chairman of the Investment Committee
Mr. Smith served as Vice Chairman of The Hartford from February 1997 to January 2002, as President and Chief Executive Officer of Hartford Life, Inc. from February 1997 to January 2002, and as President and Chief Operating Officer of The Hartford Life Insurance Companies from January 1989 to January 2002. Mr. Smith serves as a Director of White Mountains Insurance Group, Ltd., One Beacon Insurance and Symetra Financial and as Managing Director of Whittington Gray Associates.
Other Officers
Mark A. Annoni (1964) Vice President, Controller and Treasurer since 2012
Mr. Annoni serves as the Assistant Vice President of HLIC (February 2004 to present). Mr. Annoni joined The Hartford in April 2001 as part of The Hartford’s acquisition of Fortis Financial Group (“Fortis”). Prior to joining The Hartford, Mr. Annoni served as Manager of Mutual Fund Accounting at Fortis (July 1997 to April 2001).
Michael R. Dressen (1963) AML Compliance Officer since 2011
Mr. Dressen currently serves as Assistant Vice President of HLIC. He also serves as Chief Compliance Officer and AML Compliance Officer of HASCO and as AML Officer of HFD. Mr. Dressen joined The Hartford in 2005 from State Farm Insurance Companies where he held various positions related to mutual funds, variable products, and property casualty insurance.
Tamara L. Fagely (1958) Vice President since 2002 (HSF) and 1993 (HSF2)
Currently, Ms. Fagely is President and a Director of HASCO, Chief Administrative Officer and Manager of HFMC and a Vice President of HLIC. Ms. Fagely served as a Vice President of HASCO (1998-2013) and Chief Financial Officer of HASCO (2006-2013). She served as Assistant Vice President of HLIC from December 2001 through March 2005. In addition, Ms. Fagely is Manager and Chief Operating Officer of HFD.
Edward P. Macdonald (1967) Vice President, Secretary and Chief Legal Officer since 2005
Mr. Macdonald serves as Vice President of HLIC and Vice President, Chief Legal Officer and Secretary of HFD and HASCO. Mr. Macdonald also serves as Manager, Vice President, Chief Legal Officer and Secretary of HFMC. Mr. Macdonald joined The Hartford in 2005.
Joseph G. Melcher (1973) Vice President and Chief Compliance Officer since 2013(1)
Mr. Melcher currently serves as Vice President of HFMC and HFD. Mr. Melcher joined The Hartford in 2012 from Touchstone Investments, a member of the Western & Southern Financial Group, where he held the position of Vice President and Chief Compliance Officer from 2010 through 2012 and Assistant Vice President, Compliance from 2005 to 2010.
| (1) | Mr. Melcher was named Vice President and Chief Compliance Officer of HSF and HSF2 on February 6, 2013. Prior to February 6, 2013, Colleen Pernerewski served as Chief Compliance Officer of HSF and HSF2. |
| 27 |
| Hartford Healthcare HLS Fund |
| Directors and Officers (Unaudited) – (continued) |
Vernon J. Meyer (1964) Vice President since 2006
Mr. Meyer serves as Senior Vice President of HLIC. He also serves as Senior Vice President of HFMC and HFD. Mr. Meyer joined The Hartford in 2004.
Laura S. Quade (1969) Vice President since 2012
Ms. Quade currently serves as Vice President of HASCO and is a Director of Mutual Fund Service Operations. She also serves as Director, Enterprise Operations of HFD and HLIC. Ms. Quade joined The Hartford in 2001 as part of The Hartford’s acquisition of Fortis.
Elizabeth L. Schroeder (1966) Vice President since 2010(2)
Ms. Schroeder currently serves as Assistant Vice President of HLIC. Ms. Schroeder joined HLIC in 1991. She is also an Assistant Vice President of HFMC and HASCO.
(2) Ms. Schroeder served as Vice President of HSF and HSF2 until August 7, 2013.
Martin Swanson (1962) Vice President since 2010
Mr. Swanson is a Vice President of HLIC. Mr. Swanson also serves as Chief Marketing Officer for HFD. Prior to joining HLIC in 1998, Mr. Swanson was a Vice President at PaineWebber, Inc.
HOW TO OBTAIN A COPY OF THE FUND’S PROXY VOTING POLICIES AND VOTING RECORDS (UNAUDITED)
A description of the policies and procedures that the Fund uses to determine how to vote proxies relating to portfolio securities and information about how the Fund voted proxies relating to portfolio securities during the most recent twelve-month period ended June 30 are available (1) without charge, upon request, by calling 800-862-6668 and (2) on the SEC’s website at http://www.sec.gov.
QUARTERLY PORTFOLIO HOLDINGS INFORMATION (UNAUDITED)
The Fund files a complete schedule of portfolio holdings with the SEC for the first and third quarters of each fiscal year on Form N-Q. The Fund’s Forms are available (1) without charge, upon request, by calling 800-862-6668 and (2) on the SEC’s website at http://www.sec.gov. The Form N-Q may be reviewed and copied at the SEC’s Public Reference Room in Washington, DC. Information on the operation of the Public Reference Room may be obtained by calling 1-800-SEC-0330.
| 28 |
| Hartford Healthcare HLS Fund |
| Expense Example (Unaudited) |
Your Fund's Expenses
As a shareholder of the Fund, you incur two types of costs: (1) transaction costs and (2) ongoing costs including investment management fees, distribution fees, if any, and other fund expenses. This example is intended to help you understand your ongoing costs (in dollars) of investing in the Fund and to compare these costs with the ongoing costs of investing in other mutual funds. The example is based on an investment of $1,000 invested at the beginning of the period and held for the period of December 31, 2012 through June 30, 2013.
Actual Expenses
The first set of columns of the table below provides information about actual account values and actual expenses. You may use the information in this column, together with the amount you invested, to estimate the expenses that you paid over the period. Simply divide your account value by $1,000 (for example, an $8,600 account value divided by $1,000 = 8.6), then multiply the result by the number in the line under the heading entitled “Expenses Paid During Period” to estimate the expenses you paid on your account during this period.
Hypothetical Example for Comparison Purposes
The second set of columns of the table below provides information about hypothetical account values and hypothetical expenses based on the Fund’s actual expense ratio and an assumed rate of return of 5% per year before expenses, which is not the Fund’s actual return. The hypothetical account values and expenses may not be used to estimate the actual ending account balance or expenses you paid for the period. You may use this information to compare the ongoing costs of investing in the Fund and other funds. To do so, compare this 5% hypothetical example with the 5% hypothetical examples that appear in the shareholder reports of the other funds.
Please note that the expenses shown in the table are meant to highlight your ongoing costs only and do not reflect any transactional costs, such as sales charges (loads) and CDSC. Therefore, the second set of columns of the table is useful in comparing ongoing costs only, and will not help you determine the relative total costs of owning different funds. In addition, if these transactional costs were included, your costs would be higher. Expenses are equal to the Fund's annualized expense ratios multiplied by average account value over the period, multiplied by 181/365 (to reflect the one-half year period).
| Actual return | Hypothetical (5% return before expenses) | |||||||||||||||||||||||||||||||
| Beginning Account Value December 31, 2012 | Ending Account Value June 30, 2013 | Expenses paid during the period December 31, 2012 through June 30, 2013 | Beginning Account Value December 31, 2012 | Ending Account Value June 30, 2013 | Expenses paid during the period December 31, 2012 through June 30, 2013 | Annualized expense ratio | Days in the current 1/2 year | Days in the full year | ||||||||||||||||||||||||
| Class IA | $ | 1,000.00 | $ | 1,221.70 | $ | 4.96 | $ | 1,000.00 | $ | 1,020.33 | $ | 4.51 | 0.90 | % | 181 | 365 | ||||||||||||||||
| Class IB | $ | 1,000.00 | $ | 1,220.00 | $ | 6.33 | $ | 1,000.00 | $ | 1,019.09 | $ | 5.76 | 1.15 | % | 181 | 365 | ||||||||||||||||
| 29 |
| Hartford Healthcare HLS Fund |
| Principal Risks (Unaudited) |
The principal risks of investing in the Fund are described below.
Market, Selection, and Strategy Risk: The Fund’s share price may fluctuate due to market risk and/or security selections that may underperform the market or relevant benchmarks. If the sub-adviser’s investment strategy does not perform as expected, the Fund could underperform its peers or lose money. There is no guarantee the Fund will achieve its stated objective.
Health Sector Risk: Risks of focusing investments on the health care sector include regulatory and legal developments, patent considerations, intense competitive pressures, rapid technological changes and potential product obsolescence, and liquidity risk.
Foreign Investment and Emerging Markets Risk: Foreign investments can be riskier than U.S. investments. Potential risks include currency risk that may result from unfavorable exchange rates, liquidity risk if decreased demand for a security makes it difficult to sell at the desired price, and risks that stem from substantially lower trading volume on foreign markets. These risks are generally greater for investments in emerging markets, which are also subject to greater price volatility, and custodial and regulatory risks.
Small/Mid-cap Stock Risk: Small- and mid-cap stocks are generally more volatile and risky and may be less liquid than large-cap stocks because they may have limited operating histories, narrow product lines, and focus on niche markets.
| 30 |
HARTFORD HLS FUNDS
c/o The Hartford Wealth Management - Global Annuities
P.O. Box 14293
Lexington, KY 40512-4293
HARTFORDFUNDS
hartfordfunds.com
Hartford Series Fund, Inc. is underwritten and distributed by Hartford Funds Distributors, LLC.
Hartford Series Fund, Inc. inception dates range from 1977 to date. Hartford Series Fund, Inc. is not a subsidiary of The Hartford Financial Services Group, Inc. ("The Hartford") but is underwritten, distributed by and advised by subsidiaries of The Hartford. Investments in Hartford Series Fund, Inc. are not guaranteed by The Hartford or any other entity.
You should carefully consider investment objectives, risks, and charges and expenses of Hartford HLS Funds before investing. This and other information can be found in the Fund’s prospectus or summary prospectus, which can be obtained by calling 800-862-6668. Please read them carefully before you invest or send money.
HLSSAR-HC13 8-13 113543-1 Printed in U.S.A ©2013 The Hartford, Hartford, CT 06115
HARTFORDFUNDS
| HARTFORD HIGH YIELD HLS FUND
2013 Semi Annual Report
|
A MESSAGE FROM THE PRESIDENT
Dear Fellow Shareholders:
I want to take this opportunity to say thank you for investing in the Hartford HLS Funds.
Market Review
During the first half of the year, stocks rose steadily. U.S. equities (as represented by the S&P 500 Index1) posted a strong gain of 10.61% during the first quarter, on their way to an all-time high. During the second quarter, investors persevered through volatility surrounding rumors of the rollback of the U.S. Federal Reserve’s quantitative easing (QE) program later this year, and the S&P 500 Index rose 2.91%. That brought the market’s rise to 13.82% for the first half of 2013. The rumors about QE’s end sent bond yields and mortgage rates upward, but that wasn’t enough to dissuade investors from pushing equities into positive territory.
Because of QE, some have expressed concerns regarding the recent market rally. But a more careful examination of economic data reveals a strong foundation. Consumer balance sheets have improved since the financial crisis, with consumer debt as a percentage of income falling steadily. Housing continued its dogged recovery, fueled by population growth and pent-up demand. In fact, it’s substantive economic improvements that have moved Federal Reserve Chairman Ben Bernanke to consider removing the “training wheels” of QE, which we think should be viewed as a vote of confidence in the U.S. economy going forward.
As the U.S. outlook continues to improve, concerns do remain in the global economy. Emerging markets have lagged due to social unrest and rising inflation. Slowing growth in China is clouding global growth forecasts, but it’s important to remember that China still boasts 7.5% annual GDP growth.
It’s important to stay abreast of domestic and international economic developments while balancing your individual investment goals. Meeting with your financial advisor on a regular basis to examine your current investment strategy can help you determine whether you are on the right track:
| • | Is your portfolio fully diversified with an appropriate mix of stocks and bonds? |
| • | Is your fixed-income portfolio positioned to take advantage of opportunities across the credit spectrum and fulfill your income needs? |
| • | Is your portfolio still in line with your risk tolerance and investment time horizon? |
Your financial professional can help you choose options within our fund family to navigate today’s markets with confidence.
Thank you again for investing with the Hartford HLS Funds.
James Davey
President
Hartford HLS Funds
1 The S&P 500 Index is a market capitalization-weighted price index composed of 500 widely held common stocks.
Table of Contents
This report is prepared for the general information of contract owners and qualified retirement plan participants. It is not an offer of contracts or of qualified retirement plans. It should not be used in connection with any offer, except in conjunction with the appropriate product prospectus which contains all pertinent information including the applicable sales, administrative and other charges.
The views expressed in the Fund’s Manager Discussion under ‘‘Why did the Fund perform this way?’’ and ‘‘What is the outlook?’’ are views of the Fund’s sub-adviser and portfolio management team through the end of the period and are subject to change based on market and other conditions. The Fund’s Manager Discussion is for informational purposes only and does not represent an offer, recommendation or solicitation to buy, hold or sell any security. The specific securities identified and described, if any, do not represent all of the securities purchased or sold and you should not assume that investments in the securities identified and discussed will be profitable.
Hartford High Yield HLS Fund inception 09/30/1998
(sub-advised by Wellington Management Company, LLP)
Investment objective – Seeks to provide high current income, and long-term total return.
Performance Overview 6/30/03 - 6/30/13
The chart above represents the hypothetical growth of a $10,000 investment in Class IA. Growth results in classes other than Class IA will vary from what is seen above due to differences in the expenses charged to those share classes.
Average Annual Total Returns (as of 6/30/13)
| 6 Month† | 1 Year | 5 Years | 10 Years | |||||||||||||
| High Yield IA | 0.98% | 8.02% | 10.03% | 7.79% | ||||||||||||
| High Yield IB | 0.86% | 7.75% | 9.76% | 7.52% | ||||||||||||
| Barclays U.S. Corporate High Yield Bond Index | 1.42% | 9.49% | 10.94% | 8.91% | ||||||||||||
| † | Not Annualized |
PERFORMANCE DATA QUOTED REPRESENTS PAST PERFORMANCE AND DOES NOT GUARANTEE FUTURE RESULTS. The investment return and principal value of the investment will fluctuate so that investors’ shares, when redeemed, may be worth more or less than their original cost. Current performance may be lower or higher than the performance data quoted. To obtain performance data current to the most recent month-end, please visit our website www.hartfordfunds.com.
Total returns presented above were calculated using the Fund’s net asset value available to shareholders for sale or redemption of Fund shares on June 30, 2013, which may exclude investment transactions as of this date. All share class returns assume the reinvestment of all distributions at net asset value and the deduction of all fund expenses.
Performance information includes performance under the Fund’s previous sub-adviser, Hartford Investment Management Company. As of March 5, 2012, Hartford Investment Management Company no longer serves as the sub-adviser to the Fund.
Barclays U.S. Corporate High Yield Bond Index is an unmanaged broad-based market-value-weighted index that tracks the total return performance of non-investment grade, fixed-rate, publicly placed, dollar denominated and nonconvertible debt registered with the Securities and Exchange Commission.
You cannot invest directly in an index.
As of the Fund’s current prospectus dated May 1, 2013, the total annual operating expense ratios for Class IA and Class IB shares were 0.75% and 1.00%, respectively. Actual expenses may be higher. Please see the accompanying Financial Highlights for expense ratios for the six-month period ended June 30, 2013.
The chart and table do not reflect the deductions of taxes, sales charges or other fees which may be applied at the variable life insurance, variable annuity or qualified retirement plan product level. Any such additional sales charges or other fees or expenses would lower the contract’s or plan’s performance.
All investments are subject to risk including the possible loss of principal. For a discussion of the Fund’s risks, please see the Principal Risks section. For more detailed information on the risks associated with an investment in the Fund, please see the prospectus.
| 2 |
| Hartford High Yield HLS Fund |
| Manager Discussion |
| June 30, 2013 (Unaudited) |
| Portfolio Managers | ||
| Christopher A. Jones, CFA | ||
| Senior Vice President and Fixed Income Portfolio Manager | ||
How did the Fund perform?
The Class IA shares of the Hartford High Yield HLS Fund returned 0.98% for the six-month period ended June 30, 2013, underperforming its benchmark, the Barclays U.S. Corporate High Yield Bond Index, which returned 1.42% for the same period. The Fund also underperformed the 1.23% average return of the Variable Products-Underlying Funds Lipper High Current Yield Funds peer group, a group of funds with investment strategies similar to those of the Fund.
Why did the Fund perform this way?
Central bank easing and signs of gradual global economic recovery imparted a positive tone to financial markets early in the year. However, sentiment abruptly changed late in the period after the Federal Reserve (Fed) surprised markets with its earlier-than-expected plan to reduce asset purchases, sending yields sharply higher.
The Federal Open Market Committee began to publically debate the costs of open-ended bond purchases during the first quarter, raising concerns that these will end sooner than anticipated. But it was statements by Fed policymakers on June 18 and 19 that really caught market participants off guard with their unexpectedly agressive tone. Specifically, Fed officials signaled a readiness to begin reducing the central bank’s asset purchases under quantitative easing (QE) by September, and to end purchases by mid-2014 if the economy strengthened sufficiently.
In contrast to the Fed’s aggressive rhetoric, European Central Bank (ECB) officials made it clear they are in no hurry to end the central bank's accommodative stance as the eurozone’s economic recovery continued to be the world’s weakest by a large margin. Meanwhile, stress in Chinese money markets coincided with signs of slowing growth. China's central bank attempted to tighten credit at the same time that global markets were closely watching the Fed's attempts to move toward tighter policy.
U.S. economic data signaled that the economy remains on a moderate growth path, underpinned by the housing and labor markets. The residential real estate recovery continued to pick up steam as home sales rose; house prices saw their greatest annual gain in seven years, according to data from S&P/Case-Shiller. Rising home values and equity-market gains helped boost consumer confidence and prop up consumption. However, manufacturing activity contracted and growth in the services sector slowed.
Worries over an eventual end to record-low borrowing rates in the U.S. fueled a massive, broad-based sell-off across nearly all corners of the global financial markets in June. U.S. High Yield mutual funds were not immune and experienced large outflows during the month of June (U.S. $12.2 billion in aggregate). The Treasury yield curve steepened as the 10-year Treasury yield surged 0.73% to end the period at 2.49%, the highest level since August 2011. Major fixed income sectors, with the exception of high yield, posted negative absolute returns driven by rising rates and underperformed Treasuries on a duration-adjusted basis during the 6-month period.
High Yield outperformed almost all other U.S. fixed income sectors over the six-month period on a total return basis (Bank Loans being the lone exception). The Barclays U.S. Corporate High Yield Bond Index returned 1.42% for the six-months ended June 30, 2013 and outperformed duration equivalent treasuries by 2.9%. Duration is a measure of the sensitivity of an asset of portfolio’s price to nominal interest rate movement. The Option-Adjusted Spread of the High Yield index was 4.92% on June 30, 2013, a decrease of 0.19% (from 5.11%) on December 31, 2012.
The Fund underperformed its benchmark, the Barclays U.S. Corporate High Yield Bond Index, during the period due to security selection decisions. Industry allocation decisions contributed to relative returns.
In aggregate, security selection detracted from benchmark relative results. Among issuers in the financial services sectors, positions in Royal Bank Scotland and International Lease Finance detracted from relative returns. The longer duration of some of the bonds of these issuers makes them more sensitive to rises in interest rates, which caused them to underperform during the time period. However, we continued to find the financial sector attractive due to the improving credit metrics (strong balance sheets and liquidity positions) of issuers. Among issuers within the media non cable sector, not owning strong performing benchmark-constituent CC Media Holdings (better known as Clear Channel) hurt relative performance. Clear Channel is a 2008 Leveraged Buy-out and has struggled under a withering debt load since that time. In May 2013, Clear Channel was able to extend the maturities of some of its outstanding Bank Loans. Among issuers in the consumer cyclicals services sector, our overweight position in Service Corp Internal detracted from benchmark-relative returns. An allocation to high yield credit default swaps indices, which are used to manage overall portfolio risk and
| 3 |
| Hartford High Yield HLS Fund |
| Manager Discussion – (continued) |
| June 30, 2013 (Unaudited) |
enhance return, contributed to relative returns over the period. Within the technology & related sector, an out-of-benchmark position in the convertible bonds of Micron Technology benefitted the portfolio as the company continues to benefit from an upturn in the semi-conductor cycle. Within the Wireless sector an underweight to the weak performing benchmark-constituent Sprint contributed to relative returns. Dish Networks’ bid for Sprint raised concern from investors about the combined entities’ aggregate debt load and balance sheet leverage relative to Sprint’s investment grade peers (AT&T and Verizon).
In aggregate, sector allocation was additive to benchmark-relative results. An overweight allocation to the technology sector contributed positively to relative performance during the period. Within the technology sector, we saw the best opportunities in payment processing and service companies. This is due to their recurring revenue streams, low capital expenditures, and high barriers to entry. We were generally more skeptical of hardware companies. Conversely, an underweight allocation to the supermarkets sector detracted from relative returns. Supermarkets is a small sector within the High Yield Market (less than 1% of index market value), and they have thin profit margins on the goods that they sell, which in our view gives them less margin for error in managing their businesses.
Bond quality positioning had a minimal positive impact on performance during the period, although a slight overweight to CCC-rated bonds, which are generally less sensitive to changes in interest rates than their higher quality counterparts, added to relative returns.
What is the outlook?
Our outlook for U.S. high yield bonds remains positive, given what we believe are strong fundamentals and relatively appealing yields. We believe issuers have meaningfully strengthened their balance sheets and liquidity positions since the financial crisis, and proceeds from new issuance have been used mainly to refinance existing debt (although shareholder-friendly actions such as Merger & Acquisition activity and leveraged buyouts have started to pick up). The trailing 12-month par-weighted default rate ended June at 1.09%, well below the 25-year average of 3.97%. The sector’s average yield of 6.66% at quarter end compares favorably to other fixed income sectors. However, we believe technicals may prove challenging in the near-term as investors grapple with the eventual shift to tighter U.S. monetary policy. Despite the recent backup in yields and outflows from the sector, we still anticipate that a sustained, global low-interest-rate environment will drive continued demand for high yield assets from income-seeking investors over the remainder of 2013.
Distribution by Credit Quality
as of June 30, 2013
| Credit Rating * | Percentage of Net Assets | |||
| Baa / BBB | 1.1 | % | ||
| Ba / BB | 32.0 | |||
| B | 39.1 | |||
| Caa / CCC or Lower | 18.5 | |||
| Unrated | 4.3 | |||
| Non-Debt Securities and Other Short-Term Instruments | 3.9 | |||
| Other Assets & Liabilities | 1.1 | |||
| Total | 100.0 | % | ||
| * | Does not apply to the Fund itself. Based upon Moody’s and S&P long-term credit ratings for the Fund’s holdings as of the date noted. If Moody's and S&P assign different ratings to a holding, the lower rating is used. "Unrated" includes fixed-income securities (other than cash-like short-term instruments and U.S. Government securities) for which Moody’s and S&P have not issued long-term credit ratings. |
Diversification by Industry
as of June 30, 2013
| Industry | Percentage of Net Assets | |||
| Fixed Income Securities | ||||
| Accommodation and Food Services | 1.7 | % | ||
| Administrative Waste Management and Remediation | 2.1 | |||
| Arts, Entertainment and Recreation | 7.3 | |||
| Beverage and Tobacco Product Manufacturing | 0.8 | |||
| Chemical Manufacturing | 2.3 | |||
| Computer and Electronic Product Manufacturing | 2.3 | |||
| Construction | 3.9 | |||
| Fabricated Metal Product Manufacturing | 0.7 | |||
| Finance and Insurance | 12.5 | |||
| Food Manufacturing | 0.5 | |||
| Health Care and Social Assistance | 7.4 | |||
| Information | 17.0 | |||
| Machinery Manufacturing | 1.4 | |||
| Mining | 3.2 | |||
| Miscellaneous Manufacturing | 2.0 | |||
| Nonmetallic Mineral Product Manufacturing | 0.8 | |||
| Other Services | 1.1 | |||
| Paper Manufacturing | 0.1 | |||
| Petroleum and Coal Products Manufacturing | 7.4 | |||
| Pipeline Transportation | 1.8 | |||
| Plastics and Rubber Products Manufacturing | 1.3 | |||
| Primary Metal Manufacturing | 0.5 | |||
| Professional, Scientific and Technical Services | 1.3 | |||
| Real Estate, Rental and Leasing | 4.2 | |||
| Retail Trade | 6.8 | |||
| Transportation Equipment Manufacturing | 0.3 | |||
| Utilities | 3.3 | |||
| Wholesale Trade | 0.8 | |||
| Wood Product Manufacturing | 0.2 | |||
| Total | 95.0 | % | ||
| Equity Securities | ||||
| Diversified Financials | 1.6 | |||
| Energy | 0.2 | |||
| Software and Services | 0.0 | |||
| Telecommunication Services | 0.3 | |||
| Total | 2.1 | % | ||
| Short-Term Investments | 1.8 | |||
| Other Assets and Liabilities | 1.1 | |||
| Total | 100.0 | % | ||
| 4 |
| Hartford High Yield HLS Fund |
| Schedule of Investments |
| June 30, 2013 (Unaudited) |
| (000’s Omitted) |
| Shares or Principal Amount ╬ | Market Value ╪ | |||||||
ASSET & COMMERCIAL MORTGAGE BACKED SECURITIES - 0.0% | ||||||||
| Finance and Insurance - 0.0% | ||||||||
| Soundview NIM Trust | ||||||||
| $ | 2,490 | 0.00%, 12/25/2036 ■● | $ | — | ||||
| Total asset & commercial mortgage backed securities | ||||||||
| (cost $2,479) | $ | — | ||||||
CORPORATE BONDS - 90.8% | ||||||||
| Accommodation and Food Services - 1.7% | ||||||||
| Caesars Entertainment Operating Co., Inc. | ||||||||
| $ | 4,180 | 8.50%, 02/15/2020 | $ | 3,940 | ||||
| Caesars Operating Escrow | ||||||||
| 3,505 | 9.00%, 02/15/2020 ■ | 3,338 | ||||||
| Choice Hotels International, Inc. | ||||||||
| 306 | 5.70%, 08/28/2020 | 324 | ||||||
| 1,715 | 5.75%, 07/01/2022 | 1,818 | ||||||
| 9,420 | ||||||||
| Administrative Waste Management and Remediation - 2.1% | ||||||||
| Carlson Wagonlit B.V. | ||||||||
| 1,675 | 6.88%, 06/15/2019 ■ | 1,692 | ||||||
| Casella Waste Systems, Inc. | ||||||||
| 1,650 | 7.75%, 02/15/2019 | 1,567 | ||||||
| Equinix, Inc. | ||||||||
| 165 | 4.88%, 04/01/2020 | 162 | ||||||
| 995 | 5.38%, 04/01/2023 | 975 | ||||||
| 2,050 | 7.00%, 07/15/2021 | 2,224 | ||||||
| Iron Mountain, Inc. | ||||||||
| 1,350 | 5.75%, 08/15/2024 | 1,266 | ||||||
| 3,816 | 7.75%, 10/01/2019 | 4,102 | ||||||
| 11,988 | ||||||||
| Arts, Entertainment and Recreation - 7.3% | ||||||||
| AMC Entertainment, Inc. | ||||||||
| 1,814 | 8.75%, 06/01/2019 | 1,941 | ||||||
| 4,944 | 9.75%, 12/01/2020 | 5,599 | ||||||
| CCO Holdings LLC | ||||||||
| 4,021 | 5.25%, 09/30/2022 | 3,820 | ||||||
| 4,972 | 7.38%, 06/01/2020 | 5,407 | ||||||
| Chester Downs & Marina LLC | ||||||||
| 1,040 | 9.25%, 02/01/2020 ■ | 1,004 | ||||||
| Cinemark USA, Inc. | ||||||||
| 430 | 5.13%, 12/15/2022 | 415 | ||||||
| Emdeon, Inc. | ||||||||
| 1,640 | 11.00%, 12/31/2019 | 1,849 | ||||||
| Gray Television, Inc. | ||||||||
| 3,441 | 7.50%, 10/01/2020 | 3,510 | ||||||
| Great Canadian Gaming Co. | ||||||||
| CAD | 1,361 | 6.63%, 07/25/2022 ■ | 1,336 | |||||
| Greektown Superholdings, Inc. | ||||||||
| 1,650 | 13.00%, 07/01/2015 | 1,753 | ||||||
| Isle of Capri Casinos, Inc. | ||||||||
| 1,920 | 8.88%, 06/15/2020 | 2,006 | ||||||
| NAI Entertainment Holdings LLC | ||||||||
| 1,345 | 8.25%, 12/15/2017 ■ | 1,439 | ||||||
| NBC Universal Enterprise | ||||||||
| 2,180 | 5.25%, 12/19/2049 ■ | 2,180 | ||||||
| Regal Entertainment Group | ||||||||
| 246 | 5.75%, 02/01/2025 | 234 | ||||||
| 2,006 | 9.13%, 08/15/2018 | 2,207 | ||||||
| Sirius XM Radio, Inc. | ||||||||
| 860 | 4.25%, 05/15/2020 ■ | 808 | ||||||
| 2,420 | 4.63%, 05/15/2023 ■ | 2,238 | ||||||
| 376 | 5.25%, 08/15/2022 ■ | 365 | ||||||
| Univision Communications, Inc. | ||||||||
| 2,695 | 6.75%, 09/15/2022 ■ | 2,830 | ||||||
| 40,941 | ||||||||
| Beverage and Tobacco Product Manufacturing - 0.8% | ||||||||
| Constellation Brands, Inc. | ||||||||
| 295 | 4.25%, 05/01/2023 | 278 | ||||||
| 3,965 | 6.00%, 05/01/2022 | 4,253 | ||||||
| 4,531 | ||||||||
| Chemical Manufacturing - 2.3% | ||||||||
| Ferro Corp. | ||||||||
| 3,873 | 7.88%, 08/15/2018 | 4,009 | ||||||
| Hexion Specialty Chemicals | ||||||||
| 3,055 | 8.88%, 02/01/2018 | 3,116 | ||||||
| Hexion U.S. Finance Corp. | ||||||||
| 1,245 | 6.63%, 04/15/2020 | 1,242 | ||||||
| Ineos Group Holdings plc | ||||||||
| 3,265 | 6.13%, 08/15/2018 ■ | 3,118 | ||||||
| MPM Escrow LLC/MPM Finance Corp. | ||||||||
| 1,580 | 8.88%, 10/15/2020 | 1,651 | ||||||
| 13,136 | ||||||||
| Computer and Electronic Product Manufacturing - 2.3% | ||||||||
| CDW Escrow Corp. | ||||||||
| 5,455 | 8.50%, 04/01/2019 | 5,864 | ||||||
| Freescale Semiconductor, Inc. | ||||||||
| 1,645 | 9.25%, 04/15/2018 ■ | 1,773 | ||||||
| Micron Technology, Inc. | ||||||||
| 637 | 1.63%, 02/15/2033 ۞■ | 919 | ||||||
| 961 | 2.13%, 02/15/2033 ۞■ | 1,396 | ||||||
| NXP B.V./NXP Funding LLC | ||||||||
| 1,425 | 3.75%, 06/01/2018 ■ | 1,397 | ||||||
| ON Semiconductor Corp. | ||||||||
| 973 | 2.63%, 12/15/2026 ۞ | 1,118 | ||||||
| Sensata Technologies B.V. | ||||||||
| 745 | 4.88%, 10/15/2023 ■ | 717 | ||||||
| 13,184 | ||||||||
| Construction - 3.9% | ||||||||
| K Hovnanian Enterprises, Inc. | ||||||||
| 1,775 | 9.13%, 11/15/2020 ■ | 1,944 | ||||||
| KB Home | ||||||||
| 2,104 | 1.38%, 02/01/2019 ۞ | 2,183 | ||||||
| 2,206 | 7.50%, 09/15/2022 | 2,366 | ||||||
| 3,750 | 8.00%, 03/15/2020 | 4,163 | ||||||
| Lennar Corp. | ||||||||
| 5,320 | 4.75%, 12/15/2017 | 5,320 | ||||||
| 1,155 | 5.00%, 11/15/2022 ■ | 1,097 | ||||||
| M/I Homes, Inc. | ||||||||
| 566 | 3.00%, 03/01/2018 | 585 | ||||||
| Pulte Homes, Inc. | ||||||||
| 615 | 6.38%, 05/15/2033 | 575 | ||||||
| 2,446 | 7.88%, 06/15/2032 | 2,691 | ||||||
The accompanying notes are an integral part of these financial statements.
| 5 |
| Hartford High Yield HLS Fund |
| Schedule of Investments – (continued) |
| June 30, 2013 (Unaudited) |
| (000’s Omitted) |
| Shares or Principal Amount ╬ | Market Value ╪ | |||||||
CORPORATE BONDS - 90.8% - (continued) | ||||||||
| Construction - 3.9% - (continued) | ||||||||
| Ryland Group, Inc. | ||||||||
| $ | 910 | 5.38%, 10/01/2022 | $ | 878 | ||||
| 21,802 | ||||||||
| Fabricated Metal Product Manufacturing - 0.7% | ||||||||
| BOE Intermediate Holdings Corp. | ||||||||
| 1,830 | 9.00%, 11/01/2017 ■Þ | 1,757 | ||||||
| Masco Corp. | ||||||||
| 1,135 | 5.95%, 03/15/2022 | 1,191 | ||||||
| 320 | 7.13%, 03/15/2020 | 357 | ||||||
| Ply Gem Industries, Inc. | ||||||||
| 693 | 9.38%, 04/15/2017 | 733 | ||||||
| 4,038 | ||||||||
| Finance and Insurance - 11.5% | ||||||||
| Ally Financial, Inc. | ||||||||
| 1,930 | 7.50%, 09/15/2020 | 2,224 | ||||||
| CIT Group, Inc. | ||||||||
| 3,011 | 5.25%, 03/15/2018 | 3,094 | ||||||
| 2,470 | 6.63%, 04/01/2018 ■ | 2,668 | ||||||
| Community Choice Financial, Inc. | ||||||||
| 3,810 | 10.75%, 05/01/2019 | 3,648 | ||||||
| Credit Acceptance Corp. | ||||||||
| 115 | 9.13%, 02/01/2017 | 122 | ||||||
| Deutsche Bank AG | ||||||||
| 1,755 | 4.30%, 05/24/2028 | 1,620 | ||||||
| Felcor Lodging L.P. | ||||||||
| 1,450 | 5.63%, 03/01/2023 | 1,410 | ||||||
| Fibria Overseas Finance Ltd. | ||||||||
| 1,578 | 7.50%, 05/04/2020 ■ | 1,704 | ||||||
| General Motors Financial Co., Inc. | ||||||||
| 1,050 | 2.75%, 05/15/2016 ■ | 1,033 | ||||||
| 535 | 3.25%, 05/15/2018 ■ | 520 | ||||||
| 350 | 4.25%, 05/15/2023 ■ | 326 | ||||||
| Ineos Finance plc | ||||||||
| 1,220 | 7.50%, 05/01/2020 ■ | 1,296 | ||||||
| 715 | 8.38%, 02/15/2019 ■ | 781 | ||||||
| ING US, Inc. | ||||||||
| 1,300 | 5.65%, 05/15/2053 ■ | 1,222 | ||||||
| Ladder Capital Finance Holdings LLC | ||||||||
| 2,430 | 7.38%, 10/01/2017 ■ | 2,479 | ||||||
| Lloyds Banking Group plc | ||||||||
| 6,180 | 7.88%, 11/01/2020 ■ | 6,378 | ||||||
| National Money Mart Co. | ||||||||
| 2,825 | 10.38%, 12/15/2016 | 2,994 | ||||||
| Nationstar Mortgage LLC | ||||||||
| 3,115 | 6.50%, 07/01/2021 | 2,990 | ||||||
| Nuveen Investments, Inc. | ||||||||
| 4,245 | 9.13%, 10/15/2017 ■ | 4,256 | ||||||
| 2,446 | 9.50%, 10/15/2020 ■ | 2,434 | ||||||
| Provident Funding Associates L.P. | ||||||||
| 585 | 6.75%, 06/15/2021 ■ | 584 | ||||||
| Royal Bank of Scotland plc | ||||||||
| 5,075 | 6.13%, 12/15/2022 | 4,829 | ||||||
| SLM Corp. | ||||||||
| 1,440 | 6.25%, 01/25/2016 | 1,526 | ||||||
| 1,960 | 7.25%, 01/25/2022 | 2,058 | ||||||
| 2,335 | 8.45%, 06/15/2018 | 2,592 | ||||||
| Softbank Corp. | ||||||||
| 2,825 | 4.50%, 04/15/2020 ■ | 2,723 | ||||||
| TitleMax, Inc. | ||||||||
| 5,155 | 13.25%, 07/15/2015 | 5,529 | ||||||
| UBS AG Stamford CT | ||||||||
| 1,665 | 7.63%, 08/17/2022 | 1,827 | ||||||
| 64,867 | ||||||||
| Food Manufacturing - 0.5% | ||||||||
| Pinnacle Foods Finance LLC | ||||||||
| 2,930 | 4.88%, 05/01/2021 ■ | 2,798 | ||||||
| Health Care and Social Assistance - 7.3% | ||||||||
| Alere, Inc. | ||||||||
| 2,340 | 6.50%, 06/15/2020 ■ | 2,270 | ||||||
| Biomet, Inc. | ||||||||
| 2,710 | 6.50%, 08/01/2020 - 10/01/2020 | 2,750 | ||||||
| Community Health Systems, Inc. | ||||||||
| 1,681 | 5.13%, 08/15/2018 | 1,706 | ||||||
| 2,935 | 7.13%, 07/15/2020 | 3,023 | ||||||
| Exelixis, Inc. | ||||||||
| 1,265 | 4.25%, 08/15/2019 ۞ | 1,224 | ||||||
| Fresenius Medical Care US Finance II, Inc. | ||||||||
| 2,875 | 5.88%, 01/31/2022 ■ | 3,026 | ||||||
| HCA Holdings, Inc. | ||||||||
| 1,835 | 6.25%, 02/15/2021 | 1,872 | ||||||
| HCA, Inc. | ||||||||
| 4,260 | 7.25%, 09/15/2020 | 4,574 | ||||||
| 8,474 | 7.50%, 11/15/2095 | 7,881 | ||||||
| 2,531 | 8.50%, 04/15/2019 | 2,716 | ||||||
| Health Management Associates, Inc. | ||||||||
| 2,070 | 7.38%, 01/15/2020 | 2,269 | ||||||
| Hologic, Inc. | ||||||||
| 3,250 | 2.00%, 03/01/2042 ۞ | 3,215 | ||||||
| 455 | 6.25%, 08/01/2020 | 472 | ||||||
| Radiation Therapy Services, Inc. | ||||||||
| 3,665 | 9.88%, 04/15/2017 | 2,236 | ||||||
| Savient Pharmaceuticals, Inc. | ||||||||
| 3,885 | 4.75%, 02/01/2018 ۞ | 777 | ||||||
| VPII Escrow Corp | ||||||||
| 1,230 | 6.75%, 08/15/2018 ■☼ | 1,261 | ||||||
| 41,272 | ||||||||
| Information - 16.7% | ||||||||
| Altice Financing S.A. | ||||||||
| 1,500 | 7.88%, 12/15/2019 ■ | 1,568 | ||||||
| 1,080 | 9.88%, 12/15/2020 ■ | 1,156 | ||||||
| Audatex North America, Inc. | ||||||||
| 3,150 | 6.75%, 06/15/2018 | 3,308 | ||||||
| DISH DBS Corp. | ||||||||
| 2,170 | 5.00%, 03/15/2023 | 2,089 | ||||||
| 3,725 | 5.88%, 07/15/2022 | 3,781 | ||||||
| 945 | 6.75%, 06/01/2021 | 1,004 | ||||||
| 4,886 | 7.88%, 09/01/2019 | 5,472 | ||||||
| First Data Corp. | �� | |||||||
| 1,800 | 6.75%, 11/01/2020 ■ | 1,832 | ||||||
| 5,425 | 7.38%, 06/15/2019 ■ | 5,574 | ||||||
| 2,295 | 8.25%, 01/15/2021 ■ | 2,341 | ||||||
| Harron Communications L.P. | ||||||||
| 2,580 | 9.13%, 04/01/2020 ■ | 2,786 | ||||||
| Intelsat Jackson Holdings S.A. | ||||||||
| 2,330 | 6.63%, 12/15/2022 ■ | 2,260 | ||||||
| 3,145 | 8.50%, 11/01/2019 | 3,389 | ||||||
The accompanying notes are an integral part of these financial statements.
| 6 |
| Shares or Principal Amount ╬ | Market Value ╪ | |||||||
CORPORATE BONDS - 90.8% - (continued) | ||||||||
| Information - 16.7% - (continued) | ||||||||
| Intelsat Luxembourg S.A. | ||||||||
| $ | 695 | 6.75%, 06/01/2018 ■ | $ | 700 | ||||
| 6,550 | 7.75%, 06/01/2021 ■ | 6,615 | ||||||
| InterActiveCorp | ||||||||
| 290 | 4.75%, 12/15/2022 ■ | 274 | ||||||
| Lawson Software | ||||||||
| 1,890 | 9.38%, 04/01/2019 | 2,048 | ||||||
| Level 3 Financing, Inc. | ||||||||
| 4,226 | 10.00%, 02/01/2018 | 4,554 | ||||||
| MetroPCS Wireless, Inc. | ||||||||
| 1,425 | 6.63%, 11/15/2020 | 1,478 | ||||||
| 4,710 | 7.88%, 09/01/2018 | 5,016 | ||||||
| Nara Cable Funding Ltd. | ||||||||
| 3,615 | 8.88%, 12/01/2018 ■ | 3,760 | ||||||
| NII Capital Corp. | ||||||||
| 1,930 | 7.63%, 04/01/2021 | 1,501 | ||||||
| NII International Telecom S.a.r.l. | ||||||||
| 1,935 | 7.88%, 08/15/2019 ■ | 1,833 | ||||||
| 670 | 11.38%, 08/15/2019 ■ | 717 | ||||||
| Paetec Holding Corp. | ||||||||
| 2,127 | 9.88%, 12/01/2018 | 2,350 | ||||||
| Sprint Nextel Corp. | ||||||||
| 507 | 7.00%, 03/01/2020 ■ | 548 | ||||||
| 3,092 | 9.00%, 11/15/2018 ■ | 3,618 | ||||||
| Syniverse Holdings, Inc. | ||||||||
| 3,470 | 9.13%, 01/15/2019 | 3,704 | ||||||
| Unitymedia Hessen GmbH & Co. | ||||||||
| 2,555 | 5.50%, 01/15/2023 ■ | 2,414 | ||||||
| 1,496 | 7.50%, 03/15/2019 ■ | 1,575 | ||||||
| UPCB Finance III Ltd. | ||||||||
| 2,868 | 6.63%, 07/01/2020 ■ | 2,968 | ||||||
| UPCB Finance VI Ltd. | ||||||||
| 1,845 | 6.88%, 01/15/2022 ■ | 1,910 | ||||||
| Videotron Ltee | ||||||||
| 2,430 | 9.13%, 04/15/2018 | 2,548 | ||||||
| Wind Acquisition Finance S.A. | ||||||||
| 1,145 | 6.50%, 04/30/2020 ■ | 1,136 | ||||||
| 1,915 | 7.25%, 02/15/2018 ■ | 1,910 | ||||||
| Windstream Corp. | ||||||||
| 1,025 | 6.38%, 08/01/2023 | 958 | ||||||
| 3,400 | 7.50%, 04/01/2023 | 3,451 | ||||||
| 94,146 | ||||||||
| Machinery Manufacturing - 1.4% | ||||||||
| Case New Holland, Inc. | ||||||||
| 6,921 | 7.88%, 12/01/2017 ╦‡ | 7,838 | ||||||
| Mining - 2.5% | ||||||||
| American Rock Salt Co. LLC | ||||||||
| 1,171 | 8.25%, 05/01/2018 ■ | 1,113 | ||||||
| FMG Resources Pty Ltd. | ||||||||
| 320 | 6.00%, 04/01/2017 ■ | 311 | ||||||
| 6,887 | 7.00%, 11/01/2015 ■ | 6,956 | ||||||
| Peabody Energy Corp. | ||||||||
| 4,020 | 6.00%, 11/15/2018 | 4,030 | ||||||
| 1,572 | 6.50%, 09/15/2020 | 1,576 | ||||||
| 13,986 | ||||||||
| Miscellaneous Manufacturing - 2.0% | ||||||||
| BE Aerospace, Inc. | ||||||||
| 2,541 | 5.25%, 04/01/2022 | 2,528 | ||||||
| DigitalGlobe, Inc. | ||||||||
| 2,945 | 5.25%, 02/01/2021 ■ | 2,827 | ||||||
| TransDigm Group, Inc. | ||||||||
| 551 | 5.50%, 10/15/2020 ■ | 521 | ||||||
| 5,140 | 7.75%, 12/15/2018 | 5,410 | ||||||
| 11,286 | ||||||||
| Nonmetallic Mineral Product Manufacturing - 0.8% | ||||||||
| Ardagh Packaging Finance plc | ||||||||
| 510 | 4.88%, 11/15/2020 ■ | 477 | ||||||
| 1,575 | 7.00%, 11/15/2020 ■ | 1,518 | ||||||
| 480 | 7.38%, 10/15/2017 ■ | 512 | ||||||
| 511 | 9.13%, 10/15/2020 ■ | 545 | ||||||
| Cemex S.A.B. de C.V. | ||||||||
| 1,200 | 3.75%, 03/15/2018 | 1,478 | ||||||
| 4,530 | ||||||||
| Other Services - 1.1% | ||||||||
| Service Corp. International | ||||||||
| 520 | 5.38%, 01/15/2022 ■☼ | 519 | ||||||
| 5,075 | 7.63%, 10/01/2018 | 5,785 | ||||||
| 6,304 | ||||||||
| Paper Manufacturing - 0.1% | ||||||||
| Clearwater Paper Corp. | ||||||||
| 605 | 4.50%, 02/01/2023 ■ | 575 | ||||||
| Petroleum and Coal Products Manufacturing - 7.4% | ||||||||
| Antero Resources Finance Corp. | ||||||||
| 2,700 | 6.00%, 12/01/2020 | 2,660 | ||||||
| 3,605 | 7.25%, 08/01/2019 | 3,758 | ||||||
| Chesapeake Energy Corp. | ||||||||
| 3,982 | 2.50%, 05/15/2037 ۞ | 3,751 | ||||||
| Cobalt International Energy, Inc. | ||||||||
| 1,115 | 2.63%, 12/01/2019 ۞ | 1,183 | ||||||
| Continental Resources, Inc. | ||||||||
| 2,655 | 5.00%, 09/15/2022 | 2,701 | ||||||
| Denbury Resources, Inc. | ||||||||
| 2,550 | 4.63%, 07/15/2023 | 2,352 | ||||||
| Endeavour International Corp. | ||||||||
| 3,163 | 12.00%, 03/01/2018 | 3,037 | ||||||
| EPE Holding/EP Energy Bond | ||||||||
| 1,444 | 8.88%, 12/15/2017 ■Þ | 1,473 | ||||||
| Everest Acquisition LLC | ||||||||
| 570 | 6.88%, 05/01/2019 | 610 | ||||||
| 5,467 | 9.38%, 05/01/2020 | 6,178 | ||||||
| Ferrellgas Partners L.P. | ||||||||
| 891 | 6.50%, 05/01/2021 | 893 | ||||||
| Harvest Operations Corp. | ||||||||
| 1,315 | 6.88%, 10/01/2017 | 1,466 | ||||||
| MEG Energy Corp. | ||||||||
| 1,716 | 6.38%, 01/30/2023 ■ | 1,665 | ||||||
| Newfield Exploration Co. | ||||||||
| 2,176 | 5.75%, 01/30/2022 | 2,154 | ||||||
| Rosetta Resources, Inc. | ||||||||
| 1,875 | 5.63%, 05/01/2021 | 1,830 | ||||||
| 3,468 | 9.50%, 04/15/2018 | 3,745 | ||||||
| Seadrill Ltd. | ||||||||
| 2,585 | 5.63%, 09/15/2017 ■ | 2,546 | ||||||
| 42,002 | ||||||||
The accompanying notes are an integral part of these financial statements.
| 7 |
| Hartford High Yield HLS Fund |
| Schedule of Investments – (continued) |
| June 30, 2013 (Unaudited) |
| (000’s Omitted) |
| Shares or Principal Amount ╬ | Market Value ╪ | |||||||
CORPORATE BONDS - 90.8% - (continued) | ||||||||
| Pipeline Transportation - 1.8% | ||||||||
| El Paso Corp. | ||||||||
| $ | 955 | 7.75%, 01/15/2032 | $ | 1,015 | ||||
| 3,260 | 7.80%, 08/01/2031 | 3,443 | ||||||
| Energy Transfer Equity L.P. | ||||||||
| 2,588 | 7.50%, 10/15/2020 | 2,827 | ||||||
| Kinder Morgan Finance Co. | ||||||||
| 2,850 | 6.00%, 01/15/2018 ■ | 2,992 | ||||||
| 10,277 | ||||||||
| Plastics and Rubber Products Manufacturing - 1.3% | ||||||||
| Associated Materials LLC | ||||||||
| 120 | 9.13%, 11/01/2017 | 126 | ||||||
| 885 | 9.13%, 11/01/2017 ■ | 929 | ||||||
| Continental Rubber of America Corp. | ||||||||
| 3,180 | 4.50%, 09/15/2019 ■ | 3,274 | ||||||
| Nortek, Inc. | ||||||||
| 1,650 | 8.50%, 04/15/2021 | 1,766 | ||||||
| 1,135 | 8.50%, 04/15/2021 ■ | 1,203 | ||||||
| 7,298 | ||||||||
| Primary Metal Manufacturing - 0.5% | ||||||||
| Novelis, Inc. | ||||||||
| 2,513 | 8.75%, 12/15/2020 | 2,695 | ||||||
| Professional, Scientific and Technical Services - 1.3% | ||||||||
| Lamar Media Corp. | ||||||||
| 1,465 | 7.88%, 04/15/2018 | 1,560 | ||||||
| SunGard Data Systems, Inc. | ||||||||
| 490 | 6.63%, 11/01/2019 ■ | 493 | ||||||
| 3,685 | 7.38%, 11/15/2018 | 3,888 | ||||||
| 1,520 | 7.63%, 11/15/2020 | 1,611 | ||||||
| 7,552 | ||||||||
| Real Estate, Rental and Leasing - 4.2% | ||||||||
| Air Lease Corp. | ||||||||
| 4,215 | 6.13%, 04/01/2017 | 4,363 | ||||||
| CBRE Services, Inc. | ||||||||
| 2,940 | 5.00%, 03/15/2023 | 2,786 | ||||||
| Hertz Global Holdings, Inc. | ||||||||
| 1,075 | 5.88%, 10/15/2020 | 1,107 | ||||||
| 695 | 6.25%, 10/15/2022 | 725 | ||||||
| International Lease Finance Corp. | ||||||||
| 10,126 | 5.88%, 04/01/2019 - 08/15/2022 | 10,215 | ||||||
| 1,720 | 6.25%, 05/15/2019 | 1,767 | ||||||
| 2,535 | 8.88%, 09/01/2017 | 2,858 | ||||||
| 23,821 | ||||||||
| Retail Trade - 5.6% | ||||||||
| 99 Cents Only Stores | ||||||||
| 3,545 | 11.00%, 12/15/2019 | 4,006 | ||||||
| American Builders & Contractors Supply Co., Inc. | ||||||||
| 580 | 5.63%, 04/15/2021 ■ | 570 | ||||||
| AmeriGas Partners L.P. | ||||||||
| 3,336 | 6.25%, 08/20/2019 | 3,353 | ||||||
| ARAMARK Corp. | ||||||||
| 3,825 | 5.75%, 03/15/2020 ■ | 3,911 | ||||||
| Building Materials Corp. | ||||||||
| 2,948 | 7.50%, 03/15/2020 ■ | 3,154 | ||||||
| GRD Holding III Corp. | ||||||||
| 3,095 | 10.75%, 06/01/2019 ■ | 3,312 | ||||||
| J. C. Penney Co., Inc. | ||||||||
| 1,170 | 5.65%, 06/01/2020 | 977 | ||||||
| 1,065 | 6.38%, 10/15/2036 | 831 | ||||||
| 2,035 | 7.40%, 04/01/2037 | 1,654 | ||||||
| 210 | 7.95%, 04/01/2017 | 202 | ||||||
| Michaels Stores, Inc. | ||||||||
| 5,245 | 7.75%, 11/01/2018 | 5,612 | ||||||
| PC Merger Sub, Inc. | ||||||||
| 1,080 | 8.88%, 08/01/2020 ■ | 1,158 | ||||||
| Sally Holdings LLC | ||||||||
| 1,425 | 5.75%, 06/01/2022 | 1,446 | ||||||
| 1,395 | 6.88%, 11/15/2019 | 1,496 | ||||||
| 31,682 | ||||||||
| Transportation Equipment Manufacturing - 0.3% | ||||||||
| Huntington Ingalls Industries, Inc. | ||||||||
| 1,785 | 7.13%, 03/15/2021 | 1,919 | ||||||
| Utilities - 2.4% | ||||||||
| AES (The) Corp. | ||||||||
| 3,230 | 8.00%, 10/15/2017 | 3,634 | ||||||
| 2,409 | 9.75%, 04/15/2016 | 2,776 | ||||||
| Calpine Corp. | ||||||||
| 2,353 | 7.88%, 01/15/2023 ■ | 2,529 | ||||||
| Dolphin Subsidiary II, Inc. | ||||||||
| 2,615 | 7.25%, 10/15/2021 | 2,707 | ||||||
| Texas Competitive Electric Co. | ||||||||
| 2,765 | 11.50%, 10/01/2020 ■ | 2,067 | ||||||
| 13,713 | ||||||||
| Wholesale Trade - 0.8% | ||||||||
| J.M. Huber Corp. | ||||||||
| 3,415 | 9.88%, 11/01/2019 ■ | 3,825 | ||||||
| SIWF Merger Sub, Inc. / Springs Industries, Inc. | ||||||||
| 580 | 6.25%, 06/01/2021 ■ | 568 | ||||||
| 4,393 | ||||||||
| Wood Product Manufacturing - 0.2% | ||||||||
| Boise Cascade Co. | ||||||||
| 920 | 6.38%, 11/01/2020 | 932 | ||||||
| Total corporate bonds | ||||||||
| (cost $505,348) | $ | 512,926 | ||||||
SENIOR FLOATING RATE INTERESTS ♦ - 4.2% | ||||||||
| Finance and Insurance - 1.0% | ||||||||
| Asurion LLC | ||||||||
| $ | 2,344 | 4.50%, 05/24/2019 | $ | 2,320 | ||||
| Macquarie Aircraft Leasing Finance S.A., Second Lien Term Loan | ||||||||
| 3,391 | 4.19%, 11/29/2013 | 3,306 | ||||||
| 5,626 | ||||||||
| Health Care and Social Assistance - 0.1% | ||||||||
| Hologic, Inc. | ||||||||
| 903 | 4.50%, 08/01/2019 | 905 | ||||||
| Information - 0.3% | ||||||||
| Alcatel-Lucent | ||||||||
| 1,085 | 6.25%, 08/01/2016 | 1,093 | ||||||
| 478 | 7.25%, 01/30/2019 | 482 | ||||||
| 1,575 | ||||||||
The accompanying notes are an integral part of these financial statements.
| 8 |
| Shares or Principal Amount ╬ | Market Value ╪ | ||||||||||
| SENIOR FLOATING RATE INTERESTS ♦ - 4.2% - (continued) | |||||||||||
| Mining - 0.7% | |||||||||||
| Arch Coal, Inc. | |||||||||||
| $ | 3,797 | 5.75%, 05/16/2018 | $ | 3,776 | |||||||
| Retail Trade - 1.2% | |||||||||||
| EB Sports Corp. | |||||||||||
| 5,436 | 11.50%, 12/31/2015 Þ | 5,382 | |||||||||
| J. C. Penney Co., Inc. | |||||||||||
| 1,450 | 6.00%, 05/22/2018 | 1,451 | |||||||||
| 6,833 | |||||||||||
| Utilities - 0.9% | |||||||||||
| Texas Competitive Electric Holdings Co. LLC | |||||||||||
| 7,000 | 4.72%, 10/10/2017 | 4,877 | |||||||||
| Total senior floating rate interests | |||||||||||
| (cost $23,277) | $ | 23,592 | |||||||||
| COMMON STOCKS - 0.2% | |||||||||||
| Energy - 0.2% | |||||||||||
| 206,275 | KCA Deutag ⌂●† | $ | 1,045 | ||||||||
| Software and Services - 0.0% | |||||||||||
| 38 | Stratus Technologies, Inc. ⌂●† | 116 | |||||||||
| Total common stocks | |||||||||||
| (cost $2,795) | $ | 1,161 | |||||||||
| PREFERRED STOCKS - 1.9% | |||||||||||
| Diversified Financials - 1.6% | |||||||||||
| 120 | Citigroup Capital XIII | $ | 3,341 | ||||||||
| 221 | GMAC Capital Trust I ۞ | 5,749 | |||||||||
| 9,090 | |||||||||||
| Software and Services - 0.0% | |||||||||||
| 9 | Stratus Technologies, Inc. ⌂† | 155 | |||||||||
| Telecommunication Services - 0.3% | |||||||||||
| 25 | Intelsat S.A., 5.75% ۞ | 1,350 | |||||||||
| Total preferred stocks | |||||||||||
| (cost $9,592) | $ | 10,595 | |||||||||
| Total long-term investments | |||||||||||
| (cost $543,491) | $ | 548,274 | |||||||||
| SHORT-TERM INVESTMENTS - 1.8% | |||||||||||
| Repurchase Agreements - 1.8% | |||||||||||
| Bank of America Merrill Lynch TriParty Repurchase Agreement (maturing on 07/01/2013 in the amount of $38, collateralized by GNMA 3.00%, 2042, value of $38) | |||||||||||
| $ | 38 | 0.13%, 6/28/2013 | $ | 38 | |||||||
| Bank of Montreal TriParty Repurchase Agreement (maturing on 07/01/2013 in the amount of $800, collateralized by FHLMC 4.00% - 5.00%, 2023 - 2025, FNMA 2.00% - 5.00%, 2022 - 2042, GNMA 2.00% - 5.00%, 2041 - 2043, value of $814) | |||||||||||
| 800 | 0.15%, 6/28/2013 | 800 | |||||||||
| Bank of Montreal TriParty Repurchase Agreement (maturing on 07/01/2013 in the amount of $1,555, collateralized by FHLB 0.38%, 2015, FHLMC 0.38%, 2014, FNMA 0.50% - 5.50%, 2015 - 2042, value of $1,582) | |||||||||||
| 1,555 | 0.12%, 6/28/2013 | 1,555 | |||||||||
| Barclays Capital TriParty Repurchase Agreement (maturing on 07/01/2013 in the amount of $1,077, collateralized by U.S. Treasury Note 3.13%, 2021, value of $1,095) | |||||||||||
| 1,077 | 0.10%, 6/28/2013 | 1,077 | |||||||||
| Citigroup Global Markets, Inc. TriParty Repurchase Agreement (maturing on 07/01/2013 in the amount of $3,175, collateralized by U.S. Treasury Bill 0.85%, 2013, U.S. Treasury Note 0.63% - 3.25%, 2013 - 2018, value of $3,223) | |||||||||||
| 3,175 | 0.10%, 6/28/2013 | 3,175 | |||||||||
| Deutsche Bank Securities TriParty Repurchase Agreement (maturing on 07/01/2013 in the amount of $38, collateralized by FNMA 4.50%, 2035, value of $38) | |||||||||||
| 38 | 0.25%, 6/28/2013 | 38 | |||||||||
| RBS Securities, Inc. TriParty Repurchase Agreement (maturing on 07/01/2013 in the amount of $1,273, collateralized by U.S. Treasury Note 1.00% - 2.63%, 2014 - 2020, value of $1,299) | |||||||||||
| 1,273 | 0.10%, 6/28/2013 | 1,273 | |||||||||
| TD Securities TriParty Repurchase Agreement (maturing on 07/01/2013 in the amount of $2,246, collateralized by FHLMC 3.50% - 4.00%, 2042, FNMA 3.50% - 4.50%, 2041 - 2042, value of $2,284) | |||||||||||
| 2,246 | 0.12%, 6/28/2013 | 2,246 | |||||||||
| UBS Securities, Inc. Repurchase Agreement (maturing on 07/01/2013 in the amount of $32, collateralized by U.S. Treasury Note 0.63%, 2014, value of $33) | |||||||||||
| 32 | 0.09%, 6/28/2013 | 32 | |||||||||
| 10,234 | |||||||||||
| Total short-term investments | |||||||||||
| (cost $10,234) | $ | 10,234 | |||||||||
| Total investments | |||||||||||
| (cost $553,725) ▲ | 98.9 | % | $ | 558,508 | |||||||
| Other assets and liabilities | 1.1 | % | 6,302 | ||||||||
| Total net assets | 100.0 | % | $ | 564,810 | |||||||
The accompanying notes are an integral part of these financial statements.
| 9 |
| Hartford High Yield HLS Fund |
| Schedule of Investments – (continued) |
| June 30, 2013 (Unaudited) |
| (000’s Omitted) |
| Note: | Percentage of investments as shown is the ratio of the total market value to total net assets. |
| ▲ | At June 30, 2013, the cost of securities for federal income tax purposes was $554,214 and the aggregate gross unrealized appreciation and depreciation based on that cost were: |
| Unrealized Appreciation | $ | 16,619 | ||
| Unrealized Depreciation | (12,325 | ) | ||
| Net Unrealized Appreciation | $ | 4,294 |
| † | These securities are valued in good faith at fair value as determined under policies and procedures established by and under the supervision of the Company's Board of Directors. At June 30, 2013, the aggregate value of these securities was $1,316, which represents 0.2% of total net assets. |
| ● | Non-income producing. For long-term debt securities, items identified are in default as to payment of interest and/or principal. |
| ♦ | Senior floating rate interests generally pay interest rates which are periodically adjusted by reference to a base short-term, floating lending rate plus a premium. These base lending rates are generally (i) the lending rate offered by one or more major European banks, such as the LIBOR, (ii) the prime rate offered by one or more major United States Banks, or (iii) the bank's certificate of deposit rate. Senior floating rate interests often require prepayments from excess cash flows or permit the borrower to repay at its election. The rate at which the borrower repays cannot be predicted with accuracy. As a result, the actual remaining maturity may be substantially less than the stated maturities shown. Unless otherwise noted, the interest rate disclosed for these securities represents the average coupon as of June 30, 2013. |
| ■ | Securities issued within terms of a private placement memorandum, exempt from registration under Rule 144A under the Securities Act of 1933, as amended, and may be sold only to qualified institutional buyers. Unless otherwise indicated, these holdings are determined to be liquid. At June 30, 2013, the aggregate value of these securities was $168,145, which represents 29.8% of total net assets. |
| ⌂ | The following securities are considered illiquid. Illiquid securities are often purchased in private placement transactions, are often not registered under the Securities Act of 1933 and may have contractual restrictions on resale. A security may also be considered illiquid if the security lacks a readily available market or if its valuation has not changed for a certain period of time. |
| Period Acquired | Shares/ Par | Security | Cost Basis | |||||||
| 03/2011 | 206,275 | KCA Deutag | $ | 2,796 | ||||||
| 03/2010 - 04/2010 | 38 | Stratus Technologies, Inc. | – | |||||||
| 03/2010 - 04/2010 | 9 | Stratus Technologies, Inc. Preferred | – | |||||||
At June 30, 2013, the aggregate value of these securities was $1,316, which represents 0.2% of total net assets.
| ۞ | Convertible security. |
| ╬ | All principal or contract amounts are in U.S. dollars unless otherwise indicated. |
| ☼ | This security, or a portion of this security, was purchased on a when-issued, delayed-delivery or delayed-draw basis. The cost of these securities was $1,754 at June 30, 2013. |
| ‡ | This security, or a portion of this security, has been segregated to cover funding requirements on investment transactions settling in the future. |
| ╦ | This security, or a portion of this security, has been pledged as collateral in connection with swap contracts. Securities valued at $34, held on behalf of the Fund at the custody bank, were received from broker(s) as collateral in connection with swap contracts. |
| Þ | This security may pay interest in additional principal instead of cash. |
| Foreign Currency Contracts Outstanding at June 30, 2013 | ||||||||||||||||||
| Currency | Buy / Sell | Delivery Date | Counterparty | Contract Amount | Market Value ╪ | Unrealized Appreciation/ (Depreciation) | ||||||||||||
| CAD | Sell | 07/22/2013 | CSFB | $ | 1,336 | $ | 1,293 | $ | 43 | |||||||||
The accompanying notes are an integral part of these financial statements.
| 10 |
Credit Default Swap Contracts Outstanding at June 30, 2013
| Reference Entity | Counterparty | Notional Amount (a) | (Pay)/Receive Fixed Rate / Implied Credit Spread (b) | Expiration Date | Upfront Premiums Paid/ (Received) | Market Value ╪ | Unrealized Appreciation/ (Depreciation) | |||||||||||||||
| Credit default swaps on single-name issues: | ||||||||||||||||||||||
| Buy protection: | ||||||||||||||||||||||
| Time Warner Cable, Inc. | BCLY | $ | 2,245 | (1.00)% / 1.90% | 06/20/18 | $ | (11 | ) | $ | 95 | $ | 106 | ||||||||||
| Time Warner Cable, Inc. | GSC | 1,780 | (1.00)% / 1.90% | 06/20/18 | (10 | ) | 75 | 85 | ||||||||||||||
| Time Warner Cable, Inc. | JPM | 2,315 | (1.00)% / 1.90% | 06/20/18 | (11 | ) | 98 | 109 | ||||||||||||||
| Total | $ | (32 | ) | $ | 268 | $ | 300 | |||||||||||||||
| (a) | The maximum potential amount the Fund could be required to pay as a seller of credit protection or receive as a buyer of credit protection if a credit event occurs as defined under the terms of that particular swap agreement. Notional shown in U.S. dollars unless otherwise noted. |
| (b) | Implied credit spreads, represented in absolute terms, utilized in determining the market value of credit default swap agreements on corporate issues, U.S. municipal issues or sovereign government issues as of period end serve as an indicator of the current status of the payment/performance risk and represent the likelihood of risk of default for the credit derivative. The implied credit spread of a particular entity reflects the cost of buying/selling protection and may include upfront payments required to be made to enter into the agreement. Wider credit spreads represent a deterioration of the reference entity's credit soundness and a greater likelihood or risk of default or other credit event occurring as defined under the terms of the agreement. The percentage shown is the implied credit spread on June 30, 2013. For credit default swap agreements on indices, the quoted market prices and resulting values serve as the indicator of the current status of the payment/performance risk. |
| ╪ | See Significant Accounting Policies of accompanying Notes to Financial Statements regarding valuation of securities. |
| GLOSSARY: (abbreviations used in preceding Schedule of Investments) | ||
| Counterparty Abbreviations: | ||
| BCLY | Barclays | |
| CSFB | Credit Suisse First Boston Corp. | |
| GSC | Goldman Sachs & Co. | |
| JPM | JP Morgan Chase & Co. | |
| Currency Abbreviations: | ||
| CAD | Canadian Dollar | |
| Other Abbreviations: | ||
| FHLB | Federal Home Loan Bank | |
| FHLMC | Federal Home Loan Mortgage Corp. | |
| FNMA | Federal National Mortgage Association | |
| GNMA | Government National Mortgage Association | |
| LIBOR | London Interbank Offered Rate | |
The accompanying notes are an integral part of these financial statements.
| 11 |
| Hartford High Yield HLS Fund |
| Investment Valuation Hierarchy Level Summary |
| June 30, 2013 (Unaudited) |
| (000’s Omitted) |
| Total | Level 1 ♦ | Level 2 ♦ | Level 3 | |||||||||||||
| Assets: | ||||||||||||||||
| Asset & Commercial Mortgage Backed Securities | $ | – | $ | – | $ | – | $ | – | ||||||||
| Common Stocks ‡ | 1,161 | – | – | 1,161 | ||||||||||||
| Corporate Bonds | 512,926 | – | 512,926 | – | ||||||||||||
| Preferred Stocks | 10,595 | 10,440 | – | 155 | ||||||||||||
| Senior Floating Rate Interests | 23,592 | – | 23,592 | – | ||||||||||||
| Short-Term Investments | 10,234 | – | 10,234 | – | ||||||||||||
| Total | $ | 558,508 | $ | 10,440 | $ | 546,752 | $ | 1,316 | ||||||||
| Credit Default Swaps * | 300 | – | 300 | – | ||||||||||||
| Foreign Currency Contracts * | 43 | – | 43 | – | ||||||||||||
| Total | $ | 343 | $ | – | $ | 343 | $ | – | ||||||||
| ♦ | For the six-month period ended June 30, 2013, there were no transfers between Level 1 and Level 2. |
| ‡ | The Fund has all or primarily all of the equity securities categorized in a particular level. Refer to the Schedule of Investments for further industry breakout. |
| * | Derivative instruments not reflected in the Schedule of Investments are valued at the unrealized appreciation/depreciation on the investments. |
Following is a reconciliation of Level 3 assets for which significant unobservable inputs were used to determine fair value:
| Balance as of December 31, 2012 | Realized Gain (Loss) | Change in Unrealized Appreciation (Depreciation) | Net Amortization | Purchases | Sales | Transfers Into Level 3 | Transfers Out of Level 3 | Balance as of June 30, 2013 | ||||||||||||||||||||||||||||
| Assets: | ||||||||||||||||||||||||||||||||||||
| Asset & Commercial Mortgage Backed Securities | $ | — | $ | — | $ — | * | $ | — | $ | — | $ | — | $ | — | $ | — | $ | — | ||||||||||||||||||
| Common Stocks | 1,073 | — | 88 | † | — | — | — | — | — | 1,161 | ||||||||||||||||||||||||||
| Preferred Stocks | 149 | — | 6 | ‡ | — | — | — | — | — | 155 | ||||||||||||||||||||||||||
| Total | $ | 1,222 | $ | — | $ | 94 | $ | — | $ | — | $ | — | $ | — | $ | — | $ | 1,316 | ||||||||||||||||||
| * | Change in unrealized appreciation (depreciation) in the current period relating to assets still held at June 30, 2013 was zero. |
| † | Change in unrealized appreciation (depreciation) in the current period relating to assets still held at June 30, 2013 was $88. |
| ‡ | Change in unrealized appreciation (depreciation) in the current period relating to assets still held at June 30, 2013 was $6. |
The accompanying notes are an integral part of these financial statements.
| 12 |
| Hartford High Yield HLS Fund |
| Statement of Assets and Liabilities |
| June 30, 2013 (Unaudited) |
| (000’s Omitted) |
| Assets: | ||||
| Investments in securities, at market value (cost $553,725) | $ | 558,508 | ||
| Cash | 213 | |||
| Unrealized appreciation on foreign currency contracts | 43 | |||
| Unrealized appreciation on swap contracts | 300 | |||
| Receivables: | ||||
| Dividends and interest | 8,785 | |||
| Total assets | 567,849 | |||
| Liabilities: | ||||
| Payables: | ||||
| Investment securities purchased | 1,754 | |||
| Fund shares redeemed | 1,100 | |||
| Investment management fees | 65 | |||
| Distribution fees | 6 | |||
| Accrued expenses | 82 | |||
| Swap premiums received | 32 | |||
| Total liabilities | 3,039 | |||
| Net assets | $ | 564,810 | ||
| Summary of Net Assets: | ||||
| Capital stock and paid-in-capital | $ | 520,944 | ||
| Undistributed net investment income | 62,668 | |||
| Accumulated net realized loss | (23,927 | ) | ||
| Unrealized appreciation of investments and the translations of assets and liabilities denominated in foreign currency | 5,125 | |||
| Net assets | $ | 564,810 | ||
| Shares authorized | 2,800,000 | |||
| Par value | $ | 0.001 | ||
| Class IA: Net asset value per share | $ | 9.18 | ||
| Shares outstanding | 46,907 | |||
| Net assets | $ | 430,441 | ||
| Class IB: Net asset value per share | $ | 9.04 | ||
| Shares outstanding | 14,870 | |||
| Net assets | $ | 134,369 |
The accompanying notes are an integral part of these financial statements.
| 13 |
| Hartford High Yield HLS Fund |
| Statement of Operations |
| For the Six Month Period Ended June 30, 2013 (Unaudited) |
| (000’s Omitted) |
| Investment Income: | ||||
| Dividends | $ | 323 | ||
| Interest | 20,932 | |||
| Total investment income, net | 21,255 | |||
| Expenses: | ||||
| Investment management fees | 2,181 | |||
| Transfer agent fees | 2 | |||
| Distribution fees - Class IB | 180 | |||
| Custodian fees | 6 | |||
| Accounting services fees | 63 | |||
| Board of Directors' fees | 9 | |||
| Audit fees | 7 | |||
| Other expenses | 93 | |||
| Total expenses (before fees paid indirectly) | 2,541 | |||
| Custodian fee offset | — | |||
| Total fees paid indirectly | — | |||
| Total expenses, net | 2,541 | |||
| Net Investment Income | 18,714 | |||
| Net Realized Gain on Investments, Other Financial Instruments and Foreign Currency Transactions: | ||||
| Net realized gain on investments | 9,065 | |||
| Net realized gain on swap contracts | 610 | |||
| Net realized gain on foreign currency contracts | 33 | |||
| Net realized gain on other foreign currency transactions | — | |||
| Net Realized Gain on Investments, Other Financial Instruments and Foreign Currency Transactions | 9,708 | |||
| Net Changes in Unrealized Depreciation of Investments, Other Financial Instruments and Foreign Currency Transactions: | ||||
| Net unrealized depreciation of investments | (21,197 | ) | ||
| Net unrealized appreciation of swap contracts | 214 | |||
| Net unrealized appreciation of foreign currency contracts | 35 | |||
| Net unrealized depreciation on translation of other assets and liabilities in foreign currencies | (1 | ) | ||
| Net Changes in Unrealized Depreciation of Investments, Other Financial Instruments and Foreign Currency Transactions | (20,949 | ) | ||
| Net Loss on Investments, Other Financial Instruments and Foreign Currency Transactions | (11,241 | ) | ||
| Net Increase in Net Assets Resulting from Operations | $ | 7,473 |
The accompanying notes are an integral part of these financial statements.
| 14 |
| Hartford High Yield HLS Fund |
| Statement of Changes in Net Assets |
| (000’s Omitted) |
| For the Six-Month Period Ended June 30, 2013 (Unaudited) | For the Year Ended December 31, 2012 | |||||||
| Operations: | ||||||||
| Net investment income | $ | 18,714 | $ | 43,715 | ||||
| Net realized gain on investments, other financial instruments and foreign currency transactions | 9,708 | 13,105 | ||||||
| Net unrealized appreciation (depreciation) of investments, other financial instruments and foreign currency transactions | (20,949 | ) | 33,552 | |||||
| Net Increase in Net Assets Resulting from Operations | 7,473 | 90,372 | ||||||
| Distributions to Shareholders: | ||||||||
| From net investment income | ||||||||
| Class IA | — | (44,027 | ) | |||||
| Class IB | — | (13,154 | ) | |||||
| Total distributions | — | (57,181 | ) | |||||
| Capital Share Transactions: | ||||||||
| Class IA | ||||||||
| Sold | 33,213 | 117,583 | ||||||
| Issued on reinvestment of distributions | — | 44,027 | ||||||
| Redeemed | �� | (112,789 | ) | (232,004 | ) | |||
| Total capital share transactions | (79,576 | ) | (70,394 | ) | ||||
| Class IB | ||||||||
| Sold | 13,700 | 28,736 | ||||||
| Issued on reinvestment of distributions | — | 13,154 | ||||||
| Redeemed | (29,879 | ) | (60,263 | ) | ||||
| Total capital share transactions | (16,179 | ) | (18,373 | ) | ||||
| Net decrease from capital share transactions | (95,755 | ) | (88,767 | ) | ||||
| Net Decrease in Net Assets | (88,282 | ) | (55,576 | ) | ||||
| Net Assets: | ||||||||
| Beginning of period | 653,092 | 708,668 | ||||||
| End of period | $ | 564,810 | $ | 653,092 | ||||
| Undistributed (distribution in excess of) net investment income | $ | 62,668 | $ | 43,954 | ||||
| Shares: | ||||||||
| Class IA | ||||||||
| Sold | 3,594 | 12,934 | ||||||
| Issued on reinvestment of distributions | — | 5,076 | ||||||
| Redeemed | (12,154 | ) | (25,580 | ) | ||||
| Total share activity | (8,560 | ) | (7,570 | ) | ||||
| Class IB | ||||||||
| Sold | 1,500 | 3,207 | ||||||
| Issued on reinvestment of distributions | — | 1,537 | ||||||
| Redeemed | (3,266 | ) | (6,746 | ) | ||||
| Total share activity | (1,766 | ) | (2,002 | ) | ||||
The accompanying notes are an integral part of these financial statements.
| 15 |
| Hartford High Yield HLS Fund |
| Notes to Financial Statements |
| June 30, 2013 (Unaudited) |
| (000’s Omitted) |
| 1. | Organization: |
Hartford High Yield HLS Fund (the “Fund”) serves as an underlying investment option for certain variable annuity and variable life insurance separate accounts of Hartford Life Insurance Company (“HLIC”) and its affiliates and certain qualified retirement plans. The Fund may also serve as an underlying investment option for certain variable annuity and variable life separate accounts of other insurance companies. Owners of variable annuity contracts and policyholders of variable life insurance contracts may choose the funds permitted in the variable insurance contract prospectus. In addition, participants in certain qualified retirement plans may choose the Fund if permitted by their plans.
Hartford Series Fund, Inc. (the “Company”) is an open-end registered management investment company comprised of thirty portfolios. Financial statements for the Fund, a series of the Company, are included in this report.
The Company is organized under the laws of the State of Maryland and is registered with the Securities and Exchange Commission (“SEC”) under the Investment Company Act of 1940, as amended (“1940 Act”). The Fund is a diversified open-end management investment company.
The Fund is divided into Class IA and Class IB shares. Each class is offered at the per share net asset value (“NAV”) without a sales charge and is subject to the same expenses, except that the Class IB shares are subject to distribution and service fees charged pursuant to a Distribution Plan adopted in accordance with Rule 12b-1 under the 1940 Act.
| 2. | Significant Accounting Policies: |
The following is a summary of significant accounting policies of the Fund in the preparation of its financial statements, which are in accordance with the United States Generally Accepted Accounting Principles (“U.S. GAAP”). The preparation of financial statements in accordance with U.S. GAAP may require management to make estimates and assumptions that affect the reported amounts of assets and liabilities and disclosure of contingent assets and liabilities at the date of the financial statements and the reported amounts of increases and decreases in net assets from operations during the reporting period. Actual results could differ from those estimates.
| a) | Determination of Net Asset Value – The NAV of each class of the Fund’s shares is determined as of the close of regular trading (normally 4:00 p.m. Eastern Time) (the “NYSE Close”) on each day that the New York Stock Exchange (the “Exchange”) is open (“Valuation Date”). Information that becomes known to the Fund after the NAV has been calculated on a particular day will not generally be used to retroactively adjust the NAV determined earlier that day. |
| b) | Investment Valuation and Fair Value Measurements – For purposes of calculating the NAV, portfolio investments and other assets held by the Fund's portfolio for which market quotes are readily available are valued at market value. Market value is generally determined on the basis of last reported sales prices or official close price. If no sales are reported, market value is based on quotes obtained from a quotation reporting system, established market makers, or independent pricing services. If market prices are not readily available or are deemed unreliable, the Fund will use the fair value of the investment as determined in good faith under policies and procedures established by and under the supervision of the Company’s Board of Directors. Market quotes are considered not readily available where there is an absence of current or reliable market-based data (e.g., trade information or indicative market quotes), including where events occur after the close of the relevant market, but prior to the NYSE Close that materially affect the values of the Fund’s portfolio investments or assets. In addition, market quotes are considered not readily available when, due to extraordinary circumstances, the exchanges or markets on which the investments trade do not open for trading for the entire day and no other market prices are available. In addition, prices of foreign equities that are principally traded on certain foreign markets may be adjusted daily pursuant to a fair value pricing service approved by the Board of Directors in order to reflect an adjustment for the factors occurring after the close of certain foreign markets but before the NYSE Close. Investments that are primarily traded on foreign markets may trade on days that are not business days of the Fund. The value of the foreign investments in which the Fund invests may change on days when a shareholder will not be able to |
| 16 |
purchase or redeem shares of the Fund. Fair value pricing is subjective in nature and the use of fair value pricing by the Fund may cause the NAV of its shares to differ significantly from the NAV that would have been calculated using market prices at the close of the exchange on which a portfolio investment is primarily traded. There can be no assurance that the Fund could obtain the fair market value assigned to an investment if the Fund were to sell the investment at approximately the time at which the Fund determines its NAV.
Fixed income investments (other than short term obligations) and non-exchange traded derivatives held by the Fund are normally valued on the basis of quotes obtained from brokers and dealers or independent pricing services in accordance with procedures established by the Company’s Board of Directors. Prices obtained from independent pricing services use information provided by market makers or estimates of market values through accepted market modeling and trading and pricing conventions. Inputs to the models may include, but are not limited to, prepayment speeds, pricing spread, yield, trade information, dealer quotes, market color, cash flow models and the bond’s terms and conditions. Generally, the Fund may use fair valuation in regard to fixed income investments when the Fund holds defaulted or distressed investments or investments in a company in which a reorganization is pending. Senior floating rate interests generally trade in over-the-counter (“OTC”) markets and are priced through an independent pricing service utilizing independent market quotations from loan dealers or financial institutions. A composite bid price is used, which averages the dealer marks and dealer runs. Short-term investments maturing in 60 days or less are generally valued at amortized cost, if their original term to maturity was 60 days or less, or by amortizing their value on the 61st day prior to maturity, if the original term to maturity exceeded 60 days.
Investments valued in currencies other than U.S. dollars are converted to U.S. dollars using exchange rates obtained from independent pricing services for calculation of the NAV. As a result, the NAV of the Fund’s shares may be affected by changes in the value of currencies in relation to the U.S. dollar. The value of investments traded in markets outside the United States or denominated in currencies other than the U.S. dollar may be affected significantly on a day that the NYSE is closed and the market value may change on days when an investor is not able to purchase, redeem or exchange shares of the Fund.
Foreign currency contracts represent agreements to exchange currencies on specific future dates at predetermined rates. Foreign currency contracts are valued using foreign currency exchange rates and forward rates as provided by an independent pricing service on the Valuation Date.
Investments in open-end mutual funds are valued at the respective NAV of each open-end mutual fund on the Valuation Date.
Financial instruments for which prices are not available from an independent pricing service may be valued using market quotations obtained from one or more dealers that make markets in the respective financial instrument in accordance with procedures established by the Company’s Board of Directors.
U.S. GAAP defines fair value as the price that the Fund would receive to sell an asset or pay to transfer a liability in an orderly transaction between market participants. The U.S. GAAP fair value measurement standards require disclosure of a fair value hierarchy for each major category of assets and liabilities. Various inputs are used in determining the fair value of the Fund’s investments. These inputs are summarized into three broad hierarchy levels. This hierarchy is based on whether the valuation inputs are observable or unobservable. These levels are:
| · | Level 1 – Quoted prices in active markets for identical investments. Level 1 may include exchange traded instruments, such as domestic equities, some foreign equities, options, futures, mutual funds, exchange traded funds, rights and warrants. |
| · | Level 2 – Observable inputs other than Level 1 prices, such as quoted prices for similar investments; quoted prices in markets that are not active; or other inputs that are observable or can be corroborated by observable market data. Level 2 may include debt investments that are traded less frequently than exchange traded |
| 17 |
| Hartford High Yield HLS Fund |
| Notes to Financial Statements – (continued) |
| June 30, 2013 (Unaudited) |
| (000’s Omitted) |
instruments and which are valued using independent pricing services; foreign equities, which are principally traded on certain foreign markets and are adjusted daily pursuant to a fair value pricing service in order to reflect an adjustment for the factors occurring after the close of certain foreign markets but before the NYSE Close; and short-term investments, which are valued at amortized cost.
| · | Level 3 – Significant unobservable inputs that are supported by limited or no market activity. Level 3 may include financial instruments whose values are determined using indicative market quotes or require significant management judgment or estimation. These unobservable valuation inputs may include estimates for current yields, maturity/duration, prepayment speed, and indicative market quotes for comparable investments along with other assumptions relating to credit quality, collateral value, complexity of the investment structure, general market conditions and liquidity. This category may include investments where trading has been halted or there are certain restrictions on trading. While these investments are priced using unobservable inputs, the valuation of these investments reflects the best available data and management believes the prices are a reasonable representation of exit price. |
The Board of Directors of the Company generally reviews and approves the “Procedures for Valuation of Portfolio Securities” on an annual basis. These procedures define how investments are to be valued, including the formation and activities of a Valuation Committee. The Valuation Committee is responsible for determining in good faith the fair value of investments when the value cannot be obtained from primary pricing services or alternative sources or if the valuation of an investment as provided by the primary pricing service or alternative source is believed not to reflect the investment’s fair value as of the Valuation Date. Members of the Valuation Committee include the Fund’s Treasurer or designee, a Vice President of the Fund with legal expertise or designee, and a Vice President of the investment manager or designee. In addition, the Fund’s Chief Compliance Officer shall designate a member of the compliance group to attend Valuation Committee meetings as a non-voting resource, to monitor for and provide guidance with respect to compliance with these procedures. Two members of the Valuation Committee or their designees, representing different departments, shall constitute a quorum for purposes of permitting the Valuation Committee to take action. The Valuation Committee will consider all relevant factors in determining an investment’s fair value, and may seek the advice of the Fund’s sub-adviser, knowledgeable brokers, and legal counsel in making such determination. The Valuation Committee reports to the Audit Committee of the Company’s Board of Directors. The Audit Committee receives quarterly written reports which include details of all fair-valued investments, including the reason for the fair valuation, and an indication, when possible, of the accuracy of the valuation by disclosing the next available reliable public price quotation or the disposition price of such investments (the “look-back” test). The Board of Directors then must consider for ratification all of the fair value determinations made during the previous quarter.
Valuation levels are not necessarily indicative of the risk associated with investing in such investments. Individual investments within any of the above mentioned asset classes may be assigned a different hierarchical level than those presented above, as individual circumstances dictate.
For additional information, refer to the Investment Valuation Hierarchy Level Summary and the Level 3 roll-forward reconciliation, if applicable, which follow the Schedule of Investments.
For purposes of reporting transfers between different hierarchy levels, both transfers in and out of each level, as applicable, are shown as if they occurred at the beginning of the period.
| c) | Investment Transactions and Investment Income – Investment transactions are recorded as of the trade date (the date the order to buy or sell is executed) for financial reporting purposes. Investments purchased or sold on a when-issued or delayed-delivery basis may be settled a month or more after the trade date. Realized gains and losses are determined on the basis of identified cost. |
| 18 |
Trade date for senior floating rate interests purchased in the primary loan market is considered the date on which the loan allocations are determined. Trade date for senior floating rate interests purchased in the secondary loan market is the date on which the transaction is entered into.
Dividend income from domestic securities is accrued on the ex-dividend date. In general, dividend income from foreign securities is recorded on the ex-date; however, dividend notifications in certain foreign jurisdictions may not be available in a timely manner and as a result, the Fund will record the dividend as soon as the relevant details (i.e., rate per share, payment date, shareholders of record, etc.) are publicly available. Interest income, including amortization of premium and accretion of discounts, is accrued on a daily basis. Paydown gains and losses on mortgage-related and other asset-backed securities are included in interest income in the Statement of Operations, as applicable.
| d) | Foreign Currency Transactions – Assets and liabilities denominated in currencies other than U.S. dollars are translated into U.S. dollars at the exchange rates in effect on the valuation date. Purchases and sales of investments, income, and expenses are translated into U.S. dollars at the exchange rates on the dates of such transactions. |
The Fund does not isolate that portion of portfolio investment valuation resulting from fluctuations in the foreign currency exchange rates from the fluctuations arising from changes in the market prices of investments held. Exchange rate fluctuations are included with the net realized and unrealized gain or loss on investments in the accompanying financial statements.
Net realized foreign exchange gains or losses arise from sales of foreign currencies and the difference between asset and liability amounts initially stated in foreign currencies and the U.S. dollar value of the amounts actually received or paid. Net unrealized foreign exchange gains or losses arise from changes in the value of other assets and liabilities at the end of the reporting period, resulting from changes in the exchange rates.
| e) | Joint Trading Account – The Fund may invest cash balances into a joint trading account that may be invested in one or more repurchase agreements. |
| f) | Fund Share Valuation and Dividend Distributions to Shareholders – Orders for the Fund’s shares are executed in accordance with the investment instructions of the contract holders and plan participants. The NAV of the Fund’s shares is determined as of the close of business on each business day of the Exchange. The NAV is determined separately for each class of shares of the Fund by dividing the Fund’s net assets attributable to that class by the number of shares of the class outstanding. Each class of shares offered by the Fund has equal rights as to assets and voting privileges (except that shareholders of a class have exclusive voting rights regarding any matter relating solely to that class of shares). Income and non-class specific expenses are allocated daily to each class on the basis of the relative net assets of the class. Realized and unrealized capital gains and losses are allocated daily based on the relative net assets of each class of shares of the Fund. |
Orders for the purchase of the Fund’s shares received prior to the close of the Exchange on any day the Exchange is open for business are priced at the NAV determined as of the close of the Exchange. Orders received after the close of the Exchange, or on a day on which the Exchange and/or the Fund is not open for business, are priced at the next determined NAV.
Dividends are declared pursuant to a policy adopted by the Company’s Board of Directors based upon the investment performance of the Fund. The policy of the Fund is to pay dividends from net investment income and realized capital gains, if any, at least once a year.
Distributions from net investment income, net realized capital gains and capital are determined in accordance with federal income tax regulations, which may differ from U.S. GAAP with respect to character and timing. These differences may include but are not limited to losses deferred due to wash sale adjustments, foreign currency gains and
| 19 |
| Hartford High Yield HLS Fund |
| Notes to Financial Statements – (continued) |
| June 30, 2013 (Unaudited) |
| (000’s Omitted) |
losses, adjustments related to Passive Foreign Investment Companies (“PFICs”), Real Estate Investment Trusts (“REITs”), Regulated Investment Companies (“RICs”), certain derivatives and partnerships. Permanent book and federal income tax basis differences relating to shareholder distributions will result in reclassifications to certain of the Fund’s capital accounts (see Federal Income Taxes: Reclassification of Capital Accounts note).
| 3. | Securities and Other Investments: |
| a) | Repurchase Agreements – A repurchase agreement is an agreement by which a counterparty agrees to sell an investment and agrees to repurchase the investment sold from the buyer at a mutually agreed upon time and price. During the period of the repurchase agreement, the counterparty will deposit cash and or securities in a third party custodial account to serve as collateral. At the time the Fund enters into a repurchase agreement, the value of the underlying collateral, including accrued interest, will be equal to or exceed the value of the repurchase agreement. Repurchase agreements expose the Fund to counterparty risk - that is, the risk that the counterparty will not fulfill its obligations. To minimize counterparty risk, the investments that serve to collateralize the repurchase agreement are held by the Fund’s custodian in book entry or physical form in the custodial account of the Fund or in a third party custodial account. Repurchase agreements are valued at cost plus accrued interest, which approximates fair value. Repurchase agreements have master netting agreements which allow the Fund to offset amounts owed to a counterparty with amounts owed by the counterparty, including any collateral. The Fund, as shown on the Schedule of Investments, had outstanding repurchase agreements as of June 30, 2013. |
| b) | Illiquid and Restricted Investments – The Fund is permitted to invest up to 15% of its net assets in illiquid investments. Illiquid investments are those that may not be sold or disposed of in the ordinary course of business within seven days, at approximately the price used to determine the Fund’s NAV. The Fund may not be able to sell illiquid investments when its sub-adviser considers it desirable to do so or may have to sell such investments at a price that is lower than the price that could be obtained if the investments were more liquid. A sale of illiquid investments may require more time and may result in higher dealer discounts and other selling expenses than does the sale of those that are liquid. Illiquid investments also may be more difficult to value due to the unavailability of reliable market quotations for such investments, and an investment in them may have an adverse impact on the Fund’s NAV. The Fund may also purchase certain restricted investments that can only be resold to certain qualified investors and may be determined to be liquid pursuant to policies and guidelines established by the Company’s Board of Directors. The Fund, as shown on the Schedule of Investments, had illiquid and/or restricted investments as of June 30, 2013. |
| c) | Investments Purchased on a When-Issued or Delayed-Delivery Basis – Delivery and payment for investments that have been purchased by the Fund on a forward commitment, or when-issued or delayed-delivery basis, take place beyond the customary settlement period. A fund may dispose of or renegotiate a delayed-delivery transaction after it is entered into, and may sell delayed-delivery investments before they are delivered, which may result in a realized gain or loss. During this period, such investments are subject to market fluctuations, and the Fund identifies investments segregated in its records with a value at least equal to the amount of the commitment. The Fund, as shown on the Schedule of Investments, had when-issued or delayed-delivery investments as of June 30, 2013. |
| d) | Senior Floating Rate Interests – The Fund, as shown on the Schedule of Investments, invests in senior floating rate interests. Senior floating rate interests hold the most senior position in the capital structure of a business entity (the “Borrower”), are typically secured by specific collateral and have a claim on the assets and/or stock of the Borrower that is senior to that held by subordinated debtholders and stockholders of the Borrower. Senior floating rate interests are typically structured and administered by a financial institution that acts as the agent of the lenders participating in the senior floating rate interest. The Fund may invest in multiple series or tranches of a senior floating rate interest, which may have varying terms and carry different associated risks. The Fund may also enter into unfunded loan commitments, which are contractual obligations for future funding. Unfunded loan commitments may include revolving credit facilities, which may obligate the Fund to supply additional cash to the borrower on demand. Unfunded loan commitments represent a future obligation in full. The Fund may receive a commitment fee based on the undrawn portion of the underlying line of credit portion of a senior floating rate interest. In certain circumstances, the Fund may receive various |
| 20 |
fees upon the restructure of a senior floating rate interest by a borrower. Fees earned/paid may be recorded as a component of income or realized gain/loss in the Statement of Operations.
Senior floating rate interests are typically rated below-investment-grade, which suggests they are more likely to default and generally pay higher interest rates than investment-grade loans. A default could lead to non-payment of income, which would result in a reduction of income to the Fund, and there can be no assurance that the liquidation of any collateral would satisfy the Borrower’s obligation in the event of non-payment of scheduled interest or principal payments, or that such collateral could be readily liquidated.
| e) | Mortgage Related and Other Asset Backed Securities – The Fund may invest in mortgage related and other asset backed securities. These securities include mortgage pass-through securities, collateralized mortgage obligations, commercial mortgage backed securities, stripped mortgage backed securities, asset backed securities, collateralized debt obligations and other securities that directly or indirectly represent a participation in, or are secured by and payable from, mortgage loans on real property. Mortgage related securities are created from pools of residential or commercial mortgage loans, including mortgage loans made by savings and loan institutions, mortgage bankers, commercial banks and others. Asset backed securities are created from many types of assets, including auto loans, credit card receivables, home equity loans, and student loans. These securities provide a monthly payment that consists of both interest and principal payments. Interest payments may be determined by fixed or adjustable rates. The rate of pre-payments on underlying mortgages will affect the price and volatility of a mortgage related security, and may have the effect of shortening or extending the effective duration of the security relative to what was anticipated at the time of purchase. The timely payment of principal and interest of certain mortgage related securities is guaranteed by the full faith and credit of the United States Government. Mortgage related and other asset backed securities created and guaranteed by non-governmental issuers, including government-sponsored corporations, may be supported by various forms of insurance or guarantees, but there can be no assurance that the private insurers or guarantors can meet their obligations under the insurance policies or guarantee arrangements. The Fund, as shown on the Schedule of Investments, had mortgage related and other asset backed securities as of June 30, 2013. |
| 4. | Financial Derivative Instruments: |
The following disclosures contain information on how and why the Fund uses derivative instruments, the credit-risk-related contingent features in certain derivative instruments, and how derivative instruments affect the Fund’s financial position and results of operations. The location and fair value amounts of these instruments on the Statement of Assets and Liabilities and the realized gains and losses and changes in unrealized gains and losses on the Statement of Operations, each categorized by type of derivative contract, are included in the following Additional Derivative Instrument Information footnote. The derivative instruments outstanding as of period-end are disclosed in the notes to or within the Schedule of Investments for purchased options, if applicable. The amounts of realized gains and losses and changes in unrealized gains and losses on derivative instruments during the period are disclosed in the Statement of Operations.
| a) | Foreign Currency Contracts – The Fund may enter into foreign currency contracts that obligate the Fund to purchase or sell currencies at specified future dates. Foreign currency contracts are used to hedge the currency exposure associated with some or all of the Fund’s investments and/or as part of an investment strategy. Foreign currency contracts are marked to market daily and the change in value is recorded by the Fund as an unrealized gain or loss. The Fund will record a realized gain or loss when the foreign currency contract is settled. |
Foreign currency contracts involve elements of market risk in excess of the amounts reflected in the Statement of Assets and Liabilities. In addition, risks may arise upon entering into these contracts from the potential inability of the counterparties to meet the terms of the contracts and from unanticipated movements in the value of the foreign currencies relative to the U.S. dollar. The Fund had outstanding foreign currency contracts as shown on the Schedule of Investments as of June 30, 2013.
| 21 |
| Hartford High Yield HLS Fund |
| Notes to Financial Statements – (continued) |
| June 30, 2013 (Unaudited) |
| (000’s Omitted) |
| b) | Swap Contracts – The Fund may invest in swap contracts. Swap contracts are privately negotiated agreements between the Fund and a counterparty to exchange or swap investment cash flows, assets, foreign currencies or market-linked returns at specified future intervals. The Fund may enter into credit default, total return, cross-currency, interest rate, inflation and other forms of swap contracts to manage its exposure to credit, currency, interest rate, commodity and inflation risk. Swap contracts are also used to gain exposure to certain markets. In connection with these contracts, investments or cash may be identified as collateral in accordance with the terms of the respective swap contracts to provide assets of value and recourse in the event of default or bankruptcy/insolvency. Swaps are valued based on custom valuations furnished by an independent pricing service. Swaps for which prices are not available from an independent pricing service are valued in accordance with procedures established by the Company’s Board of Directors, and the change in value, if any, is recorded as an unrealized gain or loss on the Statement of Assets and Liabilities. Payments received or made at the beginning of the measurement period are reflected as such on the Statement of Assets and Liabilities and represent payments made or received upon entering into the swap contract to compensate for differences between the stated terms of the swap contract and prevailing market conditions (credit spreads, currency exchange rates, interest rates, and other relevant factors). These upfront payments are recorded as realized gains or losses on the Statement of Operations upon termination or maturity of the swap. A liquidation payment received or made at the termination of the swap and net periodic payments received or paid by the Fund are recorded as realized gains or losses on the Statement of Operations. Entering into these contracts involves, to varying degrees, elements of credit and market risk in excess of the amounts recognized on the Statement of Assets and Liabilities. Such risks involve the possibility that there will be no liquid market for these contracts, that the counterparty to the contracts may default on its obligation to perform or disagree as to the meaning of contractual terms in the contracts, and that there may be unfavorable changes in interest rates. The Fund’s maximum risk of loss from counterparty credit risk is the discounted net value of the cash flows to be received from the counterparty over the contract’s remaining life, to the extent that amount is positive. The risk is mitigated by having a master netting arrangement between the Fund and the counterparty, which allows for the netting of payments made or received (although such amounts are presented on a gross basis within the Statement of Assets and Liabilities, as applicable) as well as the posting of collateral to the Fund to cover the Fund’s exposure to the counterparty. |
Credit Default Swap Contracts – The credit default swap market allows the Fund to manage its exposure to the market or certain sectors of the market, to reduce its risk exposure to defaults of corporate and sovereign issuers, or to create exposure to corporate or sovereign issuers to which it is not otherwise exposed. Certain credit default swaps involve the exchange of a fixed rate premium for protection against the loss in value of an underlying investment or index in the event of a credit event, such as payment default or bankruptcy.
Under a credit default swap contract, one party acts as guarantor by receiving the fixed periodic payment in exchange for the commitment to purchase the underlying investment at par if the defined credit event occurs. Upon the occurrence of a defined credit event, the difference between the value of the reference obligation and the swap’s notional amount is recorded as realized gain or loss on swap transactions in the Statement of Operations. A “buyer” of credit protection agrees to pay a counterparty to assume the credit risk of an issuer upon the occurrence of certain events. The “seller” of the protection receives periodic payments and agrees to assume the credit risk of an issuer upon the occurrence of certain events. Although specified events are contract specific, credit events are generally defined as bankruptcy, failure to pay, restructuring, obligation acceleration, obligation default, or repudiation/moratorium. A “seller’s” exposure is limited to the total notional amount of the credit default swap contract. These potential amounts would be partially offset by any recovery values of the respective referenced obligations or upfront payments received upon entering into the contract.
Implied credit spreads, represented in absolute terms, utilized in determining the market value of credit default swap contracts on corporate issues, sovereign government issues or U.S. municipal issues as of period-end are disclosed in the notes to the Schedule of Investments, as applicable, and serve as an indicator of the current status of the payment/performance risk and represent the likelihood or risk of default for the credit derivative. The implied credit spread of a particular referenced entity reflects the cost of buying/selling protection and may include upfront payments required to be made to enter into the contract. Wider credit spreads represent a deterioration of the referenced entity’s soundness and a greater likelihood or risk of default or other credit event occurring as defined under the terms of the
| 22 |
contract. For credit default swap contracts on asset-backed securities and credit indices, the quoted market prices and resulting values serve as the indicator of the current status of the payment/performance risk. Increasing market values, in absolute terms when compared to the notional amount of the swap, represent a deterioration of the referenced equity’s credit soundness and a greater likelihood or risk of default or other credit event occurring as defined under the terms of the contract. The Fund, as shown on the Schedule of Investments, had outstanding credit default swaps as of June 30, 2013.
| c) | Additional Derivative Instrument Information: |
Fair Value of Derivative Instruments on the Statement of Assets and Liabilities as of June 30, 2013:
| Risk Exposure Category | ||||||||||||||||||||||||||||
| Interest Rate Contracts | Foreign Exchange Contracts | Credit Contracts | Equity Contracts | Commodity Contracts | Other Contracts | Total | ||||||||||||||||||||||
| Assets: | ||||||||||||||||||||||||||||
| Unrealized appreciation on foreign currency contracts | $ | — | $ | 43 | $ | — | $ | — | $ | — | $ | — | $ | 43 | ||||||||||||||
| Unrealized appreciation on swap contracts | — | — | 300 | — | — | — | 300 | |||||||||||||||||||||
| Total | $ | — | $ | 43 | $ | 300 | $ | — | $ | — | $ | — | $ | 343 | ||||||||||||||
The volume of derivatives that is presented in the Schedule of Investments is consistent with the derivative activity during the six-month period ended June 30, 2013.
The Effect of Derivative Instruments on the Statement of Operations for the six-month period ended June 30, 2013:
| Risk Exposure Category | ||||||||||||||||||||||||||||
| Interest Rate Contracts | Foreign Exchange Contracts | Credit Contracts | Equity Contracts | Commodity Contracts | Other Contracts | Total | ||||||||||||||||||||||
| Realized Gain on Derivatives Recognized as a Result of Operations: | ||||||||||||||||||||||||||||
| Net realized gain on swap contracts | $ | — | $ | — | $ | 610 | $ | — | $ | — | $ | — | $ | 610 | ||||||||||||||
| Net realized gain on foreign currency contracts | — | 33 | — | — | — | — | 33 | |||||||||||||||||||||
| Total | $ | — | $ | 33 | $ | 610 | $ | — | $ | — | $ | — | $ | 643 | ||||||||||||||
| Net Change in Unrealized Appreciation (Depreciation) on Derivatives Recognized as a Result of Operations: | ||||||||||||||||||||||||||||
| Net change in unrealized appreciation of swap contracts | $ | — | $ | — | $ | 214 | $ | — | $ | — | $ | — | $ | 214 | ||||||||||||||
| Net change in unrealized appreciation of foreign currency contracts | — | 35 | — | — | — | — | 35 | |||||||||||||||||||||
| Total | $ | — | $ | 35 | $ | 214 | $ | — | $ | — | $ | — | $ | 249 | ||||||||||||||
| d) | Balance Sheet Offsetting Information: |
Set forth below are tables which disclose both gross information and net information about instruments and transactions eligible for offset in the financial statements, and instruments and transactions that are subject to a master netting agreement, as well as amounts related to margin, reflected as financial collateral (including cash collateral), held at clearing brokers, counterparties, and the Fund’s custodian. The master netting agreements allow the clearing brokers to net any collateral held in or on behalf of the Fund, or liabilities or payment obligations of the clearing brokers to the Fund, against any liabilities or payment obligations of the Fund to the clearing brokers. The Fund is required to deposit financial collateral (including cash collateral) at the Fund’s custodian on behalf of clearing brokers and counterparties to continually meet the original and maintenance requirements established by the clearing brokers and counterparties. Such requirements are specific to the respective clearing broker or counterparty.
| 23 |
| Hartford High Yield HLS Fund |
| Notes to Financial Statements – (continued) |
| June 30, 2013 (Unaudited) |
| (000’s Omitted) |
Offsetting of Financial Assets and Derivative Assets as of June 30, 2013:
| Description | Gross Amounts of Recognized Assets | Gross Amounts Offset in Statement of Assets and Liabilities | Net Amounts of Assets Presented in Statement of Assets and Liabilities | Financial Instruments with Allowable Netting | Collateral Received | Net Amount (not less than 0) | ||||||||||||||||||
| Repurchase Agreements | $ | 10,234 | $ | — | $ | 10,234 | $ | — | $ | (10,406 | ) | $ | — | |||||||||||
| Swap contracts at market value | 268 | — | 268 | — | (34 | ) | 234 | |||||||||||||||||
| Unrealized appreciation on foreign currency contracts | 43 | — | 43 | — | — | 43 | ||||||||||||||||||
| Total subject to a master netting or similar arrangement | $ | 10,545 | $ | — | $ | 10,545 | $ | — | $ | (10,440 | ) | $ | 277 | |||||||||||
| 5. | Principal Risks: |
| a) | Credit and Counterparty Risks – Credit risk depends largely on the perceived financial health of bond issuers. In general, the credit rating is inversely related to the credit risk of the issuer. Higher rated bonds generally are deemed to have less credit risk, while lower or unrated bonds are deemed to have higher risk of default. The share price, yield and total return of a fund that holds securities with higher credit risk may be more volatile than those of a fund that holds bonds with lower credit risk. Similar to credit risk, the Fund may be exposed to counterparty risk, or the risk that an institution or other entity with which the Fund has unsettled or open transactions will default. |
| b) | Market Risks – The Fund’s investments expose the Fund to various risks including, but not limited to, interest rate, prepayment, extension, foreign currency, and equity risks. Interest rate risk is the risk that fixed income securities will decline in value because of changes in interest rates. As nominal interest rates rise, the values of certain fixed income securities held by the Fund are likely to decrease. A nominal interest rate can be described as the sum of a real interest rate and an expected inflation rate. Fixed income securities with longer durations tend to be more sensitive to changes in interest rates, usually making them more volatile than securities with shorter durations. Duration is useful primarily as a measure of the sensitivity of a fixed income security’s market price to interest rate (i.e., yield) movements. Senior floating rate interests and securities subject to prepayment and extension risk generally offer less potential for gains when interest rates decline. In addition, securities are subject to extension risk. Rising interest rates may cause prepayments to occur at a slower than expected rate, thereby effectively lengthening the maturity of the security and making the security more sensitive to interest rate changes. Prepayment and extension risk are major risks of mortgage backed securities, senior floating rate interests, and certain asset backed securities. For certain asset backed securities, the actual maturity may be less than the stated maturity shown in the Schedule of Investments, if applicable. As a result, the timing of income recognition relating to these securities may vary based upon the actual maturity. If the Fund invests directly in foreign currencies or in securities that trade in, and receive revenues in, foreign currencies, or in derivatives that provide exposure to foreign currencies, it will be subject to the risk that those currencies will decline in value relative to the base currency of the Fund, or, in the case of hedging positions, that the Fund’s base currency will decline in value relative to the currency being hedged. Currency rates in foreign countries may fluctuate significantly over short periods of time for a number of reasons, including changes in interest rates, intervention (or the failure to intervene) by U.S. or foreign governments, central banks or supranational entities, such as the International Monetary Fund, or by the imposition of currency controls or other political developments in the United States or abroad. As a result, the Fund’s investments in foreign currency denominated securities may reduce the returns of the Fund. The market values of equity securities, such as common stocks and preferred stocks, or equity related investments, such as futures and options, may decline due to general market conditions which are not specifically related to a particular company, such as real or perceived adverse economic conditions, changes in the general outlook for corporate earnings, changes in interest or currency rates or adverse investor sentiment generally. The market value of equity securities may also decline due to factors which affect a particular industry or industries, such as labor shortages or increased production costs and competitive conditions within an industry. Equity securities and equity related investments generally have greater market price volatility than fixed income securities. |
| 24 |
| 6. | Federal Income Taxes: |
| a) | Federal Income Taxes – For federal income tax purposes, the Fund intends to continue to qualify as a RIC under Subchapter M of the Internal Revenue Code (“IRC”) by distributing substantially all of its taxable net investment income and net realized capital gains to its shareholders and otherwise complying with the requirements of the IRC. The Fund has distributed substantially all of its income and capital gains in prior years, if applicable, and intends to distribute substantially all of its income and capital gains prior to the next fiscal year-end. Accordingly, no provision for federal income or excise taxes has been made in the accompanying financial statements. Distributions from short-term capital gains are treated as ordinary income distributions for federal income tax purposes. |
| b) | Net Investment Income (Loss), Net Realized Gains (Losses), and Distributions – Net investment income (loss) and net realized gains (losses) may differ for financial statement and tax purposes primarily because of losses deferred due to wash sale adjustments, foreign currency gains and losses, adjustments related to PFICs, REITs, RICs, certain derivatives and partnerships. The character of distributions made during the year from net investment income or net realized gains may differ from their ultimate characterization for federal income tax purposes. Also, due to the timing of dividend distributions, the fiscal year in which amounts are distributed may differ from the year that the income or realized gains (losses) were recorded by the Fund. |
| c) | Distributions and Components of Distributable Earnings – The tax character of distributions paid by the Fund for the periods indicated is as follows (as adjusted for dividends payable, if applicable): |
| For the Year Ended December 31, 2012 | For the Year Ended December 31, 2011 | |||||||
| Ordinary Income | $ | 57,181 | $ | 63,579 | ||||
As of December 31, 2012, the Fund’s components of distributable earnings (deficit) on a tax basis were as follows:
| Amount | ||||
| Undistributed Ordinary Income | $ | 43,989 | ||
| Accumulated Capital and Other Losses* | (33,139 | ) | ||
| Unrealized Appreciation† | 25,577 | |||
| Total Accumulated Earnings | $ | 36,427 | ||
* The Fund has capital loss carryforwards that are identified in the Capital Loss Carryforward note that follows.
† Differences between book-basis and tax-basis unrealized appreciation (depreciation) may be attributable to the losses deferred due to wash sale adjustments, foreign currency gains and losses, adjustments related to PFICs, REITs, RICs, certain derivatives and partnerships.
| 25 |
| Hartford High Yield HLS Fund |
| Notes to Financial Statements – (continued) |
| June 30, 2013 (Unaudited) |
| (000’s Omitted) |
| d) | Reclassification of Capital Accounts – The Fund may record reclassifications in its capital accounts. These reclassifications have no impact on the total net assets of the Fund. The reclassifications are a result of permanent differences between U.S. GAAP and tax accounting for such items as foreign currency, PFICs, expiration or utilization of capital loss carryforwards or net operating losses. Adjustments are made to reflect the impact these items have on current and future distributions to shareholders. Therefore, the source of the Fund’s distributions may be shown in the accompanying Statement of Changes in Net Assets as from undistributed net investment income, from accumulated net realized gains on investments or from capital depending on the type of book and tax differences that exist. For the year ended December 31, 2012, the Fund recorded reclassifications to increase (decrease) the accounts listed below: |
| Amount | ||||
| Undistributed Net Investment Income | $ | 274 | ||
| Accumulated Net Realized Gain (Loss) | (274 | ) | ||
| e) | Capital Loss Carryforward – On December 22, 2010, the Regulated Investment Company Modernization Act of 2010 (the “Act”) was enacted, which made changes to the capital loss carryforward rules. The changes are effective for taxable years beginning after the date of enactment. Under the Act, funds are permitted to carry forward capital losses for an unlimited period. However, any losses incurred during those future taxable years will be required to be utilized prior to the losses incurred in pre-enactment taxable years, which carry an expiration date. As a result of this ordering rule, pre-enactment capital loss carryforwards may be more likely to expire unused. Additionally, post-enactment capital loss carryforwards retain their character as either short-term or long-term capital losses rather than being considered all short-term as permitted under prior regulation. |
At December 31, 2012 (tax-year-end), the Fund had capital loss carryforwards for U.S. federal income tax purposes as follows:
| Year of Expiration | Amount | |||
| 2017 | $ | 33,139 | ||
| Total | $ | 33,139 | ||
During the year ended December 31, 2012, the Fund utilized $11,018 of prior year capital loss carryforwards.
| f) | Accounting for Uncertainty in Income Taxes – The Fund has adopted financial reporting rules that require the Fund to analyze all open tax years, as defined by the statute of limitations, for all major jurisdictions. Generally, tax authorities can examine all tax returns filed for the last three years. The Fund does not have an examination in progress. |
The Fund has reviewed all open tax years and major jurisdictions and concluded that these financial reporting rules had no effect on the Fund’s financial position or results of operations. There is no tax liability resulting from unrecognized tax benefits relating to uncertain income tax positions taken or expected to be taken on the tax return for the fiscal year ended December 31, 2012. The Fund is also not aware of any tax positions for which it is reasonably possible that the total amounts of unrecognized tax benefits will significantly change in the next twelve months.
| 7. | Expenses: |
| a) | Investment Management Agreement – Hartford Funds Management Company, LLC (“HFMC”), an indirect wholly owned subsidiary of The Hartford Financial Services Group, Inc. (“The Hartford”), serves as investment manager to the Fund pursuant to an Investment Management Agreement with the Company. The investment manager has overall investment supervisory responsibility for the Fund. In addition, the investment manager provides administrative personnel, services, equipment, facilities and office space for proper operation of the Fund. The investment manager has contracted with Wellington Management Company, LLP (“Wellington Management”) under a sub-advisory agreement for the provision of day-to-day investment management services to the Fund in accordance with the Fund’s investment |
| 26 |
objective and policies. The Fund pays a fee to the investment manager, a portion of which may be used to compensate Wellington Management.
The schedule below reflects the rates of compensation paid to HFMC for investment management services rendered as of June 30, 2013; the rates are accrued daily and paid monthly.
| Average Daily Net Assets | Annual Fee | |||
| On first $500 million | 0.7000 | % | ||
| On next $500 million | 0.6750 | % | ||
| On next $1.5 billion | 0.6250 | % | ||
| On next $2.5 billion | 0.6150 | % | ||
| On next $5 billion | 0.6050 | % | ||
| Over $10 billion | 0.5950 | % | ||
| b) | Accounting Services Agreement – Pursuant to the Fund Accounting Agreement between HFMC and the Company, on behalf of the Fund, HFMC provides accounting services to the Fund and receives monthly compensation based on the Fund’s average daily net assets at the rates set forth below. The Fund’s accounting services fees are accrued daily and paid monthly. |
| Average Daily Net Assets | Annual Fee | |||
| On first $5 billion | 0.020 | % | ||
| On next $5 billion | 0.018 | % | ||
| Over $10 billion | 0.016 | % | ||
| c) | Operating Expenses – Allocable expenses incurred by the Company are allocated to each Fund and allocated to classes within a Fund in proportion to the average daily net assets of the Fund and each class, except where allocation of certain expenses is more fairly made directly to the Fund or to specific classes within a Fund. |
| d) | Fees Paid Indirectly – The Fund’s custodian banks have agreed to reduce its fees when the Fund maintains cash on deposit in a non-interest-bearing custody account. For the six-month period ended June 30, 2013, these amounts, if any, are included in the Statement of Operations. |
The ratio of expenses to average net assets in the accompanying financial highlights excludes the reduction in expenses related to fees paid indirectly. The annualized expense ratio for the period listed below reflecting the reduction for fees paid indirectly is as follows:
| Annualized Six- Month Period Ended June 30, 2013 | ||||
| Class IA | 0.75 | % | ||
| Class IB | 1.00 | |||
| e) | Distribution Plan for Class IB shares – The Company, on behalf of the Fund, has adopted a Distribution Plan pursuant to Rule 12b-1 of the 1940 Act to compensate the distributor, Hartford Funds Distributors, LLC (“HFD”), (formerly known as Hartford Investment Financial Services, LLC), an indirect wholly owned subsidiary of The Hartford, from assets attributable to the Class IB shares for services rendered and expenses borne in connection with activities primarily intended to result in the sale of the Class IB shares, subject to the review and approval of the Company’s Board of Directors. |
| 27 |
| Hartford High Yield HLS Fund |
| Notes to Financial Statements – (continued) |
| June 30, 2013 (Unaudited) |
| (000’s Omitted) |
The Distribution Plan provides that the Fund may pay annually up to 0.25% of the average daily net assets of the Fund attributable to its Class IB shares for activities primarily intended to result in the sale of Class IB shares. The Board has the authority to suspend or reduce these payments at any point in time. Under the terms of the Distribution Plan and the principal underwriting agreement, the Fund is authorized to make payments monthly to the distributor that may be used to pay or compensate entities providing distribution and shareholder servicing with respect to the Class IB shares for such entities’ fees or expenses incurred or paid in that regard. These fees are accrued daily and paid monthly.
| f) | Other Related Party Transactions – Certain officers of the Fund are directors and/or officers of the investment manager and/or The Hartford or its subsidiaries. For the six-month period ended June 30, 2013, a portion of the Fund’s Chief Compliance Officer’s salary was paid by all the investment companies in the Hartford fund complex. The portion allocated to the Fund rounds to zero. Hartford Administrative Services Company (“HASCO”), an indirect wholly owned subsidiary of The Hartford, provides transfer agent services to the Fund. HASCO was compensated on a per account basis for providing such services. The amount paid to HASCO can be found in the Statement of Operations. These fees are accrued daily and paid monthly. |
| g) | Payment from Affiliate – In July of 2007, The Hartford entered into a settlement with the Attorneys General of the states of New York, Connecticut and Illinois relating to market timing and the company's individual variable annuity contracts in which certain payments would be made directly to the variable annuity contract holders. The distribution plan provided that unclaimed money from the settlement would be distributed to certain HLS Funds that are investment options through a Hartford individual variable annuity contract. The unclaimed money was distributed to the Fund on September 18, 2009. |
The total return in the accompanying financial highlights includes a payment from an affiliate. Had the payment from the affiliate been excluded, the impact and total return for the period listed below would have been as follows:
| For the Year Ended December 31, 2009 | ||||||||
| Class IA | Class IB | |||||||
| Impact from Payment from Affiliate for Attorneys General Settlement | 0.03 | % | 0.03 | % | ||||
| Total Return Excluding Payment from Affiliate | 50.41 | % | 50.04 | % | ||||
| 8. | Investment Transactions: |
For the six-month period ended June 30, 2013, the Fund's aggregate purchases and sales of investment securities (excluding short-term investments) were as follows:
| Amount | ||||
| Cost of Purchases Excluding U.S. Government Obligations | $ | 118,476 | ||
| Sales Proceeds Excluding U.S. Government Obligations | 192,677 | |||
| 9. | Line of Credit: |
The Fund is one of several Hartford funds that participate in a $500 million committed revolving line of credit facility. The facility is to be used for temporary or emergency purposes. Under the arrangement, the funds are required to own securities having a market value in excess of 300% of the total bank borrowings. The interest rate on borrowings varies depending on the nature of the loan. The facility also requires a fee to be paid based on the amount of the commitment. This commitment fee is allocated to all of the funds participating in the line of credit based on the average net assets of the funds. During the six-month period ended June 30, 2013, the Fund did not have any borrowings under this facility.
| 28 |
| 10. | Industry Classifications: |
Other than the industry classifications “Other Investment Pools and Funds” and “Exchange Traded Funds,” equity industry classifications used in this report are the Global Industry Classification Standard, which was developed by and is the exclusive property and service mark of MSCI, Inc. and Standard & Poor’s.
| 11. | Indemnifications: |
Under the Company’s organizational documents, the Company shall indemnify its officers and directors to the full extent required or permitted under Maryland General Corporation Law and the federal securities laws. In addition, the Company, on behalf of the Fund, may enter into contracts that contain a variety of indemnifications. The Company’s maximum exposure under these arrangements is unknown. However, as of the date of these financial statements, the Company has not had prior claims or losses pursuant to these contracts and expects the risk of loss to be remote.
| 12. | Pending Legal Proceedings: |
On February 25, 2011, Jennifer L. Kasilag, Louis Mellinger, Judith M. Menendez, Jacqueline M. Robinson, and Linda A. Russell filed a derivative lawsuit against Hartford Investment Financial Services, LLC (“HIFSCO”)(now known as Hartford Funds Distributors, LLC) on behalf of six Hartford retail mutual funds in the United States District Court for the District of New Jersey, alleging that HIFSCO received excessive advisory and distribution fees in violation of its statutory fiduciary duty under Section 36(b) of the 1940 Act when serving as investment manager and principal underwriter, respectively, to the Hartford retail mutual funds. HIFSCO moved to dismiss and, in September 2011, the motion was granted in part and denied in part, with leave to amend the complaint. In November 2011, plaintiffs filed an amended complaint on behalf of certain Hartford retail mutual funds, The Hartford Global Health Fund (now known as The Hartford Healthcare Fund), The Hartford Conservative Allocation Fund, The Hartford Growth Opportunities Fund, The Hartford Inflation Plus Fund, The Hartford Advisers Fund (now known as The Hartford Balanced Fund), and The Hartford Capital Appreciation Fund. Plaintiffs seek to rescind the investment management agreements and distribution plans between HIFSCO and these funds and to recover the total fees charged thereunder or, in the alternative, to recover any improper compensation HIFSCO received, in addition to lost earnings. HIFSCO filed a partial motion to dismiss the amended complaint and, in December 2012, the court dismissed without prejudice the claims regarding distribution fees and denied the motion with respect to the advisory fees claims. HIFSCO disputes the allegations and intends to defend vigorously.
This action concerns the activities of HIFSCO in its capacity as investment manager and principal underwriter to the Hartford retail mutual funds and does not concern HIFSCO’s activities in its capacity as principal underwriter to the HLS funds. For this reason, no accrual for litigation relating to this matter has been recorded in the financial statements of the Fund.
| 29 |
| Hartford High Yield HLS Fund |
| Financial Highlights |
| - Selected Per-Share Data (A) - |
| Class | Net Asset Value at Beginning of Period | Net Investment Income (Loss) | Net Realized and Unrealized Gain (Loss) on Investments | Total from Investment Operations | Dividends from Net Investment Income | Distributions from Realized Capital Gains | Distributions from Capital | Total Distributions | Net Asset Value at End of Period | |||||||||||||||||||||||||||
| For the Six-Month Period Ended June 30, 2013 (Unaudited) | ||||||||||||||||||||||||||||||||||||
| IA | $ | 9.09 | $ | 0.42 | $ | (0.33 | ) | $ | 0.09 | $ | – | $ | – | $ | – | $ | – | $ | 9.18 | |||||||||||||||||
| IB | 8.96 | 0.35 | (0.27 | ) | 0.08 | – | – | – | – | 9.04 | ||||||||||||||||||||||||||
| For the Year Ended December 31, 2012 (G) | ||||||||||||||||||||||||||||||||||||
| IA | 8.70 | 0.58 | 0.63 | 1.21 | (0.82 | ) | – | – | (0.82 | ) | 9.09 | |||||||||||||||||||||||||
| IB | 8.59 | 0.55 | 0.62 | 1.17 | (0.80 | ) | – | – | (0.80 | ) | 8.96 | |||||||||||||||||||||||||
| For the Year Ended December 31, 2011 (G) | ||||||||||||||||||||||||||||||||||||
| IA | 9.15 | 0.71 | (0.31 | ) | 0.40 | (0.85 | ) | – | – | (0.85 | ) | 8.70 | ||||||||||||||||||||||||
| IB | 9.04 | 0.67 | (0.30 | ) | 0.37 | (0.82 | ) | – | – | (0.82 | ) | 8.59 | ||||||||||||||||||||||||
| For the Year Ended December 31, 2010 (G) | ||||||||||||||||||||||||||||||||||||
| IA | 7.94 | 0.75 | 0.52 | 1.27 | (0.06 | ) | – | – | (0.06 | ) | 9.15 | |||||||||||||||||||||||||
| IB | 7.86 | 0.72 | 0.52 | 1.24 | (0.06 | ) | – | – | (0.06 | ) | 9.04 | |||||||||||||||||||||||||
| For the Year Ended December 31, 2009 (G) | ||||||||||||||||||||||||||||||||||||
| IA | 5.73 | 0.73 | 2.16 | 2.89 | (0.68 | ) | – | – | (0.68 | ) | 7.94 | |||||||||||||||||||||||||
| IB | 5.68 | 0.70 | 2.14 | 2.84 | (0.66 | ) | – | – | (0.66 | ) | 7.86 | |||||||||||||||||||||||||
| For the Year Ended December 31, 2008 | ||||||||||||||||||||||||||||||||||||
| IA | 8.87 | 0.83 | (3.12 | ) | (2.29 | ) | (0.85 | ) | – | – | (0.85 | ) | 5.73 | |||||||||||||||||||||||
| IB | 8.78 | 0.83 | (3.11 | ) | (2.28 | ) | (0.82 | ) | – | – | (0.82 | ) | 5.68 | |||||||||||||||||||||||
| (A) | Information presented relates to a share outstanding throughout the indicated period. |
| (B) | The figures do not include sales charges or other fees which may be applied at the variable life insurance, variable annuity or qualified retirement plan product level. Any such additional sales charges or other fees would lower the Fund's performance. |
| (C) | Ratios do not reflect reductions for fees paid indirectly. Please see Fees Paid Indirectly in the Notes to Financial Statements. |
| (D) | Portfolio turnover rate is calculated on the basis of the Fund as a whole without distinguishing between the classes of shares issued. |
| (E) | Not annualized. |
| (F) | Annualized. |
| (G) | Per share amounts have been calculated using the average shares method. |
| (H) | Total return without the inclusion of the Payment from (to) Affiliate can be found in Expenses in the accompanying Notes to Financial Statements. |
| 30 |
- Ratios and Supplemental Data -
| Total Return(B) | Net Assets at End of Period | Ratio of Expenses to Average Net Assets Before Waivers(C) | Ratio of Expenses to Average Net Assets After Waivers(C) | Ratio of Net Investment Income (Loss) to Average Net Assets | Portfolio Turnover Rate(D) | |||||||||||||||||
| 0.98 | %(E) | $ | 430,441 | 0.75 | %(F) | 0.75 | %(F) | 6.02 | %(F) | 19 | % | |||||||||||
| 0.86 | (E) | 134,369 | 1.00 | (F) | 1.00 | (F) | 5.77 | (F) | – | |||||||||||||
| 14.31 | 504,042 | 0.75 | 0.75 | 6.37 | 94 | |||||||||||||||||
| 14.03 | 149,050 | 1.00 | 1.00 | 6.12 | – | |||||||||||||||||
| 4.69 | 548,608 | 0.74 | 0.74 | 7.68 | 88 | |||||||||||||||||
| 4.44 | 160,060 | 0.99 | 0.99 | 7.43 | – | |||||||||||||||||
| 16.15 | 602,493 | 0.75 | 0.75 | 8.80 | 139 | |||||||||||||||||
| 15.86 | 186,357 | 1.00 | 1.00 | 8.57 | – | |||||||||||||||||
| 50.46 | (H) | 527,000 | 0.75 | 0.75 | 10.32 | 173 | ||||||||||||||||
| 50.08 | (H) | 188,832 | 1.00 | 1.00 | 10.08 | – | ||||||||||||||||
| (25.23 | ) | 293,839 | 0.74 | 0.74 | 9.05 | 101 | ||||||||||||||||
| (25.42 | ) | 124,701 | 0.99 | 0.99 | 8.76 | – | ||||||||||||||||
| 31 |
| Hartford High Yield HLS Fund |
| Directors and Officers (Unaudited) |
The Board of Directors of the Company appoints officers who are responsible for the day-to-day operations of the Fund and who execute policies formulated by the Directors. Each director serves until his or her death, resignation, or retirement or until the next annual meeting of shareholders is held or until his or her successor is elected and qualifies.
Directors and officers who are employed by or who have a financial interest in The Hartford are considered “interested” persons of the Fund pursuant to the 1940 Act. Each officer and two of the Company’s directors, as noted in the chart below, are “interested” persons of the Fund. Each director serves as a director for The Hartford Mutual Funds, Inc., The Hartford Mutual Funds II, Inc., Hartford Series Fund, Inc., Hartford HLS Series Fund II, Inc., and as a trustee for The Hartford Alternative Strategies Fund, which, as of June 30, 2013, collectively consist of 90 funds. Correspondence may be sent to directors and officers c/o Hartford Mutual Funds, P.O. Box 2999, Hartford, Connecticut 06104-2999, except that correspondence to Mr. Annoni, Mr. Dressen, Ms. Fagely and Ms. Quade may be sent to 500 Bielenberg Drive, Woodbury, Minnesota 55125 and correspondence to Mr. Davey and Mr. Melcher may be sent to 5 Radnor Corporate Center, Suite 300, 100 Matsonford Road, Radnor, Pennsylvania 19087.
The table below sets forth, for each director and officer, his or her name, year of birth, current position with the Company and date first elected or appointed to Hartford Series Fund, Inc. (“HSF”), and Hartford HLS Series Fund II, Inc. (“HSF2”), principal occupation, and, for directors, other directorships held. The Fund’s statement of additional information contains further information on the directors and is available free of charge by calling 1-800-862-6668 or writing to Hartford HLS Funds, c/o Hartford Life Insurance Company, Hartford Life and Annuity Insurance Company, P.O. Box 14293, Lexington, KY 40512-4293.
Information on the aggregate remuneration paid to the directors of the Company can be found in the Statement of Operations herein. The Fund pays to The Hartford a portion of the Chief Compliance Officer’s compensation, but does not pay salaries or compensation to any of their other officers or directors who are employed by The Hartford.
Non-Interested Directors
Lynn S. Birdsong (1946) Director since 2003, Co-Chairman of the Investment Committee
Mr. Birdsong is a private investor. Mr. Birdsong currently serves as a Director of the Sovereign High Yield Investment Company (April 2010 to current). Mr. Birdsong currently serves as an Independent Director of Nomura Partners Funds, Inc. (formerly, The Japan Fund) (March 2003 to current). From 1979 to 2002, Mr. Birdsong was a managing director of Zurich Scudder Investments, an investment management firm. During his employment with Scudder, Mr. Birdsong was an Interested Director of The Japan Fund. Since 1981, Mr. Birdsong has been a partner in Birdsong Company, an advertising specialty firm.
Robert M. Gavin, Jr. (1940) Director since 2002 (HSF) and 1986 (HSF2), Chairman of the Board since 2004
Dr. Gavin is an educational consultant. Prior to September 1, 2001, he was President of Cranbrook Education Community and prior to July 1996, he was President of Macalester College, St. Paul, Minnesota.
Duane E. Hill (1945) Director since 2001 (HSF) and 2002 (HSF2), Chairman of the Nominating Committee
Mr. Hill is Partner of TSG Ventures L.P., a private equity investment company. Mr. Hill is a former partner of TSG Capital Group, a private equity investment firm that served as sponsor and lead investor in leveraged buyouts of middle market companies.
Sandra S. Jaffee (1941) Director since 2005
Ms. Jaffee is the founder and Chief Executive Officer of a private company, Homeworks Concierge, LLC, which provides residential property management services in Westchester County, New York (January 2012 to present). Ms. Jaffee served as Chairman (2008 to 2009) and Chief Executive Officer of Fortent (formerly Searchspace Group), a leading provider of compliance/regulatory technology to financial institutions from August 2005 to August 2009. Ms. Jaffee currently serves as a member of the Board of Directors of Broadridge Financial Solutions as well as a Trustee of Muhlenberg College.
William P. Johnston (1944) Director since 2005, Chairman of the Compliance Committee
In February 2008, Mr. Johnston was elected to the Board of Directors of HCR-ManorCare, Inc. In August 2007, Mr. Johnston was elected to the Board of Directors of LifeCare Holdings, Inc. In July 2006, Mr. Johnston was elected to the Board of Directors of MultiPlan, Inc. and served as a director (July 2006 to August 2010). In June 2006, Mr. Johnston was appointed as Senior Advisor to The Carlyle Group, a global private equity and alternative asset investment firm. In May 2006, Mr. Johnston was elected to the Supervisory Board of Fresenius Medical Care AG & Co. KGaA, after its acquisition of Renal Care Group, Inc. in March 2006.
Phillip O. Peterson (1944) Director since 2002 (HSF) and 2000 (HSF2), Chairman of the Audit Committee
Mr. Peterson is a mutual fund industry consultant. He was a partner of KPMG LLP (an accounting firm) until July 1999. Mr. Peterson joined William Blair Funds in February 2007 as a member of the Board of Trustees. Mr. Peterson also joined the Board of Trustees of Symetra Variable Mutual Funds Trust as a trustee in February 2012.
| 32 |
Lemma W. Senbet (1946) Director since 2005
Dr. Senbet is the William E. Mayer Chair Professor of Finance and Director, Center for Financial Policy, at the University of Maryland, Robert H. Smith School of Business. He was chair of the Finance Department from 1998 to 2006. Previously he was a chaired professor of finance at the University of Wisconsin-Madison. Also, he was director of the Fortis Funds from March 2000 to July 2002. Dr. Senbet served the finance profession in various capacities, including as director of the American Finance Association and President of the Western Finance Association. In 2006, Dr. Senbet was inducted Fellow of Financial Management Association International for his career-long distinguished scholarship and professional service.
Interested Directors and Officers
James E. Davey (1964) Director since 2012, President and Chief Executive Officer since 2010
Mr. Davey serves as Executive Vice President of Hartford Life Insurance Company (“HLIC”) and The Hartford Financial Services Group, Inc. Additionally, Mr. Davey serves as Chairman of the Board and Manager of Hartford Funds Distributors, LLC (“HFD”) and Hartford Administrative Services Company (“HASCO”). Mr. Davey also serves as Manager, President and Chairman of the Board for Hartford Funds Management Company, LLC (“HFMC”). Mr. Davey joined The Hartford in 2002.
Lowndes A. Smith (1939) Director since 1996 (HSF) and 2002 (HSF2), Co-Chairman of the Investment Committee
Mr. Smith served as Vice Chairman of The Hartford from February 1997 to January 2002, as President and Chief Executive Officer of Hartford Life, Inc. from February 1997 to January 2002, and as President and Chief Operating Officer of The Hartford Life Insurance Companies from January 1989 to January 2002. Mr. Smith serves as a Director of White Mountains Insurance Group, Ltd., One Beacon Insurance and Symetra Financial and as Managing Director of Whittington Gray Associates.
Other Officers
Mark A. Annoni (1964) Vice President, Controller and Treasurer since 2012
Mr. Annoni serves as the Assistant Vice President of HLIC (February 2004 to present). Mr. Annoni joined The Hartford in April 2001 as part of The Hartford’s acquisition of Fortis Financial Group (“Fortis”). Prior to joining The Hartford, Mr. Annoni served as Manager of Mutual Fund Accounting at Fortis (July 1997 to April 2001).
Michael R. Dressen (1963) AML Compliance Officer since 2011
Mr. Dressen currently serves as Assistant Vice President of HLIC. He also serves as Chief Compliance Officer and AML Compliance Officer of HASCO and as AML Officer of HFD. Mr. Dressen joined The Hartford in 2005 from State Farm Insurance Companies where he held various positions related to mutual funds, variable products, and property casualty insurance.
Tamara L. Fagely (1958) Vice President since 2002 (HSF) and 1993 (HSF2)
Currently, Ms. Fagely is President and a Director of HASCO, Chief Administrative Officer and Manager of HFMC and a Vice President of HLIC. Ms. Fagely served as a Vice President of HASCO (1998-2013) and Chief Financial Officer of HASCO (2006-2013). She served as Assistant Vice President of HLIC from December 2001 through March 2005. In addition, Ms. Fagely is Manager and Chief Operating Officer of HFD.
Edward P. Macdonald (1967) Vice President, Secretary and Chief Legal Officer since 2005
Mr. Macdonald serves as Vice President of HLIC and Vice President, Chief Legal Officer and Secretary of HFD and HASCO. Mr. Macdonald also serves as Manager, Vice President, Chief Legal Officer and Secretary of HFMC. Mr. Macdonald joined The Hartford in 2005.
Joseph G. Melcher (1973) Vice President and Chief Compliance Officer since 2013(1)
Mr. Melcher currently serves as Vice President of HFMC and HFD. Mr. Melcher joined The Hartford in 2012 from Touchstone Investments, a member of the Western & Southern Financial Group, where he held the position of Vice President and Chief Compliance Officer from 2010 through 2012 and Assistant Vice President, Compliance from 2005 to 2010.
(1) Mr. Melcher was named Vice President and Chief Compliance Officer of HSF and HSF2 on February 6, 2013. Prior to February 6, 2013, Colleen Pernerewski served as Chief Compliance Officer of HSF and HSF2.
Vernon J. Meyer (1964) Vice President since 2006
Mr. Meyer serves as Senior Vice President of HLIC. He also serves as Senior Vice President of HFMC and HFD. Mr. Meyer joined The Hartford in 2004.
| 33 |
| Hartford High Yield HLS Fund |
| Directors and Officers (Unaudited) – (continued) |
Laura S. Quade (1969) Vice President since 2012
Ms. Quade currently serves as Vice President of HASCO and is a Director of Mutual Fund Service Operations. She also serves as Director, Enterprise Operations of HFD and HLIC. Ms. Quade joined The Hartford in 2001 as part of The Hartford’s acquisition of Fortis.
Elizabeth L. Schroeder (1966) Vice President since 2010(2)
Ms. Schroeder currently serves as Assistant Vice President of HLIC. Ms. Schroeder joined HLIC in 1991. She is also an Assistant Vice President of HFMC and HASCO.
(2) Ms. Schroeder served as Vice President of HSF and HSF2 until August 7, 2013.
Martin Swanson (1962) Vice President since 2010
Mr. Swanson is a Vice President of HLIC. Mr. Swanson also serves as Chief Marketing Officer for HFD. Prior to joining HLIC in 1998, Mr. Swanson was a Vice President at PaineWebber, Inc.
HOW TO OBTAIN A COPY OF THE FUND’S PROXY VOTING POLICIES AND VOTING RECORDS (UNAUDITED)
A description of the policies and procedures that the Fund uses to determine how to vote proxies relating to portfolio securities and information about how the Fund voted proxies relating to portfolio securities during the most recent twelve-month period ended June 30 are available (1) without charge, upon request, by calling 800-862-6668 and (2) on the SEC’s website at http://www.sec.gov.
QUARTERLY PORTFOLIO HOLDINGS INFORMATION (UNAUDITED)
The Fund files a complete schedule of portfolio holdings with the SEC for the first and third quarters of each fiscal year on Form N-Q. The Fund’s Forms are available (1) without charge, upon request, by calling 800-862-6668 and (2) on the SEC’s website at http://www.sec.gov. The Form N-Q may be reviewed and copied at the SEC’s Public Reference Room in Washington, DC. Information on the operation of the Public Reference Room may be obtained by calling 1-800-SEC-0330.
| 34 |
| Hartford High Yield HLS Fund |
| Expense Example (Unaudited) |
Your Fund's Expenses
As a shareholder of the Fund, you incur two types of costs: (1) transaction costs and (2) ongoing costs including investment management fees, distribution fees, if any, and other fund expenses. This example is intended to help you understand your ongoing costs (in dollars) of investing in the Fund and to compare these costs with the ongoing costs of investing in other mutual funds. The example is based on an investment of $1,000 invested at the beginning of the period and held for the period of December 31, 2012 through June 30, 2013.
Actual Expenses
The first set of columns of the table below provides information about actual account values and actual expenses. You may use the information in this column, together with the amount you invested, to estimate the expenses that you paid over the period. Simply divide your account value by $1,000 (for example, an $8,600 account value divided by $1,000 = 8.6), then multiply the result by the number in the line under the heading entitled “Expenses Paid During Period” to estimate the expenses you paid on your account during this period.
Hypothetical Example for Comparison Purposes
The second set of columns of the table below provides information about hypothetical account values and hypothetical expenses based on the Fund’s actual expense ratio and an assumed rate of return of 5% per year before expenses, which is not the Fund’s actual return. The hypothetical account values and expenses may not be used to estimate the actual ending account balance or expenses you paid for the period. You may use this information to compare the ongoing costs of investing in the Fund and other funds. To do so, compare this 5% hypothetical example with the 5% hypothetical examples that appear in the shareholder reports of the other funds.
Please note that the expenses shown in the table are meant to highlight your ongoing costs only and do not reflect any transactional costs, such as sales charges (loads) and CDSC. Therefore, the second set of columns of the table is useful in comparing ongoing costs only, and will not help you determine the relative total costs of owning different funds. In addition, if these transactional costs were included, your costs would be higher. Expenses are equal to the Fund's annualized expense ratios multiplied by average account value over the period, multiplied by 181/365 (to reflect the one-half year period).
| Actual return | Hypothetical (5% return before expenses) | |||||||||||||||||||||||||||||||||||
| Beginning Account Value December 31, 2012 | Ending Account Value June 30, 2013 | Expenses paid during the period December 31, 2012 through June 30, 2013 | Beginning Account Value December 31, 2012 | Ending Account Value June 30, 2013 | Expenses paid during the period December 31, 2012 through June 30, 2013 | Annualized expense ratio | Days in the current 1/2 year | Days in the full year | ||||||||||||||||||||||||||||
| Class IA | $ | 1,000.00 | $ | 1,009.80 | $ | 3.74 | $ | 1,000.00 | $ | 1,021.08 | $ | 3.76 | 0.75 | % | 181 | 365 | ||||||||||||||||||||
| Class IB | $ | 1,000.00 | $ | 1,008.60 | $ | 4.98 | $ | 1,000.00 | $ | 1,019.84 | $ | 5.01 | 1.00 | % | 181 | 365 | ||||||||||||||||||||
| 35 |
| Hartford High Yield HLS Fund |
| Principal Risks (Unaudited) |
The principal risks of investing in the Fund are described below.
Market, Selection, and Strategy Risk: The Fund’s share price may fluctuate due to market risk and/or security selections that may underperform the market or relevant benchmarks. If the sub-adviser’s investment strategy does not perform as expected, the Fund could underperform its peers or lose money. There is no guarantee the Fund will achieve its stated objective.
Junk Bond Risk: Investments in junk bonds involve greater risk of price volatility, illiquidity, and default than higher-rated debt securities.
Fixed Income Risk: The Fund is subject to interest rate risk (the risk that the value of an investment decreases when interest rates rise) and credit risk (the risk that the issuing company of a security is unable to pay interest and principal when due) and call risk (the risk that an investment may be redeemed early).
Foreign Investment Risk: Foreign investments can be riskier than U.S. investments. Potential risks include currency risk that may result from unfavorable exchange rates, liquidity risk if decreased demand for a security makes it difficult to sell at the desired price, and risks that stem from substantially lower trading volume on foreign markets.
Derivatives Risk: Investments in derivatives can be volatile. Potential risks include currency risk, leverage risk (the risk that small market movements may result in large changes in the value of an investment), liquidity risk, index risk, pricing risk, and counterparty risk (the risk that the counterparty may be unwilling or unable to honor its obligations).
Active Trading Risk: Actively trading investments may result in higher costs (thus affecting performance).
| 36 |
HARTFORD HLS FUNDS
c/o The Hartford Wealth Management - Global Annuities
P.O. Box 14293
Lexington, KY 40512-4293
HARTFORDFUNDS
hartfordfunds.com
Hartford Series Fund, Inc. is underwritten and distributed by Hartford Funds Distributors, LLC.
Hartford Series Fund, Inc. inception dates range from 1977 to date. Hartford Series Fund, Inc. is not a subsidiary of The Hartford Financial Services Group, Inc. ("The Hartford") but is underwritten, distributed by and advised by subsidiaries of The Hartford. Investments in Hartford Series Fund, Inc. are not guaranteed by The Hartford or any other entity.
You should carefully consider investment objectives, risks, and charges and expenses of Hartford HLS Funds before investing. This and other information can be found in the Fund’s prospectus or summary prospectus, which can be obtained by calling 800-862-6668. Please read them carefully before you invest or send money.
HLSSAR-HY13 8-13 113544-1 Printed in U.S.A ©2013 The Hartford, Hartford, CT 06115
HARTFORDFUNDS
| HARTFORD INDEX HLS FUND
2013 Semi Annual Report
|
A MESSAGE FROM THE PRESIDENT
Dear Fellow Shareholders:
I want to take this opportunity to say thank you for investing in the Hartford HLS Funds.
Market Review
During the first half of the year, stocks rose steadily. U.S. equities (as represented by the S&P 500 Index1) posted a strong gain of 10.61% during the first quarter, on their way to an all-time high. During the second quarter, investors persevered through volatility surrounding rumors of the rollback of the U.S. Federal Reserve’s quantitative easing (QE) program later this year, and the S&P 500 Index rose 2.91%. That brought the market’s rise to 13.82% for the first half of 2013. The rumors about QE’s end sent bond yields and mortgage rates upward, but that wasn’t enough to dissuade investors from pushing equities into positive territory.
Because of QE, some have expressed concerns regarding the recent market rally. But a more careful examination of economic data reveals a strong foundation. Consumer balance sheets have improved since the financial crisis, with consumer debt as a percentage of income falling steadily. Housing continued its dogged recovery, fueled by population growth and pent-up demand. In fact, it’s substantive economic improvements that have moved Federal Reserve Chairman Ben Bernanke to consider removing the “training wheels” of QE, which we think should be viewed as a vote of confidence in the U.S. economy going forward.
As the U.S. outlook continues to improve, concerns do remain in the global economy. Emerging markets have lagged due to social unrest and rising inflation. Slowing growth in China is clouding global growth forecasts, but it’s important to remember that China still boasts 7.5% annual GDP growth.
It’s important to stay abreast of domestic and international economic developments while balancing your individual investment goals. Meeting with your financial advisor on a regular basis to examine your current investment strategy can help you determine whether you are on the right track:
| • | Is your portfolio fully diversified with an appropriate mix of stocks and bonds? |
| • | Is your fixed-income portfolio positioned to take advantage of opportunities across the credit spectrum and fulfill your income needs? |
| • | Is your portfolio still in line with your risk tolerance and investment time horizon? |
Your financial professional can help you choose options within our fund family to navigate today’s markets with confidence.
Thank you again for investing with the Hartford HLS Funds.
James Davey
President
Hartford HLS Funds
1 The S&P 500 Index is a market capitalization-weighted price index composed of 500 widely held common stocks.
Table of Contents
This report is prepared for the general information of contract owners and qualified retirement plan participants. It is not an offer of contracts or of qualified retirement plans. It should not be used in connection with any offer, except in conjunction with the appropriate product prospectus which contains all pertinent information including the applicable sales, administrative and other charges.
The views expressed in the Fund’s Manager Discussion under ‘‘Why did the Fund perform this way?’’ and ‘‘What is the outlook?’’ are views of the Fund’s sub-adviser and portfolio management team through the end of the period and are subject to change based on market and other conditions. The Fund’s Manager Discussion is for informational purposes only and does not represent an offer, recommendation or solicitation to buy, hold or sell any security. The specific securities identified and described, if any, do not represent all of the securities purchased or sold and you should not assume that investments in the securities identified and discussed will be profitable.
| Hartford Index HLS Fund inception 05/01/1987 |
| (sub-advised by Hartford Investment Management Company) |
| Investment objective – Seeks to provide investment results which approximate the price and yield performance of publicly traded common stocks in the aggregate. |
Performance Overview 6/30/03 - 6/30/13
The chart above represents the hypothetical growth of a $10,000 investment in Class IA. Growth results in classes other than Class IA will vary from what is seen above due to differences in the expenses charged to those share classes.
Average Annual Total Returns (as of 6/30/13)
| 6 Month† | 1 Year | 5 Years | 10 Years | |||||||||||||
| Index IA | 13.64% | 20.20% | 6.72% | 6.96% | ||||||||||||
| Index IB | 13.48% | 19.88% | 6.46% | 6.70% | ||||||||||||
| S&P 500 Index | 13.82% | 20.58% | 7.00% | 7.29% | ||||||||||||
| † | Not Annualized |
PERFORMANCE DATA QUOTED REPRESENTS PAST PERFORMANCE AND DOES NOT GUARANTEE FUTURE RESULTS. The investment return and principal value of the investment will fluctuate so that investors’ shares, when redeemed, may be worth more or less than their original cost. Current performance may be lower or higher than the performance data quoted. To obtain performance data current to the most recent month-end, please visit our website www.hartfordfunds.com.
Total returns presented above were calculated using the Fund's net asset value available to shareholders for sale or redemption of Fund shares on June 30, 2013, which may exclude investment transactions as of this date. All share class returns assume the reinvestment of all distributions at net asset value and the deduction of all fund expenses.
S&P 500 Index is a market capitalization-weighted price index composed of 500 widely held common stocks.
You cannot invest directly in an index.
As of the Fund’s current prospectus dated May 1, 2013, the total annual operating expense ratios for Class IA and Class IB shares were 0.33% and 0.58%, respectively. Actual expenses may be higher. Please see the accompanying Financial Highlights for expense ratios for the six-month period ended June 30, 2013.
The chart and table do not reflect the deductions of taxes, sales charges or other fees which may be applied at the variable life insurance, variable annuity or qualified retirement plan product level. Any such additional sales charges or other fees or expenses would lower the contract’s or plan’s performance.
All investments are subject to risk including the possible loss of principal. For a discussion of the Fund’s risks, please see the Principal Risks section. For more detailed information on the risks associated with an investment in the Fund, please see the prospectus.
| 2 |
| Hartford Index HLS Fund |
| Manager Discussion |
| June 30, 2013 (Unaudited) |
| Portfolio Manager |
| Deane Gyllenhaal |
| Vice President |
How did the Fund perform?
The Class IA shares of the Hartford Index HLS Fund returned 13.64% for the six-month period ended June 30, 2013, underperforming its benchmark, the S&P 500 Index, which returned 13.82%. The Fund outperformed the 13.59% average return of the Variable Products-Underlying Funds Lipper S&P 500 Index Funds category, a group of funds with investment strategies similar to those of the Fund.
Why did the Fund perform this way?
By design, the Fund is managed to mimic the performance of the S&P 500 Index. Due to this approach, the Fund is expected to perform in line with the Index. However, we do not purchase the stock of our parent, The Hartford Financial Services Group, Inc. (HIG). This exposure to HIG is reallocated across the Life/Health, Property/Casualty and Multi-line Insurance industries. The performance of the Fund tends to marginally differ from the benchmark, primarily due to trading in futures contracts, index events, minimal cash exposure, and lack of exposure to HIG.
All ten of the sectors within the S&P 500 Index had positive returns during the first half of 2013. Health Care led the way up 20.3%. Consumer Discretionary and Financials followed, gaining 19.8% and 19.5%, respectively. The lowest performing sector was Materials, which was up 2.9%.
On the stock level, the best index performers for the quarter included Best Buy rallying 132.9%. Netflix and Micron Technology also finished with triple digit returns gaining 127.5% and 125.7%, respectively. Index laggards for the period included Cliff Natural Resources which fell 57.5% and Peabody Energy dropping 44.7%.
What is the outlook?
The equity market (as measured by the S&P 500 Index) markedly slowed its pace rising 2.9% during the second quarter after returning 10.6% during the first quarter of 2013. With year-over-year earnings growth of 4.5% during the first quarter and expectations for second quarter growth of around 3%, the market seems more aligned with fundamentals. However, as evidenced by the markets’ reaction in June to the Federal Reserve’s (Fed) hint of ending its bond buying, the market is walking on egg shells and still quite skeptical of fundamentals. Given these conditions, we see earnings and revenues growing next quarter at a tepid pace; slowly building confidence in the economic recovery. Much of the extreme skepticism in the market seems to have been released in the first quarter price to earnings multiple expansion and we believe that the market now seems to have a more “healthy” skepticism of fundamentals. The greatest risk we see to this scenario is a Fed policy change.
The Fund will continue to be invested in the securities comprising the S&P 500 Index, with a focus on risk control and efficient trading. Performance of the Fund is expected to mirror the return of the S&P 500 Index; however, there can be no assurance that the Fund’s investment performance will equal or approximate that of the S&P 500 Index.
Diversification by Industry
as of June 30, 2013
| Industry (Sector) | Percentage of Net Assets | |||
| Automobiles and Components (Consumer Discretionary) | 1.1 | % | ||
| Banks (Financials) | 3.0 | |||
| Capital Goods (Industrials) | 7.7 | |||
| Commercial and Professional Services (Industrials) | 0.6 | |||
| Consumer Durables and Apparel (Consumer Discretionary) | 1.2 | |||
| Consumer Services (Consumer Discretionary) | 1.8 | |||
| Diversified Financials (Financials) | 6.9 | |||
| Energy (Energy) | 10.4 | |||
| Food and Staples Retailing (Consumer Staples) | 2.4 | |||
| Food, Beverage and Tobacco (Consumer Staples) | 5.7 | |||
| Health Care Equipment and Services (Health Care) | 4.2 | |||
| Household and Personal Products (Consumer Staples) | 2.3 | |||
| Insurance (Financials) | 4.4 | |||
| Materials (Materials) | 3.2 | |||
| Media (Consumer Discretionary) | 3.8 | |||
| Pharmaceuticals, Biotechnology and Life Sciences (Health Care) | 8.4 | |||
| Real Estate (Financials) | 2.1 | |||
| Retailing (Consumer Discretionary) | 4.4 | |||
| Semiconductors and Semiconductor Equipment (Information Technology) | 2.1 | |||
| Software and Services (Information Technology) | 9.4 | |||
| Technology Hardware and Equipment (Information Technology) | 6.2 | |||
| Telecommunication Services (Services) | 2.8 | |||
| Transportation (Industrials) | 1.7 | |||
| Utilities (Utilities) | 3.3 | |||
| Short-Term Investments | 1.0 | |||
| Other Assets and Liabilities | (0.1 | ) | ||
| Total | 100.0 | % | ||
| 3 |
| Hartford Index HLS Fund |
| Schedule of Investments |
| June 30, 2013 (Unaudited) |
| (000’s Omitted) |
| Shares or Principal Amount | Market Value ╪ | |||||||
| COMMON STOCKS - 99.1% | ||||||||
| Automobiles and Components - 1.1% | ||||||||
| 9 | BorgWarner, Inc. ● | $ | 744 | |||||
| 22 | Delphi Automotive plc | 1,105 | ||||||
| 295 | Ford Motor Co. | 4,557 | ||||||
| 58 | General Motors Co. ● | 1,922 | ||||||
| 18 | Goodyear (The) Tire & Rubber Co. ● | 281 | ||||||
| 17 | Harley-Davidson, Inc. | 923 | ||||||
| 51 | Johnson Controls, Inc. | 1,838 | ||||||
| 11,370 | ||||||||
| Banks - 3.0% | ||||||||
| 53 | BB&T Corp. | 1,779 | ||||||
| 14 | Comerica, Inc. | 556 | ||||||
| 65 | Fifth Third Bancorp | 1,182 | ||||||
| 36 | Hudson City Bancorp, Inc. | 326 | ||||||
| 63 | Huntington Bancshares, Inc. | 495 | ||||||
| 69 | KeyCorp | 761 | ||||||
| 9 | M&T Bank Corp. | 1,027 | ||||||
| 25 | People's United Financial, Inc. | 379 | ||||||
| 40 | PNC Financial Services Group, Inc. | 2,890 | ||||||
| 106 | Regions Financial Corp. | 1,009 | ||||||
| 40 | SunTrust Banks, Inc. | 1,275 | ||||||
| 139 | US Bancorp | 5,009 | ||||||
| 369 | Wells Fargo & Co. | 15,228 | ||||||
| 14 | Zions Bancorporation | 399 | ||||||
| 32,315 | ||||||||
| Capital Goods - 7.7% | ||||||||
| 48 | 3M Co. | 5,205 | ||||||
| 51 | Boeing Co. | 5,240 | ||||||
| 49 | Caterpillar, Inc. | 4,066 | ||||||
| 13 | Cummins, Inc. | 1,432 | ||||||
| 44 | Danaher Corp. | 2,759 | ||||||
| 29 | Deere & Co. | 2,360 | ||||||
| 13 | Dover Corp. | 996 | ||||||
| 35 | Eaton Corp. plc | 2,330 | ||||||
| 54 | Emerson Electric Co. | 2,937 | ||||||
| 20 | Fastenal Co. | 928 | ||||||
| 11 | Flowserve Corp. | 587 | ||||||
| 12 | Fluor Corp. | 726 | ||||||
| 25 | General Dynamics Corp. | 1,946 | ||||||
| 775 | General Electric Co. | 17,964 | ||||||
| 59 | Honeywell International, Inc. | 4,679 | ||||||
| 31 | Illinois Tool Works, Inc. | 2,147 | ||||||
| 21 | Ingersoll-Rand plc | 1,158 | ||||||
| 10 | Jacobs Engineering Group, Inc. ● | 538 | ||||||
| 8 | Joy Global, Inc. | 389 | ||||||
| 7 | L-3 Communications Holdings, Inc. | 576 | ||||||
| 20 | Lockheed Martin Corp. | 2,163 | ||||||
| 27 | Masco Corp. | 520 | ||||||
| 18 | Northrop Grumman Corp. | 1,462 | ||||||
| 27 | PACCAR, Inc. | 1,423 | ||||||
| 8 | Pall Corp. | 556 | ||||||
| 11 | Parker-Hannifin Corp. | 1,067 | ||||||
| 15 | Pentair Ltd. | 884 | ||||||
| 11 | Precision Castparts Corp. | 2,475 | ||||||
| 16 | Quanta Services, Inc. ● | 422 | ||||||
| 24 | Raytheon Co. | 1,611 | ||||||
| 10 | Rockwell Automation, Inc. | 871 | ||||||
| 10 | Rockwell Collins, Inc. | 646 | ||||||
| 7 | Roper Industries, Inc. | 923 | ||||||
| 4 | Snap-On, Inc. | 388 | ||||||
| 12 | Stanley Black & Decker, Inc. | 941 | ||||||
| 21 | Textron, Inc. | 541 | ||||||
| 63 | United Technologies Corp. | 5,889 | ||||||
| 5 | W.W. Grainger, Inc. | 1,139 | ||||||
| 14 | Xylem, Inc. | 373 | ||||||
| 83,257 | ||||||||
| Commercial and Professional Services - 0.6% | ||||||||
| 16 | ADT (The) Corp. | 652 | ||||||
| 7 | Avery Dennison Corp. | 319 | ||||||
| 8 | Cintas Corp. | 354 | ||||||
| 3 | Dun & Bradstreet Corp. | 288 | ||||||
| 9 | Equifax, Inc. ● | 532 | ||||||
| 13 | Iron Mountain, Inc. | 335 | ||||||
| 15 | Pitney Bowes, Inc. | 222 | ||||||
| 22 | Republic Services, Inc. | 756 | ||||||
| 10 | Robert Half International, Inc. | 347 | ||||||
| 6 | Stericycle, Inc. ● | 711 | ||||||
| 35 | Tyco International Ltd. | 1,144 | ||||||
| 33 | Waste Management, Inc. | 1,326 | ||||||
| 6,986 | ||||||||
| Consumer Durables and Apparel - 1.2% | ||||||||
| 21 | Coach, Inc. | 1,202 | ||||||
| 21 | D.R. Horton, Inc. | 446 | ||||||
| 4 | Fossil Group, Inc. ● | 413 | ||||||
| 8 | Garmin Ltd. | 297 | ||||||
| 5 | Harman International Industries, Inc. | 274 | ||||||
| 9 | Hasbro, Inc. | 387 | ||||||
| 11 | Leggett & Platt, Inc. | 331 | ||||||
| 12 | Lennar Corp. | 448 | ||||||
| 26 | Mattel, Inc. | 1,173 | ||||||
| 22 | Newell Rubbermaid, Inc. | 566 | ||||||
| 54 | NIKE, Inc. Class B | 3,455 | ||||||
| 26 | Pulte Group, Inc. ● | 485 | ||||||
| 6 | PVH Corp. | 763 | ||||||
| 5 | Ralph Lauren Corp. | 788 | ||||||
| 7 | V.F. Corp. | 1,259 | ||||||
| 6 | Whirlpool Corp. | 682 | ||||||
| 12,969 | ||||||||
| Consumer Services - 1.8% | ||||||||
| 33 | Carnival Corp. | 1,141 | ||||||
| 2 | Chipotle Mexican Grill, Inc. ● | 860 | ||||||
| 10 | Darden Restaurants, Inc. | 492 | ||||||
| 20 | H & R Block, Inc. | 567 | ||||||
| 20 | International Game Technology | 326 | ||||||
| 18 | Marriott International, Inc. Class A | 726 | ||||||
| 75 | McDonald's Corp. | 7,433 | ||||||
| 56 | Starbucks Corp. | 3,676 | ||||||
| 15 | Starwood Hotels & Resorts, Inc. | 921 | ||||||
| 10 | Wyndham Worldwide Corp. | 583 | ||||||
| 6 | Wynn Resorts Ltd. | 765 | ||||||
| 34 | Yum! Brands, Inc. | 2,338 | ||||||
| 19,828 | ||||||||
| Diversified Financials - 6.9% | ||||||||
| 72 | American Express Co. | 5,351 | ||||||
| 15 | Ameriprise Financial, Inc. | 1,225 | ||||||
| 808 | Bank of America Corp. | 10,386 | ||||||
| 87 | Bank of New York Mellon Corp. | 2,440 | ||||||
| 9 | BlackRock, Inc. | 2,393 | ||||||
| 44 | Capital One Financial Corp. | 2,747 | ||||||
The accompanying notes are an integral part of these financial statements.
| 4 |
| Shares or Principal Amount | Market Value ╪ | |||||||
| COMMON STOCKS - 99.1% - (continued) | ||||||||
| Diversified Financials - 6.9% - (continued) | ||||||||
| 82 | Charles Schwab Corp. | $ | 1,750 | |||||
| 228 | Citigroup, Inc. | 10,937 | ||||||
| 23 | CME Group, Inc. | 1,747 | ||||||
| 37 | Discover Financial Services, Inc. | 1,749 | ||||||
| 22 | E*Trade Financial Corp. ● | 272 | ||||||
| 10 | Franklin Resources, Inc. | 1,409 | ||||||
| 32 | Goldman Sachs Group, Inc. | 4,878 | ||||||
| 5 | IntercontinentalExchange, Inc. ● | 974 | ||||||
| 33 | Invesco Ltd. | 1,058 | ||||||
| 283 | JP Morgan Chase & Co. | 14,945 | ||||||
| 8 | Legg Mason, Inc. | 260 | ||||||
| 22 | Leucadia National Corp. | 580 | ||||||
| 15 | Moody's Corp. | 884 | ||||||
| 103 | Morgan Stanley | 2,511 | ||||||
| 9 | Nasdaq OMX Group, Inc. | 290 | ||||||
| 16 | Northern Trust Corp. | 945 | ||||||
| 18 | NYSE Euronext | 753 | ||||||
| 33 | SLM Corp. | 760 | ||||||
| 34 | State Street Corp. | 2,225 | ||||||
| 19 | T. Rowe Price Group, Inc. | 1,420 | ||||||
| 74,889 | ||||||||
| Energy - 10.4% | ||||||||
| 38 | Anadarko Petroleum Corp. | 3,224 | ||||||
| 29 | Apache Corp. | 2,461 | ||||||
| 33 | Baker Hughes, Inc. | 1,528 | ||||||
| 16 | Cabot Oil & Gas Corp. | 1,121 | ||||||
| 19 | Cameron International Corp. ● | 1,134 | ||||||
| 39 | Chesapeake Energy Corp. | 793 | ||||||
| 145 | Chevron Corp. | 17,191 | ||||||
| 92 | ConocoPhillips Holding Co. | 5,543 | ||||||
| 17 | Consol Energy, Inc. | 466 | ||||||
| 28 | Denbury Resources, Inc. ● | 485 | ||||||
| 28 | Devon Energy Corp. | 1,466 | ||||||
| 5 | Diamond Offshore Drilling, Inc. | 360 | ||||||
| 18 | Ensco plc | 1,017 | ||||||
| 20 | EOG Resources, Inc. | 2,690 | ||||||
| 11 | EQT Corp. | 892 | ||||||
| 333 | Exxon Mobil Corp. | 30,098 | ||||||
| 18 | FMC Technologies, Inc. ● | 991 | ||||||
| 70 | Halliburton Co. | 2,912 | ||||||
| 8 | Helmerich & Payne, Inc. | 499 | ||||||
| 22 | Hess Corp. | 1,486 | ||||||
| 47 | Kinder Morgan, Inc. | 1,805 | ||||||
| 53 | Marathon Oil Corp. | 1,837 | ||||||
| 24 | Marathon Petroleum Corp. | 1,726 | ||||||
| 14 | Murphy Oil Corp. | 826 | ||||||
| 22 | Nabors Industries Ltd. | 337 | ||||||
| 32 | National Oilwell Varco, Inc. | 2,207 | ||||||
| 10 | Newfield Exploration Co. ● | 242 | ||||||
| 19 | Noble Corp. | 714 | ||||||
| 27 | Noble Energy, Inc. | 1,616 | ||||||
| 60 | Occidental Petroleum Corp. | 5,387 | ||||||
| 20 | Peabody Energy Corp. | 296 | ||||||
| 46 | Phillips 66 | 2,734 | ||||||
| 10 | Pioneer Natural Resources Co. | 1,482 | ||||||
| 13 | QEP Resources, Inc. | 373 | ||||||
| 12 | Range Resources Corp. | 944 | ||||||
| 9 | Rowan Cos. plc Class A ● | 317 | ||||||
| 100 | Schlumberger Ltd. | 7,135 | ||||||
| 26 | Southwestern Energy Co. ● | 963 | ||||||
| 50 | Spectra Energy Corp. | 1,729 | ||||||
| 10 | Tesoro Corp. | 532 | ||||||
| 41 | Valero Energy Corp. | 1,422 | ||||||
| 51 | Williams Cos., Inc. | 1,661 | ||||||
| 15 | WPX Energy, Inc. ● | 284 | ||||||
| 112,926 | ||||||||
| Food and Staples Retailing - 2.4% | ||||||||
| 33 | Costco Wholesale Corp. | 3,614 | ||||||
| 92 | CVS Caremark Corp. | 5,246 | ||||||
| 39 | Kroger (The) Co. | 1,346 | ||||||
| 18 | Safeway, Inc. | 427 | ||||||
| 44 | Sysco Corp. | 1,520 | ||||||
| 65 | Walgreen Co. | 2,853 | ||||||
| 123 | Wal-Mart Stores, Inc. | 9,145 | ||||||
| 26 | Whole Foods Market, Inc. | 1,329 | ||||||
| 25,480 | ||||||||
| Food, Beverage and Tobacco - 5.7% | ||||||||
| 150 | Altria Group, Inc. | 5,266 | ||||||
| 49 | Archer-Daniels Midland Co. | 1,674 | ||||||
| 12 | Beam, Inc. | 760 | ||||||
| 11 | Brown-Forman Corp. | 769 | ||||||
| 13 | Campbell Soup Co. | 600 | ||||||
| 287 | Coca-Cola Co. | 11,507 | ||||||
| 19 | Coca-Cola Enterprises, Inc. | 677 | ||||||
| 31 | ConAgra Foods, Inc. | 1,089 | ||||||
| 12 | Constellation Brands, Inc. Class A ● | 599 | ||||||
| 15 | Dr. Pepper Snapple Group | 703 | ||||||
| 48 | General Mills, Inc. | 2,346 | ||||||
| 11 | Hershey Co. | 1,002 | ||||||
| 10 | Hormel Foods Corp. | 392 | ||||||
| 8 | J.M. Smucker Co. | 831 | ||||||
| 19 | Kellogg Co. | 1,224 | ||||||
| 45 | Kraft Foods Group, Inc. | 2,489 | ||||||
| 28 | Lorillard, Inc. | 1,236 | ||||||
| 10 | McCormick & Co., Inc. | 698 | ||||||
| 15 | Mead Johnson Nutrition Co. | 1,201 | ||||||
| 12 | Molson Coors Brewing Co. | 564 | ||||||
| 134 | Mondelez International, Inc. | 3,812 | ||||||
| 11 | Monster Beverage Corp. ● | 656 | ||||||
| 116 | PepsiCo, Inc. | 9,472 | ||||||
| 122 | Philip Morris International, Inc. | 10,609 | ||||||
| 24 | Reynolds American, Inc. | 1,152 | ||||||
| 21 | Tyson Foods, Inc. Class A | 547 | ||||||
| 61,875 | ||||||||
| Health Care Equipment and Services - 4.2% | ||||||||
| 117 | Abbott Laboratories | 4,072 | ||||||
| 28 | Aetna, Inc. | 1,797 | ||||||
| 17 | AmerisourceBergen Corp. | 966 | ||||||
| 6 | Bard (C.R.), Inc. | 610 | ||||||
| 41 | Baxter International, Inc. | 2,814 | ||||||
| 15 | Becton, Dickinson & Co. | 1,438 | ||||||
| 101 | Boston Scientific Corp. ● | 936 | ||||||
| 26 | Cardinal Health, Inc. | 1,210 | ||||||
| 16 | CareFusion Corp. ● | 608 | ||||||
| 11 | Cerner Corp. ● | 1,053 | ||||||
| 21 | CIGNA Corp. | 1,548 | ||||||
| 35 | Covidien plc | 2,216 | ||||||
| 6 | DaVita HealthCare Partners, Inc. ● | 763 | ||||||
| 11 | Dentsply International, Inc. | 440 | ||||||
The accompanying notes are an integral part of these financial statements.
| 5 |
| Hartford Index HLS Fund |
| Schedule of Investments – (continued) |
| June 30, 2013 (Unaudited) |
| (000’s Omitted) |
| Shares or Principal Amount | Market Value ╪ | |||||||
| COMMON STOCKS - 99.1% - (continued) | ||||||||
| Health Care Equipment and Services - 4.2% - (continued) | ||||||||
| 8 | Edwards Lifesciences Corp. ● | $ | 568 | |||||
| 61 | Express Scripts Holding Co. ● | 3,771 | ||||||
| 12 | Humana, Inc. | 1,000 | ||||||
| 3 | Intuitive Surgical, Inc. ● | 1,521 | ||||||
| 7 | Laboratory Corp. of America Holdings ● | 695 | ||||||
| 17 | McKesson Corp. | 1,943 | ||||||
| 76 | Medtronic, Inc. | 3,902 | ||||||
| 6 | Patterson Cos., Inc. | 235 | ||||||
| 12 | Quest Diagnostics, Inc. | 717 | ||||||
| 21 | St. Jude Medical, Inc. | 967 | ||||||
| 21 | Stryker Corp. | 1,390 | ||||||
| 8 | Tenet Healthcare Corp. ● | 358 | ||||||
| 76 | UnitedHealth Group, Inc. | 5,000 | ||||||
| 8 | Varian Medical Systems, Inc. ● | 550 | ||||||
| 23 | Wellpoint, Inc. | 1,842 | ||||||
| 13 | Zimmer Holdings, Inc. | 944 | ||||||
| 45,874 | ||||||||
| Household and Personal Products - 2.3% | ||||||||
| 32 | Avon Products, Inc. | 683 | ||||||
| 10 | Clorox Co. | 822 | ||||||
| 66 | Colgate-Palmolive Co. | 3,765 | ||||||
| 18 | Estee Lauder Co., Inc. | 1,185 | ||||||
| 29 | Kimberly-Clark Corp. | 2,802 | ||||||
| 205 | Procter & Gamble Co. | 15,809 | ||||||
| 25,066 | ||||||||
| Insurance - 4.4% | ||||||||
| 26 | ACE Ltd. | 2,309 | ||||||
| 37 | Aflac, Inc. | 2,138 | ||||||
| 36 | Allstate Corp. | 1,716 | ||||||
| 112 | American International Group, Inc. ● | 5,014 | ||||||
| 23 | Aon plc | 1,489 | ||||||
| 6 | Assurant, Inc. | 296 | ||||||
| 139 | Berkshire Hathaway, Inc. Class B ● | 15,518 | ||||||
| 20 | Chubb Corp. | 1,668 | ||||||
| 11 | Cincinnati Financial Corp. | 510 | ||||||
| 38 | Genworth Financial, Inc. ● | 428 | ||||||
| 21 | Lincoln National Corp. | 771 | ||||||
| 23 | Loews Corp. | 1,038 | ||||||
| 41 | Marsh & McLennan Cos., Inc. | 1,647 | ||||||
| 86 | MetLife, Inc. | 3,951 | ||||||
| 22 | Principal Financial Group, Inc. | 816 | ||||||
| 42 | Progressive Corp. | 1,071 | ||||||
| 37 | Prudential Financial, Inc. | 2,679 | ||||||
| 7 | Torchmark Corp. | 474 | ||||||
| 29 | Travelers Cos., Inc. | 2,286 | ||||||
| 21 | Unum Group | 618 | ||||||
| 22 | XL Group plc | 669 | ||||||
| 47,106 | ||||||||
| Materials - 3.2% | ||||||||
| 16 | Air Products & Chemicals, Inc. | 1,428 | ||||||
| 5 | Airgas, Inc. | 470 | ||||||
| 80 | Alcoa, Inc. | 627 | ||||||
| 8 | Allegheny Technologies, Inc. | 214 | ||||||
| 11 | Ball Corp. | 464 | ||||||
| 8 | Bemis Co., Inc. | 300 | ||||||
| 4 | CF Industries Holdings, Inc. | 756 | ||||||
| 11 | Cliff's Natural Resources, Inc. | 186 | ||||||
| 91 | Dow Chemical Co. | 2,916 | ||||||
| 69 | E.I. DuPont de Nemours & Co. | 3,622 | ||||||
| 12 | Eastman Chemical Co. | 813 | ||||||
| 20 | Ecolab, Inc. | 1,703 | ||||||
| 10 | FMC Corp. | 623 | ||||||
| 78 | Freeport-McMoRan Copper & Gold, Inc. | 2,148 | ||||||
| 6 | International Flavors & Fragrances, Inc. | 460 | ||||||
| 33 | International Paper Co. | 1,479 | ||||||
| 29 | LyondellBasell Industries Class A | 1,888 | ||||||
| 13 | MeadWestvaco Corp. | 451 | ||||||
| 40 | Monsanto Co. | 3,946 | ||||||
| 21 | Mosaic Co. | 1,114 | ||||||
| 37 | Newmont Mining Corp. | 1,116 | ||||||
| 24 | Nucor Corp. | 1,031 | ||||||
| 12 | Owens-Illinois, Inc. ● | 342 | ||||||
| 11 | PPG Industries, Inc. | 1,571 | ||||||
| 22 | Praxair, Inc. | 2,555 | ||||||
| 15 | Sealed Air Corp. | 350 | ||||||
| 6 | Sherwin-Williams Co. | 1,132 | ||||||
| 9 | Sigma-Aldrich Corp. | 728 | ||||||
| 11 | United States Steel Corp. | 190 | ||||||
| 10 | Vulcan Materials Co. | 473 | ||||||
| 35,096 | ||||||||
| Media - 3.8% | ||||||||
| 16 | Cablevision Systems Corp. | 273 | ||||||
| 43 | CBS Corp. Class B | 2,091 | ||||||
| 197 | Comcast Corp. Class A | 8,260 | ||||||
| 42 | DirecTV ● | 2,575 | ||||||
| 18 | Discovery Communications, Inc. ● | 1,418 | ||||||
| 17 | Gannett Co., Inc. | 418 | ||||||
| 32 | Interpublic Group of Cos., Inc. | 466 | ||||||
| 21 | McGraw Hill Financial, Inc. | 1,093 | ||||||
| 149 | News Corp. Class A | 4,862 | ||||||
| 19 | Omnicom Group, Inc. | 1,220 | ||||||
| 6 | Scripps Networks Interactive Class A | 428 | ||||||
| 22 | Time Warner Cable, Inc. | 2,451 | ||||||
| 70 | Time Warner, Inc. | 4,035 | ||||||
| 33 | Viacom, Inc. Class B | 2,275 | ||||||
| 135 | Walt Disney Co. | 8,520 | ||||||
| — | Washington Post Co. Class B | 165 | ||||||
| 40,550 | ||||||||
| Pharmaceuticals, Biotechnology and Life Sciences - 8.4% | ||||||||
| 119 | Abbvie Inc. | 4,905 | ||||||
| 10 | Actavis, Inc. ● | 1,211 | ||||||
| 26 | Agilent Technologies, Inc. | 1,105 | ||||||
| 15 | Alexion Pharmaceuticals, Inc. ● | 1,347 | ||||||
| 22 | Allergan, Inc. | 1,868 | ||||||
| 56 | Amgen, Inc. | 5,546 | ||||||
| 18 | Biogen Idec, Inc. ● | 3,822 | ||||||
| 123 | Bristol-Myers Squibb Co. | 5,501 | ||||||
| 31 | Celgene Corp. ● | 3,648 | ||||||
| 74 | Eli Lilly & Co. | 3,646 | ||||||
| 18 | Forest Laboratories, Inc. ● | 721 | ||||||
| 114 | Gilead Sciences, Inc. ● | 5,849 | ||||||
| 12 | Hospira, Inc. ● | 473 | ||||||
| 210 | Johnson & Johnson | 18,065 | ||||||
| 13 | Life Technologies Corp. ● | 956 | ||||||
| 226 | Merck & Co., Inc. | 10,506 | ||||||
| 29 | Mylan, Inc. ● | 886 | ||||||
| 8 | PerkinElmer, Inc. | 273 | ||||||
| 7 | Perrigo Co. | 796 | ||||||
| 500 | Pfizer, Inc. | 14,003 | ||||||
| 6 | Regeneron Pharmaceuticals, Inc. ● | 1,282 | ||||||
The accompanying notes are an integral part of these financial statements.
| 6 |
| Shares or Principal Amount | Market Value ╪ | |||||||
| COMMON STOCKS - 99.1% - (continued) | ||||||||
| Pharmaceuticals, Biotechnology and Life Sciences - 8.4% - (continued) | ||||||||
| 27 | Thermo Fisher Scientific, Inc. | $ | 2,276 | |||||
| 6 | Waters Corp. ● | 640 | ||||||
| 38 | Zoetis, Inc. | 1,158 | ||||||
| 90,483 | ||||||||
| Real Estate - 2.1% | ||||||||
| 30 | American Tower Corp. REIT | 2,171 | ||||||
| 11 | Apartment Investment & Management Co. | |||||||
| Class A REIT | 327 | |||||||
| 9 | AvalonBay Communities, Inc. REIT | 1,231 | ||||||
| 11 | Boston Properties, Inc. REIT | 1,202 | ||||||
| 23 | CBRE Group, Inc. ● | 531 | ||||||
| 24 | Equity Residential Properties Trust REIT | 1,396 | ||||||
| 34 | HCP, Inc. REIT | 1,547 | ||||||
| 21 | Health Care, Inc. REIT | 1,426 | ||||||
| 56 | Host Hotels & Resorts, Inc. REIT | 942 | ||||||
| 31 | Kimco Realty Corp. REIT | 655 | ||||||
| 10 | Macerich Co. REIT | 628 | ||||||
| 12 | Plum Creek Timber Co., Inc. REIT | 568 | ||||||
| 37 | ProLogis L.P. REIT | 1,409 | ||||||
| 11 | Public Storage REIT | 1,651 | ||||||
| 23 | Simon Property Group, Inc. REIT | 3,678 | ||||||
| 22 | Ventas, Inc. REIT | 1,523 | ||||||
| 13 | Vornado Realty Trust REIT | 1,057 | ||||||
| 43 | Weyerhaeuser Co. REIT | 1,233 | ||||||
| 23,175 | ||||||||
| Retailing - 4.4% | ||||||||
| 6 | Abercrombie & Fitch Co. Class A | 267 | ||||||
| 27 | Amazon.com, Inc. ● | 7,568 | ||||||
| 3 | AutoNation, Inc. ● | 124 | ||||||
| 3 | AutoZone, Inc. ● | 1,149 | ||||||
| 16 | Bed Bath & Beyond, Inc. ● | 1,159 | ||||||
| 20 | Best Buy Co., Inc. | 549 | ||||||
| 17 | CarMax, Inc. ● | 777 | ||||||
| 23 | Dollar General Corp. ● | 1,140 | ||||||
| 17 | Dollar Tree, Inc. ● | 854 | ||||||
| 7 | Expedia, Inc. | 422 | ||||||
| 7 | Family Dollar Stores, Inc. | 443 | ||||||
| 9 | GameStop Corp. Class A | 373 | ||||||
| 22 | Gap, Inc. | 907 | ||||||
| 12 | Genuine Parts Co. | 909 | ||||||
| 109 | Home Depot, Inc. | 8,480 | ||||||
| 11 | J. C. Penney Co., Inc. ● | 183 | ||||||
| 15 | Kohl's Corp. | 772 | ||||||
| 18 | L Brands Inc. | 887 | ||||||
| 80 | Lowe's Cos., Inc. | 3,287 | ||||||
| 29 | Macy's, Inc. | 1,378 | ||||||
| 4 | Netflix, Inc. ● | 884 | ||||||
| 11 | Nordstrom, Inc. | 668 | ||||||
| 8 | O'Reilly Automotive, Inc. ● | 935 | ||||||
| 8 | PetSmart, Inc. | 516 | ||||||
| 4 | Priceline.com, Inc. ● | 3,192 | ||||||
| 16 | Ross Stores, Inc. | 1,066 | ||||||
| 50 | Staples, Inc. | 788 | ||||||
| 48 | Target Corp. | 3,309 | ||||||
| 9 | Tiffany & Co. | 655 | ||||||
| 54 | TJX Cos., Inc. | 2,699 | ||||||
| 8 | TripAdvisor, Inc. ● | 501 | ||||||
| 8 | Urban Outfitters, Inc. ● | 330 | ||||||
| 47,171 | ||||||||
| Semiconductors and Semiconductor Equipment - 2.1% | ||||||||
| 46 | Advanced Micro Devices, Inc. ● | 186 | ||||||
| 24 | Altera Corp. | 793 | ||||||
| 23 | Analog Devices, Inc. | 1,038 | ||||||
| 90 | Applied Materials, Inc. | 1,341 | ||||||
| 39 | Broadcom Corp. Class A | 1,329 | ||||||
| 5 | First Solar, Inc. ● | 222 | ||||||
| 372 | Intel Corp. | 9,020 | ||||||
| 12 | KLA-Tencor Corp. | 691 | ||||||
| 12 | Lam Research Corp. ● | 540 | ||||||
| 17 | Linear Technology Corp. | 643 | ||||||
| 41 | LSI Corp. ● | 294 | ||||||
| 15 | Microchip Technology, Inc. | 550 | ||||||
| 77 | Micron Technology, Inc. ● | 1,106 | ||||||
| 43 | NVIDIA Corp. | 608 | ||||||
| 14 | Teradyne, Inc. ● | 252 | ||||||
| 83 | Texas Instruments, Inc. | 2,896 | ||||||
| 20 | Xilinx, Inc. | 781 | ||||||
| 22,290 | ||||||||
| Software and Services - 9.4% | ||||||||
| 49 | Accenture plc | 3,502 | ||||||
| 38 | Adobe Systems, Inc. ● | 1,715 | ||||||
| 13 | Akamai Technologies, Inc. ● | 567 | ||||||
| 17 | Autodesk, Inc. ● | 573 | ||||||
| 36 | Automatic Data Processing, Inc. | 2,504 | ||||||
| 10 | BMC Software, Inc. ● | 446 | ||||||
| 25 | CA, Inc. | 712 | ||||||
| 14 | Citrix Systems, Inc. ● | 845 | ||||||
| 23 | Cognizant Technology Solutions Corp. ● | 1,413 | ||||||
| 11 | Computer Sciences Corp. | 490 | ||||||
| 87 | eBay, Inc. ● | 4,524 | ||||||
| 23 | Electronic Arts, Inc. ● | 522 | ||||||
| 22 | Fidelity National Information Services, Inc. | 939 | ||||||
| 10 | Fiserv, Inc. ● | 871 | ||||||
| 20 | Google, Inc. ● | 17,702 | ||||||
| 78 | IBM Corp. | 14,922 | ||||||
| 21 | Intuit, Inc. | 1,274 | ||||||
| 8 | Mastercard, Inc. | 4,512 | ||||||
| 563 | Microsoft Corp. | 19,441 | ||||||
| 275 | Oracle Corp. | 8,454 | ||||||
| 24 | Paychex, Inc. | 886 | ||||||
| 14 | Red Hat, Inc. ● | 679 | ||||||
| 21 | SAIC, Inc. | 297 | ||||||
| 41 | Salesforce.com, Inc. ● | 1,551 | ||||||
| 52 | Symantec Corp. | 1,172 | ||||||
| 12 | Teradata Corp. ● | 616 | ||||||
| 12 | Total System Services, Inc. | 295 | ||||||
| 11 | VeriSign, Inc. ● | 506 | ||||||
| 38 | Visa, Inc. | 6,933 | ||||||
| 42 | Western Union Co. | 714 | ||||||
| 71 | Yahoo!, Inc. ● | 1,792 | ||||||
| 101,369 | ||||||||
| Technology Hardware and Equipment - 6.2% | ||||||||
| 12 | Amphenol Corp. Class A | 929 | ||||||
| 70 | Apple, Inc. | 27,853 | ||||||
| 400 | Cisco Systems, Inc. | 9,732 | ||||||
| 110 | Corning, Inc. | 1,572 | ||||||
The accompanying notes are an integral part of these financial statements.
| 7 |
| Hartford Index HLS Fund |
| Schedule of Investments – (continued) |
| June 30, 2013 (Unaudited) |
| (000’s Omitted) |
| Shares or Principal Amount | Market Value ╪ | |||||||||||
| COMMON STOCKS - 99.1% - (continued) | ||||||||||||
| Technology Hardware and Equipment - 6.2% - (continued) | ||||||||||||
| 110 | Dell, Inc. | $ | 1,467 | |||||||||
| 157 | EMC Corp. | 3,718 | ||||||||||
| 6 | F5 Networks, Inc. ● | 407 | ||||||||||
| 11 | FLIR Systems, Inc. | 288 | ||||||||||
| 8 | Harris Corp. | 404 | ||||||||||
| 145 | Hewlett-Packard Co. | 3,584 | ||||||||||
| 14 | Jabil Circuit, Inc. | 282 | ||||||||||
| 18 | JDS Uniphase Corp. ● | 255 | ||||||||||
| 38 | Juniper Networks, Inc. ● | 732 | ||||||||||
| 10 | Molex, Inc. | 305 | ||||||||||
| 20 | Motorola Solutions, Inc. | 1,173 | ||||||||||
| 27 | NetApp, Inc. ● | 1,019 | ||||||||||
| 129 | Qualcomm, Inc. | 7,905 | ||||||||||
| 18 | SanDisk Corp. ● | 1,115 | ||||||||||
| 24 | Seagate Technology plc | 1,071 | ||||||||||
| 31 | TE Connectivity Ltd. | 1,419 | ||||||||||
| 16 | Western Digital Corp. | 990 | ||||||||||
| 92 | Xerox Corp. | 835 | ||||||||||
| 67,055 | ||||||||||||
| Telecommunication Services - 2.8% | ||||||||||||
| 403 | AT&T, Inc. | 14,267 | ||||||||||
| 46 | CenturyLink, Inc. | 1,614 | ||||||||||
| 22 | Crown Castle International Corp. ● | 1,593 | ||||||||||
| 75 | Frontier Communications Co. | 303 | ||||||||||
| 226 | Sprint Nextel Corp. ● | 1,587 | ||||||||||
| 214 | Verizon Communications, Inc. | 10,787 | ||||||||||
| 44 | Windstream Corp. | 343 | ||||||||||
| 30,494 | ||||||||||||
| Transportation - 1.7% | ||||||||||||
| 12 | C.H. Robinson Worldwide, Inc. | 677 | ||||||||||
| 77 | CSX Corp. | 1,776 | ||||||||||
| 15 | Expeditors International of Washington, Inc. | 587 | ||||||||||
| 22 | FedEx Corp. | 2,173 | ||||||||||
| 8 | Kansas City Southern | 879 | ||||||||||
| 24 | Norfolk Southern Corp. | 1,713 | ||||||||||
| 4 | Ryder System, Inc. | 235 | ||||||||||
| 54 | Southwest Airlines Co. | 697 | ||||||||||
| 35 | Union Pacific Corp. | 5,390 | ||||||||||
| 53 | United Parcel Service, Inc. Class B | 4,604 | ||||||||||
| 18,731 | ||||||||||||
| Utilities - 3.3% | ||||||||||||
| 46 | AES (The) Corp. | 557 | ||||||||||
| 9 | AGL Resources, Inc. | 380 | ||||||||||
| 18 | Ameren Corp. | 626 | ||||||||||
| 36 | American Electric Power Co., Inc. | 1,630 | ||||||||||
| 32 | CenterPoint Energy, Inc. | 754 | ||||||||||
| 20 | CMS Energy Corp. | 540 | ||||||||||
| 22 | Consolidated Edison, Inc. | 1,278 | ||||||||||
| 43 | Dominion Resources, Inc. | 2,460 | ||||||||||
| 13 | DTE Energy Co. | 872 | ||||||||||
| 53 | Duke Energy Corp. | 3,566 | ||||||||||
| 24 | Edison International | 1,176 | ||||||||||
| 13 | Entergy Corp. | 930 | ||||||||||
| 64 | Exelon Corp. | 1,978 | ||||||||||
| 31 | FirstEnergy Corp. | 1,171 | ||||||||||
| 6 | Integrys Energy Group, Inc. | 349 | ||||||||||
| 32 | NextEra Energy, Inc. | 2,593 | ||||||||||
| 23 | NiSource, Inc. | 670 | ||||||||||
| 24 | Northeast Utilities | 992 | ||||||||||
| 24 | NRG Energy, Inc. | 644 | ||||||||||
| 15 | Oneok, Inc. | 638 | ||||||||||
| 19 | Pepco Holdings, Inc. | 375 | ||||||||||
| 33 | PG&E Corp. | 1,514 | ||||||||||
| 8 | Pinnacle West Capital Corp. | 457 | ||||||||||
| 44 | PPL Corp. | 1,343 | ||||||||||
| 38 | Public Service Enterprise Group, Inc. | 1,239 | ||||||||||
| 10 | SCANA Corp. | 514 | ||||||||||
| 17 | Sempra Energy | 1,383 | ||||||||||
| 65 | Southern Co. | 2,876 | ||||||||||
| 15 | TECO Energy, Inc. | 263 | ||||||||||
| 17 | Wisconsin Energy Corp. | 702 | ||||||||||
| 37 | Xcel Energy, Inc. | 1,057 | ||||||||||
| 35,527 | ||||||||||||
| Total common stocks | ||||||||||||
| (cost $752,841) | $ | 1,071,882 | ||||||||||
| Total long-term investments | ||||||||||||
| (cost $752,841) | $ | 1,071,882 | ||||||||||
| SHORT-TERM INVESTMENTS - 1.0% | ||||||||||||
| Repurchase Agreements - 1.0% | ||||||||||||
| UBS Securities, Inc. TriParty Repurchase Agreement (maturing on 07/01/2013 in the amount of $10,356, collateralized by U.S. Treasury Bill 0.11%, 2017, U.S. Treasury Bond 2.88%, 2043, U.S. Treasury Note 0.25% - 4.25%, 2014 - 2016, value of $10,563) | ||||||||||||
| $ | 10,356 | 0.10%, 6/28/2013 | $ | 10,356 | ||||||||
| U.S. Treasury Bills - 0.0% | ||||||||||||
| 850 | 0.03%, 08/01/2013 □○ | $ | 850 | |||||||||
| Total short-term investments | ||||||||||||
| (cost $11,206) | $ | 11,206 | ||||||||||
| Total investments | ||||||||||||
| (cost $764,047) ▲ | 100.1 | % | $ | 1,083,088 | ||||||||
| Other assets and liabilities | (0.1 | )% | (1,010 | ) | ||||||||
| Total net assets | 100.0 | % | $ | 1,082,078 | ||||||||
The accompanying notes are an integral part of these financial statements.
| 8 |
Note: Percentage of investments as shown is the ratio of the total market value to total net assets.
| ▲ | At June 30, 2013, the cost of securities for federal income tax purposes was $807,774 and the aggregate gross unrealized appreciation and depreciation based on that cost were: |
| Unrealized Appreciation | $ | 381,143 | ||
| Unrealized Depreciation | (105,829 | ) | ||
| Net Unrealized Appreciation | $ | 275,314 |
| ● | Non-income producing. |
| ○ | The interest rate disclosed for these securities represents the effective yield on the date of the acquisition. |
| □ | This security, or a portion of this security, is pledged as initial margin deposit and collateral for daily variation margin loss on open futures contracts held at June 30, 2013 as listed in the table below: |
| Futures Contracts Outstanding at June 30, 2013 | ||||||||||||||||||
| Description | Number of Contracts* | Expiration Date | Notional Amount | Market Value ╪ | Unrealized Appreciation/ (Depreciation) | |||||||||||||
| Long position contracts: | ||||||||||||||||||
| S&P 500 Futures | 31 | 09/19/2013 | $ | 12,408 | $ | 12,395 | $ | (13 | ) | |||||||||
* The number of contracts does not omit 000's.
| ╪ | See Significant Accounting Policies of accompanying Notes to Financial Statements regarding valuation of securities. |
| GLOSSARY: (abbreviations used in preceding Schedule of Investments) | ||
| Index Abbreviations: | ||
| S&P | Standard & Poors | |
| Other Abbreviations: | ||
| REIT | Real Estate Investment Trust | |
The accompanying notes are an integral part of these financial statements.
| 9 |
| Hartford Index HLS Fund |
| Investment Valuation Hierarchy Level Summary |
| June 30, 2013 (Unaudited) |
| (000’s Omitted) |
| Total | Level 1 ♦ | Level 2 ♦ | Level 3 | |||||||||||||
| Assets: | ||||||||||||||||
| Common Stocks ‡ | $ | 1,071,882 | $ | 1,071,882 | $ | – | $ | – | ||||||||
| Short-Term Investments | 11,206 | – | 11,206 | – | ||||||||||||
| Total | $ | 1,083,088 | $ | 1,071,882 | $ | 11,206 | $ | – | ||||||||
| Liabilities: | ||||||||||||||||
| Futures * | 13 | 13 | – | – | ||||||||||||
| Total | $ | 13 | $ | 13 | $ | – | $ | – | ||||||||
| ♦ | For the six-month period ended June 30, 2013, there were no transfers between Level 1 and Level 2. |
| ‡ | The Fund has all or primarily all of the equity securities categorized in a particular level. Refer to the Schedule of Investments for further industry breakout. |
| * | Derivative instruments not reflected in the Schedule of Investments are valued at the unrealized appreciation/depreciation on the investments. |
The accompanying notes are an integral part of these financial statements.
| 10 |
| Hartford Index HLS Fund |
| Statement of Assets and Liabilities |
| June 30, 2013 (Unaudited) |
| (000’s Omitted) |
| Assets: | ||||
| Investments in securities, at market value (cost $764,047) | $ | 1,083,088 | ||
| Cash | 1 | |||
| Receivables: | ||||
| Investment securities sold | 134 | |||
| Fund shares sold | 446 | |||
| Dividends and interest | 1,326 | |||
| Variation margin | 1 | |||
| Other assets | 3 | |||
| Total assets | 1,084,999 | |||
| Liabilities: | ||||
| Payables: | ||||
| Investment securities purchased | 63 | |||
| Fund shares redeemed | 2,675 | |||
| Variation margin | 59 | |||
| Investment management fees | 53 | |||
| Distribution fees | 15 | |||
| Accrued expenses | 56 | |||
| Total liabilities | 2,921 | |||
| Net assets | $ | 1,082,078 | ||
| Summary of Net Assets: | ||||
| Capital stock and paid-in-capital | $ | 791,631 | ||
| Undistributed net investment income | 9,995 | |||
| Accumulated net realized loss | (38,576 | ) | ||
| Unrealized appreciation of investments | 319,028 | |||
| Net assets | $ | 1,082,078 | ||
| Shares authorized | 4,000,000 | |||
| Par value | $ | 0.001 | ||
| Class IA: Net asset value per share | $ | 33.74 | ||
| Shares outstanding | 21,492 | |||
| Net assets | $ | 725,159 | ||
| Class IB: Net asset value per share | $ | 33.55 | ||
| Shares outstanding | 10,640 | |||
| Net assets | $ | 356,919 |
The accompanying notes are an integral part of these financial statements.
| 11 |
| Hartford Index HLS Fund |
| Statement of Operations |
| For the Six-Month Period Ended June 30, 2013 (Unaudited) |
| (000’s Omitted) |
| Investment Income: | ||||
| Dividends | $ | 11,350 | ||
| Interest | 4 | |||
| Less: Foreign tax withheld | (4 | ) | ||
| Total investment income, net | 11,350 | |||
| Expenses: | ||||
| Investment management fees | 1,597 | |||
| Distribution fees - Class IB | 425 | |||
| Custodian fees | 5 | |||
| Accounting services fees | 53 | |||
| Board of Directors' fees | 12 | |||
| Audit fees | 8 | |||
| Other expenses | 76 | |||
| Total expenses | 2,176 | |||
| Net Investment Income | 9,174 | |||
| Net Realized Gain on Investments and Other Financial Instruments: | ||||
| Net realized gain on investments | 6,625 | |||
| Net realized gain on futures | 1,494 | |||
| Net Realized Gain on Investments and Other Financial Instruments | 8,119 | |||
| Net Changes in Unrealized Appreciation of Investments and Other Financial Instruments: | ||||
| Net unrealized appreciation of investments | 116,756 | |||
| Net unrealized depreciation of futures | (12 | ) | ||
| Net Changes in Unrealized Appreciation of Investments and Other Financial Instruments | 116,744 | |||
| Net Gain on Investments and Other Financial Instruments | 124,863 | |||
| Net Increase in Net Assets Resulting from Operations | $ | 134,037 |
The accompanying notes are an integral part of these financial statements.
| 12 |
| Hartford Index HLS Fund |
| Statement of Changes in Net Assets |
| (000’s Omitted) |
| For the Six-Month Period Ended June 30, 2013 (Unaudited) | For the Year Ended December 31, 2012 | |||||||
| Operations: | ||||||||
| Net investment income | $ | 9,174 | $ | 18,994 | ||||
| Net realized gain on investments and other financial instruments | 8,119 | 8,922 | ||||||
| Net unrealized appreciation of investments and other financial instruments | 116,744 | 111,762 | ||||||
| Net Increase in Net Assets Resulting from Operations | 134,037 | 139,678 | ||||||
| Distributions to Shareholders: | ||||||||
| From net investment income | ||||||||
| Class IA | — | (13,809 | ) | |||||
| Class IB | — | (5,486 | ) | |||||
| Total distributions | — | (19,295 | ) | |||||
| Capital Share Transactions: | ||||||||
| Class IA | ||||||||
| Sold | 27,170 | 67,728 | ||||||
| Issued on reinvestment of distributions | — | 13,809 | ||||||
| Redeemed | (86,032 | ) | (150,607 | ) | ||||
| Total capital share transactions | (58,862 | ) | (69,070 | ) | ||||
| Class IB | ||||||||
| Sold | 58,468 | 138,040 | ||||||
| Issued on reinvestment of distributions | — | 5,486 | ||||||
| Redeemed | (50,480 | ) | (101,658 | ) | ||||
| Total capital share transactions | 7,988 | 41,868 | ||||||
| Net decrease from capital share transactions | (50,874 | ) | (27,202 | ) | ||||
| Net Increase in Net Assets | 83,163 | 93,181 | ||||||
| Net Assets: | ||||||||
| Beginning of period | 998,915 | 905,734 | ||||||
| End of period | $ | 1,082,078 | $ | 998,915 | ||||
| Undistributed (distribution in excess of) net investment income | $ | 9,995 | $ | 821 | ||||
| Shares: | ||||||||
| Class IA | ||||||||
| Sold | 836 | 2,335 | ||||||
| Issued on reinvestment of distributions | — | 467 | ||||||
| Redeemed | (2,644 | ) | (5,199 | ) | ||||
| Total share activity | (1,808 | ) | (2,397 | ) | ||||
| Class IB | ||||||||
| Sold | 1,804 | 4,800 | ||||||
| Issued on reinvestment of distributions | — | 186 | ||||||
| Redeemed | (1,554 | ) | (3,505 | ) | ||||
| Total share activity | 250 | 1,481 | ||||||
The accompanying notes are an integral part of these financial statements.
| 13 |
| Hartford Index HLS Fund |
| Notes to Financial Statements |
| June 30, 2013 (Unaudited) |
| (000’s Omitted) |
| 1. | Organization: |
Hartford Index HLS Fund (the “Fund”) serves as an underlying investment option for certain variable annuity and variable life insurance separate accounts of Hartford Life Insurance Company (“HLIC”) and its affiliates and certain qualified retirement plans. The Fund may also serve as an underlying investment option for certain variable annuity and variable life separate accounts of other insurance companies. Owners of variable annuity contracts and policyholders of variable life insurance contracts may choose the funds permitted in the variable insurance contract prospectus. In addition, participants in certain qualified retirement plans may choose the Fund if permitted by their plans.
Hartford Series Fund, Inc. (the “Company”) is an open-end registered management investment company comprised of thirty portfolios. Financial statements for the Fund, a series of the Company, are included in this report.
The Company is organized under the laws of the State of Maryland and is registered with the Securities and Exchange Commission (“SEC”) under the Investment Company Act of 1940, as amended (“1940 Act”). The Fund is a diversified open-end management investment company.
The Fund is divided into Class IA and Class IB shares. Each class is offered at the per share net asset value (“NAV”) without a sales charge and is subject to the same expenses, except that the Class IB shares are subject to distribution and service fees charged pursuant to a Distribution Plan adopted in accordance with Rule 12b-1 under the 1940 Act.
| 2. | Significant Accounting Policies: |
The following is a summary of significant accounting policies of the Fund in the preparation of its financial statements, which are in accordance with the United States Generally Accepted Accounting Principles (“U.S. GAAP”). The preparation of financial statements in accordance with U.S. GAAP may require management to make estimates and assumptions that affect the reported amounts of assets and liabilities and disclosure of contingent assets and liabilities at the date of the financial statements and the reported amounts of increases and decreases in net assets from operations during the reporting period. Actual results could differ from those estimates.
| a) | Determination of Net Asset Value – The NAV of each class of the Fund’s shares is determined as of the close of regular trading (normally 4:00 p.m. Eastern Time) (the “NYSE Close”) on each day that the New York Stock Exchange (the “Exchange”) is open (“Valuation Date”). Information that becomes known to the Fund after the NAV has been calculated on a particular day will not generally be used to retroactively adjust the NAV determined earlier that day. |
| b) | Investment Valuation and Fair Value Measurements – For purposes of calculating the NAV, portfolio investments and other assets held by the Fund's portfolio for which market quotes are readily available are valued at market value. Market value is generally determined on the basis of last reported sales prices or official close price. If no sales are reported, market value is based on quotes obtained from a quotation reporting system, established market makers, or independent pricing services. If market prices are not readily available or are deemed unreliable, the Fund will use the fair value of the investment as determined in good faith under policies and procedures established by and under the supervision of the Company's Board of Directors. Market quotes are considered not readily available where there is an absence of current or reliable market-based data (e.g., trade information or indicative market quotes), including where events occur after the close of the relevant market, but prior to the NYSE Close that materially affect the values of the Fund's portfolio investments or assets. In addition, market quotes are considered not readily available when, due to extraordinary circumstances, the exchanges or markets on which the investments trade do not open for trading for the entire day and no other market prices are available. There can be no assurance that the Fund could obtain the fair market value assigned to an investment if the Fund were to sell the investment at approximately the time at which the Fund determines its NAV. |
| 14 |
Short-term investments maturing in 60 days or less are generally valued at amortized cost, if their original term to maturity was 60 days or less, or by amortizing their value on the 61st day prior to maturity, if the original term to maturity exceeded 60 days.
Exchange traded options, futures and options on futures are valued at the settlement price determined by the relevant exchange as of the NYSE Close. In the case of OTC options and such instruments that do not trade on an exchange, values may be supplied by a pricing service using a formula or other objective method that may take into consideration the style, direction, expiration, strike price, notional value and volatility or other special adjustments.
Financial instruments for which prices are not available from an independent pricing service may be valued using market quotations obtained from one or more dealers that make markets in the respective financial instrument in accordance with procedures established by the Company’s Board of Directors.
U.S. GAAP defines fair value as the price that the Fund would receive to sell an asset or pay to transfer a liability in an orderly transaction between market participants. The U.S. GAAP fair value measurement standards require disclosure of a fair value hierarchy for each major category of assets and liabilities. Various inputs are used in determining the fair value of the Fund’s investments. These inputs are summarized into three broad hierarchy levels. This hierarchy is based on whether the valuation inputs are observable or unobservable. These levels are:
| · | Level 1 – Quoted prices in active markets for identical investments. Level 1 may include exchange traded instruments, such as domestic equities, some foreign equities, options, futures, mutual funds, exchange traded funds, rights and warrants. |
| · | Level 2 – Observable inputs other than Level 1 prices, such as quoted prices for similar investments; quoted prices in markets that are not active; or other inputs that are observable or can be corroborated by observable market data. Level 2 may include debt investments that are traded less frequently than exchange traded instruments and which are valued using independent pricing services; foreign equities, which are principally traded on certain foreign markets and are adjusted daily pursuant to a fair value pricing service in order to reflect an adjustment for the factors occurring after the close of certain foreign markets but before the NYSE Close; and short-term investments, which are valued at amortized cost. |
| · | Level 3 – Significant unobservable inputs that are supported by limited or no market activity. Level 3 may include financial instruments whose values are determined using indicative market quotes or require significant management judgment or estimation. These unobservable valuation inputs may include estimates for current yields, maturity/duration, prepayment speed, and indicative market quotes for comparable investments along with other assumptions relating to credit quality, collateral value, complexity of the investment structure, general market conditions and liquidity. This category may include investments where trading has been halted or there are certain restrictions on trading. While these investments are priced using unobservable inputs, the valuation of these investments reflects the best available data and management believes the prices are a reasonable representation of exit price. |
The Board of Directors of the Company generally reviews and approves the “Procedures for Valuation of Portfolio Securities” on an annual basis. These procedures define how investments are to be valued, including the formation and activities of a Valuation Committee. The Valuation Committee is responsible for determining in good faith the fair value of investments when the value cannot be obtained from primary pricing services or alternative sources or if the valuation of an investment as provided by the primary pricing service or alternative source is believed not to reflect the investment’s fair value as of the Valuation Date. Members of the Valuation Committee include the Fund’s Treasurer or designee, a Vice President of the Fund with legal expertise or designee, and a Vice President of the investment manager or designee. In addition, the Fund’s Chief Compliance Officer shall designate a member of the compliance group to attend Valuation Committee meetings as a non-voting resource, to monitor for and provide guidance with respect to compliance with these procedures. Two members of the Valuation Committee or their designees, representing different departments, shall constitute a quorum for purposes of permitting the Valuation Committee to take action. The Valuation
| 15 |
| Hartford Index HLS Fund |
| Notes to Financial Statements – (continued) |
| June 30, 2013 (Unaudited) |
| (000’s Omitted) |
Committee will consider all relevant factors in determining an investment’s fair value, and may seek the advice of the Fund’s sub-adviser, knowledgeable brokers, and legal counsel in making such determination. The Valuation Committee reports to the Audit Committee of the Company’s Board of Directors. The Audit Committee receives quarterly written reports which include details of all fair-valued investments, including the reason for the fair valuation, and an indication, when possible, of the accuracy of the valuation by disclosing the next available reliable public price quotation or the disposition price of such investments (the “look-back” test). The Board of Directors then must consider for ratification all of the fair value determinations made during the previous quarter.
Valuation levels are not necessarily indicative of the risk associated with investing in such investments. Individual investments within any of the above mentioned asset classes may be assigned a different hierarchical level than those presented above, as individual circumstances dictate.
For additional information, refer to the Investment Valuation Hierarchy Level Summary and the Level 3 roll-forward reconciliation, if applicable, which follow the Schedule of Investments.
For purposes of reporting transfers between different hierarchy levels, both transfers in and out of each level, as applicable, are shown as if they occurred at the beginning of the period.
| c) | Investment Transactions and Investment Income – Investment transactions are recorded as of the trade date (the date the order to buy or sell is executed) for financial reporting purposes. Investments purchased or sold on a when-issued or delayed-delivery basis may be settled a month or more after the trade date. Realized gains and losses are determined on the basis of identified cost. |
Dividend income from domestic securities is accrued on the ex-dividend date. In general, dividend income from foreign securities is recorded on the ex-date; however, dividend notifications in certain foreign jurisdictions may not be available in a timely manner and as a result, the Fund will record the dividend as soon as the relevant details (i.e., rate per share, payment date, shareholders of record, etc.) are publicly available. Interest income, including amortization of premium and accretion of discounts, is accrued on a daily basis.
| d) | Fund Share Valuation and Dividend Distributions to Shareholders – Orders for the Fund’s shares are executed in accordance with the investment instructions of the contract holders and plan participants. The NAV of the Fund’s shares is determined as of the close of business on each business day of the Exchange. The NAV is determined separately for each class of shares of the Fund by dividing the Fund’s net assets attributable to that class by the number of shares of the class outstanding. Each class of shares offered by the Fund has equal rights as to assets and voting privileges (except that shareholders of a class have exclusive voting rights regarding any matter relating solely to that class of shares). Income and non-class specific expenses are allocated daily to each class on the basis of the relative net assets of the class. Realized and unrealized capital gains and losses are allocated daily based on the relative net assets of each class of shares of the Fund. |
Orders for the purchase of the Fund’s shares received prior to the close of the Exchange on any day the Exchange is open for business are priced at the NAV determined as of the close of the Exchange. Orders received after the close of the Exchange, or on a day on which the Exchange and/or the Fund is not open for business, are priced at the next determined NAV.
Dividends are declared pursuant to a policy adopted by the Company’s Board of Directors based upon the investment performance of the Fund. The policy of the Fund is to pay dividends from net investment income and realized capital gains, if any, at least once a year.
Distributions from net investment income, net realized capital gains and capital are determined in accordance with federal income tax regulations, which may differ from U.S. GAAP with respect to character and timing. These
| 16 |
differences may include but are not limited to losses deferred due to wash sale adjustments, foreign currency gains and losses, adjustments related to Passive Foreign Investment Companies (“PFICs”), Real Estate Investment Trusts (“REITs”), Regulated Investment Companies (“RICs”), certain derivatives and partnerships. Permanent book and federal income tax basis differences relating to shareholder distributions will result in reclassifications to certain of the Fund’s capital accounts (see Federal Income Taxes: Reclassification of Capital Accounts note).
| 3. | Securities and Other Investments: |
| a) | Repurchase Agreements – A repurchase agreement is an agreement by which a counterparty agrees to sell an investment and agrees to repurchase the investment sold from the buyer at a mutually agreed upon time and price. During the period of the repurchase agreement, the counterparty will deposit cash and or securities in a third party custodial account to serve as collateral. At the time the Fund enters into a repurchase agreement, the value of the underlying collateral, including accrued interest, will be equal to or exceed the value of the repurchase agreement. Repurchase agreements expose the Fund to counterparty risk - that is, the risk that the counterparty will not fulfill its obligations. To minimize counterparty risk, the investments that serve to collateralize the repurchase agreement are held by the Fund’s custodian in book entry or physical form in the custodial account of the Fund or in a third party custodial account. Repurchase agreements are valued at cost plus accrued interest, which approximates fair value. Repurchase agreements have master netting agreements which allow the Fund to offset amounts owed to a counterparty with amounts owed by the counterparty, including any collateral. The Fund, as shown on the Schedule of Investments, had outstanding repurchase agreements as of June 30, 2013. |
| 4. | Financial Derivative Instruments: |
The following disclosures contain information on how and why the Fund uses derivative instruments, the credit-risk-related contingent features in certain derivative instruments, and how derivative instruments affect the Fund’s financial position and results of operations. The location and fair value amounts of these instruments on the Statement of Assets and Liabilities and the realized gains and losses and changes in unrealized gains and losses on the Statement of Operations, each categorized by type of derivative contract, are included in the following Additional Derivative Instrument Information footnote. The derivative instruments outstanding as of period-end are disclosed in the notes to or within the Schedule of Investments for purchased options, if applicable. The amounts of realized gains and losses and changes in unrealized gains and losses on derivative instruments during the period are disclosed in the Statement of Operations.
| a) | Futures Contracts – The Fund may enter into futures contracts. A futures contract is an agreement between two parties to buy or sell an asset at a set price on a future date. The Fund uses futures contracts to manage or obtain exposure to the investment markets, commodities, or movements in interest rates and currency values. The primary risks associated with the use of futures contracts are the imperfect correlation between the change in market value of the investments held by the Fund and the prices of futures contracts and the possibility of an illiquid market. Upon entering into a futures contract, the Fund is required to deposit with a futures commission merchant (“FCM”) an amount of cash or U.S. Government or Agency Obligations in accordance with the initial margin requirements of the broker or exchange. Futures contracts are marked to market daily at the most recent settlement price reported by an exchange on which, over time, they are traded most extensively, and an appropriate payable or receivable for the change in value (“variation margin”) is recorded by the Fund. Gains or losses are recognized but not considered realized until the contracts expire or are closed. Futures contracts involve, to varying degrees, risk of loss in excess of the variation margin disclosed on the Statement of Assets and Liabilities; however, the Fund seeks to reduce this risk through the use of an FCM. The Fund, as shown on the Schedule of Investments, had outstanding futures contracts as of June 30, 2013. |
| 17 |
| Hartford Index HLS Fund |
| Notes to Financial Statements – (continued) |
| June 30, 2013 (Unaudited) |
| (000’s Omitted) |
| b) | Additional Derivative Instrument Information: |
Fair Value of Derivative Instruments on the Statement of Assets and Liabilities as of June 30, 2013:
| Risk Exposure Category | ||||||||||||||||||||||||||||
| Interest Rate Contracts | Foreign Exchange Contracts | Credit Contracts | Equity Contracts | Commodity Contracts | Other Contracts | Total | ||||||||||||||||||||||
| Assets: | ||||||||||||||||||||||||||||
| Variation margin receivable * | $ | — | $ | — | $ | — | $ | 1 | $ | — | $ | — | $ | 1 | ||||||||||||||
| Total | $ | — | $ | — | $ | — | $ | 1 | $ | — | $ | — | $ | 1 | ||||||||||||||
| Liabilities: | ||||||||||||||||||||||||||||
| Variation margin payable * | $ | — | $ | — | $ | — | $ | 59 | $ | — | $ | — | $ | 59 | ||||||||||||||
| Total | $ | — | $ | — | $ | — | $ | 59 | $ | — | $ | — | $ | 59 | ||||||||||||||
* Only current day's variation margin is reported within the Statement of Assets and Liabilities. The variation margin is included in the open futures cumulative depreciation of $(13) as reported in the Schedule of Investments.
The volume of derivatives that is presented in the Schedule of Investments is consistent with the derivative activity during the six-month period ended June 30, 2013.
The Effect of Derivative Instruments on the Statement of Operations for the six-month period ended June 30, 2013:
| Risk Exposure Category | ||||||||||||||||||||||||||||
| Interest Rate Contracts | Foreign Exchange Contracts | Credit Contracts | Equity Contracts | Commodity Contracts | Other Contracts | Total | ||||||||||||||||||||||
| Realized Gain on Derivatives Recognized as a Result of Operations: | ||||||||||||||||||||||||||||
| Net realized gain on futures | $ | — | $ | — | $ | — | $ | 1,494 | $ | — | $ | — | $ | 1,494 | ||||||||||||||
| Total | $ | — | $ | — | $ | — | $ | 1,494 | $ | — | $ | — | $ | 1,494 | ||||||||||||||
| Net Change in Unrealized Appreciation (Depreciation) on Derivatives Recognized as a Result of Operations: | ||||||||||||||||||||||||||||
| Net change in unrealized depreciation of futures | $ | — | $ | — | $ | — | $ | (12 | ) | $ | — | $ | — | $ | (12 | ) | ||||||||||||
| Total | $ | — | $ | — | $ | — | $ | (12 | ) | $ | — | $ | — | $ | (12 | ) | ||||||||||||
| c) | Balance Sheet Offsetting Information: |
Set forth below are tables which disclose both gross information and net information about instruments and transactions eligible for offset in the financial statements, and instruments and transactions that are subject to a master netting agreement, as well as amounts related to margin, reflected as financial collateral (including cash collateral), held at clearing brokers, counterparties, and the Fund’s custodian. The master netting agreements allow the clearing brokers to net any collateral held in or on behalf of the Fund, or liabilities or payment obligations of the clearing brokers to the Fund, against any liabilities or payment obligations of the Fund to the clearing brokers. The Fund is required to deposit financial collateral (including cash collateral) at the Fund’s custodian on behalf of clearing brokers and counterparties to continually meet the original and maintenance requirements established by the clearing brokers and counterparties. Such requirements are specific to the respective clearing broker or counterparty.
| 18 |
Offsetting of Financial Assets and Derivative Assets as of June 30, 2013:
| Description | Gross Amounts of Recognized Assets | Gross Amounts Offset in Statement of Assets and Liabilities | Net Amounts of Assets Presented in Statement of Assets and Liabilities | Financial Instruments with Allowable Netting | Collateral Received | Net Amount (not less than 0) | ||||||||||||||||||
| Futures contracts - Variation margin receivable | $ | 1 | $ | — | $ | 1 | $ | — | $ | — | $ | 1 | ||||||||||||
| Repurchase Agreements | 10,356 | — | 10,356 | — | (10,563 | ) | — | |||||||||||||||||
| Total subject to a master netting or similar arrangement | $ | 10,357 | $ | — | $ | 10,357 | $ | — | $ | (10,563 | ) | $ | 1 | |||||||||||
Offsetting of Financial Liabilities and Derivative Liabilities as of June 30, 2013:
| Description | Gross Amounts of Recognized Liabilities | Gross Amounts Offset in Statement of Assets and Liabilities | Net Amounts of Assets Presented in Statement of Assets and Liabilities | Financial Instruments with Allowable Netting | Collateral Pledged | Net Amount (not less than 0) | ||||||||||||||||||
| Futures – Variation margin payable | $ | 59 | $ | — | $ | 59 | $ | — | $ | (850 | ) | $ | — | |||||||||||
| Total subject to a master netting or similar arrangement | $ | 59 | $ | — | $ | 59 | $ | — | $ | (850 | ) | $ | — | |||||||||||
| 5. | Principal Risks: |
| a) | Counterparty Risk – The Fund may be exposed to counterparty risk, or the risk that an institution or other entity with which the Fund has unsettled or open transactions will default. |
| b) | Market Risks – The market values of equity securities, such as common stocks and preferred stocks, or equity related investments, such as futures and options, may decline due to general market conditions which are not specifically related to a particular company, such as real or perceived adverse economic conditions, changes in the general outlook for corporate earnings, changes in interest or currency rates or adverse investor sentiment generally. The market value of equity securities may also decline due to factors which affect a particular industry or industries, such as labor shortages or increased production costs and competitive conditions within an industry. Equity securities and equity related investments generally have greater market price volatility than fixed income securities. |
| 6. | Federal Income Taxes: |
| a) | Federal Income Taxes – For federal income tax purposes, the Fund intends to continue to qualify as a RIC under Subchapter M of the Internal Revenue Code (“IRC”) by distributing substantially all of its taxable net investment income and net realized capital gains to its shareholders and otherwise complying with the requirements of the IRC. The Fund has distributed substantially all of its income and capital gains in prior years, if applicable, and intends to distribute substantially all of its income and capital gains prior to the next fiscal year-end. Accordingly, no provision for federal income or excise taxes has been made in the accompanying financial statements. Distributions from short-term capital gains are treated as ordinary income distributions for federal income tax purposes. |
| b) | Net Investment Income (Loss), Net Realized Gains (Losses), and Distributions – Net investment income (loss) and net realized gains (losses) may differ for financial statement and tax purposes primarily because of losses deferred due to wash sale adjustments, foreign currency gains and losses, adjustments related to PFICs, REITs, RICs, certain derivatives and partnerships. The character of distributions made during the year from net investment income or net realized gains may differ from their ultimate characterization for federal income tax purposes. Also, due to the timing of dividend distributions, the fiscal year in which amounts are distributed may differ from the year that the income or realized gains (losses) were recorded by the Fund. |
| 19 |
| Hartford Index HLS Fund |
| Notes to Financial Statements – (continued) |
| June 30, 2013 (Unaudited) |
| (000’s Omitted) |
| c) | Distributions and Components of Distributable Earnings – The tax character of distributions paid by the Fund for the periods indicated is as follows (as adjusted for dividends payable, if applicable): |
| For the Year Ended December 31, 2012 | For the Year Ended December 31, 2011 | |||||||
| Ordinary Income | $ | 19,295 | $ | 15,474 | ||||
As of December 31, 2012, the Fund’s components of distributable earnings (deficit) on a tax basis were as follows:
| Amount | ||||
| Undistributed Ordinary Income | $ | 821 | ||
| Accumulated Capital and Other Losses* | (2,969 | ) | ||
| Unrealized Appreciation† | 158,558 | |||
| Total Accumulated Earnings | $ | 156,410 | ||
| * | The Fund has capital loss carryforwards that are identified in the Capital Loss Carryforward note that follows. |
| † | Differences between book-basis and tax-basis unrealized appreciation (depreciation) may be attributable to the losses deferred due to wash sale adjustments, foreign currency gains and losses, adjustments related to PFICs, REITs, RICs, certain derivatives and partnerships. |
| d) | Reclassification of Capital Accounts – The Fund may record reclassifications in its capital accounts. These reclassifications have no impact on the total net assets of the Fund. The reclassifications are a result of permanent differences between U.S. GAAP and tax accounting for such items as foreign currency, PFICs, expiration or utilization of capital loss carryforwards or net operating losses. Adjustments are made to reflect the impact these items have on current and future distributions to shareholders. Therefore, the source of the Fund’s distributions may be shown in the accompanying Statement of Changes in Net Assets as from undistributed net investment income, from accumulated net realized gains on investments or from capital depending on the type of book and tax differences that exist. For the year ended December 31, 2012, the Fund recorded reclassifications to increase (decrease) the accounts listed below: |
| Amount | ||||
| Undistributed Net Investment Income | $ | (329 | ) | |
| Accumulated Net Realized Gain (Loss) | 329 | |||
| e) | Capital Loss Carryforward – On December 22, 2010, the Regulated Investment Company Modernization Act of 2010 (the “Act”) was enacted, which made changes to the capital loss carryforward rules. The changes are effective for taxable years beginning after the date of enactment. Under the Act, funds are permitted to carry forward capital losses for an unlimited period. However, any losses incurred during those future taxable years will be required to be utilized prior to the losses incurred in pre-enactment taxable years, which carry an expiration date. As a result of this ordering rule, pre-enactment capital loss carryforwards may be more likely to expire unused. Additionally, post-enactment capital loss carryforwards retain their character as either short-term or long-term capital losses rather than being considered all short-term as permitted under prior regulation. |
| 20 |
At December 31, 2012 (tax-year-end), the Fund had capital loss carryforwards for U.S. federal income tax purposes as follows:
| Year of Expiration | Amount | |||
| 2017 | $ | 2,969 | ||
| Total | $ | 2,969 | ||
During the year ended December 31, 2012, the Fund utilized $19,123 of prior year capital loss carryforwards.
| f) | Accounting for Uncertainty in Income Taxes – The Fund has adopted financial reporting rules that require the Fund to analyze all open tax years, as defined by the statute of limitations, for all major jurisdictions. Generally, tax authorities can examine all tax returns filed for the last three years. The Fund does not have an examination in progress. |
The Fund has reviewed all open tax years and major jurisdictions and concluded that these financial reporting rules had no effect on the Fund’s financial position or results of operations. There is no tax liability resulting from unrecognized tax benefits relating to uncertain income tax positions taken or expected to be taken on the tax return for the fiscal year ended December 31, 2012. The Fund is also not aware of any tax positions for which it is reasonably possible that the total amounts of unrecognized tax benefits will significantly change in the next twelve months.
| 7. | Expenses: |
| a) | Investment Management Agreement – Hartford Funds Management Company, LLC (“HFMC”), an indirect wholly owned subsidiary of The Hartford Financial Services Group, Inc. (“The Hartford”), serves as investment manager to the Fund pursuant to an Investment Management Agreement with the Company. The investment manager has overall investment supervisory responsibility for the Fund. In addition, the investment manager provides administrative personnel, services, equipment, facilities and office space for proper operation of the Fund. The investment manager has contracted with Hartford Investment Management Company (“Hartford Investment Management”) under a sub-advisory agreement for the provision of day-to-day investment management services to the Fund in accordance with the Fund’s investment objective and policies. The Fund pays a fee to the investment manager, a portion of which may be used to compensate Hartford Investment Management. |
The schedule below reflects the rates of compensation paid to HFMC for investment management services rendered as of June 30, 2013; the rates are accrued daily and paid monthly.
| Average Daily Net Assets | Annual Fee | |||
| On first $2 billion | 0.3000% | |||
| On next $3 billion | 0.2000% | |||
| On next $5 billion | 0.1800% | |||
| Over $10 billion | 0.1700% | |||
| b) | Accounting Services Agreement – Pursuant to the Fund Accounting Agreement between HFMC and the Company, on behalf of the Fund, HFMC provides accounting services to the Fund and receives monthly compensation based on the Fund’s average daily net assets at the rates set forth below. The Fund’s accounting services fees are accrued daily and paid monthly. |
| Average Daily Net Assets | Annual Fee | |||
| All Assets | 0.010% | |||
| 21 |
| Hartford Index HLS Fund |
| Notes to Financial Statements – (continued) |
| June 30, 2013 (Unaudited) |
| (000’s Omitted) |
| c) | Operating Expenses – Allocable expenses incurred by the Company are allocated to each Fund and allocated to classes within a Fund in proportion to the average daily net assets of the Fund and each class, except where allocation of certain expenses is more fairly made directly to the Fund or to specific classes within a Fund. |
| d) | Distribution Plan for Class IB shares – The Company, on behalf of the Fund, has adopted a Distribution Plan pursuant to Rule 12b-1 of the 1940 Act to compensate the distributor, Hartford Funds Distributors, LLC (“HFD”), (formerly known as Hartford Investment Financial Services, LLC), an indirect wholly owned subsidiary of The Hartford, from assets attributable to the Class IB shares for services rendered and expenses borne in connection with activities primarily intended to result in the sale of the Class IB shares, subject to the review and approval of the Company’s Board of Directors. |
The Distribution Plan provides that the Fund may pay annually up to 0.25% of the average daily net assets of the Fund attributable to its Class IB shares for activities primarily intended to result in the sale of Class IB shares. The Board has the authority to suspend or reduce these payments at any point in time. Under the terms of the Distribution Plan and the principal underwriting agreement, the Fund is authorized to make payments monthly to the distributor that may be used to pay or compensate entities providing distribution and shareholder servicing with respect to the Class IB shares for such entities’ fees or expenses incurred or paid in that regard. These fees are accrued daily and paid monthly.
| e) | Other Related Party Transactions – Certain officers of the Fund are directors and/or officers of the investment manager and/or The Hartford or its subsidiaries. For the six-month period ended June 30, 2013, a portion of the Fund’s Chief Compliance Officer’s salary was paid by all the investment companies in the Hartford fund complex. The portion allocated to the Fund rounds to zero. These fees are accrued daily and paid monthly. |
| 8. | Investment Transactions: |
For the six-month period ended June 30, 2013, the Fund's aggregate purchases and sales of investment securities (excluding short-term investments) were as follows:
| Amount | ||||
| Cost of Purchases Excluding U.S. Government Obligations | $ | 11,442 | ||
| Sales Proceeds Excluding U.S. Government Obligations | 55,202 | |||
| 9. | Line of Credit: |
The Fund is one of several Hartford funds that participate in a $500 million committed revolving line of credit facility. The facility is to be used for temporary or emergency purposes. Under the arrangement, the funds are required to own securities having a market value in excess of 300% of the total bank borrowings. The interest rate on borrowings varies depending on the nature of the loan. The facility also requires a fee to be paid based on the amount of the commitment. This commitment fee is allocated to all of the funds participating in the line of credit based on the average net assets of the funds. During the six-month period ended June 30, 2013, the Fund did not have any borrowings under this facility.
| 10. | Industry Classifications: |
Other than the industry classifications “Other Investment Pools and Funds” and “Exchange Traded Funds,” equity industry classifications used in this report are the Global Industry Classification Standard, which was developed by and is the exclusive property and service mark of MSCI, Inc. and Standard & Poor’s.
| 11. | Indemnifications: |
Under the Company’s organizational documents, the Company shall indemnify its officers and directors to the full extent required or permitted under Maryland General Corporation Law and the federal securities laws. In addition, the Company, on behalf of the Fund, may enter into contracts that contain a variety of indemnifications. The Company’s maximum exposure
| 22 |
under these arrangements is unknown. However, as of the date of these financial statements, the Company has not had prior claims or losses pursuant to these contracts and expects the risk of loss to be remote.
| 12. | Pending Legal Proceedings: |
| a) | On February 25, 2011, Jennifer L. Kasilag, Louis Mellinger, Judith M. Menendez, Jacqueline M. Robinson, and Linda A. Russell filed a derivative lawsuit against Hartford Investment Financial Services, LLC (“HIFSCO”)(now known as Hartford Funds Distributors, LLC) on behalf of six Hartford retail mutual funds in the United States District Court for the District of New Jersey, alleging that HIFSCO received excessive advisory and distribution fees in violation of its statutory fiduciary duty under Section 36(b) of the 1940 Act when serving as investment manager and principal underwriter, respectively, to the Hartford retail mutual funds. HIFSCO moved to dismiss and, in September 2011, the motion was granted in part and denied in part, with leave to amend the complaint. In November 2011, plaintiffs filed an amended complaint on behalf of certain Hartford retail mutual funds, The Hartford Global Health Fund (now known as The Hartford Healthcare Fund), The Hartford Conservative Allocation Fund, The Hartford Growth Opportunities Fund, The Hartford Inflation Plus Fund, The Hartford Advisers Fund (now known as The Hartford Balanced Fund), and The Hartford Capital Appreciation Fund. Plaintiffs seek to rescind the investment management agreements and distribution plans between HIFSCO and these funds and to recover the total fees charged thereunder or, in the alternative, to recover any improper compensation HIFSCO received, in addition to lost earnings. HIFSCO filed a partial motion to dismiss the amended complaint and, in December 2012, the court dismissed without prejudice the claims regarding distribution fees and denied the motion with respect to the advisory fees claims. HIFSCO disputes the allegations and intends to defend vigorously. |
This action concerns the activities of HIFSCO in its capacity as investment manager and principal underwriter to the Hartford retail mutual funds and does not concern HIFSCO’s activities in its capacity as principal underwriter to the HLS funds. For this reason, no accrual for litigation relating to this matter has been recorded in the financial statements of the Fund.
| b) | On June 2, 2011, a complaint was filed against Hartford Investment Management Company in the United States District Court of Connecticut (Deutsche Bank Trust Company Americas v. Aetna, Inc., ING Investment Trust Co., Milan E. Chilla, Hartford Investment Management Co., and UBS AG (D. Conn.)). In a similar action, plaintiffs filed a complaint listing Hartford Series Fund, Inc. and Hartford HLS Series Fund II, Inc. as members of the defendant class (The Official Committee of Unsecured Creditors of Tribune Company v. Fitzsimons, et al. (Bankr. D. Del.)). The complaints relate to the bankruptcy of the Tribune Company, which was a public company that repurchased its shares in a leveraged buyout in 2007, but entered bankruptcy a year later. The complaints were served in August 2011. The plaintiffs in each case allege that the repurchase of shares acted as a fraudulent transfer. The plaintiffs in each case seek to recover from each class member the amount of consideration received in the buyout. Each action was recently transferred to the United States District Court for the Southern District of New York. In the Deutsche Bank Trust Company Americas action, the defendants have filed a motion to dismiss, which plaintiffs have opposed. The court in the Deutsche Bank Trust Company Americas action has not yet ruled on the motion. The Official Committee of Unsecured Creditors of Tribune Company action is currently stayed and no responsive pleading has been filed. The Hartford intends to vigorously defend these actions. |
| 23 |
| Hartford Index HLS Fund |
| Financial Highlights |
- Selected Per-Share Data (A) - |
| Class | Net Asset Value at Beginning of Period | Net Investment Income (Loss) | Net Realized and Unrealized Gain (Loss) on Investments | Total from Investment Operations | Dividends from Net Investment Income | Distributions from Realized Capital Gains | Distributions from Capital | Total Distributions | Net Asset Value at End of Period | |||||||||||||||||||||||||||
| For the Six-Month Period Ended June 30, 2013 (Unaudited) | ||||||||||||||||||||||||||||||||||||
| IA | $ | 29.69 | $ | 0.31 | $ | 3.74 | $ | 4.05 | $ | – | $ | – | $ | – | $ | – | $ | 33.74 | ||||||||||||||||||
| IB | 29.56 | 0.25 | 3.74 | 3.99 | – | – | – | – | 33.55 | |||||||||||||||||||||||||||
| For the Year Ended December 31, 2012 | ||||||||||||||||||||||||||||||||||||
| IA | 26.20 | 0.61 | 3.48 | 4.09 | (0.60 | ) | – | – | (0.60 | ) | 29.69 | |||||||||||||||||||||||||
| IB | 26.09 | 0.49 | 3.51 | 4.00 | (0.53 | ) | – | – | (0.53 | ) | 29.56 | |||||||||||||||||||||||||
| For the Year Ended December 31, 2011 | ||||||||||||||||||||||||||||||||||||
| IA | 26.20 | 0.52 | (0.05 | ) | 0.47 | (0.47 | ) | – | – | (0.47 | ) | 26.20 | ||||||||||||||||||||||||
| IB | 26.08 | 0.39 | 0.03 | 0.42 | (0.41 | ) | – | – | (0.41 | ) | 26.09 | |||||||||||||||||||||||||
| For the Year Ended December 31, 2010 | ||||||||||||||||||||||||||||||||||||
| IA | 23.22 | 0.44 | 2.97 | 3.41 | (0.43 | ) | – | – | (0.43 | ) | 26.20 | |||||||||||||||||||||||||
| IB | 23.12 | 0.34 | 2.99 | 3.33 | (0.37 | ) | – | – | (0.37 | ) | 26.08 | |||||||||||||||||||||||||
| For the Year Ended December 31, 2009 | ||||||||||||||||||||||||||||||||||||
| IA | 18.75 | 0.42 | 4.48 | 4.90 | (0.42 | ) | (0.01 | ) | – | (0.43 | ) | 23.22 | ||||||||||||||||||||||||
| IB | 18.69 | 0.35 | 4.46 | 4.81 | (0.37 | ) | (0.01 | ) | – | (0.38 | ) | 23.12 | ||||||||||||||||||||||||
| For the Year Ended December 31, 2008 | ||||||||||||||||||||||||||||||||||||
| IA | 31.54 | 0.59 | (12.16 | ) | (11.57 | ) | (0.58 | ) | (0.64 | ) | – | (1.22 | ) | 18.75 | ||||||||||||||||||||||
| IB | 31.40 | 0.51 | (12.07 | ) | (11.56 | ) | (0.51 | ) | (0.64 | ) | – | (1.15 | ) | 18.69 | ||||||||||||||||||||||
| (A) | Information presented relates to a share outstanding throughout the indicated period. |
| (B) | The figures do not include sales charges or other fees which may be applied at the variable life insurance, variable annuity or qualified retirement plan product level. Any such additional sales charges or other fees would lower the Fund's performance. |
| (C) | Portfolio turnover rate is calculated on the basis of the Fund as a whole without distinguishing between the classes of shares issued. |
| (D) | Not annualized. |
| (E) | Annualized. |
| 24 |
| - Ratios and Supplemental Data - |
| Total Return(B) | Net Assets at End of Period | Ratio of Expenses to Average Net Assets Before Waivers | Ratio of Expenses to Average Net Assets After Waivers | Ratio of Net Investment Income (Loss) to Average Net Assets | Portfolio Turnover Rate(C) | |||||||||||||
| 13.64 | %(D) | $ | 725,159 | 0.33 | %(E) | 0.33 | %(E) | 1.80 | %(E) | 1 | % | |||||||
| 13.48 | (D) | 356,919 | 0.58 | (E) | 0.58 | (E) | 1.56 | (E) | – | |||||||||
| 15.63 | 691,786 | 0.33 | 0.33 | 1.98 | 7 | |||||||||||||
| 15.34 | 307,129 | 0.58 | 0.58 | 1.75 | – | |||||||||||||
| 1.81 | 673,275 | 0.33 | 0.33 | 1.74 | 3 | |||||||||||||
| 1.60 | 232,459 | 0.58 | 0.58 | 1.51 | – | |||||||||||||
| 14.73 | 809,629 | 0.34 | 0.34 | 1.73 | 4 | |||||||||||||
| 14.45 | 209,260 | 0.59 | 0.59 | 1.48 | – | |||||||||||||
| 26.15 | 811,634 | 0.35 | 0.35 | 2.00 | 6 | |||||||||||||
| 25.81 | 166,162 | 0.60 | 0.60 | 1.75 | – | |||||||||||||
| (37.11 | ) | 718,081 | 0.32 | 0.32 | 2.02 | 4 | ||||||||||||
| (37.27 | ) | 138,014 | 0.57 | 0.57 | 1.77 | – | ||||||||||||
| 25 |
| Hartford Index HLS Fund |
| Directors and Officers (Unaudited) |
The Board of Directors of the Company appoints officers who are responsible for the day-to-day operations of the Fund and who execute policies formulated by the Directors. Each director serves until his or her death, resignation, or retirement or until the next annual meeting of shareholders is held or until his or her successor is elected and qualifies.
Directors and officers who are employed by or who have a financial interest in The Hartford are considered “interested” persons of the Fund pursuant to the 1940 Act. Each officer and two of the Company’s directors, as noted in the chart below, are “interested” persons of the Fund. Each director serves as a director for The Hartford Mutual Funds, Inc., The Hartford Mutual Funds II, Inc., Hartford Series Fund, Inc., Hartford HLS Series Fund II, Inc., and as a trustee for The Hartford Alternative Strategies Fund, which, as of June 30, 2013, collectively consist of 90 funds. Correspondence may be sent to directors and officers c/o Hartford Mutual Funds, P.O. Box 2999, Hartford, Connecticut 06104-2999, except that correspondence to Mr. Annoni, Mr. Dressen, Ms. Fagely and Ms. Quade may be sent to 500 Bielenberg Drive, Woodbury, Minnesota 55125 and correspondence to Mr. Davey and Mr. Melcher may be sent to 5 Radnor Corporate Center, Suite 300, 100 Matsonford Road, Radnor, Pennsylvania 19087.
The table below sets forth, for each director and officer, his or her name, year of birth, current position with the Company and date first elected or appointed to Hartford Series Fund, Inc. (“HSF”), and Hartford HLS Series Fund II, Inc. (“HSF2”), principal occupation, and, for directors, other directorships held. The Fund’s statement of additional information contains further information on the directors and is available free of charge by calling 1-800-862-6668 or writing to Hartford HLS Funds, c/o Hartford Life Insurance Company, Hartford Life and Annuity Insurance Company, P.O. Box 14293, Lexington, KY 40512-4293.
Information on the aggregate remuneration paid to the directors of the Company can be found in the Statement of Operations herein. The Fund pays to The Hartford a portion of the Chief Compliance Officer’s compensation, but does not pay salaries or compensation to any of their other officers or directors who are employed by The Hartford.
Non-Interested Directors
Lynn S. Birdsong (1946) Director since 2003, Co-Chairman of the Investment Committee
Mr. Birdsong is a private investor. Mr. Birdsong currently serves as a Director of the Sovereign High Yield Investment Company (April 2010 to current). Mr. Birdsong currently serves as an Independent Director of Nomura Partners Funds, Inc. (formerly, The Japan Fund) (March 2003 to current). From 1979 to 2002, Mr. Birdsong was a managing director of Zurich Scudder Investments, an investment management firm. During his employment with Scudder, Mr. Birdsong was an Interested Director of The Japan Fund. Since 1981, Mr. Birdsong has been a partner in Birdsong Company, an advertising specialty firm.
Robert M. Gavin, Jr. (1940) Director since 2002 (HSF) and 1986 (HSF2), Chairman of the Board since 2004
Dr. Gavin is an educational consultant. Prior to September 1, 2001, he was President of Cranbrook Education Community and prior to July 1996, he was President of Macalester College, St. Paul, Minnesota.
Duane E. Hill (1945) Director since 2001 (HSF) and 2002 (HSF2), Chairman of the Nominating Committee
Mr. Hill is Partner of TSG Ventures L.P., a private equity investment company. Mr. Hill is a former partner of TSG Capital Group, a private equity investment firm that served as sponsor and lead investor in leveraged buyouts of middle market companies.
Sandra S. Jaffee (1941) Director since 2005
Ms. Jaffee is the founder and Chief Executive Officer of a private company, Homeworks Concierge, LLC, which provides residential property management services in Westchester County, New York (January 2012 to present). Ms. Jaffee served as Chairman (2008 to 2009) and Chief Executive Officer of Fortent (formerly Searchspace Group), a leading provider of compliance/regulatory technology to financial institutions from August 2005 to August 2009. Ms. Jaffee currently serves as a member of the Board of Directors of Broadridge Financial Solutions as well as a Trustee of Muhlenberg College.
William P. Johnston (1944) Director since 2005, Chairman of the Compliance Committee
In February 2008, Mr. Johnston was elected to the Board of Directors of HCR-ManorCare, Inc. In August 2007, Mr. Johnston was elected to the Board of Directors of LifeCare Holdings, Inc. In July 2006, Mr. Johnston was elected to the Board of Directors of MultiPlan, Inc. and served as a director (July 2006 to August 2010). In June 2006, Mr. Johnston was appointed as Senior Advisor to The Carlyle Group, a global private equity and alternative asset investment firm. In May 2006, Mr. Johnston was elected to the Supervisory Board of Fresenius Medical Care AG & Co. KGaA, after its acquisition of Renal Care Group, Inc. in March 2006.
Phillip O. Peterson (1944) Director since 2002 (HSF) and 2000 (HSF2), Chairman of the Audit Committee
Mr. Peterson is a mutual fund industry consultant. He was a partner of KPMG LLP (an accounting firm) until July 1999. Mr. Peterson joined William Blair Funds in February 2007 as a member of the Board of Trustees. Mr. Peterson also joined the Board of Trustees of Symetra Variable Mutual Funds Trust as a trustee in February 2012.
| 26 |
Lemma W. Senbet (1946) Director since 2005
Dr. Senbet is the William E. Mayer Chair Professor of Finance and Director, Center for Financial Policy, at the University of Maryland, Robert H. Smith School of Business. He was chair of the Finance Department from 1998 to 2006. Previously he was a chaired professor of finance at the University of Wisconsin-Madison. Also, he was director of the Fortis Funds from March 2000 to July 2002. Dr. Senbet served the finance profession in various capacities, including as director of the American Finance Association and President of the Western Finance Association. In 2006, Dr. Senbet was inducted Fellow of Financial Management Association International for his career-long distinguished scholarship and professional service.
Interested Directors and Officers
James E. Davey (1964) Director since 2012, President and Chief Executive Officer since 2010
Mr. Davey serves as Executive Vice President of Hartford Life Insurance Company (“HLIC”) and The Hartford Financial Services Group, Inc. Additionally, Mr. Davey serves as Chairman of the Board and Manager of Hartford Funds Distributors, LLC (“HFD”) and Hartford Administrative Services Company (“HASCO”). Mr. Davey also serves as Manager, President and Chairman of the Board for Hartford Funds Management Company, LLC (“HFMC”). Mr. Davey joined The Hartford in 2002.
Lowndes A. Smith (1939) Director since 1996 (HSF) and 2002 (HSF2), Co-Chairman of the Investment Committee
Mr. Smith served as Vice Chairman of The Hartford from February 1997 to January 2002, as President and Chief Executive Officer of Hartford Life, Inc. from February 1997 to January 2002, and as President and Chief Operating Officer of The Hartford Life Insurance Companies from January 1989 to January 2002. Mr. Smith serves as a Director of White Mountains Insurance Group, Ltd., One Beacon Insurance and Symetra Financial and as Managing Director of Whittington Gray Associates.
Other Officers
Mark A. Annoni (1964) Vice President, Controller and Treasurer since 2012
Mr. Annoni serves as the Assistant Vice President of HLIC (February 2004 to present). Mr. Annoni joined The Hartford in April 2001 as part of The Hartford’s acquisition of Fortis Financial Group (“Fortis”). Prior to joining The Hartford, Mr. Annoni served as Manager of Mutual Fund Accounting at Fortis (July 1997 to April 2001).
Michael R. Dressen (1963) AML Compliance Officer since 2011
Mr. Dressen currently serves as Assistant Vice President of HLIC. He also serves as Chief Compliance Officer and AML Compliance Officer of HASCO and as AML Officer of HFD. Mr. Dressen joined The Hartford in 2005 from State Farm Insurance Companies where he held various positions related to mutual funds, variable products, and property casualty insurance.
Tamara L. Fagely (1958) Vice President since 2002 (HSF) and 1993 (HSF2)
Currently, Ms. Fagely is President and a Director of HASCO, Chief Administrative Officer and Manager of HFMC and a Vice President of HLIC. Ms. Fagely served as a Vice President of HASCO (1998-2013) and Chief Financial Officer of HASCO (2006-2013). She served as Assistant Vice President of HLIC from December 2001 through March 2005. In addition, Ms. Fagely is Manager and Chief Operating Officer of HFD.
Edward P. Macdonald (1967) Vice President, Secretary and Chief Legal Officer since 2005
Mr. Macdonald serves as Vice President of HLIC and Vice President, Chief Legal Officer and Secretary of HFD and HASCO. Mr. Macdonald also serves as Manager, Vice President, Chief Legal Officer and Secretary of HFMC. Mr. Macdonald joined The Hartford in 2005.
Joseph G. Melcher (1973) Vice President and Chief Compliance Officer since 2013(1)
Mr. Melcher currently serves as Vice President of HFMC and HFD. Mr. Melcher joined The Hartford in 2012 from Touchstone Investments, a member of the Western & Southern Financial Group, where he held the position of Vice President and Chief Compliance Officer from 2010 through 2012 and Assistant Vice President, Compliance from 2005 to 2010.
| (1) | Mr. Melcher was named Vice President and Chief Compliance Officer of HSF and HSF2 on February 6, 2013. Prior to February 6, 2013, Colleen Pernerewski served as Chief Compliance Officer of HSF and HSF2. |
Vernon J. Meyer (1964) Vice President since 2006
Mr. Meyer serves as Senior Vice President of HLIC. He also serves as Senior Vice President of HFMC and HFD. Mr. Meyer joined The Hartford in 2004.
| 27 |
| Hartford Index HLS Fund |
| Directors and Officers (Unaudited) – (continued) |
Laura S. Quade (1969) Vice President since 2012
Ms. Quade currently serves as Vice President of HASCO and is a Director of Mutual Fund Service Operations. She also serves as Director, Enterprise Operations of HFD and HLIC. Ms. Quade joined The Hartford in 2001 as part of The Hartford’s acquisition of Fortis.
Elizabeth L. Schroeder (1966) Vice President since 2010(2)
Ms. Schroeder currently serves as Assistant Vice President of HLIC. Ms. Schroeder joined HLIC in 1991. She is also an Assistant Vice President of HFMC and HASCO.
(2) Ms. Schroeder served as Vice President of HSF and HSF2 until August 7, 2013.
Martin Swanson (1962) Vice President since 2010
Mr. Swanson is a Vice President of HLIC. Mr. Swanson also serves as Chief Marketing Officer for HFD. Prior to joining HLIC in 1998, Mr. Swanson was a Vice President at PaineWebber, Inc.
HOW TO OBTAIN A COPY OF THE FUND’S PROXY VOTING POLICIES AND VOTING RECORDS (UNAUDITED)
A description of the policies and procedures that the Fund uses to determine how to vote proxies relating to portfolio securities and information about how the Fund voted proxies relating to portfolio securities during the most recent twelve-month period ended June 30 are available (1) without charge, upon request, by calling 800-862-6668 and (2) on the SEC’s website at http://www.sec.gov.
QUARTERLY PORTFOLIO HOLDINGS INFORMATION (UNAUDITED)
The Fund files a complete schedule of portfolio holdings with the SEC for the first and third quarters of each fiscal year on Form N-Q. The Fund’s Forms are available (1) without charge, upon request, by calling 800-862-6668 and (2) on the SEC’s website at http://www.sec.gov. The Form N-Q may be reviewed and copied at the SEC’s Public Reference Room in Washington, DC. Information on the operation of the Public Reference Room may be obtained by calling 1-800-SEC-0330.
| 28 |
| Hartford Index HLS Fund |
| Expense Example (Unaudited) |
Your Fund's Expenses
As a shareholder of the Fund, you incur two types of costs: (1) transaction costs and (2) ongoing costs including investment management fees, distribution fees, if any, and other fund expenses. This example is intended to help you understand your ongoing costs (in dollars) of investing in the Fund and to compare these costs with the ongoing costs of investing in other mutual funds. The example is based on an investment of $1,000 invested at the beginning of the period and held for the period of December 31, 2012 through June 30, 2013.
Actual Expenses
The first set of columns of the table below provides information about actual account values and actual expenses. You may use the information in this column, together with the amount you invested, to estimate the expenses that you paid over the period. Simply divide your account value by $1,000 (for example, an $8,600 account value divided by $1,000 = 8.6), then multiply the result by the number in the line under the heading entitled “Expenses Paid During Period” to estimate the expenses you paid on your account during this period.
Hypothetical Example for Comparison Purposes
The second set of columns of the table below provides information about hypothetical account values and hypothetical expenses based on the Fund’s actual expense ratio and an assumed rate of return of 5% per year before expenses, which is not the Fund’s actual return. The hypothetical account values and expenses may not be used to estimate the actual ending account balance or expenses you paid for the period. You may use this information to compare the ongoing costs of investing in the Fund and other funds. To do so, compare this 5% hypothetical example with the 5% hypothetical examples that appear in the shareholder reports of the other funds.
Please note that the expenses shown in the table are meant to highlight your ongoing costs only and do not reflect any transactional costs, such as sales charges (loads) and CDSC. Therefore, the second set of columns of the table is useful in comparing ongoing costs only, and will not help you determine the relative total costs of owning different funds. In addition, if these transactional costs were included, your costs would be higher. Expenses are equal to the Fund's annualized expense ratios multiplied by average account value over the period, multiplied by 181/365 (to reflect the one-half year period).
| Actual return | Hypothetical (5% return before expenses) | |||||||||||||||||||||||||||||||
| Beginning Account Value December 31, 2012 | Ending Account Value June 30, 2013 | Expenses paid during the period December 31, 2012 through June 30, 2013 | Beginning Account Value December 31, 2012 | Ending Account Value June 30, 2013 | Expenses paid during the period December 31, 2012 through June 30, 2013 | Annualized expense ratio | Days in the current 1/2 year | Days in the full year | ||||||||||||||||||||||||
| Class IA | $ | 1,000.00 | $ | 1,136.40 | $ | 1.75 | $ | 1,000.00 | $ | 1,023.16 | $ | 1.66 | 0.33 | % | 181 | 365 | ||||||||||||||||
| Class IB | $ | 1,000.00 | $ | 1,134.80 | $ | 3.07 | $ | 1,000.00 | $ | 1,021.92 | $ | 2.91 | 0.58 | % | 181 | 365 | ||||||||||||||||
| 29 |
| Hartford Index HLS Fund |
| Principal Risks (Unaudited) |
The principal risks of investing in the Fund are described below.
Market, Selection, and Strategy Risk: The Fund’s share price may fluctuate due to market risk and/or security selections that may underperform the market or relevant benchmarks. If the sub-adviser’s investment strategy does not perform as expected, the Fund could underperform its peers or lose money. There is no guarantee the Fund will achieve its stated objective.
Passive Management Risk: The Fund is not actively managed, and will generally remain fully invested even when stock prices are falling.
Index Tracking Risk: The Fund’s performance may not match or correlate to that of its index, which may cause the Fund’s performance to be lower than expected.
S&P Disclosure: "Standard & Poor's," "S&P®," "S&P 500®," "Standard & Poor's," and "500®" are trademarks of The McGraw-Hill Companies, Inc. and have been licensed for use by Hartford Life Insurance Company and Hartford Life and Annuity Insurance Company. Investment options are not sponsored, endorsed, sold or promoted by Standard and Poor's and Standard & Poor's makes no representation regarding the advisability of investing in the Investment Options.
| 30 |
HARTFORD HLS FUNDS
c/o The Hartford Wealth Management - Global Annuities
P.O. Box 14293
Lexington, KY 40512-4293
HARTFORDFUNDS
hartfordfunds.com
Hartford Series Fund, Inc. is underwritten and distributed by Hartford Funds Distributors, LLC.
Hartford Series Fund, Inc. inception dates range from 1977 to date. Hartford Series Fund, Inc. is not a subsidiary of The Hartford Financial Services Group, Inc. ("The Hartford") but is underwritten, distributed by and advised by subsidiaries of The Hartford. Investments in Hartford Series Fund, Inc. are not guaranteed by The Hartford or any other entity.
You should carefully consider investment objectives, risks, and charges and expenses of Hartford HLS Funds before investing. This and other information can be found in the Fund’s prospectus or summary prospectus, which can be obtained by calling 800-862-6668. Please read them carefully before you invest or send money.
HLSSAR-IX13 8-13 113545-1 Printed in U.S.A ©2013 The Hartford, Hartford, CT 06115
HARTFORDFUNDS
| HARTFORD INTERNATIONAL
OPPORTUNITIES HLS FUND
2013 Semi Annual Report
|
A MESSAGE FROM THE PRESIDENT
Dear Fellow Shareholders:
I want to take this opportunity to say thank you for investing in the Hartford HLS Funds.
Market Review
During the first half of the year, stocks rose steadily. U.S. equities (as represented by the S&P 500 Index1) posted a strong gain of 10.61% during the first quarter, on their way to an all-time high. During the second quarter, investors persevered through volatility surrounding rumors of the rollback of the U.S. Federal Reserve’s quantitative easing (QE) program later this year, and the S&P 500 Index rose 2.91%. That brought the market’s rise to 13.82% for the first half of 2013. The rumors about QE’s end sent bond yields and mortgage rates upward, but that wasn’t enough to dissuade investors from pushing equities into positive territory.
Because of QE, some have expressed concerns regarding the recent market rally. But a more careful examination of economic data reveals a strong foundation. Consumer balance sheets have improved since the financial crisis, with consumer debt as a percentage of income falling steadily. Housing continued its dogged recovery, fueled by population growth and pent-up demand. In fact, it’s substantive economic improvements that have moved Federal Reserve Chairman Ben Bernanke to consider removing the “training wheels” of QE, which we think should be viewed as a vote of confidence in the U.S. economy going forward.
As the U.S. outlook continues to improve, concerns do remain in the global economy. Emerging markets have lagged due to social unrest and rising inflation. Slowing growth in China is clouding global growth forecasts, but it’s important to remember that China still boasts 7.5% annual GDP growth.
It’s important to stay abreast of domestic and international economic developments while balancing your individual investment goals. Meeting with your financial advisor on a regular basis to examine your current investment strategy can help you determine whether you are on the right track:
| • | Is your portfolio fully diversified with an appropriate mix of stocks and bonds? |
| • | Is your fixed-income portfolio positioned to take advantage of opportunities across the credit spectrum and fulfill your income needs? |
| • | Is your portfolio still in line with your risk tolerance and investment time horizon? |
Your financial professional can help you choose options within our fund family to navigate today’s markets with confidence.
Thank you again for investing with the Hartford HLS Funds.
James Davey
President
Hartford HLS Funds
1 The S&P 500 Index is a market capitalization-weighted price index composed of 500 widely held common stocks.
Hartford International Opportunities HLS Fund
Table of Contents
This report is prepared for the general information of contract owners and qualified retirement plan participants. It is not an offer of contracts or of qualified retirement plans. It should not be used in connection with any offer, except in conjunction with the appropriate product prospectus which contains all pertinent information including the applicable sales, administrative and other charges.
The views expressed in the Fund’s Manager Discussion under ‘‘Why did the Fund perform this way?’’ and ‘‘What is the outlook?’’ are views of the Fund’s sub-adviser and portfolio management team through the end of the period and are subject to change based on market and other conditions. The Fund’s Manager Discussion is for informational purposes only and does not represent an offer, recommendation or solicitation to buy, hold or sell any security. The specific securities identified and described, if any, do not represent all of the securities purchased or sold and you should not assume that investments in the securities identified and discussed will be profitable.
| Hartford International Opportunities HLS Fund inception 07/02/1990 |
| (sub-advised by Wellington Management Company, LLP) |
| Investment objective – Seeks long-term growth of capital. |
Performance Overview 6/30/03 - 6/30/13
The chart above represents the hypothetical growth of a $10,000 investment in Class IA. Growth results in classes other than Class IA will vary from what is seen above due to differences in the expenses charged to those share classes.
| Average Annual Total Returns (as of 6/30/13) |
| 6 Month† | 1 Year | 5 Years | 10 Years | |||||||||||||
| International Opportunities IA | 2.96% | 15.55% | 1.15% | 9.66% | ||||||||||||
| International Opportunities IB | 2.83% | 15.26% | 0.90% | 9.39% | ||||||||||||
| MSCI All Country World ex USA Index | 0.27% | 14.14% | -0.34% | 9.09% | ||||||||||||
| † | Not Annualized |
PERFORMANCE DATA QUOTED REPRESENTS PAST PERFORMANCE AND DOES NOT GUARANTEE FUTURE RESULTS. The investment return and principal value of the investment will fluctuate so that investors’ shares, when redeemed, may be worth more or less than their original cost. Current performance may be lower or higher than the performance data quoted. To obtain performance data current to the most recent month-end, please visit our website www.hartfordfunds.com.
Total returns presented above were calculated using the Fund's net asset value available to shareholders for sale or redemption of Fund shares on June 30, 2013, which may exclude investment transactions as of this date. All share class returns assume the reinvestment of all distributions at net asset value and the deduction of all fund expenses.
MSCI All Country World ex USA Index is a broad-based, unmanaged, market capitalization weighted, total return index that measures the performance of both developed and emerging stock markets, excluding the U.S. The index is calculated to exclude companies and share classes which cannot be freely purchased by foreigners.
You cannot invest directly in an index.
As of the Fund’s current prospectus dated May 1, 2013, the total annual operating expense ratios for Class IA and Class IB shares were 0.74% and 0.99%, respectively. Actual expenses may be higher. Please see the accompanying Financial Highlights for expense ratios for the six-month period ended June 30, 2013.
The chart and table do not reflect the deductions of taxes, sales charges or other fees which may be applied at the variable life insurance, variable annuity or qualified retirement plan product level. Any such additional sales charges or other fees or expenses would lower the contract’s or plan’s performance.
All investments are subject to risk including the possible loss of principal. For a discussion of the Fund’s risks, please see the Principal Risks section. For more detailed information on the risks associated with an investment in the Fund, please see the prospectus.
| 2 |
| Hartford International Opportunities HLS Fund |
| Manager Discussion |
| June 30, 2013 (Unaudited) |
| Portfolio Managers | |
| Nicolas M. Choumenkovitch | Tara Connolly Stilwell, CFA |
| Senior Vice President and Equity Portfolio Manager | Vice President and Equity Portfolio Manager |
How did the Fund perform?
The Class IA of the Hartford International Opportunities HLS Fund returned 2.96% for the six-month period ended June 30, 2013, outperforming its benchmark, the MSCI All Country World ex USA Index, which returned 0.27% for the same period. The Fund also outperformed the 2.27% average return of the Variable Products-Underlying Funds Lipper International Growth Fund peer group, a group of funds with investment strategies similar to those of the Fund.
Why did the Fund perform this way?
Global equities (+6.4%), as measured by the MSCI All Country World Index, gained during the six-month period. Favorable global liquidity dynamics and accommodative monetary policy from central banks around the globe provided a tailwind for stocks, helping investors to look past slowing growth and an increase in lending rates in China. Following a dramatic shift in monetary policy by the Bank of Japan to more aggressive management of a 2% inflation target, Japanese equities soared. U.S. equities also outperformed global indexes, as the U.S. economy appeared relatively stable compared to other countries. Although investors initially reacted negatively to news in May that the Federal Reserve (Fed) might slow its bond-buying program sooner than expected, U.S. equities recovered toward the end of the quarter. Signs of strength in Germany and France partially offset concerns elsewhere in the eurozone. Ongoing European sovereign-debt issues weighed on investors in Greece and Spain. Political unrest in Turkey, Egypt, and Brazil contributed to declines in emerging markets.
Non-U.S. stocks, as measured by the MSCI All Country World ex USA Index, were roughly flat for the period (+0.3%). Eight of the ten sectors in the benchmark posted positive returns, led by Health Care (+13%), Consumer Discretionary (+10%), and Telecommunication Services (+6%), while Materials (-19%) and Energy (-8%) lagged on a relative basis.
The Fund’s outperformance versus its benchmark was primarily due to strong stock selection, particularly within Financials, Materials, and Industrials. This was modestly offset by weaker selection in Consumer Staples and Utilities. Allocation among sectors, a result of the bottom-up stock selection process, also contributed to positive relative returns, largely due to underweight positions (i.e. the Fund’s sector position was less than the benchmark position) in Materials and Energy.
Top contributors to absolute and benchmark-relative performance during the period included Roche (Health Care), Rolls-Royce (Industrials), and MUFG (Financials). Shares of Roche, a Swiss-based global health care company, outperformed as investors became positive on the company's near-term product roll out and future drug pipeline as eleven of fourteen Phase III trials delivered positive results in 2012. Shares of Rolls-Royce, U.K.-based manufacturer of engines and power systems for aircraft, particularly those used for long haul routes, rose as the stock outperformed in the first quarter as investors appreciated the company's steady and visible generation of cash flow. Shares of MUFG, a Japan-based bank, climbed during the period supported by the recovery in the Japanese economy and the improved conditions of its customers who benefit from a weaker yen.
The largest detractors from absolute and benchmark-relative returns were FANUC (Industrials), SABESP (Utilities), and ArcelorMittal (Materials). Shares of FANUC, a Japan-based manufacturer of factory automation machinery, underperformed during the period as the company was not a direct beneficiary of the weakening yen. Additionally, the weakening economic activity in China and the company's exposure to Apple contributed to the stock’s underperformance. Shares of SABESP, a Brazilian water utility company, underperformed as the market became concerned about the sustainability of tariffs in the wake of massive protests throughout Brazil. Shares of ArcelorMittal, a multinational steel manufacturing corporation, underperformed as global economic activity was weaker than expected coupled with excess capacity in the steel sector.
What is the outlook?
At a macro level, we continue to see signs of economic improvement in the developed world, which we expect to remain in a low growth environment and with low interest rates for a while longer. We believe this low growth environment could drive consolidation, and we are working to identify companies with the potential to surprise on the upside and where we see the potential for better capital discipline and improved industry structure. While we believe the risk of a sharp economic decline is reduced, we strive to maintain a well-balanced portfolio with investments that represent diverse economic drivers.
| 3 |
| Hartford International Opportunities HLS Fund |
| Manager Discussion – (continued) |
| June 30, 2013 (Unaudited) |
As is consistent with the investment approach, we continue to look for opportunities at a company-by-company level, focusing on those companies which can deliver improvements in ROIC (return on invested capital) or sustain ROIC for longer than the market anticipates.
At the end of the period, relative to the benchmark we were most overweight Health Care, Industrials and Utilities, and most underweight Energy, Telecommunication Services and Materials. On a regional basis, we ended the period with an overweight to select European countries, including France, Belgium and Italy, and underweight positions in Australia, Canada, South Korea and Germany.
| Diversification by Industry | ||||
| as of June 30, 2013 | ||||
| Industry (Sector) | Percentage of Net Assets | |||
| Automobiles and Components (Consumer Discretionary) | 3.5 | % | ||
| Banks (Financials) | 7.2 | |||
| Capital Goods (Industrials) | 10.5 | |||
| Commercial and Professional Services (Industrials) | 0.2 | |||
| Consumer Durables and Apparel (Consumer Discretionary) | 1.1 | |||
| Consumer Services (Consumer Discretionary) | 3.8 | |||
| Diversified Financials (Financials) | 4.8 | |||
| Energy (Energy) | 4.9 | |||
| Food and Staples Retailing (Consumer Staples) | 1.9 | |||
| Food, Beverage and Tobacco (Consumer Staples) | 8.5 | |||
| Health Care Equipment and Services (Health Care) | 2.4 | |||
| Insurance (Financials) | 8.2 | |||
| Materials (Materials) | 6.5 | |||
| Media (Consumer Discretionary) | 1.3 | |||
| Pharmaceuticals, Biotechnology and Life Sciences (Health Care) | 9.7 | |||
| Real Estate (Financials) | 5.3 | |||
| Retailing (Consumer Discretionary) | 2.0 | |||
| Semiconductors and Semiconductor Equipment (Information Technology) | 3.5 | |||
| Software and Services (Information Technology) | 0.4 | |||
| Technology Hardware and Equipment (Information Technology) | 1.4 | |||
| Telecommunication Services (Services) | 2.1 | |||
| Transportation (Industrials) | 2.9 | |||
| Utilities (Utilities) | 5.7 | |||
| Short-Term Investments | 2.3 | |||
| Other Assets and Liabilities | (0.1 | ) | ||
| Total | 100.0 | % | ||
| Currency Concentration of Securities | ||||
| as of June 30, 2013 | ||||
| Percentage of | ||||
| Description | Net Assets | |||
| Australian Dollar | 0.4 | % | ||
| Brazilian Real | 0.3 | |||
| British Pound | 16.7 | |||
| Canadian Dollar | 4.2 | |||
| Euro | 31.0 | |||
| Hong Kong Dollar | 7.1 | |||
| Indian Rupee | 0.8 | |||
| Japanese Yen | 20.1 | |||
| Malaysian Ringgit | 0.3 | |||
| Mexican New Peso | 0.6 | |||
| Norwegian Krone | 0.5 | |||
| Republic of Korea Won | 0.5 | |||
| Swedish Krona | 1.4 | |||
| Swiss Franc | 8.7 | |||
| Taiwanese Dollar | 1.7 | |||
| United States Dollar | 5.8 | |||
| Other Assets and Liabilities | (0.1 | ) | ||
| Total | 100.0 | % | ||
| 4 |
| Hartford International Opportunities HLS Fund |
| Schedule of Investments |
| June 30, 2013 (Unaudited) |
| (000’s Omitted) |
| Shares or Principal Amount | Market Value ╪ | |||||||
COMMON STOCKS - 96.1% | ||||||||
| Australia - 0.4% | ||||||||
| 592 | Westfield Group REIT | $ | 6,201 | |||||
| Austria - 0.6% | ||||||||
| 327 | Erste Group Bank AG | 8,703 | ||||||
| Belgium - 4.2% | ||||||||
| 501 | Anheuser-Busch InBev N.V. | 45,063 | ||||||
| 396 | Umicore S.A. | 16,440 | ||||||
| 61,503 | ||||||||
| Brazil - 1.1% | ||||||||
| 1,126 | Cia de Saneamento Basico do Estado de Sao Paulo ADR | 11,721 | ||||||
| 279 | Mills Estruturas e Servicos de Engenharia S.A. | 3,777 | ||||||
| 15,498 | ||||||||
| Canada - 4.2% | ||||||||
| 333 | Canadian National Railway Co. | 32,442 | ||||||
| 118 | MEG Energy Corp. ● | 3,243 | ||||||
| 245 | Suncor Energy, Inc. | 7,233 | ||||||
| 328 | Tim Hortons, Inc. | 17,766 | ||||||
| 60,684 | ||||||||
| China - 3.8% | ||||||||
| 12,547 | China Construction Bank | 8,817 | ||||||
| 5,361 | China Pacific Insurance Co., Ltd. | 16,995 | ||||||
| 1,180 | ENN Energy Holdings Ltd. | 6,250 | ||||||
| 17,300 | Lenovo Group Ltd. | 15,572 | ||||||
| 1,900 | Shandong Weigao Group Medical Polymer Co., Ltd. | 2,070 | ||||||
| 1,070 | Sinopharm Medicine Holding Co., Ltd. | 2,675 | ||||||
| 2,135 | Zhongsheng Group Holdings Ltd. | 2,343 | ||||||
| 54,722 | ||||||||
| Cyprus - 0.0% | ||||||||
| 21 | QIWI plc ADR | 478 | ||||||
| Finland - 0.8% | ||||||||
| 154 | Kone Oyj Class B | 12,220 | ||||||
| France - 15.1% | ||||||||
| 406 | Accor S.A. | 14,287 | ||||||
| 273 | Air Liquide | 33,705 | ||||||
| 1,752 | AXA S.A. | 34,543 | ||||||
| 542 | BNP Paribas | 29,653 | ||||||
| 106 | Bureau Veritas S.A. | 2,744 | ||||||
| 159 | Cie Generale d'Optique Essilor International S.A. | 16,937 | ||||||
| 884 | Rexel S.A. | 19,924 | ||||||
| 240 | Safran S.A. | 12,523 | ||||||
| 218 | Sanofi-Aventis S.A. | 22,587 | ||||||
| 206 | Schneider Electric S.A. | 14,951 | ||||||
| 81 | Unibail Rodamco REIT | 18,857 | ||||||
| 220,711 | ||||||||
| Germany - 2.6% | ||||||||
| 56 | Brenntag AG | 8,584 | ||||||
| 97 | Continental AG | 12,915 | ||||||
| 328 | Deutsche Wohnen AG | 5,565 | ||||||
| 175 | Lanxess | 10,561 | ||||||
| 37,625 | ||||||||
| Hong Kong - 3.3% | ||||||||
| 3,603 | AIA Group Ltd. | 15,180 | ||||||
| 3,153 | Kunlun Energy Co., Ltd. | 5,565 | ||||||
| 1,308 | Link (The) REIT | 6,417 | ||||||
| 5,231 | MGM China Holdings Ltd. | 13,880 | ||||||
| 1,202 | Shanghai Fosun Pharmaceutical Co., Ltd. ● | 1,951 | ||||||
| 985 | Shangri-La Asia Ltd. | 1,694 | ||||||
| 7,880 | Skyworth Digital Holdings Ltd. | 3,956 | ||||||
| 48,643 | ||||||||
| India - 0.8% | ||||||||
| 1,577 | ITC Ltd. | 8,581 | ||||||
| 84 | United Spirits Ltd. | 3,060 | ||||||
| 11,641 | ||||||||
| Ireland - 0.6% | ||||||||
| 457 | CRH plc | 9,280 | ||||||
| Italy - 3.7% | ||||||||
| 276 | Banca Generali S.p.A. | 5,942 | ||||||
| 3,236 | Intesa Sanpaolo | 5,179 | ||||||
| 1,260 | Mediaset S.p.A. | 4,745 | ||||||
| 8,342 | Snam S.p.A. | 37,982 | ||||||
| 53,848 | ||||||||
| Japan - 20.1% | ||||||||
| 983 | AEON Co., Ltd. | 12,914 | ||||||
| 498 | Aisin Seiki Co., Ltd. | 19,026 | ||||||
| 307 | Daiichi Sankyo Co., Ltd. | 5,123 | ||||||
| 81 | Daito Trust Construction Co., Ltd. | 7,651 | ||||||
| 371 | Eisai Co., Ltd. | 15,103 | ||||||
| 366 | FamilyMart Co., Ltd. | 15,595 | ||||||
| 223 | Honda Motor Co., Ltd. | 8,285 | ||||||
| 878 | Japan Tobacco, Inc. | 30,988 | ||||||
| 1,528 | Mitsubishi Electric Corp. | 14,278 | ||||||
| 5,523 | Mitsubishi UFJ Financial Group, Inc. | 34,111 | ||||||
| 366 | Mitsui Fudosan Co., Ltd. | 10,760 | ||||||
| 2,020 | Nomura Holdings, Inc. | 14,870 | ||||||
| 194 | Nomura Research Institute Ltd. | 6,307 | ||||||
| 173 | Omron Corp. | 5,161 | ||||||
| 203 | Ono Pharmaceutical Co., Ltd. | 13,791 | ||||||
| 1,595 | Rakuten, Inc. | 18,862 | ||||||
| 436 | Shizuoka Bank Ltd. | 4,703 | ||||||
| 133 | SoftBank Corp. | 7,719 | ||||||
| 1,551 | T&D Holdings, Inc. | 20,743 | ||||||
| 143 | THK Co., Ltd. | 3,000 | ||||||
| 758 | Tokio Marine Holdings, Inc. | 23,903 | ||||||
| 292,893 | ||||||||
| Malaysia - 0.3% | ||||||||
| 4,004 | AirAsia Berhad | 4,029 | ||||||
| Mexico - 0.6% | ||||||||
| 2,064 | Fibra Uno Administracion S.A. REIT | 6,932 | ||||||
| 1,039 | Macquarie Mexico Real Estate Management S.A. de C.V. REIT | 2,245 | ||||||
| 9,177 | ||||||||
| Netherlands - 1.3% | ||||||||
| 72 | ASML Holding N.V. | 5,671 | ||||||
| 449 | NXP Semiconductors N.V. ● | 13,897 | ||||||
| 19,568 | ||||||||
| Norway - 0.5% | ||||||||
| 201 | Algeta ASA ● | 7,633 | ||||||
The accompanying notes are an integral part of these financial statements.
| 5 |
| Hartford International Opportunities HLS Fund |
| Schedule of Investments – (continued) |
| June 30, 2013 (Unaudited) |
| (000’s Omitted) |
| Shares or Principal Amount | Market Value ╪ | |||||||
COMMON STOCKS - 96.1% - (continued) | ||||||||
| Panama - 0.4% | ||||||||
| 47 | Copa Holdings S.A. Class A | $ | 6,164 | |||||
| Portugal - 1.1% | ||||||||
| 731 | Galp Energia SGPS S.A. | 10,836 | ||||||
| 1,491 | Portugal Telecom SGPS S.A. | 5,799 | ||||||
| 16,635 | ||||||||
| South Korea - 0.5% | ||||||||
| 6 | Samsung Electronics Co., Ltd. | 6,496 | ||||||
| Spain - 1.2% | ||||||||
| 1,341 | Telefonica S.A. ● | 17,248 | ||||||
| Sweden - 1.4% | ||||||||
| 520 | Assa Abloy Ab | 20,305 | ||||||
| Switzerland - 8.7% | ||||||||
| 135 | Cie Financiere Richemont S.A. | 11,936 | ||||||
| 9 | Givaudan | 11,520 | ||||||
| 761 | Julius Baer Group Ltd. | 29,713 | ||||||
| 13 | Partners Group | 3,538 | ||||||
| 218 | Roche Holding AG | 54,200 | ||||||
| 977 | UBS AG | 16,583 | ||||||
| 127,490 | ||||||||
| Taiwan - 1.7% | ||||||||
| 6,884 | Taiwan Semiconductor Manufacturing Co., Ltd. | 24,921 | ||||||
| United Kingdom - 16.1% | ||||||||
| 233 | Al Noor Hospitals Group ● | 2,240 | ||||||
| 437 | AstraZeneca plc | 20,678 | ||||||
| 2,885 | BAE Systems plc | 16,804 | ||||||
| 859 | BG Group plc | 14,599 | ||||||
| 4,395 | BP plc | 30,504 | ||||||
| 85 | Derwent London plc REIT | 2,965 | ||||||
| 1,002 | Diageo Capital plc | 28,731 | ||||||
| 2,344 | Direct Line Insurance Group plc | 8,308 | ||||||
| 370 | Great Portland Estates plc | 2,985 | ||||||
| 854 | Hammerson plc REIT | 6,333 | ||||||
| 209 | Imperial Tobacco Group plc | 7,259 | ||||||
| 1,665 | Kingfisher plc | 8,684 | ||||||
| 13,864 | Lloyds Banking Group plc ● | 13,313 | ||||||
| 2,382 | National Grid plc | 27,002 | ||||||
| 864 | NMC Health plc | 3,547 | ||||||
| 1,904 | Rexam plc | 13,818 | ||||||
| 1,537 | Rolls-Royce Holdings plc | 26,472 | ||||||
| 234,242 | ||||||||
| United States - 1.0% | ||||||||
| 212 | Carnival Corp. | 7,276 | ||||||
| 115 | Covidien plc | 7,195 | ||||||
| 14,471 | ||||||||
| Total common stocks | ||||||||
| (cost $1,317,670) | $ | 1,403,029 | ||||||
| PREFERRED STOCKS - 1.7% | ||||||||
| Germany - 1.7% | ||||||||
| 321 | ProSieben Sat.1 Media AG | $ | 13,754 | |||||
| 58 | Volkswagen AG N.V. | 11,693 | ||||||
| 25,447 | ||||||||
| Total preferred stocks | ||||||||
| (cost $25,526) | $ | 25,447 | ||||||
| Total long-term investments (cost $1,343,196) | $ | 1,428,476 | ||||||
| SHORT-TERM INVESTMENTS - 2.3% | ||||||||
| Repurchase Agreements - 2.3% | ||||||||
Bank of America Merrill Lynch TriParty | ||||||||
| $ | 121 | 0.13%, 6/28/2013 | $ | 121 | ||||
| Bank of Montreal TriParty Repurchase Agreement (maturing on 07/01/2013 in the amount of $2,568, collateralized by FHLMC 4.00% - 5.00%, 2023 - 2025, FNMA 2.00% - 5.00%, 2022 - 2042, GNMA 2.00% - 5.00%, 2041 - 2043, value of $2,613) | ||||||||
| 2,568 | 0.15%, 6/28/2013 | 2,568 | ||||||
Bank of Montreal TriParty Repurchase | ||||||||
| 4,989 | 0.12%, 6/28/2013 | 4,989 | ||||||
| Barclays Capital TriParty Repurchase Agreement (maturing on 07/01/2013 in the amount of $3,458, collateralized by U.S. Treasury Note 3.13%, 2021, value of $3,514) | ||||||||
| 3,457 | 0.10%, 6/28/2013 | 3,457 | ||||||
| Citigroup Global Markets, Inc. TriParty Repurchase Agreement (maturing on 07/01/2013 in the amount of $10,189, collateralized by U.S. Treasury Bill 0.85%, 2013, U.S. Treasury Note 0.63% - 3.25%, 2013 - 2018, value of $10,342) | ||||||||
| 10,189 | 0.10%, 6/28/2013 | 10,189 | ||||||
| Deutsche Bank Securities TriParty Repurchase Agreement (maturing on 07/01/2013 in the amount of $121, collateralized by FNMA 4.50%, 2035, value of $123) | ||||||||
| 121 | 0.25%, 6/28/2013 | 121 | ||||||
| RBS Securities, Inc. TriParty Repurchase Agreement (maturing on 07/01/2013 in the amount of $4,086, collateralized by U.S. Treasury Note 1.00% - 2.63%, 2014 - 2020, value of $4,168) | ||||||||
| 4,086 | 0.10%, 6/28/2013 | 4,086 | ||||||
The accompanying notes are an integral part of these financial statements.
| 6 |
| Shares or Principal Amount | Market Value ╪ | |||||||||||
| SHORT-TERM INVESTMENTS - 2.3% - (continued) | ||||||||||||
| Repurchase Agreements - 2.3% - (continued) | ||||||||||||
| TD Securities TriParty Repurchase Agreement (maturing on 07/01/2013 in the amount of $7,206, collateralized by FHLMC 3.50% - 4.00%, 2042, FNMA 3.50% - 4.50%, 2041 - 2042, value of $7,328) | ||||||||||||
| $ | 7,206 | 0.12%, 6/28/2013 | $ | 7,206 | ||||||||
| UBS Securities, Inc. Repurchase Agreement (maturing on 07/01/2013 in the amount of $104, collateralized by U.S. Treasury Note 0.63%, 2014, value of $106) | ||||||||||||
| 104 | 0.09%, 6/28/2013 | 104 | ||||||||||
| 32,841 | ||||||||||||
| Total short-term investments | ||||||||||||
| (cost $32,841) | $ | 32,841 | ||||||||||
| Total investments | ||||||||||||
| (cost $1,376,037) ▲ | 100.1 | % | $ | 1,461,317 | ||||||||
| Other assets and liabilities | (0.1 | )% | (2,173 | ) | ||||||||
| Total net assets | 100.0 | % | $ | 1,459,144 | ||||||||
| Note: | Percentage of investments as shown is the ratio of the total market value to total net assets. |
| Prices of foreign equities that are principally traded on certain foreign markets may be adjusted daily pursuant to a fair value pricing service approved by the Board of Directors in order to reflect an adjustment for factors occurring after the close of certain foreign markets but before the close of the New York Stock Exchange. |
| ▲ | At June 30, 2013, the cost of securities for federal income tax purposes was $1,390,602 and the aggregate gross unrealized appreciation and depreciation based on that cost were: |
| Unrealized Appreciation | $ | 127,975 | ||
| Unrealized Depreciation | (57,260 | ) | ||
| Net Unrealized Appreciation | $ | 70,715 |
| ● | Non-income producing. |
The accompanying notes are an integral part of these financial statements.
| 7 |
| Hartford International Opportunities HLS Fund |
| Schedule of Investments – (continued) |
| June 30, 2013 (Unaudited) |
| (000’s Omitted) |
| Foreign Currency Contracts Outstanding at June 30, 2013 |
| Currency | Buy / Sell | Delivery Date | Counterparty | Contract Amount | Market Value ╪ | Unrealized Appreciation/ (Depreciation) | ||||||||||||
| AUD | Sell | 07/01/2013 | CBA | $ | 2,131 | $ | 2,089 | $ | 42 | |||||||||
| CAD | Sell | 07/03/2013 | BCLY | 524 | 522 | 2 | ||||||||||||
| CAD | Sell | 07/12/2013 | BCLY | 770 | 767 | 3 | ||||||||||||
| CAD | Sell | 07/02/2013 | CSFB | 312 | 312 | – | ||||||||||||
| CAD | Sell | 07/11/2013 | CSFB | 455 | 454 | 1 | ||||||||||||
| CHF | Buy | 07/03/2013 | UBS | 2,900 | 2,901 | 1 | ||||||||||||
| EUR | Buy | 07/01/2013 | DEUT | 2,460 | 2,464 | 4 | ||||||||||||
| EUR | Buy | 07/02/2013 | DEUT | 3,884 | 3,878 | (6 | ) | |||||||||||
| EUR | Buy | 07/03/2013 | HSBC | 2,136 | 2,136 | – | ||||||||||||
| GBP | Buy | 07/03/2013 | BCLY | 1,452 | 1,452 | – | ||||||||||||
| GBP | Buy | 07/02/2013 | UBS | 723 | 721 | (2 | ) | |||||||||||
| GBP | Sell | 07/01/2013 | NAB | 137 | 136 | 1 | ||||||||||||
| HKD | Sell | 07/02/2013 | DEUT | 407 | 407 | – | ||||||||||||
| HKD | Sell | 07/03/2013 | JPM | 5,294 | 5,295 | (1 | ) | |||||||||||
| JPY | Buy | 07/03/2013 | JPM | 2,214 | 2,211 | (3 | ) | |||||||||||
| $ | 42 | |||||||||||||||||
| ╪ | See Significant Accounting Policies of accompanying Notes to Financial Statements regarding valuation of securities. |
| GLOSSARY: (abbreviations used in preceding Schedule of Investments) | |
| Counterparty Abbreviations: | |
| BCLY | Barclays |
| CBA | Commonwealth Bank of Australia |
| CSFB | Credit Suisse First Boston Corp. |
| DEUT | Deutsche Bank Securities, Inc. |
| HSBC | HSBC Bank USA |
| JPM | JP Morgan Chase & Co. |
| NAB | National Australia Bank |
| UBS | UBS AG |
| Currency Abbreviations: | |
| AUD | Australian Dollar |
| CAD | Canadian Dollar |
| CHF | Swiss Franc |
| EUR | EURO |
| GBP | British Pound |
| HKD | Hong Kong Dollar |
| JPY | Japanese Yen |
| Other Abbreviations: | |
| ADR | American Depositary Receipt |
| FHLB | Federal Home Loan Bank |
| FHLMC | Federal Home Loan Mortgage Corp. |
| FNMA | Federal National Mortgage Association |
| GNMA | Government National Mortgage Association |
| REIT | Real Estate Investment Trust |
The accompanying notes are an integral part of these financial statements.
| 8 |
| Hartford International Opportunities HLS Fund |
| Investment Valuation Hierarchy Level Summary |
| June 30, 2013 (Unaudited) |
| (000’s Omitted) |
| Total | Level 1 ♦ | Level 2 ♦ | Level 3 | |||||||||||||
| Assets: | ||||||||||||||||
| Common Stocks ‡ | $ | 1,403,029 | $ | 140,135 | $ | 1,262,894 | $ | – | ||||||||
| Preferred Stocks | 25,447 | – | 25,447 | – | ||||||||||||
| Short-Term Investments | 32,841 | – | 32,841 | – | ||||||||||||
| Total | $ | 1,461,317 | $ | 140,135 | $ | 1,321,182 | $ | – | ||||||||
| Foreign Currency Contracts * | 54 | – | 54 | – | ||||||||||||
| Total | $ | 54 | $ | – | $ | 54 | $ | – | ||||||||
| Liabilities: | ||||||||||||||||
| Foreign Currency Contracts * | 12 | – | 12 | – | ||||||||||||
| Total | $ | 12 | $ | – | $ | 12 | $ | – | ||||||||
| ♦ | For the six-month period ended June 30, 2013, investments valued at $24,261 were transferred from Level 1 to Level 2, and investments valued at $39,580 were transferred from Level 2 to Level 1. Investments are transferred between Level 1 and Level 2 for a variety of reasons including, but not limited to: |
| 1) | Foreign equities for which a fair value price is more representative of exit value than the local market close (transfer into Level 2). Foreign equities for which the local market close is more representative of exit value (transfer into Level 1). |
| 2) | U.S. Treasury securities that no longer represent the most recent issue (transfer into Level 2). |
| 3) | Equity investments with no observable trading but a bid or close price is used (transfer into Level 2). Equity investments using observable quoted prices in an active market (transfer into Level 1). |
| ‡ | The Fund has all or primarily all of the equity securities categorized in a particular level. Refer to the Schedule of Investments for further industry breakout. |
| * | Derivative instruments not reflected in the Schedule of Investments are valued at the unrealized appreciation/depreciation on the investments. |
The accompanying notes are an integral part of these financial statements.
| 9 |
| Hartford International Opportunities HLS Fund |
| Statement of Assets and Liabilities |
| June 30, 2013 (Unaudited) |
| (000’s Omitted) |
| Assets: | ||||
| Investments in securities, at market value (cost $1,376,037) | $ | 1,461,317 | ||
| Foreign currency on deposit with custodian (cost $704) | 704 | |||
| Unrealized appreciation on foreign currency contracts | 54 | |||
| Receivables: | ||||
| Investment securities sold | 22,120 | |||
| Fund shares sold | 1,451 | |||
| Dividends and interest | 4,856 | |||
| Total assets | 1,490,502 | |||
| Liabilities: | ||||
| Unrealized depreciation on foreign currency contracts | 12 | |||
| Bank overdraft | 581 | |||
| Payables: | ||||
| Investment securities purchased | 29,283 | |||
| Fund shares redeemed | 1,173 | |||
| Investment management fees | 163 | |||
| Distribution fees | 8 | |||
| Accrued expenses | 138 | |||
| Total liabilities | 31,358 | |||
| Net assets | $ | 1,459,144 | ||
| Summary of Net Assets: | ||||
| Capital stock and paid-in-capital | $ | 1,943,419 | ||
| Undistributed net investment income | 49,260 | |||
| Accumulated net realized loss | (618,793 | ) | ||
| Unrealized appreciation of investments and the translations of assets and liabilities denominated in foreign currency | 85,258 | |||
| Net assets | $ | 1,459,144 | ||
| Shares authorized | 2,625,000 | |||
| Par value | $ | 0.001 | ||
| Class IA: Net asset value per share | $ | 13.00 | ||
| Shares outstanding | 96,509 | |||
| Net assets | $ | 1,254,902 | ||
| Class IB: Net asset value per share | $ | 13.13 | ||
| Shares outstanding | 15,561 | |||
| Net assets | $ | 204,242 |
The accompanying notes are an integral part of these financial statements.
| 10 |
| Hartford International Opportunities HLS Fund |
| Statement of Operations |
| For the Six-Month Period Ended June 30, 2013 (Unaudited) |
| (000’s Omitted) |
| Investment Income: | ||||
| Dividends | $ | 29,779 | ||
| Interest | 19 | |||
| Less: Foreign tax withheld | (3,275 | ) | ||
| Total investment income, net | 26,523 | |||
| Expenses: | ||||
| Investment management fees | 5,155 | |||
| Transfer agent fees | 2 | |||
| Distribution fees - Class IB | 268 | |||
| Custodian fees | 109 | |||
| Accounting services fees | 121 | |||
| Board of Directors' fees | 20 | |||
| Audit fees | 16 | |||
| Other expenses | 196 | |||
| Total expenses (before fees paid indirectly) | 5,887 | |||
| Commission recapture | (25 | ) | ||
| Custodian fee offset | — | |||
| Total fees paid indirectly | (25 | ) | ||
| Total expenses, net | 5,862 | |||
| Net Investment Income | 20,661 | |||
| Net Realized Gain on Investments and Foreign Currency Transactions: | ||||
| Net realized gain on investments | 103,506 | |||
| Net realized gain on foreign currency contracts | 1,538 | |||
| Net realized loss on other foreign currency transactions | (1,851 | ) | ||
| Net Realized Gain on Investments and Foreign Currency Transactions | 103,193 | |||
| Net Changes in Unrealized Depreciation of Investments and Foreign Currency Transactions: | ||||
| Net unrealized depreciation of investments | (78,458 | ) | ||
| Net unrealized appreciation of foreign currency contracts | 45 | |||
| Net unrealized depreciation on translation of other assets and liabilities in foreign currencies | (70 | ) | ||
| Net Changes in Unrealized Depreciation of Investments and Foreign Currency Transactions | (78,483 | ) | ||
| Net Gain on Investments and Foreign Currency Transactions | 24,710 | |||
| Net Increase in Net Assets Resulting from Operations | $ | 45,371 |
The accompanying notes are an integral part of these financial statements.
| 11 |
| Hartford International Opportunities HLS Fund |
| Statement of Changes in Net Assets |
| (000’s Omitted) |
| For the Six-Month Period Ended June 30, 2013 (Unaudited) | For the | |||||||
| Operations: | ||||||||
| Net investment income | $ | 20,661 | $ | 28,213 | ||||
| Net realized gain on investments and foreign currency transactions | 103,193 | 18,671 | ||||||
| Net unrealized appreciation (depreciation) of investments and foreign currency transactions | (78,483 | ) | 235,594 | |||||
| Net Increase in Net Assets Resulting from Operations | 45,371 | 282,478 | ||||||
| Distributions to Shareholders: | ||||||||
| From net investment income | ||||||||
| Class IA | — | (24,562 | ) | |||||
| Class IB | — | (3,573 | ) | |||||
| Total distributions | — | (28,135 | ) | |||||
| Capital Share Transactions: | ||||||||
| Class IA | ||||||||
| Sold | 61,015 | 85,672 | ||||||
| Issued on reinvestment of distributions | — | 24,562 | ||||||
| Redeemed | (148,362 | ) | (311,056 | ) | ||||
| Total capital share transactions | (87,347 | ) | (200,822 | ) | ||||
| Class IB | ||||||||
| Sold | 14,088 | 23,016 | ||||||
| Issued on reinvestment of distributions | — | 3,573 | ||||||
| Redeemed | (36,876 | ) | (76,826 | ) | ||||
| Total capital share transactions | (22,788 | ) | (50,237 | ) | ||||
| Net decrease from capital share transactions | (110,135 | ) | (251,059 | ) | ||||
| Net Increase (Decrease) in Net Assets | (64,764 | ) | 3,284 | |||||
| Net Assets: | ||||||||
| Beginning of period | 1,523,908 | 1,520,624 | ||||||
| End of period | $ | 1,459,144 | $ | 1,523,908 | ||||
| Undistributed (distribution in excess of) net investment income | $ | 49,260 | $ | 28,599 | ||||
| Shares: | ||||||||
| Class IA | ||||||||
| Sold | 4,658 | 7,362 | ||||||
| Issued on reinvestment of distributions | — | 2,110 | ||||||
| Redeemed | (11,335 | ) | (26,480 | ) | ||||
| Total share activity | (6,677 | ) | (17,008 | ) | ||||
| Class IB | ||||||||
| Sold | 1,060 | 1,956 | ||||||
| Issued on reinvestment of distributions | — | 303 | ||||||
| Redeemed | (2,790 | ) | (6,476 | ) | ||||
| Total share activity | (1,730 | ) | (4,217 | ) | ||||
The accompanying notes are an integral part of these financial statements.
| 12 |
| Hartford International Opportunities HLS Fund |
| Notes to Financial Statements |
| June 30, 2013 (Unaudited) |
| (000’s Omitted) |
| 1. | Organization: |
Hartford International Opportunities HLS Fund (the “Fund”) serves as an underlying investment option for certain variable annuity and variable life insurance separate accounts of Hartford Life Insurance Company (“HLIC”) and its affiliates and certain qualified retirement plans. The Fund may also serve as an underlying investment option for certain variable annuity and variable life separate accounts of other insurance companies. Owners of variable annuity contracts and policyholders of variable life insurance contracts may choose the funds permitted in the variable insurance contract prospectus. In addition, participants in certain qualified retirement plans may choose the Fund if permitted by their plans.
Hartford Series Fund, Inc. (the “Company”) is an open-end registered management investment company comprised of thirty portfolios. Financial statements for the Fund, a series of the Company, are included in this report.
The Company is organized under the laws of the State of Maryland and is registered with the Securities and Exchange Commission (“SEC”) under the Investment Company Act of 1940, as amended (“1940 Act”). The Fund is a diversified open-end management investment company.
The Fund is divided into Class IA and Class IB shares. Each class is offered at the per share net asset value (“NAV”) without a sales charge and is subject to the same expenses, except that the Class IB shares are subject to distribution and service fees charged pursuant to a Distribution Plan adopted in accordance with Rule 12b-1 under the 1940 Act.
| 2. | Significant Accounting Policies: |
The following is a summary of significant accounting policies of the Fund in the preparation of its financial statements, which are in accordance with the United States Generally Accepted Accounting Principles (“U.S. GAAP”). The preparation of financial statements in accordance with U.S. GAAP may require management to make estimates and assumptions that affect the reported amounts of assets and liabilities and disclosure of contingent assets and liabilities at the date of the financial statements and the reported amounts of increases and decreases in net assets from operations during the reporting period. Actual results could differ from those estimates.
| a) | Determination of Net Asset Value – The NAV of each class of the Fund’s shares is determined as of the close of regular trading (normally 4:00 p.m. Eastern Time) (the “NYSE Close”) on each day that the New York Stock Exchange (the “Exchange”) is open (“Valuation Date”). Information that becomes known to the Fund after the NAV has been calculated on a particular day will not generally be used to retroactively adjust the NAV determined earlier that day. |
| b) | Investment Valuation and Fair Value Measurements – For purposes of calculating the NAV, portfolio investments and other assets held by the Fund's portfolio for which market quotes are readily available are valued at market value. Market value is generally determined on the basis of last reported sales prices or official close price. If no sales are reported, market value is based on quotes obtained from a quotation reporting system, established market makers, or independent pricing services. If market prices are not readily available or are deemed unreliable, the Fund will use the fair value of the investment as determined in good faith under policies and procedures established by and under the supervision of the Company’s Board of Directors. Market quotes are considered not readily available where there is an absence of current or reliable market-based data (e.g., trade information or indicative market quotes), including where events occur after the close of the relevant market, but prior to the NYSE Close that materially affect the values of the Fund’s portfolio investments or assets. In addition, market quotes are considered not readily available when, due to extraordinary circumstances, the exchanges or markets on which the investments trade do not open for trading for the entire day and no other market prices are available. In addition, prices of foreign equities that are principally traded on certain foreign markets may be adjusted daily pursuant to a fair value pricing service approved by the Board of Directors in order to reflect an adjustment for the factors occurring after the close of certain foreign markets but before the NYSE Close. Investments that are primarily traded on foreign markets may trade on days that are not business days of the Fund. The value of the foreign investments in which the Fund invests may change on days when a shareholder will not be able to purchase or redeem shares of the Fund. Fair value pricing is subjective in nature and the use of fair value pricing by the Fund may cause the NAV of its shares to differ significantly from the NAV that would have been calculated using |
| 13 |
| Hartford International Opportunities HLS Fund |
| Notes to Financial Statements – (continued) |
| June 30, 2013 (Unaudited) |
| (000’s Omitted) |
market prices at the close of the exchange on which a portfolio investment is primarily traded. There can be no assurance that the Fund could obtain the fair market value assigned to an investment if the Fund were to sell the investment at approximately the time at which the Fund determines its NAV.
Investments valued in currencies other than U.S. dollars are converted to U.S. dollars using exchange rates obtained from independent pricing services for calculation of the NAV. As a result, the NAV of the Fund’s shares may be affected by changes in the value of currencies in relation to the U.S. dollar. The value of investments traded in markets outside the United States or denominated in currencies other than the U.S. dollar may be affected significantly on a day that the NYSE is closed and the market value may change on days when an investor is not able to purchase, redeem or exchange shares of the Fund.
Foreign currency contracts represent agreements to exchange currencies on specific future dates at predetermined rates. Foreign currency contracts are valued using foreign currency exchange rates and forward rates as provided by an independent pricing service on the Valuation Date.
Financial instruments for which prices are not available from an independent pricing service may be valued using market quotations obtained from one or more dealers that make markets in the respective financial instrument in accordance with procedures established by the Company’s Board of Directors.
U.S. GAAP defines fair value as the price that the Fund would receive to sell an asset or pay to transfer a liability in an orderly transaction between market participants. The U.S. GAAP fair value measurement standards require disclosure of a fair value hierarchy for each major category of assets and liabilities. Various inputs are used in determining the fair value of the Fund’s investments. These inputs are summarized into three broad hierarchy levels. This hierarchy is based on whether the valuation inputs are observable or unobservable. These levels are:
| · | Level 1 – Quoted prices in active markets for identical investments. Level 1 may include exchange traded instruments, such as domestic equities, some foreign equities, options, futures, mutual funds, exchange traded funds, rights and warrants. |
| · | Level 2 – Observable inputs other than Level 1 prices, such as quoted prices for similar investments; quoted prices in markets that are not active; or other inputs that are observable or can be corroborated by observable market data. Level 2 may include debt investments that are traded less frequently than exchange traded instruments and which are valued using independent pricing services; foreign equities, which are principally traded on certain foreign markets and are adjusted daily pursuant to a fair value pricing service in order to reflect an adjustment for the factors occurring after the close of certain foreign markets but before the NYSE Close; and short-term investments, which are valued at amortized cost. |
| · | Level 3 – Significant unobservable inputs that are supported by limited or no market activity. Level 3 may include financial instruments whose values are determined using indicative market quotes or require significant management judgment or estimation. These unobservable valuation inputs may include estimates for current yields, maturity/duration, prepayment speed, and indicative market quotes for comparable investments along with other assumptions relating to credit quality, collateral value, complexity of the investment structure, general market conditions and liquidity. This category may include investments where trading has been halted or there are certain restrictions on trading. While these investments are priced using unobservable inputs, the valuation of these investments reflects the best available data and management believes the prices are a reasonable representation of exit price. |
The Board of Directors of the Company generally reviews and approves the “Procedures for Valuation of Portfolio Securities” on an annual basis. These procedures define how investments are to be valued, including the formation and activities of a Valuation Committee. The Valuation Committee is responsible for determining in good faith the fair value of investments when the value cannot be obtained from primary pricing services or alternative sources or if the valuation of an investment as provided by the primary pricing service or alternative source is believed not to reflect the investment’s fair value as of the Valuation Date. Members of the Valuation
| 14 |
Committee include the Fund’s Treasurer or designee, a Vice President of the Fund with legal expertise or designee, and a Vice President of the investment manager or designee. In addition, the Fund’s Chief Compliance Officer shall designate a member of the compliance group to attend Valuation Committee meetings as a non-voting resource, to monitor for and provide guidance with respect to compliance with these procedures. Two members of the Valuation Committee or their designees, representing different departments, shall constitute a quorum for purposes of permitting the Valuation Committee to take action. The Valuation Committee will consider all relevant factors in determining an investment’s fair value, and may seek the advice of the Fund’s sub-adviser, knowledgeable brokers, and legal counsel in making such determination. The Valuation Committee reports to the Audit Committee of the Company’s Board of Directors. The Audit Committee receives quarterly written reports which include details of all fair-valued investments, including the reason for the fair valuation, and an indication, when possible, of the accuracy of the valuation by disclosing the next available reliable public price quotation or the disposition price of such investments (the “look-back” test). The Board of Directors then must consider for ratification all of the fair value determinations made during the previous quarter.
Valuation levels are not necessarily indicative of the risk associated with investing in such investments. Individual investments within any of the above mentioned asset classes may be assigned a different hierarchical level than those presented above, as individual circumstances dictate.
For additional information, refer to the Investment Valuation Hierarchy Level Summary and the Level 3 roll-forward reconciliation, if applicable, which follow the Schedule of Investments.
For purposes of reporting transfers between different hierarchy levels, both transfers in and out of each level, as applicable, are shown as if they occurred at the beginning of the period.
| c) | Investment Transactions and Investment Income – Investment transactions are recorded as of the trade date (the date the order to buy or sell is executed) for financial reporting purposes. Investments purchased or sold on a when-issued or delayed-delivery basis may be settled a month or more after the trade date. Realized gains and losses are determined on the basis of identified cost. |
Dividend income from domestic securities is accrued on the ex-dividend date. In general, dividend income from foreign securities is recorded on the ex-date; however, dividend notifications in certain foreign jurisdictions may not be available in a timely manner and as a result, the Fund will record the dividend as soon as the relevant details (i.e., rate per share, payment date, shareholders of record, etc.) are publicly available. Interest income, including amortization of premium and accretion of discounts, is accrued on a daily basis.
| d) | Foreign Currency Transactions – Assets and liabilities denominated in currencies other than U.S. dollars are translated into U.S. dollars at the exchange rates in effect on the valuation date. Purchases and sales of investments, income, and expenses are translated into U.S. dollars at the exchange rates on the dates of such transactions. |
The Fund does not isolate that portion of portfolio investment valuation resulting from fluctuations in the foreign currency exchange rates from the fluctuations arising from changes in the market prices of investments held. Exchange rate fluctuations are included with the net realized and unrealized gain or loss on investments in the accompanying financial statements.
Net realized foreign exchange gains or losses arise from sales of foreign currencies and the difference between asset and liability amounts initially stated in foreign currencies and the U.S. dollar value of the amounts actually received or paid. Net unrealized foreign exchange gains or losses arise from changes in the value of other assets and liabilities at the end of the reporting period, resulting from changes in the exchange rates.
| 15 |
Hartford International Opportunities HLS Fund
Notes to Financial Statements – (continued)
June 30, 2013 (Unaudited)
(000’s Omitted)
| e) | Joint Trading Account – The Fund may invest cash balances into a joint trading account that may be invested in one or more repurchase agreements. |
| f) | Fund Share Valuation and Dividend Distributions to Shareholders – Orders for the Fund’s shares are executed in accordance with the investment instructions of the contract holders and plan participants. The NAV of the Fund’s shares is determined as of the close of business on each business day of the Exchange. The NAV is determined separately for each class of shares of the Fund by dividing the Fund’s net assets attributable to that class by the number of shares of the class outstanding. Each class of shares offered by the Fund has equal rights as to assets and voting privileges (except that shareholders of a class have exclusive voting rights regarding any matter relating solely to that class of shares). Income and non-class specific expenses are allocated daily to each class on the basis of the relative net assets of the class. Realized and unrealized capital gains and losses are allocated daily based on the relative net assets of each class of shares of the Fund. |
Orders for the purchase of the Fund’s shares received prior to the close of the Exchange on any day the Exchange is open for business are priced at the NAV determined as of the close of the Exchange. Orders received after the close of the Exchange, or on a day on which the Exchange and/or the Fund is not open for business, are priced at the next determined NAV.
Dividends are declared pursuant to a policy adopted by the Company’s Board of Directors based upon the investment performance of the Fund. The policy of the Fund is to pay dividends from net investment income and realized capital gains, if any, at least once a year.
Distributions from net investment income, net realized capital gains and capital are determined in accordance with federal income tax regulations, which may differ from U.S. GAAP with respect to character and timing. These differences may include but are not limited to losses deferred due to wash sale adjustments, foreign currency gains and losses, adjustments related to Passive Foreign Investment Companies (“PFICs”), Real Estate Investment Trusts (“REITs”), Regulated Investment Companies (“RICs”), certain derivatives and partnerships. Permanent book and federal income tax basis differences relating to shareholder distributions will result in reclassifications to certain of the Fund’s capital accounts (see Federal Income Taxes: Reclassification of Capital Accounts note).
| 3. | Securities and Other Investments: |
| a) | Repurchase Agreements – A repurchase agreement is an agreement by which a counterparty agrees to sell an investment and agrees to repurchase the investment sold from the buyer at a mutually agreed upon time and price. During the period of the repurchase agreement, the counterparty will deposit cash and or securities in a third party custodial account to serve as collateral. At the time the Fund enters into a repurchase agreement, the value of the underlying collateral, including accrued interest, will be equal to or exceed the value of the repurchase agreement. Repurchase agreements expose the Fund to counterparty risk - that is, the risk that the counterparty will not fulfill its obligations. To minimize counterparty risk, the investments that serve to collateralize the repurchase agreement are held by the Fund’s custodian in book entry or physical form in the custodial account of the Fund or in a third party custodial account. Repurchase agreements are valued at cost plus accrued interest, which approximates fair value. Repurchase agreements have master netting agreements which allow the Fund to offset amounts owed to a counterparty with amounts owed by the counterparty, including any collateral. The Fund, as shown on the Schedule of Investments, had outstanding repurchase agreements as of June 30, 2013. |
| b) | Illiquid and Restricted Investments – The Fund is permitted to invest up to 15% of its net assets in illiquid investments. Illiquid investments are those that may not be sold or disposed of in the ordinary course of business within seven days, at approximately the price used to determine the Fund’s NAV. The Fund may not be able to sell illiquid investments when its sub-adviser considers it desirable to do so or may have to sell such investments at a price that is lower than the price that could be obtained if the investments were more liquid. A sale of illiquid investments may require more time and may result in higher dealer discounts and other selling expenses than does the sale of those that are liquid. Illiquid |
| 16 |
investments also may be more difficult to value due to the unavailability of reliable market quotations for such investments, and an investment in them may have an adverse impact on the Fund’s NAV. The Fund may also purchase certain restricted investments that can only be resold to certain qualified investors and may be determined to be liquid pursuant to policies and guidelines established by the Company’s Board of Directors. The Fund had no illiquid or restricted investments as of June 30, 2013.
| c) | Investments Purchased on a When-Issued or Delayed-Delivery Basis – Delivery and payment for investments that have been purchased by the Fund on a forward commitment, or when-issued or delayed-delivery basis, take place beyond the customary settlement period. A fund may dispose of or renegotiate a delayed-delivery transaction after it is entered into, and may sell delayed-delivery investments before they are delivered, which may result in a realized gain or loss. During this period, such investments are subject to market fluctuations, and the Fund identifies investments segregated in its records with a value at least equal to the amount of the commitment. As of June 30, 2013, the Fund had no outstanding when-issued or delayed-delivery investments. |
| 4. | Financial Derivative Instruments: |
The following disclosures contain information on how and why the Fund uses derivative instruments, the credit-risk-related contingent features in certain derivative instruments, and how derivative instruments affect the Fund’s financial position and results of operations. The location and fair value amounts of these instruments on the Statement of Assets and Liabilities and the realized gains and losses and changes in unrealized gains and losses on the Statement of Operations, each categorized by type of derivative contract, are included in the following Additional Derivative Instrument Information footnote. The derivative instruments outstanding as of period-end are disclosed in the notes to or within the Schedule of Investments for purchased options, if applicable. The amounts of realized gains and losses and changes in unrealized gains and losses on derivative instruments during the period are disclosed in the Statement of Operations.
| a) | Foreign Currency Contracts – The Fund may enter into foreign currency contracts that obligate the Fund to purchase or sell currencies at specified future dates. Foreign currency contracts are used to hedge the currency exposure associated with some or all of the Fund’s investments and/or as part of an investment strategy. Foreign currency contracts are marked to market daily and the change in value is recorded by the Fund as an unrealized gain or loss. The Fund will record a realized gain or loss when the foreign currency contract is settled. |
Foreign currency contracts involve elements of market risk in excess of the amounts reflected in the Statement of Assets and Liabilities. In addition, risks may arise upon entering into these contracts from the potential inability of the counterparties to meet the terms of the contracts and from unanticipated movements in the value of the foreign currencies relative to the U.S. dollar. The Fund had outstanding foreign currency contracts as shown on the Schedule of Investments as of June 30, 2013.
| 17 |
Hartford International Opportunities HLS Fund
Notes to Financial Statements – (continued)
June 30, 2013 (Unaudited)
(000’s Omitted)
| b) | Additional Derivative Instrument Information: |
Fair Value of Derivative Instruments on the Statement of Assets and Liabilities as of June 30, 2013:
| Risk Exposure Category | ||||||||||||||||||||||||||||
| Interest Rate Contracts | Foreign Exchange Contracts | Credit Contracts | Equity Contracts | Commodity Contracts | Other Contracts | Total | ||||||||||||||||||||||
| Assets: | ||||||||||||||||||||||||||||
| Unrealized appreciation on foreign currency contracts | $ | — | $ | 54 | $ | — | $ | — | $ | — | $ | — | $ | 54 | ||||||||||||||
| Total | $ | — | $ | 54 | $ | — | $ | — | $ | — | $ | — | $ | 54 | ||||||||||||||
| Liabilities: | ||||||||||||||||||||||||||||
| Unrealized depreciation on foreign currency contracts | $ | — | $ | 12 | $ | — | $ | — | $ | — | $ | — | $ | 12 | ||||||||||||||
| Total | $ | — | $ | 12 | $ | — | $ | — | $ | — | $ | — | $ | 12 | ||||||||||||||
The volume of derivatives that is presented in the Schedule of Investments is consistent with the derivative activity during the six-month period ended June 30, 2013.
The Effect of Derivative Instruments on the Statement of Operations for the six-month period ended June 30, 2013:
| Risk Exposure Category | ||||||||||||||||||||||||||||
| Interest Rate Contracts | Foreign Exchange Contracts | Credit Contracts | Equity Contracts | Commodity Contracts | Other Contracts | Total | ||||||||||||||||||||||
| Realized Gain on Derivatives Recognized as a Result of Operations: | ||||||||||||||||||||||||||||
| Net realized gain on foreign currency contracts | $ | — | $ | 1,538 | $ | — | $ | — | $ | — | $ | — | $ | 1,538 | ||||||||||||||
| Total | $ | — | $ | 1,538 | $ | — | $ | — | $ | — | $ | — | $ | 1,538 | ||||||||||||||
| Net Change in Unrealized Appreciation (Depreciation) on Derivatives Recognized as a Result of Operations: | ||||||||||||||||||||||||||||
| Net change in unrealized appreciation of foreign currency contracts | $ | — | $ | 45 | $ | — | $ | — | $ | — | $ | — | $ | 45 | ||||||||||||||
| Total | $ | — | $ | 45 | $ | — | $ | — | $ | — | $ | — | $ | 45 | ||||||||||||||
| c) | Balance Sheet Offsetting Information: |
Set forth below are tables which disclose both gross information and net information about instruments and transactions eligible for offset in the financial statements, and instruments and transactions that are subject to a master netting agreement, as well as amounts related to margin, reflected as financial collateral (including cash collateral), held at clearing brokers, counterparties, and the Fund’s custodian. The master netting agreements allow the clearing brokers to net any collateral held in or on behalf of the Fund, or liabilities or payment obligations of the clearing brokers to the Fund, against any liabilities or payment obligations of the Fund to the clearing brokers. The Fund is required to deposit financial collateral (including cash collateral) at the Fund’s custodian on behalf of clearing brokers and counterparties to continually meet the original and maintenance requirements established by the clearing brokers and counterparties. Such requirements are specific to the respective clearing broker or counterparty.
| 18 |
Offsetting of Financial Assets and Derivative Assets as of June 30, 2013:
| Description | Gross Amounts of Recognized Assets | Gross Amounts Offset in Statement of Assets and Liabilities | Net Amounts of Assets Presented in Statement of Assets and Liabilities | Financial Instruments with Allowable Netting | Collateral Received | Net Amount (not less than 0) | ||||||||||||||||||
| Repurchase Agreements | $ | 32,841 | $ | — | $ | 32,841 | $ | — | $ | (33,394 | ) | $ | — | |||||||||||
| Unrealized appreciation on foreign currency contracts | 54 | — | 54 | (5 | ) | — | 49 | |||||||||||||||||
| Total subject to a master netting or similar arrangement | $ | 32,895 | $ | — | $ | 32,895 | $ | (5 | ) | $ | (33,394 | ) | $ | 49 | ||||||||||
Offsetting of Financial Liabilities and Derivative Liabilities as of June 30, 2013:
| Description | Gross Amounts of Recognized Liabilities | Gross Amounts Offset in Statement of Assets and Liabilities | Net Amounts of Assets Presented in Statement of Assets and Liabilities | Financial Instruments with Allowable Netting | Collateral Pledged | Net Amount (not less than 0) | ||||||||||||||||||
| Unrealized depreciation on foreign currency contracts | $ | 12 | $ | — | $ | 12 | $ | (5 | ) | $ | — | $ | 7 | |||||||||||
| Total subject to a master netting or similar arrangement | $ | 12 | $ | — | $ | 12 | $ | (5 | ) | $ | — | $ | 7 | |||||||||||
| 5. | Principal Risks: |
| a) | Counterparty Risk – The Fund may be exposed to counterparty risk, or the risk that an institution or other entity with which the Fund has unsettled or open transactions will default. |
| b) | Market Risks – If the Fund invests directly in foreign currencies or in securities that trade in, and receive revenues in, foreign currencies, or in derivatives that provide exposure to foreign currencies, it will be subject to the risk that those currencies will decline in value relative to the base currency of the Fund, or, in the case of hedging positions, that the Fund’s base currency will decline in value relative to the currency being hedged. Currency rates in foreign countries may fluctuate significantly over short periods of time for a number of reasons, including changes in interest rates, intervention (or the failure to intervene) by U.S. or foreign governments, central banks or supranational entities, such as the International Monetary Fund, or by the imposition of currency controls or other political developments in the United States or abroad. As a result, the Fund’s investments in foreign currency denominated securities may reduce the returns of the Fund. The market values of equity securities, such as common stocks and preferred stocks, or equity related investments, such as futures and options, may decline due to general market conditions which are not specifically related to a particular company, such as real or perceived adverse economic conditions, changes in the general outlook for corporate earnings, changes in interest or currency rates or adverse investor sentiment generally. The market value of equity securities may also decline due to factors which affect a particular industry or industries, such as labor shortages or increased production costs and competitive conditions within an industry. Equity securities and equity related investments generally have greater market price volatility than fixed income securities. |
| 6. | Federal Income Taxes: |
| a) | Federal Income Taxes – For federal income tax purposes, the Fund intends to continue to qualify as a RIC under Subchapter M of the Internal Revenue Code (“IRC”) by distributing substantially all of its taxable net investment income and net realized capital gains to its shareholders and otherwise complying with the requirements of the IRC. The Fund has distributed substantially all of its income and capital gains in prior years, if applicable, and intends to distribute substantially all of its income and capital gains prior to the next fiscal year-end. Accordingly, no provision for federal |
| 19 |
Hartford International Opportunities HLS Fund
Notes to Financial Statements – (continued)
June 30, 2013 (Unaudited)
(000’s Omitted)
income or excise taxes has been made in the accompanying financial statements. Distributions from short-term capital gains are treated as ordinary income distributions for federal income tax purposes.
| b) | Net Investment Income (Loss), Net Realized Gains (Losses), and Distributions – Net investment income (loss) and net realized gains (losses) may differ for financial statement and tax purposes primarily because of losses deferred due to wash sale adjustments, foreign currency gains and losses, adjustments related to PFICs, REITs, RICs, certain derivatives and partnerships. The character of distributions made during the year from net investment income or net realized gains may differ from their ultimate characterization for federal income tax purposes. Also, due to the timing of dividend distributions, the fiscal year in which amounts are distributed may differ from the year that the income or realized gains (losses) were recorded by the Fund. |
| c) | Distributions and Components of Distributable Earnings – The tax character of distributions paid by the Fund for the periods indicated is as follows (as adjusted for dividends payable, if applicable): |
| For the Year Ended December 31, 2012 | For the Year Ended December 31, 2011 | |||||||
| Ordinary Income | $ | 28,135 | $ | 808 | ||||
As of December 31, 2012, the Fund’s components of distributable earnings (deficit) on a tax basis were as follows:
| Amount | ||||
| Undistributed Ordinary Income | $ | 32,158 | ||
| Accumulated Capital and Other Losses* | (710,980 | ) | ||
| Unrealized Appreciation† | 149,176 | |||
| Total Accumulated Deficit | $ | (529,646 | ) | |
| * | The Fund has capital loss carryforwards that are identified in the Capital Loss Carryforward note that follows. |
| † | Differences between book-basis and tax-basis unrealized appreciation (depreciation) may be attributable to the losses deferred due to wash sale adjustments, foreign currency gains and losses, adjustments related to PFICs, REITs, RICs, certain derivatives and partnerships. |
| d) | Reclassification of Capital Accounts – The Fund may record reclassifications in its capital accounts. These reclassifications have no impact on the total net assets of the Fund. The reclassifications are a result of permanent differences between U.S. GAAP and tax accounting for such items as foreign currency, PFICs, expiration or utilization of capital loss carryforwards or net operating losses. Adjustments are made to reflect the impact these items have on current and future distributions to shareholders. Therefore, the source of the Fund’s distributions may be shown in the accompanying Statement of Changes in Net Assets as from undistributed net investment income, from accumulated net realized gains on investments or from capital depending on the type of book and tax differences that exist. For the year ended December 31, 2012, the Fund recorded reclassifications to increase (decrease) the accounts listed below: |
| Amount | ||||
| Undistributed Net Investment Income | $ | 387 | ||
| Accumulated Net Realized Gain (Loss) | (387 | ) | ||
| e) | Capital Loss Carryforward – On December 22, 2010, the Regulated Investment Company Modernization Act of 2010 (the “Act”) was enacted, which made changes to the capital loss carryforward rules. The changes are effective for taxable years beginning after the date of enactment. Under the Act, funds are permitted to carry forward capital losses for an unlimited period. However, any losses incurred during those future taxable years will be required to be utilized prior to the losses incurred in pre-enactment taxable years, which carry an expiration date. As a result of this ordering rule, pre-enactment capital loss carryforwards may be more likely to expire unused. Additionally, post-enactment capital loss |
| 20 |
carryforwards retain their character as either short-term or long-term capital losses rather than being considered all short-term as permitted under prior regulation.
At December 31, 2012 (tax-year-end), the Fund had capital loss carryforwards for U.S. federal income tax purposes as follows:
| Year of Expiration | Amount | |||
| 2015 | $ | 26,254 | ||
| 2016 | 397,126 | |||
| 2017 | 287,600 | |||
| Total | $ | 710,980 | ||
During the year ended December 31, 2012, the Fund utilized $10,830 of prior year capital loss carryforwards.
| f) | Accounting for Uncertainty in Income Taxes – The Fund has adopted financial reporting rules that require the Fund to analyze all open tax years, as defined by the statute of limitations, for all major jurisdictions. Generally, tax authorities can examine all tax returns filed for the last three years. The Fund does not have an examination in progress. |
The Fund has reviewed all open tax years and major jurisdictions and concluded that these financial reporting rules had no effect on the Fund’s financial position or results of operations. There is no tax liability resulting from unrecognized tax benefits relating to uncertain income tax positions taken or expected to be taken on the tax return for the fiscal year ended December 31, 2012. The Fund is also not aware of any tax positions for which it is reasonably possible that the total amounts of unrecognized tax benefits will significantly change in the next twelve months.
| 7. | Expenses: |
| a) | Investment Management Agreement – Hartford Funds Management Company, LLC (“HFMC”), an indirect wholly owned subsidiary of The Hartford Financial Services Group, Inc. (“The Hartford”), serves as investment manager to the Fund pursuant to an Investment Management Agreement with the Company. The investment manager has overall investment supervisory responsibility for the Fund. In addition, the investment manager provides administrative personnel, services, equipment, facilities and office space for proper operation of the Fund. The investment manager has contracted with Wellington Management Company, LLP (“Wellington Management”) under a sub-advisory agreement for the provision of day-to-day investment management services to the Fund in accordance with the Fund’s investment objective and policies. The Fund pays a fee to the investment manager, a portion of which may be used to compensate Wellington Management. |
The schedule below reflects the rates of compensation paid to HFMC for investment management services rendered as of June 30, 2013; the rates are accrued daily and paid monthly.
| Average Daily Net Assets | Annual Fee | |||
| On first $250 million | 0.7750% | |||
| On next $250 million | 0.7250% | |||
| On next $500 million | 0.6750% | |||
| On next $1.5 billion | 0.6250% | |||
| On next $2.5 billion | 0.6200% | |||
| On next $5 billion | 0.6150% | |||
| Over $10 billion | 0.6100% | |||
| 21 |
Hartford International Opportunities HLS Fund
Notes to Financial Statements – (continued)
June 30, 2013 (Unaudited)
(000’s Omitted)
| b) | Accounting Services Agreement – Pursuant to the Fund Accounting Agreement between HFMC and the Company, on behalf of the Fund, HFMC provides accounting services to the Fund and receives monthly compensation based on the Fund’s average daily net assets at the rates set forth below. The Fund’s accounting services fees are accrued daily and paid monthly. |
| Average Daily Net Assets | Annual Fee | |||
| On first $5 billion | 0.016% | |||
| On next $5 billion | 0.014% | |||
| Over $10 billion | 0.012% | |||
| c) | Operating Expenses – Allocable expenses incurred by the Company are allocated to each Fund and allocated to classes within a Fund in proportion to the average daily net assets of the Fund and each class, except where allocation of certain expenses is more fairly made directly to the Fund or to specific classes within a Fund. |
| d) | Fees Paid Indirectly – The Company, on behalf of the Fund, has entered into agreements with State Street Global Markets, LLC and Russell Implementation Services, Inc. to partially recapture non-discounted trade commissions. Such rebates are used to pay a portion of the Fund’s expenses. In addition, the Fund’s custodian banks have agreed to reduce its fees when the Fund maintains cash on deposit in a non-interest-bearing custody account. For the six-month period ended June 30, 2013, these amounts, if any, are included in the Statement of Operations. |
The ratio of expenses to average net assets in the accompanying financial highlights excludes the reduction in expenses related to fees paid indirectly. The annualized expense ratio for the period listed below reflecting the reduction for fees paid indirectly is as follows:
| Annualized Six- Month Period Ended June 30, 2013 | ||||
| Class IA | 0.74 | % | ||
| Class IB | 0.99 | |||
| e) | Distribution Plan for Class IB shares – The Company, on behalf of the Fund, has adopted a Distribution Plan pursuant to Rule 12b-1 of the 1940 Act to compensate the distributor, Hartford Funds Distributors, LLC (“HFD”), (formerly known as Hartford Investment Financial Services, LLC), an indirect wholly owned subsidiary of The Hartford, from assets attributable to the Class IB shares for services rendered and expenses borne in connection with activities primarily intended to result in the sale of the Class IB shares, subject to the review and approval of the Company’s Board of Directors. |
The Distribution Plan provides that the Fund may pay annually up to 0.25% of the average daily net assets of the Fund attributable to its Class IB shares for activities primarily intended to result in the sale of Class IB shares. The Board has the authority to suspend or reduce these payments at any point in time. Under the terms of the Distribution Plan and the principal underwriting agreement, the Fund is authorized to make payments monthly to the distributor that may be used to pay or compensate entities providing distribution and shareholder servicing with respect to the Class IB shares for such entities’ fees or expenses incurred or paid in that regard. These fees are accrued daily and paid monthly.
| f) | Other Related Party Transactions – Certain officers of the Fund are directors and/or officers of the investment manager and/or The Hartford or its subsidiaries. For the six-month period ended June 30, 2013, a portion of the Fund’s Chief Compliance Officer’s salary was paid by all the investment companies in the Hartford fund complex. The portion allocated to the Fund was in the amount of $1. Hartford Administrative Services Company (“HASCO”), an indirect wholly owned subsidiary of The Hartford, provides transfer agent services to the Fund. HASCO was compensated on a |
| 22 |
per account basis for providing such services. The amount paid to HASCO can be found in the Statement of Operations. These fees are accrued daily and paid monthly.
| g) | Payment from Affiliate – In July of 2007, The Hartford entered into a settlement with the Attorneys General of the states of New York, Connecticut and Illinois relating to market timing and the company's individual variable annuity contracts in which certain payments would be made directly to the variable annuity contract holders. The distribution plan provided that unclaimed money from the settlement would be distributed to certain HLS Funds that are investment options through a Hartford individual variable annuity contract. The unclaimed money was distributed to the Fund on September 18, 2009. |
The total return in the accompanying financial highlights includes a payment from an affiliate. Had the payment from the affiliate been excluded, the impact and total return for the period listed below would have been as follows:
| For the Year Ended December 31, 2009 | ||||||||
| Class IA | Class IB | |||||||
| Impact from Payment from Affiliate for Attorneys General Settlement | 0.23 | % | 0.23 | % | ||||
| Total Return Excluding Payment from Affiliate | 33.15 | % | 32.83 | % | ||||
| 8. | Investment Transactions: |
For the six-month period ended June 30, 2013, the Fund's aggregate purchases and sales of investment securities (excluding short-term investments) were as follows:
| Amount | ||||
| Cost of Purchases Excluding U.S. Government Obligations | $ | 928,733 | ||
| Sales Proceeds Excluding U.S. Government Obligations | 1,042,276 | |||
| 9. | Line of Credit: |
The Fund is one of several Hartford funds that participate in a $500 million committed revolving line of credit facility. The facility is to be used for temporary or emergency purposes. Under the arrangement, the funds are required to own securities having a market value in excess of 300% of the total bank borrowings. The interest rate on borrowings varies depending on the nature of the loan. The facility also requires a fee to be paid based on the amount of the commitment. This commitment fee is allocated to all of the funds participating in the line of credit based on the average net assets of the funds. During the six-month period ended June 30, 2013, the Fund did not have any borrowings under this facility.
| 10. | Industry Classifications: |
Other than the industry classifications “Other Investment Pools and Funds” and “Exchange Traded Funds,” equity industry classifications used in this report are the Global Industry Classification Standard, which was developed by and is the exclusive property and service mark of MSCI, Inc. and Standard & Poor’s.
| 11. | Indemnifications: |
Under the Company’s organizational documents, the Company shall indemnify its officers and directors to the full extent required or permitted under Maryland General Corporation Law and the federal securities laws. In addition, the Company, on behalf of the Fund, may enter into contracts that contain a variety of indemnifications. The Company’s maximum exposure under these arrangements is unknown. However, as of the date of these financial statements, the Company has not had prior claims or losses pursuant to these contracts and expects the risk of loss to be remote.
| 23 |
Hartford International Opportunities HLS Fund
Notes to Financial Statements – (continued)
June 30, 2013 (Unaudited)
(000’s Omitted)
| 12. | Pending Legal Proceedings: |
On February 25, 2011, Jennifer L. Kasilag, Louis Mellinger, Judith M. Menendez, Jacqueline M. Robinson, and Linda A. Russell filed a derivative lawsuit against Hartford Investment Financial Services, LLC (“HIFSCO”)(now known as Hartford Funds Distributors, LLC) on behalf of six Hartford retail mutual funds in the United States District Court for the District of New Jersey, alleging that HIFSCO received excessive advisory and distribution fees in violation of its statutory fiduciary duty under Section 36(b) of the 1940 Act when serving as investment manager and principal underwriter, respectively, to the Hartford retail mutual funds. HIFSCO moved to dismiss and, in September 2011, the motion was granted in part and denied in part, with leave to amend the complaint. In November 2011, plaintiffs filed an amended complaint on behalf of certain Hartford retail mutual funds, The Hartford Global Health Fund (now known as The Hartford Healthcare Fund), The Hartford Conservative Allocation Fund, The Hartford Growth Opportunities Fund, The Hartford Inflation Plus Fund, The Hartford Advisers Fund (now known as The Hartford Balanced Fund), and The Hartford Capital Appreciation Fund. Plaintiffs seek to rescind the investment management agreements and distribution plans between HIFSCO and these funds and to recover the total fees charged thereunder or, in the alternative, to recover any improper compensation HIFSCO received, in addition to lost earnings. HIFSCO filed a partial motion to dismiss the amended complaint and, in December 2012, the court dismissed without prejudice the claims regarding distribution fees and denied the motion with respect to the advisory fees claims. HIFSCO disputes the allegations and intends to defend vigorously.
This action concerns the activities of HIFSCO in its capacity as investment manager and principal underwriter to the Hartford retail mutual funds and does not concern HIFSCO’s activities in its capacity as principal underwriter to the HLS funds. For this reason, no accrual for litigation relating to this matter has been recorded in the financial statements of the Fund.
| 24 |
[This page intentionally left blank]
| 25 |
Hartford International Opportunities HLS Fund
Financial Highlights
- Selected Per-Share Data (A) -
| Class | Net Asset Value at Beginning of Period | Net Investment Income (Loss) | Net Realized and Unrealized Gain (Loss) on Investments | Total from Investment Operations | Dividends from Net Investment Income | Distributions from Realized Capital Gains | Distributions from Capital | Total Distributions | Net Asset Value at End of Period | |||||||||||||||||||||||||||
| For the Six-Month Period Ended June 30, 2013 (Unaudited) (E) | ||||||||||||||||||||||||||||||||||||
| IA | $ | 12.63 | $ | 0.18 | $ | 0.19 | $ | 0.37 | $ | – | $ | – | $ | – | $ | – | $ | 13.00 | ||||||||||||||||||
| IB | 12.76 | 0.17 | 0.20 | 0.37 | – | – | – | – | 13.13 | |||||||||||||||||||||||||||
| For the Year Ended December 31, 2012 | ||||||||||||||||||||||||||||||||||||
| IA | 10.72 | 0.26 | 1.88 | 2.14 | (0.23 | ) | – | – | (0.23 | ) | 12.63 | |||||||||||||||||||||||||
| IB | 10.82 | 0.25 | 1.88 | 2.13 | (0.19 | ) | – | – | (0.19 | ) | 12.76 | |||||||||||||||||||||||||
| For the Year Ended December 31, 2011 | ||||||||||||||||||||||||||||||||||||
| IA | 12.46 | 0.21 | (1.94 | ) | (1.73 | ) | (0.01 | ) | – | – | (0.01 | ) | 10.72 | |||||||||||||||||||||||
| IB | 12.61 | 0.19 | (1.97 | ) | (1.78 | ) | (0.01 | ) | – | – | (0.01 | ) | 10.82 | |||||||||||||||||||||||
| For the Year Ended December 31, 2010 (E) | ||||||||||||||||||||||||||||||||||||
| IA | 11.01 | 0.13 | 1.46 | 1.59 | (0.14 | ) | – | – | (0.14 | ) | 12.46 | |||||||||||||||||||||||||
| IB | 11.15 | 0.11 | 1.46 | 1.57 | (0.11 | ) | – | – | (0.11 | ) | 12.61 | |||||||||||||||||||||||||
| For the Year Ended December 31, 2009 | ||||||||||||||||||||||||||||||||||||
| IA | 8.40 | 0.19 | (I) | 2.61 | 2.80 | (0.19 | ) | – | – | (0.19 | ) | 11.01 | ||||||||||||||||||||||||
| IB | 8.51 | 0.17 | (I) | 2.64 | 2.81 | (0.17 | ) | – | – | (0.17 | ) | 11.15 | ||||||||||||||||||||||||
| For the Year Ended December 31, 2008 | ||||||||||||||||||||||||||||||||||||
| IA | 15.62 | 0.28 | (6.68 | ) | (6.40 | ) | (0.28 | ) | (0.54 | ) | – | (0.82 | ) | 8.40 | ||||||||||||||||||||||
| IB | 15.78 | 0.27 | (6.76 | ) | (6.49 | ) | (0.24 | ) | (0.54 | ) | – | (0.78 | ) | 8.51 | ||||||||||||||||||||||
| (A) | Information presented relates to a share outstanding throughout the indicated period. |
| (B) | The figures do not include sales charges or other fees which may be applied at the variable life insurance, variable annuity or qualified retirement plan product level. Any such additional sales charges or other fees would lower the Fund's performance. |
| (C) | Ratios do not reflect reductions for fees paid indirectly. Please see Fees Paid Indirectly in the Notes to Financial Statements. |
| (D) | Portfolio turnover rate is calculated on the basis of the Fund as a whole without distinguishing between the classes of shares issued. |
| (E) | Per share amounts have been calculated using the average shares method. |
| (F) | Not annualized. |
| (G) | Annualized. |
| (H) | During the year ended December 31, 2010, the Fund incurred $456.2 million in sales associated with the transition of assets from Hartford International Growth HLS Fund and Hartford International Small Company HLS Fund, which merged into the Fund on April 16, 2010. These sales were excluded from the portfolio turnover calculation. |
| (I) | The impact of Payment from Affiliate per share was $0.03. |
| (J) | Total return without the inclusion of the Payment from (to) Affiliate can be found in Expenses in the accompanying Notes to Financial Statements. |
| 26 |
- Ratios and Supplemental Data -
| Total Return(B) | Net Assets at End of Period | Ratio of Expenses to Average Net Assets Before Waivers(C) | Ratio of Expenses to Average Net Assets After Waivers(C) | Ratio of Net Investment Income (Loss) to Average Net Assets | Portfolio Turnover Rate(D) | |||||||||||||||||
| 2.96 | %(F) | $ | 1,254,902 | 0.74 | %(G) | 0.74 | %(G) | 2.77 | %(G) | 63 | % | |||||||||||
| 2.83 | (F) | 204,242 | 0.99 | (G) | 0.99 | (G) | 2.51 | (G) | – | |||||||||||||
| 20.20 | 1,303,209 | 0.74 | 0.74 | 1.88 | 95 | |||||||||||||||||
| 19.89 | 220,699 | 0.99 | 0.99 | 1.64 | – | |||||||||||||||||
| (13.97 | ) | 1,287,917 | 0.73 | 0.73 | 1.66 | 111 | ||||||||||||||||
| (14.19 | ) | 232,707 | 0.98 | 0.98 | 1.41 | – | ||||||||||||||||
| 14.49 | 1,705,757 | 0.74 | 0.74 | 1.19 | 128 | (H) | ||||||||||||||||
| 14.20 | 328,671 | 0.99 | 0.99 | 0.94 | – | |||||||||||||||||
| 33.46 | (J) | 1,247,179 | 0.76 | 0.76 | 1.68 | 152 | ||||||||||||||||
| 33.13 | (J) | 216,882 | 1.01 | 1.01 | 1.43 | – | ||||||||||||||||
| �� | ||||||||||||||||||||||
| (42.25 | ) | 1,046,234 | 0.71 | 0.71 | 2.21 | 158 | ||||||||||||||||
| (42.39 | ) | 189,221 | 0.96 | 0.96 | 1.96 | – | ||||||||||||||||
| 27 |
Hartford International Opportunities HLS Fund
Directors and Officers (Unaudited)
The Board of Directors of the Company appoints officers who are responsible for the day-to-day operations of the Fund and who execute policies formulated by the Directors. Each director serves until his or her death, resignation, or retirement or until the next annual meeting of shareholders is held or until his or her successor is elected and qualifies.
Directors and officers who are employed by or who have a financial interest in The Hartford are considered “interested” persons of the Fund pursuant to the 1940 Act. Each officer and two of the Company’s directors, as noted in the chart below, are “interested” persons of the Fund. Each director serves as a director for The Hartford Mutual Funds, Inc., The Hartford Mutual Funds II, Inc., Hartford Series Fund, Inc., Hartford HLS Series Fund II, Inc., and as a trustee for The Hartford Alternative Strategies Fund, which, as of June 30, 2013, collectively consist of 90 funds. Correspondence may be sent to directors and officers c/o Hartford Mutual Funds, P.O. Box 2999, Hartford, Connecticut 06104-2999, except that correspondence to Mr. Annoni, Mr. Dressen, Ms. Fagely and Ms. Quade may be sent to 500 Bielenberg Drive, Woodbury, Minnesota 55125 and correspondence to Mr. Davey and Mr. Melcher may be sent to 5 Radnor Corporate Center, Suite 300, 100 Matsonford Road, Radnor, Pennsylvania 19087.
The table below sets forth, for each director and officer, his or her name, year of birth, current position with the Company and date first elected or appointed to Hartford Series Fund, Inc. (“HSF”), and Hartford HLS Series Fund II, Inc. (“HSF2”), principal occupation, and, for directors, other directorships held. The Fund’s statement of additional information contains further information on the directors and is available free of charge by calling 1-800-862-6668 or writing to Hartford HLS Funds, c/o Hartford Life Insurance Company, Hartford Life and Annuity Insurance Company, P.O. Box 14293, Lexington, KY 40512-4293.
Information on the aggregate remuneration paid to the directors of the Company can be found in the Statement of Operations herein. The Fund pays to The Hartford a portion of the Chief Compliance Officer’s compensation, but does not pay salaries or compensation to any of their other officers or directors who are employed by The Hartford.
Non-Interested Directors
Lynn S. Birdsong (1946) Director since 2003, Co-Chairman of the Investment Committee
Mr. Birdsong is a private investor. Mr. Birdsong currently serves as a Director of the Sovereign High Yield Investment Company (April 2010 to current). Mr. Birdsong currently serves as an Independent Director of Nomura Partners Funds, Inc. (formerly, The Japan Fund) (March 2003 to current). From 1979 to 2002, Mr. Birdsong was a managing director of Zurich Scudder Investments, an investment management firm. During his employment with Scudder, Mr. Birdsong was an Interested Director of The Japan Fund. Since 1981, Mr. Birdsong has been a partner in Birdsong Company, an advertising specialty firm.
Robert M. Gavin, Jr. (1940) Director since 2002 (HSF) and 1986 (HSF2), Chairman of the Board since 2004
Dr. Gavin is an educational consultant. Prior to September 1, 2001, he was President of Cranbrook Education Community and prior to July 1996, he was President of Macalester College, St. Paul, Minnesota.
Duane E. Hill (1945) Director since 2001 (HSF) and 2002 (HSF2), Chairman of the Nominating Committee
Mr. Hill is Partner of TSG Ventures L.P., a private equity investment company. Mr. Hill is a former partner of TSG Capital Group, a private equity investment firm that served as sponsor and lead investor in leveraged buyouts of middle market companies.
Sandra S. Jaffee (1941) Director since 2005
Ms. Jaffee is the founder and Chief Executive Officer of a private company, Homeworks Concierge, LLC, which provides residential property management services in Westchester County, New York (January 2012 to present). Ms. Jaffee served as Chairman (2008 to 2009) and Chief Executive Officer of Fortent (formerly Searchspace Group), a leading provider of compliance/regulatory technology to financial institutions from August 2005 to August 2009. Ms. Jaffee currently serves as a member of the Board of Directors of Broadridge Financial Solutions as well as a Trustee of Muhlenberg College.
William P. Johnston (1944) Director since 2005, Chairman of the Compliance Committee
In February 2008, Mr. Johnston was elected to the Board of Directors of HCR-ManorCare, Inc. In August 2007, Mr. Johnston was elected to the Board of Directors of LifeCare Holdings, Inc. In July 2006, Mr. Johnston was elected to the Board of Directors of MultiPlan, Inc. and served as a director (July 2006 to August 2010). In June 2006, Mr. Johnston was appointed as Senior Advisor to The Carlyle Group, a global private equity and alternative asset investment firm. In May 2006, Mr. Johnston was elected to the Supervisory Board of Fresenius Medical Care AG & Co. KGaA, after its acquisition of Renal Care Group, Inc. in March 2006.
| 28 |
Phillip O. Peterson (1944) Director since 2002 (HSF) and 2000 (HSF2), Chairman of the Audit Committee
Mr. Peterson is a mutual fund industry consultant. He was a partner of KPMG LLP (an accounting firm) until July 1999. Mr. Peterson joined William Blair Funds in February 2007 as a member of the Board of Trustees. Mr. Peterson also joined the Board of Trustees of Symetra Variable Mutual Funds Trust as a trustee in February 2012.
Lemma W. Senbet (1946) Director since 2005
Dr. Senbet is the William E. Mayer Chair Professor of Finance and Director, Center for Financial Policy, at the University of Maryland, Robert H. Smith School of Business. He was chair of the Finance Department from 1998 to 2006. Previously he was a chaired professor of finance at the University of Wisconsin-Madison. Also, he was director of the Fortis Funds from March 2000 to July 2002. Dr. Senbet served the finance profession in various capacities, including as director of the American Finance Association and President of the Western Finance Association. In 2006, Dr. Senbet was inducted Fellow of Financial Management Association International for his career-long distinguished scholarship and professional service.
Interested Directors and Officers
James E. Davey (1964) Director since 2012, President and Chief Executive Officer since 2010
Mr. Davey serves as Executive Vice President of Hartford Life Insurance Company (“HLIC”) and The Hartford Financial Services Group, Inc. Additionally, Mr. Davey serves as Chairman of the Board and Manager of Hartford Funds Distributors, LLC (“HFD”) and Hartford Administrative Services Company (“HASCO”). Mr. Davey also serves as Manager, President and Chairman of the Board for Hartford Funds Management Company, LLC (“HFMC”). Mr. Davey joined The Hartford in 2002.
Lowndes A. Smith (1939) Director since 1996 (HSF) and 2002 (HSF2), Co-Chairman of the Investment Committee
Mr. Smith served as Vice Chairman of The Hartford from February 1997 to January 2002, as President and Chief Executive Officer of Hartford Life, Inc. from February 1997 to January 2002, and as President and Chief Operating Officer of The Hartford Life Insurance Companies from January 1989 to January 2002. Mr. Smith serves as a Director of White Mountains Insurance Group, Ltd., One Beacon Insurance and Symetra Financial and as Managing Director of Whittington Gray Associates.
Other Officers
Mark A. Annoni (1964) Vice President, Controller and Treasurer since 2012
Mr. Annoni serves as the Assistant Vice President of HLIC (February 2004 to present). Mr. Annoni joined The Hartford in April 2001 as part of The Hartford’s acquisition of Fortis Financial Group (“Fortis”). Prior to joining The Hartford, Mr. Annoni served as Manager of Mutual Fund Accounting at Fortis (July 1997 to April 2001).
Michael R. Dressen (1963) AML Compliance Officer since 2011
Mr. Dressen currently serves as Assistant Vice President of HLIC. He also serves as Chief Compliance Officer and AML Compliance Officer of HASCO and as AML Officer of HFD. Mr. Dressen joined The Hartford in 2005 from State Farm Insurance Companies where he held various positions related to mutual funds, variable products, and property casualty insurance.
Tamara L. Fagely (1958) Vice President since 2002 (HSF) and 1993 (HSF2)
Currently, Ms. Fagely is President and a Director of HASCO, Chief Administrative Officer and Manager of HFMC and a Vice President of HLIC. Ms. Fagely served as a Vice President of HASCO (1998-2013) and Chief Financial Officer of HASCO (2006-2013). She served as Assistant Vice President of HLIC from December 2001 through March 2005. In addition, Ms. Fagely is Manager and Chief Operating Officer of HFD.
Edward P. Macdonald (1967) Vice President, Secretary and Chief Legal Officer since 2005
Mr. Macdonald serves as Vice President of HLIC and Vice President, Chief Legal Officer and Secretary of HFD and HASCO. Mr. Macdonald also serves as Manager, Vice President, Chief Legal Officer and Secretary of HFMC. Mr. Macdonald joined The Hartford in 2005.
| 29 |
Hartford International Opportunities HLS Fund
Directors and Officers (Unaudited) – (continued)
Joseph G. Melcher (1973) Vice President and Chief Compliance Officer since 2013(1)
Mr. Melcher currently serves as Vice President of HFMC and HFD. Mr. Melcher joined The Hartford in 2012 from Touchstone Investments, a member of the Western & Southern Financial Group, where he held the position of Vice President and Chief Compliance Officer from 2010 through 2012 and Assistant Vice President, Compliance from 2005 to 2010.
| (1) | Mr. Melcher was named Vice President and Chief Compliance Officer of HSF and HSF2 on February 6, 2013. Prior to February 6, 2013, Colleen Pernerewski served as Chief Compliance Officer of HSF and HSF2. |
Vernon J. Meyer (1964) Vice President since 2006
Mr. Meyer serves as Senior Vice President of HLIC. He also serves as Senior Vice President of HFMC and HFD. Mr. Meyer joined The Hartford in 2004.
Laura S. Quade (1969) Vice President since 2012
Ms. Quade currently serves as Vice President of HASCO and is a Director of Mutual Fund Service Operations. She also serves as Director, Enterprise Operations of HFD and HLIC. Ms. Quade joined The Hartford in 2001 as part of The Hartford’s acquisition of Fortis.
Elizabeth L. Schroeder (1966) Vice President since 2010(2)
Ms. Schroeder currently serves as Assistant Vice President of HLIC. Ms. Schroeder joined HLIC in 1991. She is also an Assistant Vice President of HFMC and HASCO.
| (2) | Ms. Schroeder served as Vice President of HSF and HSF2 until August 7, 2013. |
Martin Swanson (1962) Vice President since 2010
Mr. Swanson is a Vice President of HLIC. Mr. Swanson also serves as Chief Marketing Officer for HFD. Prior to joining HLIC in 1998, Mr. Swanson was a Vice President at PaineWebber, Inc.
HOW TO OBTAIN A COPY OF THE FUND’S PROXY VOTING POLICIES AND VOTING RECORDS (UNAUDITED)
A description of the policies and procedures that the Fund uses to determine how to vote proxies relating to portfolio securities and information about how the Fund voted proxies relating to portfolio securities during the most recent twelve-month period ended June 30 are available (1) without charge, upon request, by calling 800-862-6668 and (2) on the SEC’s website at http://www.sec.gov.
QUARTERLY PORTFOLIO HOLDINGS INFORMATION (UNAUDITED)
The Fund files a complete schedule of portfolio holdings with the SEC for the first and third quarters of each fiscal year on Form N-Q. The Fund’s Forms are available (1) without charge, upon request, by calling 800-862-6668 and (2) on the SEC’s website at http://www.sec.gov. The Form N-Q may be reviewed and copied at the SEC’s Public Reference Room in Washington, DC. Information on the operation of the Public Reference Room may be obtained by calling 1-800-SEC-0330.
| 30 |
Hartford International Opportunities HLS Fund
Expense Example (Unaudited)
Your Fund's Expenses
As a shareholder of the Fund, you incur two types of costs: (1) transaction costs and (2) ongoing costs including investment management fees, distribution fees, if any, and other fund expenses. This example is intended to help you understand your ongoing costs (in dollars) of investing in the Fund and to compare these costs with the ongoing costs of investing in other mutual funds. The example is based on an investment of $1,000 invested at the beginning of the period and held for the period of December 31, 2012 through June 30, 2013.
Actual Expenses
The first set of columns of the table below provides information about actual account values and actual expenses. You may use the information in this column, together with the amount you invested, to estimate the expenses that you paid over the period. Simply divide your account value by $1,000 (for example, an $8,600 account value divided by $1,000 = 8.6), then multiply the result by the number in the line under the heading entitled “Expenses Paid During Period” to estimate the expenses you paid on your account during this period.
Hypothetical Example for Comparison Purposes
The second set of columns of the table below provides information about hypothetical account values and hypothetical expenses based on the Fund’s actual expense ratio and an assumed rate of return of 5% per year before expenses, which is not the Fund’s actual return. The hypothetical account values and expenses may not be used to estimate the actual ending account balance or expenses you paid for the period. You may use this information to compare the ongoing costs of investing in the Fund and other funds. To do so, compare this 5% hypothetical example with the 5% hypothetical examples that appear in the shareholder reports of the other funds.
Please note that the expenses shown in the table are meant to highlight your ongoing costs only and do not reflect any transactional costs, such as sales charges (loads) and CDSC. Therefore, the second set of columns of the table is useful in comparing ongoing costs only, and will not help you determine the relative total costs of owning different funds. In addition, if these transactional costs were included, your costs would be higher. Expenses are equal to the Fund's annualized expense ratios multiplied by average account value over the period, multiplied by 181/365 (to reflect the one-half year period).
| Actual return | Hypothetical (5% return before expenses) | |||||||||||||||||||||||||||||||
| Beginning Account Value December 31, 2012 | Ending Account Value June 30, 2013 | Expenses paid during the period December 31, 2012 through June 30, 2013 | Beginning Account Value December 31, 2012 | Ending Account Value June 30, 2013 | Expenses paid during the period December 31, 2012 through June 30, 2013 | Annualized expense ratio | Days in the current 1/2 year | Days in the full year | ||||||||||||||||||||||||
| Class IA | $ | 1,000.00 | $ | 1,029.60 | $ | 3.72 | $ | 1,000.00 | $ | 1,021.12 | $ | 3.71 | 0.74 | % | 181 | 365 | ||||||||||||||||
| Class IB | $ | 1,000.00 | $ | 1,028.30 | $ | 4.98 | $ | 1,000.00 | $ | 1,019.89 | $ | 4.96 | 0.99 | % | 181 | 365 | ||||||||||||||||
| 31 |
Hartford International Opportunities HLS Fund
Principal Risks (Unaudited)
The principal risks of investing in the Fund are described below.
Market, Selection, and Strategy Risk: The Fund’s share price may fluctuate due to market risk and/or security selections that may underperform the market or relevant benchmarks. If the sub-adviser’s investment strategy does not perform as expected, the Fund could underperform its peers or lose money. There is no guarantee the Fund will achieve its stated objective.
Foreign Investment and Emerging Markets Risk: Foreign investments can be riskier than U.S. investments. Potential risks include currency risk that may result from unfavorable exchange rates, liquidity risk if decreased demand for a security makes it difficult to sell at the desired price, and risks that stem from substantially lower trading volume on foreign markets. These risks are generally greater for investments in emerging markets, which are also subject to greater price volatility, and custodial and regulatory risks.
Mid-cap Stock Risk: Mid-cap stocks are generally more volatile and risky and may be less liquid than large-cap stocks because they may have limited operating histories, narrow product lines, and focus on niche markets.
Active Trading Risk: Actively trading investments may result in higher costs (thus affecting performance).
| 32 |
HARTFORD HLS FUNDS
c/o The Hartford Wealth Management - Global Annuities
P.O. Box 14293
Lexington, KY 40512-4293
HARTFORDFUNDS
hartfordfunds.com
Hartford Series Fund, Inc. is underwritten and distributed by Hartford Funds Distributors, LLC.
Hartford Series Fund, Inc. inception dates range from 1977 to date. Hartford Series Fund, Inc. is not a subsidiary of The Hartford Financial Services Group, Inc. ("The Hartford") but is underwritten, distributed by and advised by subsidiaries of The Hartford. Investments in Hartford Series Fund, Inc. are not guaranteed by The Hartford or any other entity.
You should carefully consider investment objectives, risks, and charges and expenses of Hartford HLS Funds before investing. This and other information can be found in the Fund’s prospectus or summary prospectus, which can be obtained by calling 800-862-6668. Please read them carefully before you invest or send money.
HLSSAR-IO13 8-13 113546-1 Printed in U.S.A ©2013 The Hartford, Hartford, CT 06115
HARTFORDFUNDS
| HARTFORD MIDCAP HLS FUND
2013 Semi Annual Report
|
A MESSAGE FROM THE PRESIDENT
Dear Fellow Shareholders:
I want to take this opportunity to say thank you for investing in the Hartford HLS Funds.
Market Review
During the first half of the year, stocks rose steadily. U.S. equities (as represented by the S&P 500 Index1) posted a strong gain of 10.61% during the first quarter, on their way to an all-time high. During the second quarter, investors persevered through volatility surrounding rumors of the rollback of the U.S. Federal Reserve’s quantitative easing (QE) program later this year, and the S&P 500 Index rose 2.91%. That brought the market’s rise to 13.82% for the first half of 2013. The rumors about QE’s end sent bond yields and mortgage rates upward, but that wasn’t enough to dissuade investors from pushing equities into positive territory.
Because of QE, some have expressed concerns regarding the recent market rally. But a more careful examination of economic data reveals a strong foundation. Consumer balance sheets have improved since the financial crisis, with consumer debt as a percentage of income falling steadily. Housing continued its dogged recovery, fueled by population growth and pent-up demand. In fact, it’s substantive economic improvements that have moved Federal Reserve Chairman Ben Bernanke to consider removing the “training wheels” of QE, which we think should be viewed as a vote of confidence in the U.S. economy going forward.
As the U.S. outlook continues to improve, concerns do remain in the global economy. Emerging markets have lagged due to social unrest and rising inflation. Slowing growth in China is clouding global growth forecasts, but it’s important to remember that China still boasts 7.5% annual GDP growth.
It’s important to stay abreast of domestic and international economic developments while balancing your individual investment goals. Meeting with your financial advisor on a regular basis to examine your current investment strategy can help you determine whether you are on the right track:
| • | Is your portfolio fully diversified with an appropriate mix of stocks and bonds? |
| • | Is your fixed-income portfolio positioned to take advantage of opportunities across the credit spectrum and fulfill your income needs? |
| • | Is your portfolio still in line with your risk tolerance and investment time horizon? |
Your financial professional can help you choose options within our fund family to navigate today’s markets with confidence.
Thank you again for investing with the Hartford HLS Funds.
James Davey
President
Hartford HLS Funds
1 The S&P 500 Index is a market capitalization-weighted price index composed of 500 widely held common stocks.
Hartford MidCap HLS Fund
This report is prepared for the general information of contract owners and qualified retirement plan participants. It is not an offer of contracts or of qualified retirement plans. It should not be used in connection with any offer, except in conjunction with the appropriate product prospectus which contains all pertinent information including the applicable sales, administrative and other charges.
The views expressed in the Fund’s Manager Discussion under ‘‘Why did the Fund perform this way?’’ and ‘‘What is the outlook?’’ are views of the Fund’s sub-adviser and portfolio management team through the end of the period and are subject to change based on market and other conditions. The Fund’s Manager Discussion is for informational purposes only and does not represent an offer, recommendation or solicitation to buy, hold or sell any security. The specific securities identified and described, if any, do not represent all of the securities purchased or sold and you should not assume that investments in the securities identified and discussed will be profitable.
| Hartford MidCap HLS Fund* inception 07/14/1997 |
| (sub-advised by Wellington Management Company, LLP) |
| Investment objective – Seeks long-term growth of capital. |
Performance Overview 6/30/03 - 6/30/13
The chart above represents the hypothetical growth of a $10,000 investment in Class IA. Growth results in classes other than Class IA will vary from what is seen above due to differences in the expenses charged to those share classes.
| Average Annual Total Returns (as of 6/30/13) |
| 6 Month† | 1 Year | 5 Years | 10 Years | |||||||||||||
| MidCap IA | 17.22% | 25.68% | 6.75% | 10.79% | ||||||||||||
| MidCap IB | 17.07% | 25.36% | 6.47% | 10.51% | ||||||||||||
| S&P MidCap 400 Index | 14.59% | 25.18% | 8.91% | 10.74% | ||||||||||||
| † | Not Annualized |
PERFORMANCE DATA QUOTED REPRESENTS PAST PERFORMANCE AND DOES NOT GUARANTEE FUTURE RESULTS. The investment return and principal value of the investment will fluctuate so that investors’ shares, when redeemed, may be worth more or less than their original cost. Current performance may be lower or higher than the performance data quoted. To obtain performance data current to the most recent month-end, please visit our website www.hartfordfunds.com.
Total returns presented above were calculated using the Fund’s net asset value available to shareholders for sale or redemption of Fund shares on June 30, 2013, which may exclude investment transactions as of this date. All share class returns assume the reinvestment of all distributions at net asset value and the deduction of all fund expenses.
S&P MidCap 400 Index is an unmanaged index of common stocks of companies chosen by S&P designed to represent price movements in the mid-cap U.S. equity market.
You cannot invest directly in an index.
As of the Fund’s current prospectus dated May 1, 2013, the total annual operating expense ratios for Class IA and Class IB shares were 0.71% and 0.96%, respectively. Actual expenses may be higher. Please see the accompanying Financial Highlights for expense ratios for the six-month period ended June 30, 2013.
The chart and table do not reflect the deductions of taxes, sales charges or other fees which may be applied at the variable life insurance, variable annuity or qualified retirement plan product level. Any such additional sales charges or other fees or expenses would lower the contract’s or plan’s performance.
All investments are subject to risk including the possible loss of principal. For a discussion of the Fund’s risks, please see the Principal Risks section. For more detailed information on the risks associated with an investment in the Fund, please see the prospectus.
| * | The Fund has restrictions on the purchase of shares. A description of the restrictions can be found in the prospectus. |
| 2 |
| Hartford MidCap HLS Fund |
| Manager Discussion |
| June 30, 2013 (Unaudited) |
| Portfolio Managers | |
| Philip W. Ruedi, CFA | Mark A. Whitaker, CFA |
| Senior Vice President and Equity Portfolio Manager | Vice President and Equity Portfolio Manager |
How did the Fund perform?
The Class IA shares of the Hartford MidCap HLS Fund returned 17.22% for the six-month period ended June 30, 2013, outperforming its benchmark, the S&P MidCap 400 Index, which returned 14.59% for the same period. The Fund also outperformed the 14.90% average return of the Variable Products-Underlying Funds Lipper Mid-Cap Core Funds peer group, a group of funds with investment strategies similar to those of the Fund.
Why did the Fund perform this way?
U.S. equities (+13.8%), as measured by the S&P 500 Index, gained during the six-month period, reaching an all-time high in May. The rally began on the first trading day of the year after a last-minute compromise by the U.S. Congress averted the fiscal cliff. Optimism surrounding the fiscal reprieve was furthered during the first half of the period by better-than-expected corporate earnings, a robust housing market, and a gradually improving employment picture. In the second half of the period, a market rally throughout April and the first part of May paused following comments by Federal Reserve (Fed) Chairman Ben Bernanke that suggested the Fed might begin to slow quantitative easing (QE) sooner than investors anticipated. The Federal Open Market Committee’s June statement emphasized that the tapering schedule would depend on improving economic indicators. A strong housing market, positive consumer confidence trends, and a steadily healing labor market lent support to the thesis that underlying fundamentals were solid. Following an initially dramatic negative response to the Fed’s announcement and an increase in lending rates in China, U.S. markets moved higher into the end of the period.
Small cap stocks (+15.9%) outperformed mid cap stocks (+14.6%) and large cap stocks (+13.8%) during the period, as measured by the Russell 2000, S&P MidCap 400, and S&P 500 Indices, respectively. Within the S&P MidCap 400 Index, all ten sectors posted positive returns during the six-month period. The Consumer Staples (+28.2%), Health Care (+25.3%) and Utilities (+19.2%) sectors performed best while the Materials (+4.6%), Energy (+6.9%) and Information Technology (+7.4%) sectors lagged on a relative basis.
Outperformance versus the benchmark during the period was driven by strong security selection in the Information Technology, Health Care, and Energy sectors, which more than offset weak stock selection in the Industrials and Consumer Staples sectors. Sector allocation, which is a residual of our bottom-up stock selection process, contributed to relative outperformance during the period primarily based on our overweight allocation (i.e. the Fund’s sector position was greater than the benchmark position) to Health Care and an underweight allocation to Materials.
Top contributors to relative performance during the period were Actavis (Health Care), Rackspace Hosting (Information Technology), and TripAdvisor (Consumer Discretionary). Global, integrated specialty pharmaceutical company Actavis saw shares move higher after Valeant Pharmaceuticals initiated merger discussions with the company. Management rejected the offer but completed a merger agreement with Warner-Chilcott. We initiated a position during the period and shares continued to gain following the announcement. Rackspace Hosting offers a diverse portfolio of cloud computing services, including public, dedicated and private cloud, and hybrid hosting. The stock traded lower due to investor concerns about near-term profitability. Not owning the poor performing benchmark component contributed to relative returns. Shares of TripAdvisor, an online travel research company, rose as an improving outlook for search revenue boosted investor confidence in web-based travel business. Vertex Pharmaceuticals (Health Care) and Genpact (Information Technology) were also top contributors to absolute performance (i.e. total return) during the period.
Top detractors from relative performance during the period were CH Robinson Worldwide (Industrials), Newfield Exploration (Energy), and CONSOL Energy (Energy). Provider of freight transportation services and logistics solutions, CH Robinson Worldwide saw shares fall during the period after the company announced disappointing earnings, which were challenged by a slow volume recovery. We trimmed the position. Shares of U.S.-based oil & gas exploration and production company Newfield Exploration declined following lower-than-expected production guidance and plan to divest international assets. Shares of CONSOL Energy, a U.S.-based energy company, declined as investors realized anti-coal carbon policies by the Environmental Protection Agency (EPA) have resulted in permanent demand declines from coal fired power plants. Trimble Navigation (Information Technology) also detracted from absolute performance during the period.
| 3 |
| Hartford MidCap HLS Fund |
| Manager Discussion – (continued) |
| June 30, 2013 (Unaudited) |
What is the outlook?
In keeping with our philosophy, we continue to emphasize company-specific strengths in our bottom-up stock selection approach. Themes in the portfolio that may be impactful in the coming quarters include non-residential construction, trucking, and transaction processing.
At the end of the period, our largest overweights relative to the benchmark were in the Health Care and Energy sectors. Our largest underweights were Financials and Materials.
| Diversification by Industry | ||||
| as of June 30, 2013 | ||||
| Industry (Sector) | Percentage of Net Assets | |||
| Automobiles and Components (Consumer Discretionary) | 2.8 | % | ||
| Banks (Financials) | 4.9 | |||
| Capital Goods (Industrials) | 10.0 | |||
| Commercial and Professional Services (Industrials) | 7.7 | |||
| Consumer Durables and Apparel (Consumer Discretionary) | 1.8 | |||
| Consumer Services (Consumer Discretionary) | 1.0 | |||
| Diversified Financials (Financials) | 5.8 | |||
| Energy (Energy) | 11.3 | |||
| Food and Staples Retailing (Consumer Staples) | 0.7 | |||
| Food, Beverage and Tobacco (Consumer Staples) | 1.8 | |||
| Health Care Equipment and Services (Health Care) | 5.6 | |||
| Insurance (Financials) | 3.8 | |||
| Materials (Materials) | 2.6 | |||
| Media (Consumer Discretionary) | 2.1 | |||
| Pharmaceuticals, Biotechnology and Life Sciences (Health Care) | 15.0 | |||
| Retailing (Consumer Discretionary) | 7.5 | |||
| Semiconductors and Semiconductor Equipment (Information Technology) | 2.2 | |||
| Software and Services (Information Technology) | 13.0 | |||
| Technology Hardware and Equipment (Information Technology) | 4.5 | |||
| Transportation (Industrials) | 2.3 | |||
| Utilities (Utilities) | 2.6 | |||
| Short-Term Investments | 0.2 | |||
| Other Assets and Liabilities | (9.2 | ) | ||
| Total | 100.0 | % | ||
| 4 |
| Hartford MidCap HLS Fund |
| Schedule of Investments |
| June 30, 2013 (Unaudited) |
| (000’s Omitted) |
| Shares or Principal Amount | Market Value ╪ | |||||||
COMMON STOCKS - 109.0% | ||||||||
| Automobiles and Components - 2.8% | ||||||||
| 700 | Allison Transmission Holdings, Inc. | $ | 16,146 | |||||
| 438 | Harley-Davidson, Inc. | 24,018 | ||||||
| 40,164 | ||||||||
| Banks - 4.9% | ||||||||
| 109 | Cullen/Frost Bankers, Inc. | 7,286 | ||||||
| 234 | East West Bancorp, Inc. | 6,441 | ||||||
| 1,082 | First Niagara Financial Group, Inc. | 10,891 | ||||||
| 370 | First Republic Bank | 14,252 | ||||||
| 287 | M&T Bank Corp. | 32,065 | ||||||
| 70,935 | ||||||||
| Capital Goods - 10.0% | ||||||||
| 316 | IDEX Corp. | 17,014 | ||||||
| 488 | Jacobs Engineering Group, Inc. ● | 26,909 | ||||||
| 479 | Lennox International, Inc. | 30,904 | ||||||
| 251 | MSC Industrial Direct Co., Inc. | 19,435 | ||||||
| 481 | PACCAR, Inc. | 25,822 | ||||||
| 195 | Pall Corp. | 12,959 | ||||||
| 147 | Wabco Holdings, Inc. ● | 11,004 | ||||||
| 144,047 | ||||||||
| Commercial and Professional Services - 7.7% | ||||||||
| 470 | Equifax, Inc. ● | 27,692 | ||||||
| 477 | Manpowergroup, Inc. | 26,151 | ||||||
| 895 | Robert Half International, Inc. | 29,756 | ||||||
| 656 | Waste Connections, Inc. | 26,976 | ||||||
| 110,575 | ||||||||
| Consumer Durables and Apparel - 1.8% | ||||||||
| 27 | NVR, Inc. ● | 25,255 | ||||||
| Consumer Services - 1.0% | ||||||||
| 307 | Weight Watchers International, Inc. | 14,107 | ||||||
| Diversified Financials - 5.8% | ||||||||
| 182 | Greenhill & Co., Inc. | 8,333 | ||||||
| 406 | Invesco Ltd. | 12,917 | ||||||
| 220 | LPL Financial Holdings, Inc. | 8,313 | ||||||
| 222 | Moody's Corp. | 13,520 | ||||||
| 917 | SEI Investments Co. | 26,060 | ||||||
| 182 | T. Rowe Price Group, Inc. | 13,337 | ||||||
| 82,480 | ||||||||
| Energy - 11.3% | ||||||||
| 393 | Atwood Oceanics, Inc. ● | 20,480 | ||||||
| 126 | Cabot Oil & Gas Corp. | 8,916 | ||||||
| 799 | Cobalt International Energy, Inc. ● | 21,241 | ||||||
| 488 | Consol Energy, Inc. | 13,217 | ||||||
| 727 | Denbury Resources, Inc. ● | 12,595 | ||||||
| 223 | Ensco plc | 12,944 | ||||||
| 184 | EQT Corp. | 14,591 | ||||||
| 192 | Oceaneering International, Inc. | 13,855 | ||||||
| 119 | Pioneer Natural Resources Co. | 17,241 | ||||||
| 84 | Range Resources Corp. | 6,505 | ||||||
| 767 | Superior Energy Services, Inc. ● | 19,886 | ||||||
| 161,471 | ||||||||
| Food and Staples Retailing - 0.7% | ||||||||
| 111 | PriceSmart, Inc. | 9,758 | ||||||
| Food, Beverage and Tobacco - 1.8% | ||||||||
| 335 | Molson Coors Brewing Co. | 16,031 | ||||||
| 158 | Monster Beverage Corp. ● | 9,574 | ||||||
| 25,605 | ||||||||
| Health Care Equipment and Services - 5.6% | ||||||||
| 1,173 | Allscripts Healthcare Solutions, Inc. ● | 15,176 | ||||||
| 319 | Catamaran Corp. ● | 15,533 | ||||||
| 179 | Community Health Systems, Inc. | 8,374 | ||||||
| 153 | LifePoint Hospitals, Inc. ● | 7,466 | ||||||
| 490 | Patterson Cos., Inc. | 18,406 | ||||||
| 110 | Sirona Dental Systems, Inc. ● | 7,233 | ||||||
| 125 | Universal Health Services, Inc. Class B | 8,349 | ||||||
| 80,537 | ||||||||
| Insurance - 3.8% | ||||||||
| 52 | Alleghany Corp. ● | 19,821 | ||||||
| 40 | Markel Corp. ● | 21,284 | ||||||
| 321 | W.R. Berkley Corp. | 13,101 | ||||||
| 54,206 | ||||||||
| Materials - 2.6% | ||||||||
| 61 | FMC Corp. | 3,707 | ||||||
| 262 | Packaging Corp. of America | 12,812 | ||||||
| 60 | Sherwin-Williams Co. | 10,587 | ||||||
| 205 | Silgan Holdings, Inc. | 9,615 | ||||||
| 36,721 | ||||||||
| Media - 2.1% | ||||||||
| 221 | AMC Networks, Inc. Class A ● | 14,446 | ||||||
| 629 | DreamWorks Animation SKG, Inc. ● | 16,131 | ||||||
| 30,577 | ||||||||
| Pharmaceuticals, Biotechnology and Life Sciences - 15.0% | ||||||||
| 308 | Actavis, Inc. ● | 38,818 | ||||||
| 670 | Alkermes plc ● | 19,215 | ||||||
| 310 | Cubist Pharmaceuticals, Inc. ● | 14,974 | ||||||
| 169 | Illumina, Inc. ● | 12,622 | ||||||
| 547 | Incyte Corp. ● | 12,045 | ||||||
| 578 | Ironwood Pharmaceuticals, Inc. ● | 5,750 | ||||||
| 1,035 | Mylan, Inc. ● | 32,123 | ||||||
| 90 | Onyx Pharmaceuticals, Inc. ● | 7,826 | ||||||
| 34 | Regeneron Pharmaceuticals, Inc. ● | 7,709 | ||||||
| 187 | Salix Pharmaceuticals Ltd. ● | 12,395 | ||||||
| 413 | Vertex Pharmaceuticals, Inc. ● | 32,953 | ||||||
| 182 | Waters Corp. ● | 18,184 | ||||||
| 214,614 | ||||||||
| Retailing - 7.5% | ||||||||
| 365 | Advance Automotive Parts, Inc. | 29,638 | ||||||
| 542 | CarMax, Inc. ● | 25,017 | ||||||
| 232 | HomeAway, Inc. ● | 7,514 | ||||||
| 362 | Joseph A. Bank Clothiers, Inc. ● | 14,947 | ||||||
| 113 | Tiffany & Co. | 8,236 | ||||||
| 358 | TripAdvisor, Inc. ● | 21,791 | ||||||
| 107,143 | ||||||||
| Semiconductors and Semiconductor Equipment - 2.2% | ||||||||
| 575 | Maxim Integrated Products, Inc. | 15,970 | ||||||
| 495 | NXP Semiconductors N.V. ● | 15,327 | ||||||
| 31,297 | ||||||||
| Software and Services - 13.0% | ||||||||
| 192 | ANSYS, Inc. ● | 14,052 | ||||||
| 381 | Autodesk, Inc. ● | 12,915 | ||||||
| 133 | Factset Research Systems, Inc. | 13,589 | ||||||
| 162 | FleetCor Technologies, Inc. ● | 13,137 | ||||||
| 141 | Gartner, Inc. Class A ● | 8,030 | ||||||
| 2,026 | Genpact Ltd. | 38,986 | ||||||
| 388 | Micros Systems, Inc. ● | 16,722 | ||||||
| 122 | ServiceNow, Inc. ● | 4,912 | ||||||
| 119 | Teradata Corp. ● | 5,970 | ||||||
The accompanying notes are an integral part of these financial statements.
| 5 |
| Hartford MidCap HLS Fund |
| Schedule of Investments – (continued) |
| June 30, 2013 (Unaudited) |
| (000’s Omitted) |
| Shares or Principal Amount | Market Value ╪ | |||||||||||
COMMON STOCKS - 109.0% - (continued) | ||||||||||||
| Software and Services - 13.0% - (continued) | ||||||||||||
| 1,096 | Vantiv, Inc. ● | $ | 30,245 | |||||||||
| 228 | VeriSign, Inc. ● | 10,172 | ||||||||||
| 229 | WEX, Inc. ● | 17,529 | ||||||||||
| 186,259 | ||||||||||||
| Technology Hardware and Equipment - 4.5% | ||||||||||||
| 206 | Amphenol Corp. Class A | 16,016 | ||||||||||
| 131 | FEI Co. | 9,526 | ||||||||||
| 563 | National Instruments Corp. | 15,728 | ||||||||||
| 886 | Trimble Navigation Ltd. ● | 23,036 | ||||||||||
| 64,306 | ||||||||||||
| Transportation - 2.3% | ||||||||||||
| 225 | C.H. Robinson Worldwide, Inc. | 12,670 | ||||||||||
| 369 | Expeditors International of Washington, Inc. | 14,021 | ||||||||||
| 88 | J.B. Hunt Transport Services, Inc. | 6,336 | ||||||||||
| 33,027 | ||||||||||||
| Utilities - 2.6% | ||||||||||||
| 166 | Northeast Utilities | 6,973 | ||||||||||
| 568 | UGI Corp. | 22,198 | ||||||||||
| 201 | Wisconsin Energy Corp. | 8,229 | ||||||||||
| 37,400 | ||||||||||||
| Total common stocks | ||||||||||||
| (cost $1,224,744) | $ | 1,560,484 | ||||||||||
| Total long-term investments | ||||||||||||
| (cost $1,224,744) | $ | 1,560,484 | ||||||||||
| SHORT-TERM INVESTMENTS - 0.2% | ||||||||||||
| Repurchase Agreements - 0.2% | ||||||||||||
| Bank of America Merrill Lynch TriParty Repurchase Agreement (maturing on 07/01/2013 in the amount of $13, collateralized by GNMA 3.00%, 2042, value of $13) | ||||||||||||
| $ | 13 | 0.13%, 6/28/2013 | $ | 13 | ||||||||
| Bank of Montreal TriParty Repurchase Agreement (maturing on 07/01/2013 in the amount of $278, collateralized by FHLMC 4.00% - 5.00%, 2023 - 2025, FNMA 2.00% - 5.00%, 2022 - 2042, GNMA 2.00% - 5.00%, 2041 - 2043, value of $283) | ||||||||||||
| 278 | 0.15%, 6/28/2013 | 278 | ||||||||||
| Bank of Montreal TriParty Repurchase Agreement (maturing on 07/01/2013 in the amount of $540, collateralized by FHLB 0.38%, 2015, FHLMC 0.38%, 2014, FNMA 0.50% - 5.50%, 2015 - 2042, value of $550) | ||||||||||||
| 540 | 0.12%, 6/28/2013 | 540 | ||||||||||
| Barclays Capital TriParty Repurchase Agreement (maturing on 07/01/2013 in the amount of $375, collateralized by U.S. Treasury Note 3.13%, 2021, value of $381) | ||||||||||||
| 375 | 0.10%, 6/28/2013 | 375 | ||||||||||
| Citigroup Global Markets, Inc. TriParty Repurchase Agreement (maturing on 07/01/2013 in the amount of $1,104, collateralized by U.S. Treasury Bill 0.85%, 2013, U.S. Treasury Note 0.63% - 3.25%, 2013 - 2018, value of $1,120) | ||||||||||||
| 1,104 | 0.10%, 6/28/2013 | 1,104 | ||||||||||
| Deutsche Bank Securities TriParty Repurchase Agreement (maturing on 07/01/2013 in the amount of $13, collateralized by FNMA 4.50%, 2035, value of $13) | ||||||||||||
| 13 | 0.25%, 6/28/2013 | 13 | ||||||||||
| RBS Securities, Inc. TriParty Repurchase Agreement (maturing on 07/01/2013 in the amount of $443, collateralized by U.S. Treasury Note 1.00% - 2.63%, 2014 - 2020, value of $451) | ||||||||||||
| 443 | 0.10%, 6/28/2013 | 443 | ||||||||||
| TD Securities TriParty Repurchase Agreement (maturing on 07/01/2013 in the amount of $780, collateralized by FHLMC 3.50% - 4.00%, 2042, FNMA 3.50% - 4.50%, 2041 - 2042, value of $794) | ||||||||||||
| 780 | 0.12%, 6/28/2013 | 780 | ||||||||||
| UBS Securities, Inc. Repurchase Agreement (maturing on 07/01/2013 in the amount of $11, collateralized by U.S. Treasury Note 0.63%, 2014, value of $11) | ||||||||||||
| 11 | 0.09%, 6/28/2013 | 11 | ||||||||||
| 3,557 | ||||||||||||
| Total short-term investments | ||||||||||||
| (cost $3,557) | $ | 3,557 | ||||||||||
| Total investments | ||||||||||||
| (cost $1,228,301) ▲ | 109.2 | % | $ | 1,564,041 | ||||||||
| Other assets and liabilities | (9.2 | )% | (131,324 | ) | ||||||||
| Total net assets | 100.0 | % | $ | 1,432,717 | ||||||||
The accompanying notes are an integral part of these financial statements.
| 6 |
| Note: | Percentage of investments as shown is the ratio of the total market value to total net assets. |
| ▲ | At June 30, 2013, the cost of securities for federal income tax purposes was $1,238,131 and the aggregate gross unrealized appreciation and depreciation based on that cost were: |
| Unrealized Appreciation | $ | 359,533 | ||
| Unrealized Depreciation | (33,623 | ) | ||
| Net Unrealized Appreciation | $ | 325,910 |
| ● | Non-income producing. |
| ╪ | See Significant Accounting Policies of accompanying Notes to Financial Statements regarding valuation of securities. |
| GLOSSARY: (abbreviations used in preceding Schedule of Investments) | ||
| Other Abbreviations: | ||
| FHLB | Federal Home Loan Bank | |
| FHLMC | Federal Home Loan Mortgage Corp. | |
| FNMA | Federal National Mortgage Association | |
| GNMA | Government National Mortgage Association | |
The accompanying notes are an integral part of these financial statements.
| 7 |
| Hartford MidCap HLS Fund |
| Investment Valuation Hierarchy Level Summary |
| June 30, 2013 (Unaudited) |
| (000’s Omitted) |
| Total | Level 1 ♦ | Level 2 ♦ | Level 3 | |||||||||||||
| Assets: | ||||||||||||||||
| Common Stocks ‡ | $ | 1,560,484 | $ | 1,560,484 | $ | – | $ | – | ||||||||
| Short-Term Investments | 3,557 | – | 3,557 | – | ||||||||||||
| Total | $ | 1,564,041 | $ | 1,560,484 | $ | 3,557 | $ | – | ||||||||
| ♦ | For the six-month period ended June 30, 2013, there were no transfers between Level 1 and Level 2. |
| ‡ | The Fund has all or primarily all of the equity securities categorized in a particular level. Refer to the Schedule of Investments for further industry breakout. |
The accompanying notes are an integral part of these financial statements.
| 8 |
| Hartford MidCap HLS Fund |
| Statement of Assets and Liabilities |
| June 30, 2013 (Unaudited) |
| (000’s Omitted) |
| Assets: | ||||
| Investments in securities, at market value (cost $1,228,301) | $ | 1,564,041 | ||
| Cash | 6 | |||
| Receivables: | ||||
| Investment securities sold | 3,069 | |||
| Fund shares sold | 272 | |||
| Dividends and interest | 562 | |||
| Total assets | 1,567,950 | |||
| Liabilities: | ||||
| Payables: | ||||
| Investment securities purchased | 1,547 | |||
| Fund shares redeemed | 133,461 | |||
| Investment management fees | 174 | |||
| Distribution fees | 3 | |||
| Accrued expenses | 48 | |||
| Total liabilities | 135,233 | |||
| Net assets | $ | 1,432,717 | ||
| Summary of Net Assets: | ||||
| Capital stock and paid-in-capital | $ | 998,522 | ||
| Undistributed net investment income | 2,940 | |||
| Accumulated net realized gain | 95,515 | |||
| Unrealized appreciation of investments | 335,740 | |||
| Net assets | $ | 1,432,717 | ||
| Shares authorized | 2,400,000 | |||
| Par value | $ | 0.001 | ||
| Class IA: Net asset value per share | $ | 33.00 | ||
| Shares outstanding | 41,076 | |||
| Net assets | $ | 1,355,673 | ||
| Class IB: Net asset value per share | $ | 32.72 | ||
| Shares outstanding | 2,355 | |||
| Net assets | $ | 77,044 |
The accompanying notes are an integral part of these financial statements.
| 9 |
| Hartford MidCap HLS Fund |
| Statement of Operations |
| For the Six-Month Period Ended June 30, 2013 (Unaudited) |
| (000’s Omitted) |
| Investment Income: | ||||
| Dividends | $ | 8,151 | ||
| Interest | 2 | |||
| Total investment income, net | 8,153 | |||
| Expenses: | ||||
| Investment management fees | 5,202 | |||
| Transfer agent fees | 3 | |||
| Distribution fees - Class IB | 94 | |||
| Custodian fees | 5 | |||
| Accounting services fees | 76 | |||
| Board of Directors' fees | 18 | |||
| Audit fees | 10 | |||
| Other expenses | 74 | |||
| Total expenses (before fees paid indirectly) | 5,482 | |||
| Commission recapture | (9 | ) | ||
| Total fees paid indirectly | (9 | ) | ||
| Total expenses, net | 5,473 | |||
| Net Investment Income | 2,680 | |||
| Net Realized Gain on Investments: | ||||
| Net realized gain on investments | 60,063 | |||
| Net Realized Gain on Investments | 60,063 | |||
| Net Changes in Unrealized Appreciation of Investments: | ||||
| Net unrealized appreciation of investments | 174,925 | |||
| Net Changes in Unrealized Appreciation of Investments | 174,925 | |||
| Net Gain on Investments | 234,988 | |||
| Net Increase in Net Assets Resulting from Operations | $ | 237,668 |
The accompanying notes are an integral part of these financial statements.
| 10 |
| Hartford MidCap HLS Fund |
| Statement of Changes in Net Assets |
| (000’s Omitted) |
| For the Six-Month Period Ended June 30, 2013 (Unaudited) | For the Year Ended December 31, 2012 | |||||||
| Operations: | ||||||||
| Net investment income | $ | 2,680 | $ | 11,454 | ||||
| Net realized gain on investments | 60,063 | 115,900 | ||||||
| Net unrealized appreciation of investments | 174,925 | 113,137 | ||||||
| Net Increase in Net Assets Resulting from Operations | 237,668 | 240,491 | ||||||
| Distributions to Shareholders: | ||||||||
| From net investment income | ||||||||
| Class IA | — | (10,752 | ) | |||||
| Class IB | — | (400 | ) | |||||
| Total distributions | — | (11,152 | ) | |||||
| Capital Share Transactions: | ||||||||
| Class IA | ||||||||
| Sold | 67,754 | 143,048 | ||||||
| Issued on reinvestment of distributions | — | 10,752 | ||||||
| Redeemed | (263,236 | ) | (257,552 | ) | ||||
| Total capital share transactions | (195,482 | ) | (103,752 | ) | ||||
| Class IB | ||||||||
| Sold | 7,703 | 15,835 | ||||||
| Issued on reinvestment of distributions | — | 400 | ||||||
| Redeemed | (13,390 | ) | (28,049 | ) | ||||
| Total capital share transactions | (5,687 | ) | (11,814 | ) | ||||
| Net decrease from capital share transactions | (201,169 | ) | (115,566 | ) | ||||
| Net Increase in Net Assets | 36,499 | 113,773 | ||||||
| Net Assets: | ||||||||
| Beginning of period | 1,396,218 | 1,282,445 | ||||||
| End of period | $ | 1,432,717 | $ | 1,396,218 | ||||
| Undistributed (distribution in excess of) net investment income | $ | 2,940 | $ | 260 | ||||
| Shares: | ||||||||
| Class IA | ||||||||
| Sold | 2,133 | 5,211 | ||||||
| Issued on reinvestment of distributions | — | 384 | ||||||
| Redeemed | (8,126 | ) | (9,535 | ) | ||||
| Total share activity | (5,993 | ) | (3,940 | ) | ||||
| Class IB | ||||||||
| Sold | 243 | 600 | ||||||
| Issued on reinvestment of distributions | — | 14 | ||||||
| Redeemed | (428 | ) | (1,049 | ) | ||||
| Total share activity | (185 | ) | (435 | ) | ||||
The accompanying notes are an integral part of these financial statements.
| 11 |
| Hartford MidCap HLS Fund |
| Notes to Financial Statements |
| June 30, 2013 (Unaudited) |
| (000’s Omitted) |
| 1. | Organization: |
Hartford MidCap HLS Fund (the “Fund”) serves as an underlying investment option for certain variable annuity and variable life insurance separate accounts of Hartford Life Insurance Company (“HLIC”) and its affiliates and certain qualified retirement plans. The Fund may also serve as an underlying investment option for certain variable annuity and variable life separate accounts of other insurance companies. Owners of variable annuity contracts and policyholders of variable life insurance contracts may choose the funds permitted in the variable insurance contract prospectus. In addition, participants in certain qualified retirement plans may choose the Fund if permitted by their plans.
Hartford Series Fund, Inc. (the “Company”) is an open-end registered management investment company comprised of thirty portfolios. Financial statements for the Fund, a series of the Company, are included in this report.
The Company is organized under the laws of the State of Maryland and is registered with the Securities and Exchange Commission (“SEC”) under the Investment Company Act of 1940, as amended (“1940 Act”). The Fund is a diversified open-end management investment company.
The Fund is divided into Class IA and Class IB shares. Each class is offered at the per share net asset value (“NAV”) without a sales charge and is subject to the same expenses, except that the Class IB shares are subject to distribution and service fees charged pursuant to a Distribution Plan adopted in accordance with Rule 12b-1 under the 1940 Act.
| 2. | Significant Accounting Policies: |
The following is a summary of significant accounting policies of the Fund in the preparation of its financial statements, which are in accordance with the United States Generally Accepted Accounting Principles (“U.S. GAAP”). The preparation of financial statements in accordance with U.S. GAAP may require management to make estimates and assumptions that affect the reported amounts of assets and liabilities and disclosure of contingent assets and liabilities at the date of the financial statements and the reported amounts of increases and decreases in net assets from operations during the reporting period. Actual results could differ from those estimates.
| a) | Determination of Net Asset Value – The NAV of each class of the Fund’s shares is determined as of the close of regular trading (normally 4:00 p.m. Eastern Time) (the “NYSE Close”) on each day that the New York Stock Exchange (the “Exchange”) is open (“Valuation Date”). Information that becomes known to the Fund after the NAV has been calculated on a particular day will not generally be used to retroactively adjust the NAV determined earlier that day. |
| b) | Investment Valuation and Fair Value Measurements – For purposes of calculating the NAV, portfolio investments and other assets held by the Fund's portfolio for which market quotes are readily available are valued at market value. Market value is generally determined on the basis of last reported sales prices or official close price. If no sales are reported, market value is based on quotes obtained from a quotation reporting system, established market makers, or independent pricing services. If market prices are not readily available or are deemed unreliable, the Fund will use the fair value of the investment as determined in good faith under policies and procedures established by and under the supervision of the Company’s Board of Directors. Market quotes are considered not readily available where there is an absence of current or reliable market-based data (e.g., trade information or indicative market quotes), including where events occur after the close of the relevant market, but prior to the NYSE Close that materially affect the values of the Fund’s portfolio investments or assets. In addition, market quotes are considered not readily available when, due to extraordinary circumstances, the exchanges or markets on which the investments trade do not open for trading for the entire day and no other market prices are available. In addition, prices of foreign equities that are principally traded on certain foreign markets may be adjusted daily pursuant to a fair value pricing service approved by the Board of Directors in order to reflect an adjustment for the factors occurring after the close of certain foreign markets but before the NYSE Close. Investments that are primarily traded on foreign markets may trade on days that are not business days of the Fund. The |
| 12 |
value of the foreign investments in which the Fund invests may change on days when a shareholder will not be able to purchase or redeem shares of the Fund. Fair value pricing is subjective in nature and the use of fair value pricing by the Fund may cause the NAV of its shares to differ significantly from the NAV that would have been calculated using market prices at the close of the exchange on which a portfolio investment is primarily traded. There can be no assurance that the Fund could obtain the fair market value assigned to an investment if the Fund were to sell the investment at approximately the time at which the Fund determines its NAV.
Investments valued in currencies other than U.S. dollars are converted to U.S. dollars using exchange rates obtained from independent pricing services for calculation of the NAV. As a result, the NAV of the Fund’s shares may be affected by changes in the value of currencies in relation to the U.S. dollar. The value of investments traded in markets outside the United States or denominated in currencies other than the U.S. dollar may be affected significantly on a day that the NYSE is closed and the market value may change on days when an investor is not able to purchase, redeem or exchange shares of the Fund.
Financial instruments for which prices are not available from an independent pricing service may be valued using market quotations obtained from one or more dealers that make markets in the respective financial instrument in accordance with procedures established by the Company’s Board of Directors.
U.S. GAAP defines fair value as the price that the Fund would receive to sell an asset or pay to transfer a liability in an orderly transaction between market participants. The U.S. GAAP fair value measurement standards require disclosure of a fair value hierarchy for each major category of assets and liabilities. Various inputs are used in determining the fair value of the Fund’s investments. These inputs are summarized into three broad hierarchy levels. This hierarchy is based on whether the valuation inputs are observable or unobservable. These levels are:
| · | Level 1 – Quoted prices in active markets for identical investments. Level 1 may include exchange traded instruments, such as domestic equities, some foreign equities, options, futures, mutual funds, exchange traded funds, rights and warrants. |
| · | Level 2 – Observable inputs other than Level 1 prices, such as quoted prices for similar investments; quoted prices in markets that are not active; or other inputs that are observable or can be corroborated by observable market data. Level 2 may include debt investments that are traded less frequently than exchange traded instruments and which are valued using independent pricing services; foreign equities, which are principally traded on certain foreign markets and are adjusted daily pursuant to a fair value pricing service in order to reflect an adjustment for the factors occurring after the close of certain foreign markets but before the NYSE Close; and short-term investments, which are valued at amortized cost. |
| · | Level 3 – Significant unobservable inputs that are supported by limited or no market activity. Level 3 may include financial instruments whose values are determined using indicative market quotes or require significant management judgment or estimation. These unobservable valuation inputs may include estimates for current yields, maturity/duration, prepayment speed, and indicative market quotes for comparable investments along with other assumptions relating to credit quality, collateral value, complexity of the investment structure, general market conditions and liquidity. This category may include investments where trading has been halted or there are certain restrictions on trading. While these investments are priced using unobservable inputs, the valuation of these investments reflects the best available data and management believes the prices are a reasonable representation of exit price. |
The Board of Directors of the Company generally reviews and approves the “Procedures for Valuation of Portfolio Securities” on an annual basis. These procedures define how investments are to be valued, including the formation and activities of a Valuation Committee. The Valuation Committee is responsible for determining in good faith the fair value of investments when the value cannot be obtained from primary pricing services or alternative sources or if the valuation of an investment as provided by the primary pricing service or alternative source is believed not to reflect the investment’s fair value as of the Valuation Date. Members of the Valuation Committee include the Fund’s Treasurer or designee, a Vice President of the Fund with legal expertise or
| 13 |
| Hartford MidCap HLS Fund |
| Notes to Financial Statements – (continued) |
| June 30, 2013 (Unaudited) |
| (000’s Omitted) |
designee, and a Vice President of the investment manager or designee. In addition, the Fund’s Chief Compliance Officer shall designate a member of the compliance group to attend Valuation Committee meetings as a non-voting resource, to monitor for and provide guidance with respect to compliance with these procedures. Two members of the Valuation Committee or their designees, representing different departments, shall constitute a quorum for purposes of permitting the Valuation Committee to take action. The Valuation Committee will consider all relevant factors in determining an investment’s fair value, and may seek the advice of the Fund’s sub-adviser, knowledgeable brokers, and legal counsel in making such determination. The Valuation Committee reports to the Audit Committee of the Company’s Board of Directors. The Audit Committee receives quarterly written reports which include details of all fair-valued investments, including the reason for the fair valuation, and an indication, when possible, of the accuracy of the valuation by disclosing the next available reliable public price quotation or the disposition price of such investments (the “look-back” test). The Board of Directors then must consider for ratification all of the fair value determinations made during the previous quarter.
Valuation levels are not necessarily indicative of the risk associated with investing in such investments. Individual investments within any of the above mentioned asset classes may be assigned a different hierarchical level than those presented above, as individual circumstances dictate.
For additional information, refer to the Investment Valuation Hierarchy Level Summary and the Level 3 roll-forward reconciliation, if applicable, which follow the Schedule of Investments.
For purposes of reporting transfers between different hierarchy levels, both transfers in and out of each level, as applicable, are shown as if they occurred at the beginning of the period.
| c) | Investment Transactions and Investment Income – Investment transactions are recorded as of the trade date (the date the order to buy or sell is executed) for financial reporting purposes. Investments purchased or sold on a when-issued or delayed-delivery basis may be settled a month or more after the trade date. Realized gains and losses are determined on the basis of identified cost. |
Dividend income from domestic securities is accrued on the ex-dividend date. In general, dividend income from foreign securities is recorded on the ex-date; however, dividend notifications in certain foreign jurisdictions may not be available in a timely manner and as a result, the Fund will record the dividend as soon as the relevant details (i.e., rate per share, payment date, shareholders of record, etc.) are publicly available. Interest income, including amortization of premium and accretion of discounts, is accrued on a daily basis.
| d) | Joint Trading Account – The Fund may invest cash balances into a joint trading account that may be invested in one or more repurchase agreements. |
| e) | Fund Share Valuation and Dividend Distributions to Shareholders – Orders for the Fund’s shares are executed in accordance with the investment instructions of the contract holders and plan participants. The NAV of the Fund’s shares is determined as of the close of business on each business day of the Exchange. The NAV is determined separately for each class of shares of the Fund by dividing the Fund’s net assets attributable to that class by the number of shares of the class outstanding. Each class of shares offered by the Fund has equal rights as to assets and voting privileges (except that shareholders of a class have exclusive voting rights regarding any matter relating solely to that class of shares). Income and non-class specific expenses are allocated daily to each class on the basis of the relative net assets of the class. Realized and unrealized capital gains and losses are allocated daily based on the relative net assets of each class of shares of the Fund. |
Orders for the purchase of the Fund’s shares received prior to the close of the Exchange on any day the Exchange is open for business are priced at the NAV determined as of the close of the Exchange. Orders received after the close of the
| 14 |
Exchange, or on a day on which the Exchange and/or the Fund is not open for business, are priced at the next determined NAV.
Dividends are declared pursuant to a policy adopted by the Company’s Board of Directors based upon the investment performance of the Fund. The policy of the Fund is to pay dividends from net investment income and realized capital gains, if any, at least once a year.
Distributions from net investment income, net realized capital gains and capital are determined in accordance with federal income tax regulations, which may differ from U.S. GAAP with respect to character and timing. These differences may include but are not limited to losses deferred due to wash sale adjustments, foreign currency gains and losses, adjustments related to Passive Foreign Investment Companies (“PFICs”), Real Estate Investment Trusts (“REITs”), Regulated Investment Companies (“RICs”), certain derivatives and partnerships. Permanent book and federal income tax basis differences relating to shareholder distributions will result in reclassifications to certain of the Fund’s capital accounts (see Federal Income Taxes: Reclassification of Capital Accounts note).
| 3. | Securities and Other Investments: |
| a) | Repurchase Agreements – A repurchase agreement is an agreement by which a counterparty agrees to sell an investment and agrees to repurchase the investment sold from the buyer at a mutually agreed upon time and price. During the period of the repurchase agreement, the counterparty will deposit cash and or securities in a third party custodial account to serve as collateral. At the time the Fund enters into a repurchase agreement, the value of the underlying collateral, including accrued interest, will be equal to or exceed the value of the repurchase agreement. Repurchase agreements expose the Fund to counterparty risk - that is, the risk that the counterparty will not fulfill its obligations. To minimize counterparty risk, the investments that serve to collateralize the repurchase agreement are held by the Fund’s custodian in book entry or physical form in the custodial account of the Fund or in a third party custodial account. Repurchase agreements are valued at cost plus accrued interest, which approximates fair value. Repurchase agreements have master netting agreements which allow the Fund to offset amounts owed to a counterparty with amounts owed by the counterparty, including any collateral. The Fund, as shown on the Schedule of Investments, had outstanding repurchase agreements as of June 30, 2013. |
| b) | Investments Purchased on a When-Issued or Delayed-Delivery Basis – Delivery and payment for investments that have been purchased by the Fund on a forward commitment, or when-issued or delayed-delivery basis, take place beyond the customary settlement period. A fund may dispose of or renegotiate a delayed-delivery transaction after it is entered into, and may sell delayed-delivery investments before they are delivered, which may result in a realized gain or loss. During this period, such investments are subject to market fluctuations, and the Fund identifies investments segregated in its records with a value at least equal to the amount of the commitment. As of June 30, 2013, the Fund had no outstanding when-issued or delayed-delivery investments. |
| 4. | Principal Risks: |
| a) | Counterparty Risk – The Fund may be exposed to counterparty risk, or the risk that an institution or other entity with which the Fund has unsettled or open transactions will default. |
| b) | Market Risks – If the Fund invests directly in foreign currencies or in securities that trade in, and receive revenues in, foreign currencies, or in derivatives that provide exposure to foreign currencies, it will be subject to the risk that those currencies will decline in value relative to the base currency of the Fund, or, in the case of hedging positions, that the Fund’s base currency will decline in value relative to the currency being hedged. Currency rates in foreign countries may fluctuate significantly over short periods of time for a number of reasons, including changes in interest rates, intervention (or the failure to intervene) by U.S. or foreign governments, central banks or supranational entities, such as the International Monetary Fund, or by the imposition of currency controls or other political developments in the United |
| 15 |
| Hartford MidCap HLS Fund |
| Notes to Financial Statements – (continued) |
| June 30, 2013 (Unaudited) |
| (000’s Omitted) |
States or abroad. As a result, the Fund’s investments in foreign currency denominated securities may reduce the returns of the Fund. The market values of equity securities, such as common stocks and preferred stocks, or equity related investments, such as futures and options, may decline due to general market conditions which are not specifically related to a particular company, such as real or perceived adverse economic conditions, changes in the general outlook for corporate earnings, changes in interest or currency rates or adverse investor sentiment generally. The market value of equity securities may also decline due to factors which affect a particular industry or industries, such as labor shortages or increased production costs and competitive conditions within an industry. Equity securities and equity related investments generally have greater market price volatility than fixed income securities.
| 5. | Federal Income Taxes: |
| a) | Federal Income Taxes – For federal income tax purposes, the Fund intends to continue to qualify as a RIC under Subchapter M of the Internal Revenue Code (“IRC”) by distributing substantially all of its taxable net investment income and net realized capital gains to its shareholders and otherwise complying with the requirements of the IRC. The Fund has distributed substantially all of its income and capital gains in prior years, if applicable, and intends to distribute substantially all of its income and capital gains prior to the next fiscal year-end. Accordingly, no provision for federal income or excise taxes has been made in the accompanying financial statements. Distributions from short-term capital gains are treated as ordinary income distributions for federal income tax purposes. |
| b) | Net Investment Income (Loss), Net Realized Gains (Losses), and Distributions – Net investment income (loss) and net realized gains (losses) may differ for financial statement and tax purposes primarily because of losses deferred due to wash sale adjustments, foreign currency gains and losses, adjustments related to PFICs, REITs, RICs, certain derivatives and partnerships. The character of distributions made during the year from net investment income or net realized gains may differ from their ultimate characterization for federal income tax purposes. Also, due to the timing of dividend distributions, the fiscal year in which amounts are distributed may differ from the year that the income or realized gains (losses) were recorded by the Fund. |
| c) | Distributions and Components of Distributable Earnings – The tax character of distributions paid by the Fund for the periods indicated is as follows (as adjusted for dividends payable, if applicable): |
| For the Year Ended December 31, 2012 | For the Year Ended December 31, 2011 | |||||||
| Ordinary Income | $ | 11,152 | $ | 10,262 | ||||
As of December 31, 2012, the Fund’s components of distributable earnings (deficit) on a tax basis were as follows:
| Amount | ||||
| Undistributed Ordinary Income | $ | 260 | ||
| Undistributed Long-Term Capital Gain | 45,282 | |||
| Unrealized Appreciation* | 150,985 | |||
| Total Accumulated Earnings | $ | 196,527 | ||
| * | Differences between book-basis and tax-basis unrealized appreciation (depreciation) may be attributable to the losses deferred due to wash sale adjustments, foreign currency gains and losses, adjustments related to PFICs, REITs, RICs, certain derivatives and partnerships. |
| 16 |
| d) | Reclassification of Capital Accounts – The Fund may record reclassifications in its capital accounts. These reclassifications have no impact on the total net assets of the Fund. The reclassifications are a result of permanent differences between U.S. GAAP and tax accounting for such items as foreign currency, PFICs, expiration or utilization of capital loss carryforwards or net operating losses. Adjustments are made to reflect the impact these items have on current and future distributions to shareholders. Therefore, the source of the Fund’s distributions may be shown in the accompanying Statement of Changes in Net Assets as from undistributed net investment income, from accumulated net realized gains on investments or from capital depending on the type of book and tax differences that exist. For the year ended December 31, 2012, the Fund recorded reclassifications to increase (decrease) the accounts listed below: |
| Amount | ||||
| Undistributed Net Investment Income | $ | (938 | ) | |
| Accumulated Net Realized Gain (Loss) | 2,401 | |||
| Capital Stock and Paid-in-Capital | (1,463 | ) | ||
| e) | Capital Loss Carryforward – On December 22, 2010, the Regulated Investment Company Modernization Act of 2010 (the “Act”) was enacted, which made changes to the capital loss carryforward rules. The changes are effective for taxable years beginning after the date of enactment. Under the Act, funds are permitted to carry forward capital losses for an unlimited period. However, any losses incurred during those future taxable years will be required to be utilized prior to the losses incurred in pre-enactment taxable years, which carry an expiration date. As a result of this ordering rule, pre-enactment capital loss carryforwards may be more likely to expire unused. Additionally, post-enactment capital loss carryforwards retain their character as either short-term or long-term capital losses rather than being considered all short-term as permitted under prior regulation. |
The Fund had no capital loss carryforward for U.S. federal income tax purposes as of December 31, 2012.
During the year ended December 31, 2012, the Fund utilized $59,008 of prior year capital loss carryforwards.
| f) | Accounting for Uncertainty in Income Taxes – The Fund has adopted financial reporting rules that require the Fund to analyze all open tax years, as defined by the statute of limitations, for all major jurisdictions. Generally, tax authorities can examine all tax returns filed for the last three years. The Fund does not have an examination in progress. |
The Fund has reviewed all open tax years and major jurisdictions and concluded that these financial reporting rules had no effect on the Fund’s financial position or results of operations. There is no tax liability resulting from unrecognized tax benefits relating to uncertain income tax positions taken or expected to be taken on the tax return for the fiscal year ended December 31, 2012. The Fund is also not aware of any tax positions for which it is reasonably possible that the total amounts of unrecognized tax benefits will significantly change in the next twelve months.
| 6. | Expenses: |
| a) | Investment Management Agreement – Hartford Funds Management Company, LLC (“HFMC”), an indirect wholly owned subsidiary of The Hartford Financial Services Group, Inc. (“The Hartford”), serves as investment manager to the Fund pursuant to an Investment Management Agreement with the Company. The investment manager has overall investment supervisory responsibility for the Fund. In addition, the investment manager provides administrative personnel, services, equipment, facilities and office space for proper operation of the Fund. The investment manager has contracted with Wellington Management Company, LLP (“Wellington Management”) under a sub-advisory agreement for the provision of day-to-day investment management services to the Fund in accordance with the Fund’s investment objective and policies. The Fund pays a fee to the investment manager, a portion of which may be used to compensate Wellington Management. |
| 17 |
| Hartford MidCap HLS Fund |
| Notes to Financial Statements – (continued) |
| June 30, 2013 (Unaudited) |
| (000’s Omitted) |
The schedule below reflects the rates of compensation paid to HFMC for investment management services rendered as of June 30, 2013; the rates are accrued daily and paid monthly.
| Average Daily Net Assets | Annual Fee | |||
| On first $250 million | 0.7750% | |||
| On next $250 million | 0.7250% | |||
| On next $500 million | 0.6750% | |||
| On next $4 billion | 0.6250% | |||
| On next $5 billion | 0.6225% | |||
| Over $10 billion | 0.6200% | |||
| b) | Accounting Services Agreement – Pursuant to the Fund Accounting Agreement between HFMC and the Company, on behalf of the Fund, HFMC provides accounting services to the Fund and receives monthly compensation based on the Fund’s average daily net assets at the rates set forth below. The Fund’s accounting services fees are accrued daily and paid monthly. |
| Average Daily Net Assets | Annual Fee | |||
| All assets | 0.010% | |||
| c) | Operating Expenses – Allocable expenses incurred by the Company are allocated to each Fund and allocated to classes within a Fund in proportion to the average daily net assets of the Fund and each class, except where allocation of certain expenses is more fairly made directly to the Fund or to specific classes within a Fund. |
| d) | Fees Paid Indirectly – The Company, on behalf of the Fund, has entered into agreements with State Street Global Markets, LLC and Russell Implementation Services, Inc. to partially recapture non-discounted trade commissions. Such rebates are used to pay a portion of the Fund’s expenses. In addition, the Fund’s custodian banks have agreed to reduce its fees when the Fund maintains cash on deposit in a non-interest-bearing custody account. For the six-month period ended June 30, 2013, these amounts, if any, are included in the Statement of Operations. |
The ratio of expenses to average net assets in the accompanying financial highlights excludes the reduction in expenses related to fees paid indirectly. The annualized expense ratio for the period listed below reflecting the reduction for fees paid indirectly is as follows:
| Annualized Six- Month Period Ended June 30, 2013 | ||||
| Class IA | 0.71% | |||
| Class IB | 0.96 | |||
| e) | Distribution Plan for Class IB shares – The Company, on behalf of the Fund, has adopted a Distribution Plan pursuant to Rule 12b-1 of the 1940 Act to compensate the distributor, Hartford Funds Distributors, LLC (“HFD”), (formerly known as Hartford Investment Financial Services, LLC), an indirect wholly owned subsidiary of The Hartford, from assets attributable to the Class IB shares for services rendered and expenses borne in connection with activities primarily intended to result in the sale of the Class IB shares, subject to the review and approval of the Company’s Board of Directors. |
The Distribution Plan provides that the Fund may pay annually up to 0.25% of the average daily net assets of the Fund attributable to its Class IB shares for activities primarily intended to result in the sale of Class IB shares. The Board has the authority to suspend or reduce these payments at any point in time. Under the terms of the Distribution Plan and the
| 18 |
principal underwriting agreement, the Fund is authorized to make payments monthly to the distributor that may be used to pay or compensate entities providing distribution and shareholder servicing with respect to the Class IB shares for such entities’ fees or expenses incurred or paid in that regard. These fees are accrued daily and paid monthly.
| f) | Other Related Party Transactions – Certain officers of the Fund are directors and/or officers of the investment manager and/or The Hartford or its subsidiaries. For the six-month period ended June 30, 2013, a portion of the Fund’s Chief Compliance Officer’s salary was paid by all the investment companies in the Hartford fund complex. The portion allocated to the Fund was in the amount of $1. Hartford Administrative Services Company (“HASCO”), an indirect wholly owned subsidiary of The Hartford, provides transfer agent services to the Fund. HASCO was compensated on a per account basis for providing such services. The amount paid to HASCO can be found in the Statement of Operations. These fees are accrued daily and paid monthly. |
| g) | Payment from Affiliate – In July of 2007, The Hartford entered into a settlement with the Attorneys General of the states of New York, Connecticut and Illinois relating to market timing and the company's individual variable annuity contracts in which certain payments would be made directly to the variable annuity contract holders. The distribution plan provided that unclaimed money from the settlement would be distributed to certain HLS Funds that are investment options through a Hartford individual variable annuity contract. The unclaimed money was distributed to the Fund on September 18, 2009. |
The total return in the accompanying financial highlights includes a payment from an affiliate. Had the payment from the affiliate been excluded, the impact and total return for the period listed below would have been as follows:
| For the Year Ended December 31, 2009 | ||||||||
| Class IA | Class IB | |||||||
| Impact from Payment from Affiliate for Attorneys General Settlement | 0.03 | % | 0.03 | % | ||||
| Total Return Excluding Payment from Affiliate | 30.92 | % | 30.59 | % | ||||
| 7. | Investment Transactions: |
For the six-month period ended June 30, 2013, the Fund's aggregate purchases and sales of investment securities (excluding short-term investments) were as follows:
| Amount | ||||
| Cost of Purchases Excluding U.S. Government Obligations | $ | 258,457 | ||
| Sales Proceeds Excluding U.S. Government Obligations | 327,887 | |||
| 8. | Line of Credit: |
The Fund is one of several Hartford funds that participate in a $500 million committed revolving line of credit facility. The facility is to be used for temporary or emergency purposes. Under the arrangement, the funds are required to own securities having a market value in excess of 300% of the total bank borrowings. The interest rate on borrowings varies depending on the nature of the loan. The facility also requires a fee to be paid based on the amount of the commitment. This commitment fee is allocated to all of the funds participating in the line of credit based on the average net assets of the funds. During the six-month period ended June 30, 2013, the Fund did not have any borrowings under this facility.
| 9. | Industry Classifications: |
Other than the industry classifications “Other Investment Pools and Funds” and “Exchange Traded Funds,” equity industry classifications used in this report are the Global Industry Classification Standard, which was developed by and is the exclusive property and service mark of MSCI, Inc. and Standard & Poor’s.
| 19 |
| Hartford MidCap HLS Fund |
| Notes to Financial Statements – (continued) |
| June 30, 2013 (Unaudited) |
| (000’s Omitted) |
| 10. | Indemnifications: |
Under the Company’s organizational documents, the Company shall indemnify its officers and directors to the full extent required or permitted under Maryland General Corporation Law and the federal securities laws. In addition, the Company, on behalf of the Fund, may enter into contracts that contain a variety of indemnifications. The Company’s maximum exposure under these arrangements is unknown. However, as of the date of these financial statements, the Company has not had prior claims or losses pursuant to these contracts and expects the risk of loss to be remote.
| 11. | Pending Legal Proceedings:. |
On February 25, 2011, Jennifer L. Kasilag, Louis Mellinger, Judith M. Menendez, Jacqueline M. Robinson, and Linda A. Russell filed a derivative lawsuit against Hartford Investment Financial Services, LLC (“HIFSCO”)(now known as Hartford Funds Distributors, LLC) on behalf of six Hartford retail mutual funds in the United States District Court for the District of New Jersey, alleging that HIFSCO received excessive advisory and distribution fees in violation of its statutory fiduciary duty under Section 36(b) of the 1940 Act when serving as investment manager and principal underwriter, respectively, to the Hartford retail mutual funds. HIFSCO moved to dismiss and, in September 2011, the motion was granted in part and denied in part, with leave to amend the complaint. In November 2011, plaintiffs filed an amended complaint on behalf of certain Hartford retail mutual funds, The Hartford Global Health Fund (now known as The Hartford Healthcare Fund), The Hartford Conservative Allocation Fund, The Hartford Growth Opportunities Fund, The Hartford Inflation Plus Fund, The Hartford Advisers Fund (now known as The Hartford Balanced Fund), and The Hartford Capital Appreciation Fund. Plaintiffs seek to rescind the investment management agreements and distribution plans between HIFSCO and these funds and to recover the total fees charged thereunder or, in the alternative, to recover any improper compensation HIFSCO received, in addition to lost earnings. HIFSCO filed a partial motion to dismiss the amended complaint and, in December 2012, the court dismissed without prejudice the claims regarding distribution fees and denied the motion with respect to the advisory fees claims. HIFSCO disputes the allegations and intends to defend vigorously.
This action concerns the activities of HIFSCO in its capacity as investment manager and principal underwriter to the Hartford retail mutual funds and does not concern HIFSCO’s activities in its capacity as principal underwriter to the HLS funds. For this reason, no accrual for litigation relating to this matter has been recorded in the financial statements of the Fund.
| 20 |
[This page is intentionally left blank]
| 21 |
| Hartford MidCap HLS Fund |
| Financial Highlights |
| - Selected Per-Share Data (A) - |
Class | Net Asset Value at | Net Investment | Net Realized and | Total from | Dividends from Net | Distributions from | Distributions from | Total Distributions | Net Asset Value at | |||||||||||||||||||||||||||
| For the Six-Month Period Ended June 30, 2013 (Unaudited) | ||||||||||||||||||||||||||||||||||||
| IA | $ | 28.16 | $ | 0.07 | $ | 4.77 | $ | 4.84 | $ | – | $ | – | $ | – | $ | – | $ | 33.00 | ||||||||||||||||||
| IB | 27.95 | 0.02 | 4.75 | 4.77 | – | – | – | – | 32.72 | |||||||||||||||||||||||||||
| For the Year Ended December 31, 2012 | ||||||||||||||||||||||||||||||||||||
| IA | 23.77 | 0.24 | 4.38 | 4.62 | (0.23 | ) | – | – | (0.23 | ) | 28.16 | |||||||||||||||||||||||||
| IB | 23.59 | 0.17 | 4.35 | 4.52 | (0.16 | ) | – | – | (0.16 | ) | 27.95 | |||||||||||||||||||||||||
| For the Year Ended December 31, 2011 | ||||||||||||||||||||||||||||||||||||
| IA | 26.01 | 0.15 | (2.20 | ) | (2.05 | ) | (0.19 | ) | – | – | (0.19 | ) | 23.77 | |||||||||||||||||||||||
| IB | 25.74 | 0.07 | (2.17 | ) | (2.10 | ) | (0.05 | ) | – | – | (0.05 | ) | 23.59 | |||||||||||||||||||||||
| For the Year Ended December 31, 2010 | ||||||||||||||||||||||||||||||||||||
| IA | 21.12 | 0.10 | 4.85 | 4.95 | (0.06 | ) | – | – | (0.06 | ) | 26.01 | |||||||||||||||||||||||||
| IB | 20.92 | 0.04 | 4.79 | 4.83 | (0.01 | ) | – | – | (0.01 | ) | 25.74 | |||||||||||||||||||||||||
| For the Year Ended December 31, 2009 | ||||||||||||||||||||||||||||||||||||
| IA | 16.21 | 0.12 | (G) | 4.89 | 5.01 | (0.10 | ) | – | – | (0.10 | ) | 21.12 | ||||||||||||||||||||||||
| IB | 16.06 | 0.05 | (G) | 4.86 | 4.91 | (0.05 | ) | – | – | (0.05 | ) | 20.92 | ||||||||||||||||||||||||
| For the Year Ended December 31, 2008 | ||||||||||||||||||||||||||||||||||||
| IA | 26.34 | 0.12 | (9.03 | ) | (8.91 | ) | (0.12 | ) | (1.10 | ) | – | (1.22 | ) | 16.21 | ||||||||||||||||||||||
| IB | 26.08 | 0.06 | (8.92 | ) | (8.86 | ) | (0.06 | ) | (1.10 | ) | – | (1.16 | ) | 16.06 | ||||||||||||||||||||||
| (A) | Information presented relates to a share outstanding throughout the indicated period. |
| (B) | The figures do not include sales charges or other fees which may be applied at the variable life insurance, variable annuity or qualified retirement plan product level. Any such additional sales charges or other fees would lower the Fund's performance. |
| (C) | Ratios do not reflect reductions for fees paid indirectly. Please see Fees Paid Indirectly in the Notes to Financial Statements. |
| (D) | Portfolio turnover rate is calculated on the basis of the Fund as a whole without distinguishing between the classes of shares issued. |
| (E) | Not annualized. |
| (F) | Annualized. |
| (G) | The impact of Payment from Affiliate per share was $0.01. |
| (H) | Total return without the inclusion of the Payment from (to) Affiliate can be found in Expenses in the accompanying Notes to Financial Statements. |
| 22 |
| - Ratios and Supplemental Data - |
| Total Return(B) | Net Assets at End of Period | Ratio of Expenses to Average Net Assets Before Waivers(C) | Ratio of Expenses to Average Net Assets After Waivers(C) | Ratio of Net Investment Income (Loss) to Average Net Assets | Portfolio Turnover Rate(D) | |||||||||||||||||
| 17.22 | %(E) | $ | 1,355,673 | 0.71 | %(F) | 0.71 | %(F) | 0.36 | %(F) | 17 | % | |||||||||||
| 17.07 | (E) | 77,044 | 0.96 | (F) | 0.96 | (F) | 0.11 | (F) | – | |||||||||||||
| 19.44 | 1,325,221 | 0.71 | 0.71 | 0.84 | 51 | |||||||||||||||||
| 19.14 | 70,997 | 0.96 | 0.96 | 0.59 | – | |||||||||||||||||
| (7.92 | ) | 1,212,257 | 0.71 | 0.71 | 0.48 | 69 | ||||||||||||||||
| (8.16 | ) | 70,188 | 0.96 | 0.96 | 0.18 | – | ||||||||||||||||
| 23.45 | 1,722,182 | 0.70 | 0.70 | 0.44 | 52 | |||||||||||||||||
| 23.15 | 124,465 | 0.95 | 0.95 | 0.12 | – | |||||||||||||||||
| 30.96 | (H) | 1,490,852 | 0.72 | 0.72 | 0.48 | 82 | ||||||||||||||||
| 30.62 | (H) | 173,205 | 0.97 | 0.97 | 0.23 | – | ||||||||||||||||
| (35.32 | ) | 1,552,741 | 0.69 | 0.69 | 0.51 | 92 | ||||||||||||||||
| (35.49 | ) | 169,328 | 0.94 | 0.94 | 0.26 | – | ||||||||||||||||
| 23 |
| Hartford MidCap HLS Fund |
| Directors and Officers (Unaudited) |
The Board of Directors of the Company appoints officers who are responsible for the day-to-day operations of the Fund and who execute policies formulated by the Directors. Each director serves until his or her death, resignation, or retirement or until the next annual meeting of shareholders is held or until his or her successor is elected and qualifies.
Directors and officers who are employed by or who have a financial interest in The Hartford are considered “interested” persons of the Fund pursuant to the 1940 Act. Each officer and two of the Company’s directors, as noted in the chart below, are “interested” persons of the Fund. Each director serves as a director for The Hartford Mutual Funds, Inc., The Hartford Mutual Funds II, Inc., Hartford Series Fund, Inc., Hartford HLS Series Fund II, Inc., and as a trustee for The Hartford Alternative Strategies Fund, which, as of June 30, 2013, collectively consist of 90 funds. Correspondence may be sent to directors and officers c/o Hartford Mutual Funds, P.O. Box 2999, Hartford, Connecticut 06104-2999, except that correspondence to Mr. Annoni, Mr. Dressen, Ms. Fagely and Ms. Quade may be sent to 500 Bielenberg Drive, Woodbury, Minnesota 55125 and correspondence to Mr. Davey and Mr. Melcher may be sent to 5 Radnor Corporate Center, Suite 300, 100 Matsonford Road, Radnor, Pennsylvania 19087.
The table below sets forth, for each director and officer, his or her name, year of birth, current position with the Company and date first elected or appointed to Hartford Series Fund, Inc. (“HSF”), and Hartford HLS Series Fund II, Inc. (“HSF2”), principal occupation, and, for directors, other directorships held. The Fund’s statement of additional information contains further information on the directors and is available free of charge by calling 1-800-862-6668 or writing to Hartford HLS Funds, c/o Hartford Life Insurance Company, Hartford Life and Annuity Insurance Company, P.O. Box 14293, Lexington, KY 40512-4293.
Information on the aggregate remuneration paid to the directors of the Company can be found in the Statement of Operations herein. The Fund pays to The Hartford a portion of the Chief Compliance Officer’s compensation, but does not pay salaries or compensation to any of their other officers or directors who are employed by The Hartford.
Non-Interested Directors
Lynn S. Birdsong (1946) Director since 2003, Co-Chairman of the Investment Committee
Mr. Birdsong is a private investor. Mr. Birdsong currently serves as a Director of the Sovereign High Yield Investment Company (April 2010 to current). Mr. Birdsong currently serves as an Independent Director of Nomura Partners Funds, Inc. (formerly, The Japan Fund) (March 2003 to current). From 1979 to 2002, Mr. Birdsong was a managing director of Zurich Scudder Investments, an investment management firm. During his employment with Scudder, Mr. Birdsong was an Interested Director of The Japan Fund. Since 1981, Mr. Birdsong has been a partner in Birdsong Company, an advertising specialty firm.
Robert M. Gavin, Jr. (1940) Director since 2002 (HSF) and 1986 (HSF2), Chairman of the Board since 2004
Dr. Gavin is an educational consultant. Prior to September 1, 2001, he was President of Cranbrook Education Community and prior to July 1996, he was President of Macalester College, St. Paul, Minnesota.
Duane E. Hill (1945) Director since 2001 (HSF) and 2002 (HSF2), Chairman of the Nominating Committee
Mr. Hill is Partner of TSG Ventures L.P., a private equity investment company. Mr. Hill is a former partner of TSG Capital Group, a private equity investment firm that served as sponsor and lead investor in leveraged buyouts of middle market companies.
Sandra S. Jaffee (1941) Director since 2005
Ms. Jaffee is the founder and Chief Executive Officer of a private company, Homeworks Concierge, LLC, which provides residential property management services in Westchester County, New York (January 2012 to present). Ms. Jaffee served as Chairman (2008 to 2009) and Chief Executive Officer of Fortent (formerly Searchspace Group), a leading provider of compliance/regulatory technology to financial institutions from August 2005 to August 2009. Ms. Jaffee currently serves as a member of the Board of Directors of Broadridge Financial Solutions as well as a Trustee of Muhlenberg College.
William P. Johnston (1944) Director since 2005, Chairman of the Compliance Committee
In February 2008, Mr. Johnston was elected to the Board of Directors of HCR-ManorCare, Inc. In August 2007, Mr. Johnston was elected to the Board of Directors of LifeCare Holdings, Inc. In July 2006, Mr. Johnston was elected to the Board of Directors of MultiPlan, Inc. and served as a director (July 2006 to August 2010). In June 2006, Mr. Johnston was appointed as Senior Advisor to The Carlyle Group, a global private equity and alternative asset investment firm. In May 2006, Mr. Johnston was elected to the Supervisory Board of Fresenius Medical Care AG & Co. KGaA, after its acquisition of Renal Care Group, Inc. in March 2006.
| 24 |
Phillip O. Peterson (1944) Director since 2002 (HSF) and 2000 (HSF2), Chairman of the Audit Committee
Mr. Peterson is a mutual fund industry consultant. He was a partner of KPMG LLP (an accounting firm) until July 1999. Mr. Peterson joined William Blair Funds in February 2007 as a member of the Board of Trustees. Mr. Peterson also joined the Board of Trustees of Symetra Variable Mutual Funds Trust as a trustee in February 2012.
Lemma W. Senbet (1946) Director since 2005
Dr. Senbet is the William E. Mayer Chair Professor of Finance and Director, Center for Financial Policy, at the University of Maryland, Robert H. Smith School of Business. He was chair of the Finance Department from 1998 to 2006. Previously he was a chaired professor of finance at the University of Wisconsin-Madison. Also, he was director of the Fortis Funds from March 2000 to July 2002. Dr. Senbet served the finance profession in various capacities, including as director of the American Finance Association and President of the Western Finance Association. In 2006, Dr. Senbet was inducted Fellow of Financial Management Association International for his career-long distinguished scholarship and professional service.
Interested Directors and Officers
James E. Davey (1964) Director since 2012, President and Chief Executive Officer since 2010
Mr. Davey serves as Executive Vice President of Hartford Life Insurance Company (“HLIC”) and The Hartford Financial Services Group, Inc. Additionally, Mr. Davey serves as Chairman of the Board and Manager of Hartford Funds Distributors, LLC (“HFD”) and Hartford Administrative Services Company (“HASCO”). Mr. Davey also serves as Manager, President and Chairman of the Board for Hartford Funds Management Company, LLC (“HFMC”). Mr. Davey joined The Hartford in 2002.
Lowndes A. Smith (1939) Director since 1996 (HSF) and 2002 (HSF2), Co-Chairman of the Investment Committee
Mr. Smith served as Vice Chairman of The Hartford from February 1997 to January 2002, as President and Chief Executive Officer of Hartford Life, Inc. from February 1997 to January 2002, and as President and Chief Operating Officer of The Hartford Life Insurance Companies from January 1989 to January 2002. Mr. Smith serves as a Director of White Mountains Insurance Group, Ltd., One Beacon Insurance and Symetra Financial and as Managing Director of Whittington Gray Associates.
Other Officers
Mark A. Annoni (1964) Vice President, Controller and Treasurer since 2012
Mr. Annoni serves as the Assistant Vice President of HLIC (February 2004 to present). Mr. Annoni joined The Hartford in April 2001 as part of The Hartford’s acquisition of Fortis Financial Group (“Fortis”). Prior to joining The Hartford, Mr. Annoni served as Manager of Mutual Fund Accounting at Fortis (July 1997 to April 2001).
Michael R. Dressen (1963) AML Compliance Officer since 2011
Mr. Dressen currently serves as Assistant Vice President of HLIC. He also serves as Chief Compliance Officer and AML Compliance Officer of HASCO and as AML Officer of HFD. Mr. Dressen joined The Hartford in 2005 from State Farm Insurance Companies where he held various positions related to mutual funds, variable products, and property casualty insurance.
Tamara L. Fagely (1958) Vice President since 2002 (HSF) and 1993 (HSF2)
Currently, Ms. Fagely is President and a Director of HASCO, Chief Administrative Officer and Manager of HFMC and a Vice President of HLIC. Ms. Fagely served as a Vice President of HASCO (1998-2013) and Chief Financial Officer of HASCO (2006-2013). She served as Assistant Vice President of HLIC from December 2001 through March 2005. In addition, Ms. Fagely is Manager and Chief Operating Officer of HFD.
Edward P. Macdonald (1967) Vice President, Secretary and Chief Legal Officer since 2005
Mr. Macdonald serves as Vice President of HLIC and Vice President, Chief Legal Officer and Secretary of HFD and HASCO. Mr. Macdonald also serves as Manager, Vice President, Chief Legal Officer and Secretary of HFMC. Mr. Macdonald joined The Hartford in 2005.
Joseph G. Melcher (1973) Vice President and Chief Compliance Officer since 2013(1)
Mr. Melcher currently serves as Vice President of HFMC and HFD. Mr. Melcher joined The Hartford in 2012 from Touchstone Investments, a member of the Western & Southern Financial Group, where he held the position of Vice President and Chief Compliance Officer from 2010 through 2012 and Assistant Vice President, Compliance from 2005 to 2010.
| (1) | Mr. Melcher was named Vice President and Chief Compliance Officer of HSF and HSF2 on February 6, 2013. Prior to February 6, 2013, Colleen Pernerewski served as Chief Compliance Officer of HSF and HSF2. |
| 25 |
| Hartford MidCap HLS Fund |
| Directors and Officers (Unaudited) – (continued) |
Vernon J. Meyer (1964) Vice President since 2006
Mr. Meyer serves as Senior Vice President of HLIC. He also serves as Senior Vice President of HFMC and HFD. Mr. Meyer joined The Hartford in 2004.
Laura S. Quade (1969) Vice President since 2012
Ms. Quade currently serves as Vice President of HASCO and is a Director of Mutual Fund Service Operations. She also serves as Director, Enterprise Operations of HFD and HLIC. Ms. Quade joined The Hartford in 2001 as part of The Hartford’s acquisition of Fortis.
Elizabeth L. Schroeder (1966) Vice President since 2010(2)
Ms. Schroeder currently serves as Assistant Vice President of HLIC. Ms. Schroeder joined HLIC in 1991. She is also an Assistant Vice President of HFMC and HASCO.
(2) Ms. Schroeder served as Vice President of HSF and HSF2 until August 7, 2013.
Martin Swanson (1962) Vice President since 2010
Mr. Swanson is a Vice President of HLIC. Mr. Swanson also serves as Chief Marketing Officer for HFD. Prior to joining HLIC in 1998, Mr. Swanson was a Vice President at PaineWebber, Inc.
HOW TO OBTAIN A COPY OF THE FUND’S PROXY VOTING POLICIES AND VOTING RECORDS (UNAUDITED)
A description of the policies and procedures that the Fund uses to determine how to vote proxies relating to portfolio securities and information about how the Fund voted proxies relating to portfolio securities during the most recent twelve-month period ended June 30 are available (1) without charge, upon request, by calling 800-862-6668 and (2) on the SEC’s website at http://www.sec.gov.
QUARTERLY PORTFOLIO HOLDINGS INFORMATION (UNAUDITED)
The Fund files a complete schedule of portfolio holdings with the SEC for the first and third quarters of each fiscal year on Form N-Q. The Fund’s Forms are available (1) without charge, upon request, by calling 800-862-6668 and (2) on the SEC’s website at http://www.sec.gov. The Form N-Q may be reviewed and copied at the SEC’s Public Reference Room in Washington, DC. Information on the operation of the Public Reference Room may be obtained by calling 1-800-SEC-0330.
| 26 |
| Hartford MidCap HLS Fund |
| Expense Example (Unaudited) |
Your Fund's Expenses
As a shareholder of the Fund, you incur two types of costs: (1) transaction costs and (2) ongoing costs including investment management fees, distribution fees, if any, and other fund expenses. This example is intended to help you understand your ongoing costs (in dollars) of investing in the Fund and to compare these costs with the ongoing costs of investing in other mutual funds. The example is based on an investment of $1,000 invested at the beginning of the period and held for the period of December 31, 2012 through June 30, 2013.
Actual Expenses
The first set of columns of the table below provides information about actual account values and actual expenses. You may use the information in this column, together with the amount you invested, to estimate the expenses that you paid over the period. Simply divide your account value by $1,000 (for example, an $8,600 account value divided by $1,000 = 8.6), then multiply the result by the number in the line under the heading entitled “Expenses Paid During Period” to estimate the expenses you paid on your account during this period.
Hypothetical Example for Comparison Purposes
The second set of columns of the table below provides information about hypothetical account values and hypothetical expenses based on the Fund’s actual expense ratio and an assumed rate of return of 5% per year before expenses, which is not the Fund’s actual return. The hypothetical account values and expenses may not be used to estimate the actual ending account balance or expenses you paid for the period. You may use this information to compare the ongoing costs of investing in the Fund and other funds. To do so, compare this 5% hypothetical example with the 5% hypothetical examples that appear in the shareholder reports of the other funds.
Please note that the expenses shown in the table are meant to highlight your ongoing costs only and do not reflect any transactional costs, such as sales charges (loads) and CDSC. Therefore, the second set of columns of the table is useful in comparing ongoing costs only, and will not help you determine the relative total costs of owning different funds. In addition, if these transactional costs were included, your costs would be higher. Expenses are equal to the Fund's annualized expense ratios multiplied by average account value over the period, multiplied by 181/365 (to reflect the one-half year period).
| Actual return | Hypothetical (5% return before expenses) | |||||||||||||||||||||||||||||||||||
| Beginning Account Value December 31, 2012 | Ending Account Value June 30, 2013 | Expenses paid during the period December 31, 2012 through June 30, 2013 | Beginning Account Value December 31, 2012 | Ending Account Value June 30, 2013 | Expenses paid during the period December 31, 2012 through June 30, 2013 | Annualized expense ratio | Days in the current 1/2 year | Days in the full year | ||||||||||||||||||||||||||||
| Class IA | $ | 1,000.00 | $ | 1,172.20 | $ | 3.82 | $ | 1,000.00 | $ | 1,021.27 | $ | 3.56 | 0.71 | % | 181 | 365 | ||||||||||||||||||||
| Class IB | $ | 1,000.00 | $ | 1,170.70 | $ | 5.17 | $ | 1,000.00 | $ | 1,020.03 | $ | 4.81 | 0.96 | % | 181 | 365 | ||||||||||||||||||||
| 27 |
| Hartford MidCap HLS Fund |
| Principal Risks (Unaudited) |
The principal risks of investing in the Fund are described below.
Market, Selection, and Strategy Risk: The Fund’s share price may fluctuate due to market risk and/or security selections that may underperform the market or relevant benchmarks. If the sub-adviser’s investment strategy does not perform as expected, the Fund could underperform its peers or lose money. There is no guarantee the Fund will achieve its stated objective.
Mid-cap Stock Risk: Mid-cap stocks are generally more volatile and risky and may be less liquid than large-cap stocks because they may have limited operating histories, narrow product lines, and focus on niche markets.
Foreign Investment Risk: Foreign investments can be riskier than U.S. investments. Potential risks include currency risk that may result from unfavorable exchange rates, liquidity risk if decreased demand for a security makes it difficult to sell at the desired price, and risks that stem from substantially lower trading volume on foreign markets.
| 28 |
HARTFORD HLS FUNDS
c/o The Hartford Wealth Management - Global Annuities
P.O. Box 14293
Lexington, KY 40512-4293
HARTFORDFUNDS
hartfordfunds.com
Hartford Series Fund, Inc. is underwritten and distributed by Hartford Funds Distributors, LLC.
Hartford Series Fund, Inc. inception dates range from 1977 to date. Hartford Series Fund, Inc. is not a subsidiary of The Hartford Financial Services Group, Inc. ("The Hartford") but is underwritten, distributed by and advised by subsidiaries of The Hartford. Investments in Hartford Series Fund, Inc. are not guaranteed by The Hartford or any other entity.
You should carefully consider investment objectives, risks, and charges and expenses of Hartford HLS Funds before investing. This and other information can be found in the Fund’s prospectus or summary prospectus, which can be obtained by calling 800-862-6668. Please read them carefully before you invest or send money.
HLSSAR-MC13 8-13 113547-1 Printed in U.S.A ©2013 The Hartford, Hartford, CT 06115
HARTFORDFUNDS
| HARTFORD MIDCAP VALUE
HLS FUND
2013 Semi Annual Report
|
A MESSAGE FROM THE PRESIDENT
Dear Fellow Shareholders:
I want to take this opportunity to say thank you for investing in the Hartford HLS Funds.
Market Review
During the first half of the year, stocks rose steadily. U.S. equities (as represented by the S&P 500 Index1) posted a strong gain of 10.61% during the first quarter, on their way to an all-time high. During the second quarter, investors persevered through volatility surrounding rumors of the rollback of the U.S. Federal Reserve’s quantitative easing (QE) program later this year, and the S&P 500 Index rose 2.91%. That brought the market’s rise to 13.82% for the first half of 2013. The rumors about QE’s end sent bond yields and mortgage rates upward, but that wasn’t enough to dissuade investors from pushing equities into positive territory.
Because of QE, some have expressed concerns regarding the recent market rally. But a more careful examination of economic data reveals a strong foundation. Consumer balance sheets have improved since the financial crisis, with consumer debt as a percentage of income falling steadily. Housing continued its dogged recovery, fueled by population growth and pent-up demand. In fact, it’s substantive economic improvements that have moved Federal Reserve Chairman Ben Bernanke to consider removing the “training wheels” of QE, which we think should be viewed as a vote of confidence in the U.S. economy going forward.
As the U.S. outlook continues to improve, concerns do remain in the global economy. Emerging markets have lagged due to social unrest and rising inflation. Slowing growth in China is clouding global growth forecasts, but it’s important to remember that China still boasts 7.5% annual GDP growth.
It’s important to stay abreast of domestic and international economic developments while balancing your individual investment goals. Meeting with your financial advisor on a regular basis to examine your current investment strategy can help you determine whether you are on the right track:
| • | Is your portfolio fully diversified with an appropriate mix of stocks and bonds? |
| • | Is your fixed-income portfolio positioned to take advantage of opportunities across the credit spectrum and fulfill your income needs? |
| • | Is your portfolio still in line with your risk tolerance and investment time horizon? |
Your financial professional can help you choose options within our fund family to navigate today’s markets with confidence.
Thank you again for investing with the Hartford HLS Funds.
James Davey
President
Hartford HLS Funds
1 The S&P 500 Index is a market capitalization-weighted price index composed of 500 widely held common stocks.
Hartford MidCap Value HLS Fund
Table of Contents
This report is prepared for the general information of contract owners and qualified retirement plan participants. It is not an offer of contracts or of qualified retirement plans. It should not be used in connection with any offer, except in conjunction with the appropriate product prospectus which contains all pertinent information including the applicable sales, administrative and other charges.
The views expressed in the Fund’s Manager Discussion under ‘‘Why did the Fund perform this way?’’ and ‘‘What is the outlook?’’ are views of the Fund’s sub-adviser and portfolio management team through the end of the period and are subject to change based on market and other conditions. The Fund’s Manager Discussion is for informational purposes only and does not represent an offer, recommendation or solicitation to buy, hold or sell any security. The specific securities identified and described, if any, do not represent all of the securities purchased or sold and you should not assume that investments in the securities identified and discussed will be profitable.
| Hartford MidCap Value HLS Fund* inception 04/30/2001 |
| (sub-advised by Wellington Management Company, LLP) |
| Investment objective – Seeks long-term capital appreciation. |
Performance Overview 6/30/03 - 6/30/13
The chart above represents the hypothetical growth of a $10,000 investment in Class IA. Growth results in classes other than Class IA will vary from what is seen above due to differences in the expenses charged to those share classes.
Average Annual Total Returns (as of 6/30/13)
| 6 Month† | 1 Year | 5 Years | 10 Years | |||||||||||||
| MidCap Value IA | 14.60% | 28.24% | 10.79% | 10.47% | ||||||||||||
| MidCap Value IB | 14.46% | 27.92% | 10.52% | 10.20% | ||||||||||||
| Russell 2500 Value Index | 15.09% | 26.87% | 9.42% | 10.16% | ||||||||||||
| Russell Midcap Value Index | 16.10% | 27.65% | 8.87% | 10.92% | ||||||||||||
| † | Not Annualized |
PERFORMANCE DATA QUOTED REPRESENTS PAST PERFORMANCE AND DOES NOT GUARANTEE FUTURE RESULTS. The investment return and principal value of the investment will fluctuate so that investors’ shares, when redeemed, may be worth more or less than their original cost. Current performance may be lower or higher than the performance data quoted. To obtain performance data current to the most recent month-end, please visit our website www.hartfordfunds.com.
Total returns presented above were calculated using the Fund's net asset value available to shareholders for sale or redemption of Fund shares on June 30, 2013, which may exclude investment transactions as of this date. All share class returns assume the reinvestment of all distributions at net asset value and the deduction of all fund expenses.
Russell 2500 Value Index is an unmanaged index measuring the performance of those Russell 2500 Index companies with lower price-to-book ratios and lower forecasted growth values. (The Russell 2500 Index is an unmanaged index that measures the performance of the 2,500 smallest U.S. companies based on total market capitalization.)
Russell Midcap Value Index measures the performance of the mid-cap value segment of the U.S. equity universe. It includes those Russell Midcap Index companies with lower price-to-book ratios and lower forecasted growth values.
You cannot invest directly in an index.
As of the Fund’s current prospectus dated May 1, 2013, the total annual operating expense ratios for Class IA and Class IB shares were 0.85% and 1.10%, respectively. Actual expenses may be higher. Please see the accompanying Financial Highlights for expense ratios for the six-month period ended June 30, 2013.
The chart and table do not reflect the deductions of taxes, sales charges or other fees which may be applied at the variable life insurance, variable annuity or qualified retirement plan product level. Any such additional sales charges or other fees or expenses would lower the contract’s or plan’s performance.
All investments are subject to risk including the possible loss of principal. For a discussion of the Fund’s risks, please see the Principal Risks section. For more detailed information on the risks associated with an investment in the Fund, please see the prospectus.
| * | The Fund has restrictions on the purchase of shares. A description of the restrictions can be found in the prospectus |
| 2 |
Hartford MidCap Value HLS Fund
Manager Discussion
June 30, 2013 (Unaudited)
| Portfolio Manager |
| James N. Mordy |
| Senior Vice President and Equity Portfolio Manager |
How did the Fund perform?
The Class IA shares of the Hartford MidCap Value HLS Fund returned 14.60% for the six-month period ended June 30, 2013, underperforming its benchmark, the Russell 2500 Value Index, which returned 15.09% for the same period. The Fund also underperformed the 16.00% average return of the Lipper Mid-Cap Value Variable Products-Underlying Funds Fund peer group, a group of funds with investment strategies similar to those of the Fund.
Why did the Fund perform this way?
U.S. equities (+13.8%), as measured by the S&P 500 Index, gained during the six-month period, reaching an all-time high in May. The rally began on the first trading day of the year after a last-minute compromise by the U.S. Congress averted the fiscal cliff. Optimism surrounding the fiscal reprieve was furthered during the first half of the period by better-than-expected corporate earnings, a robust housing market, and a gradually improving employment picture. In the second half of the period, a market rally throughout April and the first part of May paused following comments by Federal Reserve (Fed) Chairman Ben Bernanke that suggested the Fed might begin to slow quantitative easing (QE) sooner than investors anticipated. The Federal Open Market Committee’s June statement emphasized that the tapering schedule would depend on improving economic indicators. A strong housing market, positive consumer confidence trends, and a steadily healing labor market lent support to the thesis that underlying fundamentals were solid. Following an initially dramatic negative response to the Fed’s announcement and an increase in lending rates in China, U.S. markets moved higher into the end of the period.
During the period, mid cap equities (+14.6%) underperformed small caps (+15.9%) but outperformed large caps (+13.8%) as represented by the S&P Midcap 400, Russell 2000, S&P 500 Indices, respectively. All ten sectors in the Russell 2500 Value Index gained during the period, with Telecom & Media (+25.0%), Consumer Staples (+24.0%), and Health Care (+21.3%) performing the best. Materials (+1.7%) and Energy (+8.4%) lagged on a relative basis.
The Fund’s relative underperformance versus the index was primarily due to sector allocation, a result of bottom-up security selection. An overweight (i.e. the Fund’s sector position was greater than the benchmark position) to Materials and an underweight to Telecom & Media were the primary drivers of benchmark-relative underperformance. In addition, a modest cash position was also a detractor in an upward trending market. Overall, security selection contributed to positive results driven by strong stock selection within Financials, Materials, and Utilities, which outweighed weaker stock selection within Consumer Staples, Consumer Discretionary and Information Technology.
The largest detractors from benchmark-relative returns included Impax Lab (Health Care), BR Properties (Financials), and PHH (Financials). Shares of Impax Lab, a U.S.-based pharmaceutical company, declined during the period after the company failed a critical inspection by the Food & Drug Administration of a key manufacturing facility. This will result in further delays to potential new drug approvals. Shares of BR Properties, a Brazil-based company engaged in the real estate sector, underperformed on weaker sentiment towards Brazilian equities (negative money flow) ahead of a potential interest rate tightening cycle in Brazil, and on moderately higher office supply in Sao Paolo. Shares of PHH, a U.S.-based provider of mortgage and fleet management services, declined on concerns about the sustainability of mortgage gain-on-sale margins which will decline from record levels. Impax Lab (Health Care) and New Gold (Materials) also detracted from the Funds’ absolute performance (i.e. total return).
The largest contributors to absolute and benchmark-relative performance included Unum Group (financials), Delta Air Lines (industrials), and Methanex (materials). Shares of Unum Group, a benefits and disability insurer, gained as management downplayed the need for additional provisioning against its long-term care exposure. Shares of Delta Air Lines, a U.S.-based airline, rose during the period as Delta's March quarter was profitable for the first time in 13 years, and management cited significant opportunities to continue improving operating margins. Shares of Methanex, a Canada-based supplier of methanol to international markets in Asia Pacific, North America, Europe and Latin America, rose as the company started to relocate its idle facility from Chile to the U.S. to take advantage of cheap U.S. natural gas. This is a key element of management's strategy to boost capacity utilization and will provide more visible earnings growth over the next few years.
What is the outlook?
We remain positive on the economic outlook. In our opinion, the U.S. has managed to grow through the maximum impacts of tax hikes and sequestration, and we expect to see improved
| 3 |
Hartford MidCap Value HLS Fund
Manager Discussion – (continued)
June 30, 2013 (Unaudited)
growth ahead. We believe that the strong June jobs report makes Fed QE easing likely in the fall. The U.K. has strengthened and continental Europe has stabilized but remains fragile. Japan is responding to government stimulus. We believe that China remains a large risk, as is the rise in political tensions in the Middle East and Latin America.
As the rise in rates has been due more to improved expectations for economic growth than for inflation, we believe the cyclicals can continue to outperform. This view is further supported by the fact that cyclical stocks are still about 16% undervalued versus their recent history against the defensives.
As of the end of the period we were most overweight the Information Technology, Industrials, and Health Care sectors and most underweight the Financials, Utilities, and Consumer Discretionary sectors relative to the benchmark.
| Diversification by Industry | ||||
| as of June 30, 2013 | ||||
| Industry (Sector) | Percentage of Net Assets | |||
| Banks (Financials) | 8.5 | % | ||
| Capital Goods (Industrials) | 15.6 | |||
| Consumer Durables and Apparel (Consumer Discretionary) | 5.9 | |||
| Diversified Financials (Financials) | 1.9 | |||
| Energy (Energy) | 7.0 | |||
| Food, Beverage and Tobacco (Consumer Staples) | 3.7 | |||
| Health Care Equipment and Services (Health Care) | 5.1 | |||
| Insurance (Financials) | 9.8 | |||
| Materials (Materials) | 7.5 | |||
| Pharmaceuticals, Biotechnology and Life Sciences (Health Care) | 4.0 | |||
| Real Estate (Financials) | 5.4 | |||
| Retailing (Consumer Discretionary) | 2.8 | |||
| Semiconductors and Semiconductor Equipment (Information Technology) | 7.6 | |||
| Software and Services (Information Technology) | 3.7 | |||
| Technology Hardware and Equipment (Information Technology) | 3.3 | |||
| Transportation (Industrials) | 1.6 | |||
| Utilities (Utilities) | 5.1 | |||
| Short-Term Investments | 1.5 | |||
| Other Assets and Liabilities | 0.0 | |||
| Total | 100.0 | % | ||
| 4 |
Hartford MidCap Value HLS Fund
Schedule of Investments
June 30, 2013 (Unaudited)
(000’s Omitted)
| Shares or Principal Amount | Market Value ╪ | |||||||
| COMMON STOCKS - 98.5% | ||||||||
| Banks - 8.5% | ||||||||
| 185 | BankUnited, Inc. | $ | 4,814 | |||||
| 35 | Beneficial Mutual Bancorp, Inc. ● | 297 | ||||||
| 186 | Comerica, Inc. | 7,396 | ||||||
| 279 | EverBank Financial Corp. | 4,620 | ||||||
| 250 | First Midwest Bancorp, Inc. | 3,430 | ||||||
| 84 | Iberiabank Corp. | 4,487 | ||||||
| 147 | Popular, Inc. ● | 4,448 | ||||||
| 445 | Regions Financial Corp. | 4,236 | ||||||
| 209 | Zions Bancorporation | 6,027 | ||||||
| 39,755 | ||||||||
| Capital Goods - 15.6% | ||||||||
| 96 | AGCO Corp. | 4,808 | ||||||
| 279 | Barnes Group, Inc. | 8,365 | ||||||
| 90 | Chicago Bridge & Iron Co. N.V. | 5,375 | ||||||
| 49 | Dover Corp. | 3,790 | ||||||
| 100 | Esterline Technologies Corp. ● | 7,199 | ||||||
| 82 | Hubbell, Inc. Class B | 8,148 | ||||||
| 178 | KBR, Inc. | 5,791 | ||||||
| 115 | Moog, Inc. Class A ● | 5,916 | ||||||
| 161 | Pentair Ltd. | 9,276 | ||||||
| 155 | Rexel S.A. | 3,488 | ||||||
| 20 | Teledyne Technologies, Inc. ● | 1,578 | ||||||
| 132 | WESCO International, Inc. ● | 8,971 | ||||||
| 72,705 | ||||||||
| Consumer Durables and Apparel - 5.9% | ||||||||
| 31 | Harman International Industries, Inc. | 1,675 | ||||||
| 104 | Lennar Corp. | 3,763 | ||||||
| 47 | Mattel, Inc. | 2,125 | ||||||
| 294 | Newell Rubbermaid, Inc. | 7,704 | ||||||
| 2,644 | Samsonite International S.A. | 6,336 | ||||||
| 176 | Toll Brothers, Inc. ● | 5,726 | ||||||
| 27,329 | ||||||||
| Diversified Financials - 1.9% | ||||||||
| 170 | LPL Financial Holdings, Inc. | 6,408 | ||||||
| 109 | PHH Corp. ● | 2,219 | ||||||
| 452 | Solar Cayman Ltd. ⌂■●† | 32 | ||||||
| 8,659 | ||||||||
| Energy - 7.0% | ||||||||
| 366 | Cobalt International Energy, Inc. ● | 9,717 | ||||||
| 58 | Japan Petroleum Exploration Co., Ltd. | 2,344 | ||||||
| 149 | Newfield Exploration Co. ● | 3,564 | ||||||
| 347 | Ocean Rig UDW, Inc. ● | 6,490 | ||||||
| 188 | QEP Resources, Inc. | 5,234 | ||||||
| 397 | Trican Well Service Ltd. | 5,279 | ||||||
| 32,628 | ||||||||
| Food, Beverage and Tobacco - 3.7% | ||||||||
| 107 | Bunge Ltd. Finance Corp. | 7,551 | ||||||
| 76 | Dr. Pepper Snapple Group | 3,486 | ||||||
| 233 | Ebro Foods S.A. | 4,792 | ||||||
| 24 | Ingredion, Inc. | 1,581 | ||||||
| 17,410 | ||||||||
| Health Care Equipment and Services - 5.1% | ||||||||
| 54 | AmerisourceBergen Corp. | 3,020 | ||||||
| 322 | Boston Scientific Corp. ● | 2,989 | ||||||
| 298 | Brookdale Senior Living, Inc. ● | 7,866 | ||||||
| 206 | Health Management Associates, Inc. Class A ● | 3,235 | ||||||
| 116 | Wellcare Health Plans, Inc. ● | 6,466 | ||||||
| 23,576 | ||||||||
| Insurance - 9.8% | ||||||||
| 32 | Argo Group International Holdings Ltd. | 1,344 | ||||||
| 147 | Hanover Insurance Group, Inc. | 7,168 | ||||||
| 174 | Principal Financial Group, Inc. | 6,498 | ||||||
| 167 | Reinsurance Group of America, Inc. | 11,570 | ||||||
| 398 | Unum Group | 11,686 | ||||||
| 249 | XL Group plc | 7,559 | ||||||
| 45,825 | ||||||||
| Materials - 7.5% | ||||||||
| 128 | Cabot Corp. | 4,801 | ||||||
| 123 | Celanese Corp. | 5,528 | ||||||
| 87 | Louisiana-Pacific Corp. ● | 1,293 | ||||||
| 244 | Methanex Corp. ADR | 10,419 | ||||||
| 100 | Owens-Illinois, Inc. ● | 2,784 | ||||||
| 177 | Packaging Corp. of America | 8,681 | ||||||
| 220 | Rexam plc | 1,595 | ||||||
| 35,101 | ||||||||
| Pharmaceuticals, Biotechnology and Life Sciences - 4.0% | ||||||||
| 760 | Almirall S.A. | 9,658 | ||||||
| 62 | Ono Pharmaceutical Co., Ltd. | 4,193 | ||||||
| 85 | UCB S.A. | 4,539 | ||||||
| 18,390 | ||||||||
| Real Estate - 5.4% | ||||||||
| 176 | American Assets Trust, Inc. REIT | 5,435 | ||||||
| 182 | Blackstone Mortgage Trust, Inc. REIT | 4,493 | ||||||
| 77 | Equity Lifestyle Properties, Inc. REIT | 6,020 | ||||||
| 268 | Forest City Enterprises, Inc. Class A ● | 4,791 | ||||||
| 169 | Hatteras Financial Corp. REIT | 4,171 | ||||||
| 24,910 | ||||||||
| Retailing - 2.8% | ||||||||
| 5,788 | Buck Holdings L.P. ⌂●† | 1,757 | ||||||
| 122 | GNC Holdings, Inc. | 5,402 | ||||||
| 128 | Men's Wearhouse, Inc. | 4,849 | ||||||
| 17 | Ross Stores, Inc. | 1,115 | ||||||
| 13,123 | ||||||||
| Semiconductors and Semiconductor Equipment - 7.6% | ||||||||
| 236 | Avago Technologies Ltd. | 8,829 | ||||||
| 329 | Microsemi Corp. ● | 7,494 | ||||||
| 169 | NXP Semiconductors N.V. ● | 5,248 | ||||||
| 256 | Skyworks Solutions, Inc. ● | 5,602 | ||||||
| 460 | Teradyne, Inc. ● | 8,075 | ||||||
| 35,248 | ||||||||
| Software and Services - 3.7% | ||||||||
| 272 | Booz Allen Hamilton Holding Corp. | 4,722 | ||||||
| 125 | Check Point Software Technologies Ltd. ADR ● | 6,200 | ||||||
| 179 | Verint Systems, Inc. ● | 6,364 | ||||||
| 17,286 | ||||||||
| Technology Hardware and Equipment - 3.3% | ||||||||
| 245 | Arrow Electronics, Inc. ● | 9,767 | ||||||
| 89 | SanDisk Corp. ● | 5,438 | ||||||
| 15,205 | ||||||||
| Transportation - 1.6% | ||||||||
| 393 | Delta Air Lines, Inc. ● | 7,357 | ||||||
| Utilities - 5.1% | ||||||||
| 115 | Alliant Energy Corp. | 5,778 | ||||||
| 156 | Great Plains Energy, Inc. | 3,505 | ||||||
| 191 | UGI Corp. | 7,474 | ||||||
| 158 | Westar Energy, Inc. | 5,046 | ||||||
The accompanying notes are an integral part of these financial statements.
| 5 |
Hartford MidCap Value HLS Fund
Schedule of Investments – (continued)
June 30, 2013 (Unaudited)
(000’s Omitted)
| Shares or Principal Amount | Market Value ╪ | |||||||||||
| COMMON STOCKS - 98.5% - (continued) | ||||||||||||
| Utilities - 5.1% - (continued) | ||||||||||||
| 50 | Wisconsin Energy Corp. | $ | 2,062 | |||||||||
| 23,865 | ||||||||||||
| Total common stocks | ||||||||||||
| (cost $375,052) | $ | 458,372 | ||||||||||
| Total long-term investments | ||||||||||||
| (cost $375,052) | $ | 458,372 | ||||||||||
| SHORT-TERM INVESTMENTS - 1.5% | ||||||||||||
| Repurchase Agreements - 1.5% | ||||||||||||
| Bank of America Merrill Lynch TriParty Repurchase Agreement (maturing on 07/01/2013 in the amount of $26, collateralized by GNMA 3.00%, 2042, value of $26) | ||||||||||||
| $ | 26 | 0.13%, 6/28/2013 | $ | 26 | ||||||||
| Bank of Montreal TriParty Repurchase Agreement (maturing on 07/01/2013 in the amount of $544, collateralized by FHLMC 4.00% - 5.00%, 2023 - 2025, FNMA 2.00% - 5.00%, 2022 - 2042, GNMA 2.00% - 5.00%, 2041 - 2043, value of $553) | ||||||||||||
| 544 | 0.15%, 6/28/2013 | 544 | ||||||||||
| Bank of Montreal TriParty Repurchase Agreement (maturing on 07/01/2013 in the amount of $1,056, collateralized by FHLB 0.38%, 2015, FHLMC 0.38%, 2014, FNMA 0.50% - 5.50%, 2015 - 2042, value of $1,075) | ||||||||||||
| 1,056 | 0.12%, 6/28/2013 | 1,056 | ||||||||||
| Barclays Capital TriParty Repurchase Agreement (maturing on 07/01/2013 in the amount of $732, collateralized by U.S. Treasury Note 3.13%, 2021, value of $744) | ||||||||||||
| 732 | 0.10%, 6/28/2013 | 732 | ||||||||||
| Citigroup Global Markets, Inc. TriParty Repurchase Agreement (maturing on 07/01/2013 in the amount of $2,157, collateralized by U.S. Treasury Bill 0.85%, 2013, U.S. Treasury Note 0.63% - 3.25%, 2013 - 2018, value of $2,190) | ||||||||||||
| 2,157 | 0.10%, 6/28/2013 | 2,157 | ||||||||||
| Deutsche Bank Securities TriParty Repurchase Agreement (maturing on 07/01/2013 in the amount of $26, collateralized by FNMA 4.50%, 2035, value of $26) | ||||||||||||
| 26 | 0.25%, 6/28/2013 | 26 | ||||||||||
| RBS Securities, Inc. TriParty Repurchase Agreement (maturing on 07/01/2013 in the amount of $865, collateralized by U.S. Treasury Note 1.00% - 2.63%, 2014 - 2020, value of $883) | ||||||||||||
| 865 | 0.10%, 6/28/2013 | 865 | ||||||||||
| TD Securities TriParty Repurchase Agreement (maturing on 07/01/2013 in the amount of $1,526, collateralized by FHLMC 3.50% - 4.00%, 2042, FNMA 3.50% - 4.50%, 2041 - 2042, value of $1,552) | ||||||||||||
| 1,526 | 0.12%, 6/28/2013 | 1,526 | ||||||||||
| UBS Securities, Inc. Repurchase Agreement (maturing on 07/01/2013 in the amount of $22, collateralized by U.S. Treasury Note 0.63%, 2014, value of $22) | ||||||||||||
| 22 | 0.09%, 6/28/2013 | 22 | ||||||||||
| 6,954 | ||||||||||||
| Total short-term investments | ||||||||||||
| (cost $6,954) | $ | 6,954 | ||||||||||
| Total investments | ||||||||||||
| (cost $382,006) ▲ | 100.0 | % | $ | 465,326 | ||||||||
| Other assets and liabilities | — | % | (20 | ) | ||||||||
| Total net assets | 100.0 | % | $ | 465,306 | ||||||||
The accompanying notes are an integral part of these financial statements.
| 6 |
| Note: | Percentage of investments as shown is the ratio of the total market value to total net assets. |
Prices of foreign equities that are principally traded on certain foreign markets may be adjusted daily pursuant to a fair value pricing service approved by the Board of Directors in order to reflect an adjustment for factors occurring after the close of certain foreign markets but before the close of the New York Stock Exchange.
| ▲ | At June 30, 2013, the cost of securities for federal income tax purposes was $388,165 and the aggregate gross unrealized appreciation and depreciation based on that cost were: |
| Unrealized Appreciation | $ | 86,771 | ||
| Unrealized Depreciation | (9,610 | ) | ||
| Net Unrealized Appreciation | $ | 77,161 |
| † | These securities were valued in good faith at fair value as determined under policies and procedures established by and under the supervision of the Company's Board of Directors. At June 30, 2013, the aggregate value of these securities was $1,789, which represents 0.4% of total net assets. This amount excludes securities that are principally traded in certain foreign markets and whose prices are adjusted pursuant to a third party pricing service methodology approved by the Board of Directors. |
| ● | Non-income producing. |
| ■ | Securities issued within terms of a private placement memorandum, exempt from registration under Rule 144A under the Securities Act of 1933, as amended, and may be sold only to qualified institutional buyers. Unless otherwise indicated, these holdings are determined to be liquid. At June 30, 2013, the aggregate value of these securities was $32, which rounds to zero percent of total net assets. |
| ⌂ | The following securities are considered illiquid. Illiquid securities are often purchased in private placement transactions, are often not registered under the Securities Act of 1933 and may have contractual restrictions on resale. A security may also be considered illiquid if the security lacks a readily available market or if its valuation has not changed for a certain period of time. |
| Period Acquired | Shares/ Par | Security | Cost Basis | |||||||
| 06/2007 | 5,788 | Buck Holdings L.P. | $ | 396 | ||||||
| 03/2007 | 452 | Solar Cayman Ltd. - 144A | 132 | |||||||
At June 30, 2013, the aggregate value of these securities was $1,789, which represents 0.4% of total net assets.
| Foreign Currency Contracts Outstanding at June 30, 2013 | ||||||||||||||||||||
| Currency | Buy / Sell | Delivery Date | Counterparty | Contract Amount | Market Value ╪ | Unrealized Appreciation/ (Depreciation) | ||||||||||||||
| JPY | Buy | 07/02/2013 | BCLY | $ | 39 | $ | 39 | $ | – | |||||||||||
| JPY | Buy | 07/01/2013 | JPM | 26 | 25 | (1 | ) | |||||||||||||
| $ | (1 | ) | ||||||||||||||||||
| ╪ | See Significant Accounting Policies of accompanying Notes to Financial Statements regarding valuation of securities. |
The accompanying notes are an integral part of these financial statements.
| 7 |
Hartford MidCap Value HLS Fund
Schedule of Investments – (continued)
June 30, 2013 (Unaudited)
(000’s Omitted)
| GLOSSARY: (abbreviations used in preceding Schedule of Investments) | ||
| Counterparty Abbreviations: | ||
| BCLY | Barclays | |
| JPM | JP Morgan Chase & Co. | |
| Currency Abbreviations: | ||
| JPY | Japanese Yen | |
| Other Abbreviations: | ||
| ADR | American Depositary Receipt | |
| FHLB | Federal Home Loan Bank | |
| FHLMC | Federal Home Loan Mortgage Corp. | |
| FNMA | Federal National Mortgage Association | |
| GNMA | Government National Mortgage Association | |
| REIT | Real Estate Investment Trust | |
The accompanying notes are an integral part of these financial statements.
| 8 |
Hartford MidCap Value HLS Fund
Investment Valuation Hierarchy Level Summary
June 30, 2013 (Unaudited)
(000’s Omitted)
| Total | Level 1 ♦ | Level 2 ♦ | Level 3 | |||||||||||||
| Assets: | ||||||||||||||||
| Common Stocks ‡ | $ | 458,372 | $ | 419,638 | $ | 36,945 | $ | 1,789 | ||||||||
| Short-Term Investments | 6,954 | – | 6,954 | – | ||||||||||||
| Total | $ | 465,326 | $ | 419,638 | $ | 43,899 | $ | 1,789 | ||||||||
| Liabilities: | ||||||||||||||||
| Foreign Currency Contracts * | 1 | – | 1 | – | ||||||||||||
| Total | $ | 1 | $ | – | $ | 1 | $ | – | ||||||||
| ♦ | For the six-month period ended June 30, 2013, there were no transfers between Level 1 and Level 2. |
| ‡ | The Fund has all or primarily all of the equity securities categorized in a particular level. Refer to the Schedule of Investments for further industry breakout. |
| * | Derivative instruments not reflected in the Schedule of Investments are valued at the unrealized appreciation/depreciation on the investments. |
Following is a reconciliation of Level 3 assets for which significant unobservable inputs were used to determine fair value:
| Balance as of December 31, 2012 | Realized Gain (Loss) | Change in Unrealized Appreciation (Depreciation) | Net Amortization | Purchases | Sales | Transfers Into Level 3 | Transfers Out of Level 3 | Balance as of June 30, 2013 | ||||||||||||||||||||||||||||
| Assets: | ||||||||||||||||||||||||||||||||||||
| Common Stocks | $ | 4,172 | $ | 2,630 | $ | (1,744 | )* | $ | — | $ | — | $ | (3,269 | ) | $ | — | $ | — | $ | 1,789 | ||||||||||||||||
| Total | $ | 4,172 | $ | 2,630 | $ | (1,744 | ) | $ | — | $ | — | $ | (3,269 | ) | $ | — | $ | — | $ | 1,789 | ||||||||||||||||
| * | Change in unrealized appreciation (depreciation) in the current period relating to assets still held at June 30, 2013 was $(1,744). |
The accompanying notes are an integral part of these financial statements.
| 9 |
Hartford MidCap Value HLS Fund
Statement of Assets and Liabilities
June 30, 2013 (Unaudited)
(000’s Omitted)
| Assets: | ||||
| Investments in securities, at market value (cost $382,006) | $ | 465,326 | ||
| Cash | 43 | |||
| Receivables: | ||||
| Investment securities sold | 147 | |||
| Fund shares sold | 97 | |||
| Dividends and interest | 737 | |||
| Total assets | 466,350 | |||
| Liabilities: | ||||
| Unrealized depreciation on foreign currency contracts | 1 | |||
| Bank overdraft - foreign cash | — | |||
| Payables: | ||||
| Investment securities purchased | 452 | |||
| Fund shares redeemed | 480 | |||
| Investment management fees | 60 | |||
| Distribution fees | 5 | |||
| Accrued expenses | 46 | |||
| Total liabilities | 1,044 | |||
| Net assets | $ | 465,306 | ||
| Summary of Net Assets: | ||||
| Capital stock and paid-in-capital | $ | 351,451 | ||
| Undistributed net investment income | 5,449 | |||
| Accumulated net realized gain | 25,086 | |||
| Unrealized appreciation of investments and the translations of assets and liabilities denominated in foreign currency | 83,320 | |||
| Net assets | $ | 465,306 | ||
| Shares authorized | 1,200,000 | |||
| Par value | $ | 0.001 | ||
| Class IA: Net asset value per share | $ | 13.36 | ||
| Shares outstanding | 26,126 | |||
| Net assets | $ | 348,919 | ||
| Class IB: Net asset value per share | $ | 13.26 | ||
| Shares outstanding | 8,775 | |||
| Net assets | $ | 116,387 | ||
The accompanying notes are an integral part of these financial statements.
| 10 |
Hartford MidCap Value HLS Fund
Statement of Operations
For the Six-Month Period Ended June 30, 2013 (Unaudited)
(000’s Omitted)
| Investment Income: | ||||
| Dividends | $ | 3,376 | ||
| Interest | 4 | |||
| Less: Foreign tax withheld | (84 | ) | ||
| Total investment income, net | 3,296 | |||
| Expenses: | ||||
| Investment management fees | 1,857 | |||
| Transfer agent fees | 1 | |||
| Distribution fees - Class IB | 147 | |||
| Custodian fees | 7 | |||
| Accounting services fees | 23 | |||
| Board of Directors' fees | 6 | |||
| Audit fees | 7 | |||
| Other expenses | 58 | |||
| Total expenses (before fees paid indirectly) | 2,106 | |||
| Commission recapture | (21 | ) | ||
| Total fees paid indirectly | (21 | ) | ||
| Total expenses, net | 2,085 | |||
| Net Investment Income | 1,211 | |||
| Net Realized Gain on Investments and Foreign Currency Transactions: | ||||
| Net realized gain on investments | 52,584 | |||
| Net realized gain on foreign currency contracts | 79 | |||
| Net realized loss on other foreign currency transactions | (75 | ) | ||
| Net Realized Gain on Investments and Foreign Currency Transactions | 52,588 | |||
| Net Changes in Unrealized Appreciation of Investments and Foreign Currency Transactions: | ||||
| Net unrealized appreciation of investments | 9,015 | |||
| Net unrealized depreciation of foreign currency contracts | (1 | ) | ||
| Net unrealized appreciation on translation of other assets and liabilities in foreign currencies | 1 | |||
| Net Changes in Unrealized Appreciation of Investments and Foreign Currency Transactions | 9,015 | |||
| Net Gain on Investments and Foreign Currency Transactions | 61,603 | |||
| Net Increase in Net Assets Resulting from Operations | $ | 62,814 |
The accompanying notes are an integral part of these financial statements.
| 11 |
Hartford MidCap Value HLS Fund
Statement of Changes in Net Assets
(000’s Omitted)
| For the Six-Month Period Ended June 30, 2013 (Unaudited) | For the Year Ended December 31, 2012 | |||||||
| Operations: | ||||||||
| Net investment income | $ | 1,211 | $ | 4,416 | ||||
| Net realized gain on investments and foreign currency transactions | 52,588 | 41,884 | ||||||
| Net unrealized appreciation of investments and foreign currency transactions | 9,015 | 57,149 | ||||||
| Net Increase in Net Assets Resulting from Operations | 62,814 | 103,449 | ||||||
| Distributions to Shareholders: | ||||||||
| From net investment income | ||||||||
| Class IA | — | (3,876 | ) | |||||
| Class IB | — | (1,020 | ) | |||||
| Total distributions | — | (4,896 | ) | |||||
| Capital Share Transactions: | ||||||||
| Class IA | ||||||||
| Sold | 20,663 | 20,918 | ||||||
| Issued on reinvestment of distributions | — | 3,876 | ||||||
| Redeemed | (42,600 | ) | (116,036 | ) | ||||
| Total capital share transactions | (21,937 | ) | (91,242 | ) | ||||
| Class IB | ||||||||
| Sold | 7,492 | 7,023 | ||||||
| Issued on reinvestment of distributions | — | 1,020 | ||||||
| Redeemed | (19,993 | ) | (36,570 | ) | ||||
| Total capital share transactions | (12,501 | ) | (28,527 | ) | ||||
| Net decrease from capital share transactions | (34,438 | ) | (119,769 | ) | ||||
| Net Increase (Decrease) in Net Assets | 28,376 | (21,216 | ) | |||||
| Net Assets: | ||||||||
| Beginning of period | 436,930 | 458,146 | ||||||
| End of period | $ | 465,306 | $ | 436,930 | ||||
| Undistributed (distribution in excess of) net investment income | $ | 5,449 | $ | 4,238 | ||||
| Shares: | ||||||||
| Class IA | ||||||||
| Sold | 1,639 | 1,942 | ||||||
| Issued on reinvestment of distributions | — | 357 | ||||||
| Redeemed | (3,310 | ) | (10,694 | ) | ||||
| Total share activity | (1,671 | ) | (8,395 | ) | ||||
| Class IB | ||||||||
| Sold | 592 | 652 | ||||||
| Issued on reinvestment of distributions | — | 94 | ||||||
| Redeemed | (1,568 | ) | (3,421 | ) | ||||
| Total share activity | (976 | ) | (2,675 | ) | ||||
The accompanying notes are an integral part of these financial statements.
| 12 |
Hartford MidCap Value HLS Fund
Notes to Financial Statements
June 30, 2013 (Unaudited)
(000’s Omitted)
| 1. | Organization: |
Hartford MidCap Value HLS Fund (the “Fund”) serves as an underlying investment option for certain variable annuity and variable life insurance separate accounts of Hartford Life Insurance Company (“HLIC”) and its affiliates and certain qualified retirement plans. The Fund may also serve as an underlying investment option for certain variable annuity and variable life separate accounts of other insurance companies. Owners of variable annuity contracts and policyholders of variable life insurance contracts may choose the funds permitted in the variable insurance contract prospectus. In addition, participants in certain qualified retirement plans may choose the Fund if permitted by their plans.
Hartford Series Fund, Inc. (the “Company”) is an open-end registered management investment company comprised of thirty portfolios. Financial statements for the Fund, a series of the Company, are included in this report.
The Company is organized under the laws of the State of Maryland and is registered with the Securities and Exchange Commission (“SEC”) under the Investment Company Act of 1940, as amended (“1940 Act”). The Fund is a diversified open-end management investment company.
The Fund is divided into Class IA and Class IB shares. Each class is offered at the per share net asset value (“NAV”) without a sales charge and is subject to the same expenses, except that the Class IB shares are subject to distribution and service fees charged pursuant to a Distribution Plan adopted in accordance with Rule 12b-1 under the 1940 Act.
| 2. | Significant Accounting Policies: |
The following is a summary of significant accounting policies of the Fund in the preparation of its financial statements, which are in accordance with the United States Generally Accepted Accounting Principles (“U.S. GAAP”). The preparation of financial statements in accordance with U.S. GAAP may require management to make estimates and assumptions that affect the reported amounts of assets and liabilities and disclosure of contingent assets and liabilities at the date of the financial statements and the reported amounts of increases and decreases in net assets from operations during the reporting period. Actual results could differ from those estimates.
| a) | Determination of Net Asset Value – The NAV of each class of the Fund’s shares is determined as of the close of regular trading (normally 4:00 p.m. Eastern Time) (the “NYSE Close”) on each day that the New York Stock Exchange (the “Exchange”) is open (“Valuation Date”). Information that becomes known to the Fund after the NAV has been calculated on a particular day will not generally be used to retroactively adjust the NAV determined earlier that day. |
| b) | Investment Valuation and Fair Value Measurements – For purposes of calculating the NAV, portfolio investments and other assets held by the Fund's portfolio for which market quotes are readily available are valued at market value. Market value is generally determined on the basis of last reported sales prices or official close price. If no sales are reported, market value is based on quotes obtained from a quotation reporting system, established market makers, or independent pricing services. If market prices are not readily available or are deemed unreliable, the Fund will use the fair value of the investment as determined in good faith under policies and procedures established by and under the supervision of the Company’s Board of Directors. Market quotes are considered not readily available where there is an absence of current or reliable market-based data (e.g., trade information or indicative market quotes), including where events occur after the close of the relevant market, but prior to the NYSE Close that materially affect the values of the Fund’s portfolio investments or assets. In addition, market quotes are considered not readily available when, due to extraordinary circumstances, the exchanges or markets on which the investments trade do not open for trading for the entire day and no other market prices are available. In addition, prices of foreign equities that are principally traded on certain foreign markets may be adjusted daily pursuant to a fair value pricing service approved by the Board of Directors in order to reflect an adjustment for the factors occurring after the close of certain foreign markets but before the NYSE Close. Investments that are primarily traded on foreign markets may trade on days that are not business days of the Fund. The value of the foreign investments in which the Fund invests may change on days when a shareholder will not be able to |
| 13 |
Hartford MidCap Value HLS Fund
Notes to Financial Statements – (continued)
June 30, 2013 (Unaudited)
(000’s Omitted)
purchase or redeem shares of the Fund. Fair value pricing is subjective in nature and the use of fair value pricing by the Fund may cause the NAV of its shares to differ significantly from the NAV that would have been calculated using market prices at the close of the exchange on which a portfolio investment is primarily traded. There can be no assurance that the Fund could obtain the fair market value assigned to an investment if the Fund were to sell the investment at approximately the time at which the Fund determines its NAV.
Investments valued in currencies other than U.S. dollars are converted to U.S. dollars using exchange rates obtained from independent pricing services for calculation of the NAV. As a result, the NAV of the Fund’s shares may be affected by changes in the value of currencies in relation to the U.S. dollar. The value of investments traded in markets outside the United States or denominated in currencies other than the U.S. dollar may be affected significantly on a day that the NYSE is closed and the market value may change on days when an investor is not able to purchase, redeem or exchange shares of the Fund.
Foreign currency contracts represent agreements to exchange currencies on specific future dates at predetermined rates. Foreign currency contracts are valued using foreign currency exchange rates and forward rates as provided by an independent pricing service on the Valuation Date.
Financial instruments for which prices are not available from an independent pricing service may be valued using market quotations obtained from one or more dealers that make markets in the respective financial instrument in accordance with procedures established by the Company’s Board of Directors.
U.S. GAAP defines fair value as the price that the Fund would receive to sell an asset or pay to transfer a liability in an orderly transaction between market participants. The U.S. GAAP fair value measurement standards require disclosure of a fair value hierarchy for each major category of assets and liabilities. Various inputs are used in determining the fair value of the Fund’s investments. These inputs are summarized into three broad hierarchy levels. This hierarchy is based on whether the valuation inputs are observable or unobservable. These levels are:
| · | Level 1 – Quoted prices in active markets for identical investments. Level 1 may include exchange traded instruments, such as domestic equities, some foreign equities, options, futures, mutual funds, exchange traded funds, rights and warrants. |
| · | Level 2 – Observable inputs other than Level 1 prices, such as quoted prices for similar investments; quoted prices in markets that are not active; or other inputs that are observable or can be corroborated by observable market data. Level 2 may include debt investments that are traded less frequently than exchange traded instruments and which are valued using independent pricing services; foreign equities, which are principally traded on certain foreign markets and are adjusted daily pursuant to a fair value pricing service in order to reflect an adjustment for the factors occurring after the close of certain foreign markets but before the NYSE Close; and short-term investments, which are valued at amortized cost. |
| · | Level 3 – Significant unobservable inputs that are supported by limited or no market activity. Level 3 may include financial instruments whose values are determined using indicative market quotes or require significant management judgment or estimation. These unobservable valuation inputs may include estimates for current yields, maturity/duration, prepayment speed, and indicative market quotes for comparable investments along with other assumptions relating to credit quality, collateral value, complexity of the investment structure, general market conditions and liquidity. This category may include investments where trading has been halted or there are certain restrictions on trading. While these investments are priced using unobservable inputs, the valuation of these investments reflects the best available data and management believes the prices are a reasonable representation of exit price. |
The Board of Directors of the Company generally reviews and approves the “Procedures for Valuation of Portfolio Securities” on an annual basis. These procedures define how investments are to be valued, including the formation and activities of a Valuation Committee. The Valuation Committee is responsible for determining in good faith the fair value of investments when the value cannot be obtained from primary pricing services or
| 14 |
alternative sources or if the valuation of an investment as provided by the primary pricing service or alternative source is believed not to reflect the investment’s fair value as of the Valuation Date. Members of the Valuation Committee include the Fund’s Treasurer or designee, a Vice President of the Fund with legal expertise or designee, and a Vice President of the investment manager or designee. In addition, the Fund’s Chief Compliance Officer shall designate a member of the compliance group to attend Valuation Committee meetings as a non-voting resource, to monitor for and provide guidance with respect to compliance with these procedures. Two members of the Valuation Committee or their designees, representing different departments, shall constitute a quorum for purposes of permitting the Valuation Committee to take action. The Valuation Committee will consider all relevant factors in determining an investment’s fair value, and may seek the advice of the Fund’s sub-adviser, knowledgeable brokers, and legal counsel in making such determination. The Valuation Committee reports to the Audit Committee of the Company’s Board of Directors. The Audit Committee receives quarterly written reports which include details of all fair-valued investments, including the reason for the fair valuation, and an indication, when possible, of the accuracy of the valuation by disclosing the next available reliable public price quotation or the disposition price of such investments (the “look-back” test). The Board of Directors then must consider for ratification all of the fair value determinations made during the previous quarter.
Valuation levels are not necessarily indicative of the risk associated with investing in such investments. Individual investments within any of the above mentioned asset classes may be assigned a different hierarchical level than those presented above, as individual circumstances dictate.
For additional information, refer to the Investment Valuation Hierarchy Level Summary and the Level 3 roll-forward reconciliation, if applicable, which follow the Schedule of Investments.
For purposes of reporting transfers between different hierarchy levels, both transfers in and out of each level, as applicable, are shown as if they occurred at the beginning of the period.
| c) | Investment Transactions and Investment Income – Investment transactions are recorded as of the trade date (the date the order to buy or sell is executed) for financial reporting purposes. Investments purchased or sold on a when-issued or delayed-delivery basis may be settled a month or more after the trade date. Realized gains and losses are determined on the basis of identified cost. |
Dividend income from domestic securities is accrued on the ex-dividend date. In general, dividend income from foreign securities is recorded on the ex-date; however, dividend notifications in certain foreign jurisdictions may not be available in a timely manner and as a result, the Fund will record the dividend as soon as the relevant details (i.e., rate per share, payment date, shareholders of record, etc.) are publicly available. Interest income, including amortization of premium and accretion of discounts, is accrued on a daily basis.
| d) | Foreign Currency Transactions – Assets and liabilities denominated in currencies other than U.S. dollars are translated into U.S. dollars at the exchange rates in effect on the valuation date. Purchases and sales of investments, income, and expenses are translated into U.S. dollars at the exchange rates on the dates of such transactions. |
The Fund does not isolate that portion of portfolio investment valuation resulting from fluctuations in the foreign currency exchange rates from the fluctuations arising from changes in the market prices of investments held. Exchange rate fluctuations are included with the net realized and unrealized gain or loss on investments in the accompanying financial statements.
Net realized foreign exchange gains or losses arise from sales of foreign currencies and the difference between asset and liability amounts initially stated in foreign currencies and the U.S. dollar value of the amounts actually received or paid. Net unrealized foreign exchange gains or losses arise from changes in the value of other assets and liabilities at the end of the reporting period, resulting from changes in the exchange rates.
| 15 |
Hartford MidCap Value HLS Fund
Notes to Financial Statements – (continued)
June 30, 2013 (Unaudited)
(000’s Omitted)
| e) | Joint Trading Account – The Fund may invest cash balances into a joint trading account that may be invested in one or more repurchase agreements. |
| f) | Fund Share Valuation and Dividend Distributions to Shareholders – Orders for the Fund’s shares are executed in accordance with the investment instructions of the contract holders and plan participants. The NAV of the Fund’s shares is determined as of the close of business on each business day of the Exchange. The NAV is determined separately for each class of shares of the Fund by dividing the Fund’s net assets attributable to that class by the number of shares of the class outstanding. Each class of shares offered by the Fund has equal rights as to assets and voting privileges (except that shareholders of a class have exclusive voting rights regarding any matter relating solely to that class of shares). Income and non-class specific expenses are allocated daily to each class on the basis of the relative net assets of the class. Realized and unrealized capital gains and losses are allocated daily based on the relative net assets of each class of shares of the Fund. |
Orders for the purchase of the Fund’s shares received prior to the close of the Exchange on any day the Exchange is open for business are priced at the NAV determined as of the close of the Exchange. Orders received after the close of the Exchange, or on a day on which the Exchange and/or the Fund is not open for business, are priced at the next determined NAV.
Dividends are declared pursuant to a policy adopted by the Company’s Board of Directors based upon the investment performance of the Fund. The policy of the Fund is to pay dividends from net investment income and realized capital gains, if any, at least once a year.
Distributions from net investment income, net realized capital gains and capital are determined in accordance with federal income tax regulations, which may differ from U.S. GAAP with respect to character and timing. These differences may include but are not limited to losses deferred due to wash sale adjustments, foreign currency gains and losses, adjustments related to Passive Foreign Investment Companies (“PFICs”), Real Estate Investment Trusts (“REITs”), Regulated Investment Companies (“RICs”), certain derivatives and partnerships. Permanent book and federal income tax basis differences relating to shareholder distributions will result in reclassifications to certain of the Fund’s capital accounts (see Federal Income Taxes: Reclassification of Capital Accounts note).
| 3. | Securities and Other Investments: |
| a) | Repurchase Agreements – A repurchase agreement is an agreement by which a counterparty agrees to sell an investment and agrees to repurchase the investment sold from the buyer at a mutually agreed upon time and price. During the period of the repurchase agreement, the counterparty will deposit cash and or securities in a third party custodial account to serve as collateral. At the time the Fund enters into a repurchase agreement, the value of the underlying collateral, including accrued interest, will be equal to or exceed the value of the repurchase agreement. Repurchase agreements expose the Fund to counterparty risk - that is, the risk that the counterparty will not fulfill its obligations. To minimize counterparty risk, the investments that serve to collateralize the repurchase agreement are held by the Fund’s custodian in book entry or physical form in the custodial account of the Fund or in a third party custodial account. Repurchase agreements are valued at cost plus accrued interest, which approximates fair value. Repurchase agreements have master netting agreements which allow the Fund to offset amounts owed to a counterparty with amounts owed by the counterparty, including any collateral. The Fund, as shown on the Schedule of Investments, had outstanding repurchase agreements as of June 30, 2013. |
| b) | Illiquid and Restricted Investments – The Fund is permitted to invest up to 15% of its net assets in illiquid investments. Illiquid investments are those that may not be sold or disposed of in the ordinary course of business within seven days, at approximately the price used to determine the Fund’s NAV. The Fund may not be able to sell illiquid investments when its sub-adviser considers it desirable to do so or may have to sell such investments at a price that is lower than the price that could be obtained if the investments were more liquid. A sale of illiquid investments may require more time and |
| 16 |
may result in higher dealer discounts and other selling expenses than does the sale of those that are liquid. Illiquid investments also may be more difficult to value due to the unavailability of reliable market quotations for such investments, and an investment in them may have an adverse impact on the Fund’s NAV. The Fund may also purchase certain restricted investments that can only be resold to certain qualified investors and may be determined to be liquid pursuant to policies and guidelines established by the Company’s Board of Directors. The Fund, as shown on the Schedule of Investments, had illiquid and/or restricted investments as of June 30, 2013.
| c) | Investments Purchased on a When-Issued or Delayed-Delivery Basis – Delivery and payment for investments that have been purchased by the Fund on a forward commitment, or when-issued or delayed-delivery basis, take place beyond the customary settlement period. A fund may dispose of or renegotiate a delayed-delivery transaction after it is entered into, and may sell delayed-delivery investments before they are delivered, which may result in a realized gain or loss. During this period, such investments are subject to market fluctuations, and the Fund identifies investments segregated in its records with a value at least equal to the amount of the commitment. As of June 30, 2013, the Fund had no outstanding when-issued or delayed-delivery investments. |
| 4. | Financial Derivative Instruments: |
The following disclosures contain information on how and why the Fund uses derivative instruments, the credit-risk-related contingent features in certain derivative instruments, and how derivative instruments affect the Fund’s financial position and results of operations. The location and fair value amounts of these instruments on the Statement of Assets and Liabilities and the realized gains and losses and changes in unrealized gains and losses on the Statement of Operations, each categorized by type of derivative contract, are included in the following Additional Derivative Instrument Information footnote. The derivative instruments outstanding as of period-end are disclosed in the notes to or within the Schedule of Investments for purchased options, if applicable. The amounts of realized gains and losses and changes in unrealized gains and losses on derivative instruments during the period are disclosed in the Statement of Operations.
| a) | Foreign Currency Contracts – The Fund may enter into foreign currency contracts that obligate the Fund to purchase or sell currencies at specified future dates. Foreign currency contracts are used to hedge the currency exposure associated with some or all of the Fund’s investments and/or as part of an investment strategy. Foreign currency contracts are marked to market daily and the change in value is recorded by the Fund as an unrealized gain or loss. The Fund will record a realized gain or loss when the foreign currency contract is settled. |
Foreign currency contracts involve elements of market risk in excess of the amounts reflected in the Statement of Assets and Liabilities. In addition, risks may arise upon entering into these contracts from the potential inability of the counterparties to meet the terms of the contracts and from unanticipated movements in the value of the foreign currencies relative to the U.S. dollar. The Fund had outstanding foreign currency contracts as shown on the Schedule of Investments as of June 30, 2013.
| 17 |
Hartford MidCap Value HLS Fund
Notes to Financial Statements – (continued)
June 30, 2013 (Unaudited)
(000’s Omitted)
| b) | Additional Derivative Instrument Information: |
Fair Value of Derivative Instruments on the Statement of Assets and Liabilities as of June 30, 2013:
| Risk Exposure Category | ||||||||||||||||||||||||||||
| Interest Rate Contracts | Foreign Exchange Contracts | Credit Contracts | Equity Contracts | Commodity Contracts | Other Contracts | Total | ||||||||||||||||||||||
| Liabilities: | ||||||||||||||||||||||||||||
| Unrealized depreciation on foreign currency contracts | $ | — | $ | 1 | $ | — | $ | — | $ | — | $ | — | $ | 1 | ||||||||||||||
| Total | $ | — | $ | 1 | $ | — | $ | — | $ | — | $ | — | $ | 1 | ||||||||||||||
The volume of derivatives that is presented in the Schedule of Investments is consistent with the derivative activity during the six-month period ended June 30, 2013.
The Effect of Derivative Instruments on the Statement of Operations for the six-month period ended June 30, 2013:
| Risk Exposure Category | ||||||||||||||||||||||||||||
| Interest Rate Contracts | Foreign Exchange Contracts | Credit Contracts | Equity Contracts | Commodity Contracts | Other Contracts | Total | ||||||||||||||||||||||
| Realized Gain on Derivatives Recognized as a Result of Operations: | ||||||||||||||||||||||||||||
| Net realized gain on foreign currency contracts | $ | — | $ | 79 | $ | — | $ | — | $ | — | $ | — | $ | 79 | ||||||||||||||
| Total | $ | — | $ | 79 | $ | — | $ | — | $ | — | $ | — | $ | 79 | ||||||||||||||
| Net Change in Unrealized Appreciation (Depreciation) on Derivatives Recognized as a Result of Operations: | ||||||||||||||||||||||||||||
| Net change in unrealized depreciation of foreign currency contracts | $ | — | $ | (1 | ) | $ | — | $ | — | $ | — | $ | — | $ | (1 | ) | ||||||||||||
| Total | $ | — | $ | (1 | ) | $ | — | $ | — | $ | — | $ | — | $ | (1 | ) | ||||||||||||
| c) | Balance Sheet Offsetting Information: |
Set forth below are tables which disclose both gross information and net information about instruments and transactions eligible for offset in the financial statements, and instruments and transactions that are subject to a master netting agreement, as well as amounts related to margin, reflected as financial collateral (including cash collateral), held at clearing brokers, counterparties, and the Fund’s custodian. The master netting agreements allow the clearing brokers to net any collateral held in or on behalf of the Fund, or liabilities or payment obligations of the clearing brokers to the Fund, against any liabilities or payment obligations of the Fund to the clearing brokers. The Fund is required to deposit financial collateral (including cash collateral) at the Fund’s custodian on behalf of clearing brokers and counterparties to continually meet the original and maintenance requirements established by the clearing brokers and counterparties. Such requirements are specific to the respective clearing broker or counterparty.
| 18 |
Offsetting of Financial Assets and Derivative Assets as of June 30, 2013:
| Description | Gross Amounts of Recognized Assets | Gross Amounts Offset in Statement of Assets and Liabilities | Net Amounts of Assets Presented in Statement of Assets and Liabilities | Financial Instruments with Allowable Netting | Collateral Received | Net Amount (not less than 0) | ||||||||||||||||||
| Repurchase Agreements | $ | 6,954 | $ | — | $ | 6,954 | $ | — | $ | (7,071 | ) | $ | — | |||||||||||
| Total subject to a master netting or similar arrangement | $ | 6,954 | $ | — | $ | 6,954 | $ | — | $ | (7,071 | ) | $ | — | |||||||||||
Offsetting of Financial Liabilities and Derivative Liabilities as of June 30, 2013:
| Description | Gross Amounts of Recognized Liabilities | Gross Amounts Offset in Statement of Assets and Liabilities | Net Amounts of Assets Presented in Statement of Assets and Liabilities | Financial Instruments with Allowable Netting | Collateral Pledged | Net Amount (not less than 0) | ||||||||||||||||||
| Unrealized depreciation on foreign currency contracts | $ | 1 | $ | — | $ | 1 | $ | — | $ | — | $ | 1 | ||||||||||||
| Total subject to a master netting or similar arrangement | $ | 1 | $ | — | $ | 1 | $ | — | $ | — | $ | 1 | ||||||||||||
| 5. | Principal Risks: |
| a) | Counterparty Risk – The Fund may be exposed to counterparty risk, or the risk that an institution or other entity with which the Fund has unsettled or open transactions will default. |
| b) | Market Risks – If the Fund invests directly in foreign currencies or in securities that trade in, and receive revenues in, foreign currencies, or in derivatives that provide exposure to foreign currencies, it will be subject to the risk that those currencies will decline in value relative to the base currency of the Fund, or, in the case of hedging positions, that the Fund’s base currency will decline in value relative to the currency being hedged. Currency rates in foreign countries may fluctuate significantly over short periods of time for a number of reasons, including changes in interest rates, intervention (or the failure to intervene) by U.S. or foreign governments, central banks or supranational entities, such as the International Monetary Fund, or by the imposition of currency controls or other political developments in the United States or abroad. As a result, the Fund’s investments in foreign currency denominated securities may reduce the returns of the Fund. The market values of equity securities, such as common stocks and preferred stocks, or equity related investments, such as futures and options, may decline due to general market conditions which are not specifically related to a particular company, such as real or perceived adverse economic conditions, changes in the general outlook for corporate earnings, changes in interest or currency rates or adverse investor sentiment generally. The market value of equity securities may also decline due to factors which affect a particular industry or industries, such as labor shortages or increased production costs and competitive conditions within an industry. Equity securities and equity related investments generally have greater market price volatility than fixed income securities. |
| 6. | Federal Income Taxes: |
| a) | Federal Income Taxes – For federal income tax purposes, the Fund intends to continue to qualify as a RIC under Subchapter M of the Internal Revenue Code (“IRC”) by distributing substantially all of its taxable net investment income and net realized capital gains to its shareholders and otherwise complying with the requirements of the IRC. The Fund has distributed substantially all of its income and capital gains in prior years, if applicable, and intends to distribute substantially all of its income and capital gains prior to the next fiscal year-end. Accordingly, no provision for federal income or excise taxes has been made in the accompanying financial statements. Distributions from short-term capital gains are treated as ordinary income distributions for federal income tax purposes. |
| 19 |
Hartford MidCap Value HLS Fund
Notes to Financial Statements – (continued)
June 30, 2013 (Unaudited)
(000’s Omitted)
| b) | Net Investment Income (Loss), Net Realized Gains (Losses), and Distributions – Net investment income (loss) and net realized gains (losses) may differ for financial statement and tax purposes primarily because of losses deferred due to wash sale adjustments, foreign currency gains and losses, adjustments related to PFICs, REITs, RICs, certain derivatives and partnerships. The character of distributions made during the year from net investment income or net realized gains may differ from their ultimate characterization for federal income tax purposes. Also, due to the timing of dividend distributions, the fiscal year in which amounts are distributed may differ from the year that the income or realized gains (losses) were recorded by the Fund. |
| c) | Distributions and Components of Distributable Earnings – The tax character of distributions paid by the Fund for the periods indicated is as follows (as adjusted for dividends payable, if applicable): |
| For the Year Ended December 31, 2012 | For the Year Ended December 31, 2011 | |||||||
| Ordinary Income | $ | 4,896 | $ | 54 | ||||
As of December 31, 2012, the Fund’s components of distributable earnings (deficit) on a tax basis were as follows:
| Amount | ||||
| Undistributed Ordinary Income | $ | 6,257 | ||
| Accumulated Capital and Other Losses* | (23,362 | ) | ||
| Unrealized Appreciation† | 68,146 | |||
| Total Accumulated Earnings | $ | 51,041 | ||
| * | The Fund has capital loss carryforwards that are identified in the Capital Loss Carryforward note that follows. |
| † | Differences between book-basis and tax-basis unrealized appreciation (depreciation) may be attributable to the losses deferred due to wash sale adjustments, foreign currency gains and losses, adjustments related to PFICs, REITs, RICs, certain derivatives and partnerships. |
| d) | Reclassification of Capital Accounts – The Fund may record reclassifications in its capital accounts. These reclassifications have no impact on the total net assets of the Fund. The reclassifications are a result of permanent differences between U.S. GAAP and tax accounting for such items as foreign currency, PFICs, expiration or utilization of capital loss carryforwards or net operating losses. Adjustments are made to reflect the impact these items have on current and future distributions to shareholders. Therefore, the source of the Fund’s distributions may be shown in the accompanying Statement of Changes in Net Assets as from undistributed net investment income, from accumulated net realized gains on investments or from capital depending on the type of book and tax differences that exist. For the year ended December 31, 2012, the Fund recorded reclassifications to increase (decrease) the accounts listed below: |
| Amount | ||||
| Undistributed Net Investment Income | $ | 1,304 | ||
| Accumulated Net Realized Gain (Loss) | (1,304 | ) | ||
| e) | Capital Loss Carryforward – On December 22, 2010, the Regulated Investment Company Modernization Act of 2010 (the “Act”) was enacted, which made changes to the capital loss carryforward rules. The changes are effective for taxable years beginning after the date of enactment. Under the Act, funds are permitted to carry forward capital losses for an unlimited period. However, any losses incurred during those future taxable years will be required to be utilized prior to the losses incurred in pre-enactment taxable years, which carry an expiration date. As a result of this ordering rule, pre-enactment capital loss carryforwards may be more likely to expire unused. Additionally, post-enactment capital loss carryforwards retain their character as either short-term or long-term capital losses rather than being considered all short-term as permitted under prior regulation. |
| 20 |
At December 31, 2012 (tax-year-end), the Fund had capital loss carryforwards for U.S. federal income tax purposes as follows:
| Year of Expiration | Amount | |||
| 2016 | $ | 4,700 | ||
| 2017 | 18,662 | |||
| Total | $ | 23,362 | ||
As a result of current or past mergers in the Fund, certain provisions in the Internal Revenue Code may limit the future utilization of capital losses. During the year ended December 31, 2012, the Fund utilized $37,899 of prior year capital loss carryforwards.
| f) | Accounting for Uncertainty in Income Taxes – The Fund has adopted financial reporting rules that require the Fund to analyze all open tax years, as defined by the statute of limitations, for all major jurisdictions. Generally, tax authorities can examine all tax returns filed for the last three years. The Fund does not have an examination in progress. |
The Fund has reviewed all open tax years and major jurisdictions and concluded that these financial reporting rules had no effect on the Fund’s financial position or results of operations. There is no tax liability resulting from unrecognized tax benefits relating to uncertain income tax positions taken or expected to be taken on the tax return for the fiscal year ended December 31, 2012. The Fund is also not aware of any tax positions for which it is reasonably possible that the total amounts of unrecognized tax benefits will significantly change in the next twelve months.
| 7. | Expenses: |
| a) | Investment Management Agreement – Hartford Funds Management Company, LLC (“HFMC”), an indirect wholly owned subsidiary of The Hartford Financial Services Group, Inc. (“The Hartford”), serves as investment manager to the Fund pursuant to an Investment Management Agreement with the Company. The investment manager has overall investment supervisory responsibility for the Fund. In addition, the investment manager provides administrative personnel, services, equipment, facilities and office space for proper operation of the Fund. The investment manager has contracted with Wellington Management Company, LLP (“Wellington Management”) under a sub-advisory agreement for the provision of day-to-day investment management services to the Fund in accordance with the Fund’s investment objective and policies. The Fund pays a fee to the investment manager, a portion of which may be used to compensate Wellington Management. |
The schedule below reflects the rates of compensation paid to HFMC for investment management services rendered as of June 30, 2013; the rates are accrued daily and paid monthly.
| Average Daily Net Assets | Annual Fee | |||
| On first $500 million | 0.8000 | % | ||
| On next $500 million | 0.7250 | % | ||
| On next $1.5 billion | 0.6750 | % | ||
| On next $2.5 billion | 0.6700 | % | ||
| On next $5 billion | 0.6650 | % | ||
| Over $10 billion | 0.6600 | % | ||
| 21 |
Hartford MidCap Value HLS Fund
Notes to Financial Statements – (continued)
June 30, 2013 (Unaudited)
(000’s Omitted)
| b) | Accounting Services Agreement – Pursuant to the Fund Accounting Agreement between HFMC and the Company, on behalf of the Fund, HFMC provides accounting services to the Fund and receives monthly compensation based on the Fund’s average daily net assets at the rates set forth below. The Fund’s accounting services fees are accrued daily and paid monthly. |
| Average Daily Net Assets | Annual Fee | |||
| All Assets | 0.010 | % | ||
| c) | Operating Expenses – Allocable expenses incurred by the Company are allocated to each Fund and allocated to classes within a Fund in proportion to the average daily net assets of the Fund and each class, except where allocation of certain expenses is more fairly made directly to the Fund or to specific classes within a Fund. |
| d) | Fees Paid Indirectly – The Company, on behalf of the Fund, has entered into agreements with State Street Global Markets, LLC and Russell Implementation Services, Inc. to partially recapture non-discounted trade commissions. Such rebates are used to pay a portion of the Fund’s expenses. In addition, the Fund’s custodian banks have agreed to reduce its fees when the Fund maintains cash on deposit in a non-interest-bearing custody account. For the six-month period ended June 30, 2013, these amounts, if any, are included in the Statement of Operations. |
The ratio of expenses to average net assets in the accompanying financial highlights excludes the reduction in expenses related to fees paid indirectly. The annualized expense ratio for the period listed below reflecting the reduction for fees paid indirectly is as follows:
| Annualized Six- Month Period Ended June 30, 2013 | ||||
| Class IA | 0.84 | % | ||
| Class IB | 1.09 | |||
| e) | Distribution Plan for Class IB shares – The Company, on behalf of the Fund, has adopted a Distribution Plan pursuant to Rule 12b-1 of the 1940 Act to compensate the distributor, Hartford Funds Distributors, LLC (“HFD”), (formerly known as Hartford Investment Financial Services, LLC), an indirect wholly owned subsidiary of The Hartford, from assets attributable to the Class IB shares for services rendered and expenses borne in connection with activities primarily intended to result in the sale of the Class IB shares, subject to the review and approval of the Company’s Board of Directors. |
The Distribution Plan provides that the Fund may pay annually up to 0.25% of the average daily net assets of the Fund attributable to its Class IB shares for activities primarily intended to result in the sale of Class IB shares. The Board has the authority to suspend or reduce these payments at any point in time. Under the terms of the Distribution Plan and the principal underwriting agreement, the Fund is authorized to make payments monthly to the distributor that may be used to pay or compensate entities providing distribution and shareholder servicing with respect to the Class IB shares for such entities’ fees or expenses incurred or paid in that regard. These fees are accrued daily and paid monthly.
| f) | Other Related Party Transactions – Certain officers of the Fund are directors and/or officers of the investment manager and/or The Hartford or its subsidiaries. For the six-month period ended June 30, 2013, a portion of the Fund’s Chief Compliance Officer’s salary was paid by all the investment companies in the Hartford fund complex. The portion allocated to the Fund rounds to zero. Hartford Administrative Services Company (“HASCO”), an indirect wholly owned subsidiary of The Hartford, provides transfer agent services to the Fund. HASCO was compensated on a per account basis for providing such services. The amount paid to HASCO can be found in the Statement of Operations. These fees are accrued daily and paid monthly. |
| g) | Payment from Affiliate – In July of 2007, The Hartford entered into a settlement with the Attorneys General of the states of New York, Connecticut and Illinois relating to market timing and the company's individual variable annuity contracts in which certain payments would be made directly to the variable annuity contract holders. The distribution plan |
| 22 |
provided that unclaimed money from the settlement would be distributed to certain HLS Funds that are investment options through a Hartford individual variable annuity contract. The unclaimed money was distributed to the Fund on September 18, 2009.
The total return in the accompanying financial highlights includes a payment from an affiliate. Had the payment from the affiliate been excluded, the impact and total return for the period listed below would have been as follows:
| For the Year Ended December 31, 2009 | ||||||||
| Class IA | Class IB | |||||||
| Impact from Payment from Affiliate for Attorneys General Settlement | 0.01 | % | 0.01 | % | ||||
| Total Return Excluding Payment from Affiliate | 44.18 | % | 43.82 | % | ||||
| 8. | Investment Transactions: |
For the six-month period ended June 30, 2013, the Fund's aggregate purchases and sales of investment securities (excluding short-term investments) were as follows:
| Amount | ||||
| Cost of Purchases Excluding U.S. Government Obligations | $ | 136,618 | ||
| Sales Proceeds Excluding U.S. Government Obligations | 169,292 | |||
| 9. | Line of Credit: |
The Fund is one of several Hartford funds that participate in a $500 million committed revolving line of credit facility. The facility is to be used for temporary or emergency purposes. Under the arrangement, the funds are required to own securities having a market value in excess of 300% of the total bank borrowings. The interest rate on borrowings varies depending on the nature of the loan. The facility also requires a fee to be paid based on the amount of the commitment. This commitment fee is allocated to all of the funds participating in the line of credit based on the average net assets of the funds. During the six-month period ended June 30, 2013, the Fund did not have any borrowings under this facility.
| 10. | Industry Classifications: |
Other than the industry classifications “Other Investment Pools and Funds” and “Exchange Traded Funds,” equity industry classifications used in this report are the Global Industry Classification Standard, which was developed by and is the exclusive property and service mark of MSCI, Inc. and Standard & Poor’s.
| 11. | Indemnifications: |
Under the Company’s organizational documents, the Company shall indemnify its officers and directors to the full extent required or permitted under Maryland General Corporation Law and the federal securities laws. In addition, the Company, on behalf of the Fund, may enter into contracts that contain a variety of indemnifications. The Company’s maximum exposure under these arrangements is unknown. However, as of the date of these financial statements, the Company has not had prior claims or losses pursuant to these contracts and expects the risk of loss to be remote.
| 12. | Pending Legal Proceedings: |
On February 25, 2011, Jennifer L. Kasilag, Louis Mellinger, Judith M. Menendez, Jacqueline M. Robinson, and Linda A. Russell filed a derivative lawsuit against Hartford Investment Financial Services, LLC (“HIFSCO”)(now known as Hartford Funds Distributors, LLC) on behalf of six Hartford retail mutual funds in the United States District Court for the District of New Jersey, alleging that HIFSCO received excessive advisory and distribution fees in violation of its statutory fiduciary duty under Section 36(b) of the 1940 Act when serving as investment manager and principal underwriter, respectively, to the Hartford retail mutual funds. HIFSCO moved to dismiss and, in September 2011, the motion was granted in part and denied in part, with leave to amend the complaint. In November 2011, plaintiffs filed an amended complaint on behalf of certain
| 23 |
Hartford MidCap Value HLS Fund
Notes to Financial Statements – (continued)
June 30, 2013 (Unaudited)
(000’s Omitted)
Hartford retail mutual funds, The Hartford Global Health Fund (now known as The Hartford Healthcare Fund), The Hartford Conservative Allocation Fund, The Hartford Growth Opportunities Fund, The Hartford Inflation Plus Fund, The Hartford Advisers Fund (now known as The Hartford Balanced Fund), and The Hartford Capital Appreciation Fund. Plaintiffs seek to rescind the investment management agreements and distribution plans between HIFSCO and these funds and to recover the total fees charged thereunder or, in the alternative, to recover any improper compensation HIFSCO received, in addition to lost earnings. HIFSCO filed a partial motion to dismiss the amended complaint and, in December 2012, the court dismissed without prejudice the claims regarding distribution fees and denied the motion with respect to the advisory fees claims. HIFSCO disputes the allegations and intends to defend vigorously.
This action concerns the activities of HIFSCO in its capacity as investment manager and principal underwriter to the Hartford retail mutual funds and does not concern HIFSCO’s activities in its capacity as principal underwriter to the HLS funds. For this reason, no accrual for litigation relating to this matter has been recorded in the financial statements of the Fund.
| 24 |
[This page intentionally left blank]
| 25 |
Hartford MidCap Value HLS Fund
Financial Highlights
- Selected Per-Share Data (A) -
| Class | Net Asset Value at Beginning of Period | Net Investment Income (Loss) | Net Realized and Unrealized Gain (Loss) on Investments | Total from Investment Operations | Dividends from Net Investment Income | Distributions from Realized Capital Gains | Distributions from Capital | Total Distributions | Net Asset Value at End of Period | |||||||||||||||||||||||||||
| For the Six-Month Period Ended June 30, 2013 (Unaudited) | ||||||||||||||||||||||||||||||||||||
| IA | $ | 11.65 | $ | 0.05 | $ | 1.66 | $ | 1.71 | $ | – | $ | – | $ | – | $ | – | $ | 13.36 | ||||||||||||||||||
| IB | 11.59 | 0.03 | 1.64 | 1.67 | – | – | – | – | 13.26 | |||||||||||||||||||||||||||
| For the Year Ended December 31, 2012 | ||||||||||||||||||||||||||||||||||||
| IA | 9.44 | 0.14 | 2.20 | 2.34 | (0.13 | ) | – | – | (0.13 | ) | 11.65 | |||||||||||||||||||||||||
| IB | 9.38 | 0.10 | 2.21 | 2.31 | (0.10 | ) | – | – | (0.10 | ) | 11.59 | |||||||||||||||||||||||||
| For the Year Ended December 31, 2011 | ||||||||||||||||||||||||||||||||||||
| IA | 10.32 | 0.07 | (0.95 | ) | (0.88 | ) | – | – | – | – | 9.44 | |||||||||||||||||||||||||
| IB | 10.29 | 0.04 | (0.95 | ) | (0.91 | ) | – | – | – | – | 9.38 | |||||||||||||||||||||||||
| For the Year Ended December 31, 2010 (G) | ||||||||||||||||||||||||||||||||||||
| IA | 8.33 | 0.05 | 2.00 | 2.05 | (0.06 | ) | – | – | (0.06 | ) | 10.32 | |||||||||||||||||||||||||
| IB | 8.30 | 0.03 | 1.99 | 2.02 | (0.03 | ) | – | – | (0.03 | ) | 10.29 | |||||||||||||||||||||||||
| For the Year Ended December 31, 2009 | ||||||||||||||||||||||||||||||||||||
| IA | 5.82 | 0.07 | 2.50 | 2.57 | (0.06 | ) | – | – | (0.06 | ) | 8.33 | |||||||||||||||||||||||||
| IB | 5.80 | 0.05 | 2.49 | 2.54 | (0.04 | ) | – | – | (0.04 | ) | 8.30 | |||||||||||||||||||||||||
| For the Year Ended December 31, 2008 | ||||||||||||||||||||||||||||||||||||
| IA | 12.34 | 0.07 | (4.35 | ) | (4.28 | ) | (0.06 | ) | (2.18 | ) | – | (2.24 | ) | 5.82 | ||||||||||||||||||||||
| IB | 12.30 | 0.05 | (4.33 | ) | (4.28 | ) | (0.04 | ) | (2.18 | ) | – | (2.22 | ) | 5.80 | ||||||||||||||||||||||
| (A) | Information presented relates to a share outstanding throughout the indicated period. |
| (B) | The figures do not include sales charges or other fees which may be applied at the variable life insurance, variable annuity or qualified retirement plan product level. Any such additional sales charges or other fees would lower the Fund's performance. |
| (C) | Ratios do not reflect reductions for fees paid indirectly. Please see Fees Paid Indirectly in the Notes to Financial Statements. |
| (D) | Portfolio turnover rate is calculated on the basis of the Fund as a whole without distinguishing between the classes of shares issued. |
| (E) | Not annualized. |
| (F) | Annualized. |
| (G) | Per share amounts have been calculated using the average shares method. |
| (H) | During the year ended December 31, 2010, the Fund incurred $89.7 million in purchases associated with the transition of assets from Hartford SmallCap Value HLS Fund, which merged into the Fund on July 30, 2010. These purchases were excluded from the portfolio turnover calculation. |
| (I) | Total return without the inclusion of the Payment from (to) Affiliate can be found in Expenses in the accompanying Notes to Financial Statements. |
| 26 |
- Ratios and Supplemental Data -
| Total Return(B) | Net Assets at End of Period | Ratio of Expenses to Average Net Assets Before Waivers(C) | Ratio of Expenses to Average Net Assets After Waivers(C) | Ratio of Net Investment Income (Loss) to Average Net Assets | Portfolio Turnover Rate(D) | |||||||||||||||||
| 14.60 | %(E) | $ | 348,919 | 0.84 | %(F) | 0.84 | %(F) | 0.59 | %(F) | 30 | % | |||||||||||
| 14.46 | (E) | 116,387 | 1.09 | (F) | 1.09 | (F) | 0.33 | (F) | – | |||||||||||||
| 24.95 | 323,934 | 0.85 | 0.85 | 1.03 | 45 | |||||||||||||||||
| 24.64 | 112,996 | 1.10 | 1.10 | 0.79 | – | |||||||||||||||||
| (8.56 | ) | 341,583 | 0.83 | 0.83 | 0.57 | 43 | ||||||||||||||||
| (8.79 | ) | 116,563 | 1.08 | 1.08 | 0.32 | – | ||||||||||||||||
| 24.67 | 462,281 | 0.85 | 0.85 | 0.57 | 57 | (H) | ||||||||||||||||
| 24.36 | 163,498 | 1.10 | 1.10 | 0.30 | – | |||||||||||||||||
| 44.19 | (I) | 348,742 | 0.86 | 0.86 | 0.87 | 50 | ||||||||||||||||
| 43.83 | (I) | 145,920 | 1.11 | 1.11 | 0.62 | – | ||||||||||||||||
| (40.21 | ) | 301,896 | 0.81 | 0.81 | 0.82 | 51 | ||||||||||||||||
| (40.36 | ) | 128,483 | 1.06 | 1.06 | 0.57 | – | ||||||||||||||||
| 27 |
Hartford MidCap Value HLS Fund
Directors and Officers (Unaudited)
The Board of Directors of the Company appoints officers who are responsible for the day-to-day operations of the Fund and who execute policies formulated by the Directors. Each director serves until his or her death, resignation, or retirement or until the next annual meeting of shareholders is held or until his or her successor is elected and qualifies.
Directors and officers who are employed by or who have a financial interest in The Hartford are considered “interested” persons of the Fund pursuant to the 1940 Act. Each officer and two of the Company’s directors, as noted in the chart below, are “interested” persons of the Fund. Each director serves as a director for The Hartford Mutual Funds, Inc., The Hartford Mutual Funds II, Inc., Hartford Series Fund, Inc., Hartford HLS Series Fund II, Inc., and as a trustee for The Hartford Alternative Strategies Fund, which, as of June 30, 2013, collectively consist of 90 funds. Correspondence may be sent to directors and officers c/o Hartford Mutual Funds, P.O. Box 2999, Hartford, Connecticut 06104-2999, except that correspondence to Mr. Annoni, Mr. Dressen, Ms. Fagely and Ms. Quade may be sent to 500 Bielenberg Drive, Woodbury, Minnesota 55125 and correspondence to Mr. Davey and Mr. Melcher may be sent to 5 Radnor Corporate Center, Suite 300, 100 Matsonford Road, Radnor, Pennsylvania 19087.
The table below sets forth, for each director and officer, his or her name, year of birth, current position with the Company and date first elected or appointed to Hartford Series Fund, Inc. (“HSF”), and Hartford HLS Series Fund II, Inc. (“HSF2”), principal occupation, and, for directors, other directorships held. The Fund’s statement of additional information contains further information on the directors and is available free of charge by calling 1-800-862-6668 or writing to Hartford HLS Funds, c/o Hartford Life Insurance Company, Hartford Life and Annuity Insurance Company, P.O. Box 14293, Lexington, KY 40512-4293.
Information on the aggregate remuneration paid to the directors of the Company can be found in the Statement of Operations herein. The Fund pays to The Hartford a portion of the Chief Compliance Officer’s compensation, but does not pay salaries or compensation to any of their other officers or directors who are employed by The Hartford.
Non-Interested Directors
Lynn S. Birdsong (1946) Director since 2003, Co-Chairman of the Investment Committee
Mr. Birdsong is a private investor. Mr. Birdsong currently serves as a Director of the Sovereign High Yield Investment Company (April 2010 to current). Mr. Birdsong currently serves as an Independent Director of Nomura Partners Funds, Inc. (formerly, The Japan Fund) (March 2003 to current). From 1979 to 2002, Mr. Birdsong was a managing director of Zurich Scudder Investments, an investment management firm. During his employment with Scudder, Mr. Birdsong was an Interested Director of The Japan Fund. Since 1981, Mr. Birdsong has been a partner in Birdsong Company, an advertising specialty firm.
Robert M. Gavin, Jr. (1940) Director since 2002 (HSF) and 1986 (HSF2), Chairman of the Board since 2004
Dr. Gavin is an educational consultant. Prior to September 1, 2001, he was President of Cranbrook Education Community and prior to July 1996, he was President of Macalester College, St. Paul, Minnesota.
Duane E. Hill (1945) Director since 2001 (HSF) and 2002 (HSF2), Chairman of the Nominating Committee
Mr. Hill is Partner of TSG Ventures L.P., a private equity investment company. Mr. Hill is a former partner of TSG Capital Group, a private equity investment firm that served as sponsor and lead investor in leveraged buyouts of middle market companies.
Sandra S. Jaffee (1941) Director since 2005
Ms. Jaffee is the founder and Chief Executive Officer of a private company, Homeworks Concierge, LLC, which provides residential property management services in Westchester County, New York (January 2012 to present). Ms. Jaffee served as Chairman (2008 to 2009) and Chief Executive Officer of Fortent (formerly Searchspace Group), a leading provider of compliance/regulatory technology to financial institutions from August 2005 to August 2009. Ms. Jaffee currently serves as a member of the Board of Directors of Broadridge Financial Solutions as well as a Trustee of Muhlenberg College.
William P. Johnston (1944) Director since 2005, Chairman of the Compliance Committee
In February 2008, Mr. Johnston was elected to the Board of Directors of HCR-ManorCare, Inc. In August 2007, Mr. Johnston was elected to the Board of Directors of LifeCare Holdings, Inc. In July 2006, Mr. Johnston was elected to the Board of Directors of MultiPlan, Inc. and served as a director (July 2006 to August 2010). In June 2006, Mr. Johnston was appointed as Senior Advisor to The Carlyle Group, a global private equity and alternative asset investment firm. In May 2006, Mr. Johnston was elected to the Supervisory Board of Fresenius Medical Care AG & Co. KGaA, after its acquisition of Renal Care Group, Inc. in March 2006.
Phillip O. Peterson (1944) Director since 2002 (HSF) and 2000 (HSF2), Chairman of the Audit Committee
Mr. Peterson is a mutual fund industry consultant. He was a partner of KPMG LLP (an accounting firm) until July 1999. Mr. Peterson joined William Blair Funds in February 2007 as a member of the Board of Trustees. Mr. Peterson also joined the Board of Trustees of Symetra Variable Mutual Funds Trust as a trustee in February 2012.
| 28 |
Lemma W. Senbet (1946) Director since 2005
Dr. Senbet is the William E. Mayer Chair Professor of Finance and Director, Center for Financial Policy, at the University of Maryland, Robert H. Smith School of Business. He was chair of the Finance Department from 1998 to 2006. Previously he was a chaired professor of finance at the University of Wisconsin-Madison. Also, he was director of the Fortis Funds from March 2000 to July 2002. Dr. Senbet served the finance profession in various capacities, including as director of the American Finance Association and President of the Western Finance Association. In 2006, Dr. Senbet was inducted Fellow of Financial Management Association International for his career-long distinguished scholarship and professional service.
Interested Directors and Officers
James E. Davey (1964) Director since 2012, President and Chief Executive Officer since 2010
Mr. Davey serves as Executive Vice President of Hartford Life Insurance Company (“HLIC”) and The Hartford Financial Services Group, Inc. Additionally, Mr. Davey serves as Chairman of the Board and Manager of Hartford Funds Distributors, LLC (“HFD”) and Hartford Administrative Services Company (“HASCO”). Mr. Davey also serves as Manager, President and Chairman of the Board for Hartford Funds Management Company, LLC (“HFMC”). Mr. Davey joined The Hartford in 2002.
Lowndes A. Smith (1939) Director since 1996 (HSF) and 2002 (HSF2), Co-Chairman of the Investment Committee
Mr. Smith served as Vice Chairman of The Hartford from February 1997 to January 2002, as President and Chief Executive Officer of Hartford Life, Inc. from February 1997 to January 2002, and as President and Chief Operating Officer of The Hartford Life Insurance Companies from January 1989 to January 2002. Mr. Smith serves as a Director of White Mountains Insurance Group, Ltd., One Beacon Insurance and Symetra Financial and as Managing Director of Whittington Gray Associates.
Other Officers
Mark A. Annoni (1964) Vice President, Controller and Treasurer since 2012
Mr. Annoni serves as the Assistant Vice President of HLIC (February 2004 to present). Mr. Annoni joined The Hartford in April 2001 as part of The Hartford’s acquisition of Fortis Financial Group (“Fortis”). Prior to joining The Hartford, Mr. Annoni served as Manager of Mutual Fund Accounting at Fortis (July 1997 to April 2001).
Michael R. Dressen (1963) AML Compliance Officer since 2011
Mr. Dressen currently serves as Assistant Vice President of HLIC. He also serves as Chief Compliance Officer and AML Compliance Officer of HASCO and as AML Officer of HFD. Mr. Dressen joined The Hartford in 2005 from State Farm Insurance Companies where he held various positions related to mutual funds, variable products, and property casualty insurance.
Tamara L. Fagely (1958) Vice President since 2002 (HSF) and 1993 (HSF2)
Currently, Ms. Fagely is President and a Director of HASCO, Chief Administrative Officer and Manager of HFMC and a Vice President of HLIC. Ms. Fagely served as a Vice President of HASCO (1998-2013) and Chief Financial Officer of HASCO (2006-2013). She served as Assistant Vice President of HLIC from December 2001 through March 2005. In addition, Ms. Fagely is Manager and Chief Operating Officer of HFD.
Edward P. Macdonald (1967) Vice President, Secretary and Chief Legal Officer since 2005
Mr. Macdonald serves as Vice President of HLIC and Vice President, Chief Legal Officer and Secretary of HFD and HASCO. Mr. Macdonald also serves as Manager, Vice President, Chief Legal Officer and Secretary of HFMC. Mr. Macdonald joined The Hartford in 2005.
Joseph G. Melcher (1973) Vice President and Chief Compliance Officer since 2013(1)
Mr. Melcher currently serves as Vice President of HFMC and HFD. Mr. Melcher joined The Hartford in 2012 from Touchstone Investments, a member of the Western & Southern Financial Group, where he held the position of Vice President and Chief Compliance Officer from 2010 through 2012 and Assistant Vice President, Compliance from 2005 to 2010.
| (1) | Mr. Melcher was named Vice President and Chief Compliance Officer of HSF and HSF2 on February 6, 2013. Prior to February 6, 2013, Colleen Pernerewski served as Chief Compliance Officer of HSF and HSF2. |
Vernon J. Meyer (1964) Vice President since 2006
Mr. Meyer serves as Senior Vice President of HLIC. He also serves as Senior Vice President of HFMC and HIFSCO. Mr. Meyer joined The Hartford in 2004.
| 29 |
Hartford MidCap Value HLS Fund
Directors and Officers (Unaudited) – (continued)
Laura S. Quade (1969) Vice President since 2012
Ms. Quade currently serves as Vice President of HASCO and is a Director of Mutual Fund Service Operations. She also serves as Director, Enterprise Operations of HFD and HLIC. Ms. Quade joined The Hartford in 2001 as part of The Hartford’s acquisition of Fortis.
Elizabeth L. Schroeder (1966) Vice President since 2010(2)
Ms. Schroeder currently serves as Assistant Vice President of HLIC. Ms. Schroeder joined HLIC in 1991. She is also an Assistant Vice President of HFMC and HASCO.
(2) Ms. Schroeder served as Vice President of HSF and HSF2 until August 7, 2013.
Martin Swanson (1962) Vice President since 2010
Mr. Swanson is a Vice President of HLIC. Mr. Swanson also serves as Chief Marketing Officer for HFD. Prior to joining HLIC in 1998, Mr. Swanson was a Vice President at PaineWebber, Inc.
HOW TO OBTAIN A COPY OF THE FUND’S PROXY VOTING POLICIES AND VOTING RECORDS (UNAUDITED)
A description of the policies and procedures that the Fund uses to determine how to vote proxies relating to portfolio securities and information about how the Fund voted proxies relating to portfolio securities during the most recent twelve-month period ended June 30 are available (1) without charge, upon request, by calling 800-862-6668 and (2) on the SEC’s website at http://www.sec.gov.
QUARTERLY PORTFOLIO HOLDINGS INFORMATION (UNAUDITED)
The Fund files a complete schedule of portfolio holdings with the SEC for the first and third quarters of each fiscal year on Form N-Q. The Fund’s Forms are available (1) without charge, upon request, by calling 800-862-6668 and (2) on the SEC’s website at http://www.sec.gov. The Form N-Q may be reviewed and copied at the SEC’s Public Reference Room in Washington, DC. Information on the operation of the Public Reference Room may be obtained by calling 1-800-SEC-0330.
| 30 |
Hartford MidCap Value HLS Fund
Expense Example (Unaudited)
Your Fund's Expenses
As a shareholder of the Fund, you incur two types of costs: (1) transaction costs and (2) ongoing costs including investment management fees, distribution fees, if any, and other fund expenses. This example is intended to help you understand your ongoing costs (in dollars) of investing in the Fund and to compare these costs with the ongoing costs of investing in other mutual funds. The example is based on an investment of $1,000 invested at the beginning of the period and held for the period of December 31, 2012 through June 30, 2013.
Actual Expenses
The first set of columns of the table below provides information about actual account values and actual expenses. You may use the information in this column, together with the amount you invested, to estimate the expenses that you paid over the period. Simply divide your account value by $1,000 (for example, an $8,600 account value divided by $1,000 = 8.6), then multiply the result by the number in the line under the heading entitled “Expenses Paid During Period” to estimate the expenses you paid on your account during this period.
Hypothetical Example for Comparison Purposes
The second set of columns of the table below provides information about hypothetical account values and hypothetical expenses based on the Fund’s actual expense ratio and an assumed rate of return of 5% per year before expenses, which is not the Fund’s actual return. The hypothetical account values and expenses may not be used to estimate the actual ending account balance or expenses you paid for the period. You may use this information to compare the ongoing costs of investing in the Fund and other funds. To do so, compare this 5% hypothetical example with the 5% hypothetical examples that appear in the shareholder reports of the other funds.
Please note that the expenses shown in the table are meant to highlight your ongoing costs only and do not reflect any transactional costs, such as sales charges (loads) and CDSC. Therefore, the second set of columns of the table is useful in comparing ongoing costs only, and will not help you determine the relative total costs of owning different funds. In addition, if these transactional costs were included, your costs would be higher. Expenses are equal to the Fund's annualized expense ratios multiplied by average account value over the period, multiplied by 181/365 (to reflect the one-half year period).
| Actual return | Hypothetical (5% return before expenses) | |||||||||||||||||||||||||||||||||||
| Beginning Account Value December 31, 2012 | Ending Account Value June 30, 2013 | Expenses paid during the period December 31, 2012 through June 30, 2013 | Beginning Account Value December 31, 2012 | Ending Account Value June 30, 2013 | Expenses paid during the period December 31, 2012 through June 30, 2013 | Annualized expense ratio | Days in the current 1/2 year | Days in the full year | ||||||||||||||||||||||||||||
| Class IA | $ | 1,000.00 | $ | 1,146.00 | $ | 4.47 | $ | 1,000.00 | $ | 1,020.63 | $ | 4.21 | 0.84 | % | 181 | 365 | ||||||||||||||||||||
| Class IB | $ | 1,000.00 | $ | 1,144.60 | $ | 5.80 | $ | 1,000.00 | $ | 1,019.39 | $ | 5.46 | 1.09 | % | 181 | 365 | ||||||||||||||||||||
| 31 |
Hartford MidCap Value HLS Fund
Principal Risks (Unaudited)
The principal risks of investing in the Fund are described below.
Market, Selection, and Strategy Risk: The Fund’s share price may fluctuate due to market risk and/or security selections that may underperform the market or relevant benchmarks. If the sub-adviser’s investment strategy does not perform as expected, the Fund could underperform its peers or lose money. There is no guarantee the Fund will achieve its stated objective.
Mid-cap Stock Risk: Mid-cap stocks are generally more volatile and risky and may be less liquid than large-cap stocks because they may have limited operating histories, narrow product lines, and focus on niche markets.
Value Investing Risk: Value investments are considered to be undervalued, but they may never attain their potential value. Value-style investing falls in and out of favor, which may result in periods of underperformance.
Foreign Investment Risk: Foreign investments can be riskier than U.S. investments. Potential risks include currency risk that may result from unfavorable exchange rates, liquidity risk if decreased demand for a security makes it difficult to sell at the desired price, and risks that stem from substantially lower trading volume on foreign markets.
| 32 |
HARTFORD HLS FUNDS
c/o The Hartford Wealth Management - Global Annuities
P.O. Box 14293
Lexington, KY 40512-4293
HARTFORDFUNDS
hartfordfunds.com
Hartford Series Fund, Inc. is underwritten and distributed by Hartford Funds Distributors, LLC.
Hartford Series Fund, Inc. inception dates range from 1977 to date. Hartford Series Fund, Inc. is not a subsidiary of The Hartford Financial Services Group, Inc. ("The Hartford") but is underwritten, distributed by and advised by subsidiaries of The Hartford. Investments in Hartford Series Fund, Inc. are not guaranteed by The Hartford or any other entity.
You should carefully consider investment objectives, risks, and charges and expenses of Hartford HLS Funds before investing. This and other information can be found in the Fund’s prospectus or summary prospectus, which can be obtained by calling 800-862-6668. Please read them carefully before you invest or send money.
HLSSAR-MCV13 8-13 113548-1 Printed in U.S.A ©2013 The Hartford, Hartford, CT 06115
HARTFORDFUNDS
| HARTFORD
MONEY MARKET HLS FUND
2013 Semi Annual Report
|
A MESSAGE FROM THE PRESIDENT
Dear Fellow Shareholders:
I want to take this opportunity to say thank you for investing in the Hartford HLS Funds.
Market Review
During the first half of the year, stocks rose steadily. U.S. equities (as represented by the S&P 500 Index1) posted a strong gain of 10.61% during the first quarter, on their way to an all-time high. During the second quarter, investors persevered through volatility surrounding rumors of the rollback of the U.S. Federal Reserve’s quantitative easing (QE) program later this year, and the S&P 500 Index rose 2.91%. That brought the market’s rise to 13.82% for the first half of 2013. The rumors about QE’s end sent bond yields and mortgage rates upward, but that wasn’t enough to dissuade investors from pushing equities into positive territory.
Because of QE, some have expressed concerns regarding the recent market rally. But a more careful examination of economic data reveals a strong foundation. Consumer balance sheets have improved since the financial crisis, with consumer debt as a percentage of income falling steadily. Housing continued its dogged recovery, fueled by population growth and pent-up demand. In fact, it’s substantive economic improvements that have moved Federal Reserve Chairman Ben Bernanke to consider removing the “training wheels” of QE, which we think should be viewed as a vote of confidence in the U.S. economy going forward.
As the U.S. outlook continues to improve, concerns do remain in the global economy. Emerging markets have lagged due to social unrest and rising inflation. Slowing growth in China is clouding global growth forecasts, but it’s important to remember that China still boasts 7.5% annual GDP growth.
It’s important to stay abreast of domestic and international economic developments while balancing your individual investment goals. Meeting with your financial advisor on a regular basis to examine your current investment strategy can help you determine whether you are on the right track:
| • | Is your portfolio fully diversified with an appropriate mix of stocks and bonds? |
| • | Is your fixed-income portfolio positioned to take advantage of opportunities across the credit spectrum and fulfill your income needs? |
| • | Is your portfolio still in line with your risk tolerance and investment time horizon? |
Your financial professional can help you choose options within our fund family to navigate today’s markets with confidence.
Thank you again for investing with the Hartford HLS Funds.
James Davey
President
Hartford HLS Funds
1 The S&P 500 Index is a market capitalization-weighted price index composed of 500 widely held common stocks.
Hartford Money Market HLS Fund
Table of Contents
This report is prepared for the general information of contract owners and qualified retirement plan participants. It is not an offer of contracts or of qualified retirement plans. It should not be used in connection with any offer, except in conjunction with the appropriate product prospectus which contains all pertinent information including the applicable sales, administrative and other charges.
| Hartford Money Market HLS Fund |
| Schedule of Investments |
| June 30, 2013 (Unaudited) |
| (000’s Omitted) |
| Shares or Principal Amount | Market Value ╪ | |||||||
| CERTIFICATES OF DEPOSIT - 14.6% | ||||||||
| Finance and Insurance - 14.6% | ||||||||
| Commercial Banking - 9.0% | ||||||||
| Bank of Tokyo Mitsubishi Ltd. | ||||||||
| $ | 19,400 | 0.24%, 09/04/2013 | $ | 19,400 | ||||
| Bank of Tokyo Mitsubishi UFJ Ltd. of New York | ||||||||
| 19,500 | 0.24%, 07/08/2013 | 19,500 | ||||||
| 19,250 | 0.28%, 07/23/2013 | 19,250 | ||||||
| Sumitomo Mitsui Banking Corp. | ||||||||
| 24,000 | 0.23%, 08/06/2013 | 24,000 | ||||||
| 24,000 | 0.24%, 07/09/2013 | 24,000 | ||||||
| Svenska Handelsbanken | ||||||||
| 33,000 | 0.20%, 10/03/2013 | 33,000 | ||||||
| 20,500 | 0.24%, 08/22/2013 | 20,500 | ||||||
| 159,650 | ||||||||
| Depository Credit Banking - 3.6% | ||||||||
| Bank of Nova Scotia | ||||||||
| 26,000 | 0.17%, 10/09/2013 | 26,000 | ||||||
| Toronto-Dominion Bank New York | ||||||||
| 39,000 | 0.28%, 07/26/2013 - 09/13/2013 Δ | 39,000 | ||||||
| 65,000 | ||||||||
| International Trade Financing (Foreign Banks) - 2.0% | ||||||||
| Royal Bank of Canada | ||||||||
| 35,000 | 0.33%, 07/30/2013 - 07/03/2014 Δ | 35,000 | ||||||
| Total certificates of deposit | ||||||||
| (cost $259,650) | $ | 259,650 | ||||||
| COMMERCIAL PAPER - 29.9% | ||||||||
| Beverage and Tobacco Product Manufacturing - 1.8% | ||||||||
| Beverage Manufacturing - 1.8% | ||||||||
| Coca Cola Co. | ||||||||
| $ | 13,600 | 0.10%, 08/22/2013 | $ | 13,598 | ||||
| 18,000 | 0.14%, 07/15/2013 | 17,999 | ||||||
| 31,597 | ||||||||
| Finance and Insurance - 18.7% | ||||||||
| Captive Auto Finance - 1.1% | ||||||||
| Toyota Motor Credit Corp. | ||||||||
| 19,500 | 0.20%, 07/26/2013 | 19,497 | ||||||
| Commercial Banking - 9.2% | ||||||||
| Nordea Bank AB | ||||||||
| 17,250 | 0.19%, 10/11/2013 | 17,241 | ||||||
| 14,000 | 0.20%, 09/17/2013 | 13,994 | ||||||
| Nordea North America | ||||||||
| 15,500 | 0.22%, 08/13/2013 | 15,496 | ||||||
| Old Line Funding LLC | ||||||||
| 36,250 | 0.18%, 08/19/2013 | 36,241 | ||||||
| State Street Corp. | ||||||||
| 40,750 | 0.17%, 09/09/2013 | 40,736 | ||||||
| U.S. Bank | ||||||||
| 40,750 | 0.14%, 08/08/2013 - 09/10/2013 | 40,741 | ||||||
| 164,449 | ||||||||
| Depository Credit Banking - 2.6% | ||||||||
| Bank of Nova Scotia | ||||||||
| 17,750 | 0.23%, 10/02/2013 | 17,739 | ||||||
| Toronto Dominion Bank | ||||||||
| 13,000 | 0.15%, 09/18/2013 | 12,996 | ||||||
| Wells Fargo Bank NA | ||||||||
| 14,500 | 0.15%, 08/19/2013 | 14,497 | ||||||
| 45,232 | ||||||||
| Nondepository Credit Banking - 3.9% | ||||||||
| General Electric Capital Corp. | ||||||||
| 15,500 | 0.13%, 10/09/2013 | 15,494 | ||||||
| 17,500 | 0.18%, 08/26/2013 | 17,495 | ||||||
| 15,500 | 0.20%, 08/30/2013 | 15,495 | ||||||
| Toyota Motor Credit Corp. | ||||||||
| 21,000 | 0.23%, 08/16/2013 | 20,994 | ||||||
| 69,478 | ||||||||
| Securities and Commodity Contracts and Brokerage - 1.9% | ||||||||
| JP Morgan Chase & Co. | ||||||||
| 34,500 | 0.17%, 08/01/2013 | 34,495 | ||||||
| 333,151 | ||||||||
| Health Care and Social Assistance - 4.4% | ||||||||
| Pharmaceutical and Medicine Manufacturing - 4.4% | ||||||||
| Abbott Laboratories | ||||||||
| 18,500 | 0.13%, 07/16/2013 - 07/23/2013 ■ | 18,499 | ||||||
| Johnson & Johnson | ||||||||
| 34,000 | 0.06%, 07/11/2013 | 33,999 | ||||||
| Merck & Co., Inc. | ||||||||
| 26,000 | 0.12%, 09/23/2013 | 25,993 | ||||||
| 78,491 | ||||||||
| Retail Trade - 2.5% | ||||||||
| Other General Merchandise Stores - 2.5% | ||||||||
| Wal-Mart Stores, Inc. | ||||||||
| 45,000 | 0.06%, 07/01/2013 ■ | 45,000 | ||||||
| Soap, Cleaning Compound and Toilet Manufacturing - 2.5% | ||||||||
| Soap, Cleaning Compound and Toilet Manufacturing - 2.5% | ||||||||
| Procter & Gamble Co. | ||||||||
| 27,000 | 0.10%, 08/12/2013 ■ | 26,997 | ||||||
| 17,000 | 0.10%, 09/05/2013 | 16,997 | ||||||
| 43,994 | ||||||||
| Total commercial paper | ||||||||
| (cost $532,233) | $ | 532,233 | ||||||
| CORPORATE NOTES - 4.2% | ||||||||
| Finance and Insurance - 4.2% | ||||||||
| Depository Credit Banking - 1.1% | ||||||||
| Wells Fargo Bank NA | ||||||||
| $ | 10,000 | 0.32%, 07/18/2014 Δ | $ | 10,000 | ||||
| 10,250 | 0.37%, 07/22/2014 Δ | 10,250 | ||||||
| 20,250 | ||||||||
| Insurance Carriers - 1.1% | ||||||||
| MetLife Global Funding I | ||||||||
| 19,500 | 0.48%, 12/09/2013 ■ Δ | 19,500 | ||||||
| International Trade Financing (Foreign Banks) - 1.1% | ||||||||
| International Bank for Reconstruction & Development | ||||||||
| 19,250 | 0.11%, 09/24/2013 | 19,245 | ||||||
The accompanying notes are an integral part of these financial statements.
| 2 |
| Shares or Principal Amount | Market Value ╪ | |||||||||||
| CORPORATE NOTES - 4.2% - (continued) | ||||||||||||
| Finance and Insurance - 4.2% - (continued) | ||||||||||||
| Securities and Commodity Contracts and Brokerage - 0.9% | ||||||||||||
| JP Morgan Chase Bank | ||||||||||||
| $ | 15,500 | 0.35%, 06/06/2014 Δ | $ | 15,500 | ||||||||
| 74,495 | ||||||||||||
| Total corporate notes | ||||||||||||
| (cost $74,495) | $ | 74,495 | ||||||||||
| FOREIGN GOVERNMENT OBLIGATIONS - 7.5% | ||||||||||||
| Canada - 7.5% | ||||||||||||
| British Columbia (Province of) | ||||||||||||
| $ | 24,000 | 0.09%, 09/12/2013 | $ | 23,996 | ||||||||
| 29,000 | 0.11%, 09/05/2013 | 28,994 | ||||||||||
| Ontario (Province of) | ||||||||||||
| 29,500 | 0.15%, 09/20/2013 | 29,490 | ||||||||||
| Quebec (Province of) | ||||||||||||
| 24,000 | 0.14%, 10/10/2013 | 23,990 | ||||||||||
| 27,000 | 0.16%, 09/16/2013 | 26,991 | ||||||||||
| 133,461 | ||||||||||||
| Total foreign government obligations | ||||||||||||
| (cost $133,461) | $ | 133,461 | ||||||||||
| OTHER POOLS AND FUNDS - 0.0% | ||||||||||||
| 1 | JP Morgan U.S. Government Money Market Fund | $ | 1 | |||||||||
| Total other pools and funds | ||||||||||||
| (cost $1) | $ | 1 | ||||||||||
| REPURCHASE AGREEMENTS - 15.5% | ||||||||||||
| Deutsche Bank Securities TriParty Repurchase Agreement (maturing on 07/01/2013 in the amount of $10,000, collateralized by U.S. Treasury Note 0.25%, 2015, value of $10,200) | ||||||||||||
| $ | 10,000 | 0.12% dated 06/28/2013 | $ | 10,000 | ||||||||
| RBS Greenwich Capital Markets TriParty Repurchase Agreement (maturing on 07/01/2013 in the amount of $69,000, collateralized by U.S. Treasury Note 0.25% - 3.00%, 2014 - 2017, value of $70,384) | ||||||||||||
| 69,000 | 0.08% dated 06/28/2013 | 69,000 | ||||||||||
| Royal Bank of Canada TriParty Repurchase Agreement (maturing on 07/01/2013 in the amount of $138,900, collateralized by U.S. Treasury Bond 2.88%, 2043, U.S. Treasury Note 0.25% - 4.25%, 2015, value of $141,678) | ||||||||||||
| 138,900 | 0.10% dated 06/28/2013 | 138,900 | ||||||||||
| UBS Securities, Inc. TriParty Repurchase Agreement (maturing on 07/01/2013 in the amount of $59,050, collateralized by U.S. Treasury Bond 2.75%, 2042, value of $60,231) | ||||||||||||
| 59,050 | 0.10% dated 06/28/2013 | 59,050 | ||||||||||
| Total repurchase agreements | ||||||||||||
| (cost $276,950) | $ | 276,950 | ||||||||||
| U.S. GOVERNMENT AGENCIES - 10.1% | ||||||||||||
| FHLMC - 5.1% | ||||||||||||
| $ | 44,750 | 0.07%, 09/12/2013 - 09/25/2013 | $ | 44,743 | ||||||||
| 26,000 | 0.08%, 09/09/2013 ○ | 25,996 | ||||||||||
| 19,250 | 0.13%, 08/05/2013 | 19,248 | ||||||||||
| 89,987 | ||||||||||||
| FNMA - 5.0% | ||||||||||||
| 59,000 | 0.07%, 09/11/2013 - 09/16/2013 | 58,991 | ||||||||||
| 30,000 | 0.13%, 07/31/2013 | 29,997 | ||||||||||
| 88,988 | ||||||||||||
| Total U.S. government agencies | ||||||||||||
| (cost $178,975) | $ | 178,975 | ||||||||||
| U.S. GOVERNMENT SECURITIES - 17.5% | ||||||||||||
| Other Direct Federal Obligations - 5.0% | ||||||||||||
| FHLB | ||||||||||||
| $ | 27,000 | 0.07%, 08/09/2013 | $ | 26,998 | ||||||||
| 17,750 | 0.08%, 09/18/2013 | 17,747 | ||||||||||
| 25,000 | 0.09%, 09/13/2013 | 24,996 | ||||||||||
| 20,000 | 0.13%, 08/07/2013 | 19,997 | ||||||||||
| 89,738 | ||||||||||||
| U.S. Treasury Bills - 12.5% | ||||||||||||
| 45,000 | 0.05%, 09/26/2013 | 44,995 | ||||||||||
| 50,000 | 0.06%, 09/19/2013 | 49,993 | ||||||||||
| 45,000 | 0.07%, 09/30/2013 | 45,006 | ||||||||||
| 82,500 | 0.08%, 08/15/2013 - 10/15/2013 | 82,587 | ||||||||||
| 222,581 | ||||||||||||
| Total U.S. government securities | ||||||||||||
| (cost $312,319) | $ | 312,319 | ||||||||||
| Total investments | ||||||||||||
| (cost $1,768,084) ▲ | 99.3 | % | $ | 1,768,084 | ||||||||
| Other assets and liabilities | 0.7 | % | 13,069 | |||||||||
| Total net assets | 100.0 | % | $ | 1,781,153 | ||||||||
The accompanying notes are an integral part of these financial statements.
| 3 |
| Hartford Money Market HLS Fund |
| Schedule of Investments – (continued) |
| June 30, 2013 (Unaudited) |
| (000’s Omitted) |
| Note: | Percentage of investments as shown is the ratio of the total market value to total net assets. The rates presented in this Schedule of Investments are yields, unless otherwise noted. Market value of investments in U.S. dollar denominated securities of foreign issuers represents 18.9% of total net assets at June 30, 2013. |
| ▲ | Also represents cost for tax purposes. |
| Δ | Variable rate securities; the rate reported is the coupon rate in effect at June 30, 2013. |
| ○ | The interest rate disclosed for these securities represents the effective yield on the date of the acquisition. |
| ■ | Securities issued within terms of a private placement memorandum, exempt from registration under Rule 144A under the Securities Act of 1933, as amended, and may be sold only to qualified institutional buyers. Unless otherwise indicated, these holdings are determined to be liquid. At June 30, 2013, the aggregate value of these securities was $109,996, which represents 6.2% of total net assets. |
| ╪ | See Significant Accounting Policies of accompanying Notes to Financial Statements regarding valuation of securities. |
| GLOSSARY: (abbreviations used in preceding Schedule of Investments) |
| Other Abbreviations: | ||
| FHLB | Federal Home Loan Bank | |
| FHLMC | Federal Home Loan Mortgage Corp. | |
| FNMA | Federal National Mortgage Association | |
Diversification by Security Type
as of June 30, 2013
| Category | Percentage of Net Assets | |||
| Certificates of Deposit | 14.6 | % | ||
| Commercial Paper | 29.9 | |||
| Corporate Notes | 4.2 | |||
| Foreign Government Obligations | 7.5 | |||
| Other Pools and Funds | 0.0 | |||
| Repurchase Agreements | 15.5 | |||
| U.S. Government Agencies | 10.1 | |||
| U.S. Government Securities | 17.5 | |||
| Other Assets and Liabilities | 0.7 | |||
| Total | 100.0 | % | ||
The accompanying notes are an integral part of these financial statements.
| 4 |
| Hartford Money Market HLS Fund |
| Investment Valuation Hierarchy Level Summary |
| June 30, 2013 (Unaudited) |
| (000’s Omitted) |
| Total | Level 1 ♦ | Level 2 ♦ | Level 3 | |||||||||||||
| Assets: | ||||||||||||||||
| Certificates of Deposit | $ | 259,650 | $ | – | $ | 259,650 | $ | – | ||||||||
| Commercial Paper | 532,233 | – | 532,233 | – | ||||||||||||
| Corporate Notes | 74,495 | – | 74,495 | – | ||||||||||||
| Foreign Government Obligations | 133,461 | – | 133,461 | – | ||||||||||||
| Other Pools and Funds | 1 | 1 | – | – | ||||||||||||
| Repurchase Agreements | 276,950 | – | 276,950 | – | ||||||||||||
| U.S. Government Agencies | 178,975 | – | 178,975 | – | ||||||||||||
| U.S. Government Securities | 312,319 | – | 312,319 | – | ||||||||||||
| Total | $ | 1,768,084 | $ | 1 | $ | 1,768,083 | $ | – | ||||||||
| ♦ | For the six-month period ended June 30, 2013, there were no transfers between Level 1 and Level 2. |
The accompanying notes are an integral part of these financial statements.
| 5 |
| Hartford Money Market HLS Fund |
| Statement of Assets and Liabilities |
| June 30, 2013 (Unaudited) |
| (000’s Omitted) |
| Assets: | ||||
| Investments in securities, at market value (cost $1,491,134) | $ | 1,491,134 | ||
| Investments in repurchase agreements, at market value (cost $276,950) | 276,950 | |||
| Receivables: | ||||
| Fund shares sold | 17,556 | |||
| Dividends and interest | 330 | |||
| Other assets | 93 | |||
| Total assets | 1,786,063 | |||
| Liabilities: | ||||
| Bank overdraft | — | |||
| Payables: | ||||
| Fund shares redeemed | 4,703 | |||
| Investment management fees | 116 | |||
| Distribution fees | 10 | |||
| Accrued expenses | 81 | |||
| Total liabilities | 4,910 | |||
| Net assets | $ | 1,781,153 | ||
| Summary of Net Assets: | ||||
| Capital stock and paid-in-capital | $ | 1,781,153 | ||
| Net assets | $ | 1,781,153 | ||
| Shares authorized | 14,000,000 | |||
| Par value | $ | 0.001 | ||
| Class IA: Net asset value per share | $ | 1.00 | ||
| Shares outstanding | 1,541,725 | |||
| Net assets | $ | 1,541,725 | ||
| Class IB: Net asset value per share | $ | 1.00 | ||
| Shares outstanding | 239,428 | |||
| Net assets | $ | 239,428 |
The accompanying notes are an integral part of these financial statements.
| 6 |
| Hartford Money Market HLS Fund |
| Statement of Operations |
| For the Six-Month Period Ended June 30, 2013 (Unaudited) |
| (000’s Omitted) |
| Investment Income: | ||||
| Interest | 1,454 | |||
| Total investment income, net | 1,454 | |||
| Expenses: | ||||
| Investment management fees | 3,525 | |||
| Transfer agent fees | 1 | |||
| Custodian fees | 5 | |||
| Accounting services fees | 88 | |||
| Board of Directors' fees | 26 | |||
| Audit fees | 11 | |||
| Other expenses | 98 | |||
| Total expenses (before waivers) | 3,754 | |||
| Expense waivers | (2,300 | ) | ||
| Total waivers | (2,300 | ) | ||
| Total expenses, net | 1,454 | |||
| Net Investment Income | — | |||
| Net Increase in Net Assets Resulting from Operations | $ | — | ||
The accompanying notes are an integral part of these financial statements.
| 7 |
| Hartford Money Market HLS Fund |
| Statement of Changes in Net Assets |
| (000’s Omitted) |
| For the Six-Month Period Ended June 30, 2013 (Unaudited) | For the Year Ended December 31, 2012 | |||||||
| Operations: | ||||||||
| Net investment loss | $ | — | $ | (5 | ) | |||
| Net realized gain on investments | — | 5 | ||||||
| Net Increase in Net Assets Resulting from Operations | — | — | ||||||
| Capital Share Transactions: | ||||||||
| Class IA | ||||||||
| Sold | 717,782 | 1,183,777 | ||||||
| Redeemed | (779,714 | ) | (1,550,432 | ) | ||||
| Total capital share transactions | (61,932 | ) | (366,655 | ) | ||||
| Class IB | ||||||||
| Sold | 85,384 | 156,549 | ||||||
| Redeemed | (118,421 | ) | (260,732 | ) | ||||
| Total capital share transactions | (33,037 | ) | (104,183 | ) | ||||
| Net decrease from capital share transactions | (94,969 | ) | (470,838 | ) | ||||
| Net Decrease in Net Assets | (94,969 | ) | (470,838 | ) | ||||
| Net Assets: | ||||||||
| Beginning of period | 1,876,122 | 2,346,960 | ||||||
| End of period | $ | 1,781,153 | $ | 1,876,122 | ||||
| Undistributed (distribution in excess of) net investment income | $ | — | $ | — | ||||
| Shares: | ||||||||
| Class IA | ||||||||
| Sold | 717,782 | 1,183,777 | ||||||
| Redeemed | (779,714 | ) | (1,550,432 | ) | ||||
| Total share activity | (61,932 | ) | (366,655 | ) | ||||
| Class IB | ||||||||
| Sold | 85,384 | 156,549 | ||||||
| Redeemed | (118,421 | ) | (260,732 | ) | ||||
| Total share activity | (33,037 | ) | (104,183 | ) | ||||
The accompanying notes are an integral part of these financial statements.
| 8 |
| Hartford Money Market HLS Fund |
| Notes to Financial Statements |
| June 30, 2013 (Unaudited) |
| (000’s Omitted) |
| 1. | Organization: |
Hartford Money Market HLS Fund (the “Fund”) serves as an underlying investment option for certain variable annuity and variable life insurance separate accounts of Hartford Life Insurance Company (“HLIC”) and its affiliates and certain qualified retirement plans. The Fund may also serve as an underlying investment option for certain variable annuity and variable life separate accounts of other insurance companies. Owners of variable annuity contracts and policyholders of variable life insurance contracts may choose the funds permitted in the variable insurance contract prospectus. In addition, participants in certain qualified retirement plans may choose the Fund if permitted by their plans.
Hartford Series Fund, Inc. (the “Company”) is an open-end registered management investment company comprised of thirty portfolios. Financial statements for the Fund, a series of the Company, are included in this report.
The Company is organized under the laws of the State of Maryland and is registered with the Securities and Exchange Commission (“SEC”) under the Investment Company Act of 1940, as amended (“1940 Act”). The Fund is a diversified open-end management investment company.
The Fund is divided into Class IA and Class IB shares. Each class is offered at the per share net asset value (“NAV”) without a sales charge and is subject to the same expenses, except that the Class IB shares are subject to distribution and service fees charged pursuant to a Distribution Plan adopted in accordance with Rule 12b-1 under the 1940 Act.
| 2. | Significant Accounting Policies: |
The following is a summary of significant accounting policies of the Fund in the preparation of its financial statements, which are in accordance with the United States Generally Accepted Accounting Principles (“U.S. GAAP”). The preparation of financial statements in accordance with U.S. GAAP may require management to make estimates and assumptions that affect the reported amounts of assets and liabilities and disclosure of contingent assets and liabilities at the date of the financial statements and the reported amounts of increases and decreases in net assets from operations during the reporting period. Actual results could differ from those estimates.
| a) | Determination of Net Asset Value – The NAV of each class of the Fund’s shares is determined as of the close of regular trading (normally 4:00 p.m. Eastern Time) (the “NYSE Close”) on each day that the New York Stock Exchange (the “Exchange”) is open (“Valuation Date”). Information that becomes known to the Fund after the NAV has been calculated on a particular day will not generally be used to retroactively adjust the NAV determined earlier that day. |
| b) | Investment Valuation – The Fund’s investments are valued at amortized cost, which approximates market value. Investments in open-end mutual funds are valued at the respective NAV of each open-end mutual fund as determined on the Valuation Date. |
U.S. GAAP defines fair value as the price that the Fund would receive to sell an asset or pay to transfer a liability in an orderly transaction between market participants. The U.S. GAAP fair value measurement standards require disclosure of a fair value hierarchy for each major category of assets and liabilities. Various inputs are used in determining the fair value of the Fund’s investments. These inputs are summarized into three broad hierarchy levels. This hierarchy is based on whether the valuation inputs are observable or unobservable. These levels are:
| · | Level 1 – Quoted prices in active markets for identical investments. Level 1 may include exchange traded instruments, such as domestic equities, some foreign equities, options, futures, mutual funds, exchange traded funds, rights and warrants. |
| · | Level 2 – Observable inputs other than Level 1 prices, such as quoted prices for similar investments; quoted prices in markets that are not active; or other inputs that are observable or can be corroborated by observable |
| 9 |
| Hartford Money Market HLS Fund |
| Notes to Financial Statements – (continued) |
| June 30, 2013 (Unaudited) |
| (000’s Omitted) |
market data. Level 2 may include debt investments that are traded less frequently than exchange traded instruments and which are valued using independent pricing services; foreign equities, which are principally traded on certain foreign markets and are adjusted daily pursuant to a fair value pricing service in order to reflect an adjustment for the factors occurring after the close of certain foreign markets but before the NYSE Close; and short-term investments, which are valued at amortized cost.
| · | Level 3 – Significant unobservable inputs that are supported by limited or no market activity. Level 3 may include financial instruments whose values are determined using indicative market quotes or require significant management judgment or estimation. These unobservable valuation inputs may include estimates for current yields, maturity/duration, prepayment speed, and indicative market quotes for comparable investments along with other assumptions relating to credit quality, collateral value, complexity of the investment structure, general market conditions and liquidity. This category may include investments where trading has been halted or there are certain restrictions on trading. While these investments are priced using unobservable inputs, the valuation of these investments reflects the best available data and management believes the prices are a reasonable representation of exit price. |
The Board of Directors of the Company generally reviews and approves the “Procedures for Valuation of Portfolio Securities” on an annual basis. These procedures define how investments are to be valued, including the formation and activities of a Valuation Committee. The Valuation Committee is responsible for determining in good faith the fair value of investments when the value cannot be obtained from primary pricing services or alternative sources or if the valuation of an investment as provided by the primary pricing service or alternative source is believed not to reflect the investment’s fair value as of the Valuation Date. Members of the Valuation Committee include the Fund’s Treasurer or designee, a Vice President of the Fund with legal expertise or designee, and a Vice President of the investment manager or designee. In addition, the Fund’s Chief Compliance Officer shall designate a member of the compliance group to attend Valuation Committee meetings as a non-voting resource, to monitor for and provide guidance with respect to compliance with these procedures. Two members of the Valuation Committee or their designees, representing different departments, shall constitute a quorum for purposes of permitting the Valuation Committee to take action. The Valuation Committee will consider all relevant factors in determining an investment’s fair value, and may seek the advice of the Fund’s sub-adviser, knowledgeable brokers, and legal counsel in making such determination. The Valuation Committee reports to the Audit Committee of the Company’s Board of Directors. The Audit Committee receives quarterly written reports which include details of all fair-valued investments, including the reason for the fair valuation, and an indication, when possible, of the accuracy of the valuation by disclosing the next available reliable public price quotation or the disposition price of such investments (the “look-back” test). The Board of Directors then must consider for ratification all of the fair value determinations made during the previous quarter.
Valuation levels are not necessarily indicative of the risk associated with investing in such investments. Individual investments within any of the above mentioned asset classes may be assigned a different hierarchical level than those presented above, as individual circumstances dictate.
For additional information, refer to the Investment Valuation Hierarchy Level Summary and the Level 3 roll-forward reconciliation, if applicable, which follow the Schedule of Investments.
For purposes of reporting transfers between different hierarchy levels, both transfers in and out of each level, as applicable, are shown as if they occurred at the beginning of the period.
| c) | Investment Transactions and Investment Income – Investment transactions are recorded as of the trade date (the date the order to buy or sell is executed) for financial reporting purposes. Realized gains and losses are determined on the basis of identified cost. |
Interest income, including amortization of premium and accretion of discounts, is accrued on a daily basis.
| 10 |
| d) | Fund Share Valuation and Dividend Distributions to Shareholders – Orders for the Fund’s shares are executed in accordance with the investment instructions of the contract holders and plan participants. The NAV of the Fund’s shares is determined as of the close of business on each business day of the Exchange. The NAV is determined separately for each class of shares of the Fund by dividing the Fund’s net assets attributable to that class by the number of shares of the class outstanding. Each class of shares offered by the Fund has equal rights as to assets and voting privileges (except that shareholders of a class have exclusive voting rights regarding any matter relating solely to that class of shares). Income and non-class specific expenses are allocated daily to each class on the basis of the relative net assets of the class. Realized and unrealized capital gains and losses are allocated daily based on the relative net assets of each class of shares of the Fund. |
Orders for the purchase of the Fund’s shares received prior to the close of the Exchange on any day the Exchange is open for business are priced at the NAV determined as of the close of the Exchange. Orders received after the close of the Exchange, or on a day on which the Exchange and/or the Fund is not open for business, are priced at the next determined NAV.
Dividends are declared pursuant to a policy adopted by the Company’s Board of Directors based upon the investment performance of the Fund. Normally, dividends from net investment income are declared daily and paid monthly. Dividends from realized capital gains, if any, are paid at least once a year.
Distributions from net investment income, net realized capital gains and capital are determined in accordance with federal income tax regulations, which may differ from U.S. GAAP with respect to character and timing. These differences may include but are not limited to losses deferred due to wash sale adjustments and short-term capital gain adjustments. Permanent book and federal income tax basis differences relating to shareholder distributions will result in reclassifications to certain of the Fund’s capital accounts (see Federal Income Taxes: Reclassification of Capital Accounts note).
| 3. | Securities and Other Investments: |
| a) | Repurchase Agreements – A repurchase agreement is an agreement by which a counterparty agrees to sell an investment and agrees to repurchase the investment sold from the buyer at a mutually agreed upon time and price. During the period of the repurchase agreement, the counterparty will deposit cash and or securities in a third party custodial account to serve as collateral. At the time the Fund enters into a repurchase agreement, the value of the underlying collateral, including accrued interest, will be equal to or exceed the value of the repurchase agreement. Repurchase agreements expose the Fund to counterparty risk - that is, the risk that the counterparty will not fulfill its obligations. To minimize counterparty risk, the investments that serve to collateralize the repurchase agreement are held by the Fund’s custodian in book entry or physical form in the custodial account of the Fund or in a third party custodial account. Repurchase agreements are valued at cost plus accrued interest, which approximates fair value. Repurchase agreements have master netting agreements which allow the Fund to offset amounts owed to a counterparty with amounts owed by the counterparty, including any collateral. The Fund, as shown on the Schedule of Investments, had outstanding repurchase agreements as of June 30, 2013. |
| b) | Illiquid and Restricted Investments – The Fund is permitted to invest up to 5% of its net assets in illiquid investments. Illiquid investments are those that may not be sold or disposed of in the ordinary course of business within seven days, at approximately the price used to determine the Fund’s NAV. The Fund may not be able to sell illiquid investments when its sub-adviser considers it desirable to do so or may have to sell such investments at a price that is lower than the price that could be obtained if the investments were more liquid. A sale of illiquid investments may require more time and may result in higher dealer discounts and other selling expenses than does the sale of those that are liquid. Illiquid investments also may be more difficult to value due to the unavailability of reliable market quotations for such investments, and an investment in them may have an adverse impact on the Fund’s NAV. The Fund may also purchase certain restricted investments that can only be resold to certain qualified investors and may be determined to be liquid |
| 11 |
| Hartford Money Market HLS Fund |
| Notes to Financial Statements – (continued) |
| June 30, 2013 (Unaudited) |
| (000’s Omitted) |
pursuant to policies and guidelines established by the Company’s Board of Directors. The Fund, as shown on the Schedule of Investments, had illiquid and/or restricted investments as of June 30, 2013.
| c) | Investments Purchased on a When-Issued or Delayed-Delivery Basis – Delivery and payment for investments that have been purchased by the Fund on a forward commitment, or when-issued or delayed-delivery basis, take place beyond the customary settlement period. A fund may dispose of or renegotiate a delayed-delivery transaction after it is entered into, and may sell delayed-delivery investments before they are delivered, which may result in a realized gain or loss. During this period, such investments are subject to market fluctuations, and the Fund identifies investments segregated in its records with a value at least equal to the amount of the commitment. As of June 30, 2013, the Fund had no outstanding when-issued or delayed-delivery investments. |
| 4. | Principal Risks: |
| a) | Credit and Counterparty Risks – Credit risk depends largely on the perceived financial health of bond issuers. In general, the credit rating is inversely related to the credit risk of the issuer. Higher rated bonds generally are deemed to have less credit risk, while lower or unrated bonds are deemed to have higher risk of default. The share price, yield and total return of a fund that holds securities with higher credit risk may be more volatile than those of a fund that holds bonds with lower credit risk. Similar to credit risk, the Fund may be exposed to counterparty risk, or the risk that an institution or other entity with which the Fund has unsettled or open transactions will default. |
| b) | Market Risks – The Fund’s investments expose the Fund to various risks including, but not limited to, interest rate risk. Interest rate risk is the risk that fixed income securities will decline in value because of changes in interest rates. As nominal interest rates rise, the value of certain fixed income securities held by the Fund is likely to decrease. A nominal interest rate can be described as the sum of a real interest rate and an expected inflation rate. |
| 5. | Federal Income Taxes: |
| a) | Federal Income Taxes – For federal income tax purposes, the Fund intends to continue to qualify as a Regulated Investment Company (“RIC”) under Subchapter M of the Internal Revenue Code (“IRC”) by distributing substantially all of its taxable net investment income and net realized capital gains to its shareholders and otherwise complying with the requirements of the IRC. The Fund has distributed substantially all of its income and capital gains in prior years, if applicable, and intends to distribute substantially all of its income and capital gains prior to the next fiscal year-end. Accordingly, no provision for federal income or excise taxes has been made in the accompanying financial statements. Distributions from short-term capital gains are treated as ordinary income distributions for federal income tax purposes. |
| b) | Net Investment Income (Loss), Net Realized Gains (Losses), and Distributions – Net investment income (loss) and net realized gains (losses) may differ for financial statement and tax purposes primarily because of losses deferred due to wash sale adjustments and short-term capital gain adjustments. The character of distributions made during the year from net investment income or net realized gains may differ from their ultimate characterization for federal income tax purposes. Also, due to the timing of dividend distributions, the fiscal year in which amounts are distributed may differ from the year that the income or realized gains (losses) were recorded by the Fund. No distributions were made in the current or prior year. |
| 12 |
| c) | Reclassification of Capital Accounts – The Fund may record reclassifications in its capital accounts. These reclassifications have no impact on the total net assets of the Fund. The reclassifications are a result of permanent differences between U.S. GAAP and tax accounting for such items as foreign currency, Passive Foreign Investment Companies, expiration or utilization of capital loss carryforwards or net operating losses. Adjustments are made to reflect the impact these items have on current and future distributions to shareholders. Therefore, the source of the Fund’s distributions may be shown in the accompanying Statement of Changes in Net Assets as from undistributed net investment income, from accumulated net realized gains on investments or from capital depending on the type of book and tax differences that exist. For the year ended December 31, 2012, the Fund recorded reclassifications to increase (decrease) the accounts listed below: |
| Amount | ||||
| Undistributed Net Investment Income | $ | 5 | ||
| Accumulated Net Realized Gain (Loss) | (5 | ) | ||
| d) | Capital Loss Carryforward – On December 22, 2010, the Regulated Investment Company Modernization Act of 2010 (the “Act”) was enacted, which made changes to the capital loss carryforward rules. The changes are effective for taxable years beginning after the date of enactment. Under the Act, funds are permitted to carry forward capital losses for an unlimited period. However, any losses incurred during those future taxable years will be required to be utilized prior to the losses incurred in pre-enactment taxable years, which carry an expiration date. As a result of this ordering rule, pre-enactment capital loss carryforwards may be more likely to expire unused. Additionally, post-enactment capital loss carryforwards retain their character as either short-term or long-term capital losses rather than being considered all short-term as permitted under prior regulation. |
The Fund had no capital loss carryforward for U.S. federal income tax purposes as of December 31, 2012.
| e) | Accounting for Uncertainty in Income Taxes – The Fund has adopted financial reporting rules that require the Fund to analyze all open tax years, as defined by the statute of limitations, for all major jurisdictions. Generally, tax authorities can examine all tax returns filed for the last three years. The Fund does not have an examination in progress. |
The Fund has reviewed all open tax years and major jurisdictions and concluded that these financial reporting rules had no effect on the Fund’s financial position or results of operations. There is no tax liability resulting from unrecognized tax benefits relating to uncertain income tax positions taken or expected to be taken on the tax return for the fiscal year ended December 31, 2012. The Fund is also not aware of any tax positions for which it is reasonably possible that the total amounts of unrecognized tax benefits will significantly change in the next twelve months.
| 6. | Expenses: |
| a) | Investment Management Agreement – Hartford Funds Management Company, LLC (“HFMC”), an indirect wholly owned subsidiary of The Hartford Financial Services Group, Inc. (“The Hartford”), serves as investment manager to the Fund pursuant to an Investment Management Agreement with the Company. The investment manager has overall investment supervisory responsibility for the Fund. In addition, the investment manager provides administrative personnel, services, equipment, facilities and office space for proper operation of the Fund. The investment manager has contracted with Hartford Investment Management Company (“Hartford Investment Management”) under a sub-advisory agreement for the provision of day-to-day investment management services to the Fund in accordance with the Fund’s investment objective and policies. The Fund pays a fee to the investment manager, a portion of which may be used to compensate Hartford Investment Management. |
| 13 |
Hartford Money Market HLS Fund
Notes to Financial Statements – (continued)
June 30, 2013 (Unaudited)
| (000’s Omitted) |
The schedule below reflects the rates of compensation paid to HFMC for investment management services rendered as of June 30, 2013; the rates are accrued daily and paid monthly.
| Average Daily Net Assets | Annual Fee | |||
| On first $5 billion | 0.4000 | % | ||
| On next $5 billion | 0.3800 | % | ||
| Over $10 billion | 0.3700 | % | ||
| b) | Accounting Services Agreement – Pursuant to the Fund Accounting Agreement between HFMC and the Company, on behalf of the Fund, HFMC provides accounting services to the Fund and receives monthly compensation based on the Fund’s average daily net assets at the rates set forth below. The Fund’s accounting services fees are accrued daily and paid monthly. |
| Average Daily Net Assets | Annual Fee | |||
| All Assets | 0.010 | % | ||
| c) | Operating Expenses – Allocable expenses incurred by the Company are allocated to each Fund and allocated to classes within a Fund in proportion to the average daily net assets of the Fund and each class, except where allocation of certain expenses is more fairly made directly to the Fund or to specific classes within a Fund. |
The Investment Manager has agreed to reimburse expenses or waive fees to the extent necessary to prevent earnings from falling below the level of expenses. Any such expense reimbursement or waiver is voluntary and can be changed or terminated at any time without notice. There is no guarantee that the Fund will maintain a $1.00 net asset value per share or any particular level of yield.
| d) | Distribution Plan for Class IB shares – The Company, on behalf of the Fund, has adopted a Distribution Plan pursuant to Rule 12b-1 of the 1940 Act to compensate the distributor, Hartford Funds Distributors, LLC (“HFD”), (formerly known as Hartford Investment Financial Services, LLC), an indirect wholly owned subsidiary of The Hartford, from assets attributable to the Class IB shares for services rendered and expenses borne in connection with activities primarily intended to result in the sale of the Class IB shares, subject to the review and approval of the Company’s Board of Directors. |
The Distribution Plan provides that the Fund may pay annually up to 0.25% of the average daily net assets of the Fund attributable to its Class IB shares for activities primarily intended to result in the sale of Class IB shares. The Board has the authority to suspend or reduce these payments at any point in time. Under the terms of the Distribution Plan and the principal underwriting agreement, the Fund is authorized to make payments monthly to the distributor that may be used to pay or compensate entities providing distribution and shareholder servicing with respect to the Class IB shares for such entities’ fees or expenses incurred or paid in that regard. These fees are accrued daily and paid monthly.
At a meeting held on February 4, 2009, the Board of Directors approved the temporary reduction of distribution and service fees under the Fund’s 12b-1 Plan of Distribution to zero for Class IB for a period of six months, effective March 1, 2009. The Board of Directors has extended the reduction of payment of distribution and service fees until on or about October 21, 2013, the conversion date to the Hartford Ultrashort Bond HLS Fund (see Note 9). The Fund’s action results in a corresponding temporary reduction of 12b-1 payments of amounts paid to financial intermediaries by the Fund’s distributor to zero for Class IB during this time period. The Board of Directors’ action can be changed at any time.
| e) | Other Related Party Transactions – Certain officers of the Fund are directors and/or officers of the investment manager and/or The Hartford or its subsidiaries. For the six-month period ended June 30, 2013, a portion of the Fund’s Chief Compliance Officer’s salary was paid by all the investment companies in the Hartford fund complex. The portion allocated to the Fund was in the amount of $1. Hartford Administrative Services Company (“HASCO”), an indirect wholly owned subsidiary of The Hartford, provides transfer agent services to the Fund. HASCO was compensated on a |
| 14 |
per account basis for providing such services. The amount paid to HASCO can be found in the Statement of Operations. These fees are accrued daily and paid monthly.
| 7. | Investment Transactions: |
For the six-month period ended June 30, 2013, the costs of purchases and sales of securities (including U.S. Government Obligations) for the Fund were $50,489,649 and $50,606,844, respectively.
| 8. | Indemnifications: |
Under the Company’s organizational documents, the Company shall indemnify its officers and directors to the full extent required or permitted under Maryland General Corporation Law and the federal securities laws. In addition, the Company, on behalf of the Fund, may enter into contracts that contain a variety of indemnifications. The Company’s maximum exposure under these arrangements is unknown. However, as of the date of these financial statements, the Company has not had prior claims or losses pursuant to these contracts and expects the risk of loss to be remote.
| 9. | Subsequent Events: |
At a meeting of the Board of Directors of Hartford Series Fund, Inc. on June 18, 2013, the Board approved certain changes to the Fund, which is currently managed as a money market fund seeking to maintain a stable $1.00 NAV per share. Specifically, the Board approved, among other things, changes to the Fund’s name, investment objective and principal investment strategy. Effective on or about October 21, 2013, the Fund will: (1) cease to operate as a money market fund; (2) no longer seek to maintain a stable $1.00 NAV per share; and (3) be renamed the Hartford Ultrashort Bond HLS Fund and be managed as an ultra-short bond fund. Additionally, as of that same date, Wellington Management Company, LLP will replace Hartford Investment Management as the Fund’s sub-adviser.
| 10. | Pending Legal Proceedings: |
On February 25, 2011, Jennifer L. Kasilag, Louis Mellinger, Judith M. Menendez, Jacqueline M. Robinson, and Linda A. Russell filed a derivative lawsuit against Hartford Investment Financial Services, LLC (“HIFSCO”)(now known as Hartford Funds Distributors, LLC) on behalf of six Hartford retail mutual funds in the United States District Court for the District of New Jersey, alleging that HIFSCO received excessive advisory and distribution fees in violation of its statutory fiduciary duty under Section 36(b) of the 1940 Act when serving as investment manager and principal underwriter, respectively, to the Hartford retail mutual funds. HIFSCO moved to dismiss and, in September 2011, the motion was granted in part and denied in part, with leave to amend the complaint. In November 2011, plaintiffs filed an amended complaint on behalf of certain Hartford retail mutual funds, The Hartford Global Health Fund (now known as The Hartford Healthcare Fund), The Hartford Conservative Allocation Fund, The Hartford Growth Opportunities Fund, The Hartford Inflation Plus Fund, The Hartford Advisers Fund (now known as The Hartford Balanced Fund), and The Hartford Capital Appreciation Fund. Plaintiffs seek to rescind the investment management agreements and distribution plans between HIFSCO and these funds and to recover the total fees charged thereunder or, in the alternative, to recover any improper compensation HIFSCO received, in addition to lost earnings. HIFSCO filed a partial motion to dismiss the amended complaint and, in December 2012, the court dismissed without prejudice the claims regarding distribution fees and denied the motion with respect to the advisory fees claims. HIFSCO disputes the allegations and intends to defend vigorously.
This action concerns the activities of HIFSCO in its capacity as investment manager and principal underwriter to the Hartford retail mutual funds and does not concern HIFSCO’s activities in its capacity as principal underwriter to the HLS funds. For this reason, no accrual for litigation relating to this matter has been recorded in the financial statements of the Fund.
| 15 |
Hartford Money Market HLS Fund
Financial Highlights
| - Selected Per-Share Data (A) - |
| Class | Net Asset Value at Beginning of Period | Net Investment Income (Loss) | Net Realized and Unrealized Gain (Loss) on Investments | Total from Investment Operations | Dividends from Net Investment Income | Distributions from Realized Capital Gains | Distributions from Capital | Total Distributions | Net Asset Value at End of Period | |||||||||||||||||||||||||||
| For the Six-Month Period Ended June 30, 2013 (Unaudited) | ||||||||||||||||||||||||||||||||||||
| IA | $ | 1.00 | $ | – | $ | – | $ | – | $ | – | $ | – | $ | – | $ | – | $ | 1.00 | ||||||||||||||||||
| IB | 1.00 | – | – | – | – | – | – | – | 1.00 | |||||||||||||||||||||||||||
| For the Year Ended December 31, 2012 | ||||||||||||||||||||||||||||||||||||
| IA | 1.00 | – | – | – | – | – | – | – | 1.00 | |||||||||||||||||||||||||||
| IB | 1.00 | – | – | – | – | – | – | – | 1.00 | |||||||||||||||||||||||||||
| For the Year Ended December 31, 2011 | ||||||||||||||||||||||||||||||||||||
| IA | 1.00 | – | – | – | – | – | – | – | 1.00 | |||||||||||||||||||||||||||
| IB | 1.00 | – | – | – | – | – | – | – | 1.00 | |||||||||||||||||||||||||||
| For the Year Ended December 31, 2010 | ||||||||||||||||||||||||||||||||||||
| IA | 1.00 | – | – | – | – | – | – | – | 1.00 | |||||||||||||||||||||||||||
| IB | 1.00 | – | – | – | – | – | – | – | 1.00 | |||||||||||||||||||||||||||
| For the Year Ended December 31, 2009 | ||||||||||||||||||||||||||||||||||||
| IA | 1.00 | – | – | – | – | – | – | – | 1.00 | |||||||||||||||||||||||||||
| IB | 1.00 | – | – | – | – | – | – | – | 1.00 | |||||||||||||||||||||||||||
| For the Year Ended December 31, 2008 | ||||||||||||||||||||||||||||||||||||
| IA | 1.00 | 0.02 | – | 0.02 | (0.02 | ) | – | – | (0.02 | ) | 1.00 | |||||||||||||||||||||||||
| IB | 1.00 | 0.02 | – | 0.02 | (0.02 | ) | – | – | (0.02 | ) | 1.00 | |||||||||||||||||||||||||
| (A) | Information presented relates to a share outstanding throughout the indicated period. |
| (B) | The figures do not include sales charges or other fees which may be applied at the variable life insurance, variable annuity or qualified retirement plan product level. Any such additional sales charges or other fees would lower the Fund's performance. |
| (C) | Not annualized. |
| (D) | Annualized. |
| 16 |
| - Ratios and Supplemental Data - |
| Total Return(B) | Net Assets at End of Period | Ratio of Expenses to Average Net Assets Before Waivers | Ratio of Expenses to Average Net Assets After Waivers | Ratio of Net Investment Income (Loss) to Average Net Assets | Portfolio Turnover Rate | |||||||||||||||||
| – | %(C) | $ | 1,541,725 | 0.43 | %(D) | 0.17 | %(D) | – | %(D) | N/A | ||||||||||||
| – | (C) | 239,428 | 0.43 | (D) | 0.17 | (D) | – | (D) | – | |||||||||||||
| – | 1,603,657 | 0.42 | 0.18 | – | N/A | |||||||||||||||||
| – | 272,464 | 0.42 | 0.18 | – | – | |||||||||||||||||
| – | 1,970,312 | 0.42 | 0.16 | – | N/A | |||||||||||||||||
| – | 376,648 | 0.42 | 0.16 | – | – | |||||||||||||||||
| – | 2,086,014 | 0.43 | 0.22 | – | N/A | |||||||||||||||||
| – | 419,519 | 0.43 | 0.22 | – | – | |||||||||||||||||
| 0.06 | 2,820,121 | 0.48 | 0.32 | 0.02 | N/A | |||||||||||||||||
| 0.05 | 548,134 | 0.53 | 0.34 | 0.00 | – | |||||||||||||||||
| 2.15 | 4,427,230 | 0.47 | 0.42 | 2.01 | N/A | |||||||||||||||||
| 1.89 | 774,432 | 0.72 | 0.67 | 1.80 | – | |||||||||||||||||
| 17 |
Hartford Money Market HLS Fund
| Directors and Officers (Unaudited) |
The Board of Directors of the Company appoints officers who are responsible for the day-to-day operations of the Fund and who execute policies formulated by the Directors. Each director serves until his or her death, resignation, or retirement or until the next annual meeting of shareholders is held or until his or her successor is elected and qualifies.
Directors and officers who are employed by or who have a financial interest in The Hartford are considered “interested” persons of the Fund pursuant to the 1940 Act. Each officer and two of the Company’s directors, as noted in the chart below, are “interested” persons of the Fund. Each director serves as a director for The Hartford Mutual Funds, Inc., The Hartford Mutual Funds II, Inc., Hartford Series Fund, Inc., Hartford HLS Series Fund II, Inc., and as a trustee for The Hartford Alternative Strategies Fund, which, as of June 30, 2013, collectively consist of 90 funds. Correspondence may be sent to directors and officers c/o Hartford Mutual Funds, P.O. Box 2999, Hartford, Connecticut 06104-2999, except that correspondence to Mr. Annoni, Mr. Dressen, Ms. Fagely and Ms. Quade may be sent to 500 Bielenberg Drive, Woodbury, Minnesota 55125 and correspondence to Mr. Davey and Mr. Melcher may be sent to 5 Radnor Corporate Center, Suite 300, 100 Matsonford Road, Radnor, Pennsylvania 19087.
The table below sets forth, for each director and officer, his or her name, year of birth, current position with the Company and date first elected or appointed to Hartford Series Fund, Inc. (“HSF”), and Hartford HLS Series Fund II, Inc. (“HSF2”), principal occupation, and, for directors, other directorships held. The Fund’s statement of additional information contains further information on the directors and is available free of charge by calling 1-800-862-6668 or writing to Hartford HLS Funds, c/o Hartford Life Insurance Company, Hartford Life and Annuity Insurance Company, P.O. Box 14293, Lexington, KY 40512-4293.
Information on the aggregate remuneration paid to the directors of the Company can be found in the Statement of Operations herein. The Fund pays to The Hartford a portion of the Chief Compliance Officer’s compensation, but does not pay salaries or compensation to any of their other officers or directors who are employed by The Hartford.
Non-Interested Directors
Lynn S. Birdsong (1946) Director since 2003, Co-Chairman of the Investment Committee
Mr. Birdsong is a private investor. Mr. Birdsong currently serves as a Director of the Sovereign High Yield Investment Company (April 2010 to current). Mr. Birdsong currently serves as an Independent Director of Nomura Partners Funds, Inc. (formerly, The Japan Fund) (March 2003 to current). From 1979 to 2002, Mr. Birdsong was a managing director of Zurich Scudder Investments, an investment management firm. During his employment with Scudder, Mr. Birdsong was an Interested Director of The Japan Fund. Since 1981, Mr. Birdsong has been a partner in Birdsong Company, an advertising specialty firm.
Robert M. Gavin, Jr. (1940) Director since 2002 (HSF) and 1986 (HSF2), Chairman of the Board since 2004
Dr. Gavin is an educational consultant. Prior to September 1, 2001, he was President of Cranbrook Education Community and prior to July 1996, he was President of Macalester College, St. Paul, Minnesota.
Duane E. Hill (1945) Director since 2001 (HSF) and 2002 (HSF2), Chairman of the Nominating Committee
Mr. Hill is Partner of TSG Ventures L.P., a private equity investment company. Mr. Hill is a former partner of TSG Capital Group, a private equity investment firm that served as sponsor and lead investor in leveraged buyouts of middle market companies.
Sandra S. Jaffee (1941) Director since 2005
Ms. Jaffee is the founder and Chief Executive Officer of a private company, Homeworks Concierge, LLC, which provides residential property management services in Westchester County, New York (January 2012 to present). Ms. Jaffee served as Chairman (2008 to 2009) and Chief Executive Officer of Fortent (formerly Searchspace Group), a leading provider of compliance/regulatory technology to financial institutions from August 2005 to August 2009. Ms. Jaffee currently serves as a member of the Board of Directors of Broadridge Financial Solutions as well as a Trustee of Muhlenberg College.
William P. Johnston (1944) Director since 2005, Chairman of the Compliance Committee
In February 2008, Mr. Johnston was elected to the Board of Directors of HCR-ManorCare, Inc. In August 2007, Mr. Johnston was elected to the Board of Directors of LifeCare Holdings, Inc. In July 2006, Mr. Johnston was elected to the Board of Directors of MultiPlan, Inc. and served as a director (July 2006 to August 2010). In June 2006, Mr. Johnston was appointed as Senior Advisor to The Carlyle Group, a global private equity and alternative asset investment firm. In May 2006, Mr. Johnston was elected to the Supervisory Board of Fresenius Medical Care AG & Co. KGaA, after its acquisition of Renal Care Group, Inc. in March 2006.
| 18 |
Phillip O. Peterson (1944) Director since 2002 (HSF) and 2000 (HSF2), Chairman of the Audit Committee
Mr. Peterson is a mutual fund industry consultant. He was a partner of KPMG LLP (an accounting firm) until July 1999. Mr. Peterson joined William Blair Funds in February 2007 as a member of the Board of Trustees. Mr. Peterson also joined the Board of Trustees of Symetra Variable Mutual Funds Trust as a trustee in February 2012.
Lemma W. Senbet (1946) Director since 2005
Dr. Senbet is the William E. Mayer Chair Professor of Finance and Director, Center for Financial Policy, at the University of Maryland, Robert H. Smith School of Business. He was chair of the Finance Department from 1998 to 2006. Previously he was a chaired professor of finance at the University of Wisconsin-Madison. Also, he was director of the Fortis Funds from March 2000 to July 2002. Dr. Senbet served the finance profession in various capacities, including as director of the American Finance Association and President of the Western Finance Association. In 2006, Dr. Senbet was inducted Fellow of Financial Management Association International for his career-long distinguished scholarship and professional service.
Interested Directors and Officers
James E. Davey (1964) Director since 2012, President and Chief Executive Officer since 2010
Mr. Davey serves as Executive Vice President of Hartford Life Insurance Company (“HLIC”) and The Hartford Financial Services Group, Inc. Additionally, Mr. Davey serves as Chairman of the Board and Manager of Hartford Funds Distributors, LLC (“HFD”) and Hartford Administrative Services Company (“HASCO”). Mr. Davey also serves as Manager, President and Chairman of the Board for Hartford Funds Management Company, LLC (“HFMC”). Mr. Davey joined The Hartford in 2002.
Lowndes A. Smith (1939) Director since 1996 (HSF) and 2002 (HSF2), Co-Chairman of the Investment Committee
Mr. Smith served as Vice Chairman of The Hartford from February 1997 to January 2002, as President and Chief Executive Officer of Hartford Life, Inc. from February 1997 to January 2002, and as President and Chief Operating Officer of The Hartford Life Insurance Companies from January 1989 to January 2002. Mr. Smith serves as a Director of White Mountains Insurance Group, Ltd., One Beacon Insurance and Symetra Financial and as Managing Director of Whittington Gray Associates.
Other Officers
Mark A. Annoni (1964) Vice President, Controller and Treasurer since 2012
Mr. Annoni serves as the Assistant Vice President of HLIC (February 2004 to present). Mr. Annoni joined The Hartford in April 2001 as part of The Hartford’s acquisition of Fortis Financial Group (“Fortis”). Prior to joining The Hartford, Mr. Annoni served as Manager of Mutual Fund Accounting at Fortis (July 1997 to April 2001).
Michael R. Dressen (1963) AML Compliance Officer since 2011
Mr. Dressen currently serves as Assistant Vice President of HLIC. He also serves as Chief Compliance Officer and AML Compliance Officer of HASCO and as AML Officer of HFD. Mr. Dressen joined The Hartford in 2005 from State Farm Insurance Companies where he held various positions related to mutual funds, variable products, and property casualty insurance.
Tamara L. Fagely (1958) Vice President since 2002 (HSF) and 1993 (HSF2)
Currently, Ms. Fagely is President and a Director of HASCO, Chief Administrative Officer and Manager of HFMC and a Vice President of HLIC. Ms. Fagely served as a Vice President of HASCO (1998-2013) and Chief Financial Officer of HASCO (2006-2013). She served as Assistant Vice President of HLIC from December 2001 through March 2005. In addition, Ms. Fagely is Manager and Chief Operating Officer of HFD.
Edward P. Macdonald (1967) Vice President, Secretary and Chief Legal Officer since 2005
Mr. Macdonald serves as Vice President of HLIC and Vice President, Chief Legal Officer and Secretary of HFD and HASCO. Mr. Macdonald also serves as Manager, Vice President, Chief Legal Officer and Secretary of HFMC. Mr. Macdonald joined The Hartford in 2005.
Joseph G. Melcher (1973) Vice President and Chief Compliance Officer since 2013(1)
Mr. Melcher currently serves as Vice President of HFMC and HFD. Mr. Melcher joined The Hartford in 2012 from Touchstone Investments, a member of the Western & Southern Financial Group, where he held the position of Vice President and Chief Compliance Officer from 2010 through 2012 and Assistant Vice President, Compliance from 2005 to 2010.
(1) Mr. Melcher was named Vice President and Chief Compliance Officer of HSF and HSF2 on February 6, 2013. Prior to February 6, 2013, Colleen Pernerewski served as Chief Compliance Officer of HSF and HSF2.
| 19 |
Hartford Money Market HLS Fund
| Directors and Officers (Unaudited) – (continued) |
Vernon J. Meyer (1964) Vice President since 2006
Mr. Meyer serves as Senior Vice President of HLIC. He also serves as Senior Vice President of HFMC and HFD. Mr. Meyer joined The Hartford in 2004.
Laura S. Quade (1969) Vice President since 2012
Ms. Quade currently serves as Vice President of HASCO and is a Director of Mutual Fund Service Operations. She also serves as Director, Enterprise Operations of HFD and HLIC. Ms. Quade joined The Hartford in 2001 as part of The Hartford’s acquisition of Fortis.
Elizabeth L. Schroeder (1966) Vice President since 2010(2)
Ms. Schroeder currently serves as Assistant Vice President of HLIC. Ms. Schroeder joined HLIC in 1991. She is also an Assistant Vice President of HFMC and HASCO.
(2) Ms. Schroeder served as Vice President of HSF and HSF2 until August 7, 2013.
Martin Swanson (1962) Vice President since 2010
Mr. Swanson is a Vice President of HLIC. Mr. Swanson also serves as Chief Marketing Officer for HFD. Prior to joining HLIC in 1998, Mr. Swanson was a Vice President at PaineWebber, Inc.
HOW TO OBTAIN A COPY OF THE FUND’S PROXY VOTING POLICIES AND VOTING RECORDS (UNAUDITED)
A description of the policies and procedures that the Fund uses to determine how to vote proxies relating to portfolio securities and information about how the Fund voted proxies relating to portfolio securities during the most recent twelve-month period ended June 30 are available (1) without charge, upon request, by calling 800-862-6668 and (2) on the SEC’s website at http://www.sec.gov.
QUARTERLY PORTFOLIO HOLDINGS INFORMATION (UNAUDITED)
The Fund files a complete schedule of portfolio holdings with the SEC for the first and third quarters of each fiscal year on Form N-Q. The Fund’s Forms are available (1) without charge, upon request, by calling 800-862-6668 and (2) on the SEC’s website at http://www.sec.gov. The Form N-Q may be reviewed and copied at the SEC’s Public Reference Room in Washington, DC. Information on the operation of the Public Reference Room may be obtained by calling 1-800-SEC-0330.
| 20 |
Hartford Money Market HLS Fund
| Expense Example (Unaudited) |
Your Fund's Expenses
As a shareholder of the Fund, you incur two types of costs: (1) transaction costs and (2) ongoing costs including investment management fees, distribution fees, if any, and other fund expenses. This example is intended to help you understand your ongoing costs (in dollars) of investing in the Fund and to compare these costs with the ongoing costs of investing in other mutual funds. The example is based on an investment of $1,000 invested at the beginning of the period and held for the period of December 31, 2012 through June 30, 2013.
Actual Expenses
The first set of columns of the table below provides information about actual account values and actual expenses. You may use the information in this column, together with the amount you invested, to estimate the expenses that you paid over the period. Simply divide your account value by $1,000 (for example, an $8,600 account value divided by $1,000 = 8.6), then multiply the result by the number in the line under the heading entitled “Expenses Paid During Period” to estimate the expenses you paid on your account during this period.
Hypothetical Example for Comparison Purposes
The second set of columns of the table below provides information about hypothetical account values and hypothetical expenses based on the Fund’s actual expense ratio and an assumed rate of return of 5% per year before expenses, which is not the Fund’s actual return. The hypothetical account values and expenses may not be used to estimate the actual ending account balance or expenses you paid for the period. You may use this information to compare the ongoing costs of investing in the Fund and other funds. To do so, compare this 5% hypothetical example with the 5% hypothetical examples that appear in the shareholder reports of the other funds.
Please note that the expenses shown in the table are meant to highlight your ongoing costs only and do not reflect any transactional costs, such as sales charges (loads) and CDSC. Therefore, the second set of columns of the table is useful in comparing ongoing costs only, and will not help you determine the relative total costs of owning different funds. In addition, if these transactional costs were included, your costs would be higher. Expenses are equal to the Fund's annualized expense ratios multiplied by average account value over the period, multiplied by 181/365 (to reflect the one-half year period).
| Actual return | Hypothetical (5% return before expenses) | |||||||||||||||||||||||||||||||
| Beginning Account Value December 31, 2012 | Ending Account Value June 30, 2013 | Expenses paid during the period December 31, 2012 through June 30, 2013 | Beginning Account Value December 31, 2012 | Ending Account Value June 30, 2013 | Expenses paid during the period December 31, 2012 through June 30, 2013 | Annualized expense ratio | Days in the current 1/2 year | Days in the full year | ||||||||||||||||||||||||
| Class IA | $ | 1,000.00 | $ | 1,000.00 | $ | 0.84 | $ | 1,000.00 | $ | 1,023.95 | $ | 0.85 | 0.17 | % | 181 | 365 | ||||||||||||||||
| Class IB | $ | 1,000.00 | $ | 1,000.00 | $ | 0.84 | $ | 1,000.00 | $ | 1,023.95 | $ | 0.85 | 0.17 | % | 181 | 365 | ||||||||||||||||
| 21 |
Hartford Money Market HLS Fund
| Approval of Investment Sub-Advisory Agreement (Unaudited) |
Section 15(c) of the Investment Company Act of 1940, as amended (the “1940 Act”), requires that each mutual fund’s board of directors, including a majority of those directors who are not “interested persons” of the mutual fund, as defined in the 1940 Act (the “Independent Directors”), initially approve, and annually review and consider the continuation of, the mutual fund’s investment advisory and sub-advisory agreements. At its meeting held on June 18-19, 2013, the Board of Directors (the “Board”) of Hartford Series Fund, Inc., including each of the Independent Directors, unanimously voted to approve an investment sub-advisory agreement (the “Agreement”) for Hartford Money Market HLS Fund (the “Fund”) between Hartford Funds Management Company, LLC (“HFMC”), the Fund’s investment manager, and Wellington Management Company, LLP (“Wellington Management”). In connection with the approval of the Agreement, the Board also approved at its June 2013 meeting certain changes to the Fund. Specifically, the Board approved, among other things, changes to the Fund’s name, investment objective and principal investment strategy so that the Fund will: (1) cease to operate as a money market fund; (2) no longer seek to maintain a stable $1.00 net asset value per share; and (3) be renamed Hartford Ultrashort Bond HLS Fund and be managed as an ultra-short bond fund. In connection with these changes, Wellington Management will replace Hartford Investment Management Company (“Hartford Investment Management”) as the Fund’s sub-adviser.
Prior to approving the Agreement, the Board reviewed written responses from HFMC and Wellington Management to questions posed to them on behalf of the Independent Directors and supporting materials relating to those questions and responses. In addition, the Board received an in-person presentation from Fund officers and representatives of HFMC about the proposal to replace Hartford Investment Management with Wellington Management. The Board’s Investment Committee also met in person with members of the proposed portfolio management team for the Fund regarding the capabilities of Wellington Management and the associated benefits to the Fund and its shareholders. In addition, the Board had received information with respect to Wellington Management in connection with the Board’s consideration of the re-approval of Wellington Management as the sub-adviser to certain other Hartford-sponsored funds at the Board’s August 2013 meeting and in connection with the Board’s approval of Wellington Management as the sub-adviser to certain additional Hartford-sponsored funds at other recent meetings.
In determining whether to approve the Agreement for the Fund, the members of the Board reviewed and evaluated information and factors they believed to be relevant and appropriate in light of the information that the Board deemed necessary and appropriate through the exercise of its reasonable business judgment. While individual members of the Board may have weighed certain factors differently, the Board’s determination to approve the Agreement was based on a comprehensive consideration of all information provided to the Board with respect to the approval of the Agreement. A more detailed discussion of the factors the Board considered with respect to its approval of the Agreement is provided below.
Nature, Extent, and Quality of Services to be Provided by Wellington Management
The Board requested and considered information concerning the nature, extent, and quality of the services to be provided to the Fund by Wellington Management. The Board considered, among other things, the terms of the Agreement, the range of services to be provided, and Wellington Management’s organizational structure, systems and personnel. The Board also considered Wellington Management’s reputation and overall financial strength, and the Board’s past experience with Wellington Management as sub-adviser for other Hartford-sponsored funds. The Board considered the terms of the “preferred partnership” arrangement pursuant to which Wellington Management serves as the preferred sub-adviser to the Hartford-sponsored funds, including the benefits of the arrangement for the Fund and other Hartford-sponsored funds.
With respect to Wellington Management’s fixed income capabilities, the Board considered that HFMC believes that Wellington Management is a high quality manager with greater depth and breadth relative to Hartford Investment Management, the Fund’s current sub-adviser, and other peer advisory firms and that Wellington Management has strong investment capabilities with expertise across various investment disciplines. The Board also considered Wellington Management’s global capabilities across various asset classes, including the number and geographic locations of Wellington Management’s investment personnel. The Board noted that Wellington Management is focused entirely on third-party asset management and has experience managing assets in short duration fixed income mandates, including short, ultra-short and money market mandates. In addition, the Board considered Wellington Management’s income-oriented approach, with risk managed at the security, sector, and portfolio level to avoid downside mistakes emphasizing fundamental research.
With respect to the day-to-day portfolio management services to be provided by Wellington Management, the Board considered the Investment Committee’s meeting with members of the proposed portfolio management team, and Wellington Management’s
| 22 |
investment philosophy and process, investment research capabilities and resources, performance record, trade execution capabilities and experience. The Board also considered the experience of the proposed portfolio management team.
The Board also considered information previously provided by HFMC and Wellington Management regarding Wellington Management’s compliance policies and procedures and compliance history, including a representation from HFMC that the written compliance policies and procedures of Wellington Management are reasonably designed to prevent violations of the federal securities laws.
In considering this information, the Board evaluated not only the information presented to the Board and the Investment Committee in connection with its consideration of the Agreement, but also the Board’s experience through past interactions with Wellington Management. Based on these considerations, the Board concluded that it was satisfied with the nature, extent and quality of the services to be provided to the Fund by Wellington Management.
Performance of Wellington Management
The Board considered the investment performance of Wellington Management and its portfolio management team, including, for purposes of considering the investment skill and experience of the Fund’s proposed portfolio managers, composite performance of a Wellington Management strategy that is substantially similar to the Fund’s proposed investment strategy. HFMC and Wellington Management also provided additional information about the broad range of the portfolio management team’s investment experience and their investment philosophy and process.
Based on these considerations, the Board concluded that it was satisfied that Wellington Management has the capability of providing satisfactory investment performance for the Fund.
Costs of the Services and Profitability of HFMC and Wellington Management
The Board reviewed information regarding HFMC’s cost to provide investment management and related services to the Fund and the estimated profitability to HFMC and its affiliates from all services provided to the Fund and all aspects of their relationships with the Fund both under the sub-advisory arrangement with Hartford Investment Management and assuming implementation of the Agreement with Wellington Management. The Board also requested and received information relating to the operations and profitability of Wellington Management.
Based on these considerations, the Board concluded that the profits anticipated to be realized by HFMC, Wellington Management and their affiliates from their relationships with the Fund would not be excessive.
Comparison of Fees and Services
With respect to the sub-advisory fee schedule to be paid to Wellington Management by HFMC in respect of the Fund, the Board considered comparative information with respect to the sub-advisory fees to be paid by HFMC to Wellington Management. The Board also considered information provided by Wellington Management to the Investment Committee of the Board about the quality of services to be performed for the Fund and Wellington Management’s investment philosophy. In addition, the Board considered HFMC’s representation that it had negotiated Wellington Management’s fees at arm’s length.
The Board noted that HFMC, not the Fund, would pay the sub-advisory fees to Wellington Management. The Board also considered HFMC’s assertion that ultra-short funds generally charge higher fees than money market funds, and noted that Management had not recommended any changes to the management fee paid by the Fund to HFMC in connection with the changes to the Fund’s name, investment objective and principal investment strategy.
Based on these considerations, the Board concluded that the Fund’s proposed sub-advisory fees, in conjunction with the information about quality of services, profitability, economies of scale, and other matters discussed, were reasonable in light of the services to be provided.
| 23 |
Hartford Money Market HLS Fund
| Approval of Investment Sub-Advisory Agreement – (continued) |
Economies of Scale
The Board considered the extent to which economies of scale would be realized as the Fund grows and whether the fee levels reflect these economies of scale for the benefit of the Fund’s shareholders. The Board reviewed the breakpoints in the management fee schedule for the Fund, which reduce fee rates as Fund assets grow over time.
Based on these considerations, the Board concluded that it was satisfied with the extent to which economies of scale would be shared for the benefit of the Fund’s shareholders based on currently available information and the effective advisory fees and expense ratios for the Fund at its current and reasonably anticipated asset levels. The Board noted, however, that it would review future growth in Fund assets and the appropriateness of the breakpoints as part of its future annual review of the Agreement and the investment management agreement between the Fund and HFMC.
Other Benefits
The Board considered other benefits to Wellington Management and its affiliates from their relationships with the Fund. The Board also considered the benefits, if any, to Wellington Management from any use of the Fund’s brokerage commissions to obtain soft dollar research, and representations previously received from HFMC and Wellington Management that Wellington Management would not make any revenue-sharing payments or any other type of distribution payments to any of the Fund’s distributors or their affiliates.
* * * *
Based upon its review of these various factors, among others, the Board concluded that it is in the best interests of the Fund and its shareholders for the Board to approve the Agreement. In reaching this decision, the Board did not assign relative weights to the factors discussed above or deem any one or group of them to be controlling in and of themselves. In connection with their deliberations, the Independent Directors met separately in executive session with independent legal counsel to review the relevant materials and consider their responsibilities under relevant laws and regulations.
| 24 |
Hartford Money Market HLS Fund
| Principal Risks (Unaudited) |
The principal risks of investing in the Fund are described below.
FDIC Disclosure: Money market funds are not insured or guaranteed by the Federal Deposit Insurance Corporation (FDIC) or any other government agency.
NAV Risk: Although the Fund seeks to preserve the value of the investment at $1.00 per share, it is possible to lose money by investing in the Fund. There can be no guarantee that the Fund will achieve or maintain any particular level of yield.
Market and Selection Risk: The Fund’s share price may fluctuate due to market risk and/or security selections that may underperform compared to the market or relevant benchmarks.
Fixed Income Risk: The Fund is subject to interest rate risk (the risk that the value of an investment decreases when interest rates rise) and credit risk (the risk that the issuing company of a security is unable to pay interest and principal when due). These risks also apply to the Fund’s investments in U.S. government securities, which may not be guaranteed by the U.S. government.
Foreign Debt Risk (Money Market): Investments in foreign money market securities may be riskier than investments in U.S. securities.
| 25 |
HARTFORD HLS FUNDS
c/o The Hartford Wealth Management - Global Annuities
P.O. Box 14293
Lexington, KY 40512-4293
HARTFORDFUNDS
hartfordfunds.com
Hartford Series Fund, Inc. is underwritten and distributed by Hartford Funds Distributors, LLC.
Hartford Series Fund, Inc. inception dates range from 1977 to date. Hartford Series Fund, Inc. is not a subsidiary of The Hartford Financial Services Group, Inc. ("The Hartford") but is underwritten, distributed by and advised by subsidiaries of The Hartford. Investments in Hartford Series Fund, Inc. are not guaranteed by The Hartford or any other entity.
You should carefully consider investment objectives, risks, and charges and expenses of Hartford HLS Funds before investing. This and other information can be found in the Fund’s prospectus or summary prospectus, which can be obtained by calling 800-862-6668. Please read them carefully before you invest or send money.
HLSSAR-MM13 8-13 113549-1 Printed in U.S.A ©2013 The Hartford, Hartford, CT 06115
HARTFORDFUNDS
| HARTFORD PORTFOLIO
DIVERSIFIER HLS FUND
2013 Semi Annual Report
|
A MESSAGE FROM THE PRESIDENT
Dear Fellow Shareholders:
I want to take this opportunity to say thank you for investing in the Hartford HLS Funds.
Market Review
During the first half of the year, stocks rose steadily. U.S. equities (as represented by the S&P 500 Index1) posted a strong gain of 10.61% during the first quarter, on their way to an all-time high. During the second quarter, investors persevered through volatility surrounding rumors of the rollback of the U.S. Federal Reserve’s quantitative easing (QE) program later this year, and the S&P 500 Index rose 2.91%. That brought the market’s rise to 13.82% for the first half of 2013. The rumors about QE’s end sent bond yields and mortgage rates upward, but that wasn’t enough to dissuade investors from pushing equities into positive territory.
Because of QE, some have expressed concerns regarding the recent market rally. But a more careful examination of economic data reveals a strong foundation. Consumer balance sheets have improved since the financial crisis, with consumer debt as a percentage of income falling steadily. Housing continued its dogged recovery, fueled by population growth and pent-up demand. In fact, it’s substantive economic improvements that have moved Federal Reserve Chairman Ben Bernanke to consider removing the “training wheels” of QE, which we think should be viewed as a vote of confidence in the U.S. economy going forward.
As the U.S. outlook continues to improve, concerns do remain in the global economy. Emerging markets have lagged due to social unrest and rising inflation. Slowing growth in China is clouding global growth forecasts, but it’s important to remember that China still boasts 7.5% annual GDP growth.
It’s important to stay abreast of domestic and international economic developments while balancing your individual investment goals. Meeting with your financial advisor on a regular basis to examine your current investment strategy can help you determine whether you are on the right track:
| • | Is your portfolio fully diversified with an appropriate mix of stocks and bonds? |
| • | Is your fixed-income portfolio positioned to take advantage of opportunities across the credit spectrum and fulfill your income needs? |
| • | Is your portfolio still in line with your risk tolerance and investment time horizon? |
Your financial professional can help you choose options within our fund family to navigate today’s markets with confidence.
Thank you again for investing with the Hartford HLS Funds.
James Davey
President
Hartford HLS Funds
1 The S&P 500 Index is a market capitalization-weighted price index composed of 500 widely held common stocks.
Hartford Portfolio Diversifier HLS Fund
This report is prepared for the general information of contract owners and qualified retirement plan participants. It is not an offer of contracts or of qualified retirement plans. It should not be used in connection with any offer, except in conjunction with the appropriate product prospectus which contains all pertinent information including the applicable sales, administrative and other charges.
The views expressed in the Fund’s Manager Discussion under ‘‘Why did the Fund perform this way?’’ and ‘‘What is the outlook?’’ are views of the Fund’s sub-adviser and portfolio management team through the end of the period and are subject to change based on market and other conditions. The Fund’s Manager Discussion is for informational purposes only and does not represent an offer, recommendation or solicitation to buy, hold or sell any security. The specific securities identified and described, if any, do not represent all of the securities purchased or sold and you should not assume that investments in the securities identified and discussed will be profitable.
| Hartford Portfolio Diversifier HLS Fund inception 06/06/2011 |
| (sub-advised by Hartford Investment Management Company) |
| Investment objective – Seeks to produce investment performance that mitigates against significant declines in the aggregate value of investment allocations to equity mutual funds under certain variable annuity contracts, while also preserving the potential for modest appreciation in the Fund’s net asset value when markets are appreciating. |
Performance Overview 6/06/11 - 6/30/13
The chart above represents the hypothetical growth of a $10,000 investment in Class IB.
| Average Annual Total Returns (as of 6/30/13) |
| 6 Month† | 1 Year | Since Inception▲ | ||||||||||
| Portfolio Diversifier IB | -7.87% | -10.47% | -6.42% | |||||||||
| Barclays U.S. Aggregate Bond Index | -2.44% | -0.68% | 2.98% | |||||||||
| S&P 500 Index | 13.82% | 20.58% | 13.82% | |||||||||
| † | Not Annualized |
| ▲ | Inception: 06/06/2011 |
PERFORMANCE DATA QUOTED REPRESENTS PAST PERFORMANCE AND DOES NOT GUARANTEE FUTURE RESULTS. The investment return and principal value of the investment will fluctuate so that investors’ shares, when redeemed, may be worth more or less than their original cost. Current performance may be lower or higher than the performance data quoted. To obtain performance data current to the most recent month-end, please visit our website www.hartfordfunds.com.
Total returns presented above were calculated using the Fund’s net asset value available to shareholders for sale or redemption of Fund shares on June 30, 2013, which may exclude investment transactions as of this date. All share class returns assume the reinvestment of all distributions at net asset value and the deduction of all fund expenses.
Barclays U.S. Aggregate Bond Index is an unmanaged index and is composed of securities from the Barclays Government/Credit Bond Index, Mortgage-Backed Securities Index, Asset-Backed Securities Index and Commercial Mortgage-Backed Securities Index.
S&P 500 Index is a market capitalization-weighted price index composed of 500 widely held common stocks.
You cannot invest directly in an index.
As of the Fund’s current prospectus dated May 1, 2013, the net total annual operating expense ratio for Class IB shares was 0.85%, and the gross total annual operating expense ratio for Class IB shares was 0.91%. Actual expenses may be higher. Please see the accompanying Financial Highlights for expense ratios for the six-month period ended June 30, 2013.
Net operating expenses are the expenses paid to own the Fund. If the net operating expenses shown are lower than the gross operating expenses, then the net operating expenses reflect contractual fee waivers and expense reimbursements that may not be renewed. Contractual waivers or reimbursements remain in effect until April 30, 2014, and automatically renew for one-year terms unless terminated by the Fund’s investment adviser (Hartford Funds Management Company, LLC), or upon approval of the Board of Directors of the Fund. For more information about the fee arrangement and expiration dates, please see the expense table in the prospectus.
Gross operating expenses shown are before management fee waivers or expense caps. Performance information may reflect historical or current expense waivers or reimbursements, without which, performance would have been lower. For more information on fee waivers and/or expense reimbursements, please see the expense table in the prospectus.
The chart and table do not reflect the deductions of taxes, sales charges or other fees which may be applied at the variable life insurance, variable annuity or qualified retirement plan product level. Any such additional sales charges or other fees or expenses would lower the contract’s or plan’s performance.
All investments are subject to risk including the possible loss of principal. For a discussion of the Fund’s risks, please see the Principal Risks section. For more detailed information on the risks associated with an investment in the Fund, please see the prospectus.
| 2 |
| Hartford Portfolio Diversifier HLS Fund |
| Manager Discussion |
| June 30, 2013 (Unaudited) |
| Portfolio Managers | |
| Paul Bukowski, CFA | James Ong, CFA |
| Executive Vice President and Head of Quantitative Equities | Vice President |
How did the Fund perform?
The Class IB Shares of the Hartford Portfolio Diversifier HLS Fund returned -7.87% for the six-month period ended June 30, 2013, compared to the returns of the Barclays U.S. Aggregate Bond Index which returned -2.44% and the S&P 500 Index which returned 13.82% for the same period.
Why did the Fund perform this way?
The Fund performed in line with expectations. The Fund generally invests in securities which increase in value as the S&P 500 Index declines (protection), and securities which are expected to approximate the performance of the Barclays U.S. Aggregate Bond and S&P 500 Indices.
Overall the Fund declined in value as it is designed to achieve performance generally “contra” to that of the S&P 500 which posted strong performance appreciating nearly 14% during the first half of the year. The Fund’s protection securities, short S&P futures and a modest long term S&P put position, declined in value by approximately 18%, which provided a head wind (i.e. negative impact) to performance during the first half of the year. The derivative sleeve is designed to have negative returns when the S&P 500 has positive returns. The fixed income sleeve also provided a headwind to Fund performance as it declined over 2%.
What is your outlook?
The equity market (S&P 500 Index) markedly slowed its pace rising 2.9% during the second quarter after returning 10.6% during the first quarter of 2013. With year-over-year earnings growth of 4.5% during the first quarter and expectations for second quarter growth of around 3%, the market seems more aligned with fundamentals. This is unlike the first quarter, when most of the return seems to have come from an increase in the price to earnings multiple, which in turn was driven by fading macroeconomic concerns. However, as evidenced by the market’s reaction in June to the Federal Reserve’s (Fed) hint of ending its bond buying, the market is walking on egg shells and still quite skeptical of fundamentals.
Given these conditions, looking forward over the next quarter we see a tight market price range as the most likely scenario. We see earnings and revenues growing at a tepid pace; slowly building confidence in the economic recovery. Much of the extreme skepticism in the market seems to have been released in the first quarter price to earnings multiple expansion and we believe that the market now seems to have a more “healthy” skepticism of fundamentals. The greatest risk we see to this scenario is a Fed policy change. Another risk is that earnings, sales, and other fundamental factors come in much better or worse than we expect.
| Distribution by Credit Quality | ||||
| as of June 30, 2013 | ||||
| Credit Rating * | Percentage of Net Assets | |||
| Aaa / AAA | 1.4 | % | ||
| Aa / AA | 1.1 | |||
| A | 4.3 | |||
| Baa / BBB | 4.1 | |||
| Ba / BB | 0.2 | |||
| Unrated | 0.0 | |||
| U.S. Government Agencies and Securities | 59.8 | |||
| Non-Debt Securities and Other Short-Term Instruments | 32.1 | |||
| Other Assets & Liabilities | (3.0 | ) | ||
| Total | 100.0 | % | ||
| * | Does not apply to the Fund itself. Based upon Moody’s and S&P long-term credit ratings for the Fund’s holdings as of the date noted. If Moody's and S&P assign different ratings to a holding, the lower rating is used. "Unrated" includes fixed-income securities (other than cash-like short-term instruments and U.S. Government securities) for which Moody’s and S&P have not issued long-term credit ratings. |
| 3 |
| Hartford Portfolio Diversifier HLS Fund |
| Manager Discussion – (continued) |
| June 30, 2013 (Unaudited) |
| Diversification by Industry | ||||
| as of June 30, 2013 | ||||
| Industry (Sector) | Percentage of Net Assets | |||
| Equity Securities | ||||
| Automobiles and Components (Consumer Discretionary) | 0.2 | % | ||
| Banks (Financials) | 0.6 | |||
| Capital Goods (Industrials) | 1.5 | |||
| Commercial and Professional Services (Industrials) | 0.1 | |||
| Consumer Durables and Apparel (Consumer Discretionary) | 0.2 | |||
| Consumer Services (Consumer Discretionary) | 0.4 | |||
| Diversified Financials (Financials) | 1.4 | |||
| Energy (Energy) | 2.1 | |||
| Food and Staples Retailing (Consumer Staples) | 0.5 | |||
| Food, Beverage and Tobacco (Consumer Staples) | 1.1 | |||
| Health Care Equipment and Services (Health Care) | 0.9 | |||
| Household and Personal Products (Consumer Staples) | 0.5 | |||
| Insurance (Financials) | 0.9 | |||
| Materials (Materials) | 0.6 | |||
| Media (Consumer Discretionary) | 0.8 | |||
| Other Investment Pools and Funds (Financials) | 0.3 | |||
| Pharmaceuticals, Biotechnology and Life Sciences (Health Care) | 1.7 | |||
| Real Estate (Financials) | 0.4 | |||
| Retailing (Consumer Discretionary) | 0.9 | |||
| Semiconductors and Semiconductor Equipment (Information Technology) | 0.4 | |||
| Software and Services (Information Technology) | 1.9 | |||
| Technology Hardware and Equipment (Information Technology) | 1.2 | |||
| Telecommunication Services (Services) | 0.6 | |||
| Transportation (Industrials) | 0.3 | |||
| Utilities (Utilities) | 0.7 | |||
| Total | 20.2 | % | ||
| Fixed Income Securities | ||||
| Administrative Waste Management and Remediation (Services) | 0.0 | % | ||
| Airport Revenues (Airport Revenues) | 0.0 | |||
| Arts, Entertainment and Recreation (Services) | 0.4 | |||
| Beverage and Tobacco Product Manufacturing (Consumer Staples) | 0.3 | |||
| Chemical Manufacturing (Basic Materials) | 0.2 | |||
| Computer and Electronic Product Manufacturing (Technology) | 0.3 | |||
| Construction (Consumer Cyclical) | 0.0 | |||
| Couriers and Messengers (Services) | 0.0 | |||
| Educational Services (Services) | 0.0 | |||
| Electrical Equipment and Appliance Manufacturing (Technology) | 0.1 | |||
| Finance and Insurance (Finance) | 4.5 | |||
| Food Manufacturing (Consumer Staples) | 0.2 | |||
| Food Services (Consumer Cyclical) | 0.0 | |||
| General Obligations (General Obligations) | 0.1 | |||
| Health Care and Social Assistance (Health Care) | 0.6 | |||
| Higher Education (Univ., Dorms, etc.) (Higher Education (Univ., Dorms, etc.)) | 0.0 | |||
| Information (Technology) | 0.7 | |||
| Machinery Manufacturing (Capital Goods) | 0.1 | |||
| Mining (Basic Materials) | 0.3 | |||
| Miscellaneous (Miscellaneous) | 0.0 | |||
| Miscellaneous Manufacturing (Capital Goods) | 0.2 | |||
| Motor Vehicle and Parts Manufacturing (Consumer Cyclical) | 0.0 | |||
| Other Services (Services) | 0.0 | |||
| Paper Manufacturing (Basic Materials) | 0.1 | |||
| Petroleum and Coal Products Manufacturing (Energy) | 0.8 | |||
| Pipeline Transportation (Utilities) | 0.2 | |||
| Primary Metal Manufacturing (Basic Materials) | 0.0 | |||
| Professional, Scientific and Technical Services (Services) | 0.1 | |||
| Public Administration (Services) | 0.0 | |||
| Rail Transportation (Transportation) | 0.1 | |||
| Real Estate, Rental and Leasing (Finance) | 0.1 | |||
| Retail Trade (Consumer Cyclical) | 0.3 | |||
| Soap, Cleaning Compound and Toilet Manufacturing (Consumer Staples) | 0.0 | |||
| Transportation (Transportation) | 0.1 | |||
| Transportation Equipment Manufacturing (Transportation) | 0.0 | |||
| Utilities (Utilities) | 0.5 | |||
| Utilities - Electric (Utilities - Electric) | 0.0 | |||
| Utilities - Water and Sewer (Utilities - Water and Sewer) | 0.0 | |||
| Wholesale Trade (Consumer Cyclical) | 0.0 | |||
| Total | 10.3 | % | ||
| Foreign Government Obligations | 0.8 | % | ||
| Put Options Purchased | 2.1 | |||
| U.S. Government Agencies | 12.5 | |||
| U.S. Government Securities | 15.5 | |||
| Short-Term Investments | 41.6 | |||
| Other Assets and Liabilities | (3.0 | ) | ||
| Total | 100.0 | % | ||
| 4 |
| Hartford Portfolio Diversifier HLS Fund |
| Schedule of Investments |
| June 30, 2013 (Unaudited) |
| (000’s Omitted) |
| Shares or Principal Amount | Market Value ╪ | |||||||
COMMON STOCKS - 19.9% | ||||||||
| Automobiles and Components - 0.2% | ||||||||
| 1 | BorgWarner, Inc. ● | $ | 56 | |||||
| 2 | Delphi Automotive plc | 83 | ||||||
| 22 | Ford Motor Co. | 341 | ||||||
| 4 | General Motors Co. ● | 144 | ||||||
| 1 | Goodyear (The) Tire & Rubber Co. ● | 21 | ||||||
| 1 | Harley-Davidson, Inc. | 69 | ||||||
| 4 | Johnson Controls, Inc. | 137 | ||||||
| 851 | ||||||||
| Banks - 0.6% | ||||||||
| 4 | BB&T Corp. | 133 | ||||||
| 1 | Comerica, Inc. | 42 | ||||||
| 5 | Fifth Third Bancorp | 89 | ||||||
| 3 | Hudson City Bancorp, Inc. | 24 | ||||||
| 5 | Huntington Bancshares, Inc. | 37 | ||||||
| 5 | KeyCorp | 57 | ||||||
| 1 | M&T Bank Corp. | 77 | ||||||
| 2 | People's United Financial, Inc. | 28 | ||||||
| 3 | PNC Financial Services Group, Inc. | 216 | ||||||
| 8 | Regions Financial Corp. | 76 | ||||||
| 3 | SunTrust Banks, Inc. | 95 | ||||||
| 10 | US Bancorp | 375 | ||||||
| 28 | Wells Fargo & Co. | 1,140 | ||||||
| 1 | Zions Bancorporation | 30 | ||||||
| 2,419 | ||||||||
| Capital Goods - 1.5% | ||||||||
| 4 | 3M Co. | 389 | ||||||
| 4 | Boeing Co. | 392 | ||||||
| 4 | Caterpillar, Inc. | 304 | ||||||
| 1 | Cummins, Inc. | 107 | ||||||
| 3 | Danaher Corp. | 207 | ||||||
| 2 | Deere & Co. | 177 | ||||||
| 1 | Dover Corp. | 75 | ||||||
| 3 | Eaton Corp. plc | 175 | ||||||
| 4 | Emerson Electric Co. | 220 | ||||||
| 2 | Fastenal Co. | 69 | ||||||
| 1 | Flowserve Corp. | 43 | ||||||
| 1 | Fluor Corp. | 54 | ||||||
| 2 | General Dynamics Corp. | 146 | ||||||
| 58 | General Electric Co. | 1,345 | ||||||
| 4 | Honeywell International, Inc. | 350 | ||||||
| 2 | Illinois Tool Works, Inc. | 161 | ||||||
| 2 | Ingersoll-Rand plc | 87 | ||||||
| 1 | Jacobs Engineering Group, Inc. ● | 40 | ||||||
| 1 | Joy Global, Inc. | 29 | ||||||
| 1 | L-3 Communications Holdings, Inc. | 43 | ||||||
| 1 | Lockheed Martin Corp. | 162 | ||||||
| 2 | Masco Corp. | 39 | ||||||
| 1 | Northrop Grumman Corp. | 109 | ||||||
| 2 | PACCAR, Inc. | 106 | ||||||
| 1 | Pall Corp. | 42 | ||||||
| 1 | Parker-Hannifin Corp. | 80 | ||||||
| 1 | Pentair Ltd. | 66 | ||||||
| 1 | Precision Castparts Corp. | 186 | ||||||
| 1 | Quanta Services, Inc. ● | 32 | ||||||
| 2 | Raytheon Co. | 120 | ||||||
| 1 | Rockwell Automation, Inc. | 65 | ||||||
| 1 | Rockwell Collins, Inc. | 48 | ||||||
| 1 | Roper Industries, Inc. | 69 | ||||||
| — | Snap-On, Inc. | 29 | ||||||
| 1 | Stanley Black & Decker, Inc. | 70 | ||||||
| 2 | Textron, Inc. | 41 | ||||||
| 5 | United Technologies Corp. | 441 | ||||||
| — | W.W. Grainger, Inc. | 84 | ||||||
| 1 | Xylem, Inc. | 28 | ||||||
| 6,230 | ||||||||
| Commercial and Professional Services - 0.1% | ||||||||
| 1 | ADT (The) Corp. | 49 | ||||||
| 1 | Avery Dennison Corp. | 24 | ||||||
| 1 | Cintas Corp. | 27 | ||||||
| — | Dun & Bradstreet Corp. | 22 | ||||||
| 1 | Equifax, Inc. ● | 40 | ||||||
| 1 | Iron Mountain, Inc. | 25 | ||||||
| 1 | Pitney Bowes, Inc. | 17 | ||||||
| 2 | Republic Services, Inc. | 56 | ||||||
| 1 | Robert Half International, Inc. | 26 | ||||||
| — | Stericycle, Inc. ● | 53 | ||||||
| 3 | Tyco International Ltd. | 86 | ||||||
| 2 | Waste Management, Inc. | 99 | ||||||
| 524 | ||||||||
| Consumer Durables and Apparel - 0.2% | ||||||||
| 2 | Coach, Inc. | 90 | ||||||
| 2 | D.R. Horton, Inc. | 33 | ||||||
| — | Fossil Group, Inc. ● | 31 | ||||||
| 1 | Garmin Ltd. | 22 | ||||||
| — | Harman International Industries, Inc. | 21 | ||||||
| 1 | Hasbro, Inc. | 29 | ||||||
| 1 | Leggett & Platt, Inc. | 25 | ||||||
| 1 | Lennar Corp. | 33 | ||||||
| 2 | Mattel, Inc. | 88 | ||||||
| 2 | Newell Rubbermaid, Inc. | 42 | ||||||
| 4 | NIKE, Inc. Class B | 259 | ||||||
| 2 | Pulte Group, Inc. ● | 36 | ||||||
| — | PVH Corp. | 57 | ||||||
| — | Ralph Lauren Corp. | 59 | ||||||
| — | V.F. Corp. | 95 | ||||||
| — | Whirlpool Corp. | 51 | ||||||
| 971 | ||||||||
| Consumer Services - 0.4% | ||||||||
| 2 | Carnival Corp. | 85 | ||||||
| — | Chipotle Mexican Grill, Inc. ● | 63 | ||||||
| 1 | Darden Restaurants, Inc. | 37 | ||||||
| 2 | H & R Block, Inc. | 42 | ||||||
| 1 | International Game Technology | 24 | ||||||
| 1 | Marriott International, Inc. Class A | 54 | ||||||
| 6 | McDonald's Corp. | 557 | ||||||
| 4 | Starbucks Corp. | 275 | ||||||
| 1 | Starwood Hotels & Resorts, Inc. | 69 | ||||||
| 1 | Wyndham Worldwide Corp. | 44 | ||||||
| — | Wynn Resorts Ltd. | 57 | ||||||
| 3 | Yum! Brands, Inc. | 175 | ||||||
| 1,482 | ||||||||
| Diversified Financials - 1.4% | ||||||||
| 5 | American Express Co. | 401 | ||||||
| 1 | Ameriprise Financial, Inc. | 91 | ||||||
| 60 | Bank of America Corp. | 777 | ||||||
| 7 | Bank of New York Mellon Corp. | 183 | ||||||
| 1 | BlackRock, Inc. | 180 | ||||||
| 3 | Capital One Financial Corp. | 206 | ||||||
The accompanying notes are an integral part of these financial statements.
| 5 |
| Hartford Portfolio Diversifier HLS Fund |
| Schedule of Investments – (continued) |
| June 30, 2013 (Unaudited) |
| (000’s Omitted) |
| Shares or Principal Amount | Market Value ╪ | |||||||
COMMON STOCKS - 19.9% - (continued) | ||||||||
| Diversified Financials - 1.4% - (continued) | ||||||||
| 6 | Charles Schwab Corp. | $ | 131 | |||||
| 17 | Citigroup, Inc. | 819 | ||||||
| 2 | CME Group, Inc. | 131 | ||||||
| 3 | Discover Financial Services, Inc. | 131 | ||||||
| 2 | E*Trade Financial Corp. ● | 20 | ||||||
| 1 | Franklin Resources, Inc. | 105 | ||||||
| 2 | Goldman Sachs Group, Inc. | 366 | ||||||
| — | IntercontinentalExchange, Inc. ● | 73 | ||||||
| 2 | Invesco Ltd. | 79 | ||||||
| 21 | JP Morgan Chase & Co. | 1,119 | ||||||
| 1 | Legg Mason, Inc. | 19 | ||||||
| 2 | Leucadia National Corp. | 43 | ||||||
| 1 | Moody's Corp. | 66 | ||||||
| 8 | Morgan Stanley | 188 | ||||||
| 1 | Nasdaq OMX Group, Inc. | 22 | ||||||
| 1 | Northern Trust Corp. | 71 | ||||||
| 1 | NYSE Euronext | 56 | ||||||
| 2 | SLM Corp. | 57 | ||||||
| 3 | State Street Corp. | 167 | ||||||
| 1 | T. Rowe Price Group, Inc. | 106 | ||||||
| 5,607 | ||||||||
| Energy - 2.1% | ||||||||
| 3 | Anadarko Petroleum Corp. | 242 | ||||||
| 2 | Apache Corp. | 184 | ||||||
| 2 | Baker Hughes, Inc. | 114 | ||||||
| 1 | Cabot Oil & Gas Corp. | 84 | ||||||
| 1 | Cameron International Corp. ● | 85 | ||||||
| 3 | Chesapeake Energy Corp. | 59 | ||||||
| 11 | Chevron Corp. | 1,287 | ||||||
| 7 | ConocoPhillips Holding Co. | 415 | ||||||
| 1 | Consol Energy, Inc. | 35 | ||||||
| 2 | Denbury Resources, Inc. ● | 36 | ||||||
| 2 | Devon Energy Corp. | 110 | ||||||
| — | Diamond Offshore Drilling, Inc. | 27 | ||||||
| 1 | Ensco plc | 76 | ||||||
| 2 | EOG Resources, Inc. | 201 | ||||||
| 1 | EQT Corp. | 67 | ||||||
| 25 | Exxon Mobil Corp. | 2,253 | ||||||
| 1 | FMC Technologies, Inc. ● | 74 | ||||||
| 5 | Halliburton Co. | 218 | ||||||
| 1 | Helmerich & Payne, Inc. | 37 | ||||||
| 2 | Hess Corp. | 111 | ||||||
| 4 | Kinder Morgan, Inc. | 135 | ||||||
| 4 | Marathon Oil Corp. | 138 | ||||||
| 2 | Marathon Petroleum Corp. | 130 | ||||||
| 1 | Murphy Oil Corp. | 62 | ||||||
| 2 | Nabors Industries Ltd. | 25 | ||||||
| 2 | National Oilwell Varco, Inc. | 165 | ||||||
| 1 | Newfield Exploration Co. ● | 18 | ||||||
| 1 | Noble Corp. | 53 | ||||||
| 2 | Noble Energy, Inc. | 121 | ||||||
| 5 | Occidental Petroleum Corp. | 403 | ||||||
| 2 | Peabody Energy Corp. | 22 | ||||||
| 3 | Phillips 66 | 205 | ||||||
| 1 | Pioneer Natural Resources Co. | 111 | ||||||
| 1 | QEP Resources, Inc. | 28 | ||||||
| 1 | Range Resources Corp. | 71 | ||||||
| 1 | Rowan Cos. plc Class A ● | 24 | ||||||
| 7 | Schlumberger Ltd. | 534 | ||||||
| 2 | Southwestern Energy Co. ● | 72 | ||||||
| 4 | Spectra Energy Corp. | 129 | ||||||
| 1 | Tesoro Corp. | 40 | ||||||
| 3 | Valero Energy Corp. | 106 | ||||||
| 4 | Williams Cos., Inc. | 124 | ||||||
| 1 | WPX Energy, Inc. ● | 21 | ||||||
| 8,452 | ||||||||
| Food and Staples Retailing - 0.5% | ||||||||
| 2 | Costco Wholesale Corp. | 271 | ||||||
| 7 | CVS Caremark Corp. | 392 | ||||||
| 3 | Kroger (The) Co. | 101 | ||||||
| 1 | Safeway, Inc. | 32 | ||||||
| 3 | Sysco Corp. | 114 | ||||||
| 5 | Walgreen Co. | 214 | ||||||
| 9 | Wal-Mart Stores, Inc. | 684 | ||||||
| 2 | Whole Foods Market, Inc. | 99 | ||||||
| 1,907 | ||||||||
| Food, Beverage and Tobacco - 1.1% | ||||||||
| 11 | Altria Group, Inc. | 394 | ||||||
| 4 | Archer-Daniels Midland Co. | 125 | ||||||
| 1 | Beam, Inc. | 57 | ||||||
| 1 | Brown-Forman Corp. | 58 | ||||||
| 1 | Campbell Soup Co. | 45 | ||||||
| 21 | Coca-Cola Co. | 862 | ||||||
| 1 | Coca-Cola Enterprises, Inc. | 51 | ||||||
| 2 | ConAgra Foods, Inc. | 82 | ||||||
| 1 | Constellation Brands, Inc. Class A ● | 45 | ||||||
| 1 | Dr. Pepper Snapple Group | 53 | ||||||
| 4 | General Mills, Inc. | 175 | ||||||
| 1 | Hershey Co. | 75 | ||||||
| 1 | Hormel Foods Corp. | 29 | ||||||
| 1 | J.M. Smucker Co. | 62 | ||||||
| 1 | Kellogg Co. | 91 | ||||||
| 3 | Kraft Foods Group, Inc. | 186 | ||||||
| 2 | Lorillard, Inc. | 93 | ||||||
| 1 | McCormick & Co., Inc. | 52 | ||||||
| 1 | Mead Johnson Nutrition Co. | 90 | ||||||
| 1 | Molson Coors Brewing Co. | 42 | ||||||
| 10 | Mondelez International, Inc. | 286 | ||||||
| 1 | Monster Beverage Corp. ● | 49 | ||||||
| 9 | PepsiCo, Inc. | 709 | ||||||
| 9 | Philip Morris International, Inc. | 794 | ||||||
| 2 | Reynolds American, Inc. | 86 | ||||||
| 2 | Tyson Foods, Inc. Class A | 41 | ||||||
| 4,632 | ||||||||
| Health Care Equipment and Services - 0.9% | ||||||||
| 9 | Abbott Laboratories | 305 | ||||||
| 2 | Aetna, Inc. | 135 | ||||||
| 1 | AmerisourceBergen Corp. | 72 | ||||||
| — | Bard (C.R.), Inc. | 46 | ||||||
| 3 | Baxter International, Inc. | 210 | ||||||
| 1 | Becton, Dickinson & Co. | 108 | ||||||
| 8 | Boston Scientific Corp. ● | 70 | ||||||
| 2 | Cardinal Health, Inc. | 90 | ||||||
| 1 | CareFusion Corp. ● | 45 | ||||||
| 1 | Cerner Corp. ● | 79 | ||||||
| 2 | CIGNA Corp. | 116 | ||||||
| 3 | Covidien plc | 166 | ||||||
| — | DaVita HealthCare Partners, Inc. ● | 57 | ||||||
The accompanying notes are an integral part of these financial statements.
| 6 |
| Shares or Principal Amount | Market Value ╪ | |||||||
COMMON STOCKS - 19.9% - (continued) | ||||||||
| Health Care Equipment and Services - 0.9% - (continued) | ||||||||
| 1 | Dentsply International, Inc. | $ | 33 | |||||
| 1 | Edwards Lifesciences Corp. ● | 43 | ||||||
| 5 | Express Scripts Holding Co. ● | 282 | ||||||
| 1 | Humana, Inc. | 74 | ||||||
| — | Intuitive Surgical, Inc. ● | 114 | ||||||
| 1 | Laboratory Corp. of America Holdings ● | 52 | ||||||
| 1 | McKesson Corp. | 146 | ||||||
| 6 | Medtronic, Inc. | 292 | ||||||
| — | Patterson Cos., Inc. | 18 | ||||||
| 1 | Quest Diagnostics, Inc. | 54 | ||||||
| 2 | St. Jude Medical, Inc. | 72 | ||||||
| 2 | Stryker Corp. | 104 | ||||||
| 1 | Tenet Healthcare Corp. ● | 27 | ||||||
| 6 | UnitedHealth Group, Inc. | 375 | ||||||
| 1 | Varian Medical Systems, Inc. ● | 41 | ||||||
| 2 | Wellpoint, Inc. | 138 | ||||||
| 1 | Zimmer Holdings, Inc. | 71 | ||||||
| 3,435 | ||||||||
| Household and Personal Products - 0.5% | ||||||||
| 2 | Avon Products, Inc. | 51 | ||||||
| 1 | Clorox Co. | 61 | ||||||
| 5 | Colgate-Palmolive Co. | 282 | ||||||
| 1 | Estee Lauder Co., Inc. | 89 | ||||||
| 2 | Kimberly-Clark Corp. | 210 | ||||||
| 15 | Procter & Gamble Co. | 1,183 | ||||||
| 1,876 | ||||||||
| Insurance - 0.9% | ||||||||
| 2 | ACE Ltd. | 173 | ||||||
| 3 | Aflac, Inc. | 160 | ||||||
| 3 | Allstate Corp. | 128 | ||||||
| 8 | American International Group, Inc. ● | 375 | ||||||
| 2 | Aon plc | 112 | ||||||
| — | Assurant, Inc. | 22 | ||||||
| 10 | Berkshire Hathaway, Inc. Class B ● | 1,161 | ||||||
| 1 | Chubb Corp. | 125 | ||||||
| 1 | Cincinnati Financial Corp. | 38 | ||||||
| 3 | Genworth Financial, Inc. ● | 32 | ||||||
| 2 | Lincoln National Corp. | 58 | ||||||
| 2 | Loews Corp. | 78 | ||||||
| 3 | Marsh & McLennan Cos., Inc. | 123 | ||||||
| 6 | MetLife, Inc. | 295 | ||||||
| 2 | Principal Financial Group, Inc. | 61 | ||||||
| 3 | Progressive Corp. | 80 | ||||||
| 3 | Prudential Financial, Inc. | 201 | ||||||
| 1 | Torchmark Corp. | 36 | ||||||
| 2 | Travelers Cos., Inc. | 171 | ||||||
| 2 | Unum Group | 46 | ||||||
| 2 | XL Group plc | 50 | ||||||
| 3,525 | ||||||||
| Materials - 0.6% | ||||||||
| 1 | Air Products & Chemicals, Inc. | 107 | ||||||
| — | Airgas, Inc. | 35 | ||||||
| 6 | Alcoa, Inc. | 47 | ||||||
| 1 | Allegheny Technologies, Inc. | 16 | ||||||
| 1 | Ball Corp. | 35 | ||||||
| 1 | Bemis Co., Inc. | 23 | ||||||
| — | CF Industries Holdings, Inc. | 57 | ||||||
| 1 | Cliff's Natural Resources, Inc. | 14 | ||||||
| 7 | Dow Chemical Co. | 218 | ||||||
| 5 | E.I. DuPont de Nemours & Co. | 271 | ||||||
| 1 | Eastman Chemical Co. | 61 | ||||||
| 1 | Ecolab, Inc. | 127 | ||||||
| 1 | FMC Corp. | 47 | ||||||
| 6 | Freeport-McMoRan Copper & Gold, Inc. | 161 | ||||||
| — | International Flavors & Fragrances, Inc. | 34 | ||||||
| 2 | International Paper Co. | 111 | ||||||
| 2 | LyondellBasell Industries Class A | 141 | ||||||
| 1 | MeadWestvaco Corp. | 34 | ||||||
| 3 | Monsanto Co. | 296 | ||||||
| 2 | Mosaic Co. | 83 | ||||||
| 3 | Newmont Mining Corp. | 83 | ||||||
| 2 | Nucor Corp. | 77 | ||||||
| 1 | Owens-Illinois, Inc. ● | 26 | ||||||
| 1 | PPG Industries, Inc. | 117 | ||||||
| 2 | Praxair, Inc. | 191 | ||||||
| 1 | Sealed Air Corp. | 26 | ||||||
| — | Sherwin-Williams Co. | 85 | ||||||
| 1 | Sigma-Aldrich Corp. | 54 | ||||||
| 1 | United States Steel Corp. | 14 | ||||||
| 1 | Vulcan Materials Co. | 35 | ||||||
| 2,626 | ||||||||
| Media - 0.8% | ||||||||
| 1 | Cablevision Systems Corp. | 20 | ||||||
| 3 | CBS Corp. Class B | 156 | ||||||
| 15 | Comcast Corp. Class A | 619 | ||||||
| 3 | DirecTV ● | 193 | ||||||
| 1 | Discovery Communications, Inc. ● | 106 | ||||||
| 1 | Gannett Co., Inc. | 31 | ||||||
| 2 | Interpublic Group of Cos., Inc. | 35 | ||||||
| 2 | McGraw Hill Financial, Inc. | 82 | ||||||
| 11 | News Corp. Class A | 364 | ||||||
| 1 | Omnicom Group, Inc. | 91 | ||||||
| — | Scripps Networks Interactive Class A | 32 | ||||||
| 7 | Time Warner Cable, Inc. | 486 | ||||||
| 3 | Viacom, Inc. Class B | 170 | ||||||
| 10 | Walt Disney Co. | 638 | ||||||
| — | Washington Post Co. Class B | 12 | ||||||
| 3,035 | ||||||||
| Pharmaceuticals, Biotechnology and Life Sciences - 1.7% | ||||||||
| 9 | Abbvie Inc. | 367 | ||||||
| 1 | Actavis, Inc. ● | 90 | ||||||
| 2 | Agilent Technologies, Inc. | 83 | ||||||
| 1 | Alexion Pharmaceuticals, Inc. ● | 101 | ||||||
| 2 | Allergan, Inc. | 140 | ||||||
| 4 | Amgen, Inc. | 415 | ||||||
| 1 | Biogen Idec, Inc. ● | 286 | ||||||
| 9 | Bristol-Myers Squibb Co. | 412 | ||||||
| 2 | Celgene Corp. ● | 273 | ||||||
| 6 | Eli Lilly & Co. | 273 | ||||||
| 1 | Forest Laboratories, Inc. ● | 54 | ||||||
| 9 | Gilead Sciences, Inc. ● | 438 | ||||||
| 1 | Hospira, Inc. ● | 36 | ||||||
| 16 | Johnson & Johnson | 1,353 | ||||||
| 1 | Life Technologies Corp. ● | 72 | ||||||
| 17 | Merck & Co., Inc. | 787 | ||||||
| 2 | Mylan, Inc. ● | 66 | ||||||
The accompanying notes are an integral part of these financial statements.
| 7 |
| Hartford Portfolio Diversifier HLS Fund |
| Schedule of Investments – (continued) |
| June 30, 2013 (Unaudited) |
| (000’s Omitted) |
| Shares or Principal Amount | Market Value ╪ | |||||||
COMMON STOCKS - 19.9% - (continued) | ||||||||
| Pharmaceuticals, Biotechnology and Life Sciences - 1.7% - (continued) | ||||||||
| 1 | PerkinElmer, Inc. | $ | 20 | |||||
| — | Perrigo Co. | 60 | ||||||
| 37 | Pfizer, Inc. | 1,048 | ||||||
| — | Regeneron Pharmaceuticals, Inc. ● | 96 | ||||||
| 2 | Thermo Fisher Scientific, Inc. | 170 | ||||||
| — | Waters Corp. ● | 48 | ||||||
| 3 | Zoetis, Inc. | 87 | ||||||
| 6,775 | ||||||||
| Real Estate - 0.4% | ||||||||
| 2 | American Tower Corp. REIT | 162 | ||||||
| 1 | Apartment Investment & Management Co. Class A REIT | 25 | ||||||
| 1 | AvalonBay Communities, Inc. REIT | 92 | ||||||
| 1 | Boston Properties, Inc. REIT | 90 | ||||||
| 2 | CBRE Group, Inc. ● | 40 | ||||||
| 2 | Equity Residential Properties Trust REIT | 104 | ||||||
| 3 | HCP, Inc. REIT | 116 | ||||||
| 2 | Health Care, Inc. REIT | 107 | ||||||
| 4 | Host Hotels & Resorts, Inc. REIT | 71 | ||||||
| 2 | Kimco Realty Corp. REIT | 49 | ||||||
| 1 | Macerich Co. REIT | 47 | ||||||
| 1 | Plum Creek Timber Co., Inc. REIT | 43 | ||||||
| 3 | ProLogis L.P. REIT | 105 | ||||||
| 1 | Public Storage REIT | 124 | ||||||
| 2 | Simon Property Group, Inc. REIT | 275 | ||||||
| 2 | Ventas, Inc. REIT | 114 | ||||||
| 1 | Vornado Realty Trust REIT | 79 | ||||||
| 3 | Weyerhaeuser Co. REIT | 92 | ||||||
| 1,735 | ||||||||
| Retailing - 0.9% | ||||||||
| — | Abercrombie & Fitch Co. Class A | 20 | ||||||
| 2 | Amazon.com, Inc. ● | 567 | ||||||
| — | AutoNation, Inc. ● | 9 | ||||||
| — | AutoZone, Inc. ● | 86 | ||||||
| 1 | Bed Bath & Beyond, Inc. ● | 87 | ||||||
| 2 | Best Buy Co., Inc. | 41 | ||||||
| 1 | CarMax, Inc. ● | 58 | ||||||
| 2 | Dollar General Corp. ● | 85 | ||||||
| 1 | Dollar Tree, Inc. ● | 64 | ||||||
| 1 | Expedia, Inc. | 31 | ||||||
| 1 | Family Dollar Stores, Inc. | 33 | ||||||
| 1 | GameStop Corp. Class A | 28 | ||||||
| 2 | Gap, Inc. | 68 | ||||||
| 1 | Genuine Parts Co. | 68 | ||||||
| 8 | Home Depot, Inc. | 635 | ||||||
| 1 | J. C. Penney Co., Inc. ● | 14 | ||||||
| 1 | Kohl's Corp. | 58 | ||||||
| 1 | L Brands Inc. | 66 | ||||||
| 6 | Lowe's Cos., Inc. | 246 | ||||||
| 2 | Macy's, Inc. | 103 | ||||||
| — | Netflix, Inc. ● | 67 | ||||||
| 1 | Nordstrom, Inc. | 50 | ||||||
| 1 | O'Reilly Automotive, Inc. ● | 70 | ||||||
| 1 | PetSmart, Inc. | 39 | ||||||
| — | Priceline.com, Inc. ● | 239 | ||||||
| 1 | Ross Stores, Inc. | 80 | ||||||
| 4 | Staples, Inc. | 59 | ||||||
| 4 | Target Corp. | 248 | ||||||
| 1 | Tiffany & Co. | 49 | ||||||
| 4 | TJX Cos., Inc. | 202 | ||||||
| 1 | TripAdvisor, Inc. ● | 38 | ||||||
| 1 | Urban Outfitters, Inc. ● | 25 | ||||||
| 3,533 | ||||||||
| Semiconductors and Semiconductor Equipment - 0.4% | ||||||||
| 3 | Advanced Micro Devices, Inc. ● | 14 | ||||||
| 2 | Altera Corp. | 59 | ||||||
| 2 | Analog Devices, Inc. | 78 | ||||||
| 7 | Applied Materials, Inc. | 100 | ||||||
| 3 | Broadcom Corp. Class A | 99 | ||||||
| — | First Solar, Inc. ● | 17 | ||||||
| 28 | Intel Corp. | 675 | ||||||
| 1 | KLA-Tencor Corp. | 52 | ||||||
| 1 | Lam Research Corp. ● | 40 | ||||||
| 1 | Linear Technology Corp. | 48 | ||||||
| 3 | LSI Corp. ● | 22 | ||||||
| 1 | Microchip Technology, Inc. | 41 | ||||||
| 6 | Micron Technology, Inc. ● | 83 | ||||||
| 3 | NVIDIA Corp. | 46 | ||||||
| 1 | Teradyne, Inc. ● | 19 | ||||||
| 6 | Texas Instruments, Inc. | 217 | ||||||
| 1 | Xilinx, Inc. | 59 | ||||||
| 1,669 | ||||||||
| Software and Services - 1.9% | ||||||||
| 4 | Accenture plc | 262 | ||||||
| 3 | Adobe Systems, Inc. ● | 128 | ||||||
| 1 | Akamai Technologies, Inc. ● | 42 | ||||||
| 1 | Autodesk, Inc. ● | 43 | ||||||
| 3 | Automatic Data Processing, Inc. | 187 | ||||||
| 1 | BMC Software, Inc. ● | 34 | ||||||
| 2 | CA, Inc. | 53 | ||||||
| 1 | Citrix Systems, Inc. ● | 63 | ||||||
| 2 | Cognizant Technology Solutions Corp. ● | 106 | ||||||
| 1 | Computer Sciences Corp. | 37 | ||||||
| 7 | eBay, Inc. ● | 339 | ||||||
| 2 | Electronic Arts, Inc. ● | 39 | ||||||
| 2 | Fidelity National Information Services, Inc. | 71 | ||||||
| 1 | Fiserv, Inc. ● | 65 | ||||||
| 2 | Google, Inc. ● | 1,327 | ||||||
| 6 | IBM Corp. | 1,117 | ||||||
| 2 | Intuit, Inc. | 96 | ||||||
| 1 | Mastercard, Inc. | 337 | ||||||
| 42 | Microsoft Corp. | 1,455 | ||||||
| 21 | Oracle Corp. | 633 | ||||||
| 2 | Paychex, Inc. | 66 | ||||||
| 1 | Red Hat, Inc. ● | 51 | ||||||
| 2 | SAIC, Inc. | 22 | ||||||
| 3 | Salesforce.com, Inc. ● | 116 | ||||||
| 4 | Symantec Corp. | 88 | ||||||
| 1 | Teradata Corp. ● | 46 | ||||||
| 1 | Total System Services, Inc. | 22 | ||||||
| 1 | VeriSign, Inc. ● | 38 | ||||||
| 3 | Visa, Inc. | 519 | ||||||
| 3 | Western Union Co. | 54 | ||||||
| 5 | Yahoo!, Inc. ● | 134 | ||||||
| 7,590 | ||||||||
| Technology Hardware and Equipment - 1.2% | ||||||||
| 1 | Amphenol Corp. Class A | 70 | ||||||
The accompanying notes are an integral part of these financial statements.
| 8 |
| Shares or Principal Amount | Market Value ╪ | |||||||
COMMON STOCKS - 19.9% - (continued) | ||||||||
| Technology Hardware and Equipment - 1.2% - (continued) | ||||||||
| 5 | Apple, Inc. | $ | 2,085 | |||||
| 30 | Cisco Systems, Inc. | 729 | ||||||
| 8 | Corning, Inc. | 118 | ||||||
| 8 | Dell, Inc. | 110 | ||||||
| 12 | EMC Corp. | 278 | ||||||
| — | F5 Networks, Inc. ● | 30 | ||||||
| 1 | FLIR Systems, Inc. | 22 | ||||||
| 1 | Harris Corp. | 30 | ||||||
| 11 | Hewlett-Packard Co. | 268 | ||||||
| 1 | Jabil Circuit, Inc. | 21 | ||||||
| 1 | JDS Uniphase Corp. ● | 19 | ||||||
| 3 | Juniper Networks, Inc. ● | 55 | ||||||
| 1 | Molex, Inc. | 23 | ||||||
| 2 | Motorola Solutions, Inc. | 88 | ||||||
| 2 | NetApp, Inc. ● | 76 | ||||||
| 10 | Qualcomm, Inc. | 592 | ||||||
| 1 | SanDisk Corp. ● | 83 | ||||||
| 2 | Seagate Technology plc | 80 | ||||||
| 2 | TE Connectivity Ltd. | 106 | ||||||
| 1 | Western Digital Corp. | 74 | ||||||
| 7 | Xerox Corp. | 63 | ||||||
| 5,020 | ||||||||
| Telecommunication Services - 0.6% | ||||||||
| 30 | AT&T, Inc. | 1,068 | ||||||
| 3 | CenturyLink, Inc. | 121 | ||||||
| 2 | Crown Castle International Corp. ● | 119 | ||||||
| 6 | Frontier Communications Co. | 23 | ||||||
| 17 | Sprint Nextel Corp. ● | 119 | ||||||
| 16 | Verizon Communications, Inc. | 808 | ||||||
| 3 | Windstream Corp. | 25 | ||||||
| 2,283 | ||||||||
| Transportation - 0.3% | ||||||||
| 1 | C.H. Robinson Worldwide, Inc. | 51 | ||||||
| 6 | CSX Corp. | 133 | ||||||
| 1 | Expeditors International of Washington, Inc. | 44 | ||||||
| 2 | FedEx Corp. | 163 | ||||||
| 1 | Kansas City Southern | 65 | ||||||
| 2 | Norfolk Southern Corp. | 128 | ||||||
| — | Ryder System, Inc. | 18 | ||||||
| 4 | Southwest Airlines Co. | 52 | ||||||
| 3 | Union Pacific Corp. | 404 | ||||||
| 4 | United Parcel Service, Inc. Class B | 345 | ||||||
| 1,403 | ||||||||
| Utilities - 0.7% | ||||||||
| 3 | AES (The) Corp. | 42 | ||||||
| 1 | AGL Resources, Inc. | 28 | ||||||
| 1 | Ameren Corp. | 47 | ||||||
| 3 | American Electric Power Co., Inc. | 122 | ||||||
| 2 | CenterPoint Energy, Inc. | 56 | ||||||
| 1 | CMS Energy Corp. | 41 | ||||||
| 2 | Consolidated Edison, Inc. | 96 | ||||||
| 3 | Dominion Resources, Inc. | 184 | ||||||
| 1 | DTE Energy Co. | 65 | ||||||
| 4 | Duke Energy Corp. | 267 | ||||||
| 2 | Edison International | 88 | ||||||
| 1 | Entergy Corp. | 70 | ||||||
| 5 | Exelon Corp. | 148 | ||||||
| 2 | FirstEnergy Corp. | 88 | ||||||
| — | Integrys Energy Group, Inc. | 26 | ||||||
| 2 | NextEra Energy, Inc. | 194 | ||||||
| 2 | NiSource, Inc. | 50 | ||||||
| 2 | Northeast Utilities | 74 | ||||||
| 2 | NRG Energy, Inc. | 48 | ||||||
| 1 | Oneok, Inc. | 48 | ||||||
| 1 | Pepco Holdings, Inc. | 28 | ||||||
| 2 | PG&E Corp. | 113 | ||||||
| 1 | Pinnacle West Capital Corp. | 34 | ||||||
| 3 | PPL Corp. | 101 | ||||||
| 3 | Public Service Enterprise Group, Inc. | 93 | ||||||
| 1 | SCANA Corp. | 38 | ||||||
| 1 | Sempra Energy | 103 | ||||||
| 5 | Southern Co. | 215 | ||||||
| 1 | TECO Energy, Inc. | 20 | ||||||
| 1 | Wisconsin Energy Corp. | 53 | ||||||
| 3 | Xcel Energy, Inc. | 79 | ||||||
| 2,659 | ||||||||
| Total common stocks | ||||||||
| (cost $70,303) | $ | 80,239 | ||||||
EXCHANGE TRADED FUNDS - 0.3% | ||||||||
| Other Investment Pools and Funds - 0.3% | ||||||||
| 18 | Vanguard S&P 500 ETF | $ | 1,308 | |||||
| Total exchange traded funds | ||||||||
| (cost $1,319) | $ | 1,308 | ||||||
ASSET & COMMERCIAL MORTGAGE BACKED SECURITIES - 0.8% | ||||||||
| Finance and Insurance - 0.8% | ||||||||
| Ally Automotive Receivables Trust | ||||||||
| $ | 20 | 0.93%, 02/16/2016 | $ | 20 | ||||
| Banc of America Commercial Mortgage, Inc. | ||||||||
| 25 | 5.41%, 09/10/2047 | 28 | ||||||
| 25 | 5.45%, 01/15/2049 | 28 | ||||||
| 20 | 5.49%, 02/10/2051 Δ | 22 | ||||||
| 65 | 5.62%, 04/10/2049 - 06/10/2049 Δ | 73 | ||||||
| 60 | 5.68%, 07/10/2046 | 66 | ||||||
| 15 | 5.73%, 05/10/2045 Δ | 17 | ||||||
| 10 | 5.74%, 02/10/2051 Δ | 11 | ||||||
| 25 | 5.89%, 07/10/2044 Δ | 28 | ||||||
| Bear Stearns Commercial Mortgage Securities, Inc. | ||||||||
| 60 | 5.20%, 12/11/2038 | 66 | ||||||
| 25 | 5.33%, 02/11/2044 | 27 | ||||||
| 25 | 5.70%, 06/13/2050 | 28 | ||||||
| Chase Issuance Trust | ||||||||
| 150 | 0.79%, 06/15/2017 | 150 | ||||||
| 100 | 1.30%, 02/18/2020 | 98 | ||||||
| Citibank Credit Card Issuance Trust | ||||||||
| 110 | 4.85%, 03/10/2017 | 118 | ||||||
| 100 | 5.65%, 09/20/2019 | 116 | ||||||
| Citigroup Commercial Mortgage Trust | ||||||||
| 35 | 5.70%, 12/10/2049 Δ | 40 | ||||||
| 20 | 6.13%, 12/10/2049 Δ | 23 | ||||||
The accompanying notes are an integral part of these financial statements.
| 9 |
| Hartford Portfolio Diversifier HLS Fund |
| Schedule of Investments – (continued) |
| June 30, 2013 (Unaudited) |
| (000’s Omitted) |
| Shares or Principal Amount | Market Value ╪ | |||||||
ASSET & COMMERCIAL MORTGAGE BACKED SECURITIES - 0.8% - (continued) | ||||||||
| Finance and Insurance - 0.8% - (continued) | ||||||||
| Citigroup/Deutsche Bank Commercial Mortgage Trust | ||||||||
| $ | 35 | 5.22%, 07/15/2044 Δ | $ | 38 | ||||
| 25 | 5.32%, 12/11/2049 | 28 | ||||||
| 25 | 5.62%, 10/15/2048 | 28 | ||||||
| 34 | 5.89%, 11/15/2044 | 39 | ||||||
| Commercial Mortgage Pass-Through Certificates | ||||||||
| 20 | 5.31%, 12/10/2046 | 22 | ||||||
| 25 | 5.75%, 06/10/2046 Δ | 27 | ||||||
| 15 | 5.80%, 12/10/2049 Δ | 17 | ||||||
| Community or Commercial Mortgage Trust | ||||||||
| 15 | 2.94%, 01/10/2046 | 14 | ||||||
| Credit Suisse Mortgage Capital Certificates | ||||||||
| 25 | 5.31%, 12/15/2039 | 27 | ||||||
| 50 | 5.40%, 02/15/2039 Δ | 55 | ||||||
| 29 | 5.47%, 09/15/2039 | 32 | ||||||
| 25 | 5.68%, 06/15/2039 Δ | 28 | ||||||
| CS First Boston Mortgage Securities Corp. | ||||||||
| 80 | 5.10%, 08/15/2038 | 85 | ||||||
| CW Capital Cobalt Ltd. | ||||||||
| 40 | 5.22%, 08/15/2048 | 43 | ||||||
| 25 | 5.48%, 04/15/2047 | 28 | ||||||
| 25 | 5.79%, 05/15/2046 Δ | 28 | ||||||
| Ford Credit Automotive Owner Trust | ||||||||
| 100 | 0.78%, 05/15/2018 | 99 | ||||||
| GE Capital Commercial Mortgage Corp. | ||||||||
| 30 | 5.54%, 12/10/2049 | 33 | ||||||
| Goldman Sachs Mortgage Securities Corp. | ||||||||
| 45 | 5.79%, 08/10/2045 Δ | 50 | ||||||
| Goldman Sachs Mortgage Securities Corp. II | ||||||||
| 35 | 4.75%, 07/10/2039 | 37 | ||||||
| 15 | 5.40%, 08/10/2038 | 15 | ||||||
| 25 | 5.56%, 11/10/2039 | 28 | ||||||
| Goldman Sachs Mortgage Securities Trust | ||||||||
| 10 | 2.94%, 02/10/2046 | 9 | ||||||
| 20 | 3.48%, 01/10/2045 | 20 | ||||||
| Greenwich Capital Commercial Funding Corp. | ||||||||
| 40 | 5.22%, 04/10/2037 Δ | 43 | ||||||
| 35 | 5.44%, 03/10/2039 Δ | 39 | ||||||
| 25 | 5.74%, 12/10/2049 | 28 | ||||||
| 50 | 5.86%, 07/10/2038 Δ | 55 | ||||||
| Honda Automotive Receivables Owner Trust | ||||||||
| 75 | 0.77%, 01/15/2016 | 75 | ||||||
| JP Morgan Chase Commercial Mortgage Securities Corp. | ||||||||
| 10 | 4.17%, 08/15/2046 | 10 | ||||||
| 25 | 5.20%, 12/15/2044 Δ | 27 | ||||||
| 25 | 5.34%, 05/15/2047 | 28 | ||||||
| 20 | 5.42%, 01/15/2049 | 22 | ||||||
| 40 | 5.43%, 12/12/2043 | 44 | ||||||
| 35 | 5.44%, 06/12/2047 Δ | 39 | ||||||
| 20 | 5.48%, 12/12/2044 Δ | 22 | ||||||
| 20 | 5.71%, 02/12/2049 Δ | 22 | ||||||
| 38 | 5.79%, 02/12/2051 Δ | 43 | ||||||
| 30 | 5.81%, 06/12/2043 | 33 | ||||||
| 25 | 5.81%, 06/15/2049 Δ | 28 | ||||||
| 100 | 5.86%, 04/15/2045 Δ | 110 | ||||||
| 30 | 5.88%, 02/15/2051 Δ | 34 | ||||||
| LB-UBS Commercial Mortgage Trust | ||||||||
| 25 | 5.37%, 09/15/2039 Δ | 28 | ||||||
| 60 | 5.42%, 02/15/2040 | 67 | ||||||
| 20 | 5.43%, 02/15/2040 | 22 | ||||||
| 25 | 5.86%, 07/15/2040 Δ | 28 | ||||||
| 19 | 5.87%, 09/15/2045 | 21 | ||||||
| 10 | 5.87%, 06/15/2038 Δ | 11 | ||||||
| Merrill Lynch/Countrywide Commercial Mortgage Trust | ||||||||
| 25 | 5.17%, 12/12/2049 Δ | 27 | ||||||
| 25 | 5.38%, 08/12/2048 | 27 | ||||||
| 40 | 5.70%, 09/12/2049 | 45 | ||||||
| 35 | 5.89%, 06/12/2046 Δ | 39 | ||||||
| Morgan Stanley Capital I | ||||||||
| 80 | 4.99%, 08/13/2042 | 85 | ||||||
| 50 | 5.33%, 12/15/2043 | 55 | ||||||
| 36 | 5.68%, 10/15/2042 Δ | 40 | ||||||
| 25 | 5.69%, 04/15/2049 Δ | 28 | ||||||
| 25 | 5.81%, 12/12/2049 | 28 | ||||||
| 25 | 5.89%, 06/11/2049 Δ | 28 | ||||||
| Wachovia Bank Commercial Mortgage Trust | ||||||||
| 25 | 5.29%, 12/15/2044 Δ | 27 | ||||||
| 25 | 5.31%, 11/15/2048 | 28 | ||||||
| 25 | 5.34%, 12/15/2043 | 28 | ||||||
| 23 | 5.42%, 01/15/2045 Δ | 25 | ||||||
| 25 | 5.51%, 04/15/2047 | 27 | ||||||
| 40 | 5.57%, 10/15/2048 | 44 | ||||||
| 25 | 5.68%, 05/15/2046 | 28 | ||||||
| 25 | 5.74%, 06/15/2049 Δ | 28 | ||||||
| WF-RBS Commercial Mortgage Trust | ||||||||
| 40 | 2.88%, 12/15/2045 | 37 | ||||||
| 3,342 | ||||||||
| Total asset & commercial mortgage backed securities | ||||||||
| (cost $3,346) | $ | 3,342 | ||||||
CORPORATE BONDS - 9.3% | ||||||||
| Administrative Waste Management and Remediation - 0.0% | ||||||||
| Republic Services, Inc. | ||||||||
| $ | 95 | 5.00%, 03/01/2020 | $ | 104 | ||||
| Arts, Entertainment and Recreation - 0.4% | ||||||||
| CBS Corp. | ||||||||
| 25 | 7.88%, 07/30/2030 | 32 | ||||||
| Comcast Corp. | ||||||||
| 50 | 4.65%, 07/15/2042 | 48 | ||||||
| 225 | 5.15%, 03/01/2020 | 257 | ||||||
| 55 | 7.05%, 03/15/2033 | 69 | ||||||
| DirecTV Holdings LLC | ||||||||
| 30 | 3.50%, 03/01/2016 | 32 | ||||||
| 145 | 5.00%, 03/01/2021 | 153 | ||||||
| 25 | 5.15%, 03/15/2042 | 22 | ||||||
| Discovery Communications, Inc. | ||||||||
| 15 | 4.88%, 04/01/2043 | 14 | ||||||
| 85 | 5.05%, 06/01/2020 | 94 | ||||||
The accompanying notes are an integral part of these financial statements.
| 10 |
| Shares or Principal Amount | Market Value ╪ | |||||||
CORPORATE BONDS - 9.3% - (continued) | ||||||||
| Arts, Entertainment and Recreation - 0.4% - (continued) | ||||||||
| NBC Universal Media LLC | ||||||||
| $ | 125 | 4.38%, 04/01/2021 | $ | 135 | ||||
| News America, Inc. | ||||||||
| 105 | 4.50%, 02/15/2021 | 112 | ||||||
| 86 | 6.40%, 12/15/2035 | 96 | ||||||
| Time Warner Cable, Inc. | ||||||||
| 255 | 4.00%, 09/01/2021 | 244 | ||||||
| 130 | 4.88%, 03/15/2020 | 142 | ||||||
| 85 | 6.50%, 11/15/2036 | 96 | ||||||
| 65 | 6.75%, 07/01/2018 | 74 | ||||||
| Viacom, Inc. | ||||||||
| 48 | 4.38%, 03/15/2043 ■ | 41 | ||||||
| Walt Disney Co. | ||||||||
| 35 | 4.13%, 12/01/2041 | 33 | ||||||
| 50 | 5.63%, 09/15/2016 | 57 | ||||||
| 1,751 | ||||||||
| Beverage and Tobacco Product Manufacturing - 0.3% | ||||||||
| Altria Group, Inc. | ||||||||
| 200 | 4.75%, 05/05/2021 | 214 | ||||||
| 9 | 9.70%, 11/10/2018 | 12 | ||||||
| Anheuser-Busch InBev Worldwide, Inc. | ||||||||
| 45 | 3.75%, 07/15/2042 | 39 | ||||||
| 250 | 5.38%, 01/15/2020 | 288 | ||||||
| Coca-Cola Co. | ||||||||
| 90 | 1.65%, 03/14/2018 | 89 | ||||||
| 30 | 3.15%, 11/15/2020 | 31 | ||||||
| Diageo Capital plc | ||||||||
| 50 | 3.88%, 04/29/2043 | 44 | ||||||
| 75 | 5.50%, 09/30/2016 | 85 | ||||||
| Dr. Pepper Snapple Group | ||||||||
| 40 | 2.90%, 01/15/2016 | 42 | ||||||
| PepsiCo, Inc. | ||||||||
| 180 | 3.13%, 11/01/2020 | 183 | ||||||
| 30 | 5.50%, 01/15/2040 | 34 | ||||||
| Philip Morris International, Inc. | ||||||||
| 130 | 4.50%, 03/26/2020 - 03/20/2042 | 140 | ||||||
| 1,201 | ||||||||
| Chemical Manufacturing - 0.2% | ||||||||
| Dow Chemical Co. | ||||||||
| 150 | 4.13%, 11/15/2021 | 153 | ||||||
| 90 | 8.55%, 05/15/2019 | 115 | ||||||
| E.I. DuPont de Nemours & Co. | ||||||||
| 160 | 3.63%, 01/15/2021 | 167 | ||||||
| 20 | 5.60%, 12/15/2036 | 23 | ||||||
| Ecolab, Inc. | ||||||||
| 95 | 4.35%, 12/08/2021 | 100 | ||||||
| Potash Corp. of Saskatchewan, Inc. | ||||||||
| 35 | 6.50%, 05/15/2019 | 42 | ||||||
| PPG Industries, Inc. | ||||||||
| 20 | 3.60%, 11/15/2020 | 21 | ||||||
| Praxair, Inc. | ||||||||
| 55 | 2.45%, 02/15/2022 | 52 | ||||||
| 25 | 5.38%, 11/01/2016 | 28 | ||||||
| 701 | ||||||||
| Computer and Electronic Product Manufacturing - 0.3% | ||||||||
| Apple, Inc. | ||||||||
| 210 | 2.40%, 05/03/2023 | 195 | ||||||
| Cingular Wireless LLC | ||||||||
| 25 | 7.13%, 12/15/2031 | 32 | ||||||
| Cisco Systems, Inc. | ||||||||
| 220 | 4.45%, 01/15/2020 | 243 | ||||||
| 40 | 5.50%, 02/22/2016 | 45 | ||||||
| Hewlett-Packard Co. | ||||||||
| 45 | 4.30%, 06/01/2021 | 44 | ||||||
| 170 | 5.50%, 03/01/2018 | 188 | ||||||
| Intel Corp. | ||||||||
| 90 | 2.70%, 12/15/2022 | 84 | ||||||
| 50 | 3.30%, 10/01/2021 | 50 | ||||||
| Lockheed Martin Corp. | ||||||||
| 80 | 4.25%, 11/15/2019 | 87 | ||||||
| 15 | 4.85%, 09/15/2041 | 15 | ||||||
| Raytheon Co. | ||||||||
| 95 | 3.13%, 10/15/2020 | 96 | ||||||
| Texas Instruments, Inc. | ||||||||
| 25 | 2.38%, 05/16/2016 | 26 | ||||||
| Thermo Fisher Scientific, Inc. | ||||||||
| 155 | 2.25%, 08/15/2016 | 157 | ||||||
| 1,262 | ||||||||
| Construction - 0.0% | ||||||||
| CRH America, Inc. | ||||||||
| 125 | 6.00%, 09/30/2016 | 141 | ||||||
| Couriers and Messengers - 0.0% | ||||||||
| United Parcel Service, Inc. | ||||||||
| 110 | 3.13%, 01/15/2021 | 112 | ||||||
| Educational Services - 0.0% | ||||||||
| Princeton University | ||||||||
| 75 | 4.95%, 03/01/2019 | 86 | ||||||
| Electrical Equipment and Appliance Manufacturing - 0.1% | ||||||||
| Emerson Electric Co. | ||||||||
| 70 | 4.88%, 10/15/2019 | 80 | ||||||
| General Electric Co. | ||||||||
| 67 | 4.13%, 10/09/2042 | 63 | ||||||
| 40 | 5.25%, 12/06/2017 | 45 | ||||||
| Koninklijke Philips Electronics N.V. | ||||||||
| 38 | 6.88%, 03/11/2038 | 47 | ||||||
| 235 | ||||||||
| Finance and Insurance - 3.7% | ||||||||
| Ace INA Holdings, Inc. | ||||||||
| 65 | 2.70%, 03/13/2023 | 61 | ||||||
| Aetna, Inc. | ||||||||
| 105 | 3.95%, 09/01/2020 | 108 | ||||||
| Allstate Corp. | ||||||||
| 35 | 5.00%, 08/15/2014 | 37 | ||||||
| American Express Co. | ||||||||
| 103 | 2.65%, 12/02/2022 | 95 | ||||||
| American Express Credit Corp. | ||||||||
| 195 | 2.75%, 09/15/2015 | 202 | ||||||
| American International Group, Inc. | ||||||||
| 270 | 6.40%, 12/15/2020 | 313 | ||||||
The accompanying notes are an integral part of these financial statements.
| 11 |
| Hartford Portfolio Diversifier HLS Fund |
| Schedule of Investments – (continued) |
| June 30, 2013 (Unaudited) |
| (000’s Omitted) |
| Shares or Principal Amount | Market Value ╪ | |||||||
CORPORATE BONDS - 9.3% - (continued) | ||||||||
| Finance and Insurance - 3.7% - (continued) | ||||||||
| Aon Corp. | ||||||||
| $ | 20 | 5.00%, 09/30/2020 | $ | 22 | ||||
| Asian Development Bank | ||||||||
| 265 | 2.50%, 03/15/2016 | 278 | ||||||
| Bank of America Corp. | ||||||||
| 370 | 5.00%, 05/13/2021 | 394 | ||||||
| 460 | 5.65%, 05/01/2018 | 511 | ||||||
| Bank of Montreal | ||||||||
| 150 | 1.45%, 04/09/2018 | 145 | ||||||
| Bank of New York Mellon Corp. | ||||||||
| 25 | 2.30%, 07/28/2016 | 26 | ||||||
| 50 | 3.55%, 09/23/2021 | 51 | ||||||
| Bank of Nova Scotia | ||||||||
| 35 | 4.38%, 01/13/2021 | 38 | ||||||
| Barclays Bank plc | ||||||||
| 100 | 5.00%, 09/22/2016 | 110 | ||||||
| BB&T Corp. | ||||||||
| 80 | 3.20%, 03/15/2016 | 84 | ||||||
| Berkshire Hathaway Finance Corp. | ||||||||
| 40 | 4.50%, 02/11/2043 | 38 | ||||||
| 225 | 5.40%, 05/15/2018 | 258 | ||||||
| BlackRock, Inc. | ||||||||
| 105 | 5.00%, 12/10/2019 | 119 | ||||||
| BP Capital Markets plc | ||||||||
| 160 | 2.25%, 11/01/2016 | 164 | ||||||
| 65 | 3.25%, 05/06/2022 | 63 | ||||||
| Capital One Financial Corp. | ||||||||
| 60 | 4.75%, 07/15/2021 | 63 | ||||||
| 110 | 6.15%, 09/01/2016 | 123 | ||||||
| Chubb Corp. | ||||||||
| 90 | 5.75%, 05/15/2018 | 105 | ||||||
| CIGNA Corp. | ||||||||
| 50 | 4.00%, 02/15/2022 | 51 | ||||||
| 10 | 5.38%, 02/15/2042 | 11 | ||||||
| Citigroup, Inc. | ||||||||
| 75 | 5.00%, 09/15/2014 | 78 | ||||||
| 525 | 5.38%, 08/09/2020 | 581 | ||||||
| 65 | 6.63%, 06/15/2032 | 67 | ||||||
| Credit Suisse New York | ||||||||
| 110 | 5.30%, 08/13/2019 | 124 | ||||||
| Deutsche Bank AG | ||||||||
| 110 | 3.25%, 01/11/2016 | 115 | ||||||
| European Bank for Reconstruction & Development | ||||||||
| 135 | 2.50%, 03/15/2016 | 141 | ||||||
| European Investment Bank | ||||||||
| 495 | 1.25%, 10/14/2016 | 498 | ||||||
| 215 | 2.88%, 09/15/2020 | 216 | ||||||
| Fifth Third Bancorp | ||||||||
| 35 | 3.63%, 01/25/2016 | 37 | ||||||
| Ford Motor Credit Co. LLC | ||||||||
| 170 | 6.63%, 08/15/2017 | 192 | ||||||
| General Electric Capital Corp. | ||||||||
| 335 | 4.38%, 09/16/2020 | 355 | ||||||
| 445 | 5.30%, 02/11/2021 | 488 | ||||||
| Goldman Sachs Group, Inc. | ||||||||
| 605 | 5.38%, 03/15/2020 | 656 | ||||||
| 74 | 6.25%, 02/01/2041 | 84 | ||||||
| HCP, Inc. | ||||||||
| 160 | 6.70%, 01/30/2018 | 187 | ||||||
| Health Care, Inc. | ||||||||
| 40 | 3.75%, 03/15/2023 | 38 | ||||||
| 55 | 5.25%, 01/15/2022 | 59 | ||||||
| HSBC Finance Corp. | ||||||||
| 40 | 5.00%, 06/30/2015 | 43 | ||||||
| HSBC Holdings plc | ||||||||
| 335 | 5.10%, 04/05/2021 | 368 | ||||||
| Inter-American Development Bank | ||||||||
| 145 | 2.25%, 07/15/2015 | 150 | ||||||
| 210 | 3.88%, 02/14/2020 | 233 | ||||||
| International Bank for Reconstruction & Development | ||||||||
| 150 | 1.13%, 08/25/2014 | 151 | ||||||
| 100 | 2.38%, 05/26/2015 | 104 | ||||||
| 102 | 7.63%, 01/19/2023 | 143 | ||||||
| John Deere Capital Corp. | ||||||||
| 105 | 1.85%, 09/15/2016 | 107 | ||||||
| 35 | 2.80%, 09/18/2017 | 37 | ||||||
| JP Morgan Chase & Co. | ||||||||
| 595 | 4.95%, 03/25/2020 | 650 | ||||||
| 75 | 5.13%, 09/15/2014 | 79 | ||||||
| 80 | 6.00%, 01/15/2018 | 91 | ||||||
| 180 | 6.30%, 04/23/2019 | 209 | ||||||
| KeyCorp | ||||||||
| 70 | 3.75%, 08/13/2015 | 74 | ||||||
| Kreditanstalt fuer Wiederaufbau | ||||||||
| 350 | 1.25%, 10/26/2015 - 02/15/2017 | 354 | ||||||
| 115 | 2.63%, 01/25/2022 | 115 | ||||||
| 391 | 4.00%, 01/27/2020 | 434 | ||||||
| Landwirtschaftliche Rentenbank | ||||||||
| 180 | 2.50%, 02/15/2016 | 188 | ||||||
| 100 | 3.13%, 07/15/2015 | 105 | ||||||
| Lincoln National Corp. | ||||||||
| 60 | 4.85%, 06/24/2021 | 64 | ||||||
| Marsh & McLennan Cos., Inc. | ||||||||
| 35 | 4.80%, 07/15/2021 | 38 | ||||||
| MetLife, Inc. | ||||||||
| 50 | 5.70%, 06/15/2035 | 55 | ||||||
| 120 | 7.72%, 02/15/2019 | 151 | ||||||
| Morgan Stanley | ||||||||
| 200 | 5.45%, 01/09/2017 | 216 | ||||||
| 280 | 5.50%, 07/28/2021 | 299 | ||||||
| National Rural Utilities Cooperative Finance Corp. | ||||||||
| 30 | 5.45%, 04/10/2017 | 34 | ||||||
| Nomura Holdings, Inc. | ||||||||
| 130 | 4.13%, 01/19/2016 | 136 | ||||||
| Nordic Investment Bank | ||||||||
| 100 | 2.50%, 07/15/2015 | 104 | ||||||
| Oesterreichische Kontrollbank AG | ||||||||
| 95 | 4.88%, 02/16/2016 | 105 | ||||||
| PNC Funding Corp. | ||||||||
| 70 | 2.70%, 09/19/2016 | 73 | ||||||
| 100 | 5.13%, 02/08/2020 | 110 | ||||||
| Principal Financial Group, Inc. | ||||||||
| 70 | 3.30%, 09/15/2022 | 68 | ||||||
| Prudential Financial, Inc. | ||||||||
| 155 | 5.38%, 06/21/2020 | 174 | ||||||
| 25 | 5.80%, 11/16/2041 | 27 | ||||||
The accompanying notes are an integral part of these financial statements.
| 12 |
| Shares or Principal Amount | Market Value ╪ | |||||||
CORPORATE BONDS - 9.3% - (continued) | ||||||||
| Finance and Insurance - 3.7% - (continued) | ||||||||
| Rabobank Nederland | ||||||||
| $ | 155 | 4.50%, 01/11/2021 | $ | 163 | ||||
| Royal Bank of Canada | ||||||||
| 185 | 2.30%, 07/20/2016 | 190 | ||||||
| Royal Bank of Scotland plc | ||||||||
| 35 | 6.13%, 01/11/2021 | 39 | ||||||
| Simon Property Group L.P. | ||||||||
| 160 | 5.65%, 02/01/2020 | 183 | ||||||
| Toyota Motor Credit Corp. | ||||||||
| 40 | 3.20%, 06/17/2015 | 42 | ||||||
| 140 | 3.40%, 09/15/2021 | 138 | ||||||
| Travelers Cos., Inc. | ||||||||
| 140 | 3.90%, 11/01/2020 | 150 | ||||||
| U.S. Bancorp | ||||||||
| 110 | 2.45%, 07/27/2015 | 114 | ||||||
| 50 | 4.13%, 05/24/2021 | 53 | ||||||
| UBS AG Stamford CT | ||||||||
| 100 | 5.88%, 07/15/2016 | 110 | ||||||
| UnitedHealth Group, Inc. | ||||||||
| 105 | 6.88%, 02/15/2038 | 131 | ||||||
| Wellpoint, Inc. | ||||||||
| 15 | 4.65%, 01/15/2043 | 14 | ||||||
| 135 | 5.25%, 01/15/2016 | 148 | ||||||
| 40 | 5.80%, 08/15/2040 | 43 | ||||||
| Wells Fargo & Co. | ||||||||
| 190 | 2.10%, 05/08/2017 | 191 | ||||||
| 335 | 4.60%, 04/01/2021 | 365 | ||||||
| Westpac Banking Corp. | ||||||||
| 110 | 3.00%, 12/09/2015 | 115 | ||||||
| 14,864 | ||||||||
| Food Manufacturing - 0.2% | ||||||||
| Archer-Daniels Midland Co. | ||||||||
| 33 | 4.02%, 04/16/2043 | 29 | ||||||
| ConAgra Foods, Inc. | ||||||||
| 120 | 7.00%, 04/15/2019 | 145 | ||||||
| General Mills, Inc. | ||||||||
| 20 | 5.65%, 02/15/2019 | 23 | ||||||
| Kellogg Co. | ||||||||
| 70 | 4.00%, 12/15/2020 | 74 | ||||||
| Kraft Foods Group, Inc. | ||||||||
| 20 | 5.00%, 06/04/2042 | 20 | ||||||
| 255 | 5.38%, 02/10/2020 | 287 | ||||||
| 47 | 6.88%, 02/01/2038 | 57 | ||||||
| Unilever Capital Corp. | ||||||||
| 45 | 5.90%, 11/15/2032 | 56 | ||||||
| 691 | ||||||||
| Food Services - 0.0% | ||||||||
| McDonald's Corp. | ||||||||
| 29 | 3.70%, 02/15/2042 | 26 | ||||||
| 80 | 5.35%, 03/01/2018 | 92 | ||||||
| Yum! Brands, Inc. | ||||||||
| 7 | 6.88%, 11/15/2037 | 8 | ||||||
| 126 | ||||||||
| Health Care and Social Assistance - 0.6% | ||||||||
| AbbVie, Inc. | ||||||||
| 145 | 2.90%, 11/06/2022 ■ | 136 | ||||||
| Amgen, Inc. | ||||||||
| 145 | 3.88%, 11/15/2021 | 149 | ||||||
| 67 | 5.75%, 03/15/2040 | 72 | ||||||
| AstraZeneca plc | ||||||||
| 130 | 5.90%, 09/15/2017 | 151 | ||||||
| Baxter International, Inc. | ||||||||
| 130 | 2.40%, 08/15/2022 | 120 | ||||||
| 30 | 4.50%, 08/15/2019 | 33 | ||||||
| Boston Scientific Corp. | ||||||||
| 70 | 6.00%, 01/15/2020 | 79 | ||||||
| Bristol-Myers Squibb Co. | ||||||||
| 25 | 3.25%, 08/01/2042 | 20 | ||||||
| 20 | 5.45%, 05/01/2018 | 23 | ||||||
| Celgene Corp. | ||||||||
| 30 | 3.25%, 08/15/2022 | 29 | ||||||
| Covidien International Finance S.A. | ||||||||
| 45 | 3.20%, 06/15/2022 | 44 | ||||||
| 25 | 6.00%, 10/15/2017 | 29 | ||||||
| CVS Caremark Corp. | ||||||||
| 50 | 6.13%, 09/15/2039 | 58 | ||||||
| Eli Lilly & Co. | ||||||||
| 20 | 5.20%, 03/15/2017 | 22 | ||||||
| Express Scripts Holding Co. | ||||||||
| 115 | 4.75%, 11/15/2021 | 123 | ||||||
| Gilead Sciences, Inc. | ||||||||
| 20 | 4.40%, 12/01/2021 | 22 | ||||||
| GlaxoSmithKline Capital, Inc. | ||||||||
| 40 | 2.80%, 03/18/2023 | 38 | ||||||
| 110 | 5.65%, 05/15/2018 | 128 | ||||||
| 27 | 6.38%, 05/15/2038 | 33 | ||||||
| Johnson & Johnson | ||||||||
| 75 | 2.15%, 05/15/2016 | 78 | ||||||
| 25 | 5.95%, 08/15/2037 | 31 | ||||||
| McKesson Corp. | ||||||||
| 50 | 4.75%, 03/01/2021 | 55 | ||||||
| Medtronic, Inc. | ||||||||
| 15 | 4.00%, 04/01/2043 | 13 | ||||||
| 120 | 4.45%, 03/15/2020 | 131 | ||||||
| Merck & Co., Inc. | ||||||||
| 25 | 3.60%, 09/15/2042 | 22 | ||||||
| 195 | 3.88%, 01/15/2021 | 208 | ||||||
| Novartis Securities Investment Ltd. | ||||||||
| 75 | 5.13%, 02/10/2019 | 86 | ||||||
| Pfizer, Inc. | ||||||||
| 345 | 6.20%, 03/15/2019 | 416 | ||||||
| Quest Diagnostics, Inc. | ||||||||
| 40 | 4.70%, 04/01/2021 | 42 | ||||||
| Sanofi-Aventis S.A. | ||||||||
| 20 | 4.00%, 03/29/2021 | 21 | ||||||
| Teva Pharmaceutical Finance IV B.V. | ||||||||
| 60 | 3.65%, 11/10/2021 | 60 | ||||||
| Walgreen Co. | ||||||||
| 30 | 3.10%, 09/15/2022 | 29 | ||||||
| 2,501 | ||||||||
| Information - 0.7% | ||||||||
| America Movil S.A.B. de C.V. | ||||||||
| 110 | 5.63%, 11/15/2017 | 124 | ||||||
| 25 | 6.13%, 11/15/2037 | 27 | ||||||
The accompanying notes are an integral part of these financial statements.
| 13 |
| Hartford Portfolio Diversifier HLS Fund |
| Schedule of Investments – (continued) |
| June 30, 2013 (Unaudited) |
| (000’s Omitted) |
| Shares or Principal Amount | Market Value ╪ | |||||||
CORPORATE BONDS - 9.3% - (continued) | ||||||||
| Information - 0.7% - (continued) | ||||||||
| AT&T, Inc. | ||||||||
| $ | 310 | 2.63%, 12/01/2022 | $ | 284 | ||||
| 59 | 4.35%, 06/15/2045 | 51 | ||||||
| 73 | 5.35%, 09/01/2040 | 74 | ||||||
| 200 | 5.80%, 02/15/2019 | 232 | ||||||
| British Telecommunications plc | ||||||||
| 18 | 9.62%, 12/15/2030 Δ | 27 | ||||||
| Cellco Partnership - Verizon Wireless Capital LLC | ||||||||
| 90 | 8.50%, 11/15/2018 | 117 | ||||||
| COX Communications, Inc. | ||||||||
| 19 | 5.45%, 12/15/2014 | 20 | ||||||
| Deutsche Telekom International Finance B.V. | ||||||||
| 47 | 8.75%, 06/15/2030 | 65 | ||||||
| eBay, Inc. | ||||||||
| 25 | 2.60%, 07/15/2022 | 23 | ||||||
| France Telecom S.A. | ||||||||
| 80 | 5.38%, 07/08/2019 | 88 | ||||||
| Google, Inc. | ||||||||
| 65 | 2.13%, 05/19/2016 | 67 | ||||||
| Microsoft Corp. | ||||||||
| 150 | 1.63%, 09/25/2015 | 153 | ||||||
| 65 | 5.20%, 06/01/2039 | 72 | ||||||
| Oracle Corp. | ||||||||
| 80 | 5.38%, 07/15/2040 | 89 | ||||||
| 120 | 5.75%, 04/15/2018 | 140 | ||||||
| Rogers Communications, Inc. | ||||||||
| 30 | 4.50%, 03/15/2043 | 27 | ||||||
| 50 | 6.80%, 08/15/2018 | 61 | ||||||
| Telecom Italia Capital | ||||||||
| 105 | 7.00%, 06/04/2018 | 116 | ||||||
| Telefonica Emisiones SAU | ||||||||
| 120 | 5.46%, 02/16/2021 | 124 | ||||||
| Verizon Communications, Inc. | ||||||||
| 95 | 6.00%, 04/01/2041 | 107 | ||||||
| 300 | 6.35%, 04/01/2019 | 356 | ||||||
| Vodafone Group plc | ||||||||
| 195 | 5.45%, 06/10/2019 | 221 | ||||||
| 20 | 6.15%, 02/27/2037 | 22 | ||||||
| 2,687 | ||||||||
| Machinery Manufacturing - 0.1% | ||||||||
| Baker Hughes, Inc. | ||||||||
| 46 | 5.13%, 09/15/2040 | 50 | ||||||
| Caterpillar, Inc. | ||||||||
| 25 | 3.80%, 08/15/2042 | 22 | ||||||
| 135 | 3.90%, 05/27/2021 | 141 | ||||||
| Deere & Co. | ||||||||
| 30 | 3.90%, 06/09/2042 | 27 | ||||||
| Joy Global, Inc. | ||||||||
| 10 | 5.13%, 10/15/2021 | 11 | ||||||
| Xerox Corp. | ||||||||
| 20 | 6.35%, 05/15/2018 | 23 | ||||||
| 274 | ||||||||
| Mining - 0.3% | ||||||||
| Barrick Gold Corp. | ||||||||
| 25 | 5.25%, 04/01/2042 | 19 | ||||||
| 110 | 6.95%, 04/01/2019 | 117 | ||||||
| BHP Billiton Finance USA Ltd. | ||||||||
| 15 | 4.13%, 02/24/2042 | 14 | ||||||
| 110 | 6.50%, 04/01/2019 | 132 | ||||||
| Freeport-McMoRan Copper & Gold, Inc. | ||||||||
| 170 | 3.88%, 03/15/2023 ■ | 154 | ||||||
| Newmont Mining Corp. | ||||||||
| 38 | 6.25%, 10/01/2039 | 36 | ||||||
| Rio Tinto Finance USA Ltd. | ||||||||
| 145 | 3.75%, 09/20/2021 | 143 | ||||||
| 170 | 6.50%, 07/15/2018 | 201 | ||||||
| Southern Copper Corp. | ||||||||
| 55 | 6.75%, 04/16/2040 | 54 | ||||||
| Teck Resources Ltd. | ||||||||
| 40 | 4.50%, 01/15/2021 | 40 | ||||||
| 30 | 5.40%, 02/01/2043 | 27 | ||||||
| Vale Overseas Ltd. | ||||||||
| 90 | 6.25%, 01/23/2017 | 100 | ||||||
| 65 | 6.88%, 11/10/2039 | 66 | ||||||
| 1,103 | ||||||||
| Miscellaneous Manufacturing - 0.2% | ||||||||
| 3M Co. | ||||||||
| 75 | 1.38%, 09/29/2016 | 76 | ||||||
| 25 | 5.70%, 03/15/2037 | 30 | ||||||
| Boeing Co. | ||||||||
| 200 | 4.88%, 02/15/2020 | 228 | ||||||
| Honeywell International, Inc. | ||||||||
| 100 | 4.25%, 03/01/2021 | 109 | ||||||
| Northrop Grumman Corp. | ||||||||
| 20 | 5.05%, 08/01/2019 | 22 | ||||||
| United Technologies Corp. | ||||||||
| 125 | 4.50%, 04/15/2020 - 06/01/2042 | 132 | ||||||
| 135 | 6.13%, 02/01/2019 | 160 | ||||||
| 757 | ||||||||
| Motor Vehicle and Parts Manufacturing - 0.0% | ||||||||
| DaimlerChrysler NA Holdings Corp. | ||||||||
| 18 | 8.50%, 01/18/2031 | 25 | ||||||
| Ford Motor Co. | ||||||||
| 100 | 7.45%, 07/16/2031 | 120 | ||||||
| Johnson Controls, Inc. | ||||||||
| 40 | 5.00%, 03/30/2020 | 44 | ||||||
| 189 | ||||||||
| Other Services - 0.0% | ||||||||
| Illinois Tool Works, Inc. | ||||||||
| 15 | 3.90%, 09/01/2042 | 13 | ||||||
| Paper Manufacturing - 0.1% | ||||||||
| International Paper Co. | ||||||||
| 110 | 7.50%, 08/15/2021 | 135 | ||||||
| Kimberly-Clark Corp. | ||||||||
| 12 | 5.30%, 03/01/2041 | 14 | ||||||
| 90 | 6.13%, 08/01/2017 | 105 | ||||||
| 254 | ||||||||
| Petroleum and Coal Products Manufacturing - 0.8% | ||||||||
| Anadarko Petroleum Corp. | ||||||||
| 40 | 5.95%, 09/15/2016 | 45 | ||||||
| Apache Corp. | ||||||||
| 80 | 5.10%, 09/01/2040 | 81 | ||||||
| Atmos Energy Corp. | ||||||||
| 8 | 5.50%, 06/15/2041 | 9 | ||||||
The accompanying notes are an integral part of these financial statements.
| 14 |
| Shares or Principal Amount | Market Value ╪ | |||||||
CORPORATE BONDS - 9.3% - (continued) | ||||||||
| Petroleum and Coal Products Manufacturing - 0.8% - (continued) | ||||||||
| Canadian Natural Resources Ltd. | ||||||||
| $ | 60 | 5.70%, 05/15/2017 | $ | 68 | ||||
| 15 | 6.50%, 02/15/2037 | 17 | ||||||
| Cenovus Energy, Inc. | ||||||||
| 15 | 4.45%, 09/15/2042 | 14 | ||||||
| 25 | 5.70%, 10/15/2019 | 28 | ||||||
| Chevron Corp. | ||||||||
| 35 | 2.36%, 12/05/2022 | 33 | ||||||
| ConocoPhillips | ||||||||
| 128 | 6.50%, 02/01/2039 | 161 | ||||||
| Devon Financing Corp. | ||||||||
| 65 | 7.88%, 09/30/2031 | 84 | ||||||
| EnCana Corp. | ||||||||
| 25 | 6.50%, 02/01/2038 | 28 | ||||||
| Ensco plc | ||||||||
| 50 | 4.70%, 03/15/2021 | 53 | ||||||
| Hess Corp. | ||||||||
| 53 | 5.60%, 02/15/2041 | 54 | ||||||
| Kerr-McGee Corp. | ||||||||
| 100 | 6.95%, 07/01/2024 | 120 | ||||||
| Marathon Oil Corp. | ||||||||
| 15 | 6.60%, 10/01/2037 | 18 | ||||||
| Marathon Petroleum Corp. | ||||||||
| 15 | 5.13%, 03/01/2021 | 17 | ||||||
| National Oilwell Varco, Inc. | ||||||||
| 15 | 3.95%, 12/01/2042 | 13 | ||||||
| Nexen, Inc. | ||||||||
| 50 | 7.50%, 07/30/2039 | 61 | ||||||
| Noble Corp. | ||||||||
| 45 | 3.95%, 03/15/2022 | 44 | ||||||
| Noble Energy, Inc. | ||||||||
| 20 | 6.00%, 03/01/2041 | 23 | ||||||
| Occidental Petroleum Corp. | ||||||||
| 40 | 4.10%, 02/01/2021 | 42 | ||||||
| Pemex Project Funding Master Trust | ||||||||
| 185 | 5.75%, 03/01/2018 | 203 | ||||||
| Petrobras International Finance Co. | ||||||||
| 345 | 5.38%, 01/27/2021 | 347 | ||||||
| Petroleos Mexicanos | ||||||||
| 95 | 6.50%, 06/02/2041 | 98 | ||||||
| Phillips 66 | ||||||||
| 45 | 4.30%, 04/01/2022 | 47 | ||||||
| Sempra Energy | ||||||||
| 40 | 6.00%, 10/15/2039 | 45 | ||||||
| 35 | 6.50%, 06/01/2016 | 40 | ||||||
| Shell International Finance B.V. | ||||||||
| 25 | 3.63%, 08/21/2042 | 22 | ||||||
| 170 | 4.30%, 09/22/2019 | 189 | ||||||
| Southern Natural Gas Co. LLC | ||||||||
| 60 | 5.90%, 04/01/2017 ■ | 68 | ||||||
| Statoilhydro ASA | ||||||||
| 160 | 5.25%, 04/15/2019 | 185 | ||||||
| Suncor Energy, Inc. | ||||||||
| 75 | 6.50%, 06/15/2038 | 86 | ||||||
| Talisman Energy, Inc. | ||||||||
| 25 | 7.75%, 06/01/2019 | 30 | ||||||
| Total Capital International S.A. | ||||||||
| 45 | 1.50%, 02/17/2017 | 45 | ||||||
| 95 | 4.25%, 12/15/2021 | 101 | ||||||
| Transocean, Inc. | ||||||||
| 115 | 6.50%, 11/15/2020 | 129 | ||||||
| TXU Electric Delivery Co. | ||||||||
| 95 | 7.00%, 09/01/2022 | 118 | ||||||
| Valero Energy Corp. | ||||||||
| 100 | 6.13%, 02/01/2020 | 116 | ||||||
| Weatherford International Ltd. | ||||||||
| 110 | 5.13%, 09/15/2020 | 115 | ||||||
| Williams Partners L.P. | ||||||||
| 45 | 5.25%, 03/15/2020 | 48 | ||||||
| 3,045 | ||||||||
| Pipeline Transportation - 0.2% | ||||||||
| EL Paso Pipeling Partners Operating Co. LLC | ||||||||
| 35 | 4.70%, 11/01/2042 | 31 | ||||||
| Enterprise Products Operating LLC | ||||||||
| 30 | 4.45%, 02/15/2043 | 26 | ||||||
| 20 | 4.85%, 03/15/2044 | 19 | ||||||
| 140 | 5.20%, 09/01/2020 | 157 | ||||||
| Kinder Morgan Energy Partners L.P. | ||||||||
| 137 | 6.38%, 03/01/2041 | 153 | ||||||
| Oneok Partners L.P. | ||||||||
| 25 | 6.65%, 10/01/2036 | 28 | ||||||
| Plains All American Pipeline L.P. | ||||||||
| 30 | 6.65%, 01/15/2037 | 36 | ||||||
| TransCanada Pipelines Ltd. | ||||||||
| 105 | 3.80%, 10/01/2020 | 110 | ||||||
| 90 | 7.13%, 01/15/2019 | 110 | ||||||
| Transcontinental Gas Pipe Corp. | ||||||||
| 20 | 4.45%, 08/01/2042 | 18 | ||||||
| 688 | ||||||||
| Primary Metal Manufacturing - 0.0% | ||||||||
| Alcoa, Inc. | ||||||||
| 30 | 6.15%, 08/15/2020 | 31 | ||||||
| Professional, Scientific and Technical Services - 0.1% | ||||||||
| IBM Corp. | ||||||||
| 95 | 5.60%, 11/30/2039 | 109 | ||||||
| 100 | 5.70%, 09/14/2017 | 116 | ||||||
| Omnicom Group, Inc. | ||||||||
| 30 | 3.63%, 05/01/2022 | 29 | ||||||
| 254 | ||||||||
| Public Administration - 0.0% | ||||||||
| Waste Management, Inc. | ||||||||
| 55 | 4.75%, 06/30/2020 | 59 | ||||||
| Rail Transportation - 0.1% | ||||||||
| Burlington Northern Santa Fe Corp. | ||||||||
| 47 | 4.38%, 09/01/2042 | 43 | ||||||
| 120 | 4.70%, 10/01/2019 | 133 | ||||||
| Canadian National Railway Co. | ||||||||
| 40 | 2.85%, 12/15/2021 | 39 | ||||||
| Canadian Pacific Railway Co. | ||||||||
| 8 | 7.13%, 10/15/2031 | 10 | ||||||
The accompanying notes are an integral part of these financial statements.
| 15 |
| Hartford Portfolio Diversifier HLS Fund |
| Schedule of Investments – (continued) |
| June 30, 2013 (Unaudited) |
| (000’s Omitted) |
| Shares or Principal Amount | Market Value ╪ | |||||||
CORPORATE BONDS - 9.3% - (continued) | ||||||||
| Rail Transportation - 0.1% - (continued) | ||||||||
| CSX Corp. | ||||||||
| $ | 25 | 3.70%, 10/30/2020 | $ | 26 | ||||
| 105 | 4.25%, 06/01/2021 | 112 | ||||||
| Norfolk Southern Corp. | ||||||||
| 75 | 4.84%, 10/01/2041 | 75 | ||||||
| Union Pacific Corp. | ||||||||
| 34 | 6.63%, 02/01/2029 | 43 | ||||||
| 481 | ||||||||
| Real Estate, Rental and Leasing - 0.1% | ||||||||
| Boston Properties L.P. | ||||||||
| 100 | 5.88%, 10/15/2019 | 115 | ||||||
| ERP Operating L.P. | ||||||||
| 70 | 5.75%, 06/15/2017 | 79 | ||||||
| 194 | ||||||||
| Retail Trade - 0.3% | ||||||||
| Energy Transfer Partners | ||||||||
| 50 | 6.50%, 02/01/2042 | 53 | ||||||
| 64 | 9.00%, 04/15/2019 | 82 | ||||||
| Federated Retail Holdings, Inc. | ||||||||
| 28 | 5.90%, 12/01/2016 | 32 | ||||||
| Home Depot, Inc. | ||||||||
| 215 | 4.40%, 04/01/2021 | 236 | ||||||
| Kroger (The) Co. | ||||||||
| 40 | 3.90%, 10/01/2015 | 42 | ||||||
| 70 | 6.80%, 12/15/2018 | 84 | ||||||
| Lowe's Cos., Inc. | ||||||||
| 70 | 6.65%, 09/15/2037 | 86 | ||||||
| Macy's Retail Holdings, Inc. | ||||||||
| 60 | 3.88%, 01/15/2022 | 60 | ||||||
| Target Corp. | ||||||||
| 180 | 3.88%, 07/15/2020 | 192 | ||||||
| Turlock Corp. | ||||||||
| 75 | 2.75%, 11/02/2022 ■ | 70 | ||||||
| Wal-Mart Stores, Inc. | ||||||||
| 115 | 3.25%, 10/25/2020 | 119 | ||||||
| 105 | 4.25%, 04/15/2021 | 115 | ||||||
| 118 | 5.63%, 04/15/2041 | 136 | ||||||
| 1,307 | ||||||||
| Soap, Cleaning Compound and Toilet Manufacturing - 0.0% | ||||||||
| Procter & Gamble Co. | ||||||||
| 115 | 4.70%, 02/15/2019 | 130 | ||||||
| 20 | 5.55%, 03/05/2037 | 23 | ||||||
| 153 | ||||||||
| Transportation Equipment Manufacturing - 0.0% | ||||||||
| General Dynamics Corp. | ||||||||
| 15 | 3.88%, 07/15/2021 | 16 | ||||||
| Utilities - 0.5% | ||||||||
| CenterPoint Energy Houston Electric LLC | ||||||||
| 15 | 3.55%, 08/01/2042 | 13 | ||||||
| CMS Energy Corp. | ||||||||
| 60 | 5.05%, 03/15/2022 | 65 | ||||||
| Consolidated Edison Co. of NY | ||||||||
| 20 | 3.95%, 03/01/2043 | 18 | ||||||
| 25 | 5.50%, 12/01/2039 | 28 | ||||||
| 40 | 6.65%, 04/01/2019 | 49 | ||||||
| Dominion Resources, Inc. | ||||||||
| 215 | 4.45%, 03/15/2021 | 232 | ||||||
| Duke Energy Corp. | ||||||||
| 105 | 5.30%, 02/15/2040 | 114 | ||||||
| Entergy Corp. | ||||||||
| 40 | 3.63%, 09/15/2015 | 41 | ||||||
| Exelon Generation Co. LLC | ||||||||
| 145 | 4.00%, 10/01/2020 | 147 | ||||||
| 35 | 6.25%, 10/01/2039 | 38 | ||||||
| FirstEnergy Corp. | ||||||||
| 90 | 4.25%, 03/15/2023 | 84 | ||||||
| Florida Power & Light Co. | ||||||||
| 85 | 5.69%, 03/01/2040 | 99 | ||||||
| Georgia Power Co. | ||||||||
| 100 | 2.85%, 05/15/2022 | 96 | ||||||
| 50 | 4.75%, 09/01/2040 | 49 | ||||||
| Hydro-Quebec | ||||||||
| 50 | 1.38%, 06/19/2017 | 50 | ||||||
| 70 | 8.40%, 01/15/2022 | 95 | ||||||
| Kentucky Utilities Co. | ||||||||
| 40 | 5.13%, 11/01/2040 | 44 | ||||||
| MidAmerican Energy Holdings Co. | ||||||||
| 115 | 6.13%, 04/01/2036 | 130 | ||||||
| Nevada Power Co. | ||||||||
| 25 | 6.75%, 07/01/2037 | 32 | ||||||
| Northern States Power Co. | ||||||||
| 55 | 3.40%, 08/15/2042 | 46 | ||||||
| Ohio Power Co. | ||||||||
| 115 | 5.38%, 10/01/2021 | 132 | ||||||
| Pacific Gas & Electric Co. | ||||||||
| 105 | 6.05%, 03/01/2034 | 122 | ||||||
| Progress Energy, Inc. | ||||||||
| 190 | 4.40%, 01/15/2021 | 202 | ||||||
| PSEG Power LLC | ||||||||
| 25 | 5.13%, 04/15/2020 | 27 | ||||||
| Public Service Electric & Gas Co. | ||||||||
| 30 | 3.95%, 05/01/2042 | 28 | ||||||
| San Diego Gas & Electric Co. | ||||||||
| 32 | 4.50%, 08/15/2040 | 33 | ||||||
| South Carolina Electric & Gas Co. | ||||||||
| 10 | 6.05%, 01/15/2038 | 12 | ||||||
| Southern California Edison Co. | ||||||||
| 65 | 4.50%, 09/01/2040 | 65 | ||||||
| Xcel Energy, Inc. | ||||||||
| 65 | 4.70%, 05/15/2020 | 72 | ||||||
| 2,163 | ||||||||
| Wholesale Trade - 0.0% | ||||||||
| Georgia-Pacific LLC | ||||||||
| 40 | 7.75%, 11/15/2029 | 52 | ||||||
| Total corporate bonds | ||||||||
| (cost $38,426) | $ | 37,495 | ||||||
FOREIGN GOVERNMENT OBLIGATIONS - 0.8% | ||||||||
| Brazil - 0.1% | ||||||||
| Brazil (Republic of) | ||||||||
| $ | 125 | 5.88%, 01/15/2019 | $ | 142 | ||||
| 187 | 7.13%, 01/20/2037 | 223 | ||||||
| $ | 365 | |||||||
The accompanying notes are an integral part of these financial statements.
| 16 |
| Shares or Principal Amount | Market Value ╪ | |||||||
FOREIGN GOVERNMENT OBLIGATIONS - 0.8% - (continued) | ||||||||
| Canada - 0.3% | ||||||||
| British Columbia (Province of) | ||||||||
| $ | 60 | 2.10%, 05/18/2016 | $ | 62 | ||||
| 105 | 2.65%, 09/22/2021 | 105 | ||||||
| Canada (Government of) | ||||||||
| 135 | 0.88%, 02/14/2017 | 134 | ||||||
| 40 | 2.38%, 09/10/2014 | 41 | ||||||
| Manitoba (Province of) | ||||||||
| 60 | 2.10%, 09/06/2022 | 56 | ||||||
| 75 | 2.63%, 07/15/2015 | 78 | ||||||
| Nova Scotia (Province of) | ||||||||
| 35 | 5.13%, 01/26/2017 | 39 | ||||||
| Ontario (Province of) | ||||||||
| 265 | 4.40%, 04/14/2020 | 294 | ||||||
| Quebec (Province of) | ||||||||
| 140 | 3.50%, 07/29/2020 | 147 | ||||||
| 60 | 5.13%, 11/14/2016 | 68 | ||||||
| 1,024 | ||||||||
| Colombia - 0.1% | ||||||||
| Colombia (Republic of) | ||||||||
| 131 | 8.13%, 05/21/2024 | 174 | ||||||
| Italy - 0.0% | ||||||||
| Italy (Republic of) | ||||||||
| 45 | 5.38%, 06/15/2033 | 45 | ||||||
| Mexico - 0.1% | ||||||||
| United Mexican States | ||||||||
| 140 | 5.13%, 01/15/2020 | 154 | ||||||
| 192 | 6.05%, 01/11/2040 | 209 | ||||||
| 363 | ||||||||
| Panama - 0.0% | ||||||||
| Panama (Republic of) | ||||||||
| 50 | 6.70%, 01/26/2036 | 58 | ||||||
| Peru - 0.0% | ||||||||
| Peru (Republic of) | ||||||||
| 45 | 5.63%, 11/18/2050 | 47 | ||||||
| 30 | 7.13%, 03/30/2019 | 36 | ||||||
| 83 | ||||||||
| Philippines - 0.1% | ||||||||
| Philippines (Republic of) | ||||||||
| 120 | 4.00%, 01/15/2021 | 127 | ||||||
| 100 | 6.38%, 10/23/2034 | 120 | ||||||
| 247 | ||||||||
| Poland - 0.0% | ||||||||
| Poland (Republic of) | ||||||||
| 70 | 5.00%, 03/23/2022 | 75 | ||||||
| South Africa - 0.0% | ||||||||
| South Africa (Republic of) | ||||||||
| 100 | 6.88%, 05/27/2019 | 113 | ||||||
| Turkey - 0.1% | ||||||||
| Turkey (Republic of) | ||||||||
| 110 | 6.75%, 05/30/2040 | 122 | ||||||
| 150 | 7.25%, 03/15/2015 | 161 | ||||||
| 190 | 7.38%, 02/05/2025 | 225 | ||||||
| 508 | ||||||||
| Total foreign government obligations | ||||||||
| (cost $3,212) | $ | 3,055 | ||||||
MUNICIPAL BONDS - 0.2% | ||||||||
| Airport Revenues - 0.0% | ||||||||
| Clark County, NV, Airport Rev, | ||||||||
| $ | 5 | 6.82%, 07/01/2045 | $ | 7 | ||||
| New York & New Jersey PA, | ||||||||
| 50 | 4.93%, 10/01/2051 | 49 | ||||||
| 56 | ||||||||
| General Obligations - 0.1% | ||||||||
| California State GO, | ||||||||
| 70 | 7.60%, 11/01/2040 | 95 | ||||||
| California State GO, Taxable, | ||||||||
| 55 | 7.55%, 04/01/2039 | 74 | ||||||
| Connecticut State GO, | ||||||||
| 45 | 5.85%, 03/15/2032 | 50 | ||||||
| Illionis State, GO, | ||||||||
| 130 | 5.10%, 06/01/2033 | 121 | ||||||
| Massachusetts State GO, | ||||||||
| 15 | 5.46%, 12/01/2039 | 16 | ||||||
| Mississippi State GO, | ||||||||
| 25 | 5.25%, 11/01/2034 | 27 | ||||||
| New York, NY, GO, | ||||||||
| 15 | 5.85%, 06/01/2040 | 17 | ||||||
| Texas State GO, | ||||||||
| 30 | 5.52%, 04/01/2039 | 34 | ||||||
| 434 | ||||||||
| Higher Education (Univ., Dorms, etc.) - 0.0% | ||||||||
| New York, NY, Dormitory Auth Rev, | ||||||||
| 20 | 5.60%, 03/15/2040 | 22 | ||||||
| University of California, Build America Bonds Rev, | ||||||||
| 50 | 5.77%, 05/15/2043 | 55 | ||||||
| University of Texas, | ||||||||
| 25 | 4.79%, 08/15/2046 | 26 | ||||||
| 103 | ||||||||
| Miscellaneous - 0.0% | ||||||||
| New Jersey State Econ DA Lease Rev, | ||||||||
| 15 | 7.43%, 02/15/2029 | 18 | ||||||
| Transportation - 0.1% | ||||||||
| Bay Area, CA, Toll Auth Bridge Rev, | ||||||||
| 30 | 6.26%, 04/01/2049 | 35 | ||||||
| Metropolitan Transportation Auth, NY, Rev, | ||||||||
| 20 | 5.87%, 11/15/2039 | 22 | ||||||
| 25 | 6.55%, 11/15/2031 | 29 | ||||||
| 15 | 6.65%, 11/15/2039 | 18 | ||||||
| New Jersey State Turnpike Auth, | ||||||||
| 45 | 7.10%, 01/01/2041 | 58 | ||||||
| New Jersey State Turnpike Auth, Taxable, | ||||||||
| 15 | 7.41%, 01/01/2040 | 20 | ||||||
| 182 | ||||||||
The accompanying notes are an integral part of these financial statements.
| 17 |
| Hartford Portfolio Diversifier HLS Fund |
| Schedule of Investments – (continued) |
| June 30, 2013 (Unaudited) |
| (000’s Omitted) |
| Shares or Principal Amount | Market Value ╪ | |||||||
MUNICIPAL BONDS - 0.2% - (continued) | ||||||||
| Utilities - Electric - 0.0% | ||||||||
| American Municipal Power Ohio Inc Rev, | ||||||||
| $ | 45 | 6.05%, 02/15/2043 | $ | 49 | ||||
| Municipal Elec Auth Georgia, | ||||||||
| 40 | 6.64%, 04/01/2057 | 43 | ||||||
| 92 | ||||||||
| Utilities - Water and Sewer - 0.0% | ||||||||
| New York City, NY, Municipal Water FA, | ||||||||
| 45 | 5.88%, 06/15/2044 | 51 | ||||||
| Total municipal bonds | ||||||||
| (cost $996) | $ | 936 | ||||||
U.S. GOVERNMENT AGENCIES - 12.5% | ||||||||
| FHLMC - 3.7% | ||||||||
| $ | 270 | 2.38%, 01/13/2022 | $ | 262 | ||||
| 801 | 2.50%, 07/01/2027 - 12/01/2042 | 795 | ||||||
| 760 | 2.88%, 02/09/2015 | 791 | ||||||
| 1,990 | 3.00%, 12/01/2025 - 05/01/2043 | 1,978 | ||||||
| 2,283 | 3.50%, 04/01/2026 - 01/01/2043 | 2,340 | ||||||
| 680 | 3.75%, 03/27/2019 | 747 | ||||||
| 2,037 | 4.00%, 06/01/2024 - 02/01/2042 | 2,126 | ||||||
| 2,024 | 4.50%, 03/01/2015 - 08/01/2041 | 2,145 | ||||||
| 1,198 | 5.00%, 05/01/2023 - 08/01/2041 | 1,287 | ||||||
| 360 | 5.13%, 10/18/2016 | 409 | ||||||
| 370 | 5.25%, 04/18/2016 | 417 | ||||||
| 1,174 | 5.50%, 05/01/2036 - 08/01/2038 | 1,264 | ||||||
| 222 | 6.00%, 06/01/2036 - 10/01/2037 | 242 | ||||||
| 10 | 6.25%, 07/15/2032 | 13 | ||||||
| 14,816 | ||||||||
| FNMA - 6.0% | ||||||||
| 690 | 0.88%, 08/28/2017 | 676 | ||||||
| 600 | 1.25%, 01/30/2017 | 604 | ||||||
| 1,060 | 1.63%, 10/26/2015 | 1,086 | ||||||
| 1,562 | 2.50%, 03/01/2027 - 01/01/2043 ☼ | 1,561 | ||||||
| 330 | 2.63%, 11/20/2014 | 341 | ||||||
| 4,216 | 3.00%, 12/01/2025 - 04/01/2043 ☼ | 4,185 | ||||||
| 4,011 | 3.50%, 09/01/2025 - 01/01/2043 ☼ | 4,107 | ||||||
| 3,233 | 4.00%, 04/01/2025 - 02/01/2042 | 3,382 | ||||||
| 2,936 | 4.50%, 05/01/2025 - 08/01/2041 | 3,110 | ||||||
| 1,998 | 5.00%, 02/01/2022 - 01/01/2040 | 2,151 | ||||||
| 1,743 | 5.50%, 10/01/2035 - 05/01/2040 ☼ | 1,898 | ||||||
| 130 | 5.63%, 07/15/2037 | 161 | ||||||
| 459 | 6.00%, 04/01/2036 - 07/01/2037 | 500 | ||||||
| 119 | 6.50%, 06/01/2039 | 132 | ||||||
| 53 | 6.63%, 11/15/2030 | 72 | ||||||
| 23,966 | ||||||||
| GNMA - 2.8% | ||||||||
| 158 | 2.50%, 10/15/2027 - 01/15/2043 | 152 | ||||||
| 2,317 | 3.00%, 04/15/2027 - 06/20/2043 ☼ | 2,310 | ||||||
| 2,365 | 3.50%, 09/15/2025 - 04/20/2043 | 2,431 | ||||||
| 1,742 | 4.00%, 08/15/2026 - 09/20/2042 ☼ | 1,834 | ||||||
| 2,226 | 4.50%, 05/15/2039 - 07/20/2041 | 2,394 | ||||||
| 1,542 | 5.00%, 11/20/2035 - 12/20/2041 ☼ | 1,680 | ||||||
| 389 | 5.50%, 05/20/2038 - 08/20/2041 | 426 | ||||||
| 189 | 6.00%, 02/15/2036 - 08/20/2041 | 210 | ||||||
| 11,437 | ||||||||
| Total U.S. government agencies | ||||||||
| (cost $51,145) | $ | 50,219 | ||||||
| U.S. GOVERNMENT SECURITIES - 15.5% | ||||||||
| Other Direct Federal Obligations - 0.4% | ||||||||
| FFCB - 0.1% | ||||||||
| $ | 165 | 4.88%, 12/16/2015 - 01/17/2017 | $ | 183 | ||||
| FHLB - 0.3% | ||||||||
| 540 | 4.75%, 12/16/2016 | 610 | ||||||
| 470 | 5.00%, 11/17/2017 | 540 | ||||||
| 100 | 5.25%, 06/18/2014 | 105 | ||||||
| 1,255 | ||||||||
| Tennessee Valley Authority - 0.0% | ||||||||
| 135 | 6.75%, 11/01/2025 | 177 | ||||||
| 1,615 | ||||||||
| U.S. Treasury Securities - 15.1% | ||||||||
| U.S. Treasury Bonds - 2.3% | ||||||||
| 4,176 | 3.13%, 11/15/2041 - 02/15/2043 | 3,911 | ||||||
| 305 | 3.75%, 08/15/2041 | 322 | ||||||
| 728 | 4.25%, 11/15/2040 | 837 | ||||||
| 3,060 | 5.38%, 02/15/2031 | 3,986 | ||||||
| 9,056 | ||||||||
| U.S. Treasury Notes - 12.8% | ||||||||
| 4,230 | 0.25%, 11/30/2014 | 4,231 | ||||||
| 400 | 0.50%, 07/31/2017 | 390 | ||||||
| 7,740 | 0.63%, 05/31/2017 - 04/30/2018 | 7,532 | ||||||
| 485 | 0.88%, 11/30/2016 | 485 | ||||||
| 1,912 | 1.00%, 08/31/2016 | 1,927 | ||||||
| 17,820 | 1.25%, 08/31/2015 ௠| 18,137 | ||||||
| 6,294 | 1.75%, 05/31/2016 - 05/15/2022 | 6,136 | ||||||
| 3,878 | 1.88%, 09/30/2017 | 3,993 | ||||||
| 345 | 2.13%, 08/15/2021 | 344 | ||||||
| 8,250 | 2.38%, 08/31/2014 | 8,457 | ||||||
| 215 | 3.13%, 05/15/2021 | 231 | ||||||
| 51,863 | ||||||||
| 60,919 | ||||||||
| Total U.S. government securities | ||||||||
| (cost $63,458) | $ | 62,534 | ||||||
| Contracts | Market Value ╪ | |||||||
| PUT OPTIONS PURCHASED - 2.1% | ||||||||
| Equity Contracts - 2.1% | ||||||||
| S&P 500 Option | ||||||||
| 97 | Expiration: 06/06/2016, Exercise Price: $1,170.00 Я | $ | 8,407 | |||||
| Total put options purchased | ||||||||
| (cost $22,592) | $ | 8,407 | ||||||
| Total long-term investments | ||||||||
| (cost $254,797) | $ | 247,535 | ||||||
The accompanying notes are an integral part of these financial statements.
| 18 |
Shares or Principal Amount | Market Value ╪ | |||||||||||
SHORT-TERM INVESTMENTS - 41.6% | ||||||||||||
Other Direct Federal Obligations - 4.9% | ||||||||||||
| FHLB | ||||||||||||
| $ | 20,000 | 0.11%, 7/19/2013 ○ | $ | 19,999 | ||||||||
| 19,999 | ||||||||||||
| Other Investment Pools and Funds - 0.1% | ||||||||||||
| 321 | JP Morgan U.S. Government Money Market Fund | $ | 321 | |||||||||
| Repurchase Agreements - 9.7% | ||||||||||||
| RBS Greenwich Capital Markets TriParty Repurchase Agreement (maturing on 07/01/2013 in the amount of $11,443, collateralized by U.S. Treasury Note 0.25% - 3.00%, 2014 - 2019, value of $11,679) | ||||||||||||
| $ | 11,443 | 0.08%, 6/28/2013 | $ | 11,443 | ||||||||
| Royal Bank of Canada TriParty Repurchase Agreement (maturing on 07/01/2013 in the amount of $16,065, collateralized by U.S. Treasury Bond 2.75%, 2042, U.S. Treasury Note 1.88%, 2015, value of $16,386) | ||||||||||||
| 16,065 | 0.10%, 6/28/2013 | 16,065 | ||||||||||
| UBS Securities, Inc. TriParty Repurchase Agreement (maturing on 07/01/2013 in the amount of $11,444, collateralized by U.S. Treasury Bill 0.11%, 2017, U.S. Treasury Bond 2.88%, 2043, U.S. Treasury Note 0.25% - 4.25%, 2014 - 2016, value of $11,673) | ||||||||||||
| 11,444 | 0.10%, 6/28/2013 | 11,444 | ||||||||||
| 38,952 | ||||||||||||
| U.S. Government Agencies - 14.4% | ||||||||||||
| FHLMC | ||||||||||||
| 5,000 | 0.07%, 8/1/2013 ○ | 5,000 | ||||||||||
| 3,000 | 0.08%, 9/9/2013 ○ | 3,000 | ||||||||||
| 25,000 | 0.09%, 10/22/2013 ○ | 24,996 | ||||||||||
| FNMA | ||||||||||||
| 25,000 | 0.06%, 7/10/2013 - 8/28/2013 ○ | 24,999 | ||||||||||
| 57,995 | ||||||||||||
| U.S. Treasury Bills - 12.5% | ||||||||||||
| 10,500 | 0.03%, 08/01/2013 □○ | 10,500 | ||||||||||
| 40,000 | 0.11%, 09/05/2013 ○ | 39,999 | ||||||||||
| 50,499 | ||||||||||||
| Total short-term investments | ||||||||||||
| (cost $167,754) | $ | 167,766 | ||||||||||
| Total investments | ||||||||||||
| (cost $422,551) ▲ | 103.0 | % | $ | 415,301 | ||||||||
| Other assets and liabilities | (3.0 | )% | (11,925 | ) | ||||||||
| Total net assets | 100.0 | % | $ | 403,376 | ||||||||
The accompanying notes are an integral part of these financial statements.
| 19 |
| Hartford Portfolio Diversifier HLS Fund |
| Schedule of Investments – (continued) |
| June 30, 2013 (Unaudited) |
| (000’s Omitted) |
| Note: | Percentage of investments as shown is the ratio of the total market value to total net assets. |
| ▲ | At June 30, 2013, the cost of securities for federal income tax purposes was $414,952 and the aggregate gross unrealized appreciation and depreciation based on that cost were: |
| Unrealized Appreciation | $ | 11,318 | ||
| Unrealized Depreciation | (10,969 | ) | ||
| Net Unrealized Appreciation | $ | 349 |
| ● | Non-income producing. |
| Δ | Variable rate securities; the rate reported is the coupon rate in effect at June 30, 2013. |
| ○ | The interest rate disclosed for these securities represents the effective yield on the date of the acquisition. |
| ■ | Securities issued within terms of a private placement memorandum, exempt from registration under Rule 144A under the Securities Act of 1933, as amended, and may be sold only to qualified institutional buyers. Unless otherwise indicated, these holdings are determined to be liquid. At June 30, 2013, the aggregate value of these securities was $469, which represents 0.1% of total net assets. |
| ☼ | This security, or a portion of this security, was purchased on a when-issued, delayed-delivery or delayed-draw basis. The cost of these securities was $3,109 at June 30, 2013. |
| ‡ | This security, or a portion of this security, has been segregated to cover funding requirements on investment transactions settling in the future. |
| Я | The broker deposited securities valued at $4,738 with the custodian to serve as collateral for the options purchased by the Fund. The collateral is maintained in a segregated account at the custodian on behalf of the Fund. |
| □ | This security, or a portion of this security, is pledged as initial margin deposit and collateral for daily variation margin loss on open futures contracts held at June 30, 2013 as listed in the table below: |
Futures Contracts Outstanding at June 30, 2013
| Unrealized | ||||||||||||||||||
| Number of | Expiration | Appreciation/ | ||||||||||||||||
| Description | Contracts* | Date | Notional Amount | Market Value ╪ | (Depreciation) | |||||||||||||
| Short position contracts: | ||||||||||||||||||
| S&P 500 (E-Mini) Future | 2,689 | 09/20/2013 | $ | 215,650 | $ | 215,026 | $ | 624 | ||||||||||
* The number of contracts does not omit 000's.
Cash of $235 was pledged as initial margin deposit and collateral for daily variation margin loss on open futures contracts at June 30, 2013.
| Ø | At June 30, 2013, this security, or a portion of this security, collateralized the written put options in the table below: |
Written Put Options Outstanding at June 30, 2013
| Unrealized | ||||||||||||||||||||||||
| Exercise | Expiration | Number of | Market | Premiums | Appreciation | |||||||||||||||||||
| Description (Counterparty) | Option Type | Price/ Rate | Date | Contracts* | Value ╪ | Received | (Depreciation) | |||||||||||||||||
| S&P 500 Option (BCLY) | Equity | $ | 910.00 | 06/06/2016 | 32,964 | $ | 1,340 | $ | 4,457 | $ | 3,117 | |||||||||||||
| S&P 500 Option (JPM) | Equity | $ | 910.00 | 06/06/2016 | 31,850 | 1,294 | 4,299 | 3,005 | ||||||||||||||||
| S&P 500 Option (BOA) | Equity | $ | 910.00 | 06/06/2016 | 20,282 | 824 | 2,564 | 1,740 | ||||||||||||||||
| S&P 500 Option (CSI) | Equity | $ | 910.00 | 06/06/2016 | 3,348 | 136 | 509 | 373 | ||||||||||||||||
| S&P 500 Option (UBS) | Equity | $ | 910.00 | 06/06/2016 | 8,811 | 358 | 1,389 | 1,031 | ||||||||||||||||
| $ | 3,952 | $ | 13,218 | $ | 9,266 | |||||||||||||||||||
* The number of contracts does not omit 000's. Number of contracts shown in U.S. dollars unless otherwise noted.
| ╪ | See Significant Accounting Policies of accompanying Notes to Financial Statements regarding valuation of securities. |
The accompanying notes are an integral part of these financial statements.
| 20 |
| GLOSSARY: (abbreviations used in preceding Schedule of Investments) | ||
| Counterparty Abbreviations: | ||
| BCLY | Barclays | |
| BOA | Banc of America Securities LLC | |
| CSI | Credit Suisse International | |
| JPM | JP Morgan Chase & Co. | |
| UBS | UBS AG | |
| Index Abbreviations: | ||
| S&P | Standard & Poors | |
| Municipal Bond Abbreviations: | ||
| DA | Development Authority | |
| FA | Finance Authority | |
| GO | General Obligation | |
| PA | Port Authority | |
| Rev | Revenue | |
| Other Abbreviations: | ||
| ETF | Exchange Traded Fund | |
| FFCB | Federal Farm Credit Bank | |
| FHLB | Federal Home Loan Bank | |
| FHLMC | Federal Home Loan Mortgage Corp. | |
| FNMA | Federal National Mortgage Association | |
| GNMA | Government National Mortgage Association | |
| REIT | Real Estate Investment Trust | |
The accompanying notes are an integral part of these financial statements.
| 21 |
| Hartford Portfolio Diversifier HLS Fund |
| Investment Valuation Hierarchy Level Summary |
| June 30, 2013 (Unaudited) |
| (000’s Omitted) |
| Total | Level 1 ♦ | Level 2 ♦ | Level 3 | |||||||||||||
| Assets: | ||||||||||||||||
| Asset & Commercial Mortgage Backed Securities | $ | 3,342 | $ | – | $ | 3,342 | $ | – | ||||||||
| Common Stocks ‡ | 80,239 | 80,239 | – | – | ||||||||||||
| Corporate Bonds | 37,495 | – | 37,495 | – | ||||||||||||
| Exchange Traded Funds | 1,308 | �� | 1,308 | – | – | |||||||||||
| Foreign Government Obligations | 3,055 | – | 3,055 | – | ||||||||||||
| Municipal Bonds | 936 | – | 936 | – | ||||||||||||
| Put Options Purchased | 8,407 | – | 8,407 | – | ||||||||||||
| U.S. Government Agencies | 50,219 | – | 50,219 | – | ||||||||||||
| U.S. Government Securities | 62,534 | – | 62,534 | – | ||||||||||||
| Short-Term Investments | 167,766 | 321 | 167,445 | – | ||||||||||||
| Total | $ | 415,301 | $ | 81,868 | $ | 333,433 | $ | – | ||||||||
| Futures * | 624 | 624 | – | – | ||||||||||||
| Written Options * | 9,266 | – | 9,266 | – | ||||||||||||
| Total | $ | 9,890 | $ | 624 | $ | 9,266 | $ | – | ||||||||
| ♦ | For the six-month period ended June 30, 2013, there were no transfers between Level 1 and Level 2. |
| ‡ | The Fund has all or primarily all of the equity securities categorized in a particular level. Refer to the Schedule of Investments for further industry breakout. |
| * | Derivative instruments not reflected in the Schedule of Investments are valued at the unrealized appreciation/depreciation on the investments. |
The accompanying notes are an integral part of these financial statements.
| 22 |
| Hartford Portfolio Diversifier HLS Fund |
| Statement of Assets and Liabilities |
| June 30, 2013 (Unaudited) |
| (000’s Omitted) |
| Assets: | ||||
| Investments in securities, at market value (cost $422,551) | $ | 415,301 | ||
| Cash | 237 | * | ||
| Receivables: | ||||
| Investment securities sold | 10 | |||
| Fund shares sold | 709 | |||
| Dividends and interest | 1,100 | |||
| Variation margin | 981 | |||
| Other assets | 5 | |||
| Total assets | 418,343 | |||
| Liabilities: | ||||
| Payables: | ||||
| Investment securities purchased | 10,900 | |||
| Fund shares redeemed | 6 | |||
| Investment management fees | 40 | |||
| Distribution fees | 16 | |||
| Other liabilities | 35 | |||
| Accrued expenses | 18 | |||
| Written options (proceeds $13,218) | 3,952 | |||
| Total liabilities | 14,967 | |||
| Net assets | $ | 403,376 | ||
| Summary of Net Assets: | ||||
| Capital stock and paid-in-capital | $ | 443,397 | ||
| Undistributed net investment income | 283 | |||
| Accumulated net realized loss | (42,944 | ) | ||
| Unrealized appreciation of investments | 2,640 | |||
| Net assets | $ | 403,376 | ||
| Shares authorized | 1,000,000 | |||
| Par value | $ | 0.001 | ||
| Class IB: Net asset value per share | $ | 8.64 | ||
| Shares outstanding | 46,675 | |||
| Net assets | $ | 403,376 |
| * | Cash of $235 was pledged as initial margin deposit and collateral for daily variation margin loss on open futures contracts at June 30, 2013. |
The accompanying notes are an integral part of these financial statements.
| 23 |
| Hartford Portfolio Diversifier HLS Fund |
| Statement of Operations |
| For the Six-Month Period Ended June 30, 2013 (Unaudited) |
| (000’s Omitted) |
| Investment Income: | ||||
| Dividends | $ | 705 | ||
| Interest | 1,059 | |||
| Less: Foreign tax withheld | — | |||
| Total investment income, net | 1,764 | |||
| Expenses: | ||||
| Investment management fees | 1,045 | |||
| Transfer agent fees | 1 | |||
| Distribution fees - Class IB | 436 | |||
| Custodian fees | 4 | |||
| Accounting services fees | 31 | |||
| Board of Directors' fees | 3 | |||
| Audit fees | 6 | |||
| Other expenses | 19 | |||
| Total expenses (before waivers) | 1,545 | |||
| Expense waivers | (64 | ) | ||
| Total waivers | (64 | ) | ||
| Total expenses, net | 1,481 | |||
| Net Investment Income | 283 | |||
| Net Realized Loss on Investments and Other Financial Instruments: | ||||
| Net realized gain on investments | 573 | |||
| Net realized loss on futures | (27,190 | ) | ||
| Net Realized Loss on Investments and Other Financial Instruments | (26,617 | ) | ||
| Net Changes in Unrealized Depreciation of Investments and Other Financial Instruments: | ||||
| Net unrealized appreciation of investments | 1,461 | |||
| Net unrealized depreciation of purchased options | (5,867 | ) | ||
| Net unrealized appreciation of futures | 498 | |||
| Net unrealized appreciation of written options | 3,084 | |||
| Net Changes in Unrealized Depreciation of Investments and Other Financial Instruments | (824 | ) | ||
| Net Loss on Investments and Other Financial Instruments | (27,441 | ) | ||
| Net Decrease in Net Assets Resulting from Operations | $ | (27,158 | ) |
The accompanying notes are an integral part of these financial statements.
| 24 |
| Hartford Portfolio Diversifier HLS Fund |
| Statement of Changes in Net Assets |
| (000’s Omitted) |
| For the Six-Month Period Ended June 30, 2013 (Unaudited) | For the Year Ended December 31, 2012 | |||||||
| Operations: | ||||||||
| Net investment income | $ | 283 | $ | 567 | ||||
| Net realized loss on investments and other financial instruments | (26,617 | ) | (15,883 | ) | ||||
| Net unrealized appreciation (depreciation) of investments and other financial instruments | (824 | ) | 2,972 | |||||
| Net Decrease in Net Assets Resulting from Operations | (27,158 | ) | (12,344 | ) | ||||
| Distributions to Shareholders: | ||||||||
| From net investment income | ||||||||
| Class IB | — | (1,025 | ) | |||||
| Total distributions | — | (1,025 | ) | |||||
| Capital Share Transactions: | ||||||||
| Class IB | ||||||||
| Sold | 147,660 | 218,964 | ||||||
| Issued on reinvestment of distributions | — | 1,025 | ||||||
| Redeemed | (12,888 | ) | (17,439 | ) | ||||
| Total capital share transactions | 134,772 | 202,550 | ||||||
| Net increase from capital share transactions | 134,772 | 202,550 | ||||||
| Net Increase in Net Assets | 107,614 | 189,181 | ||||||
| Net Assets: | ||||||||
| Beginning of period | 295,762 | 106,581 | ||||||
| End of period | $ | 403,376 | $ | 295,762 | ||||
| Undistributed (distribution in excess of) net investment income | $ | 283 | $ | — | ||||
| Shares: | ||||||||
| Class IB | ||||||||
| Sold | 16,616 | 22,772 | ||||||
| Issued on reinvestment of distributions | — | 109 | ||||||
| Redeemed | (1,472 | ) | (1,815 | ) | ||||
| Total share activity | 15,144 | 21,066 | ||||||
The accompanying notes are an integral part of these financial statements.
| 25 |
| Hartford Portfolio Diversifier HLS Fund |
| Notes to Financial Statements |
| June 30, 2013 (Unaudited) |
| (000’s Omitted) |
| 1. | Organization: |
Hartford Portfolio Diversifier HLS Fund (the “Fund”) serves as an underlying investment option for certain variable annuity separate accounts of Hartford Life Insurance Company (“HLIC”) and its affiliates. The Fund’s shares are available only to separate accounts of HLIC and its affiliates as a required investment option for variable annuity contracts whose holders have elected a guaranteed benefit rider subject to an allocation requiring investment in the Fund.
Hartford Series Fund, Inc. (the “Company”) is an open-end registered management investment company comprised of thirty portfolios. Financial statements for the Fund, a series of the Company, are included in this report.
The Company is organized under the laws of the State of Maryland and is registered with the Securities and Exchange Commission (“SEC”) under the Investment Company Act of 1940, as amended (“1940 Act”). The Fund is a diversified open-end management investment company.
Class IB shares of the Fund are offered at the per share net asset value (“NAV”) without a sales charge and are subject to distribution and service fees charged pursuant to a Distribution Plan adopted in accordance with Rule 12b-1 under the 1940 Act.
| 2. | Significant Accounting Policies: |
The following is a summary of significant accounting policies of the Fund in the preparation of its financial statements, which are in accordance with the United States Generally Accepted Accounting Principles (“U.S. GAAP”). The preparation of financial statements in accordance with U.S. GAAP may require management to make estimates and assumptions that affect the reported amounts of assets and liabilities and disclosure of contingent assets and liabilities at the date of the financial statements and the reported amounts of increases and decreases in net assets from operations during the reporting period. Actual results could differ from those estimates.
| a) | Determination of Net Asset Value – The NAV of the Fund’s shares is determined as of the close of regular trading (normally 4:00 p.m. Eastern Time) (the “NYSE Close”) on each day that the New York Stock Exchange (the “Exchange”) is open (“Valuation Date”). Information that becomes known to the Fund after the NAV has been calculated on a particular day will not generally be used to retroactively adjust the NAV determined earlier that day. |
| b) | Investment Valuation and Fair Value Measurements – For purposes of calculating the NAV, portfolio investments and other assets held by the Fund's portfolio for which market quotes are readily available are valued at market value. Market value is generally determined on the basis of last reported sales prices or official close price. If no sales are reported, market value is based on quotes obtained from a quotation reporting system, established market makers, or independent pricing services. If market prices are not readily available or are deemed unreliable, the Fund will use the fair value of the investment as determined in good faith under policies and procedures established by and under the supervision of the Company’s Board of Directors. Market quotes are considered not readily available where there is an absence of current or reliable market-based data (e.g., trade information or indicative market quotes), including where events occur after the close of the relevant market, but prior to the NYSE Close that materially affect the values of the Fund’s portfolio investments or assets. In addition, market quotes are considered not readily available when, due to extraordinary circumstances, the exchanges or markets on which the investments trade do not open for trading for the entire day and no other market prices are available. In addition, prices of foreign equities that are principally traded on certain foreign markets may be adjusted daily pursuant to a fair value pricing service approved by the Board of Directors in order to reflect an adjustment for the factors occurring after the close of certain foreign markets but before the NYSE Close. Investments that are primarily traded on foreign markets may trade on days that are not business days of the Fund. The value of the foreign investments in which the Fund invests may change on days when a shareholder will not be able to purchase or redeem shares of the Fund. Fair value pricing is subjective in nature and the use of fair value pricing by the |
| 26 |
Fund may cause the NAV of its shares to differ significantly from the NAV that would have been calculated using market prices at the close of the exchange on which a portfolio investment is primarily traded. There can be no assurance that the Fund could obtain the fair market value assigned to an investment if the Fund were to sell the investment at approximately the time at which the Fund determines its NAV.
Fixed income investments (other than short term obligations) and non-exchange traded derivatives held by the Fund are normally valued on the basis of quotes obtained from brokers and dealers or independent pricing services in accordance with procedures established by the Company’s Board of Directors. Prices obtained from independent pricing services use information provided by market makers or estimates of market values through accepted market modeling and trading and pricing conventions. Inputs to the models may include, but are not limited to, prepayment speeds, pricing spread, yield, trade information, dealer quotes, market color, cash flow models and the bond’s terms and conditions. Generally, the Fund may use fair valuation in regard to fixed income investments when the Fund holds defaulted or distressed investments or investments in a company in which a reorganization is pending. Short-term investments maturing in 60 days or less are generally valued at amortized cost, if their original term to maturity was 60 days or less, or by amortizing their value on the 61st day prior to maturity, if the original term to maturity exceeded 60 days.
Exchange traded options, futures and options on futures are valued at the settlement price determined by the relevant exchange as of the NYSE Close. In the case of OTC options and such instruments that do not trade on an exchange, values may be supplied by a pricing service using a formula or other objective method that may take into consideration the style, direction, expiration, strike price, notional value and volatility or other special adjustments.
Investments in open-end mutual funds are valued at the respective NAV of each open-end mutual fund on the Valuation Date.
Financial instruments for which prices are not available from an independent pricing service may be valued using market quotations obtained from one or more dealers that make markets in the respective financial instrument in accordance with procedures established by the Company’s Board of Directors.
U.S. GAAP defines fair value as the price that the Fund would receive to sell an asset or pay to transfer a liability in an orderly transaction between market participants. The U.S. GAAP fair value measurement standards require disclosure of a fair value hierarchy for each major category of assets and liabilities. Various inputs are used in determining the fair value of the Fund’s investments. These inputs are summarized into three broad hierarchy levels. This hierarchy is based on whether the valuation inputs are observable or unobservable. These levels are:
| · | Level 1 – Quoted prices in active markets for identical investments. Level 1 may include exchange traded instruments, such as domestic equities, some foreign equities, options, futures, mutual funds, exchange traded funds, rights and warrants. |
| · | Level 2 – Observable inputs other than Level 1 prices, such as quoted prices for similar investments; quoted prices in markets that are not active; or other inputs that are observable or can be corroborated by observable market data. Level 2 may include debt investments that are traded less frequently than exchange traded instruments and which are valued using independent pricing services; foreign equities, which are principally traded on certain foreign markets and are adjusted daily pursuant to a fair value pricing service in order to reflect an adjustment for the factors occurring after the close of certain foreign markets but before the NYSE Close; and short-term investments, which are valued at amortized cost. |
| · | Level 3 – Significant unobservable inputs that are supported by limited or no market activity. Level 3 may include financial instruments whose values are determined using indicative market quotes or require significant management judgment or estimation. These unobservable valuation inputs may include estimates for current yields, maturity/duration, prepayment speed, and indicative market quotes for comparable investments along with other assumptions relating to credit quality, collateral value, complexity of the investment structure, general market conditions and liquidity. This category may include investments where trading has been halted |
| 27 |
| Hartford Portfolio Diversifier HLS Fund |
| Notes to Financial Statements – (continued) |
| June 30, 2013 (Unaudited) |
| (000’s Omitted) |
or there are certain restrictions on trading. While these investments are priced using unobservable inputs, the valuation of these investments reflects the best available data and management believes the prices are a reasonable representation of exit price.
The Board of Directors of the Company generally reviews and approves the “Procedures for Valuation of Portfolio Securities” on an annual basis. These procedures define how investments are to be valued, including the formation and activities of a Valuation Committee. The Valuation Committee is responsible for determining in good faith the fair value of investments when the value cannot be obtained from primary pricing services or alternative sources or if the valuation of an investment as provided by the primary pricing service or alternative source is believed not to reflect the investment’s fair value as of the Valuation Date. Members of the Valuation Committee include the Fund’s Treasurer or designee, a Vice President of the Fund with legal expertise or designee, and a Vice President of the investment manager or designee. In addition, the Fund’s Chief Compliance Officer shall designate a member of the compliance group to attend Valuation Committee meetings as a non-voting resource, to monitor for and provide guidance with respect to compliance with these procedures. Two members of the Valuation Committee or their designees, representing different departments, shall constitute a quorum for purposes of permitting the Valuation Committee to take action. The Valuation Committee will consider all relevant factors in determining an investment’s fair value, and may seek the advice of the Fund’s sub-adviser, knowledgeable brokers, and legal counsel in making such determination. The Valuation Committee reports to the Audit Committee of the Company’s Board of Directors. The Audit Committee receives quarterly written reports which include details of all fair-valued investments, including the reason for the fair valuation, and an indication, when possible, of the accuracy of the valuation by disclosing the next available reliable public price quotation or the disposition price of such investments (the “look-back” test). The Board of Directors then must consider for ratification all of the fair value determinations made during the previous quarter.
Valuation levels are not necessarily indicative of the risk associated with investing in such investments. Individual investments within any of the above mentioned asset classes may be assigned a different hierarchical level than those presented above, as individual circumstances dictate.
For additional information, refer to the Investment Valuation Hierarchy Level Summary and the Level 3 roll-forward reconciliation, if applicable, which follow the Schedule of Investments.
For purposes of reporting transfers between different hierarchy levels, both transfers in and out of each level, as applicable, are shown as if they occurred at the beginning of the period.
| c) | Investment Transactions and Investment Income – Investment transactions are recorded as of the trade date (the date the order to buy or sell is executed) for financial reporting purposes. Investments purchased or sold on a when-issued or delayed-delivery basis may be settled a month or more after the trade date. Realized gains and losses are determined on the basis of identified cost. |
Dividend income from domestic securities is accrued on the ex-dividend date. In general, dividend income from foreign securities is recorded on the ex-date; however, dividend notifications in certain foreign jurisdictions may not be available in a timely manner and as a result, the Fund will record the dividend as soon as the relevant details (i.e., rate per share, payment date, shareholders of record, etc.) are publicly available. Interest income, including amortization of premium and accretion of discounts, is accrued on a daily basis. Paydown gains and losses on mortgage-related and other asset-backed securities are included in interest income in the Statement of Operations, as applicable.
| d) | Fund Share Valuation and Dividend Distributions to Shareholders – Orders for the Fund’s shares are executed in accordance with the investment instructions of the contract holders. The NAV of the Fund’s shares is determined as of the close of business on each business day of the Exchange. The NAV is determined by dividing the Fund’s net assets by the number of shares outstanding. |
| 28 |
Orders for the purchase of the Fund’s shares received prior to the close of the Exchange on any day the Exchange is open for business are priced at the NAV determined as of the close of the Exchange. Orders received after the close of the Exchange, or on a day on which the Exchange and/or the Fund is not open for business, are priced at the next determined NAV.
Dividends are declared pursuant to a policy adopted by the Company’s Board of Directors based upon the investment performance of the Fund. The policy of the Fund is to pay dividends from net investment income and realized capital gains, if any, at least once a year.
Distributions from net investment income, net realized capital gains and capital are determined in accordance with federal income tax regulations, which may differ from U.S. GAAP with respect to character and timing. These differences may include but are not limited to losses deferred due to wash sale adjustments, foreign currency gains and losses, adjustments related to Passive Foreign Investment Companies (“PFICs”), Real Estate Investment Trusts (“REITs”), Regulated Investment Companies (“RICs”), certain derivatives and partnerships. Permanent book and federal income tax basis differences relating to shareholder distributions will result in reclassifications to certain of the Fund’s capital accounts (see Federal Income Taxes: Reclassification of Capital Accounts note).
| 3. | Securities and Other Investments: |
| a) | Repurchase Agreements – A repurchase agreement is an agreement by which a counterparty agrees to sell an investment and agrees to repurchase the investment sold from the buyer at a mutually agreed upon time and price. During the period of the repurchase agreement, the counterparty will deposit cash and or securities in a third party custodial account to serve as collateral. At the time the Fund enters into a repurchase agreement, the value of the underlying collateral, including accrued interest, will be equal to or exceed the value of the repurchase agreement. Repurchase agreements expose the Fund to counterparty risk - that is, the risk that the counterparty will not fulfill its obligations. To minimize counterparty risk, the investments that serve to collateralize the repurchase agreement are held by the Fund’s custodian in book entry or physical form in the custodial account of the Fund or in a third party custodial account. Repurchase agreements are valued at cost plus accrued interest, which approximates fair value. Repurchase agreements have master netting agreements which allow the Fund to offset amounts owed to a counterparty with amounts owed by the counterparty, including any collateral. The Fund, as shown on the Schedule of Investments, had outstanding repurchase agreements as of June 30, 2013. |
| b) | Illiquid and Restricted Investments – The Fund is permitted to invest up to 15% of its net assets in illiquid investments. Illiquid investments are those that may not be sold or disposed of in the ordinary course of business within seven days, at approximately the price used to determine the Fund’s NAV. The Fund may not be able to sell illiquid investments when its sub-adviser considers it desirable to do so or may have to sell such investments at a price that is lower than the price that could be obtained if the investments were more liquid. A sale of illiquid investments may require more time and may result in higher dealer discounts and other selling expenses than does the sale of those that are liquid. Illiquid investments also may be more difficult to value due to the unavailability of reliable market quotations for such investments, and an investment in them may have an adverse impact on the Fund’s NAV. The Fund may also purchase certain restricted investments that can only be resold to certain qualified investors and may be determined to be liquid pursuant to policies and guidelines established by the Company’s Board of Directors. The Fund, as shown on the Schedule of Investments, had illiquid and/or restricted investments as of June 30, 2013. |
| c) | Investments Purchased on a When-Issued or Delayed-Delivery Basis – Delivery and payment for investments that have been purchased by the Fund on a forward commitment, or when-issued or delayed-delivery basis, take place beyond the customary settlement period. A fund may dispose of or renegotiate a delayed-delivery transaction after it is entered into, and may sell delayed-delivery investments before they are delivered, which may result in a realized gain or loss. During this period, such investments are subject to market fluctuations, and the Fund identifies investments segregated in its |
| 29 |
| Hartford Portfolio Diversifier HLS Fund |
| Notes to Financial Statements – (continued) |
| June 30, 2013 (Unaudited) |
| (000’s Omitted) |
records with a value at least equal to the amount of the commitment. The Fund, as shown on the Schedule of Investments, had when-issued or delayed-delivery investments as of June 30, 2013.
| d) | Mortgage Related and Other Asset Backed Securities – The Fund may invest in mortgage related and other asset backed securities. These securities include mortgage pass-through securities, collateralized mortgage obligations, commercial mortgage backed securities, stripped mortgage backed securities, asset backed securities, collateralized debt obligations and other securities that directly or indirectly represent a participation in, or are secured by and payable from, mortgage loans on real property. Mortgage related securities are created from pools of residential or commercial mortgage loans, including mortgage loans made by savings and loan institutions, mortgage bankers, commercial banks and others. Asset backed securities are created from many types of assets, including auto loans, credit card receivables, home equity loans, and student loans. These securities provide a monthly payment that consists of both interest and principal payments. Interest payments may be determined by fixed or adjustable rates. The rate of pre-payments on underlying mortgages will affect the price and volatility of a mortgage related security, and may have the effect of shortening or extending the effective duration of the security relative to what was anticipated at the time of purchase. The timely payment of principal and interest of certain mortgage related securities is guaranteed by the full faith and credit of the United States Government. Mortgage related and other asset backed securities created and guaranteed by non-governmental issuers, including government-sponsored corporations, may be supported by various forms of insurance or guarantees, but there can be no assurance that the private insurers or guarantors can meet their obligations under the insurance policies or guarantee arrangements. The Fund, as shown on the Schedule of Investments, had mortgage related and other asset backed securities as of June 30, 2013. |
| 4. | Financial Derivative Instruments: |
The following disclosures contain information on how and why the Fund uses derivative instruments, the credit-risk-related contingent features in certain derivative instruments, and how derivative instruments affect the Fund’s financial position and results of operations. The location and fair value amounts of these instruments on the Statement of Assets and Liabilities and the realized gains and losses and changes in unrealized gains and losses on the Statement of Operations, each categorized by type of derivative contract, are included in the following Additional Derivative Instrument Information footnote. The derivative instruments outstanding as of period-end are disclosed in the notes to or within the Schedule of Investments for purchased options, if applicable. The amounts of realized gains and losses and changes in unrealized gains and losses on derivative instruments during the period are disclosed in the Statement of Operations.
| a) | Futures Contracts – The Fund may enter into futures contracts. A futures contract is an agreement between two parties to buy or sell an asset at a set price on a future date. The Fund uses futures contracts to manage or obtain exposure to the investment markets, commodities, or movements in interest rates. The primary risks associated with the use of futures contracts are the imperfect correlation between the change in market value of the investments held by the Fund and the prices of futures contracts and the possibility of an illiquid market. Upon entering into a futures contract, the Fund is required to deposit with a futures commission merchant (“FCM”) an amount of cash or U.S. Government or Agency Obligations in accordance with the initial margin requirements of the broker or exchange. Futures contracts are marked to market daily at the most recent settlement price reported by an exchange on which, over time, they are traded most extensively, and an appropriate payable or receivable for the change in value (“variation margin”) is recorded by the Fund. Gains or losses are recognized but not considered realized until the contracts expire or are closed. Futures contracts involve, to varying degrees, risk of loss in excess of the variation margin disclosed on the Statement of Assets and Liabilities; however, the Fund seeks to reduce this risk through the use of an FCM. The Fund, as shown on the Schedule of Investments, had outstanding futures contracts as of June 30, 2013. |
| b) | Options Contracts – An option contract is a contract sold by one party to another party that offers the buyer the right, but not the obligation, to buy (call) or sell (put) an investment or other financial asset at an agreed-upon price during a specific period of time or on a specific date. The Fund may write (sell) covered call and put options on futures, swaps (“swaptions”), securities or commodities. “Covered” means that so long as the Fund is obligated as the writer of an option, it will own either the underlying investments or currency or an option to purchase the same underlying |
| 30 |
investments or currency having an expiration date of the covered option and an exercise price equal to or less than the exercise price of the covered option, or will pledge cash or other liquid investments having a value equal to or greater than the fluctuating market value of the option investment or currency. Writing put options increases the Fund’s exposure to the underlying instrument. Writing call options decreases the Fund’s exposure to the underlying instrument. Premiums received from writing options that expire are treated as realized gains. Premiums received from writing options that are exercised or closed are added to the proceeds or offset amounts paid on the underlying futures, swap, investment or currency transaction to determine the realized gain or loss. The Fund as a writer of an option has no control over whether the underlying instrument may be sold (call) or purchased (put) and as a result bears the market risk of an unfavorable change in the price of the instrument underlying the written option. There is the risk the Fund may not be able to enter into a closing transaction because of an illiquid market. The Fund may also purchase put and call options. Purchasing call options increases the Fund’s exposure to the underlying instrument. Purchasing put options decreases the Fund’s exposure to the underlying instrument. The Fund pays a premium, which is included on the Fund’s Statement of Assets and Liabilities as an investment and is subsequently marked to market to reflect the current value of the option. Premiums paid for purchasing options that expire are treated as realized losses. Certain options may be purchased with premiums to be determined on a future date. The premiums for these options are based upon implied volatility parameters at specified terms. The risk associated with purchasing put and call options is generally limited to the premium paid. Premiums paid for purchasing options that are exercised or closed are added to the amounts paid or offset against the proceeds on the underlying investment transaction to determine the realized gain or loss. Entering into over-the-counter options also exposes the Fund to counterparty risk. Counterparty risk is the possibility that the counterparty to the agreements may default on its obligation to perform or disagree as to the meaning of the contractual terms in the agreements. The Fund, as shown on the Schedule of Investments, had outstanding purchased options and written options contracts as of June 30, 2013. Transactions involving written options contracts during the six-month period ended June 30, 2013, are summarized below:
| Options Contract Activity During the Six-month Period Ended June 30, 2013 | ||||||||
| Put Options Written During the Period | Number of Contracts* | Premium Amounts | ||||||
| Beginning of the period | 97,255 | $ | 13,218 | |||||
| Written | — | — | ||||||
| Expired | — | — | ||||||
| Closed | — | — | ||||||
| Exercised | — | — | ||||||
| End of period | 97,255 | $ | 13,218 | |||||
* The number of contracts does not omit 000's.
| c) | Additional Derivative Instrument Information: |
Fair Value of Derivative Instruments on the Statement of Assets and Liabilities as of June 30, 2013:
| Risk Exposure Category | ||||||||||||||||||||||||||||
| Interest Rate Contracts | Foreign Exchange Contracts | Credit Contracts | Equity Contracts | Commodity Contracts | Other Contracts | Total | ||||||||||||||||||||||
| Assets: | ||||||||||||||||||||||||||||
| Investments in securities, at value (purchased options), market value | $ | — | $ | — | $ | — | $ | 8,407 | $ | — | $ | — | $ | 8,407 | ||||||||||||||
| Variation margin receivable * | — | — | — | 981 | — | — | 981 | |||||||||||||||||||||
| Total | $ | — | $ | — | $ | — | $ | 9,388 | $ | — | $ | — | $ | 9,388 | ||||||||||||||
| Liabilities: | ||||||||||||||||||||||||||||
| Written options, market value | $ | — | $ | — | $ | — | $ | 3,952 | $ | — | $ | — | $ | 3,952 | ||||||||||||||
| Total | $ | — | $ | — | $ | — | $ | 3,952 | $ | — | $ | — | $ | 3,952 | ||||||||||||||
| * | Only current day's variation margin is reported within the Statement of Assets and Liabilities. The variation margin is included in the open futures cumulative appreciation of $624 as reported in the Schedule of Investments. |
| 31 |
| Hartford Portfolio Diversifier HLS Fund |
| Notes to Financial Statements – (continued) |
| June 30, 2013 (Unaudited) |
| (000’s Omitted) |
The volume of derivatives that is presented in the Schedule of Investments is consistent with the derivative activity during the six-month period ended June 30, 2013.
| The Effect of Derivative Instruments on the Statement of Operations for the six-month period ended June 30, 2013: |
| Risk Exposure Category | ||||||||||||||||||||||||||||
| Interest Rate Contracts | Foreign Exchange Contracts | Credit Contracts | Equity Contracts | Commodity Contracts | Other Contracts | Total | ||||||||||||||||||||||
| Realized Loss on Derivatives Recognized as a Result of Operations: | ||||||||||||||||||||||||||||
| Net realized loss on futures | $ | — | $ | — | $ | — | $ | (27,190 | ) | $ | — | $ | — | $ | (27,190 | ) | ||||||||||||
| Total | $ | — | $ | — | $ | — | $ | (27,190 | ) | $ | — | $ | — | $ | (27,190 | ) | ||||||||||||
| Net Change in Unrealized Appreciation (Depreciation) on Derivatives Recognized as a Result of Operations: | ||||||||||||||||||||||||||||
| Net change in unrealized depreciation of investments in purchased options | $ | — | $ | — | $ | — | $ | (5,867 | ) | $ | — | $ | — | $ | (5,867 | ) | ||||||||||||
| Net change in unrealized appreciation of futures | — | — | — | 498 | — | — | 498 | |||||||||||||||||||||
| Net change in unrealized appreciation of written options | — | — | — | 3,084 | — | — | 3,084 | |||||||||||||||||||||
| Total | $ | — | $ | — | $ | — | $ | (2,285 | ) | $ | — | $ | — | $ | (2,285 | ) | ||||||||||||
| d) | Balance Sheet Offsetting Information: |
Set forth below are tables which disclose both gross information and net information about instruments and transactions eligible for offset in the financial statements, and instruments and transactions that are subject to a master netting agreement, as well as amounts related to margin, reflected as financial collateral (including cash collateral), held at clearing brokers, counterparties, and the Fund’s custodian. The master netting agreements allow the clearing brokers to net any collateral held in or on behalf of the Fund, or liabilities or payment obligations of the clearing brokers to the Fund, against any liabilities or payment obligations of the Fund to the clearing brokers. The Fund is required to deposit financial collateral (including cash collateral) at the Fund’s custodian on behalf of clearing brokers and counterparties to continually meet the original and maintenance requirements established by the clearing brokers and counterparties. Such requirements are specific to the respective clearing broker or counterparty.
Offsetting of Financial Assets and Derivative Assets as of June 30, 2013:
| Description | Gross Amounts of Recognized Assets | Gross Amounts Offset in Statement of Assets and Liabilities | Net Amounts of Assets Presented in Statement of Assets and Liabilities | Financial Instruments with Allowable Netting | Collateral Received | Net Amount (not less than 0) | ||||||||||||||||||
| Futures contracts - Variation margin receivable | $ | 981 | $ | — | $ | 981 | $ | — | $ | (10,735 | ) | $ | — | |||||||||||
| Purchased options at market value | 8,407 | — | 8,407 | — | (4,738 | ) | 3,669 | |||||||||||||||||
| Repurchase Agreements | 38,952 | — | 38,952 | — | (39,738 | ) | — | |||||||||||||||||
| Total subject to a master netting or similar arrangement | $ | 48,340 | $ | — | $ | 48,340 | $ | — | $ | (55,211 | ) | $ | 3,669 | |||||||||||
| 32 |
Offsetting of Financial Liabilities and Derivative Liabilities as of June 30, 2013:
| Description | Gross Amounts of Recognized Liabilities | Gross Amounts Offset in Statement of Assets and Liabilities | Net Amounts of Assets Presented in Statement of Assets and Liabilities | Financial Instruments with Allowable Netting | Collateral Pledged | Net Amount (not less than 0) | ||||||||||||||||||
| Written options at market value | $ | 3,952 | $ | — | $ | 3,952 | $ | — | $ | — | $ | 3,952 | ||||||||||||
| Total subject to a master netting or similar arrangement | $ | 3,952 | $ | — | $ | 3,952 | $ | — | $ | — | $ | 3,952 | ||||||||||||
| 5. | Principal Risks: |
| a) | Credit and Counterparty Risks – Credit risk depends largely on the perceived financial health of bond issuers. In general, the credit rating is inversely related to the credit risk of the issuer. Higher rated bonds generally are deemed to have less credit risk, while lower or unrated bonds are deemed to have higher risk of default. The share price, yield and total return of a fund that holds securities with higher credit risk may be more volatile than those of a fund that holds bonds with lower credit risk. Similar to credit risk, the Fund may be exposed to counterparty risk, or the risk that an institution or other entity with which the Fund has unsettled or open transactions will default. |
| b) | Market Risks – The Fund’s investments expose the Fund to various risks including, but not limited to, interest rate, prepayment, extension, and equity risks. Interest rate risk is the risk that fixed income securities will decline in value because of changes in interest rates. As nominal interest rates rise, the values of certain fixed income securities held by the Fund are likely to decrease. A nominal interest rate can be described as the sum of a real interest rate and an expected inflation rate. Fixed income securities with longer durations tend to be more sensitive to changes in interest rates, usually making them more volatile than securities with shorter durations. Duration is useful primarily as a measure of the sensitivity of a fixed income security’s market price to interest rate (i.e., yield) movements. In addition, securities are subject to extension risk. Rising interest rates may cause prepayments to occur at a slower than expected rate, thereby effectively lengthening the maturity of the security and making the security more sensitive to interest rate changes. Prepayment and extension risk are major risks of mortgage backed securities and certain asset backed securities. For certain asset backed securities, the actual maturity may be less than the stated maturity shown in the Schedule of Investments, if applicable. As a result, the timing of income recognition relating to these securities may vary based upon the actual maturity. The market values of equity securities, such as common stocks and preferred stocks, or equity related investments, such as futures and options, may decline due to general market conditions which are not specifically related to a particular company, such as real or perceived adverse economic conditions, changes in the general outlook for corporate earnings, changes in interest or currency rates or adverse investor sentiment generally. The market value of equity securities may also decline due to factors which affect a particular industry or industries, such as labor shortages or increased production costs and competitive conditions within an industry. Equity securities and equity related investments generally have greater market price volatility than fixed income securities. |
| 6. | Federal Income Taxes: |
| a) | Federal Income Taxes – For federal income tax purposes, the Fund intends to continue to qualify as a RIC under Subchapter M of the Internal Revenue Code (“IRC”) by distributing substantially all of its taxable net investment income and net realized capital gains to its shareholders and otherwise complying with the requirements of the IRC. The Fund has distributed substantially all of its income and capital gains in prior years, if applicable, and intends to distribute substantially all of its income and capital gains prior to the next fiscal year-end. Accordingly, no provision for federal income or excise taxes has been made in the accompanying financial statements. Distributions from short-term capital gains are treated as ordinary income distributions for federal income tax purposes. |
| b) | Net Investment Income (Loss), Net Realized Gains (Losses), and Distributions – Net investment income (loss) and net realized gains (losses) may differ for financial statement and tax purposes primarily because of losses deferred due to |
| 33 |
| Hartford Portfolio Diversifier HLS Fund |
| Notes to Financial Statements – (continued) |
| June 30, 2013 (Unaudited) |
| (000’s Omitted) |
wash sale adjustments, foreign currency gains and losses, adjustments related to PFICs, REITs, RICs, certain derivatives and partnerships. The character of distributions made during the year from net investment income or net realized gains may differ from their ultimate characterization for federal income tax purposes. Also, due to the timing of dividend distributions, the fiscal year in which amounts are distributed may differ from the year that the income or realized gains (losses) were recorded by the Fund.
| c) | Distributions and Components of Distributable Earnings – The tax character of distributions paid by the Fund for the periods indicated is as follows (as adjusted for dividends payable, if applicable): |
| For the Year Ended December 31, 2012 | For the Period June 6, 2011 (Commencement of Operations) through December 31, 2011 | |||||||
| Ordinary Income | $ | 1,025 | $ | 486 | ||||
| Long-Term Capital Gains* | — | 57 | ||||||
| * | The Fund designates these distributions as long-term capital dividends pursuant to IRC Sec. 852(b)(3)(C). |
As of December 31, 2012, the Fund’s components of distributable earnings (deficit) on a tax basis were as follows:
| Amount | ||||
| Accumulated Capital and Other Losses | $ | (15,482 | ) | |
| Unrealized Appreciation* | 2,619 | |||
| Total Accumulated Deficit | $ | (12,863 | ) | |
| * | Differences between book-basis and tax-basis unrealized appreciation (depreciation) may be attributable to the losses deferred due to wash sale adjustments, foreign currency gains and losses, adjustments related to PFICs, REITs, RICs, certain derivatives and partnerships. |
| d) | Reclassification of Capital Accounts – The Fund may record reclassifications in its capital accounts. These reclassifications have no impact on the total net assets of the Fund. The reclassifications are a result of permanent differences between U.S. GAAP and tax accounting for such items as foreign currency, PFICs, expiration or utilization of capital loss carryforwards or net operating losses. Adjustments are made to reflect the impact these items have on current and future distributions to shareholders. Therefore, the source of the Fund’s distributions may be shown in the accompanying Statement of Changes in Net Assets as from undistributed net investment income, from accumulated net realized gains on investments or from capital depending on the type of book and tax differences that exist. For the year ended December 31, 2012, the Fund recorded reclassifications to increase (decrease) the accounts listed below: |
| Amount | ||||
| Undistributed Net Investment Income | $ | 458 | ||
| Accumulated Net Realized Gain (Loss) | (454 | ) | ||
| Capital Stock and Paid-in-Capital | (4 | ) | ||
| e) | Capital Loss Carryforward – On December 22, 2010, the Regulated Investment Company Modernization Act of 2010 (the “Act”) was enacted, which made changes to the capital loss carryforward rules. The changes are effective for taxable years beginning after the date of enactment. Under the Act, funds are permitted to carry forward capital losses for an unlimited period. Additionally, capital loss carryforwards retain their character as either short-term or long-term capital losses rather than being considered all short-term as permitted under prior regulation. |
| 34 |
At December 31, 2012 (tax-year-end), the Fund had capital loss carryforwards for U.S. federal income tax purposes as follows:
Capital loss carryforwards with no expiration:
| Amount | ||||
| Short-Term Capital Loss Carryforward | $ | 8,688 | ||
| Long-Term Capital Loss Carryforward | 6,794 | |||
| Total | $ | 15,482 | ||
| f) | Accounting for Uncertainty in Income Taxes – The Fund has adopted financial reporting rules that require the Fund to analyze all open tax years, as defined by the statute of limitations, for all major jurisdictions. Generally, tax authorities can examine all tax returns filed for the last three years. The Fund does not have an examination in progress. |
The Fund has reviewed all open tax years and major jurisdictions and concluded that these financial reporting rules had no effect on the Fund’s financial position or results of operations. There is no tax liability resulting from unrecognized tax benefits relating to uncertain income tax positions taken or expected to be taken on the tax return for the fiscal year ended December 31, 2012. The Fund is also not aware of any tax positions for which it is reasonably possible that the total amounts of unrecognized tax benefits will significantly change in the next twelve months.
| 7. | Expenses: |
| a) | Investment Management Agreement – Hartford Funds Management Company, LLC (“HFMC”), an indirect wholly owned subsidiary of The Hartford Financial Services Group, Inc. (“The Hartford”), serves as investment manager to the Fund pursuant to an Investment Management Agreement with the Company. The investment manager has overall investment supervisory responsibility for the Fund. In addition, the investment manager provides administrative personnel, services, equipment, facilities and office space for proper operation of the Fund. The investment manager has contracted with Hartford Investment Management Company (“Hartford Investment Management”) under a sub-advisory agreement for the provision of day-to-day investment management services to the Fund in accordance with the Fund’s investment objective and policies. The Fund pays a fee to the investment manager, a portion of which may be used to compensate Hartford Investment Management. |
The schedule below reflects the rates of compensation paid to HFMC for investment management services rendered as of June 30, 2013; the rates are accrued daily and paid monthly.
| Average Daily Net Assets | Annual Fee | |||
| On first $500 million | 0.60% | |||
| On next $500 million | 0.55% | |||
| On next $4 billion | 0.50% | |||
| On next $5 billion | 0.48% | |||
| Over $10 billion | 0.47% | |||
| b) | Accounting Services Agreement – Pursuant to the Fund Accounting Agreement between HFMC and the Company, on behalf of the Fund, HFMC provides accounting services to the Fund and receives monthly compensation based on the Fund’s average daily net assets at the rates set forth below. The Fund’s accounting services fees are accrued daily and paid monthly. |
| Average Daily Net Assets | Annual Fee | |||
| On first $5 billion | 0.018% | |||
| On next $5 billion | 0.016% | |||
| Over $10 billion | 0.014% | |||
| 35 |
| Hartford Portfolio Diversifier HLS Fund |
| Notes to Financial Statements – (continued) |
| June 30, 2013 (Unaudited) |
| (000’s Omitted) |
| c) | Operating Expenses – Allocable expenses incurred by the Company are allocated to each Fund in proportion to the average daily net assets of the Fund, except where allocation of certain expenses is more fairly made directly to the Fund. HFMC has contractually agreed to reimburse expenses (exclusive of taxes, interest expense, brokerage commissions, acquired fund fees and expenses and extraordinary expenses) to the extent necessary to maintain total annual operating expenses for the Class IB shares of the Fund at the annual rate of 0.85% of the Fund’s average daily net assets. This contractual arrangement will remain in effect until April 30, 2014, and shall renew automatically for one-year terms unless HFMC provides written notice of termination prior to the start date of the next term or upon approval of the Board of Directors of the Company. |
| d) | Distribution Plan for Class IB shares – The Company, on behalf of the Fund, has adopted a Distribution Plan pursuant to Rule 12b-1 of the 1940 Act to compensate the distributor, Hartford Funds Distributors, LLC (“HFD”), (formerly known as Hartford Investment Financial Services, LLC), an indirect wholly owned subsidiary of The Hartford, from assets attributable to the Class IB shares for services rendered and expenses borne in connection with activities primarily intended to result in the sale of the Class IB shares, subject to the review and approval of the Company’s Board of Directors. |
The Distribution Plan provides that the Fund may pay annually up to 0.25% of the average daily net assets of the Fund attributable to its Class IB shares for activities primarily intended to result in the sale of Class IB shares. The Board has the authority to suspend or reduce these payments at any point in time. Under the terms of the Distribution Plan and the principal underwriting agreement, the Fund is authorized to make payments monthly to the distributor that may be used to pay or compensate entities providing distribution and shareholder servicing with respect to the Class IB shares for such entities’ fees or expenses incurred or paid in that regard. These fees are accrued daily and paid monthly.
| e) | Other Related Party Transactions – Certain officers of the Fund are directors and/or officers of the investment manager and/or The Hartford or its subsidiaries. For the six-month period ended June 30, 2013, a portion of the Fund’s Chief Compliance Officer’s salary was paid by all the investment companies in the Hartford fund complex. The portion allocated to the Fund rounds to zero. Hartford Administrative Services Company (“HASCO”), an indirect wholly owned subsidiary of The Hartford, provides transfer agent services to the Fund. HASCO was compensated on a per account basis for providing such services. The amount paid to HASCO can be found in the Statement of Operations. These fees are accrued daily and paid monthly. |
| 8. | Affiliate Holdings: |
As of June 30, 2013, affiliates of The Hartford had ownership of shares in the Fund as follows:
| Percentage of Class | ||||
| Class IB | 11% | |||
| 9. | Investment Transactions: |
For the six-month period ended June 30, 2013, the cost of purchases and proceeds from sales of investment securities (excluding short-term investments) were as follows:
| Amount | ||||
| Cost of Purchases Excluding U.S. Government Obligations | $ | 159,204 | ||
| Sales Proceeds Excluding U.S. Government Obligations | 96,341 | |||
| Cost of Purchases for U.S. Government Obligations | 28,568 | |||
| Sales Proceeds for U.S. Government Obligations | 4,018 | |||
| 36 |
| 10. | Industry Classifications: |
Other than the industry classifications “Other Investment Pools and Funds” and “Exchange Traded Funds,” equity industry classifications used in this report are the Global Industry Classification Standard, which was developed by and is the exclusive property and service mark of MSCI, Inc. and Standard & Poor’s.
| 11. | Indemnifications: |
Under the Company’s organizational documents, the Company shall indemnify its officers and directors to the full extent required or permitted under Maryland General Corporation Law and the federal securities laws. In addition, the Company, on behalf of the Fund, may enter into contracts that contain a variety of indemnifications. The Company’s maximum exposure under these arrangements is unknown. However, as of the date of these financial statements, the Company has not had prior claims or losses pursuant to these contracts and expects the risk of loss to be remote.
| 12. | Pending Legal Proceedings: |
On February 25, 2011, Jennifer L. Kasilag, Louis Mellinger, Judith M. Menendez, Jacqueline M. Robinson, and Linda A. Russell filed a derivative lawsuit against Hartford Investment Financial Services, LLC (“HIFSCO”)(now known as Hartford Funds Distributors, LLC) on behalf of six Hartford retail mutual funds in the United States District Court for the District of New Jersey, alleging that HIFSCO received excessive advisory and distribution fees in violation of its statutory fiduciary duty under Section 36(b) of the 1940 Act when serving as investment manager and principal underwriter, respectively, to the Hartford retail mutual funds. HIFSCO moved to dismiss and, in September 2011, the motion was granted in part and denied in part, with leave to amend the complaint. In November 2011, plaintiffs filed an amended complaint on behalf of certain Hartford retail mutual funds, The Hartford Global Health Fund (now known as The Hartford Healthcare Fund), The Hartford Conservative Allocation Fund, The Hartford Growth Opportunities Fund, The Hartford Inflation Plus Fund, The Hartford Advisers Fund (now known as The Hartford Balanced Fund), and The Hartford Capital Appreciation Fund. Plaintiffs seek to rescind the investment management agreements and distribution plans between HIFSCO and these funds and to recover the total fees charged thereunder or, in the alternative, to recover any improper compensation HIFSCO received, in addition to lost earnings. HIFSCO filed a partial motion to dismiss the amended complaint and, in December 2012, the court dismissed without prejudice the claims regarding distribution fees and denied the motion with respect to the advisory fees claims. HIFSCO disputes the allegations and intends to defend vigorously.
This action concerns the activities of HIFSCO in its capacity as investment manager and principal underwriter to the Hartford retail mutual funds and does not concern HIFSCO’s activities in its capacity as principal underwriter to the HLS funds. For this reason, no accrual for litigation relating to this matter has been recorded in the financial statements of the Fund.
| 37 |
| Hartford Portfolio Diversifier HLS Fund |
| Financial Highlights |
| - Selected Per-Share Data (A) - |
| Class | Net Asset Value at Beginning of Period | Net Investment Income (Loss) | �� | Net Realized and Unrealized Gain (Loss) on Investments | Total from Investment Operations | Dividends from Net Investment Income | Distributions from Realized Capital Gains | Distributions from Capital | Total Distributions | Net Asset Value at End of Period | ||||||||||||||||||||||||||
| For the Six-Month Period Ended June 30, 2013 (Unaudited) | ||||||||||||||||||||||||||||||||||||
| IB | $ | 9.38 | $ | 0.01 | $ | (0.75 | ) | $ | (0.74 | ) | $ | – | $ | – | $ | – | $ | – | $ | 8.64 | ||||||||||||||||
| For the Year Ended December 31, 2012 | ||||||||||||||||||||||||||||||||||||
| IB | 10.18 | 0.02 | (0.79 | ) | (0.77 | ) | (0.03 | ) | – | – | (0.03 | ) | 9.38 | |||||||||||||||||||||||
| From June 6, 2011 (commencement of operations) through December 31, 2011 (E) | ||||||||||||||||||||||||||||||||||||
| IB(F) | 10.00 | 0.04 | 0.19 | 0.23 | (0.03 | ) | (0.02 | ) | – | (0.05 | ) | 10.18 | ||||||||||||||||||||||||
| (A) | Information presented relates to a share outstanding throughout the indicated period. |
| (B) | The figures do not include sales charges or other fees which may be applied at the variable annuity product level. Any such additional sales charges or other fees would lower the Fund's performance. |
| (C) | Not annualized. |
| (D) | Annualized. |
| (E) | Per share amounts have been calculated using the average shares method. |
| (F) | Commenced operations on June 6, 2011. |
| 38 |
| - Ratios and Supplemental Data - |
| Total Return(B) | Net Assets at End of Period | Ratio of Expenses to Average Net Assets Before Waivers | Ratio of Expenses to Average Net Assets After Waivers | Ratio of Net Investment Income (Loss) to Average Net Assets | Portfolio Turnover Rate | |||||||||||||||||
| (7.87 | )%(C) | $ | 403,376 | 0.89 | %(D) | 0.85 | %(D) | 0.16 | %(D) | 44 | % | |||||||||||
| (7.58 | ) | 295,762 | 0.91 | 0.85 | 0.27 | 61 | ||||||||||||||||
| 2.38 | (C) | 106,581 | 0.93 | (D) | 0.85 | (D) | 0.58 | (D) | 43 | |||||||||||||
| 39 |
| Hartford Portfolio Diversifier HLS Fund |
| Directors and Officers (Unaudited) |
The Board of Directors of the Company appoints officers who are responsible for the day-to-day operations of the Fund and who execute policies formulated by the Directors. Each director serves until his or her death, resignation, or retirement or until the next annual meeting of shareholders is held or until his or her successor is elected and qualifies.
Directors and officers who are employed by or who have a financial interest in The Hartford are considered “interested” persons of the Fund pursuant to the 1940 Act. Each officer and two of the Company’s directors, as noted in the chart below, are “interested” persons of the Fund. Each director serves as a director for The Hartford Mutual Funds, Inc., The Hartford Mutual Funds II, Inc., Hartford Series Fund, Inc., Hartford HLS Series Fund II, Inc., and as a trustee for The Hartford Alternative Strategies Fund, which, as of June 30, 2013, collectively consist of 90 funds. Correspondence may be sent to directors and officers c/o Hartford Mutual Funds, P.O. Box 2999, Hartford, Connecticut 06104-2999, except that correspondence to Mr. Annoni, Mr. Dressen, Ms. Fagely and Ms. Quade may be sent to 500 Bielenberg Drive, Woodbury, Minnesota 55125 and correspondence to Mr. Davey and Mr. Melcher may be sent to 5 Radnor Corporate Center, Suite 300, 100 Matsonford Road, Radnor, Pennsylvania 19087.
The table below sets forth, for each director and officer, his or her name, year of birth, current position with the Company and date first elected or appointed to Hartford Series Fund, Inc. (“HSF”), and Hartford HLS Series Fund II, Inc. (“HSF2”), principal occupation, and, for directors, other directorships held. The Fund’s statement of additional information contains further information on the directors and is available free of charge by calling 1-800-862-6668 or writing to Hartford HLS Funds, c/o Hartford Life Insurance Company, Hartford Life and Annuity Insurance Company, P.O. Box 14293, Lexington, KY 40512-4293.
Information on the aggregate remuneration paid to the directors of the Company can be found in the Statement of Operations herein. The Fund pays to The Hartford a portion of the Chief Compliance Officer’s compensation, but does not pay salaries or compensation to any of their other officers or directors who are employed by The Hartford.
Non-Interested Directors
Lynn S. Birdsong (1946) Director since 2003, Co-Chairman of the Investment Committee
Mr. Birdsong is a private investor. Mr. Birdsong currently serves as a Director of the Sovereign High Yield Investment Company (April 2010 to current). Mr. Birdsong currently serves as an Independent Director of Nomura Partners Funds, Inc. (formerly, The Japan Fund) (March 2003 to current). From 1979 to 2002, Mr. Birdsong was a managing director of Zurich Scudder Investments, an investment management firm. During his employment with Scudder, Mr. Birdsong was an Interested Director of The Japan Fund. Since 1981, Mr. Birdsong has been a partner in Birdsong Company, an advertising specialty firm.
Robert M. Gavin, Jr. (1940) Director since 2002 (HSF) and 1986 (HSF2), Chairman of the Board since 2004
Dr. Gavin is an educational consultant. Prior to September 1, 2001, he was President of Cranbrook Education Community and prior to July 1996, he was President of Macalester College, St. Paul, Minnesota.
Duane E. Hill (1945) Director since 2001 (HSF) and 2002 (HSF2), Chairman of the Nominating Committee
Mr. Hill is Partner of TSG Ventures L.P., a private equity investment company. Mr. Hill is a former partner of TSG Capital Group, a private equity investment firm that served as sponsor and lead investor in leveraged buyouts of middle market companies.
Sandra S. Jaffee (1941) Director since 2005
Ms. Jaffee is the founder and Chief Executive Officer of a private company, Homeworks Concierge, LLC, which provides residential property management services in Westchester County, New York (January 2012 to present). Ms. Jaffee served as Chairman (2008 to 2009) and Chief Executive Officer of Fortent (formerly Searchspace Group), a leading provider of compliance/regulatory technology to financial institutions from August 2005 to August 2009. Ms. Jaffee currently serves as a member of the Board of Directors of Broadridge Financial Solutions as well as a Trustee of Muhlenberg College.
William P. Johnston (1944) Director since 2005, Chairman of the Compliance Committee
In February 2008, Mr. Johnston was elected to the Board of Directors of HCR-ManorCare, Inc. In August 2007, Mr. Johnston was elected to the Board of Directors of LifeCare Holdings, Inc. In July 2006, Mr. Johnston was elected to the Board of Directors of MultiPlan, Inc. and served as a director (July 2006 to August 2010). In June 2006, Mr. Johnston was appointed as Senior Advisor to The Carlyle Group, a global private equity and alternative asset investment firm. In May 2006, Mr. Johnston was elected to the Supervisory Board of Fresenius Medical Care AG & Co. KGaA, after its acquisition of Renal Care Group, Inc. in March 2006.
| 40 |
Phillip O. Peterson (1944) Director since 2002 (HSF) and 2000 (HSF2), Chairman of the Audit Committee
Mr. Peterson is a mutual fund industry consultant. He was a partner of KPMG LLP (an accounting firm) until July 1999. Mr. Peterson joined William Blair Funds in February 2007 as a member of the Board of Trustees. Mr. Peterson also joined the Board of Trustees of Symetra Variable Mutual Funds Trust as a trustee in February 2012.
Lemma W. Senbet (1946) Director since 2005
Dr. Senbet is the William E. Mayer Chair Professor of Finance and Director, Center for Financial Policy, at the University of Maryland, Robert H. Smith School of Business. He was chair of the Finance Department from 1998 to 2006. Previously he was a chaired professor of finance at the University of Wisconsin-Madison. Also, he was director of the Fortis Funds from March 2000 to July 2002. Dr. Senbet served the finance profession in various capacities, including as director of the American Finance Association and President of the Western Finance Association. In 2006, Dr. Senbet was inducted Fellow of Financial Management Association International for his career-long distinguished scholarship and professional service.
Interested Directors and Officers
James E. Davey (1964) Director since 2012, President and Chief Executive Officer since 2010
Mr. Davey serves as Executive Vice President of Hartford Life Insurance Company (“HLIC”) and The Hartford Financial Services Group, Inc. Additionally, Mr. Davey serves as Chairman of the Board and Manager of Hartford Funds Distributors, LLC (“HFD”) and Hartford Administrative Services Company (“HASCO”). Mr. Davey also serves as Manager, President and Chairman of the Board for Hartford Funds Management Company, LLC (“HFMC”). Mr. Davey joined The Hartford in 2002.
Lowndes A. Smith (1939) Director since 1996 (HSF) and 2002 (HSF2), Co-Chairman of the Investment Committee
Mr. Smith served as Vice Chairman of The Hartford from February 1997 to January 2002, as President and Chief Executive Officer of Hartford Life, Inc. from February 1997 to January 2002, and as President and Chief Operating Officer of The Hartford Life Insurance Companies from January 1989 to January 2002. Mr. Smith serves as a Director of White Mountains Insurance Group, Ltd., One Beacon Insurance and Symetra Financial and as Managing Director of Whittington Gray Associates.
Other Officers
Mark A. Annoni (1964) Vice President, Controller and Treasurer since 2012
Mr. Annoni serves as the Assistant Vice President of HLIC (February 2004 to present). Mr. Annoni joined The Hartford in April 2001 as part of The Hartford’s acquisition of Fortis Financial Group (“Fortis”). Prior to joining The Hartford, Mr. Annoni served as Manager of Mutual Fund Accounting at Fortis (July 1997 to April 2001).
Michael R. Dressen (1963) AML Compliance Officer since 2011
Mr. Dressen currently serves as Assistant Vice President of HLIC. He also serves as Chief Compliance Officer and AML Compliance Officer of HASCO and as AML Officer of HFD. Mr. Dressen joined The Hartford in 2005 from State Farm Insurance Companies where he held various positions related to mutual funds, variable products, and property casualty insurance.
Tamara L. Fagely (1958) Vice President since 2002 (HSF) and 1993 (HSF2)
Currently, Ms. Fagely is President and a Director of HASCO, Chief Administrative Officer and Manager of HFMC and a Vice President of HLIC. Ms. Fagely served as a Vice President of HASCO (1998-2013) and Chief Financial Officer of HASCO (2006-2013). She served as Assistant Vice President of HLIC from December 2001 through March 2005. In addition, Ms. Fagely is Manager and Chief Operating Officer of HFD.
Edward P. Macdonald (1967) Vice President, Secretary and Chief Legal Officer since 2005
Mr. Macdonald serves as Vice President of HLIC and Vice President, Chief Legal Officer and Secretary of HFD and HASCO. Mr. Macdonald also serves as Manager, Vice President, Chief Legal Officer and Secretary of HFMC. Mr. Macdonald joined The Hartford in 2005.
Joseph G. Melcher (1973) Vice President and Chief Compliance Officer since 2013(1)
Mr. Melcher currently serves as Vice President of HFMC and HFD. Mr. Melcher joined The Hartford in 2012 from Touchstone Investments, a member of the Western & Southern Financial Group, where he held the position of Vice President and Chief Compliance Officer from 2010 through 2012 and Assistant Vice President, Compliance from 2005 to 2010.
| (1) | Mr. Melcher was named Vice President and Chief Compliance Officer of HSF and HSF2 on February 6, 2013. Prior to February 6, 2013, Colleen Pernerewski served as Chief Compliance Officer of HSF and HSF2. |
| 41 |
| Hartford Portfolio Diversifier HLS Fund |
| Directors and Officers (Unaudited) – (continued) |
Vernon J. Meyer (1964) Vice President since 2006
Mr. Meyer serves as Senior Vice President of HLIC. He also serves as Senior Vice President of HFMC and HFD. Mr. Meyer joined The Hartford in 2004.
Laura S. Quade (1969) Vice President since 2012
Ms. Quade currently serves as Vice President of HASCO and is a Director of Mutual Fund Service Operations. She also serves as Director, Enterprise Operations of HFD and HLIC. Ms. Quade joined The Hartford in 2001 as part of The Hartford’s acquisition of Fortis.
Elizabeth L. Schroeder (1966) Vice President since 2010(2)
Ms. Schroeder currently serves as Assistant Vice President of HLIC. Ms. Schroeder joined HLIC in 1991. She is also an Assistant Vice President of HFMC and HASCO.
(2) Ms. Schroeder served as Vice President of HSF and HSF2 until August 7, 2013.
Martin Swanson (1962) Vice President since 2010
Mr. Swanson is a Vice President of HLIC. Mr. Swanson also serves as Chief Marketing Officer for HFD. Prior to joining HLIC in 1998, Mr. Swanson was a Vice President at PaineWebber, Inc.
HOW TO OBTAIN A COPY OF THE FUND’S PROXY VOTING POLICIES AND VOTING RECORDS (UNAUDITED)
A description of the policies and procedures that the Fund uses to determine how to vote proxies relating to portfolio securities and information about how the Fund voted proxies relating to portfolio securities during the most recent twelve-month period ended June 30 are available (1) without charge, upon request, by calling 800-862-6668 and (2) on the SEC’s website at http://www.sec.gov.
QUARTERLY PORTFOLIO HOLDINGS INFORMATION (UNAUDITED)
The Fund files a complete schedule of portfolio holdings with the SEC for the first and third quarters of each fiscal year on Form N-Q. The Fund’s Forms are available (1) without charge, upon request, by calling 800-862-6668 and (2) on the SEC’s website at http://www.sec.gov. The Form N-Q may be reviewed and copied at the SEC’s Public Reference Room in Washington, DC. Information on the operation of the Public Reference Room may be obtained by calling 1-800-SEC-0330.
| 42 |
| Hartford Portfolio Diversifier HLS Fund |
| Expense Example (Unaudited) |
Your Fund's Expenses
As a shareholder of the Fund, you incur two types of costs: (1) transaction costs and (2) ongoing costs including investment management fees, distribution fees, and other fund expenses. This example is intended to help you understand your ongoing costs (in dollars) of investing in the Fund and to compare these costs with the ongoing costs of investing in other mutual funds. The example is based on an investment of $1,000 invested at the beginning of the period and held for the period of December 31, 2012 through June 30, 2013.
Actual Expenses
The first set of columns of the table below provides information about actual account values and actual expenses. You may use the information in this column, together with the amount you invested, to estimate the expenses that you paid over the period. Simply divide your account value by $1,000 (for example, an $8,600 account value divided by $1,000 = 8.6), then multiply the result by the number in the line under the heading entitled “Expenses Paid During Period” to estimate the expenses you paid on your account during this period.
Hypothetical Example for Comparison Purposes
The second set of columns of the table below provides information about hypothetical account values and hypothetical expenses based on the Fund’s actual expense ratio and an assumed rate of return of 5% per year before expenses, which is not the Fund’s actual return. The hypothetical account values and expenses may not be used to estimate the actual ending account balance or expenses you paid for the period. You may use this information to compare the ongoing costs of investing in the Fund and other funds. To do so, compare this 5% hypothetical example with the 5% hypothetical examples that appear in the shareholder reports of the other funds.
Please note that the expenses shown in the table are meant to highlight your ongoing costs only and do not reflect any transactional costs, such as sales charges (loads) and CDSC. Therefore, the second set of columns of the table is useful in comparing ongoing costs only, and will not help you determine the relative total costs of owning different funds. In addition, if these transactional costs were included, your costs would be higher. Expenses are equal to the Fund's annualized expense ratios multiplied by average account value over the period, multiplied by 181/365 (to reflect the one-half year period).
| Actual return | Hypothetical (5% return before expenses) | |||||||||||||||||||||||||||||||||||
Beginning | Ending | Expenses paid during the period December 31, 2012 through June 30, 2013 | Beginning | Ending | Expenses paid | Annualized | Days in | Days | ||||||||||||||||||||||||||||
| Class IB | $ | 1,000.00 | $ | 921.30 | $ | 4.05 | $ | 1,000.00 | $ | 1,020.58 | $ | 4.26 | 0.85 | % | 181 | 365 | ||||||||||||||||||||
| 43 |
| Hartford Portfolio Diversifier HLS Fund |
| Principal Risks (Unaudited) |
The principal risks of investing in the Fund are described below.
Market and Selection Risk: The Fund’s share price may fluctuate due to market risk and/or security selections that may underperform compared to the market or relevant benchmarks.
Derivatives Risk: Investments in derivatives can be volatile. Potential risks include currency risk, leverage risk (the risk that small market movements may result in large changes in the value of an investment), liquidity risk, index risk, pricing risk, and counterparty risk (the risk that the counterparty may be unwilling or unable to honor its obligations).
Fixed Income Risk: The Fund is subject to interest rate risk (the risk that the value of an investment decreases when interest rates rise) and credit risk (the risk that the issuing company of a security is unable to pay interest and principal when due) and call risk (the risk that an investment may be redeemed early). These risks also apply to the Fund’s investment in U.S. government securities, which may not be guaranteed by the U.S. government.
Fund Strategy Risk: The Fund is available solely to holders of variable annuity contracts issued by Hartford Life and its affiliates and by Forethought who have elected a Rider. The Fund is designed to replicate the Index, which is designed to produce investment performance that may mitigate against significant declines in the values of the Allocated Funds held by Rider holders. Hartford Life and its affiliates and Forethought have financial obligations to holders of the Riders arising from guarantee obligations under the Riders. To the extent that the Fund’s strategy is successful, Hartford Life and its affiliates and Forethought will benefit from a reduction of the risk arising from their guarantee obligations under the Riders, and they will have less risk to hedge under the Riders than would be the case if holders did not allocate to the Fund.
As a holder of a Rider, you also will have exposure to changes in the values of the Allocated Funds, although your particular exposure will differ from the aggregated exposure that the Index is designed to address, depending on your allocations and investment activity, among other factors. Although the Fund may have the effect of mitigating declines in your contract value under a Rider in the event of a significant decline in equity market valuations, the strategy followed by the Fund, if successful, will also generally result in your contract value increasing to a lesser degree than the equity markets, or decreasing, when the values of equity investments are stable or rising. This may deprive you of some or all of the benefit of increases in equity market values under your contract and could also result in a decrease in the value of your variable annuity contract. Depending on future market conditions, you might benefit more from selecting alternative allocations under a guaranteed benefit rider (if available) or alternate investments. In addition, there is no guarantee that the Fund’s strategy will have its intended effect, and it may not work as effectively as is intended. Depending on your particular allocation to the Allocated Funds under a Rider, the Fund’s strategy may be more or less effective in mitigating potential losses under your variable annuity contract than may be the case for others who elect a Rider and allocate contract value differently among the Allocated Funds. In particular, the Fund’s investment strategy is not as likely to be as effective with respect to allocations that have relatively lower anticipated correlation to the investment performance of the S&P 500 Index.
Hartford Life’s and Forethought’s financial interest in reducing the volatility of overall contract value invested under the Riders, in light of their obligations under the Riders, may be deemed to present a potential conflict of interest with respect to the interests of the holders of the Riders, in that Hartford Life’s and Forethought’s interest may at times conflict with the Fund’s goal of preserving the potential for modest appreciation in the Fund’s net asset value when markets are appreciating. HFMC and the Fund have developed procedures designed to address this potential conflict by (i) specifying the processes for developing and communicating the data used to calculate the Index, calculating the Index and managing the Fund to replicate the performance of the Index and (ii) monitoring for compliance with the specified processes.
| 44 |
Index and Information Risk: The data used by HFMC to calculate the Index may not always be current. To the extent the data, and in particular the market-related data, is outdated or inaccurate, the Derivative Sleeve may fail to hedge or may hedge less effectively against equity market declines. In addition, when the values of investments are increasing, the Fund’s value could increase to a lesser extent, or decrease to a greater extent, than would be the case if the data used to calculate the Index were current.
In addition, the Index is intended to hedge against the aggregate allocations of holders of the Riders to the Allocated Funds and not the allocation of any individual contract owner. The Derivative Sleeve may not be successful in providing an effective hedge, and the hedge, even if effective, will benefit some Rider holders more than others, depending upon the allocations to funds selected by the holders. In particular, contract owners whose allocations have a relatively higher anticipated correlation to the investment performance of the S&P 500 Index will benefit to a greater extent from the hedge during periods of equity market declines.
| 45 |
HARTFORD HLS FUNDS
c/o The Hartford Wealth Management - Global Annuities
P.O. Box 14293
Lexington, KY 40512-4293
HARTFORDFUNDS
hartfordfunds.com
Hartford Series Fund, Inc. is underwritten and distributed by Hartford Funds Distributors, LLC.
Hartford Series Fund, Inc. inception dates range from 1977 to date. Hartford Series Fund, Inc. is not a subsidiary of The Hartford Financial Services Group, Inc. ("The Hartford") but is underwritten, distributed by and advised by subsidiaries of The Hartford. Investments in Hartford Series Fund, Inc. are not guaranteed by The Hartford or any other entity.
You should carefully consider investment objectives, risks, and charges and expenses of Hartford HLS Funds before investing. This and other information can be found in the Fund’s prospectus or summary prospectus, which can be obtained by calling 800-862-6668. Please read them carefully before you invest or send money.
HLSSAR-PD13 8-13 113550-1 Printed in U.S.A ©2013 The Hartford, Hartford, CT 06115
HARTFORDFUNDS
| HARTFORD
SMALL COMPANY HLS FUND
2013 Semi Annual Report
|
A MESSAGE FROM THE PRESIDENT
Dear Fellow Shareholders:
I want to take this opportunity to say thank you for investing in the Hartford HLS Funds.
Market Review
During the first half of the year, stocks rose steadily. U.S. equities (as represented by the S&P 500 Index1) posted a strong gain of 10.61% during the first quarter, on their way to an all-time high. During the second quarter, investors persevered through volatility surrounding rumors of the rollback of the U.S. Federal Reserve’s quantitative easing (QE) program later this year, and the S&P 500 Index rose 2.91%. That brought the market’s rise to 13.82% for the first half of 2013. The rumors about QE’s end sent bond yields and mortgage rates upward, but that wasn’t enough to dissuade investors from pushing equities into positive territory.
Because of QE, some have expressed concerns regarding the recent market rally. But a more careful examination of economic data reveals a strong foundation. Consumer balance sheets have improved since the financial crisis, with consumer debt as a percentage of income falling steadily. Housing continued its dogged recovery, fueled by population growth and pent-up demand. In fact, it’s substantive economic improvements that have moved Federal Reserve Chairman Ben Bernanke to consider removing the “training wheels” of QE, which we think should be viewed as a vote of confidence in the U.S. economy going forward.
As the U.S. outlook continues to improve, concerns do remain in the global economy. Emerging markets have lagged due to social unrest and rising inflation. Slowing growth in China is clouding global growth forecasts, but it’s important to remember that China still boasts 7.5% annual GDP growth.
It’s important to stay abreast of domestic and international economic developments while balancing your individual investment goals. Meeting with your financial advisor on a regular basis to examine your current investment strategy can help you determine whether you are on the right track:
| • | Is your portfolio fully diversified with an appropriate mix of stocks and bonds? |
| • | Is your fixed-income portfolio positioned to take advantage of opportunities across the credit spectrum and fulfill your income needs? |
| • | Is your portfolio still in line with your risk tolerance and investment time horizon? |
Your financial professional can help you choose options within our fund family to navigate today’s markets with confidence.
Thank you again for investing with the Hartford HLS Funds.
James Davey
President
Hartford HLS Funds
1 The S&P 500 Index is a market capitalization-weighted price index composed of 500 widely held common stocks.
Hartford Small Company HLS Fund
This report is prepared for the general information of contract owners and qualified retirement plan participants. It is not an offer of contracts or of qualified retirement plans. It should not be used in connection with any offer, except in conjunction with the appropriate product prospectus which contains all pertinent information including the applicable sales, administrative and other charges.
The views expressed in the Fund’s Manager Discussion under ‘‘Why did the Fund perform this way?’’ and ‘‘What is the outlook?’’ are views of the Fund’s sub-adviser and portfolio management team through the end of the period and are subject to change based on market and other conditions. The Fund’s Manager Discussion is for informational purposes only and does not represent an offer, recommendation or solicitation to buy, hold or sell any security. The specific securities identified and described, if any, do not represent all of the securities purchased or sold and you should not assume that investments in the securities identified and discussed will be profitable.
| Hartford Small Company HLS Fund inception 08/09/1996 | |
| (sub-advised by Wellington Management Company, LLP) | |
| Investment objective – Seeks growth of capital. | |
Performance Overview 6/30/03 - 6/30/13

The chart above represents the hypothetical growth of a $10,000 investment in Class IA. Growth results in classes other than Class IA will vary from what is seen above due to differences in the expenses charged to those share classes.
Average Annual Total Returns (as of 06/30/13)
| 6 Month† | 1 Year | 5 Years | 10 Years | |||||||||||||
| Small Company IA | 19.03% | 23.89% | 7.16% | 10.83% | ||||||||||||
| Small Company IB | 18.88% | 23.58% | 6.89% | 10.56% | ||||||||||||
| Russell 2000 Growth Index | 17.44% | 23.67% | 8.89% | 9.62% | ||||||||||||
| † | Not Annualized |
PERFORMANCE DATA QUOTED REPRESENTS PAST PERFORMANCE AND DOES NOT GUARANTEE FUTURE RESULTS. The investment return and principal value of the investment will fluctuate so that investors’ shares, when redeemed, may be worth more or less than their original cost. Current performance may be lower or higher than the performance data quoted. To obtain performance data current to the most recent month-end, please visit our website www.hartfordfunds.com.
Total returns presented above were calculated using the Fund's net asset value available to shareholders for sale or redemption of Fund shares on June 30, 2013, which may exclude investment transactions as of this date. All share class returns assume the reinvestment of all distributions at net asset value and the deduction of all fund expenses.
Russell 2000 Growth Index is an unmanaged index of those Russell 2000 Index growth companies with higher price-to-book ratios and higher forecasted growth values. (The Russell 2000 Index is a broad-based unmanaged index comprised of 2,000 of the smallest U.S.-domiciled company common stocks (on the basis of capitalization) that are traded in the United States on the New York Stock Exchange, American Stock Exchange and Nasdaq.)
You cannot invest directly in an index.
As of the Fund’s current prospectus dated May 1, 2013, the total annual operating expense ratios for Class IA and Class IB shares were 0.72% and 0.97%, respectively. Actual expenses may be higher. Please see the accompanying Financial Highlights for expense ratios for the six-month period ended June 30, 2013.
For additional information regarding the prior performance history of the Fund, please see the section entitled “Performance Notes” in the Fund’s prospectus.
The chart and table do not reflect the deductions of taxes, sales charges or other fees which may be applied at the variable life insurance, variable annuity or qualified retirement plan product level. Any such additional sales charges or other fees or expenses would lower the contract’s or plan’s performance.
All investments are subject to risk including the possible loss of principal. For a discussion of the Fund’s risks, please see the Principal Risks section. For more detailed information on the risks associated with an investment in the Fund, please see the prospectus.
| 2 |
| Hartford Small Company HLS Fund |
| Manager Discussion |
June 30, 2013 (Unaudited) |
| Portfolio Managers | ||
| Steven C. Angeli, CFA | Stephen C. Mortimer | Jamie A. Rome, CFA |
| Senior Vice President and Equity Portfolio Manager | Senior Vice President and Equity Portfolio Manager | Senior Vice President and Equity Portfolio Manager |
| Mario E. Abularach, CFA | Mammen Chally, CFA | |
| Senior Vice President and Equity Research Analyst | Vice President and Equity Portfolio Manager |
How did the Fund perform?
The Class IA shares of the Hartford Small Company HLS Fund returned 19.03% for the six-month period ended June 30, 2013, outperforming its benchmark, the Russell 2000 Growth Index which returned 17.44% for the same period. The Fund also outperformed the 16.63% average return of the Variable Products-Underlying Funds Lipper Small-Cap Growth Funds peer group, a group of funds with investment strategies similar to those of the Fund.
Why did the Fund perform this way?
U.S. equities (+13.8%), as measured by the S&P 500 Index, gained during the six-month period, reaching an all-time high in May. The rally began on the first trading day of the year after a last-minute compromise by the U.S. Congress averted the fiscal cliff. Optimism surrounding the fiscal reprieve was furthered during the first half of the period by better-than-expected corporate earnings, a robust housing market, and a gradually improving employment picture. In the second half of the period, a market rally throughout April and the first part of May paused following comments by Federal Reserve (Fed) Chairman Ben Bernanke that suggested the Fed might begin to slow quantitative easing (QE) sooner than investors anticipated. The Federal Open Market Committee’s June statement emphasized that the tapering schedule would depend on improving economic indicators. A strong housing market, positive consumer confidence trends, and a steadily healing labor market lent support to the thesis that underlying fundamentals were solid. Following an initially dramatic negative response to the Fed’s announcement and an increase in lending rates in China, U.S. markets moved higher into the end of the period.
Small cap (+15.9%) stocks outperformed large cap stocks (+13.8%) during the period, as measured by the Russell 2000 and S&P 500 Indices, respectively. Value (+15.8%) stocks outperformed growth (+12.2%) stocks during the period, as measured by the Russell 3000 Value and Russell 3000 Growth Indices, respectively. All ten sectors in the Russell 2000 Growth Index had positive returns during the period. Consumer Discretionary (+21.9%), Consumer Staples (+21.7%), and Health Care (+21.7%) performed best, while Utilities (+1.1%) and Materials (+4.2%) lagged on a relative basis.
Stock selection was the main driver of relative outperformance versus the benchmark, primarily in the Consumer Discretionary, Industrials, and Materials sectors. This was partially offset by weak selection in the Information Technology and Consumer Staples sectors. Sector allocation, which is the result of bottom-up stock selection, detracted from relative returns, primarily due to an underweight (i.e. the Fund’s sector position was less than the benchmark position) to Health Care. A modest cash position in an upward trending equity market environment also detracted from relative returns in the period.
Top contributors to relative performance during the period included WageWorks (Industrials), KapStone Paper (Materials), and Pandora Media (Information Technology). Shares of WageWorks, an on-demand provider of tax-advantaged programs for consumer-directed health, commuter and other employee spending account benefits, outperformed after the company posted better-than-expected quarterly revenue and earnings and management raised its 2013 revenue and earnings guidance. Strong performance in the commuter benefits division led the growth in revenue. Packaging and containerboard manufacturer KapStone Paper saw its shares climb after the company announced it would purchase Longview Fiber Paper and Packaging. Shares of Pandora Media, a subscription music streaming site, rose following solid earnings results and guidance for the full year; monetization of the mobile platform is driving revenue growth. Spirit Airlines (Industrials) also contributed to absolute performance (i.e. total return) during the period.
Stocks that detracted the most from relative returns during the period included VeriFone Systems (Information Technology), BroadSoft (Information Technology), and Polypore International (Industrials). Shares of Verifone Systems, an electronic payment solution provider, fell on lowered earnings guidance citing weak macroeconomic conditions in Europe, lower revenue from Brazil-based business, and delays in customer projects. We eliminated the position. BroadSoft, a communications software and services company offering
| 3 |
| Hartford Small Company HLS Fund |
| Manager Discussion – (continued) |
| June 30, 2013 (Unaudited) |
cloud-based, hosted, internet-protocol (IP) and fixed line services, saw its stock price decline following lowered earnings guidance due to a decline in professional services. We also eliminated this position. Shares of Polypore International, a supplier of lithium batteries to the Nissan Leaf and Chevrolet Volt, fell amid concerns about earnings visibility, particularly with regard to demand for lithium batteries (for which the company supplies separator material) for electric drive vehicles (EDVs). LivePerson (Information Technology) also detracted from absolute returns during the period.
What is the outlook?
We continue to challenge ourselves to discover emerging growth companies and to be opportunistic to uncover re-emerging growth companies. In our view, market volatility over the past year has validated our long-standing focus on fundamental research, which we continue to apply with rigor.
As a residual of our bottom-up, stock-by-stock investment decisions, the Fund ended the period most overweight in the Industrials and Information Technology sectors relative to the Russell 2000 Growth Index. The Fund ended the period most underweight Health Care, Financials, and Consumer Staples.
Diversification by Industry
as of June 30, 2013
| Industry (Sector) | Percentage of Net Assets | |||
| Automobiles and Components (Consumer Discretionary) | 1.6 | % | ||
| Banks (Financials) | 0.9 | |||
| Capital Goods (Industrials) | 13.1 | |||
| Commercial and Professional Services (Industrials) | 3.8 | |||
| Consumer Durables and Apparel (Consumer Discretionary) | 4.6 | |||
| Consumer Services (Consumer Discretionary) | 4.6 | |||
| Diversified Financials (Financials) | 2.0 | |||
| Energy (Energy) | 4.8 | |||
| Food and Staples Retailing (Consumer Staples) | 1.0 | |||
| Food, Beverage and Tobacco (Consumer Staples) | 0.1 | |||
| Health Care Equipment and Services (Health Care) | 5.5 | |||
| Household and Personal Products (Consumer Staples) | 2.0 | |||
| Insurance (Financials) | 0.3 | |||
| Materials (Materials) | 5.4 | |||
| Media (Consumer Discretionary) | 2.4 | |||
| Other Investment Pools and Funds (Financials) | 0.8 | |||
| Pharmaceuticals, Biotechnology and Life Sciences (Health Care) | 8.7 | |||
| Real Estate (Financials) | 2.1 | |||
| Retailing (Consumer Discretionary) | 7.5 | |||
| Semiconductors and Semiconductor Equipment (Information Technology) | 2.3 | |||
| Software and Services (Information Technology) | 21.0 | |||
| Technology Hardware and Equipment (Information Technology) | 4.2 | |||
| Telecommunication Services (Services) | 0.1 | |||
| Transportation (Industrials) | 3.2 | |||
| Utilities (Utilities) | 0.3 | |||
| Short-Term Investments | 2.5 | |||
| Other Assets and Liabilities | (4.8 | ) | ||
| Total | 100.0 | % | ||
| 4 |
| Hartford Small Company HLS Fund |
| Schedule of Investments |
| June 30, 2013 (Unaudited) |
| (000’s Omitted) |
| Shares or Principal Amount | Market Value ╪ | |||||||
| COMMON STOCKS - 101.5% | ||||||||
| Automobiles and Components - 1.6% | ||||||||
| 21 | Standard Motor Products, Inc. | $ | 725 | |||||
| 428 | Tenneco Automotive, Inc. ● | 19,362 | ||||||
| 6 | Tesla Motors, Inc. ● | 594 | ||||||
| 20,681 | ||||||||
| Banks - 0.9% | ||||||||
| 152 | Boston Private Financial Holdings, Inc. | 1,622 | ||||||
| 69 | EverBank Financial Corp. | 1,143 | ||||||
| 72 | First Merchants Corp. | 1,230 | ||||||
| 115 | Flushing Financial Corp. | 1,898 | ||||||
| 36 | Home Loan Servicing Solutions Ltd. | 856 | ||||||
| 51 | Hudson Valley Holding Corp. | 864 | ||||||
| 38 | Ocwen Financial Corp. ● | 1,570 | ||||||
| 87 | Umpqua Holdings Corp. | 1,299 | ||||||
| 32 | Wintrust Financial Corp. | 1,206 | ||||||
| 11,688 | ||||||||
| Capital Goods - 13.1% | ||||||||
| 57 | A.O. Smith Corp. | 2,080 | ||||||
| 32 | AAON, Inc. | 1,067 | ||||||
| 139 | Acuity Brands, Inc. | 10,509 | ||||||
| 11 | AGCO Corp. | 542 | ||||||
| 413 | Altra Holdings, Inc. | 11,318 | ||||||
| 253 | Apogee Enterprises, Inc. | 6,081 | ||||||
| 232 | Applied Industrial Technologies, Inc. | 11,192 | ||||||
| 236 | Armstrong World Industries, Inc. ● | 11,276 | ||||||
| 77 | Astronics Corp. ● | 3,165 | ||||||
| 14 | Astronics Corp. Class B ● | 582 | ||||||
| 46 | AZZ, Inc. | 1,775 | ||||||
| 38 | Belden, Inc. | 1,918 | ||||||
| 451 | Briggs & Stratton Corp. | 8,938 | ||||||
| 34 | CAI International, Inc. ● | 804 | ||||||
| 12 | Carlisle Cos., Inc. | 743 | ||||||
| 31 | Chart Industries, Inc. ● | 2,950 | ||||||
| 14 | Crane Co. | 819 | ||||||
| 368 | DigitalGlobe, Inc. ● | 11,399 | ||||||
| 84 | DXP Enterprises, Inc. ● | 5,572 | ||||||
| 20 | EMCOR Group, Inc. | 826 | ||||||
| 23 | Esterline Technologies Corp. ● | 1,636 | ||||||
| 55 | Franklin Electric Co., Inc. | 1,841 | ||||||
| 136 | Generac Holdings, Inc. | 5,050 | ||||||
| 96 | GrafTech International Ltd. ● | 696 | ||||||
| 44 | H & E Equipment Services, Inc. | 931 | ||||||
| 45 | Heico Corp. | 2,289 | ||||||
| 25 | John Bean Technologies Corp. | 523 | ||||||
| 35 | Lennox International, Inc. | 2,253 | ||||||
| 21 | Lindsay Corp. | 1,576 | ||||||
| 49 | Luxfer Holdings plc | 773 | ||||||
| 243 | Moog, Inc. Class A ● | 12,545 | ||||||
| 31 | Nordson Corp. | 2,182 | ||||||
| 263 | Owens Corning, Inc. ● | 10,284 | ||||||
| 208 | Polypore International, Inc. ● | 8,365 | ||||||
| 40 | Sun Hydraulics Corp. | 1,267 | ||||||
| 21 | TAL International Group, Inc. | 893 | ||||||
| 142 | Teledyne Technologies, Inc. ● | 10,951 | ||||||
| 21 | Textainer Group Holdings Ltd. | 803 | ||||||
| 41 | Titan International, Inc. | 693 | ||||||
| 67 | Trimas Corp. ● | 2,488 | ||||||
| 120 | WESCO International, Inc. ● | 8,147 | ||||||
| 169,742 | ||||||||
| Commercial and Professional Services - 3.8% | ||||||||
| 53 | Deluxe Corp. | 1,826 | ||||||
| 47 | Exponent, Inc. | 2,759 | ||||||
| 76 | GP Strategies Corp. ● | 1,820 | ||||||
| 409 | On Assignment, Inc. ● | 10,936 | ||||||
| 572 | Performant Financial Corp. ● | 6,633 | ||||||
| 55 | RPX Corp. ● | 922 | ||||||
| 446 | TrueBlue, Inc. ● | 9,394 | ||||||
| 446 | Wageworks, Inc. ● | 15,381 | ||||||
| 49,671 | ||||||||
| Consumer Durables and Apparel - 4.6% | ||||||||
| 47 | Arctic Cat, Inc. | 2,130 | ||||||
| 106 | Fifth & Pacific Cos., Inc. ● | 2,375 | ||||||
| 214 | iRobot Corp. ● | 8,517 | ||||||
| 249 | Leapfrog Enterprises, Inc. ● | 2,452 | ||||||
| 19 | Oxford Industries, Inc. | 1,157 | ||||||
| 650 | Quiksilver, Inc. ● | 4,183 | ||||||
| 3,148 | Samsonite International S.A. | 7,546 | ||||||
| 374 | Skechers USA, Inc. Class A ● | 8,977 | ||||||
| 237 | Steven Madden Ltd. ● | 11,456 | ||||||
| 437 | Taylor Morrison Home Corp. ● | 10,647 | ||||||
| 59,440 | ||||||||
| Consumer Services - 4.6% | ||||||||
| 695 | Bloomin' Brands, Inc. ● | 17,295 | ||||||
| 55 | Brinker International, Inc. | 2,169 | ||||||
| 141 | Buffalo Wild Wings, Inc. ● | 13,836 | ||||||
| 167 | Cheesecake Factory, Inc. | 7,014 | ||||||
| 64 | Del Frisco's Restaurant Group, Inc. ● | 1,376 | ||||||
| 145 | Ignite Restaurant Group, Inc. ● | 2,740 | ||||||
| 187 | Life Time Fitness, Inc. ● | 9,378 | ||||||
| 50 | Marriott Vacations Worldwide Corp. ● | 2,156 | ||||||
| 30 | Noodles & Co. ● | 1,114 | ||||||
| 48 | Sotheby's Holdings | 1,814 | ||||||
| 17 | Steiner Leisure Ltd. ● | 877 | ||||||
| 59,769 | ||||||||
| Diversified Financials - 2.0% | ||||||||
| 170 | DFC Global Corp. ● | 2,343 | ||||||
| 72 | Fifth Street Finance Corp. | 754 | ||||||
| 216 | Financial Engines, Inc. | 9,826 | ||||||
| 19 | Portfolio Recovery Associates, Inc. ● | 2,922 | ||||||
| 34 | Virtus Investment Partners, Inc. ● | 5,958 | ||||||
| 392 | Wisdomtree Investment, Inc. ● | 4,530 | ||||||
| 26,333 | ||||||||
| Energy - 4.8% | ||||||||
| 534 | BPZ Resources, Inc. ● | 955 | ||||||
| 56 | C&J Energy Services, Inc. ■● | 1,079 | ||||||
| 14 | CVR Energy, Inc. | 652 | ||||||
| 140 | Diamondback Energy, Inc. ● | 4,649 | ||||||
| 84 | Energy XXI (Bermuda) Ltd. | 1,869 | ||||||
| 76 | EPL Oil & Gas, Inc. ● | 2,227 | ||||||
| 34 | Gulfport Energy Corp. ● | 1,612 | ||||||
| 188 | ION Geophysical Corp. ● | 1,130 | ||||||
| 126 | Karoon Gas Australia Ltd. ● | 586 | ||||||
| 692 | Painted Pony Petroleum Ltd. ● | 5,560 | ||||||
| 51 | PBF Energy, Inc. | 1,310 | ||||||
| 489 | Rex Energy Corp. ● | 8,592 | ||||||
| 221 | Rosetta Resources, Inc. ● | 9,417 | ||||||
| 241 | SemGroup Corp. | 12,962 | ||||||
| 2,778 | Sunshine Oilsands Ltd. ● | 554 | ||||||
The accompanying notes are an integral part of these financial statements.
| 5 |
| Hartford Small Company HLS Fund |
| Schedule of Investments – (continued) |
| June 30, 2013 (Unaudited) |
| (000’s Omitted) |
| Shares or Principal Amount | Market Value ╪ | |||||||
| COMMON STOCKS - 101.5% - (continued) | ||||||||
| Energy - 4.8% - (continued) | ||||||||
| 75 | Synergy Resources Corp. ● | $ | 551 | |||||
| 659 | Trican Well Service Ltd. | 8,757 | ||||||
| 62,462 | ||||||||
| Food and Staples Retailing - 1.0% | ||||||||
| 185 | Casey's General Stores, Inc. | 11,122 | ||||||
| 60 | Natural Grocers by Vitamin Cottage, Inc. ● | 1,859 | ||||||
| 12,981 | ||||||||
| Food, Beverage and Tobacco - 0.1% | ||||||||
| 96 | Darling International, Inc. ● | 1,798 | ||||||
| Health Care Equipment and Services - 5.5% | ||||||||
| 222 | Acadia Healthcare Co., Inc. ● | 7,329 | ||||||
| 21 | AmSurg Corp. ● | 730 | ||||||
| 5 | Atrion Corp. | 1,164 | ||||||
| 53 | Corvel Corp. ● | 1,564 | ||||||
| 34 | Cyberonics, Inc. ● | 1,772 | ||||||
| 423 | Dexcom, Inc. ● | 9,507 | ||||||
| 26 | Ensign Group, Inc. | 926 | ||||||
| 149 | Globus Medical, Inc. ● | 2,515 | ||||||
| 26 | Greatbatch, Inc. ● | 849 | ||||||
| 77 | HealthSouth Corp. ● | 2,225 | ||||||
| 83 | Heartware International, Inc. ● | 7,887 | ||||||
| 48 | ICU Medical, Inc. ● | 3,453 | ||||||
| 214 | Insulet Corp. ● | 6,707 | ||||||
| 13 | LHC Group, Inc. ● | 249 | ||||||
| 9 | MEDNAX, Inc. ● | 778 | ||||||
| 215 | Merge Healthcare, Inc. ● | 775 | ||||||
| 27 | Orthofix International N.V. ● | 718 | ||||||
| 39 | Owens & Minor, Inc. | 1,303 | ||||||
| 23 | Photomedex, Inc. ● | 360 | ||||||
| 150 | Team Health Holdings ● | 6,164 | ||||||
| 66 | U.S. Physical Therapy, Inc. | 1,826 | ||||||
| 84 | Vascular Solutions, Inc. ● | 1,243 | ||||||
| 52 | Volcano Corp. ● | 939 | ||||||
| 186 | Wellcare Health Plans, Inc. ● | 10,346 | ||||||
| 71,329 | ||||||||
| Household and Personal Products - 2.0% | ||||||||
| 221 | Elizabeth Arden, Inc. ● | 9,940 | ||||||
| 135 | Inter Parfums, Inc. | 3,850 | ||||||
| 72 | Prestige Brands Holdings, Inc. ● | 2,085 | ||||||
| 168 | Spectrum Brands Holdings, Inc. | 9,528 | ||||||
| 25,403 | ||||||||
| Insurance - 0.3% | ||||||||
| 48 | Amerisafe, Inc. | 1,547 | ||||||
| 14 | Argo Group International Holdings Ltd. | 610 | ||||||
| 10 | Partnership Assurance Group ● | 74 | ||||||
| 43 | Protective Life Corp. | 1,633 | ||||||
| 3,864 | ||||||||
| Materials - 5.4% | ||||||||
| 23 | ADA-ES, Inc. ● | 965 | ||||||
| 20 | Aurcana Corp. ● | 26 | ||||||
| 127 | Axiall Corp. | 5,425 | ||||||
| 215 | Graphic Packaging Holding Co. ● | 1,663 | ||||||
| 1,186 | Headwaters, Inc. ● | 10,486 | ||||||
| 20 | Innospec, Inc. | 783 | ||||||
| 481 | KapStone Paper & Packaging Corp. | 19,324 | ||||||
| 624 | Louisiana-Pacific Corp. ● | 9,231 | ||||||
| 24 | LSB Industries, Inc. ● | 715 | ||||||
| 119 | Methanex Corp. ADR | 5,095 | ||||||
| 101 | New Gold, Inc. ● | 645 | ||||||
| 71 | Olin Corp. | 1,687 | ||||||
| 118 | Omnova Solutions, Inc. ● | 948 | ||||||
| 151 | Packaging Corp. of America | 7,413 | ||||||
| 99 | PolyOne Corp. | 2,442 | ||||||
| 744 | Romarco Minerals, Inc. ● | 332 | ||||||
| 44 | Silgan Holdings, Inc. | 2,065 | ||||||
| 8 | Universal Stainless & Alloy Products, Inc. ● | 248 | ||||||
| 69,493 | ||||||||
| Media - 2.4% | ||||||||
| 325 | Imax Corp. ● | 8,082 | ||||||
| 623 | Pandora Media, Inc. ● | 11,467 | ||||||
| 185 | Shutterstock, Inc. ● | 10,298 | ||||||
| 64 | Tremor Video, Inc. ● | 573 | ||||||
| 30,420 | ||||||||
| Pharmaceuticals, Biotechnology and Life Sciences - 8.7% | ||||||||
| 51 | Acorda Therapeutics, Inc. ● | 1,685 | ||||||
| 131 | Algeta ASA ● | 4,988 | ||||||
| 106 | Alkermes plc ● | 3,039 | ||||||
| 626 | Arena Pharmaceuticals, Inc. ● | 4,817 | ||||||
| 110 | Bruker Corp. ● | 1,770 | ||||||
| 179 | Cadence Pharmaceuticals, Inc. ● | 1,221 | ||||||
| 145 | Covance, Inc. ● | 11,016 | ||||||
| 196 | Cubist Pharmaceuticals, Inc. ● | 9,459 | ||||||
| 1,061 | Exelixis, Inc. ● | 4,819 | ||||||
| 21 | Hyperion Therapeutics, Inc. ● | 453 | ||||||
| 436 | Immunogen, Inc. ● | 7,232 | ||||||
| 257 | Incyte Corp. ● | 5,656 | ||||||
| 532 | Ironwood Pharmaceuticals, Inc. ● | 5,294 | ||||||
| 325 | Medicines Co. ● | 10,007 | ||||||
| 675 | NPS Pharmaceuticals, Inc. ● | 10,188 | ||||||
| 110 | Optimer Pharmaceuticals, Inc. ● | 1,588 | ||||||
| 54 | PAREXEL International Corp. ● | 2,480 | ||||||
| 31 | Puma Biotechnology, Inc. ● | 1,365 | ||||||
| 328 | Rigel Pharmaceuticals, Inc. ● | 1,094 | ||||||
| 194 | Salix Pharmaceuticals Ltd. ● | 12,857 | ||||||
| 222 | Seattle Genetics, Inc. ● | 6,981 | ||||||
| 89 | Tesaro, Inc. ● | 2,911 | ||||||
| 113 | Trius Therapeutics, Inc. ● | 917 | ||||||
| 111,837 | ||||||||
| Real Estate - 2.1% | ||||||||
| 126 | Altisource Residential Corp. ● | 2,105 | ||||||
| 65 | Armada Hoffler Properties, Inc. | 760 | ||||||
| 56 | Colonial Properties Trust REIT | 1,341 | ||||||
| 51 | Coresite Realty Corp. REIT | 1,619 | ||||||
| 132 | Glimcher Realty Trust REIT | 1,441 | ||||||
| 20 | Hatteras Financial Corp. REIT | 495 | ||||||
| 56 | Medical Properties Trust, Inc. REIT | 798 | ||||||
| 296 | Pebblebrook Hotel Trust REIT | 7,657 | ||||||
| 159 | Potlatch Corp. REIT | 6,422 | ||||||
| 62 | Ramco-Gershenson Properties Trust REIT | 960 | ||||||
| 85 | Summit Hotel Properties, Inc. REIT | 799 | ||||||
| 146 | Sunstone Hotel Investors, Inc. REIT ● | 1,768 | ||||||
| 45 | Whitestone REIT | 714 | ||||||
| 26,879 | ||||||||
| Retailing - 7.5% | ||||||||
| 5,016 | Allstar Co. ⌂●† | 10,404 | ||||||
The accompanying notes are an integral part of these financial statements.
| 6 |
| Shares or Principal Amount | Market Value ╪ | |||||||
| COMMON STOCKS - 101.5% - (continued) | ||||||||
| Retailing - 7.5% - (continued) | ||||||||
| 100 | Ascena Retail Group, Inc. ● | $ | 1,738 | |||||
| 37 | Cato Corp. | 916 | ||||||
| 43 | Core-Mark Holding Co., Inc. | 2,712 | ||||||
| 255 | CST Brands, Inc. ● | 7,858 | ||||||
| 584 | Debenhams plc | 847 | ||||||
| 168 | DSW, Inc. | 12,309 | ||||||
| 126 | Five Below, Inc. ● | 4,642 | ||||||
| 24 | Foot Locker, Inc. | 843 | ||||||
| 364 | Francescas Holding Corp. ● | 10,121 | ||||||
| 30 | Group 1 Automotive, Inc. | 1,925 | ||||||
| 147 | Hibbett Sports, Inc. ● | 8,150 | ||||||
| 155 | HomeAway, Inc. ● | 4,999 | ||||||
| 250 | HSN, Inc. | 13,413 | ||||||
| 75 | Mattress Firm Holding Corp. ● | 3,034 | ||||||
| 526 | Pier 1 Imports, Inc. | 12,366 | ||||||
| 47 | The Finish Line, Inc. | 1,030 | ||||||
| 97,307 | ||||||||
| Semiconductors and Semiconductor Equipment - 2.3% | ||||||||
| 1,804 | Lattice Semiconductor Corp. ● | 9,149 | ||||||
| 210 | Mindspeed Technologies, Inc. ● | 680 | ||||||
| 88 | Nanometrics, Inc. ● | 1,289 | ||||||
| 809 | SunEdison, Inc. ● | 6,610 | ||||||
| 316 | Ultratech Stepper, Inc. ● | 11,601 | ||||||
| 29,329 | ||||||||
| Software and Services - 21.0% | ||||||||
| 267 | Angie's List, Inc. ● | 7,078 | ||||||
| 73 | Aspen Technology, Inc. ● | 2,112 | ||||||
| 25 | Blackhawk Network Holdings, Inc. ● | 585 | ||||||
| 988 | Cadence Design Systems, Inc. ● | 14,311 | ||||||
| 54 | Cass Information Systems, Inc. | 2,488 | ||||||
| 9 | Commvault Systems, Inc. ● | 652 | ||||||
| 165 | Concur Technologies, Inc. ● | 13,441 | ||||||
| 174 | Cornerstone OnDemand, Inc. ● | 7,545 | ||||||
| 66 | CoStar Group, Inc. ● | 8,472 | ||||||
| 323 | DealerTrack Technologies, Inc. ● | 11,438 | ||||||
| 87 | Demandware, Inc. ● | 3,711 | ||||||
| 143 | Fair Isaac, Inc. | 6,553 | ||||||
| 503 | Fleetmatics Group Ltd. ● | 16,701 | ||||||
| 376 | Heartland Payment Systems, Inc. | 13,997 | ||||||
| 165 | Higher One Holdings, Inc. ● | 1,919 | ||||||
| 259 | IAC/InterActiveCorp. | 12,306 | ||||||
| 327 | Imperva, Inc. ● | 14,736 | ||||||
| 92 | j2 Global, Inc. | 3,917 | ||||||
| 92 | Keynote Systems, Inc. | 1,816 | ||||||
| 592 | LivePerson, Inc. ● | 5,302 | ||||||
| 16 | Manhattan Associates, Inc. ● | 1,266 | ||||||
| 187 | Mitek Systems, Inc. ● | 1,082 | ||||||
| 103 | Model N, Inc. ● | 2,417 | ||||||
| 95 | Netscout Systems, Inc. ● | 2,220 | ||||||
| 46 | Nuance Communications, Inc. ● | 853 | ||||||
| 34 | Opentable, Inc. ● | 2,187 | ||||||
| 411 | PTC, Inc. ● | 10,085 | ||||||
| 66 | QLIK Technologies, Inc. ● | 1,872 | ||||||
| 139 | Sapient Corp. ● | 1,815 | ||||||
| 233 | ServiceNow, Inc. ● | 9,406 | ||||||
| 26 | Solera Holdings, Inc. | 1,434 | ||||||
| 25 | Sourcefire, Inc. ● | 1,396 | ||||||
| 113 | Splunk, Inc. ● | 5,227 | ||||||
| 157 | Stamps.com, Inc. ● | 6,196 | ||||||
| 364 | Trulia, Inc. ● | 11,326 | ||||||
| 108 | Tyler Corp. ● | 7,424 | ||||||
| 331 | Verint Systems, Inc. ● | 11,752 | ||||||
| 246 | Virtusa Corp. ● | 5,447 | ||||||
| 694 | Web.com Group, Inc. ● | 17,760 | ||||||
| 145 | WEX, Inc. ● | 11,155 | ||||||
| 546 | WNS Holdings Ltd. ADR ● | 9,107 | ||||||
| 270,507 | ||||||||
| Technology Hardware and Equipment - 4.2% | ||||||||
| 54 | Arris Group, Inc. ● | 774 | ||||||
| 203 | Aruba Networks, Inc. ● | 3,111 | ||||||
| 57 | CDW Corp. of Delaware ● | 1,054 | ||||||
| 18 | Coherent, Inc. | 1,015 | ||||||
| 128 | Emulex Corp. ● | 831 | ||||||
| 216 | Extreme Networks, Inc. ● | 746 | ||||||
| 96 | IPG Photonics Corp. | 5,836 | ||||||
| 534 | Ixia ● | 9,833 | ||||||
| 913 | JDS Uniphase Corp. ● | 13,131 | ||||||
| 255 | Mitel Networks Corp. ● | 979 | ||||||
| 30 | Netgear, Inc. ● | 910 | ||||||
| 91 | Oplink Communications, Inc. ● | 1,576 | ||||||
| 182 | ParkerVision, Inc. ● | 827 | ||||||
| 49 | Plantronics, Inc. | 2,172 | ||||||
| 173 | Rogers Corp. ● | 8,167 | ||||||
| 81 | TTM Technologies, Inc. ● | 679 | ||||||
| 124 | Ubiquiti Networks, Inc. | 2,172 | ||||||
| 53,813 | ||||||||
| Telecommunication Services - 0.1% | ||||||||
| 78 | Allot Communications Ltd. ● | 1,069 | ||||||
| Transportation - 3.2% | ||||||||
| 419 | Avis Budget Group, Inc. ● | 12,046 | ||||||
| 67 | Celadon Group, Inc. | 1,230 | ||||||
| 134 | Landstar System, Inc. | 6,901 | ||||||
| 75 | Marten Transport Ltd. | 1,177 | ||||||
| 248 | Old Dominion Freight Line, Inc. ● | 10,342 | ||||||
| 306 | Spirit Airlines, Inc. ● | 9,721 | ||||||
| 41,417 | ||||||||
| Utilities - 0.3% | ||||||||
| 13 | ALLETE, Inc. | 623 | ||||||
| 49 | UNS Energy Corp. | 2,203 | ||||||
| 18 | Westar Energy, Inc. | 579 | ||||||
| 3,405 | ||||||||
| Total common stocks | ||||||||
| (cost $1,088,432) | $ | 1,310,637 | ||||||
| EXCHANGE TRADED FUNDS - 0.8% | ||||||||
| Other Investment Pools and Funds - 0.8% | ||||||||
| 89 | iShares Russell 2000 Growth Index Fund | $ | 9,976 | |||||
| Total exchange traded funds | ||||||||
| (cost $9,448) | $ | 9,976 | ||||||
| Total long-term investments | ||||||||
| (cost $1,097,880) | $ | 1,320,613 | ||||||
The accompanying notes are an integral part of these financial statements.
| 7 |
| Hartford Small Company HLS Fund |
| Schedule of Investments – (continued) |
| June 30, 2013 (Unaudited) |
| (000’s Omitted) |
| Shares or Principal Amount | Market Value ╪ | |||||||||||
| SHORT-TERM INVESTMENTS - 2.5% | ||||||||||||
| Repurchase Agreements - 2.5% | ||||||||||||
| Bank of America Merrill Lynch TriParty Repurchase Agreement (maturing on 07/01/2013 in the amount of $119, collateralized by GNMA 3.00%, 2042, value of $121) | ||||||||||||
| $ | 119 | 0.13%, 6/28/2013 | $ | 119 | ||||||||
| Bank of Montreal TriParty Repurchase Agreement (maturing on 07/01/2013 in the amount of $2,525, collateralized by FHLMC 4.00% - 5.00%, 2023 - 2025, FNMA 2.00% - 5.00%, 2022 - 2042, GNMA 2.00% - 5.00%, 2041 - 2043, value of $2,569) | ||||||||||||
| 2,525 | 0.15%, 6/28/2013 | 2,525 | ||||||||||
| Bank of Montreal TriParty Repurchase Agreement (maturing on 07/01/2013 in the amount of $4,906, collateralized by FHLB 0.38%, 2015, FHLMC 0.38%, 2014, FNMA 0.50% - 5.50%, 2015 - 2042, value of $4,992) | ||||||||||||
| 4,906 | 0.12%, 6/28/2013 | 4,906 | ||||||||||
| Barclays Capital TriParty Repurchase Agreement (maturing on 07/01/2013 in the amount of $3,399, collateralized by U.S. Treasury Note 3.13%, 2021, value of $3,455) | ||||||||||||
| 3,399 | 0.10%, 6/28/2013 | 3,399 | ||||||||||
| Citigroup Global Markets, Inc. TriParty Repurchase Agreement (maturing on 07/01/2013 in the amount of $10,018, collateralized by U.S. Treasury Bill 0.85%, 2013, U.S. Treasury Note 0.63% - 3.25%, 2013 - 2018, value of $10,169) | ||||||||||||
| 10,018 | 0.10%, 6/28/2013 | 10,018 | ||||||||||
| Deutsche Bank Securities TriParty Repurchase Agreement (maturing on 07/01/2013 in the amount of $119, collateralized by FNMA 4.50%, 2035, value of $121) | ||||||||||||
| 119 | 0.25%, 6/28/2013 | 119 | ||||||||||
| RBS Securities, Inc. TriParty Repurchase Agreement (maturing on 07/01/2013 in the amount of $4,017, collateralized by U.S. Treasury Note 1.00% - 2.63%, 2014 - 2020, value of $4,098) | ||||||||||||
| 4,017 | 0.10%, 6/28/2013 | 4,017 | ||||||||||
| TD Securities TriParty Repurchase Agreement (maturing on 07/01/2013 in the amount of $7,085, collateralized by FHLMC 3.50% - 4.00%, 2042, FNMA 3.50% - 4.50%, 2041 - 2042, value of $7,205) | ||||||||||||
| 7,085 | 0.12%, 6/28/2013 | 7,085 | ||||||||||
| UBS Securities, Inc. Repurchase Agreement (maturing on 07/01/2013 in the amount of $102, collateralized by U.S. Treasury Note 0.63%, 2014, value of $104) | ||||||||||||
| 102 | 0.09%, 6/28/2013 | 102 | ||||||||||
| 32,290 | ||||||||||||
| Total short-term investments | ||||||||||||
| (cost $32,290) | $ | 32,290 | ||||||||||
| Total investments | ||||||||||||
| (cost $1,130,170) ▲ | 104.8 | % | $ | 1,352,903 | ||||||||
| Other assets and liabilities | (4.8 | )% | (62,358 | ) | ||||||||
| Total net assets | 100.0 | % | $ | 1,290,545 | ||||||||
The accompanying notes are an integral part of these financial statements.
| 8 |
| Note: | Percentage of investments as shown is the ratio of the total market value to total net assets. |
| Prices of foreign equities that are principally traded on certain foreign markets may be adjusted daily pursuant to a fair value pricing service approved by the Board of Directors in order to reflect an adjustment for factors occurring after the close of certain foreign markets but before the close of the New York Stock Exchange. |
| ▲ | At June 30, 2013, the cost of securities for federal income tax purposes was $1,137,816 and the aggregate gross unrealized appreciation and depreciation based on that cost were: |
| Unrealized Appreciation | $ | 252,201 | ||
| Unrealized Depreciation | (37,114 | ) | ||
| Net Unrealized Appreciation | $ | 215,087 |
| † | These securities were valued in good faith at fair value as determined under policies and procedures established by and under the supervision of the Company's Board of Directors. At June 30, 2013, the aggregate value of these securities was $10,404, which represents 0.8% of total net assets. This amount excludes securities that are principally traded in certain foreign markets and whose prices are adjusted pursuant to a third party pricing service methodology approved by the Board of Directors. |
| ● | Non-income producing. |
| ■ | Securities issued within terms of a private placement memorandum, exempt from registration under Rule 144A under the Securities Act of 1933, as amended, and may be sold only to qualified institutional buyers. Unless otherwise indicated, these holdings are determined to be liquid. At June 30, 2013, the aggregate value of these securities was $1,079, which represents 0.1% of total net assets. |
| ⌂ | The following securities are considered illiquid. Illiquid securities are often purchased in private placement transactions, are often not registered under the Securities Act of 1933 and may have contractual restrictions on resale. A security may also be considered illiquid if the security lacks a readily available market or if its valuation has not changed for a certain period of time. |
| Period Acquired | Shares/ Par | Security | Cost Basis | |||||||||
| 08/2011 | 5,016 | Allstar Co. | $ | 2,964 | ||||||||
At June 30, 2013, the aggregate value of these securities was $10,404, which represents 0.8% of total net assets.
| Foreign Currency Contracts Outstanding at June 30, 2013 | ||||||||||||||||||||
| Currency | Buy / Sell | Delivery Date | Counterparty | Contract Amount | Market Value ╪ | Unrealized Appreciation/ (Depreciation) | ||||||||||||||
| CAD | Sell | 07/03/2013 | BCLY | $ | 268 | $ | 267 | $ | 1 | |||||||||||
| CAD | Sell | 07/02/2013 | CSFB | 347 | 347 | – | ||||||||||||||
| GBP | Sell | 07/01/2013 | NAB | 214 | 212 | 2 | ||||||||||||||
| $ | 3 | |||||||||||||||||||
| ╪ | See Significant Accounting Policies of accompanying Notes to Financial Statements regarding valuation of securities. |
| GLOSSARY: (abbreviations used in preceding Schedule of Investments) | |
| Counterparty Abbreviations: | |
| BCLY | Barclays |
| CSFB | Credit Suisse First Boston Corp. |
| NAB | National Australia Bank |
| Currency Abbreviations: | |
| CAD | Canadian Dollar |
| GBP | British Pound |
| Other Abbreviations: | ||
| ADR | American Depositary Receipt | |
| FHLB | Federal Home Loan Bank | |
| FHLMC | Federal Home Loan Mortgage Corp. | |
| FNMA | Federal National Mortgage Association | |
| GNMA | Government National Mortgage Association | |
| REIT | Real Estate Investment Trust | |
The accompanying notes are an integral part of these financial statements.
| 9 |
| Hartford Small Company HLS Fund |
| Investment Valuation Hierarchy Level Summary |
| June 30, 2013 (Unaudited) |
| (000’s Omitted) |
| Total | Level 1 ♦ | Level 2 ♦ | Level 3 | |||||||||||||
| Assets: | ||||||||||||||||
| Common Stocks ‡ | $ | 1,310,637 | $ | 1,285,712 | $ | 14,521 | $ | 10,404 | ||||||||
| Exchange Traded Funds | 9,976 | 9,976 | – | – | ||||||||||||
| Short-Term Investments | 32,290 | – | 32,290 | – | ||||||||||||
| Total | $ | 1,352,903 | $ | 1,295,688 | $ | 46,811 | $ | 10,404 | ||||||||
| Foreign Currency Contracts * | 3 | – | 3 | – | ||||||||||||
| Total | $ | 3 | $ | – | $ | 3 | $ | – | ||||||||
| ♦ | For the six-month period ended June 30, 2013, investments valued at $1,076 were transferred from Level 1 to Level 2, and there were no transfers from Level 2 to Level 1. Investments are transferred between Level 1 and Level 2 for a variety of reasons including, but not limited to: |
| 1) | Foreign equities for which a fair value price is more representative of exit value than the local market close (transfer into Level 2). Foreign equities for which the local market close is more representative of exit value (transfer into Level 1). |
| 2) | U.S. Treasury securities that no longer represent the most recent issue (transfer into Level 2). |
| 3) | Equity investments with no observable trading but a bid or close price is used (transfer into Level 2). Equity investments using observable quoted prices in an active market (transfer into Level 1). |
| ‡ | The Fund has all or primarily all of the equity securities categorized in a particular level. Refer to the Schedule of Investments for further industry breakout. |
| * | Derivative instruments not reflected in the Schedule of Investments are valued at the unrealized appreciation/depreciation on the investments. |
Following is a reconciliation of Level 3 assets for which significant unobservable inputs were used to determine fair value:
| Balance as of December 31, 2012 | Realized Gain (Loss) | Change in Unrealized Appreciation (Depreciation) | Net Amortization | Purchases | Sales | Transfers Into Level 3 | Transfers Out of Level 3 | Balance as of June 30, 2013 | ||||||||||||||||||||||||||||
| Assets: | ||||||||||||||||||||||||||||||||||||
| Common Stocks | $ | 7,074 | $ | — | $ | 3,330 | * | $ | — | $ | — | $ | — | $ | — | $ | — | $ | 10,404 | |||||||||||||||||
| Total | $ | 7,074 | $ | — | $ | 3,330 | $ | — | $ | — | $ | — | $ | — | $ | — | $ | 10,404 | ||||||||||||||||||
| * | Change in unrealized appreciation (depreciation) in the current period relating to assets still held at June 30, 2013 was $3,330. |
The accompanying notes are an integral part of these financial statements.
| 10 |
| Hartford Small Company HLS Fund |
| Statement of Assets and Liabilities |
| June 30, 2013 (Unaudited) |
| (000’s Omitted) |
| Assets: | ||||
| Investments in securities, at market value (cost $1,130,170) | $ | 1,352,903 | ||
| Cash | 27 | |||
| Unrealized appreciation on foreign currency contracts | 3 | |||
| Receivables: | ||||
| Investment securities sold | 17,332 | |||
| Fund shares sold | 764 | |||
| Dividends and interest | 483 | |||
| Other assets | — | |||
| Total assets | 1,371,512 | |||
| Liabilities: | ||||
| Payables: | ||||
| Investment securities purchased | 18,206 | |||
| Fund shares redeemed | 62,530 | |||
| Investment management fees | 151 | |||
| Distribution fees | 5 | |||
| Accrued expenses | 75 | |||
| Total liabilities | 80,967 | |||
| Net assets | $ | 1,290,545 | ||
| Summary of Net Assets: | ||||
| Capital stock and paid-in-capital | $ | 859,377 | ||
| Undistributed net investment income | 212 | |||
| Accumulated net realized gain | 208,224 | |||
| Unrealized appreciation of investments and the translations of assets and liabilities denominated in foreign currency | 222,732 | |||
| Net assets | $ | 1,290,545 | ||
| Shares authorized | 1,500,000 | |||
| Par value | $ | 0.001 | ||
| Class IA: Net asset value per share | $ | 23.49 | ||
| Shares outstanding | 49,619 | |||
| Net assets | $ | 1,165,698 | ||
| Class IB: Net asset value per share | $ | 22.71 | ||
| Shares outstanding | 5,498 | |||
| Net assets | $ | 124,847 |
The accompanying notes are an integral part of these financial statements.
| 11 |
| Hartford Small Company HLS Fund |
| Statement of Operations |
| For the Six-Month Period Ended June 30, 2013 (Unaudited) |
| (000’s Omitted) |
| Investment Income: | ||||
| Dividends | $ | 3,685 | ||
| Interest | 13 | |||
| Less: Foreign tax withheld | (51 | ) | ||
| Total investment income, net | 3,647 | |||
| Expenses: | ||||
| Investment management fees | 4,537 | |||
| Transfer agent fees | 3 | |||
| Distribution fees - Class IB | 157 | |||
| Custodian fees | 11 | |||
| Accounting services fees | 80 | |||
| Board of Directors' fees | 17 | |||
| Audit fees | 10 | |||
| Other expenses | 92 | |||
| Total expenses (before fees paid indirectly) | 4,907 | |||
| Commission recapture | (60 | ) | ||
| Total fees paid indirectly | (60 | ) | ||
| Total expenses, net | 4,847 | |||
| Net Investment Loss | (1,200 | ) | ||
| Net Realized Gain on Investments and Foreign Currency Transactions: | ||||
| Net realized gain on investments | 116,761 | |||
| Net realized gain on foreign currency contracts | 47 | |||
| Net realized loss on other foreign currency transactions | (50 | ) | ||
| Net Realized Gain on Investments and Foreign Currency Transactions | 116,758 | |||
| Net Changes in Unrealized Appreciation of Investments and Foreign Currency Transactions: | ||||
| Net unrealized appreciation of investments | 113,328 | |||
| Net unrealized appreciation of foreign currency contracts | — | |||
| Net unrealized depreciation on translation of other assets and liabilities in foreign currencies | (2 | ) | ||
| Net Changes in Unrealized Appreciation of Investments and Foreign Currency Transactions | 113,326 | |||
| Net Gain on Investments and Foreign Currency Transactions | 230,084 | |||
| Net Increase in Net Assets Resulting from Operations | $ | 228,884 |
The accompanying notes are an integral part of these financial statements.
| 12 |
| Hartford Small Company HLS Fund |
| Statement of Changes in Net Assets |
| (000’s Omitted) |
| For the Six-Month Period Ended June 30, 2013 (Unaudited) | For the Year Ended December 31, 2012 | |||||||
| Operations: | ||||||||
| Net investment income (loss) | $ | (1,200 | ) | $ | 1,596 | |||
| Net realized gain on investments and foreign currency transactions | 116,758 | 105,170 | ||||||
| Net unrealized appreciation of investments and foreign currency transactions | 113,326 | 81,683 | ||||||
| Net Increase in Net Assets Resulting from Operations | 228,884 | 188,449 | ||||||
| Distributions to Shareholders: | �� | |||||||
| From net realized gain on investments | ||||||||
| Class IA | — | (70 | ) | |||||
| Class IB | — | (10 | ) | |||||
| Total distributions | — | (80 | ) | |||||
| Capital Share Transactions: | ||||||||
| Class IA | ||||||||
| Sold | 54,918 | 86,327 | ||||||
| Issued on reinvestment of distributions | — | 70 | ||||||
| Redeemed | (222,952 | ) | (217,332 | ) | ||||
| Total capital share transactions | (168,034 | ) | (130,935 | ) | ||||
| Class IB | ||||||||
| Sold | 15,199 | 17,856 | ||||||
| Issued on reinvestment of distributions | — | 10 | ||||||
| Redeemed | (28,987 | ) | (78,670 | ) | ||||
| Total capital share transactions | (13,788 | ) | (60,804 | ) | ||||
| Net decrease from capital share transactions | (181,822 | ) | (191,739 | ) | ||||
| Net Increase (Decrease) in Net Assets | 47,062 | (3,370 | ) | |||||
| Net Assets: | ||||||||
| Beginning of period | 1,243,483 | 1,246,853 | ||||||
| End of period | $ | 1,290,545 | $ | 1,243,483 | ||||
| Undistributed (distribution in excess of) net investment income | $ | 212 | $ | 1,412 | ||||
| Shares: | ||||||||
| Class IA | ||||||||
| Sold | 2,494 | 4,505 | ||||||
| Issued on reinvestment of distributions | — | 4 | ||||||
| Redeemed | (9,928 | ) | (11,366 | ) | ||||
| Total share activity | (7,434 | ) | (6,857 | ) | ||||
| Class IB | ||||||||
| Sold | 703 | 962 | ||||||
| Issued on reinvestment of distributions | — | 1 | ||||||
| Redeemed | (1,350 | ) | (4,236 | ) | ||||
| Total share activity | (647 | ) | (3,273 | ) | ||||
The accompanying notes are an integral part of these financial statements.
| 13 |
| Hartford Small Company HLS Fund |
| Notes to Financial Statements |
| June 30, 2013 (Unaudited) |
| (000’s Omitted) |
| 1. | Organization: |
Hartford Small Company HLS Fund (the “Fund”) serves as an underlying investment option for certain variable annuity and variable life insurance separate accounts of Hartford Life Insurance Company (“HLIC”) and its affiliates and certain qualified retirement plans. The Fund may also serve as an underlying investment option for certain variable annuity and variable life separate accounts of other insurance companies. Owners of variable annuity contracts and policyholders of variable life insurance contracts may choose the funds permitted in the variable insurance contract prospectus. In addition, participants in certain qualified retirement plans may choose the Fund if permitted by their plans.
Hartford Series Fund, Inc. (the “Company”) is an open-end registered management investment company comprised of thirty portfolios. Financial Statements for the Fund, a series of the Company, are included in this report.
The Company is organized under the laws of the State of Maryland and is registered with the Securities and Exchange Commission (“SEC”) under the Investment Company Act of 1940, as amended (“1940 Act”). The Fund’s portfolio managers are Steven C. Angeli (74.47%), Mammen Chally (20.77%) and Jamie A. Rome (4.76%). The portfolio management team also includes Stephen C. Mortimer and Mario E. Abularach. The Fund is a diversified open-end management investment company.
The Fund is divided into Class IA and Class IB shares. Each class is offered at the per share net asset value (“NAV”) without a sales charge and is subject to the same expenses, except that the Class IB shares are subject to distribution and service fees charged pursuant to a Distribution Plan adopted in accordance with Rule 12b-1 under the 1940 Act.
| 2. | Significant Accounting Policies: |
The following is a summary of significant accounting policies of the Fund in the preparation of its financial statements, which are in accordance with the United States Generally Accepted Accounting Principles (“U.S. GAAP”). The preparation of financial statements in accordance with U.S. GAAP may require management to make estimates and assumptions that affect the reported amounts of assets and liabilities and disclosure of contingent assets and liabilities at the date of the financial statements and the reported amounts of increases and decreases in net assets from operations during the reporting period. Actual results could differ from those estimates.
| a) | Determination of Net Asset Value – The NAV of each class of the Fund’s shares is determined as of the close of regular trading (normally 4:00 p.m. Eastern Time) (the “NYSE Close”) on each day that the New York Stock Exchange (the “Exchange”) is open (“Valuation Date”). Information that becomes known to the Fund after the NAV has been calculated on a particular day will not generally be used to retroactively adjust the NAV determined earlier that day. |
| b) | Investment Valuation and Fair Value Measurements – For purposes of calculating the NAV, portfolio investments and other assets held by the Fund's portfolio for which market quotes are readily available are valued at market value. Market value is generally determined on the basis of last reported sales prices or official close price. If no sales are reported, market value is based on quotes obtained from a quotation reporting system, established market makers, or independent pricing services. If market prices are not readily available or are deemed unreliable, the Fund will use the fair value of the investment as determined in good faith under policies and procedures established by and under the supervision of the Company’s Board of Directors. Market quotes are considered not readily available where there is an absence of current or reliable market-based data (e.g., trade information or indicative market quotes), including where events occur after the close of the relevant market, but prior to the NYSE Close that materially affect the values of the Fund’s portfolio investments or assets. In addition, market quotes are considered not readily available when, due to extraordinary circumstances, the exchanges or markets on which the investments trade do not open for trading for the entire day and no other market prices are available. In addition, prices of foreign equities that are principally traded on certain foreign markets may be adjusted daily pursuant to a fair value pricing service approved by the Board of Directors in order to |
| 14 |
| reflect an adjustment for the factors occurring after the close of certain foreign markets but before the NYSE Close. Investments that are primarily traded on foreign markets may trade on days that are not business days of the Fund. The value of the foreign investments in which the Fund invests may change on days when a shareholder will not be able to purchase or redeem shares of the Fund. Fair value pricing is subjective in nature and the use of fair value pricing by the Fund may cause the NAV of its shares to differ significantly from the NAV that would have been calculated using market prices at the close of the exchange on which a portfolio investment is primarily traded. There can be no assurance that the Fund could obtain the fair market value assigned to an investment if the Fund were to sell the investment at approximately the time at which the Fund determines its NAV. |
| Investments valued in currencies other than U.S. dollars are converted to U.S. dollars using exchange rates obtained from independent pricing services for calculation of the NAV. As a result, the NAV of the Fund’s shares may be affected by changes in the value of currencies in relation to the U.S. dollar. The value of investments traded in markets outside the United States or denominated in currencies other than the U.S. dollar may be affected significantly on a day that the NYSE is closed and the market value may change on days when an investor is not able to purchase, redeem or exchange shares of the Fund. |
| Foreign currency contracts represent agreements to exchange currencies on specific future dates at predetermined rates. Foreign currency contracts are valued using foreign currency exchange rates and forward rates as provided by an independent pricing service on the Valuation Date. |
| Financial instruments for which prices are not available from an independent pricing service may be valued using market quotations obtained from one or more dealers that make markets in the respective financial instrument in accordance with procedures established by the Company’s Board of Directors. |
| U.S. GAAP defines fair value as the price that the Fund would receive to sell an asset or pay to transfer a liability in an orderly transaction between market participants. The U.S. GAAP fair value measurement standards require disclosure of a fair value hierarchy for each major category of assets and liabilities. Various inputs are used in determining the fair value of the Fund’s investments. These inputs are summarized into three broad hierarchy levels. This hierarchy is based on whether the valuation inputs are observable or unobservable. These levels are: |
| · | Level 1 – Quoted prices in active markets for identical investments. Level 1 may include exchange traded instruments, such as domestic equities, some foreign equities, options, futures, mutual funds, exchange traded funds, rights and warrants. |
| · | Level 2 – Observable inputs other than Level 1 prices, such as quoted prices for similar investments; quoted prices in markets that are not active; or other inputs that are observable or can be corroborated by observable market data. Level 2 may include debt investments that are traded less frequently than exchange traded instruments and which are valued using independent pricing services; foreign equities, which are principally traded on certain foreign markets and are adjusted daily pursuant to a fair value pricing service in order to reflect an adjustment for the factors occurring after the close of certain foreign markets but before the NYSE Close; and short-term investments, which are valued at amortized cost. |
| · | Level 3 – Significant unobservable inputs that are supported by limited or no market activity. Level 3 may include financial instruments whose values are determined using indicative market quotes or require significant management judgment or estimation. These unobservable valuation inputs may include estimates for current yields, maturity/duration, prepayment speed, and indicative market quotes for comparable investments along with other assumptions relating to credit quality, collateral value, complexity of the investment structure, general market conditions and liquidity. This category may include investments where trading has been halted or there are certain restrictions on trading. While these investments are priced using unobservable inputs, the valuation of these investments reflects the best available data and management believes the prices are a reasonable representation of exit price. |
| 15 |
| Hartford Small Company HLS Fund |
| Notes to Financial Statements – (continued) |
| June 30, 2013 (Unaudited) |
| (000’s Omitted) |
| The Board of Directors of the Company generally reviews and approves the “Procedures for Valuation of Portfolio Securities” on an annual basis. These procedures define how investments are to be valued, including the formation and activities of a Valuation Committee. The Valuation Committee is responsible for determining in good faith the fair value of investments when the value cannot be obtained from primary pricing services or alternative sources or if the valuation of an investment as provided by the primary pricing service or alternative source is believed not to reflect the investment’s fair value as of the Valuation Date. Members of the Valuation Committee include the Fund’s Treasurer or designee, a Vice President of the Fund with legal expertise or designee, and a Vice President of the investment manager or designee. In addition, the Fund’s Chief Compliance Officer shall designate a member of the compliance group to attend Valuation Committee meetings as a non-voting resource, to monitor for and provide guidance with respect to compliance with these procedures. Two members of the Valuation Committee or their designees, representing different departments, shall constitute a quorum for purposes of permitting the Valuation Committee to take action. The Valuation Committee will consider all relevant factors in determining an investment’s fair value, and may seek the advice of the Fund’s sub-adviser, knowledgeable brokers, and legal counsel in making such determination. The Valuation Committee reports to the Audit Committee of the Company’s Board of Directors. The Audit Committee receives quarterly written reports which include details of all fair-valued investments, including the reason for the fair valuation, and an indication, when possible, of the accuracy of the valuation by disclosing the next available reliable public price quotation or the disposition price of such investments (the “look-back” test). The Board of Directors then must consider for ratification all of the fair value determinations made during the previous quarter. |
| Valuation levels are not necessarily indicative of the risk associated with investing in such investments. Individual investments within any of the above mentioned asset classes may be assigned a different hierarchical level than those presented above, as individual circumstances dictate. |
| For additional information, refer to the Investment Valuation Hierarchy Level Summary and the Level 3 roll-forward reconciliation, if applicable, which follow the Schedule of Investments. |
| For purposes of reporting transfers between different hierarchy levels, both transfers in and out of each level, as applicable, are shown as if they occurred at the beginning of the period. |
| c) | Investment Transactions and Investment Income – Investment transactions are recorded as of the trade date (the date the order to buy or sell is executed) for financial reporting purposes. Investments purchased or sold on a when-issued or delayed-delivery basis may be settled a month or more after the trade date. Realized gains and losses are determined on the basis of identified cost. |
| Dividend income from domestic securities is accrued on the ex-dividend date. In general, dividend income from foreign securities is recorded on the ex-date; however, dividend notifications in certain foreign jurisdictions may not be available in a timely manner and as a result, the Fund will record the dividend as soon as the relevant details (i.e., rate per share, payment date, shareholders of record, etc.) are publicly available. Interest income, including amortization of premium and accretion of discounts, is accrued on a daily basis. |
| d) | Foreign Currency Transactions – Assets and liabilities denominated in currencies other than U.S. dollars are translated into U.S. dollars at the exchange rates in effect on the valuation date. Purchases and sales of investments, income, and expenses are translated into U.S. dollars at the exchange rates on the dates of such transactions. |
| The Fund does not isolate that portion of portfolio investment valuation resulting from fluctuations in the foreign currency exchange rates from the fluctuations arising from changes in the market prices of investments held. Exchange rate fluctuations are included with the net realized and unrealized gain or loss on investments in the accompanying financial statements. |
| 16 |
| Net realized foreign exchange gains or losses arise from sales of foreign currencies and the difference between asset and liability amounts initially stated in foreign currencies and the U.S. dollar value of the amounts actually received or paid. Net unrealized foreign exchange gains or losses arise from changes in the value of other assets and liabilities at the end of the reporting period, resulting from changes in the exchange rates. |
| e) | Joint Trading Account – The Fund may invest cash balances into a joint trading account that may be invested in one or more repurchase agreements. |
| f) | Fund Share Valuation and Dividend Distributions to Shareholders – Orders for the Fund’s shares are executed in accordance with the investment instructions of the contract holders and plan participants. The NAV of the Fund’s shares is determined as of the close of business on each business day of the Exchange. The NAV is determined separately for each class of shares of the Fund by dividing the Fund’s net assets attributable to that class by the number of shares of the class outstanding. Each class of shares offered by the Fund has equal rights as to assets and voting privileges (except that shareholders of a class have exclusive voting rights regarding any matter relating solely to that class of shares). Income and non-class specific expenses are allocated daily to each class on the basis of the relative net assets of the class. Realized and unrealized capital gains and losses are allocated daily based on the relative net assets of each class of shares of the Fund. |
| Orders for the purchase of the Fund’s shares received prior to the close of the Exchange on any day the Exchange is open for business are priced at the NAV determined as of the close of the Exchange. Orders received after the close of the Exchange, or on a day on which the Exchange and/or the Fund is not open for business, are priced at the next determined NAV. |
| Dividends are declared pursuant to a policy adopted by the Company’s Board of Directors based upon the investment performance of the Fund. The policy of the Fund is to pay dividends from net investment income and realized capital gains, if any, at least once a year. |
| Distributions from net investment income, net realized capital gains and capital are determined in accordance with federal income tax regulations, which may differ from U.S. GAAP with respect to character and timing. These differences may include but are not limited to losses deferred due to wash sale adjustments, foreign currency gains and losses, adjustments related to Passive Foreign Investment Companies (“PFICs”), Real Estate Investment Trusts (“REITs”), Regulated Investment Companies (“RICs”), certain derivatives and partnerships. Permanent book and federal income tax basis differences relating to shareholder distributions will result in reclassifications to certain of the Fund’s capital accounts (see Federal Income Taxes: Reclassification of Capital Accounts note). |
| 3. | Securities and Other Investments: |
| a) | Repurchase Agreements – A repurchase agreement is an agreement by which a counterparty agrees to sell an investment and agrees to repurchase the investment sold from the buyer at a mutually agreed upon time and price. During the period of the repurchase agreement, the counterparty will deposit cash and or securities in a third party custodial account to serve as collateral. At the time the Fund enters into a repurchase agreement, the value of the underlying collateral, including accrued interest, will be equal to or exceed the value of the repurchase agreement. Repurchase agreements expose the Fund to counterparty risk - that is, the risk that the counterparty will not fulfill its obligations. To minimize counterparty risk, the investments that serve to collateralize the repurchase agreement are held by the Fund’s custodian in book entry or physical form in the custodial account of the Fund or in a third party custodial account. Repurchase agreements are valued at cost plus accrued interest, which approximates fair value. Repurchase agreements have master netting agreements which allow the Fund to offset amounts owed to a counterparty with amounts owed by the counterparty, including any collateral. The Fund, as shown on the Schedule of Investments, had outstanding repurchase agreements as of June 30, 2013. |
| 17 |
| Hartford Small Company HLS Fund |
| Notes to Financial Statements – (continued) |
| June 30, 2013 (Unaudited) |
| (000’s Omitted) |
| b) | Illiquid and Restricted Investments – The Fund is permitted to invest up to 15% of its net assets in illiquid investments. Illiquid investments are those that may not be sold or disposed of in the ordinary course of business within seven days, at approximately the price used to determine the Fund’s NAV. The Fund may not be able to sell illiquid investments when its sub-adviser considers it desirable to do so or may have to sell such investments at a price that is lower than the price that could be obtained if the investments were more liquid. A sale of illiquid investments may require more time and may result in higher dealer discounts and other selling expenses than does the sale of those that are liquid. Illiquid investments also may be more difficult to value due to the unavailability of reliable market quotations for such investments, and an investment in them may have an adverse impact on the Fund’s NAV. The Fund may also purchase certain restricted investments that can only be resold to certain qualified investors and may be determined to be liquid pursuant to policies and guidelines established by the Company’s Board of Directors. The Fund, as shown on the Schedule of Investments, had illiquid and/or restricted investments as of June 30, 2013. |
| c) | Investments Purchased on a When-Issued or Delayed-Delivery Basis – Delivery and payment for investments that have been purchased by the Fund on a forward commitment, or when-issued or delayed-delivery basis, take place beyond the customary settlement period. A fund may dispose of or renegotiate a delayed-delivery transaction after it is entered into, and may sell delayed-delivery investments before they are delivered, which may result in a realized gain or loss. During this period, such investments are subject to market fluctuations, and the Fund identifies investments segregated in its records with a value at least equal to the amount of the commitment. As of June 30, 2013, the Fund had no outstanding when-issued or delayed-delivery investments. |
| 4. | Financial Derivative Instruments: |
| The following disclosures contain information on how and why the Fund uses derivative instruments, the credit-risk-related contingent features in certain derivative instruments, and how derivative instruments affect the Fund’s financial position and results of operations. The location and fair value amounts of these instruments on the Statement of Assets and Liabilities and the realized gains and losses and changes in unrealized gains and losses on the Statement of Operations, each categorized by type of derivative contract, are included in the following Additional Derivative Instrument Information footnote. The derivative instruments outstanding as of period-end are disclosed in the notes to or within the Schedule of Investments for purchased options, if applicable. The amounts of realized gains and losses and changes in unrealized gains and losses on derivative instruments during the period are disclosed in the Statement of Operations. |
| a) | Foreign Currency Contracts – The Fund may enter into foreign currency contracts that obligate the Fund to purchase or sell currencies at specified future dates. Foreign currency contracts are used to hedge the currency exposure associated with some or all of the Fund’s investments and/or as part of an investment strategy. Foreign currency contracts are marked to market daily and the change in value is recorded by the Fund as an unrealized gain or loss. The Fund will record a realized gain or loss when the foreign currency contract is settled. |
| Foreign currency contracts involve elements of market risk in excess of the amounts reflected in the Statement of Assets and Liabilities. In addition, risks may arise upon entering into these contracts from the potential inability of the counterparties to meet the terms of the contracts and from unanticipated movements in the value of the foreign currencies relative to the U.S. dollar. The Fund had outstanding foreign currency contracts as shown on the Schedule of Investments as of June 30, 2013. |
| 18 |
| b) | Additional Derivative Instrument Information: |
Fair Value of Derivative Instruments on the Statement of Assets and Liabilities as of June 30, 2013:
| Risk Exposure Category | ||||||||||||||||||||||||||||
| Interest Rate Contracts | Foreign Exchange Contracts | Credit Contracts | Equity Contracts | Commodity Contracts | Other Contracts | Total | ||||||||||||||||||||||
| Assets: | ||||||||||||||||||||||||||||
| Unrealized appreciation on foreign currency contracts | $ | — | $ | 3 | $ | — | $ | — | $ | — | $ | — | $ | 3 | ||||||||||||||
| Total | $ | — | $ | 3 | $ | — | $ | — | $ | — | $ | — | $ | 3 | ||||||||||||||
The volume of derivatives that is presented in the Schedule of Investments is consistent with the derivative activity during the six-month period ended June 30, 2013.
The Effect of Derivative Instruments on the Statement of Operations for the six-month period ended June 30, 2013:
| Risk Exposure Category | ||||||||||||||||||||||||||||
| Interest Rate Contracts | Foreign Exchange Contracts | Credit Contracts | Equity Contracts | Commodity Contracts | Other Contracts | Total | ||||||||||||||||||||||
| Realized Gain on Derivatives Recognized as a Result of Operations: | ||||||||||||||||||||||||||||
| Net realized gain on foreign currency contracts | $ | — | $ | 47 | $ | — | $ | — | $ | — | $ | — | $ | 47 | ||||||||||||||
| Total | $ | — | $ | 47 | $ | — | $ | — | $ | — | $ | — | $ | 47 | ||||||||||||||
| Net Change in Unrealized Appreciation (Depreciation) on Derivatives Recognized as a Result of Operations: | ||||||||||||||||||||||||||||
| Net change in unrealized appreciation of foreign currency contracts | $ | — | $ | — | $ | — | $ | — | $ | — | $ | — | $ | — | ||||||||||||||
| Total | $ | — | $ | — | $ | — | $ | — | $ | — | $ | — | $ | — | ||||||||||||||
| c) | Balance Sheet Offsetting Information: |
Set forth below are tables which disclose both gross information and net information about instruments and transactions eligible for offset in the financial statements, and instruments and transactions that are subject to a master netting agreement, as well as amounts related to margin, reflected as financial collateral (including cash collateral), held at clearing brokers, counterparties, and the Fund’s custodian. The master netting agreements allow the clearing brokers to net any collateral held in or on behalf of the Fund, or liabilities or payment obligations of the clearing brokers to the Fund, against any liabilities or payment obligations of the Fund to the clearing brokers. The Fund is required to deposit financial collateral (including cash collateral) at the Fund’s custodian on behalf of clearing brokers and counterparties to continually meet the original and maintenance requirements established by the clearing brokers and counterparties. Such requirements are specific to the respective clearing broker or counterparty.
Offsetting of Financial Assets and Derivative Assets as of June 30, 2013:
| Description | Gross Amounts of Recognized Assets | Gross Amounts Offset in Statement of Assets and Liabilities | Net Amounts of Assets Presented in Statement of Assets and Liabilities | Financial Instruments with Allowable Netting | Collateral Received | Net Amount (not less than 0) | ||||||||||||||||||
| Repurchase Agreements | $ | 32,290 | $ | — | $ | 32,290 | $ | — | $ | (32,834 | ) | $ | — | |||||||||||
| Unrealized appreciation on foreign currency contracts | 3 | — | 3 | — | — | 3 | ||||||||||||||||||
| Total subject to a master netting or similar arrangement | $ | 32,293 | $ | — | $ | 32,293 | $ | — | $ | (32,834 | ) | $ | 3 | |||||||||||
| 19 |
| Hartford Small Company HLS Fund |
| Notes to Financial Statements – (continued) |
| June 30, 2013 (Unaudited) |
| (000’s Omitted) |
| 5. | Principal Risks: |
| a) | Counterparty Risk – The Fund may be exposed to counterparty risk, or the risk that an institution or other entity with which the Fund has unsettled or open transactions will default. |
| b) | Market Risks – If the Fund invests directly in foreign currencies or in securities that trade in, and receive revenues in, foreign currencies, or in derivatives that provide exposure to foreign currencies, it will be subject to the risk that those currencies will decline in value relative to the base currency of the Fund, or, in the case of hedging positions, that the Fund’s base currency will decline in value relative to the currency being hedged. Currency rates in foreign countries may fluctuate significantly over short periods of time for a number of reasons, including changes in interest rates, intervention (or the failure to intervene) by U.S. or foreign governments, central banks or supranational entities, such as the International Monetary Fund, or by the imposition of currency controls or other political developments in the United States or abroad. As a result, the Fund’s investments in foreign currency denominated securities may reduce the returns of the Fund. The market values of equity securities, such as common stocks and preferred stocks, or equity related investments, such as futures and options, may decline due to general market conditions which are not specifically related to a particular company, such as real or perceived adverse economic conditions, changes in the general outlook for corporate earnings, changes in interest or currency rates or adverse investor sentiment generally. The market value of equity securities may also decline due to factors which affect a particular industry or industries, such as labor shortages or increased production costs and competitive conditions within an industry. Equity securities and equity related investments generally have greater market price volatility than fixed income securities. |
| 6. | Federal Income Taxes: |
| a) | Federal Income Taxes – For federal income tax purposes, the Fund intends to continue to qualify as a RIC under Subchapter M of the Internal Revenue Code (“IRC”) by distributing substantially all of its taxable net investment income and net realized capital gains to its shareholders and otherwise complying with the requirements of the IRC. The Fund has distributed substantially all of its income and capital gains in prior years, if applicable, and intends to distribute substantially all of its income and capital gains prior to the next fiscal year-end. Accordingly, no provision for federal income or excise taxes has been made in the accompanying financial statements. Distributions from short-term capital gains are treated as ordinary income distributions for federal income tax purposes. |
| b) | Net Investment Income (Loss), Net Realized Gains (Losses), and Distributions – Net investment income (loss) and net realized gains (losses) may differ for financial statement and tax purposes primarily because of losses deferred due to wash sale adjustments, foreign currency gains and losses, adjustments related to PFICs, REITs, RICs, certain derivatives and partnerships. The character of distributions made during the year from net investment income or net realized gains may differ from their ultimate characterization for federal income tax purposes. Also, due to the timing of dividend distributions, the fiscal year in which amounts are distributed may differ from the year that the income or realized gains (losses) were recorded by the Fund. |
| 20 |
| c) | Distributions and Components of Distributable Earnings – The tax character of distributions paid by the Fund for the periods indicated is as follows (as adjusted for dividends payable, if applicable): |
| For the Year Ended December 31, 2012 | For the Year Ended December 31, 2011 | |||||||
| Long-Term Capital Gains* | $ | 80 | $ | — | ||||
| * | The Fund designates these distributions as long-term capital dividends pursuant to IRC Sec. 852(b)(3)(C). |
| Amount | ||||
| Undistributed Ordinary Income | $ | 2,065 | ||
| Undistributed Long-Term Capital Gain | 98,459 | |||
| Unrealized Appreciation* | 101,760 | |||
| Total Accumulated Earnings | $ | 202,284 | ||
| * | Differences between book-basis and tax-basis unrealized appreciation (depreciation) may be attributable to the losses deferred due to wash sale adjustments, foreign currency gains and losses, adjustments related to PFICs, REITs, RICs, certain derivatives and partnerships. |
| d) | Reclassification of Capital Accounts – The Fund may record reclassifications in its capital accounts. These reclassifications have no impact on the total net assets of the Fund. The reclassifications are a result of permanent differences between U.S. GAAP and tax accounting for such items as foreign currency, PFICs, expiration or utilization of capital loss carryforwards or net operating losses. Adjustments are made to reflect the impact these items have on current and future distributions to shareholders. Therefore, the source of the Fund’s distributions may be shown in the accompanying Statement of Changes in Net Assets as from undistributed net investment income, from accumulated net realized gains on investments or from capital depending on the type of book and tax differences that exist. For the year ended December 31, 2012, the Fund recorded reclassifications to increase (decrease) the accounts listed below: |
| Amount | ||||
| Undistributed Net Investment Income | $ | (117 | ) | |
| Accumulated Net Realized Gain (Loss) | 746 | |||
| Capital Stock and Paid-in-Capital | (629 | ) | ||
| e) | Capital Loss Carryforward – On December 22, 2010, the Regulated Investment Company Modernization Act of 2010 (the “Act”) was enacted, which made changes to the capital loss carryforward rules. The changes are effective for taxable years beginning after the date of enactment. Under the Act, funds are permitted to carry forward capital losses for an unlimited period. However, any losses incurred during those future taxable years will be required to be utilized prior to the losses incurred in pre-enactment taxable years, which carry an expiration date. As a result of this ordering rule, pre-enactment capital loss carryforwards may be more likely to expire unused. Additionally, post-enactment capital loss carryforwards retain their character as either short-term or long-term capital losses rather than being considered all short-term as permitted under prior regulation. |
The Fund had no capital loss carryforward for U.S. federal income tax purposes as of December 31, 2012.
| f) | Accounting for Uncertainty in Income Taxes – The Fund has adopted financial reporting rules that require the Fund to analyze all open tax years, as defined by the statute of limitations, for all major jurisdictions. Generally, tax authorities can examine all tax returns filed for the last three years. The Fund does not have an examination in progress. |
| 21 |
| Hartford Small Company HLS Fund |
| Notes to Financial Statements – (continued) |
| June 30, 2013 (Unaudited) |
| (000’s Omitted) |
The Fund has reviewed all open tax years and major jurisdictions and concluded that these financial reporting rules had no effect on the Fund’s financial position or results of operations. There is no tax liability resulting from unrecognized tax benefits relating to uncertain income tax positions taken or expected to be taken on the tax return for the fiscal year ended December 31, 2012. The Fund is also not aware of any tax positions for which it is reasonably possible that the total amounts of unrecognized tax benefits will significantly change in the next twelve months.
| 7. | Expenses: |
| a) | Investment Management Agreement – Hartford Funds Management Company, LLC (“HFMC”), an indirect wholly owned subsidiary of The Hartford Financial Services Group, Inc. (“The Hartford”), serves as investment manager to the Fund pursuant to an Investment Management Agreement with the Company. The investment manager has overall investment supervisory responsibility for the Fund. In addition, the investment manager provides administrative personnel, services, equipment, facilities and office space for proper operation of the Fund. The investment manager has contracted with Wellington Management Company, LLP (“Wellington Management”) under a sub-advisory agreement for the provision of day-to-day investment management services to the Fund in accordance with the Fund’s investment objective and policies. The Fund pays a fee to the investment manager, a portion of which may be used to compensate Wellington Management. |
The schedule below reflects the rates of compensation paid to HFMC for investment management services rendered as of June 30, 2013; the rates are accrued daily and paid monthly.
| Average Daily Net Assets | Annual Fee | |||
| On first $250 million | 0.7750 | % | ||
| On next $250 million | 0.7250 | % | ||
| On next $500 million | 0.6750 | % | ||
| On next $500 million | 0.6000 | % | ||
| On next $3.5 billion | 0.5500 | % | ||
| On next $5 billion | 0.5300 | % | ||
| Over $10 billion | 0.5200 | % | ||
| b) | Accounting Services Agreement – Pursuant to the Fund Accounting Agreement between HFMC and the Company, on behalf of the Fund, HFMC provides accounting services to the Fund and receives monthly compensation based on the Fund’s average daily net assets at the rates set forth below. The Fund’s accounting services fees are accrued daily and paid monthly. |
| Average Daily Net Assets | Annual Fee | |||
| On first $5 billion | 0.012 | % | ||
| Over $5 billion | 0.010 | % | ||
| c) | Operating Expenses – Allocable expenses incurred by the Company are allocated to each Fund and allocated to classes within a Fund in proportion to the average daily net assets of the Fund and each class, except where allocation of certain expenses is more fairly made directly to the Fund or to specific classes within a Fund. |
| d) | Fees Paid Indirectly – The Company, on behalf of the Fund, has entered into agreements with State Street Global Markets, LLC and Russell Implementation Services, Inc. to partially recapture non-discounted trade commissions. Such rebates are used to pay a portion of the Fund’s expenses. In addition, the Fund’s custodian banks have agreed to reduce its fees when the Fund maintains cash on deposit in a non-interest-bearing custody account. For the six-month period ended June 30, 2013, these amounts, if any, are included in the Statement of Operations. |
| 22 |
The ratio of expenses to average net assets in the accompanying financial highlights excludes the reduction in expenses related to fees paid indirectly. The annualized expense ratio for the period listed below reflecting the reduction for fees paid indirectly is as follows:
| Annualized Six- Month Period Ended June 30, 2013 | ||||
| Class IA | 0.71 | % | ||
| Class IB | 0.96 | |||
| e) | Distribution Plan for Class IB shares – The Company, on behalf of the Fund, has adopted a Distribution Plan pursuant to Rule 12b-1 of the 1940 Act to compensate the distributor, Hartford Funds Distributors, LLC (“HFD”), (formerly known as Hartford Investment Financial Services, LLC), an indirect wholly owned subsidiary of The Hartford, from assets attributable to the Class IB shares for services rendered and expenses borne in connection with activities primarily intended to result in the sale of the Class IB shares, subject to the review and approval of the Company’s Board of Directors. |
The Distribution Plan provides that the Fund may pay annually up to 0.25% of the average daily net assets of the Fund attributable to its Class IB shares for activities primarily intended to result in the sale of Class IB shares. The Board has the authority to suspend or reduce these payments at any point in time. Under the terms of the Distribution Plan and the principal underwriting agreement, the Fund is authorized to make payments monthly to the distributor that may be used to pay or compensate entities providing distribution and shareholder servicing with respect to the Class IB shares for such entities’ fees or expenses incurred or paid in that regard. These fees are accrued daily and paid monthly.
| f) | Other Related Party Transactions – Certain officers of the Fund are directors and/or officers of the investment manager and/or The Hartford or its subsidiaries. For the six-month period ended June 30, 2013, a portion of the Fund’s Chief Compliance Officer’s salary was paid by all the investment companies in the Hartford fund complex. The portion allocated to the Fund was in the amount of $1. Hartford Administrative Services Company (“HASCO”), an indirect wholly owned subsidiary of The Hartford, provides transfer agent services to the Fund. HASCO was compensated on a per account basis for providing such services. The amount paid to HASCO can be found in the Statement of Operations. These fees are accrued daily and paid monthly. |
| g) | Payments from Affiliates – In July of 2007, The Hartford entered into a settlement with the Attorneys General of the states of New York, Connecticut and Illinois relating to market timing and the company's individual variable annuity contracts in which certain payments would be made directly to the variable annuity contract holders. The distribution plan provided that unclaimed money from the settlement would be distributed to certain HLS Funds that are investment options through a Hartford individual variable annuity contract. The unclaimed money was distributed to the Fund on September 18, 2009. |
The total return in the accompanying financial highlights includes payments from affiliates. Had the payments from the affiliates been excluded, the impact and total return for the periods listed below would have been as follows:
| For the Year Ended December 31, 2009 | |||||
Class IA | Class IB | ||||
| Impact from Payment from Affiliate for Attorneys General Settlement | 0.08 | % | 0.09 | % | |
| Total Return Excluding Payment from Affiliate | 29.18 | % | 28.90 | % | |
| 23 |
| Hartford Small Company HLS Fund |
| Notes to Financial Statements – (continued) |
| June 30, 2013 (Unaudited) |
| (000’s Omitted) |
| 8. | Investment Transactions: |
For the six-month period ended June 30, 2013, the Fund's aggregate purchases and sales of investment securities (excluding short-term investments) were as follows:
| Amount | ||||
| Cost of Purchases Excluding U.S. Government Obligations | $ | 602,783 | ||
| Sales Proceeds Excluding U.S. Government Obligations | 749,995 | |||
| 9. | Line of Credit: |
The Fund is one of several Hartford funds that participate in a $500 million committed revolving line of credit facility. The facility is to be used for temporary or emergency purposes. Under the arrangement, the funds are required to own securities having a market value in excess of 300% of the total bank borrowings. The interest rate on borrowings varies depending on the nature of the loan. The facility also requires a fee to be paid based on the amount of the commitment. This commitment fee is allocated to all of the funds participating in the line of credit based on the average net assets of the funds. During the six-month period ended June 30, 2013, the Fund did not have any borrowings under this facility.
| 10. | Industry Classifications: |
Other than the industry classifications “Other Investment Pools and Funds” and “Exchange Traded Funds,” equity industry classifications used in this report are the Global Industry Classification Standard, which was developed by and is the exclusive property and service mark of MSCI, Inc. and Standard & Poor’s.
| 11. | Indemnifications: |
Under the Company’s organizational documents, the Company shall indemnify its officers and directors to the full extent required or permitted under Maryland General Corporation Law and the federal securities laws. In addition, the Company, on behalf of the Fund, may enter into contracts that contain a variety of indemnifications. The Company’s maximum exposure under these arrangements is unknown. However, as of the date of these financial statements, the Company has not had prior claims or losses pursuant to these contracts and expects the risk of loss to be remote.
| 12. | Pending Legal Proceedings: |
On February 25, 2011, Jennifer L. Kasilag, Louis Mellinger, Judith M. Menendez, Jacqueline M. Robinson, and Linda A. Russell filed a derivative lawsuit against Hartford Investment Financial Services, LLC (“HIFSCO”)(now known as Hartford Funds Distributors, LLC) on behalf of six Hartford retail mutual funds in the United States District Court for the District of New Jersey, alleging that HIFSCO received excessive advisory and distribution fees in violation of its statutory fiduciary duty under Section 36(b) of the 1940 Act when serving as investment manager and principal underwriter, respectively, to the Hartford retail mutual funds. HIFSCO moved to dismiss and, in September 2011, the motion was granted in part and denied in part, with leave to amend the complaint. In November 2011, plaintiffs filed an amended complaint on behalf of certain Hartford retail mutual funds, The Hartford Global Health Fund (now known as The Hartford Healthcare Fund), The Hartford Conservative Allocation Fund, The Hartford Growth Opportunities Fund, The Hartford Inflation Plus Fund, The Hartford Advisers Fund (now known as The Hartford Balanced Fund), and The Hartford Capital Appreciation Fund. Plaintiffs seek to rescind the investment management agreements and distribution plans between HIFSCO and these funds and to recover the total fees charged thereunder or, in the alternative, to recover any improper compensation HIFSCO received, in addition to lost earnings. HIFSCO filed a partial motion to dismiss the amended complaint and, in December 2012, the court dismissed without prejudice the claims regarding distribution fees and denied the motion with respect to the advisory fees claims. HIFSCO disputes the allegations and intends to defend vigorously.
This action concerns the activities of HIFSCO in its capacity as investment manager and principal underwriter to the Hartford retail mutual funds and does not concern HIFSCO’s activities in its capacity as principal underwriter to the HLS funds. For this reason, no accrual for litigation relating to this matter has been recorded in the financial statements of the Fund.
| 24 |
[This page intentionally left blank]
| 25 |
| Hartford Small Company HLS Fund |
| Financial Highlights |
| - Selected Per-Share Data (A) - |
| Class | Net Asset Value at Beginning of Period | Net Investment Income (Loss) | Net Realized and Unrealized Gain (Loss) on Investments | Total from Investment Operations | Dividends from Net Investment Income | Distributions from Realized Capital Gains | Distributions from Capital | Total Distributions | Net Asset Value at End of Period | |||||||||||||||||||||||||||
| For the Six-Month Period Ended June 30, 2013 (Unaudited) | ||||||||||||||||||||||||||||||||||||
| IA | $ | 19.74 | $ | (0.01 | ) | $ | 3.76 | $ | 3.75 | $ | – | $ | – | $ | – | $ | – | $ | 23.49 | |||||||||||||||||
| IB | 19.06 | (0.05 | ) | 3.70 | 3.65 | – | – | – | – | 22.71 | ||||||||||||||||||||||||||
| For the Year Ended December 31, 2012 | ||||||||||||||||||||||||||||||||||||
| IA | 17.07 | 0.03 | 2.64 | 2.67 | – | – | – | – | 19.74 | |||||||||||||||||||||||||||
| IB | 16.56 | (0.03 | ) | 2.53 | 2.50 | – | – | – | – | 19.06 | ||||||||||||||||||||||||||
| For the Year Ended December 31, 2011 | ||||||||||||||||||||||||||||||||||||
| IA | 17.66 | (0.02 | ) | (0.57 | ) | (0.59 | ) | – | – | – | – | 17.07 | ||||||||||||||||||||||||
| IB | 17.18 | (0.09 | ) | (0.53 | ) | (0.62 | ) | – | – | – | – | 16.56 | ||||||||||||||||||||||||
| For the Year Ended December 31, 2010 | ||||||||||||||||||||||||||||||||||||
| IA | 14.23 | (0.01 | ) | 3.44 | 3.43 | – | – | – | – | 17.66 | ||||||||||||||||||||||||||
| IB | 13.88 | (0.06 | ) | 3.36 | 3.30 | – | – | – | – | 17.18 | ||||||||||||||||||||||||||
| For the Year Ended December 31, 2009 | ||||||||||||||||||||||||||||||||||||
| IA | 11.01 | – | (G) | 3.22 | 3.22 | – | – | – | – | 14.23 | ||||||||||||||||||||||||||
| IB | 10.76 | (0.03 | )(G) | 3.15 | 3.12 | – | – | – | – | 13.88 | ||||||||||||||||||||||||||
| For the Year Ended December 31, 2008 | ||||||||||||||||||||||||||||||||||||
| IA | 18.62 | 0.02 | (7.56 | ) | (7.54 | ) | (0.02 | ) | (0.05 | ) | – | (0.07 | ) | 11.01 | ||||||||||||||||||||||
| IB | 18.20 | (0.01 | ) | (7.38 | ) | (7.39 | ) | – | (0.05 | ) | – | (0.05 | ) | 10.76 | ||||||||||||||||||||||
| (A) | Information presented relates to a share outstanding throughout the indicated period. |
| (B) | The figures do not include sales charges or other fees which may be applied at the variable life insurance, variable annuity or qualified retirement plan product level. Any such additional sales charges or other fees would lower the Fund's performance. |
| (C) | Ratios do not reflect reductions for fees paid indirectly. Please see Fees Paid Indirectly in the Notes to Financial Statements. |
| (D) | Portfolio turnover rate is calculated on the basis of the Fund as a whole without distinguishing between the classes of shares issued. |
| (E) | Not annualized. |
| (F) | Annualized. |
| (G) | The impact of Payment from Affiliate per share was $0.01. |
| (H) | Total return without the inclusion of the Payment from (to) Affiliate can be found in Expenses in the accompanying Notes to Financial Statements. |
| 26 |
| - Ratios and Supplemental Data - |
| Total Return(B) | Net Assets at End of Period | Ratio of Expenses to Average Net Assets Before Waivers(C) | Ratio of Expenses to Average Net Assets After Waivers(C) | Ratio of Net Investment Income (Loss) to Average Net Assets | Portfolio Turnover Rate(D) | ||||||||||||||||
| 19.03 | %(E) | $ | 1,165,698 | 0.72 | %(F) | 0.72 | %(F) | (0.16 | )%(F) | 46 | % | ||||||||||
| 18.88 | (E) | 124,847 | 0.97 | (F) | 0.97 | (F) | (0.41 | ) (F) | – | ||||||||||||
| 15.64 | 1,126,350 | 0.72 | 0.72 | 0.16 | 110 | ||||||||||||||||
| 15.10 | 117,133 | 0.97 | 0.97 | (0.13 | ) | – | |||||||||||||||
| (3.36 | ) | 1,090,883 | 0.71 | 0.71 | (0.13 | ) | 99 | ||||||||||||||
| (3.62 | ) | 155,970 | 0.96 | 0.96 | (0.38 | ) | – | ||||||||||||||
| 24.13 | 1,180,045 | 0.73 | 0.73 | (0.08 | ) | 171 | |||||||||||||||
| 23.83 | 212,281 | 0.98 | 0.98 | (0.33 | ) | – | |||||||||||||||
| 29.29 | (H) | 1,026,150 | 0.75 | 0.75 | (0.07 | ) | 184 | ||||||||||||||
| 29.01 | (H) | 208,358 | 1.00 | 1.00 | (0.32 | ) | – | ||||||||||||||
| (40.60 | ) | 793,078 | 0.71 | 0.71 | 0.16 | 194 | |||||||||||||||
| (40.73 | ) | 179,411 | 0.96 | 0.96 | (0.09 | ) | – | ||||||||||||||
| 27 |
| Hartford Small Company HLS Fund |
| Directors and Officers (Unaudited) |
The Board of Directors of the Company appoints officers who are responsible for the day-to-day operations of the Fund and who execute policies formulated by the Directors. Each director serves until his or her death, resignation, or retirement or until the next annual meeting of shareholders is held or until his or her successor is elected and qualifies.
Directors and officers who are employed by or who have a financial interest in The Hartford are considered “interested” persons of the Fund pursuant to the 1940 Act. Each officer and two of the Company’s directors, as noted in the chart below, are “interested” persons of the Fund. Each director serves as a director for The Hartford Mutual Funds, Inc., The Hartford Mutual Funds II, Inc., Hartford Series Fund, Inc., Hartford HLS Series Fund II, Inc., and as a trustee for The Hartford Alternative Strategies Fund, which, as of June 30, 2013, collectively consist of 90 funds. Correspondence may be sent to directors and officers c/o Hartford Mutual Funds, P.O. Box 2999, Hartford, Connecticut 06104-2999, except that correspondence to Mr. Annoni, Mr. Dressen, Ms. Fagely and Ms. Quade may be sent to 500 Bielenberg Drive, Woodbury, Minnesota 55125 and correspondence to Mr. Davey and Mr. Melcher may be sent to 5 Radnor Corporate Center, Suite 300, 100 Matsonford Road, Radnor, Pennsylvania 19087.
The table below sets forth, for each director and officer, his or her name, year of birth, current position with the Company and date first elected or appointed to Hartford Series Fund, Inc. (“HSF”), and Hartford HLS Series Fund II, Inc. (“HSF2”), principal occupation, and, for directors, other directorships held. The Fund’s statement of additional information contains further information on the directors and is available free of charge by calling 1-800-862-6668 or writing to Hartford HLS Funds, c/o Hartford Life Insurance Company, Hartford Life and Annuity Insurance Company, P.O. Box 14293, Lexington, KY 40512-4293.
Information on the aggregate remuneration paid to the directors of the Company can be found in the Statement of Operations herein. The Fund pays to The Hartford a portion of the Chief Compliance Officer’s compensation, but does not pay salaries or compensation to any of their other officers or directors who are employed by The Hartford.
Non-Interested Directors
Lynn S. Birdsong (1946) Director since 2003, Co-Chairman of the Investment Committee
Mr. Birdsong is a private investor. Mr. Birdsong currently serves as a Director of the Sovereign High Yield Investment Company (April 2010 to current). Mr. Birdsong currently serves as an Independent Director of Nomura Partners Funds, Inc. (formerly, The Japan Fund) (March 2003 to current). From 1979 to 2002, Mr. Birdsong was a managing director of Zurich Scudder Investments, an investment management firm. During his employment with Scudder, Mr. Birdsong was an Interested Director of The Japan Fund. Since 1981, Mr. Birdsong has been a partner in Birdsong Company, an advertising specialty firm.
Robert M. Gavin, Jr. (1940) Director since 2002 (HSF) and 1986 (HSF2), Chairman of the Board since 2004
Dr. Gavin is an educational consultant. Prior to September 1, 2001, he was President of Cranbrook Education Community and prior to July 1996, he was President of Macalester College, St. Paul, Minnesota.
Duane E. Hill (1945) Director since 2001 (HSF) and 2002 (HSF2), Chairman of the Nominating Committee
Mr. Hill is Partner of TSG Ventures L.P., a private equity investment company. Mr. Hill is a former partner of TSG Capital Group, a private equity investment firm that served as sponsor and lead investor in leveraged buyouts of middle market companies.
Sandra S. Jaffee (1941) Director since 2005
Ms. Jaffee is the founder and Chief Executive Officer of a private company, Homeworks Concierge, LLC, which provides residential property management services in Westchester County, New York (January 2012 to present). Ms. Jaffee served as Chairman (2008 to 2009) and Chief Executive Officer of Fortent (formerly Searchspace Group), a leading provider of compliance/regulatory technology to financial institutions from August 2005 to August 2009. Ms. Jaffee currently serves as a member of the Board of Directors of Broadridge Financial Solutions as well as a Trustee of Muhlenberg College.
William P. Johnston (1944) Director since 2005, Chairman of the Compliance Committee
In February 2008, Mr. Johnston was elected to the Board of Directors of HCR-ManorCare, Inc. In August 2007, Mr. Johnston was elected to the Board of Directors of LifeCare Holdings, Inc. In July 2006, Mr. Johnston was elected to the Board of Directors of MultiPlan, Inc. and served as a director (July 2006 to August 2010). In June 2006, Mr. Johnston was appointed as Senior Advisor to The Carlyle Group, a global private equity and alternative asset investment firm. In May 2006, Mr. Johnston was elected to the Supervisory Board of Fresenius Medical Care AG & Co. KGaA, after its acquisition of Renal Care Group, Inc. in March 2006.
Phillip O. Peterson (1944) Director since 2002 (HSF) and 2000 (HSF2), Chairman of the Audit Committee
Mr. Peterson is a mutual fund industry consultant. He was a partner of KPMG LLP (an accounting firm) until July 1999. Mr. Peterson joined William Blair Funds in February 2007 as a member of the Board of Trustees. Mr. Peterson also joined the Board of Trustees of Symetra Variable Mutual Funds Trust as a trustee in February 2012.
| 28 |
Lemma W. Senbet (1946) Director since 2005
Dr. Senbet is the William E. Mayer Chair Professor of Finance and Director, Center for Financial Policy, at the University of Maryland, Robert H. Smith School of Business. He was chair of the Finance Department from 1998 to 2006. Previously he was a chaired professor of finance at the University of Wisconsin-Madison. Also, he was director of the Fortis Funds from March 2000 to July 2002. Dr. Senbet served the finance profession in various capacities, including as director of the American Finance Association and President of the Western Finance Association. In 2006, Dr. Senbet was inducted Fellow of Financial Management Association International for his career-long distinguished scholarship and professional service.
Interested Directors and Officers
James E. Davey (1964) Director since 2012, President and Chief Executive Officer since 2010
Mr. Davey serves as Executive Vice President of Hartford Life Insurance Company (“HLIC”) and The Hartford Financial Services Group, Inc. Additionally, Mr. Davey serves as Chairman of the Board and Manager of Hartford Funds Distributors, LLC (“HFD”) and Hartford Administrative Services Company (“HASCO”). Mr. Davey also serves as Manager, President and Chairman of the Board for Hartford Funds Management Company, LLC (“HFMC”). Mr. Davey joined The Hartford in 2002.
Lowndes A. Smith (1939) Director since 1996 (HSF) and 2002 (HSF2), Co-Chairman of the Investment Committee
Mr. Smith served as Vice Chairman of The Hartford from February 1997 to January 2002, as President and Chief Executive Officer of Hartford Life, Inc. from February 1997 to January 2002, and as President and Chief Operating Officer of The Hartford Life Insurance Companies from January 1989 to January 2002. Mr. Smith serves as a Director of White Mountains Insurance Group, Ltd., One Beacon Insurance and Symetra Financial and as Managing Director of Whittington Gray Associates.
Other Officers
Mark A. Annoni (1964) Vice President, Controller and Treasurer since 2012
Mr. Annoni serves as the Assistant Vice President of HLIC (February 2004 to present). Mr. Annoni joined The Hartford in April 2001 as part of The Hartford’s acquisition of Fortis Financial Group (“Fortis”). Prior to joining The Hartford, Mr. Annoni served as Manager of Mutual Fund Accounting at Fortis (July 1997 to April 2001).
Michael R. Dressen (1963) AML Compliance Officer since 2011
Mr. Dressen currently serves as Assistant Vice President of HLIC. He also serves as Chief Compliance Officer and AML Compliance Officer of HASCO and as AML Officer of HFD. Mr. Dressen joined The Hartford in 2005 from State Farm Insurance Companies where he held various positions related to mutual funds, variable products, and property casualty insurance.
Tamara L. Fagely (1958) Vice President since 2002 (HSF) and 1993 (HSF2)
Currently, Ms. Fagely is President and a Director of HASCO, Chief Administrative Officer and Manager of HFMC and a Vice President of HLIC. Ms. Fagely served as a Vice President of HASCO (1998-2013) and Chief Financial Officer of HASCO (2006-2013). She served as Assistant Vice President of HLIC from December 2001 through March 2005. In addition, Ms. Fagely is Manager and Chief Operating Officer of HFD.
Edward P. Macdonald (1967) Vice President, Secretary and Chief Legal Officer since 2005
Mr. Macdonald serves as Vice President of HLIC and Vice President, Chief Legal Officer and Secretary of HFD and HASCO. Mr. Macdonald also serves as Manager, Vice President, Chief Legal Officer and Secretary of HFMC. Mr. Macdonald joined The Hartford in 2005.
Joseph G. Melcher (1973) Vice President and Chief Compliance Officer since 2013(1)
Mr. Melcher currently serves as Vice President of HFMC and HFD. Mr. Melcher joined The Hartford in 2012 from Touchstone Investments, a member of the Western & Southern Financial Group, where he held the position of Vice President and Chief Compliance Officer from 2010 through 2012 and Assistant Vice President, Compliance from 2005 to 2010.
| (1) | Mr. Melcher was named Vice President and Chief Compliance Officer of HSF and HSF2 on February 6, 2013. Prior to February 6, 2013, Colleen Pernerewski served as Chief Compliance Officer of HSF and HSF2. |
Vernon J. Meyer (1964) Vice President since 2006
Mr. Meyer serves as Senior Vice President of HLIC. He also serves as Senior Vice President of HFMC and HFD. Mr. Meyer joined The Hartford in 2004.
| 29 |
| Hartford Small Company HLS Fund |
| Directors and Officers (Unaudited) – (continued) |
Laura S. Quade (1969) Vice President since 2012
Ms. Quade currently serves as Vice President of HASCO and is a Director of Mutual Fund Service Operations. She also serves as Director, Enterprise Operations of HFD and HLIC. Ms. Quade joined The Hartford in 2001 as part of The Hartford’s acquisition of Fortis.
Elizabeth L. Schroeder (1966) Vice President since 2010(2)
Ms. Schroeder currently serves as Assistant Vice President of HLIC. Ms. Schroeder joined HLIC in 1991. She is also an Assistant Vice President of HFMC and HASCO.
| (2) | Ms. Schroeder served as Vice President of HSF and HSF2 until August 7, 2013. |
Martin Swanson (1962) Vice President since 2010
Mr. Swanson is a Vice President of HLIC. Mr. Swanson also serves as Chief Marketing Officer for HFD. Prior to joining HLIC in 1998, Mr. Swanson was a Vice President at PaineWebber, Inc.
HOW TO OBTAIN A COPY OF THE FUND’S PROXY VOTING POLICIES AND VOTING RECORDS (UNAUDITED)
A description of the policies and procedures that the Fund uses to determine how to vote proxies relating to portfolio securities and information about how the Fund voted proxies relating to portfolio securities during the most recent twelve-month period ended June 30 are available (1) without charge, upon request, by calling 800-862-6668 and (2) on the SEC’s website at http://www.sec.gov.
QUARTERLY PORTFOLIO HOLDINGS INFORMATION (UNAUDITED)
The Fund files a complete schedule of portfolio holdings with the SEC for the first and third quarters of each fiscal year on Form N-Q. The Fund’s Forms are available (1) without charge, upon request, by calling 800-862-6668 and (2) on the SEC’s website at http://www.sec.gov. The Form N-Q may be reviewed and copied at the SEC’s Public Reference Room in Washington, DC. Information on the operation of the Public Reference Room may be obtained by calling 1-800-SEC-0330.
| 30 |
| Hartford Small Company HLS Fund |
| Expense Example (Unaudited) |
Your Fund's Expenses
As a shareholder of the Fund, you incur two types of costs: (1) transaction costs and (2) ongoing costs including investment management fees, distribution fees, if any, and other fund expenses. This example is intended to help you understand your ongoing costs (in dollars) of investing in the Fund and to compare these costs with the ongoing costs of investing in other mutual funds. The example is based on an investment of $1,000 invested at the beginning of the period and held for the period of December 31, 2012 through June 30, 2013.
Actual Expenses
The first set of columns of the table below provides information about actual account values and actual expenses. You may use the information in this column, together with the amount you invested, to estimate the expenses that you paid over the period. Simply divide your account value by $1,000 (for example, an $8,600 account value divided by $1,000 = 8.6), then multiply the result by the number in the line under the heading entitled “Expenses Paid During Period” to estimate the expenses you paid on your account during this period.
Hypothetical Example for Comparison Purposes
The second set of columns of the table below provides information about hypothetical account values and hypothetical expenses based on the Fund’s actual expense ratio and an assumed rate of return of 5% per year before expenses, which is not the Fund’s actual return. The hypothetical account values and expenses may not be used to estimate the actual ending account balance or expenses you paid for the period. You may use this information to compare the ongoing costs of investing in the Fund and other funds. To do so, compare this 5% hypothetical example with the 5% hypothetical examples that appear in the shareholder reports of the other funds.
Please note that the expenses shown in the table are meant to highlight your ongoing costs only and do not reflect any transactional costs, such as sales charges (loads) and CDSC. Therefore, the second set of columns of the table is useful in comparing ongoing costs only, and will not help you determine the relative total costs of owning different funds. In addition, if these transactional costs were included, your costs would be higher. Expenses are equal to the Fund's annualized expense ratios multiplied by average account value over the period, multiplied by 181/365 (to reflect the one-half year period).
| Actual return | Hypothetical (5% return before expenses) | |||||||||||||||||||||||||||||||||||
| Beginning Account Value December 31, 2012 | Ending Account Value June 30, 2013 | Expenses paid during the period December 31, 2012 through June 30, 2013 | Beginning Account Value December 31, 2012 | Ending Account Value June 30, 2013 | Expenses paid during the period December 31, 2012 through June 30, 2013 | Annualized expense ratio | Days in the current 1/2 year | Days in the full year | ||||||||||||||||||||||||||||
| Class IA | $ | 1,000.00 | $ | 1,190.30 | $ | 3.91 | $ | 1,000.00 | $ | 1,021.22 | $ | 3.61 | 0.72 | % | 181 | 365 | ||||||||||||||||||||
| Class IB | $ | 1,000.00 | $ | 1,188.80 | $ | 5.26 | $ | 1,000.00 | $ | 1,019.98 | $ | 4.86 | 0.97 | % | 181 | 365 | ||||||||||||||||||||
| 31 |
| Hartford Small Company HLS Fund |
| Principal Risks (Unaudited) |
The principal risks of investing in the Fund are described below.
Market, Selection, and Strategy Risk: The Fund’s share price may fluctuate due to market risk and/or security selections that may underperform the market or relevant benchmarks. If the sub-adviser’s investment strategy does not perform as expected, the Fund could underperform its peers or lose money. There is no guarantee the Fund will achieve its stated objective.
Small-cap Stock Risk: Small-cap stocks are generally more volatile and risky and may be less liquid than large-cap stocks because they may have limited operating histories, narrow product lines, and focus on niche markets.
Foreign Investment Risk: Foreign investments can be riskier than U.S. investments. Potential risks include currency risk that may result from unfavorable exchange rates, liquidity risk if decreased demand for a security makes it difficult to sell at the desired price, and risks that stem from substantially lower trading volume on foreign markets.
Active Trading Risk: Actively trading investments may result in higher costs (thus affecting performance).
| 32 |
HARTFORD HLS FUNDS
c/o The Hartford Wealth Management - Global Annuities
P.O. Box 14293
Lexington, KY 40512-4293
HARTFORDFUNDS
hartfordfunds.com
Hartford Series Fund, Inc. is underwritten and distributed by Hartford Funds Distributors, LLC.
Hartford Series Fund, Inc. inception dates range from 1977 to date. Hartford Series Fund, Inc. is not a subsidiary of The Hartford Financial Services Group, Inc. ("The Hartford") but is underwritten, distributed by and advised by subsidiaries of The Hartford. Investments in Hartford Series Fund, Inc. are not guaranteed by The Hartford or any other entity.
You should carefully consider investment objectives, risks, and charges and expenses of Hartford HLS Funds before investing. This and other information can be found in the Fund’s prospectus or summary prospectus, which can be obtained by calling 800-862-6668. Please read them carefully before you invest or send money.
HLSSAR-SC13 8-13 113551-1 Printed in U.S.A ©2013 The Hartford, Hartford, CT 06115
HARTFORDFUNDS
| HARTFORD STOCK HLS FUND
2013 Semi Annual Report
|
A MESSAGE FROM THE PRESIDENT
Dear Fellow Shareholders:
I want to take this opportunity to say thank you for investing in the Hartford HLS Funds.
Market Review
During the first half of the year, stocks rose steadily. U.S. equities (as represented by the S&P 500 Index1) posted a strong gain of 10.61% during the first quarter, on their way to an all-time high. During the second quarter, investors persevered through volatility surrounding rumors of the rollback of the U.S. Federal Reserve’s quantitative easing (QE) program later this year, and the S&P 500 Index rose 2.91%. That brought the market’s rise to 13.82% for the first half of 2013. The rumors about QE’s end sent bond yields and mortgage rates upward, but that wasn’t enough to dissuade investors from pushing equities into positive territory.
Because of QE, some have expressed concerns regarding the recent market rally. But a more careful examination of economic data reveals a strong foundation. Consumer balance sheets have improved since the financial crisis, with consumer debt as a percentage of income falling steadily. Housing continued its dogged recovery, fueled by population growth and pent-up demand. In fact, it’s substantive economic improvements that have moved Federal Reserve Chairman Ben Bernanke to consider removing the “training wheels” of QE, which we think should be viewed as a vote of confidence in the U.S. economy going forward.
As the U.S. outlook continues to improve, concerns do remain in the global economy. Emerging markets have lagged due to social unrest and rising inflation. Slowing growth in China is clouding global growth forecasts, but it’s important to remember that China still boasts 7.5% annual GDP growth.
It’s important to stay abreast of domestic and international economic developments while balancing your individual investment goals. Meeting with your financial advisor on a regular basis to examine your current investment strategy can help you determine whether you are on the right track:
| • | Is your portfolio fully diversified with an appropriate mix of stocks and bonds? |
| • | Is your fixed-income portfolio positioned to take advantage of opportunities across the credit spectrum and fulfill your income needs? |
| • | Is your portfolio still in line with your risk tolerance and investment time horizon? |
Your financial professional can help you choose options within our fund family to navigate today’s markets with confidence.
Thank you again for investing with the Hartford HLS Funds.
James Davey
President
Hartford HLS Funds
1 The S&P 500 Index is a market capitalization-weighted price index composed of 500 widely held common stocks.
Table of Contents
This report is prepared for the general information of contract owners and qualified retirement plan participants. It is not an offer of contracts or of qualified retirement plans. It should not be used in connection with any offer, except in conjunction with the appropriate product prospectus which contains all pertinent information including the applicable sales, administrative and other charges.
The views expressed in the Fund’s Manager Discussion under ‘‘Why did the Fund perform this way?’’ and ‘‘What is the outlook?’’ are views of the Fund’s sub-adviser and portfolio management team through the end of the period and are subject to change based on market and other conditions. The Fund’s Manager Discussion is for informational purposes only and does not represent an offer, recommendation or solicitation to buy, hold or sell any security. The specific securities identified and described, if any, do not represent all of the securities purchased or sold and you should not assume that investments in the securities identified and discussed will be profitable.
| Hartford Stock HLS Fund inception 08/31/1977 |
| (sub-advised by Wellington Management Company, LLP) |
| Investment objective – Seeks long-term growth of capital. |
Performance Overview 6/30/03 - 6/30/13

The chart above represents the hypothetical growth of a $10,000 investment in Class IA. Growth results in classes other than Class IA will vary from what is seen above due to differences in the expenses charged to those share classes.
Average Annual Total Returns (as of 6/30/13)
| 6 Month† | 1 Year | 5 Years | 10 Years | |||||||||||||
| Stock IA | 15.74% | 20.12% | 7.14% | 6.80% | ||||||||||||
| Stock IB | 15.60% | 19.82% | 6.87% | 6.53% | ||||||||||||
| Russell 1000 Index | 13.91% | 21.24% | 7.12% | 7.67% | ||||||||||||
| † | Not Annualized |
PERFORMANCE DATA QUOTED REPRESENTS PAST PERFORMANCE AND DOES NOT GUARANTEE FUTURE RESULTS. The investment return and principal value of the investment will fluctuate so that investors’ shares, when redeemed, may be worth more or less than their original cost. Current performance may be lower or higher than the performance data quoted. To obtain performance data current to the most recent month-end, please visit our website www.hartfordfunds.com.
Total returns presented above were calculated using the Fund's net asset value available to shareholders for sale or redemption of Fund shares on June 30, 2013, which may exclude investment transactions as of this date. All share class returns assume the reinvestment of all distributions at net asset value and the deduction of all fund expenses.
Russell 1000 Index is an unmanaged index which measures the performance of the 1,000 largest companies in the Russell 3000 Index, which measures the performance of the 3,000 largest U.S. companies, based on total market capitalization.
You cannot invest directly in an index.
As of the Fund’s current prospectus dated May 1, 2013, the total annual operating expense ratios for Class IA and Class IB shares were 0.51% and 0.76%, respectively. Actual expenses may be higher. Please see the accompanying Financial Highlights for expense ratios for the six-month period ended June 30, 2013.
The chart and table do not reflect the deductions of taxes, sales charges or other fees which may be applied at the variable life insurance, variable annuity or qualified retirement plan product level. Any such additional sales charges or other fees or expenses would lower the contract’s or plan’s performance.
All investments are subject to risk including the possible loss of principal. For a discussion of the Fund’s risks, please see the Principal Risks section. For more detailed information on the risks associated with an investment in the Fund, please see the prospectus.
| 2 |
| Hartford Stock HLS Fund |
| Manager Discussion |
| June 30, 2013 (Unaudited) |
| Portfolio Managers |
| Donald J. Kilbride |
| Senior Vice President and Equity Portfolio Manager |
How did the Fund perform?
The Class IA shares of the Hartford Stock HLS Fund returned 15.74% for the six-month period ended June 30, 2013, outperforming the Russell 1000 Index, which returned 13.91% for the same period. For the same period, the Fund also outperformed the 13.60% average return of the Variable Products-Underlying Funds Lipper Large-Cap Core Funds peer group, a group of funds with investment strategies similar to those of the Fund.
Why did the Fund perform this way?
U.S. equities (+13.8%), as measured by the S&P 500 Index, gained during the six-month period, reaching an all-time high in May. The rally began on the first trading day of the year after a last-minute compromise by the U.S. Congress averted the fiscal cliff. Optimism surrounding the fiscal reprieve was furthered during the first half of the period by better-than-expected corporate earnings, a robust housing market, and a gradually improving employment picture. In the second half of the period, a market rally throughout April and the first part of May paused following comments by Federal Reserve (Fed) Chairman Ben Bernanke that suggested the Fed might begin to slow quantitative easing (QE) sooner than investors anticipated. The Federal Open Market Committee’s June statement emphasized that the tapering schedule would depend on improving economic indicators. A strong housing market, positive consumer confidence trends, and a steadily healing labor market lent support to the thesis that underlying fundamentals were solid. Following an initially dramatic negative response to the Fed’s announcement and an increase in lending rates in China, U.S. markets moved higher into the end of the period.
Overall equity market performance was positive for the period across all market capitalizations: large cap (+14%), mid caps (+15%) and small cap equities (+16%) all rose meaningfully, as represented by the Russell 1000, S&P Midcap 400, and Russell 2000 Indices, respectively. During the six-month period all ten sectors rose within the Russell 1000 Index, led by Health Care (+20%), Consumer Discretionary (+20%), and Financials (+18%). Materials (+3%) and Information Technology (+6%) lagged on a relative basis.
The Fund’s outperformance versus the benchmark was driven by strong security selection in Information Technology, Materials and Consumer Discretionary. This was modestly offset by weaker security selection in Energy and Health Care. Sector allocation overall was also a contributor to relative performance due to an underweight (i.e. the Fund’s sector position was less than the benchmark position) to Information Technology and an overweight to Health Care. Note that sector positioning is typically an indirect result of our deliberate bottom-up security selection.
Top contributors to benchmark relative performance during the period were Apple (Information Technology), Microsoft (Information Technology), and Roche (Health Care). Apple, a provider of smartphones, tablets, and other personal technology items, saw its shares fall during the period after the firm slightly missed earnings expectations due to weaker-than-expected iPad sales. In addition, the company gave disappointing revenue and earnings guidance. Not holding benchmark constituent Apple during this period aided relative performance. Shares of Microsoft, a U.S.-based software company, rose during the period after the company posted better-than-expected quarterly earnings. The enterprise business continued to deliver strong results, more than offsetting the sluggish consumer business. Shares of Roche, a Swiss-based global health care company, outperformed during the period. Investors became more positive about the company's near-term product roll out and future drug pipeline as eleven of fourteen Phase III trials delivered positive results in 2012. Microsoft (Information Technology), Johnson & Johnson (Health Care), and Roche (Health Care) were the top contributors to performance on an absolute basis (i.e. total return).
Stocks that detracted the most from benchmark relative returns during the period were CH Robinson Worldwide (Industrials), Oracle (Information Technology), and Enbridge (Energy). Shares of CH Robinson Worldwide, a freight transportation services and logistics solutions provider, fell during the quarter after the company announced disappointing earnings, which were challenged by a slow volume recovery. Shares of Oracle, a provider of enterprise software (Database and Middleware), fell during the period after the company reported quarterly results that missed consensus expectations. Shares of Enbridge, a transporter and distributor of energy across North America, fell during the period as some investors were disappointed by management's cautious tone for the remainder of the year. Additionally, a large secondary offering added temporary pressure on the shares. CH Robinson Worldwide
| 3 |
| Hartford Stock HLS Fund |
| Manager Discussion – (continued) |
| June 30, 2013 (Unaudited) |
(Industrials), Oracle (Information Technology), and Merck (Health Care) were the top detractors from performance on an absolute basis.
What is the outlook?
As a reminder, we try to measure the prospects for the portfolio’s current and potential holdings over a five-year horizon. We continue to have high conviction in the virtue of our dividend-oriented approach in which we seek to find companies that we believe have above-average growth in dividends.
We continue to believe that global investors are presenting too optimistic a view of the underlying health of the world’s economy. While the effect of massive central bank liquidity seems to have nudged employment in the right direction, we remain concerned with the private sector’s ability to take the momentum to the next level. Indeed, we believe that the rather dramatic equity market sell-off that followed the mere suggestion of a slowdown in Fed purchase activity seems to suggest as much. We believe that earnings results from the recently completed second quarter are likely to confirm this continued softness as well. As always, we will aggressively use any price weakness that might occur to seek to raise the quality of the portfolio.
At the end of the period, our bottom-up investment approach resulted in overweight exposures in Health Care, Consumer Discretionary, and Industrials as we continued to find attractive investment opportunities in these sectors. The Fund’s largest underweights relative to the Russell 1000 Index were in Financials, Information Technology, and Telecommunication Services.
Diversification by Industry
as of June 30, 2013
| Industry (Sector) | Percentage of Net Assets | |||
| Banks (Financials) | 3.6 | % | ||
| Capital Goods (Industrials) | 10.0 | |||
| Consumer Durables and Apparel (Consumer Discretionary) | 3.6 | |||
| Consumer Services (Consumer Discretionary) | 3.2 | |||
| Diversified Financials (Financials) | 1.6 | |||
| Energy (Energy) | 8.9 | |||
| Food and Staples Retailing (Consumer Staples) | 4.0 | |||
| Food, Beverage and Tobacco (Consumer Staples) | 3.3 | |||
| Health Care Equipment and Services (Health Care) | 6.8 | |||
| Household and Personal Products (Consumer Staples) | 3.7 | |||
| Insurance (Financials) | 3.7 | |||
| Materials (Materials) | 4.2 | |||
| Media (Consumer Discretionary) | 3.6 | |||
| Pharmaceuticals, Biotechnology and Life Sciences (Health Care) | 13.5 | |||
| Real Estate (Financials) | 1.1 | |||
| Retailing (Consumer Discretionary) | 5.8 | |||
| Software and Services (Information Technology) | 11.1 | |||
| Transportation (Industrials) | 3.9 | |||
| Utilities (Utilities) | 1.3 | |||
| Short-Term Investments | 2.8 | |||
| Other Assets and Liabilities | 0.3 | |||
| Total | 100.0 | % | ||
| 4 |
| Hartford Stock HLS Fund |
| Schedule of Investments |
| June 30, 2013 (Unaudited) |
| (000’s Omitted) |
| Shares or Principal Amount | Market Value ╪ | |||||||
| COMMON STOCKS - 96.9% | ||||||||
| Banks - 3.6% | ||||||||
| 448 | PNC Financial Services Group, Inc. | $ | 32,690 | |||||
| 783 | Wells Fargo & Co. | 32,313 | ||||||
| 65,003 | ||||||||
| Capital Goods - 10.0% | ||||||||
| 333 | Emerson Electric Co. | 18,159 | ||||||
| 418 | General Dynamics Corp. | 32,724 | ||||||
| 368 | Honeywell International, Inc. | 29,233 | ||||||
| 390 | Lockheed Martin Corp. | 42,275 | ||||||
| 266 | Northrop Grumman Corp. | 22,011 | ||||||
| 396 | United Technologies Corp. | 36,799 | ||||||
| 181,201 | ||||||||
| Consumer Durables and Apparel - 3.6% | ||||||||
| 687 | Mattel, Inc. | 31,141 | ||||||
| 520 | NIKE, Inc. Class B | 33,132 | ||||||
| 64,273 | ||||||||
| Consumer Services - 3.2% | ||||||||
| 587 | McDonald's Corp. | 58,120 | ||||||
| Diversified Financials - 1.6% | ||||||||
| 114 | BlackRock, Inc. | 29,360 | ||||||
| Energy - 8.9% | ||||||||
| 1,730 | BG Group plc | 29,398 | ||||||
| 220 | Chevron Corp. | 26,082 | ||||||
| 722 | Enbridge, Inc. | 30,359 | ||||||
| 450 | Exxon Mobil Corp. | 40,630 | ||||||
| 385 | Occidental Petroleum Corp. | 34,379 | ||||||
| 160,848 | ||||||||
| Food and Staples Retailing - 4.0% | ||||||||
| 566 | CVS Caremark Corp. | 32,370 | ||||||
| 534 | Wal-Mart Stores, Inc. | 39,787 | ||||||
| 72,157 | ||||||||
| Food, Beverage and Tobacco - 3.3% | ||||||||
| 590 | Coca-Cola Co. | 23,647 | ||||||
| 443 | PepsiCo, Inc. | 36,225 | ||||||
| 59,872 | ||||||||
| Health Care Equipment and Services - 6.8% | ||||||||
| 905 | Cardinal Health, Inc. | 42,708 | ||||||
| 839 | Medtronic, Inc. | 43,198 | ||||||
| 566 | UnitedHealth Group, Inc. | 37,060 | ||||||
| 122,966 | ||||||||
| Household and Personal Products - 3.7% | ||||||||
| 481 | Colgate-Palmolive Co. | 27,564 | ||||||
| 515 | Procter & Gamble Co. | 39,638 | ||||||
| 67,202 | ||||||||
| Insurance - 3.7% | ||||||||
| 353 | ACE Ltd. | 31,585 | ||||||
| 205 | Chubb Corp. | 17,346 | ||||||
| 452 | Marsh & McLennan Cos., Inc. | 18,028 | ||||||
| 66,959 | ||||||||
| Materials - 4.2% | ||||||||
| 360 | Ecolab, Inc. | 30,697 | ||||||
| 385 | Praxair, Inc. | 44,295 | ||||||
| 74,992 | ||||||||
| Media - 3.6% | ||||||||
| 639 | Omnicom Group, Inc. | 40,182 | ||||||
| 400 | Walt Disney Co. | 25,268 | ||||||
| 65,450 | ||||||||
| Pharmaceuticals, Biotechnology and Life Sciences - 13.5% | ||||||||
| 318 | Amgen, Inc. | 31,405 | ||||||
| 628 | Johnson & Johnson | 53,910 | ||||||
| 925 | Merck & Co., Inc. | 42,945 | ||||||
| 1,213 | Pfizer, Inc. | 33,982 | ||||||
| 189 | Roche Holding AG | 46,933 | ||||||
| 907 | Teva Pharmaceutical Industries Ltd. ADR | 35,555 | ||||||
| 244,730 | ||||||||
| Real Estate - 1.1% | ||||||||
| 128 | Public Storage REIT | 19,665 | ||||||
| Retailing - 5.8% | ||||||||
| 9,440 | Allstar Co. ⌂●† | 19,578 | ||||||
| 10,986 | Buck Holdings L.P. ⌂●† | 3,335 | ||||||
| 900 | Lowe's Cos., Inc. | 36,813 | ||||||
| 650 | Target Corp. | 44,780 | ||||||
| 104,506 | ||||||||
| Software and Services - 11.1% | ||||||||
| 338 | Accenture plc | 24,319 | ||||||
| 642 | Automatic Data Processing, Inc. | 44,190 | ||||||
| 200 | IBM Corp. | 38,297 | ||||||
| 1,743 | Microsoft Corp. | 60,187 | ||||||
| 1,112 | Oracle Corp. | 34,162 | ||||||
| 201,155 | ||||||||
| Transportation - 3.9% | ||||||||
| 313 | C.H. Robinson Worldwide, Inc. | 17,642 | ||||||
| 614 | United Parcel Service, Inc. Class B | 53,139 | ||||||
| 70,781 | ||||||||
| Utilities - 1.3% | ||||||||
| 397 | Dominion Resources, Inc. | 22,545 | ||||||
| Total common stocks | ||||||||
| (cost $1,479,047) | $ | 1,751,785 | ||||||
| Total long-term investments | ||||||||
| (cost $1,479,047) | $ | 1,751,785 | ||||||
| SHORT-TERM INVESTMENTS - 2.8% | ||||||||
| Repurchase Agreements - 2.8% | ||||||||
| Bank of America Merrill Lynch TriParty Repurchase Agreement (maturing on 07/01/2013 in the amount of $189, collateralized by GNMA 3.00%, 2042, value of $192) | ||||||||
| $ | 189 | 0.13%, 6/28/2013 | $ | 189 | ||||
| Bank of Montreal TriParty Repurchase Agreement (maturing on 07/01/2013 in the amount of $4,018, collateralized by FHLMC 4.00% - 5.00%, 2023 - 2025, FNMA 2.00% - 5.00%, 2022 - 2042, GNMA 2.00% - 5.00%, 2041 - 2043, value of $4,088) | ||||||||
| 4,018 | 0.15%, 6/28/2013 | 4,018 | ||||||
The accompanying notes are an integral part of these financial statements.
| 5 |
| Hartford Stock HLS Fund |
| Schedule of Investments – (continued) |
| June 30, 2013 (Unaudited) |
| (000’s Omitted) |
| Shares or Principal Amount | Market Value ╪ | |||||||||||
| SHORT-TERM INVESTMENTS - 2.8% - (continued) | ||||||||||||
| Repurchase Agreements - 2.8% - (continued) | ||||||||||||
| Bank of Montreal TriParty Repurchase Agreement (maturing on 07/01/2013 in the amount of $7,806, collateralized by FHLB 0.38%, 2015, FHLMC 0.38%, 2014, FNMA 0.50% - 5.50%, 2015 - 2042, value of $7,944) | ||||||||||||
| $ | 7,806 | 0.12%, 6/28/2013 | $ | 7,806 | ||||||||
| Barclays Capital TriParty Repurchase Agreement (maturing on 07/01/2013 in the amount of $5,409, collateralized by U.S. Treasury Note 3.13%, 2021, value of $5,499) | ||||||||||||
| 5,409 | 0.10%, 6/28/2013 | 5,409 | ||||||||||
| Citigroup Global Markets, Inc. TriParty Repurchase Agreement (maturing on 07/01/2013 in the amount of $15,941, collateralized by U.S. Treasury Bill 0.85%, 2013, U.S. Treasury Note 0.63% - 3.25%, 2013 - 2018, value of $16,181) | ||||||||||||
| 15,941 | 0.10%, 6/28/2013 | 15,941 | ||||||||||
| Deutsche Bank Securities TriParty Repurchase Agreement (maturing on 07/01/2013 in the amount of $189, collateralized by FNMA 4.50%, 2035, value of $192) | ||||||||||||
| 189 | 0.25%, 6/28/2013 | 189 | ||||||||||
| RBS Securities, Inc. TriParty Repurchase Agreement (maturing on 07/01/2013 in the amount of $6,393, collateralized by U.S. Treasury Note 1.00% - 2.63%, 2014 - 2020, value of $6,521) | ||||||||||||
| 6,393 | 0.10%, 6/28/2013 | 6,393 | ||||||||||
| TD Securities TriParty Repurchase Agreement (maturing on 07/01/2013 in the amount of $11,274, collateralized by FHLMC 3.50% - 4.00%, 2042, FNMA 3.50% - 4.50%, 2041 - 2042, value of $11,466) | ||||||||||||
| 11,274 | 0.12%, 6/28/2013 | 11,274 | ||||||||||
| UBS Securities, Inc. Repurchase Agreement (maturing on 07/01/2013 in the amount of $163, collateralized by U.S. Treasury Note 0.63%, 2014, value of $166) | ||||||||||||
| 163 | 0.09%, 6/28/2013 | 163 | ||||||||||
| 51,382 | ||||||||||||
| Total short-term investments | ||||||||||||
| (cost $51,382) | $ | 51,382 | ||||||||||
| Total investments | ||||||||||||
| (cost $1,530,429)▲ | 99.7 | % | $ | 1,803,167 | ||||||||
| Other assets and liabilities | 0.3 | % | 5,414 | |||||||||
| Total net assets | 100.0 | % | $ | 1,808,581 | ||||||||
The accompanying notes are an integral part of these financial statements.
| 6 |
| Note: | Percentage of investments as shown is the ratio of the total market value to total net assets. |
Prices of foreign equities that are principally traded on certain foreign markets may be adjusted daily pursuant to a fair value pricing service approved by the Board of Directors in order to reflect an adjustment for factors occurring after the close of certain foreign markets but before the close of the New York Stock Exchange.
| ▲ | At June 30, 2013, the cost of securities for federal income tax purposes was $1,536,415 and the aggregate gross unrealized appreciation and depreciation based on that cost were: |
| Unrealized Appreciation | $ | 289,185 | ||
| Unrealized Depreciation | (22,433 | ) | ||
| Net Unrealized Appreciation | $ | 266,752 |
| † | These securities were valued in good faith at fair value as determined under policies and procedures established by and under the supervision of the Company's Board of Directors. At June 30, 2013, the aggregate value of these securities was $22,913, which represents 1.3% of total net assets. This amount excludes securities that are principally traded in certain foreign markets and whose prices are adjusted pursuant to a third party pricing service methodology approved by the Board of Directors. |
| ● | Non-income producing. |
| ⌂ | The following securities are considered illiquid. Illiquid securities are often purchased in private placement transactions, are often not registered under the Securities Act of 1933 and may have contractual restrictions on resale. A security may also be considered illiquid if the security lacks a readily available market or if its valuation has not changed for a certain period of time. |
| Period Acquired | Shares/ Par | Security | Cost Basis | |||||||
| 08/2011 | 9,440 | Allstar Co. | $ | 5,578 | ||||||
| 06/2007 | 10,986 | Buck Holdings L.P. | $ | 742 | ||||||
At June 30, 2013, the aggregate value of these securities was $22,913, which represents 1.3% of total net assets.
Foreign Currency Contracts Outstanding at June 30, 2013
| Currency | Buy / Sell | Delivery Date | Counterparty | Contract Amount | Market Value ╪ | Unrealized Appreciation/ (Depreciation) | ||||||||||||
| CHF | Sell | 07/03/2013 | UBS | $ | 571 | $ | 571 | $ | – | |||||||||
| GBP | Sell | 07/03/2013 | BCLY | 364 | 364 | – | ||||||||||||
| $ | – | |||||||||||||||||
| ╪ | See Significant Accounting Policies of accompanying Notes to Financial Statements regarding valuation of securities. |
| GLOSSARY: (abbreviations used in preceding Schedule of Investments) | |
| Counterparty Abbreviations: | |
| BCLY | Barclays |
| UBS | UBS AG |
| Currency Abbreviations: | |
| CHF | Swiss Franc |
| GBP | British Pound |
| Other Abbreviations: | |
| ADR | American Depositary Receipt |
| FHLB | Federal Home Loan Bank |
| FHLMC | Federal Home Loan Mortgage Corp. |
| FNMA | Federal National Mortgage Association |
| GNMA | Government National Mortgage Association |
| REIT | Real Estate Investment Trust |
The accompanying notes are an integral part of these financial statements.
| 7 |
| Hartford Stock HLS Fund |
| Investment Valuation Hierarchy Level Summary |
| June 30, 2013 (Unaudited) |
| (000’s Omitted) |
| Total | Level 1 ♦ | Level 2 ♦ | Level 3 | |||||||||||||
| Assets: | ||||||||||||||||
| Common Stocks ‡ | $ | 1,751,785 | $ | 1,652,541 | $ | 76,331 | $ | 22,913 | ||||||||
| Short-Term Investments | 51,382 | – | 51,382 | – | ||||||||||||
| Total | $ | 1,803,167 | $ | 1,652,541 | $ | 127,713 | $ | 22,913 | ||||||||
| Liabilities: | ||||||||||||||||
| Foreign Currency Contracts * | – | – | – | – | ||||||||||||
| Total | $ | – | $ | – | $ | – | $ | – | ||||||||
| ♦ | For the six-month period ended June 30, 2013, there were no transfers between Level 1 and Level 2. |
| ‡ | The Fund has all or primarily all of the equity securities categorized in a particular level. Refer to the Schedule of Investments for further industry breakout. |
| * | Derivative instruments not reflected in the Schedule of Investments are valued at the unrealized appreciation/depreciation on the investments. |
Following is a reconciliation of Level 3 assets for which significant unobservable inputs were used to determine fair value:
| Balance as of December 31, 2012 | Realized Gain (Loss) | Change in Unrealized Appreciation (Depreciation) | Net Amortization | Purchases | Sales | Transfers Into Level 3 | Transfers Out of Level 3 | Balance as of June 30, 2013 | ||||||||||||||||||||||||||||
| Assets: | ||||||||||||||||||||||||||||||||||||
| Common Stocks | $ | 21,169 | $ | 4,993 | $ | 2,956 | * | $ | — | $ | — | $ | (6,205 | ) | $ | — | $ | — | $ | 22,913 | ||||||||||||||||
| Total | $ | 21,169 | $ | 4,993 | $ | 2,956 | $ | — | $ | — | $ | (6,205 | ) | $ | — | $ | — | $ | 22,913 | |||||||||||||||||
| * | Change in unrealized appreciation (depreciation) in the current period relating to assets still held at June 30, 2013 was $2,956. |
The accompanying notes are an integral part of these financial statements.
| 8 |
| Hartford Stock HLS Fund |
| Statement of Assets and Liabilities |
| June 30, 2013 (Unaudited) |
| (000’s Omitted) |
| Assets: | ||||
| Investments in securities, at market value (cost $1,530,429) | $ | 1,803,167 | ||
| Cash | 56 | |||
| Receivables: | ||||
| Investment securities sold | �� | 38,887 | ||
| Fund shares sold | 420 | |||
| Dividends and interest | 2,329 | |||
| Total assets | 1,844,859 | |||
| Liabilities: | ||||
| Unrealized depreciation on foreign currency contracts | — | |||
| Payables: | ||||
| Investment securities purchased | 34,970 | |||
| Fund shares redeemed | 1,059 | |||
| Investment management fees | 141 | |||
| Distribution fees | 8 | |||
| Accrued expenses | 100 | |||
| Total liabilities | 36,278 | |||
| Net assets | $ | 1,808,581 | ||
| Summary of Net Assets: | ||||
| Capital stock and paid-in-capital | $ | 2,158,224 | ||
| Undistributed net investment income | 17,618 | |||
| Accumulated net realized loss | (640,007 | ) | ||
| Unrealized appreciation of investments and the translations of assets and liabilities denominated in foreign currency | 272,746 | |||
| Net assets | $ | 1,808,581 | ||
| Shares authorized | 4,000,000 | |||
| Par value | $ | 0.001 | ||
| Class IA: Net asset value per share | $ | 51.77 | ||
| Shares outstanding | 31,023 | |||
| Net assets | $ | 1,606,100 | ||
| Class IB: Net asset value per share | $ | 51.68 | ||
| Shares outstanding | 3,918 | |||
| Net assets | $ | 202,481 |
The accompanying notes are an integral part of these financial statements.
| 9 |
| Hartford Stock HLS Fund |
| Statement of Operations |
| For the Six-Month Period Ended June 30, 2013 (Unaudited) |
| (000’s Omitted) |
| Investment Income: | ||||
| Dividends | $ | 22,585 | ||
| Interest | 17 | |||
| Less: Foreign tax withheld | (369 | ) | ||
| Total investment income, net | 22,233 | |||
| Expenses: | ||||
| Investment management fees | 4,289 | |||
| Distribution fees - Class IB | 258 | |||
| Custodian fees | 6 | |||
| Accounting services fees | 91 | |||
| Board of Directors' fees | 24 | |||
| Audit fees | 10 | |||
| Other expenses | 142 | |||
| Total expenses (before fees paid indirectly) | 4,820 | |||
| Commission recapture | (1 | ) | ||
| Custodian fee offset | — | |||
| Total fees paid indirectly | (1 | ) | ||
| Total expenses, net | 4,819 | |||
| Net Investment Income | 17,414 | |||
| Net Realized Gain on Investments and Foreign Currency Transactions: | ||||
| Net realized gain on investments | 84,699 | |||
| Net realized gain on foreign currency contracts | 35 | |||
| Net realized loss on other foreign currency transactions | (59 | ) | ||
| Net Realized Gain on Investments and Foreign Currency Transactions | 84,675 | |||
| Net Changes in Unrealized Appreciation of Investments and Foreign Currency Transactions: | ||||
| Net unrealized appreciation of investments | 161,351 | |||
| Net unrealized depreciation of foreign currency contracts | — | |||
| Net unrealized appreciation on translation of other assets and liabilities in foreign currencies | 6 | |||
| Net Changes in Unrealized Appreciation of Investments and Foreign Currency Transactions | 161,357 | |||
| Net Gain on Investments and Foreign Currency Transactions | 246,032 | |||
| Net Increase in Net Assets Resulting from Operations | $ | 263,446 |
The accompanying notes are an integral part of these financial statements.
| 10 |
| Hartford Stock HLS Fund |
| Statement of Changes in Net Assets |
| (000’s Omitted) |
| For the Six-Month Period Ended June 30, 2013 (Unaudited) | For the Year Ended December 31, 2012 | |||||||
| Operations: | ||||||||
| Net investment income | $ | 17,414 | $ | 33,887 | ||||
| Net realized gain on investments and foreign currency transactions | 84,675 | 236,957 | ||||||
| Net unrealized appreciation (depreciation) of investments and foreign currency transactions | 161,357 | (18,825 | ) | |||||
| Net Increase in Net Assets Resulting from Operations | 263,446 | 252,019 | ||||||
| Distributions to Shareholders: | ||||||||
| From net investment income | ||||||||
| Class IA | — | (32,577 | ) | |||||
| Class IB | — | (3,720 | ) | |||||
| Total distributions | — | (36,297 | ) | |||||
| Capital Share Transactions: | ||||||||
| Class IA | ||||||||
| Sold | 17,395 | 24,409 | ||||||
| Issued on reinvestment of distributions | — | 32,577 | ||||||
| Redeemed | (176,809 | ) | (328,593 | ) | ||||
| Total capital share transactions | (159,414 | ) | �� | (271,607 | ) | |||
| Class IB | ||||||||
| Sold | 6,665 | 8,307 | ||||||
| Issued on reinvestment of distributions | — | 3,720 | ||||||
| Redeemed | (34,385 | ) | (70,038 | ) | ||||
| Total capital share transactions | (27,720 | ) | (58,011 | ) | ||||
| Net decrease from capital share transactions | (187,134 | ) | (329,618 | ) | ||||
| Net Increase (Decrease) in Net Assets | 76,312 | (113,896 | ) | |||||
| Net Assets: | ||||||||
| Beginning of period | 1,732,269 | 1,846,165 | ||||||
| End of period | $ | 1,808,581 | $ | 1,732,269 | ||||
| Undistributed (distribution in excess of) net investment income | $ | 17,618 | $ | 204 | ||||
| Shares: | ||||||||
| Class IA | ||||||||
| Sold | 347 | 554 | ||||||
| Issued on reinvestment of distributions | — | 728 | ||||||
| Redeemed | (3,577 | ) | (7,451 | ) | ||||
| Total share activity | (3,230 | ) | (6,169 | ) | ||||
| Class IB | ||||||||
| Sold | 134 | 190 | ||||||
| Issued on reinvestment of distributions | — | 83 | ||||||
| Redeemed | (693 | ) | (1,592 | ) | ||||
| Total share activity | (559 | ) | (1,319 | ) | ||||
The accompanying notes are an integral part of these financial statements.
| 11 |
| Hartford Stock HLS Fund |
| Notes to Financial Statements |
| June 30, 2013 (Unaudited) |
| (000’s Omitted) |
| 1. | Organization: |
Hartford Stock HLS Fund (the “Fund”) serves as an underlying investment option for certain variable annuity and variable life insurance separate accounts of Hartford Life Insurance Company (“HLIC”) and its affiliates and certain qualified retirement plans. The Fund may also serve as an underlying investment option for certain variable annuity and variable life separate accounts of other insurance companies. Owners of variable annuity contracts and policyholders of variable life insurance contracts may choose the funds permitted in the variable insurance contract prospectus. In addition, participants in certain qualified retirement plans may choose the Fund if permitted by their plans.
Hartford Series Fund, Inc. (the “Company”) is an open-end registered management investment company comprised of thirty portfolios. Financial statements for the Fund, a series of the Company, are included in this report.
The Company is organized under the laws of the State of Maryland and is registered with the Securities and Exchange Commission (“SEC”) under the Investment Company Act of 1940, as amended (“1940 Act”). The Fund is a diversified open-end management investment company.
The Fund is divided into Class IA and Class IB shares. Each class is offered at the per share net asset value (“NAV”) without a sales charge and is subject to the same expenses, except that the Class IB shares are subject to distribution and service fees charged pursuant to a Distribution Plan adopted in accordance with Rule 12b-1 under the 1940 Act.
| 2. | Significant Accounting Policies: |
The following is a summary of significant accounting policies of the Fund in the preparation of its financial statements, which are in accordance with the United States Generally Accepted Accounting Principles (“U.S. GAAP”). The preparation of financial statements in accordance with U.S. GAAP may require management to make estimates and assumptions that affect the reported amounts of assets and liabilities and disclosure of contingent assets and liabilities at the date of the financial statements and the reported amounts of increases and decreases in net assets from operations during the reporting period. Actual results could differ from those estimates.
| a) | Determination of Net Asset Value – The NAV of each class of the Fund’s shares is determined as of the close of regular trading (normally 4:00 p.m. Eastern Time) (the “NYSE Close”) on each day that the New York Stock Exchange (the “Exchange”) is open (“Valuation Date”). Information that becomes known to the Fund after the NAV has been calculated on a particular day will not generally be used to retroactively adjust the NAV determined earlier that day. |
| b) | Investment Valuation and Fair Value Measurements – For purposes of calculating the NAV, portfolio investments and other assets held by the Fund's portfolio for which market quotes are readily available are valued at market value. Market value is generally determined on the basis of last reported sales prices or official close price. If no sales are reported, market value is based on quotes obtained from a quotation reporting system, established market makers, or independent pricing services. If market prices are not readily available or are deemed unreliable, the Fund will use the fair value of the investment as determined in good faith under policies and procedures established by and under the supervision of the Company’s Board of Directors. Market quotes are considered not readily available where there is an absence of current or reliable market-based data (e.g., trade information or indicative market quotes), including where events occur after the close of the relevant market, but prior to the NYSE Close that materially affect the values of the Fund’s portfolio investments or assets. In addition, market quotes are considered not readily available when, due to extraordinary circumstances, the exchanges or markets on which the investments trade do not open for trading for the entire day and no other market prices are available. In addition, prices of foreign equities that are principally traded on certain foreign markets may be adjusted daily pursuant to a fair value pricing service approved by the Board of Directors in order to reflect an adjustment for the factors occurring after the close of certain foreign markets but before the NYSE Close. Investments that are primarily traded on foreign markets may trade on days that are not business days of the Fund. The value of the foreign investments in which the Fund invests may change on days when a shareholder will not be able to purchase or redeem shares of the Fund. Fair value pricing is subjective in nature and the use of fair value pricing by the |
| 12 |
Fund may cause the NAV of its shares to differ significantly from the NAV that would have been calculated using market prices at the close of the exchange on which a portfolio investment is primarily traded. There can be no assurance that the Fund could obtain the fair market value assigned to an investment if the Fund were to sell the investment at approximately the time at which the Fund determines its NAV.
Investments valued in currencies other than U.S. dollars are converted to U.S. dollars using exchange rates obtained from independent pricing services for calculation of the NAV. As a result, the NAV of the Fund’s shares may be affected by changes in the value of currencies in relation to the U.S. dollar. The value of investments traded in markets outside the United States or denominated in currencies other than the U.S. dollar may be affected significantly on a day that the NYSE is closed and the market value may change on days when an investor is not able to purchase, redeem or exchange shares of the Fund.
Foreign currency contracts represent agreements to exchange currencies on specific future dates at predetermined rates. Foreign currency contracts are valued using foreign currency exchange rates and forward rates as provided by an independent pricing service on the Valuation Date.
Financial instruments for which prices are not available from an independent pricing service may be valued using market quotations obtained from one or more dealers that make markets in the respective financial instrument in accordance with procedures established by the Company’s Board of Directors.
U.S. GAAP defines fair value as the price that the Fund would receive to sell an asset or pay to transfer a liability in an orderly transaction between market participants. The U.S. GAAP fair value measurement standards require disclosure of a fair value hierarchy for each major category of assets and liabilities. Various inputs are used in determining the fair value of the Fund’s investments. These inputs are summarized into three broad hierarchy levels. This hierarchy is based on whether the valuation inputs are observable or unobservable. These levels are:
| · | Level 1 – Quoted prices in active markets for identical investments. Level 1 may include exchange traded instruments, such as domestic equities, some foreign equities, options, futures, mutual funds, exchange traded funds, rights and warrants. |
| · | Level 2 – Observable inputs other than Level 1 prices, such as quoted prices for similar investments; quoted prices in markets that are not active; or other inputs that are observable or can be corroborated by observable market data. Level 2 may include debt investments that are traded less frequently than exchange traded instruments and which are valued using independent pricing services; foreign equities, which are principally traded on certain foreign markets and are adjusted daily pursuant to a fair value pricing service in order to reflect an adjustment for the factors occurring after the close of certain foreign markets but before the NYSE Close; and short-term investments, which are valued at amortized cost. |
| · | Level 3 – Significant unobservable inputs that are supported by limited or no market activity. Level 3 may include financial instruments whose values are determined using indicative market quotes or require significant management judgment or estimation. These unobservable valuation inputs may include estimates for current yields, maturity/duration, prepayment speed, and indicative market quotes for comparable investments along with other assumptions relating to credit quality, collateral value, complexity of the investment structure, general market conditions and liquidity. This category may include investments where trading has been halted or there are certain restrictions on trading. While these investments are priced using unobservable inputs, the valuation of these investments reflects the best available data and management believes the prices are a reasonable representation of exit price. |
The Board of Directors of the Company generally reviews and approves the “Procedures for Valuation of Portfolio Securities” on an annual basis. These procedures define how investments are to be valued, including the formation and activities of a Valuation Committee. The Valuation Committee is responsible for determining in good faith the fair value of investments when the value cannot be obtained from primary pricing services or alternative sources or if the valuation of an investment as provided by the primary pricing service or alternative
| 13 |
| Hartford Stock HLS Fund |
| Notes to Financial Statements – (continued) |
| June 30, 2013 (Unaudited) |
| (000’s Omitted) |
source is believed not to reflect the investment’s fair value as of the Valuation Date. Members of the Valuation Committee include the Fund’s Treasurer or designee, a Vice President of the Fund with legal expertise or designee, and a Vice President of the investment manager or designee. In addition, the Fund’s Chief Compliance Officer shall designate a member of the compliance group to attend Valuation Committee meetings as a non-voting resource, to monitor for and provide guidance with respect to compliance with these procedures. Two members of the Valuation Committee or their designees, representing different departments, shall constitute a quorum for purposes of permitting the Valuation Committee to take action. The Valuation Committee will consider all relevant factors in determining an investment’s fair value, and may seek the advice of the Fund’s sub-adviser, knowledgeable brokers, and legal counsel in making such determination. The Valuation Committee reports to the Audit Committee of the Company’s Board of Directors. The Audit Committee receives quarterly written reports which include details of all fair-valued investments, including the reason for the fair valuation, and an indication, when possible, of the accuracy of the valuation by disclosing the next available reliable public price quotation or the disposition price of such investments (the “look-back” test). The Board of Directors then must consider for ratification all of the fair value determinations made during the previous quarter.
Valuation levels are not necessarily indicative of the risk associated with investing in such investments. Individual investments within any of the above mentioned asset classes may be assigned a different hierarchical level than those presented above, as individual circumstances dictate.
For additional information, refer to the Investment Valuation Hierarchy Level Summary and the Level 3 roll-forward reconciliation, if applicable, which follow the Schedule of Investments.
For purposes of reporting transfers between different hierarchy levels, both transfers in and out of each level, as applicable, are shown as if they occurred at the beginning of the period.
| c) | Investment Transactions and Investment Income – Investment transactions are recorded as of the trade date (the date the order to buy or sell is executed) for financial reporting purposes. Investments purchased or sold on a when-issued or delayed-delivery basis may be settled a month or more after the trade date. Realized gains and losses are determined on the basis of identified cost. |
Dividend income from domestic securities is accrued on the ex-dividend date. In general, dividend income from foreign securities is recorded on the ex-date; however, dividend notifications in certain foreign jurisdictions may not be available in a timely manner and as a result, the Fund will record the dividend as soon as the relevant details (i.e., rate per share, payment date, shareholders of record, etc.) are publicly available. Interest income, including amortization of premium and accretion of discounts, is accrued on a daily basis.
| d) | Foreign Currency Transactions – Assets and liabilities denominated in currencies other than U.S. dollars are translated into U.S. dollars at the exchange rates in effect on the valuation date. Purchases and sales of investments, income, and expenses are translated into U.S. dollars at the exchange rates on the dates of such transactions. |
The Fund does not isolate that portion of portfolio investment valuation resulting from fluctuations in the foreign currency exchange rates from the fluctuations arising from changes in the market prices of investments held. Exchange rate fluctuations are included with the net realized and unrealized gain or loss on investments in the accompanying financial statements.
Net realized foreign exchange gains or losses arise from sales of foreign currencies and the difference between asset and liability amounts initially stated in foreign currencies and the U.S. dollar value of the amounts actually received or paid. Net unrealized foreign exchange gains or losses arise from changes in the value of other assets and liabilities at the end of the reporting period, resulting from changes in the exchange rates.
| 14 |
| e) | Joint Trading Account – The Fund may invest cash balances into a joint trading account that may be invested in one or more repurchase agreements. |
| f) | Fund Share Valuation and Dividend Distributions to Shareholders – Orders for the Fund’s shares are executed in accordance with the investment instructions of the contract holders and plan participants. The NAV of the Fund’s shares is determined as of the close of business on each business day of the Exchange. The NAV is determined separately for each class of shares of the Fund by dividing the Fund’s net assets attributable to that class by the number of shares of the class outstanding. Each class of shares offered by the Fund has equal rights as to assets and voting privileges (except that shareholders of a class have exclusive voting rights regarding any matter relating solely to that class of shares). Income and non-class specific expenses are allocated daily to each class on the basis of the relative net assets of the class. Realized and unrealized capital gains and losses are allocated daily based on the relative net assets of each class of shares of the Fund. |
Orders for the purchase of the Fund’s shares received prior to the close of the Exchange on any day the Exchange is open for business are priced at the NAV determined as of the close of the Exchange. Orders received after the close of the Exchange, or on a day on which the Exchange and/or the Fund is not open for business, are priced at the next determined NAV.
Dividends are declared pursuant to a policy adopted by the Company’s Board of Directors based upon the investment performance of the Fund. The policy of the Fund is to pay dividends from net investment income and realized capital gains, if any, at least once a year.
Distributions from net investment income, net realized capital gains and capital are determined in accordance with federal income tax regulations, which may differ from U.S. GAAP with respect to character and timing. These differences may include but are not limited to losses deferred due to wash sale adjustments, foreign currency gains and losses, adjustments related to Passive Foreign Investment Companies (“PFICs”), Real Estate Investment Trusts (“REITs”), Regulated Investment Companies (“RICs”), certain derivatives and partnerships. Permanent book and federal income tax basis differences relating to shareholder distributions will result in reclassifications to certain of the Fund’s capital accounts (see Federal Income Taxes: Reclassification of Capital Accounts note).
| 3. | Securities and Other Investments: |
| a) | Repurchase Agreements – A repurchase agreement is an agreement by which a counterparty agrees to sell an investment and agrees to repurchase the investment sold from the buyer at a mutually agreed upon time and price. During the period of the repurchase agreement, the counterparty will deposit cash and or securities in a third party custodial account to serve as collateral. At the time the Fund enters into a repurchase agreement, the value of the underlying collateral, including accrued interest, will be equal to or exceed the value of the repurchase agreement. Repurchase agreements expose the Fund to counterparty risk - that is, the risk that the counterparty will not fulfill its obligations. To minimize counterparty risk, the investments that serve to collateralize the repurchase agreement are held by the Fund’s custodian in book entry or physical form in the custodial account of the Fund or in a third party custodial account. Repurchase agreements are valued at cost plus accrued interest, which approximates fair value. Repurchase agreements have master netting agreements which allow the Fund to offset amounts owed to a counterparty with amounts owed by the counterparty, including any collateral. The Fund, as shown on the Schedule of Investments, had outstanding repurchase agreements as of June 30, 2013. |
| b) | Illiquid and Restricted Investments – The Fund is permitted to invest up to 15% of its net assets in illiquid investments. Illiquid investments are those that may not be sold or disposed of in the ordinary course of business within seven days, at approximately the price used to determine the Fund’s NAV. The Fund may not be able to sell illiquid investments when its sub-adviser considers it desirable to do so or may have to sell such investments at a price that is lower than the price that could be obtained if the investments were more liquid. A sale of illiquid investments may require more time and may result in higher dealer discounts and other selling expenses than does the sale of those that are liquid. Illiquid |
| 15 |
| Hartford Stock HLS Fund |
| Notes to Financial Statements – (continued) |
| June 30, 2013 (Unaudited) |
| (000’s Omitted) |
investments also may be more difficult to value due to the unavailability of reliable market quotations for such investments, and an investment in them may have an adverse impact on the Fund’s NAV. The Fund may also purchase certain restricted investments that can only be resold to certain qualified investors and may be determined to be liquid pursuant to policies and guidelines established by the Company’s Board of Directors. The Fund, as shown on the Schedule of Investments, had illiquid and/or restricted investments as of June 30, 2013.
| 4. | Financial Derivative Instruments: |
The following disclosures contain information on how and why the Fund uses derivative instruments, the credit-risk-related contingent features in certain derivative instruments, and how derivative instruments affect the Fund’s financial position and results of operations. The location and fair value amounts of these instruments on the Statement of Assets and Liabilities and the realized gains and losses and changes in unrealized gains and losses on the Statement of Operations, each categorized by type of derivative contract, are included in the following Additional Derivative Instrument Information footnote. The derivative instruments outstanding as of period-end are disclosed in the notes to or within the Schedule of Investments for purchased options, if applicable. The amounts of realized gains and losses and changes in unrealized gains and losses on derivative instruments during the period are disclosed in the Statement of Operations.
| a) | Foreign Currency Contracts – The Fund may enter into foreign currency contracts that obligate the Fund to purchase or sell currencies at specified future dates. Foreign currency contracts are used to hedge the currency exposure associated with some or all of the Fund’s investments and/or as part of an investment strategy. Foreign currency contracts are marked to market daily and the change in value is recorded by the Fund as an unrealized gain or loss. The Fund will record a realized gain or loss when the foreign currency contract is settled. |
Foreign currency contracts involve elements of market risk in excess of the amounts reflected in the Statement of Assets and Liabilities. In addition, risks may arise upon entering into these contracts from the potential inability of the counterparties to meet the terms of the contracts and from unanticipated movements in the value of the foreign currencies relative to the U.S. dollar. The Fund had outstanding foreign currency contracts as shown on the Schedule of Investments as of June 30, 2013.
| b) | Additional Derivative Instrument Information: |
Fair Value of Derivative Instruments on the Statement of Assets and Liabilities as of June 30, 2013:
| Risk Exposure Category | ||||||||||||||||||||||||||||
| Interest Rate Contracts | Foreign Exchange Contracts | Credit Contracts | Equity Contracts | Commodity Contracts | Other Contracts | Total | ||||||||||||||||||||||
| Liabilities: | ||||||||||||||||||||||||||||
| Unrealized depreciation on foreign currency contracts | $ | — | $ | — | $ | — | $ | — | $ | — | $ | — | $ | — | ||||||||||||||
| Total | $ | — | $ | — | $ | — | $ | — | $ | — | $ | — | $ | — | ||||||||||||||
The volume of derivative activity was minimal during the six-month period ended June 30, 2013.
| 16 |
The Effect of Derivative Instruments on the Statement of Operations for the six-month period ended June 30, 2013:
| Risk Exposure Category | ||||||||||||||||||||||||||||
| Interest Rate Contracts | Foreign Exchange Contracts | Credit Contracts | Equity Contracts | Commodity Contracts | Other Contracts | Total | ||||||||||||||||||||||
| Realized Gain on Derivatives Recognized as a Result of Operations: | ||||||||||||||||||||||||||||
Net realized gain on foreign currency contracts | $ | — | $ | 35 | $ | — | $ | — | $ | — | $ | — | $ | 35 | ||||||||||||||
| Total | $ | — | $ | 35 | $ | — | $ | — | $ | — | $ | — | $ | 35 | ||||||||||||||
| Net Change in Unrealized Appreciation (Depreciation) on Derivatives Recognized as a Result of Operations: | ||||||||||||||||||||||||||||
| Net change in unrealized appreciation of foreign currency contracts | $ | — | $ | — | $ | — | $ | — | $ | — | $ | — | $ | — | ||||||||||||||
| Total | $ | — | $ | — | $ | — | $ | — | $ | — | $ | — | $ | — | ||||||||||||||
| c) | Balance Sheet Offsetting Information: |
Set forth below are tables which disclose both gross information and net information about instruments and transactions eligible for offset in the financial statements, and instruments and transactions that are subject to a master netting agreement, as well as amounts related to margin, reflected as financial collateral (including cash collateral), held at clearing brokers, counterparties, and the Fund’s custodian. The master netting agreements allow the clearing brokers to net any collateral held in or on behalf of the Fund, or liabilities or payment obligations of the clearing brokers to the Fund, against any liabilities or payment obligations of the Fund to the clearing brokers. The Fund is required to deposit financial collateral (including cash collateral) at the Fund’s custodian on behalf of clearing brokers and counterparties to continually meet the original and maintenance requirements established by the clearing brokers and counterparties. Such requirements are specific to the respective clearing broker or counterparty.
Offsetting of Financial Assets and Derivative Assets as of June 30, 2013:
| Description | Gross Amounts of Recognized Assets | Gross Amounts Offset in Statement of Assets and Liabilities | Net Amounts of Assets Presented in Statement of Assets and Liabilities | Financial Instruments with Allowable Netting | Collateral Received | Net Amount (not less than 0) | ||||||||||||||||||
| Repurchase Agreements | $ | 51,382 | $ | — | $ | 51,382 | $ | — | $ | (52,249 | ) | $ | — | |||||||||||
| Total subject to a master netting or similar arrangement | $ | 51,382 | $ | — | $ | 51,382 | $ | — | $ | (52,249 | ) | $ | — | |||||||||||
Offsetting of Financial Liabilities and Derivative Liabilities as of June 30, 2013:
| Description | Gross Amounts of Recognized Liabilities | Gross Amounts Offset in Statement of Assets and Liabilities | Net Amounts of Assets Presented in Statement of Assets and Liabilities | Financial Instruments with Allowable Netting | Collateral Pledged | Net Amount (not less than 0) | ||||||||||||||||||
| Unrealized depreciation on foreign currency contracts | $ | — | $ | — | $ | — | $ | — | $ | — | $ | — | ||||||||||||
| Total subject to a master netting or similar arrangement | $ | — | $ | — | $ | — | $ | — | $ | — | $ | — | ||||||||||||
| 5. | Principal Risks: |
| a) | Counterparty Risk – The Fund may be exposed to counterparty risk, or the risk that an institution or other entity with which the Fund has unsettled or open transactions will default. |
| 17 |
| Hartford Stock HLS Fund |
| Notes to Financial Statements – (continued) |
| June 30, 2013 (Unaudited) |
| (000’s Omitted) |
| b) | Market Risks – If the Fund invests directly in foreign currencies or in securities that trade in, and receive revenues in, foreign currencies, or in derivatives that provide exposure to foreign currencies, it will be subject to the risk that those currencies will decline in value relative to the base currency of the Fund, or, in the case of hedging positions, that the Fund’s base currency will decline in value relative to the currency being hedged. Currency rates in foreign countries may fluctuate significantly over short periods of time for a number of reasons, including changes in interest rates, intervention (or the failure to intervene) by U.S. or foreign governments, central banks or supranational entities, such as the International Monetary Fund, or by the imposition of currency controls or other political developments in the United States or abroad. As a result, the Fund’s investments in foreign currency denominated securities may reduce the returns of the Fund. The market values of equity securities, such as common stocks and preferred stocks, or equity related investments, such as futures and options, may decline due to general market conditions which are not specifically related to a particular company, such as real or perceived adverse economic conditions, changes in the general outlook for corporate earnings, changes in interest or currency rates or adverse investor sentiment generally. The market value of equity securities may also decline due to factors which affect a particular industry or industries, such as labor shortages or increased production costs and competitive conditions within an industry. Equity securities and equity related investments generally have greater market price volatility than fixed income securities. |
| 6. | Federal Income Taxes: |
| a) | Federal Income Taxes – For federal income tax purposes, the Fund intends to continue to qualify as a RIC under Subchapter M of the Internal Revenue Code (“IRC”) by distributing substantially all of its taxable net investment income and net realized capital gains to its shareholders and otherwise complying with the requirements of the IRC. The Fund has distributed substantially all of its income and capital gains in prior years, if applicable, and intends to distribute substantially all of its income and capital gains prior to the next fiscal year-end. Accordingly, no provision for federal income or excise taxes has been made in the accompanying financial statements. Distributions from short-term capital gains are treated as ordinary income distributions for federal income tax purposes. |
| b) | Net Investment Income (Loss), Net Realized Gains (Losses), and Distributions – Net investment income (loss) and net realized gains (losses) may differ for financial statement and tax purposes primarily because of losses deferred due to wash sale adjustments, foreign currency gains and losses, adjustments related to PFICs, REITs, RICs, certain derivatives and partnerships. The character of distributions made during the year from net investment income or net realized gains may differ from their ultimate characterization for federal income tax purposes. Also, due to the timing of dividend distributions, the fiscal year in which amounts are distributed may differ from the year that the income or realized gains (losses) were recorded by the Fund. |
| c) | Distributions and Components of Distributable Earnings – The tax character of distributions paid by the Fund for the periods indicated is as follows (as adjusted for dividends payable, if applicable): |
| For the Year Ended December 31, 2012 | For the Year Ended December 31, 2011 | |||||||
| Ordinary Income | $ | 36,297 | $ | 25,942 | ||||
| 18 |
As of December 31, 2012, the Fund’s components of distributable earnings (deficit) on a tax basis were as follows:
| Amount | ||||
| Undistributed Ordinary Income | $ | 204 | ||
| Accumulated Capital and Other Losses* | (718,694 | ) | ||
| Unrealized Appreciation† | 105,401 | |||
| Total Accumulated Deficit | $ | (613,089 | ) | |
| * | The Fund has capital loss carryforwards that are identified in the Capital Loss Carryforward note that follows. |
| † | Differences between book-basis and tax-basis unrealized appreciation (depreciation) may be attributable to the losses deferred due to wash sale adjustments, foreign currency gains and losses, adjustments related to PFICs, REITs, RICs, certain derivatives and partnerships. |
| d) | Reclassification of Capital Accounts – The Fund may record reclassifications in its capital accounts. These reclassifications have no impact on the total net assets of the Fund. The reclassifications are a result of permanent differences between U.S. GAAP and tax accounting for such items as foreign currency, PFICs, expiration or utilization of capital loss carryforwards or net operating losses. Adjustments are made to reflect the impact these items have on current and future distributions to shareholders. Therefore, the source of the Fund’s distributions may be shown in the accompanying Statement of Changes in Net Assets as from undistributed net investment income, from accumulated net realized gains on investments or from capital depending on the type of book and tax differences that exist. For the year ended December 31, 2012, the Fund recorded reclassifications to increase (decrease) the accounts listed below: |
| Amount | ||||
| Undistributed Net Investment Income | $ | 78 | ||
| Accumulated Net Realized Gain (Loss) | (78 | ) | ||
| e) | Capital Loss Carryforward – On December 22, 2010, the Regulated Investment Company Modernization Act of 2010 (the “Act”) was enacted, which made changes to the capital loss carryforward rules. The changes are effective for taxable years beginning after the date of enactment. Under the Act, funds are permitted to carry forward capital losses for an unlimited period. However, any losses incurred during those future taxable years will be required to be utilized prior to the losses incurred in pre-enactment taxable years, which carry an expiration date. As a result of this ordering rule, pre-enactment capital loss carryforwards may be more likely to expire unused. Additionally, post-enactment capital loss carryforwards retain their character as either short-term or long-term capital losses rather than being considered all short-term as permitted under prior regulation. |
At December 31, 2012 (tax-year-end), the Fund had capital loss carryforwards for U.S. federal income tax purposes as follows:
| Year of Expiration | Amount | |||
| 2017 | $ | 718,694 | ||
| Total | $ | 718,694 | ||
During the year ended December 31, 2012, the Fund utilized $225,623 of prior year capital loss carryforwards.
| f) | Accounting for Uncertainty in Income Taxes – The Fund has adopted financial reporting rules that require the Fund to analyze all open tax years, as defined by the statute of limitations, for all major jurisdictions. Generally, tax authorities can examine all tax returns filed for the last three years. The Fund does not have an examination in progress. |
The Fund has reviewed all open tax years and major jurisdictions and concluded that these financial reporting rules had no effect on the Fund’s financial position or results of operations. There is no tax liability resulting from unrecognized
| 19 |
| Hartford Stock HLS Fund |
| Notes to Financial Statements – (continued) |
| June 30, 2013 (Unaudited) |
| (000’s Omitted) |
tax benefits relating to uncertain income tax positions taken or expected to be taken on the tax return for the fiscal year ended December 31, 2012. The Fund is also not aware of any tax positions for which it is reasonably possible that the total amounts of unrecognized tax benefits will significantly change in the next twelve months.
| 7. | Expenses: |
| a) | Investment Management Agreement – Hartford Funds Management Company, LLC (“HFMC”), an indirect wholly owned subsidiary of The Hartford Financial Services Group, Inc. (“The Hartford”), serves as investment manager to the Fund pursuant to an Investment Management Agreement with the Company. The investment manager has overall investment supervisory responsibility for the Fund. In addition, the investment manager provides administrative personnel, services, equipment, facilities and office space for proper operation of the Fund. The investment manager has contracted with Wellington Management Company, LLP (“Wellington Management”) under a sub-advisory agreement for the provision of day-to-day investment management services to the Fund in accordance with the Fund’s investment objective and policies. The Fund pays a fee to the investment manager, a portion of which may be used to compensate Wellington Management. |
The schedule below reflects the rates of compensation paid to HFMC for investment management services rendered as of June 30, 2013; the rates are accrued daily and paid monthly.
| Average Daily Net Assets | Annual Fee | |||
| On first $250 million | 0.5250 | % | ||
| On next $250 million | 0.5000 | % | ||
| On next $500 million | 0.4750 | % | ||
| On next $4 billion | 0.4500 | % | ||
| On next $5 billion | 0.4475 | % | ||
| Over $10 billion | 0.4450 | % | ||
| b) | Accounting Services Agreement – Pursuant to the Fund Accounting Agreement between HFMC and the Company, on behalf of the Fund, HFMC provides accounting services to the Fund and receives monthly compensation based on the Fund’s average daily net assets at the rates set forth below. The Fund’s accounting services fees are accrued daily and paid monthly. |
| Average Daily Net Assets | Annual Fee | |||
| All assets | 0.010 | % | ||
| c) | Operating Expenses – Allocable expenses incurred by the Company are allocated to each Fund and allocated to classes within a Fund in proportion to the average daily net assets of the Fund and each class, except where allocation of certain expenses is more fairly made directly to the Fund or to specific classes within a Fund. |
| d) | Fees Paid Indirectly – The Company, on behalf of the Fund, has entered into agreements with State Street Global Markets, LLC and Russell Implementation Services, Inc. to partially recapture non-discounted trade commissions. Such rebates are used to pay a portion of the Fund’s expenses. In addition, the Fund’s custodian banks have agreed to reduce its fees when the Fund maintains cash on deposit in a non-interest-bearing custody account. For the six-month period ended June 30, 2013, these amounts, if any, are included in the Statement of Operations. |
| 20 |
The ratio of expenses to average net assets in the accompanying financial highlights excludes the reduction in expenses related to fees paid indirectly. The annualized expense ratio for the period listed below reflecting the reduction for fees paid indirectly is as follows:
| Annualized Six- Month Period Ended June 30, 2013 | ||||
| Class IA | 0.50 | % | ||
| Class IB | 0.75 | |||
| e) | Distribution Plan for Class IB shares – The Company, on behalf of the Fund, has adopted a Distribution Plan pursuant to Rule 12b-1 of the 1940 Act to compensate the distributor, Hartford Funds Distributors, LLC (“HFD”), (formerly known as Hartford Investment Financial Services, LLC), an indirect wholly owned subsidiary of The Hartford, from assets attributable to the Class IB shares for services rendered and expenses borne in connection with activities primarily intended to result in the sale of the Class IB shares, subject to the review and approval of the Company’s Board of Directors. |
The Distribution Plan provides that the Fund may pay annually up to 0.25% of the average daily net assets of the Fund attributable to its Class IB shares for activities primarily intended to result in the sale of Class IB shares. The Board has the authority to suspend or reduce these payments at any point in time. Under the terms of the Distribution Plan and the principal underwriting agreement, the Fund is authorized to make payments monthly to the distributor that may be used to pay or compensate entities providing distribution and shareholder servicing with respect to the Class IB shares for such entities’ fees or expenses incurred or paid in that regard. These fees are accrued daily and paid monthly.
| f) | Other Related Party Transactions – Certain officers of the Fund are directors and/or officers of the investment manager and/or The Hartford or its subsidiaries. For the six-month period ended June 30, 2013, a portion of the Fund’s Chief Compliance Officer’s salary was paid by all the investment companies in the Hartford fund complex. The portion allocated to the Fund was in the amount of $1. These fees are accrued daily and paid monthly. |
| g) | Payment from Affiliate – In July of 2007, The Hartford entered into a settlement with the Attorneys General of the states of New York, Connecticut and Illinois relating to market timing and the company's individual variable annuity contracts in which certain payments would be made directly to the variable annuity contract holders. The distribution plan provided that unclaimed money from the settlement would be distributed to certain HLS Funds that are investment options through a Hartford individual variable annuity contract. The unclaimed money was distributed to the Fund on September 18, 2009. |
The total return in the accompanying financial highlights includes a payment from an affiliate. Had the payment from the affiliate been excluded, the impact and total return for the period listed below would have been as follows:
| For the Year Ended December 31, 2009 | ||||||||
Class IA | Class IB | |||||||
| Impact from Payment from Affiliate for Attorneys General Settlement | — | % | — | % | ||||
| Total Return Excluding Payment from Affiliate | 41.53 | % | 41.18 | % | ||||
| 21 |
| Hartford Stock HLS Fund |
| Notes to Financial Statements – (continued) |
| June 30, 2013 (Unaudited) |
| (000’s Omitted) |
| 8. | Investment Transactions: |
For the six-month period ended June 30, 2013, the Fund's aggregate purchases and sales of investment securities (excluding short-term investments) were as follows:
| Amount | ||||
| Cost of Purchases Excluding U.S. Government Obligations | $ | 261,597 | ||
| Sales Proceeds Excluding U.S. Government Obligations | 465,096 | |||
| 9. | Line of Credit: |
The Fund is one of several Hartford funds that participate in a $500 million committed revolving line of credit facility. The facility is to be used for temporary or emergency purposes. Under the arrangement, the funds are required to own securities having a market value in excess of 300% of the total bank borrowings. The interest rate on borrowings varies depending on the nature of the loan. The facility also requires a fee to be paid based on the amount of the commitment. This commitment fee is allocated to all of the funds participating in the line of credit based on the average net assets of the funds. During the six-month period ended June 30, 2013, the Fund did not have any borrowings under this facility.
| 10. | Industry Classifications: |
Other than the industry classifications “Other Investment Pools and Funds” and “Exchange Traded Funds,” equity industry classifications used in this report are the Global Industry Classification Standard, which was developed by and is the exclusive property and service mark of MSCI, Inc. and Standard & Poor’s.
| 11. | Indemnifications: |
Under the Company’s organizational documents, the Company shall indemnify its officers and directors to the full extent required or permitted under Maryland General Corporation Law and the federal securities laws. In addition, the Company, on behalf of the Fund, may enter into contracts that contain a variety of indemnifications. The Company’s maximum exposure under these arrangements is unknown. However, as of the date of these financial statements, the Company has not had prior claims or losses pursuant to these contracts and expects the risk of loss to be remote.
| 12. | Pending Legal Proceedings: |
On February 25, 2011, Jennifer L. Kasilag, Louis Mellinger, Judith M. Menendez, Jacqueline M. Robinson, and Linda A. Russell filed a derivative lawsuit against Hartford Investment Financial Services, LLC (“HIFSCO”)(now known as Hartford Funds Distributors, LLC) on behalf of six Hartford retail mutual funds in the United States District Court for the District of New Jersey, alleging that HIFSCO received excessive advisory and distribution fees in violation of its statutory fiduciary duty under Section 36(b) of the 1940 Act when serving as investment manager and principal underwriter, respectively, to the Hartford retail mutual funds. HIFSCO moved to dismiss and, in September 2011, the motion was granted in part and denied in part, with leave to amend the complaint. In November 2011, plaintiffs filed an amended complaint on behalf of certain Hartford retail mutual funds, The Hartford Global Health Fund (now known as The Hartford Healthcare Fund), The Hartford Conservative Allocation Fund, The Hartford Growth Opportunities Fund, The Hartford Inflation Plus Fund, The Hartford Advisers Fund (now known as The Hartford Balanced Fund), and The Hartford Capital Appreciation Fund. Plaintiffs seek to rescind the investment management agreements and distribution plans between HIFSCO and these funds and to recover the total fees charged thereunder or, in the alternative, to recover any improper compensation HIFSCO received, in addition to lost earnings. HIFSCO filed a partial motion to dismiss the amended complaint and, in December 2012, the court dismissed without prejudice the claims regarding distribution fees and denied the motion with respect to the advisory fees claims. HIFSCO disputes the allegations and intends to defend vigorously.
This action concerns the activities of HIFSCO in its capacity as investment manager and principal underwriter to the Hartford retail mutual funds and does not concern HIFSCO’s activities in its capacity as principal underwriter to the HLS funds. For this reason, no accrual for litigation relating to this matter has been recorded in the financial statements of the Fund.
| 22 |
[This page intentionally left blank]
| 23 |
| Hartford Stock HLS Fund |
| Financial Highlights |
| - Selected Per-Share Data (A) - |
| Class | Net Asset Value at Beginning of Period | Net Investment Income (Loss) | Net Realized and Unrealized Gain (Loss) on Investments | Total from Investment Operations | Dividends from Net Investment Income | Distributions from Realized Capital Gains | Distributions from Capital | Total Distributions | Net Asset Value at End of Period | |||||||||||||||||||||||||||
| For the Six-Month Period Ended June 30, 2013 (Unaudited) | ||||||||||||||||||||||||||||||||||||
| IA | $ | 44.73 | $ | 0.51 | $ | 6.53 | $ | 7.04 | $ | – | $ | – | $ | – | $ | – | $ | 51.77 | ||||||||||||||||||
| IB | 44.71 | 0.45 | 6.52 | 6.97 | – | – | – | – | 51.68 | |||||||||||||||||||||||||||
| For the Year Ended December 31, 2012 | ||||||||||||||||||||||||||||||||||||
| IA | 39.95 | 0.91 | 4.83 | 5.74 | (0.96 | ) | – | – | (0.96 | ) | 44.73 | |||||||||||||||||||||||||
| IB | 39.92 | 0.82 | 4.81 | 5.63 | (0.84 | ) | – | – | (0.84 | ) | 44.71 | |||||||||||||||||||||||||
| For the Year Ended December 31, 2011 | ||||||||||||||||||||||||||||||||||||
| IA | 40.98 | 0.62 | (1.07 | ) | (0.45 | ) | (0.58 | ) | – | – | (0.58 | ) | 39.95 | |||||||||||||||||||||||
| IB | 40.94 | 0.51 | (1.06 | ) | (0.55 | ) | (0.47 | ) | – | – | (0.47 | ) | 39.92 | |||||||||||||||||||||||
| For the Year Ended December 31, 2010 | ||||||||||||||||||||||||||||||||||||
| IA | 36.10 | 0.44 | 4.89 | 5.33 | (0.45 | ) | – | – | (0.45 | ) | 40.98 | |||||||||||||||||||||||||
| IB | 36.06 | 0.35 | 4.88 | 5.23 | (0.35 | ) | – | – | (0.35 | ) | 40.94 | |||||||||||||||||||||||||
| For the Year Ended December 31, 2009 | ||||||||||||||||||||||||||||||||||||
| IA | 25.86 | 0.48 | 10.25 | 10.73 | (0.49 | ) | – | – | (0.49 | ) | 36.10 | |||||||||||||||||||||||||
| IB | 25.84 | 0.39 | 10.24 | 10.63 | (0.41 | ) | – | – | (0.41 | ) | 36.06 | |||||||||||||||||||||||||
| For the Year Ended December 31, 2008 | ||||||||||||||||||||||||||||||||||||
| IA | 47.11 | 0.59 | (20.79 | ) | (20.20 | ) | (0.81 | ) | (0.24 | ) | – | (1.05 | ) | 25.86 | ||||||||||||||||||||||
| IB | 47.00 | 0.50 | (20.72 | ) | (20.22 | ) | (0.70 | ) | (0.24 | ) | – | (0.94 | ) | 25.84 | ||||||||||||||||||||||
| (A) | Information presented relates to a share outstanding throughout the indicated period. |
| (B) | The figures do not include sales charges or other fees which may be applied at the variable life insurance, variable annuity or qualified retirement plan product level. Any such additional sales charges or other fees would lower the Fund's performance. |
| (C) | Ratios do not reflect reductions for fees paid indirectly. Please see Fees Paid Indirectly in the Notes to Financial Statements. |
| (D) | Portfolio turnover rate is calculated on the basis of the Fund as a whole without distinguishing between the classes of shares issued. |
| (E) | Not annualized. |
| (F) | Annualized. |
| (G) | Total return without the inclusion of the Payment from (to) Affiliate can be found in Expenses in the accompanying Notes to Financial Statements. |
| 24 |
| - Ratios and Supplemental Data - |
| Total Return(B) | Net Assets at End of Period | Ratio of Expenses to Average Net Assets Before Waivers(C) | Ratio of Expenses to Average Net Assets After Waivers(C) | Ratio of Net Investment Income (Loss) to Average Net Assets | Portfolio Turnover Rate(D) | |||||||||||||||||
| 15.74 | %(E) | $ | 1,606,100 | 0.50 | %(F) | 0.50 | %(F) | 1.95 | %(F) | 15 | % | |||||||||||
| 15.60 | (E) | 202,481 | 0.75 | (F) | 0.75 | (F) | 1.70 | (F) | – | |||||||||||||
| 14.38 | 1,532,116 | 0.51 | 0.51 | 1.86 | 82 | |||||||||||||||||
| 14.10 | 200,153 | 0.76 | 0.76 | 1.61 | – | |||||||||||||||||
| (1.09 | ) | 1,614,788 | 0.50 | 0.50 | 1.37 | 43 | ||||||||||||||||
| (1.34 | ) | 231,377 | 0.75 | 0.75 | 1.11 | – | ||||||||||||||||
| 14.80 | 1,980,502 | 0.50 | 0.50 | 1.09 | 77 | |||||||||||||||||
| 14.51 | 300,279 | 0.75 | 0.75 | 0.84 | – | |||||||||||||||||
| 41.54 | (G) | 2,055,227 | 0.51 | 0.51 | 1.43 | 84 | ||||||||||||||||
| 41.18 | (G) | 328,275 | 0.76 | 0.76 | 1.19 | – | ||||||||||||||||
| (43.13 | ) | 1,810,864 | 0.49 | 0.49 | 1.38 | 89 | ||||||||||||||||
| (43.27 | ) | 287,794 | 0.74 | 0.74 | 1.13 | – | ||||||||||||||||
| 25 |
| Hartford Stock HLS Fund |
| Directors and Officers (Unaudited) |
The Board of Directors of the Company appoints officers who are responsible for the day-to-day operations of the Fund and who execute policies formulated by the Directors. Each director serves until his or her death, resignation, or retirement or until the next annual meeting of shareholders is held or until his or her successor is elected and qualifies.
Directors and officers who are employed by or who have a financial interest in The Hartford are considered “interested” persons of the Fund pursuant to the 1940 Act. Each officer and two of the Company’s directors, as noted in the chart below, are “interested” persons of the Fund. Each director serves as a director for The Hartford Mutual Funds, Inc., The Hartford Mutual Funds II, Inc., Hartford Series Fund, Inc., Hartford HLS Series Fund II, Inc., and as a trustee for The Hartford Alternative Strategies Fund, which, as of June 30, 2013, collectively consist of 90 funds. Correspondence may be sent to directors and officers c/o Hartford Mutual Funds, P.O. Box 2999, Hartford, Connecticut 06104-2999, except that correspondence to Mr. Annoni, Mr. Dressen, Ms. Fagely and Ms. Quade may be sent to 500 Bielenberg Drive, Woodbury, Minnesota 55125 and correspondence to Mr. Davey and Mr. Melcher may be sent to 5 Radnor Corporate Center, Suite 300, 100 Matsonford Road, Radnor, Pennsylvania 19087.
The table below sets forth, for each director and officer, his or her name, year of birth, current position with the Company and date first elected or appointed to Hartford Series Fund, Inc. (“HSF”), and Hartford HLS Series Fund II, Inc. (“HSF2”), principal occupation, and, for directors, other directorships held. The Fund’s statement of additional information contains further information on the directors and is available free of charge by calling 1-800-862-6668 or writing to Hartford HLS Funds, c/o Hartford Life Insurance Company, Hartford Life and Annuity Insurance Company, P.O. Box 14293, Lexington, KY 40512-4293.
Information on the aggregate remuneration paid to the directors of the Company can be found in the Statement of Operations herein. The Fund pays to The Hartford a portion of the Chief Compliance Officer’s compensation, but does not pay salaries or compensation to any of their other officers or directors who are employed by The Hartford.
Non-Interested Directors
Lynn S. Birdsong (1946) Director since 2003, Co-Chairman of the Investment Committee
Mr. Birdsong is a private investor. Mr. Birdsong currently serves as a Director of the Sovereign High Yield Investment Company (April 2010 to current). Mr. Birdsong currently serves as an Independent Director of Nomura Partners Funds, Inc. (formerly, The Japan Fund) (March 2003 to current). From 1979 to 2002, Mr. Birdsong was a managing director of Zurich Scudder Investments, an investment management firm. During his employment with Scudder, Mr. Birdsong was an Interested Director of The Japan Fund. Since 1981, Mr. Birdsong has been a partner in Birdsong Company, an advertising specialty firm.
Robert M. Gavin, Jr. (1940) Director since 2002 (HSF) and 1986 (HSF2), Chairman of the Board since 2004
Dr. Gavin is an educational consultant. Prior to September 1, 2001, he was President of Cranbrook Education Community and prior to July 1996, he was President of Macalester College, St. Paul, Minnesota.
Duane E. Hill (1945) Director since 2001 (HSF) and 2002 (HSF2), Chairman of the Nominating Committee
Mr. Hill is Partner of TSG Ventures L.P., a private equity investment company. Mr. Hill is a former partner of TSG Capital Group, a private equity investment firm that served as sponsor and lead investor in leveraged buyouts of middle market companies.
Sandra S. Jaffee (1941) Director since 2005
Ms. Jaffee is the founder and Chief Executive Officer of a private company, Homeworks Concierge, LLC, which provides residential property management services in Westchester County, New York (January 2012 to present). Ms. Jaffee served as Chairman (2008 to 2009) and Chief Executive Officer of Fortent (formerly Searchspace Group), a leading provider of compliance/regulatory technology to financial institutions from August 2005 to August 2009. Ms. Jaffee currently serves as a member of the Board of Directors of Broadridge Financial Solutions as well as a Trustee of Muhlenberg College.
William P. Johnston (1944) Director since 2005, Chairman of the Compliance Committee
In February 2008, Mr. Johnston was elected to the Board of Directors of HCR-ManorCare, Inc. In August 2007, Mr. Johnston was elected to the Board of Directors of LifeCare Holdings, Inc. In July 2006, Mr. Johnston was elected to the Board of Directors of MultiPlan, Inc. and served as a director (July 2006 to August 2010). In June 2006, Mr. Johnston was appointed as Senior Advisor to The Carlyle Group, a global private equity and alternative asset investment firm. In May 2006, Mr. Johnston was elected to the Supervisory Board of Fresenius Medical Care AG & Co. KGaA, after its acquisition of Renal Care Group, Inc. in March 2006.
| 26 |
Phillip O. Peterson (1944) Director since 2002 (HSF) and 2000 (HSF2), Chairman of the Audit Committee
Mr. Peterson is a mutual fund industry consultant. He was a partner of KPMG LLP (an accounting firm) until July 1999. Mr. Peterson joined William Blair Funds in February 2007 as a member of the Board of Trustees. Mr. Peterson also joined the Board of Trustees of Symetra Variable Mutual Funds Trust as a trustee in February 2012.
Lemma W. Senbet (1946) Director since 2005
Dr. Senbet is the William E. Mayer Chair Professor of Finance and Director, Center for Financial Policy, at the University of Maryland, Robert H. Smith School of Business. He was chair of the Finance Department from 1998 to 2006. Previously he was a chaired professor of finance at the University of Wisconsin-Madison. Also, he was director of the Fortis Funds from March 2000 to July 2002. Dr. Senbet served the finance profession in various capacities, including as director of the American Finance Association and President of the Western Finance Association. In 2006, Dr. Senbet was inducted Fellow of Financial Management Association International for his career-long distinguished scholarship and professional service.
Interested Directors and Officers
James E. Davey (1964) Director since 2012, President and Chief Executive Officer since 2010
Mr. Davey serves as Executive Vice President of Hartford Life Insurance Company (“HLIC”) and The Hartford Financial Services Group, Inc. Additionally, Mr. Davey serves as Chairman of the Board and Manager of Hartford Funds Distributors, LLC (“HFD”) and Hartford Administrative Services Company (“HASCO”). Mr. Davey also serves as Manager, President and Chairman of the Board for Hartford Funds Management Company, LLC (“HFMC”). Mr. Davey joined The Hartford in 2002.
Lowndes A. Smith (1939) Director since 1996 (HSF) and 2002 (HSF2), Co-Chairman of the Investment Committee
Mr. Smith served as Vice Chairman of The Hartford from February 1997 to January 2002, as President and Chief Executive Officer of Hartford Life, Inc. from February 1997 to January 2002, and as President and Chief Operating Officer of The Hartford Life Insurance Companies from January 1989 to January 2002. Mr. Smith serves as a Director of White Mountains Insurance Group, Ltd., One Beacon Insurance and Symetra Financial and as Managing Director of Whittington Gray Associates.
Other Officers
Mark A. Annoni (1964) Vice President, Controller and Treasurer since 2012
Mr. Annoni serves as the Assistant Vice President of HLIC (February 2004 to present). Mr. Annoni joined The Hartford in April 2001 as part of The Hartford’s acquisition of Fortis Financial Group (“Fortis”). Prior to joining The Hartford, Mr. Annoni served as Manager of Mutual Fund Accounting at Fortis (July 1997 to April 2001).
Michael R. Dressen (1963) AML Compliance Officer since 2011
Mr. Dressen currently serves as Assistant Vice President of HLIC. He also serves as Chief Compliance Officer and AML Compliance Officer of HASCO and as AML Officer of HFD. Mr. Dressen joined The Hartford in 2005 from State Farm Insurance Companies where he held various positions related to mutual funds, variable products, and property casualty insurance.
Tamara L. Fagely (1958) Vice President since 2002 (HSF) and 1993 (HSF2)
Currently, Ms. Fagely is President and a Director of HASCO, Chief Administrative Officer and Manager of HFMC and a Vice President of HLIC. Ms. Fagely served as a Vice President of HASCO (1998-2013) and Chief Financial Officer of HASCO (2006-2013). She served as Assistant Vice President of HLIC from December 2001 through March 2005. In addition, Ms. Fagely is Manager and Chief Operating Officer of HFD.
Edward P. Macdonald (1967) Vice President, Secretary and Chief Legal Officer since 2005
Mr. Macdonald serves as Vice President of HLIC and Vice President, Chief Legal Officer and Secretary of HFD and HASCO. Mr. Macdonald also serves as Manager, Vice President, Chief Legal Officer and Secretary of HFMC. Mr. Macdonald joined The Hartford in 2005.
Joseph G. Melcher (1973) Vice President and Chief Compliance Officer since 2013(1)
Mr. Melcher currently serves as Vice President of HFMC and HFD. Mr. Melcher joined The Hartford in 2012 from Touchstone Investments, a member of the Western & Southern Financial Group, where he held the position of Vice President and Chief Compliance Officer from 2010 through 2012 and Assistant Vice President, Compliance from 2005 to 2010.
(1) Mr. Melcher was named Vice President and Chief Compliance Officer of HSF and HSF2 on February 6, 2013. Prior to February 6, 2013, Colleen Pernerewski served as Chief Compliance Officer of HSF and HSF2.
| 27 |
| Hartford Stock HLS Fund |
| Directors and Officers (Unaudited) – (continued) |
Vernon J. Meyer (1964) Vice President since 2006
Mr. Meyer serves as Senior Vice President of HLIC. He also serves as Senior Vice President of HFMC and HFD. Mr. Meyer joined The Hartford in 2004.
Laura S. Quade (1969) Vice President since 2012
Ms. Quade currently serves as Vice President of HASCO and is a Director of Mutual Fund Service Operations. She also serves as Director, Enterprise Operations of HFD and HLIC. Ms. Quade joined The Hartford in 2001 as part of The Hartford’s acquisition of Fortis.
Elizabeth L. Schroeder (1966) Vice President since 2010(2)
Ms. Schroeder currently serves as Assistant Vice President of HLIC. Ms. Schroeder joined HLIC in 1991. She is also an Assistant Vice President of HFMC and HASCO.
(2) Ms. Schroeder served as Vice President of HSF and HSF2 until August 7, 2013.
Martin Swanson (1962) Vice President since 2010
Mr. Swanson is a Vice President of HLIC. Mr. Swanson also serves as Chief Marketing Officer for HFD. Prior to joining HLIC in 1998, Mr. Swanson was a Vice President at PaineWebber, Inc.
HOW TO OBTAIN A COPY OF THE FUND’S PROXY VOTING POLICIES AND VOTING RECORDS (UNAUDITED)
A description of the policies and procedures that the Fund uses to determine how to vote proxies relating to portfolio securities and information about how the Fund voted proxies relating to portfolio securities during the most recent twelve-month period ended June 30 are available (1) without charge, upon request, by calling 800-862-6668 and (2) on the SEC’s website at http://www.sec.gov.
QUARTERLY PORTFOLIO HOLDINGS INFORMATION (UNAUDITED)
The Fund files a complete schedule of portfolio holdings with the SEC for the first and third quarters of each fiscal year on Form N-Q. The Fund’s Forms are available (1) without charge, upon request, by calling 800-862-6668 and (2) on the SEC’s website at http://www.sec.gov. The Form N-Q may be reviewed and copied at the SEC’s Public Reference Room in Washington, DC. Information on the operation of the Public Reference Room may be obtained by calling 1-800-SEC-0330.
| 28 |
| Hartford Stock HLS Fund |
| Expense Example (Unaudited) |
Your Fund's Expenses
As a shareholder of the Fund, you incur two types of costs: (1) transaction costs and (2) ongoing costs including investment management fees, distribution fees, if any, and other fund expenses. This example is intended to help you understand your ongoing costs (in dollars) of investing in the Fund and to compare these costs with the ongoing costs of investing in other mutual funds. The example is based on an investment of $1,000 invested at the beginning of the period and held for the period of December 31, 2012 through June 30, 2013.
Actual Expenses
The first set of columns of the table below provides information about actual account values and actual expenses. You may use the information in this column, together with the amount you invested, to estimate the expenses that you paid over the period. Simply divide your account value by $1,000 (for example, an $8,600 account value divided by $1,000 = 8.6), then multiply the result by the number in the line under the heading entitled “Expenses Paid During Period” to estimate the expenses you paid on your account during this period.
Hypothetical Example for Comparison Purposes
The second set of columns of the table below provides information about hypothetical account values and hypothetical expenses based on the Fund’s actual expense ratio and an assumed rate of return of 5% per year before expenses, which is not the Fund’s actual return. The hypothetical account values and expenses may not be used to estimate the actual ending account balance or expenses you paid for the period. You may use this information to compare the ongoing costs of investing in the Fund and other funds. To do so, compare this 5% hypothetical example with the 5% hypothetical examples that appear in the shareholder reports of the other funds.
Please note that the expenses shown in the table are meant to highlight your ongoing costs only and do not reflect any transactional costs, such as sales charges (loads) and CDSC. Therefore, the second set of columns of the table is useful in comparing ongoing costs only, and will not help you determine the relative total costs of owning different funds. In addition, if these transactional costs were included, your costs would be higher. Expenses are equal to the Fund's annualized expense ratios multiplied by average account value over the period, multiplied by 181/365 (to reflect the one-half year period).
| Actual return | Hypothetical (5% return before expenses) | |||||||||||||||||||||||||||||||||||
| Beginning Account Value December 31, 2012 | Ending Account Value June 30, 2013 | Expenses paid during the period December 31, 2012 through June 30, 2013 | Beginning Account Value December 31, 2012 | Ending Account Value June 30, 2013 | Expenses paid during the period December 31, 2012 through June 30, 2013 | Annualized expense ratio | Days in the current 1/2 year | Days in the full year | ||||||||||||||||||||||||||||
| Class IA | $ | 1,000.00 | $ | 1,157.40 | $ | 2.67 | $ | 1,000.00 | $ | 1,022.32 | $ | 2.51 | 0.50 | % | 181 | 365 | ||||||||||||||||||||
| Class IB | $ | 1,000.00 | $ | 1,156.00 | $ | 4.01 | $ | 1,000.00 | $ | 1,021.08 | $ | 3.76 | 0.75 | % | 181 | 365 | ||||||||||||||||||||
| 29 |
| Hartford Stock HLS Fund |
| Principal Risks (Unaudited) |
The principal risks of investing in the Fund are described below.
Foreign Investment Risk: Foreign investments can be riskier than U.S. investments. Potential risks include currency risk that may result from unfavorable exchange rates, liquidity risk if decreased demand for a security makes it difficult to sell at the desired price, and risks that stem from substantially lower trading volume on foreign markets.
Market, Selection and Strategy Risk: The Fund’s share price may fluctuate due to market risk and/or security selections that may underperform the market or relevant benchmarks. If the sub-adviser’s investment strategy does not perform as expected, the Fund could underperform its peers or lose money. There is no guarantee the Fund will achieve its stated objective.
| 30 |
HARTFORD HLS FUNDS
c/o The Hartford Wealth Management - Global Annuities
P.O. Box 14293
Lexington, KY 40512-4293
HARTFORDFUNDS
hartfordfunds.com
Hartford Series Fund, Inc. is underwritten and distributed by Hartford Funds Distributors, LLC.
Hartford Series Fund, Inc. inception dates range from 1977 to date. Hartford Series Fund, Inc. is not a subsidiary of The Hartford Financial Services Group, Inc. ("The Hartford") but is underwritten, distributed by and advised by subsidiaries of The Hartford. Investments in Hartford Series Fund, Inc. are not guaranteed by The Hartford or any other entity.
You should carefully consider investment objectives, risks, and charges and expenses of Hartford HLS Funds before investing. This and other information can be found in the Fund’s prospectus or summary prospectus, which can be obtained by calling 800-862-6668. Please read them carefully before you invest or send money.
HLSSAR-S13 8-13 113554-1 Printed in U.S.A ©2013 The Hartford, Hartford, CT 06115
HARTFORDFUNDS
| HARTFORD TOTAL RETURN
BOND HLS FUND
2013 Semi Annual Report
|
A MESSAGE FROM THE PRESIDENT
Dear Fellow Shareholders:
I want to take this opportunity to say thank you for investing in the Hartford HLS Funds.
Market Review
During the first half of the year, stocks rose steadily. U.S. equities (as represented by the S&P 500 Index1) posted a strong gain of 10.61% during the first quarter, on their way to an all-time high. During the second quarter, investors persevered through volatility surrounding rumors of the rollback of the U.S. Federal Reserve’s quantitative easing (QE) program later this year, and the S&P 500 Index rose 2.91%. That brought the market’s rise to 13.82% for the first half of 2013. The rumors about QE’s end sent bond yields and mortgage rates upward, but that wasn’t enough to dissuade investors from pushing equities into positive territory.
Because of QE, some have expressed concerns regarding the recent market rally. But a more careful examination of economic data reveals a strong foundation. Consumer balance sheets have improved since the financial crisis, with consumer debt as a percentage of income falling steadily. Housing continued its dogged recovery, fueled by population growth and pent-up demand. In fact, it’s substantive economic improvements that have moved Federal Reserve Chairman Ben Bernanke to consider removing the “training wheels” of QE, which we think should be viewed as a vote of confidence in the U.S. economy going forward.
As the U.S. outlook continues to improve, concerns do remain in the global economy. Emerging markets have lagged due to social unrest and rising inflation. Slowing growth in China is clouding global growth forecasts, but it’s important to remember that China still boasts 7.5% annual GDP growth.
It’s important to stay abreast of domestic and international economic developments while balancing your individual investment goals. Meeting with your financial advisor on a regular basis to examine your current investment strategy can help you determine whether you are on the right track:
| • | Is your portfolio fully diversified with an appropriate mix of stocks and bonds? |
| • | Is your fixed-income portfolio positioned to take advantage of opportunities across the credit spectrum and fulfill your income needs? |
| • | Is your portfolio still in line with your risk tolerance and investment time horizon? |
Your financial professional can help you choose options within our fund family to navigate today’s markets with confidence.
Thank you again for investing with the Hartford HLS Funds.
James Davey
President
Hartford HLS Funds
1 The S&P 500 Index is a market capitalization-weighted price index composed of 500 widely held common stocks.
Hartford Total Return Bond HLS Fund
Table of Contents
This report is prepared for the general information of contract owners and qualified retirement plan participants. It is not an offer of contracts or of qualified retirement plans. It should not be used in connection with any offer, except in conjunction with the appropriate product prospectus which contains all pertinent information including the applicable sales, administrative and other charges.
The views expressed in the Fund’s Manager Discussion under ‘‘Why did the Fund perform this way?’’ and ‘‘What is the outlook?’’ are views of the Fund’s sub-adviser and portfolio management team through the end of the period and are subject to change based on market and other conditions. The Fund’s Manager Discussion is for informational purposes only and does not represent an offer, recommendation or solicitation to buy, hold or sell any security. The specific securities identified and described, if any, do not represent all of the securities purchased or sold and you should not assume that investments in the securities identified and discussed will be profitable.
| Hartford Total Return Bond HLS Fund inception 08/31/1977 |
| (sub-advised by Wellington Management Company, LLP) |
| Investment objective – Seeks a competitive total return, with income as a secondary objective. |
Performance Overview 6/30/03 - 6/30/13
The chart above represents the hypothetical growth of a $10,000 investment in Class IA. Growth results in classes other than Class IA will vary from what is seen above due to differences in the expenses charged to those share classes.
Average Annual Total Returns (as of 6/30/13)
| 6 Month† | 1 Year | 5 Years | 10 Years | |||||||||||||
| Total Return Bond IA | -2.98% | 0.78% | 5.04% | 4.29% | ||||||||||||
| Total Return Bond IB | -3.10% | 0.53% | 4.78% | 4.03% | ||||||||||||
| Barclays U.S. Aggregate Bond Index | -2.44% | -0.68% | 5.19% | 4.52% | ||||||||||||
| † | Not Annualized |
PERFORMANCE DATA QUOTED REPRESENTS PAST PERFORMANCE AND DOES NOT GUARANTEE FUTURE RESULTS. The investment return and principal value of the investment will fluctuate so that investors’ shares, when redeemed, may be worth more or less than their original cost. Current performance may be lower or higher than the performance data quoted. To obtain performance data current to the most recent month-end, please visit our website www.hartfordfunds.com.
Total returns presented above were calculated using the Fund’s net asset value available to shareholders for sale or redemption of Fund shares on June 30, 2013, which may exclude investment transactions as of this date. All share class returns assume the reinvestment of all distributions at net asset value and the deduction of all fund expenses.
Performance information includes performance under the Fund’s previous sub-adviser, Hartford Investment Management Company. As of March 5, 2012, Hartford Investment Management Company no longer serves as the sub-adviser to the Fund.
Barclays U.S. Aggregate Bond Index is an unmanaged index and is composed of securities from the Barclays Government/Credit Bond Index, Mortgage-Backed Securities Index, Asset-Backed Securities Index and Commercial Mortgage-Backed Securities Index.
You cannot invest directly in an index.
As of the Fund’s current prospectus dated May 1, 2013, the total annual operating expense ratios for Class IA and Class IB shares were 0.50% and 0.75%, respectively. Actual expenses may be higher. Please see the accompanying Financial Highlights for expense ratios for the six-month period ended June 30, 2013.
The chart and table do not reflect the deductions of taxes, sales charges or other fees which may be applied at the variable life insurance, variable annuity or qualified retirement plan product level. Any such additional sales charges or other fees or expenses would lower the contract’s or plan’s performance.
All investments are subject to risk including the possible loss of principal. For a discussion of the Fund’s risks, please see the Principal Risks section. For more detailed information on the risks associated with an investment in the Fund, please see the prospectus.
| 2 |
| Hartford Total Return Bond HLS Fund |
| Manager Discussion |
| June 30, 2013 (Unaudited) |
| Portfolio Managers | ||
| Joseph F. Marvan, CFA | Lucius T. Hill, III | Campe Goodman, CFA |
| Senior Vice President and Fixed Income Portfolio Manager | Senior Vice President and Fixed Income Portfolio Manager | Vice President and Fixed Income Portfolio Manager |
How did the Fund perform?
The Class IA shares of the Hartford Total Return Bond HLS Fund returned -2.98% for the six-month period ended June 30, 2013, underperforming the Fund’s benchmark, the Barclays U.S. Aggregate Bond Index, which returned -2.44% for the same period. The Fund also underperformed the -2.55% average return of the Variable Products-Underlying Funds Lipper Intermediate Investment Grade Debt Funds peer group, a group of funds with investment strategies similar to those of the Fund.
Why did the Fund perform this way?
Central bank easing and signs of gradual global economic recovery imparted a positive tone to financial markets early in the year. However, sentiment abruptly changed late in the period after the Federal Reserve (Fed) surprised markets with its earlier-than-expected plan to reduce asset purchases, sending yields sharply higher.
The Federal Open Market Committee began to publically debate the costs of open-ended bond purchases during the first quarter, raising concerns that these will end sooner than anticipated. But it was statements by Fed reserve policymakers on June 18 and 19 that really caught market participants off guard with their unexpectedly agressive tone. Specifically, Fed officials signaled a readiness to begin reducing the central bank’s asset purchases under quantitative easing (QE) by September, and to end purchases by mid-2014 if the economy strengthened sufficiently.
In contrast to the Fed’s aggressive rhetoric, European Central Bank (ECB) officials made it clear they are in no hurry to end the central bank's accommodative stance as the eurozone’s economic recovery continued to be the world’s weakest by a large margin. Meanwhile, stress in Chinese money markets coincided with signs of slowing growth. China's central bank attempted to tighten credit at the same time that global markets were closely watching the Fed's attempts to move toward tighter policy.
U.S. economic data signaled that the economy remains on a moderate growth path, underpinned by the housing and labor markets. The residential real estate recovery continued to pick up steam as home sales rose; house prices saw their greatest annual gain in seven years, according to data from S&P/Case-Shiller. Rising home values and equity-market gains helped boost consumer confidence and prop up consumption. However, manufacturing activity contracted and growth in the services sector slowed.
Worries over an eventual end to record-low borrowing rates in the U.S. fueled a massive, broad-based sell-off across nearly all corners of the global financial markets in June. The Treasury yield curve steepened as the 10-year Treasury yield surged 0.73% to end the period at 2.49%, the highest level since August 2011. Major fixed income sectors, with the exception of high yield, posted negative absolute returns driven by rising rates and underperformed Treasuries on a duration-adjusted basis during the 6-month period.
The primary drivers of the Fund’s underperformance were its high yield credit, emerging market debt (EMD), commercial mortgage backed securities (CMBS) and Non-Dollar exposures. Positive results from an allocation to bank loans and BB-rated high yield issuers were more than offset by the negative impact of high yield credit default swap index positions, which were used as a source of liquidity and to manage overall portfolio risk. The Fund’s positioning in high yield credit detracted from performance overall. Our allocation to EMD detracted from performance particularly in the second quarter when EM spreads widened on concerns over early Fed tapering of its monthly bond purchases and protests in Brazil and Turkey. Our EMD positions were primarily implemented via credit default index swaps. The Fund’s agency MBS pass-throughs positioning, particularly in lower coupons, had a negative impact on performance. Our CMBS exposure, which also detracted from performance, was gained via a combination of bonds and credit default swap indexes. The Fund’s Non-Dollar exposure, via forwards and futures, also hurt relative performance. The Fund’s tactical duration posture detracted from relative results over the period as gains in January from maintaining a short duration posture were more than offset by a long duration posture in June when the Fed signaled an earlier-than-expected end to quantitative easing, driving Treasury yields sharply higher out of their previously narrow range.
The Fund’s non-agency mortgage exposure was a significant positive for performance as strong performance in the non-agency sector carried over into 2013 amid continued improvement in housing and investors’ appetite for higher yielding securities. Our tactical investment grade credit
| 3 |
| Hartford Total Return Bond HLS Fund |
| Manager Discussion – (continued) |
| June 30, 2013 (Unaudited) |
positioning via credit default swaps indexes also contributed to relative results.
What is the outlook?
In the U.S., we maintain a moderately procyclical risk bias. While sector valuations have improved, Fed tapering of its monthly bond purchases rhetoric has introduced volatility and economic uncertainty into the markets. We are concerned about the potential impact of higher rates on the housing sector and on business activity in general. Federal government spending cuts scheduled for later this year will also weigh on economic growth.
We expect the Fed to maintain its low-rate stance, although the central bank has made clear that the timing of any tapering off in policy accommodation will be data dependent. We believe that the 10-year yield is likely to trade in a range over the near term. We plan to tactically trade this range, adding duration when yields reach the top end of the range and reducing duration when rates drift toward the lower end.
As of the end of the period, we continued to favor bank loans, which have experienced strong demand amid the backup in yields given their floating-rate coupon structure. We believe upper-quality-tier high yield also looks attractive, but less so than bank loans. We maintained an allocation to non-agency MBS and overweights to CMBS and investment-grade financials. At the end of the period, we had a tactical overweight to agency MBS, where supply is dwindling and valuations look attractive. Extension risk is increasing with the rise in rates, however, making us somewhat cautious on the sector. We maintained an allocation to EMD based on attractive valuations. Within Non-Dollar, we expect the North American economy to underperform Europe, with U.S. and Canadian rates outperforming U.K. and German rates. We also expect better growth and higher inflation in Japan and had a short Japanese Government bond position at the end of the period.
Diversification by Industry
as of June 30, 2013
| Industry | Percentage of Net Assets | |||
| Fixed Income Securities | ||||
| Accommodation and Food Services | 0.2 | % | ||
| Administrative Waste Management and Remediation | 0.2 | |||
| Air Transportation | 0.3 | |||
| Apparel Manufacturing | 0.1 | |||
| Arts, Entertainment and Recreation | 2.8 | |||
| Beverage and Tobacco Product Manufacturing | 1.0 | |||
| Chemical Manufacturing | 0.5 | |||
| Computer and Electronic Product Manufacturing | 0.4 | |||
| Construction | 0.1 | |||
| Educational Services | 0.0 | |||
| Fabricated Metal Product Manufacturing | 0.2 | |||
| Finance and Insurance | 30.5 | |||
| Food Manufacturing | 0.2 | |||
| Food Services | 0.1 | |||
| Furniture and Related Product Manufacturing | 0.0 | |||
| General Obligations | 0.5 | |||
| Health Care and Social Assistance | 1.8 | |||
| Higher Education (Univ., Dorms, etc.) | 0.1 | |||
| Information | 3.7 | |||
| Machinery Manufacturing | 0.2 | |||
| Mining | 1.0 | |||
| Miscellaneous Manufacturing | 0.6 | |||
| Motor Vehicle and Parts Manufacturing | 0.2 | |||
| Nonmetallic Mineral Product Manufacturing | 0.2 | |||
| Other Services | 0.0 | |||
| Paper Manufacturing | 0.1 | |||
| Petroleum and Coal Products Manufacturing | 2.4 | |||
| Pipeline Transportation | 0.6 | |||
| Plastics and Rubber Products Manufacturing | 0.2 | |||
| Primary Metal Manufacturing | 0.2 | |||
| Professional, Scientific and Technical Services | 0.2 | |||
| Real Estate and Rental and Leasing | 0.8 | |||
| Retail Trade | 2.1 | |||
| Tax Allocation | 0.0 | |||
| Transportation Equipment Manufacturing | 0.2 | |||
| Truck Transportation | 0.3 | |||
| Utilities | 1.3 | |||
| Utilities - Electric | 0.3 | |||
| Utilities - Water and Sewer | 0.2 | |||
| Wholesale Trade | 0.3 | |||
| Total | 54.1 | % | ||
| Equity Securities | ||||
| Diversified Banks | 0.0 | |||
| Other Diversified Financial Services | 0.1 | |||
| Total | 0.1 | % | ||
| Foreign Government Obligations | 0.4 | |||
| Put Options Purchased | 0.0 | |||
| U.S. Government Agencies | 57.0 | |||
| U.S. Government Securities | 14.7 | |||
| Short-Term Investments | 4.3 | |||
| Other Assets and Liabilities | (30.6 | ) | ||
| Total | 100.0 | % | ||
The above table represents investments by industry, rather than industry sub-classifications. Each industry combines multiple sub-classifications into one industry category. Detailed information on sub-classification breakdowns is available in the Schedule of Investments.
| 4 |
Distribution by Credit Quality
as of June 30, 2013
| Credit Rating * | Percentage of Net Assets | |||
| Aaa / AAA | 6.1 | % | ||
| Aa / AA | 3.3 | |||
| A | 7.2 | |||
| Baa / BBB | 18.0 | |||
| Ba / BB | 9.2 | |||
| B | 4.5 | |||
| Caa / CCC or Lower | 5.5 | |||
| Unrated | 0.7 | |||
| U.S. Government Agencies and Securities | 71.7 | |||
| Non-Debt Securities and Other Short-Term Instruments | 4.4 | |||
| Other Assets & Liabilities | (30.6 | ) | ||
| Total | 100.0 | % | ||
| * | Does not apply to the Fund itself. Based upon Moody’s and S&P long-term credit ratings for the Fund’s holdings as of the date noted. If Moody's and S&P assign different ratings to a holding, the lower rating is used. "Unrated" includes fixed-income securities (other than cash-like short-term instruments and U.S. Government securities) for which Moody’s and S&P have not issued long-term credit ratings. |
| 5 |
| Hartford Total Return Bond HLS Fund |
| Schedule of Investments |
| June 30, 2013 (Unaudited) |
| (000’s Omitted) |
| Shares or Principal Amount | Market Value ╪ | |||||||
ASSET & COMMERCIAL MORTGAGE BACKED SECURITIES - 16.4% | ||||||||
| Finance and Insurance - 16.2% | ||||||||
| Captive Auto Finance - 1.7% | ||||||||
| Ally Automotive Receivables Trust | ||||||||
| $ | 5,675 | 3.38%, 09/15/2017 ■ | $ | 5,811 | ||||
| 5,650 | 3.61%, 08/15/2016 ■ | 5,739 | ||||||
| Carnow Automotive Receivables Trust | ||||||||
| 198 | 2.09%, 01/15/2015 ■ | 198 | ||||||
| CPS Automotive Trust | ||||||||
| 2,915 | 1.82%, 12/16/2019 ■ | 2,928 | ||||||
| Credit Acceptance Automotive Loan Trust | ||||||||
| 5,325 | 1.21%, 10/15/2020 ■ | 5,284 | ||||||
| 1,860 | 2.21%, 09/15/2020 ■ | 1,865 | ||||||
| 5,115 | 3.12%, 03/16/2020 ■ | 5,130 | ||||||
| Ford Credit Automotive Owner Trust | ||||||||
| 4,600 | 2.54%, 02/15/2016 | 4,707 | ||||||
| 3,680 | 3.21%, 07/15/2017 | 3,818 | ||||||
| 1,730 | 5.53%, 05/15/2016 ■ | 1,782 | ||||||
| Ford Credit Floorplan Master Owner Trust | ||||||||
| 6,225 | 1.50%, 09/15/2015 | 6,239 | ||||||
| Harley-Davidson Motorcycle Trust | ||||||||
| 4,180 | 2.12%, 08/15/2017 | 4,203 | ||||||
| Hyundai Automotive Receivables Trust | ||||||||
| 6,710 | 2.27%, 02/15/2017 | 6,864 | ||||||
| Prestige Automotive Receivables Trust | ||||||||
| 3,855 | 2.49%, 04/16/2018 ■ | 3,872 | ||||||
| Santander Drive Automotive Receivables Trust | ||||||||
| 5,125 | 3.89%, 07/17/2017 | 5,260 | ||||||
| SNAAC Automotive Receivables Trust | ||||||||
| 1,092 | 1.78%, 06/15/2016 ■ | 1,096 | ||||||
| 64,796 | ||||||||
| Captive Retail Finance - 0.1% | ||||||||
| CNH Equipment Trust | ||||||||
| 3,075 | 2.97%, 05/15/2017 | 3,145 | ||||||
| Real Estate Credit (Mortgage Banking) - 14.4% | ||||||||
| American Home Mortgage Assets | ||||||||
| 2,570 | 1.11%, 10/25/2046 Δ | 1,856 | ||||||
| Asset Backed Funding Certificates | ||||||||
| 4,787 | 0.41%, 01/25/2037 Δ | 2,604 | ||||||
| Banc of America Commercial Mortgage, Inc. | ||||||||
| 6,070 | 5.19%, 09/10/2047 Δ | 6,544 | ||||||
| 11,725 | 5.21%, 11/10/2042 Δ | 12,366 | ||||||
| 2,780 | 5.63%, 07/10/2046 Δ | 3,051 | ||||||
| Banc of America Funding Corp. | ||||||||
| 7,786 | 0.49%, 05/20/2047 Δ | 6,293 | ||||||
| 9,866 | 5.77%, 05/25/2037 | 8,649 | ||||||
| 445 | 5.85%, 01/25/2037 | 361 | ||||||
| BB-UBS Trust | ||||||||
| 11,170 | 3.43%, 11/05/2036 ■ | 10,460 | ||||||
| BCAP LLC Trust | ||||||||
| 1,602 | 0.36%, 01/25/2037 Δ | 1,146 | ||||||
| 4,041 | 0.37%, 03/25/2037 Δ | 3,200 | ||||||
| Bear Stearns Adjustable Rate Mortgage Trust | ||||||||
| 6,626 | 2.32%, 08/25/2035 Δ | 6,521 | ||||||
| 10,098 | 2.47%, 10/25/2035 Δ | 9,607 | ||||||
| Bear Stearns Alt-A Trust | ||||||||
| 882 | 0.57%, 05/25/2036 Δ | 529 | ||||||
| Bear Stearns Commercial Mortgage Securities, Inc. | ||||||||
| 7,015 | 5.15%, 10/12/2042 Δ | 7,564 | ||||||
| 2,010 | 5.47%, 01/12/2045 | 2,253 | ||||||
| 3,600 | 5.54%, 10/12/2041 | 3,997 | ||||||
| Cal Funding II Ltd. | ||||||||
| 1,909 | 3.47%, 10/25/2027 ■ | 1,889 | ||||||
| Citigroup Commercial Mortgage Trust | ||||||||
| 3,480 | 3.09%, 03/10/2023 Δ | 3,268 | ||||||
| Citigroup/Deutsche Bank Commercial Mortgage Trust | ||||||||
| 2,300 | 5.30%, 01/15/2046 Δ | 2,486 | ||||||
| 7,950 | 5.32%, 12/11/2049 | 8,752 | ||||||
| Commercial Mortgage Loan Trust | ||||||||
| 8,640 | 6.01%, 12/10/2049 Δ | 9,777 | ||||||
| Commercial Mortgage Pass-Through Certificates | ||||||||
| 27,615 | 0.67%, 07/10/2046 ■► | 1,970 | ||||||
| 640 | 2.82%, 11/15/2045 | 594 | ||||||
| 650 | 2.85%, 10/15/2045 | 601 | ||||||
| 4,190 | 4.33%, 12/10/2045 ■Δ | 2,937 | ||||||
| 8,135 | 5.75%, 06/10/2046 Δ | 8,942 | ||||||
| Community or Commercial Mortgage Trust | ||||||||
| 2,065 | 2.77%, 12/10/2045 | 1,900 | ||||||
| 860 | 3.10%, 02/10/2023 | 810 | ||||||
| 4,610 | 3.21%, 04/10/2023 | 4,368 | ||||||
| 2,575 | 3.42%, 03/10/2031 ■ | 2,472 | ||||||
| 2,540 | 4.75%, 11/15/2045 ■ | 1,931 | ||||||
| Consumer Portfolio Services, Inc. | ||||||||
| 572 | 5.01%, 06/17/2019 ■ | 597 | ||||||
| Countrywide Alternative Loan Trust | ||||||||
| 3,827 | 0.51%, 11/25/2035 Δ | 2,822 | ||||||
| Countrywide Home Loans, Inc. | ||||||||
| 1,242 | 3.00%, 04/20/2036 Δ | 828 | ||||||
| 7,364 | 3.08%, 09/25/2047 Δ | 5,933 | ||||||
| Credit Suisse Mortgage Capital Certificates | ||||||||
| 6,965 | 5.47%, 09/15/2039 | 7,673 | ||||||
| CS First Boston Mortgage Securities Corp. | ||||||||
| 2,364 | 4.83%, 04/15/2037 | 2,483 | ||||||
| 5,304 | 5.50%, 06/25/2035 | 5,103 | ||||||
| CW Capital Cobalt Ltd. | ||||||||
| 14,611 | 5.22%, 08/15/2048 | 15,834 | ||||||
| DBUBS Mortgage Trust | ||||||||
| 26,632 | 0.87%, 01/01/2021 ■► | 1,126 | ||||||
| Fieldstone Mortgage Investment Corp. | ||||||||
| 3,953 | 0.46%, 05/25/2036 Δ | 2,167 | ||||||
| 3,242 | 0.53%, 04/25/2047 Δ | 1,918 | ||||||
| First Franklin Mortgage Loan Trust | ||||||||
| 14,867 | 0.43%, 04/25/2036 Δ | 8,414 | ||||||
| First Horizon Alternative Mortgage Securities | ||||||||
| 13,358 | 2.33%, 04/25/2036 Δ | 10,269 | ||||||
| 14,540 | 2.36%, 09/25/2035 Δ | 12,060 | ||||||
| Fremont Home Loan Trust | ||||||||
| 1,898 | 0.34%, 10/25/2036 Δ | 847 | ||||||
The accompanying notes are an integral part of these financial statements.
| 6 |
| Shares or Principal Amount | Market Value ╪ | |||||||
ASSET & COMMERCIAL MORTGAGE BACKED SECURITIES - 16.4% - (continued) | ||||||||
| Finance and Insurance - 16.2% - (continued) | ||||||||
| Real Estate Credit (Mortgage Banking) - 14.4% - (continued) | ||||||||
| GE Business Loan Trust | ||||||||
| $ | 5,774 | 1.19%, 05/15/2034 ■Δ | $ | 4,018 | ||||
| GMAC Commercial Mortgage Securities, Inc. | ||||||||
| 905 | 5.24%, 11/10/2045 Δ | 967 | ||||||
| GMAC Mortgage Corp. Loan Trust | ||||||||
| 6,350 | 3.68%, 09/19/2035 Δ | 6,031 | ||||||
| 98 | 3.90%, 04/19/2036 Δ | 81 | ||||||
| Goldman Sachs Mortgage Securities Corp. | ||||||||
| 805 | 3.38%, 05/10/2045 | 793 | ||||||
| Goldman Sachs Mortgage Securities Corp. II | ||||||||
| 3,325 | 2.95%, 11/05/2034 ■ | 3,093 | ||||||
| Goldman Sachs Mortgage Securities Trust | ||||||||
| 3,585 | 2.77%, 11/10/2045 | 3,314 | ||||||
| 3,305 | 2.94%, 02/10/2046 | 3,074 | ||||||
| 8,170 | 3.55%, 04/10/2034 ■ | 8,044 | ||||||
| 3,180 | 4.86%, 11/10/2045 ■Δ | 2,763 | ||||||
| Greenwich Capital Commercial Funding Corp. | ||||||||
| 4,425 | 5.74%, 12/10/2049 | 4,956 | ||||||
| 4,550 | 5.86%, 07/10/2038 Δ | 5,043 | ||||||
| GS Mortgage Securities Trust | ||||||||
| 3,760 | 2.93%, 06/05/2031 ■ | 3,738 | ||||||
| 3,925 | 3.14%, 06/10/2046 | 3,690 | ||||||
| GSAA Home Equity Trust | ||||||||
| 4,260 | 0.24%, 03/25/2047 Δ | 2,373 | ||||||
| 16,484 | 0.27%, 02/25/2037 Δ | 8,137 | ||||||
| 3,262 | 0.28%, 12/25/2036 Δ | 1,646 | ||||||
| 6,703 | 0.29%, 03/25/2037 Δ | 3,284 | ||||||
| 2,618 | 0.35%, 07/25/2036 Δ | 1,243 | ||||||
| 1,634 | 0.42%, 04/25/2047 Δ | 932 | ||||||
| 4,606 | 5.98%, 06/25/2036 | 2,571 | ||||||
| GSAMP Trust | ||||||||
| 17,008 | 0.28%, 01/25/2037 Δ | 9,014 | ||||||
| 2,518 | 0.29%, 12/25/2046 Δ | 1,275 | ||||||
| 1,860 | 0.39%, 11/25/2036 Δ | 998 | ||||||
| GSR Mortgage Loan Trust | ||||||||
| 11,471 | 2.79%, 01/25/2036 Δ | 9,102 | ||||||
| Harborview Mortgage Loan Trust | ||||||||
| 5,910 | 0.38%, 01/19/2038 Δ | 4,758 | ||||||
| 8,711 | 0.41%, 05/19/2047 Δ | 4,178 | ||||||
| 4,710 | 0.52%, 09/19/2035 Δ | 3,467 | ||||||
| Impac Secured Assets Trust | ||||||||
| 2,574 | 0.39%, 11/25/2036 Δ | 1,447 | ||||||
| IndyMac Index Mortgage Loan Trust | ||||||||
| 763 | 0.48%, 01/25/2036 Δ | 463 | ||||||
| 9,894 | 0.59%, 07/25/2046 Δ | 4,038 | ||||||
| 3,090 | 2.47%, 01/25/2036 Δ | 2,773 | ||||||
| 1,883 | 2.52%, 08/25/2035 Δ | 1,395 | ||||||
| 11,923 | 2.66%, 03/25/2036 Δ | 8,151 | ||||||
| 76 | 2.89%, 12/25/2036 Δ | 62 | ||||||
| JP Morgan Chase Commercial Mortgage Securities Corp. | ||||||||
| 2,070 | 2.75%, 10/15/2045 ■ | 1,313 | ||||||
| 575 | 2.83%, 10/15/2045 | 537 | ||||||
| 3,090 | 2.84%, 12/15/2047 | 2,865 | ||||||
| 2,675 | 3.91%, 05/05/2030 ■Δ | 2,674 | ||||||
| 700 | 4.67%, 10/15/2045 ■Δ | 603 | ||||||
| 80 | 4.92%, 10/15/2042 | 85 | ||||||
| 9,995 | 5.20%, 12/15/2044 Δ | 10,786 | ||||||
| 6,876 | 5.29%, 01/12/2043 Δ | 7,429 | ||||||
| 1,890 | 5.31%, 08/15/2046 ■Δ | 1,737 | ||||||
| 4,594 | 5.34%, 08/12/2037 | 4,855 | ||||||
| 3,782 | 5.71%, 02/12/2049 Δ | 4,241 | ||||||
| JP Morgan Mortgage Trust | ||||||||
| 5,349 | 2.80%, 05/25/2036 Δ | 4,676 | ||||||
| 838 | 2.87%, 04/25/2037 Δ | 683 | ||||||
| 3,975 | 3.08%, 09/25/2035 Δ | 3,706 | ||||||
| LB-UBS Commercial Mortgage Trust | ||||||||
| 8,695 | 4.95%, 09/15/2030 | 9,245 | ||||||
| 6,275 | 5.20%, 11/15/2030 Δ | 6,728 | ||||||
| 5,953 | 5.43%, 02/15/2040 | 6,530 | ||||||
| 800 | 5.87%, 06/15/2038 Δ | 888 | ||||||
| 4,200 | 6.15%, 04/15/2041 Δ | 4,888 | ||||||
| Lehman Brothers Small Balance Commercial | ||||||||
| 1,399 | 5.52%, 09/25/2030 ■Δ | 1,359 | ||||||
| Lehman XS Trust | ||||||||
| 3,212 | 0.40%, 07/25/2046 Δ | 2,371 | ||||||
| Luminent Mortgage Trust | ||||||||
| 2,957 | 0.45%, 11/25/2035 Δ | 2,485 | ||||||
| Merrill Lynch Mortgage Investors Trust | ||||||||
| 185 | 2.63%, 12/25/2035 Δ | 167 | ||||||
| 1,782 | 2.82%, 07/25/2035 Δ | 1,469 | ||||||
| 2,259 | 3.00%, 03/25/2036 Δ | 1,532 | ||||||
| Merrill Lynch Mortgage Trust | ||||||||
| 1,255 | 4.75%, 06/12/2043 | 1,321 | ||||||
| 220 | 5.05%, 07/12/2038 | 236 | ||||||
| 5,135 | 5.20%, 09/12/2042 | 5,418 | ||||||
| Morgan Stanley Capital I | ||||||||
| 101,118 | 1.99%, 09/15/2047 ■► | 2,889 | ||||||
| 625 | 3.24%, 03/15/2045 | 607 | ||||||
| 814 | 5.68%, 10/15/2042 Δ | 887 | ||||||
| 11,950 | 5.69%, 04/15/2049 ‡Δ | 13,307 | ||||||
| Morgan Stanley Mortgage Loan Trust | ||||||||
| 6,193 | 0.36%, 05/25/2036 - 11/25/2036 Δ | 2,923 | ||||||
| National Credit Union Administration | ||||||||
| 3,082 | 1.84%, 10/07/2020 Δ | 3,089 | ||||||
| Residential Accredit Loans, Inc. | ||||||||
| 7,530 | 3.02%, 11/25/2037 Δ | 3,739 | ||||||
| Residential Asset Securitization Trust | ||||||||
| 3,951 | 0.64%, 03/25/2035 Δ | 3,017 | ||||||
| RFMSI Trust | ||||||||
| 687 | 3.21%, 04/25/2037 Δ | 573 | ||||||
| Securitized Asset Backed Receivables LLC | ||||||||
| 2,430 | 0.28%, 07/25/2036 Δ | 1,104 | ||||||
| Sequoia Mortgage Trust | ||||||||
| 1,075 | 2.54%, 07/20/2037 Δ | 856 | ||||||
| Soundview Home Equity Loan Trust, Inc. | ||||||||
| 3,900 | 0.37%, 07/25/2037 Δ | 1,985 | ||||||
| 7,820 | 0.44%, 06/25/2036 Δ | 5,002 | ||||||
The accompanying notes are an integral part of these financial statements.
| 7 |
| Hartford Total Return Bond HLS Fund |
| Schedule of Investments – (continued) |
| June 30, 2013 (Unaudited) |
| (000’s Omitted) |
| Shares or Principal Amount | Market Value ╪ | |||||||
| ASSET & COMMERCIAL MORTGAGE BACKED SECURITIES - 16.4% - (continued) | ||||||||
| Finance and Insurance - 16.2% - (continued) | ||||||||
| Real Estate Credit (Mortgage Banking) - 14.4% - (continued) | ||||||||
| Structured Adjustable Rate Mortgage Loan Trust | ||||||||
| $ | 1,781 | 0.49%, 09/25/2034 Δ | $ | 1,490 | ||||
| Structured Asset Mortgage Investments Trust | ||||||||
| 3,519 | 0.41%, 05/25/2046 Δ | 1,866 | ||||||
| UBS-Barclays Commercial Mortgage Trust | ||||||||
| 5,400 | 3.18%, 03/10/2046 Δ | 5,189 | ||||||
| Wachovia Bank Commercial Mortgage Trust | ||||||||
| 465 | 5.24%, 10/15/2044 Δ | 500 | ||||||
| 1,351 | 5.42%, 01/15/2045 Δ | 1,453 | ||||||
| Wells Fargo Alternative Loan Trust | ||||||||
| 7,275 | 6.25%, 11/25/2037 | 6,770 | ||||||
| Wells Fargo Commercial Mortgage Trust | ||||||||
| 6,965 | 2.92%, 10/15/2045 | 6,524 | ||||||
| 1,660 | 4.78%, 10/15/2045 ■Δ | 1,420 | ||||||
| Wells Fargo Mortgage Backed Securities Trust | ||||||||
| 2,476 | 5.15%, 10/25/2035 Δ | 2,410 | ||||||
| WF-RBS Commercial Mortgage Trust | ||||||||
| 875 | 2.87%, 11/15/2045 | 811 | ||||||
| 3,888 | 2.88%, 12/15/2045 | 3,595 | ||||||
| 2,822 | 3.07%, 03/15/2045 | 2,649 | ||||||
| 3,470 | 3.20%, 03/15/2048 | 3,293 | ||||||
| 8,875 | 3.34%, 06/15/2046 | 8,461 | ||||||
| 175 | 3.44%, 04/15/2045 | 173 | ||||||
| 2,330 | 4.19%, 03/15/2045 ■Δ | 1,696 | ||||||
| 3,135 | 4.46%, 12/15/2045 ■Δ | 2,364 | ||||||
| 4,840 | 4.87%, 02/15/2044 ■ | 5,271 | ||||||
| 550 | 4.90%, 06/15/2044 ■ | 597 | ||||||
| 2,780 | 5.00%, 06/15/2044 ■ | 2,247 | ||||||
| 1,045 | 5.56%, 04/15/2045 ■Δ | 965 | ||||||
| 529,233 | ||||||||
| 597,174 | ||||||||
| Information - 0.2% | ||||||||
| Telecommunications - Other - 0.2% | ||||||||
| SBA Tower Trust | ||||||||
| 5,620 | 2.93%, 12/15/2017 ■ | 5,672 | ||||||
| Total asset & commercial mortgage backed securities | ||||||||
| (cost $598,428) | $ | 602,846 | ||||||
| CORPORATE BONDS - 32.0% | ||||||||
| Accommodation and Food Services - 0.2% | ||||||||
| Traveler Accommodation - 0.2% | ||||||||
| Choice Hotels International, Inc. | ||||||||
| $ | 151 | 5.70%, 08/28/2020 | $ | 160 | ||||
| 2,300 | 5.75%, 07/01/2022 | 2,438 | ||||||
| Wynn Las Vegas LLC | ||||||||
| 5,415 | 7.75%, 08/15/2020 | 6,013 | ||||||
| 8,611 | ||||||||
| Administrative Waste Management and Remediation - 0.1% | ||||||||
| Waste Treatment and Disposal - 0.1% | ||||||||
| Clean Harbors, Inc. | ||||||||
| 345 | 5.13%, 06/01/2021 | 347 | ||||||
| 1,385 | 5.25%, 08/01/2020 | 1,406 | ||||||
| 1,753 | ||||||||
| Air Transportation - 0.2% | ||||||||
| Scheduled Air Transportation - 0.2% | ||||||||
| Continental Airlines, Inc. | ||||||||
| 5,825 | 4.00%, 10/29/2024 | 5,811 | ||||||
| US Airways Group, Inc. | ||||||||
| 910 | 6.25%, 04/22/2023 | 962 | ||||||
| 6,773 | ||||||||
| Apparel Manufacturing - 0.1% | ||||||||
| Accessories and Other Apparel Manufacturing - 0.0% | ||||||||
| PVH Corp. | ||||||||
| 470 | 4.50%, 12/15/2022 | 451 | ||||||
| Cut and Sew Apparel Manufacturing - 0.1% | ||||||||
| Hanesbrands, Inc. | ||||||||
| 1,530 | 6.38%, 12/15/2020 | 1,631 | ||||||
| Phillips Van-Heusen Corp. | ||||||||
| 1,950 | 7.38%, 05/15/2020 | 2,116 | ||||||
| 3,747 | ||||||||
| 4,198 | ||||||||
| Arts, Entertainment and Recreation - 2.4% | ||||||||
| Cable and Other Subscription Programming - 1.4% | ||||||||
| CCO Holdings LLC | ||||||||
| 840 | 5.25%, 09/30/2022 | 798 | ||||||
| 7,635 | 6.63%, 01/31/2022 | 7,960 | ||||||
| 1,900 | 7.38%, 06/01/2020 | 2,066 | ||||||
| DirecTV Holdings LLC | ||||||||
| 4,880 | 3.80%, 03/15/2022 | 4,688 | ||||||
| 4,200 | 5.00%, 03/01/2021 | 4,424 | ||||||
| Time Warner Cable, Inc. | ||||||||
| 2,405 | 4.50%, 09/15/2042 | 1,865 | ||||||
| 3,500 | 5.88%, 11/15/2040 | 3,206 | ||||||
| Time Warner Entertainment Co., L.P. | ||||||||
| 8,175 | 8.38%, 07/15/2033 | 9,635 | ||||||
| Time Warner, Inc. | ||||||||
| 2,540 | 3.40%, 06/15/2022 | 2,462 | ||||||
| 3,800 | 6.10%, 07/15/2040 | 4,149 | ||||||
| 2,700 | 6.50%, 11/15/2036 | 3,054 | ||||||
| Viacom, Inc. | ||||||||
| 7,000 | 5.63%, 09/15/2019 | 8,035 | ||||||
| 52,342 | ||||||||
| Motion Picture and Video Industries - 0.1% | ||||||||
| NAI Entertainment Holdings LLC | ||||||||
| 732 | 8.25%, 12/15/2017 ■ | 783 | ||||||
| National CineMedia LLC | ||||||||
| 160 | 6.00%, 04/15/2022 | 164 | ||||||
| 947 | ||||||||
| Newspaper, Periodical, Book and Database Publisher - 0.2% | ||||||||
| News America, Inc. | ||||||||
| 7,200 | 6.15%, 03/01/2037 - 02/15/2041 | 7,852 | ||||||
The accompanying notes are an integral part of these financial statements.
| 8 |
| Shares or Principal Amount | Market Value ╪ | |||||||
| CORPORATE BONDS - 32.0% - (continued) | ||||||||
| Arts, Entertainment and Recreation - 2.4% - (continued) | ||||||||
| Radio and Television Broadcasting - 0.7% | ||||||||
| CBS Corp. | ||||||||
| $ | 3,700 | 3.38%, 03/01/2022 | $ | 3,567 | ||||
| 3,810 | 4.85%, 07/01/2042 | 3,522 | ||||||
| Liberty Media Corp. | ||||||||
| 4,047 | 8.25%, 02/01/2030 | 4,330 | ||||||
| NBC Universal Enterprise | ||||||||
| 1,700 | 1.66%, 04/15/2018 ■ | 1,655 | ||||||
| NBC Universal Media LLC | ||||||||
| 3,465 | 5.15%, 04/30/2020 | 3,945 | ||||||
| 3,390 | 5.95%, 04/01/2041 | 3,871 | ||||||
| 3,215 | 6.40%, 04/30/2040 | 3,845 | ||||||
| Starz Financial Corp | ||||||||
| 665 | 5.00%, 09/15/2019 | 660 | ||||||
| 25,395 | ||||||||
| 86,536 | ||||||||
| Beverage and Tobacco Product Manufacturing - 0.9% | ||||||||
| Beverage Manufacturing - 0.7% | ||||||||
| Anheuser-Busch InBev Worldwide, Inc. | ||||||||
| 6,890 | 7.75%, 01/15/2019 ‡ | 8,715 | ||||||
| Constellation Brands, Inc. | ||||||||
| 1,680 | 6.00%, 05/01/2022 | 1,802 | ||||||
| 5,535 | 7.25%, 05/15/2017 | 6,296 | ||||||
| Molson Coors Brewing Co. | ||||||||
| 1,825 | 3.50%, 05/01/2022 | 1,791 | ||||||
| Pernod-Ricard S.A. | ||||||||
| 8,265 | 2.95%, 01/15/2017 ■ | 8,457 | ||||||
| 27,061 | ||||||||
| Tobacco Manufacturing - 0.2% | ||||||||
| Altria Group, Inc. | ||||||||
| 3,740 | 10.20%, 02/06/2039 ‡ | 5,629 | ||||||
| Lorillard Tobacco Co. | ||||||||
| 1,160 | 8.13%, 06/23/2019 | 1,421 | ||||||
| 7,050 | ||||||||
| 34,111 | ||||||||
| Chemical Manufacturing - 0.3% | ||||||||
| Agricultural Chemical Manufacturing - 0.1% | ||||||||
| CF Industries Holdings, Inc. | ||||||||
| 2,950 | 3.45%, 06/01/2023 | 2,835 | ||||||
| Basic Chemical Manufacturing - 0.2% | ||||||||
| Ashland, Inc. | ||||||||
| 1,050 | 4.75%, 08/15/2022 ■ | 1,040 | ||||||
| Dow Chemical Co. | ||||||||
| 6,000 | 8.55%, 05/15/2019 | 7,655 | ||||||
| 8,695 | ||||||||
| 11,530 | ||||||||
| Computer and Electronic Product Manufacturing - 0.3% | ||||||||
| Computer and Peripheral Equipment Manufacturing - 0.3% | ||||||||
| Apple, Inc. | ||||||||
| 3,605 | 2.40%, 05/03/2023 ‡ | 3,344 | ||||||
| Hewlett-Packard Co. | ||||||||
| 2,970 | 2.65%, 06/01/2016 | 3,027 | ||||||
| Seagate HDD Cayman | ||||||||
| 3,435 | 6.88%, 05/01/2020 | 3,641 | ||||||
| 10,012 | ||||||||
| Navigational, Measuring and Control Instruments - 0.0% | ||||||||
| Esterline Technologies Corp. | ||||||||
| 1,890 | 7.00%, 08/01/2020 | 2,027 | ||||||
| 12,039 | ||||||||
| Construction - 0.1% | ||||||||
| Residential Building Construction - 0.1% | ||||||||
| D.R. Horton, Inc. | ||||||||
| 1,245 | 6.50%, 04/15/2016 | 1,345 | ||||||
| Pulte Homes, Inc. | ||||||||
| 800 | 7.88%, 06/15/2032 | 880 | ||||||
| Ryland Group, Inc. | ||||||||
| 785 | 5.38%, 10/01/2022 | 757 | ||||||
| 2,982 | ||||||||
| Fabricated Metal Product Manufacturing - 0.2% | ||||||||
| Boiler, Tank and Shipping Container Manufacturing - 0.1% | ||||||||
| Ball Corp. | ||||||||
| 3,015 | 4.00%, 11/15/2023 | 2,789 | ||||||
| 1,330 | 5.00%, 03/15/2022 ‡ | 1,323 | ||||||
| 4,112 | ||||||||
| Other Fabricated Metal Product Manufacturing - 0.1% | ||||||||
| Crown Americas, Inc. | ||||||||
| 1,005 | 4.50%, 01/15/2023 ■ | 947 | ||||||
| 2,400 | 6.25%, 02/01/2021 | 2,544 | ||||||
| Masco Corp. | ||||||||
| 575 | 5.95%, 03/15/2022 | 604 | ||||||
| 4,095 | ||||||||
| Spring and Wire Product Manufacturing - 0.0% | ||||||||
| Anixter International, Inc. | ||||||||
| 805 | 5.63%, 05/01/2019 ‡ | 833 | ||||||
| 9,040 | ||||||||
| Finance and Insurance - 13.7% | ||||||||
| Captive Auto Finance - 0.3% | ||||||||
| Credit Acceptance Corp. | ||||||||
| 1,611 | 9.13%, 02/01/2017 | 1,704 | ||||||
| Ford Motor Credit Co. LLC | ||||||||
| 4,000 | 1.70%, 05/09/2016 | 3,935 | ||||||
| 2,245 | 3.00%, 06/12/2017 | 2,250 | ||||||
| 3,600 | 5.88%, 08/02/2021 | 3,925 | ||||||
| 475 | 6.63%, 08/15/2017 | 537 | ||||||
| 12,351 | ||||||||
| Commercial Banking - 0.9% | ||||||||
| Barclays Bank plc | ||||||||
| 11,775 | 6.05%, 12/04/2017 ■‡ | 12,737 | ||||||
| BNP Paribas | ||||||||
| 11,625 | 2.38%, 09/14/2017 | 11,509 | ||||||
| 3,800 | 3.25%, 03/11/2015 | 3,923 | ||||||
| Lloyds Banking Group plc | ||||||||
| 3,090 | 6.50%, 09/14/2020 ■ | 3,294 | ||||||
| 31,463 | ||||||||
| Consumer Lending - 0.0% | ||||||||
| Minerva Luxembourg S.A. | ||||||||
| 1,645 | 7.75%, 01/31/2023 ■ | 1,637 | ||||||
The accompanying notes are an integral part of these financial statements.
| 9 |
| Hartford Total Return Bond HLS Fund |
| Schedule of Investments – (continued) |
| June 30, 2013 (Unaudited) |
| (000’s Omitted) |
| Shares or Principal Amount | Market Value ╪ | |||||||
CORPORATE BONDS - 32.0% - (continued) | ||||||||
| Finance and Insurance - 13.7% - (continued) | ||||||||
| Depository Credit Banking - 2.8% | ||||||||
| Bank of America Corp. | ||||||||
| $ | 5,965 | 2.00%, 01/11/2018 | $ | 5,778 | ||||
| 6,500 | 5.63%, 07/01/2020 ‡ | 7,156 | ||||||
| 6,365 | 5.75%, 12/01/2017 ‡ | 7,074 | ||||||
| 3,330 | 5.88%, 01/05/2021 | 3,748 | ||||||
| 3,700 | 7.63%, 06/01/2019 ‡ | 4,446 | ||||||
| Citigroup, Inc. | ||||||||
| 4,075 | 1.30%, 04/01/2016 | 4,027 | ||||||
| 6,490 | 4.05%, 07/30/2022 | 6,238 | ||||||
| 7,800 | 4.59%, 12/15/2015 | 8,330 | ||||||
| 1,427 | 4.88%, 05/07/2015 | 1,505 | ||||||
| 4,102 | 6.13%, 08/25/2036 | 4,016 | ||||||
| 8,900 | 6.63%, 06/15/2032 | 9,200 | ||||||
| 4,839 | 8.50%, 05/22/2019 | 6,097 | ||||||
| HSBC Holdings plc | ||||||||
| 4,500 | 6.80%, 06/01/2038 | 5,176 | ||||||
| HSBC USA, Inc. | ||||||||
| 3,950 | 1.63%, 01/16/2018 | 3,854 | ||||||
| PNC Bank NA | ||||||||
| 2,235 | 6.00%, 12/07/2017 | 2,584 | ||||||
| 2,924 | 6.88%, 04/01/2018 | 3,507 | ||||||
| PNC Funding Corp. | ||||||||
| 9,000 | 5.25%, 11/15/2015 | 9,794 | ||||||
| Wells Fargo & Co. | ||||||||
| 3,000 | 1.50%, 07/01/2015 | 3,034 | ||||||
| 4,165 | 3.45%, 02/13/2023 | 3,978 | ||||||
| 4,000 | 4.60%, 04/01/2021 | 4,359 | ||||||
| 103,901 | ||||||||
| Insurance Carriers - 1.1% | ||||||||
| American International Group, Inc. | ||||||||
| 4,595 | 2.38%, 08/24/2015 ‡ | 4,668 | ||||||
| 2,865 | 3.80%, 03/22/2017 ‡ | 3,003 | ||||||
| 2,100 | 8.25%, 08/15/2018 | 2,604 | ||||||
| ING US, Inc. | ||||||||
| 1,995 | 5.50%, 07/15/2022 ■ | 2,122 | ||||||
| Massachusetts Mutual Life Insurance Co. | ||||||||
| 2,493 | 8.88%, 06/01/2039 ■ | 3,654 | ||||||
| Nationwide Financial Services, Inc. | ||||||||
| 4,280 | 5.38%, 03/25/2021 ■ | 4,659 | ||||||
| Nationwide Mutual Insurance Co. | ||||||||
| 5,925 | 9.38%, 08/15/2039 ■ | 8,017 | ||||||
| Teachers Insurance & Annuity Association of America | ||||||||
| 5,748 | 6.85%, 12/16/2039 ■ | 7,020 | ||||||
| Wellpoint, Inc. | ||||||||
| 2,920 | 1.88%, 01/15/2018 | 2,859 | ||||||
| 38,606 | ||||||||
| International Trade Financing (Foreign Banks) - 0.9% | ||||||||
| Deutsche Bank AG | ||||||||
| 2,705 | 4.30%, 05/24/2028 | 2,498 | ||||||
| Royal Bank of Scotland plc | ||||||||
| 7,875 | 2.55%, 09/18/2015 | 8,007 | ||||||
| 5,000 | 3.95%, 09/21/2015 | 5,222 | ||||||
| 4,995 | 6.13%, 12/15/2022 | 4,753 | ||||||
| Santander U.S. Debt S.A. | ||||||||
| 8,000 | 3.72%, 01/20/2015 ■ | 8,075 | ||||||
| TSMC Global LTD | ||||||||
| 4,920 | 0.95%, 04/03/2016 ■ | 4,845 | ||||||
| 33,400 | ||||||||
| Nondepository Credit Banking - 1.9% | ||||||||
| Capital One Financial Corp. | ||||||||
| 8,063 | 2.15%, 03/23/2015 | 8,190 | ||||||
| 4,000 | 6.15%, 09/01/2016 | 4,464 | ||||||
| CIT Group, Inc. | ||||||||
| 45 | 5.00%, 05/15/2017 | 46 | ||||||
| 75 | 5.38%, 05/15/2020 | 77 | ||||||
| 6,443 | 5.50%, 02/15/2019 ■ | 6,652 | ||||||
| 1,175 | 6.63%, 04/01/2018 ■ | 1,269 | ||||||
| Discover Financial Services, Inc. | ||||||||
| 5,970 | 5.20%, 04/27/2022 | 6,162 | ||||||
| General Electric Capital Corp. | ||||||||
| 10,029 | 4.38%, 09/16/2020 | 10,617 | ||||||
| 11,900 | 5.30%, 02/11/2021 | 13,054 | ||||||
| 8,490 | 5.63%, 05/01/2018 | 9,738 | ||||||
| 725 | 5.88%, 01/14/2038 | 798 | ||||||
| 3,900 | 6.25%, 12/15/2022 ♠ | 4,144 | ||||||
| General Motors Financial Co., Inc. | ||||||||
| 495 | 2.75%, 05/15/2016 ■ | 487 | ||||||
| 255 | 3.25%, 05/15/2018 ■ | �� | 248 | |||||
| 165 | 4.25%, 05/15/2023 ■ | 154 | ||||||
| Provident Funding Associates L.P. | ||||||||
| 315 | 6.75%, 06/15/2021 ■ | 314 | ||||||
| SLM Corp. | ||||||||
| 2,020 | 7.25%, 01/25/2022 | 2,121 | ||||||
| 2,830 | 8.45%, 06/15/2018 | 3,141 | ||||||
| 71,676 | ||||||||
| Other Financial Investment Activities - 0.3% | ||||||||
| Ladder Capital Finance Holdings LLC | ||||||||
| 971 | 7.38%, 10/01/2017 ■ | 991 | ||||||
| State Street Corp. | ||||||||
| 7,610 | 4.96%, 03/15/2018 | 8,384 | ||||||
| 9,375 | ||||||||
| Other Investment Pools and Funds - 0.1% | ||||||||
| Fibria Overseas Finance Ltd. | ||||||||
| 1,730 | 7.50%, 05/04/2020 ■ | 1,868 | ||||||
| Real Estate Investment Trust (REIT) - 1.2% | ||||||||
| Brandywine Operating Partnership L.P. | ||||||||
| 6,200 | 3.95%, 02/15/2023 | 5,830 | ||||||
| DuPont Fabros Technology L.P. | ||||||||
| 1,900 | 8.50%, 12/15/2017 | 2,005 | ||||||
| HCP, Inc. | ||||||||
| 4,000 | 2.63%, 02/01/2020 | 3,747 | ||||||
| Health Care, Inc. | ||||||||
| 2,305 | 2.25%, 03/15/2018 | 2,263 | ||||||
| 2,260 | 4.13%, 04/01/2019 | 2,364 | ||||||
| Kimco Realty Corp. | ||||||||
| 8,525 | 3.13%, 06/01/2023 | 7,887 | ||||||
| 1,390 | 4.30%, 02/01/2018 | 1,494 | ||||||
| Liberty Property L.P. | ||||||||
| 2,165 | 3.38%, 06/15/2023 | 2,008 | ||||||
| 1,930 | 4.13%, 06/15/2022 | 1,909 | ||||||
The accompanying notes are an integral part of these financial statements.
| 10 |
| Shares or Principal Amount | Market Value ╪ | |||||||
| CORPORATE BONDS - 32.0% - (continued) | ||||||||
| Finance and Insurance - 13.7% - (continued) | ||||||||
| Real Estate Investment Trust (REIT) - 1.2% - (continued) | ||||||||
| Realty Income Corp. | ||||||||
| $ | 3,966 | 3.25%, 10/15/2022 | $ | 3,627 | ||||
| Ventas Realty L.P. | ||||||||
| 2,895 | 2.00%, 02/15/2018 | 2,802 | ||||||
| 3,425 | 2.70%, 04/01/2020 | 3,239 | ||||||
| 6,400 | 3.25%, 08/15/2022 | 5,941 | ||||||
| 45,116 | ||||||||
| Sales Financing - 0.1% | ||||||||
| Imerial Tobacco Finance plc | ||||||||
| 5,400 | 3.50%, 02/11/2023 ■ | 5,077 | ||||||
| Securities and Commodity Contracts and Brokerage - 4.1% | ||||||||
| Bear Stearns & Co., Inc. | ||||||||
| 292 | 5.55%, 01/22/2017 | 320 | ||||||
| 365 | 7.25%, 02/01/2018 | 434 | ||||||
| Goldman Sachs Group, Inc. | ||||||||
| 9,205 | 5.75%, 01/24/2022 | 10,153 | ||||||
| 6,637 | 6.00%, 06/15/2020 | 7,458 | ||||||
| 4,400 | 6.45%, 05/01/2036 | 4,427 | ||||||
| 11,720 | 6.75%, 10/01/2037 | 12,006 | ||||||
| JP Morgan Chase & Co. | ||||||||
| 12,170 | 3.15%, 07/05/2016 | 12,640 | ||||||
| 3,820 | 3.38%, 05/01/2023 | 3,557 | ||||||
| 11,645 | 4.35%, 08/15/2021 | 12,131 | ||||||
| 800 | 4.50%, 01/24/2022 | 837 | ||||||
| 6,375 | 6.00%, 01/15/2018 | 7,275 | ||||||
| Merrill Lynch & Co., Inc. | ||||||||
| 3,006 | 5.70%, 05/02/2017 | 3,237 | ||||||
| 24,775 | 6.05%, 05/16/2016 ‡ | 26,827 | ||||||
| 5,580 | 7.75%, 05/14/2038 | 6,383 | ||||||
| Morgan Stanley | ||||||||
| 2,545 | 1.75%, 02/25/2016 | 2,521 | ||||||
| 5,920 | 4.88%, 11/01/2022 | 5,848 | ||||||
| 3,690 | 5.63%, 09/23/2019 | 3,966 | ||||||
| 2,750 | 5.75%, 01/25/2021 | 2,985 | ||||||
| 17,500 | 6.25%, 08/28/2017 ‡ | 19,514 | ||||||
| 4,050 | 6.38%, 07/24/2042 | 4,519 | ||||||
| 865 | 7.30%, 05/13/2019 | 1,005 | ||||||
| UBS AG Stamford CT | ||||||||
| 1,600 | 7.63%, 08/17/2022 | 1,756 | ||||||
| 149,799 | ||||||||
| 504,269 | ||||||||
| Health Care and Social Assistance - 1.7% | ||||||||
| General Medical and Surgical Hospitals - 0.5% | ||||||||
| Community Health Systems, Inc. | ||||||||
| 4,445 | 5.13%, 08/15/2018 | 4,512 | ||||||
| HCA, Inc. | ||||||||
| 4,160 | 6.50%, 02/15/2020 | 4,501 | ||||||
| 2,135 | 7.25%, 09/15/2020 | 2,292 | ||||||
| 3,177 | 7.50%, 11/15/2095 | 2,955 | ||||||
| 1,140 | 8.50%, 04/15/2019 | 1,223 | ||||||
| Memorial Sloan-Kettering Cancer Center | ||||||||
| 4,710 | 5.00%, 07/01/2042 | 4,989 | ||||||
| 20,472 | ||||||||
| Health and Personal Care Stores - 0.3% | ||||||||
| CVS Caremark Corp. | ||||||||
| 7,998 | 8.35%, 07/10/2031 ■ | 10,253 | ||||||
| Offices and Physicians - 0.1% | ||||||||
| Partners Healthcare System, Inc. | ||||||||
| 2,815 | 3.44%, 07/01/2021 | 2,818 | ||||||
| Pharmaceutical and Medicine Manufacturing - 0.7% | ||||||||
| AbbVie, Inc. | ||||||||
| 4,145 | 1.75%, 11/06/2017 ■ | 4,061 | ||||||
| 8,831 | 2.00%, 11/06/2018 ■ | 8,563 | ||||||
| Express Scripts Holding Co. | ||||||||
| 2,910 | 2.10%, 02/12/2015 | 2,959 | ||||||
| Gilead Sciences, Inc. | ||||||||
| 3,564 | 4.40%, 12/01/2021 | 3,827 | ||||||
| Mylan, Inc. | ||||||||
| 2,095 | 1.80%, 06/24/2016 ■ | 2,089 | ||||||
| 2,250 | 6.00%, 11/15/2018 ■ | 2,466 | ||||||
| Zoetis, Inc. | ||||||||
| 1,830 | 3.25%, 02/01/2023 ■ | 1,739 | ||||||
| 25,704 | ||||||||
| Specialty Hospital-Except Psychiatric & Drug Abuse - 0.1% | ||||||||
| Fresenius Medical Care US Finance II, Inc. | ||||||||
| 3,185 | 5.63%, 07/31/2019 ■ | 3,312 | ||||||
| 596 | 9.00%, 07/15/2015 ■ | 659 | ||||||
| 3,971 | ||||||||
| 63,218 | ||||||||
| Information - 2.6% | ||||||||
| Cable and Other Program Distribution - 0.9% | ||||||||
| Cox Communications, Inc. | ||||||||
| 16,445 | 2.95%, 06/30/2023 ■ | 14,959 | ||||||
| CSC Holdings, Inc. | ||||||||
| 725 | 7.63%, 07/15/2018 | 817 | ||||||
| DISH DBS Corp. | ||||||||
| 4,955 | 5.88%, 07/15/2022 | 5,029 | ||||||
| 7,530 | 7.88%, 09/01/2019 | 8,434 | ||||||
| Rogers Communications, Inc. | ||||||||
| 1,745 | 8.75%, 05/01/2032 | 2,388 | ||||||
| TCI Communications, Inc. | ||||||||
| 2,025 | 8.75%, 08/01/2015 | 2,342 | ||||||
| 33,969 | ||||||||
| Data Processing Services - 0.1% | ||||||||
| Audatex North America, Inc. | ||||||||
| 2,001 | 6.75%, 06/15/2018 | 2,101 | ||||||
| Internet Publishing and Broadcasting - 0.0% | ||||||||
| Netflix, Inc. | ||||||||
| 1,535 | 5.38%, 02/01/2021 ■ | 1,527 | ||||||
| Other Information Services - 0.0% | ||||||||
| InterActiveCorp | ||||||||
| 505 | 4.75%, 12/15/2022 ■ | 477 | ||||||
| Satellite Telecommunications - 0.1% | ||||||||
| Hughes Satelite Systems Corp. | ||||||||
| 2,050 | 6.50%, 06/15/2019 | 2,173 | ||||||
The accompanying notes are an integral part of these financial statements.
| 11 |
| Hartford Total Return Bond HLS Fund |
| Schedule of Investments – (continued) |
| June 30, 2013 (Unaudited) |
| (000’s Omitted) |
| Shares or Principal Amount | Market Value ╪ | |||||||
| CORPORATE BONDS - 32.0% - (continued) | ||||||||
| Information - 2.6% - (continued) | ||||||||
| Software Publishers - 0.1% | ||||||||
| Brocade Communications Systems, Inc. | ||||||||
| $ | 2,536 | 4.63%, 01/15/2023 ■ | $ | 2,384 | ||||
| Telecommunications - Other - 0.7% | ||||||||
| SBA Tower Trust | ||||||||
| 7,645 | 3.60%, 04/16/2043 ■ | 7,565 | ||||||
| Sprint Nextel Corp. | ||||||||
| 2,995 | 7.00%, 03/01/2020 ■ | 3,235 | ||||||
| 1,306 | 9.00%, 11/15/2018 ■ | 1,528 | ||||||
| Telefonica Emisiones SAU | ||||||||
| 3,520 | 3.99%, 02/16/2016 | 3,630 | ||||||
| UPCB Finance III Ltd. | ||||||||
| 1,084 | 6.63%, 07/01/2020 ■ | 1,122 | ||||||
| UPCB Finance VI Ltd. | ||||||||
| 3,070 | 6.88%, 01/15/2022 ■ | 3,177 | ||||||
| Vivendi S.A. | ||||||||
| 1,800 | 2.40%, 04/10/2015 ■ | 1,832 | ||||||
| Wind Acquisition Finance S.A. | ||||||||
| 3,470 | 7.25%, 02/15/2018 ■ | 3,476 | ||||||
| 25,565 | ||||||||
| Telecommunications - Wired Carriers - 0.4% | ||||||||
| Deutsche Telekom International Finance B.V. | ||||||||
| 7,065 | 3.13%, 04/11/2016 ■ | 7,371 | ||||||
| Paetec Holding Corp. | ||||||||
| 698 | 9.88%, 12/01/2018 | 771 | ||||||
| Unitymedia Hessen GmbH & Co. | ||||||||
| 1,650 | 5.50%, 01/15/2023 ■ | 1,559 | ||||||
| 1,814 | 7.50%, 03/15/2019 ■ | 1,909 | ||||||
| Videotron Ltee | ||||||||
| 915 | 9.13%, 04/15/2018 | 960 | ||||||
| Windstream Corp. | ||||||||
| 2,216 | 7.88%, 11/01/2017 | 2,432 | ||||||
| 15,002 | ||||||||
| Telecommunications - Wireless Carriers - 0.1% | ||||||||
| Qwest Corp. | ||||||||
| 1,906 | 7.25%, 10/15/2035 | 1,916 | ||||||
| Vimpelcom Holdings | ||||||||
| 3,915 | 5.95%, 02/13/2023 ■ | 3,660 | ||||||
| 5,576 | ||||||||
| Wireless Communications Services - 0.2% | ||||||||
| Altice Financing S.A. | ||||||||
| 1,745 | 7.88%, 12/15/2019 ■ | 1,824 | ||||||
| Verizon Communications, Inc. | ||||||||
| 5,020 | 6.40%, 02/15/2038 | 5,845 | ||||||
| 7,669 | ||||||||
| 96,443 | ||||||||
| Machinery Manufacturing - 0.2% | ||||||||
| Agriculture, Construction, Mining and Machinery - 0.2% | ||||||||
| Case New Holland, Inc. | ||||||||
| 7,851 | 7.88%, 12/01/2017 | 8,891 | ||||||
| Mining - 0.8% | ||||||||
| Coal Mining - 0.3% | ||||||||
| Consol Energy, Inc. | ||||||||
| 925 | 8.00%, 04/01/2017 | 974 | ||||||
| Peabody Energy Corp. | ||||||||
| 1,370 | 6.00%, 11/15/2018 | 1,373 | ||||||
| 3,550 | 6.50%, 09/15/2020 | 3,559 | ||||||
| 3,675 | 7.38%, 11/01/2016 | 4,079 | ||||||
| 9,985 | ||||||||
| Metal Ore Mining - 0.4% | ||||||||
| Freeport-McMoRan Copper & Gold, Inc. | ||||||||
| 7,455 | 3.88%, 03/15/2023 ■ | 6,747 | ||||||
| Glencore Funding LLC | ||||||||
| 9,720 | 1.70%, 05/27/2016 ■ | 9,426 | ||||||
| 16,173 | ||||||||
| Nonmetallic Mineral Mining and Quarrying - 0.1% | ||||||||
| FMG Resources Pty Ltd. | ||||||||
| 815 | 6.00%, 04/01/2017 ■ | 793 | ||||||
| 1,299 | 7.00%, 11/01/2015 ■ | 1,312 | ||||||
| Vulcan Materials Co. | ||||||||
| 240 | 7.15%, 11/30/2037 | 240 | ||||||
| 440 | 7.50%, 06/15/2021 | 493 | ||||||
| 2,838 | ||||||||
| 28,996 | ||||||||
| Miscellaneous Manufacturing - 0.4% | ||||||||
| Aerospace Product and Parts Manufacturing - 0.3% | ||||||||
| BE Aerospace, Inc. | ||||||||
| 4,056 | 5.25%, 04/01/2022 ‡ | 4,035 | ||||||
| 3,059 | 6.88%, 10/01/2020 ‡ | 3,304 | ||||||
| Bombardier, Inc. | ||||||||
| 3,280 | 7.75%, 03/15/2020 ■ | 3,641 | ||||||
| 10,980 | ||||||||
| Other Miscellaneous Manufacturing - 0.1% | ||||||||
| Owens-Brockway Glass Container, Inc. | ||||||||
| 2,690 | 7.38%, 05/15/2016 | 3,000 | ||||||
| 13,980 | ||||||||
| Motor Vehicle and Parts Manufacturing - 0.1% | ||||||||
| Motor Vehicle Parts Manufacturing - 0.1% | ||||||||
| Tenneco, Inc. | ||||||||
| 2,110 | 6.88%, 12/15/2020 | 2,258 | ||||||
| Nonmetallic Mineral Product Manufacturing - 0.2% | ||||||||
| Glass and Glass Product Manufacturing - 0.2% | ||||||||
| Ardagh Packaging Finance plc | ||||||||
| 1,985 | 7.38%, 10/15/2017 ■ | 2,119 | ||||||
| Silgan Holdings, Inc. | ||||||||
| 5,315 | 5.00%, 04/01/2020 | 5,262 | ||||||
| 7,381 | ||||||||
| Other Services - 0.0% | ||||||||
| Death Care Services - 0.0% | ||||||||
| Service Corp. International | ||||||||
| 1,045 | 5.38%, 01/15/2022 ■☼ | 1,042 | ||||||
| Paper Manufacturing - 0.1% | ||||||||
| Converted Paper Product Manufacturing - 0.0% | ||||||||
| Clearwater Paper Corp. | ||||||||
| 385 | 4.50%, 02/01/2023 ■ | 366 | ||||||
The accompanying notes are an integral part of these financial statements.
| 12 |
| Shares or Principal Amount | Market Value ╪ | |||||||
| CORPORATE BONDS - 32.0% - (continued) | ||||||||
| Paper Manufacturing - 0.1% - (continued) | ||||||||
| Pulp, Paper and Paperboard Mills - 0.1% | ||||||||
| Rock-Tenn Co. | ||||||||
| $ | 360 | 3.50%, 03/01/2020 | $ | 352 | ||||
| 2,690 | 4.00%, 03/01/2023 | 2,592 | ||||||
| 2,944 | ||||||||
| 3,310 | ||||||||
| Petroleum and Coal Products Manufacturing - 2.3% | ||||||||
| Natural Gas Distribution - 0.1% | ||||||||
| Ferrellgas Partners L.P. | ||||||||
| 2,770 | 6.50%, 05/01/2021 | 2,777 | ||||||
| Oil and Gas Extraction - 1.8% | ||||||||
| Anadarko Petroleum Corp. | ||||||||
| 3,565 | 6.38%, 09/15/2017 ‡ | 4,100 | ||||||
| Chesapeake Energy Corp. | ||||||||
| 1,394 | 2.50%, 05/15/2037 ۞ | 1,313 | ||||||
| CNPC General Capital | ||||||||
| 9,560 | 1.45%, 04/16/2016 ■ | 9,445 | ||||||
| Continental Resources, Inc. | ||||||||
| 2,775 | 5.00%, 09/15/2022 | 2,824 | ||||||
| Denbury Resources, Inc. | ||||||||
| 1,290 | 4.63%, 07/15/2023 | 1,190 | ||||||
| EDC Finance Ltd. | ||||||||
| 3,135 | 4.88%, 04/17/2020 ■ | 2,868 | ||||||
| Gazprom Neft OAO via GPN Capital S.A. | ||||||||
| 2,786 | 4.38%, 09/19/2022 ■ | 2,552 | ||||||
| Harvest Operations Corp. | ||||||||
| 1,695 | 6.88%, 10/01/2017 | 1,890 | ||||||
| Lukoil International Finance B.V. | ||||||||
| 8,525 | 3.42%, 04/24/2018 ■ | 8,291 | ||||||
| Nexen, Inc. | ||||||||
| 2,735 | 7.50%, 07/30/2039 | 3,340 | ||||||
| Pemex Project Funding Master Trust | ||||||||
| 6,205 | 6.63%, 06/15/2035 | 6,515 | ||||||
| Petrobras Global Finance Co. | ||||||||
| 3,810 | 3.00%, 01/15/2019 | 3,539 | ||||||
| Petrobras International Finance Co. | ||||||||
| 1,900 | 5.38%, 01/27/2021 | 1,909 | ||||||
| 6,950 | 5.75%, 01/20/2020 | 7,231 | ||||||
| Pioneer Natural Resources Co. | ||||||||
| 660 | 6.65%, 03/15/2017 | 753 | ||||||
| 2,090 | 7.50%, 01/15/2020 | 2,566 | ||||||
| Range Resources Corp. | ||||||||
| 1,950 | 6.75%, 08/01/2020 | 2,091 | ||||||
| Seadrill Ltd. | ||||||||
| 2,440 | 5.63%, 09/15/2017 ■ | 2,403 | ||||||
| 64,820 | ||||||||
| Petroleum and Coal Products Manufacturing - 0.3% | ||||||||
| Chevron Corp. | ||||||||
| 3,160 | 2.43%, 06/24/2020 | 3,142 | ||||||
| MEG Energy Corp. | ||||||||
| 1,105 | 6.38%, 01/30/2023 ■ | 1,072 | ||||||
| Rosneft Oil Co. | ||||||||
| 2,245 | 3.15%, 03/06/2017 ■ | 2,211 | ||||||
| Valero Energy Corp. | ||||||||
| 4,791 | 9.38%, 03/15/2019 | 6,282 | ||||||
| 12,707 | ||||||||
| Support Activities For Mining - 0.1% | ||||||||
| Transocean, Inc. | ||||||||
| 1,120 | 5.05%, 12/15/2016 | 1,218 | ||||||
| 4,075 | 6.38%, 12/15/2021 | 4,580 | ||||||
| 5,798 | ||||||||
| 86,102 | ||||||||
| Pipeline Transportation - 0.5% | ||||||||
| Pipeline Transportation of Natural Gas - 0.5% | ||||||||
| El Paso Corp. | ||||||||
| 2,075 | 7.00%, 06/15/2017 | 2,256 | ||||||
| 1,602 | 7.80%, 08/01/2031 | 1,692 | ||||||
| Energy Transfer Equity L.P. | ||||||||
| 4,627 | 7.50%, 10/15/2020 | 5,055 | ||||||
| Kinder Morgan Energy Partners L.P. | ||||||||
| 3,000 | 6.85%, 02/15/2020 | 3,572 | ||||||
| Kinder Morgan Finance Co. | ||||||||
| 3,980 | 6.00%, 01/15/2018 ■ | 4,178 | ||||||
| MarkWest Energy Partners L.P. | ||||||||
| 1,299 | 6.25%, 06/15/2022 | 1,338 | ||||||
| 18,091 | ||||||||
| Plastics and Rubber Products Manufacturing - 0.1% | ||||||||
| Rubber Product Manufacturing - 0.1% | ||||||||
| Continental Rubber of America Corp. | ||||||||
| 2,245 | 4.50%, 09/15/2019 ■ | 2,312 | ||||||
| Primary Metal Manufacturing - 0.1% | ||||||||
| Iron and Steel Mills and Ferroalloy Manufacturing - 0.1% | ||||||||
| ArcelorMittal | ||||||||
| 2,975 | 9.50%, 02/15/2015 ‡ | 3,250 | ||||||
| Professional, Scientific and Technical Services - 0.1% | ||||||||
| Advertising and Related Services - 0.0% | ||||||||
| Lamar Media Corp. | ||||||||
| 955 | 5.88%, 02/01/2022 | 981 | ||||||
| Computer Systems Design and Related Services - 0.1% | ||||||||
| Flextronics International Ltd. | ||||||||
| 455 | 4.63%, 02/15/2020 ■ | 441 | ||||||
| 680 | 5.00%, 02/15/2023 ■ | 658 | ||||||
| Lender Processing Services, Inc. | ||||||||
| 1,320 | 5.75%, 04/15/2023 | 1,403 | ||||||
| 2,502 | ||||||||
| 3,483 | ||||||||
| Real Estate and Rental and Leasing - 0.8% | ||||||||
| Activities Related To Real Estate - 0.1% | ||||||||
| Duke Realty L.P. | ||||||||
| 4,000 | 3.63%, 04/15/2023 | 3,702 | ||||||
| Automotive Equipment Rental and Leasing - 0.0% | ||||||||
| Ashtead Capital, Inc. | ||||||||
| 295 | 6.50%, 07/15/2022 ■ | 307 | ||||||
| United Rentals North America, Inc. | ||||||||
| 139 | 5.75%, 07/15/2018 | 146 | ||||||
| 453 | ||||||||
| General Rental Centers - 0.2% | ||||||||
| ERAC USA Finance Co. | ||||||||
| 4,795 | 6.38%, 10/15/2017 ■ | 5,568 | ||||||
The accompanying notes are an integral part of these financial statements.
| 13 |
| Hartford Total Return Bond HLS Fund |
| Schedule of Investments – (continued) |
| June 30, 2013 (Unaudited) |
| (000’s Omitted) |
| Shares or Principal Amount | Market Value ╪ | |||||||
| CORPORATE BONDS - 32.0% - (continued) | ||||||||
| Real Estate and Rental and Leasing - 0.8% - (continued) | ||||||||
| Industrial Machinery and Equipment Rental and Leasing - 0.5% | ||||||||
| Air Lease Corp. | ||||||||
| $ | 2,575 | 4.50%, 01/15/2016 | $ | 2,588 | ||||
| International Lease Finance Corp. | ||||||||
| 13,570 | 5.88%, 04/01/2019 | 13,706 | ||||||
| 1,885 | 6.25%, 05/15/2019 | 1,937 | ||||||
| 1,597 | 8.88%, 09/01/2017 | 1,800 | ||||||
| 20,031 | ||||||||
| 29,754 | ||||||||
| Retail Trade - 1.5% | ||||||||
| Automobile Dealers - 0.1% | ||||||||
| AutoNation, Inc. | ||||||||
| 2,685 | 5.50%, 02/01/2020 ‡ | 2,792 | ||||||
| Automotive Parts, Accessories and Tire Stores - 0.2% | ||||||||
| AutoZone, Inc. | ||||||||
| 9,535 | 3.70%, 04/15/2022 ‡ | 9,271 | ||||||
| Building Material and Supplies Dealers - 0.1% | ||||||||
| Building Materials Corp. | ||||||||
| 3,474 | 6.75%, 05/01/2021 ■ | 3,691 | ||||||
| 1,962 | 7.50%, 03/15/2020 ■ | 2,100 | ||||||
| 5,791 | ||||||||
| Clothing Stores - 0.2% | ||||||||
| Ltd. Brands, Inc. | ||||||||
| 5,470 | 5.63%, 02/15/2022 | 5,552 | ||||||
| 370 | 6.95%, 03/01/2033 | 368 | ||||||
| 5,920 | ||||||||
| Direct Selling Establishments - 0.4% | ||||||||
| AmeriGas Partners L.P. | ||||||||
| 1,554 | 6.25%, 08/20/2019 ‡ | 1,562 | ||||||
| Energy Transfer Partners | ||||||||
| 5,965 | 3.60%, 02/01/2023 | 5,582 | ||||||
| 6,110 | 6.50%, 02/01/2042 | 6,516 | ||||||
| 13,660 | ||||||||
| Electronics and Appliance Stores - 0.1% | ||||||||
| Arcelik AS | ||||||||
| 2,810 | 5.00%, 04/03/2023 ■ | 2,515 | ||||||
| Other Miscellaneous Store Retailers - 0.4% | ||||||||
| Hutchinson Whampoa International 12 II Ltd. | ||||||||
| 10,500 | 2.00%, 11/08/2017 ■ | 10,195 | ||||||
| Sally Holdings LLC | ||||||||
| 1,515 | 5.75%, 06/01/2022 | 1,538 | ||||||
| Sotheby's | ||||||||
| 2,390 | 5.25%, 10/01/2022 ■ | 2,318 | ||||||
| 14,051 | ||||||||
| 54,000 | ||||||||
| Transportation Equipment Manufacturing - 0.2% | ||||||||
| Railroad Rolling Stock Manufacturing - 0.1% | ||||||||
| Kansas City Southern de Mexico S.A. de C.V. | ||||||||
| 3,110 | 3.00%, 05/15/2023 ■ | 2,919 | ||||||
| Ship and Boat Building - 0.1% | ||||||||
| Huntington Ingalls Industries, Inc. | ||||||||
| 3,925 | 6.88%, 03/15/2018 | 4,195 | ||||||
| 7,114 | ||||||||
| Truck Transportation - 0.3% | ||||||||
| Specialized Freight Trucking - 0.3% | ||||||||
| Penske Truck Leasing Co. | ||||||||
| 10,465 | 2.88%, 07/17/2018 ■ | 10,569 | ||||||
| Utilities - 1.2% | ||||||||
| Electric Generation, Transmission and Distribution - 1.2% | ||||||||
| AES (The) Corp. | ||||||||
| 890 | 9.75%, 04/15/2016 ‡ | 1,026 | ||||||
| Calpine Corp. | ||||||||
| 4,860 | 7.50%, 02/15/2021 ■ | 5,188 | ||||||
| 621 | 7.50%, 02/15/2021 § | 663 | ||||||
| 1,408 | 7.88%, 01/15/2023 ■ | 1,514 | ||||||
| Carolina Power & Light Co. | ||||||||
| 2,065 | 4.10%, 05/15/2042 | 1,889 | ||||||
| CenterPoint Energy, Inc. | ||||||||
| 7,475 | 6.85%, 06/01/2015 | 8,249 | ||||||
| Dolphin Subsidiary II, Inc. | ||||||||
| 6,895 | 7.25%, 10/15/2021 | 7,136 | ||||||
| EDP Finance B.V. | ||||||||
| 2,520 | 4.90%, 10/01/2019 ■ | 2,476 | ||||||
| MidAmerican Energy Holdings Co. | ||||||||
| 7,665 | 8.48%, 09/15/2028 | 10,256 | ||||||
| Pacific Gas & Electric Co. | ||||||||
| 3,708 | 8.25%, 10/15/2018 | 4,782 | ||||||
| 43,179 | ||||||||
| Wholesale Trade - 0.3% | ||||||||
| Beer, Wine, Distilled Alcoholic Beverage Wholesalers - 0.3% | ||||||||
| Heineken N.V. | ||||||||
| 2,880 | 1.40%, 10/01/2017 ■ | 2,798 | ||||||
| SABMiller Holdings, Inc. | ||||||||
| 6,840 | 2.45%, 01/15/2017 ■ | 6,949 | ||||||
| 2,425 | 3.75%, 01/15/2022 ■ | 2,468 | ||||||
| 12,215 | ||||||||
| Total corporate bonds | ||||||||
| (cost $1,163,915) | $ | 1,177,430 | ||||||
| FOREIGN GOVERNMENT OBLIGATIONS - 0.4% | ||||||||
| Brazil - 0.1% | ||||||||
| Brazil (Republic of) | ||||||||
| $ | 2,375 | 5.88%, 01/15/2019 | $ | 2,705 | ||||
| Mexico - 0.2% | ||||||||
| United Mexican States | ||||||||
| 7,260 | 4.75%, 03/08/2044 | 6,461 | ||||||
| Russia - 0.1% | ||||||||
| Russian Federation | ||||||||
| 4,400 | 3.25%, 04/04/2017 ■ | 4,526 | ||||||
| Total foreign government obligations | ||||||||
| (cost $14,360) | $ | 13,692 | ||||||
The accompanying notes are an integral part of these financial statements.
| 14 |
| Shares or Principal Amount | Market Value ╪ | |||||||
| MUNICIPAL BONDS - 1.1% | ||||||||
| General Obligations - 0.5% | ||||||||
| California State GO | ||||||||
| $ | 3,180 | 7.50%, 04/01/2034 | $ | 4,122 | ||||
| California State GO, Taxable | ||||||||
| 10,720 | 7.55%, 04/01/2039 ╦Θ Ø | 14,355 | ||||||
| 18,477 | ||||||||
| Higher Education (Univ., Dorms, etc.) - 0.1% | ||||||||
| Curators University, System Facs Rev Build America Bonds | ||||||||
| 2,020 | 5.79%, 11/01/2041 | 2,297 | ||||||
| Tax Allocation - 0.0% | ||||||||
| Industry, CA, Urban Development Agency | ||||||||
| 275 | 6.10%, 05/01/2024 | 257 | ||||||
| Utilities - Electric - 0.3% | ||||||||
| Municipal Elec Auth Georgia | ||||||||
| 10,065 | 6.64%, 04/01/2057 | 10,859 | ||||||
| Utilities - Water and Sewer - 0.2% | ||||||||
| San Franciso City & County, CA, Public Utilities | ||||||||
| 7,820 | 6.00%, 11/01/2040 | 8,867 | ||||||
| Total municipal bonds | ||||||||
| (cost $38,503) | $ | 40,757 | ||||||
| SENIOR FLOATING RATE INTERESTS♦ - 4.6% | ||||||||
| Administrative Waste Management and Remediation - 0.1% | ||||||||
| Business Support Services - 0.1% | ||||||||
| Audio Visual Services Group, Inc. | ||||||||
| $ | 1,164 | 6.75%, 11/09/2018 | $ | 1,170 | ||||
| ISS A/S | ||||||||
| 705 | 3.75%, 03/24/2018 | 703 | ||||||
| 1,873 | ||||||||
| Facilities Support Services - 0.0% | ||||||||
| Affinia Group, Inc. | ||||||||
| 685 | 4.75%, 04/25/2020 | 683 | ||||||
| 2,556 | ||||||||
| Air Transportation - 0.1% | ||||||||
| Scheduled Air Transportation - 0.1% | ||||||||
| Delta Air Lines, Inc. | ||||||||
| 968 | 4.00%, 10/18/2018 | 966 | ||||||
| United Airlines, Inc. | ||||||||
| 1,460 | 4.00%, 04/01/2019 | 1,456 | ||||||
| 2,422 | ||||||||
| Apparel Manufacturing - 0.0% | ||||||||
| Apparel Knitting Mills - 0.0% | ||||||||
| PVH Corp. | ||||||||
| 743 | 3.25%, 02/13/2020 | 741 | ||||||
| Arts, Entertainment and Recreation - 0.4% | ||||||||
| Cable and Other Subscription Programming - 0.1% | ||||||||
| Cequel Communications LLC | ||||||||
| 504 | 3.50%, 02/14/2019 | 499 | ||||||
| CSC Holdings, Inc. | ||||||||
| 985 | 2.70%, 04/17/2020 | 973 | ||||||
| Kabel Deutschland Holding AG | ||||||||
| 695 | 3.25%, 02/01/2019 | 692 | ||||||
| 2,164 | ||||||||
| Gambling Industries - 0.2% | ||||||||
| Caesars Entertainment Operating Co., Inc. | ||||||||
| 2,599 | 4.44%, 01/28/2018 | 2,227 | ||||||
| 2,648 | 5.44%, 01/28/2018 | 2,336 | ||||||
| MGM Resorts International | ||||||||
| 1,378 | 3.50%, 12/20/2019 | 1,368 | ||||||
| Rock Ohio Caesars LLC | ||||||||
| 450 | 5.00%, 03/28/2019 | 449 | ||||||
| The Seminole Tribe of Florida, Inc. | ||||||||
| 1,500 | 3.03%, 04/29/2020 | 1,494 | ||||||
| 7,874 | ||||||||
| Newspaper, Periodical, Book and Database Publisher - 0.1% | ||||||||
| Tribune Co. | ||||||||
| 3,279 | 4.00%, 12/31/2019 | 3,258 | ||||||
| Radio and Television Broadcasting - 0.0% | ||||||||
| Sinclair Television Group, Inc. | ||||||||
| 653 | 3.00%, 04/09/2020 | 651 | ||||||
| Spectator Sports - 0.0% | ||||||||
| Penn National Gaming, Inc. | ||||||||
| 394 | 3.75%, 07/16/2018 | 395 | ||||||
| 14,342 | ||||||||
| Beverage and Tobacco Product Manufacturing - 0.1% | ||||||||
| Beverage Manufacturing - 0.1% | ||||||||
| Constellation Brands, Inc. | ||||||||
| 2,400 | 2.75%, 05/01/2020 | 2,391 | ||||||
| Chemical Manufacturing - 0.2% | ||||||||
| Basic Chemical Manufacturing - 0.2% | ||||||||
| Huntsman International LLC, Extended Term Loan B | ||||||||
| 800 | 2.73%, 04/19/2017 | 798 | ||||||
| Pinnacle Operating Corp. | ||||||||
| 2,608 | 3.25%, 04/29/2020 | 2,589 | ||||||
| 893 | 4.75%, 11/15/2018 | 890 | ||||||
| PQ Corp. | ||||||||
| 1,343 | 4.50%, 08/07/2017 | 1,343 | ||||||
| 5,620 | ||||||||
| Other Chemical and Preparations Manufacturing - 0.0% | ||||||||
| Cytec Industries, Inc. | ||||||||
| 249 | 10/04/2019 ◊ | 248 | ||||||
| DuPont Performance Coatings, Inc. | ||||||||
| 294 | 4.75%, 02/01/2020 | 294 | ||||||
| Monarch, Inc. | ||||||||
| 481 | 10/04/2019 ◊ | 478 | ||||||
| Utex Industries, Inc. | ||||||||
| 245 | 4.75%, 04/10/2020 | 243 | ||||||
| 1,263 | ||||||||
The accompanying notes are an integral part of these financial statements.
| 15 |
| Hartford Total Return Bond HLS Fund |
| Schedule of Investments – (continued) |
| June 30, 2013 (Unaudited) |
| (000’s Omitted) |
| Shares or Principal Amount | Market Value ╪ | |||||||
| SENIOR FLOATING RATE INTERESTS♦ - 4.6% - (continued) | ||||||||
| Chemical Manufacturing - 0.2% - (continued) | ||||||||
| Paint, Coating and Adhesive Manufacturing - 0.0% | ||||||||
| Tronox Pigments Holland | ||||||||
| $ | 1,115 | 4.50%, 03/19/2020 | $ | 1,118 | ||||
| 8,001 | ||||||||
| Computer and Electronic Product Manufacturing - 0.1% | ||||||||
| Computer and Peripheral - 0.1% | ||||||||
| CDW LLC | ||||||||
| 2,883 | 3.50%, 04/29/2020 | 2,842 | ||||||
| Semiconductor, Electronic Components - 0.0% | ||||||||
| NXP Semiconductors N.V. | ||||||||
| 1,577 | 4.75%, 01/10/2020 | 1,596 | ||||||
| 4,438 | ||||||||
| Construction - 0.0% | ||||||||
| Construction - Other Specialty Trade Contractors - 0.0% | ||||||||
| Brand Energy & Infrastructure Services, Inc. | ||||||||
| 656 | 6.25%, 10/23/2018 | 660 | ||||||
| Other Heavy Construction - 0.0% | ||||||||
| Aluma Systems, Inc. | ||||||||
| 158 | 6.25%, 10/23/2018 | 158 | ||||||
| 818 | ||||||||
| Educational Services - 0.0% | ||||||||
| Educational Support Services - 0.0% | ||||||||
| Bright Horizons Family Solutions, Inc. | ||||||||
| 323 | 4.00%, 01/30/2020 | 324 | ||||||
| Finance and Insurance - 0.6% | ||||||||
| Activities Related To Credit Banking - 0.1% | ||||||||
| Evertec LLC | ||||||||
| 5,125 | 3.50%, 04/17/2020 | 5,097 | ||||||
| Agencies, Brokerages and Other Insurance - 0.1% | ||||||||
| Cooper Gay Swett & Crawford Ltd. | ||||||||
| 815 | 5.00%, 04/16/2020 | 811 | ||||||
| USI Insurance Services LLC | ||||||||
| 898 | 5.25%, 12/27/2019 | 899 | ||||||
| 1,710 | ||||||||
| Captive Auto Finance - 0.2% | ||||||||
| Chrysler Group LLC | ||||||||
| 4,331 | 4.25%, 05/24/2017 | 4,346 | ||||||
| Macquarie Aircraft Leasing Finance S.A., Second Lien Term Loan | ||||||||
| 1,696 | 4.19%, 11/29/2013 | 1,654 | ||||||
| 6,000 | ||||||||
| Insurance Carriers - 0.0% | ||||||||
| Asurion LLC | ||||||||
| 1,101 | 4.50%, 05/24/2019 | 1,090 | ||||||
| Other Financial Investment Activities - 0.2% | ||||||||
| Nuveen Investments, Inc. | ||||||||
| 4,600 | 4.20%, 05/13/2017 | 4,558 | ||||||
| Ocwen Financial Corp. | ||||||||
| 420 | 5.00%, 02/15/2018 | 422 | ||||||
| Walter Investment Management | ||||||||
| 2,013 | 5.75%, 11/28/2017 | 2,014 | ||||||
| 6,994 | ||||||||
| 20,891 | ||||||||
| Food Manufacturing - 0.2% | ||||||||
| Fruit and Vegetable Preserving and Specialty Foods - 0.0% | ||||||||
| Dole Food Co., Inc. | ||||||||
| 2,623 | 3.75%, 04/01/2020 | 2,608 | ||||||
| Other Food Manufacturing - 0.2% | ||||||||
| H. J. Heinz Co. | ||||||||
| 5,110 | 3.50%, 03/27/2020 | 5,104 | ||||||
| Hostess Brands, Inc. | ||||||||
| 365 | 6.75%, 04/09/2020 | 371 | ||||||
| U.S. Foodservice, Inc. | ||||||||
| 1,153 | 4.50%, 05/31/2021 | 1,139 | ||||||
| 6,614 | ||||||||
| 9,222 | ||||||||
| Food Services - 0.1% | ||||||||
| Full-Service Restaurants - 0.1% | ||||||||
| OSI Restaurant Partners, Inc. | ||||||||
| 3,887 | 3.50%, 10/28/2019 | 3,871 | ||||||
| Furniture and Related Product Manufacturing - 0.0% | ||||||||
| Household, Institution Furniture, Kitchen Cabinet - 0.0% | ||||||||
| Tempur-Pedic International, Inc. | ||||||||
| 1,018 | 3.50%, 12/31/2019 | 1,008 | ||||||
| Other Furniture Related Product Manufacturing - 0.0% | ||||||||
| Wilsonart International Holding LLC | ||||||||
| 856 | 4.00%, 10/31/2019 | 848 | ||||||
| 1,856 | ||||||||
| Health Care and Social Assistance - 0.1% | ||||||||
| General Medical and Surgical Hospitals - 0.1% | ||||||||
| HCA, Inc. | ||||||||
| 2,185 | 2.95%, 05/01/2018 | 2,173 | ||||||
| 1,275 | 3.03%, 03/31/2017 | 1,268 | ||||||
| 3,441 | ||||||||
| Scientific Research and Development Services - 0.0% | ||||||||
| IMS Health, Inc. | ||||||||
| 652 | 3.75%, 09/01/2017 | 652 | ||||||
| 4,093 | ||||||||
| Information - 0.9% | ||||||||
| Cable and Other Program Distribution - 0.3% | ||||||||
| Charter Communications Operating LLC | ||||||||
| 3,075 | 03/31/2020 ◊☼ | 3,034 | ||||||
| 1,105 | 3.00%, 12/31/2020 | 1,094 | ||||||
| UPC Financing Partnership | ||||||||
| 1,165 | 3.25%, 06/30/2021 | 1,158 | ||||||
| 760 | 4.00%, 01/31/2021 | 759 | ||||||
| Virgin Media Finance plc | ||||||||
| 4,400 | 3.50%, 02/15/2020 ☼ | 4,348 | ||||||
| 10,393 | ||||||||
| Data Processing Services - 0.2% | ||||||||
| Emdeon, Inc. | ||||||||
| 1,440 | 3.75%, 11/02/2018 | 1,430 | ||||||
The accompanying notes are an integral part of these financial statements.
| 16 |
| Shares or Principal Amount | Market Value ╪ | |||||||
| SENIOR FLOATING RATE INTERESTS♦ - 4.6% - (continued) | ||||||||
| Information - 0.9% - (continued) | ||||||||
| Data Processing Services - 0.2% - (continued) | ||||||||
| First Data Corp. | ||||||||
| $ | 1,820 | 4.19%, 03/24/2017 - 09/24/2018 | $ | 1,774 | ||||
| First Data Corp., Extended 1st Lien Term Loan | ||||||||
| 5,740 | 4.19%, 03/23/2018 | 5,589 | ||||||
| 8,793 | ||||||||
| Software Publishers - 0.2% | ||||||||
| Epicor Software Corp. | ||||||||
| 441 | 4.50%, 05/16/2018 | 441 | ||||||
| Infor (US), Inc. | ||||||||
| 1,896 | 5.25%, 04/05/2018 | 1,898 | ||||||
| Kronos, Inc. | ||||||||
| 2,129 | 4.50%, 10/30/2019 | 2,132 | ||||||
| 410 | 9.75%, 04/30/2020 | 420 | ||||||
| Web.com Group, Inc. | ||||||||
| 1,588 | 4.50%, 10/27/2017 | 1,597 | ||||||
| 6,488 | ||||||||
| Telecommunications - Other - 0.1% | ||||||||
| Nine Entertainment Group Ltd. | ||||||||
| 1,245 | 3.50%, 02/05/2020 | 1,237 | ||||||
| Sorenson Communications, Inc. | ||||||||
| 1,766 | 9.50%, 10/31/2014 | 1,760 | ||||||
| 2,997 | ||||||||
| Telecommunications - Wireless Carriers - 0.0% | ||||||||
| Alcatel-Lucent | ||||||||
| 493 | 7.25%, 01/30/2019 | 496 | ||||||
| Light Tower Fiber LLC | ||||||||
| 540 | 4.50%, 04/13/2020 | 536 | ||||||
| Syniverse Holdings, Inc. | ||||||||
| 1,040 | 4.00%, 04/23/2019 | 1,035 | ||||||
| 2,067 | ||||||||
| Wireless Communications Services - 0.1% | ||||||||
| Leap Wireless International, Inc. | ||||||||
| 2,750 | 4.75%, 03/08/2020 | 2,724 | ||||||
| Windstream Corp. | ||||||||
| 478 | 3.50%, 01/23/2020 | 477 | ||||||
| 3,201 | ||||||||
| 33,939 | ||||||||
| Mining - 0.2% | ||||||||
| Metal Ore Mining - 0.1% | ||||||||
| Fortescue Metals Group Ltd. | ||||||||
| 2,630 | 5.25%, 10/18/2017 | 2,612 | ||||||
| Mining and Quarrying Nonmetallic Mineral - 0.1% | ||||||||
| Arch Coal, Inc. | ||||||||
| 3,211 | 5.75%, 05/16/2018 | 3,194 | ||||||
| 5,806 | ||||||||
| Miscellaneous Manufacturing - 0.2% | ||||||||
| Aerospace Product and Parts Manufacturing - 0.1% | ||||||||
| DigitalGlobe, Inc. | ||||||||
| 808 | 3.75%, 01/31/2020 | 805 | ||||||
| Doncasters plc | ||||||||
| 2,785 | 5.50%, 04/09/2020 | 2,778 | ||||||
| Hamilton Sundstrand Corp. | ||||||||
| 970 | 4.00%, 12/13/2019 | 961 | ||||||
| TransDigm Group, Inc. | ||||||||
| 218 | 3.75%, 02/28/2020 | 215 | ||||||
| 4,759 | ||||||||
| Miscellaneous Manufacturing - 0.1% | ||||||||
| Reynolds Group Holdings, Inc. | ||||||||
| 1,737 | 4.75%, 09/28/2018 | 1,740 | ||||||
| 6,499 | ||||||||
| Motor Vehicle and Parts Manufacturing - 0.1% | ||||||||
| Motor Vehicle Parts Manufacturing - 0.1% | ||||||||
| Federal Mogul Corp., Tranche B Term Loan | ||||||||
| 1,511 | 2.95%, 12/29/2014 | 1,442 | ||||||
| Federal Mogul Corp., Tranche C Term Loan | ||||||||
| 771 | 2.95%, 12/28/2015 | 736 | ||||||
| Tower International, Inc. | ||||||||
| 1,415 | 5.75%, 04/23/2020 | 1,426 | ||||||
| 3,604 | ||||||||
| Other Services - 0.0% | ||||||||
| Commercial/Industrial Machine and Equipment - 0.0% | ||||||||
| Apex Tool Group LLC | ||||||||
| 225 | 4.50%, 01/31/2020 | 225 | ||||||
| Petroleum and Coal Products Manufacturing - 0.1% | ||||||||
| Oil and Gas Extraction - 0.1% | ||||||||
| Dynegy Power LLC | ||||||||
| 551 | 4.00%, 04/23/2020 | 546 | ||||||
| Ruby Western Pipeline Holdings LLC | ||||||||
| 1,400 | 3.50%, 03/27/2020 | 1,393 | ||||||
| 1,939 | ||||||||
| Pipeline Transportation - 0.1% | ||||||||
| Pipeline Transportation of Crude Oil - 0.0% | ||||||||
| Philadelphia Energy Solutions LLC | ||||||||
| 830 | 6.25%, 04/04/2018 | 824 | ||||||
| Pipeline Transportation of Natural Gas - 0.1% | ||||||||
| EP Energy LLC | ||||||||
| 3,745 | 4.50%, 04/30/2019 | 3,743 | ||||||
| 4,567 | ||||||||
| Plastics and Rubber Products Manufacturing - 0.1% | ||||||||
| Plastics Product Manufacturing - 0.1% | ||||||||
| Berry Plastics Group, Inc. | ||||||||
| 3,367 | 3.50%, 02/08/2020 | 3,326 | ||||||
| Consolidated Container Co. | ||||||||
| 1,191 | 5.00%, 07/03/2019 | 1,194 | ||||||
| 4,520 | ||||||||
| Primary Metal Manufacturing - 0.1% | ||||||||
| Alumina and Aluminum Production and Processing - 0.1% | ||||||||
| Novelis, Inc. | ||||||||
| 5,250 | 3.75%, 03/10/2017 | 5,255 | ||||||
| Professional, Scientific and Technical Services - 0.1% | ||||||||
| Professional Services - Computer System Design and Related - 0.1% | ||||||||
| MoneyGram International, Inc. | ||||||||
| 1,751 | 4.25%, 03/27/2020 | 1,752 | ||||||
The accompanying notes are an integral part of these financial statements.
| 17 |
| Hartford Total Return Bond HLS Fund |
| Schedule of Investments – (continued) |
| June 30, 2013 (Unaudited) |
| (000’s Omitted) |
| Shares or Principal Amount | Market Value ╪ | |||||||
| SENIOR FLOATING RATE INTERESTS♦ - 4.6% - (continued) | ||||||||
| Professional, Scientific and Technical Services - 0.1% - (continued) | ||||||||
| Professional Services - Computer System Design and Related - 0.1% - (continued) | ||||||||
| SunGard Data Systems, Inc. | ||||||||
| $ | 798 | 4.50%, 01/31/2020 | $ | 799 | ||||
| 2,551 | ||||||||
| Real Estate and Rental and Leasing - 0.0% | ||||||||
| Automotive Equipment Rental and Leasing - 0.0% | ||||||||
| The Hertz Corp. | ||||||||
| 928 | 3.00%, 03/11/2018 | 921 | ||||||
| Retail Trade - 0.6% | ||||||||
| Automobile Dealers - 0.0% | ||||||||
| TI Automotive Ltd. | ||||||||
| 923 | 5.50%, 03/28/2019 | 931 | ||||||
| Building Material and Supplies Dealers - 0.0% | ||||||||
| American Builders & Contractors Supply Co. | ||||||||
| 940 | 3.50%, 04/16/2020 | 932 | ||||||
| Department Stores - 0.1% | ||||||||
| Neiman (The) Marcus Group, Inc. | ||||||||
| 2,835 | 4.00%, 05/16/2018 | 2,824 | ||||||
| Grocery Stores - 0.0% | ||||||||
| Sprouts Farmers Markets Holdings LLC | ||||||||
| 1,080 | 4.50%, 04/23/2020 | 1,077 | ||||||
| Other Miscellaneous Store Retailers - 0.1% | ||||||||
| Aramark Corp. | ||||||||
| 2,520 | 3.78%, 07/26/2016 | 2,518 | ||||||
| 645 | 4.00%, 09/09/2019 | 643 | ||||||
| Rite Aid Corp. | ||||||||
| 708 | 4.00%, 02/21/2020 | 705 | ||||||
| 250 | 5.75%, 08/21/2020 | 253 | ||||||
| 4,119 | ||||||||
| Specialty Food Stores - 0.2% | ||||||||
| Weight Watchers International, Inc. | ||||||||
| 5,965 | 3.75%, 04/02/2020 | 5,922 | ||||||
| Sporting Goods, Hobby and Musical Instrument Store - 0.2% | ||||||||
| EB Sports Corp. | ||||||||
| 5,188 | 11.50%, 12/31/2015 Þ | 5,136 | ||||||
| Michaels Stores, Inc. | ||||||||
| 1,025 | 3.75%, 01/28/2020 | 1,021 | ||||||
| 6,157 | ||||||||
| 21,962 | ||||||||
| Truck Transportation - 0.0% | ||||||||
| Freight Trucking - General - 0.0% | ||||||||
| Nexeo Solutions LLC | ||||||||
| 652 | 5.00%, 09/09/2017 | 641 | ||||||
| Utilities - 0.1% | ||||||||
| Electric Generation, Transmission and Distribution - 0.1% | ||||||||
| Star West Generation LLC | ||||||||
| 3,015 | 4.25%, 03/13/2020 | 3,019 | ||||||
| Total senior floating rate interests | ||||||||
| (cost $171,848) | 171,414 | |||||||
| U.S. GOVERNMENT AGENCIES - 57.0% | ||||||||
| FHLMC - 5.3% | ||||||||
| $ | 6,409 | 0.50%, 01/15/2039 ► | $ | 781 | ||||
| 33,526 | 2.08%, 08/25/2018 ► | 2,912 | ||||||
| 75,379 | 2.49%, 10/25/2020 ► | 1,375 | ||||||
| 70,000 | 3.50%, 07/15/2043 ☼ | 70,897 | ||||||
| 18,017 | 4.00%, 08/01/2025 - 07/15/2043 ‡☼ | 19,158 | ||||||
| 61,819 | 5.50%, 10/01/2018 - 06/01/2041 ‡ | 66,539 | ||||||
| 19,774 | 6.00%, 04/01/2017 - 11/01/2037 | 21,606 | ||||||
| 8,450 | 6.03%, 05/15/2037 ► | 1,444 | ||||||
| 999 | 6.50%, 07/01/2031 - 12/01/2037 | 1,110 | ||||||
| 31,637 | 6.61%, 01/15/2041 ► | 4,815 | ||||||
| 5 | 7.50%, 09/01/2029 - 11/01/2031 | 6 | ||||||
| 15,560 | 14.18%, 12/15/2036 ► | 2,295 | ||||||
| 192,938 | ||||||||
| FNMA - 29.7% | ||||||||
| 7,739 | 2.14%, 11/01/2022 | 7,273 | ||||||
| 10,846 | 2.15%, 10/01/2022 | 10,267 | ||||||
| 5,192 | 2.20%, 12/01/2022 | 4,897 | ||||||
| 3,014 | 2.28%, 11/01/2022 | 2,859 | ||||||
| 2,554 | 2.34%, 11/01/2022 | 2,431 | ||||||
| 2,306 | 2.40%, 10/01/2022 | 2,208 | ||||||
| 2,013 | 2.42%, 11/01/2022 | 1,929 | ||||||
| 2,066 | 2.47%, 11/01/2022 | 1,985 | ||||||
| 72,740 | 2.50%, 07/12/2028 ☼ | 73,161 | ||||||
| 141,920 | 3.00%, 07/15/2028 - 07/15/2043 ☼ | 140,518 | ||||||
| 486,200 | 3.50%, 08/15/2025 - 07/15/2043 ☼ | 494,225 | ||||||
| 9,498 | 3.97%, 06/25/2042 ► | 1,677 | ||||||
| 125,432 | 4.00%, 06/01/2025 - 07/15/2043 ☼ | 130,942 | ||||||
| 62,901 | 4.50%, 04/01/2025 - 07/15/2043 ☼ | 66,788 | ||||||
| 72,424 | 5.00%, 02/01/2018 - 04/25/2038 ‡ | 78,014 | ||||||
| 48,821 | 5.50%, 12/01/2013 - 01/01/2037 ‡ | 53,193 | ||||||
| 11,836 | 6.00%, 11/01/2013 - 02/01/2037 | 12,970 | ||||||
| 24 | 6.50%, 11/01/2014 - 07/01/2032 | 26 | ||||||
| 435 | 7.00%, 02/01/2016 - 10/01/2037 | 506 | ||||||
| 339 | 7.50%, 11/01/2015 - 05/01/2032 | 385 | ||||||
| 2 | 8.00%, 04/01/2032 | 2 | ||||||
| 15,950 | 9.69%, 11/25/2039 ► | 2,622 | ||||||
| 16,049 | 11.58%, 10/25/2036 ► | 2,838 | ||||||
| 23,646 | 14.35%, 09/25/2040 ► | 3,244 | ||||||
| 1,094,960 | ||||||||
| GNMA - 22.0% | ||||||||
| 85,300 | 3.00%, 07/15/2043 ☼ | 84,327 | ||||||
| 211,887 | 3.50%, 12/15/2040 - 07/15/2043 ☼ | 217,794 | ||||||
| 181,503 | 4.00%, 07/20/2040 - 07/15/2043 ‡☼ | 191,288 | ||||||
| 170,400 | 4.50%, 11/15/2039 - 09/20/2041 ‡ | 183,455 | ||||||
| 64,601 | 5.00%, 08/15/2039 - 06/20/2040 ‡ | 71,055 | ||||||
| 9,263 | 5.50%, 03/15/2033 - 10/20/2034 | 10,331 | ||||||
| 41,699 | 6.00%, 12/15/2023 - 07/15/2043 ☼ | 46,301 | ||||||
| 6,212 | 6.50%, 06/15/2028 - 09/15/2032 | 7,020 | ||||||
| 21 | 7.00%, 06/20/2030 - 08/15/2031 | 25 | ||||||
The accompanying notes are an integral part of these financial statements.
| 18 |
| Shares or Principal Amount | Market Value ╪ | |||||||
| U.S. GOVERNMENT AGENCIES - 57.0% - (continued) | ||||||||
| GNMA - 22.0% - (continued) | ||||||||
| $ | 1 | 8.50%, 11/15/2024 | $ | 1 | ||||
| 811,597 | ||||||||
| Total U.S. government agencies | ||||||||
| (cost $2,106,829) | $ | 2,099,495 | ||||||
| U.S. GOVERNMENT SECURITIES - 14.7% | ||||||||
| U.S. Treasury Securities - 14.7% | ||||||||
| U.S. Treasury Bonds - 4.8% | ||||||||
| $ | 67,410 | 2.88%, 05/15/2043 □‡ | $ | 59,658 | ||||
| 20,138 | 3.13%, 11/15/2041 ‡ | 18,879 | ||||||
| 30,512 | 4.38%, 05/15/2041 ‡ | 35,785 | ||||||
| 49,873 | 4.75%, 02/15/2041 ‡ | 61,983 | ||||||
| 176,305 | ||||||||
| U.S. Treasury Notes - 9.9% | ||||||||
| 311,838 | 0.88%, 01/31/2017 - 04/30/2017 ‡ | 310,287 | ||||||
| 9,319 | 1.00%, 10/31/2016 □ | 9,374 | ||||||
| 14,675 | 1.88%, 09/30/2017 ‡ | 15,111 | ||||||
| 10,000 | 2.00%, 04/30/2016 ‡ | 10,384 | ||||||
| 16,975 | 3.13%, 04/30/2017 ‡ | 18,329 | ||||||
| 363,485 | ||||||||
| 539,790 | ||||||||
| Total U.S. government securities | ||||||||
| (cost $553,449) | $ | 539,790 | ||||||
| Contracts | Market Value ╪ | |||||||
| PUT OPTIONS PURCHASED - 0.0% | ||||||||
| Interest Rate Contracts - 0.0% | ||||||||
| Interest Rate Swaption USD | ||||||||
| 13,480 | Expiration: 04/17/2023, Exercise Rate: 3.46% | $ | 2,085 | |||||
| Total put options purchased | ||||||||
| (cost $1,961) | $ | 2,085 | ||||||
| Shares or Principal Amount | Market Value ╪ | |||||||
| PREFERRED STOCKS - 0.1% | ||||||||
| Diversified Banks - 0.0% | ||||||||
| 2 | U.S. Bancorp | $ | 1,931 | |||||
| Other Diversified Financial Services - 0.1% | ||||||||
| 122 | Citigroup Capital XIII | 3,391 | ||||||
| Total preferred stocks | ||||||||
| (cost $4,974) | $ | 5,322 | ||||||
| Total long-term investments | ||||||||
| (cost $4,654,267) | $ | 4,652,831 | ||||||
| SHORT-TERM INVESTMENTS - 4.3% | ||||||||||||
| Repurchase Agreements - 4.3% | ||||||||||||
| Bank of America Merrill Lynch TriParty Repurchase Agreement (maturing on 07/01/2013 in the amount of $582, collateralized by GNMA 3.00%, 2042, value of $592) | ||||||||||||
| $ | 582 | 0.13%, 6/28/2013 | $ | 582 | ||||||||
| Bank of Montreal TriParty Repurchase Agreement (maturing on 07/01/2013 in the amount of $12,372, collateralized by FHLMC 4.00% - 5.00%, 2023 - 2025, FNMA 2.00% - 5.00%, 2022 - 2042, GNMA 2.00% - 5.00%, 2041 - 2043, value of $12,587) | ||||||||||||
| 12,372 | 0.15%, 6/28/2013 | 12,372 | ||||||||||
| Bank of Montreal TriParty Repurchase Agreement (maturing on 07/01/2013 in the amount of $24,036, collateralized by FHLB 0.38%, 2015, FHLMC 0.38%, 2014, FNMA 0.50% - 5.50%, 2015 - 2042, value of $24,461) | ||||||||||||
| 24,036 | 0.12%, 6/28/2013 | 24,036 | ||||||||||
| Barclays Capital TriParty Repurchase Agreement (maturing on 07/01/2013 in the amount of $16,657, collateralized by U.S. Treasury Note 3.13%, 2021, value of $16,931) | ||||||||||||
| 16,657 | 0.10%, 6/28/2013 | 16,657 | ||||||||||
| Citigroup Global Markets, Inc. TriParty Repurchase Agreement (maturing on 07/01/2013 in the amount of $49,085, collateralized by U.S. Treasury Bill 0.85%, 2013, U.S. Treasury Note 0.63% - 3.25%, 2013 - 2018, value of $49,823) | ||||||||||||
| 49,085 | 0.10%, 6/28/2013 | 49,085 | ||||||||||
| Deutsche Bank Securities TriParty Repurchase Agreement (maturing on 07/01/2013 in the amount of $582, collateralized by FNMA 4.50%, 2035, value of $592) | ||||||||||||
| 582 | 0.25%, 6/28/2013 | 582 | ||||||||||
| RBS Securities, Inc. TriParty Repurchase Agreement (maturing on 07/01/2013 in the amount of $19,685, collateralized by U.S. Treasury Note 1.00% - 2.63%, 2014 - 2020, value of $20,078) | ||||||||||||
| 19,684 | 0.10%, 6/28/2013 | 19,684 | ||||||||||
| TD Securities TriParty Repurchase Agreement (maturing on 07/01/2013 in the amount of $34,714, collateralized by FHLMC 3.50% - 4.00%, 2042, FNMA 3.50% - 4.50%, 2041 - 2042, value of $35,305) | ||||||||||||
| 34,713 | 0.12%, 6/28/2013 | 34,713 | ||||||||||
| UBS Securities, Inc. Repurchase Agreement (maturing on 07/01/2013 in the amount of $501, collateralized by U.S. Treasury Note 0.63%, 2014, value of $511) | ||||||||||||
| 501 | 0.09%, 6/28/2013 | 501 | ||||||||||
| 158,212 | ||||||||||||
| Total short-term investments | ||||||||||||
| (cost $158,212) | $ | 158,212 | ||||||||||
| Total investments | ||||||||||||
| (cost $4,812,479) ▲ | 130.6 | % | $ | 4,811,043 | ||||||||
| Other assets and liabilities | (30.6 | )% | (1,128,413 | ) | ||||||||
| Total net assets | 100.0 | % | $ | 3,682,630 | ||||||||
The accompanying notes are an integral part of these financial statements.
| 19 |
| Hartford Total Return Bond HLS Fund |
| Schedule of Investments – (continued) |
| June 30, 2013 (Unaudited) |
| (000’s Omitted) |
| Note: | Percentage of investments as shown is the ratio of the total market value to total net assets. |
| ▲ | At June 30, 2013, the cost of securities for federal income tax purposes was $4,821,792 and the aggregate gross unrealized appreciation and depreciation based on that cost were: |
| Unrealized Appreciation | $ | 84,858 | ||
| Unrealized Depreciation | (95,607 | ) | ||
| Net Unrealized Depreciation | $ | (10,749 | ) |
| Δ | Variable rate securities; the rate reported is the coupon rate in effect at June 30, 2013. |
| Þ | This security may pay interest in additional principal instead of cash. |
| ► | Securities disclosed are interest-only strips. The interest rates represent effective yields based upon estimated future cash flows at June 30, 2013. |
| ◊ | All or a portion of this position represents unsettled loan commitment. The coupon rate will be determined at time of settlement. |
| ♦ | Senior floating rate interests generally pay interest rates which are periodically adjusted by reference to a base short-term, floating lending rate plus a premium. These base lending rates are generally (i) the lending rate offered by one or more major European banks, such as the LIBOR, (ii) the prime rate offered by one or more major United States Banks, or (iii) the bank's certificate of deposit rate. Senior floating rate interests often require prepayments from excess cash flows or permit the borrower to repay at its election. The rate at which the borrower repays cannot be predicted with accuracy. As a result, the actual remaining maturity may be substantially less than the stated maturities shown. Unless otherwise noted, the interest rate disclosed for these securities represents the average coupon as of June 30, 2013. |
| ■ | Securities issued within terms of a private placement memorandum, exempt from registration under Rule 144A under the Securities Act of 1933, as amended, and may be sold only to qualified institutional buyers. Unless otherwise indicated, these holdings are determined to be liquid. At June 30, 2013, the aggregate value of these securities was $414,277, which represents 11.2% of total net assets. |
| § | These securities were sold to the Fund under Regulation S, rules governing offers and sales made outside the United States without registration under the Securities Act of 1933. The Fund may only be able to resell these securities in the United States if an exemption from registration under the federal and state securities laws is available, or the Fund may only be able to sell these securities outside of the United States (such as on a foreign exchange) to a non-U.S. person. Unless otherwise indicated, these holdings are determined to be liquid. At June 30, 2013, the aggregate value of these securities was $663, which rounds to zero percent of total net assets. |
| ۞ | Convertible security. |
| ♠ | Perpetual maturity security. Maturity date shown is the first call date. |
| ☼ | This security, or a portion of this security, was purchased on a when-issued, delayed-delivery or delayed-draw basis. The cost of these securities was $1,086,092 at June 30, 2013. |
| ‡ | This security, or a portion of this security, has been segregated to cover funding requirements on investment transactions settling in the future. |
| ╦ | This security, or a portion of this security, has been pledged as collateral in connection with swap contracts. In addition, cash of $19,030 was received from broker(s) as collateral in connection with swap contracts. Securities valued at $8,807, held on behalf of the Fund at the custody bank, were designated by broker(s) as collateral in connection with swap contracts. |
The accompanying notes are an integral part of these financial statements.
| 20 |
| □ | This security, or a portion of this security, is pledged as initial margin deposit and collateral for daily variation margin loss on open futures contracts held at June 30, 2013 as listed in the table below: |
Futures Contracts Outstanding at June 30, 2013
| Description | Number of Contracts* | Expiration Date | Notional Amount | Market Value ╪ | Unrealized Appreciation/ (Depreciation) | |||||||||||||
| Long position contracts: | ||||||||||||||||||
| Long Gilt Future | 117 | 09/26/2013 | $ | 19,819 | $ | 19,913 | $ | 94 | ||||||||||
| U.S. Treasury 2-Year Note Future | 1,094 | 09/30/2013 | 240,887 | 240,680 | (207 | ) | ||||||||||||
| U.S. Treasury 5-Year Note Future | 3,202 | 09/30/2013 | 392,204 | 387,592 | (4,612 | ) | ||||||||||||
| $ | (4,725 | ) | ||||||||||||||||
| Short position contracts: | ||||||||||||||||||
| Euro-BUND Future | 120 | 09/06/2013 | $ | 22,004 | $ | 22,105 | $ | (101 | ) | |||||||||
| Japan 10-Year Bond Future | 120 | 09/10/2013 | 173,230 | 172,656 | 574 | |||||||||||||
| U.S. Treasury 10-Year Note Future | 3,905 | 09/19/2013 | 498,942 | 494,227 | 4,715 | |||||||||||||
| U.S. Treasury 30-Year Bond Future | 23 | 09/19/2013 | 3,200 | 3,124 | 76 | |||||||||||||
| U.S. Treasury CME Ultra Long Term Bond Future | 215 | 09/19/2013 | 32,120 | 31,672 | 448 | |||||||||||||
| $ | 5,712 | |||||||||||||||||
| $ | 987 | |||||||||||||||||
| * | The number of contracts does not omit 000's. |
| Θ | At June 30, 2013, this security, or a portion of this security, is designated to cover written call options in the table below: |
Written Call Options Outstanding at June 30, 2013
| Description (Counterparty) | Option Type | Exercise Price/ Rate | Expiration Date | Number of Contracts* | Market Value ╪ | Premiums Received | Unrealized Appreciation (Depreciation) | |||||||||||||||||
| CDX.NA.IG.20 (CSI) | Credit | 0.85 | % | 07/17/2013 | 189,450,000 | $ | 292 | $ | 664 | $ | 372 | |||||||||||||
| CDX.NA.IG.20 (CSI) | Credit | 1.00 | % | 07/17/2013 | 275,130,000 | 1,752 | 1,306 | (446 | ) | |||||||||||||||
| $ | 2,044 | $ | 1,970 | $ | (74 | ) | ||||||||||||||||||
| * | The number of contracts does not omit 000's. Number of contracts shown in U.S. dollars unless otherwise noted. |
| Ø | At June 30, 2013, this security, or a portion of this security, collateralized the written put options in the table below: |
Written Put Options Outstanding at June 30, 2013
| Description (Counterparty) | Option Type | Exercise Price/ Rate | Expiration Date | Number of Contracts* | Market Value ╪ | Premiums Received | Unrealized Appreciation (Depreciation) | |||||||||||||||||
| CDX.NA.IG.20 (CSI) | Credit | 0.85 | % | 07/17/2013 | 189,450,000 | $ | 566 | $ | 379 | $ | (187 | ) | ||||||||||||
| CDX.NA.IG.20 (CSI) | Credit | 1.00 | % | 07/17/2013 | 275,130,000 | 213 | 377 | 164 | ||||||||||||||||
| $ | 779 | $ | 756 | $ | (23 | ) | ||||||||||||||||||
| * | The number of contracts does not omit 000's. Number of contracts shown in U.S. dollars unless otherwise noted. |
The accompanying notes are an integral part of these financial statements.
| 21 |
| Hartford Total Return Bond HLS Fund |
| Schedule of Investments – (continued) |
| June 30, 2013 (Unaudited) |
| (000’s Omitted) |
Credit Default Swap Contracts Outstanding at June 30, 2013
| Reference Entity | Counterparty | Notional Amount (a) | (Pay)/Receive Fixed Rate | Expiration Date | Upfront Premiums Paid/ (Received) | Market Value ╪ | Unrealized Appreciation/ (Depreciation) | |||||||||||||||||||
| Credit default swaps on traded indices: | ||||||||||||||||||||||||||
| Buy protection: | ||||||||||||||||||||||||||
| ABX.HE.AA.06 | BCLY | $ | 5,878 | (0.32 | )% | 07/25/45 | $ | 2,193 | $ | 1,761 | $ | (432 | ) | |||||||||||||
| ABX.HE.AAA.06 | BCLY | 12,488 | (0.18 | )% | 07/25/45 | 1,306 | 445 | (861 | ) | |||||||||||||||||
| ABX.HE.AAA.06 | BOA | 6,262 | (0.18 | )% | 07/25/45 | 340 | 223 | (117 | ) | |||||||||||||||||
| ABX.HE.AAA.06 | GSC | 3,542 | (0.18 | )% | 07/25/45 | 290 | 126 | (164 | ) | |||||||||||||||||
| ABX.HE.AAA.06 | JPM | 1,675 | (0.18 | )% | 07/25/45 | 63 | 60 | (3 | ) | |||||||||||||||||
| ABX.HE.AAA.06 | JPM | 671 | (0.18 | )% | 07/25/45 | 24 | 24 | – | ||||||||||||||||||
| ABX.HE.AAA.06 | MSC | 4,740 | (0.18 | )% | 07/25/45 | 388 | 169 | (219 | ) | |||||||||||||||||
| ABX.HE.PENAAA.06 | BCLY | 1,418 | (0.11 | )% | 05/25/46 | 232 | 303 | 71 | ||||||||||||||||||
| ABX.HE.PENAAA.06 | BOA | 2,802 | (0.11 | )% | 05/25/46 | 638 | 599 | (39 | ) | |||||||||||||||||
| ABX.HE.PENAAA.06 | GSC | 2,638 | (0.11 | )% | 05/25/46 | 660 | 564 | (96 | ) | |||||||||||||||||
| ABX.HE.PENAAA.06 | JPM | 211 | (0.11 | )% | 05/25/46 | 38 | 45 | 7 | ||||||||||||||||||
| ABX.HE.PENAAA.06 | JPM | 4,881 | (0.11 | )% | 05/25/46 | 1,192 | 1,044 | (148 | ) | |||||||||||||||||
| ABX.HE.PENAAA.06 | MSC | 1,171 | (0.11 | )% | 05/25/46 | 208 | 250 | 42 | ||||||||||||||||||
| ABX.HE.PENAAA.06 | MSC | 3,323 | (0.11 | )% | 05/25/46 | 806 | 710 | (96 | ) | |||||||||||||||||
| ABX.HE.PENAAA.07 | BCLY | 225 | (0.09 | )% | 08/25/37 | 74 | 82 | 8 | ||||||||||||||||||
| ABX.HE.PENAAA.07 | JPM | 272 | (0.09 | )% | 08/25/37 | 94 | 99 | 5 | ||||||||||||||||||
| ABX.HE.PENAAA.07 | JPM | 5,363 | (0.09 | )% | 08/25/37 | 2,206 | 1,956 | (250 | ) | |||||||||||||||||
| CDX.NA.HY.20 | BOA | 22,100 | (5.00 | )% | 06/20/18 | (1,271 | ) | (669 | ) | 602 | ||||||||||||||||
| CDX.NA.HY.20 | CSI | 64,120 | (5.00 | )% | 06/20/18 | (3,691 | ) | (1,941 | ) | 1,750 | ||||||||||||||||
| CDX.NA.HY.20 | GSC | 59,040 | (5.00 | )% | 06/20/18 | (1,937 | ) | (1,787 | ) | 150 | ||||||||||||||||
| CDX.NA.HY.20 | JPM | 29,415 | (5.00 | )% | 06/20/18 | (1,107 | ) | (890 | ) | 217 | ||||||||||||||||
| CDX.NA.HY.20 | MSC | 25,160 | (5.00 | )% | 06/20/18 | (636 | ) | (762 | ) | (126 | ) | |||||||||||||||
| CDX.NA.HY.20 | MSC | 18,555 | (5.00 | )% | 06/20/18 | (767 | ) | (562 | ) | 205 | ||||||||||||||||
| CDX.NA.IG.20 | CSI | 138,140 | (1.00 | )% | 06/20/18 | (953 | ) | (849 | ) | 104 | ||||||||||||||||
| CDX.NA.IG.20 | GSC | 38,715 | (1.00 | )% | 06/20/18 | (325 | ) | (238 | ) | 87 | ||||||||||||||||
| CDX.NA.IG.20 | MSC | 134,125 | (1.00 | )% | 06/20/18 | (1,467 | ) | (824 | ) | 643 | ||||||||||||||||
| CMBX.NA.A.1 | BOA | 2,910 | (0.35 | )% | 10/12/52 | 928 | 1,186 | 258 | ||||||||||||||||||
| CMBX.NA.A.1 | DEUT | 5,450 | (0.35 | )% | 10/12/52 | 2,518 | 2,221 | (297 | ) | |||||||||||||||||
| CMBX.NA.A.1 | GSC | 2,510 | (0.35 | )% | 10/12/52 | 1,136 | 1,023 | (113 | ) | |||||||||||||||||
| CMBX.NA.A.1 | MSC | 1,025 | (0.35 | )% | 10/12/52 | 425 | 418 | (7 | ) | |||||||||||||||||
| CMBX.NA.AA.1 | CSI | 6,640 | (0.25 | )% | 10/12/52 | 1,519 | 1,415 | (104 | ) | |||||||||||||||||
| CMBX.NA.AA.1 | DEUT | 6,550 | (0.25 | )% | 10/12/52 | 1,384 | 1,396 | 12 | ||||||||||||||||||
| CMBX.NA.AA.1 | UBS | 17,925 | (0.25 | )% | 10/12/52 | 4,066 | 3,820 | (246 | ) | |||||||||||||||||
| CMBX.NA.AA.2 | BOA | 425 | (0.15 | )% | 03/15/49 | 165 | 163 | (2 | ) | |||||||||||||||||
| CMBX.NA.AA.2 | BOA | 7,960 | (0.15 | )% | 03/15/49 | 3,025 | 3,050 | 25 | ||||||||||||||||||
| CMBX.NA.AA.2 | GSC | 815 | (0.15 | )% | 03/15/49 | 321 | 312 | (9 | ) | |||||||||||||||||
| CMBX.NA.AA.2 | JPM | 1,025 | (0.15 | )% | 03/15/49 | 387 | 393 | 6 | ||||||||||||||||||
| CMBX.NA.AA.2 | MSC | 2,670 | (0.15 | )% | 03/15/49 | 1,060 | 1,023 | (37 | ) | |||||||||||||||||
| CMBX.NA.AJ.1 | DEUT | 1,430 | (0.84 | )% | 10/12/52 | 100 | 117 | 17 | ||||||||||||||||||
| CMBX.NA.AJ.1 | JPM | 510 | (0.84 | )% | 10/12/52 | 36 | 42 | 6 | ||||||||||||||||||
| CMBX.NA.AJ.1 | MSC | 2,550 | (0.84 | )% | 10/12/52 | 179 | 208 | 29 | ||||||||||||||||||
| CMBX.NA.AJ.4 | MSC | 4,210 | (0.96 | )% | 02/17/51 | 1,647 | 1,259 | (388 | ) | |||||||||||||||||
| CMBX.NA.AM.2 | CSI | 7,960 | (0.50 | )% | 03/15/49 | 487 | 527 | 40 | ||||||||||||||||||
| CMBX.NA.AM.2 | DEUT | 7,960 | (0.50 | )% | 03/15/49 | 457 | 527 | 70 | ||||||||||||||||||
| CMBX.NA.AM.2 | MSC | 2,050 | (0.50 | )% | 03/15/49 | 101 | 136 | 35 | ||||||||||||||||||
| CMBX.NA.AM.3 | CSI | 7,460 | (0.50 | )% | 12/13/49 | 746 | 832 | 86 | ||||||||||||||||||
| CMBX.NA.AM.3 | MSC | 960 | (0.50 | )% | 12/13/49 | 87 | 107 | 20 | ||||||||||||||||||
| CMBX.NA.AM.4 | BOA | 1,910 | (0.50 | )% | 02/17/51 | 229 | 229 | – | ||||||||||||||||||
| CMBX.NA.AM.4 | GSC | 1,845 | (0.50 | )% | 02/17/51 | 231 | 231 | – | ||||||||||||||||||
| CMBX.NA.AM.4 | MSC | 960 | (0.50 | )% | 02/17/51 | 97 | 116 | 19 | ||||||||||||||||||
| CMBX.NA.AM.4 | MSC | 7,460 | (0.50 | )% | 02/17/51 | 1,672 | 897 | (775 | ) | |||||||||||||||||
| ITRX.XOV.19 | DEUT | EUR | 9,035 | (5.00 | )% | 06/20/18 | (572 | ) | (109 | ) | 463 | |||||||||||||||
| ITRX.XOV.19 | GSC | EUR | 8,325 | (5.00 | )% | 06/20/18 | (397 | ) | (102 | ) | 295 | |||||||||||||||
| ITRX.XOV.19 | GSC | EUR | 5,220 | (5.00 | )% | 06/20/18 | (28 | ) | (63 | ) | (35 | ) | ||||||||||||||
| ITRX.XOV.19 | MSC | EUR | 25,375 | (5.00 | )% | 06/20/18 | $ | (593 | ) | $ | (309 | ) | $ | 284 | ||||||||||||
The accompanying notes are an integral part of these financial statements.
| 22 |
Credit Default Swap Contracts Outstanding at June 30, 2013 - (continued)
| Reference Entity | Counterparty | Notional Amount (a) | (Pay)/Receive Fixed Rate | Expiration Date | Upfront Premiums Paid/ (Received) | Market Value ╪ | Unrealized Appreciation/ (Depreciation) | |||||||||||||||||||
| Credit default swaps on traded indices: - (continued) | ||||||||||||||||||||||||||
| Buy protection: - (continued) | ||||||||||||||||||||||||||
| Total | $ | 20,011 | $ | 21,003 | $ | 992 | ||||||||||||||||||||
| Sell protection: | ||||||||||||||||||||||||||
| ABX.HE.AAA.06 | CSI | $ | 2,258 | 0.11 | % | 05/25/46 | $ | (734 | ) | $ | (666 | ) | $ | 68 | ||||||||||||
| ABX.HE.AAA.06 | JPM | 582 | 0.11 | % | 05/25/46 | (171 | ) | (172 | ) | (1 | ) | |||||||||||||||
| ABX.HE.AAA.06 | JPM | 2,258 | 0.11 | % | 05/25/46 | (732 | ) | (666 | ) | 66 | ||||||||||||||||
| CDX.EM.19 | DEUT | 81,090 | 5.00 | % | 06/20/18 | 10,557 | 6,466 | (4,091 | ) | |||||||||||||||||
| CDX.EM.19 | GSC | 5,135 | 5.00 | % | 06/20/18 | 667 | 409 | (258 | ) | |||||||||||||||||
| CDX.NA.IG.20 | CSI | 17,175 | 1.00 | % | 06/20/18 | 166 | 106 | (60 | ) | |||||||||||||||||
| CDX.NA.IG.20 | CSI | 74,740 | 1.00 | % | 06/20/18 | 342 | 459 | 117 | ||||||||||||||||||
| CMBX.NA. BBB-.6 | CSI | 5,240 | 3.00 | % | 05/11/63 | (366 | ) | (525 | ) | (159 | ) | |||||||||||||||
| CMBX.NA.AA.4 | MSC | 12,575 | 1.65 | % | 02/17/51 | (7,903 | ) | (7,762 | ) | 141 | ||||||||||||||||
| CMBX.NA.AAA.3 | JPM | 830 | 0.08 | % | 12/13/49 | (22 | ) | (34 | ) | (12 | ) | |||||||||||||||
| CMBX.NA.AAA.3 | JPM | 6,400 | 0.08 | % | 12/13/49 | (368 | ) | (266 | ) | 102 | ||||||||||||||||
| CMBX.NA.AAA.6 | BOA | 3,805 | 0.50 | % | 05/11/63 | (130 | ) | (213 | ) | (83 | ) | |||||||||||||||
| CMBX.NA.AAA.6 | CSI | 40,600 | 0.50 | % | 05/11/63 | (1,078 | ) | (2,276 | ) | (1,198 | ) | |||||||||||||||
| CMBX.NA.AAA.6 | DEUT | 12,125 | 0.50 | % | 05/11/63 | (296 | ) | (680 | ) | (384 | ) | |||||||||||||||
| CMBX.NA.AAA.6 | JPM | 3,475 | 0.50 | % | 05/11/63 | (115 | ) | (195 | ) | (80 | ) | |||||||||||||||
| CMBX.NA.AAA.6 | UBS | 26,840 | 0.50 | % | 05/11/63 | (676 | ) | (1,505 | ) | (829 | ) | |||||||||||||||
| CMBX.NA.AJ.3 | CSI | 6,170 | 1.47 | % | 12/13/49 | (1,935 | ) | (1,794 | ) | 141 | ||||||||||||||||
| CMBX.NA.AJ.3 | MSC | 1,290 | 1.47 | % | 12/13/49 | (403 | ) | (375 | ) | 28 | ||||||||||||||||
| CMBX.NA.AJ.3 | MSC | 1,685 | 1.47 | % | 12/13/49 | (489 | ) | (490 | ) | (1 | ) | |||||||||||||||
| CMBX.NA.AJ.3 | UBS | 5,475 | 1.47 | % | 12/13/49 | (2,154 | ) | (1,592 | ) | 562 | ||||||||||||||||
| CMBX.NA.BB. 6 | UBS | 1,980 | 5.00 | % | 05/11/63 | (83 | ) | (190 | ) | (107 | ) | |||||||||||||||
| CMBX.NA.BB.6 | CSI | 4,655 | 5.00 | % | 05/11/63 | (211 | ) | (446 | ) | (235 | ) | |||||||||||||||
| CMBX.NA.BB.6 | MSC | 2,335 | 5.00 | % | 05/11/63 | (150 | ) | (224 | ) | (74 | ) | |||||||||||||||
| CMBX.NA.BB.6 | UBS | 3,520 | 5.00 | % | 05/11/63 | 85 | (338 | ) | (423 | ) | ||||||||||||||||
| CMBX.NA.BBB-.6 | BCLY | 1,880 | 3.00 | % | 05/11/63 | (56 | ) | (188 | ) | (132 | ) | |||||||||||||||
| CMBX.NA.BBB-.6 | CSI | 6,715 | 3.00 | % | 05/11/63 | 18 | (673 | ) | (691 | ) | ||||||||||||||||
| CMBX.NA.BBB-.6 | DEUT | 5,031 | 3.00 | % | 05/11/63 | (144 | ) | (504 | ) | (360 | ) | |||||||||||||||
| CMBX.NA.BBB-.6 | MSC | 1,745 | 3.00 | % | 05/11/63 | (100 | ) | (175 | ) | (75 | ) | |||||||||||||||
| PrimeX.ARM.1 | MSC | 2,895 | 4.42 | % | 06/25/36 | 84 | 293 | 209 | ||||||||||||||||||
| PrimeX.ARM.1 | MSC | 255 | 4.42 | % | 06/25/36 | 27 | 26 | (1 | ) | |||||||||||||||||
| PrimeX.ARM.2 | MSC | 8,926 | 4.58 | % | 06/25/36 | (655 | ) | 257 | 912 | |||||||||||||||||
| PrimeX.ARM.2 | MSC | 1,164 | 4.58 | % | 12/25/37 | 38 | 33 | (5 | ) | |||||||||||||||||
| Total | $ | (6,987 | ) | $ | (13,900 | ) | $ | (6,913 | ) | |||||||||||||||||
| Total traded indices | $ | 13,024 | $ | 7,103 | $ | (5,921 | ) | |||||||||||||||||||
| (a) | The maximum potential amount the Fund could be required to pay as a seller of credit protection or receive as a buyer of credit protection if a credit event occurs as defined under the terms of that particular swap agreement. Notional shown in U.S. dollars unless otherwise noted. |
Interest Rate Swap Contracts Outstanding at June 30, 2013
| Counterparty | Payments made by Fund | Payments received by Fund | Notional Amount * | Expiration Date | Upfront Premiums Paid/ (Received) | Market Value ╪ | Unrealized Appreciation/ (Depreciation) | |||||||||||||||
| DEUT | 3M LIBOR | 2.82% Fixed | $ | 3,250 | 04/17/43 | $ | – | $ | (402 | ) | $ | (402 | ) | |||||||||
| GSC | 1.73% Fixed | 6M EURIBOR | EUR | 41,700 | 01/09/23 | – | 1,132 | 1,132 | ||||||||||||||
| JPM | 3M STIBOR | 2.16% Fixed | SEK | 447,800 | 01/09/23 | – | (3,106 | ) | (3,106 | ) | ||||||||||||
| $ | – | $ | (2,376 | ) | $ | (2,376 | ) | |||||||||||||||
| * | Notional shown in U.S. dollars unless otherwise noted. |
The accompanying notes are an integral part of these financial statements.
| 23 |
| Hartford Total Return Bond HLS Fund |
| Schedule of Investments – (continued) |
| June 30, 2013 (Unaudited) |
| (000’s Omitted) |
Spreadlock Swap Contracts Outstanding at June 30, 2013
| Counterparty | Strike | Notional Amount | Determination Date | Upfront Premiums Paid/ (Received) | Market Value ╪ | Unrealized Appreciation/ (Depreciation) | ||||||||||||||
| JPM | 80.0 bps Fixed* | $ | 319,000 | 09/20/13 | $ | – | $ | 683 | $ | 683 | ||||||||||
| * | This is a spreadlock swap between the 10-Year constant maturity swap curve ("CMS") and the yield to maturity on a 30-Year FNMA. If the yield to maturity on the 30-Year FNMA minus the 10-Year CMS rate is greater than 0.80%, the Fund will receive money from the counterparty based on this differential. If the yield to maturity on the 30-Year FNMA minus the 10-Year CMS rate is less than 0.80%, the Fund will pay the counterparty. |
Foreign Currency Contracts Outstanding at June 30, 2013
| Currency | Buy / Sell | Delivery Date | Counterparty | Contract Amount | Market Value ╪ | Unrealized Appreciation/ (Depreciation) | ||||||||||||||
| BRL | Buy | 08/02/2013 | GSC | $ | 4,902 | $ | 4,419 | $ | (483 | ) | ||||||||||
| BRL | Buy | 08/02/2013 | UBS | 4,808 | 4,419 | (389 | ) | |||||||||||||
| EUR | Buy | 07/01/2013 | JPM | 10 | 10 | – | ||||||||||||||
| GBP | Buy | 07/01/2013 | JPM | 30 | 30 | – | ||||||||||||||
| JPY | Buy | 07/01/2013 | JPM | 12 | 12 | – | ||||||||||||||
| $ | (872 | ) | ||||||||||||||||||
Securities Sold Short Outstanding at June 30, 2013
| Description | Principal Amount | Maturity Date | Market Value ╪ | Unrealized Appreciation/ Depreciation | ||||||||||
| FHLMC TBA, 5.50% | $ | 49,800 | 08/15/2039 | $ | 53,566 | $ | (160 | ) | ||||||
| FNMA TBA, 4.00% | 59,000 | 07/15/2043 | 61,464 | 763 | ||||||||||
| FNMA TBA, 5.00% | 58,000 | 07/15/2041 | 62,418 | (77 | ) | |||||||||
| FNMA TBA, 5.50% | 28,400 | 07/15/2043 | 30,845 | (111 | ) | |||||||||
| GNMA TBA, 3.00% | 108,200 | 07/15/2042 | 107,000 | 3,342 | ||||||||||
| GNMA TBA, 3.50% | 207,800 | 07/15/2043 | 213,157 | 4,368 | ||||||||||
| GNMA TBA, 4.00% | 21,900 | 07/15/2043 | 22,954 | 296 | ||||||||||
| GNMA TBA, 4.50% | 37,400 | 07/15/2043 | 39,870 | 143 | ||||||||||
| $ | 591,274 | $ | 8,564 | |||||||||||
At June 30, 2013, the aggregate value of these securities represents 16.1% of total net assets.
| ╪ | See Significant Accounting Policies of accompanying Notes to Financial Statements regarding valuation of securities. |
The accompanying notes are an integral part of these financial statements.
| 24 |
| GLOSSARY: (abbreviations used in preceding Schedule of Investments) | |
| Counterparty Abbreviations: | |
| BCLY | Barclays |
| BOA | Banc of America Securities LLC |
| CSI | Credit Suisse International |
| DEUT | Deutsche Bank Securities, Inc. |
| GSC | Goldman Sachs & Co. |
| JPM | JP Morgan Chase & Co. |
| MSC | Morgan Stanley |
| UBS | UBS AG |
| Currency Abbreviations: | |
| BRL | Brazilian Real |
| EUR | EURO |
| GBP | British Pound |
| JPY | Japanese Yen |
| SEK | Swedish Krona |
| Index Abbreviations: | |
| ABX.HE | Markit Asset Backed Security Home Equity |
| ABX.HE.PEN | Markit Asset Backed Security Home Equity Penultimate |
| CDX.EM | Credit Derivatives Emerging Markets |
| CDX.NA.HY | Credit Derivatives North American High Yield |
| CDX.NA.IG | Credit Derivatives North American Investment Grade |
| CMBX.NA | Markit Commercial Mortgage Backed North American |
| ITRX.XOV | Markit iTraxx Index - Europe Crossover |
| PrimeX.ARM | Markit PrimeX Mortgage Backed Security |
| Municipal Bond Abbreviations: | |
| GO | General Obligation |
| Rev | Revenue |
| Other Abbreviations: | |
| EURIBOR | Euro Interbank Offered Rate |
| FHLB | Federal Home Loan Bank |
| FHLMC | Federal Home Loan Mortgage Corp. |
| FNMA | Federal National Mortgage Association |
| GNMA | Government National Mortgage Association |
| LIBOR | London Interbank Offered Rate |
| STIBOR | Stockholm Interbank Offer Rate |
The accompanying notes are an integral part of these financial statements.
| 25 |
| Hartford Total Return Bond HLS Fund |
| Investment Valuation Hierarchy Level Summary |
| June 30, 2013 (Unaudited) |
| (000’s Omitted) |
| Total | Level 1 ♦ | Level 2 ♦ | Level 3 | |||||||||||||
| Assets: | ||||||||||||||||
| Asset & Commercial Mortgage Backed Securities | $ | 602,846 | $ | – | $ | 520,477 | $ | 82,369 | ||||||||
| Corporate Bonds | 1,177,430 | – | 1,170,417 | 7,013 | ||||||||||||
| Foreign Government Obligations | 13,692 | – | 13,692 | – | ||||||||||||
| Municipal Bonds | 40,757 | – | 40,757 | – | ||||||||||||
| Preferred Stocks | 5,322 | 3,391 | 1,931 | – | ||||||||||||
| Put Options Purchased | 2,085 | – | 2,085 | – | ||||||||||||
| Senior Floating Rate Interests | 171,414 | – | 171,414 | – | ||||||||||||
| U.S. Government Agencies | 2,099,495 | – | 2,099,495 | – | ||||||||||||
| U.S. Government Securities | 539,790 | 59,658 | 480,132 | – | ||||||||||||
| Short-Term Investments | 158,212 | – | 158,212 | – | ||||||||||||
| Total | $ | 4,811,043 | $ | 63,049 | $ | 4,658,612 | $ | 89,382 | ||||||||
| Credit Default Swaps * | 7,902 | – | 7,902 | – | ||||||||||||
| Foreign Currency Contracts * | – | – | – | – | ||||||||||||
| Futures * | 5,907 | 5,907 | – | – | ||||||||||||
| Interest Rate Swaps * | 1,132 | – | 1,132 | – | ||||||||||||
| Spreadlock Swaps * | 683 | – | 683 | – | ||||||||||||
| Written Options * | 536 | – | 536 | – | ||||||||||||
| Total | $ | 16,160 | $ | 5,907 | $ | 10,253 | $ | – | ||||||||
| Liabilities: | ||||||||||||||||
| Securities Sold Short | $ | 591,274 | $ | – | $ | 591,274 | $ | – | ||||||||
| Total | $ | 591,274 | $ | – | $ | 591,274 | $ | – | ||||||||
| Credit Default Swaps * | 13,823 | – | 13,823 | – | ||||||||||||
| Foreign Currency Contracts * | 872 | – | 872 | – | ||||||||||||
| Futures * | 4,920 | 4,920 | – | – | ||||||||||||
| Interest Rate Swaps * | 3,508 | – | 3,508 | – | ||||||||||||
| Written Options * | 633 | – | 633 | – | ||||||||||||
| Total | $ | 23,756 | $ | 4,920 | $ | 18,836 | $ | – | ||||||||
| ♦ | For the six-month period ended June 30, 2013, there were no transfers between Level 1 and Level 2. |
| * | Derivative instruments not reflected in the Schedule of Investments are valued at the unrealized appreciation/depreciation on the investments. |
Following is a reconciliation of Level 3 assets for which significant unobservable inputs were used to determine fair value:
| Balance as of December 31, 2012 | Realized Gain (Loss) | Change in Unrealized Appreciation (Depreciation) | Net Amortization | Purchases | Sales | Transfers Into Level 3 * | Transfers Out of Level 3 * | Balance as of June 30, 2013 | ||||||||||||||||||||||||||||
| Assets: | ||||||||||||||||||||||||||||||||||||
| Asset & Commercial Mortgage Backed Securities | $ | 90,626 | $ | 8,779 | $ | (2,169 | )† | $ | 3,906 | $ | 37,048 | $ | (41,913 | ) | $ | — | $ | (13,908 | ) | $ | 82,369 | |||||||||||||||
| Corporate Bonds | 8,928 | 81 | (419 | )‡ | (2 | ) | 41 | (1,616 | ) | — | — | 7,013 | ||||||||||||||||||||||||
| Total | $ | 99,554 | $ | 8,860 | $ | (2,588 | ) | $ | 3,904 | $ | 37,089 | $ | (43,529 | ) | $ | — | $ | (13,908 | ) | $ | 89,382 | |||||||||||||||
| * | Investments are transferred into and out of Level 3 for a variety of reasons including, but not limited to: |
1) Investments where trading has been halted (transfer into Level 3) or investments where trading has resumed (transfer out of Level 3).
2) Broker quoted investments (transfer into Level 3) or quoted prices in active markets (transfer out of Level 3).
3) Investments that have certain restrictions on trading (transfer into Level 3) or investments where trading restrictions have expired (transfer out of Level 3).
| † | Change in unrealized appreciation (depreciation) in the current period relating to assets still held at June 30, 2013 was $704. |
| ‡ | Change in unrealized appreciation (depreciation) in the current period relating to assets still held at June 30, 2013 was $(419). |
The accompanying notes are an integral part of these financial statements.
| 26 |
| Hartford Total Return Bond HLS Fund |
| Statement of Assets and Liabilities |
| June 30, 2013 (Unaudited) |
| (000’s Omitted) |
| Assets: | ||||
| Investments in securities, at market value (cost $4,812,479) | $ | 4,811,043 | ||
| Cash | 5,755 | |||
| Unrealized appreciation on foreign currency contracts | — | |||
| Unrealized appreciation on swap contracts | 9,717 | |||
| Receivables: | ||||
| Investment securities sold | 1,314,240 | |||
| Fund shares sold | 2,168 | |||
| Dividends and interest | 24,015 | |||
| Variation margin | 402 | |||
| Swap premiums paid | 45,739 | |||
| Other assets | 4 | |||
| Total assets | 6,213,083 | |||
| Liabilities: | ||||
| Unrealized depreciation on foreign currency contracts | 872 | |||
| Unrealized depreciation on swap contracts | 17,331 | |||
| Securities sold short, at market value (proceeds $599,838) | 591,274 | |||
| Payables: | ||||
| Investment securities purchased | 1,861,993 | |||
| Fund shares redeemed | 3,386 | |||
| Collateral received from broker | 19,030 | |||
| Variation margin | 371 | |||
| Investment management fees | 278 | |||
| Distribution fees | 19 | |||
| Other liabilities | 44 | |||
| Accrued expenses | 317 | |||
| Swap premiums received | 32,715 | |||
| Written options (proceeds $2,726) | 2,823 | |||
| Total liabilities | 2,530,453 | |||
| Net assets | $ | 3,682,630 | ||
| Summary of Net Assets: | ||||
| Capital stock and paid-in-capital | $ | 3,495,312 | ||
| Undistributed net investment income | 203,012 | |||
| Accumulated net realized loss | (15,211 | ) | ||
| Unrealized depreciation of investments and the translations of assets and liabilities denominated in foreign currency | (483 | ) | ||
| Net assets | $ | 3,682,630 | ||
| Shares authorized | 5,000,000 | |||
| Par value | $ | 0.001 | ||
| Class IA: Net asset value per share | $ | 11.64 | ||
| Shares outstanding | 275,211 | |||
| Net assets | $ | 3,202,431 | ||
| Class IB: Net asset value per share | $ | 11.54 | ||
| Shares outstanding | 41,614 | |||
| Net assets | $ | 480,199 |
The accompanying notes are an integral part of these financial statements.
| 27 |
| Hartford Total Return Bond HLS Fund |
| Statement of Operations |
For the Six-Month Period Ended June 30, 2013 (Unaudited) |
| (000’s Omitted) |
| Investment Income: | ||||
| Dividends | $ | 159 | ||
| Interest | 62,738 | |||
| Less: Foreign tax withheld | 1 | |||
| Total investment income, net | 62,898 | |||
| Expenses: | ||||
| Investment management fees | 9,006 | |||
| Transfer agent fees | 2 | |||
| Distribution fees - Class IB | 658 | |||
| Custodian fees | 31 | |||
| Accounting services fees | 392 | |||
| Board of Directors' fees | 54 | |||
| Audit fees | 19 | |||
| Other expenses | 383 | |||
| Total expenses (before fees paid indirectly) | 10,545 | |||
| Custodian fee offset | — | |||
| Total fees paid indirectly | — | |||
| Total expenses, net | 10,545 | |||
| Net Investment Income | 52,353 | |||
| Net Realized Gain on Investments, Other Financial Instruments and Foreign Currency Transactions: | ||||
| Net realized gain on investments | 11,545 | |||
| Net realized gain on purchased options | 1,850 | |||
| Net realized gain on securities sold short | 13,449 | |||
| Net realized gain on futures | 11,884 | |||
| Net realized loss on swap contracts | (13,268 | ) | ||
| Net realized gain on foreign currency contracts | 105 | |||
| Net realized loss on other foreign currency transactions | (96 | ) | ||
| Net Realized Gain on Investments, Other Financial Instruments and Foreign Currency Transactions | 25,469 | |||
| Net Changes in Unrealized Depreciation of Investments, Other Financial Instruments and Foreign Currency Transactions: | ||||
| Net unrealized depreciation of investments | (186,678 | ) | ||
| Net unrealized depreciation of purchased options | (542 | ) | ||
| Net unrealized appreciation of securities sold short | 9,123 | |||
| Net unrealized depreciation of futures | (1,804 | ) | ||
| Net unrealized depreciation of written options | (97 | ) | ||
| Net unrealized depreciation of swap contracts | (9,187 | ) | ||
| Net unrealized depreciation of foreign currency contracts | (1,383 | ) | ||
| Net unrealized depreciation on translation of other assets and liabilities in foreign currencies | (14 | ) | ||
| Net Changes in Unrealized Depreciation of Investments, Other Financial Instruments and Foreign Currency Transactions | (190,582 | ) | ||
| Net Loss on Investments, Other Financial Instruments and Foreign Currency Transactions | (165,113 | ) | ||
| Net Decrease in Net Assets Resulting from Operations | $ | (112,760 | ) |
The accompanying notes are an integral part of these financial statements.
| 28 |
| Hartford Total Return Bond HLS Fund |
| Statement of Changes in Net Assets |
| (000’s Omitted) |
| For the Six-Month Period Ended June 30, 2013 (Unaudited) | For the Year Ended December 31, 2012 | |||||||
| Operations: | ||||||||
| Net investment income | $ | 52,353 | $ | 127,213 | ||||
| Net realized gain on investments, other financial instruments and foreign currency transactions | 25,469 | 150,173 | ||||||
| Net unrealized appreciation (depreciation) of investments, other financial instruments and foreign currency transactions | (190,582 | ) | 32,054 | |||||
| Net Increase (Decrease) in Net Assets Resulting from Operations | (112,760 | ) | 309,440 | |||||
| Distributions to Shareholders: | ||||||||
| From net investment income | ||||||||
| Class IA | — | (149,453 | ) | |||||
| Class IB | — | (22,764 | ) | |||||
| Total distributions | — | (172,217 | ) | |||||
| Capital Share Transactions: | ||||||||
| Class IA | ||||||||
| Sold | 206,632 | 332,218 | ||||||
| Issued on reinvestment of distributions | — | 149,453 | ||||||
| Redeemed | (479,419 | ) | (745,553 | ) | ||||
| Total capital share transactions | (272,787 | ) | (263,882 | ) | ||||
| Class IB | ||||||||
| Sold | 31,403 | 85,231 | ||||||
| Issued on reinvestment of distributions | — | 22,764 | ||||||
| Redeemed | (102,011 | ) | (193,845 | ) | ||||
| Total capital share transactions | (70,608 | ) | (85,850 | ) | ||||
| Net decrease from capital share transactions | (343,395 | ) | (349,732 | ) | ||||
| Net Decrease in Net Assets | (456,155 | ) | (212,509 | ) | ||||
| Net Assets: | ||||||||
| Beginning of period | 4,138,785 | 4,351,294 | ||||||
| End of period | $ | 3,682,630 | $ | 4,138,785 | ||||
| Undistributed (distribution in excess of) net investment income | $ | 203,012 | $ | 150,659 | ||||
| Shares: | ||||||||
| Class IA | ||||||||
| Sold | 17,348 | 27,974 | ||||||
| Issued on reinvestment of distributions | — | 12,783 | ||||||
| Redeemed | (39,995 | ) | (62,562 | ) | ||||
| Total share activity | (22,647 | ) | (21,805 | ) | ||||
| Class IB | ||||||||
| Sold | 2,640 | 7,217 | ||||||
| Issued on reinvestment of distributions | — | 1,959 | ||||||
| Redeemed | (8,578 | ) | (16,407 | ) | ||||
| Total share activity | (5,938 | ) | (7,231 | ) | ||||
The accompanying notes are an integral part of these financial statements.
| 29 |
| Hartford Total Return Bond HLS Fund |
| Notes to Financial Statements |
| June 30, 2013 (Unaudited) |
| (000’s Omitted) |
| 1. | Organization: |
Hartford Total Return Bond HLS Fund (the “Fund”) serves as an underlying investment option for certain variable annuity and variable life insurance separate accounts of Hartford Life Insurance Company (“HLIC”) and its affiliates and certain qualified retirement plans. The Fund may also serve as an underlying investment option for certain variable annuity and variable life separate accounts of other insurance companies. Owners of variable annuity contracts and policyholders of variable life insurance contracts may choose the funds permitted in the variable insurance contract prospectus. In addition, participants in certain qualified retirement plans may choose the Fund if permitted by their plans.
Hartford Series Fund, Inc. (the “Company”) is an open-end registered management investment company comprised of thirty portfolios. Financial statements for the Fund, a series of the Company, are included in this report.
The Company is organized under the laws of the State of Maryland and is registered with the Securities and Exchange Commission (“SEC”) under the Investment Company Act of 1940, as amended (“1940 Act”). The Fund is a diversified open-end management investment company.
The Fund is divided into Class IA and Class IB shares. Each class is offered at the per share net asset value (“NAV”) without a sales charge and is subject to the same expenses, except that the Class IB shares are subject to distribution and service fees charged pursuant to a Distribution Plan adopted in accordance with Rule 12b-1 under the 1940 Act.
| 2. | Significant Accounting Policies: |
The following is a summary of significant accounting policies of the Fund in the preparation of its financial statements, which are in accordance with the United States Generally Accepted Accounting Principles (“U.S. GAAP”). The preparation of financial statements in accordance with U.S. GAAP may require management to make estimates and assumptions that affect the reported amounts of assets and liabilities and disclosure of contingent assets and liabilities at the date of the financial statements and the reported amounts of increases and decreases in net assets from operations during the reporting period. Actual results could differ from those estimates.
| a) | Determination of Net Asset Value – The NAV of each class of the Fund’s shares is determined as of the close of regular trading (normally 4:00 p.m. Eastern Time) (the “NYSE Close”) on each day that the New York Stock Exchange (the “Exchange”) is open (“Valuation Date”). Information that becomes known to the Fund after the NAV has been calculated on a particular day will not generally be used to retroactively adjust the NAV determined earlier that day. |
| b) | Investment Valuation and Fair Value Measurements – For purposes of calculating the NAV, portfolio investments and other assets held by the Fund's portfolio for which market quotes are readily available are valued at market value. Market value is generally determined on the basis of last reported sales prices or official close price. If no sales are reported, market value is based on quotes obtained from a quotation reporting system, established market makers, or independent pricing services. If market prices are not readily available or are deemed unreliable, the Fund will use the fair value of the investment as determined in good faith under policies and procedures established by and under the supervision of the Company’s Board of Directors. Market quotes are considered not readily available where there is an absence of current or reliable market-based data (e.g., trade information or indicative market quotes), including where events occur after the close of the relevant market, but prior to the NYSE Close that materially affect the values of the Fund’s portfolio investments or assets. In addition, market quotes are considered not readily available when, due to extraordinary circumstances, the exchanges or markets on which the investments trade do not open for trading for the entire day and no other market prices are available. In addition, prices of foreign equities that are principally traded on certain foreign markets may be adjusted daily pursuant to a fair value pricing service approved by the Board of Directors in order to reflect an adjustment for the factors occurring after the close of certain foreign markets but before the NYSE Close. Investments that are primarily traded on foreign markets may trade on days that are not business days of the Fund. The value of the foreign investments in which the Fund invests may change on days when a shareholder will not be able to purchase or redeem shares of the Fund. Fair value pricing is subjective in nature and the use of fair value pricing by the Fund may cause the NAV of its shares to differ significantly from the NAV that would have been calculated using |
| 30 |
market prices at the close of the exchange on which a portfolio investment is primarily traded. There can be no assurance that the Fund could obtain the fair market value assigned to an investment if the Fund were to sell the investment at approximately the time at which the Fund determines its NAV.
Fixed income investments (other than short term obligations) and non-exchange traded derivatives held by the Fund are normally valued on the basis of quotes obtained from brokers and dealers or independent pricing services in accordance with procedures established by the Company’s Board of Directors. Prices obtained from independent pricing services use information provided by market makers or estimates of market values through accepted market modeling and trading and pricing conventions. Inputs to the models may include, but are not limited to, prepayment speeds, pricing spread, yield, trade information, dealer quotes, market color, cash flow models and the bond’s terms and conditions. Generally, the Fund may use fair valuation in regard to fixed income investments when the Fund holds defaulted or distressed investments or investments in a company in which a reorganization is pending. Senior floating rate interests generally trade in over-the-counter (“OTC”) markets and are priced through an independent pricing service utilizing independent market quotations from loan dealers or financial institutions. A composite bid price is used, which averages the dealer marks and dealer runs. Short-term investments maturing in 60 days or less are generally valued at amortized cost, if their original term to maturity was 60 days or less, or by amortizing their value on the 61st day prior to maturity, if the original term to maturity exceeded 60 days.
Exchange traded options, futures and options on futures are valued at the settlement price determined by the relevant exchange as of the NYSE Close. In the case of OTC options and such instruments that do not trade on an exchange, values may be supplied by a pricing service using a formula or other objective method that may take into consideration the style, direction, expiration, strike price, notional value and volatility or other special adjustments.
Investments valued in currencies other than U.S. dollars are converted to U.S. dollars using exchange rates obtained from independent pricing services for calculation of the NAV. As a result, the NAV of the Fund’s shares may be affected by changes in the value of currencies in relation to the U.S. dollar. The value of investments traded in markets outside the United States or denominated in currencies other than the U.S. dollar may be affected significantly on a day that the NYSE is closed and the market value may change on days when an investor is not able to purchase, redeem or exchange shares of the Fund.
Foreign currency contracts represent agreements to exchange currencies on specific future dates at predetermined rates. Foreign currency contracts are valued using foreign currency exchange rates and forward rates as provided by an independent pricing service on the Valuation Date.
Investments in open-end mutual funds are valued at the respective NAV of each open-end mutual fund on the Valuation Date.
Financial instruments for which prices are not available from an independent pricing service may be valued using market quotations obtained from one or more dealers that make markets in the respective financial instrument in accordance with procedures established by the Company’s Board of Directors.
U.S. GAAP defines fair value as the price that the Fund would receive to sell an asset or pay to transfer a liability in an orderly transaction between market participants. The U.S. GAAP fair value measurement standards require disclosure of a fair value hierarchy for each major category of assets and liabilities. Various inputs are used in determining the fair value of the Fund’s investments. These inputs are summarized into three broad hierarchy levels. This hierarchy is based on whether the valuation inputs are observable or unobservable. These levels are:
| · | Level 1 – Quoted prices in active markets for identical investments. Level 1 may include exchange traded instruments, such as domestic equities, some foreign equities, options, futures, mutual funds, exchange traded funds, rights and warrants. |
| 31 |
| Hartford Total Return Bond HLS Fund |
| Notes to Financial Statements – (continued) |
| June 30, 2013 (Unaudited) |
| (000’s Omitted) |
| · | Level 2 – Observable inputs other than Level 1 prices, such as quoted prices for similar investments; quoted prices in markets that are not active; or other inputs that are observable or can be corroborated by observable market data. Level 2 may include debt investments that are traded less frequently than exchange traded instruments and which are valued using independent pricing services; foreign equities, which are principally traded on certain foreign markets and are adjusted daily pursuant to a fair value pricing service in order to reflect an adjustment for the factors occurring after the close of certain foreign markets but before the NYSE Close; and short-term investments, which are valued at amortized cost. |
| · | Level 3 – Significant unobservable inputs that are supported by limited or no market activity. Level 3 may include financial instruments whose values are determined using indicative market quotes or require significant management judgment or estimation. These unobservable valuation inputs may include estimates for current yields, maturity/duration, prepayment speed, and indicative market quotes for comparable investments along with other assumptions relating to credit quality, collateral value, complexity of the investment structure, general market conditions and liquidity. This category may include investments where trading has been halted or there are certain restrictions on trading. While these investments are priced using unobservable inputs, the valuation of these investments reflects the best available data and management believes the prices are a reasonable representation of exit price. For more information on specific valuation techniques and unobservable inputs, please see table below titled "Quantitative Information about Level 3 Fair Value Measurements". |
The Board of Directors of the Company generally reviews and approves the “Procedures for Valuation of Portfolio Securities” on an annual basis. These procedures define how investments are to be valued, including the formation and activities of a Valuation Committee. The Valuation Committee is responsible for determining in good faith the fair value of investments when the value cannot be obtained from primary pricing services or alternative sources or if the valuation of an investment as provided by the primary pricing service or alternative source is believed not to reflect the investment’s fair value as of the Valuation Date. Members of the Valuation Committee include the Fund’s Treasurer or designee, a Vice President of the Fund with legal expertise or designee, and a Vice President of the investment manager or designee. In addition, the Fund’s Chief Compliance Officer shall designate a member of the compliance group to attend Valuation Committee meetings as a non-voting resource, to monitor for and provide guidance with respect to compliance with these procedures. Two members of the Valuation Committee or their designees, representing different departments, shall constitute a quorum for purposes of permitting the Valuation Committee to take action. The Valuation Committee will consider all relevant factors in determining an investment’s fair value, and may seek the advice of the Fund’s sub-adviser, knowledgeable brokers, and legal counsel in making such determination. The Valuation Committee reports to the Audit Committee of the Company’s Board of Directors. The Audit Committee receives quarterly written reports which include details of all fair-valued investments, including the reason for the fair valuation, and an indication, when possible, of the accuracy of the valuation by disclosing the next available reliable public price quotation or the disposition price of such investments (the “look-back” test). The Board of Directors then must consider for ratification all of the fair value determinations made during the previous quarter.
Valuation levels are not necessarily indicative of the risk associated with investing in such investments. Individual investments within any of the above mentioned asset classes may be assigned a different hierarchical level than those presented above, as individual circumstances dictate.
For additional information, refer to the Investment Valuation Hierarchy Level Summary and the Level 3 roll-forward reconciliation, if applicable, which follow the Schedule of Investments.
For purposes of reporting transfers between different hierarchy levels, both transfers in and out of each level, as applicable, are shown as if they occurred at the beginning of the period.
| 32 |
Quantitative Information about Level 3 Fair Value Measurements:
| Security Type / Valuation Technique | Unobservable Input(1) | Range (Weighted Average(2) ) | Fair Value at June 30, 2013 | |||||
| Asset & Commercial Mortgage Backed Securities: | ||||||||
| Third party vendor | Prior day valuation | Not Applicable | $ | 1,359 | ||||
| Discounted cash flow | Internal rate of return Life expectancy (in months) | 2.1% - 8.6% (4.8%) 69-296 (187) | 77,921 | |||||
| Indicative market quotations | Broker Quote(3) | Not Applicable | 3,089 | |||||
| Corporate Bonds: | ||||||||
| Third party vendor | Prior day valuation | Not Applicable | 240 | |||||
| Indicative market quotations | Broker Quote(3) | Not Applicable | 6,773 | |||||
| Total | $ | 89,382 | ||||||
(1) Significant changes to any unobservable inputs may result in a significant change to the fair value.
(2) Unless otherwise noted, inputs were weighted based on the fair value of the investments included in the range.
(3) For investments priced using indicative market quotes, these quotes represent the best available estimate of fair value as of June 30, 2013.
| c) | Investment Transactions and Investment Income – Investment transactions are recorded as of the trade date (the date the order to buy or sell is executed) for financial reporting purposes. Investments purchased or sold on a when-issued or delayed-delivery basis may be settled a month or more after the trade date. Realized gains and losses are determined on the basis of identified cost. |
Trade date for senior floating rate interests purchased in the primary loan market is considered the date on which the loan allocations are determined. Trade date for senior floating rate interests purchased in the secondary loan market is the date on which the transaction is entered into.
Dividend income from domestic securities is accrued on the ex-dividend date. In general, dividend income from foreign securities is recorded on the ex-date; however, dividend notifications in certain foreign jurisdictions may not be available in a timely manner and as a result, the Fund will record the dividend as soon as the relevant details (i.e., rate per share, payment date, shareholders of record, etc.) are publicly available. Interest income, including amortization of premium and accretion of discounts, is accrued on a daily basis. Paydown gains and losses on mortgage-related and other asset-backed securities are included in interest income in the Statement of Operations, as applicable.
| d) | Foreign Currency Transactions – Assets and liabilities denominated in currencies other than U.S. dollars are translated into U.S. dollars at the exchange rates in effect on the valuation date. Purchases and sales of investments, income, and expenses are translated into U.S. dollars at the exchange rates on the dates of such transactions. |
The Fund does not isolate that portion of portfolio investment valuation resulting from fluctuations in the foreign currency exchange rates from the fluctuations arising from changes in the market prices of investments held. Exchange rate fluctuations are included with the net realized and unrealized gain or loss on investments in the accompanying financial statements.
Net realized foreign exchange gains or losses arise from sales of foreign currencies and the difference between asset and liability amounts initially stated in foreign currencies and the U.S. dollar value of the amounts actually received or paid. Net unrealized foreign exchange gains or losses arise from changes in the value of other assets and liabilities at the end of the reporting period, resulting from changes in the exchange rates.
| e) | Joint Trading Account – The Fund may invest cash balances into a joint trading account that may be invested in one or more repurchase agreements. |
| 33 |
| Hartford Total Return Bond HLS Fund |
| Notes to Financial Statements – (continued) |
| June 30, 2013 (Unaudited) |
| (000’s Omitted) |
| f) | Fund Share Valuation and Dividend Distributions to Shareholders – Orders for the Fund’s shares are executed in accordance with the investment instructions of the contract holders and plan participants. The NAV of the Fund’s shares is determined as of the close of business on each business day of the Exchange. The NAV is determined separately for each class of shares of the Fund by dividing the Fund’s net assets attributable to that class by the number of shares of the class outstanding. Each class of shares offered by the Fund has equal rights as to assets and voting privileges (except that shareholders of a class have exclusive voting rights regarding any matter relating solely to that class of shares). Income and non-class specific expenses are allocated daily to each class on the basis of the relative net assets of the class. Realized and unrealized capital gains and losses are allocated daily based on the relative net assets of each class of shares of the Fund. |
Orders for the purchase of the Fund’s shares received prior to the close of the Exchange on any day the Exchange is open for business are priced at the NAV determined as of the close of the Exchange. Orders received after the close of the Exchange, or on a day on which the Exchange and/or the Fund is not open for business, are priced at the next determined NAV.
Dividends are declared pursuant to a policy adopted by the Company’s Board of Directors based upon the investment performance of the Fund. The policy of the Fund is to pay dividends from net investment income and realized capital gains, if any, at least once a year.
Distributions from net investment income, net realized capital gains and capital are determined in accordance with federal income tax regulations, which may differ from U.S. GAAP with respect to character and timing. These differences may include but are not limited to losses deferred due to wash sale adjustments, foreign currency gains and losses, adjustments related to Passive Foreign Investment Companies (“PFICs”), Real Estate Investment Trusts (“REITs”), Regulated Investment Companies (“RICs”), certain derivatives and partnerships. Permanent book and federal income tax basis differences relating to shareholder distributions will result in reclassifications to certain of the Fund’s capital accounts (see Federal Income Taxes: Reclassification of Capital Accounts note).
| 3. | Securities and Other Investments: |
| a) | Repurchase Agreements – A repurchase agreement is an agreement by which a counterparty agrees to sell an investment and agrees to repurchase the investment sold from the buyer at a mutually agreed upon time and price. During the period of the repurchase agreement, the counterparty will deposit cash and or securities in a third party custodial account to serve as collateral. At the time the Fund enters into a repurchase agreement, the value of the underlying collateral, including accrued interest, will be equal to or exceed the value of the repurchase agreement. Repurchase agreements expose the Fund to counterparty risk - that is, the risk that the counterparty will not fulfill its obligations. To minimize counterparty risk, the investments that serve to collateralize the repurchase agreement are held by the Fund’s custodian in book entry or physical form in the custodial account of the Fund or in a third party custodial account. Repurchase agreements are valued at cost plus accrued interest, which approximates fair value. Repurchase agreements have master netting agreements which allow the Fund to offset amounts owed to a counterparty with amounts owed by the counterparty, including any collateral. The Fund, as shown on the Schedule of Investments, had outstanding repurchase agreements as of June 30, 2013. |
| b) | Illiquid and Restricted Investments – The Fund is permitted to invest up to 15% of its net assets in illiquid investments. Illiquid investments are those that may not be sold or disposed of in the ordinary course of business within seven days, at approximately the price used to determine the Fund’s NAV. The Fund may not be able to sell illiquid investments when its sub-adviser considers it desirable to do so or may have to sell such investments at a price that is lower than the price that could be obtained if the investments were more liquid. A sale of illiquid investments may require more time and may result in higher dealer discounts and other selling expenses than does the sale of those that are liquid. Illiquid investments also may be more difficult to value due to the unavailability of reliable market quotations for such investments, and an investment in them may have an adverse impact on the Fund’s NAV. The Fund may also purchase certain restricted investments that can only be resold to certain qualified investors and may be determined to be liquid |
| 34 |
pursuant to policies and guidelines established by the Company’s Board of Directors. The Fund, as shown on the Schedule of Investments, had illiquid and/or restricted investments as of June 30, 2013.
| c) | Investments Purchased on a When-Issued or Delayed-Delivery Basis – Delivery and payment for investments that have been purchased by the Fund on a forward commitment, or when-issued or delayed-delivery basis, take place beyond the customary settlement period. A fund may dispose of or renegotiate a delayed-delivery transaction after it is entered into, and may sell delayed-delivery investments before they are delivered, which may result in a realized gain or loss. During this period, such investments are subject to market fluctuations, and the Fund identifies investments segregated in its records with a value at least equal to the amount of the commitment. The Fund, as shown on the Schedule of Investments, had when-issued or delayed-delivery investments as of June 30, 2013. |
In connection with the Fund’s ability to purchase investments on a when-issued or forward commitment basis, the Fund may enter into to-be announced (“TBA”) commitments. TBA commitments are forward agreements for the purchase or sale of mortgage-backed securities for a fixed price, with payment and delivery on an agreed-upon future settlement date. The specific securities to be delivered are not identified at the trade date; however, delivered securities must meet specified terms, including issuer, rate and mortgage terms. Although the Fund may enter into TBA commitments with the intention of acquiring or delivering securities for its portfolio, the Fund can extend the settlement date, roll the transaction, or dispose of a commitment prior to settlement if deemed appropriate to do so. If the TBA commitment is closed through the acquisition of an offsetting TBA commitment, the Fund realizes a gain or loss. In a TBA roll transaction, the Fund generally purchases or sells the initial TBA commitment prior to the agreed upon settlement date and enters into a new TBA commitment for future delivery or receipt of the mortgage-backed securities. TBA commitments involve a risk of loss if the value of the security to be purchased or sold declines or increases, respectively, prior to settlement date.
The Fund may enter into “dollar rolls” in which the Fund sells securities and contracts with the same counterparty to repurchase substantially similar securities (for example, same issuer, coupon and maturity) on a specified future date at an agreed upon price. The Fund gives up the right to receive interest paid on the investments sold. The Fund would benefit to the extent of any differences between the price received for the security and the lower forward price for the future purchase. Dollar rolls involve the risk that the market value of the securities that the Fund is required to purchase may decline below the agreed upon repurchase price of those securities. The Fund records dollar roll transactions as purchases and sales and realizes gains and losses on these transactions. These transactions are excluded from the Fund’s portfolio turnover rate. The Fund had open dollar roll transactions as of June 30, 2013.
| d) | Senior Floating Rate Interests – The Fund, as shown on the Schedule of Investments, invests in senior floating rate interests. Senior floating rate interests hold the most senior position in the capital structure of a business entity (the “Borrower”), are typically secured by specific collateral and have a claim on the assets and/or stock of the Borrower that is senior to that held by subordinated debtholders and stockholders of the Borrower. Senior floating rate interests are typically structured and administered by a financial institution that acts as the agent of the lenders participating in the senior floating rate interest. The Fund may invest in multiple series or tranches of a senior floating rate interest, which may have varying terms and carry different associated risks. The Fund may also enter into unfunded loan commitments, which are contractual obligations for future funding. Unfunded loan commitments may include revolving credit facilities, which may obligate the Fund to supply additional cash to the borrower on demand. Unfunded loan commitments represent a future obligation in full. The Fund may receive a commitment fee based on the undrawn portion of the underlying line of credit portion of a senior floating rate interest. In certain circumstances, the Fund may receive various fees upon the restructure of a senior floating rate interest by a borrower. Fees earned/paid may be recorded as a component of income or realized gain/loss in the Statement of Operations. |
Senior floating rate interests are typically rated below-investment-grade, which suggests they are more likely to default and generally pay higher interest rates than investment-grade loans. A default could lead to non-payment of income, which would result in a reduction of income to the Fund, and there can be no assurance that the liquidation of any
| 35 |
| Hartford Total Return Bond HLS Fund |
| Notes to Financial Statements – (continued) |
| June 30, 2013 (Unaudited) |
| (000’s Omitted) |
collateral would satisfy the Borrower’s obligation in the event of non-payment of scheduled interest or principal payments, or that such collateral could be readily liquidated.
| e) | Mortgage Related and Other Asset Backed Securities – The Fund may invest in mortgage related and other asset backed securities. These securities include mortgage pass-through securities, collateralized mortgage obligations, commercial mortgage backed securities, stripped mortgage backed securities, asset backed securities, collateralized debt obligations and other securities that directly or indirectly represent a participation in, or are secured by and payable from, mortgage loans on real property. Mortgage related securities are created from pools of residential or commercial mortgage loans, including mortgage loans made by savings and loan institutions, mortgage bankers, commercial banks and others. Asset backed securities are created from many types of assets, including auto loans, credit card receivables, home equity loans, and student loans. These securities provide a monthly payment that consists of both interest and principal payments. Interest payments may be determined by fixed or adjustable rates. The rate of pre-payments on underlying mortgages will affect the price and volatility of a mortgage related security, and may have the effect of shortening or extending the effective duration of the security relative to what was anticipated at the time of purchase. The timely payment of principal and interest of certain mortgage related securities is guaranteed by the full faith and credit of the United States Government. Mortgage related and other asset backed securities created and guaranteed by non-governmental issuers, including government-sponsored corporations, may be supported by various forms of insurance or guarantees, but there can be no assurance that the private insurers or guarantors can meet their obligations under the insurance policies or guarantee arrangements. The Fund, as shown on the Schedule of Investments, had mortgage related and other asset backed securities as of June 30, 2013. |
| 4. | Financial Derivative Instruments: |
The following disclosures contain information on how and why the Fund uses derivative instruments, the credit-risk-related contingent features in certain derivative instruments, and how derivative instruments affect the Fund’s financial position and results of operations. The location and fair value amounts of these instruments on the Statement of Assets and Liabilities and the realized gains and losses and changes in unrealized gains and losses on the Statement of Operations, each categorized by type of derivative contract, are included in the following Additional Derivative Instrument Information footnote. The derivative instruments outstanding as of period-end are disclosed in the notes to or within the Schedule of Investments for purchased options, if applicable. The amounts of realized gains and losses and changes in unrealized gains and losses on derivative instruments during the period are disclosed in the Statement of Operations.
| a) | Foreign Currency Contracts – The Fund may enter into foreign currency contracts that obligate the Fund to purchase or sell currencies at specified future dates. Foreign currency contracts are used to hedge the currency exposure associated with some or all of the Fund’s investments and/or as part of an investment strategy. Foreign currency contracts are marked to market daily and the change in value is recorded by the Fund as an unrealized gain or loss. The Fund will record a realized gain or loss when the foreign currency contract is settled. |
Foreign currency contracts involve elements of market risk in excess of the amounts reflected in the Statement of Assets and Liabilities. In addition, risks may arise upon entering into these contracts from the potential inability of the counterparties to meet the terms of the contracts and from unanticipated movements in the value of the foreign currencies relative to the U.S. dollar. The Fund had outstanding foreign currency contracts as shown on the Schedule of Investments as of June 30, 2013.
| b) | Futures Contracts – The Fund may enter into futures contracts. A futures contract is an agreement between two parties to buy or sell an asset at a set price on a future date. The Fund uses futures contracts to manage or obtain exposure to the investment markets, commodities, or movements in interest rates and currency values. The primary risks associated with the use of futures contracts are the imperfect correlation between the change in market value of the investments held by the Fund and the prices of futures contracts and the possibility of an illiquid market. Upon entering into a futures contract, the Fund is required to deposit with a futures commission merchant (“FCM”) an amount of cash or U.S. Government or Agency Obligations in accordance with the initial margin requirements of the broker or exchange. |
| 36 |
Futures contracts are marked to market daily at the most recent settlement price reported by an exchange on which, over time, they are traded most extensively, and an appropriate payable or receivable for the change in value (“variation margin”) is recorded by the Fund. Gains or losses are recognized but not considered realized until the contracts expire or are closed. Futures contracts involve, to varying degrees, risk of loss in excess of the variation margin disclosed on the Statement of Assets and Liabilities; however, the Fund seeks to reduce this risk through the use of an FCM. The Fund, as shown on the Schedule of Investments, had outstanding futures contracts as of June 30, 2013.
| c) | Options Contracts – An option contract is a contract sold by one party to another party that offers the buyer the right, but not the obligation, to buy (call) or sell (put) an investment or other financial asset at an agreed-upon price during a specific period of time or on a specific date. The Fund may write (sell) covered call and put options on futures, swaps (“swaptions”), securities, commodities or currencies. “Covered” means that so long as the Fund is obligated as the writer of an option, it will own either the underlying investments or currency or an option to purchase the same underlying investments or currency having an expiration date of the covered option and an exercise price equal to or less than the exercise price of the covered option, or will pledge cash or other liquid investments having a value equal to or greater than the fluctuating market value of the option investment or currency. Writing put options increases the Fund’s exposure to the underlying instrument. Writing call options decreases the Fund’s exposure to the underlying instrument. Premiums received from writing options that expire are treated as realized gains. Premiums received from writing options that are exercised or closed are added to the proceeds or offset amounts paid on the underlying futures, swap, investment or currency transaction to determine the realized gain or loss. The Fund as a writer of an option has no control over whether the underlying instrument may be sold (call) or purchased (put) and as a result bears the market risk of an unfavorable change in the price of the instrument underlying the written option. There is the risk the Fund may not be able to enter into a closing transaction because of an illiquid market. The Fund may also purchase put and call options. Purchasing call options increases the Fund’s exposure to the underlying instrument. Purchasing put options decreases the Fund’s exposure to the underlying instrument. The Fund pays a premium, which is included on the Fund’s Statement of Assets and Liabilities as an investment and is subsequently marked to market to reflect the current value of the option. Premiums paid for purchasing options that expire are treated as realized losses. Certain options may be purchased with premiums to be determined on a future date. The premiums for these options are based upon implied volatility parameters at specified terms. The risk associated with purchasing put and call options is generally limited to the premium paid. Premiums paid for purchasing options that are exercised or closed are added to the amounts paid or offset against the proceeds on the underlying investment transaction to determine the realized gain or loss. Entering into over-the-counter options also exposes the Fund to counterparty risk. Counterparty risk is the possibility that the counterparty to the agreements may default on its obligation to perform or disagree as to the meaning of the contractual terms in the agreements. The Fund, as shown on the Schedule of Investments, had outstanding purchased options and written options contracts as of June 30, 2013. Transactions involving written options contracts during the six-month period ended June 30, 2013, are summarized below: |
| 37 |
| Hartford Total Return Bond HLS Fund |
| Notes to Financial Statements – (continued) |
| June 30, 2013 (Unaudited) |
| (000’s Omitted) |
| Options Contract Activity During the Six-month Period Ended June 30, 2013 | ||||||||
| Call Options Written During the Period | Number of Contracts* | Premium Amounts | ||||||
| Beginning of the period | — | $ | — | |||||
| Written | 464,580,000 | 1,970 | ||||||
| Expired | — | — | ||||||
| Closed | — | — | ||||||
| Exercised | — | — | ||||||
| End of period | 464,580,000 | $ | 1,970 | |||||
| Options Contract Activity During the Six-month Period Ended June 30, 2013 | ||||||||
| Put Options Written During the Period | Number of Contracts* | Premium Amounts | ||||||
| Beginning of the period | — | $ | — | |||||
| Written | 464,580,000 | 756 | ||||||
| Expired | — | — | ||||||
| Closed | — | — | ||||||
| Exercised | — | — | ||||||
| End of period | 464,580,000 | $ | 756 | |||||
* The number of contracts does not omit 000's.
| d) | Swap Contracts – The Fund may invest in swap contracts. Swap contracts are privately negotiated agreements between the Fund and a counterparty to exchange or swap investment cash flows, assets, foreign currencies or market-linked returns at specified future intervals. The Fund may enter into credit default, total return, cross-currency, interest rate, inflation and other forms of swap contracts to manage its exposure to credit, currency, interest rate, commodity and inflation risk. Swap contracts are also used to gain exposure to certain markets. In connection with these contracts, investments or cash may be identified as collateral in accordance with the terms of the respective swap contracts to provide assets of value and recourse in the event of default or bankruptcy/insolvency. Swaps are valued based on custom valuations furnished by an independent pricing service. Swaps for which prices are not available from an independent pricing service are valued in accordance with procedures established by the Company’s Board of Directors, and the change in value, if any, is recorded as an unrealized gain or loss on the Statement of Assets and Liabilities. Payments received or made at the beginning of the measurement period are reflected as such on the Statement of Assets and Liabilities and represent payments made or received upon entering into the swap contract to compensate for differences between the stated terms of the swap contract and prevailing market conditions (credit spreads, currency exchange rates, interest rates, and other relevant factors). These upfront payments are recorded as realized gains or losses on the Statement of Operations upon termination or maturity of the swap. A liquidation payment received or made at the termination of the swap and net periodic payments received or paid by the Fund are recorded as realized gains or losses on the Statement of Operations. Entering into these contracts involves, to varying degrees, elements of credit and market risk in excess of the amounts recognized on the Statement of Assets and Liabilities. Such risks involve the possibility that there will be no liquid market for these contracts, that the counterparty to the contracts may default on its obligation to perform or disagree as to the meaning of contractual terms in the contracts, and that there may be unfavorable changes in interest rates. The Fund’s maximum risk of loss from counterparty credit risk is the discounted net value of the cash flows to be received from the counterparty over the contract’s remaining life, to the extent that amount is positive. The risk is mitigated by having a master netting arrangement between the Fund and the counterparty, which allows for the netting of payments made or received (although such amounts are presented on a gross basis within the Statement of Assets and Liabilities, as applicable) as well as the posting of collateral to the Fund to cover the Fund’s exposure to the counterparty. |
Credit Default Swap Contracts – The credit default swap market allows the Fund to manage its exposure to the market or certain sectors of the market, to reduce its risk exposure to defaults of corporate and sovereign issuers, or to create exposure to corporate or sovereign issuers to which it is not otherwise exposed. Certain credit default swaps involve the exchange of a fixed rate premium for protection against the loss in value of an underlying investment or index in the event of a credit event, such as payment default or bankruptcy.
| 38 |
Under a credit default swap contract, one party acts as guarantor by receiving the fixed periodic payment in exchange for the commitment to purchase the underlying investment at par if the defined credit event occurs. Upon the occurrence of a defined credit event, the difference between the value of the reference obligation and the swap’s notional amount is recorded as realized gain or loss on swap transactions in the Statement of Operations. A “buyer” of credit protection agrees to pay a counterparty to assume the credit risk of an issuer upon the occurrence of certain events. The “seller” of the protection receives periodic payments and agrees to assume the credit risk of an issuer upon the occurrence of certain events. Although specified events are contract specific, credit events are generally defined as bankruptcy, failure to pay, restructuring, obligation acceleration, obligation default, or repudiation/moratorium. A “seller’s” exposure is limited to the total notional amount of the credit default swap contract. These potential amounts would be partially offset by any recovery values of the respective referenced obligations or upfront payments received upon entering into the contract.
Implied credit spreads, represented in absolute terms, utilized in determining the market value of credit default swap contracts on corporate issues, sovereign government issues or U.S. municipal issues as of period-end are disclosed in the notes to the Schedule of Investments, as applicable, and serve as an indicator of the current status of the payment/performance risk and represent the likelihood or risk of default for the credit derivative. The implied credit spread of a particular referenced entity reflects the cost of buying/selling protection and may include upfront payments required to be made to enter into the contract. Wider credit spreads represent a deterioration of the referenced entity’s soundness and a greater likelihood or risk of default or other credit event occurring as defined under the terms of the contract. For credit default swap contracts on asset-backed securities and credit indices, the quoted market prices and resulting values serve as the indicator of the current status of the payment/performance risk. Increasing market values, in absolute terms when compared to the notional amount of the swap, represent a deterioration of the referenced equity’s credit soundness and a greater likelihood or risk of default or other credit event occurring as defined under the terms of the contract. The Fund, as shown on the Schedule of Investments, had outstanding credit default swaps as of June 30, 2013.
Interest Rate Swap Contracts – The Fund is subject to interest rate risk exposure in the normal course of pursuing its investment objectives. Because the Fund holds fixed rate bonds, the value of these bonds may decrease if interest rates rise. To help hedge against this risk and to maintain its ability to generate income at prevailing market rates, the Fund may enter into interest rate swap contracts. In a typical interest rate swap, one party agrees to make regular payments equal to a floating interest rate, based on a specified interest rate or inflation benchmark (e.g. London Interbank Offered Rate (“LIBOR”)), multiplied by a “notional principal amount”, in return for payments equal to a fixed rate multiplied by the same amount, for a specific period of time. The net interest received or paid on interest rate swap contracts is recorded as a realized gain or loss. Interest rate swaps are marked to market daily and the change, if any, is recorded as an unrealized gain or loss in the Statement of Operations. When the interest rate swap contract is terminated early, the Fund records a realized gain or loss equal to the difference between the current realized value and the expected cash flows.
If an interest rate swap contract provides for payments in different currencies, the parties might agree to exchange the notional principal amount as well. Interest rate swaps may also depend on other prices or rates, such as the value of an index or mortgage prepayment rates. The risks of interest rate swaps include changes in market conditions which will affect the value of the contract or the cash flows and the possible inability of the counterparty to fulfill its obligations under the contract. The Fund’s maximum risk of loss from counterparty credit risk is the discounted net value of the cash flows to be received from the counterparty over the contract’s remaining life, to the extent that amount is positive. The Fund, as shown on the Schedule of Investments, had outstanding interest rate swaps as of June 30, 2013.
Spreadlock Swap Contracts – The Fund may invest in spreadlock swap contracts. These contracts involve commitments to pay or receive a settlement amount calculated as the difference between the swap spread and a fixed spread at a specific forward date. The Fund, as shown on the Schedule of Investments, had outstanding spreadlock swaps as of June 30, 2013.
| 39 |
| Hartford Total Return Bond HLS Fund |
| Notes to Financial Statements – (continued) |
| June 30, 2013 (Unaudited) |
| (000’s Omitted) |
| e) | Additional Derivative Instrument Information: |
Fair Value of Derivative Instruments on the Statement of Assets and Liabilities as of June 30, 2013:
| Risk Exposure Category | ||||||||||||||||||||||||||||
Interest Rate | Foreign | Credit | Equity | Commodity | Other | Total | ||||||||||||||||||||||
| Assets: | ||||||||||||||||||||||||||||
| Investments in securities, at value (purchased options), market value | $ | 2,085 | $ | — | $ | — | $ | — | $ | — | $ | — | $ | 2,085 | ||||||||||||||
| Unrealized appreciation on foreign currency contracts | — | — | — | — | — | — | — | |||||||||||||||||||||
| Unrealized appreciation on swap contracts | 1,815 | — | 7,902 | — | — | — | 9,717 | |||||||||||||||||||||
| Variation margin receivable * | 402 | — | — | — | — | — | 402 | |||||||||||||||||||||
| Total | $ | 4,302 | $ | — | $ | 7,902 | $ | — | $ | — | $ | — | $ | 12,204 | ||||||||||||||
| Liabilities: | ||||||||||||||||||||||||||||
| Unrealized depreciation on foreign currency contracts | $ | — | $ | 872 | $ | — | $ | — | $ | — | $ | — | $ | 872 | ||||||||||||||
| Unrealized depreciation on swap contracts | 3,508 | — | 13,823 | — | — | — | 17,331 | |||||||||||||||||||||
| Variation margin payable * | 371 | — | — | — | — | — | 371 | |||||||||||||||||||||
| Written options, market value | — | — | 2,823 | — | — | — | 2,823 | |||||||||||||||||||||
| Total | $ | 3,137 | $ | 872 | $ | 16,646 | $ | — | $ | — | $ | — | $ | 21,397 | ||||||||||||||
| * | Only current day's variation margin is reported within the Statement of Assets and Liabilities. The variation margin is included in the open futures cumulative appreciation of $987 as reported in the Schedule of Investments. |
The ratio of futures contracts to net assets at June 30, 2013 was 27.09%, compared to the six-month period ended June 30, 2013 average ratio of futures contracts to net assets of 21.98%. The volume of other derivatives that are presented in the Schedule of Investments is consistent with the derivative activity during the six-month period ended June 30, 2013.
| The Effect of Derivative Instruments on the Statement of Operations for the six-month period ended June 30, 2013: |
| Risk Exposure Category | ||||||||||||||||||||||||||||
| Interest Rate Contracts | Foreign Exchange Contracts | Credit Contracts | Equity Contracts | Commodity Contracts | Other Contracts | Total | ||||||||||||||||||||||
| Realized Gain (Loss) on Derivatives Recognized as a Result of Operations: | ||||||||||||||||||||||||||||
| Net realized gain on purchased options | $ | 932 | $ | 918 | $ | — | $ | — | $ | — | $ | — | $ | 1,850 | ||||||||||||||
| Net realized gain on futures | 11,884 | — | — | — | — | — | 11,884 | |||||||||||||||||||||
| Net realized gain (loss) on swap contracts | 1,307 | — | (14,575 | ) | — | — | — | (13,268 | ) | |||||||||||||||||||
| Net realized gain on foreign currency contracts | — | 105 | — | — | — | — | 105 | |||||||||||||||||||||
| Total | $ | 14,123 | $ | 1,023 | $ | (14,575 | ) | $ | — | $ | — | $ | — | $ | 571 | |||||||||||||
| Net Change in Unrealized Appreciation (Depreciation) on Derivatives Recognized as a Result of Operations: | ||||||||||||||||||||||||||||
| Net change in unrealized depreciation of investments in purchased options | $ | (372 | ) | $ | (170 | ) | $ | — | $ | — | $ | — | $ | — | $ | (542 | ) | |||||||||||
| Net change in unrealized depreciation of futures | (1,804 | ) | — | — | — | — | — | (1,804 | ) | |||||||||||||||||||
| Net change in unrealized depreciation of written options | — | — | (97 | ) | — | — | — | (97 | ) | |||||||||||||||||||
| Net change in unrealized depreciation of swap contracts | (1,736 | ) | — | (7,451 | ) | — | — | — | (9,187 | ) | ||||||||||||||||||
| Net change in unrealized depreciation of foreign currency contracts | — | (1,383 | ) | — | — | — | — | (1,383 | ) | |||||||||||||||||||
| Total | $ | (3,912 | ) | $ | (1,553 | ) | $ | (7,548 | ) | $ | — | $ | — | $ | — | $ | (13,013 | ) | ||||||||||
| 40 |
| f) | Balance Sheet Offsetting Information: |
Set forth below are tables which disclose both gross information and net information about instruments and transactions eligible for offset in the financial statements, and instruments and transactions that are subject to a master netting agreement, as well as amounts related to margin, reflected as financial collateral (including cash collateral), held at clearing brokers, counterparties, and the Fund’s custodian. The master netting agreements allow the clearing brokers to net any collateral held in or on behalf of the Fund, or liabilities or payment obligations of the clearing brokers to the Fund, against any liabilities or payment obligations of the Fund to the clearing brokers. The Fund is required to deposit financial collateral (including cash collateral) at the Fund’s custodian on behalf of clearing brokers and counterparties to continually meet the original and maintenance requirements established by the clearing brokers and counterparties. Such requirements are specific to the respective clearing broker or counterparty.
Offsetting of Financial Assets and Derivative Assets as of June 30, 2013:
| Description | Gross Amounts of Recognized Assets | Gross Amounts Offset in Statement of Assets and Liabilities | Net Amounts of Assets Presented in Statement of Assets and Liabilities | Financial Instruments with Allowable Netting | Collateral Received | Net Amount (not less than 0) | ||||||||||||||||||
| Futures contracts - Variation margin receivable | $ | 402 | $ | — | $ | 402 | $ | — | $ | — | $ | 402 | ||||||||||||
| Purchased options at market value | 2,085 | — | 2,085 | — | — | 2,085 | ||||||||||||||||||
| Repurchase Agreements | 158,212 | — | 158,212 | — | (160,880 | ) | — | |||||||||||||||||
| Swap contracts at market value | 39,972 | — | 39,972 | (22,167 | ) | (27,837 | ) | — | ||||||||||||||||
| Unrealized appreciation on foreign currency contracts | — | — | — | — | — | — | ||||||||||||||||||
| Total subject to a master netting or similar arrangement | $ | 200,671 | $ | — | $ | 200,671 | $ | (22,167 | ) | $ | (188,717 | ) | $ | 2,487 | ||||||||||
Offsetting of Financial Liabilities and Derivative Liabilities as of June 30, 2013:
| Description | Gross Amounts of Recognized Liabilities | Gross Amounts Offset in Statement of Assets and Liabilities | Net Amounts of Assets Presented in Statement of Assets and Liabilities | Financial Instruments with Allowable Netting | Collateral Pledged | Net Amount (not less than 0) | ||||||||||||||||||
| Futures – Variation margin payable | $ | 371 | $ | — | $ | 371 | $ | — | $ | (10,134 | ) | $ | — | |||||||||||
| Swap contracts at market value | 34,562 | — | 34,562 | (22,167 | ) | — | 12,395 | |||||||||||||||||
| Unrealized depreciation on foreign currency contracts | 872 | — | 872 | — | — | 872 | ||||||||||||||||||
| Written options at market value | 2,823 | — | 2,823 | — | — | 2,823 | ||||||||||||||||||
| Total subject to a master netting or similar arrangement | $ | 38,628 | $ | — | $ | 38,628 | $ | (22,167 | ) | $ | (10,134 | ) | $ | 16,090 | ||||||||||
| 5. | Principal Risks: |
| a) | Credit and Counterparty Risks – Credit risk depends largely on the perceived financial health of bond issuers. In general, the credit rating is inversely related to the credit risk of the issuer. Higher rated bonds generally are deemed to have less credit risk, while lower or unrated bonds are deemed to have higher risk of default. The share price, yield and total return of a fund that holds securities with higher credit risk may be more volatile than those of a fund that holds bonds with lower credit risk. Similar to credit risk, the Fund may be exposed to counterparty risk, or the risk that an institution or other entity with which the Fund has unsettled or open transactions will default. |
| b) | Market Risks – The Fund’s investments expose the Fund to various risks including, but not limited to, interest rate, prepayment, extension, foreign currency, and equity risks. Interest rate risk is the risk that fixed income securities will decline in value because of changes in interest rates. As nominal interest rates rise, the values of certain fixed income |
| 41 |
| Hartford Total Return Bond HLS Fund |
| Notes to Financial Statements – (continued) |
| June 30, 2013 (Unaudited) |
| (000’s Omitted) |
securities held by the Fund are likely to decrease. A nominal interest rate can be described as the sum of a real interest rate and an expected inflation rate. Fixed income securities with longer durations tend to be more sensitive to changes in interest rates, usually making them more volatile than securities with shorter durations. Duration is useful primarily as a measure of the sensitivity of a fixed income security’s market price to interest rate (i.e., yield) movements. Senior floating rate interests and securities subject to prepayment and extension risk generally offer less potential for gains when interest rates decline. In addition, securities are subject to extension risk. Rising interest rates may cause prepayments to occur at a slower than expected rate, thereby effectively lengthening the maturity of the security and making the security more sensitive to interest rate changes. Prepayment and extension risk are major risks of mortgage backed securities, senior floating rate interests, and certain asset backed securities. For certain asset backed securities, the actual maturity may be less than the stated maturity shown in the Schedule of Investments, if applicable. As a result, the timing of income recognition relating to these securities may vary based upon the actual maturity. If the Fund invests directly in foreign currencies or in securities that trade in, and receive revenues in, foreign currencies, or in derivatives that provide exposure to foreign currencies, it will be subject to the risk that those currencies will decline in value relative to the base currency of the Fund, or, in the case of hedging positions, that the Fund’s base currency will decline in value relative to the currency being hedged. Currency rates in foreign countries may fluctuate significantly over short periods of time for a number of reasons, including changes in interest rates, intervention (or the failure to intervene) by U.S. or foreign governments, central banks or supranational entities, such as the International Monetary Fund, or by the imposition of currency controls or other political developments in the United States or abroad. As a result, the Fund’s investments in foreign currency denominated securities may reduce the returns of the Fund. The market values of equity securities, such as common stocks and preferred stocks, or equity related investments, such as futures and options, may decline due to general market conditions which are not specifically related to a particular company, such as real or perceived adverse economic conditions, changes in the general outlook for corporate earnings, changes in interest or currency rates or adverse investor sentiment generally. The market value of equity securities may also decline due to factors which affect a particular industry or industries, such as labor shortages or increased production costs and competitive conditions within an industry. Equity securities and equity related investments generally have greater market price volatility than fixed income securities.
| 6. | Federal Income Taxes: |
| a) | Federal Income Taxes – For federal income tax purposes, the Fund intends to continue to qualify as a RIC under Subchapter M of the Internal Revenue Code (“IRC”) by distributing substantially all of its taxable net investment income and net realized capital gains to its shareholders and otherwise complying with the requirements of the IRC. The Fund has distributed substantially all of its income and capital gains in prior years, if applicable, and intends to distribute substantially all of its income and capital gains prior to the next fiscal year-end. Accordingly, no provision for federal income or excise taxes has been made in the accompanying financial statements. Distributions from short-term capital gains are treated as ordinary income distributions for federal income tax purposes. |
| b) | Net Investment Income (Loss), Net Realized Gains (Losses), and Distributions – Net investment income (loss) and net realized gains (losses) may differ for financial statement and tax purposes primarily because of losses deferred due to wash sale adjustments, foreign currency gains and losses, adjustments related to PFICs, REITs, RICs, certain derivatives and partnerships. The character of distributions made during the year from net investment income or net realized gains may differ from their ultimate characterization for federal income tax purposes. Also, due to the timing of dividend distributions, the fiscal year in which amounts are distributed may differ from the year that the income or realized gains (losses) were recorded by the Fund. |
| c) | Distributions and Components of Distributable Earnings – The tax character of distributions paid by the Fund for the periods indicated is as follows (as adjusted for dividends payable, if applicable): |
| For the Year Ended December 31, 2012 | For the Year Ended December 31, 2011 | |||||||
| Ordinary Income | $ | 172,217 | $ | 9,707 | ||||
| 42 |
As of December 31, 2012, the Fund’s components of distributable earnings (deficit) on a tax basis were as follows:
| Amount | ||||
| Undistributed Ordinary Income | $ | 150,659 | ||
| Accumulated Capital and Other Losses* | (28,692 | ) | ||
| Unrealized Appreciation† | 178,111 | |||
| Total Accumulated Earnings | $ | 300,078 | ||
| * | The Fund has capital loss carryforwards that are identified in the Capital Loss Carryforward note that follows. | |
| † | Differences between book-basis and tax-basis unrealized appreciation (depreciation) may be attributable to the losses deferred due to wash sale adjustments, foreign currency gains and losses, adjustments related to PFICs, REITs, RICs, certain derivatives and partnerships. |
| d) | Reclassification of Capital Accounts – The Fund may record reclassifications in its capital accounts. These reclassifications have no impact on the total net assets of the Fund. The reclassifications are a result of permanent differences between U.S. GAAP and tax accounting for such items as foreign currency, PFICs, expiration or utilization of capital loss carryforwards or net operating losses. Adjustments are made to reflect the impact these items have on current and future distributions to shareholders. Therefore, the source of the Fund’s distributions may be shown in the accompanying Statement of Changes in Net Assets as from undistributed net investment income, from accumulated net realized gains on investments or from capital depending on the type of book and tax differences that exist. For the year ended December 31, 2012, the Fund recorded reclassifications to increase (decrease) the accounts listed below: |
| Amount | ||||
| Undistributed Net Investment Income | $ | 23,451 | ||
| Accumulated Net Realized Gain (Loss) | (23,451 | ) | ||
| e) | Capital Loss Carryforward – On December 22, 2010, the Regulated Investment Company Modernization Act of 2010 (the “Act”) was enacted, which made changes to the capital loss carryforward rules. The changes are effective for taxable years beginning after the date of enactment. Under the Act, funds are permitted to carry forward capital losses for an unlimited period. However, any losses incurred during those future taxable years will be required to be utilized prior to the losses incurred in pre-enactment taxable years, which carry an expiration date. As a result of this ordering rule, pre-enactment capital loss carryforwards may be more likely to expire unused. Additionally, post-enactment capital loss carryforwards retain their character as either short-term or long-term capital losses rather than being considered all short-term as permitted under prior regulation. |
At December 31, 2012 (tax-year-end), the Fund had capital loss carryforwards for U.S. federal income tax purposes as follows:
| Year of Expiration | Amount | |||
| 2017 | $ | 28,692 | ||
| Total | $ | 28,692 | ||
During the year ended December 31, 2012, the Fund utilized $121,285 of prior year capital loss carryforwards.
| f) | Accounting for Uncertainty in Income Taxes – The Fund has adopted financial reporting rules that require the Fund to analyze all open tax years, as defined by the statute of limitations, for all major jurisdictions. Generally, tax authorities can examine all tax returns filed for the last three years. The Fund does not have an examination in progress. |
The Fund has reviewed all open tax years and major jurisdictions and concluded that these financial reporting rules had no effect on the Fund’s financial position or results of operations. There is no tax liability resulting from unrecognized
| 43 |
| Hartford Total Return Bond HLS Fund |
| Notes to Financial Statements – (continued) |
| June 30, 2013 (Unaudited) |
| (000’s Omitted) |
tax benefits relating to uncertain income tax positions taken or expected to be taken on the tax return for the fiscal year ended December 31, 2012. The Fund is also not aware of any tax positions for which it is reasonably possible that the total amounts of unrecognized tax benefits will significantly change in the next twelve months.
| 7. | Expenses: |
| a) | Investment Management Agreement – Hartford Funds Management Company, LLC (“HFMC”), an indirect wholly owned subsidiary of The Hartford Financial Services Group, Inc. (“The Hartford”), serves as investment manager to the Fund pursuant to an Investment Management Agreement with the Company. The investment manager has overall investment supervisory responsibility for the Fund. In addition, the investment manager provides administrative personnel, services, equipment, facilities and office space for proper operation of the Fund. The investment manager has contracted with Wellington Management Company, LLP (“Wellington Management”) under a sub-advisory agreement for the provision of day-to-day investment management services to the Fund in accordance with the Fund’s investment objective and policies. The Fund pays a fee to the investment manager, a portion of which may be used to compensate Wellington Management. |
The schedule below reflects the rates of compensation paid to HFMC for investment management services rendered as of June 30, 2013; the rates are accrued daily and paid monthly.
| Average Daily Net Assets | Annual Fee | |||
| On first $250 million | 0.5250 | % | ||
| On next $250 million | 0.5000 | % | ||
| On next $500 million | 0.4750 | % | ||
| On next $1.5 billion | 0.4500 | % | ||
| On next $2.5 billion | 0.4450 | % | ||
| On next $5 billion | 0.4300 | % | ||
| Over $10 billion | 0.4200 | % | ||
| b) | Accounting Services Agreement – Pursuant to the Fund Accounting Agreement between HFMC and the Company, on behalf of the Fund, HFMC provides accounting services to the Fund and receives monthly compensation based on the Fund’s average daily net assets at the rates set forth below. The Fund’s accounting services fees are accrued daily and paid monthly. |
| Average Daily Net Assets | Annual Fee | |||
| On first $5 billion | 0.020 | % | ||
| On next $5 billion | 0.018 | % | ||
| Over $10 billion | 0.016 | % | ||
| c) | Operating Expenses – Allocable expenses incurred by the Company are allocated to each Fund and allocated to classes within a Fund in proportion to the average daily net assets of the Fund and each class, except where allocation of certain expenses is more fairly made directly to the Fund or to specific classes within a Fund. |
| d) | Fees Paid Indirectly – The Fund’s custodian banks have agreed to reduce its fees when the Fund maintains cash on deposit in a non-interest-bearing custody account. For the six-month period ended June 30, 2013, these amounts, if any, are included in the Statement of Operations. |
| 44 |
The ratio of expenses to average net assets in the accompanying financial highlights excludes the reduction in expenses related to fees paid indirectly. The annualized expense ratio for the period listed below reflecting the reduction for fees paid indirectly is as follows:
| Annualized Six- Month Period Ended June 30, 2013 | ||||
| Class IA | 0.50 | % | ||
| Class IB | 0.75 | |||
| e) | Distribution Plan for Class IB shares – The Company, on behalf of the Fund, has adopted a Distribution Plan pursuant to Rule 12b-1 of the 1940 Act to compensate the distributor, Hartford Funds Distributors, LLC (“HFD”), (formerly known as Hartford Investment Financial Services, LLC), an indirect wholly owned subsidiary of The Hartford, from assets attributable to the Class IB shares for services rendered and expenses borne in connection with activities primarily intended to result in the sale of the Class IB shares, subject to the review and approval of the Company’s Board of Directors. |
The Distribution Plan provides that the Fund may pay annually up to 0.25% of the average daily net assets of the Fund attributable to its Class IB shares for activities primarily intended to result in the sale of Class IB shares. The Board has the authority to suspend or reduce these payments at any point in time. Under the terms of the Distribution Plan and the principal underwriting agreement, the Fund is authorized to make payments monthly to the distributor that may be used to pay or compensate entities providing distribution and shareholder servicing with respect to the Class IB shares for such entities’ fees or expenses incurred or paid in that regard. These fees are accrued daily and paid monthly.
| f) | Other Related Party Transactions – Certain officers of the Fund are directors and/or officers of the investment manager and/or The Hartford or its subsidiaries. For the six-month period ended June 30, 2013, a portion of the Fund’s Chief Compliance Officer’s salary was paid by all the investment companies in the Hartford fund complex. The portion allocated to the Fund was in the amount of $2. Hartford Administrative Services Company (“HASCO”), an indirect wholly owned subsidiary of The Hartford, provides transfer agent services to the Fund. HASCO was compensated on a per account basis for providing such services. The amount paid to HASCO can be found in the Statement of Operations. These fees are accrued daily and paid monthly. |
| 8. | Investment Transactions: |
For the six-month period ended June 30, 2013, the Fund's aggregate purchases and sales of investment securities (excluding short-term investments) were as follows:
| Amount | ||||
| Cost of Purchases Excluding U.S. Government Obligations | $ | 9,853,953 | ||
| Sales Proceeds Excluding U.S. Government Obligations | 9,629,166 | |||
| Cost of Purchases for U.S. Government Obligations | 709,723 | |||
| Sales Proceeds for U.S. Government Obligations | 768,138 | |||
| 9. | Line of Credit: |
The Fund is one of several Hartford funds that participate in a $500 million committed revolving line of credit facility. The facility is to be used for temporary or emergency purposes. Under the arrangement, the funds are required to own securities having a market value in excess of 300% of the total bank borrowings. The interest rate on borrowings varies depending on the nature of the loan. The facility also requires a fee to be paid based on the amount of the commitment. This commitment
| 45 |
| Hartford Total Return Bond HLS Fund |
| Notes to Financial Statements – (continued) |
| June 30, 2013 (Unaudited) |
| (000’s Omitted) |
fee is allocated to all of the funds participating in the line of credit based on the average net assets of the funds. During the six-month period ended June 30, 2013, the Fund did not have any borrowings under this facility.
| 10. | Industry Classifications: |
Other than the industry classifications “Other Investment Pools and Funds” and “Exchange Traded Funds,” equity industry classifications used in this report are the Global Industry Classification Standard, which was developed by and is the exclusive property and service mark of MSCI, Inc. and Standard & Poor’s.
| 11. | Indemnifications: |
Under the Company’s organizational documents, the Company shall indemnify its officers and directors to the full extent required or permitted under Maryland General Corporation Law and the federal securities laws. In addition, the Company, on behalf of the Fund, may enter into contracts that contain a variety of indemnifications. The Company’s maximum exposure under these arrangements is unknown. However, as of the date of these financial statements, the Company has not had prior claims or losses pursuant to these contracts and expects the risk of loss to be remote.
| 12. | Pending Legal Proceedings: |
On February 25, 2011, Jennifer L. Kasilag, Louis Mellinger, Judith M. Menendez, Jacqueline M. Robinson, and Linda A. Russell filed a derivative lawsuit against Hartford Investment Financial Services, LLC (“HIFSCO”)(now known as Hartford Funds Distributors, LLC) on behalf of six Hartford retail mutual funds in the United States District Court for the District of New Jersey, alleging that HIFSCO received excessive advisory and distribution fees in violation of its statutory fiduciary duty under Section 36(b) of the 1940 Act when serving as investment manager and principal underwriter, respectively, to the Hartford retail mutual funds. HIFSCO moved to dismiss and, in September 2011, the motion was granted in part and denied in part, with leave to amend the complaint. In November 2011, plaintiffs filed an amended complaint on behalf of certain Hartford retail mutual funds, The Hartford Global Health Fund (now known as The Hartford Healthcare Fund), The Hartford Conservative Allocation Fund, The Hartford Growth Opportunities Fund, The Hartford Inflation Plus Fund, The Hartford Advisers Fund (now known as The Hartford Balanced Fund), and The Hartford Capital Appreciation Fund. Plaintiffs seek to rescind the investment management agreements and distribution plans between HIFSCO and these funds and to recover the total fees charged thereunder or, in the alternative, to recover any improper compensation HIFSCO received, in addition to lost earnings. HIFSCO filed a partial motion to dismiss the amended complaint and, in December 2012, the court dismissed without prejudice the claims regarding distribution fees and denied the motion with respect to the advisory fees claims. HIFSCO disputes the allegations and intends to defend vigorously.
This action concerns the activities of HIFSCO in its capacity as investment manager and principal underwriter to the Hartford retail mutual funds and does not concern HIFSCO’s activities in its capacity as principal underwriter to the HLS funds. For this reason, no accrual for litigation relating to this matter has been recorded in the financial statements of the Fund.
| 46 |
[This page intentionally left blank]
| 47 |
| Hartford Total Return Bond HLS Fund |
| Financial Highlights |
| - Selected Per-Share Data (A) - |
Class | Net Asset Value at | Net Investment | Net Realized and | Total from | Dividends from Net | Distributions from | Distributions from | Total Distributions | Net Asset Value at | |||||||||||||||||||||||||||
| For the Six-Month Period Ended June 30, 2013 (Unaudited) (E) | ||||||||||||||||||||||||||||||||||||
| IA | $ | 11.99 | $ | 0.16 | $ | (0.51 | ) | $ | (0.35 | ) | $ | – | $ | – | $ | – | $ | – | $ | 11.64 | ||||||||||||||||
| IB | 11.91 | 0.14 | (0.51 | ) | (0.37 | ) | – | – | – | – | 11.54 | |||||||||||||||||||||||||
| For the Year Ended December 31, 2012 | ||||||||||||||||||||||||||||||||||||
| IA | 11.63 | 0.41 | 0.45 | 0.86 | (0.50 | ) | – | – | (0.50 | ) | 11.99 | |||||||||||||||||||||||||
| IB | 11.55 | 0.40 | 0.43 | 0.83 | (0.47 | ) | – | – | (0.47 | ) | 11.91 | |||||||||||||||||||||||||
| For the Year Ended December 31, 2011 | ||||||||||||||||||||||||||||||||||||
| IA | 10.90 | 0.44 | 0.31 | 0.75 | (0.02 | ) | – | – | (0.02 | ) | 11.63 | |||||||||||||||||||||||||
| IB | 10.84 | 0.42 | 0.31 | 0.73 | (0.02 | ) | – | – | (0.02 | ) | 11.55 | |||||||||||||||||||||||||
| For the Year Ended December 31, 2010 | ||||||||||||||||||||||||||||||||||||
| IA | 10.58 | 0.45 | 0.34 | 0.79 | (0.47 | ) | – | – | (0.47 | ) | 10.90 | |||||||||||||||||||||||||
| IB | 10.53 | 0.44 | 0.31 | 0.75 | (0.44 | ) | – | – | (0.44 | ) | 10.84 | |||||||||||||||||||||||||
| For the Year Ended December 31, 2009 | ||||||||||||||||||||||||||||||||||||
| IA | 9.54 | 0.46 | 0.98 | 1.44 | (0.40 | ) | – | – | (0.40 | ) | 10.58 | |||||||||||||||||||||||||
| IB | 9.50 | 0.46 | 0.95 | 1.41 | (0.38 | ) | – | – | (0.38 | ) | 10.53 | |||||||||||||||||||||||||
| For the Year Ended December 31, 2008 | ||||||||||||||||||||||||||||||||||||
| IA | 11.15 | 0.62 | (1.49 | ) | (0.87 | ) | (0.74 | ) | – | – | (0.74 | ) | 9.54 | |||||||||||||||||||||||
| IB | 11.09 | 0.67 | (1.55 | ) | (0.88 | ) | (0.71 | ) | – | – | (0.71 | ) | 9.50 | |||||||||||||||||||||||
| (A) | Information presented relates to a share outstanding throughout the indicated period. |
| (B) | The figures do not include sales charges or other fees which may be applied at the variable life insurance, variable annuity or qualified retirement plan product level. Any such additional sales charges or other fees would lower the Fund's performance. |
| (C) | Ratios do not reflect reductions for fees paid indirectly. Please see Fees Paid Indirectly in the Notes to Financial Statements. |
| (D) | Portfolio turnover rate is calculated on the basis of the Fund as a whole without distinguishing between the classes of shares issued. |
| (E) | Per share amounts have been calculated using the average shares method. |
| (F) | Not annualized. |
| (G) | Annualized. |
| 48 |
| - Ratios and Supplemental Data - |
Total Return(B) | Net Assets at End of Period | Ratio of Expenses to Average Net Assets | Ratio of Expenses to Average Net Assets | Ratio of Net Investment | Portfolio | |||||||||||||||||
| (2.98 | )%(F) | $ | 3,202,431 | 0.50 | %(G) | 0.50 | %(G) | 2.70 | %(G) | 49 | % | |||||||||||
| (3.10 | )(F) | 480,199 | 0.75 | (G) | 0.75 | (G) | 2.45 | (G) | – | |||||||||||||
| 7.54 | 3,572,511 | 0.50 | 0.50 | 3.01 | 88 | |||||||||||||||||
| 7.27 | 566,274 | 0.75 | 0.75 | 2.76 | – | |||||||||||||||||
| 6.99 | 3,718,609 | 0.49 | 0.49 | 3.60 | 107 | |||||||||||||||||
| 6.72 | 632,685 | 0.74 | 0.74 | 3.35 | – | |||||||||||||||||
| 7.51 | 4,026,583 | 0.50 | 0.50 | 3.90 | 188 | |||||||||||||||||
| 7.25 | 722,317 | 0.75 | 0.75 | 3.65 | – | |||||||||||||||||
| 15.01 | 3,902,957 | 0.51 | 0.51 | 4.67 | 215 | |||||||||||||||||
| 14.72 | 789,541 | 0.76 | 0.76 | 4.42 | – | |||||||||||||||||
| (7.62 | ) | 3,167,919 | 0.49 | 0.49 | 5.54 | 173 | ||||||||||||||||
| (7.85 | ) | 740,580 | 0.74 | 0.74 | 5.27 | – | ||||||||||||||||
| 49 |
| Hartford Total Return Bond HLS Fund |
| Directors and Officers (Unaudited) |
The Board of Directors of the Company appoints officers who are responsible for the day-to-day operations of the Fund and who execute policies formulated by the Directors. Each director serves until his or her death, resignation, or retirement or until the next annual meeting of shareholders is held or until his or her successor is elected and qualifies.
Directors and officers who are employed by or who have a financial interest in The Hartford are considered “interested” persons of the Fund pursuant to the 1940 Act. Each officer and two of the Company’s directors, as noted in the chart below, are “interested” persons of the Fund. Each director serves as a director for The Hartford Mutual Funds, Inc., The Hartford Mutual Funds II, Inc., Hartford Series Fund, Inc., Hartford HLS Series Fund II, Inc., and as a trustee for The Hartford Alternative Strategies Fund, which, as of June 30, 2013, collectively consist of 90 funds. Correspondence may be sent to directors and officers c/o Hartford Mutual Funds, P.O. Box 2999, Hartford, Connecticut 06104-2999, except that correspondence to Mr. Annoni, Mr. Dressen, Ms. Fagely and Ms. Quade may be sent to 500 Bielenberg Drive, Woodbury, Minnesota 55125 and correspondence to Mr. Davey and Mr. Melcher may be sent to 5 Radnor Corporate Center, Suite 300, 100 Matsonford Road, Radnor, Pennsylvania 19087.
The table below sets forth, for each director and officer, his or her name, year of birth, current position with the Company and date first elected or appointed to Hartford Series Fund, Inc. (“HSF”), and Hartford HLS Series Fund II, Inc. (“HSF2”), principal occupation, and, for directors, other directorships held. The Fund’s statement of additional information contains further information on the directors and is available free of charge by calling 1-800-862-6668 or writing to Hartford HLS Funds, c/o Hartford Life Insurance Company, Hartford Life and Annuity Insurance Company, P.O. Box 14293, Lexington, KY 40512-4293.
Information on the aggregate remuneration paid to the directors of the Company can be found in the Statement of Operations herein. The Fund pays to The Hartford a portion of the Chief Compliance Officer’s compensation, but does not pay salaries or compensation to any of their other officers or directors who are employed by The Hartford.
Non-Interested Directors
Lynn S. Birdsong (1946) Director since 2003, Co-Chairman of the Investment Committee
Mr. Birdsong is a private investor. Mr. Birdsong currently serves as a Director of the Sovereign High Yield Investment Company (April 2010 to current). Mr. Birdsong currently serves as an Independent Director of Nomura Partners Funds, Inc. (formerly, The Japan Fund) (March 2003 to current). From 1979 to 2002, Mr. Birdsong was a managing director of Zurich Scudder Investments, an investment management firm. During his employment with Scudder, Mr. Birdsong was an Interested Director of The Japan Fund. Since 1981, Mr. Birdsong has been a partner in Birdsong Company, an advertising specialty firm.
Robert M. Gavin, Jr. (1940) Director since 2002 (HSF) and 1986 (HSF2), Chairman of the Board since 2004
Dr. Gavin is an educational consultant. Prior to September 1, 2001, he was President of Cranbrook Education Community and prior to July 1996, he was President of Macalester College, St. Paul, Minnesota.
Duane E. Hill (1945) Director since 2001 (HSF) and 2002 (HSF2), Chairman of the Nominating Committee
Mr. Hill is Partner of TSG Ventures L.P., a private equity investment company. Mr. Hill is a former partner of TSG Capital Group, a private equity investment firm that served as sponsor and lead investor in leveraged buyouts of middle market companies.
Sandra S. Jaffee (1941) Director since 2005
Ms. Jaffee is the founder and Chief Executive Officer of a private company, Homeworks Concierge, LLC, which provides residential property management services in Westchester County, New York (January 2012 to present). Ms. Jaffee served as Chairman (2008 to 2009) and Chief Executive Officer of Fortent (formerly Searchspace Group), a leading provider of compliance/regulatory technology to financial institutions from August 2005 to August 2009. Ms. Jaffee currently serves as a member of the Board of Directors of Broadridge Financial Solutions as well as a Trustee of Muhlenberg College.
William P. Johnston (1944) Director since 2005, Chairman of the Compliance Committee
In February 2008, Mr. Johnston was elected to the Board of Directors of HCR-ManorCare, Inc. In August 2007, Mr. Johnston was elected to the Board of Directors of LifeCare Holdings, Inc. In July 2006, Mr. Johnston was elected to the Board of Directors of MultiPlan, Inc. and served as a director (July 2006 to August 2010). In June 2006, Mr. Johnston was appointed as Senior Advisor to The Carlyle Group, a global private equity and alternative asset investment firm. In May 2006, Mr. Johnston was elected to the Supervisory Board of Fresenius Medical Care AG & Co. KGaA, after its acquisition of Renal Care Group, Inc. in March 2006.
| 50 |
Phillip O. Peterson (1944) Director since 2002 (HSF) and 2000 (HSF2), Chairman of the Audit Committee
Mr. Peterson is a mutual fund industry consultant. He was a partner of KPMG LLP (an accounting firm) until July 1999. Mr. Peterson joined William Blair Funds in February 2007 as a member of the Board of Trustees. Mr. Peterson also joined the Board of Trustees of Symetra Variable Mutual Funds Trust as a trustee in February 2012.
Lemma W. Senbet (1946) Director since 2005
Dr. Senbet is the William E. Mayer Chair Professor of Finance and Director, Center for Financial Policy, at the University of Maryland, Robert H. Smith School of Business. He was chair of the Finance Department from 1998 to 2006. Previously he was a chaired professor of finance at the University of Wisconsin-Madison. Also, he was director of the Fortis Funds from March 2000 to July 2002. Dr. Senbet served the finance profession in various capacities, including as director of the American Finance Association and President of the Western Finance Association. In 2006, Dr. Senbet was inducted Fellow of Financial Management Association International for his career-long distinguished scholarship and professional service.
Interested Directors and Officers
James E. Davey (1964) Director since 2012, President and Chief Executive Officer since 2010
Mr. Davey serves as Executive Vice President of Hartford Life Insurance Company (“HLIC”) and The Hartford Financial Services Group, Inc. Additionally, Mr. Davey serves as Chairman of the Board and Manager of Hartford Funds Distributors, LLC (“HFD”) and Hartford Administrative Services Company (“HASCO”). Mr. Davey also serves as Manager, President and Chairman of the Board for Hartford Funds Management Company, LLC (“HFMC”). Mr. Davey joined The Hartford in 2002.
Lowndes A. Smith (1939) Director since 1996 (HSF) and 2002 (HSF2), Co-Chairman of the Investment Committee
Mr. Smith served as Vice Chairman of The Hartford from February 1997 to January 2002, as President and Chief Executive Officer of Hartford Life, Inc. from February 1997 to January 2002, and as President and Chief Operating Officer of The Hartford Life Insurance Companies from January 1989 to January 2002. Mr. Smith serves as a Director of White Mountains Insurance Group, Ltd., One Beacon Insurance and Symetra Financial and as Managing Director of Whittington Gray Associates.
Other Officers
Mark A. Annoni (1964) Vice President, Controller and Treasurer since 2012
Mr. Annoni serves as the Assistant Vice President of HLIC (February 2004 to present). Mr. Annoni joined The Hartford in April 2001 as part of The Hartford’s acquisition of Fortis Financial Group (“Fortis”). Prior to joining The Hartford, Mr. Annoni served as Manager of Mutual Fund Accounting at Fortis (July 1997 to April 2001).
Michael R. Dressen (1963) AML Compliance Officer since 2011
Mr. Dressen currently serves as Assistant Vice President of HLIC. He also serves as Chief Compliance Officer and AML Compliance Officer of HASCO and as AML Officer of HFD. Mr. Dressen joined The Hartford in 2005 from State Farm Insurance Companies where he held various positions related to mutual funds, variable products, and property casualty insurance.
Tamara L. Fagely (1958) Vice President since 2002 (HSF) and 1993 (HSF2)
Currently, Ms. Fagely is President and a Director of HASCO, Chief Administrative Officer and Manager of HFMC and a Vice President of HLIC. Ms. Fagely served as a Vice President of HASCO (1998-2013) and Chief Financial Officer of HASCO (2006-2013). She served as Assistant Vice President of HLIC from December 2001 through March 2005. In addition, Ms. Fagely is Manager and Chief Operating Officer of HFD.
Edward P. Macdonald (1967) Vice President, Secretary and Chief Legal Officer since 2005
Mr. Macdonald serves as Vice President of HLIC and Vice President, Chief Legal Officer and Secretary of HFD and HASCO. Mr. Macdonald also serves as Manager, Vice President, Chief Legal Officer and Secretary of HFMC. Mr. Macdonald joined The Hartford in 2005.
Joseph G. Melcher (1973) Vice President and Chief Compliance Officer since 2013(1)
Mr. Melcher currently serves as Vice President of HFMC and HFD. Mr. Melcher joined The Hartford in 2012 from Touchstone Investments, a member of the Western & Southern Financial Group, where he held the position of Vice President and Chief Compliance Officer from 2010 through 2012 and Assistant Vice President, Compliance from 2005 to 2010.
| (1) | Mr. Melcher was named Vice President and Chief Compliance Officer of HSF and HSF2 on February 6, 2013. Prior to February 6, 2013, Colleen Pernerewski served as Chief Compliance Officer of HSF and HSF2. |
| 51 |
| Hartford Total Return Bond HLS Fund |
| Directors and Officers (Unaudited) – (continued) |
Vernon J. Meyer (1964) Vice President since 2006
Mr. Meyer serves as Senior Vice President of HLIC. He also serves as Senior Vice President of HFMC and HFD. Mr. Meyer joined The Hartford in 2004.
Laura S. Quade (1969) Vice President since 2012
Ms. Quade currently serves as Vice President of HASCO and is a Director of Mutual Fund Service Operations. She also serves as Director, Enterprise Operations of HFD and HLIC. Ms. Quade joined The Hartford in 2001 as part of The Hartford’s acquisition of Fortis.
Elizabeth L. Schroeder (1966) Vice President since 2010(2)
Ms. Schroeder currently serves as Assistant Vice President of HLIC. Ms. Schroeder joined HLIC in 1991. She is also an Assistant Vice President of HFMC and HASCO.
(2) Ms. Schroeder served as Vice President of HSF and HSF2 until August 7, 2013.
Martin Swanson (1962) Vice President since 2010
Mr. Swanson is a Vice President of HLIC. Mr. Swanson also serves as Chief Marketing Officer for HFD. Prior to joining HLIC in 1998, Mr. Swanson was a Vice President at PaineWebber, Inc.
HOW TO OBTAIN A COPY OF THE FUND’S PROXY VOTING POLICIES AND VOTING RECORDS (UNAUDITED)
A description of the policies and procedures that the Fund uses to determine how to vote proxies relating to portfolio securities and information about how the Fund voted proxies relating to portfolio securities during the most recent twelve-month period ended June 30 are available (1) without charge, upon request, by calling 800-862-6668 and (2) on the SEC’s website at http://www.sec.gov.
QUARTERLY PORTFOLIO HOLDINGS INFORMATION (UNAUDITED)
The Fund files a complete schedule of portfolio holdings with the SEC for the first and third quarters of each fiscal year on Form N-Q. The Fund’s Forms are available (1) without charge, upon request, by calling 800-862-6668 and (2) on the SEC’s website at http://www.sec.gov. The Form N-Q may be reviewed and copied at the SEC’s Public Reference Room in Washington, DC. Information on the operation of the Public Reference Room may be obtained by calling 1-800-SEC-0330.
| 52 |
| Hartford Total Return Bond HLS Fund |
| Expense Example (Unaudited) |
Your Fund's Expenses
As a shareholder of the Fund, you incur two types of costs: (1) transaction costs and (2) ongoing costs including investment management fees, distribution fees, if any, and other fund expenses. This example is intended to help you understand your ongoing costs (in dollars) of investing in the Fund and to compare these costs with the ongoing costs of investing in other mutual funds. The example is based on an investment of $1,000 invested at the beginning of the period and held for the period of December 31, 2012 through June 30, 2013.
Actual Expenses
The first set of columns of the table below provides information about actual account values and actual expenses. You may use the information in this column, together with the amount you invested, to estimate the expenses that you paid over the period. Simply divide your account value by $1,000 (for example, an $8,600 account value divided by $1,000 = 8.6), then multiply the result by the number in the line under the heading entitled “Expenses Paid During Period” to estimate the expenses you paid on your account during this period.
Hypothetical Example for Comparison Purposes
The second set of columns of the table below provides information about hypothetical account values and hypothetical expenses based on the Fund’s actual expense ratio and an assumed rate of return of 5% per year before expenses, which is not the Fund’s actual return. The hypothetical account values and expenses may not be used to estimate the actual ending account balance or expenses you paid for the period. You may use this information to compare the ongoing costs of investing in the Fund and other funds. To do so, compare this 5% hypothetical example with the 5% hypothetical examples that appear in the shareholder reports of the other funds.
Please note that the expenses shown in the table are meant to highlight your ongoing costs only and do not reflect any transactional costs, such as sales charges (loads) and CDSC. Therefore, the second set of columns of the table is useful in comparing ongoing costs only, and will not help you determine the relative total costs of owning different funds. In addition, if these transactional costs were included, your costs would be higher. Expenses are equal to the Fund's annualized expense ratios multiplied by average account value over the period, multiplied by 181/365 (to reflect the one-half year period).
| Actual return | Hypothetical (5% return before expenses) | |||||||||||||||||||||||||||||||||||
Beginning | Ending | Expenses paid during the period December 31, 2012 through June 30, 2013 | Beginning | Ending | Expenses paid | Annualized | Days in | Days | ||||||||||||||||||||||||||||
| Class IA | $ | 1,000.00 | $ | 970.20 | $ | 2.44 | $ | 1,000.00 | $ | 1,022.32 | $ | 2.51 | 0.50 | % | 181 | 365 | ||||||||||||||||||||
| Class IB | $ | 1,000.00 | $ | 969.00 | $ | 3.66 | $ | 1,000.00 | $ | 1,021.08 | $ | 3.76 | 0.75 | % | 181 | 365 | ||||||||||||||||||||
| 53 |
| Hartford Total Return Bond HLS Fund |
| Principal Risks (Unaudited) |
The principal risks of investing in the Fund are described below.
Market, Selection, and Strategy Risk: The Fund’s share price may fluctuate due to market risk and/or security selections that may underperform the market or relevant benchmarks. If the sub-adviser’s investment strategy does not perform as expected, the Fund could underperform its peers or lose money. There is no guarantee the Fund will achieve its stated objective.
Fixed Income Risk: The Fund is subject to interest rate risk (the risk that the value of an investment decreases when interest rates rise) and credit risk (the risk that the issuing company of a security is unable to pay interest and principal when due) and call risk (the risk that an investment may be redeemed early). These risks also apply to the Fund’s investments in U.S. government securities, which may not be guaranteed by the U.S. government.
Mortgage-Backed Securities Risk: Mortgage-backed securities are subject to interest rate risk, credit risk, prepayment risk, extension risk, and the risk that an investment’s value may be reduced or become worthless if it receives interest or income payments only after other investments in the same pool.
Foreign Investment and Emerging Markets Risk: Foreign investments can be riskier than U.S. investments. Potential risks include currency risk that may result from unfavorable exchange rates, liquidity risk if decreased demand for a security makes it difficult to sell at the desired price, and risks that stem from substantially lower trading volume on foreign markets. These risks are generally greater for investments in emerging markets, which are also subject to greater price volatility, and custodial and regulatory risks.
Derivatives Risk: Investments in derivatives can be volatile. Potential risks include currency risk, leverage risk (the risk that small market movements may result in large changes in the value of an investment), liquidity risk, index risk, pricing risk, and counterparty risk (the risk that the counterparty may be unwilling or unable to honor its obligations).
Active Trading Risk: Actively trading investments may result in higher costs (thus affecting performance).
| 54 |
HARTFORD HLS FUNDS
c/o The Hartford Wealth Management - Global Annuities
P.O. Box 14293
Lexington, KY 40512-4293
HARTFORDFUNDS
hartfordfunds.com
Hartford Series Fund, Inc. is underwritten and distributed by Hartford Funds Distributors, LLC.
Hartford Series Fund, Inc. inception dates range from 1977 to date. Hartford Series Fund, Inc. is not a subsidiary of The Hartford Financial Services Group, Inc. ("The Hartford") but is underwritten, distributed by and advised by subsidiaries of The Hartford. Investments in Hartford Series Fund, Inc. are not guaranteed by The Hartford or any other entity.
You should carefully consider investment objectives, risks, and charges and expenses of Hartford HLS Funds before investing. This and other information can be found in the Fund’s prospectus or summary prospectus, which can be obtained by calling 800-862-6668. Please read them carefully before you invest or send money.
HLSSAR-TRB13 8-13 113555-1 Printed in U.S.A ©2013 The Hartford, Hartford, CT 06115
HARTFORDFUNDS
| HARTFORD VALUE HLS FUND
2013 Semi Annual Report
|
A MESSAGE FROM THE PRESIDENT
Dear Fellow Shareholders:
I want to take this opportunity to say thank you for investing in the Hartford HLS Funds.
Market Review
During the first half of the year, stocks rose steadily. U.S. equities (as represented by the S&P 500 Index1) posted a strong gain of 10.61% during the first quarter, on their way to an all-time high. During the second quarter, investors persevered through volatility surrounding rumors of the rollback of the U.S. Federal Reserve’s quantitative easing (QE) program later this year, and the S&P 500 Index rose 2.91%. That brought the market’s rise to 13.82% for the first half of 2013. The rumors about QE’s end sent bond yields and mortgage rates upward, but that wasn’t enough to dissuade investors from pushing equities into positive territory.
Because of QE, some have expressed concerns regarding the recent market rally. But a more careful examination of economic data reveals a strong foundation. Consumer balance sheets have improved since the financial crisis, with consumer debt as a percentage of income falling steadily. Housing continued its dogged recovery, fueled by population growth and pent-up demand. In fact, it’s substantive economic improvements that have moved Federal Reserve Chairman Ben Bernanke to consider removing the “training wheels” of QE, which we think should be viewed as a vote of confidence in the U.S. economy going forward.
As the U.S. outlook continues to improve, concerns do remain in the global economy. Emerging markets have lagged due to social unrest and rising inflation. Slowing growth in China is clouding global growth forecasts, but it’s important to remember that China still boasts 7.5% annual GDP growth.
It’s important to stay abreast of domestic and international economic developments while balancing your individual investment goals. Meeting with your financial advisor on a regular basis to examine your current investment strategy can help you determine whether you are on the right track:
| • | Is your portfolio fully diversified with an appropriate mix of stocks and bonds? |
| • | Is your fixed-income portfolio positioned to take advantage of opportunities across the credit spectrum and fulfill your income needs? |
| • | Is your portfolio still in line with your risk tolerance and investment time horizon? |
Your financial professional can help you choose options within our fund family to navigate today’s markets with confidence.
Thank you again for investing with the Hartford HLS Funds.
James Davey
President
Hartford HLS Funds
1 The S&P 500 Index is a market capitalization-weighted price index composed of 500 widely held common stocks.
Table of Contents
This report is prepared for the general information of contract owners and qualified retirement plan participants. It is not an offer of contracts or of qualified retirement plans. It should not be used in connection with any offer, except in conjunction with the appropriate product prospectus which contains all pertinent information including the applicable sales, administrative and other charges.
The views expressed in the Fund’s Manager Discussion under “Why did the Fund perform this way?” and “What is the outlook?” are views of the Fund’s sub-adviser and portfolio management team through the end of the period and are subject to change based on market and other conditions. The Fund’s Manager Discussion is for informational purposes only and does not represent an offer, recommendation or solicitation to buy, hold or sell any security. The specific securities identified and described, if any, do not represent all of the securities purchased or sold and you should not assume that investments in the securities identified and discussed will be profitable.
| Hartford Value HLS Fund inception 04/30/2001 |
| (sub-advised by Wellington Management Company, LLP) |
| Investment objective – Seeks long-term total return. |
Performance Overview 6/30/03 - 6/30/13
The chart above represents the hypothetical growth of a $10,000 investment in Class IA. Growth results in classes other than Class IA will vary from what is seen above due to differences in the expenses charged to those share classes.
| Average Annual Total Returns (as of 6/30/13) |
| 6 Month† | 1 Year | 5 Years | 10 Years | |||||
| Value IA | 16.34% | 25.45% | 6.80% | 8.69% | ||||
| Value IB | 16.20% | 25.14% | 6.53% | 8.42% | ||||
| Russell 1000 Value Index | 15.90% | 25.32% | 6.67% | 7.79% |
| † | Not Annualized |
PERFORMANCE DATA QUOTED REPRESENTS PAST PERFORMANCE AND DOES NOT GUARANTEE FUTURE RESULTS. The investment return and principal value of the investment will fluctuate so that investors’ shares, when redeemed, may be worth more or less than their original cost. Current performance may be lower or higher than the performance data quoted. To obtain performance data current to the most recent month-end, please visit our website www.hartfordfunds.com.
Total returns presented above were calculated using the Fund’s net asset value available to shareholders for sale or redemption of Fund shares on June 30, 2013, which may exclude investment transactions as of this date. All share class returns assume the reinvestment of all distributions at net asset value and the deduction of all fund expenses.
Russell 1000 Value Index is an unmanaged index measuring the performance of those Russell 1000 Index companies with lower price-to-book ratios and lower forecasted growth values. The Russell 1000 Index is an unmanaged index that measures the performance of the 1,000 largest companies in the Russell 3000 Index, which measures the performance of the 3,000 largest U.S. companies, based on total market capitalizations.
You cannot invest directly in an index.
As of the Fund’s current prospectus dated May 1, 2013, the total annual operating expense ratios for Class IA and Class IB shares were 0.76% and 1.01%, respectively. Actual expenses may be higher. Please see the accompanying Financial Highlights for expense ratios for the six-month period ended June 30, 2013.
The chart and table do not reflect the deductions of taxes, sales charges or other fees which may be applied at the variable life insurance, variable annuity or qualified retirement plan product level. Any such additional sales charges or other fees or expenses would lower the contract’s or plan’s performance.
All investments are subject to risk including the possible loss of principal. For a discussion of the Fund’s risks, please see the Principal Risks section. For more detailed information on the risks associated with an investment in the Fund, please see the prospectus.
| 2 |
| Hartford Value HLS Fund |
| Manager Discussion |
| June 30, 2013 (Unaudited) |
| Portfolio Managers | ||
| Karen H. Grimes, CFA | W. Michael Reckmeyer, III, CFA | Ian R. Link, CFA |
| Senior Vice President and Equity Portfolio Manager | Senior Vice President and Equity Portfolio Manager | Director and Equity Portfolio Manager |
How did the Fund perform?
The Class IA shares of the Hartford Value HLS Fund returned 16.34% for the six-month period ended June 30, 2013, outperforming the Fund’s benchmark, the Russell 1000 Value Index, which returned 15.90% for the same period. The Fund outperformed the 15.99% average return of the Variable Products-Underlying Funds Lipper Large Cap Value Funds peer group, a group of funds with investment strategies similar to those of the Fund.
Why did the Fund perform this way?
U.S. equities (+13.8%), as measured by the S&P 500 Index, gained during the six-month period, reaching an all-time high in May. The rally began on the first trading day of the year after a last-minute compromise by the U.S. Congress averted the fiscal cliff. Optimism surrounding the fiscal reprieve was furthered during the first half of the period by better-than-expected corporate earnings, a robust housing market, and a gradually improving employment picture. In the second half of the period, a market rally throughout April and the first part of May paused following comments by Federal Reserve (Fed) Chairman Ben Bernanke that suggested the Fed might begin to slow quantitative easing (QE) sooner than investors anticipated. The Federal Open Market Committee’s June statement emphasized that the tapering schedule would depend on improving economic indicators. A strong housing market, positive consumer confidence trends, and a steadily healing labor market lent support to the thesis that underlying fundamentals were solid. Following an initially dramatic negative response to the Fed’s announcement and an increase in lending rates in China, U.S. markets moved higher into the end of the period.
Nine of the ten sectors within the Russell 1000 Value Index posted positive returns during the period. Information Technology (+26%), Health Care (+20%), and Financials (+19%) gained the most while Materials (-2%), Telecommunication Services (+8%), and Energy (+9%) lagged on a relative basis.
The Fund’s outperformance versus its benchmark was primarily due to strong stock selection within financials, industrials and energy. Sector allocation, a result of the bottom up stock selection process, also contributed to relative outperformance. Notably, an overweight allocation (i.e. the Fund’s position was greater than the benchmark) to the Information Technology sector and an underweight allocation to the underperforming Energy sector contributed to relative results. These contributors were partially offset by weak stock selection decisions within the Information Technology and Health Care sectors and an overweight to the Materials sector. A modest cash position in a generally rising market environment also detracted from relative returns.
Among the top contributors to benchmark-relative returns were Exxon Mobil (Energy), Intercontinental Exchange (Financials) and Unum Group (Financials). Exxon Mobil is a U.S. based oil and gas company. Shares rose modestly during the period but underperformed the broad market; our underweight position contributed to relative performance. Intercontinental Exchange, an operator of global futures exchanges, over-the-counter (OTC) markets, derivatives clearing houses, and post-trade services, saw its share price climb steadily during the period as a result of better-than-expected Q1 earnings and the announcement of the pending acquisition of NYSE Euronext, scheduled for the second half of the year. Unum Group, a benefits and disability insurer, saw its share price increase as management downplayed the need for additional provisioning against its long-term care exposure. Economic expansion, growth in its voluntary benefits market and the optionality of higher interest rates provided a solid backdrop for unit growth and improving returns in its core U.S. operations. Top absolute contributors (i.e. total return) included JPMorgan Chase (Financials), Wells Fargo (Financials) and Cisco Systems (Information Technology).
The Fund’s holdings of Barrick Gold (Materials) and Mosaic (Materials) detracted most from benchmark-relative returns during the period. The Fund’s relative performance also suffered due to our zero-weight in Berkshire Hathaway (Financials), a component of the benchmark that performed well during the period. Barrick Gold is a Canadian-based gold exploration and mining company. Shares steadily declined during the period as the spot price of gold continued to fall, which caused reduced earnings forecasts for Barrick and other mining companies. Berkshire Hathaway, a U.S. based insurance company, saw shares climb during the first half of the year. We did not own the security in the portfolio, which detracted from relative performance. Shares of Mosaic, one of the largest global fertilizer producers, underperformed amid a deteriorating demand and pricing environment for phosphates
| 3 |
| Hartford Value HLS Fund |
| Manager Discussion – (continued) |
| June 30, 2013 (Unaudited) |
and potash. Verizon Communications (Telecommunication Services) and Royal Dutch Shell (Energy) were among the top detractors from absolute performance.
What is the outlook?
The recent change in the Fed’s rhetoric regarding monetary policy appears to have resulted in interest rates increasing sharply. While we don’t expect that higher interest rates will disrupt our expectation of an improving domestic economy, it may present new challenges for fixed income markets with resulting risks of unintended consequences on equities. Ultimately, it is likely that the Fed’s actions derive from their view of better economic traction in the U.S., and we agree with this assessment.
We believe that the U.S. economy continues to improve, albeit at moderate growth rates. We anticipate that economic growth will increase into the second half of 2013 as the negative effects of tax reform and sequestration moderate. Consumer confidence appears to be high, supporting improvements in housing and auto-sales, and sustained growth in the oil shale industry continues to benefit the U.S. economy.
We believe that Europe remains lackluster with growth about flat. Germany and the U.K. are experiencing positive growth, but sluggishness continues in southern European economies. We are seeing some evidence of stabilization in these challenged economies and remain hopeful of better growth in 2014.
We believe that Chinese economic growth has been disappointing. The government appears focused on reducing non-bank lending and addressing over-capacity of inefficient manufacturing, with a goal of shifting to a more consumer driven economy. It is likely that this is resulting in slower growth.
In terms of portfolio positioning, the consumer discretionary sector represented our largest sector overweight at the end of the period.
The recent annual reconstitution of the Russell 1000 Value Index resulted in an increase in the benchmark’s Technology sector, with the inclusion of Apple as a notable highlight. This brought the index more in-line with our positioning, as Technology had been the largest overweight before the index rebalanced. We remained moderately overweight in the sector after the change.
Diversification by Industry
as of June 30, 2013
| Industry (Sector) | Percentage of Net Assets | |||
| Automobiles and Components (Consumer Discretionary) | 0.3 | % | ||
| Banks (Financials) | 7.4 | |||
| Capital Goods (Industrials) | 11.2 | |||
| Consumer Durables and Apparel (Consumer Discretionary) | 2.1 | |||
| Diversified Financials (Financials) | 11.7 | |||
| Energy (Energy) | 12.9 | |||
| Food and Staples Retailing (Consumer Staples) | 1.3 | |||
| Food, Beverage and Tobacco (Consumer Staples) | 3.7 | |||
| Health Care Equipment and Services (Health Care) | 4.5 | |||
| Insurance (Financials) | 7.4 | |||
| Materials (Materials) | 4.9 | |||
| Media (Consumer Discretionary) | 2.9 | |||
| Pharmaceuticals, Biotechnology and Life Sciences (Health Care) | 8.5 | |||
| Retailing (Consumer Discretionary) | 5.1 | |||
| Semiconductors and Semiconductor Equipment (Information Technology) | 4.0 | |||
| Software and Services (Information Technology) | 1.6 | |||
| Technology Hardware and Equipment (Information Technology) | 5.0 | |||
| Telecommunication Services (Services) | 2.1 | |||
| Utilities (Utilities) | 3.0 | |||
| Short-Term Investments | 0.7 | |||
| Other Assets and Liabilities | (0.3 | ) | ||
| Total | 100.0 | % | ||
| 4 |
| Hartford Value HLS Fund |
| Schedule of Investments |
| June 30, 2013 (Unaudited) |
| (000’s Omitted) |
| Shares or Principal Amount | Market Value ╪ | |||||||
| COMMON STOCKS - 99.6% | ||||||||
| Automobiles and Components - 0.3% | ||||||||
| 68 | General Motors Co. ● | $ | 2,276 | |||||
| Banks - 7.4% | ||||||||
| 238 | BB&T Corp. | 8,069 | ||||||
| 217 | PNC Financial Services Group, Inc. | 15,797 | ||||||
| 641 | Wells Fargo & Co. | 26,449 | ||||||
| 50,315 | ||||||||
| Capital Goods - 11.2% | ||||||||
| 65 | 3M Co. | 7,084 | ||||||
| 65 | Boeing Co. | 6,638 | ||||||
| 149 | Eaton Corp. plc | 9,821 | ||||||
| 548 | General Electric Co. | 12,715 | ||||||
| 98 | Illinois Tool Works, Inc. | 6,768 | ||||||
| 123 | Ingersoll-Rand plc | 6,851 | ||||||
| 91 | PACCAR, Inc. | 4,881 | ||||||
| 246 | Spirit Aerosystems Holdings, Inc. ● | 5,277 | ||||||
| 99 | Stanley Black & Decker, Inc. | 7,628 | ||||||
| 89 | United Technologies Corp. | 8,317 | ||||||
| 75,980 | ||||||||
| Consumer Durables and Apparel - 2.1% | ||||||||
| 241 | Newell Rubbermaid, Inc. | 6,329 | ||||||
| 63 | PVH Corp. | 7,830 | ||||||
| 14,159 | ||||||||
| Diversified Financials - 11.7% | ||||||||
| 89 | Ameriprise Financial, Inc. | 7,177 | ||||||
| 42 | BlackRock, Inc. | 10,806 | ||||||
| 265 | Citigroup, Inc. | 12,726 | ||||||
| 126 | Credit Suisse Group ADR | 3,346 | ||||||
| 64 | Goldman Sachs Group, Inc. | 9,724 | ||||||
| 48 | IntercontinentalExchange, Inc. ● | 8,520 | ||||||
| 511 | JP Morgan Chase & Co. | 26,949 | ||||||
| 230 | Solar Cayman Ltd. ⌂■●† | 16 | ||||||
| 79,264 | ||||||||
| Energy - 12.9% | ||||||||
| 84 | Anadarko Petroleum Corp. | 7,253 | ||||||
| 187 | Chevron Corp. | 22,085 | ||||||
| 43 | EOG Resources, Inc. | 5,619 | ||||||
| 155 | Exxon Mobil Corp. | 13,979 | ||||||
| 219 | Halliburton Co. | 9,137 | ||||||
| 197 | Marathon Oil Corp. | 6,810 | ||||||
| 91 | Noble Corp. | 3,411 | ||||||
| 105 | Occidental Petroleum Corp. | 9,392 | ||||||
| 70 | Royal Dutch Shell plc ADR | 4,639 | ||||||
| 136 | Southwestern Energy Co. ● | 4,961 | ||||||
| 87,286 | ||||||||
| Food and Staples Retailing - 1.3% | ||||||||
| 160 | CVS Caremark Corp. | 9,133 | ||||||
| Food, Beverage and Tobacco - 3.7% | ||||||||
| 71 | Anheuser-Busch InBev N.V. | 6,420 | ||||||
| 35 | Diageo plc ADR | 3,981 | ||||||
| 46 | Kraft Foods Group, Inc. | 2,597 | ||||||
| 68 | PepsiCo, Inc. | 5,533 | ||||||
| 74 | Philip Morris International, Inc. | 6,441 | ||||||
| 24,972 | ||||||||
| Health Care Equipment and Services - 4.5% | ||||||||
| 136 | Baxter International, Inc. | 9,452 | ||||||
| 140 | Covidien plc | 8,794 | ||||||
| 192 | UnitedHealth Group, Inc. | 12,594 | ||||||
| 30,840 | ||||||||
| Insurance - 7.4% | ||||||||
| 141 | ACE Ltd. | 12,647 | ||||||
| 182 | American International Group, Inc. ● | 8,116 | ||||||
| 71 | Chubb Corp. | 5,987 | ||||||
| 273 | Marsh & McLennan Cos., Inc. | 10,914 | ||||||
| 148 | Principal Financial Group, Inc. | 5,546 | ||||||
| 247 | Unum Group | 7,249 | ||||||
| 50,459 | ||||||||
| Materials - 4.9% | ||||||||
| 105 | Barrick Gold Corp. | 1,659 | ||||||
| 182 | Dow Chemical Co. | 5,856 | ||||||
| 104 | E.I. DuPont de Nemours & Co. | 5,435 | ||||||
| 146 | International Paper Co. | 6,490 | ||||||
| 106 | Mosaic Co. | 5,729 | ||||||
| 85 | Nucor Corp. | 3,662 | ||||||
| 300 | Steel Dynamics, Inc. | 4,475 | ||||||
| 33,306 | ||||||||
| Media - 2.9% | ||||||||
| 102 | CBS Corp. Class B | 4,966 | ||||||
| 204 | Comcast Corp. Class A | 8,542 | ||||||
| 193 | Thomson Reuters Corp. | 6,281 | ||||||
| 19,789 | ||||||||
| Pharmaceuticals, Biotechnology and Life Sciences - 8.5% | ||||||||
| 76 | Amgen, Inc. | 7,513 | ||||||
| 81 | �� | Johnson & Johnson | 6,915 | |||||
| 368 | Merck & Co., Inc. | 17,107 | ||||||
| 296 | Pfizer, Inc. | 8,279 | ||||||
| 38 | Roche Holding AG | 9,551 | ||||||
| 137 | Teva Pharmaceutical Industries Ltd. ADR | 5,368 | ||||||
| 93 | Zoetis, Inc. | 2,877 | ||||||
| 57,610 | ||||||||
| Retailing - 5.1% | ||||||||
| 19 | AutoZone, Inc. ● | 8,025 | ||||||
| 3,040 | Buck Holdings L.P. ⌂●† | 923 | ||||||
| 94 | Home Depot, Inc. | 7,285 | ||||||
| 82 | Kohl’s Corp. | 4,155 | ||||||
| 216 | Lowe’s Cos., Inc. | 8,847 | ||||||
| 89 | Nordstrom, Inc. | 5,325 | ||||||
| 34,560 | ||||||||
| Semiconductors and Semiconductor Equipment - 4.0% | ||||||||
| 155 | Analog Devices, Inc. | 6,963 | ||||||
| 443 | Intel Corp. | 10,718 | ||||||
| 235 | Xilinx, Inc. | 9,312 | ||||||
| 26,993 | ||||||||
| Software and Services - 1.6% | ||||||||
| 253 | Microsoft Corp. | 8,738 | ||||||
| 106 | Symantec Corp. | 2,375 | ||||||
| 11,113 | ||||||||
| Technology Hardware and Equipment - 5.0% | ||||||||
| 902 | Cisco Systems, Inc. | 21,922 | ||||||
| 523 | EMC Corp. | 12,356 | ||||||
| 34,278 | ||||||||
| Telecommunication Services - 2.1% | ||||||||
| 217 | AT&T, Inc. | 7,681 | ||||||
| 126 | Verizon Communications, Inc. | 6,354 | ||||||
| 14,035 | ||||||||
The accompanying notes are an integral part of these financial statements.
| 5 |
| Hartford Value HLS Fund |
| Schedule of Investments – (continued) |
| June 30, 2013 (Unaudited) |
| (000’s Omitted) |
| Shares or Principal Amount | Market Value ╪ | |||||||||||
| COMMON STOCKS - 99.6% - (continued) | ||||||||||||
| Utilities - 3.0% | ||||||||||||
| 120 | Edison International | $ | 5,778 | |||||||||
| 70 | Entergy Corp. | 4,891 | ||||||||||
| 44 | NextEra Energy, Inc. | 3,557 | ||||||||||
| 146 | Northeast Utilities | 6,116 | ||||||||||
| 20,342 | ||||||||||||
| Total common stocks | ||||||||||||
| (cost $510,941) | $ | 676,710 | ||||||||||
| Total long-term investments | ||||||||||||
| (cost $510,941) | $ | 676,710 | ||||||||||
| SHORT-TERM INVESTMENTS - 0.7% | ||||||||||||
| Repurchase Agreements - 0.7% | ||||||||||||
| Bank of America Merrill Lynch TriParty Repurchase Agreement (maturing on 07/01/2013 in the amount of $17, collateralized by GNMA 3.00%, 2042, value of $17) | ||||||||||||
| $ | 17 | 0.13%, 6/28/2013 | $ | 17 | ||||||||
| Bank of Montreal TriParty Repurchase Agreement (maturing on 07/01/2013 in the amount of $363, collateralized by FHLMC 4.00% - 5.00%, 2023 - 2025, FNMA 2.00% - 5.00%, 2022 - 2042, GNMA 2.00% - 5.00%, 2041 - 2043, value of $369) | ||||||||||||
| 363 | 0.15%, 6/28/2013 | 363 | ||||||||||
| Bank of Montreal TriParty Repurchase Agreement (maturing on 07/01/2013 in the amount of $705, collateralized by FHLB 0.38%, 2015, FHLMC 0.38%, 2014, FNMA 0.50% - 5.50%, 2015 - 2042, value of $718) | ||||||||||||
| 705 | 0.12%, 6/28/2013 | 705 | ||||||||||
| Barclays Capital TriParty Repurchase Agreement (maturing on 07/01/2013 in the amount of $489, collateralized by U.S. Treasury Note 3.13%, 2021, value of $497) | ||||||||||||
| 489 | 0.10%, 6/28/2013 | 489 | ||||||||||
| Citigroup Global Markets, Inc. TriParty Repurchase Agreement (maturing on 07/01/2013 in the amount of $1,441, collateralized by U.S. Treasury Bill 0.85%, 2013, U.S. Treasury Note 0.63% - 3.25%, 2013 - 2018, value of $1,462) | ||||||||||||
| 1,441 | 0.10%, 6/28/2013 | 1,441 | ||||||||||
| Deutsche Bank Securities TriParty Repurchase Agreement (maturing on 07/01/2013 in the amount of $17, collateralized by FNMA 4.50%, 2035, value of $17) | ||||||||||||
| 17 | 0.25%, 6/28/2013 | 17 | ||||||||||
| RBS Securities, Inc. TriParty Repurchase Agreement (maturing on 07/01/2013 in the amount of $578, collateralized by U.S. Treasury Note 1.00% - 2.63%, 2014 - 2020, value of $589) | ||||||||||||
| 578 | 0.10%, 6/28/2013 | 578 | ||||||||||
| TD Securities TriParty Repurchase Agreement (maturing on 07/01/2013 in the amount of $1,019, collateralized by FHLMC 3.50% - 4.00%, 2042, FNMA 3.50% - 4.50%, 2041 - 2042, value of $1,036) | ||||||||||||
| 1,019 | 0.12%, 6/28/2013 | 1,019 | ||||||||||
| UBS Securities, Inc. Repurchase Agreement (maturing on 07/01/2013 in the amount of $15, collateralized by U.S. Treasury Note 0.63%, 2014, value of $15) | ||||||||||||
| 15 | 0.09%, 6/28/2013 | 15 | ||||||||||
| 4,644 | ||||||||||||
| Total short-term investments | ||||||||||||
| (cost $4,644) | $ | 4,644 | ||||||||||
| Total investments | ||||||||||||
| (cost $515,585) ▲ | 100.3 | % | $ | 681,354 | ||||||||
| Other assets and liabilities | (0.3 | )% | (2,135 | ) | ||||||||
| Total net assets | 100.0 | % | $ | 679,219 | ||||||||
The accompanying notes are an integral part of these financial statements.
| 6 |
| Note: | Percentage of investments as shown is the ratio of the total market value to total net assets. |
Prices of foreign equities that are principally traded on certain foreign markets may be adjusted daily pursuant to a fair value pricing service approved by the Board of Directors in order to reflect an adjustment for factors occurring after the close of certain foreign markets but before the close of the New York Stock Exchange.
| ▲ | At June 30, 2013, the cost of securities for federal income tax purposes was $521,344 and the aggregate gross unrealized appreciation and depreciation based on that cost were: |
| Unrealized Appreciation | $ | 173,707 | ||
| Unrealized Depreciation | (13,697 | ) | ||
| Net Unrealized Appreciation | $ | 160,010 |
| † | These securities were valued in good faith at fair value as determined under policies and procedures established by and under the supervision of the Company’s Board of Directors. At June 30, 2013, the aggregate value of these securities was $939, which represents 0.1% of total net assets. This amount excludes securities that are principally traded in certain foreign markets and whose prices are adjusted pursuant to a third party pricing service methodology approved by the Board of Directors. |
| ● | Non-income producing. |
| ■ | Securities issued within terms of a private placement memorandum, exempt from registration under Rule 144A under the Securities Act of 1933, as amended, and may be sold only to qualified institutional buyers. Unless otherwise indicated, these holdings are determined to be liquid. At June 30, 2013, the aggregate value of these securities was $16, which rounds to zero percent of total net assets. |
| ⌂ | The following securities are considered illiquid. Illiquid securities are often purchased in private placement transactions, are often not registered under the Securities Act of 1933 and may have contractual restrictions on resale. A security may also be considered illiquid if the security lacks a readily available market or if its valuation has not changed for a certain period of time. |
| Period Acquired | Shares/ Par | Security | Cost Basis | |||||||
| 06/2007 | 3,040 | Buck Holdings L.P. | $ | 214 | ||||||
| 03/2007 | 230 | Solar Cayman Ltd. - 144A | 67 | |||||||
At June 30, 2013, the aggregate value of these securities was $939, which represents 0.1% of total net assets.
Foreign Currency Contracts Outstanding at June 30, 2013
| Currency | Buy / Sell | Delivery Date | Counterparty | Contract Amount | Market Value ╪ | Unrealized Appreciation/ (Depreciation) | ||||||||||||||
| CHF | Sell | 07/01/2013 | BCLY | $ | 70 | $ | 70 | $ | – | |||||||||||
| ╪ | See Significant Accounting Policies of accompanying Notes to Financial Statements regarding valuation of securities. |
| GLOSSARY: (abbreviations used in preceding Schedule of Investments) | |
| Counterparty Abbreviations: | |
| BCLY | Barclays |
| Currency Abbreviations: | |
| CHF | Swiss Franc |
| Other Abbreviations: | |
| ADR | American Depositary Receipt |
| FHLB | Federal Home Loan Bank |
| FHLMC | Federal Home Loan Mortgage Corp. |
| FNMA | Federal National Mortgage Association |
| GNMA | Government National Mortgage Association |
The accompanying notes are an integral part of these financial statements.
| 7 |
| Hartford Value HLS Fund |
| Investment Valuation Hierarchy Level Summary |
| June 30, 2013 (Unaudited) |
| (000��s Omitted) |
| Total | Level 1 ♦ | Level 2 ♦ | Level 3 | |||||||||||||
| Assets: | ||||||||||||||||
| Common Stocks ‡ | $ | 676,710 | $ | 666,220 | $ | 9,551 | $ | 939 | ||||||||
| Short-Term Investments | 4,644 | – | 4,644 | – | ||||||||||||
| Total | $ | 681,354 | $ | 666,220 | $ | 14,195 | $ | 939 | ||||||||
| Foreign Currency Contracts * | – | – | – | – | ||||||||||||
| Total | $ | – | $ | – | $ | – | $ | – | ||||||||
| ♦ | For the six-month period ended June 30, 2013, there were no transfers between Level 1 and Level 2. |
| ‡ | The Fund has all or primarily all of the equity securities categorized in a particular level. Refer to the Schedule of Investments for further industry breakout. |
| * | Derivative instruments not reflected in the Schedule of Investments are valued at the unrealized appreciation/depreciation on the investments. |
Following is a reconciliation of Level 3 assets for which significant unobservable inputs were used to determine fair value:
| Balance as of December 31, 2012 | Realized Gain (Loss) | Change in Unrealized Appreciation (Depreciation) | Net Amortization | Purchases | Sales | Transfers Into Level 3 | Transfers Out of Level 3 | Balance as of June 30, 2013 | ||||||||||||||||||||||||||||
| Assets: | ||||||||||||||||||||||||||||||||||||
| Common Stocks | $ | 2,190 | $ | 1,382 | $ | (916 | )* | $ | — | $ | — | $ | (1,717 | ) | $ | — | $ | — | $ | 939 | ||||||||||||||||
| Total | $ | 2,190 | $ | 1,382 | $ | (916 | ) | $ | — | $ | — | $ | (1,717 | ) | $ | — | $ | — | $ | 939 | ||||||||||||||||
| * | Change in unrealized appreciation (depreciation) in the current period relating to assets still held at June 30, 2013 was $(916). |
The accompanying notes are an integral part of these financial statements.
| 8 |
| Hartford Value HLS Fund |
| Statement of Assets and Liabilities |
| June 30, 2013 (Unaudited) |
| (000’s Omitted) |
| Assets: | ||||
| Investments in securities, at market value (cost $515,585) | $ | 681,354 | ||
| Cash | 2 | |||
| Unrealized appreciation on foreign currency contracts | — | |||
| Receivables: | ||||
| Investment securities sold | 69 | |||
| Fund shares sold | 131 | |||
| Dividends and interest | 866 | |||
| Other assets | — | |||
| Total assets | 682,422 | |||
| Liabilities: | ||||
| Payables: | ||||
| Investment securities purchased | 2,376 | |||
| Fund shares redeemed | 693 | |||
| Investment management fees | 81 | |||
| Distribution fees | 4 | |||
| Accrued expenses | 49 | |||
| Total liabilities | 3,203 | |||
| Net assets | $ | 679,219 | ||
| Summary of Net Assets: | ||||
| Capital stock and paid-in-capital | $ | 602,566 | ||
| Undistributed net investment income | 6,133 | |||
| Accumulated net realized loss | (95,249 | ) | ||
| Unrealized appreciation of investments and the translations of assets and liabilities denominated in foreign currency | 165,769 | |||
| Net assets | $ | 679,219 | ||
| Shares authorized | 800,000 | |||
| Par value | $ | 0.001 | ||
| Class IA: Net asset value per share | $ | 13.79 | ||
| Shares outstanding | 41,366 | |||
| Net assets | $ | 570,618 | ||
| Class IB: Net asset value per share | $ | 13.77 | ||
| Shares outstanding | 7,889 | |||
| Net assets | $ | 108,601 |
The accompanying notes are an integral part of these financial statements.
| 9 |
| Hartford Value HLS Fund |
| Statement of Operations |
| For the Six-Month Period Ended June 30, 2013 (Unaudited) |
| (000’s Omitted) |
| Investment Income: | ||||
| Dividends | $ | 8,980 | ||
| Interest | 3 | |||
| Less: Foreign tax withheld | (112 | ) | ||
| Total investment income, net | 8,871 | |||
| Expenses: | ||||
| Investment management fees | 2,494 | |||
| Distribution fees - Class IB | 135 | |||
| Custodian fees | 4 | |||
| Accounting services fees | 34 | |||
| Board of Directors’ fees | 9 | |||
| Audit fees | 8 | |||
| Other expenses | 56 | |||
| Total expenses (before fees paid indirectly) | 2,740 | |||
| Commission recapture | (2 | ) | ||
| Total fees paid indirectly | (2 | ) | ||
| Total expenses, net | 2,738 | |||
| Net Investment Income | 6,133 | |||
| Net Realized Gain on Investments and Foreign Currency Transactions: | ||||
| Net realized gain on investments | 36,776 | |||
| Net realized gain on foreign currency contracts | 41 | |||
| Net realized loss on other foreign currency transactions | (56 | ) | ||
| Net Realized Gain on Investments and Foreign Currency Transactions | 36,761 | |||
| Net Changes in Unrealized Appreciation of Investments and Foreign Currency Transactions: | ||||
| Net unrealized appreciation of investments | 60,199 | |||
| Net unrealized appreciation of foreign currency contracts | — | |||
| Net unrealized appreciation on translation of other assets and liabilities in foreign currencies | — | |||
| Net Changes in Unrealized Appreciation of Investments and Foreign Currency Transactions | 60,199 | |||
| Net Gain on Investments and Foreign Currency Transactions | 96,960 | |||
| Net Increase in Net Assets Resulting from Operations | $ | 103,093 |
The accompanying notes are an integral part of these financial statements.
| 10 |
| Hartford Value HLS Fund |
| Statement of Changes in Net Assets |
| (000’s Omitted) |
| For the Six-Month Period Ended June 30, 2013 (Unaudited) | For the Year Ended December 31, 2012 | |||||||
| Operations: | ||||||||
| Net investment income | $ | 6,133 | $ | 13,773 | ||||
| Net realized gain on investments and foreign currency transactions | 36,761 | 45,302 | ||||||
| Net unrealized appreciation of investments | 60,199 | 51,181 | ||||||
| Net Increase in Net Assets Resulting from Operations | 103,093 | 110,256 | ||||||
| Distributions to Shareholders: | ||||||||
| From net investment income | ||||||||
| Class IA | — | (12,440 | ) | |||||
| Class IB | — | (2,077 | ) | |||||
| Total distributions | — | (14,517 | ) | |||||
| Capital Share Transactions: | ||||||||
| Class IA | ||||||||
| Sold | 21,622 | 29,616 | ||||||
| Issued on reinvestment of distributions | — | 12,440 | ||||||
| Redeemed | (87,129 | ) | (164,750 | ) | ||||
| Total capital share transactions | (65,507 | ) | (122,694 | ) | ||||
| Class IB | ||||||||
| Sold | 6,346 | 10,336 | ||||||
| Issued on reinvestment of distributions | — | 2,077 | ||||||
| Redeemed | (17,379 | ) | (35,556 | ) | ||||
| Total capital share transactions | (11,033 | ) | (23,143 | ) | ||||
| Net decrease from capital share transactions | (76,540 | ) | (145,837 | ) | ||||
| Net Increase (Decrease) in Net Assets | 26,553 | (50,098 | ) | |||||
| Net Assets: | ||||||||
| Beginning of period | 652,666 | 702,764 | ||||||
| End of period | $ | 679,219 | $ | 652,666 | ||||
| Undistributed (distribution in excess of) net investment income | $ | 6,133 | $ | — | ||||
| Shares: | ||||||||
| Class IA | ||||||||
| Sold | 1,643 | 2,604 | ||||||
| Issued on reinvestment of distributions | — | 1,054 | ||||||
| Redeemed | (6,598 | ) | (14,358 | ) | ||||
| Total share activity | (4,955 | ) | (10,700 | ) | ||||
| Class IB | ||||||||
| Sold | 480 | 906 | ||||||
| Issued on reinvestment of distributions | — | 176 | ||||||
| Redeemed | (1,322 | ) | (3,113 | ) | ||||
| Total share activity | (842 | ) | (2,031 | ) | ||||
The accompanying notes are an integral part of these financial statements.
| 11 |
| Hartford Value HLS Fund |
| Notes to Financial Statements |
| June 30, 2013 (Unaudited) |
| (000’s Omitted) |
| 1. | Organization: |
Hartford Value HLS Fund (the “Fund”) serves as an underlying investment option for certain variable annuity and variable life insurance separate accounts of Hartford Life Insurance Company (“HLIC”) and its affiliates and certain qualified retirement plans. The Fund may also serve as an underlying investment option for certain variable annuity and variable life separate accounts of other insurance companies. Owners of variable annuity contracts and policyholders of variable life insurance contracts may choose the funds permitted in the variable insurance contract prospectus. In addition, participants in certain qualified retirement plans may choose the Fund if permitted by their plans.
Hartford Series Fund, Inc. (the “Company”) is an open-end registered management investment company comprised of thirty portfolios. Financial statements for the Fund, a series of the Company, are included in this report.
The Company is organized under the laws of the State of Maryland and is registered with the Securities and Exchange Commission (“SEC”) under the Investment Company Act of 1940, as amended (“1940 Act”). The Fund is a diversified open-end management investment company.
The Fund is divided into Class IA and Class IB shares. Each class is offered at the per share net asset value (“NAV”) without a sales charge and is subject to the same expenses, except that the Class IB shares are subject to distribution and service fees charged pursuant to a Distribution Plan adopted in accordance with Rule 12b-1 under the 1940 Act.
| 2. | Significant Accounting Policies: |
The following is a summary of significant accounting policies of the Fund in the preparation of its financial statements, which are in accordance with the United States Generally Accepted Accounting Principles (“U.S. GAAP”). The preparation of financial statements in accordance with U.S. GAAP may require management to make estimates and assumptions that affect the reported amounts of assets and liabilities and disclosure of contingent assets and liabilities at the date of the financial statements and the reported amounts of increases and decreases in net assets from operations during the reporting period. Actual results could differ from those estimates.
| a) | Determination of Net Asset Value – The NAV of each class of the Fund’s shares is determined as of the close of regular trading (normally 4:00 p.m. Eastern Time) (the “NYSE Close”) on each day that the New York Stock Exchange (the “Exchange”) is open (“Valuation Date”). Information that becomes known to the Fund after the NAV has been calculated on a particular day will not generally be used to retroactively adjust the NAV determined earlier that day. |
| b) | Investment Valuation and Fair Value Measurements – For purposes of calculating the NAV, portfolio investments and other assets held by the Fund's portfolio for which market quotes are readily available are valued at market value. Market value is generally determined on the basis of last reported sales prices or official close price. If no sales are reported, market value is based on quotes obtained from a quotation reporting system, established market makers, or independent pricing services. If market prices are not readily available or are deemed unreliable, the Fund will use the fair value of the investment as determined in good faith under policies and procedures established by and under the supervision of the Company’s Board of Directors. Market quotes are considered not readily available where there is an absence of current or reliable market-based data (e.g., trade information or indicative market quotes), including where events occur after the close of the relevant market, but prior to the NYSE Close that materially affect the values of the Fund’s portfolio investments or assets. In addition, market quotes are considered not readily available when, due to extraordinary circumstances, the exchanges or markets on which the investments trade do not open for trading for the entire day and no other market prices are available. In addition, prices of foreign equities that are principally traded on certain foreign markets may be adjusted daily pursuant to a fair value pricing service approved by the Board of Directors in order to reflect an adjustment for the factors occurring after the close of certain foreign markets but before the NYSE Close. Investments that are primarily traded on foreign markets may trade on days that are not business days of the Fund. The value of the foreign investments in which the Fund invests may change on days when a shareholder will not be able to purchase or redeem shares of the Fund. Fair value pricing is subjective in nature and the use of fair value pricing by the |
| 12 |
Fund may cause the NAV of its shares to differ significantly from the NAV that would have been calculated using market prices at the close of the exchange on which a portfolio investment is primarily traded. There can be no assurance that the Fund could obtain the fair market value assigned to an investment if the Fund were to sell the investment at approximately the time at which the Fund determines its NAV.
Investments valued in currencies other than U.S. dollars are converted to U.S. dollars using exchange rates obtained from independent pricing services for calculation of the NAV. As a result, the NAV of the Fund’s shares may be affected by changes in the value of currencies in relation to the U.S. dollar. The value of investments traded in markets outside the United States or denominated in currencies other than the U.S. dollar may be affected significantly on a day that the NYSE is closed and the market value may change on days when an investor is not able to purchase, redeem or exchange shares of the Fund.
Foreign currency contracts represent agreements to exchange currencies on specific future dates at predetermined rates. Foreign currency contracts are valued using foreign currency exchange rates and forward rates as provided by an independent pricing service on the Valuation Date.
Financial instruments for which prices are not available from an independent pricing service may be valued using market quotations obtained from one or more dealers that make markets in the respective financial instrument in accordance with procedures established by the Company’s Board of Directors.
U.S. GAAP defines fair value as the price that the Fund would receive to sell an asset or pay to transfer a liability in an orderly transaction between market participants. The U.S. GAAP fair value measurement standards require disclosure of a fair value hierarchy for each major category of assets and liabilities. Various inputs are used in determining the fair value of the Fund’s investments. These inputs are summarized into three broad hierarchy levels. This hierarchy is based on whether the valuation inputs are observable or unobservable. These levels are:
| · | Level 1 – Quoted prices in active markets for identical investments. Level 1 may include exchange traded instruments, such as domestic equities, some foreign equities, options, futures, mutual funds, exchange traded funds, rights and warrants. |
| · | Level 2 – Observable inputs other than Level 1 prices, such as quoted prices for similar investments; quoted prices in markets that are not active; or other inputs that are observable or can be corroborated by observable market data. Level 2 may include debt investments that are traded less frequently than exchange traded instruments and which are valued using independent pricing services; foreign equities, which are principally traded on certain foreign markets and are adjusted daily pursuant to a fair value pricing service in order to reflect an adjustment for the factors occurring after the close of certain foreign markets but before the NYSE Close; and short-term investments, which are valued at amortized cost. |
| · | Level 3 – Significant unobservable inputs that are supported by limited or no market activity. Level 3 may include financial instruments whose values are determined using indicative market quotes or require significant management judgment or estimation. These unobservable valuation inputs may include estimates for current yields, maturity/duration, prepayment speed, and indicative market quotes for comparable investments along with other assumptions relating to credit quality, collateral value, complexity of the investment structure, general market conditions and liquidity. This category may include investments where trading has been halted or there are certain restrictions on trading. While these investments are priced using unobservable inputs, the valuation of these investments reflects the best available data and management believes the prices are a reasonable representation of exit price. |
The Board of Directors of the Company generally reviews and approves the “Procedures for Valuation of Portfolio Securities” on an annual basis. These procedures define how investments are to be valued, including the formation and activities of a Valuation Committee. The Valuation Committee is responsible for determining in good faith the fair value of investments when the value cannot be obtained from primary pricing services or alternative sources or if the valuation of an investment as provided by the primary pricing service or alternative
| 13 |
| Hartford Value HLS Fund |
| Notes to Financial Statements – (continued) |
| June 30, 2013 (Unaudited) |
| (000’s Omitted) |
source is believed not to reflect the investment’s fair value as of the Valuation Date. Members of the Valuation Committee include the Fund’s Treasurer or designee, a Vice President of the Fund with legal expertise or designee, and a Vice President of the investment manager or designee. In addition, the Fund’s Chief Compliance Officer shall designate a member of the compliance group to attend Valuation Committee meetings as a non-voting resource, to monitor for and provide guidance with respect to compliance with these procedures. Two members of the Valuation Committee or their designees, representing different departments, shall constitute a quorum for purposes of permitting the Valuation Committee to take action. The Valuation Committee will consider all relevant factors in determining an investment’s fair value, and may seek the advice of the Fund’s sub-adviser, knowledgeable brokers, and legal counsel in making such determination. The Valuation Committee reports to the Audit Committee of the Company’s Board of Directors. The Audit Committee receives quarterly written reports which include details of all fair-valued investments, including the reason for the fair valuation, and an indication, when possible, of the accuracy of the valuation by disclosing the next available reliable public price quotation or the disposition price of such investments (the “look-back” test). The Board of Directors then must consider for ratification all of the fair value determinations made during the previous quarter.
Valuation levels are not necessarily indicative of the risk associated with investing in such investments. Individual investments within any of the above mentioned asset classes may be assigned a different hierarchical level than those presented above, as individual circumstances dictate.
For additional information, refer to the Investment Valuation Hierarchy Level Summary and the Level 3 roll-forward reconciliation, if applicable, which follow the Schedule of Investments.
For purposes of reporting transfers between different hierarchy levels, both transfers in and out of each level, as applicable, are shown as if they occurred at the beginning of the period.
| c) | Investment Transactions and Investment Income – Investment transactions are recorded as of the trade date (the date the order to buy or sell is executed) for financial reporting purposes. Investments purchased or sold on a when-issued or delayed-delivery basis may be settled a month or more after the trade date. Realized gains and losses are determined on the basis of identified cost. |
Dividend income from domestic securities is accrued on the ex-dividend date. In general, dividend income from foreign securities is recorded on the ex-date; however, dividend notifications in certain foreign jurisdictions may not be available in a timely manner and as a result, the Fund will record the dividend as soon as the relevant details (i.e., rate per share, payment date, shareholders of record, etc.) are publicly available. Interest income, including amortization of premium and accretion of discounts, is accrued on a daily basis.
| d) | Foreign Currency Transactions – Assets and liabilities denominated in currencies other than U.S. dollars are translated into U.S. dollars at the exchange rates in effect on the valuation date. Purchases and sales of investments, income, and expenses are translated into U.S. dollars at the exchange rates on the dates of such transactions. |
The Fund does not isolate that portion of portfolio investment valuation resulting from fluctuations in the foreign currency exchange rates from the fluctuations arising from changes in the market prices of investments held. Exchange rate fluctuations are included with the net realized and unrealized gain or loss on investments in the accompanying financial statements.
��
Net realized foreign exchange gains or losses arise from sales of foreign currencies and the difference between asset and liability amounts initially stated in foreign currencies and the U.S. dollar value of the amounts actually received or paid. Net unrealized foreign exchange gains or losses arise from changes in the value of other assets and liabilities at the end of the reporting period, resulting from changes in the exchange rates.
| 14 |
| e) | Joint Trading Account – The Fund may invest cash balances into a joint trading account that may be invested in one or more repurchase agreements. |
| f) | Fund Share Valuation and Dividend Distributions to Shareholders – Orders for the Fund’s shares are executed in accordance with the investment instructions of the contract holders and plan participants. The NAV of the Fund’s shares is determined as of the close of business on each business day of the Exchange. The NAV is determined separately for each class of shares of the Fund by dividing the Fund’s net assets attributable to that class by the number of shares of the class outstanding. Each class of shares offered by the Fund has equal rights as to assets and voting privileges (except that shareholders of a class have exclusive voting rights regarding any matter relating solely to that class of shares). Income and non-class specific expenses are allocated daily to each class on the basis of the relative net assets of the class. Realized and unrealized capital gains and losses are allocated daily based on the relative net assets of each class of shares of the Fund. |
Orders for the purchase of the Fund’s shares received prior to the close of the Exchange on any day the Exchange is open for business are priced at the NAV determined as of the close of the Exchange. Orders received after the close of the Exchange, or on a day on which the Exchange and/or the Fund is not open for business, are priced at the next determined NAV.
Dividends are declared pursuant to a policy adopted by the Company’s Board of Directors based upon the investment performance of the Fund. The policy of the Fund is to pay dividends from net investment income and realized capital gains, if any, at least once a year.
Distributions from net investment income, net realized capital gains and capital are determined in accordance with federal income tax regulations, which may differ from U.S. GAAP with respect to character and timing. These differences may include but are not limited to losses deferred due to wash sale adjustments, foreign currency gains and losses, adjustments related to Passive Foreign Investment Companies (“PFICs”), Real Estate Investment Trusts (“REITs”), Regulated Investment Companies (“RICs”), certain derivatives and partnerships. Permanent book and federal income tax basis differences relating to shareholder distributions will result in reclassifications to certain of the Fund’s capital accounts (see Federal Income Taxes: Reclassification of Capital Accounts note).
| 3. | Securities and Other Investments: |
| a) | Repurchase Agreements – A repurchase agreement is an agreement by which a counterparty agrees to sell an investment and agrees to repurchase the investment sold from the buyer at a mutually agreed upon time and price. During the period of the repurchase agreement, the counterparty will deposit cash and or securities in a third party custodial account to serve as collateral. At the time the Fund enters into a repurchase agreement, the value of the underlying collateral, including accrued interest, will be equal to or exceed the value of the repurchase agreement. Repurchase agreements expose the Fund to counterparty risk - that is, the risk that the counterparty will not fulfill its obligations. To minimize counterparty risk, the investments that serve to collateralize the repurchase agreement are held by the Fund’s custodian in book entry or physical form in the custodial account of the Fund or in a third party custodial account. Repurchase agreements are valued at cost plus accrued interest, which approximates fair value. Repurchase agreements have master netting agreements which allow the Fund to offset amounts owed to a counterparty with amounts owed by the counterparty, including any collateral. The Fund, as shown on the Schedule of Investments, had outstanding repurchase agreements as of June 30, 2013. |
| b) | Illiquid and Restricted Investments – The Fund is permitted to invest up to 15% of its net assets in illiquid investments. Illiquid investments are those that may not be sold or disposed of in the ordinary course of business within seven days, at approximately the price used to determine the Fund’s NAV. The Fund may not be able to sell illiquid investments when its sub-adviser considers it desirable to do so or may have to sell such investments at a price that is lower than the price that could be obtained if the investments were more liquid. A sale of illiquid investments may require more time and may result in higher dealer discounts and other selling expenses than does the sale of those that are liquid. Illiquid investments also may be more difficult to value due to the unavailability of reliable market quotations for such |
| 15 |
| Hartford Value HLS Fund |
| Notes to Financial Statements – (continued) |
| June 30, 2013 (Unaudited) |
| (000’s Omitted) |
investments, and an investment in them may have an adverse impact on the Fund’s NAV. The Fund may also purchase certain restricted investments that can only be resold to certain qualified investors and may be determined to be liquid pursuant to policies and guidelines established by the Company’s Board of Directors. The Fund, as shown on the Schedule of Investments, had illiquid and/or restricted investments as of June 30, 2013.
| 4. | Financial Derivative Instruments: |
The following disclosures contain information on how and why the Fund uses derivative instruments, the credit-risk-related contingent features in certain derivative instruments, and how derivative instruments affect the Fund’s financial position and results of operations. The location and fair value amounts of these instruments on the Statement of Assets and Liabilities and the realized gains and losses and changes in unrealized gains and losses on the Statement of Operations, each categorized by type of derivative contract, are included in the following Additional Derivative Instrument Information footnote. The derivative instruments outstanding as of period-end are disclosed in the notes to or within the Schedule of Investments for purchased options, if applicable. The amounts of realized gains and losses and changes in unrealized gains and losses on derivative instruments during the period are disclosed in the Statement of Operations.
| a) | Foreign Currency Contracts – The Fund may enter into foreign currency contracts that obligate the Fund to purchase or sell currencies at specified future dates. Foreign currency contracts are used to hedge the currency exposure associated with some or all of the Fund’s investments and/or as part of an investment strategy. Foreign currency contracts are marked to market daily and the change in value is recorded by the Fund as an unrealized gain or loss. The Fund will record a realized gain or loss when the foreign currency contract is settled. |
Foreign currency contracts involve elements of market risk in excess of the amounts reflected in the Statement of Assets and Liabilities. In addition, risks may arise upon entering into these contracts from the potential inability of the counterparties to meet the terms of the contracts and from unanticipated movements in the value of the foreign currencies relative to the U.S. dollar. The Fund had outstanding foreign currency contracts as shown on the Schedule of Investments as of June 30, 2013.
| b) | Additional Derivative Instrument Information: |
Fair Value of Derivative Instruments on the Statement of Assets and Liabilities as of June 30, 2013:
| Risk Exposure Category | ||||||||||||||||||||||||||||
| Interest Rate Contracts | Foreign Exchange Contracts | Credit Contracts | Equity Contracts | Commodity Contracts | Other Contracts | Total | ||||||||||||||||||||||
| Assets: | ||||||||||||||||||||||||||||
| Unrealized appreciation on foreign currency contracts | $ | — | $ | — | $ | — | $ | — | $ | — | $ | — | $ | — | ||||||||||||||
| Total | $ | — | $ | — | $ | — | $ | — | $ | — | $ | — | $ | — | ||||||||||||||
The volume of derivatives that is presented in the Schedule of Investments is consistent with the derivative activity during the six-month period ended June 30, 2013.
| 16 |
The Effect of Derivative Instruments on the Statement of Operations for the six-month period ended June 30, 2013:
| Risk Exposure Category | ||||||||||||||||||||||||||||
| Interest Rate Contracts | Foreign Exchange Contracts | Credit Contracts | Equity Contracts | Commodity Contracts | Other Contracts | Total | ||||||||||||||||||||||
| Realized Gain on Derivatives Recognized as a Result of Operations: | ||||||||||||||||||||||||||||
| Net realized gain on foreign currency contracts | $ | — | $ | 41 | $ | — | $ | — | $ | — | $ | — | $ | 41 | ||||||||||||||
| Total | $ | — | $ | 41 | $ | — | $ | — | $ | — | $ | — | $ | 41 | ||||||||||||||
| Net Change in Unrealized Appreciation (Depreciation) on Derivatives Recognized as a Result of Operations: | ||||||||||||||||||||||||||||
| Net change in unrealized appreciation of foreign currency contracts | $ | — | $ | — | $ | — | $ | — | $ | — | $ | — | $ | — | ||||||||||||||
| Total | $ | — | $ | — | $ | — | $ | — | $ | — | $ | — | $ | — | ||||||||||||||
| c) | Balance Sheet Offsetting Information: |
Set forth below are tables which disclose both gross information and net information about instruments and transactions eligible for offset in the financial statements, and instruments and transactions that are subject to a master netting agreement, as well as amounts related to margin, reflected as financial collateral (including cash collateral), held at clearing brokers, counterparties, and the Fund’s custodian. The master netting agreements allow the clearing brokers to net any collateral held in or on behalf of the Fund, or liabilities or payment obligations of the clearing brokers to the Fund, against any liabilities or payment obligations of the Fund to the clearing brokers. The Fund is required to deposit financial collateral (including cash collateral) at the Fund’s custodian on behalf of clearing brokers and counterparties to continually meet the original and maintenance requirements established by the clearing brokers and counterparties. Such requirements are specific to the respective clearing broker or counterparty.
Offsetting of Financial Assets and Derivative Assets as of June 30, 2013:
| Description | Gross Amounts of Recognized Assets | Gross Amounts Offset in Statement of Assets and Liabilities | Net Amounts of Assets Presented in Statement of Assets and Liabilities | Financial Instruments with Allowable Netting | Collateral Received | Net Amount (not less than 0) | ||||||||||||||||||
| Repurchase Agreements | $ | 4,644 | $ | — | $ | 4,644 | $ | — | $ | (4,720 | ) | $ | — | |||||||||||
| Unrealized appreciation on foreign currency contracts | — | — | — | — | — | — | ||||||||||||||||||
| Total subject to a master netting or similar arrangement | $ | 4,644 | $ | — | $ | 4,644 | $ | — | $ | (4,720 | ) | $ | — | |||||||||||
| 5. | Principal Risks: |
| a) | Counterparty Risk – The Fund may be exposed to counterparty risk, or the risk that an institution or other entity with which the Fund has unsettled or open transactions will default. |
| b) | Market Risks – If the Fund invests directly in foreign currencies or in securities that trade in, and receive revenues in, foreign currencies, or in derivatives that provide exposure to foreign currencies, it will be subject to the risk that those currencies will decline in value relative to the base currency of the Fund, or, in the case of hedging positions, that the Fund’s base currency will decline in value relative to the currency being hedged. Currency rates in foreign countries may fluctuate significantly over short periods of time for a number of reasons, including changes in interest rates, intervention (or the failure to intervene) by U.S. or foreign governments, central banks or supranational entities, such as the International Monetary Fund, or by the imposition of currency controls or other political developments in the United States or abroad. As a result, the Fund’s investments in foreign currency denominated securities may reduce the returns of the Fund. The market values of equity securities, such as common stocks and preferred stocks, or equity related investments, such as futures and options, may decline due to general market conditions which are not specifically related |
| 17 |
| Hartford Value HLS Fund |
| Notes to Financial Statements – (continued) |
| June 30, 2013 (Unaudited) |
| (000’s Omitted) |
to a particular company, such as real or perceived adverse economic conditions, changes in the general outlook for corporate earnings, changes in interest or currency rates or adverse investor sentiment generally. The market value of equity securities may also decline due to factors which affect a particular industry or industries, such as labor shortages or increased production costs and competitive conditions within an industry. Equity securities and equity related investments generally have greater market price volatility than fixed income securities.
| 6. | Federal Income Taxes: |
| a) | Federal Income Taxes – For federal income tax purposes, the Fund intends to continue to qualify as a RIC under Subchapter M of the Internal Revenue Code (“IRC”) by distributing substantially all of its taxable net investment income and net realized capital gains to its shareholders and otherwise complying with the requirements of the IRC. The Fund has distributed substantially all of its income and capital gains in prior years, if applicable, and intends to distribute substantially all of its income and capital gains prior to the next fiscal year-end. Accordingly, no provision for federal income or excise taxes has been made in the accompanying financial statements. Distributions from short-term capital gains are treated as ordinary income distributions for federal income tax purposes. |
| b) | Net Investment Income (Loss), Net Realized Gains (Losses), and Distributions – Net investment income (loss) and net realized gains (losses) may differ for financial statement and tax purposes primarily because of losses deferred due to wash sale adjustments, foreign currency gains and losses, adjustments related to PFICs, REITs, RICs, certain derivatives and partnerships. The character of distributions made during the year from net investment income or net realized gains may differ from their ultimate characterization for federal income tax purposes. Also, due to the timing of dividend distributions, the fiscal year in which amounts are distributed may differ from the year that the income or realized gains (losses) were recorded by the Fund. |
| c) | Distributions and Components of Distributable Earnings – The tax character of distributions paid by the Fund for the periods indicated is as follows (as adjusted for dividends payable, if applicable): |
| For the Year Ended December 31, 2012 | For the Year Ended December 31, 2011 | |||||||
| Ordinary Income | $ | 14,517 | $ | 12,398 | ||||
As of December 31, 2012, the Fund’s components of distributable earnings (deficit) on a tax basis were as follows:
| Amount | ||||
| Accumulated Capital and Other Losses* | $ | (126,251 | ) | |
| Unrealized Appreciation† | 99,811 | |||
| Total Accumulated Deficit | $ | (26,440 | ) | |
| * | The Fund has capital loss carryforwards that are identified in the Capital Loss Carryforward note that follows. |
| † | Differences between book-basis and tax-basis unrealized appreciation (depreciation) may be attributable to the losses deferred due to wash sale adjustments, foreign currency gains and losses, adjustments related to PFICs, REITs, RICs, certain derivatives and partnerships. |
| 18 |
| d) | Reclassification of Capital Accounts – The Fund may record reclassifications in its capital accounts. These reclassifications have no impact on the total net assets of the Fund. The reclassifications are a result of permanent differences between U.S. GAAP and tax accounting for such items as foreign currency, PFICs, expiration or utilization of capital loss carryforwards or net operating losses. Adjustments are made to reflect the impact these items have on current and future distributions to shareholders. Therefore, the source of the Fund’s distributions may be shown in the accompanying Statement of Changes in Net Assets as from undistributed net investment income, from accumulated net realized gains on investments or from capital depending on the type of book and tax differences that exist. For the year ended December 31, 2012, the Fund recorded reclassifications to increase (decrease) the accounts listed below: |
| Amount | ||||
| Undistributed Net Investment Income | $ | (52 | ) | |
| Accumulated Net Realized Gain (Loss) | 56 | |||
| Capital Stock and Paid-in-Capital | (4 | ) | ||
| e) | Capital Loss Carryforward – On December 22, 2010, the Regulated Investment Company Modernization Act of 2010 (the “Act”) was enacted, which made changes to the capital loss carryforward rules. The changes are effective for taxable years beginning after the date of enactment. Under the Act, funds are permitted to carry forward capital losses for an unlimited period. However, any losses incurred during those future taxable years will be required to be utilized prior to the losses incurred in pre-enactment taxable years, which carry an expiration date. As a result of this ordering rule, pre-enactment capital loss carryforwards may be more likely to expire unused. Additionally, post-enactment capital loss carryforwards retain their character as either short-term or long-term capital losses rather than being considered all short-term as permitted under prior regulation. |
At December 31, 2012 (tax-year-end), the Fund had capital loss carryforwards for U.S. federal income tax purposes as follows:
| Year of Expiration | Amount | |||
| 2016 | $ | 82,242 | ||
| 2017 | 44,009 | |||
| Total | $ | 126,251 | ||
As a result of current or past mergers in the Fund, certain provisions in the Internal Revenue Code may limit the future utilization of capital losses. During the year ended December 31, 2012, the Fund utilized $43,923 of prior year capital loss carryforwards.
| f) | Accounting for Uncertainty in Income Taxes – The Fund has adopted financial reporting rules that require the Fund to analyze all open tax years, as defined by the statute of limitations, for all major jurisdictions. Generally, tax authorities can examine all tax returns filed for the last three years. The Fund does not have an examination in progress. |
The Fund has reviewed all open tax years and major jurisdictions and concluded that these financial reporting rules had no effect on the Fund’s financial position or results of operations. There is no tax liability resulting from unrecognized tax benefits relating to uncertain income tax positions taken or expected to be taken on the tax return for the fiscal year ended December 31, 2012. The Fund is also not aware of any tax positions for which it is reasonably possible that the total amounts of unrecognized tax benefits will significantly change in the next twelve months.
| 7. | Expenses: |
| a) | Investment Management Agreement – Hartford Funds Management Company, LLC (“HFMC”), an indirect wholly owned subsidiary of The Hartford Financial Services Group, Inc. (“The Hartford”), serves as investment manager to the Fund pursuant to an Investment Management Agreement with the Company. The investment manager has overall investment supervisory responsibility for the Fund. In addition, the investment manager provides administrative |
| 19 |
| Hartford Value HLS Fund |
| Notes to Financial Statements – (continued) |
| June 30, 2013 (Unaudited) |
| (000’s Omitted) |
personnel, services, equipment, facilities and office space for proper operation of the Fund. The investment manager has contracted with Wellington Management Company, LLP (“Wellington Management”) under a sub-advisory agreement for the provision of day-to-day investment management services to the Fund in accordance with the Fund’s investment objective and policies. The Fund pays a fee to the investment manager, a portion of which may be used to compensate Wellington Management.
The schedule below reflects the rates of compensation paid to HFMC for investment management services rendered as of June 30, 2013; the rates are accrued daily and paid monthly.
| Average Daily Net Assets | Annual Fee | |||
| On first $250 million | 0.7750 | % | ||
| On next $250 million | 0.7250 | % | ||
| On next $500 million | 0.6750 | % | ||
| On next $1.5 billion | 0.6250 | % | ||
| On next $2.5 billion | 0.6200 | % | ||
| On next $5 billion | 0.6150 | % | ||
| Over $10 billion | 0.6100 | % | ||
| b) | Accounting Services Agreement – Pursuant to the Fund Accounting Agreement between HFMC and the Company, on behalf of the Fund, HFMC provides accounting services to the Fund and receives monthly compensation based on the Fund’s average daily net assets at the rates set forth below. The Fund’s accounting services fees are accrued daily and paid monthly. |
| Average Daily Net Assets | Annual Fee | |||
| All Assets | 0.010 | % | ||
| c) | Operating Expenses – Allocable expenses incurred by the Company are allocated to each Fund and allocated to classes within a Fund in proportion to the average daily net assets of the Fund and each class, except where allocation of certain expenses is more fairly made directly to the Fund or to specific classes within a Fund. |
| d) | Fees Paid Indirectly – The Company, on behalf of the Fund, has entered into agreements with State Street Global Markets, LLC and Russell Implementation Services, Inc. to partially recapture non-discounted trade commissions. Such rebates are used to pay a portion of the Fund’s expenses. In addition, the Fund’s custodian banks have agreed to reduce its fees when the Fund maintains cash on deposit in a non-interest-bearing custody account. For the six-month period ended June 30, 2013, these amounts, if any, are included in the Statement of Operations. |
The ratio of expenses to average net assets in the accompanying financial highlights excludes the reduction in expenses related to fees paid indirectly. The annualized expense ratio for the period listed below reflecting the reduction for fees paid indirectly is as follows:
| Annualized Six- Month Period Ended June 30, 2013 | ||||
| Class IA | 0.76 | % | ||
| Class IB | 1.01 | |||
| e) | Distribution Plan for Class IB shares – The Company, on behalf of the Fund, has adopted a Distribution Plan pursuant to Rule 12b-1 of the 1940 Act to compensate the distributor, Hartford Funds Distributors, LLC (“HFD”), (formerly known as Hartford Investment Financial Services, LLC), an indirect wholly owned subsidiary of The Hartford, from assets attributable to the Class IB shares for services rendered and expenses borne in connection with activities primarily |
| 20 |
intended to result in the sale of the Class IB shares, subject to the review and approval of the Company’s Board of Directors.
The Distribution Plan provides that the Fund may pay annually up to 0.25% of the average daily net assets of the Fund attributable to its Class IB shares for activities primarily intended to result in the sale of Class IB shares. The Board has the authority to suspend or reduce these payments at any point in time. Under the terms of the Distribution Plan and the principal underwriting agreement, the Fund is authorized to make payments monthly to the distributor that may be used to pay or compensate entities providing distribution and shareholder servicing with respect to the Class IB shares for such entities’ fees or expenses incurred or paid in that regard. These fees are accrued daily and paid monthly.
| f) | Other Related Party Transactions – Certain officers of the Fund are directors and/or officers of the investment manager and/or The Hartford or its subsidiaries. For the six-month period ended June 30, 2013, a portion of the Fund’s Chief Compliance Officer’s salary was paid by all the investment companies in the Hartford fund complex. The portion allocated to the Fund rounds to zero. These fees are accrued daily and paid monthly. |
| g) | Payment from Affiliate – In July of 2007, The Hartford entered into a settlement with the Attorneys General of the states of New York, Connecticut and Illinois relating to market timing and the company's individual variable annuity contracts in which certain payments would be made directly to the variable annuity contract holders. The distribution plan provided that unclaimed money from the settlement would be distributed to certain HLS Funds that are investment options through a Hartford individual variable annuity contract. The unclaimed money was distributed to the Fund on September 18, 2009. |
The total return in the accompanying financial highlights includes a payment from an affiliate. Had the payment from the affiliate been excluded, the impact and total return for the period listed below would have been as follows:
| For the Year Ended December 31, 2009 | ||||||||
| Class IA | Class IB | |||||||
| Impact from Payment from Affiliate for Attorneys General Settlement | — | % | — | % | ||||
| Total Return Excluding Payment from Affiliate | 24.37 | % | 24.05 | % | ||||
| 8. | Investment Transactions: |
For the six-month period ended June 30, 2013, the Fund's aggregate purchases and sales of investment securities (excluding short-term investments) were as follows:
| Amount | ||||
| Cost of Purchases Excluding U.S. Government Obligations | $ | 69,424 | ||
| Sales Proceeds Excluding U.S. Government Obligations | 141,710 | |||
| 9. | Line of Credit: |
The Fund is one of several Hartford funds that participate in a $500 million committed revolving line of credit facility. The facility is to be used for temporary or emergency purposes. Under the arrangement, the funds are required to own securities having a market value in excess of 300% of the total bank borrowings. The interest rate on borrowings varies depending on the nature of the loan. The facility also requires a fee to be paid based on the amount of the commitment. This commitment fee is allocated to all of the funds participating in the line of credit based on the average net assets of the funds. During the six-month period ended June 30, 2013, the Fund did not have any borrowings under this facility.
| 21 |
| Hartford Value HLS Fund |
| Notes to Financial Statements – (continued) |
| June 30, 2013 (Unaudited) |
| (000’s Omitted) |
| 10. | Industry Classifications: |
Other than the industry classifications “Other Investment Pools and Funds” and “Exchange Traded Funds,” equity industry classifications used in this report are the Global Industry Classification Standard, which was developed by and is the exclusive property and service mark of MSCI, Inc. and Standard & Poor’s.
| 11. | Indemnifications: |
Under the Company’s organizational documents, the Company shall indemnify its officers and directors to the full extent required or permitted under Maryland General Corporation Law and the federal securities laws. In addition, the Company, on behalf of the Fund, may enter into contracts that contain a variety of indemnifications. The Company’s maximum exposure under these arrangements is unknown. However, as of the date of these financial statements, the Company has not had prior claims or losses pursuant to these contracts and expects the risk of loss to be remote.
| 12. | Pending Legal Proceedings: |
On February 25, 2011, Jennifer L. Kasilag, Louis Mellinger, Judith M. Menendez, Jacqueline M. Robinson, and Linda A. Russell filed a derivative lawsuit against Hartford Investment Financial Services, LLC (“HIFSCO”)(now known as Hartford Funds Distributors, LLC) on behalf of six Hartford retail mutual funds in the United States District Court for the District of New Jersey, alleging that HIFSCO received excessive advisory and distribution fees in violation of its statutory fiduciary duty under Section 36(b) of the 1940 Act when serving as investment manager and principal underwriter, respectively, to the Hartford retail mutual funds. HIFSCO moved to dismiss and, in September 2011, the motion was granted in part and denied in part, with leave to amend the complaint. In November 2011, plaintiffs filed an amended complaint on behalf of certain Hartford retail mutual funds, The Hartford Global Health Fund (now known as The Hartford Healthcare Fund), The Hartford Conservative Allocation Fund, The Hartford Growth Opportunities Fund, The Hartford Inflation Plus Fund, The Hartford Advisers Fund (now known as The Hartford Balanced Fund), and The Hartford Capital Appreciation Fund. Plaintiffs seek to rescind the investment management agreements and distribution plans between HIFSCO and these funds and to recover the total fees charged thereunder or, in the alternative, to recover any improper compensation HIFSCO received, in addition to lost earnings. HIFSCO filed a partial motion to dismiss the amended complaint and, in December 2012, the court dismissed without prejudice the claims regarding distribution fees and denied the motion with respect to the advisory fees claims. HIFSCO disputes the allegations and intends to defend vigorously.
This action concerns the activities of HIFSCO in its capacity as investment manager and principal underwriter to the Hartford retail mutual funds and does not concern HIFSCO’s activities in its capacity as principal underwriter to the HLS funds. For this reason, no accrual for litigation relating to this matter has been recorded in the financial statements of the Fund.
| 22 |
[This page intentionally left blank]
| 23 |
| Hartford Value HLS Fund |
| Financial Highlights |
| - Selected Per-Share Data (A) - |
| Class | Net Asset Value at Beginning of Period | Net Investment Income (Loss) | Net Realized and Unrealized Gain (Loss) on Investments | Total from Investment Operations | Dividends from Net Investment Income | Distributions from Realized Capital Gains | Distributions from Capital | Total Distributions | Net Asset Value at End of Period | |||||||||||||||||||||||||||
| For the Six-Month Period Ended June 30, 2013 (Unaudited) | ||||||||||||||||||||||||||||||||||||
| IA | $ | 11.86 | $ | 0.13 | $ | 1.80 | $ | 1.93 | $ | – | $ | – | $ | – | $ | – | $ | 13.79 | ||||||||||||||||||
| IB | 11.85 | 0.11 | 1.81 | 1.92 | – | – | – | – | 13.77 | |||||||||||||||||||||||||||
| For the Year Ended December 31, 2012 | ||||||||||||||||||||||||||||||||||||
| IA | 10.37 | 0.26 | 1.50 | 1.76 | (0.27 | ) | – | – | (0.27 | ) | 11.86 | |||||||||||||||||||||||||
| IB | 10.36 | 0.23 | 1.50 | 1.73 | (0.24 | ) | – | – | (0.24 | ) | 11.85 | |||||||||||||||||||||||||
| For the Year Ended December 31, 2011 | ||||||||||||||||||||||||||||||||||||
| IA | 10.77 | 0.20 | (0.41 | ) | (0.21 | ) | (0.19 | ) | – | – | (0.19 | ) | 10.37 | |||||||||||||||||||||||
| IB | 10.76 | 0.17 | (0.41 | ) | (0.24 | ) | (0.16 | ) | – | – | (0.16 | ) | 10.36 | |||||||||||||||||||||||
| For the Year Ended December 31, 2010 (G) | ||||||||||||||||||||||||||||||||||||
| IA | 9.50 | 0.13 | 1.26 | 1.39 | (0.12 | ) | – | – | (0.12 | ) | 10.77 | |||||||||||||||||||||||||
| IB | 9.50 | 0.11 | 1.25 | 1.36 | (0.10 | ) | – | – | (0.10 | ) | 10.76 | |||||||||||||||||||||||||
| For the Year Ended December 31, 2009 | ||||||||||||||||||||||||||||||||||||
| IA | 7.77 | 0.14 | 1.75 | 1.89 | (0.16 | ) | – | – | (0.16 | ) | 9.50 | |||||||||||||||||||||||||
| IB | 7.77 | 0.13 | 1.74 | 1.87 | (0.14 | ) | – | – | (0.14 | ) | 9.50 | |||||||||||||||||||||||||
| For the Year Ended December 31, 2008 | ||||||||||||||||||||||||||||||||||||
| IA | 12.83 | 0.20 | (4.36 | ) | (4.16 | ) | (0.20 | ) | (0.70 | ) | – | (0.90 | ) | 7.77 | ||||||||||||||||||||||
| IB | 12.81 | 0.20 | (4.37 | ) | (4.17 | ) | (0.17 | ) | (0.70 | ) | – | (0.87 | ) | 7.77 | ||||||||||||||||||||||
| (A) | Information presented relates to a share outstanding throughout the indicated period. |
| (B) | The figures do not include sales charges or other fees which may be applied at the variable life insurance, variable annuity or qualified retirement plan product level. Any such additional sales charges or other fees would lower the Fund's performance. |
| (C) | Ratios do not reflect reductions for fees paid indirectly. Please see Fees Paid Indirectly in the Notes to Financial Statements. |
| (D) | Portfolio turnover rate is calculated on the basis of the Fund as a whole without distinguishing between the classes of shares issued. |
| (E) | Not annualized. |
| (F) | Annualized. |
| (G) | Per share amounts have been calculated using the average shares method. |
| (H) | During the year ended December 31, 2010, the Fund incurred $269.8 million in sales associated with the transition of assets from Hartford Equity Income HLS Fund and Hartford Value Opportunities HLS Fund, which merged into the Fund on March 19, 2010. These sales were excluded from the portfolio turnover calculation. |
| (I) | Total return without the inclusion of the Payment from (to) Affiliate can be found in Expenses in the accompanying Notes to Financial Statements. |
| 24 |
| - Ratios and Supplemental Data - |
| Total Return(B) | Net Assets at End of Period | Ratio of Expenses to Average Net Assets Before Waivers(C) | Ratio of Expenses to Average Net Assets After Waivers(C) | Ratio of Net Investment Income (Loss) to Average Net Assets | Portfolio Turnover Rate(D) | |||||||||||||||||
| 16.34 | %(E) | $ | 570,618 | 0.76 | %(F) | 0.76 | %(F) | 1.83 | %(F) | 10 | % | |||||||||||
| 16.20 | (E) | 108,601 | 1.01 | (F) | 1.01 | (F) | 1.58 | (F) | – | |||||||||||||
| 16.99 | 549,228 | 0.76 | 0.76 | 2.02 | 22 | |||||||||||||||||
| 16.69 | 103,438 | 1.01 | 1.01 | 1.77 | – | |||||||||||||||||
| (1.96 | ) | 591,278 | 0.75 | 0.75 | 1.65 | 16 | ||||||||||||||||
| (2.20 | ) | 111,486 | 1.00 | 1.00 | 1.40 | – | ||||||||||||||||
| 14.67 | 741,230 | 0.78 | 0.78 | 1.36 | 47 | (H) | ||||||||||||||||
| 14.38 | 154,731 | 1.03 | 1.03 | 1.11 | – | |||||||||||||||||
| 24.37 | (I) | 244,909 | 0.87 | 0.87 | 1.65 | 50 | ||||||||||||||||
| 24.06 | (I) | 63,003 | 1.12 | 1.12 | 1.40 | – | ||||||||||||||||
| (34.03 | ) | 217,460 | 0.84 | 0.84 | 1.87 | 57 | ||||||||||||||||
| (34.20 | ) | 63,338 | 1.09 | 1.09 | 1.62 | – | ||||||||||||||||
| 25 |
| Hartford Value HLS Fund |
| Directors and Officers (Unaudited) |
The Board of Directors of the Company appoints officers who are responsible for the day-to-day operations of the Fund and who execute policies formulated by the Directors. Each director serves until his or her death, resignation, or retirement or until the next annual meeting of shareholders is held or until his or her successor is elected and qualifies.
Directors and officers who are employed by or who have a financial interest in The Hartford are considered “interested” persons of the Fund pursuant to the 1940 Act. Each officer and two of the Company’s directors, as noted in the chart below, are “interested” persons of the Fund. Each director serves as a director for The Hartford Mutual Funds, Inc., The Hartford Mutual Funds II, Inc., Hartford Series Fund, Inc., Hartford HLS Series Fund II, Inc., and as a trustee for The Hartford Alternative Strategies Fund, which, as of June 30, 2013, collectively consist of 90 funds. Correspondence may be sent to directors and officers c/o Hartford Mutual Funds, P.O. Box 2999, Hartford, Connecticut 06104-2999, except that correspondence to Mr. Annoni, Mr. Dressen, Ms. Fagely and Ms. Quade may be sent to 500 Bielenberg Drive, Woodbury, Minnesota 55125 and correspondence to Mr. Davey and Mr. Melcher may be sent to 5 Radnor Corporate Center, Suite 300, 100 Matsonford Road, Radnor, Pennsylvania 19087.
The table below sets forth, for each director and officer, his or her name, year of birth, current position with the Company and date first elected or appointed to Hartford Series Fund, Inc. (“HSF”), and Hartford HLS Series Fund II, Inc. (“HSF2”), principal occupation, and, for directors, other directorships held. The Fund’s statement of additional information contains further information on the directors and is available free of charge by calling 1-800-862-6668 or writing to Hartford HLS Funds, c/o Hartford Life Insurance Company, Hartford Life and Annuity Insurance Company, P.O. Box 14293, Lexington, KY 40512-4293.
Information on the aggregate remuneration paid to the directors of the Company can be found in the Statement of Operations herein. The Fund pays to The Hartford a portion of the Chief Compliance Officer’s compensation, but does not pay salaries or compensation to any of their other officers or directors who are employed by The Hartford.
Non-Interested Directors
Lynn S. Birdsong (1946) Director since 2003, Co-Chairman of the Investment Committee
Mr. Birdsong is a private investor. Mr. Birdsong currently serves as a Director of the Sovereign High Yield Investment Company (April 2010 to current). Mr. Birdsong currently serves as an Independent Director of Nomura Partners Funds, Inc. (formerly, The Japan Fund) (March 2003 to current). From 1979 to 2002, Mr. Birdsong was a managing director of Zurich Scudder Investments, an investment management firm. During his employment with Scudder, Mr. Birdsong was an Interested Director of The Japan Fund. Since 1981, Mr. Birdsong has been a partner in Birdsong Company, an advertising specialty firm.
Robert M. Gavin, Jr. (1940) Director since 2002 (HSF) and 1986 (HSF2), Chairman of the Board since 2004
Dr. Gavin is an educational consultant. Prior to September 1, 2001, he was President of Cranbrook Education Community and prior to July 1996, he was President of Macalester College, St. Paul, Minnesota.
Duane E. Hill (1945) Director since 2001 (HSF) and 2002 (HSF2), Chairman of the Nominating Committee
Mr. Hill is Partner of TSG Ventures L.P., a private equity investment company. Mr. Hill is a former partner of TSG Capital Group, a private equity investment firm that served as sponsor and lead investor in leveraged buyouts of middle market companies.
Sandra S. Jaffee (1941) Director since 2005
Ms. Jaffee is the founder and Chief Executive Officer of a private company, Homeworks Concierge, LLC, which provides residential property management services in Westchester County, New York (January 2012 to present). Ms. Jaffee served as Chairman (2008 to 2009) and Chief Executive Officer of Fortent (formerly Searchspace Group), a leading provider of compliance/regulatory technology to financial institutions from August 2005 to August 2009. Ms. Jaffee currently serves as a member of the Board of Directors of Broadridge Financial Solutions as well as a Trustee of Muhlenberg College.
William P. Johnston (1944) Director since 2005, Chairman of the Compliance Committee
In February 2008, Mr. Johnston was elected to the Board of Directors of HCR-ManorCare, Inc. In August 2007, Mr. Johnston was elected to the Board of Directors of LifeCare Holdings, Inc. In July 2006, Mr. Johnston was elected to the Board of Directors of MultiPlan, Inc. and served as a director (July 2006 to August 2010). In June 2006, Mr. Johnston was appointed as Senior Advisor to The Carlyle Group, a global private equity and alternative asset investment firm. In May 2006, Mr. Johnston was elected to the Supervisory Board of Fresenius Medical Care AG & Co. KGaA, after its acquisition of Renal Care Group, Inc. in March 2006.
Phillip O. Peterson (1944) Director since 2002 (HSF) and 2000 (HSF2), Chairman of the Audit Committee
Mr. Peterson is a mutual fund industry consultant. He was a partner of KPMG LLP (an accounting firm) until July 1999. Mr. Peterson joined William Blair Funds in February 2007 as a member of the Board of Trustees. Mr. Peterson also joined the Board of Trustees of Symetra Variable Mutual Funds Trust as a trustee in February 2012.
| 26 |
Lemma W. Senbet (1946) Director since 2005
Dr. Senbet is the William E. Mayer Chair Professor of Finance and Director, Center for Financial Policy, at the University of Maryland, Robert H. Smith School of Business. He was chair of the Finance Department from 1998 to 2006. Previously he was a chaired professor of finance at the University of Wisconsin-Madison. Also, he was director of the Fortis Funds from March 2000 to July 2002. Dr. Senbet served the finance profession in various capacities, including as director of the American Finance Association and President of the Western Finance Association. In 2006, Dr. Senbet was inducted Fellow of Financial Management Association International for his career-long distinguished scholarship and professional service.
Interested Directors and Officers
James E. Davey (1964) Director since 2012, President and Chief Executive Officer since 2010
Mr. Davey serves as Executive Vice President of Hartford Life Insurance Company (“HLIC”) and The Hartford Financial Services Group, Inc. Additionally, Mr. Davey serves as Chairman of the Board and Manager of Hartford Funds Distributors, LLC (“HFD”) and Hartford Administrative Services Company (“HASCO”). Mr. Davey also serves as Manager, President and Chairman of the Board for Hartford Funds Management Company, LLC (“HFMC”). Mr. Davey joined The Hartford in 2002.
Lowndes A. Smith (1939) Director since 1996 (HSF) and 2002 (HSF2), Co-Chairman of the Investment Committee
Mr. Smith served as Vice Chairman of The Hartford from February 1997 to January 2002, as President and Chief Executive Officer of Hartford Life, Inc. from February 1997 to January 2002, and as President and Chief Operating Officer of The Hartford Life Insurance Companies from January 1989 to January 2002. Mr. Smith serves as a Director of White Mountains Insurance Group, Ltd., One Beacon Insurance and Symetra Financial and as Managing Director of Whittington Gray Associates.
Other Officers
Mark A. Annoni (1964) Vice President, Controller and Treasurer since 2012
Mr. Annoni serves as the Assistant Vice President of HLIC (February 2004 to present). Mr. Annoni joined The Hartford in April 2001 as part of The Hartford’s acquisition of Fortis Financial Group (“Fortis”). Prior to joining The Hartford, Mr. Annoni served as Manager of Mutual Fund Accounting at Fortis (July 1997 to April 2001).
Michael R. Dressen (1963) AML Compliance Officer since 2011
Mr. Dressen currently serves as Assistant Vice President of HLIC. He also serves as Chief Compliance Officer and AML Compliance Officer of HASCO and as AML Officer of HFD. Mr. Dressen joined The Hartford in 2005 from State Farm Insurance Companies where he held various positions related to mutual funds, variable products, and property casualty insurance.
Tamara L. Fagely (1958) Vice President since 2002 (HSF) and 1993 (HSF2)
Currently, Ms. Fagely is President and a Director of HASCO, Chief Administrative Officer and Manager of HFMC and a Vice President of HLIC. Ms. Fagely served as a Vice President of HASCO (1998-2013) and Chief Financial Officer of HASCO (2006-2013). She served as Assistant Vice President of HLIC from December 2001 through March 2005. In addition, Ms. Fagely is Manager and Chief Operating Officer of HFD.
Edward P. Macdonald (1967) Vice President, Secretary and Chief Legal Officer since 2005
Mr. Macdonald serves as Vice President of HLIC and Vice President, Chief Legal Officer and Secretary of HFD and HASCO. Mr. Macdonald also serves as Manager, Vice President, Chief Legal Officer and Secretary of HFMC. Mr. Macdonald joined The Hartford in 2005.
Joseph G. Melcher (1973) Vice President and Chief Compliance Officer since 2013(1)
Mr. Melcher currently serves as Vice President of HFMC and HFD. Mr. Melcher joined The Hartford in 2012 from Touchstone Investments, a member of the Western & Southern Financial Group, where he held the position of Vice President and Chief Compliance Officer from 2010 through 2012 and Assistant Vice President, Compliance from 2005 to 2010.
(1) Mr. Melcher was named Vice President and Chief Compliance Officer of HSF and HSF2 on February 6, 2013. Prior to February 6, 2013, Colleen Pernerewski served as Chief Compliance Officer of HSF and HSF2.
Vernon J. Meyer (1964) Vice President since 2006
Mr. Meyer serves as Senior Vice President of HLIC. He also serves as Senior Vice President of HFMC and HFD. Mr. Meyer joined The Hartford in 2004.
| 27 |
| Hartford Value HLS Fund |
| Directors and Officers (Unaudited) – (continued) |
Laura S. Quade (1969) Vice President since 2012
Ms. Quade currently serves as Vice President of HASCO and is a Director of Mutual Fund Service Operations. She also serves as Director, Enterprise Operations of HFD and HLIC. Ms. Quade joined The Hartford in 2001 as part of The Hartford’s acquisition of Fortis.
Elizabeth L. Schroeder (1966) Vice President since 2010(2)
Ms. Schroeder currently serves as Assistant Vice President of HLIC. Ms. Schroeder joined HLIC in 1991. She is also an Assistant Vice President of HFMC and HASCO.
(2) Ms. Schroeder served as Vice President of HSF and HSF2 until August 7, 2013.
Martin Swanson (1962) Vice President since 2010
Mr. Swanson is a Vice President of HLIC. Mr. Swanson also serves as Chief Marketing Officer for HFD. Prior to joining HLIC in 1998, Mr. Swanson was a Vice President at PaineWebber, Inc.
HOW TO OBTAIN A COPY OF THE FUND’S PROXY VOTING POLICIES AND VOTING RECORDS (UNAUDITED)
A description of the policies and procedures that the Fund uses to determine how to vote proxies relating to portfolio securities and information about how the Fund voted proxies relating to portfolio securities during the most recent twelve-month period ended June 30 are available (1) without charge, upon request, by calling 800-862-6668 and (2) on the SEC’s website at http://www.sec.gov.
QUARTERLY PORTFOLIO HOLDINGS INFORMATION (UNAUDITED)
The Fund files a complete schedule of portfolio holdings with the SEC for the first and third quarters of each fiscal year on Form N-Q. The Fund’s Forms are available (1) without charge, upon request, by calling 800-862-6668 and (2) on the SEC’s website at http://www.sec.gov. The Form N-Q may be reviewed and copied at the SEC’s Public Reference Room in Washington, DC. Information on the operation of the Public Reference Room may be obtained by calling 1-800-SEC-0330.
| 28 |
| Hartford Value HLS Fund |
| Expense Example (Unaudited) |
Your Fund's Expenses
As a shareholder of the Fund, you incur two types of costs: (1) transaction costs and (2) ongoing costs including investment management fees, distribution fees, if any, and other fund expenses. This example is intended to help you understand your ongoing costs (in dollars) of investing in the Fund and to compare these costs with the ongoing costs of investing in other mutual funds. The example is based on an investment of $1,000 invested at the beginning of the period and held for the period of December 31, 2012 through June 30, 2013.
Actual Expenses
The first set of columns of the table below provides information about actual account values and actual expenses. You may use the information in this column, together with the amount you invested, to estimate the expenses that you paid over the period. Simply divide your account value by $1,000 (for example, an $8,600 account value divided by $1,000 = 8.6), then multiply the result by the number in the line under the heading entitled “Expenses Paid During Period” to estimate the expenses you paid on your account during this period.
Hypothetical Example for Comparison Purposes
The second set of columns of the table below provides information about hypothetical account values and hypothetical expenses based on the Fund’s actual expense ratio and an assumed rate of return of 5% per year before expenses, which is not the Fund’s actual return. The hypothetical account values and expenses may not be used to estimate the actual ending account balance or expenses you paid for the period. You may use this information to compare the ongoing costs of investing in the Fund and other funds. To do so, compare this 5% hypothetical example with the 5% hypothetical examples that appear in the shareholder reports of the other funds.
Please note that the expenses shown in the table are meant to highlight your ongoing costs only and do not reflect any transactional costs, such as sales charges (loads) and CDSC. Therefore, the second set of columns of the table is useful in comparing ongoing costs only, and will not help you determine the relative total costs of owning different funds. In addition, if these transactional costs were included, your costs would be higher. Expenses are equal to the Fund's annualized expense ratios multiplied by average account value over the period, multiplied by 181/365 (to reflect the one-half year period).
| Actual return | Hypothetical (5% return before expenses) | |||||||||||||||||||||||||||||||||||
| Beginning Account Value December 31, 2012 | Ending Account Value June 30, 2013 | Expenses paid during the period December 31, 2012 through June 30, 2013 | Beginning Account Value December 31, 2012 | Ending Account Value June 30, 2013 | Expenses paid during the period December 31, 2012 through June 30, 2013 | Annualized expense ratio | Days in the current 1/2 year | Days in the full year | ||||||||||||||||||||||||||||
| Class IA | $ | 1,000.00 | $ | 1,163.40 | $ | 4.08 | $ | 1,000.00 | $ | 1,021.03 | $ | 3.81 | 0.76 | % | 181 | 365 | ||||||||||||||||||||
| Class IB | $ | 1,000.00 | $ | 1,162.00 | $ | 5.41 | $ | 1,000.00 | $ | 1,019.79 | $ | 5.06 | 1.01 | % | 181 | 365 | ||||||||||||||||||||
| 29 |
| Hartford Value HLS Fund |
| Principal Risks (Unaudited) |
The principal risks of investing in the Fund are described below.
Market, Selection, and Strategy Risk: The Fund’s share price may fluctuate due to market risk and/or security selections that may underperform the market or relevant benchmarks. If the sub-adviser’s investment strategy does not perform as expected, the Fund could underperform its peers or lose money. There is no guarantee the Fund will achieve its stated objective.
Value Investing Risk: Value investments are considered to be undervalued, but they may never attain their potential value. Value-style investing falls in and out of favor, which may result in periods of underperformance.
Foreign Investment Risk: Foreign investments can be riskier than U.S. investments. Potential risks include currency risk that may result from unfavorable exchange rates, liquidity risk if decreased demand for a security makes it difficult to sell at the desired price, and risks that stem from substantially lower trading volume on foreign markets.
| 30 |
HARTFORD HLS FUNDS
c/o The Hartford Wealth Management - Global Annuities
P.O. Box 14293
Lexington, KY 40512-4293
HARTFORDFUNDS
hartfordfunds.com
Hartford Series Fund, Inc. is underwritten and distributed by Hartford Funds Distributors, LLC.
Hartford Series Fund, Inc. inception dates range from 1977 to date. Hartford Series Fund, Inc. is not a subsidiary of The Hartford Financial Services Group, Inc. ("The Hartford") but is underwritten, distributed by and advised by subsidiaries of The Hartford. Investments in Hartford Series Fund, Inc. are not guaranteed by The Hartford or any other entity.
You should carefully consider investment objectives, risks, and charges and expenses of Hartford HLS Funds before investing. This and other information can be found in the Fund’s prospectus or summary prospectus, which can be obtained by calling 800-862-6668. Please read them carefully before you invest or send money.
HLSSAR-V13 8-13 113557-1 Printed in U.S.A ©2013 The Hartford, Hartford, CT 06115
Item 2. Code of Ethics.
Not applicable to this semi-annual filing.
Item 3. Audit Committee Financial Expert.
Not applicable to this semi-annual filing.
Item 4. Principal Accountant Fees and Services.
Not applicable to this semi-annual filing.
Item 5. Audit Committee of Listed Registrants.
Not applicable to this semi-annual filing.
Item 6. Investments.
| (a) | The Schedule of Investments is included as part of the semi-annual report filed under Item 1 of this form. |
| (b) | Not applicable. |
Item 7. Disclosure of Proxy Voting Policies and Procedures for Closed-End Management Investment Companies.
Not applicable.
Item 8. Portfolio Managers of Closed-End Management Investment Companies.
Not applicable.
Item 9. Purchases of Equity Securities by Closed-End Management Investment Company and Affiliated Purchasers.
Not applicable.
Item 10. Submission of Matters to a Vote of Security Holders.
There have been no material changes to the procedures by which shareholders may recommend nominees to the registrant’s board of directors since registrant last provided disclosure in response to this requirement.
Item 11. Controls and Procedures.
| (a) | The registrant’s principal executive and principal financial officers, or persons performing similar functions, have concluded that the registrant’s disclosure controls and procedures (as defined in Rule 30a-3(c) under the Investment Company Act of 1940, as amended (the “1940 Act”) (17 CFR 270.30a-3(c))) are effective, as of a date within 90 days of the filing date of the report that includes the disclosure required by this paragraph, based on their evaluation of these controls and procedures required by Rule 30a-3(b) under the 1940 Act (17 CFR 270.30a-3(b)) and Rules 13a-15(b) or 15d-15(b) under the Securities Exchange Act of 1934, as amended (17 CFR 240.13a-15(b) or 240.15d-15(b)). |
| (b) | There were no changes in the registrant’s internal control over financial reporting (as defined in Rule 30a-3(d) under the 1940 Act (17 CFR 270.30a-3(d)) that occurred during the registrant’s second fiscal quarter of the period covered by this report that have materially affected, or is reasonably likely to materially affect, the registrant’s internal control over financial reporting. |
Item 12. Exhibits.
| (a)(1) | Not applicable. | |
| (a)(2) | Section 302 certifications of the principal executive officer and principal financial officer of Registrant. | |
| (a)(3) | Not applicable. | |
| (b) | Section 906 certification. |
SIGNATURES
Pursuant to the requirements of the Securities Exchange Act of 1934 and the Investment Company Act of 1940, the registrant has duly caused this report to be signed on its behalf by the undersigned, thereunto duly authorized.
| HARTFORD SERIES FUND, INC. | ||
| Date: August 13, 2013 | By: | /s/ James E. Davey |
James E. Davey President | ||
Pursuant to the requirements of the Securities Exchange Act of 1934 and the Investment Company Act of 1940, this report has been signed below by the following persons on behalf of the registrant and in the capacities and on the dates indicated.
| Date: August 13, 2013 | By: | /s/ James E. Davey |
James E. Davey President | ||
| Date: August 13, 2013 | By: | /s/ Mark A. Annoni |
Mark A. Annoni Vice President, Controller and Treasurer | ||