UNITED STATES
SECURITIES AND EXCHANGE COMMISSION
Washington, D.C. 20549
FORM N-CSR
CERTIFIED SHAREHOLDER REPORT OF REGISTERED MANAGEMENT INVESTMENT COMPANIES
Investment Company Act file number: 811-08629
HARTFORD SERIES FUND, INC.
(Exact name of registrant as specified in charter)
P. O. Box 2999, Hartford, Connecticut 06104-2999
(Address of Principal Executive Offices)
Edward P. Macdonald, Esquire
Life Law Unit
The Hartford Financial Services Group, Inc.
200 Hopmeadow Street
Simsbury, Connecticut 06089
(Name and Address of Agent for Service)
Registrant’s telephone number, including area code: (860) 843-9934
Date of fiscal year end: December 31st
Date of reporting period: January 1, 2011 – June 30, 2011
Form N-CSR is to be used by management investment companies to file reports with the Commission not later than 10 days after the transmission to stockholders of any report that is required to be transmitted to stockholders under Rule 30e-1 under the Investment Company Act of 1940 (17 CFR 270.30e-1). The Commission may use the information provided on Form N-CSR in its regulatory, disclosure review, inspection, and policymaking roles.
A registrant is required to disclose the information specified by Form N-CSR, and the Commission will make this information public. A registrant is not required to respond to the collection of information contained in Form N-CSR unless the Form displays a currently valid Office of Management and Budget ("OMB") control number. Please direct comments concerning the accuracy of the information collection burden estimate and any suggestions for reducing the burden to Secretary, Securities and Exchange Commission, 450 Fifth Street, NW, Washington, DC 20549-0609. The OMB has reviewed this collection of information under the clearance requirements of 44 U.S.C. § 3507.
Item 1. Reports to Stockholders.

A MESSAGE FROM THE PRESIDENT

Dear Fellow Shareholders:
I want to take this opportunity to say thank you for your continued confidence and trust.
We have seen a significant amount of global turbulence in the first half of 2011. Investors have continued to be concerned about the implications of the European sovereign debt crisis, as well as our own high levels of domestic debt. Since January we have witnessed significant political uprisings in the already-volatile Middle East and North Africa region. In addition, the ramifications of Japan's massive earthquake, subsequent tsunami, and nuclear disaster are still being played out in the market.
Although corporate earnings have remained robust, the unemployment picture has been mixed. After adding more than 200,000 jobs from February to April, more recent unemployment reports have shown a pullback in hiring.
While official inflation remains low as measured by the Consumer Price Index (CPI), high oil prices may be indicative of higher inflation in the future. The federal funds rate remains at a historic low, however, the Fed could potentially raise the rate to get it closer to its historical average once the economy strengthens.
Even with these headwinds, domestic, international, and world indices (as measured by the S&P 500, MSCI EAFE and MSCI World) are all up more than 5% through June, 30 2011.
Looking ahead, continued growth in emerging markets is fueling global recovery efforts. Emerging markets comprise about 48 percent of the world’s GDP, and many economists believe they are poised for further expansion. As GDP growth continues in emerging markets, roughly 100 million people are added to the middle class each year. This middle class population growth could potentially drive a considerable shift in consumer purchasing power.
Now that we have reached the midpoint of 2011, perhaps now would be a good time to schedule a meeting with your financial adviser to examine your current investment strategy and determine whether you are on the right track.
| • | Are you concerned about inflation and its effects on your portfolio? |
| • | Is your portfolio prepared for rising interest rates? |
| • | Does your portfolio reflect the global economy with a mix of developed nations and emerging markets? |
Your financial professional’s advice can help you to navigate today’s volatile markets with confidence. You can also rest assured that we will continue to provide you with solid investments and stellar service for the road ahead.
Thank you again for your business.

James Davey
President
Hartford HLS Funds
Hartford Advisers HLS Fund
| Manager Discussion (Unaudited) | 2 | ||
| Financial Statements | |||
| 6 | |||
| 13 | |||
| 14 | |||
| 15 | |||
| 16 | |||
| 17 | |||
| 30 | |||
| 32 | |||
| 34 | |||
| 34 | |||
| 35 |
This report is prepared for the general information of contract owners and qualified retirement plan participants. It is not an offer of contracts or of qualified retirement plans. It should not be used in connection with any offer, except in conjunction with the appropriate product prospectus which contains all pertinent information including the applicable sales, administrative and other charges.
The views expressed in the Fund’s Manager Discussion under ‘‘Why did the Fund perform this way?’’ and ‘‘What is the outlook?’’ are views of the Fund’s sub-adviser and portfolio management team through the end of the reporting period and are subject to change based on market and other conditions.
Hartford Advisers HLS Fund inception 03/31/1983
(sub-advised by Wellington Management Company, LLP)
| Investment objective – Seeks long-term total return. |
Performance Overview 6/30/01 - 6/30/11

The chart above shows the growth of a $10,000 investment in Class IA. Growth results in classes other than Class IA will vary from what is seen above due to differences in the expenses charged to those share classes.
Average Annual Total Returns (as of 6/30/11) | ||||
6 Month† | 1 Year | 5 year | 10 year | |
| Advisers IA | 3.71% | 21.19% | 4.08% | 3.24% |
| Advisers IB | 3.59% | 20.89% | 3.82% | 2.99% |
Advisers HLS Fund Blended Index | 4.54% | 19.26% | 4.47% | 4.11% |
| Barclays Capital | ||||
Government/Credit Bond Index | 2.61% | 3.68% | 6.35% | 5.74% |
| S&P 500 Index | 6.01% | 30.68% | 2.94% | 2.72% |
| † | Not Annualized |
PAST PERFORMANCE IS NOT INDICATIVE OF FUTURE RESULTS.
Total returns presented above were calculated using the Fund's net asset value available to shareholders for sale or redemption of Fund shares on June 30, 2011, which excludes investment transactions as of this date.
Advisers HLS Fund Blended Index is a blended index comprised of the following indices: S&P 500 (60%), Barclays Capital U.S. Government/Credit Bond (35%) and 90 day Treasury Bill (5%).
Barclays Capital Government/Credit Bond Index is an unmanaged, market-value-weighted index of all debt obligations of the U.S. Treasury and U.S. Government agencies (excluding mortgaged-backed securities) and of all publicly-issued fixed-rate, nonconvertible, investment grade domestic corporate debt.
S&P 500 Index is a market capitalization-weighted price index composed of 500 widely held common stocks.
You cannot invest directly in an index.
The chart represents a hypothetical investment in the Fund. Performance data represents past performance and current performance could be higher or lower.
Performance information may reflect historical or current expense waivers/reimbursements from the investment adviser, without which performance would have been lower. For information on current expense waivers/reimbursements, please see the prospectus.
The value of the fund will fluctuate so that when redeemed, it may be worth more or less than the original investment. The chart and table do not reflect the deductions of taxes, sales charges or other fees which may be applied at the variable life insurance, variable annuity or qualified retirement plan product level. Any such additional sales charges or other fees or expenses would lower the contract’s or plan’s performance.
| Portfolio Managers | ||
| Steven T. Irons, CFA | John C. Keogh | Peter I. Higgins, CFA |
| Senior Vice President | Senior Vice President | Senior Vice President |
How did the Fund perform?
The Class IA shares of the Hartford Advisers HLS Fund returned 3.71% for the six-month period ended June 30, 2011, underperforming its blended benchmark, (60% S&P 500 Index, 35% Barclays Capital Government/Credit Bond Index, and 5% Treasury Bills), which returned 4.54%, as well as the S&P 500, which returned 6.01% for the same period. The Fund outperformed the Barclays Capital Government/Credit Bond Index, which returned 2.61% over the same period. The Fund underperformed the 4.89% return of the average fund in the Lipper Mixed-Asset Target Allocation Growth Funds VP-UF peer group, a group of funds that hold between 60%-80% in equity securities, with the remainder invested in bonds, cash, and cash equivalents.
Why did the Fund perform this way?
U.S. equities moved higher during the period despite a high degree of volatility caused by mounting concerns about unrest in North Africa and the Middle East and the devastating earthquake and nuclear crisis in Japan. Equity markets as measured by the S&P 500 returned 6.01% during the period. Health Care (+14%), Energy (+11%), and Utilities (+9%) posted the largest gains while Financials (-3%) was the only sector to post a negative absolute return (i.e. total return).
The bond market, as measured by the Barclays Capital Government/Credit Bond Index, returned 2.61% during the period. All risk segments of the fixed income market outperformed duration-equivalent Treasuries for the period.
The Fund has three primary levers to generate investment performance: equity investments, fixed income investments, and asset allocation among stocks, bonds, and cash. During the period, the equity portion of the Fund underperformed its benchmark, while the fixed income portion of the Fund outperformed its benchmark. Asset allocation contributed positively to benchmark-relative (i.e. performance of the Fund as measured against the benchmark) results as the Fund was generally overweight (i.e. the Fund’s sector position was greater than the benchmark position) equities and underweight (i.e. the Fund’s position was less than the benchmark position) fixed income and cash relative to the benchmark.
Equity underperformance versus the benchmark was driven in part by security selection, which was weakest in Consumer Discretionary and Industrials. This was partially offset by stronger selection in Materials. Sector positioning, which is a result of bottom-up (i.e. stock by stock fundamental research) security selection, also detracted from relative performance due to an overweight to Financials and underweight exposure to Energy.
Stocks that detracted the most from both absolute and relative returns in the equity portion of the Fund during the period were Cisco Systems (Information Technology), Hewlett-Packard (Information Technology), and Google (Information Technology). Networking equipment provider Cisco saw its shares decline as the company disappointed investors with its margin guidance, stoking concerns that the company is being forced to cut prices to protect market share. Global technology company Hewlett-Packard, a leader in printing and PCs, saw its stock sell off as its new CEO was forced to restructure numerous acquisitions of his predecessors and consensus mounted that the printing franchise is vulnerable to tablet computers. Shares of software company Google fell as headline news surrounding antitrust and patent-related lawsuits from their major competitors weighed on the stock price.
Top contributors to relative performance of the equity portion of the Fund during the period were UCB (Health Care), Vertex Pharmaceuticals (Health Care), and UnitedHealth Group (Health Care). UCB, a Swiss pharmaceutical company, saw its shares rise as two potential blockbuster drugs, Cimzia, for arthritis, and Vimpat for epilepsy, proved successful in the marketplace. Earnings growth is also expected to accelerate in 2012 as Keppra generic erosion annualizes. Shares of Vertex Pharmaceuticals, a development stage pharmaceutical company, surged higher after the company reported success in a Phase 3 study of a cystic fibrosis treatment, opening the way for the company to apply for regulatory approval later this year. UnitedHealth Group, a health care benefits and services provider, saw its shares rise after the company reported strong first quarter earnings, beating analysts' estimates, driven in part by reduced use of services by its members. Investors looked favorably on the increase in enrollments as a potential sign of growth going forward, pushing the stock higher. Pfizer (Health Care) and Exxon Mobil (Energy) also contributed positively to the Fund’s returns on an absolute basis.
The fixed income portion of the Fund outperformed its benchmark during the period. Security selection within the Investment Grade corporate bond sector was the primary
driver of the outperformance. Allocations to agency mortgage-backed securities (MBS) and consumer asset-backed securities (ABS) were also modestly additive. Our duration and yield curve positioning detracted from relative performance. Despite a challenging second quarter due to sovereign debt concerns and signs of slowing economic growth, corporate bonds posted strong performance for the period. Outperformance came during the first quarter, as corporate earnings surprised to the upside and demand for corporate bonds remained strong. The sector experienced large inflows as investors sought higher-yielding alternatives to low cash rates. Within the sector, Financials benefitted early on from solid earnings reports and the continued rally in subordinated issues. The Fund’s overweight to Financials, in particular Banks, Insurance companies and REITS was a positive for performance. The portfolio held an allocation to the agency MBS sector based on attractive valuations. Increased demand for high quality assets caused Agency MBS to outperform.
What is the outlook?
We expect the modest U.S. economic expansion to continue; however, we feel that European sovereign debt risk poses a threat to global growth. We believe that the U.S. Federal Reserve will maintain its accommodative stance and short-term rates will remain low until the economy strengthens.
Within the equity portion of the Fund we continue to focus our efforts on stock-by-stock fundamental research to construct a diversified large-cap core portfolio. We screen for companies on specific valuation, return on capital, and earnings characteristics and we focus on understanding how returns on capital are being created, employing a disciplined valuation methodology for both purchases and sales. At the end of the period, our bottom-up investment approach resulted in the largest overweight exposures in Information Technology, Health Care, and Financials. The largest underweights of the equity portion of the Fund to the S&P 500 were in Consumer Staples, Utilities, and Telecommunication Services.
Overall within the fixed income portion of the Fund, we are tactically managing the Fund’s duration around neutral. We continue to be positioned with an underweight to the Government sector, as we believe that there are more compelling opportunities in other sectors. We believe that corporate fundamentals remain strong, financial companies will continue to de-lever, and that valuations remain attractive. We maintained our overweight posture to the corporate sector at the end of the period. We also maintained our overweight allocation to taxable municipal bonds due to the attractive valuations in this relatively high quality and diverse sector of the market. Lastly, at the end of the period we maintained our modest allocation to asset-backed securities and agency mortgage-backed securities. Since the end of the period, economic data has continued to point to a slowdown in the U.S. A weaker macroeconomic environment combined with uncertainty over the debt ceiling negotiations and worries over European sovereign debt contagion lead us to be more inclined to reduce risk in the fixed income portfolio overall.
The equity and fixed income managers will continue to work collaboratively to make decisions regarding portfolio weights in stocks, bonds, and cash. As of June 30, 2011, the Fund’s equity exposure was at 68% compared to 60% in its benchmark and at the upper end of the Fund’s 50-70% range.
| Diversification by Security Type | ||||
| as of June 30, 2011 | ||||
| Percentage of | ||||
| Category | Net Assets | |||
| Equity Securities | ||||
| Common Stocks | 68.6 | % | ||
| Total | 68.6 | % | ||
| Fixed Income Securities | ||||
| Asset & Commercial Mortgage Backed Securities | 0.7 | % | ||
| Corporate Bonds: Investment Grade | 12.8 | |||
| Corporate Bonds: Non-Investment Grade | 0.2 | |||
| Municipal Bonds | 1.0 | |||
| U.S. Government Agencies | 1.4 | |||
| U.S. Government Securities | 13.5 | |||
| Total | 29.6 | % | ||
| Short-Term Investments | 1.6 | % | ||
| Other Assets and Liabilities | 0.2 | |||
| Total | 100.0 | % | ||
Diversification by Industry
as of June 30, 2011
| Percentage of | ||||
| Industry (Sector) | Net Assets | |||
| Equity Securities | ||||
| Automobiles & Components (Consumer Discretionary) | 1.8 | % | ||
| Banks (Financials) | 3.6 | |||
| Capital Goods (Industrials) | 5.0 | |||
| Consumer Durables & Apparel (Consumer Discretionary) | 0.2 | |||
| Consumer Services (Consumer Discretionary) | 0.6 | |||
| Diversified Financials (Financials) | 6.9 | |||
| Energy (Energy) | 7.5 | |||
| Food & Staples Retailing (Consumer Staples) | 1.1 | |||
| Food, Beverage & Tobacco (Consumer Staples) | 3.1 | |||
| Health Care Equipment & Services (Health Care) | 2.3 | |||
| Household & Personal Products (Consumer Staples) | 0.7 | |||
| Insurance (Financials) | 1.6 | |||
| Materials (Materials) | 2.7 | |||
| Media (Consumer Discretionary) | 1.7 | |||
| Pharmaceuticals, Biotechnology & Life Sciences (Health Care) | 8.3 | |||
| Retailing (Consumer Discretionary) | 3.2 | |||
| Semiconductors & Semiconductor Equipment (Information Technology) | 1.3 | |||
| Software & Services (Information Technology) | 7.3 | |||
| Technology Hardware & Equipment (Information Technology) | 6.3 | |||
| Telecommunication Services (Services) | 0.7 | |||
| Transportation (Industrials) | 2.1 | |||
| Utilities (Utilities) | 0.6 | |||
| Total | 68.6 | % | ||
| Fixed Income Securities | ||||
| Air Transportation (Transportation) | 0.3 | % | ||
| Arts, Entertainment and Recreation (Services) | 0.6 | |||
| Beverage and Tobacco Product Manufacturing (Consumer Staples) | 0.2 | |||
| Chemical Manufacturing (Basic Materials) | 0.0 | |||
Computer and Electronic Product Manufacturing (Technology) | 0.1 | |||
| Electrical Equipment, Appliance Manufacturing (Technology) | 0.2 | |||
| Finance and Insurance (Finance) | 8.1 | |||
| Food Manufacturing (Consumer Staples) | 0.3 | |||
| General Obligations (General Obligations) | 0.4 | |||
| Health Care and Social Assistance (Health Care) | 0.6 | |||
| Health Care/Services (Health Care/Services) | 0.0 | |||
| Higher Education (Univ., Dorms, etc.) (Higher Education (Univ., Dorms, etc.)) | 0.1 | |||
| Information (Technology) | 0.6 | |||
| Machinery Manufacturing (Capital Goods) | 0.2 | |||
| Motor Vehicle & Parts Manufacturing (Consumer Cyclical) | 0.3 | |||
| Petroleum and Coal Products Manufacturing (Energy) | 0.4 | |||
| Pipeline Transportation (Utilities) | 0.1 | |||
| Primary Metal Manufacturing (Basic Materials) | 0.0 | |||
| Real Estate and Rental and Leasing (Finance) | 0.3 | |||
| Retail Trade (Consumer Cyclical) | 0.2 | |||
| Soap, Cleaning Compound and Toilet Manufacturing (Consumer Staples) | 0.3 | |||
| Tax Allocation (Tax Allocation) | 0.1 | |||
| Transportation (Transportation) | 0.3 | |||
| U.S. Government Agencies (U.S. Government Agencies) | 1.4 | |||
| U.S. Government Securities (U.S. Government Agencies) | 13.5 | |||
| Utilities (Utilities) | 0.9 | |||
| Utilities - Water and Sewer (Utilities - Water and Sewer) | 0.1 | |||
| Total | 29.6 | % | ||
| Short-Term Investments | 1.6 | % | ||
| Other Assets and Liabilities | 0.2 | |||
| Total | 100.0 | % | ||
| Schedule of Investments |
| June 30, 2011 (Unaudited) |
| (000’s Omitted) |
| Shares or Principal Amount | Market Value ╪ | ||||||
| COMMON STOCKS - 68.6% | |||||||
| Automobiles & Components - 1.8% | |||||||
| 1,730 | Ford Motor Co. ● | $ | 23,859 | ||||
| 783 | Harley-Davidson, Inc. | 32,092 | |||||
| 357 | Johnson Controls, Inc. | 14,860 | |||||
| 70,811 | |||||||
| Banks - 3.6% | |||||||
| 1,033 | BB&T Corp. | 27,720 | |||||
| 5,195 | Mitsubishi UFJ Financial Group, Inc. | 25,318 | |||||
| 1,267 | US Bancorp | 32,332 | |||||
| 1,944 | Wells Fargo & Co. | 54,547 | |||||
| 139,917 | |||||||
| Capital Goods - 5.0% | |||||||
| 397 | 3M Co. | 37,618 | |||||
| 347 | Boeing Co. | 25,617 | |||||
| 570 | Ingersoll-Rand plc | 25,861 | |||||
| 165 | Masco Corp. | 1,980 | |||||
| 816 | PACCAR, Inc. | 41,689 | |||||
| 265 | Rockwell Collins, Inc. | 16,360 | |||||
| 256 | Stanley Black & Decker, Inc. | 18,423 | |||||
| 1,036 | Textron, Inc. | 24,449 | |||||
| 191,997 | |||||||
| Consumer Durables & Apparel - 0.2% | |||||||
| 516 | Newell Rubbermaid, Inc. | 8,142 | |||||
| Consumer Services - 0.6% | |||||||
| 359 | DeVry, Inc. | 21,251 | |||||
| Diversified Financials - 6.9% | |||||||
| 5,144 | Bank of America Corp. | 56,373 | |||||
| 86 | BlackRock, Inc. | 16,515 | |||||
| 198 | Goldman Sachs Group, Inc. | 26,405 | |||||
| 1,021 | Invesco Ltd. | 23,882 | |||||
| 1,543 | JP Morgan Chase & Co. | 63,170 | |||||
| 672 | SEI Investments Co. | 15,127 | |||||
| 421 | T. Rowe Price Group, Inc. | 25,415 | |||||
| 103 | UBS AG | 1,882 | |||||
| 1,915 | UBS AG ADR ● | 34,971 | |||||
| 263,740 | |||||||
| Energy - 7.5% | |||||||
| 390 | Anadarko Petroleum Corp. | 29,913 | |||||
| 871 | Chesapeake Energy Corp. | 25,869 | |||||
| 1,260 | Exxon Mobil Corp. | 102,531 | |||||
| 893 | OAO Gazprom Class S ADR | 13,021 | |||||
| 316 | Occidental Petroleum Corp. | 32,846 | |||||
| 396 | Petroleo Brasileiro S.A. ADR | 13,392 | |||||
| 1,391 | Petroleum Geo-Services ● | 19,878 | |||||
| 882 | Statoilhydro ASA ADR | 22,447 | |||||
| 425 | Suncor Energy, Inc. | 16,628 | |||||
| 274 | Ultra Petroleum Corp. ● | 12,558 | |||||
| 289,083 | |||||||
| Food & Staples Retailing - 1.1% | |||||||
| 668 | CVS/Caremark Corp. | 25,096 | |||||
| 494 | Sysco Corp. | 15,412 | |||||
| 40,508 | |||||||
| Food, Beverage & Tobacco - 3.1% | |||||||
| 820 | General Mills, Inc. | 30,509 | |||||
| 946 | Kraft Foods, Inc. | 33,328 | |||||
| 800 | PepsiCo, Inc. | 56,344 | |||||
| 120,181 | |||||||
| Health Care Equipment & Services - 2.3% | |||||||
| 484 | HCA Holdings, Inc. ● | 15,979 | |||||
| 913 | Medtronic, Inc. | 35,170 | |||||
| 408 | UnitedHealth Group, Inc. | 21,019 | |||||
| 240 | Zimmer Holdings, Inc. ● | 15,193 | |||||
| 87,361 | |||||||
| Household & Personal Products - 0.7% | |||||||
| 390 | Procter & Gamble Co. | 24,799 | |||||
| Insurance - 1.6% | |||||||
| 4,208 | Ageas | 11,397 | |||||
| 1,213 | Genworth Financial, Inc. ● | 12,472 | |||||
| 734 | Marsh & McLennan Cos., Inc. | 22,903 | |||||
| 612 | Unum Group | 15,588 | |||||
| 62,360 | |||||||
| Materials - 2.7% | |||||||
| 208 | Airgas, Inc. | 14,554 | |||||
| 107 | CF Industries Holdings, Inc. | 15,187 | |||||
| 372 | Dow Chemical Co. | 13,399 | |||||
| 501 | Monsanto Co. | 36,371 | |||||
| 356 | Nucor Corp. | 14,654 | |||||
| 150 | Potash Corp. of Saskatchewan, Inc. | 8,526 | |||||
| 102,691 | |||||||
| Media - 1.7% | |||||||
| 1,266 | Comcast Corp. Class A | 32,088 | |||||
| 893 | Walt Disney Co. | 34,847 | |||||
| 66,935 | |||||||
| Pharmaceuticals, Biotechnology & Life Sciences - 8.3% | |||||||
| 402 | Agilent Technologies, Inc. ● | 20,531 | |||||
| 792 | Amgen, Inc. ● | 46,219 | |||||
| 630 | Celgene Corp. ● | 37,984 | |||||
| 1,320 | Daiichi Sankyo Co., Ltd. | 25,788 | |||||
| 198 | Life Technologies Corp. ● | 10,294 | |||||
| 1,482 | Merck & Co., Inc. | 52,289 | |||||
| 2,544 | Pfizer, Inc. | 52,396 | |||||
| 88 | Roche Holding AG | 14,771 | |||||
| 1,090 | Shionogi & Co., Ltd. | 17,854 | |||||
| 705 | UCB S.A. | 31,666 | |||||
| 188 | Vertex Pharmaceuticals, Inc. ● | 9,768 | |||||
| 319,560 | |||||||
| Retailing - 3.2% | |||||||
| 11,241 | Buck Holdings L.P. ⌂●† | 27,817 | |||||
| 514 | Kohl's Corp. | 25,715 | |||||
| 1,950 | Lowe's Co., Inc. | 45,455 | |||||
| 532 | Nordstrom, Inc. | 24,977 | |||||
| 123,964 | |||||||
| Semiconductors & Semiconductor Equipment - 1.3% | |||||||
| 186 | Cree, Inc. ● | 6,231 | |||||
| 1,008 | Maxim Integrated Products, Inc. | 25,767 | |||||
| 458 | Xilinx, Inc. | 16,714 | |||||
| 48,712 | |||||||
| Software & Services - 7.3% | |||||||
| 625 | Accenture plc | 37,781 | |||||
| 719 | Automatic Data Processing, Inc. | 37,856 | |||||
| 398 | Check Point Software Technologies Ltd. ADR ● | 22,609 | |||||
| 768 | eBay, Inc. ● | 24,780 | |||||
| 143 | Google, Inc. ● | 72,514 | |||||
| 457 | Lender Processing Services | 9,547 | |||||
| 977 | Microsoft Corp. | 25,410 | |||||
| 2,493 | Western Union Co. | 49,925 | |||||
| 280,422 | |||||||
| Shares or Principal Amount | Market Value ╪ | ||||||
| COMMON STOCKS - 68.6% - (continued) | |||||||
| Technology Hardware & Equipment - 6.3% | |||||||
| 188 | Apple, Inc. ● | $ | 62,938 | ||||
| 3,219 | Cisco Systems, Inc. | 50,250 | |||||
| 1,257 | EMC Corp. ● | 34,633 | |||||
| 1,386 | Hewlett-Packard Co. | 50,458 | |||||
| 742 | Qualcomm, Inc. | 42,155 | |||||
| 240,434 | |||||||
| Telecommunication Services - 0.7% | |||||||
| 1,012 | Vodafone Group plc ADR | 27,041 | |||||
| Transportation - 2.1% | |||||||
| 314 | Con-way, Inc. | 12,170 | |||||
| 147 | FedEx Corp. | 13,936 | |||||
| 384 | Kansas City Southern ● | 22,771 | |||||
| 449 | United Parcel Service, Inc. Class B | 32,709 | |||||
| 81,586 | |||||||
| Utilities - 0.6% | |||||||
| 267 | NextEra Energy, Inc. | 15,336 | |||||
| 326 | PPL Corp. | 9,084 | |||||
| 24,420 | |||||||
| Total common stocks | |||||||
| (cost $2,304,695) | $ | 2,635,915 | |||||
| ASSET & COMMERCIAL MORTGAGE BACKED SECURITIES - 0.7 % | |||||||
| Finance and Insurance - 0.7% | |||||||
| Bear Stearns Commercial Mortgage Securities, Inc. | |||||||
| $ | 71 | 5.61%, 11/15/2033 | $ | 72 | |||
| Citibank Credit Card Issuance Trust | |||||||
| 11,945 | 5.65%, 09/20/2019 | 13,717 | |||||
| Commercial Mortgage Asset Trust | |||||||
| 18 | 6.64%, 01/17/2032 | 18 | |||||
| CS First Boston Mortgage Securities Corp. | |||||||
| 450 | 3.94%, 05/15/2038 | 466 | |||||
| Goldman Sachs Mortgage Securities Corp. II | |||||||
| 110 | 3.02%, 03/06/2020 ■Δ | 109 | |||||
| Harley-Davidson Motorcycle Trust | |||||||
| 3,158 | 5.21%, 06/17/2013 | 3,194 | |||||
| Marriott Vacation Club Owner Trust | |||||||
| 510 | 5.36%, 10/20/2028 ■ | 527 | |||||
| New Century Home Equity Loan Trust | |||||||
| 8 | 0.48%, 03/25/2035 Δ | 7 | |||||
| Prudential Commercial Mortgage Trust | |||||||
| 570 | 4.49%, 02/11/2036 | 594 | |||||
| USAA Automotive Owner Trust | |||||||
| 6,113 | 4.50%, 10/15/2013 | 6,188 | |||||
| 24,892 | |||||||
| Total asset & commercial mortgage backed securities | |||||||
| (cost $22,882) | $ | 24,892 | |||||
| CORPORATE BONDS: INVESTMENT GRADE - 12.8% | |||||||
| Air Transportation - 0.3% | |||||||
| Continental Airlines, Inc. | |||||||
| $ | 3,921 | 5.98%, 04/19/2022 | $ | 4,033 | |||
| Southwest Airlines Co. | |||||||
| 2,700 | 5.75%, 12/15/2016 | 2,982 | |||||
| 3,037 | 6.15%, 08/01/2022 | 3,311 | |||||
| 10,326 | |||||||
| Arts, Entertainment and Recreation - 0.6% | |||||||
| CBS Corp. | |||||||
| 575 | 5.75%, 04/15/2020 | 623 | |||||
| Comcast Corp. | |||||||
| 8,000 | 5.90%, 03/15/2016 | 9,107 | |||||
| DirecTV Holdings LLC | |||||||
| 3,310 | 6.38%, 03/01/2041 | 3,534 | |||||
| News America Holdings, Inc. | |||||||
| 1,275 | 4.50%, 02/15/2021 ■ | 1,258 | |||||
| Time Warner Cable, Inc. | |||||||
| 4,870 | 5.85%, 05/01/2017 | 5,477 | |||||
| Virgin Media Secured Finance plc | |||||||
| 1,255 | 5.25%, 01/15/2021 ■ | 1,336 | |||||
| 21,335 | |||||||
| Beverage and Tobacco Product Manufacturing - 0.2% | |||||||
| Altria Group, Inc. | |||||||
| 2,445 | 4.75%, 05/05/2021 | 2,443 | |||||
| Anheuser-Busch InBev N.V. | |||||||
| 4,200 | 7.75%, 01/15/2019 | 5,284 | |||||
| Cia Brasileira de Bebidas | |||||||
| 300 | 10.50%, 12/15/2011 | 313 | |||||
| Coca-Cola Enterprises, Inc. | |||||||
| 500 | 8.50%, 02/01/2022 | 684 | |||||
| Diageo Capital plc | |||||||
| 430 | 5.20%, 01/30/2013 | 458 | |||||
| Philip Morris International, Inc. | |||||||
| 270 | 5.65%, 05/16/2018 | 304 | |||||
| 9,486 | |||||||
| Chemical Manufacturing - 0.0% | |||||||
| Agrium, Inc. | |||||||
| 660 | 6.13%, 01/15/2041 | 688 | |||||
| Computer and Electronic Product Manufacturing - 0.1% | |||||||
| Dell, Inc. | |||||||
| 2,735 | 5.88%, 06/15/2019 | 3,069 | |||||
| Thermo Fisher Scientific, Inc. | |||||||
| 845 | 3.20%, 05/01/2015 | 879 | |||||
| 3,948 | |||||||
| Electrical Equipment, Appliance Manufacturing - 0.2% | |||||||
| General Electric Co. | |||||||
| 6,925 | 5.00%, 02/01/2013 | 7,350 | |||||
| Finance and Insurance - 7.2% | |||||||
| Ace INA Holdings, Inc. | |||||||
| 700 | 5.88%, 06/15/2014 | 783 | |||||
| American Express Centurion Bank | |||||||
| 6,350 | 6.00%, 09/13/2017 | 7,163 | |||||
| ANZ National Ltd. | |||||||
| 1,360 | 2.38%, 12/21/2012 ■ | 1,381 | |||||
| Bank of America Corp. | |||||||
| 200 | 7.38%, 05/15/2014 | 225 | |||||
| Barclays Bank plc | |||||||
| 2,150 | 2.38%, 01/13/2014 | 2,175 | |||||
| BP Capital Markets plc | |||||||
| 2,850 | 4.75%, 03/10/2019 | 3,006 | |||||
| Brandywine Operating Partnership | |||||||
| 2,010 | 6.00%, 04/01/2016 | 2,185 | |||||
| CDP Financial, Inc. | |||||||
| 3,475 | 4.40%, 11/25/2019 ■ | 3,559 | |||||
| Citibank NA | |||||||
| 26,000 | 1.88%, 06/04/2012 | 26,384 | |||||
| Hartford Advisers HLS Fund |
| Schedule of Investments – (continued) |
| June 30, 2011 (Unaudited) |
| (000’s Omitted) |
| Shares or Principal Amount | Market Value ╪ | ||||||
| CORPORATE BONDS: INVESTMENT GRADE - 12.8% - (continued) | |||||||
| Finance and Insurance - 7.2% - (continued) | |||||||
| Citigroup, Inc. | |||||||
| $ | 8,800 | 6.00%, 10/31/2033 | $ | 8,416 | |||
| 2,700 | 6.13%, 05/15/2018 | 2,973 | |||||
| 1,700 | 6.88%, 03/05/2038 | 1,892 | |||||
| 520 | 8.13%, 07/15/2039 | 651 | |||||
| Credit Agricole | |||||||
| 3,950 | 3.50%, 04/13/2015 ■ | 3,961 | |||||
| Eaton Vance Corp. | |||||||
| 3,305 | 6.50%, 10/02/2017 | 3,816 | |||||
| Everest Reinsurance Holdings, Inc. | |||||||
| 4,525 | 5.40%, 10/15/2014 | 4,910 | |||||
| General Electric Capital Corp. | |||||||
| 4,300 | 4.38%, 09/16/2020 | 4,251 | |||||
| 5,000 | 5.88%, 01/14/2038 | 5,058 | |||||
| Goldman Sachs Group, Inc. | |||||||
| 14,000 | 1.63%, 07/15/2011 | 14,008 | |||||
| 6,000 | 5.63%, 01/15/2017 | 6,352 | |||||
| 2,750 | 6.00%, 05/01/2014 | 3,017 | |||||
| 1,700 | 6.15%, 04/01/2018 | 1,850 | |||||
| 2,590 | 6.25%, 02/01/2041 | 2,611 | |||||
| Health Care Properties | |||||||
| 4,230 | 6.00%, 01/30/2017 | 4,658 | |||||
| HSBC Holdings plc | |||||||
| 240 | 0.50%, 10/06/2016 Δ | 237 | |||||
| Jackson National Life Insurance Co. | |||||||
| 6,250 | 8.15%, 03/15/2027 ■ | 7,043 | |||||
| JP Morgan Chase & Co. | |||||||
| 3,500 | 3.70%, 01/20/2015 | 3,639 | |||||
| 2,000 | 4.95%, 03/25/2020 | 2,066 | |||||
| 10,375 | 5.13%, 09/15/2014 | 11,212 | |||||
| Kimco Realty Corp. | |||||||
| 4,380 | 5.78%, 03/15/2016 | 4,838 | |||||
| Liberty Mutual Group, Inc. | |||||||
| 6,050 | 5.75%, 03/15/2014 ■ | 6,420 | |||||
| Liberty Property L.P. | |||||||
| 1,725 | 6.63%, 10/01/2017 | 1,978 | |||||
| Merrill Lynch & Co., Inc. | |||||||
| 11,000 | 5.00%, 02/03/2014 | 11,843 | |||||
| 1,000 | 6.40%, 08/28/2017 | 1,092 | |||||
| 6,000 | 6.88%, 04/25/2018 | 6,638 | |||||
| Morgan Stanley | |||||||
| 13,000 | 5.38%, 10/15/2015 | 13,897 | |||||
| 250 | 5.63%, 09/23/2019 | 256 | |||||
| National City Corp. | |||||||
| 4,250 | 6.88%, 05/15/2019 | 4,898 | |||||
| New England Mutual Life Insurance Co. | |||||||
| 6,000 | 7.88%, 02/15/2024 ■ | 7,150 | |||||
| Nordea Bank Ab | |||||||
| 1,790 | 3.70%, 11/13/2014 ■ | 1,873 | |||||
| Postal Square L.P. | |||||||
| 14,502 | 8.95%, 06/15/2022 | 18,991 | |||||
| Prudential Financial, Inc. | |||||||
| 8,000 | 5.50%, 03/15/2016 | 8,708 | |||||
| Rabobank Nederland N.V. NY | |||||||
| 3,900 | 3.20%, 03/11/2015 ■ | 4,035 | |||||
| Realty Income Corp. | |||||||
| 2,830 | 6.75%, 08/15/2019 | 3,235 | |||||
| Republic New York Capital I | |||||||
| 500 | 7.75%, 11/15/2026 | 511 | |||||
| Royal Bank of Scotland plc | |||||||
| 2,600 | 4.88%, 03/16/2015 | 2,698 | |||||
| Simon Property Group L.P. | |||||||
| 3,710 | 6.10%, 05/01/2016 | 4,261 | |||||
| Sovereign Bancorp, Inc. | |||||||
| 4,795 | 8.75%, 05/30/2018 | 5,413 | |||||
| Sovereign Capital Trust IV | |||||||
| 7,250 | 7.91%, 06/13/2036 | 7,392 | |||||
| Svenska Handelsbanken Ab | |||||||
| 2,900 | 4.88%, 06/10/2014 ■ | 3,132 | |||||
| UBS AG Stamford | |||||||
| 235 | 5.88%, 12/20/2017 | 258 | |||||
| Wachovia Corp. | |||||||
| 10,000 | 5.25%, 08/01/2014 | 10,718 | |||||
| 2,000 | 5.75%, 06/15/2017 | 2,224 | |||||
| WEA Finance LLC | |||||||
| 2,850 | 7.13%, 04/15/2018 ■ | 3,326 | |||||
| 275,267 | |||||||
| Food Manufacturing - 0.3% | |||||||
| Kellogg Co. | |||||||
| 3,900 | 4.00%, 12/15/2020 | 3,894 | |||||
| Kraft Foods, Inc. | |||||||
| 3,800 | 4.13%, 02/09/2016 | 4,063 | |||||
| 285 | 5.38%, 02/10/2020 | 312 | |||||
| Wrigley Jr., William Co. | |||||||
| 3,900 | 3.70%, 06/30/2014 ■ | 4,052 | |||||
| 12,321 | |||||||
| Health Care and Social Assistance - 0.6% | |||||||
| CVS Corp. | |||||||
| 7,725 | 6.13%, 08/15/2016 | 8,856 | |||||
| Express Scripts, Inc. | |||||||
| 1,020 | 6.25%, 06/15/2014 | 1,149 | |||||
| McKesson Corp | |||||||
| 475 | 3.25%, 03/01/2016 | 490 | |||||
| Merck & Co., Inc. | |||||||
| 2,100 | 4.00%, 06/30/2015 | 2,273 | |||||
| Schering-Plough Corp. | |||||||
| 9,000 | 5.30%, 12/01/2013 | 9,951 | |||||
| 22,719 | |||||||
| Information - 0.6% | |||||||
| AT&T, Inc. | |||||||
| 2,300 | 2.50%, 08/15/2015 | 2,330 | |||||
| 2,510 | 6.80%, 05/15/2036 | 2,806 | |||||
| BellSouth Telecommunications | |||||||
| 650 | 7.00%, 12/01/2095 | 682 | |||||
| Cellco Partnership - Verizon Wireless Capital | |||||||
| 395 | 5.55%, 02/01/2014 | 435 | |||||
| France Telecom S.A. | |||||||
| 1,300 | 4.38%, 07/08/2014 | 1,408 | |||||
| Intuit, Inc. | |||||||
| 7,900 | 5.40%, 03/15/2012 | 8,147 | |||||
| SBA Tower Trust | |||||||
| 2,035 | 4.25%, 04/15/2015 ■ | 2,141 | |||||
| Telecom Italia Capital | |||||||
| 2,900 | 7.00%, 06/04/2018 | 3,172 | |||||
| Verizon Communications, Inc. | |||||||
| 240 | 4.35%, 02/15/2013 | 253 | |||||
| 21,374 | |||||||
| Machinery Manufacturing - 0.2% | |||||||
| Xerox Corp. | |||||||
| 6,000 | 8.25%, 05/15/2014 | 7,040 | |||||
| Shares or Principal Amount | Market Value ╪ | ||||||
| CORPORATE BONDS: INVESTMENT GRADE - 12.8% - (continued) | |||||||
| Motor Vehicle & Parts Manufacturing - 0.3% | |||||||
| DaimlerChrysler NA Holdings Corp. | |||||||
| $ | 9,550 | 6.50%, 11/15/2013 | $ | 10,624 | |||
| Petroleum and Coal Products Manufacturing - 0.4% | |||||||
| Atmos Energy Corp. | |||||||
| 5,875 | 6.35%, 06/15/2017 | 6,794 | |||||
| EnCana Corp. | |||||||
| 305 | 5.90%, 12/01/2017 | 346 | |||||
| Motiva Enterprises LLC | |||||||
| 420 | 5.75%, 01/15/2020 ■ | 466 | |||||
| Ras Laffan Liquefied Natural Gas Co., Ltd. | |||||||
| 1,200 | 5.50%, 09/30/2014 ■ | 1,313 | |||||
| Shell International Finance B.V. | |||||||
| 6,400 | 4.38%, 03/25/2020 | 6,725 | |||||
| 15,644 | |||||||
| Pipeline Transportation - 0.1% | |||||||
| Kinder Morgan Energy Partners L.P. | |||||||
| 5,000 | 6.95%, 01/15/2038 | 5,431 | |||||
| Primary Metal Manufacturing - 0.0% | |||||||
| ArcelorMittal | |||||||
| 1,571 | 6.75%, 03/01/2041 | 1,557 | |||||
| Real Estate and Rental and Leasing - 0.3% | |||||||
| COX Communications, Inc. | |||||||
| 440 | 4.63%, 06/01/2013 | 467 | |||||
| 9,000 | 5.45%, 12/15/2014 | 10,031 | |||||
| ERAC USA Finance Co. | |||||||
| 1,121 | 2.25%, 01/10/2014 ■ | 1,132 | |||||
| 1,800 | 4.50%, 08/16/2021 ■ | 1,789 | |||||
| 13,419 | |||||||
| Retail Trade - 0.2% | |||||||
| Lowe's Co., Inc. | |||||||
| 3,400 | 4.63%, 04/15/2020 | 3,618 | |||||
| Staples, Inc. | |||||||
| 2,525 | 9.75%, 01/15/2014 | 3,006 | |||||
| 6,624 | |||||||
| Soap, Cleaning Compound and Toilet Manufacturing - 0.3% | |||||||
| Procter & Gamble Co. | |||||||
| 10,339 | 9.36%, 01/01/2021 | 13,372 | |||||
| Utilities - 0.9% | |||||||
| Consolidated Edison Co. of NY | |||||||
| 4,605 | 5.30%, 12/01/2016 | 5,241 | |||||
| Enel Finance International S.A. | |||||||
| 300 | 3.88%, 10/07/2014 ■ | 310 | |||||
| Indianapolis Power and Light | |||||||
| 8,000 | 6.60%, 06/01/2037 ■ | 9,124 | |||||
| MidAmerican Energy Co. | |||||||
| 6,000 | 5.65%, 07/15/2012 | 6,306 | |||||
| Niagara Mohawk Power Corp. | |||||||
| 2,510 | 3.55%, 10/01/2014 ■ | 2,628 | |||||
| Southern California Edison Co. | |||||||
| 8,000 | 5.55%, 01/15/2037 | 8,371 | |||||
| Wisconsin Electirc Power Co. | |||||||
| 1,960 | 4.25%, 12/15/2019 | 2,055 | |||||
| 34,035 | |||||||
| Total corporate bonds: investment grade | |||||||
| (cost $456,523) | $ | 492,560 | |||||
| CORPORATE BONDS: NON-INVESTMENT GRADE - 0.2% | |||||||
| Finance and Insurance - 0.2% | |||||||
| Capital One Capital IV | |||||||
| $ | 1,625 | 6.75%, 02/17/2037 | $ | 1,647 | |||
| Discover Financial Services, Inc. | |||||||
| 3,620 | 6.45%, 06/12/2017 | 4,016 | |||||
| Southern Capital Corp. | |||||||
| 58 | 5.70%, 06/30/2022 ■ | 59 | |||||
| 5,722 | |||||||
| Total corporate bonds: non-investment grade | |||||||
| (cost $5,278) | $ | 5,722 | |||||
| MUNICIPAL BONDS - 1.0% | |||||||
| General Obligations - 0.4% | |||||||
| Chicago Metropolitan Water Reclamation Dist, | |||||||
| $ | 685 | 5.72%, 12/01/2038 | $ | 711 | |||
| Illinois State GO, | |||||||
| 60 | 5.37%, 03/01/2017 | 62 | |||||
| 1,075 | 5.67%, 03/01/2018 | 1,115 | |||||
| 860 | 5.88%, 03/01/2019 | 884 | |||||
| Los Angeles USD, | |||||||
| 4,300 | 5.75%, 07/01/2034 | 4,238 | |||||
| Oregon School Boards Association, Taxable Pension, | |||||||
| 10,000 | 4.76%, 06/30/2028 | 9,275 | |||||
| 16,285 | |||||||
| Health Care/Services - 0.0% | |||||||
| University of California, Regents Medical Center Rev, | |||||||
| 1,935 | 6.58%, 05/15/2049 | 2,035 | |||||
| Higher Education (Univ., Dorms, etc.) - 0.1% | |||||||
| Curators University, MO, System Fac Rev, | |||||||
| 2,170 | 5.96%, 11/01/2039 | 2,370 | |||||
| University of California, Build America Bonds Revs, | |||||||
| 1,960 | 5.77%, 05/15/2043 | 1,948 | |||||
| 4,318 | |||||||
| Tax Allocation - 0.1% | |||||||
| Dallas, TX, Area Rapid Transit Taxable Sales Tax Rev, | |||||||
| 2,200 | 6.00%, 12/01/2044 | 2,411 | |||||
| Transportation - 0.3% | |||||||
| Bay Area Toll Auth, | |||||||
| 3,100 | 6.26%, 04/01/2049 | 3,335 | |||||
| Illinois State Toll Highway Auth, Taxable Rev, | |||||||
| 1,875 | 6.18%, 01/01/2034 | 1,941 | |||||
| Maryland State Transit Auth, | |||||||
| 1,350 | 5.89%, 07/01/2043 | 1,432 | |||||
| New York and New Jersey PA, Taxable Rev, | |||||||
| 975 | 5.86%, 12/01/2024 | 1,092 | |||||
| 570 | 6.04%, 12/01/2029 | 618 | |||||
| Hartford Advisers HLS Fund |
| Schedule of Investments – (continued) |
| June 30, 2011 (Unaudited) |
| (000’s Omitted) |
| Shares or Principal Amount | Market Value ╪ | ||||||
| MUNICIPAL BONDS - 1.0% - (continued) | |||||||
| Transportation - 0.3% - (continued) | |||||||
| North Texas Tollway Auth Rev, | |||||||
| $ | 3,400 | 6.72%, 01/01/2049 | $ | 3,705 | |||
| 12,123 | |||||||
| Utilities - Water and Sewer - 0.1% | |||||||
| Irvine Ranch, CA, Water Dist, | |||||||
| 2,870 | 2.61%, 03/15/2014 | 2,976 | |||||
| Total municipal bonds | |||||||
| (cost $39,493) | $ | 40,148 | |||||
| U.S. GOVERNMENT AGENCIES - 1.4% | |||||||
| Federal Home Loan Mortgage Corporation - 0.9% | |||||||
| $ | 183 | 2.41%, 04/01/2029 Δ | $ | 188 | |||
| 35,775 | 4.00%, 12/01/2040 - 03/01/2041 | 35,796 | |||||
| 35,984 | |||||||
| Federal National Mortgage Association - 0.1% | |||||||
| 525 | 2.75%, 02/05/2014 | 552 | |||||
| 887 | 4.78%, 02/01/2014 | 943 | |||||
| 1,424 | 4.97%, 12/01/2013 | 1,521 | |||||
| 298 | 5.00%, 02/01/2019 - 04/01/2019 | 322 | |||||
| 23 | 6.50%, 11/01/2013 | 23 | |||||
| 3 | 7.00%, 02/01/2029 | 4 | |||||
| 3,365 | |||||||
| Government National Mortgage Association - 0.4% | |||||||
| 4,622 | 6.00%, 06/15/2024 - 06/15/2035 | 5,184 | |||||
| 1,486 | 6.50%, 03/15/2026 - 02/15/2035 | 1,695 | |||||
| 6,067 | 7.00%, 11/15/2031 - 11/15/2033 | 7,071 | |||||
| 285 | 7.50%, 09/16/2035 | 325 | |||||
| 1,052 | 8.00%, 09/15/2026 - 02/15/2031 | 1,174 | |||||
| 73 | 9.00%, 06/20/2016 - 06/15/2022 | 80 | |||||
| 15,529 | |||||||
| Total U.S. government agencies | |||||||
| (cost $52,160) | $ | 54,878 | |||||
| U.S. GOVERNMENT SECURITIES - 13.5% | |||||||
| Other Direct Federal Obligations - 2.8% | |||||||
| Federal Financing Corporation - 0.4% | |||||||
| $ | 17,617 | 4.40%, 12/06/2013 - 12/27/2013 ○ | $ | 17,153 | |||
| Tennessee Valley Authority - 2.4% | |||||||
| 34,300 | 4.38%, 06/15/2015 | 37,884 | |||||
| 50,000 | 6.00%, 03/15/2013 | 54,542 | |||||
| 92,426 | |||||||
| 109,579 | |||||||
| U.S. Treasury Securities - 10.7% | |||||||
| U.S. Treasury Bonds - 3.2% | |||||||
| 42,353 | 4.38%, 11/15/2039 - 05/15/2041 | 42,341 | |||||
| 22,000 | 4.38%, 02/15/2038 | 22,144 | |||||
| 1,100 | 4.50%, 05/15/2038 | 1,129 | |||||
| 850 | 4.75%, 02/15/2041 □ | 904 | |||||
| 100 | 5.38%, 02/15/2031 | 117 | |||||
| 18,000 | 6.00%, 02/15/2026 | 22,404 | |||||
| 25,650 | 6.25%, 08/15/2023 | 32,540 | |||||
| 121,579 | |||||||
| U.S. Treasury Notes - 7.5% | |||||||||||
| 22,600 | 0.63%, 12/31/2012 | 22,693 | |||||||||
| 18,000 | 1.13%, 12/15/2012 | 18,203 | |||||||||
| 106,000 | 1.25%, 10/31/2015 | 105,105 | |||||||||
| 26,900 | 1.38%, 05/15/2012 - 01/15/2013 | 27,230 | |||||||||
| 23,000 | 2.75%, 02/15/2019 | 23,221 | |||||||||
| 75 | 3.13%, 04/30/2013 | 79 | |||||||||
| 38,090 | 3.50%, 05/15/2020 | 39,765 | |||||||||
| 25,000 | 3.88%, 05/15/2018 | 27,385 | |||||||||
| 13,000 | 4.25%, 08/15/2013 | 14,032 | |||||||||
| 9,950 | 4.75%, 05/31/2012 | 10,362 | |||||||||
| 288,075 | |||||||||||
| 409,654 | |||||||||||
| Total U.S. government securities | |||||||||||
| (cost $500,769) | $ | 519,233 | |||||||||
| Total long-term investments | |||||||||||
| (cost $3,381,800) | $ | 3,773,348 | |||||||||
| SHORT-TERM INVESTMENTS - 1.6% | |||||||||||
| Repurchase Agreements - 1.6% | |||||||||||
| Bank of America Merrill Lynch TriParty | |||||||||||
| Joint Repurchase Agreement (maturing on | |||||||||||
| 07/01/2011 in the amount of $6,066, | |||||||||||
| collateralized by FHLB 4.91%, 2015, | |||||||||||
| GNMA 0.87% - 5.72%, 2025 - 2061, value | |||||||||||
| of $6,187) | |||||||||||
| $ | 6,066 | 0.05%, 06/30/2011 | $ | 6,066 | |||||||
| BNP Paribas Securities Corp. TriParty Joint | |||||||||||
| Repurchase Agreement (maturing on | |||||||||||
| 07/01/2011 in the amount of $4,565, | |||||||||||
| collateralized by FNMA 3.50% - 6.50%, | |||||||||||
| 2023 - 2041, value of $4,657) | |||||||||||
| 4,565 | 0.05%, 06/30/2011 | 4,565 | |||||||||
| Deutsche Bank Securities TriParty Joint | |||||||||||
| Repurchase Agreement (maturing on | |||||||||||
| 07/01/2011 in the amount of $44,154, | |||||||||||
| collateralized by GNMA 4.00% - 7.00%, | |||||||||||
| 2035 - 2040, value of $45,037) | |||||||||||
| 44,154 | 0.05%, 06/30/2011 | 44,154 | |||||||||
| UBS Securities, Inc. Joint Repurchase | |||||||||||
| Agreement (maturing on 07/01/2011 in the | |||||||||||
| amount of $88, collateralized by U.S. | |||||||||||
| Treasury Bill 0.63%, 2012, value of $90) | |||||||||||
| 88 | 0.01%, 06/30/2011 | 88 | |||||||||
| UBS Securities, Inc. TriParty Joint | |||||||||||
| Repurchase Agreement (maturing on | |||||||||||
| 07/01/2011 in the amount of $6,739, | |||||||||||
| collateralized by FHLMC 4.50%, 2040, | |||||||||||
| FNMA 4.50% - 6.00%, 2035 - 2041, value | |||||||||||
| of $6,874) | |||||||||||
| 6,739 | 0.06%, 06/30/2011 | 6,739 | |||||||||
| 61,612 | |||||||||||
| Total short-term investments | |||||||||||
| (cost $61,612) | $ | 61,612 | |||||||||
| Total investments | |||||||||||
(cost $3,443,412) ▲ | 99.8 | % | $ | 3,834,960 | |||||||
| Other assets and liabilities | 0.2 | % | 6,683 | ||||||||
| Total net assets | 100.0 | % | $ | 3,841,643 | |||||||
| Note: | Percentage of investments as shown is the ratio of the total market value to total net assets. Market value of investments in foreign securities represents 8.7% of total net assets at June 30, 2011. |
Prices of foreign equities that are principally traded on certain foreign markets may be adjusted daily pursuant to a fair value pricing service approved by the Board of Directors in order to reflect an adjustment for factors occurring after the close of certain foreign markets but before the close of the New York Stock Exchange.
| ▲ | At June 30, 2011, the cost of securities for federal income tax purposes was $3,492,604 and the aggregate gross unrealized appreciation and depreciation based on that cost were: |
| Unrealized Appreciation | $ | 459,499 | ||
| Unrealized Depreciation | (117,143 | ) | ||
| Net Unrealized Appreciation | $ | 342,356 |
| † | The aggregate value of securities valued in good faith at fair value as determined under policies and procedures established by and under the supervision of the Company's Board of Directors at June 30, 2011, was $27,817, which represents 0.72% of total net assets. This amount excludes securities that are principally traded in certain foreign markets and whose prices are adjusted pursuant to a third party pricing service methodology approved by the Board of Directors. |
| ● | Currently non-income producing. |
| Δ | Variable rate securities; the rate reported is the coupon rate in effect at June 30, 2011. |
| ○ | The interest rate disclosed for these securities represents the effective yield on the date of the acquisition. |
| ■ | Securities issued within terms of a private placement memorandum, exempt from registration under Rule 144A under the Securities Act of 1933, as amended, and may be sold only to qualified institutional buyers. Pursuant to guidelines adopted by the Board of Directors, these issues are determined to be liquid. At June 30, 2011, the aggregate value of these securities was $68,124, which represents 1.77% of total net assets. |
| □ | Security pledged as initial margin deposit for open futures contracts at June 30, 2011 as follows: |
| Unrealized | |||||||||||||||||||
| Number of | Expiration | Notional | Appreciation/ | ||||||||||||||||
| Description | Contracts* | Position | Date | Market Value ╪ | Amount | (Depreciation) | |||||||||||||
| U.S. 10 Year Note Future | 104 | Short | 09/21/2011 | $ | 12,722 | $ | 12,655 | $ | (67 | ) | |||||||||
| * | The number of contracts does not omit 000's. |
| ⌂ | The following securities are considered illiquid. Illiquid securities are often purchased in private placement transactions, are often not registered under the Securities Act of 1933 and may have contractual restrictions on resale. A security may also be considered illiquid if the security lacks a readily available market or if its valuation has not changed for a certain period of time. |
| Period Acquired | Shares/ Par | Security | Cost Basis | ||||||
| 06/2007 | 11,241 | Buck Holdings L.P. | $ | 8,617 | |||||
The aggregate value of these securities at June 30, 2011, was $27,817, which represents 0.72% of total net assets.
| GO | – | General Obligations |
| USD | – | United School District |
| Hartford Advisers HLS Fund |
| Schedule of Investments – (continued) |
| June 30, 2011 (Unaudited) |
| (000’s Omitted) |
Foreign Currency Contracts Outstanding at June 30, 2011
| Unrealized | |||||||||||||||||
| Contract | Appreciation/ | ||||||||||||||||
| Description | Counterparty | Buy / Sell | Market Value ╪ | Amount | Delivery Date | (Depreciation) | |||||||||||
| Japanese Yen | BNP Paribas Securities | Buy | $ | 21,838 | $ | 20,604 | 09/02/2011 | $ | 1,234 | ||||||||
| Japanese Yen | Citibank | Sell | 25,630 | 25,422 | 10/21/2011 | (208 | ) | ||||||||||
| Japanese Yen | Goldman Sachs | Buy | 25,636 | 24,184 | 09/02/2011 | 1,452 | |||||||||||
| Japanese Yen | Goldman Sachs | Sell | 47,474 | 45,498 | 09/02/2011 | (1,976 | ) | ||||||||||
| Japanese Yen | Goldman Sachs | Sell | 26,676 | 26,457 | 10/21/2011 | (219 | ) | ||||||||||
| $ | 283 | ||||||||||||||||
| ╪ | See Significant Accounting Policies of accompanying Notes to Financial Statements regarding valuation of securities. |
| Investment Valuation Hierarchy Level Summary |
| June 30, 2011 (Unaudited) |
| (000’s Omitted) |
| Total | Level 1 ♦ | Level 2 ♦ | Level 3 | |||||||||||||
| Assets: | ||||||||||||||||
| Asset & Commercial Mortgage Backed Securities | $ | 24,892 | $ | – | $ | 24,885 | $ | 7 | ||||||||
Common Stocks ‡ | 2,635,915 | 2,459,544 | 148,554 | 27,817 | ||||||||||||
| Corporate Bonds: Investment Grade | 492,560 | – | 485,216 | 7,344 | ||||||||||||
| Corporate Bonds: Non-Investment Grade | 5,722 | – | 5,663 | 59 | ||||||||||||
| Municipal Bonds | 40,148 | – | 40,148 | – | ||||||||||||
| U.S. Government Agencies | 54,878 | – | 54,878 | – | ||||||||||||
| U.S. Government Securities | 519,233 | 13,978 | 505,255 | – | ||||||||||||
| Short-Term Investments | 61,612 | – | 61,612 | – | ||||||||||||
| Total | $ | 3,834,960 | $ | 2,473,522 | $ | 1,326,211 | $ | 35,227 | ||||||||
| Foreign Currency Contracts * | 2,686 | – | 2,686 | – | ||||||||||||
| Total | $ | 2,686 | $ | – | $ | 2,686 | $ | – | ||||||||
| Liabilities: | ||||||||||||||||
| Foreign Currency Contracts * | 2,403 | – | 2,403 | – | ||||||||||||
| Futures * | 67 | 67 | – | – | ||||||||||||
| Total | $ | 2,470 | $ | 67 | $ | 2,403 | $ | – | ||||||||
| ♦ | For the six-month period ended June 30, 2011, there were no significant transfers between Level 1 and Level 2. |
| ‡ | The Fund has all or primarily all of the equity securities categorized in a particular level. Refer to the Schedule of Investments for further industry breakout. |
| * | Derivative instruments not reflected in the Schedule of Investments are valued at the unrealized appreciation/depreciation on the investments. |
Following is a reconciliation of Level 3 assets for which significant unobservable inputs were used to determine fair value:
| Balance as | Change in | |||||||||||||||||||||||||||||||||||
| of | Realized | Unrealized | Transfers | Transfers | Balance as | |||||||||||||||||||||||||||||||
| December | Gain | Appreciation | Net | Into | Out of | of June | ||||||||||||||||||||||||||||||
| 31, 2010 | (Loss) | (Depreciation) | Amortization | Purchases | Sales | Level 3 | Level 3 | 30, 2011 | ||||||||||||||||||||||||||||
| Assets: | ||||||||||||||||||||||||||||||||||||
| Asset & Commercial Mortgage Backed Securities | $ | 7 | $ | — | $ | — | * | $ | — | $ | — | $ | — | $ | — | $ | — | $ | 7 | |||||||||||||||||
| Common Stocks | 25,248 | — | 2,569 | † | — | — | — | — | — | 27,817 | ||||||||||||||||||||||||||
| Corporate Bonds | 7,681 | — | (137 | )‡ | — | — | (142 | ) | — | 1 | 7,403 | |||||||||||||||||||||||||
| Total | $ | 32,936 | $ | — | $ | 2,432 | $ | — | $ | — | $ | (142 | ) | $ | — | $ | 1 | $ | 35,227 | |||||||||||||||||
| * | Change in unrealized appreciation or depreciation in the current period relating to assets still held at June 30, 2011 rounds to zero. |
| † | Change in unrealized appreciation or depreciation in the current period relating to assets still held at June 30, 2011 was $2,569. |
| ‡ | Change in unrealized appreciation or depreciation in the current period relating to assets still held at June 30, 2011 was $(137). |
| Statement of Assets and Liabilities |
| June 30, 2011 (Unaudited) |
| (000’s Omitted) |
| Assets: | ||||
| Investments in securities, at market value (cost $3,443,412) | $ | 3,834,960 | ||
| Cash | 3 | |||
| Unrealized appreciation on foreign currency contracts | 2,686 | |||
| Receivables: | ||||
| Investment securities sold | 9,709 | |||
| Fund shares sold | 163 | |||
| Dividends and interest | 14,535 | |||
| Variation margin | 53 | |||
| Other assets | — | |||
| Total assets | 3,862,109 | |||
| Liabilities: | ||||
| Unrealized depreciation on foreign currency contracts | 2,403 | |||
| Payables: | ||||
| Fund shares redeemed | 17,410 | |||
| Investment management fees | 382 | |||
| Distribution fees | 21 | |||
| Accrued expenses | 250 | |||
| Total liabilities | 20,466 | |||
| Net assets | $ | 3,841,643 | ||
| Summary of Net Assets: | ||||
| Capital stock and paid-in-capital | $ | 4,510,930 | ||
| Accumulated undistributed net investment income | 52,478 | |||
| Accumulated net realized loss on investments and foreign currency transactions | (1,113,574 | ) | ||
| Unrealized appreciation of investments and the translations of assets and liabilities denominated in foreign currency | 391,809 | |||
| Net assets | $ | 3,841,643 | ||
| Shares authorized | 9,500,000 | |||
| Par value | $ | 0.001 | ||
Class IA: Net asset value per share | $ | 20.04 | ||
| Shares outstanding | 165,827 | |||
| Net assets | $ | 3,323,144 | ||
Class IB: Net asset value per share | $ | 20.25 | ||
| Shares outstanding | 25,601 | |||
| Net assets | $ | 518,499 | ||
| Statement of Operations |
| For the Six-Month Period Ended June 30, 2011 (Unaudited) |
| (000’s Omitted) |
| Investment Income: | ||||
| Dividends | $ | 25,689 | ||
| Interest | 23,573 | |||
| Less: Foreign tax withheld | (715 | ) | ||
| Total investment income, net | 48,547 | |||
| Expenses: | ||||
| Investment management fees | 12,242 | |||
| Distribution fees - Class IB | 678 | |||
| Custodian fees | 9 | |||
| Accounting services fees | 321 | |||
| Board of Directors' fees | 43 | |||
| Audit fees | 30 | |||
| Other expenses | 260 | |||
| Total expenses (before fees paid indirectly) | 13,583 | |||
| Commission recapture | (9 | ) | ||
| Total fees paid indirectly | (9 | ) | ||
| Total expenses, net | 13,574 | |||
| Net investment income | 34,973 | |||
| Net Realized Gain on Investments, Other Financial Instruments and Foreign Currency Transactions: | ||||
| Net realized gain on investments | 179,184 | |||
| Net realized loss on futures | (1,254 | ) | ||
| Net realized loss on foreign currency contracts | (186 | ) | ||
| Net realized gain on other foreign currency transactions | 214 | |||
| Net Realized Gain on Investments, Other Financial Instruments and Foreign Currency Transactions | 177,958 | |||
| Net Changes in Unrealized Depreciation of Investments, Other Financial Instruments and Foreign Currency Transactions: | ||||
| Net unrealized depreciation of investments | (61,309 | ) | ||
| Net unrealized depreciation of futures | (703 | ) | ||
| Net unrealized depreciation of foreign currency contracts | (236 | ) | ||
| Net unrealized appreciation on translation of other assets and liabilities in foreign currencies | 23 | |||
| Net Changes in Unrealized Depreciation of Investments, Other Financial Instruments and Foreign Currency Transactions | (62,225 | ) | ||
| Net Gain on Investments, Other Financial Instruments and Foreign Currency Transactions | 115,733 | |||
| Net Increase in Net Assets Resulting from Operations | $ | 150,706 | ||
| Statement of Changes in Net Assets |
| (000’s Omitted) |
| For the | ||||||||
| Six-Month | For the | |||||||
| Period Ended | Year Ended | |||||||
| June 30, 2011 | December 31, | |||||||
| (Unaudited) | 2010 | |||||||
| Operations: | ||||||||
| Net investment income | $ | 34,973 | $ | 67,724 | ||||
| Net realized gain on investments, other financial instruments and foreign currency transactions | 177,958 | 291,769 | ||||||
| Net unrealized appreciation (depreciation) of investments, other financial instruments and foreign currency transactions | (62,225 | ) | 97,470 | |||||
| Net Increase In Net Assets Resulting From Operations | 150,706 | 456,963 | ||||||
| Distributions to Shareholders: | ||||||||
| From net investment income | ||||||||
| Class IA | — | (48,804 | ) | |||||
| Class IB | — | (6,196 | ) | |||||
| Total distributions | — | (55,000 | ) | |||||
| Capital Share Transactions: | ||||||||
| Class IA | ||||||||
| Sold | 29,241 | 57,957 | ||||||
| Issued in merger | — | 188,305 | ||||||
| Issued on reinvestment of distributions | — | 48,804 | ||||||
| Redeemed | (376,924 | ) | (710,101 | ) | ||||
| Total capital share transactions | (347,683 | ) | (415,035 | ) | ||||
| Class IB | ||||||||
| Sold | 15,051 | 28,941 | ||||||
| Issued in merger | — | 36,319 | ||||||
| Issued on reinvestment of distributions | — | 6,196 | ||||||
| Redeemed | (72,583 | ) | (148,646 | ) | ||||
| Total capital share transactions | (57,532 | ) | (77,190 | ) | ||||
| Net decrease from capital share transactions | (405,215 | ) | (492,225 | ) | ||||
| Proceeds from regulatory settlements | — | 147 | ||||||
| Net Decrease In Net Assets | (254,509 | ) | (90,115 | ) | ||||
| Net Assets: | ||||||||
| Beginning of period | 4,096,152 | 4,186,267 | ||||||
| End of period | $ | 3,841,643 | $ | 4,096,152 | ||||
| Accumulated undistributed (distribution in excess of) net investment income | $ | 52,478 | $ | 17,505 | ||||
| Shares: | ||||||||
| Class IA | ||||||||
| Sold | 1,461 | 3,219 | ||||||
| Issued in merger | — | 10,373 | ||||||
| Issued on reinvestment of distributions | — | 2,575 | ||||||
| Redeemed | (18,844 | ) | (39,434 | ) | ||||
| Total share activity | (17,383 | ) | (23,267 | ) | ||||
| Class IB | ||||||||
| Sold | 744 | 1,579 | ||||||
| Issued in merger | — | 1,979 | ||||||
| Issued on reinvestment of distributions | — | 324 | ||||||
| Redeemed | (3,588 | ) | (8,152 | ) | ||||
| Total share activity | (2,844 | ) | (4,270 | ) | ||||
| Notes to Financial Statements |
| June 30, 2011 (Unaudited) |
| (000’s Omitted) |
| 1. | Organization: |
Hartford Advisers HLS Fund (the “Fund”) serves as an underlying investment option for certain variable annuity and variable life insurance separate accounts of Hartford Life Insurance Company (“HLIC”) and its affiliates and certain qualified retirement plans. The Fund may also serve as an underlying investment option for certain variable annuity and variable life separate accounts of other insurance companies. Owners of variable annuity contracts and policyholders of variable life insurance contracts may choose the funds permitted in the variable insurance contract prospectus. In addition, participants in certain qualified retirement plans may choose the Fund if permitted by their plans.
Hartford Series Fund, Inc. (the “Company”) is an open-end registered management investment company comprised of thirty portfolios. Financial Statements for the Fund, a series of the Company, are included in this report.
The Company is organized under the laws of the State of Maryland and is registered with the Securities and Exchange Commission (“SEC”) under the Investment Company Act of 1940, as amended (“1940 Act”). The Fund is a diversified open-end management investment company.
The Fund is divided into Class IA and Class IB shares. Each class is offered at the per share net asset value (“NAV”) without a sales charge and is subject to the same expenses, except that the Class IB shares are subject to distribution and service fees charged pursuant to a Distribution Plan adopted in accordance with Rule 12b-1 under the 1940 Act.
| 2. | Significant Accounting Policies: |
The following is a summary of significant accounting policies of the Fund in the preparation of its financial statements, which are in accordance with the United States Generally Accepted Accounting Principles (“U.S. GAAP”). The preparation of financial statements in accordance with U.S. GAAP may require management to make estimates and assumptions that affect the reported amounts of assets and liabilities and disclosure of contingent assets and liabilities at the date of the financial statements and the reported amounts of increases and decreases in net assets from operations during the reporting period. Actual results could differ from those estimates.
| a) | Determination of Net Asset Value – The NAV of each class of the Fund's shares is determined as of the close of regular trading (normally 4:00 p.m. Eastern Time) (the “NYSE Close”) on each day that the New York Stock Exchange (the “Exchange”) is open (“Valuation Date”). Information that becomes known to the Fund after the NAV has been calculated on a particular day will not generally be used to retroactively adjust the NAV determined earlier that day. |
| b) | Investment Valuation and Fair Value Measurements – For purposes of calculating the NAV, portfolio securities and other assets held by the Fund's portfolio for which market quotes are readily available are valued at market value. Market value is generally determined on the basis of last reported sales prices or official close price. If no sales are reported, market value is based on quotes obtained from a quotation reporting system, established market makers, or independent pricing services. If market prices are not readily available or are deemed unreliable, the Fund will use the fair value of the security as determined in good faith under policies and procedures established by and under the supervision of the Company's Board of Directors. Market quotes are considered not readily available where there is an absence of current or reliable market-based data (e.g., trade information or broker quotes), including where events occur after the close of the relevant market, but prior to the NYSE Close that materially affect the values of the Fund's portfolio securities or assets. In addition, market quotes are considered not readily available when, due to extraordinary circumstances, the exchanges or markets on which the securities trade, do not open for trading for the entire day and no other market prices are available. In addition, prices of foreign equities that are principally traded on certain foreign markets are adjusted daily pursuant to a fair value pricing service approved by the Board of Directors in order to reflect an adjustment for the factors occurring after the close of certain foreign markets but before the NYSE Close. Securities that are primarily traded on foreign markets may trade on days that are not business days of the Fund. The value of the foreign securities, |
| Hartford Advisers HLS Fund |
| Notes to Financial Statements – (continued) |
| June 30, 2011 (Unaudited) |
| (000’s Omitted) |
in which the Fund invests, may change on days when a shareholder will not be able to purchase or redeem shares of the Fund. Fair value pricing is subjective in nature and the use of fair value pricing by the Fund may cause the NAV of its shares to differ significantly from the NAV that would have been calculated using market prices at the close of the exchange on which a portfolio security is primarily traded. There can be no assurance that the Fund could obtain the fair market value assigned to a security if the Fund were to sell the security at approximately the time at which the Fund determines its NAV.
Fixed income securities (other than short term obligations) and non-exchange traded derivatives held by the Fund are normally valued on the basis of quotes obtained from brokers and dealers or independent pricing services in accordance with procedures established by the Company’s Board of Directors. Prices obtained from independent pricing services use information provided by market makers or estimates of market values obtained from yield data relating to investments or securities with similar characteristics. Generally, the Fund may use fair valuation in regard to fixed income securities when the Fund holds defaulted or distressed securities or securities in a company in which a reorganization is pending. Short-term investments maturing in 60 days or less are generally valued at amortized cost, if their original term to maturity was 60 days or less, or by amortizing their value on the 61st day prior to maturity, if the original term to maturity exceeded 60 days.
Futures contracts are valued at the most recent settlement price reported by an exchange on which, over time, they are traded most extensively. If a settlement price is not available, futures contracts will be valued at the most recent trade price as of the Valuation Time. If there were no trades, the contract shall be valued at the mean of the closing bid and asked prices as of the Valuation Time.
Investments valued in currencies other than U.S. dollars are converted to U.S. dollars using exchange rates obtained from independent pricing services for calculation of the NAV. As a result, the NAV of the Fund’s shares may be affected by changes in the value of currencies in relation to the U.S. dollar. The value of securities traded in markets outside the United States or denominated in currencies other than the U.S. dollar may be affected significantly on a day that the NYSE is closed and the market value may change on days when an investor is not able to purchase, redeem or exchange shares of the Fund.
Foreign currency contracts represent agreements to exchange currencies on specific future dates at predetermined rates. Foreign currency contracts are valued using foreign currency exchange rates and forward rates as provided by an independent pricing service on Valuation Date.
Financial instruments for which prices are not available from an independent pricing service may be valued using market quotations obtained from one or more dealers that make markets in the respective financial instrument in accordance with procedures established by the Company’s Board of Directors.
U.S. GAAP defines fair value as the price that the Fund would receive to sell an asset or pay to transfer a liability in an orderly transaction between market participants. The U.S. GAAP fair value measurement standards require disclosure of a fair value hierarchy for each major category of assets and liabilities. Various inputs are used in determining the fair value of the Fund’s investments. These inputs are summarized into three broad hierarchy levels. This hierarchy is based on whether the valuation inputs are observable or unobservable. These levels are:
| · | Level 1 – Quoted prices in active markets for identical securities. Level 1 may include exchange-traded instruments such as domestic equities, some foreign equities, options, futures, mutual funds, exchange-traded funds, rights and warrants. |
| · | Level 2 – Observable inputs other than Level 1 prices, such as quoted prices for similar securities; quoted prices in markets that are not active; or other inputs that are observable or can be corroborated by observable market data. Level 2 may include debt securities that are traded less frequently than exchange-traded instruments and which are valued using third party pricing services; foreign equities, whose value is determined using a multi- |
factor regression model with inputs that are observable in the market; and short-term securities, which are valued at amortized cost.
| · | Level 3 – Significant unobservable inputs that are supported by limited or no market activity. Level 3 may include financial instruments whose values are determined using broker quotes or require significant management judgment or estimation. These unobservable valuation inputs may include estimates for current yields, maturity/duration, prepayment speed, and broker quotes for comparable securities along with other assumptions relating to credit quality, collateral value, complexity of the security structure, general market conditions and liquidity. This category may include securities where trading has been halted or there are certain restrictions on trading. While these securities are priced using unobservable inputs, the valuation of these securities reflects the best available data and management believes the prices are a reasonable representation of exit price. |
Valuation levels are not necessarily indicative of the risk associated with investing in such securities. Individual securities within any of the above mentioned asset classes may be assigned a different hierarchical level than those presented above, as individual circumstances dictate.
For additional information, refer to the Investment Valuation Hierarchy Level Summary and the Level 3 roll forward reconciliation which follow the Schedule of Investments.
For purposes of reporting transfers between different hierarchy levels, both transfers in and out of each level, as applicable, are shown as if they occurred at the beginning of the period.
| c) | Security Transactions and Investment Income – Security transactions are recorded as of the trade date (the date the order to buy or sell is executed) for financial reporting purposes. Securities purchased or sold on a when-issued or delayed-delivery basis may be settled a month or more after the trade date. Realized gains and losses are determined on the basis of identified cost. |
Dividend income is recorded on the ex-dividend date, except certain dividends from foreign securities where the ex-dividend date may have passed are recorded as soon as the Fund is informed of the dividend. Interest income, including amortization of premium and accretion of discounts, is accrued on a daily basis. Paydown gains and losses on mortgage-related and other asset-backed securities are included in interest income on the Statement of Operations.
| d) | Foreign Currency Transactions – Assets and liabilities denominated in currencies other than U.S. dollars are translated into U.S. dollars at the exchange rates in effect on the valuation date. Purchases and sales of investment securities, income, and expenses are translated into U.S. dollars at the exchange rates on the dates of such transactions. |
The Fund does not isolate that portion of portfolio security valuation resulting from fluctuations in the foreign currency exchange rates from the fluctuations arising from changes in the market prices of securities held. Exchange rate fluctuations are included with the net realized and unrealized gain or loss on investments in the accompanying financial statements.
Net realized foreign exchange gains or losses arise from sales of foreign currencies and the difference between asset and liability amounts initially stated in foreign currencies and the U.S. dollar value of the amounts actually received or paid. Net unrealized foreign exchange gains or losses arise from changes in the value of other assets and liabilities at the end of the reporting period, resulting from changes in the exchange rates.
| e) | Joint Trading Account – The Fund may invest cash balances into a joint trading account that may be invested in one or more repurchase agreements. |
| Hartford Advisers HLS Fund |
| Notes to Financial Statements – (continued) |
| June 30, 2011 (Unaudited) |
| (000’s Omitted) |
| f) | Fund Share Valuation and Dividend Distributions to Shareholders – Orders for the Fund’s shares are executed in accordance with the investment instructions of the contract holders and plan participants. The NAV of the Fund’s shares is determined as of the close of business on each business day of the Exchange. The NAV is determined separately for each class of shares of the Fund by dividing the Fund’s net assets attributable to that class by the number of shares of the class outstanding. Each class of shares offered by the Fund has equal rights as to assets and voting privileges (except that shareholders of a class have exclusive voting rights regarding any matter relating solely to that class of shares). Income and non-class specific expenses are allocated daily to each class on the basis of the relative net assets of the class. Realized and unrealized capital gains and losses of each class are allocated daily based on the relative net assets of each class of shares of the Fund. |
Orders for the purchase of the Fund’s shares received prior to the close of the Exchange on any day the Exchange is open for business are priced at the NAV determined as of the close of the Exchange. Orders received after the close of the Exchange, or on a day on which the Exchange and/or the Fund is not open for business, are priced at the next determined NAV.
Dividends are declared pursuant to a policy adopted by the Company’s Board of Directors based upon the investment performance of the Fund. The policy of the Fund is to pay dividends from net investment income and realized capital gains, if any, at least once a year.
Distributions from net investment income, net realized capital gains and capital are determined in accordance with federal income tax regulations, which may differ from U.S. GAAP with respect to character and timing. These differences may include but are not limited to losses deferred due to wash sale adjustments, foreign currency gains and losses, adjustments related to Passive Foreign Investment Companies (“PFICs”), Real Estate Investment Trusts (“REITs”), Regulated Investment Companies (“RICs”), certain derivatives and partnerships. Permanent book and federal income tax basis differences relating to shareholder distributions will result in reclassifications to certain of the Fund’s capital accounts (see Federal Income Taxes: Reclassification of Capital Accounts note).
| 3. | Securities and Other Investments: |
| a) | Repurchase Agreements – A repurchase agreement is an agreement by which a counterparty agrees to sell a security and agrees to repurchase the security sold at a mutually agreed upon time and price. At the time the Fund enters into a repurchase agreement, the value of the underlying collateral security(ies), including accrued interest, will be equal to or exceed the value of the repurchase agreement. Repurchase agreements expose the Fund to counterparty risk. To minimize counterparty risk, the securities that serve to collateralize the repurchase agreement are held by the Fund's custodian in book entry or physical form in the custodial account of the Fund or in a third party custodial account. Repurchase agreements are valued at cost plus accrued interest. The Fund, as shown on the Schedule of Investments, had outstanding repurchase agreements as of June 30, 2011. |
| b) | Illiquid and Restricted Securities – The Fund is permitted to invest up to 15% of its net assets in illiquid securities. Illiquid securities are those that may not be sold or disposed of in the ordinary course of business within seven days, at approximately the price used to determine the Fund’s NAV. The Fund may not be able to sell illiquid securities or other investments when its sub-adviser considers it desirable to do so or may have to sell such securities or investments at a price that is lower than the price that could be obtained if the securities or investments were more liquid. A sale of illiquid securities or other investments may require more time and may result in higher dealer discounts and other selling expenses than does the sale of those that are liquid. Illiquid securities and investments also may be more difficult to value, due to the unavailability of reliable market quotations for such securities or investments, and an investment in them may have an adverse impact on the Fund’s NAV. The Fund may also purchase certain restricted securities that can only be resold to certain qualified investors and may be determined to be liquid pursuant to policies and guidelines established by the Company’s Board of Directors. The Fund, as shown on the Schedule of Investments, had illiquid and/or restricted securities as of June 30, 2011. |
| c) | Securities Purchased on a When-Issued or Delayed-Delivery Basis – Delivery and payment for securities that have been purchased by the Fund on a forward commitment, or when-issued or delayed-delivery basis, take place beyond the customary settlement period. During this period, such securities are subject to market fluctuations, and the Fund identifies securities segregated in its records with value at least equal to the amount of the commitment. The Fund had no outstanding when-issued or delayed delivery securities as of June 30, 2011. |
| d) | Mortgage Related and Other Asset Backed Securities – The Fund may invest in mortgage related and other asset backed securities. These securities include mortgage pass-through securities, collateralized mortgage obligations, commercial mortgage backed securities, stripped mortgage backed securities, asset backed securities, collateralized debt obligations and other securities that directly or indirectly represent a participation in, or are secured by and payable from, mortgage loans on real property. Mortgage related securities are created from pools of residential or commercial mortgage loans, including mortgage loans made by savings and loan institutions, mortgage bankers, commercial banks and others. Asset backed securities are created from many types of assets, including auto loans, credit card receivables, home equity loans, and student loans. These securities provide a monthly payment which consists of both interest and principal payments. Interest payments may be determined by fixed or adjustable rates. The rate of pre-payments on underlying mortgages will affect the price and volatility of a mortgage related security, and may have the effect of shortening or extending the effective duration of the security relative to what was anticipated at the time of purchase. The timely payment of principal and interest of certain mortgage-related securities is guaranteed by the full faith and credit of the United States Government. Pools created and guaranteed by non-governmental issuers, including government-sponsored corporations, may be supported by various forms of insurance or guarantees, but there can be no assurance that the private insurers or guarantors can meet their obligations under the insurance policies or guarantee arrangements. |
| 4. | Financial Derivative Instruments: |
The following disclosures contain information on how and why the Fund uses derivative instruments, the credit-risk-related contingent features in certain derivative instruments, and how derivative instruments affect the Fund’s financial position, results of operations and cash flows. The location and fair value amounts of these instruments on the Statement of Assets and Liabilities and the realized gains and losses and changes in unrealized gains and losses on the Statement of Operations, each categorized by type of derivative contract, are included in the following Additional Derivative Instrument Information footnote. The derivative instruments outstanding as of period-end are disclosed in the Notes to the Schedule of Investments and the amounts of realized gains and losses and changes in unrealized gains and losses on derivative instruments during the period are disclosed in the Statement of Operations.
| a) | Foreign Currency Contracts – The Fund may enter into foreign currency contracts that obligate the Fund to purchase or sell currencies at specified future dates. Foreign currency contracts are used to hedge the currency exposure associated with some or all of the Fund's securities and/or as part of an investment strategy. Foreign currency contracts are marked to market daily and the change in value is recorded by the Fund as an unrealized gain or loss. Realized gains or losses equal to the difference between the value of the contract at the time it was opened and the value at the time it was closed are recorded upon delivery or receipt of the currency. |
Foreign currency contracts involve elements of market risk in excess of the amounts reflected in the Statement of Assets and Liabilities. In addition, risks may arise upon entering into these contracts from the potential inability of the counterparties to meet the terms of the contracts and from unanticipated movements in the value of the foreign currencies relative to the U.S. dollar. The Fund had outstanding foreign currency contracts as shown on the Schedule of Investments as of June 30, 2011.
| b) | Futures Contracts – The Fund may enter into futures contracts. A futures contract is an agreement between two parties to buy or sell an asset at a set price on a future date. The Fund uses futures contracts to manage or obtain exposure to the securities markets, commodities, or movements in interest rates and currency values. The primary risks associated with the use of futures contracts are the imperfect correlation between the change in market value of the securities held by the |
| Hartford Advisers HLS Fund |
| Notes to Financial Statements – (continued) |
| June 30, 2011 (Unaudited) |
| (000’s Omitted) |
Fund and the prices of futures contracts and the possibility of an illiquid market. Upon entering into a futures contract, the Fund is required to deposit with a futures commission merchant (“FCM”), an amount of cash or U.S. Government Agency Obligations in accordance with the initial margin requirements of the broker or exchange. Futures contracts marked to market daily at the most recent settlement price reported by an exchange on which, over time, they are traded most extensively, and an appropriate payable or receivable for the change in value (“variation margin”) is recorded the Fund. Gains or losses are recognized but not considered realized until the contracts expire or are closed. Futures contracts involve, to varying degrees, risk of loss in excess of the variation margin disclosed on the Statement of Assets and Liabilities, however, this risk is reduced through the use of an FCM. The Fund, as shown on the Schedule Investments, had outstanding futures contracts as of June 30, 2011.
| c) | Additional Derivative Instrument Information: |
Fair Values of Derivative Instruments on the Statement of Assets and Liabilities as of June 30, 2011:
| Risk Exposure Category | ||||||||||||||||||||||||||||
| Foreign | ||||||||||||||||||||||||||||
| Interest Rate | Exchange | Credit | Equity | Commodity | Other | |||||||||||||||||||||||
| Contracts | Contracts | Contracts | Contracts | Contracts | Contracts | Total | ||||||||||||||||||||||
| Assets: | ||||||||||||||||||||||||||||
Unrealized appreciation on foreign currency contracts | $ | — | $ | 2,686 | $ | — | $ | — | $ | — | $ | — | $ | 2,686 | ||||||||||||||
| Variation margin receivable * | 53 | — | — | — | — | — | 53 | |||||||||||||||||||||
| Total | $ | 53 | $ | 2,686 | $ | — | $ | — | $ | — | $ | — | $ | 2,739 | ||||||||||||||
| Liabilities: | ||||||||||||||||||||||||||||
Unrealized depreciation on foreign currency contracts | $ | — | $ | 2,403 | $ | — | $ | — | $ | — | $ | — | $ | 2,403 | ||||||||||||||
| Total | $ | — | $ | 2,403 | $ | — | $ | — | $ | — | $ | — | $ | 2,403 | ||||||||||||||
* Only current day's variation margin is reported within the Statement of Assets and Liabilities. The variation margin is included in the open futures cumulative appreciation (depreciation) of $(67) as reported in the Schedule of Investments.
The volume of derivatives that is presented in the Schedule of Investments is consistent with the derivative activity during the six-month period ended June 30, 2011.
The Effect of Derivative Instruments on the Statement of Operations for the six-month period ended June 30, 2011:
| Risk Exposure Category | ||||||||||||||||||||||||||||
| Foreign | ||||||||||||||||||||||||||||
| Interest Rate | Exchange | Credit | Equity | Commodity | Other | |||||||||||||||||||||||
| Contracts | Contracts | Contracts | Contracts | Contracts | Contracts | Total | ||||||||||||||||||||||
| Realized Gain (Loss) on Derivatives Recognized as a Result from Operations: | ||||||||||||||||||||||||||||
| Net realized loss on futures | $ | (1,254 | ) | $ | — | — | $ | — | $ | — | $ | — | $ | (1,254 | ) | |||||||||||||
Net realized loss on foreign currency contracts | — | (186 | ) | — | — | — | — | (186 | ) | |||||||||||||||||||
| Total | $ | (1,254 | ) | $ | (186 | ) | $ | — | $ | — | $ | — | $ | — | $ | (1,440 | ) | |||||||||||
| Net Change in Unrealized Appreciation (Depreciation) on Derivatives Recognized as a Result from Operations: | ||||||||||||||||||||||||||||
Net change in unrealized depreciation of futures | $ | (703 | ) | $ | — | — | $ | — | $ | — | $ | — | $ | (703 | ) | |||||||||||||
| Net change in unrealized depreciation of foreign currency contracts | — | (236 | ) | — | — | — | — | (236 | ) | |||||||||||||||||||
| Total | $ | (703 | ) | $ | (236 | ) | $ | — | $ | — | $ | — | $ | — | $ | (939 | ) | |||||||||||
| 5. | Principal Risks: |
| a) | Credit and Counterparty Risks – Credit risk depends largely on the perceived financial health of bond issuers. In general, the credit rating is inversely related to the credit risk of the issuer. Higher rated bonds generally are deemed to have less credit risk, while lower or unrated bonds are deemed to have higher risk of default. The share price, yield and total return of a fund that holds securities with higher credit risk may be more volatile than those of a fund that holds bonds with lower credit risk. Similar to credit risk, the Fund may be exposed to counterparty risk, or the risk that an institution or other entity with which the Fund has unsettled or open transactions will default. |
| b) | Market Risks – A Fund’s investments in derivatives and other financial instruments expose the Fund to various risks including, but not limited to, interest rate, prepayment, extension, foreign currency, and equity risks. Interest rate risk is the risk that fixed income securities will decline in value because of changes in interest rates. As nominal interest rates rise, the value of certain fixed income securities held by the Fund is likely to decrease. A nominal interest rate can be described as the sum of a real interest rate and an expected inflation rate. Fixed income securities with longer durations tend to be more sensitive to changes in interest rates, usually making them more volatile than securities with shorter durations. Duration is useful primarily as a measure of the sensitivity of a fixed income security’s market price to interest rate (i.e., yield) movements. In addition, securities are subject to extension risk. Rising interest rates may cause prepayments to occur at a slower than expected rate, thereby effectively lengthening the maturity of the security and making the security more sensitive to interest rate changes. Prepayment and extension risk are major risks of mortgage-backed securities, and certain asset-backed securities. For certain asset-backed securities, the actual maturity may be less than the stated maturity shown in the Schedule of Investments. As a result, the timing of income recognition relating to these securities may vary based upon the actual maturity. If a Fund invests directly in foreign currencies or in securities that trade in, and receive revenues in, foreign currencies, or in derivatives that provide exposure to foreign currencies, it will be subject to the risk that those currencies will decline in value relative to the base currency of the Fund, or, in the case of hedging positions, that the Fund’s base currency will decline in value relative to the currency being hedged. Currency rates in foreign countries may fluctuate significantly over short periods of time for a number of reasons, including changes in interest rates, intervention (or the failure to intervene) by U.S. or foreign governments, central banks or supranational entities such as the International Monetary Fund, or by the imposition of currency controls or other political developments in the United States or abroad. As a result, the Fund’s investments in foreign currency denominated securities may reduce the returns of the Fund. The market values of equity securities, such as common stocks and preferred stocks or equity related investments such as futures and options, may decline due to general market conditions which are not specifically related to a particular company, such as real or perceived adverse economic conditions, changes in the general outlook for corporate earnings, changes in interest or currency rates or adverse investor sentiment generally. The market value of equity securities may also decline due to factors which affect a particular industry or industries, such as labor shortages or increased production costs and competitive conditions within an industry. Equity securities and equity related investments generally have greater market price volatility than fixed income securities. |
| 6. | Federal Income Taxes: |
| a) | Federal Income Taxes – For federal income tax purposes, the Fund intends to continue to qualify as a RIC under Subchapter M of the Internal Revenue Code (“IRC”) by distributing substantially all of its taxable net investment income and net realized capital gains to its shareholders and otherwise complying with the requirements of RICs. The Fund has distributed substantially all of its income and capital gains in prior years, if applicable, and intends to distribute substantially all of its income and capital gains prior to the next fiscal year-end. Accordingly, no provision for federal income or excise taxes has been made in the accompanying financial statements. Distributions from short-term capital gains are treated as ordinary income distributions for federal income tax purposes. |
| b) | Net Investment Income (Loss), Net Realized Gains (Losses) – Net investment income (loss) and net realized gains (losses) may differ for financial statement and tax purposes primarily because of losses deferred due to wash sale adjustments, foreign currency gains and losses, adjustments related to PFICs, REITs, RICs, certain derivatives and |
| Hartford Advisers HLS Fund |
| Notes to Financial Statements – (continued) |
| June 30, 2011 (Unaudited) |
| (000’s Omitted) |
partnerships. The character of distributions made during the year from net investment income or net realized gains may differ from their ultimate characterization for federal income tax purposes. Also, due to the timing of dividend distributions, the fiscal year in which amounts are distributed may differ from the year that the income or realized gains (losses) were recorded by the Fund.
| c) | Distributions and Components of Distributable Earnings – The tax character of distributions paid by the Fund for the periods indicated is as follows (as adjusted for dividends payable): |
| For the Year Ended | For the Year Ended | |||||||
| December 31, 2010 | December 31, 2009 | |||||||
| Ordinary Income | $ | 55,000 | $ | 83,425 | ||||
As of December 31, 2010, the Fund’s components of distributable earnings (deficit) on a tax basis were as follows:
| Amount | ||||
| Undistributed Ordinary Income | $ | 18,214 | ||
| Accumulated Capital and Other Losses* | (1,241,886 | ) | ||
Unrealized Appreciation† | 403,679 | |||
| Total Accumulated Deficit | $ | (819,993 | ) | |
| * | The Fund has capital loss carryforwards that are identified in the Capital Loss Carryforward note that follows. |
| † | The difference between book-basis and tax-basis unrealized appreciation (depreciation) may be attributable to the losses deferred due to wash sale adjustments, foreign currency gains and losses, adjustments related to PFICs, REITs, RICs, certain derivatives and partnerships. |
| d) | Reclassification of Capital Accounts – The Fund may record reclassifications in its capital accounts. These reclassifications have no impact on the total net assets of the Fund. The reclassifications are a result of permanent differences between U.S. GAAP and tax accounting for such items as expiration or utilization of capital loss carryforwards or net operating losses. Adjustments are made to reflect the impact these items have on current and future distributions to shareholders. Therefore, the source of the Fund’s distributable income may be shown in the accompanying Statement of Assets and Liabilities as from accumulated undistributed net investment income, from accumulated net realized gains on investments or from capital depending on the type of book and tax differences that exist. For the year ended December 31, 2010, the Fund recorded reclassifications to increase (decrease) the accounts listed below: |
| Amount | ||||
| Accumulated Undistributed Net Investment Income | $ | 51 | ||
| Accumulated Net Realized Gain (Loss) on Investments and Foreign Currency Transactions | (8 | ) | ||
| Capital Stock and Paid-in-Capital | (43 | ) | ||
| e) | Capital Loss Carryforward – As of December 31, 2010 (tax-year end), the Fund had capital loss carryforwards for U.S. federal income tax purposes of approximately: |
| Year of Expiration | Amount | |||
| 2016 | $ | 284,231 | ||
| 2017 | 957,655 | |||
| Total | $ | 1,241,886 | ||
As a result of current or past mergers in the Fund, certain provisions in the Internal Revenue Code may limit the future utilization of capital losses. As of December 31, 2010, the Fund utilized $222,635 of prior year capital loss carryforwards.
| f) | Accounting for Uncertainty in Income Taxes – The Fund has adopted financial reporting rules that require the Fund to analyze all open tax years, as defined by the Statute of Limitations, for all major jurisdictions. Generally, tax authorities can examine all tax returns filed for the last three years. The Fund does not have an examination in progress. |
The Fund has reviewed all open tax years and major jurisdictions and concluded that these financial reporting rules had no effect on the Fund’s financial position or results of operations. There is no tax liability resulting from unrecognized tax benefits relating to uncertain income tax positions taken or expected to be taken on the tax return for the fiscal year-end December 31, 2010. The Fund is also not aware of any tax positions for which it is reasonably possible that the total amounts of unrecognized tax benefits will significantly change in the next twelve months.
| 7. | Expenses: |
| a) | Investment Management Agreements – HL Investment Advisors, LLC (“HL Advisors”), an indirect wholly owned subsidiary of The Hartford Financial Services Group, Inc. (“The Hartford”), serves as investment manager to the Fund pursuant to an Investment Management Agreement with the Company. As investment manager, HL Advisors has overall investment supervisory responsibility for the Fund. In addition, HL Advisors provides administrative personnel, services, equipment, facilities and office space for proper operation of the Fund. HL Advisors has contracted with Wellington Management Company, LLP (“Wellington Management”) under a sub-advisory agreement for the provision of day-today investment management services to the Fund in accordance with the Fund’s investment objective and policies. The Fund pays a fee to HL Advisors, a portion of which may be used to compensate Wellington Management. |
The schedule below reflects the rates of compensation paid to HL Advisors for investment management services rendered as of June 30, 2011; the rates are accrued daily and paid monthly.
| Average Daily Net Assets | Annual Fee | |||
| On first $250 million | 0.6800 | % | ||
| On next $250 million | 0.6550 | % | ||
| On next $500 million | 0.6450 | % | ||
| On next $4 billion | 0.5950 | % | ||
| On next $5 billion | 0.5925 | % | ||
| Over $10 billion | 0.5900 | % | ||
| Hartford Advisers HLS Fund |
| Notes to Financial Statements – (continued) |
| June 30, 2011 (Unaudited) |
| (000’s Omitted) |
| b) | Accounting Services Agreement – Pursuant to the Fund Accounting Agreement between HLIC and the Company, on behalf of the Fund, HLIC provides accounting services to the Fund and receives monthly compensation based on the Fund’s average net assets at the rates set forth below. The Fund’s accounting services fees are accrued daily and paid monthly. |
| Average Daily Net Assets | Annual Fee | |||
| On first $5 billion | 0.016 | % | ||
| On next $5 billion | 0.014 | % | ||
| Over $10 billion | 0.012 | % | ||
| c) | Operating Expenses – Allocable expenses incurred by the Company are allocated to each Fund and allocated to classes within a Fund in proportion to the average daily net assets of the Fund and each class, except where allocation of certain expenses is more fairly made directly to the Fund or to specific classes within a Fund. |
| d) | Fees Paid Indirectly – The Company, on behalf of the Fund, has entered into agreements with State Street Global Markets, LLC and Russell Implementation Services, Inc. to partially recapture non-discounted trade commissions. Such rebates are used to pay a portion of the Fund’s expenses. In addition, the Fund’s custodian bank has also agreed to reduce its fees when the Fund maintains cash on deposit in a non-interest-bearing custody account. For the six-month period ended June 30, 2011, these amounts are included in the Statement of Operations. |
The ratio of expenses to average net assets in the accompanying financial highlights excludes the reduction in expenses related to fees paid indirectly. The annualized expense ratio for the period listed below including the fees paid indirectly is as follows:
| Annualized Six- | ||||
| Month Period | ||||
| Ended June 30, | ||||
| 2011 | ||||
| Class IA | 0.64 | % | ||
| Class IB | 0.89 | |||
| e) | Distribution Plan for Class IB shares – The Company, on behalf of the Fund, has adopted a Distribution Plan pursuant to Rule 12b-1 of the 1940 Act to compensate the Distributor, Hartford Securities Distribution Company, Inc. (a wholly owned, ultimate subsidiary of The Hartford), from assets attributable to the Class IB shares for services rendered and expenses borne in connection with activities primarily intended to result in the sale of the Class IB shares, subject to the review and approval of the Company’s Board of Directors. |
The Distribution Plan provides that the Fund may pay annually up to 0.25% of the average daily net assets of the Fund attributable to its Class IB shares for activities primarily intended to result in the sale of Class IB shares. The Board has the authority to suspend or reduce these payments at any point in time. Under the terms of the Distribution Plan and the principal underwriting agreement, the Fund is authorized to make payments monthly to the Distributor that may be used to pay or compensate entities providing distribution and shareholder servicing with respect to the Class IB shares for such entities’ fees or expenses incurred or paid in that regard. These fees are accrued daily and paid monthly.
| f) | Other Related Party Transactions – Certain officers of the Fund are directors and/or officers of HL Advisors and/or The Hartford or its subsidiaries. For the six-month period ended June 30, 2011, a portion of the Fund’s chief compliance officer’s salary was paid by all the investment companies in the Hartford fund complex. The portion allocated to the Fund was in the amount of $3. These fees are accrued daily and paid monthly. |
| g) | Payment from Affiliate – On November 8, 2006, the SEC issued an order setting forth the terms of a settlement reached with three subsidiaries of The Hartford that resolved the SEC’s Division of Enforcement’s investigation of aspects of The Hartford’s variable annuity and mutual fund operations related to directed brokerage and revenue sharing. The Hartford settled this matter without admitting or denying the findings of the SEC. |
The total return in the accompanying financial highlights includes a payment from an affiliate. Had the payment from the affiliate been excluded, the impact and total return for the period listed below would have been as follows:
| For the Year Ended December 31, 2006 | ||||||||
| Class IA | Class IB | |||||||
| Impact from Payment from Affiliate for Unrestricted Transfers | 0.09 | % | 0.09 | % | ||||
| Total Return Excluding Payment from Affiliate | 10.61 | 10.34 | ||||||
| 8. | Investment Transactions: |
For the six-month period ended June 30, 2011, the Fund's aggregate purchases and sales of investment securities (excluding short-term investments) were as follows:
| Amount | ||||
| Cost of Purchases Excluding U.S. Government Obligations | $ | 895,750 | ||
| Sales Proceeds Excluding U.S. Government Obligations | 1,182,929 | |||
| Cost of Purchases for U.S. Government Obligations | 58,502 | |||
| Sales Proceeds for U.S. Government Obligations | 97,984 | |||
| 9. | Proceeds from Regulatory Settlement: |
During the year ended December 31, 2010, as a result of a settlement of an administrative proceeding brought by the SEC against an unaffiliated third party relating to market timing and/or late trading of mutual funds, the Fund received $147, which represented the Fund’s portion of the proceeds from the settlement (the Fund was not a party to the proceeding). The proceeds received by the Fund were recorded as an increase to additional paid-in-capital. The payment did not have a material impact on the Fund’s NAV.
| 10. | Line of Credit: |
The Fund is one of several Hartford funds that participate in a $500 million committed revolving line of credit facility. The facility is to be used for temporary or emergency purposes. Under the arrangement, a fund is required to own securities having a market value in excess of 300% of the total bank borrowings. The interest rate on borrowings varies depending on the nature of the loan. The facility also requires a fee to be paid based on the amount of the commitment. This commitment fee is allocated to all the funds participating in the line of credit based on the average net assets of the funds. During the six-month period ended June 30, 2011, the Fund did not have any borrowings under this facility.
| 11. | Industry Classifications: |
Other than the industry classifications “Other Investment Pools and Funds” and “Exchange Traded Funds,” equity industry classifications used in this report are the Global Industry Classification Standard, which was developed by and is the exclusive property and service mark of MSCI, Inc. and Standard & Poor’s.
| Hartford Advisers HLS Fund |
| Notes to Financial Statements – (continued) |
| June 30, 2011 (Unaudited) |
| (000’s Omitted) |
| 12. | Indemnifications: |
Under the Company’s organizational documents, the Company shall indemnify its officers and directors to the full extent required or permitted under Maryland General Corporation Law and the federal securities laws. In addition, the Company, on behalf of the Fund, may enter into contracts that contain a variety of indemnifications. The Company’s maximum exposure under these arrangements is unknown. However, as of the date of these financial statements the Company has not had prior claims or losses pursuant to these contracts and expects the risk of loss to be remote.
[This page is intentionally left blank]
| Financial Highlights |
| – Selected Per-Share Data – (A) |
| Net Asset | Net Realized | Net Increase | ||||||||||||||||||||||||||||||||||||||||||
| Value at | and Unrealized | Total from | Dividends from | Distributions | (Decrease) in | Net Asset | ||||||||||||||||||||||||||||||||||||||
| Beginning of | Net Investment | Payments from | Gain (Loss) on | Investment | Net Investment | from Realized | Distributions | Total | Net Asset | Value at End of | ||||||||||||||||||||||||||||||||||
| Class | Period | Income (Loss) | (to) Affiliate | Investments | Operations | Income | Capital Gains | from Capital | Distributions | Value | Period | |||||||||||||||||||||||||||||||||
| For the Six-Month Period Ended June 30, 2011 (Unaudited) | ||||||||||||||||||||||||||||||||||||||||||||
| IA | $ | 19.32 | $ | 0.19 | $ | – | $ | 0.53 | $ | 0.72 | $ | – | $ | – | $ | – | $ | – | $ | 0.72 | $ | 20.04 | ||||||||||||||||||||||
| IB | 19.55 | 0.17 | – | 0.53 | 0.70 | – | – | – | – | 0.70 | 20.25 | |||||||||||||||||||||||||||||||||
| For the Year Ended December 31, 2010(G) | ||||||||||||||||||||||||||||||||||||||||||||
| IA | 17.47 | 0.30 | – | 1.82 | 2.12 | (0.27 | ) | – | – | (0.27 | ) | 1.85 | 19.32 | |||||||||||||||||||||||||||||||
| IB | 17.68 | 0.26 | – | 1.83 | 2.09 | (0.22 | ) | – | – | (0.22 | ) | 1.87 | 19.55 | |||||||||||||||||||||||||||||||
| For the Year Ended December 31, 2009 | ||||||||||||||||||||||||||||||||||||||||||||
| IA | 13.69 | 0.36 | – | 3.78 | 4.14 | (0.36 | ) | – | – | (0.36 | ) | 3.78 | 17.47 | |||||||||||||||||||||||||||||||
| IB | 13.85 | 0.32 | – | 3.83 | 4.15 | (0.32 | ) | – | – | (0.32 | ) | 3.83 | 17.68 | |||||||||||||||||||||||||||||||
| For the Year Ended December 31, 2008 | ||||||||||||||||||||||||||||||||||||||||||||
| IA | 20.97 | 0.50 | – | (7.09 | ) | (6.59 | ) | (0.58 | ) | (0.11 | ) | – | (0.69 | ) | (7.28 | ) | 13.69 | |||||||||||||||||||||||||||
| IB | 21.18 | 0.47 | – | (7.17 | ) | (6.70 | ) | (0.52 | ) | (0.11 | ) | – | (0.63 | ) | (7.33 | ) | 13.85 | |||||||||||||||||||||||||||
| For the Year Ended December 31, 2007 | ||||||||||||||||||||||||||||||||||||||||||||
| IA | 22.60 | 0.55 | – | 0.90 | 1.45 | (0.53 | ) | (2.55 | ) | – | (3.08 | ) | (1.63 | ) | 20.97 | |||||||||||||||||||||||||||||
| IB | 22.78 | 0.49 | – | 0.92 | 1.41 | (0.46 | ) | (2.55 | ) | – | (3.01 | ) | (1.60 | ) | 21.18 | |||||||||||||||||||||||||||||
| For the Year Ended December 31, 2006 | ||||||||||||||||||||||||||||||||||||||||||||
| IA | 22.53 | 0.58 | 0.02 | 1.81 | 2.41 | (0.57 | ) | (1.77 | ) | – | (2.34 | ) | 0.07 | 22.60 | ||||||||||||||||||||||||||||||
| IB | 22.70 | 0.51 | 0.02 | 1.83 | 2.36 | (0.51 | ) | (1.77 | ) | – | (2.28 | ) | 0.08 | 22.78 | ||||||||||||||||||||||||||||||
| (A) | Information presented relates to a share outstanding throughout the indicated period. |
| (B) | The figures do not include sales charges or other fees which may be applied at the variable life insurance, variable annuity or qualified retirement plan product level. Any such additional sales charges or other fees would lower the Fund's performance. |
| (C) | Ratios do not reflect reductions for fees paid indirectly. Please see Fees Paid Indirectly in the Notes to Financial Statements. |
| (D) | Portfolio turnover rate is calculated on the basis of the Fund as a whole without distinguishing between the classes of shares issued. |
| (E) | Not annualized. |
| (F) | Annualized. |
| (G) | Per share amounts have been calculated using the average shares method. |
| (H) | During the year ended December 31, 2010, the Fund incurred $204.5 million in purchases associated with the transition of assets from Hartford Global Advisers HLS Fund, which merged into the Fund on March 19, 2010. These purchases were excluded from the portfolio turnover calculation. |
| (I) | Total return without the inclusion of the Payment from (to) Affiliate can be found in Expenses in the accompanying Notes to Financial Statements. |
| - Ratios and Supplemental Data - |
| Ratio of Expenses to Average Net | Ratio of Expenses to Average Net | Ratio of Net Investment Income to | Portfolio Turnover | |||||||||||||||||||
| Total Return(B) | Net Assets at End of Period | Assets Before Waivers(C) | Assets After Waivers(C) | Average Net Assets | Rate(D) | |||||||||||||||||
| 3.71 | %(E) | $ | 3,323,144 | 0.64 | %(F) | 0.64 | %(F) | 1.78 | %(F) | 23 | % | |||||||||||
| 3.59 | (E) | 518,499 | 0.89 | (F) | 0.89 | (F) | 1.53 | (F) | – | |||||||||||||
| 12.14 | 3,539,983 | 0.65 | 0.65 | 1.68 | 65 | (H) | ||||||||||||||||
| 11.86 | 556,169 | 0.90 | 0.90 | 1.43 | – | |||||||||||||||||
| 30.29 | 3,607,929 | 0.65 | 0.65 | 2.15 | 73 | |||||||||||||||||
| 29.96 | 578,338 | 0.90 | 0.90 | 1.90 | – | |||||||||||||||||
| (31.64 | ) | 3,404,626 | 0.63 | 0.63 | 2.43 | 76 | ||||||||||||||||
| (31.81 | ) | 548,899 | 0.88 | 0.88 | 2.18 | – | ||||||||||||||||
| 6.64 | 6,291,220 | 0.63 | 0.63 | 2.13 | 47 | |||||||||||||||||
| 6.37 | 1,080,254 | 0.88 | 0.88 | 1.88 | – | |||||||||||||||||
| 10.70 | (I) | 7,207,926 | 0.64 | 0.64 | 2.24 | 87 | ||||||||||||||||
| 10.43 | (I) | 1,252,293 | 0.89 | 0.89 | 1.99 | – | ||||||||||||||||
| Directors and Officers (Unaudited) |
The Board of Directors of the Company appoints officers who are responsible for the day-to-day operations of the Fund and who execute policies formulated by the Directors. Each director serves until his or her death, resignation, or retirement or until the next annual meeting of shareholders is held or until his or her successor is elected and qualifies.
Directors and officers who are employed by or who have a financial interest in The Hartford are considered “interested” persons of the Fund pursuant to the 1940 Act. Each officer and two of the Company’s directors, as noted in the chart below, are “interested” persons of the Fund. Each director serves as a director for The Hartford Mutual Funds, Inc., The Hartford Mutual Funds II, Inc., Hartford Series Fund, Inc., and Hartford HLS Series Fund II, Inc., which, as of June 30, 2011, collectively consist of 89 funds. Correspondence may be sent to directors and officers c/o Hartford Mutual Funds, P.O. Box 2999, Hartford, Connecticut 06104-2999, except that correspondence to Ms. Fagely may be sent to 500 Bielenberg Drive, Woodbury, Minnesota 55125.
The table below sets forth, for each director and officer, his or her name, year of birth, current position with the Company and date first elected or appointed to Hartford Series Fund, Inc. (“HSF”), and Hartford HLS Series Fund II, Inc. (“HSF2”), principal occupation, and, for directors, other directorships held. The Fund’s statement of additional information contains further information on the directors and is available free of charge by calling 1-800-862-6668 or writing to Hartford HLS Funds, c/o Individual Annuity Services, P.O. Box 5085, Hartford, CT 06102-5085.
Information on the aggregate remuneration paid to the directors of the Company can be found in the Statement of Operations herein. The Fund pays to The Hartford a portion of the chief compliance officer’s compensation, but does not pay salaries or compensation to any of their other officers or directors who are employed by The Hartford.
Non-Interested Directors
Lynn S. Birdsong (1946) Director since 2003, Co-Chairman of the Investment Committee
Mr. Birdsong is a private investor. Mr. Birdsong currently serves as a Director of the Sovereign High Yield Investment Company (April 2010 to current). Mr. Birdsong currently serves as an Independent Director of Nomura Partners Funds, Inc. (formerly, The Japan Fund) (March 2003 to current). From 2003 to March 2005, Mr. Birdsong was an independent director of the Atlantic Whitehall Funds. From 1979 to 2002, Mr. Birdsong was a managing director of Zurich Scudder Investments, an investment management firm. During his employment with Scudder, Mr. Birdsong was an Interested Director of The Japan Fund. Since 1981, Mr. Birdsong has been a partner in Birdsong Company, an advertising specialty firm.
Robert M. Gavin, Jr. (1940) Director since 2002 (HSF) and 1986 (HSF2), Chairman of the Board since 2004
Dr. Gavin is an educational consultant. Prior to September 1, 2001, he was President of Cranbrook Education Community and prior to July 1996, he was President of Macalester College, St. Paul, Minnesota.
Duane E. Hill (1945) Director since 2001 (HSF) and 2002 (HSF2), Chairman of the Nominating Committee
Mr. Hill is Partner of TSG Ventures L.P., a private equity investment company. Mr. Hill is a former partner of TSG Capital Group, a private equity investment firm that served as sponsor and lead investor in leveraged buyouts of middle market companies.
Sandra S. Jaffee (1941) Director since 2005
Ms. Jaffee served as Chairman (2008 to 2009) and Chief Executive Officer of Fortent (formerly Searchspace Group), a leading provider of compliance/regulatory technology to financial institutions from August 2005 to August 2009. From August 2004 to August 2005, Ms. Jaffee served as an Entrepreneur in Residence with Warburg Pincus, a private equity firm. From September 1995 to July 2004, Ms. Jaffee served as Executive Vice President at Citigroup, where she was President and Chief Executive Officer of Citibank’s Global Securities Services (1995 to 2003). Ms. Jaffe currently serves as a member of the Board of Directors of Broadridge Financial Solutions as well as a Trustee of Muhlenberg College.
William P. Johnston (1944) Director since 2005, Chairman of the Compliance Committee
In June 2006, Mr. Johnston was appointed as Senior Advisor to The Carlyle Group, a global private equity investment firm. In July 2006, Mr. Johnston was elected to the Board of Directors of MultiPlan, Inc. In August 2007, Mr. Johnston was elected to the Board of Directors of LifeCare Holdings, Inc. In February 2008, Mr. Johnston was elected to the Board of Directors of HCR-ManorCare, Inc. In May 2006, Mr. Johnston was elected to the Supervisory Board of Fresenius Medical Care AG & Co. KGaA, after its acquisition of Renal Care Group, Inc. in March 2006. Mr. Johnston joined Renal Care Group in November 2002 as a member of the Board of Directors and served as Chairman of the Board from March 2003 through March 2006. From September 1987 to December 2002, Mr. Johnston was with Equitable Securities Corporation (and its successors, SunTrust Equitable Securities and SunTrust Robinson Humphrey) serving in various investment banking and managerial positions, including Managing Director and Head of Investment Banking, Chief Executive Officer and Vice Chairman.
Phillip O. Peterson (1944) Director since 2002 (HSF) and 2000 (HSF2), Chairman of the Audit Committee
Mr. Peterson is a mutual fund industry consultant. He was a partner of KPMG LLP (an accounting firm) until July 1999. Mr. Peterson joined William Blair Funds in February 2007 as a member of the Board of Trustees. From January 2004 to April 2005, Mr. Peterson served as Independent President of the Strong Mutual Funds.
Lemma W. Senbet (1946) Director since 2005
Dr. Senbet is the William E. Mayer Chair Professor of Finance and Director, Center for Financial Policy, at the University of Maryland, Robert H. Smith School of Business. He was chair of the Finance Department from 1998 to 2006. Previously he was a chaired professor of finance at the University of Wisconsin-Madison. Also, he was director of the Fortis Funds from March 2000 to July 2002. Dr. Senbet served the finance profession in various capacities, including as director of the American Finance Association and President of the Western Finance Association. In 2006, Dr. Senbet was inducted Fellow of Financial Management Association International for his career-long distinguished scholarship and professional service.
Interested Directors and Officers
David N. Levenson (1966) Director since 2010
Mr. Levenson currently serves as President of The Hartford’s Wealth Management business. He was appointed to this role in July 2010. Previously, Mr. Levenson served as Executive Vice President of Legacy Holdings for The Hartford from June 2009 to July 2010. From 2006 to 2009, Mr. Levenson was with Hartford Life Insurance K.K. where he served as President and CEO from 2007 to 2009. He served as Managing Director of Hartford Investment Management Company from 2005 to 2006. Additionally, Mr. Levenson serves as Executive Vice President of The Hartford and as President, Director and Chief Executive Officer of Hartford Life Insurance Company (“HLIC”) and Hartford Life, Inc. (“HL Inc.”).
Lowndes A. Smith (1939) Director since 1996 (HSF) and 2002 (HSF2), Co-Chairman of the Investment Committee
Mr. Smith served as Vice Chairman of The Hartford from February 1997 to January 2002, as President and Chief Executive Officer of HL Inc. from February 1997 to January 2002, and as President and Chief Operating Officer of The Hartford Life Insurance Companies from January 1989 to January 2002. Mr. Smith serves as a Director of White Mountains Insurance Group, Ltd., One Beacon Insurance and Symetra Financial and as a Managing Director of Whittington Gray Associates.
Other Officers
James E. Davey (1964) President and Chief Executive Officer since 2010
Mr. Davey serves as Executive Vice President of HLIC. Additionally, Mr. Davey serves as President, Chief Executive Officer and Manager of Hartford Investment Financial Services, Inc. (“HIFSCO”) and President, Chief Executive Officer and Manager of HL Advisors. Mr. Davey joined The Hartford in 2002.
Tamara L. Fagely (1958) Vice President, Treasurer and Controller since 2002 (HSF) and 1993 (HSF2)
Ms. Fagely has been a Vice President of HASCO since 1998 and Chief Financial Officer since 2006. Currently Ms. Fagely is a Vice President of HLIC. She served as Assistant Vice President of HLIC from December 2001 through March 2005. In addition, Ms. Fagely is Controller and Chief Financial Officer of HIFSCO.
Susan M. Fleege (1959) AML Compliance Officer since 2011
Ms. Fleege currently serves as a Director of Risk Management at The Hartford. She previously served as AML Compliance Officer for the Fund from 2005-2008. Ms. Fleege joined HLIC in 2005 from Amerprise Financial Corporation where she held the position of Counsel from 2000 to 2005. Ms. Fleege is a certified Anti-Money Laundering Specialist.
Dr. Robert J. Froehlich (1953) Senior Managing Director since 2009
Dr. Froehlich joined The Hartford as Senior Managing Director in September 2009. Prior to joining The Hartford, Dr. Froehlich served as Vice Chairman of Deutsche Asset Management from 1997-2009.
Edward P. Macdonald (1967) Vice President, Secretary and Chief Legal Officer since 2005
Mr. Macdonald serves as Vice President of HLIC and Chief Legal Officer of Mutual Funds and Vice President of HIFSCO. He also serves as Vice President and Secretary of HASCO, and Chief Legal Officer, Secretary and Vice President of HL Advisors. Mr. Macdonald joined The Hartford in 2005.
| Hartford Advisers HLS Fund |
| Directors and Officers (Unaudited) – (continued) |
Vernon J. Meyer (1964) Vice President since 2006
Mr. Meyer serves as Senior Vice President of HLIC. He also serves as Senior Vice President of HIFSCO and HL Advisors. Mr. Meyer joined The Hartford in 2004.
Colleen B. Pernerewski (1969) Vice President and Chief Compliance Officer since 2010
Ms. Pernerewski serves as Vice President and Chief Investment Advisor Compliance Officer of HIFSCO and as Vice President and Chief Compliance Officer of HL Advisors. Ms. Pernerewski joined The Hartford in 2005 from Travelers Life and Annuity where she served as Counsel (2004-2005). Prior to Travelers Life and Annuity, Ms. Pernerewski held the position of Counsel at The Hartford (1998-2004).
Elizabeth L. Schroeder (1966) Vice President since 2010
Ms. Schroeder currently serves as Assistant Vice President of HLIC. Ms. Schroeder joined HLIC in 1991. She is also an Assistant Vice President of HIFSCO and HL Advisers.
Martin Swanson (1962) Vice President since 2010
Mr. Swanson is a Vice President of HLIC. Mr. Swanson also serves as Vice President/Marketing for HIFSCO. Prior to joining HLIC in 1998, Mr. Swanson was a Vice President at PaineWebber, Inc.
Jane Wolak (1961) Vice President since 2009
Ms. Wolak currently serves as Senior Vice President of HLIC. Ms. Wolak joined HLIC as Vice President, Retail Product Services in May 2007. She is also Vice President of HASCO. Previously, Ms. Wolak was with Sun Life Financial where she held the position of Vice President, Service Center Operations from 2001-2007.
A description of the policies and procedures that the Fund uses to determine how to vote proxies relating to portfolio securities and a record of how the Fund voted any proxies for the twelve-month period ended June 30, 2011 are available (1) without charge, upon request, by calling 800-862-6668 and (2) on the SEC’s website at http://www.sec.gov.
The Fund files a complete schedule of portfolio holdings with the SEC for the first and third quarters of each fiscal year on Form N-Q. The Fund’s Forms are available (1) without charge, upon request, by calling 800-862-6668 and (2) on the SEC’s website at http://www.sec.gov. The Form N-Q may be reviewed and copied at the SEC’s Public Reference Room in Washington, DC. Information on the operation of the Public Reference Room may be obtained by calling 1-800-SEC-0330.
| Expense Example (Unaudited) |
Your Fund's Expenses
As a shareholder of the Fund, you incur two types of costs: (1) transaction costs and (2) ongoing costs including investment management fees, distribution fees, and other fund expenses. This example is intended to help you understand your ongoing costs (in dollars) of investing in a Fund and to compare these costs with the ongoing costs of investing in other mutual funds. The example is based on an investment of $1,000 invested at the beginning of the period and held for the period of December 31, 2010 through June 30, 2011.
Actual Expenses
The first set of columns of the table below provides information about actual account values and actual expenses. You may use the information in this column, together with the amount you invested, to estimate the expenses that you paid over the period. Simply divide your account value by $1,000 (for example, an $8,600 account value divided by $1,000 = 8.6), then multiply the result by the number in the line under the heading entitled “Expenses Paid During Period” to estimate the expenses you paid on your account during this period.
Hypothetical Example for Comparison Purposes
The second set of columns of the table below provides information about hypothetical account values and hypothetical expenses based on a Fund's actual expense ratio and an assumed rate of return of 5% per year before expenses, which is not the Fund's actual return. The hypothetical account values and expenses may not be used to estimate the actual ending account balance or expenses you paid for the period. You may use this information to compare the ongoing costs of investing in a Fund and other funds. To do so, compare this 5% hypothetical example with the 5% hypothetical examples that appear in the shareholder reports of the other funds.
Please note that the expenses shown in the table are meant to highlight your ongoing costs only and do not reflect any transactional costs, such as sales charges (loads) and CDSC. Therefore, the second set of columns of the table is useful in comparing ongoing costs only, and will not help you determine the relative total costs of owning different funds. In addition, if these transactional costs were included, your costs would be higher. Expenses are equal to the Fund's annualized expense ratios multiplied by average account value over the period, multiplied by 181/365 (to reflect the one-half year period).
| Actual return | Hypothetical (5% return before expenses) | |||||||||||||||||||||||||||||||||||
| Expenses paid | Expenses paid | Days in | ||||||||||||||||||||||||||||||||||
| during the period | during the period | the | Days | |||||||||||||||||||||||||||||||||
| Beginning | Ending | December 31, 2010 | Beginning | Ending | December 31, 2010 | Annualized | current | in the | ||||||||||||||||||||||||||||
| Account Value | Account Value | through | Account Value | Account Value | through | expense | 1/2 | full | ||||||||||||||||||||||||||||
| December 31, 2010 | June 30, 2011 | June 30, 2011 | December 31, 2010 | June 30, 2011 | June 30, 2011 | ratio | year | year | ||||||||||||||||||||||||||||
| Class IA | $ | 1,000.00 | $ | 1,037.15 | $ | 3.23 | $ | 1,000.00 | $ | 1,021.62 | $ | 3.21 | 0.64 | % | 181 | 365 | ||||||||||||||||||||
| Class IB | $ | 1,000.00 | $ | 1,035.86 | $ | 4.49 | $ | 1,000.00 | $ | 1,020.38 | $ | 4.46 | 0.89 | % | 181 | 365 | ||||||||||||||||||||
35
| The Hartford | |
| P.O. Box 5085 | |
| Hartford, CT 06102-5085 |
Hartford Series Fund, Inc. is underwritten and distributed by Hartford Securities Distribution Company, Inc.
"The Hartford" is The Hartford Financial Services Group, Inc. and its subsidiaries.
Hartford Series Fund, Inc. inception dates range from 1977 to date. Hartford Series Fund, Inc. is not a subsidiary of The Hartford but is underwritten, distributed by and advised by subsidiaries of The Hartford. Investments in Hartford Series Fund, Inc. are not guaranteed by The Hartford or any other entity.
You should carefully consider investment objectives, risks, and charges and expenses of Hartford HLS Funds before investing. This and other information can be found in the Fund’s prospectus or summary prospectus, which can be obtained by calling 800-862-6668. Please read them carefully before you invest or send money.
| HLSSAR-AD11 8-11 | 106632 | Printed in U.S.A ©2011 The Hartford, Hartford, CT 06115 |
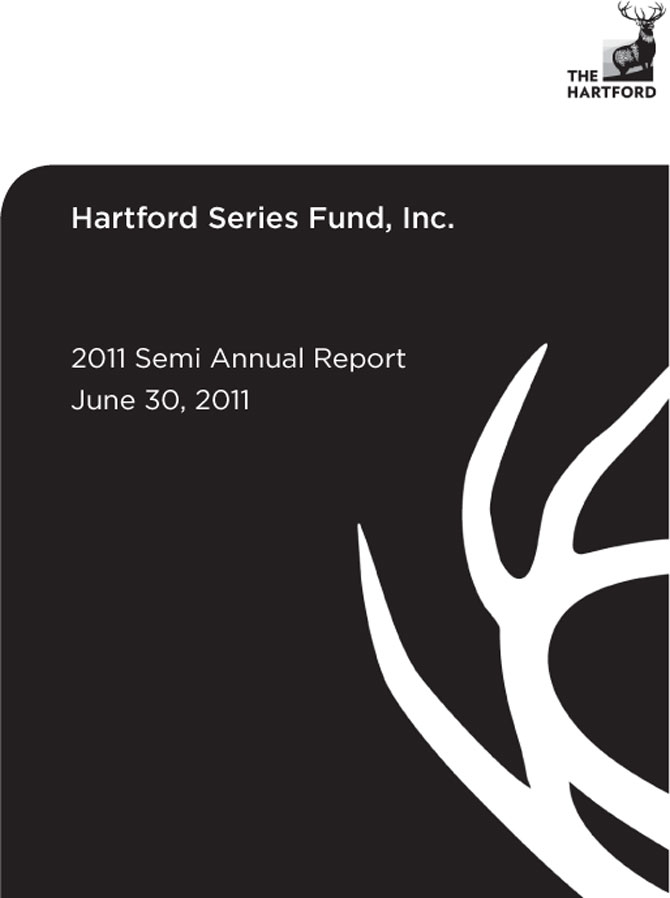
A MESSAGE FROM THE PRESIDENT

Dear Fellow Shareholders:
I want to take this opportunity to say thank you for your continued confidence and trust.
We have seen a significant amount of global turbulence in the first half of 2011. Investors have continued to be concerned about the implications of the European sovereign debt crisis, as well as our own high levels of domestic debt. Since January we have witnessed significant political uprisings in the already-volatile Middle East and North Africa region. In addition, the ramifications of Japan's massive earthquake, subsequent tsunami, and nuclear disaster are still being played out in the market.
Although corporate earnings have remained robust, the unemployment picture has been mixed. After adding more than 200,000 jobs from February to April, more recent unemployment reports have shown a pullback in hiring.
While official inflation remains low as measured by the Consumer Price Index (CPI), high oil prices may be indicative of higher inflation in the future. The federal funds rate remains at a historic low, however, the Fed could potentially raise the rate to get it closer to its historical average once the economy strengthens.
Even with these headwinds, domestic, international, and world indices (as measured by the S&P 500, MSCI EAFE and MSCI World) are all up more than 5% through June, 30 2011.
Looking ahead, continued growth in emerging markets is fueling global recovery efforts. Emerging markets comprise about 48 percent of the world’s GDP, and many economists believe they are poised for further expansion. As GDP growth continues in emerging markets, roughly 100 million people are added to the middle class each year. This middle class population growth could potentially drive a considerable shift in consumer purchasing power.
Now that we have reached the midpoint of 2011, perhaps now would be a good time to schedule a meeting with your financial adviser to examine your current investment strategy and determine whether you are on the right track.
| · | Are you concerned about inflation and its effects on your portfolio? |
| · | Is your portfolio prepared for rising interest rates? |
| · | Does your portfolio reflect the global economy with a mix of developed nations and emerging markets? |
Your financial professional’s advice can help you to navigate today’s volatile markets with confidence. You can also rest assured that we will continue to provide you with solid investments and stellar service for the road ahead.
Thank you again for your business.

James Davey
President
Hartford HLS Funds
Hartford Series Fund, Inc.
| Manager Discussions (Unaudited) | 2 | |
| Hartford Series Fund, Inc. Financial Statements: | ||
| Schedule of Investments as of June 30, 2011 (Unaudited): | ||
| 13 | ||
| 13 | ||
| 14 | ||
| 14 | ||
| 15 | ||
| 15 | ||
| 16 | ||
| 16 | ||
| 17 | ||
| 17 | ||
| 18 | ||
| 20 | ||
| 22 | ||
| 24 | ||
| 28 | ||
| 35 | ||
| 38 | ||
| 40 | ||
| 40 | ||
| 41 |
This report is prepared for the general information of contract owners and is not an offer of contracts. It should not be used in connection with any offer, except in conjunction with the appropriate product prospectus which contains all pertinent product information including the applicable sales, administrative and other charges.
American Funds Asset Allocation HLS Fund inception 4/30/2008 |
| (advised by HL Investment Advisors, LLC) |
| Investment Goal: Seeks high total return (including income and capital gains) consistent with preservation of capital over the long term. |
Performance Overview 4/30/08 - 6/30/11
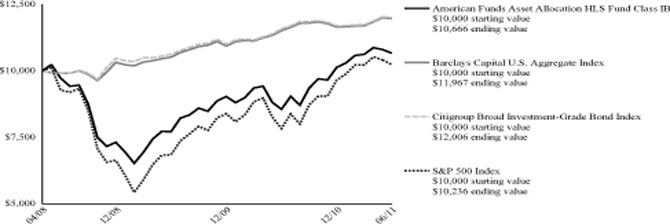
Average Annual Total Returns (as of 6/30/11) | |||
| Since | |||
| 6 Month† | 1 Year | Inception | |
| American Funds Asset Allocation HLS Fund IB | 5.26% | 24.62% | 2.06% |
| Barclays Capital U.S. Aggregate Index | 2.72% | 3.90% | 5.83% |
| Citigroup Broad Investment-Grade Bond Index | 2.66% | 3.66% | 5.94% |
| S&P 500 Index | 6.01% | 30.68% | 0.74% |
| † | Not Annualized |
PAST PERFORMANCE IS NOT INDICATIVE OF FUTURE RESULTS.
Total returns presented above were calculated using the Fund's net asset value available to shareholders for sale or redemption of Fund shares on June 30, 2011, which excludes investment transactions as of this date.
Barclays Capital U.S. Aggregate Index represents the U.S. investment-grade fixed-rate bond market. This index is unmanaged, and its results include reinvested dividends and/or distributions, but do not reflect the effect of sales charges, commissions, expenses or taxes.
Citigroup Broad Investment-Grade (BIG) Bond Index is a market capitalization-weighted index that includes fixed-rate U.S. Treasury, government-sponsored, mortgage, asset-backed and investment-grade corporates with a maturity of one year or longer. This index is unmanaged, and its results include reinvested dividends and/or distributions, but do not reflect the effect of sales charges, commissions, expenses or taxes.
S&P 500 Index is a market capitalization-weighted price index composed of 500 widely held common stocks.
You cannot invest directly in an index.
The chart represents a hypothetical investment in the Fund. Performance data represents past performance and current performance could be higher or lower.
Performance information may reflect historical or current expense waivers/reimbursements from the investment adviser, without which performance would have been lower. For information on current expense waivers/reimbursements, please see the prospectus.
| The value of the fund will fluctuate so that when redeemed, it may be worth more or less than the original investment. The chart and table do not reflect the deductions of taxes, sales charges or other fees which may be applied at the variable life insurance, variable annuity or qualified retirement plan product level. Any such additional sales charges or other fees or expenses would lower the contract’s or plan’s performance. |
How did the Fund perform?
The Class IB Shares of the American Funds Asset Allocation HLS Fund returned 5.26% for the six-month period ended June 30, 2011 versus the returns of 6.01% for the S&P 500 Index, 2.66% for the Citigroup Broad Investment-Grade Bond Index and 2.72% for the Barclays Capital U.S. Aggregate Index. The Fund outperformed the 4.89% average return of the Lipper Mixed Asset Target Allocation Growth Funds VP-UF peer group, a group of funds with investment strategies similar to those of the Fund.
The performance of the American Funds Asset Allocation HLS Fund is directly related to the performance of the American Funds Insurance Series – Asset Allocation Fund Class 1, in which the Fund invests. The financial statements of the American Funds Insurance Series – Asset Allocation Fund Class 1, including the Schedule of Investments, are provided in the accompanying report and should be read in conjunction with the American Funds Asset Allocation HLS Fund’s financial statements.
American Funds Blue Chip Income and Growth HLS Fund inception 4/30/2008 |
| (advised by HL Investment Advisors, LLC) |
| Investment Goal: Seeks to produce income exceeding the average yield on U.S. stocks generally and to provide an opportunity for growth of principal consistent with sound common stock investing. |
Performance Overview 4/30/08 - 6/30/11

Average Annual Total Returns (as of 6/30/11) | |||
| Since | |||
| 6 Month† | 1 Year | Inception | |
| American Funds Blue Chip Income and Growth HLS Fund IB | 3.52% | 25.15% | -0.15% |
| S&P 500 Index | 6.01% | 30.68% | 0.74% |
| † | Not Annualized |
PAST PERFORMANCE IS NOT INDICATIVE OF FUTURE RESULTS.
Total returns presented above were calculated using the Fund's net asset value available to shareholders for sale or redemption of Fund shares on June 30, 2011, which excludes investment transactions as of this date.
S&P 500 Index is a market capitalization-weighted price index composed of 500 widely held common stocks.
You cannot invest directly in an index.
The chart represents a hypothetical investment in the Fund. Performance data represents past performance and current performance could be higher or lower.
Performance information may reflect historical or current expense waivers/reimbursements from the investment adviser, without which performance would have been lower. For information on current expense waivers/reimbursements, please see the prospectus.
| The value of the fund will fluctuate so that when redeemed, it may be worth more or less than the original investment. The chart and table do not reflect the deductions of taxes, sales charges or other fees which may be applied at the variable life insurance, variable annuity or qualified retirement plan product level. Any such additional sales charges or other fees or expenses would lower the contract’s or plan’s performance. |
How did the Fund perform?
The Class IB Shares of the American Funds Blue Chip Income and Growth HLS Fund returned 3.52% for the six-month period ended June 30, 2011, versus the return of 6.01% for the S&P 500 Index. The Fund underperformed the 4.93% average return of the Lipper Large Cap Core Funds VP-UF peer group, a group of funds with investment strategies similar to those of the Fund.
The performance of the American Funds Blue Chip Income and Growth HLS Fund is directly related to the performance of the American Funds Insurance Series – Blue Chip Income and Growth Fund Class 1, in which the Fund invests. The financial statements of the American Funds Insurance Series – Blue Chip Income and Growth Fund Class 1, including the Schedule of Investments, are provided in the accompanying report and should be read in conjunction with the American Funds Blue Chip Income and Growth HLS Fund’s financial statements.
American Funds Bond HLS Fund inception 4/30/2008 |
| (advised by HL Investment Advisors, LLC) |
| Investment Goal: Seeks to maximize current income and preservation of capital. |
Performance Overview 4/30/08 - 6/30/11
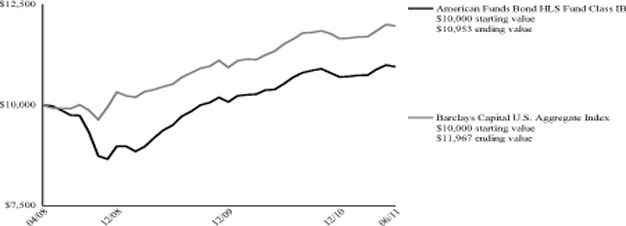
Average Annual Total Returns (as of 6/30/11) | |||
| Since | |||
| 6 Month† | 1 Year | Inception | |
| American Funds Bond HLS Fund IB | 2.39% | 4.02% | 2.92% |
| Barclays Capital U.S. Aggregate Index | 2.72% | 3.90% | 5.83% |
| † | Not Annualized |
PAST PERFORMANCE IS NOT INDICATIVE OF FUTURE RESULTS.
Total returns presented above were calculated using the Fund's net asset value available to shareholders for sale or redemption of Fund shares on June 30, 2011, which excludes investment transactions as of this date.
Barclays Capital U.S. Aggregate Index represents the U.S. investment-grade fixed-rate bond market. This index is unmanaged, and its results include reinvested dividends and/or distributions, but do not reflect the effect of sales charges, commissions, expenses or taxes.
You cannot invest directly in an index.
The chart represents a hypothetical investment in the Fund. Performance data represents past performance and current performance could be higher or lower.
Performance information may reflect historical or current expense waivers/reimbursements from the investment adviser, without which performance would have been lower. For information on current expense waivers/reimbursements, please see the prospectus.
| The value of the fund will fluctuate so that when redeemed, it may be worth more or less than the original investment. The chart and table do not reflect the deductions of taxes, sales charges or other fees which may be applied at the variable life insurance, variable annuity or qualified retirement plan product level. Any such additional sales charges or other fees or expenses would lower the contract’s or plan’s performance. |
How did the Fund perform?
The Class IB Shares of the American Funds Bond HLS Fund returned 2.39% for the six-month period ended June 30, 2011, versus the return of 2.72% for the Barclays Capital U.S. Aggregate Index. The Fund underperformed the 3.01% average return of the Lipper Corporate Debt Funds BBB-Rated VP-UF peer group, a group of funds with investment strategies similar to those of the Fund.
The performance of the American Funds Bond HLS Fund is directly related to the performance of the American Funds Insurance Series – Bond Fund Class 1, in which the Fund invests. The financial statements of the American Funds Insurance Series – Bond Fund Class 1, including the Schedule of Investments, are provided in the accompanying report and should be read in conjunction with the American Funds Bond HLS Fund’s financial statements.
American Funds Global Bond HLS Fund inception 4/30/2008 |
| (advised by HL Investment Advisors, LLC) |
| Investment Goal: Seeks a high level of total return over the long term. |
Performance Overview 4/30/08 - 6/30/11

Average Annual Total Returns (as of 6/30/11)
| Since | |||
| 6 Month† | 1 Year | Inception | |
| American Funds Global Bond HLS Fund IB | 4.18% | 10.18% | 5.29% |
| Barclays Capital Global Aggregate Index | 4.38% | 10.51% | 5.37% |
| † | Not Annualized |
PAST PERFORMANCE IS NOT INDICATIVE OF FUTURE RESULTS.
Total returns presented above were calculated using the Fund's net asset value available to shareholders for sale or redemption of Fund shares on June 30, 2011, which excludes investment transactions as of this date.
Barclays Capital Global Aggregate Index represents the global investment-grade fixed-income markets. This index is unmanaged and its results include reinvested dividends and/or distributions, but do not reflect the effect of sales charges, commissions, expenses or taxes.
You cannot invest directly in an index.
The chart represents a hypothetical investment in the Fund. Performance data represents past performance and current performance could be higher or lower.
Performance information may reflect historical or current expense waivers/reimbursements from the investment adviser, without which performance would have been lower. For information on current expense waivers/reimbursements, please see the prospectus.
| The value of the fund will fluctuate so that when redeemed, it may be worth more or less than the original investment. The chart and table do not reflect the deductions of taxes, sales charges or other fees which may be applied at the variable life insurance, variable annuity or qualified retirement plan product level. Any such additional sales charges or other fees or expenses would lower the contract’s or plan’s performance. |
How did the Fund perform?
The Class IB Shares of the American Funds Global Bond HLS Fund returned 4.18% for the six-month period ended June 30, 2011, versus the return of 4.38% for the Barclays Capital Global Aggregate Index. The Fund underperformed the 4.25% average return of the Lipper Global Income Funds VP-UF peer group, a group of funds with investment strategies similar to those of the Fund.
The performance of the American Funds Global Bond HLS Fund is directly related to the performance of the American Funds Insurance Series – Global Bond Fund Class 1, in which the Fund invests. The financial statements of the American Funds Insurance Series – Global Bond Fund Class 1, including the Schedule of Investments, are provided in the accompanying report and should be read in conjunction with the American Funds Global Bond HLS Fund’s financial statements.
American Funds Global Growth and Income HLS Fund inception 4/30/2008 |
| (advised by HL Investment Advisors, LLC) |
| Investment Goal: Seeks growth of capital over time and current income. |
Performance Overview 4/30/08 - 6/30/11

Average Annual Total Returns (as of 6/30/11) | |||
| Since | |||
| 6 Month† | 1 Year | Inception | |
American Funds Global Growth and Income HLS Fund IB | 2.98% | 26.04% | -1.00% |
| MSCI World Index | 5.62% | 31.19% | -1.11% |
| † | Not Annualized |
PAST PERFORMANCE IS NOT INDICATIVE OF FUTURE RESULTS.
Total returns presented above were calculated using the Fund's net asset value available to shareholders for sale or redemption of Fund shares on June 30, 2011, which excludes investment transactions as of this date.
MSCI World Index is a free float-adjusted market capitalization index that is designed to measure global-developed market equity performance. The index consists of 23 developed-market country indices, including the United States. This index is unmanaged, and its results include reinvested dividends and/or distributions, but do not reflect the effect of sales charges, commissions, expenses or taxes.
The American Funds Insurance Series – Global Growth and Income Fund Class 1 has selected the MSCI World Index to replace the MSCI All Country World Index as its broad-based securities market index. The investment manager believes that the MSCI World Index better reflects the market sectors and securities in which the American Funds Insurance Series – Global Growth and Income Fund Class 1 primarily invests than the MSCI All Country World Index.
You cannot invest directly in an index.
The chart represents a hypothetical investment in the Fund. Performance data represents past performance and current performance could be higher or lower.
Performance information may reflect historical or current expense waivers/reimbursements from the investment adviser, without which performance would have been lower. For information on current expense waivers/reimbursements, please see the prospectus.
| The value of the fund will fluctuate so that when redeemed, it may be worth more or less than the original investment. The chart and table do not reflect the deductions of taxes, sales charges or other fees which may be applied at the variable life insurance, variable annuity or qualified retirement plan product level. Any such additional sales charges or other fees or expenses would lower the contract’s or plan’s performance. |
How did the Fund perform?
The Class IB Shares of the American Funds Global Growth and Income HLS Fund returned 2.98% for the six-month period ended June 30, 2011, versus the return of 5.62% for the MSCI World Index. The Fund underperformed the 6.05% average return of the Lipper Global Core Funds VP-UF peer group, a group of funds with investment strategies similar to those of the Fund.
The performance of the American Funds Global Growth and Income HLS Fund is directly related to the performance of the American Funds Insurance Series – Global Growth and Income Fund Class 1, in which the Fund invests. The financial statements of the American Funds Insurance Series – Global Growth and Income Fund Class 1, including the Schedule of Investments, are provided in the accompanying report and should be read in conjunction with the American Funds Global Growth and Income HLS Fund’s financial statements.
American Funds Global Growth HLS Fund inception 4/30/2008 |
| (advised by HL Investment Advisors, LLC) |
| Investment Goal: Seeks long-term growth of capital. |
Performance Overview 4/30/08 - 6/30/11
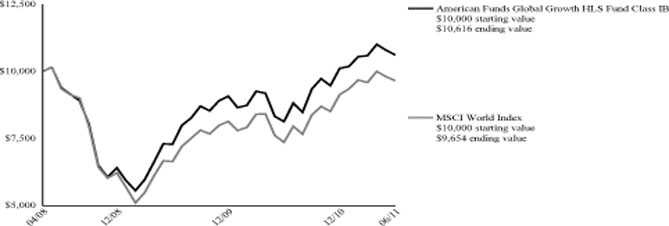
Average Annual Total Returns (as of 6/30/11)
| Since | |||
| 6 Month† | 1 Year | Inception | |
American Funds Global Growth HLS Fund IB | 4.94% | 30.57% | 1.90% |
| MSCI World Index | 5.62% | 31.19% | -1.11% |
| † | Not Annualized |
PAST PERFORMANCE IS NOT INDICATIVE OF FUTURE RESULTS.
Total returns presented above were calculated using the Fund's net asset value available to shareholders for sale or redemption of Fund shares on June 30, 2011, which excludes investment transactions as of this date.
MSCI World Index is a free float-adjusted market capitalization index that is designed to measure global-developed market equity performance. The index consists of 23 developed-market country indices, including the United States. This index is unmanaged, and its results include reinvested dividends and/or distributions, but do not reflect the effect of sales charges, commissions, expenses or taxes.
You cannot invest directly in an index.
The chart represents a hypothetical investment in the Fund. Performance data represents past performance and current performance could be higher or lower.
Performance information may reflect historical or current expense waivers/reimbursements from the investment adviser, without which performance would have been lower. For information on current expense waivers/reimbursements, please see the prospectus.
| The value of the fund will fluctuate so that when redeemed, it may be worth more or less than the original investment. The chart and table do not reflect the deductions of taxes, sales charges or other fees which may be applied at the variable life insurance, variable annuity or qualified retirement plan product level. Any such additional sales charges or other fees or expenses would lower the contract’s or plan’s performance. |
How did the Fund perform?
The Class IB Shares of the American Funds Global Growth HLS Fund returned 4.94% for the six-month period ended June 30, 2011, versus the return of 5.62% for the MSCI World Index. The Fund outperformed the 3.93% average return of the Lipper Global Growth Funds VP-UF peer group, a group of funds with investment strategies similar to those of the Fund.
The performance of the American Funds Global Growth HLS Fund is directly related to the performance of the American Funds Insurance Series – Global Growth Fund Class 1, in which the Fund invests. The financial statements of the American Funds Insurance Series – Global Growth Fund Class 1, including the Schedule of Investments, are provided in the accompanying report and should be read in conjunction with the American Funds Global Growth HLS Fund’s financial statements.
American Funds Global Small Capitalization HLS Fund inception 4/30/2008 |
| (advised by HL Investment Advisors, LLC) |
| Investment Goal: Seeks growth of capital over time. |
Performance Overview 4/30/08 - 6/30/11

Average Annual Total Returns (as of 6/30/11)
| Since | |||
| 6 Month† | 1 Year | Inception | |
American Funds Global Small Capitalization HLS Fund IB | 0.39% | 28.41% | 0.13% |
| MSCI All Country World Small Cap Index | 4.70% | 37.27% | 5.68% |
| † | Not Annualized |
PAST PERFORMANCE IS NOT INDICATIVE OF FUTURE RESULTS.
Total returns presented above were calculated using the Fund's net asset value available to shareholders for sale or redemption of Fund shares on June 30, 2011, which excludes investment transactions as of this date.
MSCI All Country World Small Cap Index is a free float-adjusted market capitalization-weighted index that is designed to measure equity market performance of smaller capitalization companies in both developed and emerging markets. This index is unmanaged and its results include reinvested dividends and/or distributions, but do not reflect the effect of sales charges, commissions, expenses or taxes.
The American Funds Insurance Series – Global Small Capitalization Fund Class 1 has selected the MSCI All Country World Small Cap Index to replace the S&P Global <$3 Billion Index as its broad-based securities market index. The investment manager believes that the MSCI All Country World Small Cap Index better reflects the market sectors and securities in which the American Funds Insurance Series – Global Small Capitalization Fund Class 1 primarily invests than the S&P Global <$3 Billion Index.
You cannot invest directly in an index.
The chart represents a hypothetical investment in the Fund. Performance data represents past performance and current performance could be higher or lower.
Performance information may reflect historical or current expense waivers/reimbursements from the investment adviser, without which performance would have been lower. For information on current expense waivers/reimbursements, please see the prospectus.
| The value of the fund will fluctuate so that when redeemed, it may be worth more or less than the original investment. The chart and table do not reflect the deductions of taxes, sales charges or other fees which may be applied at the variable life insurance, variable annuity or qualified retirement plan product level. Any such additional sales charges or other fees or expenses would lower the contract’s or plan’s performance. |
How did the Fund perform?
The Class IB Shares of the American Funds Global Small Capitalization HLS Fund returned 0.39% for the six-month period ended June 30, 2011, versus the return of 4.70% for the MSCI All Country World Small Cap Index. The Fund underperformed the 3.93% average return of the Lipper Global Growth Funds VP-UF peer group, a group of funds with investment strategies similar to those of the Fund.
The performance of the American Funds Global Small Capitalization HLS Fund is directly related to the performance of the American Funds Insurance Series – Global Small Capitalization Fund Class 1, in which the Fund invests. The financial statements of the American Funds Insurance Series – Global Small Capitalization Fund Class 1, including the Schedule of Investments, are provided in the accompanying report and should be read in conjunction with the American Funds Global Small Capitalization HLS Fund’s financial statements.
American Funds Growth HLS Fund inception 4/30/2008 |
| (advised by HL Investment Advisors, LLC) |
| Investment Goal: Seeks growth of capital. |
Performance Overview 4/30/08 - 6/30/11

Average Annual Total Returns (as of 6/30/11)
| Since | |||
| 6 Month† | 1 Year | Inception | |
| American Funds Growth HLS Fund IB | 5.83% | 32.69% | 0.76% |
| S&P 500 Index | 6.01% | 30.68% | 0.74% |
| † | Not Annualized |
PAST PERFORMANCE IS NOT INDICATIVE OF FUTURE RESULTS.
Total returns presented above were calculated using the Fund's net asset value available to shareholders for sale or redemption of Fund shares on June 30, 2011, which excludes investment transactions as of this date.
S&P 500 Index is a market capitalization-weighted price index composed of 500 widely held common stocks.
You cannot invest directly in an index.
The chart represents a hypothetical investment in the Fund. Performance data represents past performance and current performance could be higher or lower.
Performance information may reflect historical or current expense waivers/reimbursements from the investment adviser, without which performance would have been lower. For information on current expense waivers/reimbursements, please see the prospectus.
| The value of the fund will fluctuate so that when redeemed, it may be worth more or less than the original investment. The chart and table do not reflect the deductions of taxes, sales charges or other fees which may be applied at the variable life insurance, variable annuity or qualified retirement plan product level. Any such additional sales charges or other fees or expenses would lower the contract’s or plan’s performance. |
How did the Fund perform?
The Class IB Shares of the American Funds Growth HLS Fund returned 5.83% for the six-month period ended June 30, 2011, versus the return of 6.01% for the S&P 500 Index. The Fund outperformed the 5.55% average return of the Lipper Large-Cap Growth Funds VP-UF peer group, a group of funds with investment strategies similar to those of the Fund.
The performance of the American Funds Growth HLS Fund is directly related to the performance of the American Funds Insurance Series – Growth Fund Class 1, in which the Fund invests. The financial statements of the American Funds Insurance Series – Growth Fund Class 1, including the Schedule of Investments, are provided in the accompanying report and should be read in conjunction with the American Funds Growth HLS Fund’s financial statements.
American Funds Growth-Income HLS Fund inception 4/30/2008 |
| (advised by HL Investment Advisors, LLC) |
| Investment Goal: Seeks long-term growth of capital and income over time. |
Performance Overview 4/30/08 - 6/30/11
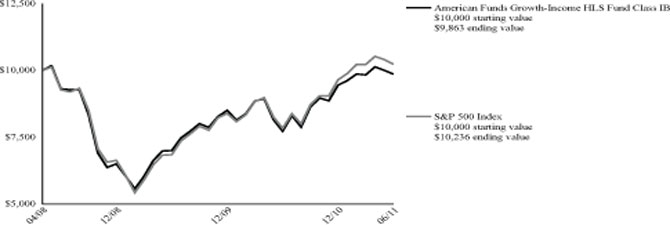
Average Annual Total Returns (as of 6/30/11)
| Since | |||
| 6 Month† | 1 Year | Inception | |
| American Funds Growth-Income HLS Fund IB | 4.34% | 27.64% | -0.43% |
| S&P 500 Index | 6.01% | 30.68% | 0.74% |
| † | Not Annualized |
PAST PERFORMANCE IS NOT INDICATIVE OF FUTURE RESULTS.
Total returns presented above were calculated using the Fund's net asset value available to shareholders for sale or redemption of Fund shares on June 30, 2011, which excludes investment transactions as of this date.
S&P 500 Index is a market capitalization-weighted price index composed of 500 widely held common stocks.
You cannot invest directly in an index.
The chart represents a hypothetical investment in the Fund. Performance data represents past performance and current performance could be higher or lower.
Performance information may reflect historical or current expense waivers/reimbursements from the investment adviser, without which performance would have been lower. For information on current expense waivers/reimbursements, please see the prospectus.
| The value of the fund will fluctuate so that when redeemed, it may be worth more or less than the original investment. The chart and table do not reflect the deductions of taxes, sales charges or other fees which may be applied at the variable life insurance, variable annuity or qualified retirement plan product level. Any such additional sales charges or other fees or expenses would lower the contract’s or plan’s performance. |
How did the Fund perform?
The Class IB Shares of the American Funds Growth-Income HLS Fund returned 4.34% for the six-month period ended June 30, 2011, versus the return of 6.01% for the S&P 500 Index. The Fund underperformed the 4.93% average return of the Lipper Large-Cap Core Funds VP-UF peer group, a group of funds with investment strategies similar to those of the Fund.
The performance of the American Funds Growth-Income HLS Fund is directly related to the performance of the American Funds Insurance Series – Growth-Income Fund Class 1, in which the Fund invests. The financial statements of the American Funds Insurance Series – Growth-Income Fund Class 1, including the Schedule of Investments, are provided in the accompanying report and should be read in conjunction with the American Funds Growth-Income HLS Fund’s financial statements.
American Funds International HLS Fund inception 4/30/2008 |
| (advised by HL Investment Advisors, LLC) |
| Investment Goal: Seeks long-term growth of capital over time. |
Performance Overview 4/30/08 - 6/30/11

Average Annual Total Returns (as of 6/30/11)
| Since | |||
| 6 Month† | 1 Year | Inception | |
| American Funds International HLS Fund IB | 4.26% | 28.76% | -0.98% |
| MSCI All Country World ex USA | 4.11% | 30.27% | -2.04% |
| † | Not Annualized |
PAST PERFORMANCE IS NOT INDICATIVE OF FUTURE RESULTS.
Total returns presented above were calculated using the Fund's net asset value available to shareholders for sale or redemption of Fund shares on June 30, 2011, which excludes investment transactions as of this date.
MSCI All Country World ex USA Index is a broad-based, unmanaged, market capitalization weighted, total return index that measures the performance of both developed and emerging stock markets, excluding the U.S. The index is calculated to exclude companies and share classes which cannot be freely purchased by foreigners.
You cannot invest directly in an index.
The chart represents a hypothetical investment in the Fund. Performance data represents past performance and current performance could be higher or lower.
Performance information may reflect historical or current expense waivers/reimbursements from the investment adviser, without which performance would have been lower. For information on current expense waivers/reimbursements, please see the prospectus.
| The value of the fund will fluctuate so that when redeemed, it may be worth more or less than the original investment. The chart and table do not reflect the deductions of taxes, sales charges or other fees which may be applied at the variable life insurance, variable annuity or qualified retirement plan product level. Any such additional sales charges or other fees or expenses would lower the contract’s or plan’s performance. |
How did the Fund perform?
The Class IB Shares of the American Funds International HLS Fund returned 4.26% for the six-month period ended June 30, 2011, versus the return of 4.11% for the MSCI All Country World ex USA Index. The Fund underperformed the 4.62% average return of the Lipper International Core Funds VP-UF peer group, a group of funds with investment strategies similar to those of the Fund.
The performance of the American Funds International HLS Fund is directly related to the performance of the American Funds Insurance Series – International Fund Class 1, in which the Fund invests. The financial statements of the American Funds Insurance Series – International Fund Class 1, including the Schedule of Investments, are provided in the accompanying report and should be read in conjunction with the American Funds International HLS Fund’s financial statements.
American Funds New World HLS Fund inception 4/30/2008 |
| (advised by HL Investment Advisors, LLC) |
| Investment Goal: Seeks long-term capital appreciation. |
Performance Overview 4/30/08 - 6/30/11

Average Annual Total Returns (as of 6/30/11)
| Since | |||
| 6 Month† | 1 Year | Inception | |
| American Funds New World HLS Fund IB | 0.91% | 25.37% | 1.92% |
| MSCI All Country World Index | 4.99% | 30.77% | -0.78% |
| MSCI Emerging Markets Index | 1.03% | 28.17% | 1.49% |
| † | Not Annualized |
PAST PERFORMANCE IS NOT INDICATIVE OF FUTURE RESULTS.
Total returns presented above were calculated using the Fund's net asset value available to shareholders for sale or redemption of Fund shares on June 30, 2011, which excludes investment transactions as of this date.
MSCI All Country World Index is a free float-adjusted market capitalization index that measures equity market performance in the global developed and emerging markets, consisting of 45 developed and emerging market country indices. This index is unmanaged, and its results include reinvested dividends and/or distributions, but do not reflect the effect of sales charges, commissions, expenses or taxes.
MSCI Emerging Markets Index is a free float-adjusted market capitalization-weighted index that is designed to measure equity market performance in the global emerging markets, consisting of 24 emerging market country indices. This index is unmanaged and its results include reinvested dividends and/or distributions, but do not reflect the effect of sales charges, commissions, expenses or taxes.
You cannot invest directly in an index.
The chart represents a hypothetical investment in the Fund. Performance data represents past performance and current performance could be higher or lower.
Performance information may reflect historical or current expense waivers/reimbursements from the investment adviser, without which performance would have been lower. For information on current expense waivers/reimbursements, please see the prospectus.
| The value of the fund will fluctuate so that when redeemed, it may be worth more or less than the original investment. The chart and table do not reflect the deductions of taxes, sales charges or other fees which may be applied at the variable life insurance, variable annuity or qualified retirement plan product level. Any such additional sales charges or other fees or expenses would lower the contract’s or plan’s performance. |
How did the Fund perform?
The Class IB Shares of the American Funds New World HLS Fund returned 0.91% for the six-month period ended June 30, 2011, versus the returns of 4.99% for the MSCI All Country World Index and 1.03% for the MSCI Emerging Markets Index. The Fund outperformed the -0.35% average return of the Lipper Emerging Markets Funds VP-UF peer group, a group of funds with investment strategies similar to those of the Fund.
The performance of the American Funds New World HLS Fund is directly related to the performance of the American Funds Insurance Series – New World Fund Class 1, in which the Fund invests. The financial statements of the American Funds Insurance Series – New World Fund Class 1, including the Schedule of Investments, are provided in the accompanying report and should be read in conjunction with the American Funds New World HLS Fund’s financial statements.
American Funds Asset Allocation HLS Fund |
| Schedule of Investments |
| June 30, 2011 (Unaudited) |
| (000’s Omitted) |
| Shares | Market Value ╪ | ||||||||||
| INVESTMENT COMPANIES - 100.0% | |||||||||||
| 3,948 | American Funds Insurance Series – Asset | ||||||||||
| Allocation Fund Class 1 | $ | 67,550 | |||||||||
| Total investment companies | |||||||||||
| (cost $55,157) | $ | 67,550 | |||||||||
| Total investments | |||||||||||
| (cost $55,157) ▲ | 100.0 | % | $ | 67,550 | |||||||
| Other assets and liabilities | – | % | (11 | ) | |||||||
| Total net assets | 100.0 | % | $ | 67,539 | |||||||
| Note: | Percentage of investments as shown is the ratio of the total market value to total net assets. |
| ▲ | At June 30, 2011, the cost of securities for federal income tax purposes was $56,915 and the aggregate gross unrealized appreciation and depreciation based on that cost were: |
| Unrealized Appreciation | $ | 10,635 | ||
| Unrealized Depreciation | — | |||
| Net Unrealized Appreciation | $ | 10,635 |
| ╪ | See Significant Accounting Policies of accompanying Notes to Financial Statements regarding valuation of securities. |
At June 30, 2011, the investment valuation hierarchy levels were:
| Assets: | ||||
| Investment in Securities - Level 1 | $ | 67,550 | ||
| Total | $ | 67,550 | ||
American Funds Blue Chip Income and Growth HLS Fund |
| Schedule of Investments |
| June 30, 2011 (Unaudited) |
| (000’s Omitted) |
| Shares | Market Value ╪ | ||||||||||
| INVESTMENT COMPANIES - 100.0% | |||||||||||
| 3,482 | American Funds Insurance Series – Blue | ||||||||||
| Chip Income and Growth Fund Class 1 | $ | 33,320 | |||||||||
| Total investment companies | |||||||||||
| (cost $25,016) | $ | 33,320 | |||||||||
| Total investments | |||||||||||
| (cost $25,016) ▲ | 100.0 | % | $ | 33,320 | |||||||
| Other assets and liabilities | – | % | (7 | ) | |||||||
| Total net assets | 100.0 | % | $ | 33,313 | |||||||
| Note: | Percentage of investments as shown is the ratio of the total market value to total net assets. |
| ▲ | At June 30, 2011, the cost of securities for federal income tax purposes was $26,033 and the aggregate gross unrealized appreciation and depreciation based on that cost were: |
| Unrealized Appreciation | $ | 7,287 | ||
| Unrealized Depreciation | — | |||
| Net Unrealized Appreciation | $ | 7,287 |
| ╪ | See Significant Accounting Policies of accompanying Notes to Financial Statements regarding valuation of securities. |
At June 30, 2011, the investment valuation hierarchy levels were:
| Assets: | ||||
| Investment in Securities - Level 1 | $ | 33,320 | ||
| Total | $ | 33,320 | ||
The accompanying notes are an integral part of these financial statements.
American Funds Bond HLS Fund |
| Schedule of Investments |
| June 30, 2011 (Unaudited) |
| (000’s Omitted) |
| Shares | Market Value ╪ | ||||||||||
| INVESTMENT COMPANIES - 100.0% | |||||||||||
| 19,453 | American Funds Insurance Series - Bond | ||||||||||
| Fund Class 1 | $ | 212,033 | |||||||||
| Total investment companies | |||||||||||
| (cost $197,208) | $ | 212,033 | |||||||||
| Total investments | |||||||||||
| (cost $197,208) ▲ | 100.0 | % | $ | 212,033 | |||||||
| Other assets and liabilities | – | % | (33 | ) | |||||||
| Total net assets | 100.0 | % | $ | 212,000 | |||||||
| Note: | Percentage of investments as shown is the ratio of the total market value to total net assets. |
| ▲ | At June 30, 2011, the cost of securities for federal income tax purposes was $198,134 and the aggregate gross unrealized appreciation and depreciation based on that cost were: |
| Unrealized Appreciation | $ | 13,899 | ||
| Unrealized Depreciation | — | |||
| Net Unrealized Appreciation | $ | 13,899 |
| ╪ | See Significant Accounting Policies of accompanying Notes to Financial Statements regarding valuation of securities. |
At June 30, 2011, the investment valuation hierarchy levels were:
| Assets: | ||||
| Investment in Securities - Level 1 | $ | 212,033 | ||
| Total | $ | 212,033 | ||
American Funds Global Bond HLS Fund |
| Schedule of Investments |
| June 30, 2011 (Unaudited) |
| (000’s Omitted) |
| Shares | Market Value ╪ | ||||||||||
| INVESTMENT COMPANIES - 100.0% | |||||||||||
| 3,485 | American Funds Insurance Series – Global | ||||||||||
| Bond Fund Class 1 | $ | 42,591 | |||||||||
| Total investment companies | |||||||||||
| (cost $38,590) | $ | 42,591 | |||||||||
| Total investments | |||||||||||
| (cost $38,590) ▲ | 100.0 | % | $ | 42,591 | |||||||
| Other assets and liabilities | – | % | (10 | ) | |||||||
| Total net assets | 100.0 | % | $ | 42,581 | |||||||
| Note: | Percentage of investments as shown is the ratio of the total market value to total net assets. |
| ▲ | At June 30, 2011, the cost of securities for federal income tax purposes was $38,950 and the aggregate gross unrealized appreciation and depreciation based on that cost were: |
| Unrealized Appreciation | $ | 3,641 | ||
| Unrealized Depreciation | — | |||
| Net Unrealized Appreciation | $ | 3,641 |
| ╪ | See Significant Accounting Policies of accompanying Notes to Financial Statements regarding valuation of securities. |
At June 30, 2011, the investment valuation hierarchy levels were:
| Assets: | ||||
| Investment in Securities - Level 1 | $ | 42,591 | ||
| Total | $ | 42,591 | ||
The accompanying notes are an integral part of these financial statements.
American Funds Global Growth and Income HLS Fund |
| Schedule of Investments |
| June 30, 2011 (Unaudited) |
| (000’s Omitted) |
| Shares | Market Value ╪ | ||||||||||
| INVESTMENT COMPANIES - 100.0% | |||||||||||
| 8,800 | American Funds Insurance Series - Global | ||||||||||
| Growth and Income Fund Class 1 | $ | 89,935 | |||||||||
| Total investment companies | |||||||||||
| (cost $67,372) | $ | 89,935 | |||||||||
| Total investments | |||||||||||
| (cost $67,372) ▲ | 100.0 | % | $ | 89,935 | |||||||
| Other assets and liabilities | – | % | (15 | ) | |||||||
| Total net assets | 100.0 | % | $ | 89,920 | |||||||
| Note: | Percentage of investments as shown is the ratio of the total market value to total net assets. |
| ▲ | At June 30, 2011, the cost of securities for federal income tax purposes was $69,223 and the aggregate gross unrealized appreciation and depreciation based on that cost were: |
| Unrealized Appreciation | $ | 20,712 | ||
| Unrealized Depreciation | — | |||
| Net Unrealized Appreciation | $ | 20,712 |
| ╪ | See Significant Accounting Policies of accompanying Notes to Financial Statements regarding valuation of securities. |
At June 30, 2011, the investment valuation hierarchy levels were:
| Assets: | ||||
| Investment in Securities - Level 1 | $ | 89,935 | ||
| Total | $ | 89,935 | ||
American Funds Global Growth HLS Fund |
| Schedule of Investments |
| June 30, 2011 (Unaudited) |
| (000’s Omitted) |
| Shares | Market Value ╪ | ||||||||||
| INVESTMENT COMPANIES - 100.0% | |||||||||||
| 1,543 | American Funds Insurance Series - Global | ||||||||||
| Growth Fund Class 1 | $ | 34,968 | |||||||||
| Total investment companies | |||||||||||
| (cost $26,062) | $ | 34,968 | |||||||||
| Total investments | |||||||||||
| (cost $26,062) ▲ | 100.0 | % | $ | 34,968 | |||||||
| Other assets and liabilities | – | % | (9 | ) | |||||||
| Total net assets | 100.0 | % | $ | 34,959 | |||||||
| Note: | Percentage of investments as shown is the ratio of the total market value to total net assets. |
| ▲ | At June 30, 2011, the cost of securities for federal income tax purposes was $27,619 and the aggregate gross unrealized appreciation and depreciation based on that cost were: |
| Unrealized Appreciation | $ | 7,349 | ||
| Unrealized Depreciation | — | |||
| Net Unrealized Appreciation | $ | 7,349 |
| ╪ | See Significant Accounting Policies of accompanying Notes to Financial Statements regarding valuation of securities. |
At June 30, 2011, the investment valuation hierarchy levels were:
| Assets: | ||||
| Investment in Securities - Level 1 | $ | 34,968 | ||
| Total | $ | 34,968 | ||
The accompanying notes are an integral part of these financial statements.
American Funds Global Small Capitalization HLS Fund |
| Schedule of Investments |
| June 30, 2011 (Unaudited) |
| (000’s Omitted) |
| Shares | Market Value ╪ | ||||||||||
| INVESTMENT COMPANIES - 100.0% | |||||||||||
| 3,223 | American Funds Insurance Series - Global | ||||||||||
| Small Capitalization Fund Class 1 | $ | 69,383 | |||||||||
| Total investment companies | |||||||||||
| (cost $46,728) | $ | 69,383 | |||||||||
| Total investments | |||||||||||
| (cost $46,728) ▲ | 100.0 | % | $ | 69,383 | |||||||
| Other assets and liabilities | – | % | (14 | ) | |||||||
| Total net assets | 100.0 | % | $ | 69,369 | |||||||
| Note: | Percentage of investments as shown is the ratio of the total market value to total net assets. |
| ▲ | At June 30, 2011, the cost of securities for federal income tax purposes was $49,141 and the aggregate gross unrealized appreciation and depreciation based on that cost were: |
| Unrealized Appreciation | $ | 20,242 | ||
| Unrealized Depreciation | — | |||
| Net Unrealized Appreciation | $ | 20,242 |
| ╪ | See Significant Accounting Policies of accompanying Notes to Financial Statements regarding valuation of securities. |
At June 30, 2011, the investment valuation hierarchy levels were:
| Assets: | ||||
| Investment in Securities - Level 1 | $ | 69,383 | ||
| Total | $ | 69,383 | ||
American Funds Growth HLS Fund |
| Schedule of Investments |
| June 30, 2011 (Unaudited) |
| (000’s Omitted) |
| Shares | Market Value ╪ | ||||||||||
| INVESTMENT COMPANIES - 100.0% | |||||||||||
| 6,129 | American Funds Insurance Series - Growth | ||||||||||
| Fund Class 1 | $ | 355,079 | |||||||||
| Total investment companies | |||||||||||
| (cost $240,720) | $ | 355,079 | |||||||||
| Total investments | |||||||||||
| (cost $240,720) ▲ | 100.0 | % | $ | 355,079 | |||||||
| Other assets and liabilities | – | % | (50 | ) | |||||||
| Total net assets | 100.0 | % | $ | 355,029 | |||||||
| Note: | Percentage of investments as shown is the ratio of the total market value to total net assets. |
| ▲ | At June 30, 2011, the cost of securities for federal income tax purposes was $249,602 and the aggregate gross unrealized appreciation and depreciation based on that cost were: |
| Unrealized Appreciation | $ | 105,477 | ||
| Unrealized Depreciation | — | |||
| Net Unrealized Appreciation | $ | 105,477 |
| ╪ | See Significant Accounting Policies of accompanying Notes to Financial Statements regarding valuation of securities. |
At June 30, 2011, the investment valuation hierarchy levels were:
| Assets: | ||||
| Investment in Securities - Level 1 | $ | 355,079 | ||
| Total | $ | 355,079 | ||
The accompanying notes are an integral part of these financial statements.
American Funds Growth-Income HLS Fund |
| Schedule of Investments |
| June 30, 2011 (Unaudited) |
| (000’s Omitted) |
| Shares | Market Value ╪ | ||||||||||
| INVESTMENT COMPANIES - 100.0% | |||||||||||
| 5,173 | American Funds Insurance Series - | ||||||||||
| Growth-Income Fund Class 1 | $ | 185,926 | |||||||||
| Total investment companies | |||||||||||
| (cost $142,086) | $ | 185,926 | |||||||||
| Total investments | |||||||||||
| (cost $142,086) ▲ | 100.0 | % | $ | 185,926 | |||||||
| Other assets and liabilities | – | % | (28 | ) | |||||||
| Total net assets | 100.0 | % | $ | 185,898 | |||||||
| Note: | Percentage of investments as shown is the ratio of the total market value to total net assets. |
| ▲ | At June 30, 2011, the cost of securities for federal income tax purposes was $145,479 and the aggregate gross unrealized appreciation and depreciation based on that cost were: |
| Unrealized Appreciation | $ | 40,447 | ||
| Unrealized Depreciation | — | |||
| Net Unrealized Appreciation | $ | 40,447 |
| ╪ | See Significant Accounting Policies of accompanying Notes to Financial Statements regarding valuation of securities. |
At June 30, 2011, the investment valuation hierarchy levels were:
| Assets: | ||||
| Investment in Securities - Level 1 | $ | 185,926 | ||
| Total | $ | 185,926 | ||
American Funds International HLS Fund |
| Schedule of Investments |
| June 30, 2011 (Unaudited) |
| (000’s Omitted) |
| Shares | Market Value ╪ | ||||||||||
| INVESTMENT COMPANIES - 100.0% | |||||||||||
| 12,813 | American Funds Insurance Series - | ||||||||||
| International Fund Class 1 | $ | 241,016 | |||||||||
| Total investment companies | |||||||||||
| (cost $185,131) | $ | 241,016 | |||||||||
| Total investments | |||||||||||
| (cost $185,131) ▲ | 100.0 | % | $ | 241,016 | |||||||
| Other assets and liabilities | – | % | (40 | ) | |||||||
| Total net assets | 100.0 | % | $ | 240,976 | |||||||
| Note: | Percentage of investments as shown is the ratio of the total market value to total net assets. |
| ▲ | At June 30, 2011, the cost of securities for federal income tax purposes was $190,269 and the aggregate gross unrealized appreciation and depreciation based on that cost were: |
| Unrealized Appreciation | $ | 50,747 | ||
| Unrealized Depreciation | — | |||
| Net Unrealized Appreciation | $ | 50,747 |
| ╪ | See Significant Accounting Policies of accompanying Notes to Financial Statements regarding valuation of securities. |
At June 30, 2011, the investment valuation hierarchy levels were:
| Assets: | ||||
| Investment in Securities - Level 1 | $ | 241,016 | ||
| Total | $ | 241,016 | ||
The accompanying notes are an integral part of these financial statements.
American Funds New World HLS Fund |
| Schedule of Investments |
| June 30, 2011 (Unaudited) |
| (000’s Omitted) |
| Shares | Market Value ╪ | ||||||||||
| INVESTMENT COMPANIES - 100.0% | |||||||||||
| 2,872 | American Funds Insurance Series - New | ||||||||||
| World Fund Class 1 | $ | 67,256 | |||||||||
| Total investment companies | |||||||||||
| (cost $48,753) | $ | 67,256 | |||||||||
| Total investments | |||||||||||
| (cost $48,753) ▲ | 100.0 | % | $ | 67,256 | |||||||
| Other assets and liabilities | – | % | (13 | ) | |||||||
| Total net assets | 100.0 | % | $ | 67,243 | |||||||
| Note: | Percentage of investments as shown is the ratio of the total market value to total net assets. |
| ▲ | At June 30, 2011, the cost of securities for federal income tax purposes was $50,831 and the aggregate gross unrealized appreciation and depreciation based on that cost were: |
| Unrealized Appreciation | $ | 16,425 | ||
| Unrealized Depreciation | — | |||
| Net Unrealized Appreciation | $ | 16,425 |
| ╪ | See Significant Accounting Policies of accompanying Notes to Financial Statements regarding valuation of securities. |
At June 30, 2011, the investment valuation hierarchy levels were:
| Assets: | ||||
| Investment in Securities - Level 1 | $ | 67,256 | ||
| Total | $ | 67,256 | ||
The accompanying notes are an integral part of these financial statements.
[This page is intentionally left blank]
| Hartford Series Fund, Inc. |
Statements of Assets and Liabilities |
| June 30, 2011 (Unaudited) |
| (000’s Omitted) |
| American Funds | ||||||||||||
| Blue Chip | ||||||||||||
| American Funds | Income and | American Funds | ||||||||||
| Asset Allocation | Growth | Bond | ||||||||||
| HLS Fund | HLS Fund | HLS Fund | ||||||||||
| Assets: | ||||||||||||
| Investments in securities, at market value @ | $ | 67,550 | $ | 33,320 | $ | 212,033 | ||||||
| Receivables: | ||||||||||||
| Investment securities sold | 47 | 15 | 9 | |||||||||
| Fund shares sold | — | — | 68 | |||||||||
| Other assets | 4 | 3 | 9 | |||||||||
| Total assets | 67,601 | 33,338 | 212,119 | |||||||||
| Liabilities: | ||||||||||||
| Payables: | ||||||||||||
| Investment securities purchased | — | — | — | |||||||||
| Fund shares redeemed | 47 | 15 | 77 | |||||||||
| Investment management fees | 7 | 4 | 17 | |||||||||
| Distribution fees | 3 | 1 | 9 | |||||||||
| Accrued expenses | 5 | 5 | 16 | |||||||||
| Total liabilities | 62 | 25 | 119 | |||||||||
| Net assets | $ | 67,539 | $ | 33,313 | $ | 212,000 | ||||||
| Summary of Net Assets: | ||||||||||||
| Capital stock and paid-in-capital | $ | 55,839 | $ | 25,956 | $ | 191,849 | ||||||
| Accumulated undistributed net investment income | 960 | 23 | 6,066 | |||||||||
| Accumulated net realized gain (loss) on investments | (1,653 | ) | (970 | ) | (740 | ) | ||||||
| Unrealized appreciation of investments | 12,393 | 8,304 | 14,825 | |||||||||
| Net assets | $ | 67,539 | $ | 33,313 | $ | 212,000 | ||||||
| Shares authorized | 200,000 | 200,000 | 200,000 | |||||||||
| Par value | $ | 0.001 | $ | 0.001 | $ | 0.001 | ||||||
Class IB: Net asset value per share | $ | 10.25 | $ | 9.50 | $ | 10.45 | ||||||
| Shares outstanding | 6,588 | 3,506 | 20,280 | |||||||||
| Net assets | $ | 67,539 | $ | 33,313 | $ | 212,000 | ||||||
| @ Cost of securities | $ | 55,157 | $ | 25,016 | $ | 197,208 | ||||||
The accompanying notes are an integral part of these financial statements.
| American Funds | American Funds | |||||||||||||||||||||||||||||
| American Funds | Global Growth | American Funds | Global Small | American Funds | American Funds | American Funds | American Funds | |||||||||||||||||||||||
| Global Bond | and Income | Global Growth | Capitalization | Growth | Growth-Income | International | New World | |||||||||||||||||||||||
| HLS Fund | HLS Fund | HLS Fund | HLS Fund | HLS Fund | HLS Fund | HLS Fund | HLS Fund | |||||||||||||||||||||||
| $ | 42,591 | $ | 89,935 | $ | 34,968 | $ | 69,383 | $ | 355,079 | $ | 185,926 | $ | 241,016 | $ | 67,256 | |||||||||||||||
| 54 | — | 347 | 153 | — | — | 85 | — | |||||||||||||||||||||||
| — | 102 | 1 | 2 | 213 | 202 | 13 | 90 | |||||||||||||||||||||||
| 3 | 8 | 4 | 6 | 28 | 14 | 23 | 9 | |||||||||||||||||||||||
| 42,648 | 90,045 | 35,320 | 69,544 | 355,320 | 186,142 | 241,137 | 67,355 | |||||||||||||||||||||||
| — | 83 | — | — | 135 | 111 | — | 16 | |||||||||||||||||||||||
| 54 | 19 | 348 | 155 | 77 | 91 | 98 | 73 | |||||||||||||||||||||||
| 5 | 11 | 6 | 9 | 42 | 21 | 32 | 12 | |||||||||||||||||||||||
| 2 | 4 | 1 | 3 | 14 | 7 | 10 | 3 | |||||||||||||||||||||||
| 6 | 8 | 6 | 8 | 23 | 14 | 21 | 8 | |||||||||||||||||||||||
| 67 | 125 | 361 | 175 | 291 | 244 | 161 | 112 | |||||||||||||||||||||||
| $ | 42,581 | $ | 89,920 | $ | 34,959 | $ | 69,369 | $ | 355,029 | $ | 185,898 | $ | 240,976 | $ | 67,243 | |||||||||||||||
| $ | 37,144 | $ | 68,449 | $ | 26,931 | $ | 44,270 | $ | 248,636 | $ | 145,905 | $ | 186,555 | $ | 48,781 | |||||||||||||||
| 1,059 | 2,222 | 383 | 1,539 | 207 | 102 | 3,876 | 982 | |||||||||||||||||||||||
| 377 | (3,314 | ) | (1,261 | ) | 905 | (8,173 | ) | (3,949 | ) | (5,340 | ) | (1,023 | ) | |||||||||||||||||
| 4,001 | 22,563 | 8,906 | 22,655 | 114,359 | 43,840 | 55,885 | 18,503 | |||||||||||||||||||||||
| $ | 42,581 | $ | 89,920 | $ | 34,959 | $ | 69,369 | $ | 355,029 | $ | 185,898 | $ | 240,976 | $ | 67,243 | |||||||||||||||
| 200,000 | 200,000 | 200,000 | 200,000 | 200,000 | 200,000 | 200,000 | 200,000 | |||||||||||||||||||||||
| $ | 0.001 | $ | 0.001 | $ | 0.001 | $ | 0.001 | $ | 0.001 | $ | 0.001 | $ | 0.001 | $ | 0.001 | |||||||||||||||
| $ | 11.31 | $ | 9.33 | $ | 10.22 | $ | 9.96 | $ | 9.92 | $ | 9.39 | $ | 9.34 | $ | 10.33 | |||||||||||||||
| 3,765 | 9,642 | 3,421 | 6,965 | 35,775 | 19,790 | 25,790 | 6,509 | |||||||||||||||||||||||
| $ | 42,581 | $ | 89,920 | $ | 34,959 | $ | 69,369 | $ | 355,029 | $ | 185,898 | $ | 240,976 | $ | 67,243 | |||||||||||||||
| $ | 38,590 | $ | 67,372 | $ | 26,062 | $ | 46,728 | $ | 240,720 | $ | 142,086 | $ | 185,131 | $ | 48,753 | |||||||||||||||
The accompanying notes are an integral part of these financial statements.
| Hartford Series Fund, Inc. |
Statements of Operations |
| For the Six-Month Period Ended June 30, 2011 (Unaudited) |
| (000’s Omitted) |
| American Funds | ||||||||||||
| Blue Chip | ||||||||||||
| American Funds | Income and | American Funds | ||||||||||
| Asset Allocation | Growth | Bond | ||||||||||
| HLS Fund | HLS Fund | HLS Fund | ||||||||||
| Investment Income: | ||||||||||||
| Dividends from underlying funds | $ | 269 | $ | 107 | $ | 1,047 | ||||||
| Total investment income | 269 | 107 | 1,047 | |||||||||
| Expenses: | ||||||||||||
| Investment management fees | 208 | 126 | 523 | |||||||||
| Distribution fees - Class IB | 80 | 42 | 261 | |||||||||
| Custodian fees | — | — | — | |||||||||
| Accounting services fees | 3 | 1 | 10 | |||||||||
| Board of Directors' fees | 1 | 1 | 2 | |||||||||
| Audit fees | 3 | 3 | 4 | |||||||||
| Other expenses | 4 | 3 | 14 | |||||||||
| Total expenses (before waivers) | 299 | 176 | 814 | |||||||||
| Expense waivers | (128 | ) | (84 | ) | (261 | ) | ||||||
| Total waivers | (128 | ) | (84 | ) | (261 | ) | ||||||
| Total expenses, net | 171 | 92 | 553 | |||||||||
| Net investment income | 98 | 15 | 494 | |||||||||
| Net Realized Gain on Investments: | ||||||||||||
| Capital gain distribution received from underlying funds | — | — | — | |||||||||
| Net realized gain on investments in underlying funds | 101 | 92 | 162 | |||||||||
| Net Realized Gain on Investments | 101 | 92 | 162 | |||||||||
| Net Changes in Unrealized Appreciation of Investments: | ||||||||||||
| Net unrealized appreciation (depreciation) of investments | 3,046 | 1,070 | 4,359 | |||||||||
| Net Gain (Loss) on Investments | 3,147 | 1,162 | 4,521 | |||||||||
| Net Increase in Net Assets Resulting from Operations | $ | 3,245 | $ | 1,177 | $ | 5,015 | ||||||
The accompanying notes are an integral part of these financial statements.
| American Funds | American Funds | |||||||||||||||||||||||||||||
| American Funds | Global Growth | American Funds | Global Small | American Funds | American Funds | American Funds | American Funds | |||||||||||||||||||||||
| Global Bond | and Income | Global Growth | Capitalization | Growth | Growth-Income | International | New World | |||||||||||||||||||||||
| HLS Fund | HLS Fund | HLS Fund | HLS Fund | HLS Fund | HLS Fund | HLS Fund | HLS Fund | |||||||||||||||||||||||
| $ | 203 | $ | 543 | $ | 118 | $ | 869 | $ | 1,136 | $ | 591 | $ | 727 | $ | 372 | |||||||||||||||
| 203 | 543 | 118 | 869 | 1,136 | 591 | 727 | 372 | |||||||||||||||||||||||
| 145 | 363 | 176 | 288 | 1,335 | 649 | 1,025 | 378 | |||||||||||||||||||||||
| 48 | 114 | 44 | 90 | 445 | 232 | 302 | 86 | |||||||||||||||||||||||
| — | — | — | — | — | — | — | — | |||||||||||||||||||||||
| 2 | 5 | 2 | 4 | 18 | 9 | 12 | 4 | |||||||||||||||||||||||
| 1 | 1 | 1 | 1 | 4 | 2 | 3 | 1 | |||||||||||||||||||||||
| 3 | 3 | 3 | 3 | 4 | 4 | 4 | 3 | |||||||||||||||||||||||
| 4 | 6 | 4 | 7 | 23 | 12 | 21 | 6 | |||||||||||||||||||||||
| 203 | 492 | 230 | 393 | 1,829 | 908 | 1,367 | 478 | |||||||||||||||||||||||
| (97 | ) | (250 | ) | (132 | ) | (198 | ) | (890 | ) | (417 | ) | (724 | ) | (292 | ) | |||||||||||||||
| (97 | ) | (250 | ) | (132 | ) | (198 | ) | (890 | ) | (417 | ) | (724 | ) | (292 | ) | |||||||||||||||
| 106 | 242 | 98 | 195 | 939 | 491 | 643 | 186 | |||||||||||||||||||||||
| 97 | 301 | 20 | 674 | 197 | 100 | 84 | 186 | |||||||||||||||||||||||
| 214 | — | — | — | — | — | — | — | |||||||||||||||||||||||
| 207 | 11 | 317 | 2,958 | 1,654 | 252 | 140 | 1,264 | |||||||||||||||||||||||
| 421 | 11 | 317 | 2,958 | 1,654 | 252 | 140 | 1,264 | |||||||||||||||||||||||
| 1,073 | 2,365 | 1,355 | (3,351 | ) | 18,550 | 7,584 | 10,084 | (866 | ) | |||||||||||||||||||||
| 1,494 | 2,376 | 1,672 | (393 | ) | 20,204 | 7,836 | 10,224 | 398 | ||||||||||||||||||||||
| $ | 1,591 | $ | 2,677 | $ | 1,692 | $ | 281 | $ | 20,401 | $ | 7,936 | $ | 10,308 | $ | 584 | |||||||||||||||
The accompanying notes are an integral part of these financial statements.
| Hartford Series Fund, Inc. |
Statements of Changes in Net Assets |
| (000’s Omitted) |
| American Funds | American Funds | |||||||||||||||
| Asset Allocation | Blue Chip Income and Growth | |||||||||||||||
| HLS Fund | HLS Fund | |||||||||||||||
| For the | For the | |||||||||||||||
| Six-Month | For the | Six-Month | For the | |||||||||||||
| Period Ended | Year Ended | Period Ended | Year Ended | |||||||||||||
| June 30, 2011 | December 31, | June 30, 2011 | December 31, | |||||||||||||
| (Unaudited) | 2010 | (Unaudited) | 2010 | |||||||||||||
| Operations: | ||||||||||||||||
| Net investment income | $ | 98 | $ | 863 | $ | 15 | $ | 438 | ||||||||
| Net realized gain (loss) on investments | 101 | (546 | ) | 92 | (323 | ) | ||||||||||
| Net unrealized appreciation of investments | 3,046 | 5,634 | 1,070 | 3,422 | ||||||||||||
| Net increase in net assets resulting from operations | 3,245 | 5,951 | 1,177 | 3,537 | ||||||||||||
| Distributions to Shareholders: | ||||||||||||||||
| From net investment income | ||||||||||||||||
| Class IB | — | (881 | ) | — | (871 | ) | ||||||||||
| From net realized gain on investments | ||||||||||||||||
| Class IB | — | — | — | — | ||||||||||||
| Total distributions | — | (881 | ) | — | (871 | ) | ||||||||||
| Capital Share Transactions: | ||||||||||||||||
| Class IB | ||||||||||||||||
| Sold | 9,111 | 11,541 | 2,326 | 6,415 | ||||||||||||
| Issued on reinvestment of distributions | — | 881 | — | 871 | ||||||||||||
| Redeemed | (3,143 | ) | (7,734 | ) | (4,220 | ) | (4,952 | ) | ||||||||
| Net increase (decrease) from capital share transactions | 5,968 | 4,688 | (1,894 | ) | 2,334 | |||||||||||
| Net increase (decrease) in net assets | 9,213 | 9,758 | (717 | ) | 5,000 | |||||||||||
| Net Assets: | ||||||||||||||||
| Beginning of period | 58,326 | 48,568 | 34,030 | 29,030 | ||||||||||||
| End of period | $ | 67,539 | $ | 58,326 | $ | 33,313 | $ | 34,030 | ||||||||
Accumulated undistributed (distribution in excess of) net investment income | $ | 960 | $ | 862 | $ | 23 | $ | 8 | ||||||||
| Shares: | ||||||||||||||||
| Class IB | ||||||||||||||||
| Sold | 911 | 1,262 | 245 | 747 | ||||||||||||
| Issued on reinvestment of distributions | — | 105 | — | 104 | ||||||||||||
| Redeemed | (311 | ) | (866 | ) | (446 | ) | (585 | ) | ||||||||
| Total share activity | 600 | 501 | (201 | ) | 266 | |||||||||||
The accompanying notes are an integral part of these financial statements.
| American Funds | American Funds | American Funds | American Funds | |||||||||||||||||||||||||||
| Bond | Global Bond | Global Growth and Income | Global Growth | |||||||||||||||||||||||||||
| HLS Fund | HLS Fund | HLS Fund | HLS Fund | |||||||||||||||||||||||||||
| For the | For the | For the | For the | |||||||||||||||||||||||||||
| Six-Month | For the | Six-Month | For the | Six-Month | For the | Six-Month | For the | |||||||||||||||||||||||
| Period Ended | Year Ended | Period Ended | Year Ended | Period Ended | Year Ended | Period Ended | Year Ended | |||||||||||||||||||||||
| June 30, 2011 | December 31, | June 30, 2011 | December 31, | June 30, 2011 | December 31, | June 30, 2011 | December 31, | |||||||||||||||||||||||
| (Unaudited) | 2010 | (Unaudited) | 2010 | (Unaudited) | 2010 | (Unaudited) | 2010 | |||||||||||||||||||||||
| $ | 494 | $ | 5,573 | $ | 97 | $ | 964 | $ | 301 | $ | 1,927 | $ | 20 | $ | 364 | |||||||||||||||
| 162 | (327 | ) | 421 | 393 | 11 | (2,373 | ) | 317 | (429 | ) | ||||||||||||||||||||
| 4,359 | 6,464 | 1,073 | 408 | 2,365 | 9,401 | 1,355 | 3,570 | |||||||||||||||||||||||
| 5,015 | 11,710 | 1,591 | 1,765 | 2,677 | 8,955 | 1,692 | 3,505 | |||||||||||||||||||||||
| — | (4,625 | ) | — | (405 | ) | — | (1,600 | ) | — | (286 | ) | |||||||||||||||||||
| — | — | — | (31 | ) | — | — | — | — | ||||||||||||||||||||||
| — | (4,625 | ) | — | (436 | ) | — | (1,600 | ) | — | (286 | ) | |||||||||||||||||||
| 18,513 | 50,638 | 5,671 | 8,267 | 3,017 | 8,826 | 3,230 | 5,363 | |||||||||||||||||||||||
| — | 4,625 | — | 436 | — | 1,600 | — | 286 | |||||||||||||||||||||||
| (17,888 | ) | (37,538 | ) | (3,335 | ) | (9,911 | ) | (7,028 | ) | (15,289 | ) | (4,208 | ) | (5,080 | ) | |||||||||||||||
| 625 | 17,725 | 2,336 | (1,208 | ) | (4,011 | ) | (4,863 | ) | (978 | ) | 569 | |||||||||||||||||||
| 5,640 | 24,810 | 3,927 | 121 | (1,334 | ) | 2,492 | 714 | 3,788 | ||||||||||||||||||||||
| 206,360 | 181,550 | 38,654 | 38,533 | 91,254 | 88,762 | 34,245 | 30,457 | |||||||||||||||||||||||
| $ | 212,000 | $ | 206,360 | $ | 42,581 | $ | 38,654 | $ | 89,920 | $ | 91,254 | $ | 34,959 | $ | 34,245 | |||||||||||||||
| $ | 6,066 | $ | 5,572 | $ | 1,059 | $ | 962 | $ | 2,222 | $ | 1,921 | $ | 383 | $ | 363 | |||||||||||||||
| 1,805 | 4,984 | 506 | 774 | 325 | 1,056 | 322 | 614 | |||||||||||||||||||||||
| — | 449 | — | 41 | — | 209 | — | 35 | |||||||||||||||||||||||
| (1,738 | ) | (3,670 | ) | (302 | ) | (934 | ) | (760 | ) | (1,885 | ) | (417 | ) | (583 | ) | |||||||||||||||
| 67 | 1,763 | 204 | (119 | ) | (435 | ) | (620 | ) | (95 | ) | 66 | |||||||||||||||||||
The accompanying notes are an integral part of these financial statements
| Hartford Series Fund, Inc. |
| Statements of Changes in Net Assets – (continued) |
| (000’s Omitted) |
| American Funds | American Funds | |||||||||||||||
| Global Small Capitalization | Growth | |||||||||||||||
| HLS Fund | HLS Fund | |||||||||||||||
| For the | For the | |||||||||||||||
| Six-Month | For the | Six-Month | For the | |||||||||||||
| Period Ended | Year Ended | Period Ended | Year Ended | |||||||||||||
| June 30, 2011 | December 31, | June 30, 2011 | December 31, | |||||||||||||
| (Unaudited) | 2010 | (Unaudited) | 2010 | |||||||||||||
| Operations: | ||||||||||||||||
| Net investment income | $ | 674 | $ | 866 | $ | 197 | $ | 1,351 | ||||||||
| Net realized gain (loss) on investments | 2,958 | 17 | 1,654 | (6,158 | ) | |||||||||||
| Net unrealized appreciation (depreciation) of investments | (3,351 | ) | 12,561 | 18,550 | 60,757 | |||||||||||
| Net increase in net assets resulting from operations | 281 | 13,444 | 20,401 | 55,950 | ||||||||||||
| Distributions to Shareholders: | ||||||||||||||||
| From net investment income | ||||||||||||||||
| Class IB | — | (10 | ) | — | (1,529 | ) | ||||||||||
| From net realized gain on investments | ||||||||||||||||
| Class IB | — | — | — | — | ||||||||||||
| Total distributions | — | (10 | ) | — | (1,529 | ) | ||||||||||
| Capital Share Transactions: | ||||||||||||||||
| Class IB | ||||||||||||||||
| Sold | 4,068 | 15,106 | 12,013 | 40,109 | ||||||||||||
| Issued on reinvestment of distributions | — | 10 | — | 1,529 | ||||||||||||
| Redeemed | (9,979 | ) | (15,070 | ) | (33,547 | ) | (36,556 | ) | ||||||||
| Net increase (decrease) from capital share transactions | (5,911 | ) | 46 | (21,534 | ) | 5,082 | ||||||||||
| Net increase (decrease) in net assets | (5,630 | ) | 13,480 | (1,133 | ) | 59,503 | ||||||||||
| Net Assets: | ||||||||||||||||
| Beginning of period | 74,999 | 61,519 | 356,162 | 296,659 | ||||||||||||
| End of period | $ | 69,369 | $ | 74,999 | $ | 355,029 | $ | 356,162 | ||||||||
Accumulated undistributed (distribution in excess of) net investment income | $ | 1,539 | $ | 865 | $ | 207 | $ | 10 | ||||||||
| Shares: | ||||||||||||||||
| Class IB | ||||||||||||||||
| Sold | 407 | 1,752 | 1,231 | 4,951 | ||||||||||||
| Issued on reinvestment of distributions | — | 1 | — | 169 | ||||||||||||
| Redeemed | (1,001 | ) | (1,761 | ) | (3,439 | ) | (4,417 | ) | ||||||||
| Total share activity | (594 | ) | (8 | ) | (2,208 | ) | 703 | |||||||||
The accompanying notes are an integral part of these financial statements
| American Funds | American Funds | American Funds | ||||||||||||||||||||
| Growth-Income | International | New World | ||||||||||||||||||||
| HLS Fund | HLS Fund | HLS Fund | ||||||||||||||||||||
| For the | For the | For the | ||||||||||||||||||||
| Six-Month | For the | Six-Month | For the | Six-Month | For the | |||||||||||||||||
| Period Ended | Year Ended | Period Ended | Year Ended | Period Ended | Year Ended | |||||||||||||||||
| June 30, 2011 | December 31, | June 30, 2011 | December 31, | June 30, 2011 | December 31, | |||||||||||||||||
| (Unaudited) | 2010 | (Unaudited) | 2010 | (Unaudited) | 2010 | |||||||||||||||||
| $ | 100 | $ | 2,033 | $ | 84 | $ | 3,795 | $ | 186 | $ | 798 | |||||||||||
| 252 | (3,498 | ) | 140 | (1,534 | ) | 1,264 | (531 | ) | ||||||||||||||
| 7,584 | 20,125 | 10,084 | 14,307 | (866 | ) | 9,905 | ||||||||||||||||
| 7,936 | 18,660 | 10,308 | 16,568 | 584 | 10,172 | |||||||||||||||||
| — | (2,183 | ) | — | (2,100 | ) | — | (584 | ) | ||||||||||||||
| — | — | — | (715 | ) | — | — | ||||||||||||||||
| — | (2,183 | ) | — | (2,815 | ) | — | (584 | ) | ||||||||||||||
| 7,066 | 20,249 | 13,329 | 45,834 | 6,024 | 15,738 | |||||||||||||||||
| — | 2,183 | — | 2,815 | — | 584 | |||||||||||||||||
| (14,940 | ) | (21,763 | ) | (18,363 | ) | (23,958 | ) | (11,622 | ) | (12,231 | ) | |||||||||||
| (7,874 | ) | 669 | (5,034 | ) | 24,691 | (5,598 | ) | 4,091 | ||||||||||||||
| 62 | 17,146 | 5,274 | 38,444 | (5,014 | ) | 13,679 | ||||||||||||||||
| 185,836 | 168,690 | 235,702 | 197,258 | 72,257 | 58,578 | |||||||||||||||||
| $ | 185,898 | $ | 185,836 | $ | 240,976 | $ | 235,702 | $ | 67,243 | $ | 72,257 | |||||||||||
| $ | 102 | $ | 2 | $ | 3,876 | $ | 3,792 | $ | 982 | $ | 796 | |||||||||||
| 762 | 2,472 | 1,471 | 5,579 | 588 | 1,707 | |||||||||||||||||
| — | 248 | — | 366 | — | 67 | |||||||||||||||||
| (1,614 | ) | (2,648 | ) | (1,982 | ) | (2,863 | ) | (1,137 | ) | (1,374 | ) | |||||||||||
| (852 | ) | 72 | (511 | ) | 3,082 | (549 | ) | 400 | ||||||||||||||
The accompanying notes are an integral part of these financial statements
| Hartford Series Fund, Inc. |
Notes to Financial Statements |
| June 30, 2011 (Unaudited) |
| (000’s Omitted) |
| 1. | Organization: |
The Hartford HLS Funds serve as underlying investment options for certain variable annuity and variable life insurance separate accounts of Hartford Life Insurance Company (“HLIC”) and its affiliates and certain qualified retirement plans. Certain Hartford HLS Funds may also serve as underlying investment options for certain variable annuity and variable life separate accounts of other insurance companies. Owners of variable annuity contracts and policyholders of variable life insurance contracts may choose the funds permitted in the variable insurance contract prospectus. In addition, participants in certain qualified retirement plans may choose the Fund if permitted by their plans.
Hartford Series Fund, Inc. (the “Company”) is an open-end management investment company comprised of thirty portfolios, eleven portfolios of which are included in these financial statements (each a “Fund” or together the “Funds”). These eleven portfolios of the Company are American Funds Asset Allocation HLS Fund, American Funds Blue Chip Income and Growth HLS Fund, American Funds Bond HLS Fund, American Funds Global Bond HLS Fund, American Funds Global Growth and Income HLS Fund, American Funds Global Growth HLS Fund, American Funds Global Small Capitalization HLS Fund, American Funds Growth HLS Fund, American Funds Growth-Income HLS Fund, American Funds International HLS Fund and American Funds New World HLS Fund.
The Company is organized under the laws of the State of Maryland and is registered with the Securities and Exchange Commission (“SEC”) under the Investment Company Act of 1940, as amended (“1940 Act”). Each Fund is organized as a diversified open-end management investment company, except for American Funds Global Bond HLS Fund, which is non-diversified.
Each Fund operates in the manner of a fund of funds, investing in shares of underlying mutual funds (the “Underlying Funds”). Each Underlying Fund is offered by American Funds Insurance Series, and is a registered open-end investment company. The Funds and their related Underlying Funds are listed below:
| Fund | Underlying Fund | |
| American Funds Asset Allocation HLS Fund | Asset Allocation Fund Class 1 | |
| American Funds Blue Chip Income and Growth HLS Fund | Blue Chip Income and Growth Fund Class 1 | |
| American Funds Bond HLS Fund | Bond Fund Class 1 | |
| American Funds Global Bond HLS Fund | Global Bond Fund Class 1 | |
| American Funds Global Growth and Income HLS Fund | Global Growth and Income Fund Class 1 | |
| American Funds Global Growth HLS Fund | Global Growth Fund Class 1 | |
| American Funds Global Small Capitalization HLS Fund | Global Small Capitalization Fund Class 1 | |
| American Funds Growth HLS Fund | Growth Fund Class 1 | |
| American Funds Growth-Income HLS Fund | Growth-Income Fund Class 1 | |
| American Funds International HLS Fund | International Fund Class 1 | |
| American Funds New World HLS Fund | New World Fund Class 1 |
The Underlying Funds’ accounting policies are outlined in the Underlying Funds’ shareholder report, which accompanies this report.
Class IB shares of the Funds are offered at the per share net asset value (“NAV”) without a sales charge and are subject to distribution fees charged pursuant to a Distribution and Service Plan. The Distribution and Service Plan has been adopted in accordance with Rule 12b-1 under the 1940 Act.
| 2. | Significant Accounting Policies: |
The following is a summary of significant accounting policies of the Funds in the preparation of their financial statements, which are in accordance with the United States Generally Accepted Accounting Principles (“U.S. GAAP”). The preparation of financial statements in accordance with U.S. GAAP may require management to make estimates and assumptions that affect the reported amounts of assets and liabilities and disclosure of contingent assets and liabilities at the date of the financial statements and the reported amounts of increases and decreases in net assets from operations during the reporting period. Actual results could differ from those estimates.
| a) | Determination of Net Asset Value – The NAV of each class of the Fund's shares is determined as of the close of regular trading (normally 4:00 p.m. Eastern Time) (the “NYSE Close”) on each day that the New York Stock Exchange (the “Exchange”) is open (“Valuation Date”). Information that becomes known to the Fund after the NAV has been calculated on a particular day will not generally be used to retroactively adjust the NAV determined earlier that day. |
| b) | Investment Valuation – Investments in the Underlying Funds are valued at the respective NAV of each Underlying Fund as determined as of the NYSE Close on Valuation Date. Valuation of securities held by the Underlying Funds is discussed in Notes to Financial Statements of the Underlying Funds, which are included in the Underlying Funds’ shareholder report, accompanying this report. |
U.S. GAAP defines fair value as the price that the Fund would receive to sell an asset or pay to transfer a liability in an orderly transaction between market participants. The U.S. GAAP fair value measurement standards require disclosure of a fair value hierarchy for each major category of assets and liabilities. Various inputs are used in determining the fair value of each Fund’s investments. These inputs are summarized into three broad hierarchy levels. This hierarchy is based on whether the valuation inputs are observable or unobservable. These levels are:
| · | Level 1 – Quoted prices in active markets for identical securities. |
| · | Level 2 – Observable inputs other than Level 1 prices, such as quoted prices for similar securities; quoted prices in markets that are not active; or other inputs that are observable or can be corroborated by observable market data. |
| · | Level 3 – Significant unobservable inputs that are supported by limited or no market activity. Level 3 may include financial instruments whose values are determined using broker quotes or require significant management judgment or estimation. |
Valuation levels are not necessarily indicative of the risk associated with investing in such securities. Individual securities within any of the above mentioned asset classes may be assigned a different hierarchical level than those presented above, as individual circumstances dictate.
During the six-month period ended June 30, 2011, the Funds held no Level 3 securities, therefore no reconciliations of Level 3 securities are presented.
For additional information, refer to the investment valuation hierarchy level summary which follows the Schedule of Investments for each Fund.
For purposes of reporting transfers between different hierarchy levels, both transfers in and out of each level, as applicable, are shown as if they occurred at the beginning of the period.
| c) | Security Transactions and Investment Income – Security transactions are recorded as of the trade date (the date the order to buy or sell is executed) for financial reporting purposes. Realized gains and losses are determined on the basis of identified cost. |
Income and capital gain distributions from Underlying Funds are recorded on the ex-dividend date.
| Hartford Series Fund, Inc. |
| Notes to Financial Statements – (continued) |
| June 30, 2011 (Unaudited) |
| (000’s Omitted) |
| d) | Fund Share Valuation and Dividend Distributions to Shareholders – Orders for the Funds’ shares are executed in accordance with the investment instructions of the contract holders. The NAV of each Fund’s shares is determined as of the close of each business day of the Exchange. The NAV is determined for each Fund by dividing the Fund’s net assets by the number of shares outstanding. Orders for the purchase of a Fund’s shares received by an insurance company prior to the close of the Exchange on any day on which the Exchange is open for business are priced at the NAV determined as of the close of the Exchange. Orders received by an insurance company after the close of the Exchange, or on a day on which the Exchange and/or the Fund is not open for business, are priced at the next determined NAV. |
Dividends are declared pursuant to a policy adopted by the Funds’ Board of Directors based upon the investment performance of the Funds. The policy of all Funds is to pay dividends from net investment income and realized capital gains, if any, at least once a year.
Distributions from net investment income, net realized capital gains and capital are determined in accordance with federal income tax regulations, which may differ from U.S. GAAP with respect to character and timing. These differences may include but are not limited to losses deferred due to wash sale adjustments and short-term capital gain adjustments. Permanent book and federal income tax basis differences relating to shareholder distributions will result in reclassifications to certain of the Fund’s capital accounts (see Federal Income Taxes: Reclassification of Capital Accounts note).
| 3. | Principal Risks: |
| a) | Market Risks – The Fund’s are exposed to the risks of the Underlying Funds in direct proportion to the amount of assets each Fund allocates to each Underlying Fund. The market values of Underlying Funds may decline due to general market conditions which are not specifically related to a particular company, such as real or perceived adverse economic conditions, changes in the general outlook for corporate earnings, changes in interest or currency rates or adverse investor sentiment generally. The market value of equity securities may also decline due to factors which affect a particular industry or industries, such as labor shortages or increased production costs and competitive conditions within an industry. |
| 4. | Federal Income Taxes: |
| a) | Federal Income Taxes– For federal income tax purposes, the Funds intend to continue to qualify as Regulated Investment Companies (“RIC”) under Subchapter M of the Internal Revenue Code (“IRC”) by distributing substantially all of their taxable net investment income and net realized capital gains to their shareholders and otherwise complying with the requirements of RIC. The Funds have distributed substantially all of their income and capital gains in the prior year and each Fund intends to distribute substantially all of its income and gains prior to the next fiscal year end. Accordingly, no provision for federal income or excise taxes has been made in the accompanying financial statements. Distributions from short-term capital gains are treated as ordinary income distributions for federal income tax purposes. |
| b) | Net Investment Income (Loss), Net Realized Gains (Losses) –Net investment income (loss) and net realized gains (losses) may differ for financial statement and tax purposes primarily because of losses deferred due to wash sale adjustments and short-term capital gain adjustments. The character of distributions made during the year from net investment income or net realized gains may differ from their ultimate characterization for federal income tax purposes. Also, due to the timing of dividend distributions, the fiscal year in which amounts are distributed may differ from the year that the net investment income (loss) or net realized gains (losses) were recorded by a Fund. |
| c) | Distributions and Components of Distributable Earnings – The tax character of distributions paid by the Funds for the periods indicated is as follows (as adjusted for dividends payable): |
| For the Year Ended | For the Year Ended | |||||||||||||||||||||||
| December 31, 2010 | December 31, 2009 | |||||||||||||||||||||||
| Long- | Tax | Long- | Tax | |||||||||||||||||||||
| Term | return | Term | return | |||||||||||||||||||||
| Ordinary | Capital | of | Ordinary | Capital | of | |||||||||||||||||||
| Income | Gains(a) | capital | Income | Gains(a) | capital | |||||||||||||||||||
| American Funds Asset Allocation HLS Fund | $ | 881 | $ | — | $ | — | $ | 708 | $ | 172 | $ | — | ||||||||||||
| American Funds Blue Chip Income and Growth HLS Fund | 871 | — | — | 304 | 134 | — | ||||||||||||||||||
| American Funds Bond HLS Fund | 4,625 | — | — | 3,303 | 8 | — | ||||||||||||||||||
| American Funds Global Bond HLS Fund | 405 | 31 | — | 966 | — | — | ||||||||||||||||||
| American Funds Global Growth and Income HLS Fund | 1,600 | — | — | 1,283 | 23 | — | ||||||||||||||||||
| American Funds Global Growth HLS Fund | 286 | — | — | 408 | 349 | — | ||||||||||||||||||
| American Funds Global Small Capitalization HLS Fund | 10 | — | — | 27 | 355 | — | ||||||||||||||||||
| American Funds Growth HLS Fund | 1,529 | — | — | 1,044 | 2,508 | — | ||||||||||||||||||
| American Funds Growth-Income HLS Fund | 2,183 | — | — | 2,102 | 849 | — | ||||||||||||||||||
| American Funds International HLS Fund | 2,100 | 715 | — | 2,217 | 1,535 | — | ||||||||||||||||||
| American Funds New World HLS Fund | 584 | — | — | 495 | 336 | — | ||||||||||||||||||
| (a) | The Funds designate these distributions as long-term capital dividends per IRC code Sec. 852(b) (3) (C). |
As of December 31, 2010, the components of distributable earnings (deficit) on a tax basis were as follows:
| Total | ||||||||||||||||||||
| Undistributed | Undistributed | Accumulated | Unrealized | Accumulated | ||||||||||||||||
| Ordinary | Long-Term | Capital and Other | Appreciation | Earnings | ||||||||||||||||
| Income | Capital Gain | Losses | (Depreciation)@ | (Deficit) | ||||||||||||||||
| American Funds Asset Allocation HLS Fund | $ | 862 | $ | 4 | $ | – | $ | 7,589 | $ | 8,455 | ||||||||||
American Funds Blue Chip Income and Growth HLS Fund | 8 | – | (45 | ) | 6,217 | 6,180 | ||||||||||||||
| American Funds Bond HLS Fund | 5,572 | 24 | – | 9,540 | 15,136 | |||||||||||||||
| American Funds Global Bond HLS Fund | 962 | 315 | – | 2,569 | 3,846 | |||||||||||||||
American Funds Global Growth and Income HLS Fund | 1,921 | – | (1,474 | ) | 18,347 | 18,794 | ||||||||||||||
| American Funds Global Growth HLS Fund | 363 | – | (20 | ) | 5,993 | 6,336 | ||||||||||||||
American Funds Global Small Capitalization HLS Fund | 865 | 360 | – | 23,593 | 24,818 | |||||||||||||||
| American Funds Growth HLS Fund | 10 | – | (945 | ) | 86,927 | 85,992 | ||||||||||||||
| American Funds Growth-Income HLS Fund | 2 | – | (808 | ) | 32,863 | 32,057 | ||||||||||||||
| American Funds International HLS Fund | 3,792 | – | (342 | ) | 40,663 | 44,113 | ||||||||||||||
| American Funds New World HLS Fund | 796 | – | (209 | ) | 17,291 | 17,878 | ||||||||||||||
@ The difference between book-basis and tax-basis unrealized appreciation (depreciation) is attributable primarily to the tax deferral of wash sale losses.
| d) | Reclassification of Capital Accounts – The Funds may record reclassifications in their capital accounts. These reclassifications have no impact on the total net assets of the Funds. The reclassifications are a result of permanent differences between U.S. GAAP and tax accounting for such items as net operating losses that reduce distribution requirements. Adjustments are made to reflect the impact these items have on current and future distributions to shareholders. Therefore, the source of a Fund’s distributable income may be shown in the accompanying Statement of |
| Hartford Series Fund, Inc. |
Notes to Financial Statements – (continued) |
| June 30, 2011 (Unaudited) |
| (000’s Omitted) |
Assets and Liabilities as from net investment income, from net realized gains on investments or from capital depending on the type of book and tax differences that exist. For the year ended December 31, 2010, the Funds recorded no reclassifications.
| e) | Capital Loss Carryforward – At December 31, 2010 (tax-year-end), certain of the Funds had capital loss carryforwards for U.S. federal income tax purposes of approximately: |
| 2011 | 2012 | 2013 | 2014 | 2015 | 2016 | 2017 | 2018 | Total | ||||||||||||||||||||||||||||
American Funds Blue Chip Income and Growth HLS Fund | $ | — | $ | — | $ | — | $ | — | $ | — | $ | — | $ | — | $ | 45 | $ | 45 | ||||||||||||||||||
American Funds Global Growth and Income HLS Fund | — | — | — | — | — | — | — | 1,457 | 1,457 | |||||||||||||||||||||||||||
American Funds Global Growth HLS Fund | — | — | — | — | — | — | — | 20 | 20 | |||||||||||||||||||||||||||
American Funds Growth HLS Fund | — | — | — | — | — | — | — | 848 | 848 | |||||||||||||||||||||||||||
American Funds Growth-Income HLS Fund | — | — | — | — | — | — | — | 701 | 701 | |||||||||||||||||||||||||||
American Funds International HLS Fund | — | — | — | — | — | — | — | 332 | 332 | |||||||||||||||||||||||||||
American Funds New World HLS Fund | — | — | — | — | — | — | — | 209 | 209 | |||||||||||||||||||||||||||
As of December 31, 2010, the following Funds elected to defer the following post-October losses:
| Ordinary | Long-Term | |||||||
| Income | Capital Gain | |||||||
| American Funds Global Growth and Income HLS Fund | $ | — | $ | 17 | ||||
| American Funds Growth HLS Fund | — | 97 | ||||||
| American Funds Growth-Income HLS Fund | — | 107 | ||||||
| American Funds International HLS Fund | — | 10 | ||||||
| f) | Accounting for Uncertainty in Income Taxes – The Funds have adopted financial reporting rules that require the Funds to analyze all open tax years, as defined by the Statute of Limitations, for all major jurisdictions. Generally, tax authorities can examine all tax returns filed for the last three years. The Funds do not have an examination in progress. |
The Funds have reviewed all open tax years and major jurisdictions and concluded that these financial reporting rules have no effect on the Funds’ financial positions or results of operations. There is no tax liability resulting from unrecognized tax benefits relating to uncertain income tax positions taken or expected to be taken on the tax return for the fiscal year-end December 31, 2010. The Funds are also not aware of any tax positions for which it is reasonably possible that the total amounts of unrecognized tax benefits will significantly change in the next twelve months.
| 5. | Expenses: |
| a) | Investment Management Agreement – HL Investment Advisors, LLC (“HL Advisors”), an indirect wholly owned subsidiary of The Hartford Financial Services Group, Inc. (“The Hartford”), serves as investment manager to the Funds pursuant to an Investment Management Agreement with the Company. As investment manager, HL Advisors has overall investment supervisory responsibility for each Fund. In addition, HL Advisors provides administrative personnel, services, equipment, facilities and office space for proper operation of the Funds. |
The schedule below reflects the rates of compensation as a percentage of each Fund’s average daily net assets paid to HL Advisors for investment management services rendered during the six-month period ended June 30, 2011. The rates are accrued daily and paid monthly:
| Fund | Annual Rate* | |||
| American Funds Asset Allocation HLS Fund | 0.65 | % | ||
| American Funds Blue Chip Income and Growth HLS Fund | 0.75 | % | ||
| American Funds Bond HLS Fund | 0.50 | % | ||
| American Funds Global Bond HLS Fund | 0.75 | % | ||
| American Funds Global Growth and Income HLS Fund | 0.80 | % | ||
| American Funds Global Growth HLS Fund | 1.00 | % | ||
| American Funds Global Small Capitalization HLS Fund | 0.80 | % | ||
| American Funds Growth HLS Fund | 0.75 | % | ||
| American Funds Growth-Income HLS Fund | 0.70 | % | ||
| American Funds International HLS Fund | 0.85 | % | ||
| American Funds New World HLS Fund | 1.10 | % | ||
| * | HL Advisors has entered into an agreement under which it will waive a portion of its investment management fee with respect to each Fund for as long as that Fund is invested in its corresponding Underlying Fund. The net investment management fee under the agreement with HL Advisors, after giving effect to the waiver, is 0.25% of the average daily net assets for each Fund. |
| b) | Accounting Services Agreement – Pursuant to the Fund Accounting Agreement between HLIC and the Company, on behalf of the Funds, HLIC provides accounting services to the Funds and receives monthly compensation of 0.01% of each Fund’s average daily net assets. These fees are accrued daily and paid monthly. |
| c) | Other Related Party Transactions – Certain officers of the Funds are directors and/or officers of HL Advisors, and/or The Hartford or its subsidiaries. For the six-month period ended June 30, 2011, a portion of the Funds’ chief compliance officer’s salary was paid by all the investment companies in the Hartford fund complex. The portion allocated to the Funds was in the amount of $1. These fees are accrued daily and paid monthly. |
| d) | Operating Expenses – Allocable expenses incurred by the Company are allocated to each Fund in proportion to the average daily net assets of each Fund, except where allocation of certain expenses is more fairly made directly to the Fund. |
| e) | Distribution Plan for Class IB shares – The Company, on behalf of the Funds, has adopted a Distribution Plan pursuant to Rule 12b-1 of the 1940 Act to compensate the Distributor, Hartford Securities Distribution Company, Inc. (a wholly owned, ultimate subsidiary of The Hartford), from assets attributable to the Class IB shares for services rendered and expenses borne in connection with activities primarily intended to result in the sale of the Class IB shares, subject to the review and approval of the Company’s Board of Directors. |
The Distribution Plan provides that each Fund may pay annually up to 0.25% of the average daily net assets of a Fund attributable to its Class IB shares for activities primarily intended to result in the sale of Class IB shares. The Board has the authority to suspend or reduce these payments at any point in time. Under the terms of the Distribution Plan and the principal underwriting agreement, each Fund is authorized to make payments monthly to the Distributor that may be used to pay or compensate entities providing distribution and shareholder servicing with respect to the Class IB shares for such entities’ fees or expenses incurred or paid in that regard. These fees are accrued daily and paid monthly.
| Hartford Series Fund, Inc. |
| Notes to Financial Statements – (continued) |
| June 30, 2011 (Unaudited) |
| (000’s Omitted) |
| 6. | Investment Transactions: |
For the six-month period ended June 30, 2011, aggregate purchases and sales of investment securities (excluding short-term investments) were as follows:
| Cost of Purchases | Sales Proceeds | |||||||
| Excluding U.S. | Excluding U.S. | |||||||
| Government | Government | |||||||
| Obligations | Obligations | |||||||
| American Funds Asset Allocation HLS Fund | $ | 7,967 | $ | 1,904 | ||||
| American Funds Blue Chip Income and Growth HLS Fund | 1,491 | 3,373 | ||||||
| American Funds Bond HLS Fund | 14,819 | 13,707 | ||||||
| American Funds Global Bond HLS Fund | 5,184 | 2,539 | ||||||
| American Funds Global Growth and Income HLS Fund | 1,751 | 5,466 | ||||||
| American Funds Global Growth HLS Fund | 2,371 | 3,331 | ||||||
| American Funds Global Small Capitalization HLS Fund | 2,793 | 8,033 | ||||||
| American Funds Growth HLS Fund | 4,698 | 26,047 | ||||||
| American Funds Growth-Income HLS Fund | 3,638 | 11,421 | ||||||
| American Funds International HLS Fund | 8,981 | 13,934 | ||||||
| American Funds New World HLS Fund | 3,436 | 8,852 | ||||||
| 7. | Line of Credit: |
The Funds, along with several other Hartford funds, participate in a $500 million committed revolving line of credit facility. The facility is to be used for temporary or emergency purposes. Under the arrangement, a fund is required to own securities having a market value in excess of 300% of the total bank borrowings. The interest rate on borrowings varies depending on the nature of the loan. The facility also requires a fee to be paid based on the amount of the commitment. This commitment fee is allocated to all the funds participating in the line of credit based on the average net assets of the funds. During the six-month period ended June 30, 2011, the Funds did not have any borrowings under this facility.
| 8. | Indemnifications: |
Under the Company’s organizational documents, the Company shall indemnify its officers and directors to the full extent required or permitted under Maryland General Corporation Law and the federal securities laws. In addition, the Company, on behalf of the Fund, may enter into contracts that contain a variety of indemnifications. The Company’s maximum exposure under these arrangements is unknown. However, as of the date of these financial statements the Company has not had prior claims or losses pursuant to these contracts and expects the risk of loss to be remote.
| Hartford Series Fund, Inc. |
Financial Highlights |
| ─ Selected Per-Share Data(A) ─ | ─ Ratios and Supplemental Data ─ | |||||||||||||||||||||||||||||||||||||||||||||||||||||||||||
| Net | ||||||||||||||||||||||||||||||||||||||||||||||||||||||||||||
| Realized | ||||||||||||||||||||||||||||||||||||||||||||||||||||||||||||
| and Un- | Distrib- | Net | Ratio of | Ratio of | ||||||||||||||||||||||||||||||||||||||||||||||||||||||||
| Net | realized | Dividends | utions | Increase | Expenses to | Expenses to | Ratio of Net | |||||||||||||||||||||||||||||||||||||||||||||||||||||
| Net Asset | Invest- | Gain | from Net | from | (Decrease) | Net Asset | Average | Average | Investment | |||||||||||||||||||||||||||||||||||||||||||||||||||
| Value at | ment | (Loss) on | Total from | Invest- | Realized | Total | in Net | Value at | Net Assets | Net Assets | Net Assets | Income to | Portfolio | |||||||||||||||||||||||||||||||||||||||||||||||
| Beginning | Income | Invest- | Investment | ment | Capital | Distri- | Asset | End of | Total | at End of | Before | After | Average Net | Turnover | ||||||||||||||||||||||||||||||||||||||||||||||
| Class | of Period | (Loss) | ments | Operations | Income | Gains | butions | Value | Period | Return(B) | Period | Waivers(C) | Waivers(C) | Assets | Rate | |||||||||||||||||||||||||||||||||||||||||||||
| American Funds Asset Allocation HLS Fund | ||||||||||||||||||||||||||||||||||||||||||||||||||||||||||||
| For the Six-Month Period Ended June 30, 2011 (Unaudited) | ||||||||||||||||||||||||||||||||||||||||||||||||||||||||||||
| IB | $ | 9.74 | $ | – | $ | 0.51 | $ | 0.51 | $ | – | $ | – | $ | – | $ | 0.51 | $ | 10.25 | 5.26 | %(D) | $ | 67,539 | 0.93 | %(E) | 0.53 | %(E) | 0.31 | %(E) | 3 | % | ||||||||||||||||||||||||||||||
| For the Year Ended December 31, 2010 | ||||||||||||||||||||||||||||||||||||||||||||||||||||||||||||
| IB | 8.85 | 0.14 | 0.91 | 1.05 | (0.16 | ) | – | (0.16 | ) | 0.89 | 9.74 | 12.13 | 58,326 | 0.95 | 0.55 | 1.73 | 11 | |||||||||||||||||||||||||||||||||||||||||||
| For the Year Ended December 31, 2009(F) | ||||||||||||||||||||||||||||||||||||||||||||||||||||||||||||
| IB | 7.31 | 0.18 | 1.53 | 1.71 | (0.14 | ) | (0.03 | ) | (0.17 | ) | 1.54 | 8.85 | 23.59 | 48,568 | 0.95 | 0.55 | 2.33 | 8 | ||||||||||||||||||||||||||||||||||||||||||
| From (commencement of operations) April 30, 2008 through December 31, 2008 | ||||||||||||||||||||||||||||||||||||||||||||||||||||||||||||
| IB | 10.00 | 0.19 | (2.88 | ) | (2.69 | ) | – | – | – | (2.69 | ) | 7.31 | ( 26.88 | ) (D) | 26,312 | 0.99 | (E) | 0.59 | (E) | 8.02 | (E) | – | ||||||||||||||||||||||||||||||||||||||
| American Funds Blue Chip Income and Growth HLS Fund | ||||||||||||||||||||||||||||||||||||||||||||||||||||||||||||
| For the Six-Month Period Ended June 30, 2011 (Unaudited) | ||||||||||||||||||||||||||||||||||||||||||||||||||||||||||||
| IB | 9.18 | – | 0.32 | 0.32 | – | – | – | 0.32 | 9.50 | 3.52 | (D) | 33,313 | 1.05 | (E) | 0.55 | (E) | 0.09 | (E) | 4 | |||||||||||||||||||||||||||||||||||||||||
| For the Year Ended December 31, 2010 | ||||||||||||||||||||||||||||||||||||||||||||||||||||||||||||
| IB | 8.44 | 0.12 | 0.86 | 0.98 | (0.24 | ) | – | (0.24 | ) | 0.74 | 9.18 | 11.98 | 34,030 | 1.07 | 0.57 | 1.48 | 11 | |||||||||||||||||||||||||||||||||||||||||||
| For the Year Ended December 31, 2009(F) | ||||||||||||||||||||||||||||||||||||||||||||||||||||||||||||
| IB | 6.74 | 0.15 | 1.68 | 1.83 | (0.09 | ) | (0.04 | ) | (0.13 | ) | 1.70 | 8.44 | 27.46 | 29,030 | 1.07 | 0.57 | 2.06 | 6 | ||||||||||||||||||||||||||||||||||||||||||
| From (commencement of operations) April 30, 2008 through December 31, 2008 | ||||||||||||||||||||||||||||||||||||||||||||||||||||||||||||
| IB | 10.00 | 0.14 | (3.40 | ) | (3.26 | ) | – | – | – | (3.26 | ) | 6.74 | ( 32.64 | ) (D) | 13,182 | 1.17 | (E) | 0.67 | (E) | 6.79 | (E) | 3 | ||||||||||||||||||||||||||||||||||||||
| American Funds Bond HLS Fund | ||||||||||||||||||||||||||||||||||||||||||||||||||||||||||||
| For the Six-Month Period Ended June 30, 2011 (Unaudited) | ||||||||||||||||||||||||||||||||||||||||||||||||||||||||||||
| IB | 10.21 | 0.02 | 0.22 | 0.24 | – | – | – | 0.24 | 10.45 | 2.39 | (D) | 212,000 | 0.78 | (E) | 0.53 | (E) | 0.47 | (E) | 7 | |||||||||||||||||||||||||||||||||||||||||
| For the Year Ended December 31, 2010 | ||||||||||||||||||||||||||||||||||||||||||||||||||||||||||||
| IB | 9.84 | 0.26 | 0.35 | 0.61 | (0.24 | ) | – | (0.24 | ) | 0.37 | 10.21 | 6.15 | 206,360 | 0.80 | 0.55 | 2.75 | 13 | |||||||||||||||||||||||||||||||||||||||||||
| For the Year Ended December 31, 2009(F) | ||||||||||||||||||||||||||||||||||||||||||||||||||||||||||||
| IB | 8.98 | 0.35 | 0.74 | 1.09 | (0.23 | ) | – | (0.23 | ) | 0.86 | 9.84 | 12.23 | 181,550 | 0.78 | 0.53 | 3.75 | 2 | |||||||||||||||||||||||||||||||||||||||||||
| From (commencement of operations) April 30, 2008 through December 31, 2008 | ||||||||||||||||||||||||||||||||||||||||||||||||||||||||||||
| IB | 10.00 | 0.44 | (1.46 | ) | (1.02 | ) | – | – | – | (1.02 | ) | 8.98 | ( 10.21 | ) (D) | 67,597 | 0.80 | (E) | 0.55 | (E) | 16.32 | (E) | 5 | ||||||||||||||||||||||||||||||||||||||
| American Funds Global Bond HLS Fund | ||||||||||||||||||||||||||||||||||||||||||||||||||||||||||||
| For the Six-Month Period Ended June 30, 2011 (Unaudited) | ||||||||||||||||||||||||||||||||||||||||||||||||||||||||||||
| IB | 10.86 | 0.01 | 0.44 | 0.45 | – | – | – | 0.45 | 11.31 | 4.18 | (D) | 42,581 | 1.05 | (E) | 0.55 | (E) | 0.50 | (E) | 6 | |||||||||||||||||||||||||||||||||||||||||
| For the Year Ended December 31, 2010 | ||||||||||||||||||||||||||||||||||||||||||||||||||||||||||||
| IB | 10.47 | 0.27 | 0.24 | 0.51 | (0.11 | ) | (0.01 | ) | (0.12 | ) | 0.39 | 10.86 | 4.85 | 38,654 | 1.07 | 0.57 | 2.49 | 17 | ||||||||||||||||||||||||||||||||||||||||||
| For the Year Ended December 31, 2009(F) | ||||||||||||||||||||||||||||||||||||||||||||||||||||||||||||
| IB | 9.85 | 0.13 | 0.79 | 0.92 | (0.30 | ) | – | (0.30 | ) | 0.62 | 10.47 | 9.43 | 38,533 | 1.06 | 0.56 | 1.29 | 5 | |||||||||||||||||||||||||||||||||||||||||||
| From (commencement of operations) April 30, 2008 through December 31, 2008 | ||||||||||||||||||||||||||||||||||||||||||||||||||||||||||||
| IB | 10.00 | 0.42 | (0.57 | ) | (0.15 | ) | – | – | – | (0.15 | ) | 9.85 | ( 1.51 | ) (D) | 22,386 | 1.10 | (E) | 0.60 | (E) | 13.11 | (E) | 42 | ||||||||||||||||||||||||||||||||||||||
| American Funds Global Growth and Income HLS Fund | ||||||||||||||||||||||||||||||||||||||||||||||||||||||||||||
| For the Six-Month Period Ended June 30, 2011 (Unaudited) | ||||||||||||||||||||||||||||||||||||||||||||||||||||||||||||
| IB | 9.06 | 0.04 | 0.23 | 0.27 | – | – | – | 0.27 | 9.33 | 2.98 | (D) | 89,920 | 1.08 | (E) | 0.53 | (E) | 0.66 | (E) | 2 | |||||||||||||||||||||||||||||||||||||||||
| For the Year Ended December 31, 2010 | ||||||||||||||||||||||||||||||||||||||||||||||||||||||||||||
| IB | 8.30 | 0.20 | 0.72 | 0.92 | (0.16 | ) | – | (0.16 | ) | 0.76 | 9.06 | 11.41 | 91,254 | 1.10 | 0.55 | 2.25 | 8 | |||||||||||||||||||||||||||||||||||||||||||
| For the Year Ended December 31, 2009(F) | ||||||||||||||||||||||||||||||||||||||||||||||||||||||||||||
| IB | 6.06 | 0.16 | 2.21 | 2.37 | (0.13 | ) | – | (0.13 | ) | 2.24 | 8.30 | 39.37 | 88,762 | 1.09 | 0.54 | 2.39 | 3 | |||||||||||||||||||||||||||||||||||||||||||
| From (commencement of operations) April 30, 2008 through December 31, 2008 | ||||||||||||||||||||||||||||||||||||||||||||||||||||||||||||
| IB | 10.00 | 0.17 | (4.11 | ) | (3.94 | ) | – | – | – | (3.94 | ) | 6.06 | ( 39.43 | ) (D) | 44,065 | 1.11 | (E) | 0.56 | (E) | 8.24 | (E) | – | ||||||||||||||||||||||||||||||||||||||
| Hartford Series Fund, Inc. |
Financial Highlights – (continued) |
| ─ Selected Per-Share Data(A) ─ | ─ Ratios and Supplemental Data ─ | |||||||||||||||||||||||||||||||||||||||||||||||||||||||||||
| Net | ||||||||||||||||||||||||||||||||||||||||||||||||||||||||||||
| Realized | ||||||||||||||||||||||||||||||||||||||||||||||||||||||||||||
| and Un- | Distrib- | Net | Ratio of | Ratio of | ||||||||||||||||||||||||||||||||||||||||||||||||||||||||
| Net | realized | Dividends | utions | Increase | Expenses to | Expenses to | Ratio of Net | |||||||||||||||||||||||||||||||||||||||||||||||||||||
| Net Asset | Invest- | Gain | from Net | from | (Decrease) | Net Asset | Average | Average | Investment | |||||||||||||||||||||||||||||||||||||||||||||||||||
| Value at | ment | (Loss) on | Total from | Invest- | Realized | Total | in Net | Value at | Net Assets | Net Assets | Net Assets | Income to | Portfolio | |||||||||||||||||||||||||||||||||||||||||||||||
| Beginning | Income | Invest- | Investment | ment | Capital | Distri- | Asset | End of | Total | at End of | Before | After | Average Net | Turnover | ||||||||||||||||||||||||||||||||||||||||||||||
| Class | of Period | (Loss) | ments | Operations | Income | Gains | butions | Value | Period | Return(B) | Period | Waivers(C) | Waivers(C) | Assets | Rate | |||||||||||||||||||||||||||||||||||||||||||||
| American Funds Global Growth HLS Fund | ||||||||||||||||||||||||||||||||||||||||||||||||||||||||||||
| For the Six-Month Period Ended June 30, 2011 (Unaudited) | ||||||||||||||||||||||||||||||||||||||||||||||||||||||||||||
| IB | $ | 9.74 | $ | 0.01 | $ | 0.47 | $ | 0.48 | $ | – | $ | – | $ | – | $ | 0.48 | $ | 10.22 | 4.94 | %(D) | $ | 34,959 | 1.30 | %(E) | 0.55 | %(E) | 0.12 | %(E) | 7 | % | ||||||||||||||||||||||||||||||
| For the Year Ended December 31, 2010 | ||||||||||||||||||||||||||||||||||||||||||||||||||||||||||||
| IB | 8.83 | 0.10 | 0.89 | 0.99 | (0.08 | ) | – | (0.08 | ) | 0.91 | 9.74 | 11.41 | 34,245 | 1.32 | 0.57 | 1.17 | 11 | |||||||||||||||||||||||||||||||||||||||||||
| For the Year Ended December 31, 2009(F) | ||||||||||||||||||||||||||||||||||||||||||||||||||||||||||||
| IB | 6.40 | 0.09 | 2.57 | 2.66 | (0.12 | ) | (0.11 | ) | (0.23 | ) | 2.43 | 8.83 | 41.78 | 30,457 | 1.32 | 0.57 | 1.24 | 12 | ||||||||||||||||||||||||||||||||||||||||||
| From (commencement of operations) April 30, 2008 through December 31, 2008 | ||||||||||||||||||||||||||||||||||||||||||||||||||||||||||||
| IB | 10.00 | 0.15 | (3.75 | ) | (3.60 | ) | – | – | – | (3.60 | ) | 6.40 | ( 35.95 | ) (D) | 15,490 | 1.37 | (E) | 0.62 | (E) | 5.68 | (E) | – | ||||||||||||||||||||||||||||||||||||||
| American Funds Global Small Capitalization HLS Fund | ||||||||||||||||||||||||||||||||||||||||||||||||||||||||||||
| For the Six-Month Period Ended June 30, 2011 (Unaudited) | ||||||||||||||||||||||||||||||||||||||||||||||||||||||||||||
| IB | 9.92 | 0.11 | (0.07 | ) | 0.04 | – | – | – | 0.04 | 9.96 | 0.39 | (D) | 69,369 | 1.09 | (E) | 0.54 | (E) | 1.87 | (E) | 4 | ||||||||||||||||||||||||||||||||||||||||
| For the Year Ended December 31, 2010 | ||||||||||||||||||||||||||||||||||||||||||||||||||||||||||||
| IB | 8.13 | 0.11 | 1.68 | 1.79 | – | – | – | 1.79 | 9.92 | 22.06 | 74,999 | 1.12 | 0.57 | 1.35 | 16 | |||||||||||||||||||||||||||||||||||||||||||||
| For the Year Ended December 31, 2009(F) | ||||||||||||||||||||||||||||||||||||||||||||||||||||||||||||
| IB | 5.10 | – | 3.08 | 3.08 | – | (0.05 | ) | (0.05 | ) | 3.03 | 8.13 | 60.77 | 61,519 | 1.10 | 0.55 | 0.02 | 10 | |||||||||||||||||||||||||||||||||||||||||||
| From (commencement of operations) April 30, 2008 through December 31, 2008 | ||||||||||||||||||||||||||||||||||||||||||||||||||||||||||||
| IB | 10.00 | (0.01 | ) | (4.89 | ) | (4.90 | ) | – | – | – | (4.90 | ) | 5.10 | ( 49.04 | ) (D) | 19,807 | 1.16 | (E) | 0.61 | (E) | ( 0.62 | ) (E) | – | |||||||||||||||||||||||||||||||||||||
| American Funds Growth HLS Fund | ||||||||||||||||||||||||||||||||||||||||||||||||||||||||||||
| For the Six-Month Period Ended June 30, 2011 (Unaudited) | ||||||||||||||||||||||||||||||||||||||||||||||||||||||||||||
| IB | 9.38 | 0.01 | 0.53 | 0.54 | – | – | – | 0.54 | 9.92 | 5.83 | (D) | 355,029 | 1.03 | (E) | 0.53 | (E) | 0.11 | (E) | 1 | |||||||||||||||||||||||||||||||||||||||||
| For the Year Ended December 31, 2010 | ||||||||||||||||||||||||||||||||||||||||||||||||||||||||||||
| IB | 7.96 | 0.04 | 1.42 | 1.46 | (0.04 | ) | – | (0.04 | ) | 1.42 | 9.38 | 18.36 | 356,162 | 1.05 | 0.55 | 0.43 | 7 | |||||||||||||||||||||||||||||||||||||||||||
| For the Year Ended December 31, 2009(F) | ||||||||||||||||||||||||||||||||||||||||||||||||||||||||||||
| IB | 5.81 | 0.03 | 2.22 | 2.25 | (0.03 | ) | (0.07 | ) | (0.10 | ) | 2.15 | 7.96 | 39.02 | 296,659 | 1.03 | 0.53 | 0.47 | 3 | ||||||||||||||||||||||||||||||||||||||||||
| From (commencement of operations) April 30, 2008 through December 31, 2008 | ||||||||||||||||||||||||||||||||||||||||||||||||||||||||||||
| IB | 10.00 | 0.07 | (4.18 | ) | (4.11 | ) | (0.08 | ) | – | (0.08 | ) | (4.19 | ) | 5.81 | ( 41.18 | ) (D) | 122,888 | 1.03 | (E) | 0.53 | (E) | 3.39 | (E) | – | ||||||||||||||||||||||||||||||||||||
| American Funds Growth-Income HLS Fund | ||||||||||||||||||||||||||||||||||||||||||||||||||||||||||||
| For the Six-Month Period Ended June 30, 2011 (Unaudited) | ||||||||||||||||||||||||||||||||||||||||||||||||||||||||||||
| IB | 9.00 | 0.01 | 0.38 | 0.39 | – | – | – | 0.39 | 9.39 | 4.34 | (D) | 185,898 | 0.98 | (E) | 0.53 | (E) | 0.11 | (E) | 2 | |||||||||||||||||||||||||||||||||||||||||
| For the Year Ended December 31, 2010 | ||||||||||||||||||||||||||||||||||||||||||||||||||||||||||||
| IB | 8.20 | 0.10 | 0.81 | 0.91 | (0.11 | ) | – | (0.11 | ) | 0.80 | 9.00 | 11.11 | 185,836 | 0.99 | 0.54 | 1.19 | 8 | |||||||||||||||||||||||||||||||||||||||||||
| For the Year Ended December 31, 2009(F) | ||||||||||||||||||||||||||||||||||||||||||||||||||||||||||||
| IB | 6.39 | 0.11 | 1.86 | 1.97 | (0.11 | ) | (0.05 | ) | (0.16 | ) | 1.81 | 8.20 | 30.85 | 168,690 | 0.98 | 0.53 | 1.56 | 1 | ||||||||||||||||||||||||||||||||||||||||||
| From (commencement of operations) April 30, 2008 through December 31, 2008 | ||||||||||||||||||||||||||||||||||||||||||||||||||||||||||||
| IB | 10.00 | 0.13 | (3.63 | ) | (3.50 | ) | (0.11 | ) | – | (0.11 | ) | (3.61 | ) | 6.39 | ( 34.98 | ) (D) | 74,039 | 0.99 | (E) | 0.54 | (E) | 5.87 | (E) | – | ||||||||||||||||||||||||||||||||||||
| American Funds International HLS Fund | ||||||||||||||||||||||||||||||||||||||||||||||||||||||||||||
| For the Six-Month Period Ended June 30, 2011 (Unaudited) | ||||||||||||||||||||||||||||||||||||||||||||||||||||||||||||
| IB | 8.96 | 0.01 | 0.37 | 0.38 | – | – | – | 0.38 | 9.34 | 4.26 | (D) | 240,976 | 1.13 | (E) | 0.53 | (E) | 0.07 | (E) | 4 | |||||||||||||||||||||||||||||||||||||||||
| For the Year Ended December 31, 2010 | ||||||||||||||||||||||||||||||||||||||||||||||||||||||||||||
| IB | 8.50 | 0.13 | 0.44 | 0.57 | (0.08 | ) | (0.03 | ) | (0.11 | ) | 0.46 | 8.96 | 6.92 | 235,702 | 1.16 | 0.56 | 1.78 | 7 | ||||||||||||||||||||||||||||||||||||||||||
| For the Year Ended December 31, 2009(F) | ||||||||||||||||||||||||||||||||||||||||||||||||||||||||||||
| IB | 6.09 | 0.11 | 2.48 | 2.59 | (0.11 | ) | (0.07 | ) | (0.18 | ) | 2.41 | 8.50 | 42.75 | 197,258 | 1.13 | 0.53 | 1.53 | 7 | ||||||||||||||||||||||||||||||||||||||||||
| From (commencement of operations) April 30, 2008 through December 31, 2008 | ||||||||||||||||||||||||||||||||||||||||||||||||||||||||||||
| IB | 10.00 | 0.16 | (4.07 | ) | (3.91 | ) | – | – | – | (3.91 | ) | 6.09 | ( 39.10 | ) (D) | 78,825 | 1.14 | (E) | 0.54 | (E) | 8.05 | (E) | – | ||||||||||||||||||||||||||||||||||||||
| ─ Selected Per-Share Data(A) ─ | ─ Ratios and Supplemental Data ─ | |||||||||||||||||||||||||||||||||||||||||||||||||||||||||||
| Net | ||||||||||||||||||||||||||||||||||||||||||||||||||||||||||||
| Realized | ||||||||||||||||||||||||||||||||||||||||||||||||||||||||||||
| and Un- | Distrib- | Net | Ratio of | Ratio of | ||||||||||||||||||||||||||||||||||||||||||||||||||||||||
| Net | realized | Dividends | utions | Increase | Expenses to | Expenses to | Ratio of Net | |||||||||||||||||||||||||||||||||||||||||||||||||||||
| Net Asset | Invest- | Gain | from Net | from | (Decrease) | Net Asset | Average | Average | Investment | |||||||||||||||||||||||||||||||||||||||||||||||||||
| Value at | ment | (Loss) on | Total from | Invest- | Realized | Total | in Net | Value at | Net Assets | Net Assets | Net Assets | Income to | Portfolio | |||||||||||||||||||||||||||||||||||||||||||||||
| Beginning | Income | Invest- | Investment | ment | Capital | Distri- | Asset | End of | Total | at End of | Before | After | Average Net | Turnover | ||||||||||||||||||||||||||||||||||||||||||||||
| Class | of Period | (Loss) | ments | Operations | Income | Gains | butions | Value | Period | Return(B) | Period | Waivers(C) | Waivers(C) | Assets | Rate | |||||||||||||||||||||||||||||||||||||||||||||
| American Funds New World HLS Fund | ||||||||||||||||||||||||||||||||||||||||||||||||||||||||||||
| For the Six-Month Period Ended June 30, 2011 (Unaudited) | ||||||||||||||||||||||||||||||||||||||||||||||||||||||||||||
| IB | $ | 10.24 | $ | 0.04 | $ | 0.05 | $ | 0.09 | $ | – | $ | – | $ | – | $ | 0.09 | $ | 10.33 | 0.91 | %(D) | $ | 67,243 | 1.39 | %(E) | 0.54 | %(E) | 0.54 | %(E) | 5 | % | ||||||||||||||||||||||||||||||
| For the Year Ended December 31, 2010 | ||||||||||||||||||||||||||||||||||||||||||||||||||||||||||||
| IB | 8.80 | 0.11 | 1.42 | 1.53 | (0.09 | ) | – | (0.09 | ) | 1.44 | 10.24 | 17.54 | 72,257 | 1.42 | 0.57 | 1.30 | 12 | |||||||||||||||||||||||||||||||||||||||||||
| For the Year Ended December 31, 2009(F) | ||||||||||||||||||||||||||||||||||||||||||||||||||||||||||||
| IB | 6.00 | 0.10 | 2.84 | 2.94 | (0.08 | ) | (0.06 | ) | (0.14 | ) | 2.80 | 8.80 | 49.14 | 58,578 | 1.40 | 0.55 | 1.44 | 8 | ||||||||||||||||||||||||||||||||||||||||||
| From (commencement of operations) April 30, 2008 through December 31, 2008 | ||||||||||||||||||||||||||||||||||||||||||||||||||||||||||||
| IB | 10.00 | 0.11 | (4.11 | ) | (4.00 | ) | – | – | – | (4.00 | ) | 6.00 | ( 39.97 | ) (D) | 23,933 | 1.44 | (E) | 0.59 | (E) | 5.06 | (E) | 1 | ||||||||||||||||||||||||||||||||||||||
| (A) | Information presented relates to a share outstanding throughout the indicated period. |
| (B) | The figures do not include sales charges or other fees which may be applied at the variable life insurance, variable annuity or qualified retirement plan product level. Any such additional sales charges or other fees would lower the Fund's performance. |
| (C) | Expense ratios do not include expenses of the underlying funds. |
| (D) | Not annualized. |
| (E) | Annualized. |
| (F) | Per share amounts have been calculated using average shares method.. |
| Hartford Series Fund, Inc. |
Directors and Officers (Unaudited) |
The Board of Directors of the Company appoints officers who are responsible for the day-to-day operations of the Funds and who execute policies formulated by the Directors. Each director serves until his or her death, resignation, or retirement or until the next annual meeting of shareholders is held or until his or her successor is elected and qualifies.
Directors and officers who are employed by or who have a financial interest in The Hartford are considered “interested” persons of the Funds pursuant to the 1940 Act. Each officer and two of the Company’s directors, as noted in the chart below, are “interested” persons of the Funds. Each director serves as a director for The Hartford Mutual Funds, Inc., The Hartford Mutual Funds II, Inc., Hartford Series Fund, Inc., and Hartford HLS Series Fund II, Inc., which, as of June 30, 2011, collectively consist of 89 funds. Correspondence may be sent to directors and officers c/o Hartford Mutual Funds, P.O. Box 2999, Hartford, Connecticut 06104-2999, except that correspondence to Ms. Fagely may be sent to 500 Bielenberg Drive, Woodbury, Minnesota 55125.
The table below sets forth, for each director and officer, his or her name, year of birth, current position with the Company and date first elected or appointed to Hartford Series Fund, Inc. (“HSF”), and Hartford HLS Series Fund II, Inc. (“HSF2”), principal occupation, and, for directors, other directorships held. The Funds’ statement of additional information contains further information on the directors and is available free of charge by calling 1-800-862-6668 or writing to Hartford HLS Funds, c/o Individual Annuity Services, P.O. Box 5085, Hartford, CT 06102-5085.
Information on the aggregate remuneration paid to the directors of the Company can be found in the Statement of Operations herein. The Funds pay to The Hartford a portion of the chief compliance officer’s compensation, but do not pay salaries or compensation to any of their other officers or directors who are employed by The Hartford.
Non-Interested Directors
Lynn S. Birdsong (1946) Director since 2003, Co-Chairman of the Investment Committee
Mr. Birdsong is a private investor. Mr. Birdsong currently serves as a Director of the Sovereign High Yield Investment Company (April 2010 to current). Mr. Birdsong currently serves as an Independent Director of Nomura Partners Funds, Inc. (formerly, The Japan Fund) (March 2003 to current). From 2003 to March 2005, Mr. Birdsong was an independent director of the Atlantic Whitehall Funds. From 1979 to 2002, Mr. Birdsong was a managing director of Zurich Scudder Investments, an investment management firm. During his employment with Scudder, Mr. Birdsong was an Interested Director of The Japan Fund. Since 1981, Mr. Birdsong has been a partner in Birdsong Company, an advertising specialty firm.
Robert M. Gavin, Jr. (1940) Director since 2002 (HSF) and 1986 (HSF2), Chairman of the Board since 2004
Dr. Gavin is an educational consultant. Prior to September 1, 2001, he was President of Cranbrook Education Community and prior to July 1996, he was President of Macalester College, St. Paul, Minnesota.
Duane E. Hill (1945) Director since 2001 (HSF) and 2002 (HSF2), Chairman of the Nominating Committee
Mr. Hill is Partner of TSG Ventures L.P., a private equity investment company. Mr. Hill is a former partner of TSG Capital Group, a private equity investment firm that served as sponsor and lead investor in leveraged buyouts of middle market companies.
Sandra S. Jaffee (1941) Director since 2005
Ms. Jaffee served as Chairman (2008 to 2009) and Chief Executive Officer of Fortent (formerly Searchspace Group), a leading provider of compliance/regulatory technology to financial institutions from August 2005 to August 2009. From August 2004 to August 2005, Ms. Jaffee served as an Entrepreneur in Residence with Warburg Pincus, a private equity firm. From September 1995 to July 2004, Ms. Jaffee served as Executive Vice President at Citigroup, where she was President and Chief Executive Officer of Citibank’s Global Securities Services (1995 to 2003). Ms. Jaffe currently serves as a member of the Board of Directors of Broadridge Financial Solutions as well as a Trustee of Muhlenberg College.
William P. Johnston (1944) Director since 2005, Chairman of the Compliance Committee
In June 2006, Mr. Johnston was appointed as Senior Advisor to The Carlyle Group, a global private equity investment firm. In July 2006, Mr. Johnston was elected to the Board of Directors of MultiPlan, Inc. In August 2007, Mr. Johnston was elected to the Board of Directors of LifeCare Holdings, Inc. In February 2008, Mr. Johnston was elected to the Board of Directors of HCR-ManorCare, Inc. In May 2006, Mr. Johnston was elected to the Supervisory Board of Fresenius Medical Care AG & Co. KGaA, after its acquisition of Renal Care Group, Inc. in March 2006. Mr. Johnston joined Renal Care Group in November 2002 as a member of the Board of Directors and served as Chairman of the Board from March 2003 through March 2006. From September 1987 to December 2002, Mr. Johnston was with Equitable Securities Corporation (and its successors, SunTrust Equitable Securities and SunTrust Robinson Humphrey) serving in various investment banking and managerial positions, including Managing Director and Head of Investment Banking, Chief Executive Officer and Vice Chairman.
Phillip O. Peterson (1944) Director since 2002 (HSF) and 2000 (HSF2), Chairman of the Audit Committee
Mr. Peterson is a mutual fund industry consultant. He was a partner of KPMG LLP (an accounting firm) until July 1999. Mr. Peterson joined William Blair Funds in February 2007 as a member of the Board of Trustees. From January 2004 to April 2005, Mr. Peterson served as Independent President of the Strong Mutual Funds.
Lemma W. Senbet (1946) Director since 2005
Dr. Senbet is the William E. Mayer Chair Professor of Finance and Director, Center for Financial Policy, at the University of Maryland, Robert H. Smith School of Business. He was chair of the Finance Department from 1998 to 2006. Previously he was a chaired professor of finance at the University of Wisconsin-Madison. Also, he was director of the Fortis Funds from March 2000 to July 2002. Dr. Senbet served the finance profession in various capacities, including as director of the American Finance Association and President of the Western Finance Association. In 2006, Dr. Senbet was inducted Fellow of Financial Management Association International for his career-long distinguished scholarship and professional service.
Interested Directors and Officers
David N. Levenson (1966) Director since 2010
Mr. Levenson currently serves as President of The Hartford’s Wealth Management business. He was appointed to this role in July 2010. Previously, Mr. Levenson served as Executive Vice President of Legacy Holdings for The Hartford from June 2009 to July 2010. From 2006 to 2009, Mr. Levenson was with Hartford Life Insurance K.K. where he served as President and CEO from 2007 to 2009. He served as Managing Director of Hartford Investment Management Company from 2005 to 2006. Additionally, Mr. Levenson serves as Executive Vice President of The Hartford and as President, Director and Chief Executive Officer of Hartford Life Insurance Company (“HLIC”) and Hartford Life, Inc. (“HL Inc.”).
Lowndes A. Smith (1939) Director since 1996 (HSF) and 2002 (HSF2), Co-Chairman of the Investment Committee
Mr. Smith served as Vice Chairman of The Hartford from February 1997 to January 2002, as President and Chief Executive Officer of HL Inc. from February 1997 to January 2002, and as President and Chief Operating Officer of The Hartford Life Insurance Companies from January 1989 to January 2002. Mr. Smith serves as a Director of White Mountains Insurance Group, Ltd., One Beacon Insurance and Symetra Financial and as a Managing Director of Whittington Gray Associates.
Other Officers
James E. Davey (1964) President and Chief Executive Officer since 2010
Mr. Davey serves as Executive Vice President of HLIC. Additionally, Mr. Davey serves as President, Chief Executive Officer and Manager of Hartford Investment Financial Services, Inc. (“HIFSCO”) and President, Chief Executive Officer and Manager of HL Advisors. Mr. Davey joined The Hartford in 2002.
Tamara L. Fagely (1958) Vice President, Treasurer and Controller since 2002 (HSF) and 1993 (HSF2)
Ms. Fagely has been a Vice President of Hartford Administrative Services Company (“HASCO”) since 1998 and Chief Financial Officer since 2006. Currently Ms. Fagely is a Vice President of HLIC. She served as Assistant Vice President of HLIC from December 2001 through March 2005. In addition, Ms. Fagely is Controller and Chief Financial Officer of HIFSCO.
Susan M. Fleege (1959) AML Compliance Officer since 2011
Ms. Fleege currently serves as a Director of Risk Management at The Hartford. She previously served as AML Compliance Officer for the Fund from 2005-2008. Ms. Fleege joined HLIC in 2005 from Amerprise Financial Corporation where she held the position of Counsel from 2000 to 2005. Ms. Fleege is a certified Anti-Money Laundering Specialist.
Dr. Robert J. Froehlich (1953) Senior Managing Director since 2009
Dr. Froehlich joined The Hartford as Senior Managing Director in September 2009. Prior to joining The Hartford, Dr. Froehlich served as Vice Chairman of Deutsche Asset Management from 1997-2009.
Edward P. Macdonald (1967) Vice President, Secretary and Chief Legal Officer since 2005
Mr. Macdonald serves as Vice President of HLIC and Chief Legal Officer of Mutual Funds and Vice President of HIFSCO. He also serves as Vice President and Secretary of HASCO, and Chief Legal Officer, Secretary and Vice President of HL Advisors. Mr. Macdonald joined The Hartford in 2005.
| Hartford Series Fund, Inc. |
| Directors and Officers (Unaudited) – (continued) |
Vernon J. Meyer (1964) Vice President since 2006
Mr. Meyer serves as Senior Vice President of HLIC. He also serves as Senior Vice President of HIFSCO and HL Advisors. Mr. Meyer joined The Hartford in 2004.
Colleen B. Pernerewski (1969) Vice President and Chief Compliance Officer since 2010
Ms. Pernerewski serves as Vice President and Chief Investment Advisor Compliance Officer of HIFSCO and as Vice President and Chief Compliance Officer of HL Advisors. Ms. Pernerewski joined The Hartford in 2005 from Travelers Life and Annuity where she served as Counsel (2004-2005). Prior to Travelers Life and Annuity, Ms. Pernerewski held the position of Counsel at The Hartford (1998-2004).
Elizabeth L. Schroeder (1966) Vice President since 2010
Ms. Schroeder currently serves as Assistant Vice President of HLIC. Ms. Schroeder joined HLIC in 1991. She is also an Assistant Vice President of HIFSCO and HL Advisers.
Martin Swanson (1962) Vice President since 2010
Mr. Swanson is a Vice President of HLIC. Mr. Swanson also serves as Vice President/Marketing for HIFSCO. Prior to joining HLIC in 1998, Mr. Swanson was a Vice President at PaineWebber, Inc.
Jane Wolak (1961) Vice President since 2009
Ms. Wolak currently serves as Senior Vice President of HLIC. Ms. Wolak joined HLIC as Vice President, Retail Product Services in May 2007. She is also Vice President of HASCO. Previously, Ms. Wolak was with Sun Life Financial where she held the position of Vice President, Service Center Operations from 2001-2007.
HOW TO OBTAIN A COPY OF THE FUND’S PROXY VOTING POLICIES AND VOTING RECORDS (UNAUDITED)
A description of the policies and procedures that the Funds use to determine how to vote proxies relating to portfolio securities and a record of how the Funds voted any proxies for the twelve-month period ended June 30, 2011 are available (1) without charge, upon request, by calling 800-862-6668 and (2) on the SEC’s website at http://www.sec.gov.
QUARTERLY PORTFOLIO HOLDINGS INFORMATION (UNAUDITED)
The Funds file a complete schedule of portfolio holdings with the SEC for the first and third quarters of each fiscal year on Form N-Qs. The Funds’ Forms are available (1) without charge, upon request, by calling 800-862-6668 and (2) on the SEC’s website at http://www.sec.gov. The Form N-Q may be reviewed and copied at the SEC’s Public Reference Room in Washington, DC. Information on the operation of the Public Reference Room may be obtained by calling 1-800-SEC-0330.
| Hartford Series Fund, Inc. |
Expense Example (Unaudited) |
Your Fund's Expenses
As a shareholder of a Fund, you incur two types of costs: (1) transaction costs and (2) ongoing costs including investment management fees, distribution fees, and other fund expenses. This example is intended to help you understand your ongoing costs (in dollars) of investing in a Fund and to compare these costs with the ongoing costs of investing in other mutual funds. The example is based on an investment of $1,000 invested at the beginning of the period and held for the period of December 31, 2010 through June 30, 2011.
Actual Expenses
The first set of columns of the table below provides information about actual account values and actual expenses. You may use the information in this column, together with the amount you invested, to estimate the expenses that you paid over the period. Simply divide your account value by $1,000 (for example, an $8,600 account value divided by $1,000 = 8.6), then multiply the result by the number in the line under the heading entitled “Expenses Paid During Period” to estimate the expenses you paid on your account during this period.
Hypothetical Example for Comparison Purposes
The second set of columns of the table below provides information about hypothetical account values and hypothetical expenses based on a Fund's actual expense ratio and an assumed rate of return of 5% per year before expenses, which is not the Fund's actual return. The hypothetical account values and expenses may not be used to estimate the actual ending account balance or expenses you paid for the period. You may use this information to compare the ongoing costs of investing in a Fund and other funds. To do so, compare this 5% hypothetical example with the 5% hypothetical examples that appear in the shareholder reports of the other funds.
Please note that the expenses shown in the table are meant to highlight your ongoing costs only and do not reflect any transactional costs, such as sales charges (loads) and CDSC. Therefore, the second set of columns of the table is useful in comparing ongoing costs only, and will not help you determine the relative total costs of owning different funds. In addition, if these transactional costs were included, your costs would be higher. Expenses are equal to the Fund's annualized expense ratios multiplied by average account value over the period, multiplied by 181/365 (to reflect the one-half year period).
| Expenses paid | Expenses paid | Days in | ||||||||||||||||||||||||||||||||||
| during the period | during the period | the | Days | |||||||||||||||||||||||||||||||||
| Beginning | Ending | December 31, 2010 | Beginning Account | Ending | December 31, | Annualized | current | in the | ||||||||||||||||||||||||||||
| Account Value | Account Value | through | Value December | Account Value | 2010 through | expense | 1/2 | full | ||||||||||||||||||||||||||||
| December 31, 2010 | June 30, 2011 | June 30, 2011 | 31, 2010 | June 30, 2011 | June 30, 2011 | ratio | year | year | ||||||||||||||||||||||||||||
| American Funds Asset Allocation HLS Fund | ||||||||||||||||||||||||||||||||||||
| Class IB | $ | 1,000.00 | $ | 1,052.57 | $ | 2.70 | $ | 1,000.00 | $ | 1,022.17 | $ | 2.66 | 0.53 | % | 181 | 365 | ||||||||||||||||||||
| American Funds Blue Chip Income and Growth HLS Fund | ||||||||||||||||||||||||||||||||||||
| Class IB | $ | 1,000.00 | $ | 1,035.24 | $ | 2.78 | $ | 1,000.00 | $ | 1,022.07 | $ | 2.76 | 0.55 | % | 181 | 365 | ||||||||||||||||||||
| American Funds Bond HLS Fund | ||||||||||||||||||||||||||||||||||||
| Class IB | $ | 1,000.00 | $ | 1,023.91 | $ | 2.66 | $ | 1,000.00 | $ | 1,022.17 | $ | 2.66 | 0.53 | % | 181 | 365 | ||||||||||||||||||||
| American Funds Global Bond HLS Fund | ||||||||||||||||||||||||||||||||||||
| Class IB | $ | 1,000.00 | $ | 1,041.78 | $ | 2.78 | $ | 1,000.00 | $ | 1,022.07 | $ | 2.76 | 0.55 | % | 181 | 365 | ||||||||||||||||||||
| American Funds Global Growth and Income HLS Fund | ||||||||||||||||||||||||||||||||||||
| Class IB | $ | 1,000.00 | $ | 1,029.83 | $ | 2.67 | $ | 1,000.00 | $ | 1,022.17 | $ | 2.66 | 0.53 | % | 181 | 365 | ||||||||||||||||||||
| American Funds Global Growth HLS Fund | ||||||||||||||||||||||||||||||||||||
| Class IB | $ | 1,000.00 | $ | 1,049.41 | $ | 2.79 | $ | 1,000.00 | $ | 1,022.07 | $ | 2.76 | 0.55 | % | 181 | 365 | ||||||||||||||||||||
| American Funds Global Small Capitalization HLS Fund | ||||||||||||||||||||||||||||||||||||
| Class IB | $ | 1,000.00 | $ | 1,003.88 | $ | 2.68 | $ | 1,000.00 | $ | 1,022.12 | $ | 2.71 | 0.54 | % | 181 | 365 | ||||||||||||||||||||
| American Funds Growth HLS Fund | ||||||||||||||||||||||||||||||||||||
| Class IB | $ | 1,000.00 | $ | 1,058.34 | $ | 2.70 | $ | 1,000.00 | $ | 1,022.17 | $ | 2.66 | 0.53 | % | 181 | 365 | ||||||||||||||||||||
| American Funds Growth-Income HLS Fund | ||||||||||||||||||||||||||||||||||||
| Class IB | $ | 1,000.00 | $ | 1,043.39 | $ | 2.69 | $ | 1,000.00 | $ | 1,022.17 | $ | 2.66 | 0.53 | % | 181 | 365 | ||||||||||||||||||||
| American Funds International HLS Fund | ||||||||||||||||||||||||||||||||||||
| Class IB | $ | 1,000.00 | $ | 1,042.64 | $ | 2.68 | $ | 1,000.00 | $ | 1,022.17 | $ | 2.66 | 0.53 | % | 181 | 365 | ||||||||||||||||||||
| American Funds New World HLS Fund | ||||||||||||||||||||||||||||||||||||
| Class IB | $ | 1,000.00 | $ | 1,009.07 | $ | 2.69 | $ | 1,000.00 | $ | 1,022.12 | $ | 2.71 | 0.54 | % | 181 | 365 | ||||||||||||||||||||
41
| The Hartford | |
| P.O. Box 5085 | |
| Hartford, CT 06102-5085 |
Hartford Series Fund, Inc. is underwritten and distributed by Hartford Securities Distribution Company, Inc.
“The Hartford” is The Hartford Financial Services Group, Inc. and its subsidiaries.
Hartford Series Fund, Inc. inception dates range from 1977 to date. Hartford Series Fund, Inc. is not a subsidiary of The Hartford but is underwritten, distributed by and advised by subsidiaries of The Hartford. Investments in Hartford Series Fund, Inc. are not guaranteed by The Hartford or any other entity.
You should carefully consider investment objectives, risks, and charges and expenses of Hartford HLS Funds before investing. This and other information can be found in the Fund’s prospectus or summary prospectus, which can be obtained by calling 800-862-6668. Please read them carefully before you invest or send money.
AFHLSSAR-11 8-11 | 106632 | Printed in U.S.A ©2011 The Hartford, Hartford, CT 06115 |

A MESSAGE FROM THE PRESIDENT

Dear Fellow Shareholders:
I want to take this opportunity to say thank you for your continued confidence and trust.
We have seen a significant amount of global turbulence in the first half of 2011. Investors have continued to be concerned about the implications of the European sovereign debt crisis, as well as our own high levels of domestic debt. Since January we have witnessed significant political uprisings in the already-volatile Middle East and North Africa region. In addition, the ramifications of Japan's massive earthquake, subsequent tsunami, and nuclear disaster are still being played out in the market.
Although corporate earnings have remained robust, the unemployment picture has been mixed. After adding more than 200,000 jobs from February to April, more recent unemployment reports have shown a pullback in hiring.
While official inflation remains low as measured by the Consumer Price Index (CPI), high oil prices may be indicative of higher inflation in the future. The federal funds rate remains at a historic low, however, the Fed could potentially raise the rate to get it closer to its historical average once the economy strengthens.
Even with these headwinds, domestic, international, and world indices (as measured by the S&P 500, MSCI EAFE and MSCI World) are all up more than 5% through June, 30 2011.
Looking ahead, continued growth in emerging markets is fueling global recovery efforts. Emerging markets comprise about 48 percent of the world’s GDP, and many economists believe they are poised for further expansion. As GDP growth continues in emerging markets, roughly 100 million people are added to the middle class each year. This middle class population growth could potentially drive a considerable shift in consumer purchasing power.
Now that we have reached the midpoint of 2011, perhaps now would be a good time to schedule a meeting with your financial adviser to examine your current investment strategy and determine whether you are on the right track.
| • | Are you concerned about inflation and its effects on your portfolio? |
| • | Is your portfolio prepared for rising interest rates? |
| • | Does your portfolio reflect the global economy with a mix of developed nations and emerging markets? |
Your financial professional’s advice can help you to navigate today’s volatile markets with confidence. You can also rest assured that we will continue to provide you with solid investments and stellar service for the road ahead.
Thank you again for your business.
 |
| James Davey |
| President |
| Hartford HLS Funds |
Hartford Capital Appreciation HLS Fund
| Manager Discussion (Unaudited) | 2 |
| Financial Statements | |
| 5 | |
| 12 | |
| 13 | |
| 14 | |
| 15 | |
| 16 | |
| 26 | |
| 28 | |
| 30 | |
| 30 | |
| 31 |
This report is prepared for the general information of contract owners and qualified retirement plan participants. It is not an offer of contracts or of qualified retirement plans. It should not be used in connection with any offer, except in conjunction with the appropriate product prospectus which contains all pertinent information including the applicable sales, administrative and other charges.
The views expressed in the Fund’s Manager Discussion under ‘‘Why did the Fund perform this way?’’ and ‘‘What is the outlook?’’ are views of the Fund’s sub-adviser and portfolio management team through the end of the reporting period and are subject to change based on market and other conditions.
Hartford Capital Appreciation HLS Fund inception 04/02/1984 | |
(sub-advised by Wellington Management Company, LLP) Investment objective – Seeks growth of capital. | |
Performance Overview 6/30/01 - 6/30/11
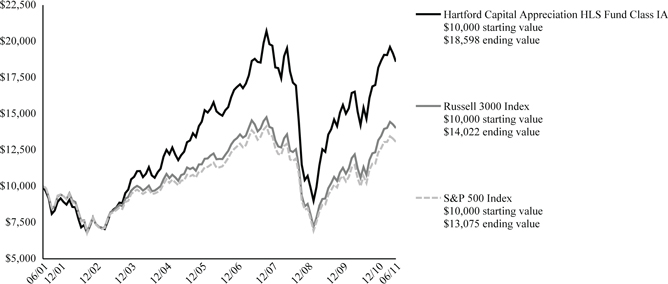
The chart above shows the growth of a $10,000 investment in Class IA. Growth results in classes other than Class IA will vary from what is seen above due to differences in the expenses charged to those share classes.
Average Annual Total Returns (as of 6/30/11) | ||||
6 Month† | 1 Year | 5 year | 10 year | |
| Capital Appreciation IA | 2.25% | 30.77% | 4.40% | 6.40% |
| Capital Appreciation IB | 2.12% | 30.45% | 4.14% | 6.14% |
| Russell 3000 Index | 6.35% | 32.37% | 3.35% | 3.44% |
| S&P 500 Index | 6.01% | 30.68% | 2.94% | 2.72% |
† Not Annualized
PAST PERFORMANCE IS NOT INDICATIVE OF FUTURE RESULTS.
Total returns presented above were calculated using the Fund's net asset value available to shareholders for sale or redemption of Fund shares on June 30, 2011, which excludes investment transactions as of this date.
Russell 3000 Index is an unmanaged index that measures the performance of the 3,000 largest U.S. companies based on total market capitalization.
S&P 500 Index is a market capitalization-weighted price index composed of 500 widely held common stocks.
You cannot invest directly in an index.
The chart represents a hypothetical investment in the Fund. Performance data represents past performance and current performance could be higher or lower.
Performance information may reflect historical or current expense waivers/reimbursements from the investment adviser, without which performance would have been lower. For information on current expense waivers/reimbursements, please see the prospectus.
The value of the fund will fluctuate so that when redeemed, it may be worth more or less than the original investment. The chart and table do not reflect the deductions of taxes, sales charges or other fees which may be applied at the variable life insurance, variable annuity or qualified retirement plan product level. Any such additional sales charges or other fees or expenses would lower the contract’s or plan’s performance.
| Portfolio Managers | ||
| Saul J. Pannell, CFA | Kent M. Stahl, CFA | Peter I. Higgins, CFA |
| Senior Vice President | Senior Vice President | Senior Vice President |
| Director of Investments and Risk Management | ||
| Paul E. Marrkand, CFA | Nicolas M. Choumenkovitch | Donald J. Kilbride |
| Senior Vice President | Senior Vice President | Senior Vice President |
| Stephen Mortimer | David W. Palmer, CFA | Jeffrey L. Kripke |
| Senior Vice President | Senior Vice President | Vice President |
| Francis J. Boggan, CFA* | ||
| Senior Vice President |
How did the Fund perform?
The Class IA shares of the Hartford Capital Appreciation HLS Fund returned 2.25% for the six-month period ended June 30, 2011, underperforming its benchmarks, the Russell 3000 Index, which returned 6.35% and the S&P 500 Index, which returned 6.01% for the same period. The Fund underperformed the 4.93% return of the average fund in the Lipper Large-Cap Core Funds VP-UF peer group, a group of funds with investment strategies similar to those of the Fund.
Why did the Fund perform this way?
The six-month period ended June 30, 2011 was a volatile period. U.S. equities moved higher despite a high degree of volatility caused by mounting concerns about unrest in North Africa and the Middle East and the devastating earthquake and nuclear crisis in Japan. Equities were pushed higher by investors’ enthusiasm for additional government debt purchases by the U.S. Federal Reserve, the extension of tax cuts in the U.S., and strong earnings growth. Fears of a global economic slowdown due to sovereign debt troubles in Europe, Japanese supply disruptions, and concerns about heightened geopolitical risks were not enough to offset optimism about the global economy, a tidal wave of global liquidity, strong corporate earnings, and a continued accommodative U.S. Federal Reserve Board policy. However, equities fell during the last two months of the period as a slowdown in consumer spending and generally negative news on the U.S. economic front triggered a sharp rise in risk aversion.
Equity markets as measured by the Russell 3000 returned (+6%) during the period, with nine of ten sectors within the index posting positive returns. Health Care (+14%), Energy (+11%), and Utilities (+9%) rose the most. Financials was the only sector to post a negative absolute return (i.e. total return) during the period.
The Fund underperformed its benchmark due in part to weak stock selection in the Energy, Consumer Discretionary, and Materials sectors. Underweights (i.e. the Fund’s sector position was less than the benchmark position) to the strong performing Energy and Consumer Staples sectors also detracted from benchmark-relative (i.e. performance of the Fund as measured against the benchmark) returns. Strong stock selection within the Consumer Staples and Health Care sectors aided relative returns, as did an overweight (i.e. the Fund’s sector position was greater than the benchmark position) to Health Care. A modest allocation to cash during the period detracted from relative returns in an upward trending market.
The largest detractors from both absolute and relative returns were Ford (Consumer Discretionary), Sino-Forest (Materials), and Nokia (Information Technology). Shares of automobile and truck manufacturer Ford Motor came under pressure during the period due to results that fell short of expectations as replenishment of the U.S. inventory channel, which boosted prior results, came to an end, and Europe remained weak. China-based commercial forest plantation operator Sino-Forest saw its stock fall after a published report raised several questions with regard to their business practices and asset base. Shares of mobile device manufacturer Nokia fell as management reduced guidance for its Devices & Services segment due to increased competition and a product mix shift toward devices with lower average selling prices and gross margins.
UnitedHealth Group (Health Care), Green Mountain Coffee (Consumer Staples), and Microsoft (Information Technology) were among the top contributors to relative returns. Shares of health care benefits and services provider UnitedHealth rose as the company reported strong fourth quarter 2010 earnings, beating analysts’ estimates, driven in part by reduced use of services by its members. Investors also looked favorably on the increase in enrollments as a potential sign of growth going forward, pushing the stock higher. Green Mountain Coffee, a specialty coffee and brewing systems company, saw its shares soar after the company announced it had formed strategic relationships with Starbucks, Tazo tea, and Dunkin Donuts. An underweight position in poor performing Microsoft was additive to relative performance. Shares of the software development company were pressured in the first quarter of 2011 by concerns that tablets will cannibalize consumer PC and laptop demand. Pfizer (Health Care) was also a top contributor to absolute returns.
What is the outlook?
Looking forward, we are cautiously optimistic about the macroeconomic and valuation backdrop for stocks. As long as the European and U.S. debt crises do not intensify, we believe that continued macroeconomic improvement will overshadow debt
concerns. We generally do not devote much time or energy to forecasting the market's direction from a top-down perspective. Instead, we focus our efforts on identifying attractive stocks from a bottom-up (i.e. stock by stock fundamental research) perspective, using fundamental analysis.
At the end of the period the Fund was most overweight the Information Technology, Materials, and Industrials sectors and most underweight Consumer Staples, Utilities, and Telecommunication Services sectors relative to its benchmark. The Fund’s largest absolute sector weights were in the Information Technology, Financials, and Industrials sectors.
*Effective July 15, 2011, Francis J. Boggan will replace Jeffrey L. Kripke as a member of the portfolio management and securities analysis team of the Hartford Capital Appreciation HLS Fund.
| Diversification by Industry | ||||
| as of June 30, 2011 | ||||
| Percentage of | ||||
| Industry (Sector) | Net Assets | |||
| Equity Securities | ||||
Automobiles & Components (Consumer Discretionary) | 4.8 | % | ||
| Banks (Financials) | 4.9 | |||
| Capital Goods (Industrials) | 8.9 | |||
Commercial & Professional Services (Industrials) | 0.2 | |||
Consumer Durables & Apparel (Consumer Discretionary) | 1.3 | |||
| Consumer Services (Consumer Discretionary) | 1.5 | |||
| Diversified Financials (Financials) | 7.2 | |||
| Energy (Energy) | 11.9 | |||
| Food & Staples Retailing (Consumer Staples) | 1.9 | |||
Food, Beverage & Tobacco (Consumer Staples) | 3.6 | |||
Health Care Equipment & Services (Health Care) | 3.6 | |||
Household & Personal Products (Consumer Staples) | 0.4 | |||
| Insurance (Financials) | 2.9 | |||
| Materials (Materials) | 6.2 | |||
| Media (Consumer Discretionary) | 1.3 | |||
| Other Investment Pools and Funds (Financials) | 0.3 | |||
Pharmaceuticals, Biotechnology & Life Sciences (Health Care) | 7.9 | |||
| Real Estate (Financials) | 0.3 | |||
| Retailing (Consumer Discretionary) | 3.6 | |||
Semiconductors & Semiconductor Equipment (Information Technology) | 4.7 | |||
| Software & Services (Information Technology) | 7.9 | |||
Technology Hardware & Equipment (Information Technology) | 6.6 | |||
| Telecommunication Services (Services) | 1.4 | |||
| Transportation (Industrials) | 3.8 | |||
| Utilities (Utilities) | 0.5 | |||
| Total | 97.6 | % | ||
| Fixed Income Securities | ||||
| Finance and Insurance (Finance) | 0.3 | % | ||
| Total | 0.3 | % | ||
| Short-Term Investments | 2.1 | % | ||
| Other Assets and Liabilities | – | |||
| Total | 100.0 | % | ||
| Diversification by Country | ||||
| as of June 30, 2011 | ||||
| Percentage of | ||||
| Country | Net Assets | |||
| Australia | 0.2 | % | ||
| Belgium | 0.8 | |||
| Brazil | 1.9 | |||
| Canada | 2.0 | |||
| China | 0.6 | |||
| Denmark | 0.2 | |||
| Finland | 0.7 | |||
| France | 1.7 | |||
| Germany | 0.6 | |||
| Greece | 0.0 | |||
| Hong Kong | 0.6 | |||
| India | 1.1 | |||
| Ireland | 0.4 | |||
| Israel | 1.7 | |||
| Italy | 0.4 | |||
| Japan | 3.6 | |||
| Jersey | 0.4 | |||
| Luxembourg | 0.1 | |||
| Malaysia | 0.0 | |||
| Mexico | 0.1 | |||
| Netherlands | 0.8 | |||
| Norway | 0.6 | |||
| Russia | 0.6 | |||
| Singapore | 0.3 | |||
| South Africa | 0.3 | |||
| Spain | 0.1 | |||
| Sweden | 0.1 | |||
| Switzerland | 2.6 | |||
| Taiwan | 1.8 | |||
| United Kingdom | 4.6 | |||
| United States | 69.0 | |||
| Short-Term Investments | 2.1 | |||
| Other Assets and Liabilities | - | |||
| Total | 100.0 | % | ||
| Hartford Capital Appreciation HLS Fund |
Schedule of Investments June 30, 2011 (Unaudited) |
| (000’s Omitted) |
| Shares or Principal Amount | Market Value ╪ | ||||||
| COMMON STOCKS - 97.3% | |||||||
| Automobiles & Components - 4.8% | |||||||
| 182 | Daimler AG | $ | 13,699 | ||||
| 742 | Dana Holding Corp. ● | 13,570 | |||||
| 19,067 | Ford Motor Co. ● | 262,929 | |||||
| 299 | General Motors Co. ● | 9,084 | |||||
| 265 | Gentex Corp. | 8,017 | |||||
| 2,076 | Goodyear Tire & Rubber Co. ● | 34,813 | |||||
| 686 | Johnson Controls, Inc. | 28,563 | |||||
| 1,168 | Modine Manufacturing Co. ● | 17,950 | |||||
| 708 | Stoneridge, Inc. ● | 10,432 | |||||
| 1,192 | TRW Automotive Holdings Corp. ● | 70,363 | |||||
| 165 | Yamaha Motor Co., Ltd. | 3,028 | |||||
| 472,448 | |||||||
| Banks - 4.9% | |||||||
| 2,574 | Banco Santander Brasil S.A. | 30,145 | |||||
| 999 | Barclays Bank plc | 4,097 | |||||
| 688 | BB&T Corp. | 18,459 | |||||
| 610 | DNB Nor ASA | 8,501 | |||||
| 188 | Itau Unibanco Banco Multiplo S.A. ADR | 4,439 | |||||
| 1,352 | MGIC Investment Corp. ● | 8,043 | |||||
| 19,372 | Mitsubishi UFJ Financial Group, Inc. | 94,408 | |||||
| 224 | PNC Financial Services Group, Inc. | 13,359 | |||||
| 2,492 | Radian Group, Inc. | 10,542 | |||||
| 2,225 | Standard Chartered plc | 58,436 | |||||
| 714 | State Bank of India | 38,497 | |||||
| 6,727 | Wells Fargo & Co. | 188,770 | |||||
| 477,696 | |||||||
| Capital Goods - 8.9% | |||||||
| 62 | ABB Ltd. ADR | 1,613 | |||||
| 498 | Assa Abloy Ab | 13,379 | |||||
| 58 | Boeing Co. | 4,273 | |||||
| 103 | Caterpillar, Inc. | 10,931 | |||||
| 8,981 | Changsha Zoomlion Heavy Industry Science and Technology Co., Ltd. | 17,195 | |||||
| 75 | Dover Corp. | 5,064 | |||||
| 41 | Fanuc Corp. | 6,906 | |||||
| 3,245 | Fiat Industrial S.p.A. ● | 41,914 | |||||
| 61 | Flowserve Corp. | 6,725 | |||||
| 80 | FLSmidth & Co. A/S | 6,789 | |||||
| 152 | Fluor Corp. | 9,809 | |||||
| 190 | Foster Wheeler AG ● | 5,778 | |||||
| 458 | General Dynamics Corp. | 34,102 | |||||
| 8,309 | General Electric Co. | 156,713 | |||||
| 117 | Goodrich Corp. | 11,207 | |||||
| 1,122 | Honeywell International, Inc. | 66,838 | |||||
| 58 | Illinois Tool Works, Inc. | 3,255 | |||||
| 171 | Ingersoll-Rand plc | 7,774 | |||||
| 10,641 | Itochu Corp. | 110,674 | |||||
| 60 | Joy Global, Inc. | 5,743 | |||||
| 169 | JS Group Corp. | 4,362 | |||||
| 148 | Kone Oyj Class B | 9,322 | |||||
| 120 | L-3 Communications Holdings, Inc. | 10,465 | |||||
| 105 | Lockheed Martin Corp. | 8,521 | |||||
| 652 | Meritor, Inc. ● | 10,463 | |||||
| 93 | Moog, Inc. Class A ● | 4,067 | |||||
| 748 | Navistar International Corp. ● | 42,233 | |||||
| 434 | Northrop Grumman Corp. | 30,078 | |||||
| 223 | PACCAR, Inc. | 11,418 | |||||
| 89 | Parker-Hannifin Corp. | 8,025 | |||||
| 189 | Pentair, Inc. | 7,645 | |||||
| 120 | Precision Castparts Corp. | 19,750 | |||||
| 174 | Raytheon Co. | 8,649 | |||||
| 967 | Safran S.A. | 41,244 | |||||
| 2,172 | Sany Heavy Equipment International Holdings Co., Ltd. | 2,484 | |||||
| 85 | Schneider Electric S.A. | 14,181 | |||||
| 1,397 | Tata Motors Ltd. | 31,189 | |||||
| 120 | United Rentals, Inc. ● | 3,051 | |||||
| 580 | Vallourec | 70,738 | |||||
| 47 | W.W. Grainger, Inc. | 7,222 | |||||
| 153 | WESCO International, Inc. ● | 8,292 | |||||
| 880,081 | |||||||
| Commercial & Professional Services - 0.2% | |||||||
| 222 | Edenred | 6,778 | |||||
| 469 | Experian plc | 5,969 | |||||
| 95 | Manpower, Inc. | 5,092 | |||||
| 17,839 | |||||||
| Consumer Durables & Apparel - 1.3% | |||||||
| 789 | Anta Sports Products Ltd. | 1,415 | |||||
| 1,245 | Brunswick Corp. | 25,390 | |||||
| 164 | Burberry Group plc | 3,816 | |||||
| 48 | CIE Financiere Richemont S.A. | 3,150 | |||||
| 184 | Coach, Inc. | 11,776 | |||||
| 1,161 | Furniture Brands International, Inc. ● | 4,807 | |||||
| 274 | Hanesbrands, Inc. ● | 7,823 | |||||
| 64 | Lululemon Athletica, Inc. ● | 7,138 | |||||
| 24 | LVMH Moet Hennessy Louis Vuitton S.A. | 4,242 | |||||
| 716 | Mattel, Inc. | 19,677 | |||||
| 261 | Pandora A/S | 8,207 | |||||
| 1,465 | PDG Realty S.A. | 8,249 | |||||
| 150 | Tempur-Pedic International, Inc. ● | 10,153 | |||||
| 95 | Under Armour, Inc. Class A ● | 7,306 | |||||
| 1,629 | Xtep International Holdings Ltd. | 1,110 | |||||
| 124,259 | |||||||
| Consumer Services - 1.5% | |||||||
| 127 | Apollo Group, Inc. Class A ● | 5,558 | |||||
| 292 | Carnival Corp. | 10,988 | |||||
| 120 | Coinstar, Inc. ● | 6,558 | |||||
| 388 | Compass Group plc | 3,745 | |||||
| 100 | Ctrip.com International Ltd. ADR ● | 4,287 | |||||
| 159 | DeVry, Inc. | 9,377 | |||||
| 1,621 | Educomp Solutions Ltd. | 14,248 | |||||
| 198 | ITT Educational Services, Inc. ● | 15,470 | |||||
| 347 | Marriott International, Inc. Class A | 12,318 | |||||
| 709 | MGM Resorts International ● | 9,361 | |||||
| 35 | New Oriental Education & Technology Group, Inc. ADR ● | 3,900 | |||||
| 232 | Starbucks Corp. | 9,150 | |||||
| 55 | Strayer Education, Inc. | 6,997 | |||||
| 1,512 | Thomas Cook Group plc | 3,230 | |||||
| 127 | Weight Watchers International, Inc. | 9,585 | |||||
| 1,207 | Wynn Macau Ltd. | 3,954 | |||||
| 293 | Yum! Brands, Inc. | 16,169 | |||||
| 144,895 | |||||||
| Diversified Financials - 7.2% | |||||||
| 301 | Ameriprise Financial, Inc. | 17,388 | |||||
| 4,687 | Bank of America Corp. | 51,372 | |||||
| 149 | BlackRock, Inc. | 28,541 | |||||
| 381 | Cetip S.A. - Balcao Organizado | 5,877 | |||||
The accompanying notes are an integral part of these financial statements.
| Hartford Capital Appreciation HLS Fund |
Schedule of Investments – (continued) June 30, 2011 (Unaudited) |
| (000’s Omitted) |
| Shares or Principal Amount | Market Value ╪ | ||||||
| COMMON STOCKS - 97.3% - (continued) | |||||||
| Diversified Financials - 7.2% - (continued) | |||||||
| 4 | Cetip S.A. - Balcao Organizado - Receipt Shares ⌂● | $ | 56 | ||||
| 1,277 | Citigroup, Inc. | 53,192 | |||||
| 296 | Credit Suisse Group AG | 11,548 | |||||
| 892 | Goldman Sachs Group, Inc. | 118,749 | |||||
| 54 | Hong Kong Exchanges & Clearing Ltd. | 1,130 | |||||
| 4,612 | ING Groep N.V. ● | 56,830 | |||||
| 6,396 | JP Morgan Chase & Co. | 261,864 | |||||
| 298 | Justice Holdings Ltd. ● | 4,692 | |||||
| 153 | LPL Investment Holdings, Inc. ● | 5,224 | |||||
| 605 | Nasdaq OMX Group, Inc. ● | 15,312 | |||||
| 1,320 | Nomura Holdings, Inc. | 6,512 | |||||
| 119 | Oaktree Capital ■● | 6,020 | |||||
| 225 | PHH Corp. ● | 4,609 | |||||
| 75 | Solar Cayman Ltd. ⌂●† | 7 | |||||
| 1,339 | UBS AG | 24,444 | |||||
| 2,063 | UBS AG ADR ● | 37,676 | |||||
| 711,043 | |||||||
| Energy - 11.9% | |||||||
| 622 | Alpha Natural Resources, Inc. ● | 28,264 | |||||
| 541 | Anadarko Petroleum Corp. | 41,548 | |||||
| 91 | Apache Corp. | 11,261 | |||||
| 52 | Baker Hughes, Inc. | 3,763 | |||||
| 903 | BG Group plc | 20,495 | |||||
| 175 | Bourbon S.A. | 7,603 | |||||
| 2,515 | BP plc ADR | 111,401 | |||||
| 70 | Cameron International Corp. ● | 3,544 | |||||
| 267 | Canadian Natural Resources Ltd. ADR | 11,194 | |||||
| 3,638 | Chesapeake Energy Corp. | 107,998 | |||||
| 141 | Chevron Corp. | 14,492 | |||||
| 27 | China Petroleum & Chemical Corp. ADR | 2,717 | |||||
| 1,150 | Cobalt International Energy ● | 15,668 | |||||
| 1,221 | Consol Energy, Inc. | 59,188 | |||||
| 68 | Diamond Offshore Drilling, Inc. | 4,779 | |||||
| 1,388 | ENSCO International plc | 73,999 | |||||
| 278 | EOG Resources, Inc. | 29,065 | |||||
| 938 | Exxon Mobil Corp. | 76,310 | |||||
| 279 | Frontline Ltd. | 4,071 | |||||
| 281 | Hornbeck Offshore Services, Inc. ● | 7,715 | |||||
| 1,238 | Imperial Oil Ltd. | 57,678 | |||||
| 2 | Inpex Corp. | 15,895 | |||||
| 1,847 | Karoon Gas Australia Ltd. ● | 10,412 | |||||
| 134 | Kior, Inc. ● | 2,026 | |||||
| 345 | Lone Pine Resources, Inc. ● | 3,662 | |||||
| 554 | Noble Corp. | 21,837 | |||||
| 4,117 | OAO Gazprom Class S ADR | 60,024 | |||||
| 116 | Occidental Petroleum Corp. | 12,120 | |||||
| 113 | Overseas Shipholding Group, Inc. | 3,042 | |||||
| 342 | Peabody Energy Corp. | 20,130 | |||||
| 6,644 | PetroChina Co., Ltd. | 9,759 | |||||
| 3,453 | Petroleo Brasileiro S.A. ADR | 116,903 | |||||
| 472 | Petroleum Geo-Services ● | 6,739 | |||||
| 488 | Pioneer Natural Resources Co. | 43,683 | |||||
| 262 | Reliance Industries Ltd. GDR ■ | 10,530 | |||||
| 159 | Royal Dutch Shell plc ADR | 11,298 | |||||
| 500 | Southwestern Energy Co. ● | 21,431 | |||||
| 283 | Statoilhydro ASA ADR | 7,204 | |||||
| 910 | Suncor Energy, Inc. | 35,577 | |||||
| 28 | Technip S.A. | 2,960 | |||||
| 105 | TGS Nopec Geophysical Co. ASA | 2,942 | |||||
| 445 | Tsakos Energy Navigation Ltd. | 4,446 | |||||
| 609 | Ultra Petroleum Corp. ● | 27,913 | |||||
| 104 | Valero Energy Corp. | 2,658 | |||||
| 190 | Vallares ● | 3,071 | |||||
| 226 | Venoco, Inc. ● | 2,883 | |||||
| 215 | Whiting Petroleum Corp. ● | 12,261 | |||||
| 111 | Woodside Petroleum Ltd. | 4,918 | |||||
| 1,169,077 | |||||||
| Food & Staples Retailing - 1.9% | |||||||
| 3,686 | CVS/Caremark Corp. | 138,536 | |||||
| 11,352 | Olam International Ltd. | 25,236 | |||||
| 617 | Sysco Corp. | 19,238 | |||||
| 82 | Whole Foods Market, Inc. | 5,190 | |||||
| 188,200 | |||||||
| Food, Beverage & Tobacco - 3.6% | |||||||
| 657 | Anheuser-Busch InBev N.V. | 38,124 | |||||
| 470 | Archer Daniels Midland Co. | 14,177 | |||||
| 6,715 | China Agri-Industries Holdings | 7,135 | |||||
| 254 | Green Mountain Coffee Roasters, Inc. ● | 22,634 | |||||
| 672 | Grupo Modelo S.A.B. | 4,065 | |||||
| 1,115 | Imperial Tobacco Group plc | 37,117 | |||||
| 1 | Japan Tobacco, Inc. | 5,524 | |||||
| 3,680 | Kraft Foods, Inc. | 129,636 | |||||
| 669 | Maple Leaf Foods, Inc. | 8,253 | |||||
| 384 | Molson Coors Brewing Co. | 17,184 | |||||
| 652 | PepsiCo, Inc. | 45,900 | |||||
| 167 | Philip Morris International, Inc. | 11,174 | |||||
| 161 | Sanderson Farms, Inc. | 7,684 | |||||
| 366 | Tyson Foods, Inc. Class A | 7,098 | |||||
| 355,705 | |||||||
| Health Care Equipment & Services - 3.6% | |||||||
| 132 | Aetna, Inc. | 5,811 | |||||
| 109 | Amerisource Bergen Corp. | 4,518 | |||||
| 548 | Cardinal Health, Inc. | 24,877 | |||||
| 6,532 | CareView Communications, Inc. ● | 11,299 | |||||
| 228 | CIGNA Corp. | 11,708 | |||||
| 1,049 | Covidien plc | 55,825 | |||||
| 139 | Edwards Lifesciences Corp. ● | 12,132 | |||||
| 220 | Express Scripts, Inc. ● | 11,871 | |||||
| 105 | Gen-Probe, Inc. ● | 7,247 | |||||
| 576 | Hologic, Inc. ● | 11,626 | |||||
| 10 | Intuitive Surgical, Inc. ● | 3,836 | |||||
| 46 | Laboratory Corp. of America Holdings ● | 4,450 | |||||
| 1,146 | Medtronic, Inc. | 44,157 | |||||
| 102 | St. Jude Medical, Inc. | 4,849 | |||||
| 122 | SXC Health Solutions Corp. ● | 7,188 | |||||
| 2,419 | UnitedHealth Group, Inc. | 124,749 | |||||
| 76 | Wellpoint, Inc. | 5,971 | |||||
| 352,114 | |||||||
| Household & Personal Products - 0.4% | |||||||
| 104 | Beiersdorf AG | 6,751 | |||||
| 256 | Colgate-Palmolive Co. | 22,379 | |||||
| 168 | Reckitt Benckiser Group plc | 9,255 | |||||
| 38,385 | |||||||
| Insurance - 2.9% | |||||||
| 316 | ACE Ltd. | 20,774 | |||||
| 1,986 | Ageas | 5,379 | |||||
| 4,165 | AIA Group Ltd. ● | 14,499 | |||||
The accompanying notes are an integral part of these financial statements.
| Shares or Principal Amount | Market Value ╪ | ||||||
| COMMON STOCKS - 97.3% - (continued) | |||||||
| Insurance - 2.9% - (continued) | |||||||
| 1,786 | American International Group, Inc. ● | $ | 52,351 | ||||
| 419 | AON Corp. | 21,487 | |||||
| 564 | Assured Guaranty Ltd. | 9,192 | |||||
| 183 | Everest Re Group Ltd. | 14,938 | |||||
| 633 | Fidelity National Financial, Inc. | 9,957 | |||||
| 929 | Genworth Financial, Inc. ● | 9,545 | |||||
| 1,395 | Marsh & McLennan Cos., Inc. | 43,498 | |||||
| 185 | Platinum Underwriters Holdings Ltd. | 6,143 | |||||
| 233 | Principal Financial Group, Inc. | 7,083 | |||||
| 620 | Prudential plc | 7,155 | |||||
| 218 | Reinsurance Group of America, Inc. | 13,253 | |||||
| 97 | StanCorp Financial Group, Inc. | 4,101 | |||||
| 324 | Swiss Re Ltd. ● | 18,185 | |||||
| 825 | Unum Group | 21,011 | |||||
| 37 | Zurich Financial Services AG | 9,323 | |||||
| 287,874 | |||||||
| Materials - 6.2% | |||||||
| 51 | Agnico Eagle Mines Ltd. | 3,211 | |||||
| 148 | Allegheny Technologies, Inc. | 9,374 | |||||
| 663 | AngloGold Ltd. ADR | 27,906 | |||||
| 455 | Antofagasta | 10,185 | |||||
| 177 | ArcelorMittal ADR | 6,151 | |||||
| 265 | Barrick Gold Corp. | 12,011 | |||||
| 167 | BASF SE | 16,349 | |||||
| 174 | Bumi plc ● | 3,244 | |||||
| 329 | Cemex S.A. de C.V. ADR ● | 2,832 | |||||
| 36 | CF Industries Holdings, Inc. | 5,106 | |||||
| 38 | Cliff's Natural Resources, Inc. | 3,470 | |||||
| 1,007 | CRH plc | 22,444 | |||||
| 4,378 | Dow Chemical Co. | 157,596 | |||||
| 33 | First Quantum Minerals Ltd. | 4,855 | |||||
| 544 | Fortescue Metals Group Ltd. | 3,730 | |||||
| 30 | Freeport-McMoRan Copper & Gold, Inc. | 1,576 | |||||
| 5,491 | Glencore International plc ● | 43,268 | |||||
| 99 | HeidelbergCement AG | 6,333 | |||||
| 12,186 | Huabao International Holdings Ltd. | 11,087 | |||||
| 224 | JSR Corp. | 4,344 | |||||
| 1,570 | Louisiana-Pacific Corp. ● | 12,776 | |||||
| 584 | Methanex Corp. ADR | 18,330 | |||||
| 1,188 | Mosaic Co. | 80,492 | |||||
| 49 | Nitto Denko Corp. | 2,488 | |||||
| 806 | Norbord, Inc. ● | 10,116 | |||||
| 212 | Nucor Corp. | 8,752 | |||||
| 967 | Owens-Illinois, Inc. ● | 24,963 | |||||
| 1,939 | Petronas Chemicals Group Bhd. ● | 4,561 | |||||
| 253 | Potash Corp. of Saskatchewan, Inc. | 14,424 | |||||
| 114 | Rio Tinto plc | 8,258 | |||||
| 207 | Rio Tinto plc ADR | 14,938 | |||||
| 1,856 | Sino Forest Corp. Class A ● | 6,159 | |||||
| 685 | Tata Steel Ltd. | 9,383 | |||||
| 105 | Teck Cominco Ltd. Class B | 5,306 | |||||
| 1,844 | TSRC Corp. | 5,440 | |||||
| 138 | Umicore | 7,544 | |||||
| 95 | Vulcan Materials Co. | 3,667 | |||||
| 24 | Walter Energy, Inc. | 2,729 | |||||
| 361 | Xstrata plc | 7,941 | |||||
| 110 | Yamato Kogyo Co. | 3,431 | |||||
| 606,770 | |||||||
| Media - 1.3% | |||||||
| 352 | CBS Corp. Class B | 10,039 | |||||
| 1,334 | Comcast Corp. Class A | 33,800 | |||||
| 389 | Comcast Corp. Special Class A | 9,429 | |||||
| 607 | DirecTV Class A ● | 30,857 | |||||
| 30 | Harvey Weinstein Co Holdings Class A-1 ⌂●† | – | |||||
| 1,476 | News Corp. Class A | 26,131 | |||||
| 142 | Omnicom Group, Inc. | 6,857 | |||||
| 163 | Publicis Groupe | 9,094 | |||||
| 156 | Walt Disney Co. | 6,090 | |||||
| 132,297 | |||||||
| Pharmaceuticals, Biotechnology & Life Sciences - 7.9% | |||||||
| 1,201 | Agilent Technologies, Inc. ● | 61,368 | |||||
| 479 | Almirall S.A. | 5,127 | |||||
| 1,085 | Amgen, Inc. ● | 63,296 | |||||
| 117 | Amylin Pharmaceuticals, Inc. ● | 1,566 | |||||
| 302 | AstraZeneca plc | 15,076 | |||||
| 73 | AstraZeneca plc ADR | 3,670 | |||||
| 139 | Auxilium Pharmaceuticals, Inc. ● | 2,717 | |||||
| 1,309 | Avanir Pharmaceuticals ● | 4,399 | |||||
| 142 | Bruker Corp. ● | 2,897 | |||||
| 1,139 | Celgene Corp. ● | 68,698 | |||||
| 2,291 | Daiichi Sankyo Co., Ltd. | 44,763 | |||||
| 756 | Elan Corp. plc ADR ● | 8,594 | |||||
| 319 | Gilead Sciences, Inc. ● | 13,213 | |||||
| 426 | Map Pharmaceuticals, Inc. ● | 6,803 | |||||
| 941 | Merck & Co., Inc. | 33,190 | |||||
| 5,081 | Novavax, Inc. ● | 10,263 | |||||
| 869 | Pfizer, Inc. | 17,911 | |||||
| 234 | Pharmaceutical Product Development, Inc. | 6,292 | |||||
| 827 | Roche Holding AG | 138,388 | |||||
| 67 | Salix Pharmaceuticals Ltd. ● | 2,677 | |||||
| 1,754 | Shionogi & Co., Ltd. | 28,719 | |||||
| 3,303 | Teva Pharmaceutical Industries Ltd. ADR | 159,271 | |||||
| 424 | Thermo Fisher Scientific, Inc. ● | 27,308 | |||||
| 723 | UCB S.A. | 32,505 | |||||
| 166 | Waters Corp. ● | 15,851 | |||||
| 450 | WuXi PharmaTech Cayman, Inc. ● | 7,897 | |||||
| 782,459 | |||||||
| Real Estate - 0.3% | |||||||
| 2,290 | Hang Lung Properties Ltd. | 9,416 | |||||
| 161 | HCP, Inc. | 5,925 | |||||
| 299 | Plum Creek Timber Co., Inc. | 12,123 | |||||
| 27,464 | |||||||
| Retailing - 3.6% | |||||||
| 38 | Advance Automotive Parts, Inc. | 2,234 | |||||
| 112 | Amazon.com, Inc. ● | 22,964 | |||||
| 1,490 | Belle International Holdings Ltd. | 3,149 | |||||
| 29,055 | Buck Holdings L.P. ⌂●† | 71,902 | |||||
| 187 | CarMax, Inc. ● | 6,168 | |||||
| 974 | China ZhengTong Automotive Services Holdings Ltd. ● | 1,118 | |||||
| 95 | Dick's Sporting Goods, Inc. ● | 3,656 | |||||
| 87 | Expedia, Inc. | 2,528 | |||||
| 350 | Express, Inc. | 7,634 | |||||
| 1,074 | Golden Eagle Retail Group Ltd. | 2,734 | |||||
| 117 | Guess?, Inc. | 4,900 | |||||
| 498 | Kohl's Corp. | 24,896 | |||||
| 1,992 | Lowe's Co., Inc. | 46,427 | |||||
| 31 | Netflix, Inc. ● | 8,091 | |||||
| 230 | Nordstrom, Inc. | 10,810 | |||||
The accompanying notes are an integral part of these financial statements.
| Hartford Capital Appreciation HLS Fund |
Schedule of Investments – (continued) June 30, 2011 (Unaudited) |
| (000’s Omitted) |
| Shares or Principal Amount | Market Value ╪ | ||||||
| COMMON STOCKS - 97.3% - (continued) | |||||||
| Retailing - 3.6% - (continued) | |||||||
| 1,847 | Ontime Department Store | $ | 3,146 | ||||
| 21 | Priceline.com, Inc. ● | 10,980 | |||||
| 101 | Ross Stores, Inc. | 8,108 | |||||
| 3,032 | Sa Sa International Holdings Ltd. | 1,944 | |||||
| 186 | Start Today Co., Ltd. | 3,719 | |||||
| 585 | Target Corp. | 27,428 | |||||
| 1,538 | TJX Cos., Inc. | 80,815 | |||||
| 355,351 | |||||||
| Semiconductors & Semiconductor Equipment - 4.7% | |||||||
| 1,039 | Altera Corp. | 48,154 | |||||
| 486 | Analog Devices, Inc. | 19,035 | |||||
| 684 | ASML Holding N.V. ADR | 25,288 | |||||
| 1,879 | Avago Technologies Ltd. | 71,391 | |||||
| 1,927 | Broadcom Corp. Class A | 64,810 | |||||
| 148 | Cavium, Inc. ● | 6,434 | |||||
| 507 | Cree, Inc. ● | 17,023 | |||||
| 263 | Cypress Semiconductor Corp. | 5,562 | |||||
| 170 | Freescale Semiconductor Holdings Ltd. ● | 3,123 | |||||
| 460 | Intersil Corp. | 5,913 | |||||
| 550 | Maxim Integrated Products, Inc. | 14,066 | |||||
| 841 | Micron Technology, Inc. ● | 6,292 | |||||
| 1,994 | NVIDIA Corp. ● | 31,777 | |||||
| 187 | NXP Semiconductors N.V. ● | 5,009 | |||||
| 427 | Skyworks Solutions, Inc. ● | 9,820 | |||||
| 3,657 | Taiwan Semiconductor Manufacturing Co., Ltd. ADR | 46,116 | |||||
| 1,595 | Texas Instruments, Inc. | 52,374 | |||||
| 769 | Xilinx, Inc. | 28,044 | |||||
| 460,231 | |||||||
| Software & Services - 7.9% | |||||||
| 2,328 | Activision Blizzard, Inc. | 27,186 | |||||
| 136 | Adobe Systems, Inc. ● | 4,281 | |||||
| 898 | Alibaba.com Ltd. | 1,436 | |||||
| 77 | AsiaInfo-Linkage, Inc. ● | 1,277 | |||||
| 367 | Automatic Data Processing, Inc. | 19,316 | |||||
| 23 | Baidu, Inc. ADR ● | 3,286 | |||||
| 96 | BMC Software, Inc. ● | 5,249 | |||||
| 406 | Booz Allen Hamilton Holding Corp. ● | 7,755 | |||||
| 637 | Cadence Design Systems, Inc. ● | 6,731 | |||||
| 93 | Check Point Software Technologies Ltd. ADR ● | 5,299 | |||||
| 152 | Citrix Systems, Inc. ● | 12,169 | |||||
| 136 | Concur Technologies, Inc. ● | 6,789 | |||||
| 58 | DeNa Co., Ltd. | 2,505 | |||||
| 3,361 | eBay, Inc. ● | 108,466 | |||||
| 162 | Fiserv, Inc. ● | 10,152 | |||||
| 159 | Google, Inc. ● | 80,687 | |||||
| 189 | IAC/Interactive Corp. ● | 7,231 | |||||
| 599 | IBM Corp. | 102,704 | |||||
| 1,734 | Kit Digital, Inc. ● | 20,700 | |||||
| 108 | Longtop Financial Technologies Ltd. ⌂●† | 1,024 | |||||
| 2,015 | Microsoft Corp. | 52,386 | |||||
| 26 | MicroStrategy, Inc. ● | 4,197 | |||||
| 31 | Netease.com, Inc. ● | 1,393 | |||||
| 5,185 | Oracle Corp. | 170,636 | |||||
| 190 | Paychex, Inc. | 5,844 | |||||
| 165 | QLIK Technologies, Inc. ● | 5,610 | |||||
| 90 | S.p.A. ADR | 5,473 | |||||
| 66 | Salesforce.com, Inc. ● | 9,803 | |||||
| 126 | SAP AG | 7,628 | |||||
| 26 | Sohu.com, Inc. ● | 1,882 | |||||
| 137 | Teradata Corp. ● | 8,235 | |||||
| 245 | Tibco Software, Inc. ● | 7,122 | |||||
| 909 | TiVo, Inc. ● | 9,356 | |||||
| 2,766 | Western Union Co. | 55,410 | |||||
| 779,218 | |||||||
| Technology Hardware & Equipment - 6.6% | |||||||
| 129 | Acme Packet, Inc. ● | 9,061 | |||||
| 218 | ADTRAN, Inc. | 8,443 | |||||
| 1,782 | Alcatel - Lucent ADR ● | 10,281 | |||||
| 236 | Apple, Inc. ● | 79,220 | |||||
| 4,631 | Cisco Systems, Inc. | 72,287 | |||||
| 326 | Corning, Inc. | 5,920 | |||||
| 425 | Dell, Inc. ● | 7,087 | |||||
| 3,415 | EMC Corp. ● | 94,091 | |||||
| 397 | Emulex Corp. ● | 3,416 | |||||
| 63 | F5 Networks, Inc. ● | 6,979 | |||||
| 516 | Finisar Corp. ● | 9,308 | |||||
| 1,490 | Flextronics International Ltd. ● | 9,566 | |||||
| 962 | Fujitsu Ltd. | 5,501 | |||||
| 160 | Harris Corp. | 7,210 | |||||
| 595 | High Technology Computer Corp. | 20,118 | |||||
| 28,890 | Hon Hai Precision Industry Co., Ltd. | 99,463 | |||||
| 105 | Hon Hai Precision Industry Co., Ltd. GDR § | 717 | |||||
| 965 | Jabil Circuit, Inc. | 19,489 | |||||
| 1,028 | JDS Uniphase Corp. ● | 17,132 | |||||
| 1,891 | Juniper Networks, Inc. ● | 59,581 | |||||
| 89 | NetApp, Inc. ● | 4,709 | |||||
| 1,392 | Nokia Corp. ADR | 8,937 | |||||
| 7,931 | Nokia Oyj | 51,162 | |||||
| 205 | Polycom, Inc. ● | 13,162 | |||||
| 453 | QLogic Corp. ● | 7,213 | |||||
| 258 | Qualcomm, Inc. | 14,646 | |||||
| 66 | Riverbed Technology, Inc. ● | 2,604 | |||||
| 32 | Universal Display Corp. ● | 1,116 | |||||
| 2,937 | WPG Holdings Co., Ltd. | 4,994 | |||||
| 653,413 | |||||||
| Telecommunication Services - 1.4% | |||||||
| 1,415 | Clearwire Corp. ● | 5,348 | |||||
| 139 | MetroPCS Communications, Inc. ● | 2,394 | |||||
| 256 | Softbank Corp. | 9,706 | |||||
| 9,299 | Sprint Nextel Corp. ● | 50,119 | |||||
| 2,205 | Telenor ASA | 36,089 | |||||
| 1,246 | Vodafone Group plc ADR | 33,299 | |||||
| 136,955 | |||||||
| Transportation - 3.8% | |||||||
| 7,646 | Delta Air Lines, Inc. ● | 70,114 | |||||
| 791 | FedEx Corp. | 74,998 | |||||
| 2,721 | Hertz Global Holdings, Inc. ● | 43,206 | |||||
| 663 | JSL S.A. | 4,885 | |||||
| 88 | Knight Transportation, Inc. | 1,498 | |||||
| 60 | Kuehne & Nagel International AG | 9,189 | |||||
| 753 | Localiza Rent a Car S.A. | 13,395 | |||||
| 419 | Swift Transportation Co. ● | 5,673 | |||||
| 1,092 | Toll Holdings Ltd. | 5,695 | |||||
| 5,567 | United Continental Holdings, Inc. ● | 125,974 | |||||
| 294 | United Parcel Service, Inc. Class B | 21,473 | |||||
| 376,100 | |||||||
The accompanying notes are an integral part of these financial statements.
| Shares or Principal Amount | Market Value ╪ | ||||||||
| COMMON STOCKS - 97.3% - (continued) | |||||||||
| Utilities - 0.5% | |||||||||
| 256 | Chubu Electric Power Co., Inc. | $ | 4,995 | ||||||
| 352 | Companhia Energetica de Minas Gerais ADR | 7,264 | |||||||
| 194 | Entergy Corp. | 13,225 | |||||||
| 748 | N.V. Energy, Inc. | 11,477 | |||||||
| 345 | PG&E Corp. | 14,488 | |||||||
| 51,449 | |||||||||
| Total common stocks | |||||||||
| (cost $8,957,499) | $ | 9,581,323 | |||||||
| WARRANTS - 0.0% | |||||||||
| Pharmaceuticals, Biotechnology & Life Sciences - 0.0% | |||||||||
| 510 | Novavax, Inc. ⌂● | $ | – | ||||||
| Total warrants | |||||||||
| (cost $–) | $ | – | |||||||
| EXCHANGE TRADED FUNDS - 0.3% | |||||||||
| Other Investment Pools and Funds - 0.3% | |||||||||
| 69 | SPDR S&P MidCap 400 ETF Trust | $ | 12,294 | ||||||
| 530 | Utilities Select SPDR | 17,748 | |||||||
| Total exchange traded funds | |||||||||
| (cost $28,666) | $ | 30,042 | |||||||
| CORPORATE BONDS: NON-INVESTMENT GRADE - 0.3% | |||||||||
| Finance and Insurance - 0.3% | |||||||||
| MBIA Insurance Co. | |||||||||
| $ | 53,500 | 14.00%, 01/15/2033 ■Δ | $ | 31,832 | |||||
| Total corporate bonds: non-investment grade | |||||||||
| (cost $53,137) | $ | 31,832 | |||||||
| Total long-term investments | |||||||||
| (cost $9,039,302) | $ | 9,643,197 | |||||||
| SHORT-TERM INVESTMENTS - 2.1% | |||||||||
| Repurchase Agreements - 2.1% | |||||||||
| Bank of America Merrill Lynch TriParty | |||||||||
| Joint Repurchase Agreement (maturing on | |||||||||
| 07/01/2011 in the amount of $20,179, | |||||||||
| collateralized by FHLB 4.91%, 2015, | |||||||||
| GNMA 0.87% - 5.72%, 2025 - 2061, value | |||||||||
| of $20,583) | |||||||||
| $ | 20,179 | 0.05%, 06/30/2011 | $ | 20,179 | |||||
| BNP Paribas Securities Corp. TriParty Joint | |||||||||
| Repurchase Agreement (maturing on | |||||||||
| 07/01/2011 in the amount of $15,189, | |||||||||
| collateralized by FNMA 3.50% - 6.50%, | |||||||||
| 2023 - 2041, value of $15,492) | |||||||||
| 15,189 | 0.05%, 06/30/2011 | 15,189 | |||||||
| Deutsche Bank Securities TriParty Joint | |||||||||
| Repurchase Agreement (maturing on | |||||||||
| 07/01/2011 in the amount of $146,897, | |||||||||
| collateralized by GNMA 4.00% - 7.00%, | |||||||||
| 2035 - 2040, value of $149,835) | |||||||||
| 146,897 | 0.05%, 06/30/2011 | 146,897 | |||||||
| UBS Securities, Inc. Joint Repurchase | |||||||||
| Agreement (maturing on 07/01/2011 in the | |||||||||
| amount of $293, collateralized by U.S. | |||||||||
| Treasury Bill 0.63%, 2012, value of $298) | |||||||||
| 293 | 0.01%, 06/30/2011 | 293 | |||||||
| UBS Securities, Inc. TriParty Joint | |||||||||
| Repurchase Agreement (maturing on | |||||||||
| 07/01/2011 in the amount of $22,421, | |||||||||
| collateralized by FHLMC 4.50%, 2040, | |||||||||
| FNMA 4.50% - 6.00%, 2035 - 2041, value | |||||||||
| of $22,870) | |||||||||
| 22,421 | 0.06%, 06/30/2011 | 22,421 | |||||||
| 204,979 | |||||||||
| Total short-term investments | |||||||||
| (cost $204,979) | $ | 204,979 | |||||||
| Total investments | �� | ||||||||
(cost $9,244,281) ▲ | 100.0% | $ | 9,848,176 | ||||||
| Other assets and liabilities | –% | 3,553 | |||||||
| Total net assets | 100.0% | $ | 9,851,729 | ||||||
The accompanying notes are an integral part of these financial statements.
| Hartford Capital Appreciation HLS Fund |
Schedule of Investments – (continued) June 30, 2011 (Unaudited) |
| (000’s Omitted) |
| Note: | Percentage of investments as shown is the ratio of the total market value to total net assets. Market value of investments in foreign securities represents 28.9% of total net assets at June 30, 2011. |
Prices of foreign equities that are principally traded on certain foreign markets may be adjusted daily pursuant to a fair value pricing service approved by the Board of Directors in order to reflect an adjustment for factors occurring after the close of certain foreign markets but before the close of the New York Stock Exchange.
| ▲ | At June 30, 2011, the cost of securities for federal income tax purposes was $9,460,926 and the aggregate gross unrealized appreciation and depreciation based on that cost were: |
| Unrealized Appreciation | $ | 1,003,974 | ||
| Unrealized Depreciation | (616,724 | ) | ||
| Net Unrealized Appreciation | $ | 387,250 |
| † | The aggregate value of securities valued in good faith at fair value as determined under policies and procedures established by and under the supervision of the Company's Board of Directors at June 30, 2011, was $72,933, which represents 0.74% of total net assets. This amount excludes securities that are principally traded in certain foreign markets and whose prices are adjusted pursuant to a third party pricing service methodology approved by the Board of Directors. |
| ● | Currently non-income producing. |
| Δ | Variable rate securities; the rate reported is the coupon rate in effect at June 30, 2011. |
| ■ | Securities issued within terms of a private placement memorandum, exempt from registration under Rule 144A under the Securities Act of 1933, as amended, and may be sold only to qualified institutional buyers. Pursuant to guidelines adopted by the Board of Directors, these issues are determined to be liquid. At June 30, 2011, the aggregate value of these securities was $48,382, which represents 0.49% of total net assets. |
| § | These securities were sold to the Fund under Regulation S, rules governing offers and sales made outside the United States without registration under the Securities Act of 1933. The Fund may only be able to resell these securities in the United States if an exemption from registration under the federal and state securities laws is available, or the Fund may only be able to sell these securities outside of the United States (such as on a foreign exchange) to a non-U.S. person. Unless otherwise indicated, these holdings are determined to be liquid. At June 30, 2011, the aggregate value of these securities amounted to $717, which represents 0.01% of total net assets. |
| ⌂ | The following securities are considered illiquid. Illiquid securities are often purchased in private placement transactions, are often not registered under the Securities Act of 1933 and may have contractual restrictions on resale. A security may also be considered illiquid if the security lacks a readily available market or if its valuation has not changed for a certain period of time. |
| Period Acquired | Shares/Par | Security | Cost Basis | |||||||
| 06/2007 | 29,055 | Buck Holdings L.P. | $ | 22,268 | ||||||
| 06/2011 | 4 | Cetip S.A. - Balcao Organizado - Receipt Shares | 50 | |||||||
| 10/2005 | 30 | Harvey Weinstein Co. Holdings Class A-1 - Reg D | 27,951 | |||||||
| 09/2010-04/2011 | 108 | Longtop Financial Technologies Ltd. | 3,301 | |||||||
| 07/2008 | 510 | Novavax, Inc. Warrants | – | |||||||
| 03/2007 | 75 | Solar Cayman Ltd. - 144A | 55 | |||||||
The aggregate value of these securities at June 30, 2011, was $72,989, which represents 0.74% of total net assets.
The accompanying notes are an integral part of these financial statements.
Foreign Currency Contracts Outstanding at June 30, 2011
| Unrealized | |||||||||||||||||
| Contract | Appreciation/ | ||||||||||||||||
| Description | Counterparty | Buy / Sell | Market Value ╪ | Amount | Delivery Date | (Depreciation) | |||||||||||
| British Pound | Banc of America Securities | Buy | $ | 554 | $ | 552 | 07/01/2011 | $ | 2 | ||||||||
| British Pound | Deutsche Bank Securities | Buy | 842 | 843 | 07/01/2011 | (1 | ) | ||||||||||
| British Pound | Deutsche Bank Securities | Sell | 5,485 | 5,489 | 07/05/2011 | 4 | |||||||||||
| Hong Kong Dollar | Deutsche Bank Securities | Sell | 2,095 | 2,095 | 07/05/2011 | – | |||||||||||
| Hong Kong Dollar | JP Morgan Securities | Sell | 4,749 | 4,749 | 07/05/2011 | – | |||||||||||
| Japanese Yen | Deutsche Bank Securities | Sell | 61,652 | 60,374 | 03/02/2012 | (1,278 | ) | ||||||||||
| Japanese Yen | Goldman Sachs | Buy | 1,059 | 1,054 | 07/01/2011 | 5 | |||||||||||
| Japanese Yen | Goldman Sachs | Sell | 10,967 | 11,010 | 09/21/2011 | 43 | |||||||||||
| Japanese Yen | JP Morgan Securities | Buy | 588 | 584 | 07/01/2011 | 4 | |||||||||||
| Japanese Yen | Morgan Stanley | Sell | 61,652 | 60,407 | 03/02/2012 | (1,245 | ) | ||||||||||
| Japanese Yen | Standard Chartered Bank | Buy | 1,231 | 1,232 | 07/05/2011 | (1 | ) | ||||||||||
| Japanese Yen | UBS AG | Sell | 61,560 | 60,302 | 03/02/2012 | (1,258 | ) | ||||||||||
| Swiss Franc | UBS AG | Sell | 1,091 | 1,102 | 07/01/2011 | 11 | |||||||||||
| $ | (3,714 | ) | |||||||||||||||
| ╪ | See Significant Accounting Policies of accompanying Notes to Financial Statements regarding valuation of securities. |
The accompanying notes are an integral part of these financial statements.
Investment Valuation Hierarchy Level Summary June 30, 2011 (Unaudited) |
| (000’s Omitted) |
| Total | Level 1 ♦ | Level 2 ♦ | Level 3 | |||||||||||||
| Assets: | ||||||||||||||||
| Common Stocks | ||||||||||||||||
| Automobiles & Components | $ | 472,448 | $ | 455,721 | $ | 16,727 | $ | – | ||||||||
| Banks | 477,696 | 273,757 | 203,939 | – | ||||||||||||
| Capital Goods | 880,081 | 509,704 | 370,377 | – | ||||||||||||
| Commercial & Professional Services | 17,839 | 11,870 | 5,969 | – | ||||||||||||
| Consumer Durables & Apparel | 124,259 | 110,526 | 13,733 | – | ||||||||||||
| Consumer Services | 144,895 | 119,718 | 25,177 | – | ||||||||||||
| Diversified Financials | 711,043 | 604,552 | 100,464 | 6,027 | ||||||||||||
| Energy | 1,169,077 | 1,085,707 | 83,370 | – | ||||||||||||
| Food & Staples Retailing | 188,200 | 162,964 | 25,236 | – | ||||||||||||
| Food, Beverage & Tobacco | 355,705 | 267,805 | 87,900 | – | ||||||||||||
| Health Care Equipment & Services | 352,114 | 352,114 | – | – | ||||||||||||
| Household & Personal Products | 38,385 | 22,379 | 16,006 | – | ||||||||||||
| Insurance | 287,874 | 251,518 | 36,356 | – | ||||||||||||
| Materials | 606,770 | 494,339 | 112,431 | – | ||||||||||||
| Media | 132,297 | 123,203 | 9,094 | – | ||||||||||||
| Pharmaceuticals, Biotechnology & Life Sciences | 782,459 | 517,881 | 264,578 | – | ||||||||||||
| Real Estate | 27,464 | 18,048 | 9,416 | – | ||||||||||||
| Retailing | 355,351 | 267,639 | 15,810 | 71,902 | ||||||||||||
| Semiconductors & Semiconductor Equipment | 460,231 | 460,231 | – | – | ||||||||||||
| Software & Services | 779,218 | 766,625 | 11,569 | 1,024 | ||||||||||||
| Technology Hardware & Equipment | 653,413 | 472,175 | 181,238 | – | ||||||||||||
| Telecommunication Services | 136,955 | 91,160 | 45,795 | – | ||||||||||||
| Transportation | 376,100 | 361,216 | 14,884 | – | ||||||||||||
| Utilities | 51,449 | 46,454 | 4,995 | – | ||||||||||||
| Total | 9,581,323 | 7,847,306 | 1,655,064 | 78,953 | ||||||||||||
| Corporate Bonds: Non-Investment Grade | 31,832 | – | 31,832 | – | ||||||||||||
| Exchange Traded Funds | 30,042 | 30,042 | – | – | ||||||||||||
| Warrants | – | – | – | – | ||||||||||||
| Short-Term Investments | 204,979 | – | 204,979 | – | ||||||||||||
| Total | $ | 9,848,176 | $ | 7,877,348 | $ | 1,891,875 | $ | 78,953 | ||||||||
| Foreign Currency Contracts* | 69 | – | 69 | – | ||||||||||||
| Total | $ | 69 | $ | – | $ | 69 | $ | – | ||||||||
| Liabilities: | ||||||||||||||||
| Foreign Currency Contracts* | 3,783 | – | 3,783 | – | ||||||||||||
| Total | $ | 3,783 | $ | – | $ | 3,783 | $ | – | ||||||||
| t | For the six-month period ended June 30, 2011, there were no significant transfers between Level 1 and Level 2. |
| * | Derivative instruments not reflected in the Schedule of Investments are valued at the unrealized appreciation/depreciation on the investments. |
Following is a reconciliation of Level 3 assets for which significant unobservable inputs were used to determine fair value:
| Balance as | Change in | |||||||||||||||||||||||||||||||||||
| of | Realized | Unrealized | Transfers | Transfers | Balance | |||||||||||||||||||||||||||||||
| December | Gain | Appreciation | Net | Into | Out of | as of June | ||||||||||||||||||||||||||||||
| 31, 2010 | (Loss) | (Depreciation) | Amortization | Purchases | Sales | Level 3 * | Level 3* | 30, 2011 | ||||||||||||||||||||||||||||
| Assets: | ||||||||||||||||||||||||||||||||||||
| Common Stocks | $ | 81,336 | $ | 4,983 | $ | 3,912 | † | $ | — | $ | 2,352 | $ | (23,891 | ) | $ | 10,261 | $ | — | $ | 78,953 | ||||||||||||||||
| Total | $ | 81,336 | $ | 4,983 | $ | 3,912 | $ | — | $ | 2,352 | $ | (23,891 | ) | $ | 10,261 | $ | — | $ | 78,953 | |||||||||||||||||
| * | Securities are transferred into and out of Level 3 for a variety of reasons including, but not limited to: |
1) Securities where trading has been halted (transfer into Level 3) or securities where trading has resumed (transfer out of Level 3).
2) Broker quoted securities (transfer into Level 3) or quoted prices in active markets (transfer out of Level 3).
3) Securities that have certain restrictions on trading (transfer into Level 3) or securities where trading restrictions have expired (transfer out of Level 3).
| † | Change in unrealized appreciation or depreciation in the current period relating to assets still held at June 30, 2011 was $5,048. |
The accompanying notes are an integral part of these financial statements.
Statement of Assets and Liabilities June 30, 2011 (Unaudited) |
| (000’s Omitted) |
| Assets: | ||||
| Investments in securities, at market value (cost $9,244,281) | $ | 9,848,176 | ||
| Foreign currency on deposit with custodian (cost $943) | 946 | |||
| Unrealized appreciation on foreign currency contracts | 69 | |||
| Receivables: | ||||
| Investment securities sold | 71,577 | |||
| Fund shares sold | 4,779 | |||
| Dividends and interest | 18,327 | |||
| Other assets | — | |||
| Total assets | 9,943,874 | |||
| Liabilities: | ||||
| Unrealized depreciation on foreign currency contracts | 3,783 | |||
| Bank overdraft — U.S. Dollars | 106 | |||
| Payables: | ||||
| Investment securities purchased | 46,343 | |||
| Fund shares redeemed | 40,455 | |||
| Investment management fees | 999 | |||
| Distribution fees | 56 | |||
| Accrued expenses | 403 | |||
| Total liabilities | 92,145 | |||
| Net assets | $ | 9,851,729 | ||
| Summary of Net Assets: | ||||
| Capital stock and paid-in-capital | $ | 9,967,698 | ||
| Accumulated undistributed net investment income | 49,688 | |||
| Accumulated net realized loss on investments and foreign currency transactions | (766,247 | ) | ||
| Unrealized appreciation of investments and the translations of assets and liabilities denominated in foreign currency | 600,590 | |||
| Net assets | $ | 9,851,729 | ||
| Shares authorized | 5,000,000 | |||
| Par value | $ | 0.001 | ||
Class IA: Net asset value per share | $ | 43.31 | ||
| Shares outstanding | 194,922 | |||
| Net assets | $ | 8,442,450 | ||
Class IB: Net asset value per share | $ | 42.89 | ||
| Shares outstanding | 32,856 | |||
| Net assets | $ | 1,409,279 | ||
The accompanying notes are an integral part of these financial statements.
Statement of Operations For the Six-Month Period Ended June 30, 2011 (Unaudited) |
| (000’s Omitted) |
| Investment Income: | ||||
| Dividends | $ | 90,311 | ||
| Interest | 3,853 | |||
| Less: Foreign tax withheld | (4,311 | ) | ||
| Total investment income, net | 89,853 | |||
| Expenses: | ||||
| Investment management fees | 32,615 | |||
| Transfer agent fees | 3 | |||
| Distribution fees - Class IB | 1,868 | |||
| Custodian fees | 107 | |||
| Accounting services fees | 871 | |||
| Board of Directors' fees | 101 | |||
| Audit fees | 68 | |||
| Other expenses | 551 | |||
| Total expenses (before fees paid indirectly) | 36,184 | |||
| Commission recapture | (141 | ) | ||
| Total fees paid indirectly | (141 | ) | ||
| Total expenses, net | 36,043 | |||
| Net investment income | 53,810 | |||
| Net Realized Gain on Investments and Foreign Currency Transactions: | ||||
| Net realized gain on investments | 1,113,758 | |||
| Net realized loss on foreign currency contracts | (885 | ) | ||
| Net realized gain on other foreign currency transactions | 19 | |||
| Net Realized Gain on Investments and Foreign Currency Transactions | 1,112,892 | |||
| Net Changes in Unrealized Depreciation of Investments and Foreign Currency Transactions: | ||||
| Net unrealized depreciation of investments | (923,479 | ) | ||
| Net unrealized depreciation of foreign currency contracts | (3,430 | ) | ||
| Net unrealized appreciation on translation of other assets and liabilities in foreign currencies | 273 | |||
| Net Changes in Unrealized Depreciation of Investments and Foreign Currency Transactions | (926,636 | ) | ||
| Net Gain on Investments and Foreign Currency Transactions | 186,256 | |||
| Net Increase in Net Assets Resulting from Operations | $ | 240,066 | ||
The accompanying notes are an integral part of these financial statements.
| Statement of Changes in Net Assets |
| (000’s Omitted) |
| For the | ||||||||
| Six-Month | For the | |||||||
| Period Ended | Year Ended | |||||||
| June 30, 2011 | December 31, | |||||||
| (Unaudited) | 2010 | |||||||
| Operations: | ||||||||
| Net investment income | $ | 53,810 | $ | 71,356 | ||||
| Net realized gain on investments and foreign currency transactions | 1,112,892 | 971,618 | ||||||
| Net unrealized appreciation (depreciation) of investments and foreign currency transactions | (926,636 | ) | 448,187 | |||||
| Net Increase In Net Assets Resulting From Operations | 240,066 | 1,491,161 | ||||||
| Distributions to Shareholders: | ||||||||
| From net investment income | ||||||||
| Class IA | — | (55,594 | ) | |||||
| Class IB | — | (5,968 | ) | |||||
| From tax-return of capital | ||||||||
| Class IA | — | (6,340 | ) | |||||
| Class IB | — | (1,098 | ) | |||||
| Total distributions | — | (69,000 | ) | |||||
| Capital Share Transactions: | ||||||||
| Class IA | ||||||||
| Sold | 241,141 | 552,196 | ||||||
| Issued on reinvestment of distributions | — | 61,934 | ||||||
| Redeemed | (894,728 | ) | (1,348,500 | ) | ||||
| Total capital share transactions | (653,587 | ) | (734,370 | ) | ||||
| Class IB | ||||||||
| Sold | 63,151 | 111,815 | ||||||
| Issued on reinvestment of distributions | — | 7,066 | ||||||
| Redeemed | (210,025 | ) | (400,674 | ) | ||||
| Total capital share transactions | (146,874 | ) | (281,793 | ) | ||||
| Net decrease from capital share transactions | (800,461 | ) | (1,016,163 | ) | ||||
| Net Increase (Decrease) In Net Assets | (560,395 | ) | 405,998 | |||||
| Net Assets: | ||||||||
| Beginning of period | 10,412,124 | 10,006,126 | ||||||
| End of period | $ | 9,851,729 | $ | 10,412,124 | ||||
Accumulated undistributed (distribution in excess of) net investment income | $ | 49,688 | $ | (4,122 | ) | |||
| Shares: | ||||||||
| Class IA | ||||||||
| Sold | 5,506 | 14,803 | ||||||
| Issued on reinvestment of distributions | — | 1,534 | ||||||
| Redeemed | (20,452 | ) | (36,097 | ) | ||||
| Total share activity | (14,946 | ) | (19,760 | ) | ||||
| Class IB | ||||||||
| Sold | 1,447 | 2,990 | ||||||
| Issued on reinvestment of distributions | — | 181 | ||||||
| Redeemed | (4,833 | ) | (10,870 | ) | ||||
| Total share activity | (3,386 | ) | (7,699 | ) | ||||
The accompanying notes are an integral part of these financial statements.
| Hartford Capital Appreciation HLS Fund |
Notes to Financial Statements June 30, 2011 (Unaudited) |
| (000’s Omitted) |
| 1. | Organization: |
Hartford Capital Appreciation HLS Fund (the “Fund”) serves as an underlying investment option for certain variable annuity and variable life insurance separate accounts of Hartford Life Insurance Company (“HLIC”) and its affiliates and certain qualified retirement plans. The Fund may also serve as an underlying investment option for certain variable annuity and variable life separate accounts of other insurance companies. Owners of variable annuity contracts and policyholders of variable life insurance contracts may choose the funds permitted in the variable insurance contract prospectus. In addition, participants in certain qualified retirement plans may choose the Fund if permitted by their plans.
Hartford Series Fund, Inc. (the “Company”) is an open-end registered management investment company comprised of thirty portfolios. Financial Statements for the Fund, a series of the Company, are included in this report.
The Company is organized under the laws of the State of Maryland and is registered with the Securities and Exchange Commission (“SEC”) under the Investment Company Act of 1940, as amended (“1940 Act”). The Fund is a diversified open-end management investment company.
The Fund is divided into Class IA and Class IB shares. Each class is offered at the per share net asset value (“NAV”) without a sales charge and is subject to the same expenses, except that the Class IB shares are subject to distribution and service fees charged pursuant to a Distribution Plan adopted in accordance with Rule 12b-1 under the 1940 Act.
| 2. | Significant Accounting Policies: |
The following is a summary of significant accounting policies of the Fund in the preparation of its financial statements, which are in accordance with the United States Generally Accepted Accounting Principles (“U.S. GAAP”). The preparation of financial statements in accordance with U.S. GAAP may require management to make estimates and assumptions that affect the reported amounts of assets and liabilities and disclosure of contingent assets and liabilities at the date of the financial statements and the reported amounts of increases and decreases in net assets from operations during the reporting period. Actual results could differ from those estimates.
| a) | Determination of Net Asset Value – The NAV of each class of the Fund's shares is determined as of the close of regular trading (normally 4:00 p.m. Eastern Time) (the “NYSE Close”) on each day that the New York Stock Exchange (the “Exchange”) is open (“Valuation Date”). Information that becomes known to the Fund after the NAV has been calculated on a particular day will not generally be used to retroactively adjust the NAV determined earlier that day. |
| b) | Investment Valuation and Fair Value Measurements – For purposes of calculating the NAV, portfolio securities and other assets held by the Fund's portfolio for which market quotes are readily available are valued at market value. Market value is generally determined on the basis of last reported sales prices or official close price. If no sales are reported, market value is based on quotes obtained from a quotation reporting system, established market makers, or independent pricing services. If market prices are not readily available or are deemed unreliable, the Fund will use the fair value of the security as determined in good faith under policies and procedures established by and under the supervision of the Company's Board of Directors. Market quotes are considered not readily available where there is an absence of current or reliable market-based data (e.g., trade information or broker quotes), including where events occur after the close of the relevant market, but prior to the NYSE Close that materially affect the values of the Fund's portfolio securities or assets. In addition, market quotes are considered not readily available when, due to extraordinary circumstances, the exchanges or markets on which the securities trade, do not open for trading for the entire day and no other market prices are available. In addition, prices of foreign equities that are principally traded on certain foreign markets are adjusted daily pursuant to a fair value pricing service approved by the Board of Directors in order to reflect an adjustment for the factors occurring after the close of certain foreign markets but before the NYSE Close. Securities that are primarily traded on foreign markets may trade on days that are not business days of the Fund. The value of the foreign securities, in which the Fund invests, may change on days when a shareholder will not be able to purchase or redeem shares of the Fund. Fair value pricing is subjective in nature and the use of fair value pricing by the Fund may |
cause the NAV of its shares to differ significantly from the NAV that would have been calculated using market prices at the close of the exchange on which a portfolio security is primarily traded. There can be no assurance that the Fund could obtain the fair market value assigned to a security if the Fund were to sell the security at approximately the time at which the Fund determines its NAV.
Fixed income securities (other than short term obligations) and non-exchange traded derivatives held by the Fund are normally valued on the basis of quotes obtained from brokers and dealers or independent pricing services in accordance with procedures established by the Company’s Board of Directors. Prices obtained from independent pricing services use information provided by market makers or estimates of market values obtained from yield data relating to investments or securities with similar characteristics. Generally, the Fund may use fair valuation in regard to fixed income securities when the Fund holds defaulted or distressed securities or securities in a company in which a reorganization is pending. Short-term investments maturing in 60 days or less are generally valued at amortized cost, if their original term to maturity was 60 days or less, or by amortizing their value on the 61st day prior to maturity, if the original term to maturity exceeded 60 days.
Investments valued in currencies other than U.S. dollars are converted to U.S. dollars using exchange rates obtained from independent pricing services for calculation of the NAV. As a result, the NAV of the Fund’s shares may be affected by changes in the value of currencies in relation to the U.S. dollar. The value of securities traded in markets outside the United States or denominated in currencies other than the U.S. dollar may be affected significantly on a day that the NYSE is closed and the market value may change on days when an investor is not able to purchase, redeem or exchange shares of the Fund.
Foreign currency contracts represent agreements to exchange currencies on specific future dates at predetermined rates. Foreign currency contracts are valued using foreign currency exchange rates and forward rates as provided by an independent pricing service on Valuation Date.
Investments in open-end mutual funds are valued at the respective NAV of each open-end mutual fund on the Valuation Date.
Financial instruments for which prices are not available from an independent pricing service may be valued using market quotations obtained from one or more dealers that make markets in the respective financial instrument in accordance with procedures established by the Company’s Board of Directors.
U.S. GAAP defines fair value as the price that the Fund would receive to sell an asset or pay to transfer a liability in an orderly transaction between market participants. The U.S. GAAP fair value measurement standards require disclosure of a fair value hierarchy for each major category of assets and liabilities. Various inputs are used in determining the fair value of the Fund’s investments. These inputs are summarized into three broad hierarchy levels. This hierarchy is based on whether the valuation inputs are observable or unobservable. These levels are:
| · | Level 1 – Quoted prices in active markets for identical securities. Level 1 may include exchange-traded instruments such as domestic equities, some foreign equities, options, futures, mutual funds, exchange-traded funds, rights and warrants. |
| · | Level 2 – Observable inputs other than Level 1 prices, such as quoted prices for similar securities; quoted prices in markets that are not active; or other inputs that are observable or can be corroborated by observable market data. Level 2 may include debt securities that are traded less frequently than exchange-traded instruments and which are valued using third party pricing services; foreign equities, whose value is determined using a multi-factor regression model with inputs that are observable in the market; and short-term securities, which are valued at amortized cost. |
| · | Level 3 – Significant unobservable inputs that are supported by limited or no market activity. Level 3 may include financial instruments whose values are determined using broker quotes or require significant management judgment or estimation. These unobservable valuation inputs may include estimates for current yields, maturity/duration, prepayment speed, and broker quotes for comparable securities along with other |
| Hartford Capital Appreciation HLS Fund |
Notes to Financial Statements – (continued) June 30, 2011 (Unaudited) |
| (000’s Omitted) |
| assumptions relating to credit quality, collateral value, complexity of the security structure, general market conditions and liquidity. This category may include securities where trading has been halted or there are certain restrictions on trading. While these securities are priced using unobservable inputs, the valuation of these securities reflects the best available data and management believes the prices are a reasonable representation of exit price. |
Valuation levels are not necessarily indicative of the risk associated with investing in such securities. Individual securities within any of the above mentioned asset classes may be assigned a different hierarchical level than those presented above, as individual circumstances dictate.
For additional information, refer to the Investment Valuation Hierarchy Level Summary and the Level 3 roll forward reconciliation which follow the Schedule of Investments.
For purposes of reporting transfers between different hierarchy levels, both transfers in and out of each level, as applicable, are shown as if they occurred at the beginning of the period.
| c) | Security Transactions and Investment Income – Security transactions are recorded as of the trade date (the date the order to buy or sell is executed) for financial reporting purposes. Securities purchased or sold on a when-issued or delayed-delivery basis may be settled a month or more after the trade date. Realized gains and losses are determined on the basis of identified cost. |
Dividend income is accrued as of the ex-dividend date, except that certain dividends from foreign securities where the ex-dividend date may have passed are recorded as soon as the Fund is informed of the dividend. Interest income, including amortization of premium and accretion of discounts, is accrued on a daily basis.
| d) | Foreign Currency Transactions – Assets and liabilities denominated in currencies other than U.S. dollars are translated into U.S. dollars at the exchange rates in effect on the valuation date. Purchases and sales of investment securities, income, and expenses are translated into U.S. dollars at the exchange rates on the dates of such transactions. |
The Fund does not isolate that portion of portfolio security valuation resulting from fluctuations in the foreign currency exchange rates from the fluctuations arising from changes in the market prices of securities held. Exchange rate fluctuations are included with the net realized and unrealized gain or loss on investments in the accompanying financial statements.
Net realized foreign exchange gains or losses arise from sales of foreign currencies and the difference between asset and liability amounts initially stated in foreign currencies and the U.S. dollar value of the amounts actually received or paid. Net unrealized foreign exchange gains or losses arise from changes in the value of other assets and liabilities at the end of the reporting period, resulting from changes in the exchange rates.
| e) | Joint Trading Account – The Fund may invest cash balances into a joint trading account that may be invested in one or more repurchase agreements. |
| f) | Fund Share Valuation and Dividend Distributions to Shareholders – Orders for the Fund’s shares are executed in accordance with the investment instructions of the contract holders and plan participants. The NAV of the Fund’s shares is determined as of the close of business on each business day of the Exchange. The NAV is determined separately for each class of shares of the Fund by dividing the Fund’s net assets attributable to that class by the number of shares of the class outstanding. Each class of shares offered by the Fund has equal rights as to assets and voting privileges (except that shareholders of a class have exclusive voting rights regarding any matter relating solely to that class of shares). Income and non-class specific expenses are allocated daily to each class on the basis of the relative net assets of the class. Realized and unrealized capital gains and losses of each class are allocated daily based on the relative net assets of each class of shares of the Fund. |
Orders for the purchase of the Fund’s shares received prior to the close of the Exchange on any day the Exchange is open for business are priced at the NAV determined as of the close of the Exchange. Orders received after the close of the Exchange, or on a day on which the Exchange and/or the Fund is not open for business, are priced at the next determined NAV.
Dividends are declared pursuant to a policy adopted by the Company’s Board of Directors based upon the investment performance of the Fund. The policy of the Fund is to pay dividends from net investment income and realized capital gains, if any, at least once a year.
Distributions from net investment income, net realized capital gains and capital are determined in accordance with federal income tax regulations, which may differ from U.S. GAAP with respect to character and timing. These differences may include but are not limited to losses deferred due to wash sale adjustments, foreign currency gains and losses, adjustments related to Passive Foreign Investment Companies (“PFICs”), Real Estate Investment Trusts (“REITs”), Regulated Investment Companies (“RICs”), certain derivatives and partnerships. Permanent book and federal income tax basis differences relating to shareholder distributions will result in reclassifications to certain of the Fund’s capital accounts (see Federal Income Taxes: Reclassification of Capital Accounts note).
| 3. | Securities and Other Investments: |
| a) | Repurchase Agreements – A repurchase agreement is an agreement by which a counterparty agrees to sell a security and agrees to repurchase the security sold at a mutually agreed upon time and price. At the time the Fund enters into a repurchase agreement, the value of the underlying collateral security(ies), including accrued interest, will be equal to or exceed the value of the repurchase agreement. Repurchase agreements expose the Fund to counterparty risk. To minimize counterparty risk, the securities that serve to collateralize the repurchase agreement are held by the Fund's custodian in book entry or physical form in the custodial account of the Fund or in a third party custodial account. Repurchase agreements are valued at cost plus accrued interest. The Fund, as shown on the Schedule of Investments, had outstanding repurchase agreements as of June 30, 2011. |
| b) | Illiquid and Restricted Securities – The Fund is permitted to invest up to 15% of its net assets in illiquid securities. Illiquid securities are those that may not be sold or disposed of in the ordinary course of business within seven days, at approximately the price used to determine the Fund’s NAV. The Fund may not be able to sell illiquid securities or other investments when its sub-adviser considers it desirable to do so or may have to sell such securities or investments at a price that is lower than the price that could be obtained if the securities or investments were more liquid. A sale of illiquid securities or other investments may require more time and may result in higher dealer discounts and other selling expenses than does the sale of those that are liquid. Illiquid securities and investments also may be more difficult to value, due to the unavailability of reliable market quotations for such securities or investments, and an investment in them may have an adverse impact on the Fund’s NAV. The Fund may also purchase certain restricted securities that can only be resold to certain qualified investors and may be determined to be liquid pursuant to policies and guidelines established by the Company’s Board of Directors. The Fund, as shown on the Schedule of Investments, had illiquid and/or restricted securities as of June 30, 2011. |
| c) | Securities Purchased on a When-Issued or Delayed-Delivery Basis – Delivery and payment for securities that have been purchased by the Fund on a forward commitment, or when-issued or delayed-delivery basis, take place beyond the customary settlement period. During this period, such securities are subject to market fluctuations, and the Fund identifies securities segregated in its records with value at least equal to the amount of the commitment. The Fund had no outstanding when-issued or delayed delivery securities as of June 30, 2011. |
| 4. | Financial Derivative Instruments: |
The following disclosures contain information on how and why the Fund uses derivative instruments, the credit-risk-related contingent features in certain derivative instruments, and how derivative instruments affect the Fund’s financial position, results of operations and cash flows. The location and fair value amounts of these instruments on the
19
| Hartford Capital Appreciation HLS Fund |
Notes to Financial Statements – (continued) June 30, 2011 (Unaudited) |
| (000’s Omitted) |
Statement of Assets and Liabilities and the realized gains and losses and changes in unrealized gains and losses on the Statement of Operations, each categorized by type of derivative contract, are included in the following Additional Derivative Instrument Information footnote. The derivative instruments outstanding as of period-end are disclosed in the Notes to the Schedule of Investments and the amounts of realized gains and losses and changes in unrealized gains and losses on derivative instruments during the period are disclosed in the Statement of Operations.
| a) | Foreign Currency Contracts – The Fund may enter into foreign currency contracts that obligate the Fund to purchase or sell currencies at specified future dates. Foreign currency contracts are used to hedge the currency exposure associated with some or all of the Fund's securities and/or as part of an investment strategy. Foreign currency contracts are marked to market daily and the change in value is recorded by the Fund as an unrealized gain or loss. Realized gains or losses equal to the difference between the value of the contract at the time it was opened and the value at the time it was closed are recorded upon delivery or receipt of the currency. |
Foreign currency contracts involve elements of market risk in excess of the amounts reflected in the Statement of Assets and Liabilities. In addition, risks may arise upon entering into these contracts from the potential inability of the counterparties to meet the terms of the contracts and from unanticipated movements in the value of the foreign currencies relative to the U.S. dollar. The Fund had outstanding foreign currency contracts as shown on the Schedule of Investments as of June 30, 2011.
| b) | Additional Derivative Instrument Information: |
Fair Values of Derivative Instruments on the Statement of Assets and Liabilities as of June 30, 2011:
| Risk Exposure Category | ||||||||||||||||||||||||||||
| Foreign | ||||||||||||||||||||||||||||
| Interest Rate | Exchange | Credit | Equity | Commodity | Other | |||||||||||||||||||||||
| Contracts | Contracts | Contracts | Contracts | Contracts | Contracts | Total | ||||||||||||||||||||||
| Assets: | ||||||||||||||||||||||||||||
Unrealized appreciation on foreign currency contracts | $ | — | $ | 69 | $ | — | $ | — | $ | — | $ | — | $ | 69 | ||||||||||||||
| Total | $ | — | $ | 69 | $ | — | $ | — | $ | — | $ | — | $ | 69 | ||||||||||||||
| Liabilities: | ||||||||||||||||||||||||||||
Unrealized depreciation on foreign currency contracts | $ | — | $ | 3,783 | $ | — | $ | — | $ | — | $ | — | $ | 3,783 | ||||||||||||||
| Total | $ | — | $ | 3,783 | $ | — | $ | — | $ | — | $ | — | $ | 3,783 | ||||||||||||||
The volume of derivatives that is presented in the Schedule of Investments is consistent with the derivative activity during the six-month period ended June 30, 2011.
The Effect of Derivative Instruments on the Statement of Operations for the six-month period ended June 30, 2011:
| Risk Exposure Category | ||||||||||||||||||||||||||||
| Foreign | ||||||||||||||||||||||||||||
| Interest Rate | Exchange | Credit | Equity | Commodity | Other | |||||||||||||||||||||||
| Contracts | Contracts | Contracts | Contracts | Contracts | Contracts | Total | ||||||||||||||||||||||
| Realized Gain (Loss) on Derivatives Recognized as a Result from Operations: | ||||||||||||||||||||||||||||
Net realized loss on foreign currency contracts | $ | — | $ | (885 | ) | $ | — | $ | — | $ | — | $ | — | $ | (885 | ) | ||||||||||||
| Total | $ | — | $ | (885 | ) | $ | — | $ | — | $ | — | $ | — | $ | (885 | ) | ||||||||||||
| Net Change in Unrealized Appreciation (Depreciation) on Derivatives Recognized as a Result from Operations: | ||||||||||||||||||||||||||||
Net change in unrealized depreciation of foreign currency contracts | $ | — | $ | (3,430 | ) | $ | — | $ | — | $ | — | $ | — | $ | (3,430 | ) | ||||||||||||
| Total | $ | — | $ | (3,430 | ) | $ | — | $ | — | $ | — | $ | — | $ | (3,430 | ) | ||||||||||||
| 5. | Principal Risks: |
| a) | Credit and Counterparty Risks – Credit risk depends largely on the perceived financial health of bond issuers. In general, the credit rating is inversely related to the credit risk of the issuer. Higher rated bonds generally are deemed to have less credit risk, while lower or unrated bonds are deemed to have higher risk of default. The share price, yield and total return of a fund that holds securities with higher credit risk may be more volatile than those of a fund that holds bonds with lower credit risk. Similar to credit risk, the Fund may be exposed to counterparty risk, or the risk that an institution or other entity with which the Fund has unsettled or open transactions will default. |
| b) | Market Risks – A Fund’s investments in derivatives and other financial instruments expose the Fund to various risks including, but not limited to, interest rate, prepayment, extension, foreign currency, and equity risks. Interest rate risk is the risk that fixed income securities will decline in value because of changes in interest rates. As nominal interest rates rise, the value of certain fixed income securities held by the Fund is likely to decrease. A nominal interest rate can be described as the sum of a real interest rate and an expected inflation rate. Fixed income securities with longer durations tend to be more sensitive to changes in interest rates, usually making them more volatile than securities with shorter durations. Duration is useful primarily as a measure of the sensitivity of a fixed income security’s market price to interest rate (i.e., yield) movements. In addition, securities are subject to extension risk. Rising interest rates may cause prepayments to occur at a slower than expected rate, thereby effectively lengthening the maturity of the security and making the security more sensitive to interest rate changes. Prepayment and extension risk are major risks of mortgage-backed securities, and certain asset-backed securities. For certain asset-backed securities, the actual maturity may be less than the stated maturity shown in the Schedule of Investments. As a result, the timing of income recognition relating to these securities may vary based upon the actual maturity. If a Fund invests directly in foreign currencies or in securities that trade in, and receive revenues in, foreign currencies, or in derivatives that provide exposure to foreign currencies, it will be subject to the risk that those currencies will decline in value relative to the base currency of the Fund, or, in the case of hedging positions, that the Fund’s base currency will decline in value relative to the currency being hedged. Currency rates in foreign countries may fluctuate significantly over short periods of time for a number of reasons, including changes in interest rates, intervention (or the failure to intervene) by U.S. or foreign governments, central banks or supranational entities such as the International Monetary Fund, or by the imposition of currency controls or other political developments in the United States or abroad. As a result, the Fund’s investments in foreign currency denominated securities may reduce the returns of the Fund. The market values of equity securities, such as common stocks and preferred stocks or equity related investments such as futures and options, may decline due to general market conditions which are not specifically related to a particular company, such as real or perceived adverse economic conditions, changes in the general outlook for corporate earnings, changes in interest or currency rates or adverse investor sentiment generally. The market value of equity securities may also decline due to factors which affect a particular industry or industries, such as labor shortages or increased production costs and competitive conditions within an industry. Equity securities and equity related investments generally have greater market price volatility than fixed income securities. |
| 6. | Federal Income Taxes: |
| a) | Federal Income Taxes – For federal income tax purposes, the Fund intends to continue to qualify as a RIC under Subchapter M of the Internal Revenue Code (“IRC”) by distributing substantially all of its taxable net investment income and net realized capital gains to its shareholders and otherwise complying with the requirements of RICs. The Fund has distributed substantially all of its income and capital gains in prior years, if applicable, and intends to distribute substantially all of its income and capital gains prior to the next fiscal year-end. Accordingly, no provision for federal income or excise taxes has been made in the accompanying financial statements. Distributions from short-term capital gains are treated as ordinary income distributions for federal income tax purposes. |
| b) | Net Investment Income (Loss), Net Realized Gains (Losses) – Net investment income (loss) and net realized gains (losses) may differ for financial statement and tax purposes primarily because of losses deferred due to wash sale adjustments, foreign currency gains and losses, adjustments related to PFICs, REITs, RICs, certain derivatives and partnerships. The character of distributions made during the year from net investment income or net realized gains may |
| Hartford Capital Appreciation HLS Fund |
Notes to Financial Statements – (continued) June 30, 2011 (Unaudited) |
| (000’s Omitted) |
differ from their ultimate characterization for federal income tax purposes. Also, due to the timing of dividend distributions, the fiscal year in which amounts are distributed may differ from the year that the income or realized gains (losses) were recorded by the Fund.
| c) | Distributions and Components of Distributable Earnings – The tax character of distributions paid by the Fund for the periods indicated is as follows (as adjusted for dividends payable): |
| For the Year Ended | For the Year Ended | |||||||
| December 31, 2010 | December 31, 2009 | |||||||
| Ordinary Income | $ | 61,562 | $ | 75,000 | ||||
| Tax Return of Capital | 7,438 | — | ||||||
As of December 31, 2010, the Fund’s components of distributable earnings (deficit) on a tax basis were as follows:
| Amount | ||||
| Accumulated Capital and Other Losses* | $ | (1,666,944 | ) | |
Unrealized Appreciation† | 1,310,909 | |||
| Total Accumulated Deficit | $ | (356,035 | ) | |
| * | The Fund has capital loss carryforwards that are identified in the Capital Loss Carryforward note that follows. |
| † | The difference between book-basis and tax-basis unrealized appreciation (depreciation) may be attributable to the losses deferred due to wash sale adjustments, foreign currency gains and losses, adjustments related to PFICs, REITs, RICs, certain derivatives and partnerships. |
| d) | Reclassification of Capital Accounts – The Fund may record reclassifications in its capital accounts. These reclassifications have no impact on the total net assets of the Fund. The reclassifications are a result of permanent differences between U.S. GAAP and tax accounting for such items as expiration or utilization of capital loss carryforwards or net operating losses. Adjustments are made to reflect the impact these items have on current and future distributions to shareholders. Therefore, the source of the Fund’s distributable income may be shown in the accompanying Statement of Assets and Liabilities as from accumulated undistributed net investment income, from accumulated net realized gains on investments or from capital depending on the type of book and tax differences that exist. For the year ended December 31, 2010, the Fund recorded reclassifications to increase (decrease) the accounts listed below: |
| Amount | ||||
| Accumulated Undistributed Net Investment Income | $ | (19,760 | ) | |
| Accumulated Net Realized Gain (Loss) on Investments and Foreign Currency Transactions | 18,978 | |||
| Capital Stock and Paid-in-Capital | 782 | |||
| e) | Capital Loss Carryforward – At December 31, 2010 (tax-year-end), the Fund had capital loss carryforwards for U.S. federal income tax purposes of approximately: |
| Year of Expiration | Amount | |||
| 2017 | $ | 1,664,527 | ||
| Total | $ | 1,664,527 | ||
As of December 31, 2010, the Fund utilized $835,404 of prior year capital loss carryforwards.
As of December 31, 2010, the Fund elected to defer the following post-October losses:
| Amount | ||||
| Ordinary Income | $ | 2,417 | ||
| f) | Accounting for Uncertainty in Income Taxes – The Fund has adopted financial reporting rules that require the Fund to analyze all open tax years, as defined by the Statute of Limitations, for all major jurisdictions. Generally, tax authorities can examine all tax returns filed for the last three years. The Fund does not have an examination in progress. |
The Fund has reviewed all open tax years and major jurisdictions and concluded that these financial reporting rules had no effect on the Fund’s financial position or results of operations. There is no tax liability resulting from unrecognized tax benefits relating to uncertain income tax positions taken or expected to be taken on the tax return for the fiscal year-end December 31, 2010. The Fund is also not aware of any tax positions for which it is reasonably possible that the total amounts of unrecognized tax benefits will significantly change in the next twelve months.
| 7. | Expenses: |
| a) | Investment Management Agreements – HL Investment Advisors, LLC (“HL Advisors”), an indirect wholly owned subsidiary of The Hartford Financial Services Group, Inc. (“The Hartford”), serves as investment manager to the Fund pursuant to an Investment Management Agreement with the Company. As investment manager, HL Advisors has overall investment supervisory responsibility for the Fund. In addition, HL Advisors provides administrative personnel, services, equipment, facilities and office space for proper operation of the Fund. HL Advisors has contracted with Wellington Management Company, LLP (“Wellington Management”) under a sub-advisory agreement for the provision of day-to-day investment management services to the Fund in accordance with the Fund’s investment objective and policies. The Fund pays a fee to HL Advisors, a portion of which may be used to compensate Wellington Management. |
The schedule below reflects the rates of compensation paid to HL Advisors for investment management services rendered as of June 30, 2011; the rates are accrued daily and paid monthly.
| Average Daily Net Assets | Annual Fee | |||
| On first $250 million | 0.7750 | % | ||
| On next $250 million | 0.7250 | % | ||
| On next $500 million | 0.6750 | % | ||
| On next $4 billion | 0.6250 | % | ||
| On next $5 billion | 0.6225 | % | ||
| Over $10 billion | 0.6200 | % | ||
| b) | Accounting Services Agreement – Pursuant to the Fund Accounting Agreement between HLIC and the Company, on behalf of the Fund, HLIC provides accounting services to the Fund and receives monthly compensation based on the Fund’s average net assets at the rates set forth below. The Fund’s accounting services fees are accrued daily and paid monthly. |
| Average Daily Net Assets | Annual Fee | |||
| On first $5 billion | 0.018 | % | ||
| On next $5 billion | 0.016 | % | ||
| Over $10 billion | 0.014 | % | ||
| c) | Operating Expenses – Allocable expenses incurred by the Company are allocated to each Fund and allocated to classes within a Fund in proportion to the average daily net assets of the Fund and each class, except where allocation of certain expenses is more fairly made directly to the Fund or to specific classes within a Fund. |
| d) | Fees Paid Indirectly – The Company, on behalf of the Fund, has entered into agreements with State Street Global Markets, LLC and Russell Implementation Services, Inc. to partially recapture non-discounted trade commissions. Such |
| Hartford Capital Appreciation HLS Fund |
Notes to Financial Statements – (continued) June 30, 2011 (Unaudited) |
| (000’s Omitted) |
rebates are used to pay a portion of the Fund’s expenses. In addition, the Fund’s custodian bank has also agreed to reduce its fees when the Fund maintains cash on deposit in a non-interest-bearing custody account. For the six-month period ended June 30, 2011, these amounts are included in the Statement of Operations.
The ratio of expenses to average net assets in the accompanying financial highlights excludes the reduction in expenses related to fees paid indirectly. The annualized expense ratio for the period listed below including the fees paid indirectly is as follows:
| Annualized Six- | ||||
| Month Period | ||||
| Ended June 30, | ||||
| 2011 | ||||
| Class IA | 0.66 | % | ||
| Class IB | 0.91 | |||
| e) | Distribution Plan for Class IB shares – The Company, on behalf of the Fund, has adopted a Distribution Plan pursuant to Rule 12b-1 of the 1940 Act to compensate the Distributor, Hartford Securities Distribution Company, Inc. (a wholly owned, ultimate subsidiary of The Hartford), from assets attributable to the Class IB shares for services rendered and expenses borne in connection with activities primarily intended to result in the sale of the Class IB shares, subject to the review and approval of the Company’s Board of Directors. |
The Distribution Plan provides that the Fund may pay annually up to 0.25% of the average daily net assets of the Fund attributable to its Class IB shares for activities primarily intended to result in the sale of Class IB shares. The Board has the authority to suspend or reduce these payments at any point in time. Under the terms of the Distribution Plan and the principal underwriting agreement, the Fund is authorized to make payments monthly to the Distributor that may be used to pay or compensate entities providing distribution and shareholder servicing with respect to the Class IB shares for such entities’ fees or expenses incurred or paid in that regard. These fees are accrued daily and paid monthly.
| f) | Other Related Party Transactions – Certain officers of the Fund are directors and/or officers of HL Advisors and/or The Hartford or its subsidiaries. For the six-month period ended June 30, 2011, a portion of the Fund’s chief compliance officer’s salary was paid by all the investment companies in the Hartford fund complex. The portion allocated to the Fund was in the amount of $8. Hartford Administrative Services Company (“HASCO”), an indirect wholly owned subsidiary of The Hartford, provides transfer agent services to the Fund. The amount paid to HASCO can be found in the Statement of Operations. These fees are accrued daily and paid monthly. |
| g) | Payments from Affiliates – In July of 2007, The Hartford entered into a settlement with the Attorneys General of the states of New York, Connecticut and Illinois relating to market timing and the company's individual variable annuity contracts in which certain payments would be made directly to the variable annuity contract holders. The distribution plan provided that unclaimed money from the settlement would be distributed to certain HLS Funds that are investment options through a Hartford individual variable annuity contract. The unclaimed money was distributed to the Fund on September 18, 2009, as follows: |
| Amount | ||||
| Reimbursement | $ | 273 | ||
On November 8, 2006, the SEC issued an order setting forth the terms of a settlement reached with three subsidiaries of The Hartford that resolved the SEC’s Division of Enforcement’s investigation of aspects of The Hartford’s variable annuity and mutual fund operations related to directed brokerage and revenue sharing. The Hartford settled this matter without admitting or denying the findings of the SEC.
The total return in the accompanying financial highlights includes payments from affiliates. Had the payments from the affiliates been excluded, the impact and total return for the periods listed below would have been as follows:
| For the Year Ended December 31, 2009 | ||||||||
| Class IA | Class IB | |||||||
| Impact from Payment from Affiliate for Attorneys General Settlement | — | % | — | % | ||||
| Total Return Excluding Payment from Affiliate | 45.66 | 45.30 | ||||||
| For the Year Ended December 31, 2006 | ||||||||
| Class IA | Class IB | |||||||
| Impact from Payment from Affiliate for SEC Settlement | 0.09 | % | 0.09 | % | ||||
| Total Return Excluding Payment from Affiliate | 16.52 | 16.23 | ||||||
| 8. | Investment Transactions: |
For the six-month period ended June 30, 2011, the Fund's aggregate purchases and sales of investment securities (excluding short-term investments) were as follows:
| Amount | ||||
| Cost of Purchases Excluding U.S. Government Obligations | $ | 5,836,685 | ||
| Sales Proceeds Excluding U.S. Government Obligations | 6,702,896 | |||
| 9. | Line of Credit: |
The Fund is one of several Hartford funds that participate in a $500 million committed revolving line of credit facility. The facility is to be used for temporary or emergency purposes. Under the arrangement, a fund is required to own securities having a market value in excess of 300% of the total bank borrowings. The interest rate on borrowings varies depending on the nature of the loan. The facility also requires a fee to be paid based on the amount of the commitment. This commitment fee is allocated to all the funds participating in the line of credit based on the average net assets of the funds. During the six-month period ended June 30, 2011, the Fund did not have any borrowings under this facility.
| 10. | Industry Classifications: |
Other than the industry classifications “Other Investment Pools and Funds” and “Exchange Traded Funds,” equity industry classifications used in this report are the Global Industry Classification Standard, which was developed by and is the exclusive property and service mark of MSCI, Inc. and Standard & Poor’s.
| 11. | Indemnifications: |
Under the Company’s organizational documents, the Company shall indemnify its officers and directors to the full extent required or permitted under Maryland General Corporation Law and the federal securities laws. In addition, the Company, on behalf of the Fund, may enter into contracts that contain a variety of indemnifications. The Company’s maximum exposure under these arrangements is unknown. However, as of the date of these financial statements the Company has not had prior claims or losses pursuant to these contracts and expects the risk of loss to be remote.
| Financial Highlights |
| – Selected Per-Share Data (A) – |
| Net Asset | Net Realized | Net Increase | ||||||||||||||||||||||||||||||||||||||||||
| Value at | and Unrealized | Total from | Dividends from | Distributions | (Decrease) in | Net Asset | ||||||||||||||||||||||||||||||||||||||
| Beginning of | Net Investment | Payments from | Gain (Loss) on | Investment | Net Investment | from Realized | Distributions | Total | Net Asset | Value at End of | ||||||||||||||||||||||||||||||||||
| Class | Period | Income (Loss) | (to) Affiliate | Investments | Operations | Income | Capital Gains | from Capital | Distributions | Value | Period | |||||||||||||||||||||||||||||||||
| For the Six-Month Period Ended June 30, 2011 (Unaudited) | ||||||||||||||||||||||||||||||||||||||||||||
| IA | $ | 42.36 | $ | 0.24 | $ | – | $ | 0.71 | $ | 0.95 | $ | – | $ | – | $ | – | $ | – | $ | 0.95 | $ | 43.31 | ||||||||||||||||||||||
| IB | 42.00 | 0.19 | – | 0.70 | 0.89 | – | – | – | – | 0.89 | 42.89 | |||||||||||||||||||||||||||||||||
| For the Year Ended December 31, 2010 | ||||||||||||||||||||||||||||||||||||||||||||
| IA | 36.63 | 0.30 | – | 5.72 | 6.02 | (0.26 | ) | – | (0.03 | ) | (0.29 | ) | 5.73 | 42.36 | ||||||||||||||||||||||||||||||
| IB | 36.32 | 0.21 | – | 5.66 | 5.87 | (0.16 | ) | – | (0.03 | ) | (0.19 | ) | 5.68 | 42.00 | ||||||||||||||||||||||||||||||
| For the Year Ended December 31, 2009 | ||||||||||||||||||||||||||||||||||||||||||||
| IA | 25.34 | 0.31 | – | 11.27 | 11.58 | (0.29 | ) | – | – | (0.29 | ) | 11.29 | 36.63 | |||||||||||||||||||||||||||||||
| IB | 25.14 | 0.25 | – | 11.14 | 11.39 | (0.21 | ) | – | – | (0.21 | ) | 11.18 | 36.32 | |||||||||||||||||||||||||||||||
| For the Year Ended December 31, 2008 | ||||||||||||||||||||||||||||||||||||||||||||
| IA | 52.46 | 0.46 | – | (22.58 | ) | (22.12 | ) | (0.50 | )(H) | (4.28 | ) | (0.22 | )(H) | (5.00 | ) | (27.12 | ) | 25.34 | ||||||||||||||||||||||||||
| IB | 52.01 | 0.39 | – | (22.37 | ) | (21.98 | ) | (0.39 | )(H) | (4.28 | ) | (0.22 | )(H) | (4.89 | ) | (26.87 | ) | 25.14 | ||||||||||||||||||||||||||
| For the Year Ended December 31, 2007 | ||||||||||||||||||||||||||||||||||||||||||||
| IA | 53.49 | 0.35 | – | 8.36 | 8.71 | (0.07 | ) | (9.67 | ) | – | (9.74 | ) | (1.03 | ) | 52.46 | |||||||||||||||||||||||||||||
| IB | 53.21 | 0.22 | – | 8.28 | 8.50 | (0.03 | ) | (9.67 | ) | – | (9.70 | ) | (1.20 | ) | 52.01 | |||||||||||||||||||||||||||||
| For the Year Ended December 31, 2006 | ||||||||||||||||||||||||||||||||||||||||||||
| IA | 52.99 | 0.50 | 0.04 | 7.88 | 8.42 | (0.76 | ) | (7.16 | ) | – | (7.92 | ) | 0.50 | 53.49 | ||||||||||||||||||||||||||||||
| IB | 52.75 | 0.36 | 0.04 | 7.83 | 8.23 | (0.61 | ) | (7.16 | ) | – | (7.77 | ) | 0.46 | 53.21 | ||||||||||||||||||||||||||||||
| (A) | Information presented relates to a share outstanding throughout the indicated period. |
| (B) | The figures do not include sales charges or other fees which may be applied at the variable life insurance, variable annuity or qualified retirement plan product level. Any such additional sales charges or other fees would lower the Fund's performance. |
| (C) | Ratios do not reflect reductions for fees paid indirectly. Please see Fees Paid Indirectly in the Notes to Financial Statements. |
| (D) | Portfolio turnover rate is calculated on the basis of the Fund as a whole without distinguishing between the classes of shares issued. |
| (E) | Not annualized. |
| (F) | Annualized. |
| (G) | Total return without the inclusion of the Payment from (to) Affiliate can be found in Expenses in the accompanying Notes to Financial Statements. |
| (H) | In 2009, the Fund amended its 2008 federal tax return in order to change an election relating to the recognition and classification of certain net realized losses and ordinary income items. As a result, a portion of the distributions that were made by the Fund during 2008 were reclassified as return of capital. This reclassification had no impact on the total net assets or net asset value of the Fund. |
| Ratio of Expenses to Average Net | Ratio of Expenses to Average Net | Ratio of Net Investment Income to | Portfolio Turnover | ||||||||||||||||||||
| Total Return(B) | Net Assets at End of Period | Assets Before Waivers(C) | Assets After Waivers(C) | Average Net Assets | Rate(D) | ||||||||||||||||||
| 2.25 | %(E) | $ | 8,442,450 | 0.66 | %(F) | 0.66 | %(F) | 1.08 | %(F) | 57 | % | ||||||||||||
| 2.12 | (E) | 1,409,279 | 0.91 | (F) | 0.91 | (F) | 0.83 | (F) | – | ||||||||||||||
| 16.50 | 8,889,906 | 0.67 | 0.67 | 0.77 | 95 | ||||||||||||||||||
| 16.21 | 1,522,218 | 0.92 | 0.92 | 0.52 | – | ||||||||||||||||||
| 45.67 | (G) | 8,410,214 | 0.68 | 0.68 | 1.03 | 128 | |||||||||||||||||
| 45.30 | (G) | 1,595,912 | 0.93 | 0.93 | 0.79 | – | |||||||||||||||||
| (45.59 | ) | 6,017,984 | 0.67 | 0.67 | 1.12 | 131 | |||||||||||||||||
| (45.73 | ) | 1,295,065 | 0.92 | 0.92 | 0.87 | – | |||||||||||||||||
| 16.83 | 12,123,834 | 0.67 | 0.67 | 0.68 | 101 | ||||||||||||||||||
| 16.53 | 2,933,905 | 0.92 | 0.92 | 0.42 | – | ||||||||||||||||||
| 16.61 | (G) | 11,746,831 | 0.67 | 0.67 | 0.82 | 73 | |||||||||||||||||
| 16.32 | (G) | 2,810,587 | 0.92 | 0.92 | 0.57 | – | |||||||||||||||||
| Directors and Officers (Unaudited) |
The Board of Directors of the Company appoints officers who are responsible for the day-to-day operations of the Fund and who execute policies formulated by the Directors. Each director serves until his or her death, resignation, or retirement or until the next annual meeting of shareholders is held or until his or her successor is elected and qualifies.
Directors and officers who are employed by or who have a financial interest in The Hartford are considered “interested” persons of the Fund pursuant to the 1940 Act. Each officer and two of the Company’s directors, as noted in the chart below, are “interested” persons of the Fund. Each director serves as a director for The Hartford Mutual Funds, Inc., The Hartford Mutual Funds II, Inc., Hartford Series Fund, Inc., and Hartford HLS Series Fund II, Inc., which, as of June 30, 2011, collectively consist of 89 funds. Correspondence may be sent to directors and officers c/o Hartford Mutual Funds, P.O. Box 2999, Hartford, Connecticut 06104-2999, except that correspondence to Ms. Fagely may be sent to 500 Bielenberg Drive, Woodbury, Minnesota 55125.
The table below sets forth, for each director and officer, his or her name, year of birth, current position with the Company and date first elected or appointed to Hartford Series Fund, Inc. (“HSF”), and Hartford HLS Series Fund II, Inc. (“HSF2”), principal occupation, and, for directors, other directorships held. The Fund’s statement of additional information contains further information on the directors and is available free of charge by calling 1-800-862-6668 or writing to Hartford HLS Funds, c/o Individual Annuity Services, P.O. Box 5085, Hartford, CT 06102-5085.
Information on the aggregate remuneration paid to the directors of the Company can be found in the Statement of Operations herein. The Fund pays to The Hartford a portion of the chief compliance officer’s compensation, but does not pay salaries or compensation to any of their other officers or directors who are employed by The Hartford.
Non-Interested Directors
Lynn S. Birdsong (1946) Director since 2003, Co-Chairman of the Investment Committee
Mr. Birdsong is a private investor. Mr. Birdsong currently serves as a Director of the Sovereign High Yield Investment Company (April 2010 to current). Mr. Birdsong currently serves as an Independent Director of Nomura Partners Funds, Inc. (formerly, The Japan Fund) (March 2003 to current). From 2003 to March 2005, Mr. Birdsong was an independent director of the Atlantic Whitehall Funds. From 1979 to 2002, Mr. Birdsong was a managing director of Zurich Scudder Investments, an investment management firm. During his employment with Scudder, Mr. Birdsong was an Interested Director of The Japan Fund. Since 1981, Mr. Birdsong has been a partner in Birdsong Company, an advertising specialty firm.
Robert M. Gavin, Jr. (1940) Director since 2002 (HSF) and 1986 (HSF2), Chairman of the Board since 2004
Dr. Gavin is an educational consultant. Prior to September 1, 2001, he was President of Cranbrook Education Community and prior to July 1996, he was President of Macalester College, St. Paul, Minnesota.
Duane E. Hill (1945) Director since 2001 (HSF) and 2002 (HSF2), Chairman of the Nominating Committee
Mr. Hill is Partner of TSG Ventures L.P., a private equity investment company. Mr. Hill is a former partner of TSG Capital Group, a private equity investment firm that served as sponsor and lead investor in leveraged buyouts of middle market companies.
Sandra S. Jaffee (1941) Director since 2005
Ms. Jaffee served as Chairman (2008 to 2009) and Chief Executive Officer of Fortent (formerly Searchspace Group), a leading provider of compliance/regulatory technology to financial institutions from August 2005 to August 2009. From August 2004 to August 2005, Ms. Jaffee served as an Entrepreneur in Residence with Warburg Pincus, a private equity firm. From September 1995 to July 2004, Ms. Jaffee served as Executive Vice President at Citigroup, where she was President and Chief Executive Officer of Citibank’s Global Securities Services (1995 to 2003). Ms. Jaffe currently serves as a member of the Board of Directors of Broadridge Financial Solutions as well as a Trustee of Muhlenberg College.
William P. Johnston (1944) Director since 2005, Chairman of the Compliance Committee
In June 2006, Mr. Johnston was appointed as Senior Advisor to The Carlyle Group, a global private equity investment firm. In July 2006, Mr. Johnston was elected to the Board of Directors of MultiPlan, Inc. In August 2007, Mr. Johnston was elected to the Board of Directors of LifeCare Holdings, Inc. In February 2008, Mr. Johnston was elected to the Board of Directors of HCR-ManorCare, Inc. In May 2006, Mr. Johnston was elected to the Supervisory Board of Fresenius Medical Care AG & Co. KGaA, after its acquisition of Renal Care Group, Inc. in March 2006. Mr. Johnston joined Renal Care Group in November 2002 as a member of the Board of Directors and served as Chairman of the Board from March 2003 through March 2006. From September 1987 to December 2002, Mr. Johnston was with Equitable Securities Corporation (and its successors, SunTrust Equitable Securities and SunTrust Robinson Humphrey) serving in various investment banking and managerial positions, including Managing Director and Head of Investment Banking, Chief Executive Officer and Vice Chairman.
Phillip O. Peterson (1944) Director since 2002 (HSF) and 2000 (HSF2), Chairman of the Audit Committee
Mr. Peterson is a mutual fund industry consultant. He was a partner of KPMG LLP (an accounting firm) until July 1999. Mr. Peterson joined William Blair Funds in February 2007 as a member of the Board of Trustees. From January 2004 to April 2005, Mr. Peterson served as Independent President of the Strong Mutual Funds.
Lemma W. Senbet (1946) Director since 2005
Dr. Senbet is the William E. Mayer Chair Professor of Finance and Director, Center for Financial Policy, at the University of Maryland, Robert H. Smith School of Business. He was chair of the Finance Department from 1998 to 2006. Previously he was a chaired professor of finance at the University of Wisconsin-Madison. Also, he was director of the Fortis Funds from March 2000 to July 2002. Dr. Senbet served the finance profession in various capacities, including as director of the American Finance Association and President of the Western Finance Association. In 2006, Dr. Senbet was inducted Fellow of Financial Management Association International for his career-long distinguished scholarship and professional service.
Interested Directors and Officers
David N. Levenson (1966) Director since 2010
Mr. Levenson currently serves as President of The Hartford’s Wealth Management business. He was appointed to this role in July 2010. Previously, Mr. Levenson served as Executive Vice President of Legacy Holdings for The Hartford from June 2009 to July 2010. From 2006 to 2009, Mr. Levenson was with Hartford Life Insurance K.K. where he served as President and CEO from 2007 to 2009. He served as Managing Director of Hartford Investment Management Company from 2005 to 2006. Additionally, Mr. Levenson serves as Executive Vice President of The Hartford and as President, Director and Chief Executive Officer of Hartford Life Insurance Company (“HLIC”) and Hartford Life, Inc. (“HL Inc.”).
Lowndes A. Smith (1939) Director since 1996 (HSF) and 2002 (HSF2), Co-Chairman of the Investment Committee
Mr. Smith served as Vice Chairman of The Hartford from February 1997 to January 2002, as President and Chief Executive Officer of HL Inc. from February 1997 to January 2002, and as President and Chief Operating Officer of The Hartford Life Insurance Companies from January 1989 to January 2002. Mr. Smith serves as a Director of White Mountains Insurance Group, Ltd., One Beacon Insurance and Symetra Financial and as a Managing Director of Whittington Gray Associates.
Other Officers
James E. Davey (1964) President and Chief Executive Officer since 2010
Mr. Davey serves as Executive Vice President of HLIC. Additionally, Mr. Davey serves as President, Chief Executive Officer and Manager of Hartford Investment Financial Services, Inc. (“HIFSCO”) and President, Chief Executive Officer and Manager of HL Advisors. Mr. Davey joined The Hartford in 2002.
Tamara L. Fagely (1958) Vice President, Treasurer and Controller since 2002 (HSF) and 1993 (HSF2)
Ms. Fagely has been a Vice President of HASCO since 1998 and Chief Financial Officer since 2006. Currently Ms. Fagely is a Vice President of HLIC. She served as Assistant Vice President of HLIC from December 2001 through March 2005. In addition, Ms. Fagely is Controller and Chief Financial Officer of HIFSCO.
Susan M. Fleege (1959) AML Compliance Officer since 2011
Ms. Fleege currently serves as a Director of Risk Management at The Hartford. She previously served as AML Compliance Officer for the Fund from 2005-2008. Ms. Fleege joined HLIC in 2005 from Amerprise Financial Corporation where she held the position of Counsel from 2000 to 2005. Ms. Fleege is a certified Anti-Money Laundering Specialist.
Dr. Robert J. Froehlich (1953) Senior Managing Director since 2009
Dr. Froehlich joined The Hartford as Senior Managing Director in September 2009. Prior to joining The Hartford, Dr. Froehlich served as Vice Chairman of Deutsche Asset Management from 1997-2009.
Edward P. Macdonald (1967) Vice President, Secretary and Chief Legal Officer since 2005
Mr. Macdonald serves as Vice President of HLIC and Chief Legal Officer of Mutual Funds and Vice President of HIFSCO. He also serves as Vice President and Secretary of HASCO, and Chief Legal Officer, Secretary and Vice President of HL Advisors. Mr. Macdonald joined The Hartford in 2005.
| Hartford Capital Appreciation HLS Fund |
| Directors and Officers (Unaudited) – (continued) |
Vernon J. Meyer (1964) Vice President since 2006
Mr. Meyer serves as Senior Vice President of HLIC. He also serves as Senior Vice President of HIFSCO and HL Advisors. Mr. Meyer joined The Hartford in 2004.
Colleen B. Pernerewski (1969) Vice President and Chief Compliance Officer since 2010
Ms. Pernerewski serves as Vice President and Chief Investment Advisor Compliance Officer of HIFSCO and as Vice President and Chief Compliance Officer of HL Advisors. Ms. Pernerewski joined The Hartford in 2005 from Travelers Life and Annuity where she served as Counsel (2004-2005). Prior to Travelers Life and Annuity, Ms. Pernerewski held the position of Counsel at The Hartford (1998-2004).
Elizabeth L. Schroeder (1966) Vice President since 2010
Ms. Schroeder currently serves as Assistant Vice President of HLIC. Ms. Schroeder joined HLIC in 1991. She is also an Assistant Vice President of HIFSCO and HL Advisers.
Martin Swanson (1962) Vice President since 2010
Mr. Swanson is a Vice President of HLIC. Mr. Swanson also serves as Vice President/Marketing for HIFSCO. Prior to joining HLIC in 1998, Mr. Swanson was a Vice President at PaineWebber, Inc.
Jane Wolak (1961) Vice President since 2009
Ms. Wolak currently serves as Senior Vice President of HLIC. Ms. Wolak joined HLIC as Vice President, Retail Product Services in May 2007. She is also Vice President of HASCO. Previously, Ms. Wolak was with Sun Life Financial where she held the position of Vice President, Service Center Operations from 2001-2007.
A description of the policies and procedures that the Fund uses to determine how to vote proxies relating to portfolio securities and a record of how the Fund voted any proxies for the twelve-month period ended June 30, 2011 are available (1) without charge, upon request, by calling 800-862-6668 and (2) on the SEC’s website at http://www.sec.gov.
The Fund files a complete schedule of portfolio holdings with the SEC for the first and third quarters of each fiscal year on Form N-Q. The Fund’s Forms are available (1) without charge, upon request, by calling 800-862-6668 and (2) on the SEC’s website at http://www.sec.gov. The Form N-Q may be reviewed and copied at the SEC’s Public Reference Room in Washington, DC. Information on the operation of the Public Reference Room may be obtained by calling 1-800-SEC-0330.
| Expense Example (Unaudited) |
Your Fund's Expenses
As a shareholder of the Fund, you incur two types of costs: (1) transaction costs and (2) ongoing costs including investment management fees, distribution fees, and other fund expenses. This example is intended to help you understand your ongoing costs (in dollars) of investing in a Fund and to compare these costs with the ongoing costs of investing in other mutual funds. The example is based on an investment of $1,000 invested at the beginning of the period and held for the period of December 31, 2010 through June 30, 2011.
Actual Expenses
The first set of columns of the table below provides information about actual account values and actual expenses. You may use the information in this column, together with the amount you invested, to estimate the expenses that you paid over the period. Simply divide your account value by $1,000 (for example, an $8,600 account value divided by $1,000 = 8.6), then multiply the result by the number in the line under the heading entitled “Expenses Paid During Period” to estimate the expenses you paid on your account during this period.
Hypothetical Example for Comparison Purposes
The second set of columns of the table below provides information about hypothetical account values and hypothetical expenses based on a Fund's actual expense ratio and an assumed rate of return of 5% per year before expenses, which is not the Fund's actual return. The hypothetical account values and expenses may not be used to estimate the actual ending account balance or expenses you paid for the period. You may use this information to compare the ongoing costs of investing in a Fund and other funds. To do so, compare this 5% hypothetical example with the 5% hypothetical examples that appear in the shareholder reports of the other funds.
Please note that the expenses shown in the table are meant to highlight your ongoing costs only and do not reflect any transactional costs, such as sales charges (loads) and CDSC. Therefore, the second set of columns of the table is useful in comparing ongoing costs only, and will not help you determine the relative total costs of owning different funds. In addition, if these transactional costs were included, your costs would be higher. Expenses are equal to the Fund's annualized expense ratios multiplied by average account value over the period, multiplied by 181/365 (to reflect the one-half year period).
| Actual return | Hypothetical (5% return before expenses) | |||||||||||||||||||||||||||||||||||
| Expenses paid | Expenses paid | Days in | ||||||||||||||||||||||||||||||||||
| during the period | during the period | the | Days | |||||||||||||||||||||||||||||||||
| Beginning | Ending | December 31, 2010 | Beginning | Ending | December 31, 2010 | Annualized | current | in the | ||||||||||||||||||||||||||||
| Account Value | Account Value | through | Account Value | Account Value | through | expense | 1/2 | full | ||||||||||||||||||||||||||||
| December 31, 2010 | June 30, 2011 | June 30, 2011 | December 31, 2010 | June 30, 2011 | June 30, 2011 | ratio | year | year | ||||||||||||||||||||||||||||
| Class IA | $ | 1,000.00 | $ | 1,022.48 | $ | 3.31 | $ | 1,000.00 | $ | 1,021.52 | $ | 3.31 | 0.66 | % | 181 | 365 | ||||||||||||||||||||
| Class IB | $ | 1,000.00 | $ | 1,021.22 | $ | 4.56 | $ | 1,000.00 | $ | 1,020.28 | $ | 4.56 | 0.91 | % | 181 | 365 | ||||||||||||||||||||
31
The Hartford P.O. Box 5085 Hartford, CT 06102-5085 |
Hartford Series Fund, Inc. is underwritten and distributed by Hartford Securities Distribution Company, Inc.
“The Hartford” is The Hartford Financial Services Group, Inc. and its subsidiaries.
Hartford Series Fund, Inc. inception dates range from 1977 to date. Hartford Series Fund, Inc. is not a subsidiary of The Hartford but is underwritten, distributed by and advised by subsidiaries of The Hartford. Investments in Hartford Series Fund, Inc. are not guaranteed by The Hartford or any other entity.
You should carefully consider investment objectives, risks, and charges and expenses of Hartford HLS Funds before investing. This and other information can be found in the Fund’s prospectus or summary prospectus, which can be obtained by calling 800-862-6668. Please read them carefully before you invest or send money.
HLSSAR-CA11 8-11 106632 Printed in U.S.A ©2011 The Hartford, Hartford, CT 06115 |
A MESSAGE FROM THE PRESIDENT

Dear Fellow Shareholders:
I want to take this opportunity to say thank you for your continued confidence and trust.
We have seen a significant amount of global turbulence in the first half of 2011. Investors have continued to be concerned about the implications of the European sovereign debt crisis, as well as our own high levels of domestic debt. Since January we have witnessed significant political uprisings in the already-volatile Middle East and North Africa region. In addition, the ramifications of Japan's massive earthquake, subsequent tsunami, and nuclear disaster are still being played out in the market.
Although corporate earnings have remained robust, the unemployment picture has been mixed. After adding more than 200,000 jobs from February to April, more recent unemployment reports have shown a pullback in hiring.
While official inflation remains low as measured by the Consumer Price Index (CPI), high oil prices may be indicative of higher inflation in the future. The federal funds rate remains at a historic low, however, the Fed could potentially raise the rate to get it closer to its historical average once the economy strengthens.
Even with these headwinds, domestic, international, and world indices (as measured by the S&P 500, MSCI EAFE and MSCI World) are all up more than 5% through June, 30 2011.
Looking ahead, continued growth in emerging markets is fueling global recovery efforts. Emerging markets comprise about 48 percent of the world’s GDP, and many economists believe they are poised for further expansion. As GDP growth continues in emerging markets, roughly 100 million people are added to the middle class each year. This middle class population growth could potentially drive a considerable shift in consumer purchasing power.
Now that we have reached the midpoint of 2011, perhaps now would be a good time to schedule a meeting with your financial adviser to examine your current investment strategy and determine whether you are on the right track.
| • | Are you concerned about inflation and its effects on your portfolio? |
| • | Is your portfolio prepared for rising interest rates? |
| • | Does your portfolio reflect the global economy with a mix of developed nations and emerging markets? |
Your financial professional’s advice can help you to navigate today’s volatile markets with confidence. You can also rest assured that we will continue to provide you with solid investments and stellar service for the road ahead.
Thank you again for your business.

James Davey
President
Hartford HLS Funds
Hartford Disciplined Equity HLS Fund
| Manager Discussion (Unaudited) | 2 |
| Financial Statements | |
| 5 | |
| 8 | |
| 9 | |
| 10 | |
| 11 | |
| 12 | |
| 22 | |
| 24 | |
| 26 | |
| 26 | |
| 27 |
This report is prepared for the general information of contract owners and qualified retirement plan participants. It is not an offer of contracts or of qualified retirement plans. It should not be used in connection with any offer, except in conjunction with the appropriate product prospectus which contains all pertinent information including the applicable sales, administrative and other charges.
The views expressed in the Fund’s Manager Discussion under ‘‘Why did the Fund perform this way?’’ and ‘‘What is the outlook?’’ are views of the Fund’s sub-adviser and portfolio management team through the end of the reporting period and are subject to change based on market and other conditions.
Hartford Disciplined Equity HLS Fund inception 05/29/1998 |
| (sub-advised by Wellington Management Company, LLP) |
| Investment objective – Seeks growth of capital. |
Performance Overview 6/30/01 – 6/30/11

The chart above shows the growth of a $10,000 investment in Class IA. Growth results in classes other than Class IA will vary from what is seen above due to differences in the expenses charged to those share classes.
Average Annual Total Returns (as of 6/30/11)
6 Month† | 1 Year | 5 year | 10 year | |||||
| Disciplined Equity IA | 7.77 % | 33.38 % | 3.01 % | 2.24 % | ||||
| Disciplined Equity IB | 7.63 % | 33.04 % | 2.75 % | 1.99 % | ||||
| S&P 500 Index | 6.01 % | 30.68 % | 2.94 % | 2.72 % |
| † | Not Annualized |
PAST PERFORMANCE IS NOT INDICATIVE OF FUTURE RESULTS.
Total returns presented above were calculated using the Fund's net asset value available to shareholders for sale or redemption of Fund shares on June 30, 2011, which excludes investment transactions as of this date.
S&P 500 Index is a market capitalization-weighted price index composed of 500 widely held common stocks.
You cannot invest directly in an index.
The chart represents a hypothetical investment in the Fund. Performance data represents past performance and current performance could be higher or lower.
Performance information may reflect historical or current expense waivers/reimbursements from the investment adviser, without which performance would have been lower. For information on current expense waivers/reimbursements, please see the prospectus.
The value of the fund will fluctuate so that when redeemed, it may be worth more or less than the original investment. The chart and table do not reflect the deductions of taxes, sales charges or other fees which may be applied at the variable life insurance, variable annuity or qualified retirement plan product level. Any such additional sales charges or other fees or expenses would lower the contract’s or plan’s performance.
| Portfolio Manager |
| Mammen Chally, CFA |
| Vice President |
How did the Fund perform?
The Class IA shares of the Hartford Disciplined Equity HLS Fund returned 7.77% for the six-month period ended June 30, 2011, outperforming its benchmark, the S&P 500, which returned 6.01% for the same period. The Fund also outperformed the 4.93% return of the average fund in the Lipper Large-Cap Core Funds VP-UF peer group, a group of funds with investment strategies similar to those of the Fund.
Why did the Fund perform this way?
U.S. equities moved higher during the period despite a high degree of volatility caused by mounting concerns about unrest in North Africa and the Middle East and the devastating earthquake and nuclear crisis in Japan. Equities were pushed higher by investors’ enthusiasm for additional government debt purchases by the U.S. Federal Reserve, the extension of tax cuts in the U.S., and strong earnings growth. Fears of a global economic slowdown due to sovereign debt troubles in Europe, Japanese supply disruptions, and the end of the Federal Reserve’s quantitative easing program were not enough to offset optimism about the global economy, strong corporate earnings, and a continued accommodative Fed policy.
Overall equity market performance was positive for the period across all market capitalizations: large-cap equities (+6%), mid-caps (+9%), and small-caps (+6%) all rose as represented by the S&P 500, S&P 400 MidCap, and Russell 2000 Indices, respectively. During the six-month period nine of ten sectors within the S&P 500 Index posted positive returns, led by Health Care (+14%) and Energy (+11%), while Financials (-3%) was the only sector to produce negative absolute returns (i.e. total return).
The Fund outperformed its benchmark due to stock selection, which was strongest in Information Technology, Health Care, and Industrials. This was partially offset by weaker security selection in Financials, Utilities, and Materials. Sector positioning, which is a fallout of the bottom-up (i.e. stock by stock fundamental research) stock selection process, modestly detracted from benchmark-relative (i.e. performance of the Fund as measured against the benchmark) returns. In particular, an underweight (i.e. the Fund’s sector position was less than the benchmark position) position in Energy and an overweight (i.e. the Fund’s sector position was greater than the benchmark position) position in Information Technology detracted from relative performance.
The largest contributors to absolute and relative performance were UnitedHealth Group (Health Care), Regeneron Pharmaceuticals (Health Care), and Marathon Oil (Energy). Healthcare benefits and services provider UnitedHealth Group reported strong first quarter earnings, beating analysts’ estimates, driven in part by reduced use of services by its members. Investors also looked favorably on the increase in enrollments as a potential sign of growth going forward, pushing the stock higher. Regeneron Pharmaceuticals, a biotechnology company, reported favorable results from a study on its key pipeline drug for second-line treatment of metastatic colorectal cancer. Marathon Oil, a large U.S. refiner and oil exploration company, announced a split-up of refining and oil production, leading to a large rally in the company’s stock.
The largest detractors from absolute and performance relative to the benchmark were Goldman Sachs (Financials), Wells Fargo (Financials), and Bank of America (Financials). Investment bank and brokerage company Goldman Sachs’ shares came under pressure as investors continued to discount the potential impact of financial industry regulation on revenues and profits. Shares of Wells Fargo, a diversified financial services company, were pressured by uncertainty over regulatory capital requirements and the near-term direction of fee and interest income. Bank of America is a large U.S.-based multinational financial services company. The company’s stock suffered during the period due to uncertainty over the ultimate cost to the company from settlements related to soured mortgages. The likely cost was ascertained towards the end of June in a settlement with holders of bonds issued by Countrywide Financial, which Bank of America acquired in 2008. In addition, elevated expenses, which affected first quarter earnings results, and a change in CFO helped pressure the stock downwards during the period.
What is the outlook?
The recent economic news flow in the U.S. has been disappointing. Consumers are faced with accelerating inflation at a time when their balance sheets continue to be stretched. Property prices in particular are showing renewed weakness, and given the chronic overhang of supply, more housing price declines can be expected.
Japanese transplants have cut production by more than 50% in the economically important U.S. auto industry. This is a temporary supply-side distortion following Japan’s earthquake and will be followed by a technical production rebound in the second-half as supply chains get restored. A second boost can be expected from the recently legislated 100% depreciation allowance for capital goods purchases towards the end of this year.
Fiscal policy is the wild card for the economy in 2012. We anticipate a fiscal drag of GDP in 2012, leading to a gradual reduction in the U.S. fiscal deficit, while enabling another year of moderate, but positive economic growth.
The Fund focuses on stock selection as the key driver of returns and uses proprietary fundamental and quantitative research in a disciplined framework to build a portfolio of the most attractive stocks. Sector exposures are residuals from this bottom-up stock selection process and are not explicit management decisions. Based on individual stock decisions, the Fund ended the period most overweight the Information Technology, Health Care, and Utilities sectors and most underweight the Energy, Telecommunication Services, and Consumer Staples sectors relative to the S&P 500 Index, the Fund’s benchmark.
Diversification by Industry
as of June 30, 2011
| Percentage of | ||||
| Industry (Sector) | Net Assets | |||
Automobiles & Components (Consumer Discretionary) | 2.2 | % | ||
| Banks (Financials) | 4.7 | |||
| Capital Goods (Industrials) | 11.4 | |||
Consumer Durables & Apparel (Consumer Discretionary) | 1.3 | |||
| Consumer Services (Consumer Discretionary) | 1.3 | |||
| Diversified Financials (Financials) | 6.6 | |||
| Energy (Energy) | 9.2 | |||
| Food & Staples Retailing (Consumer Staples) | 1.2 | |||
| Food, Beverage & Tobacco (Consumer Staples) | 6.9 | |||
| Health Care Equipment & Services (Health Care) | 4.0 | |||
| Household & Personal Products (Consumer Staples) | 0.5 | |||
| Insurance (Financials) | 1.9 | |||
| Materials (Materials) | 2.6 | |||
Pharmaceuticals, Biotechnology & Life Sciences (Health Care) | 10.8 | |||
| Retailing (Consumer Discretionary) | 7.1 | |||
Semiconductors & Semiconductor Equipment (Information Technology) | 1.7 | |||
| Software & Services (Information Technology) | 14.1 | |||
Technology Hardware & Equipment (Information Technology) | 5.2 | |||
| Telecommunication Services (Services) | 0.8 | |||
| Utilities (Utilities) | 5.0 | |||
| Short-Term Investments | 1.4 | |||
| Other Assets and Liabilities | 0.1 | |||
| Total | 100.0 | % | ||
| Schedule of Investments |
| June 30, 2011 (Unaudited) |
| (000’s Omitted) |
| Shares or Principal Amount | Market Value ╪ | ||||||
| COMMON STOCKS - 98.5% | |||||||
| Automobiles & Components - 2.2% | |||||||
| 724 | Ford Motor Co. · | $ | 9,987 | ||||
| 254 | General Motors Co. · | 7,699 | |||||
| 123 | TRW Automotive Holdings Corp. · | 7,284 | |||||
| 24,970 | |||||||
| Banks - 4.7% | |||||||
| 340 | BB&T Corp. | 9,114 | |||||
| 276 | PNC Financial Services Group, Inc. Ø | 16,423 | |||||
| 998 | Wells Fargo & Co. | 28,014 | |||||
| 53,551 | |||||||
| Capital Goods - 11.4% | |||||||
| 202 | 3M Co. | 19,187 | |||||
| 202 | AMETEK, Inc. | 9,088 | |||||
| 89 | Caterpillar, Inc. | 9,422 | |||||
| 150 | Cooper Industries plc Class A | 8,966 | |||||
| 184 | Dover Corp. | 12,477 | |||||
| 146 | Illinois Tool Works, Inc. | 8,236 | |||||
| 233 | Northrop Grumman Corp. | 16,131 | |||||
| 100 | Parker-Hannifin Corp. | 8,992 | |||||
| 76 | TransDigm Group, Inc. · | 6,930 | |||||
| 224 | United Technologies Corp. | 19,848 | |||||
| 61 | W.W. Grainger, Inc. | 9,379 | |||||
| 128,656 | |||||||
| Consumer Durables & Apparel - 1.3% | |||||||
| 91 | Deckers Outdoor Corp. · | 7,995 | |||||
| 106 | Phillips Van-Heusen Corp. | 6,908 | |||||
| 14,903 | |||||||
| Consumer Services - 1.3% | |||||||
| 169 | McDonald's Corp. | 14,267 | |||||
| Diversified Financials - 6.6% | |||||||
| 152 | Ameriprise Financial, Inc. | 8,769 | |||||
| 1,598 | Bank of America Corp. | 17,518 | |||||
| 33 | BlackRock, Inc. | 6,291 | |||||
| 104 | Goldman Sachs Group, Inc. | 13,895 | |||||
| 393 | JP Morgan Chase & Co. | 16,083 | |||||
| 176 | Nasdaq OMX Group, Inc. · | 4,448 | |||||
| 434 | SLM Corp. | 7,294 | |||||
| 74,298 | |||||||
| Energy - 9.2% | |||||||
| 172 | Anadarko Petroleum Corp. Θ | 13,233 | |||||
| 276 | Chesapeake Energy Corp. | 8,186 | |||||
| 120 | Chevron Corp. | 12,295 | |||||
| 342 | Exxon Mobil Corp. | 27,803 | |||||
| 211 | Marathon Oil Corp. | 11,101 | |||||
| 192 | Occidental Petroleum Corp. | 19,940 | |||||
| 240 | Ultra Petroleum Corp. · | 10,986 | |||||
| 103,544 | |||||||
| Food & Staples Retailing - 1.2% | |||||||
| 307 | Walgreen Co. | 13,015 | |||||
| Food, Beverage & Tobacco - 6.9% | |||||||
| 407 | Altria Group, Inc. | 10,742 | |||||
| 277 | Constellation Brands, Inc. Class A · | 5,765 | |||||
| 138 | Dr. Pepper Snapple Group | 5,803 | |||||
| 102 | Lorillard, Inc. | 11,105 | |||||
| 211 | PepsiCo, Inc. | 14,833 | |||||
| 443 | Philip Morris International, Inc. | 29,557 | |||||
| 77,805 | |||||||
| Health Care Equipment & Services - 4.0% | |||||||
| 177 | Covidien plc | 9,400 | |||||
| 132 | McKesson Corp. | 11,042 | |||||
| 132 | St. Jude Medical, Inc. | 6,272 | |||||
| 355 | UnitedHealth Group, Inc. | 18,288 | |||||
| 45,002 | |||||||
| Household & Personal Products - 0.5% | |||||||
| 92 | Kimberly-Clark Corp. | 6,137 | |||||
| Insurance - 1.9% | |||||||
| 214 | Allied World Assurance Holdings Ltd. | 12,321 | |||||
| 360 | Unum Group | 9,161 | |||||
| 21,482 | |||||||
| Materials - 2.6% | |||||||
| 264 | Dow Chemical Co. | 9,510 | |||||
| 155 | Freeport-McMoRan Copper & Gold, Inc. Θ | 8,210 | |||||
| 102 | Mosaic Co. Θ | 6,936 | |||||
| 93 | Newmont Mining Corp. | 5,008 | |||||
| 29,664 | |||||||
| Pharmaceuticals, Biotechnology & Life Sciences - 10.8% | |||||||
| 156 | Agilent Technologies, Inc. · | 7,976 | |||||
| 254 | Amgen, Inc. · | 14,845 | |||||
| 166 | Celgene Corp. · | 9,993 | |||||
| 314 | Forest Laboratories, Inc. · | 12,345 | |||||
| 214 | Gilead Sciences, Inc. · | 8,862 | |||||
| 484 | Merck & Co., Inc. | 17,072 | |||||
| 539 | Pfizer, Inc. | 11,113 | |||||
| 123 | Regeneron Pharmaceuticals, Inc. · | 6,987 | |||||
| 153 | Salix Pharmaceuticals Ltd. · | 6,109 | |||||
| 112 | Thermo Fisher Scientific, Inc. · | 7,180 | |||||
| 87 | Waters Corp. · | 8,328 | |||||
| 172 | Watson Pharmaceuticals, Inc. · | 11,815 | |||||
| 122,625 | |||||||
| Retailing - 7.1% | |||||||
| 116 | Abercrombie & Fitch Co. Class A | 7,738 | |||||
| 70 | Amazon.com, Inc. ·Θ | 14,298 | |||||
| 256 | Guess?, Inc. Θ | 10,763 | |||||
| 394 | Lowe's Co., Inc. | 9,192 | |||||
| 27 | Netflix, Inc. ·Θ | 7,080 | |||||
| 17 | Priceline.com, Inc. · | 8,856 | |||||
| 114 | Ross Stores, Inc. | 9,115 | |||||
| 262 | TJX Cos., Inc. | 13,743 | |||||
| 80,785 | |||||||
| Semiconductors & Semiconductor Equipment - 1.7% | |||||||
| 132 | Avago Technologies Ltd. | 5,024 | |||||
| 155 | Skyworks Solutions, Inc. · | 3,550 | |||||
| 332 | Texas Instruments, Inc. | 10,903 | |||||
| 19,477 | |||||||
| Software & Services - 14.1% | |||||||
| 316 | Accenture plc | 19,088 | |||||
| 211 | BMC Software, Inc. · | 11,532 | |||||
| 471 | eBay, Inc. · | 15,195 | |||||
| 91 | Factset Research Systems, Inc. | 9,289 | |||||
| 27 | Google, Inc. · | 13,910 | |||||
| 136 | IBM Corp. | 23,352 | |||||
| 782 | Oracle Corp. | 25,738 | |||||
| 226 | Solera Holdings, Inc. | 13,392 | |||||
| 137 | Teradata Corp. · | 8,217 | |||||
| 310 | VeriSign, Inc. | 10,361 | |||||
The accompanying notes are an integral part of these financial statements.
| Hartford Disciplined Equity HLS Fund |
| Schedule of Investments – (continued) |
| June 30, 2011 (Unaudited) |
| (000’s Omitted) |
| Shares or Principal Amount | Market Value ╪ | ||||||||||
| COMMON STOCKS - 98.5% - (continued) | |||||||||||
| Software & Services - 14.1% - (continued) | |||||||||||
| 498 | Western Union Co. | $ | 9,973 | ||||||||
| 160,047 | |||||||||||
| Technology Hardware & Equipment - 5.2% | |||||||||||
| 95 | Apple, Inc. · | 31,784 | |||||||||
| 553 | EMC Corp. ·Θ | 15,228 | |||||||||
| 105 | Juniper Networks, Inc. · | 3,292 | |||||||||
| 160 | Qualcomm, Inc. | 9,081 | |||||||||
| 59,385 | |||||||||||
| Telecommunication Services - 0.8% | |||||||||||
| 1,601 | Sprint Nextel Corp. · | 8,629 | |||||||||
| Utilities - 5.0% | |||||||||||
| 160 | Entergy Corp. | 10,913 | |||||||||
| 120 | NextEra Energy, Inc. | 6,866 | |||||||||
| 228 | Northeast Utilities | 8,005 | |||||||||
| 274 | PG&E Corp. | 11,508 | |||||||||
| 189 | UGI Corp. | 6,027 | |||||||||
| 549 | Xcel Energy, Inc. | 13,352 | |||||||||
| 56,671 | |||||||||||
| Total common stocks | |||||||||||
| (cost $883,368) | $ | 1,114,913 | |||||||||
| Total long-term investments | |||||||||||
| (cost $883,368) | $ | 1,114,913 | |||||||||
| SHORT-TERM INVESTMENTS - 1.4% | |||||||||||
| Repurchase Agreements - 1.4% | |||||||||||
| Bank of America Merrill Lynch TriParty Joint | |||||||||||
| Repurchase Agreement (maturing on | |||||||||||
| 07/01/2011 in the amount of $1,526, | |||||||||||
| collateralized by FHLB 4.91%, 2015, | |||||||||||
| GNMA 0.87% - 5.72%, 2025 - 2061, value | |||||||||||
| of $1,556) | |||||||||||
| $ | 1,526 | 0.05%, 06/30/2011 | $ | 1,526 | |||||||
| BNP Paribas Securities Corp. TriParty Joint | |||||||||||
| Repurchase Agreement (maturing on | |||||||||||
| 07/01/2011 in the amount of $1,148, | |||||||||||
| collateralized by FNMA 3.50% - 6.50%, | |||||||||||
| 2023 - 2041, value of $1,171) | |||||||||||
| 1,148 | 0.05%, 06/30/2011 | 1,148 | |||||||||
| Deutsche Bank Securities TriParty Joint | |||||||||||
| Repurchase Agreement (maturing on | |||||||||||
| 07/01/2011 in the amount of $11,106, | |||||||||||
| collateralized by GNMA 4.00% - 7.00%, | |||||||||||
| 2035 - 2040, value of $11,328) | |||||||||||
| 11,106 | 0.05%, 06/30/2011 | 11,106 | |||||||||
| UBS Securities, Inc. Joint Repurchase | |||||||||||
| Agreement (maturing on 07/01/2011 in the | |||||||||||
| amount of $22, collateralized by U.S. | |||||||||||
| Treasury Bill 0.63%, 2012, value of $23) | |||||||||||
| 22 | 0.01%, 06/30/2011 | 22 | |||||||||
| UBS Securities, Inc. TriParty Joint | |||||||||||
| Repurchase Agreement (maturing on | |||||||||||
| 07/01/2011 in the amount of $1,695, | |||||||||||
| collateralized by FHLMC 4.50%, 2040, | |||||||||||
| FNMA 4.50% - 6.00%, 2035 - 2041, value | |||||||||||
| of $1,729) | |||||||||||
| 1,695 | 0.06%, 06/30/2011 | 1,695 | |||||||||
| 15,497 | |||||||||||
| Total short-term investments | |||||||||||
| (cost $15,497) | $ | 15,497 | |||||||||
| Total investments | |||||||||||
(cost $898,865) ▲ | 99.9 | % | $ | 1,130,410 | |||||||
| Other assets and liabilities | 0.1 | % | 1,658 | ||||||||
| Total net assets | 100.0 | % | $ | 1,132,068 | |||||||
The accompanying notes are an integral part of these financial statements.
Note: Percentage of investments as shown is the ratio of the total market value to total net assets.
| ▲ | At June 30, 2011, the cost of securities for federal income tax purposes was $899,036 and the aggregate gross unrealized appreciation and depreciation based on that cost were: |
| Unrealized Appreciation | $ | 240,433 | ||
| Unrealized Depreciation | (9,059 | ) | ||
| Net Unrealized Appreciation | $ | 231,374 |
· | Currently non-income producing. |
| Θ | At June 30, 2011, these securities were designated to cover written call options in the table below: |
| Unrealized | |||||||||||||||||||||||
| Exercise Price/ | Expiration | Number of | Market | Premiums | Appreciation | ||||||||||||||||||
| Issuer | Option Type | Rate | Date | Contracts* | Value ╪ | Received | (Depreciation) | ||||||||||||||||
| Amazon.com, Inc. | Equity | $ | 220.00 | 08/22/2011 | 81 | $ | 35 | $ | 38 | $ | 3 | ||||||||||||
| Anadarko Petroleum Corp. | Equity | $ | 85.00 | 08/22/2011 | 146 | 15 | 14 | (1 | ) | ||||||||||||||
| EMC Corp. | Equity | $ | 28.00 | 07/18/2011 | 411 | 15 | 12 | (3 | ) | ||||||||||||||
Freeport-McMoRan Copper & Gold, Inc. | Equity | $ | 57.00 | 08/22/2011 | 213 | 25 | 23 | (2 | ) | ||||||||||||||
| Guess?, Inc. | Equity | $ | 49.00 | 07/18/2011 | 194 | – | 12 | 12 | |||||||||||||||
| Mosaic Co. | Equity | $ | 77.50 | 07/18/2011 | 166 | 1 | 13 | 12 | |||||||||||||||
| Netflix, Inc. | Equity | $ | 270.00 | 07/18/2011 | 48 | 17 | 32 | 15 | |||||||||||||||
| $ | 108 | $ | 144 | $ | 36 | ||||||||||||||||||
| * | The number of contracts does not omit 000's. |
| Ø | Securities valued at $9,896 and cash of $744 collateralized the written put options in the table below. At June 30, 2011, the maximum delivery obligation of the written put options is $10,640. |
| Unrealized | |||||||||||||||||||||||
| Exercise Price/ | Expiration | Number of | Market | Premiums | Appreciation | ||||||||||||||||||
| Issuer | Option Type | Rate | Date | Contracts* | Value ╪ | Received | (Depreciation) | ||||||||||||||||
| Abercrombie & Fitch Co. | Equity | $ | 67.50 | 07/18/2011 | 155 | $ | 30 | $ | 17 | $ | (13 | ) | |||||||||||
| Anadarko Petroleum Corp. | Equity | $ | 65.00 | 07/18/2011 | 153 | 1 | 14 | 13 | |||||||||||||||
| Chesapeake Energy Corp. | Equity | $ | 25.00 | 08/22/2011 | 573 | 15 | 16 | 1 | |||||||||||||||
| Deckers Outdoor Corp. | Equity | $ | 75.00 | 08/22/2011 | 125 | 16 | 16 | – | |||||||||||||||
| eBay, Inc. | Equity | $ | 28.00 | 07/18/2011 | 565 | 3 | 19 | 16 | |||||||||||||||
| Mosaic Co. | Equity | $ | 57.50 | 07/18/2011 | 171 | 2 | 16 | 14 | |||||||||||||||
| Occidental Petroleum Corp. | Equity | $ | 90.00 | 08/22/2011 | 108 | 9 | 11 | 2 | |||||||||||||||
PNC Financial Services Group, Inc. | Equity | $ | 52.50 | 08/22/2011 | 189 | 7 | 10 | 3 | |||||||||||||||
| Priceline.com, Inc. | Equity | $ | 430.00 | 07/18/2011 | 23 | 1 | 12 | 11 | |||||||||||||||
| Skyworks Solutions, Inc. | Equity | $ | 22.00 | 07/18/2011 | 323 | 14 | 12 | (2 | ) | ||||||||||||||
| $ | 98 | $ | 143 | $ | 45 | ||||||||||||||||||
| * | The number of contracts does not omit 000's. |
Futures Contracts Outstanding at June 30, 2011
| Unrealized | |||||||||||||||||||
| Number of | Expiration | Notional | Appreciation/ | ||||||||||||||||
| Description | Contracts* | Position | Date | Market Value ╪ | Amount | (Depreciation) | |||||||||||||
| S&P 500 E-Mini | 172 | Long | 09/16/2011 | $ | 11,313 | $ | 10,931 | $ | 382 | ||||||||||
| * | The number of contracts does not omit 000's. |
Cash of $688 was pledged as initial margin deposit for open futures contracts at June 30, 2011.
| ╪ | See Significant Accounting Policies of accompanying Notes to Financial Statements regarding valuation of securities. |
The accompanying notes are an integral part of these financial statements.
| Investment Valuation Hierarchy Level Summary |
| June 30, 2011 (Unaudited) |
| (000’s Omitted) |
| Total | Level 1 ♦ | Level 2 ♦ | Level 3 | |||||||||||||
| Assets: | ||||||||||||||||
Common Stocks ‡ | $ | 1,114,913 | $ | 1,114,913 | $ | – | $ | – | ||||||||
| Short-Term Investments | 15,497 | – | 15,497 | – | ||||||||||||
| Total | $ | 1,130,410 | $ | 1,114,913 | $ | 15,497 | $ | – | ||||||||
| Futures * | 382 | 382 | – | – | ||||||||||||
| Written Options * | 102 | 102 | – | – | ||||||||||||
| Total | $ | 484 | $ | 484 | $ | – | $ | – | ||||||||
| Liabilities: | ||||||||||||||||
| Written Options * | 21 | 21 | – | – | ||||||||||||
| Total | $ | 21 | $ | 21 | $ | – | $ | – | ||||||||
| ♦ | For the six-month period ended June 30, 2011, there were no significant transfers between Level 1 and Level 2. |
| ‡ | The Fund has all or primarily all of the equity securities categorized in a particular level. Refer to the Schedule of Investments for further industry breakout. |
| * | Derivative instruments not reflected in the Schedule of Investments are valued at the unrealized appreciation/depreciation on the investments. |
The accompanying notes are an integral part of these financial statements.
| Statement of Assets and Liabilities |
| June 30, 2011 (Unaudited) |
| (000’s Omitted) |
| Assets: | ||||
| Investments in securities, at market value (cost $898,865) | $ | 1,130,410 | ||
| Cash | 1,435 | *,† | ||
| Receivables: | ||||
| Investment securities sold | 8,111 | |||
| Fund shares sold | 489 | |||
| Dividends and interest | 1,386 | |||
| Variation margin | 96 | |||
| Total assets | 1,141,927 | |||
| Liabilities: | ||||
| Payables: | ||||
| Investment securities purchased | 8,460 | |||
| Fund shares redeemed | 966 | |||
| Investment management fees | 127 | |||
| Distribution fees | 6 | |||
| Accrued expenses | 94 | |||
| Written options (proceeds $287) | 206 | |||
| Total liabilities | 9,859 | |||
| Net assets | $ | 1,132,068 | ||
| Summary of Net Assets: | ||||
| Capital stock and paid-in-capital | $ | 1,153,902 | ||
| Accumulated undistributed net investment income | 8,225 | |||
| Accumulated net realized loss on investments | (262,067 | ) | ||
| Unrealized appreciation of investments | 232,008 | |||
| Net assets | $ | 1,132,068 | ||
| Shares authorized | 3,500,000 | |||
| Par value | $ | 0.001 | ||
Class IA: Net asset value per share | $ | 12.71 | ||
| Shares outstanding | 77,135 | |||
| Net assets | $ | 980,405 | ||
Class IB: Net asset value per share | $ | 12.63 | ||
| Shares outstanding | 12,009 | |||
| Net assets | $ | 151,663 | ||
* Cash of $744 is pledged as collateral for open put options.
† Cash of $688 is pledged as collateral for open futures contracts.
The accompanying notes are an integral part of these financial statements.
| Statement of Operations |
| For the Six-Month Period Ended June 30, 2011 (Unaudited) |
(000’s Omitted) |
| Investment Income: | ||||
| Dividends | $ | 10,558 | ||
| Interest | 5 | |||
| Total investment income, net | 10,563 | |||
| Expenses: | ||||
| Investment management fees | 4,043 | |||
| Distribution fees - Class IB | 195 | |||
| Custodian fees | 3 | |||
| Accounting services fees | 69 | |||
| Board of Directors' fees | 12 | |||
| Audit fees | 11 | |||
| Other expenses | 110 | |||
| Total expenses (before fees paid indirectly) | 4,443 | |||
| Commission recapture | (2 | ) | ||
| Custodian fee offset | — | |||
| Total fees paid indirectly | (2 | ) | ||
| Total expenses, net | 4,441 | |||
| Net investment income | 6,122 | |||
| Net Realized Gain on Investments and Other Financial Instruments: | ||||
| Net realized gain on investments | 51,946 | |||
| Net realized gain on futures | 594 | |||
| Net realized gain on written options | 780 | |||
| Net Realized Gain on Investments and Other Financial Instruments | 53,320 | |||
| Net Changes in Unrealized Appreciation of Investments and Other Financial Instruments: | ||||
| Net unrealized appreciation of investments | 27,833 | |||
| Net unrealized appreciation of futures | 419 | |||
| Net unrealized appreciation of written options | 43 | |||
| Net Changes in Unrealized Appreciation of Investments and Other Financial Instruments | 28,295 | |||
| Net Gain on Investments and Other Financial Instruments | 81,615 | |||
| Net Increase in Net Assets Resulting from Operations | $ | 87,737 | ||
The accompanying notes are an integral part of these financial statements.
| Statement of Changes in Net Assets |
| (000’s Omitted) |
| For the | ||||||||
| Six-Month | For the | |||||||
| Period Ended | Year Ended | |||||||
| June 30, 2011 | December 31, | |||||||
| (Unaudited) | 2010 | |||||||
| Operations: | ||||||||
| Net investment income | $ | 6,122 | $ | 14,763 | ||||
| Net realized gain on investments and other financial instruments | 53,320 | 19,613 | ||||||
| Net unrealized appreciation of investments and other financial instruments | 28,295 | 116,681 | ||||||
| Net Increase In Net Assets Resulting From Operations | 87,737 | 151,057 | ||||||
| Distributions to Shareholders: | ||||||||
| From net investment income | ||||||||
| Class IA | — | (12,627 | ) | |||||
| Class IB | — | (1,603 | ) | |||||
| Total distributions | — | (14,230 | ) | |||||
| Capital Share Transactions: | ||||||||
| Class IA | ||||||||
| Sold | 19,319 | 62,386 | ||||||
| Issued on reinvestment of distributions | — | 12,627 | ||||||
| Redeemed | (137,293 | ) | (179,815 | ) | ||||
| Total capital share transactions | (117,974 | ) | (104,802 | ) | ||||
| Class IB | ||||||||
| Sold | 6,585 | 13,283 | ||||||
| Issued on reinvestment of distributions | — | 1,603 | ||||||
| Redeemed | (26,499 | ) | (46,630 | ) | ||||
| Total capital share transactions | (19,914 | ) | (31,744 | ) | ||||
| Net decrease from capital share transactions | (137,888 | ) | (136,546 | ) | ||||
| Net Increase (Decrease) In Net Assets | (50,151 | ) | 281 | |||||
| Net Assets: | ||||||||
| Beginning of period | 1,182,219 | 1,181,938 | ||||||
| End of period | $ | 1,132,068 | $ | 1,182,219 | ||||
Accumulated undistributed (distribution in excess of) net investment income | $ | 8,225 | $ | 2,103 | ||||
| Shares: | ||||||||
| Class IA | ||||||||
| Sold | 1,551 | 6,035 | ||||||
| Issued on reinvestment of distributions | — | 1,107 | ||||||
| Redeemed | (11,097 | ) | (16,783 | ) | ||||
| Total share activity | (9,546 | ) | (9,641 | ) | ||||
| Class IB | ||||||||
| Sold | 532 | 1,267 | ||||||
| Issued on reinvestment of distributions | — | 142 | ||||||
| Redeemed | (2,150 | ) | (4,389 | ) | ||||
| Total share activity | (1,618 | ) | (2,980 | ) | ||||
The accompanying notes are an integral part of these financial statements.
| Notes to Financial Statements |
| June 30, 2011 (Unaudited) |
| (000’s Omitted) |
| 1. | Organization: |
Hartford Disciplined Equity HLS Fund (the “Fund”) serves as an underlying investment option for certain variable annuity and variable life insurance separate accounts of Hartford Life Insurance Company (“HLIC”) and its affiliates and certain qualified retirement plans. The Fund may also serve as an underlying investment option for certain variable annuity and variable life separate accounts of other insurance companies. Owners of variable annuity contracts and policyholders of variable life insurance contracts may choose the funds permitted in the variable insurance contract prospectus. In addition, participants in certain qualified retirement plans may choose the Fund if permitted by their plans.
Hartford Series Fund, Inc. (the “Company”) is an open-end registered management investment company comprised of thirty portfolios. Financial Statements for the Fund, a series of the Company, are included in this report.
The Company is organized under the laws of the State of Maryland and is registered with the Securities and Exchange Commission (“SEC”) under the Investment Company Act of 1940, as amended (“1940 Act”). The Fund is a diversified open-end management investment company.
The Fund is divided into Class IA and Class IB shares. Each class is offered at the per share net asset value (“NAV”) without a sales charge and is subject to the same expenses, except that the Class IB shares are subject to distribution and service fees charged pursuant to a Distribution Plan adopted in accordance with Rule 12b-1 under the 1940 Act.
| 2. | Significant Accounting Policies: |
The following is a summary of significant accounting policies of the Fund in the preparation of its financial statements, which are in accordance with the United States Generally Accepted Accounting Principles (“U.S. GAAP”). The preparation of financial statements in accordance with U.S. GAAP may require management to make estimates and assumptions that affect the reported amounts of assets and liabilities and disclosure of contingent assets and liabilities at the date of the financial statements and the reported amounts of increases and decreases in net assets from operations during the reporting period. Actual results could differ from those estimates.
| a) | Determination of Net Asset Value – The NAV of each class of the Fund's shares is determined as of the close of regular trading (normally 4:00 p.m. Eastern Time) (the “NYSE Close”) on each day that the New York Stock Exchange (the “Exchange”) is open (“Valuation Date”). Information that becomes known to the Fund after the NAV has been calculated on a particular day will not generally be used to retroactively adjust the NAV determined earlier that day. |
| b) | Investment Valuation and Fair Value Measurements – For purposes of calculating the NAV, portfolio securities and other assets held by the Fund's portfolio for which market quotes are readily available are valued at market value. Market value is generally determined on the basis of last reported sales prices or official close price. If no sales are reported, market value is based on quotes obtained from a quotation reporting system, established market makers, or independent pricing services. If market prices are not readily available or are deemed unreliable, the Fund will use the fair value of the security as determined in good faith under policies and procedures established by and under the supervision of the Company's Board of Directors. Market quotes are considered not readily available where there is an absence of current or reliable market-based data (e.g., trade information or broker quotes), including where events occur after the close of the relevant market, but prior to the NYSE Close that materially affect the values of the Fund's portfolio securities or assets. In addition, market quotes are considered not readily available when, due to extraordinary circumstances, the exchanges or markets on which the securities trade, do not open for trading for the entire day and no other market prices are available. In addition, prices of foreign equities that are principally traded on certain foreign markets are adjusted daily pursuant to a fair value pricing service approved by the Board of Directors in order to reflect an adjustment for the factors occurring after the close of certain foreign markets but before the NYSE Close. Securities that are primarily traded on foreign markets may trade on days that are not business days of the Fund. The value of the foreign securities, in which the Fund invests, may change on days when a shareholder will not be able to purchase or redeem shares of the |
Fund. Fair value pricing is subjective in nature and the use of fair value pricing by the Fund may cause the NAV of its shares to differ significantly from the NAV that would have been calculated using market prices at the close of the exchange on which a portfolio security is primarily traded. There can be no assurance that the Fund could obtain the fair market value assigned to a security if the Fund were to sell the security at approximately the time at which the Fund determines its NAV.
Exchange traded options, futures and options on futures are valued at the settlement price determined by the relevant exchange as of the NYSE Close. If such instruments do not trade on an exchange, values may be supplied by an independent pricing service using a formula or other objective method that may take into consideration the style, direction, expiration, strike price, notional value and volatility or other adjustments.
Financial instruments for which prices are not available from an independent pricing service may be valued using market quotations obtained from one or more dealers that make markets in the respective financial instrument in accordance with procedures established by the Company’s Board of Directors.
U.S. GAAP defines fair value as the price that the Fund would receive to sell an asset or pay to transfer a liability in an orderly transaction between market participants. The U.S. GAAP fair value measurement standards require disclosure of a fair value hierarchy for each major category of assets and liabilities. Various inputs are used in determining the fair value of the Fund’s investments. These inputs are summarized into three broad hierarchy levels. This hierarchy is based on whether the valuation inputs are observable or unobservable. These levels are:
| · | Level 1 – Quoted prices in active markets for identical securities. Level 1 may include exchange-traded instruments such as domestic equities, some foreign equities, options, futures, mutual funds, exchange-traded funds, rights and warrants. |
| · | Level 2 – Observable inputs other than Level 1 prices, such as quoted prices for similar securities; quoted prices in markets that are not active; or other inputs that are observable or can be corroborated by observable market data. Level 2 may include debt securities that are traded less frequently than exchange-traded instruments and which are valued using third party pricing services; foreign equities, whose value is determined using a multi-factor regression model with inputs that are observable in the market; and short-term securities, which are valued at amortized cost. |
| · | Level 3 – Significant unobservable inputs that are supported by limited or no market activity. Level 3 may include financial instruments whose values are determined using broker quotes or require significant management judgment or estimation. These unobservable valuation inputs may include estimates for current yields, maturity/duration, prepayment speed, and broker quotes for comparable securities along with other assumptions relating to credit quality, collateral value, complexity of the security structure, general market conditions and liquidity. This category may include securities where trading has been halted or there are certain restrictions on trading. While these securities are priced using unobservable inputs, the valuation of these securities reflects the best available data and management believes the prices are a reasonable representation of exit price. |
Valuation levels are not necessarily indicative of the risk associated with investing in such securities. Individual securities within any of the above mentioned asset classes may be assigned a different hierarchical level than those presented above, as individual circumstances dictate.
During the six-month period ended June 30, 2011, the Fund held no Level 3 securities, therefore no reconciliation of Level 3 securities is presented.
For additional information, refer to the Investment Valuation Hierarchy Level Summary which follows the Schedule of Investments.
Hartford Disciplined Equity HLS Fund |
| Notes to Financial Statements – (continued) |
| June 30, 2011 (Unaudited) |
| (000’s Omitted) |
For purposes of reporting transfers between different hierarchy levels, both transfers in and out of each level, as applicable, are shown as if they occurred at the beginning of the period.
| c) | Security Transactions and Investment Income – Security transactions are recorded as of the trade date (the date the order to buy or sell is executed) for financial reporting purposes. Securities purchased or sold on a when-issued or delayed-delivery basis may be settled a month or more after the trade date. Realized gains and losses are determined on the basis of identified cost. |
Dividend income is accrued as of the ex-dividend date, except that certain dividends from foreign securities where the ex-dividend date may have passed are recorded as soon as the Fund is informed of the dividend. Interest income, including amortization of premium and accretion of discounts, is accrued on a daily basis.
| d) | Joint Trading Account – The Fund may invest cash balances into a joint trading account that may be invested in one or more repurchase agreements. |
| e) | Fund Share Valuation and Dividend Distributions to Shareholders – Orders for the Fund’s shares are executed in accordance with the investment instructions of the contract holders and plan participants. The NAV of the Fund’s shares is determined as of the close of business on each business day of the Exchange. The NAV is determined separately for each class of shares of the Fund by dividing the Fund’s net assets attributable to that class by the number of shares of the class outstanding. Each class of shares offered by the Fund has equal rights as to assets and voting privileges (except that shareholders of a class have exclusive voting rights regarding any matter relating solely to that class of shares). Income and non-class specific expenses are allocated daily to each class on the basis of the relative net assets of the class. Realized and unrealized capital gains and losses of each class are allocated daily based on the relative net assets of each class of shares of the Fund. |
Orders for the purchase of the Fund’s shares received prior to the close of the Exchange on any day the Exchange is open for business are priced at the NAV determined as of the close of the Exchange. Orders received after the close of the Exchange, or on a day on which the Exchange and/or the Fund is not open for business, are priced at the next determined NAV.
Dividends are declared pursuant to a policy adopted by the Company’s Board of Directors based upon the investment performance of the Fund. The policy of the Fund is to pay dividends from net investment income and realized capital gains, if any, at least once a year.
Distributions from net investment income, net realized capital gains and capital are determined in accordance with federal income tax regulations, which may differ from U.S. GAAP with respect to character and timing. These differences may include but are not limited to losses deferred due to wash sale adjustments, foreign currency gains and losses, adjustments related to Passive Foreign Investment Companies (“PFICs”), Real Estate Investment Trusts (“REITs”), Regulated Investment Companies (“RICs”), certain derivatives and partnerships. Permanent book and federal income tax basis differences relating to shareholder distributions will result in reclassifications to certain of the Fund’s capital accounts (see Federal Income Taxes: Reclassification of Capital Accounts note).
| 3. | Securities and Other Investments: |
| a) | Repurchase Agreements – A repurchase agreement is an agreement by which a counterparty agrees to sell a security and agrees to repurchase the security sold at a mutually agreed upon time and price. At the time the Fund enters into a repurchase agreement, the value of the underlying collateral security(ies), including accrued interest, will be equal to or exceed the value of the repurchase agreement. Repurchase agreements expose the Fund to counterparty risk. To minimize counterparty risk, the securities that serve to collateralize the repurchase agreement are held by the Fund's |
custodian in book entry or physical form in the custodial account of the Fund or in a third party custodial account. Repurchase agreements are valued at cost plus accrued interest. The Fund, as shown on the Schedule of Investments, had outstanding repurchase agreements as of June 30, 2011.
| 4. | Financial Derivative Instruments: |
The following disclosures contain information on how and why the Fund uses derivative instruments, the credit-risk-related contingent features in certain derivative instruments, and how derivative instruments affect the Fund’s financial position, results of operations and cash flows. The location and fair value amounts of these instruments on the Statement of Assets and Liabilities and the realized gains and losses and changes in unrealized gains and losses on the Statement of Operations, each categorized by type of derivative contract, are included in the following Additional Derivative Instrument Information footnote. The derivative instruments outstanding as of period-end are disclosed in the Notes to the Schedule of Investments and the amounts of realized gains and losses and changes in unrealized gains and losses on derivative instruments during the period are disclosed in the Statement of Operations.
| a) | Futures Contracts – The Fund may enter into futures contracts. A futures contract is an agreement between two parties to buy or sell an asset at a set price on a future date. The Fund uses futures contracts to manage or obtain exposure to the securities markets, commodities, or movements in interest rates and currency values. The primary risks associated with the use of futures contracts are the imperfect correlation between the change in market value of the securities held by the Fund and the prices of futures contracts and the possibility of an illiquid market. Upon entering into a futures contract, the Fund is required to deposit with a futures commission merchant (“FCM”), an amount of cash or U.S. Government or Agency Obligations in accordance with the initial margin requirements of the broker or exchange. Futures contracts are marked to market daily at the most recent settlement price reported by an exchange on which, over time, they are traded most extensively, and an appropriate payable or receivable for the change in value (“variation margin”) is recorded by the Fund. Gains or losses are recognized but not considered realized until the contracts expire or are closed. Futures contracts involve, to varying degrees, risk of loss in excess of the variation margin disclosed on the Statement of Assets and Liabilities, however, this risk is reduced through the use of an FCM. The Fund, as shown on the Schedule of Investments, had outstanding futures contracts as of June 30, 2011. |
| b) | Options Contracts – An option contract is a contract sold by one party to another party that offers the buyer the right, but not the obligation, to buy (call) or sell (put) a security or other financial asset at an agreed-upon price during a specific period of time or on a specific date. The Fund may write (sell) covered call and put options on futures, swaps (“swaptions”), securities, commodities or currencies. “Covered” means that so long as the Fund is obligated as the writer of an option, it will own either the underlying securities or currency or an option to purchase the same underlying securities or currency having an expiration date of the covered option and an exercise price equal to or less than the exercise price of the covered option, or will pledge cash or other liquid securities having a value equal to or greater than the fluctuating market value of the option security or currency. Writing put options increases the Fund’s exposure to the underlying instrument. Writing call options decreases the Fund’s exposure to the underlying instrument. Premiums received from writing options that expire are treated as realized gains. Premiums received from writing options that are exercised or closed are added to the proceeds or offset against amounts paid on the underlying futures, swap, security or currency transaction to determine the realized gain or loss. The Fund as a writer of an option has no control over whether the underlying instrument may be sold (call) or purchased (put) and as a result bears the market risk of an unfavorable change in the price of the instrument underlying the written option. There is the risk the Fund may not be able to enter into a closing transaction because of an illiquid market. The Fund may also purchase put and call options. Purchasing call options increases the Fund’s exposure to the underlying instrument. Purchasing put options decreases the Fund’s exposure to the underlying instrument. A Fund pays a premium, which is included on the Fund’s Statement of Assets and Liabilities as an investment and is subsequently marked to market to reflect the current value of the option. Premiums paid for purchasing options that expire are treated as realized losses. Certain options may be purchased with premiums to be determined on a future date. The premiums for these options are based upon implied volatility parameters at specified terms. The risk associated with purchasing put and call options is generally limited to the premium paid. Premiums paid |
Hartford Disciplined Equity HLS Fund |
| Notes to Financial Statements – (continued) |
| June 30, 2011 (Unaudited) |
| (000’s Omitted) |
for purchasing options that are exercised or closed are added to the amounts paid or offset against the proceeds on the underlying investment transaction to determine the realized gain or loss. The Fund had no outstanding purchased options contracts as of June 30, 2011. Transactions involving written options contracts for the Fund during the six-month period ended June 30, 2011, are summarized below:
| Options Contract Activity During the | ||||||||
| Six-month Period Ended June 30, 2011 | ||||||||
| Call Options Written During the Period | Number of Contracts* | Premium Amounts | ||||||
| Beginning of the period | 568 | $ | 122 | |||||
| Written | 8,478 | 551 | ||||||
| Expired | (7,340 | ) | (466 | ) | ||||
| Closed | (131 | ) | (30 | ) | ||||
| Exercised | (316 | ) | (33 | ) | ||||
| End of period | 1,259 | $ | 144 | |||||
| Put Options Written During the Period | Number of Contracts* | Premium Amounts | ||||||
| Beginning of the period | 559 | 52 | ||||||
| Written | 8,044 | 455 | ||||||
| Expired | (4,890 | ) | (283 | ) | ||||
| Closed | (1,328 | ) | (81 | ) | ||||
| Exercised | — | — | ||||||
| End of period | 2,385 | 143 | ||||||
* The number of contracts does not omit 000's.
| c) | Additional Derivative Instrument Information: |
Fair Values of Derivative Instruments on the Statement of Assets and Liabilities as of June 30, 2011:
| Risk Exposure Category | ||||||||||||||||||||||||||||
| Foreign | ||||||||||||||||||||||||||||
| Interest Rate | Exchange | Credit | Equity | Commodity | Other | |||||||||||||||||||||||
| Contracts | Contracts | Contracts | Contracts | Contracts | Contracts | Total | ||||||||||||||||||||||
| Assets: | ||||||||||||||||||||||||||||
| Variation margin receivable * | $ | — | $ | — | $ | — | $ | 96 | $ | — | $ | — | $ | 96 | ||||||||||||||
| Total | $ | — | $ | — | $ | — | $ | 96 | $ | — | $ | — | $ | 96 | ||||||||||||||
| Liabilities: | ||||||||||||||||||||||||||||
| Written options, market value | $ | — | $ | — | $ | — | $ | 206 | $ | — | $ | — | $ | 206 | ||||||||||||||
| Total | $ | — | $ | — | $ | — | $ | 206 | $ | — | $ | — | $ | 206 | ||||||||||||||
| * | Only current day's variation margin is reported within the Statement of Assets and Liabilities. The variation margin is included in the open futures cumulative appreciation (depreciation) of $382 as reported in the Schedule of Investments. |
The volume of derivatives that is presented in the Schedule of Investments is consistent with the derivative activity during the six-month period ended June 30, 2011.
The Effect of Derivative Instruments on the Statement of Operations for the six-month period ended June 30, 2011:
| Risk Exposure Category | ||||||||||||||||||||||||||||
| Foreign | ||||||||||||||||||||||||||||
| Interest Rate | Exchange | Credit | Equity | Commodity | Other | |||||||||||||||||||||||
| Contracts | Contracts | Contracts | Contracts | Contracts | Contracts | Total | ||||||||||||||||||||||
| Realized Gain (Loss) on Derivatives Recognized as a Result from Operations: | ||||||||||||||||||||||||||||
| Net realized gain on futures | $ | — | $ | — | $ | — | $ | 594 | $ | — | $ | — | $ | 594 | ||||||||||||||
| Net realized gain on written options | — | — | — | 780 | — | — | 780 | |||||||||||||||||||||
| Total | $ | — | $ | — | $ | — | $ | 1,374 | $ | — | $ | — | $ | 1,374 | ||||||||||||||
| Net Change in Unrealized Appreciation (Depreciation) on Derivatives Recognized as a Result from Operations: | ||||||||||||||||||||||||||||
Net change in unrealized appreciation of futures | $ | — | $ | — | $ | — | $ | 419 | $ | — | $ | — | $ | 419 | ||||||||||||||
Net change in unrealized appreciation of written options | — | — | — | 43 | — | — | 43 | |||||||||||||||||||||
| Total | $ | — | $ | — | $ | — | $ | 462 | $ | — | $ | — | $ | 462 | ||||||||||||||
| 5. | Principal Risks: |
| a) | Counterparty Risk – The Fund may be exposed to counterparty risk, or the risk that an institution or other entity with which the Fund has unsettled or open transactions will default. |
| b) | Market Risks – The market values of equity securities, such as common stocks and preferred stocks or equity related investments such as futures and options, may decline due to general market conditions which are not specifically related to a particular company, such as real or perceived adverse economic conditions, changes in the general outlook for corporate earnings, changes in interest or currency rates or adverse investor sentiment generally. The market value of equity securities may also decline due to factors which affect a particular industry or industries, such as labor shortages or increased production costs and competitive conditions within an industry. Equity securities and equity related investments generally have greater market price volatility than fixed income securities. |
| 6. | Federal Income Taxes: |
| a) | Federal Income Taxes – For federal income tax purposes, the Fund intends to continue to qualify as a RIC under Subchapter M of the Internal Revenue Code (“IRC”) by distributing substantially all of its taxable net investment income and net realized capital gains to its shareholders and otherwise complying with the requirements of RICs. The Fund has distributed substantially all of its income and capital gains in prior years, if applicable, and intends to distribute substantially all of its income and capital gains prior to the next fiscal year-end. Accordingly, no provision for federal income or excise taxes has been made in the accompanying financial statements. Distributions from short-term capital gains are treated as ordinary income distributions for federal income tax purposes. |
| b) | Net Investment Income (Loss), Net Realized Gains (Losses) – Net investment income (loss) and net realized gains (losses) may differ for financial statement and tax purposes primarily because of losses deferred due to wash sale adjustments, foreign currency gains and losses, adjustments related to PFICs, REITs, RICs, certain derivatives and partnerships. The character of distributions made during the year from net investment income or net realized gains may differ from their ultimate characterization for federal income tax purposes. Also, due to the timing of dividend distributions, the fiscal year in which amounts are distributed may differ from the year that the income or realized gains (losses) were recorded by the Fund. |
Hartford Disciplined Equity HLS Fund |
| Notes to Financial Statements – (continued) |
| June 30, 2011 (Unaudited) |
| (000’s Omitted) |
| c) | Distributions and Components of Distributable Earnings – The tax character of distributions paid by the Fund for the periods indicated is as follows (as adjusted for dividends payable): |
| For the Year Ended | For the Year Ended | |||||||
| December 31, 2010 | December 31, 2009 | |||||||
| Ordinary Income | $ | 14,230 | $ | 16,054 | ||||
As of December 31, 2010, the Fund’s components of distributable earnings (deficit) on a tax basis were as follows:
| Amount | ||||
| Undistributed Ordinary Income | $ | 2,103 | ||
| Accumulated Capital and Other Losses* | (315,253 | ) | ||
Unrealized Appreciation† | 203,579 | |||
| Total Accumulated Deficit | $ | (109,571 | ) | |
| * | The Fund has capital loss carryforwards that are identified in the Capital Loss Carryforward note that follows. |
| † | The difference between book-basis and tax-basis unrealized appreciation (depreciation) may be attributable to the losses deferred due to wash sale adjustments, foreign currency gains and losses, adjustments related to PFICs, REITs, RICs, certain derivatives and partnerships. |
| d) | Reclassification of Capital Accounts – The Fund may record reclassifications in its capital accounts. These reclassifications have no impact on the total net assets of the Fund. The reclassifications are a result of permanent differences between U.S. GAAP and tax accounting for such items as expiration or utilization of capital loss carryforwards or net operating losses. Adjustments are made to reflect the impact these items have on current and future distributions to shareholders. Therefore, the source of the Fund’s distributable income may be shown in the accompanying Statement of Assets and Liabilities as from accumulated undistributed net investment income, from accumulated net realized gains on investments or from capital depending on the type of book and tax differences that exist. For the year ended December 31, 2010, the Fund recorded reclassifications to increase (decrease) the accounts listed below: |
| Amount | ||||
| Accumulated Undistributed Net Investment Income | $ | (13 | ) | |
| Accumulated Net Realized Gain (Loss) on Investments | 13 | |||
| e) | Capital Loss Carryforward – At December 31, 2010 (tax-year-end), the Fund had capital loss carryforwards for U.S. federal income tax purposes of approximately: |
| Year of Expiration | Amount | |||
| 2016 | $ | 128,352 | ||
| 2017 | 186,901 | |||
| Total | $ | 315,253 | ||
As of December 31, 2010, the Fund utilized $18,985 of prior year capital loss carryforwards.
| f) | Accounting for Uncertainty in Income Taxes – The Fund has adopted financial reporting rules that require the Fund to analyze all open tax years, as defined by the Statute of Limitations, for all major jurisdictions. Generally, tax authorities can examine all tax returns filed for the last three years. The Fund does not have an examination in progress. |
The Fund has reviewed all open tax years and major jurisdictions and concluded that these financial reporting rules had no effect on the Fund’s financial position or results of operations. There is no tax liability resulting from unrecognized tax benefits relating to uncertain income tax positions taken or expected to be taken on the tax return for the fiscal year-end December 31, 2010. The Fund is also not aware of any tax positions for which it is reasonably possible that the total amounts of unrecognized tax benefits will significantly change in the next twelve months.
| 7. | Expenses: |
| a) | Investment Management Agreements – HL Investment Advisors, LLC (“HL Advisors”), an indirect wholly owned subsidiary of The Hartford Financial Services Group, Inc. (“The Hartford”), serves as investment manager to the Fund pursuant to an Investment Management Agreement with the Company. As investment manager, HL Advisors has overall investment supervisory responsibility for the Fund. In addition, HL Advisors provides administrative personnel, services, equipment, facilities and office space for proper operation of the Fund. HL Advisors has contracted with Wellington Management Company, LLP (“Wellington Management”) under a sub-advisory agreement for the provision of day-today investment management services to the Fund in accordance with the Fund’s investment objective and policies. The Fund pays a fee to HL Advisors, a portion of which may be used to compensate Wellington Management. |
The schedule below reflects the rates of compensation paid to HL Advisors for investment management services rendered as of June 30, 2011; the rates are accrued daily and paid monthly.
| Average Daily Net Assets | Annual Fee | |||
| On first $250 million | 0.7750 | % | ||
| On next $250 million | 0.7250 | % | ||
| On next $500 million | 0.6750 | % | ||
| On next $4 billion | 0.6250 | % | ||
| On next $5 billion | 0.6225 | % | ||
| Over $10 billion | 0.6200 | % | ||
| b) | Accounting Services Agreement – Pursuant to the Fund Accounting Agreement between HLIC and the Company, on behalf of the Fund, HLIC provides accounting services to the Fund and receives monthly compensation based on the Fund’s average net assets at the rates set forth below. The Fund’s accounting services fees are accrued daily and paid monthly. |
| Average Daily Net Assets | Annual Fee | |||
| On first $5 billion | 0.012 | % | ||
| Over $5 billion | 0.010 | % | ||
| c) | Operating Expenses – Allocable expenses incurred by the Company are allocated to each Fund and allocated to classes within a Fund in proportion to the average daily net assets of the Fund and each class, except where allocation of certain expenses is more fairly made directly to the Fund or to specific classes within a Fund. |
| d) | Fees Paid Indirectly – The Company, on behalf of the Fund, has entered into agreements with State Street Global Markets, LLC and Russell Implementation Services, Inc. to partially recapture non-discounted trade commissions. Such rebates are used to pay a portion of the Fund’s expenses. In addition, the Fund’s custodian bank has also agreed to reduce its fees when the Fund maintains cash on deposit in a non-interest-bearing custody account. For the six-month period ended June 30, 2011, these amounts are included in the Statement of Operations. |
Hartford Disciplined Equity HLS Fund |
| Notes to Financial Statements – (continued) |
| June 30, 2011 (Unaudited) |
| (000’s Omitted) |
The ratio of expenses to average net assets in the accompanying financial highlights excludes the reduction in expenses related to fees paid indirectly. The annualized expense ratio for the period listed below including the fees paid indirectly is as follows:
| Annualized Six- | ||||
| Month Period Ended | ||||
| June 30, 2011 | ||||
| Class IA Shares | 0.74 | % | ||
| Class IB Shares | 0.99 | |||
| e) | Distribution Plan for Class IB shares – The Company, on behalf of the Fund, has adopted a Distribution Plan pursuant to Rule 12b-1 of the 1940 Act to compensate the Distributor, Hartford Securities Distribution Company, Inc. (a wholly owned, ultimate subsidiary of The Hartford), from assets attributable to the Class IB shares for services rendered and expenses borne in connection with activities primarily intended to result in the sale of the Class IB shares, subject to the review and approval of the Company’s Board of Directors. |
The Distribution Plan provides that the Fund may pay annually up to 0.25% of the average daily net assets of the Fund attributable to its Class IB shares for activities primarily intended to result in the sale of Class IB shares. The Board has the authority to suspend or reduce these payments at any point in time. Under the terms of the Distribution Plan and the principal underwriting agreement, the Fund is authorized to make payments monthly to the Distributor that may be used to pay or compensate entities providing distribution and shareholder servicing with respect to the Class IB shares for such entities’ fees or expenses incurred or paid in that regard. These fees are accrued daily and paid monthly.
| f) | Other Related Party Transactions – Certain officers of the Fund are directors and/or officers of HL Advisors and/or The Hartford or its subsidiaries. For the six-month period ended June 30, 2011, a portion of the Fund’s chief compliance officer’s salary was paid by all the investment companies in the Hartford fund complex. The portion allocated to the Fund was in the amount of $1. These fees are accrued daily and paid monthly. |
| g) | Payments from Affiliates – In July of 2007, The Hartford entered into a settlement with the Attorneys General of the states of New York, Connecticut and Illinois relating to market timing and the company's individual variable annuity contracts in which certain payments would be made directly to the variable annuity contract holders. The distribution plan provided that unclaimed money from the settlement would be distributed to certain HLS Funds that are investment options through a Hartford individual variable annuity contract. The unclaimed money was distributed to the Fund on September 18, 2009, as follows: |
| Amount | ||||
| Reimbursement | $ | 76 | ||
On November 8, 2006, the SEC issued an order setting forth the terms of a settlement reached with three subsidiaries of The Hartford that resolved the SEC’s Division of Enforcement’s investigation of aspects of The Hartford’s variable annuity and mutual fund operations related to directed brokerage and revenue sharing. The Hartford settled this matter without admitting or denying the findings of the SEC.
The Fund is available for purchase by the separate accounts of different variable universal life policies, variable annuity products, and funding agreements and it is offered directly to certain qualified retirement plans (collectively “Products”). Although existing Products contain transfer restrictions, some Products, particularly older variable annuity products, do not contain restrictions on the frequency of transfers. In addition, as the result of the settlement of litigation against Hartford Life, Inc. (“Hartford Life”) (the issuers of such variable annuity products), the Fund’s ability to restrict transfers by certain owners of older variable annuity products was limited. During 2006, these annuity owners surrendered the older variable annuity contracts that were the subject of prior litigation.
The total return in the accompanying financial highlights includes payments from affiliates. Had the payments from the affiliates been excluded, the impact and total return for the periods listed below would have been as follows:
| For the Year Ended December 31, 2009 | ||||||||
| Class IA | Class IB | |||||||
| Impact from Payment from Affiliate for Attorneys General Settlement | 0.01 | % | 0.01 | % | ||||
| Total Return Excluding Payment from Affiliate | 25.64 | 25.32 | ||||||
| For the Year Ended December 31, 2006 | ||||||||
| Class IA | Class IB | |||||||
| Impact from Payment from Affiliate for SEC Settlement | 0.03 | % | 0.03 | % | ||||
| Impact from Payment from Affiliate for Unrestricted Transfers | 0.01 | 0.01 | ||||||
| Total Return Excluding Payments from Affiliates | 12.41 | 12.13 | ||||||
| 8. | Investment Transactions: |
For the six-month period ended June 30, 2011, the Fund's aggregate purchases and sales of investment securities (excluding short-term investments) were as follows:
| Amount | ||||
| Cost of Purchases Excluding U.S. Government Obligations | $ | 262,816 | ||
| Sales Proceeds Excluding U.S. Government Obligations | 365,952 | |||
| 9. | Line of Credit: |
The Fund is one of several Hartford funds that participate in a $500 million committed revolving line of credit facility. The facility is to be used for temporary or emergency purposes. Under the arrangement, a fund is required to own securities having a market value in excess of 300% of the total bank borrowings. The interest rate on borrowings varies depending on the nature of the loan. The facility also requires a fee to be paid based on the amount of the commitment. This commitment fee is allocated to all the funds participating in the line of credit based on the average net assets of the funds. During the six-month period ended June 30, 2011, the Fund did not have any borrowings under this facility.
| 10. | Industry Classifications: |
Other than the industry classifications “Other Investment Pools and Funds” and “Exchange Traded Funds,” equity industry classifications used in this report are the Global Industry Classification Standard, which was developed by and is the exclusive property and service mark of MSCI, Inc. and Standard & Poor’s.
| 11. | Indemnifications: |
Under the Company’s organizational documents, the Company shall indemnify its officers and directors to the full extent required or permitted under Maryland General Corporation Law and the federal securities laws. In addition, the Company, on behalf of the Fund, may enter into contracts that contain a variety of indemnifications. The Company’s maximum exposure under these arrangements is unknown. However, as of the date of these financial statements the Company has not had prior claims or losses pursuant to these contracts and expects the risk of loss to be remote.
| Financial Highlights |
| - Selected Per-Share Data (A) - |
| Net Asset | Net Realized | Net Increase | ||||||||||||||||||||||||||||||||||||||||||
| Value at | and Unrealized | Total from | Dividends from | Distributions | (Decrease) in | Net Asset | ||||||||||||||||||||||||||||||||||||||
| Beginning of | Net Investment | Payments from | Gain (Loss) on | Investment | Net Investment | from Realized | Distributions | Total | Net Asset | Value at End of | ||||||||||||||||||||||||||||||||||
| Class | Period | Income (Loss) | (to) Affiliate | Investments | Operations | Income | Capital Gains | from Capital | Distributions | Value | Period | |||||||||||||||||||||||||||||||||
| For the Six-Month Period Ended June 30, 2011 (Unaudited) | ||||||||||||||||||||||||||||||||||||||||||||
| IA | $ | 11.79 | $ | 0.07 | $ | – | $ | 0.85 | $ | 0.92 | $ | – | $ | – | $ | – | $ | – | $ | 0.92 | $ | 12.71 | ||||||||||||||||||||||
| IB | 11.73 | 0.06 | – | 0.84 | 0.90 | – | – | – | – | 0.90 | 12.63 | |||||||||||||||||||||||||||||||||
| For the Year Ended December 31, 2010 | ||||||||||||||||||||||||||||||||||||||||||||
| IA | 10.47 | 0.15 | – | 1.32 | 1.47 | (0.15 | ) | – | – | (0.15 | ) | 1.32 | 11.79 | |||||||||||||||||||||||||||||||
| IB | 10.42 | 0.13 | – | 1.30 | 1.43 | (0.12 | ) | – | – | (0.12 | ) | 1.31 | 11.73 | |||||||||||||||||||||||||||||||
| For the Year Ended December 31, 2009 | ||||||||||||||||||||||||||||||||||||||||||||
| IA | 8.46 | 0.15 | – | 2.01 | 2.16 | (0.15 | ) | – | – | (0.15 | ) | 2.01 | 10.47 | |||||||||||||||||||||||||||||||
| IB | 8.41 | 0.13 | – | 2.00 | 2.13 | (0.12 | ) | – | – | (0.12 | ) | 2.01 | 10.42 | |||||||||||||||||||||||||||||||
| For the Year Ended December 31, 2008 | ||||||||||||||||||||||||||||||||||||||||||||
| IA | 15.05 | 0.14 | – | (5.37 | ) | (5.23 | ) | (0.14 | ) | (1.22 | ) | – | (1.36 | ) | (6.59 | ) | 8.46 | |||||||||||||||||||||||||||
| IB | 14.97 | 0.12 | – | (5.35 | ) | (5.23 | ) | (0.11 | ) | (1.22 | ) | – | (1.33 | ) | (6.56 | ) | 8.41 | |||||||||||||||||||||||||||
| For the Year Ended December 31, 2007 | ||||||||||||||||||||||||||||||||||||||||||||
| IA | 14.08 | 0.16 | – | 1.01 | 1.17 | (0.15 | ) | (0.05 | ) | – | (0.20 | ) | 0.97 | 15.05 | ||||||||||||||||||||||||||||||
| IB | 14.01 | 0.13 | – | 1.00 | 1.13 | (0.12 | ) | (0.05 | ) | – | (0.17 | ) | 0.96 | 14.97 | ||||||||||||||||||||||||||||||
| For the Year Ended December 31, 2006 | ||||||||||||||||||||||||||||||||||||||||||||
| IA | 12.66 | 0.14 | 0.01 | 1.42 | 1.57 | (0.15 | ) | – | – | (0.15 | ) | 1.42 | 14.08 | |||||||||||||||||||||||||||||||
| IB | 12.58 | 0.13 | 0.01 | 1.39 | 1.53 | (0.10 | ) | – | – | (0.10 | ) | 1.43 | 14.01 | |||||||||||||||||||||||||||||||
| (A) | Information presented relates to a share outstanding throughout the indicated period. |
| (B) | The figures do not include sales charges or other fees which may be applied at the variable life insurance, variable annuity or qualified retirement plan product level. Any such additional sales charges or other fees would lower the Fund's performance. |
| (C) | Ratios do not reflect reductions for fees paid indirectly. Please see Fees Paid Indirectly in the Notes to Financial Statements. |
| (D) | Portfolio turnover rate is calculated on the basis of the Fund as a whole without distinguishing between the classes of shares issued. |
| (E) | Not annualized. |
| (F) | Annualized. |
| (G) | Total return without the inclusion of the Payment from (to) Affiliate can be found in Expenses in the accompanying Notes to Financial Statements. |
| - Ratios and Supplemental Data - |
| Ratio of Expenses to Average Net | Ratio of Expenses to Average Net | Ratio of Net Investment Income to | Portfolio Turnover | |||||||||||||||||||
| Total Return(B) | Net Assets at End of Period | Assets Before Waivers(C) | Assets After Waivers(C) | Average Net Assets | Rate(D) | |||||||||||||||||
| 7.77 | %(E) | $ | 980,405 | 0.74 | %(F) | 0.74 | %(F) | 1.09 | %(F) | 23 | % | |||||||||||
| 7.63 | (E) | 151,663 | 0.99 | (F) | 0.99 | (F) | 0.84 | (F) | – | |||||||||||||
| 14.04 | 1,022,321 | 0.75 | 0.75 | 1.35 | 44 | |||||||||||||||||
| 13.76 | 159,898 | 1.00 | 1.00 | 1.10 | – | |||||||||||||||||
| 25.65 | (G) | 1,008,875 | 0.75 | 0.75 | 1.56 | 59 | ||||||||||||||||
| 25.33 | (G) | 173,063 | 1.00 | 1.00 | 1.31 | – | ||||||||||||||||
| (37.27 | ) | 868,799 | 0.71 | 0.71 | 1.14 | 73 | ||||||||||||||||
| (37.43 | ) | 165,848 | 0.96 | 0.96 | 0.89 | – | ||||||||||||||||
| 8.34 | 1,566,652 | 0.70 | 0.70 | 1.04 | 75 | |||||||||||||||||
| 8.07 | 339,877 | 0.95 | 0.95 | 0.79 | – | |||||||||||||||||
| 12.45 | (G) | 1,401,619 | 0.72 | 0.72 | 1.19 | 63 | ||||||||||||||||
| 12.17 | (G) | 354,559 | 0.97 | 0.97 | 0.93 | – | ||||||||||||||||
| Directors and Officers (Unaudited) |
The Board of Directors of the Company appoints officers who are responsible for the day-to-day operations of the Fund and who execute policies formulated by the Directors. Each director serves until his or her death, resignation, or retirement or until the next annual meeting of shareholders is held or until his or her successor is elected and qualifies.
Directors and officers who are employed by or who have a financial interest in The Hartford are considered “interested” persons of the Fund pursuant to the 1940 Act. Each officer and two of the Company’s directors, as noted in the chart below, are “interested” persons of the Fund. Each director serves as a director for The Hartford Mutual Funds, Inc., The Hartford Mutual Funds II, Inc., Hartford Series Fund, Inc., and Hartford HLS Series Fund II, Inc., which, as of June 30, 2011, collectively consist of 89 funds. Correspondence may be sent to directors and officers c/o Hartford Mutual Funds, P.O. Box 2999, Hartford, Connecticut 06104-2999, except that correspondence to Ms. Fagely may be sent to 500 Bielenberg Drive, Woodbury, Minnesota 55125.
The table below sets forth, for each director and officer, his or her name, year of birth, current position with the Company and date first elected or appointed to Hartford Series Fund, Inc. (“HSF”), and Hartford HLS Series Fund II, Inc. (“HSF2”), principal occupation, and, for directors, other directorships held. The Fund’s statement of additional information contains further information on the directors and is available free of charge by calling 1-800-862-6668 or writing to Hartford HLS Funds, c/o Individual Annuity Services, P.O. Box 5085, Hartford, CT 06102-5085.
Information on the aggregate remuneration paid to the directors of the Company can be found in the Statement of Operations herein. The Fund pays to The Hartford a portion of the chief compliance officer’s compensation, but does not pay salaries or compensation to any of their other officers or directors who are employed by The Hartford.
Non-Interested Directors
Lynn S. Birdsong (1946) Director since 2003, Co-Chairman of the Investment Committee
Mr. Birdsong is a private investor. Mr. Birdsong currently serves as a Director of the Sovereign High Yield Investment Company (April 2010 to current). Mr. Birdsong currently serves as an Independent Director of Nomura Partners Funds, Inc. (formerly, The Japan Fund) (March 2003 to current). From 2003 to March 2005, Mr. Birdsong was an independent director of the Atlantic Whitehall Funds. From 1979 to 2002, Mr. Birdsong was a managing director of Zurich Scudder Investments, an investment management firm. During his employment with Scudder, Mr. Birdsong was an Interested Director of The Japan Fund. Since 1981, Mr. Birdsong has been a partner in Birdsong Company, an advertising specialty firm.
Robert M. Gavin, Jr. (1940) Director since 2002 (HSF) and 1986 (HSF2), Chairman of the Board since 2004
Dr. Gavin is an educational consultant. Prior to September 1, 2001, he was President of Cranbrook Education Community and prior to July 1996, he was President of Macalester College, St. Paul, Minnesota.
Duane E. Hill (1945) Director since 2001 (HSF) and 2002 (HSF2), Chairman of the Nominating Committee
Mr. Hill is Partner of TSG Ventures L.P., a private equity investment company. Mr. Hill is a former partner of TSG Capital Group, a private equity investment firm that served as sponsor and lead investor in leveraged buyouts of middle market companies.
Sandra S. Jaffee (1941) Director since 2005
Ms. Jaffee served as Chairman (2008 to 2009) and Chief Executive Officer of Fortent (formerly Searchspace Group), a leading provider of compliance/regulatory technology to financial institutions from August 2005 to August 2009. From August 2004 to August 2005, Ms. Jaffee served as an Entrepreneur in Residence with Warburg Pincus, a private equity firm. From September 1995 to July 2004, Ms. Jaffee served as Executive Vice President at Citigroup, where she was President and Chief Executive Officer of Citibank’s Global Securities Services (1995 to 2003). Ms. Jaffe currently serves as a member of the Board of Directors of Broadridge Financial Solutions as well as a Trustee of Muhlenberg College.
William P. Johnston (1944) Director since 2005, Chairman of the Compliance Committee
In June 2006, Mr. Johnston was appointed as Senior Advisor to The Carlyle Group, a global private equity investment firm. In July 2006, Mr. Johnston was elected to the Board of Directors of MultiPlan, Inc. In August 2007, Mr. Johnston was elected to the Board of Directors of LifeCare Holdings, Inc. In February 2008, Mr. Johnston was elected to the Board of Directors of HCR-ManorCare, Inc. In May 2006, Mr. Johnston was elected to the Supervisory Board of Fresenius Medical Care AG & Co. KGaA, after its acquisition of Renal Care Group, Inc. in March 2006. Mr. Johnston joined Renal Care Group in November 2002 as a member of the Board of Directors and served as Chairman of the Board from March 2003 through March 2006. From September 1987 to December 2002, Mr. Johnston was with Equitable Securities Corporation (and its successors, SunTrust Equitable Securities and SunTrust Robinson Humphrey) serving in various investment banking and managerial positions, including Managing Director and Head of Investment Banking, Chief Executive Officer and Vice Chairman.
Phillip O. Peterson (1944) Director since 2002 (HSF) and 2000 (HSF2), Chairman of the Audit Committee
Mr. Peterson is a mutual fund industry consultant. He was a partner of KPMG LLP (an accounting firm) until July 1999. Mr. Peterson joined William Blair Funds in February 2007 as a member of the Board of Trustees. From January 2004 to April 2005, Mr. Peterson served as Independent President of the Strong Mutual Funds.
Lemma W. Senbet (1946) Director since 2005
Dr. Senbet is the William E. Mayer Chair Professor of Finance and Director, Center for Financial Policy, at the University of Maryland, Robert H. Smith School of Business. He was chair of the Finance Department from 1998 to 2006. Previously he was a chaired professor of finance at the University of Wisconsin-Madison. Also, he was director of the Fortis Funds from March 2000 to July 2002. Dr. Senbet served the finance profession in various capacities, including as director of the American Finance Association and President of the Western Finance Association. In 2006, Dr. Senbet was inducted Fellow of Financial Management Association International for his career-long distinguished scholarship and professional service.
Interested Directors and Officers
David N. Levenson (1966) Director since 2010
Mr. Levenson currently serves as President of The Hartford’s Wealth Management business. He was appointed to this role in July 2010. Previously, Mr. Levenson served as Executive Vice President of Legacy Holdings for The Hartford from June 2009 to July 2010. From 2006 to 2009, Mr. Levenson was with Hartford Life Insurance K.K. where he served as President and CEO from 2007 to 2009. He served as Managing Director of Hartford Investment Management Company from 2005 to 2006. Additionally, Mr. Levenson serves as Executive Vice President of The Hartford and as President, Director and Chief Executive Officer of Hartford Life Insurance Company (“HLIC”) and Hartford Life, Inc. (“HL Inc.”).
Lowndes A. Smith (1939) Director since 1996 (HSF) and 2002 (HSF2), Co-Chairman of the Investment Committee
Mr. Smith served as Vice Chairman of The Hartford from February 1997 to January 2002, as President and Chief Executive Officer of HL Inc. from February 1997 to January 2002, and as President and Chief Operating Officer of The Hartford Life Insurance Companies from January 1989 to January 2002. Mr. Smith serves as a Director of White Mountains Insurance Group, Ltd., One Beacon Insurance and Symetra Financial and as a Managing Director of Whittington Gray Associates.
Other Officers
James E. Davey (1964) President and Chief Executive Officer since 2010
Mr. Davey serves as Executive Vice President of HLIC. Additionally, Mr. Davey serves as President, Chief Executive Officer and Manager of Hartford Investment Financial Services, Inc. (“HIFSCO”) and President, Chief Executive Officer and Manager of HL Advisors. Mr. Davey joined The Hartford in 2002.
Tamara L. Fagely (1958) Vice President, Treasurer and Controller since 2002 (HSF) and 1993 (HSF2)
Ms. Fagely has been a Vice President of HASCO since 1998 and Chief Financial Officer since 2006. Currently Ms. Fagely is a Vice President of HLIC. She served as Assistant Vice President of HLIC from December 2001 through March 2005. In addition, Ms. Fagely is Controller and Chief Financial Officer of HIFSCO.
Susan M. Fleege (1959) AML Compliance Officer since 2011
Ms. Fleege currently serves as a Director of Risk Management at The Hartford. She previously served as AML Compliance Officer for the Fund from 2005-2008. Ms. Fleege joined HLIC in 2005 from Amerprise Financial Corporation where she held the position of Counsel from 2000 to 2005. Ms. Fleege is a certified Anti-Money Laundering Specialist.
Dr. Robert J. Froehlich (1953) Senior Managing Director since 2009
Dr. Froehlich joined The Hartford as Senior Managing Director in September 2009. Prior to joining The Hartford, Dr. Froehlich served as Vice Chairman of Deutsche Asset Management from 1997-2009.
Edward P. Macdonald (1967) Vice President, Secretary and Chief Legal Officer since 2005
Mr. Macdonald serves as Vice President of HLIC and Chief Legal Officer of Mutual Funds and Vice President of HIFSCO. He also serves as Vice President and Secretary of HASCO, and Chief Legal Officer, Secretary and Vice President of HL Advisors. Mr. Macdonald joined The Hartford in 2005.
Hartford Disciplined Equity HLS Fund |
| Directors and Officers (Unaudited) – (continued) |
Vernon J. Meyer (1964) Vice President since 2006
Mr. Meyer serves as Senior Vice President of HLIC. He also serves as Senior Vice President of HIFSCO and HL Advisors. Mr. Meyer joined The Hartford in 2004.
Colleen B. Pernerewski (1969) Vice President and Chief Compliance Officer since 2010
Ms. Pernerewski serves as Vice President and Chief Investment Advisor Compliance Officer of HIFSCO and as Vice President and Chief Compliance Officer of HL Advisors. Ms. Pernerewski joined The Hartford in 2005 from Travelers Life and Annuity where she served as Counsel (2004-2005). Prior to Travelers Life and Annuity, Ms. Pernerewski held the position of Counsel at The Hartford (1998-2004).
Elizabeth L. Schroeder (1966) Vice President since 2010
Ms. Schroeder currently serves as Assistant Vice President of HLIC. Ms. Schroeder joined HLIC in 1991. She is also an Assistant Vice President of HIFSCO and HL Advisers.
Martin Swanson (1962) Vice President since 2010
Mr. Swanson is a Vice President of HLIC. Mr. Swanson also serves as Vice President/Marketing for HIFSCO. Prior to joining HLIC in 1998, Mr. Swanson was a Vice President at PaineWebber, Inc.
Jane Wolak (1961) Vice President since 2009
Ms. Wolak currently serves as Senior Vice President of HLIC. Ms. Wolak joined HLIC as Vice President, Retail Product Services in May 2007. She is also Vice President of HASCO. Previously, Ms. Wolak was with Sun Life Financial where she held the position of Vice President, Service Center Operations from 2001-2007.
A description of the policies and procedures that the Fund uses to determine how to vote proxies relating to portfolio securities and a record of how the Fund voted any proxies for the twelve-month period ended June 30, 2011 are available (1) without charge, upon request, by calling 800-862-6668 and (2) on the SEC’s website at http://www.sec.gov.
The Fund files a complete schedule of portfolio holdings with the SEC for the first and third quarters of each fiscal year on Form N-Q. The Fund’s Forms are available (1) without charge, upon request, by calling 800-862-6668 and (2) on the SEC’s website at http://www.sec.gov. The Form N-Q may be reviewed and copied at the SEC’s Public Reference Room in Washington, DC. Information on the operation of the Public Reference Room may be obtained by calling 1-800-SEC-0330.
| Expense Example (Unaudited) |
Your Fund's Expenses
As a shareholder of the Fund, you incur two types of costs: (1) transaction costs and (2) ongoing costs including investment management fees, distribution fees, and other fund expenses. This example is intended to help you understand your ongoing costs (in dollars) of investing in a Fund and to compare these costs with the ongoing costs of investing in other mutual funds. The example is based on an investment of $1,000 invested at the beginning of the period and held for the period of December 31, 2010 through June 30, 2011.
Actual Expenses
The first set of columns of the table below provides information about actual account values and actual expenses. You may use the information in this column, together with the amount you invested, to estimate the expenses that you paid over the period. Simply divide your account value by $1,000 (for example, an $8,600 account value divided by $1,000 = 8.6), then multiply the result by the number in the line under the heading entitled “Expenses Paid During Period” to estimate the expenses you paid on your account during this period.
Hypothetical Example for Comparison Purposes
The second set of columns of the table below provides information about hypothetical account values and hypothetical expenses based on a Fund's actual expense ratio and an assumed rate of return of 5% per year before expenses, which is not the Fund's actual return. The hypothetical account values and expenses may not be used to estimate the actual ending account balance or expenses you paid for the period. You may use this information to compare the ongoing costs of investing in a Fund and other funds. To do so, compare this 5% hypothetical example with the 5% hypothetical examples that appear in the shareholder reports of the other funds.
Please note that the expenses shown in the table are meant to highlight your ongoing costs only and do not reflect any transactional costs, such as sales charges (loads) and CDSC. Therefore, the second set of columns of the table is useful in comparing ongoing costs only, and will not help you determine the relative total costs of owning different funds. In addition, if these transactional costs were included, your costs would be higher. Expenses are equal to the Fund's annualized expense ratios multiplied by average account value over the period, multiplied by 181/365 (to reflect the one-half year period).
| Actual return | Hypothetical (5% return before expenses) | |||||||||||||||||||||||||||||||||||
| Expenses paid | Expenses paid | Days in | ||||||||||||||||||||||||||||||||||
| during the period | during the period | the | Days | |||||||||||||||||||||||||||||||||
| Beginning | Ending | December 31, 2010 | Beginning | Ending | December 31, 2010 | Annualized | current | in the | ||||||||||||||||||||||||||||
| Account Value | Account Value | through | Account Value | Account Value | through | expense | 1/2 | full | ||||||||||||||||||||||||||||
| December 31, 2010 | June 30, 2011 | June 30, 2011 | December 31, 2010 | June 30, 2011 | June 30, 2011 | ratio | year | year | ||||||||||||||||||||||||||||
| Class IA | $ | 1,000.00 | $ | 1,077.68 | $ | 3.81 | $ | 1,000.00 | $ | 1,021.12 | $ | 3.71 | 0.74 | % | 181 | 365 | ||||||||||||||||||||
| Class IB | $ | 1,000.00 | $ | 1,076.34 | $ | 5.10 | $ | 1,000.00 | $ | 1,019.89 | $ | 4.96 | 0.99 | % | 181 | 365 | ||||||||||||||||||||
27
| The Hartford | |
| P.O. Box 5085 | |
| Hartford, CT 06102-5085 |
Hartford Series Fund, Inc. is underwritten and distributed by Hartford Securities Distribution Company, Inc.
"The Hartford" is The Hartford Financial Services Group, Inc. and its subsidiaries.
Hartford Series Fund, Inc. inception dates range from 1977 to date. Hartford Series Fund, Inc. is not a subsidiary of The Hartford but is underwritten, distributed by and advised by subsidiaries of The Hartford. Investments in Hartford Series Fund, Inc. are not guaranteed by The Hartford or any other entity.
You should carefully consider investment objectives, risks, and charges and expenses of Hartford HLS Funds before investing. This and other information can be found in the Fund’s prospectus or summary prospectus, which can be obtained by calling 800-862-6668. Please read them carefully before you invest or send money.
HLSSAR-DE11 8-11 | 106632 | Printed in U.S.A ©2011 The Hartford, Hartford, CT 06115 |

A MESSAGE FROM THE PRESIDENT

Dear Fellow Shareholders:
I want to take this opportunity to say thank you for your continued confidence and trust.
We have seen a significant amount of global turbulence in the first half of 2011. Investors have continued to be concerned about the implications of the European sovereign debt crisis, as well as our own high levels of domestic debt. Since January we have witnessed significant political uprisings in the already-volatile Middle East and North Africa region. In addition, the ramifications of Japan's massive earthquake, subsequent tsunami, and nuclear disaster are still being played out in the market.
Although corporate earnings have remained robust, the unemployment picture has been mixed. After adding more than 200,000 jobs from February to April, more recent unemployment reports have shown a pullback in hiring.
While official inflation remains low as measured by the Consumer Price Index (CPI), high oil prices may be indicative of higher inflation in the future. The federal funds rate remains at a historic low, however, the Fed could potentially raise the rate to get it closer to its historical average once the economy strengthens.
Even with these headwinds, domestic, international, and world indices (as measured by the S&P 500, MSCI EAFE and MSCI World) are all up more than 5% through June, 30 2011.
Looking ahead, continued growth in emerging markets is fueling global recovery efforts. Emerging markets comprise about 48 percent of the world’s GDP, and many economists believe they are poised for further expansion. As GDP growth continues in emerging markets, roughly 100 million people are added to the middle class each year. This middle class population growth could potentially drive a considerable shift in consumer purchasing power.
Now that we have reached the midpoint of 2011, perhaps now would be a good time to schedule a meeting with your financial adviser to examine your current investment strategy and determine whether you are on the right track.
| • | Are you concerned about inflation and its effects on your portfolio? |
| • | Is your portfolio prepared for rising interest rates? |
| • | Does your portfolio reflect the global economy with a mix of developed nations and emerging markets? |
Your financial professional’s advice can help you to navigate today’s volatile markets with confidence. You can also rest assured that we will continue to provide you with solid investments and stellar service for the road ahead.
Thank you again for your business.

James Davey
President
Hartford HLS Funds
Hartford Dividend and Growth HLS Fund
| Manager Discussion (Unaudited) | 2 |
| Financial Statements | |
| 5 | |
| 8 | |
| 9 | |
| 10 | |
| 11 | |
| 12 | |
| 22 | |
| 24 | |
| 26 | |
| 26 | |
| 27 |
This report is prepared for the general information of contract owners and qualified retirement plan participants. It is not an offer of contracts or of qualified retirement plans. It should not be used in connection with any offer, except in conjunction with the appropriate product prospectus which contains all pertinent information including the applicable sales, administrative and other charges.
The views expressed in the Fund’s Manager Discussion under ‘‘Why did the Fund perform this way?’’ and ‘‘What is the outlook?’’ are views of the Fund’s sub-adviser and portfolio management team through the end of the reporting period and are subject to change based on market and other conditions.
Hartford Dividend and Growth HLS Fund inception 03/09/1994 |
| (sub-advised by Wellington Management Company, LLP) |
Investment objective – Seeks a high level of current income consistent with growth of capital. |
Performance Overview 6/30/01 - 6/30/11

The chart above shows the growth of a $10,000 investment in Class IA. Growth results in classes other than Class IA will vary from what is seen above due to differences in the expenses charged to those share classes.
Average Annual Total Returns (as of 6/30/11)
| 6 Month† | 1 Year | 5 year | 10 year | |||||||||||||
| Dividend and Growth IA | 5.65 | % | 28.98 | % | 4.49 | % | 5.17 | % | ||||||||
| Dividend and Growth IB | 5.52 | % | 28.66 | % | 4.23 | % | 4.91 | % | ||||||||
| Russell 1000 Value Index | 5.92 | % | 28.94 | % | 1.15 | % | 3.99 | % | ||||||||
| S&P 500 Index | 6.01 | % | 30.68 | % | 2.94 | % | 2.72 | % | ||||||||
| † | Not Annualized |
PAST PERFORMANCE IS NOT INDICATIVE OF FUTURE RESULTS.
Total returns presented above were calculated using the Fund's net asset value available to shareholders for sale or redemption of Fund shares on June 30, 2011, which excludes investment transactions as of this date.
Russell 1000 Value Index is an unmanaged index measuring the performance of those Russell 1000 Index companies with lower price-to-book ratios and lower forecasted growth values. (The Russell 1000 Index is an unmanaged index that measures the performance of the 1,000 largest companies in the Russell 3000 Index, which measures the performance of the 3,000 largest U.S. companies, based on total market capitalizations.)
S&P 500 Index is a market capitalization-weighted price index composed of 500 widely held common stocks.
You cannot invest directly in an index.
The chart represents a hypothetical investment in the Fund. Performance data represents past performance and current performance could be higher or lower.
Performance information may reflect historical or current expense waivers/reimbursements from the investment adviser, without which performance would have been lower. For information on current expense waivers/reimbursements, please see the prospectus.
The value of the fund will fluctuate so that when redeemed, it may be worth more or less than the original investment. The chart and table do not reflect the deductions of taxes, sales charges or other fees which may be applied at the variable life insurance, variable annuity or qualified retirement plan product level. Any such additional sales charges or other fees or expenses would lower the contract’s or plan’s performance.
| Portfolio Managers | ||
| Edward P. Bousa, CFA | Donald J. Kilbride | Matthew G. Baker |
| Senior Vice President | Senior Vice President | Vice President |
How did the Fund perform?
The Class IA shares of the Hartford Dividend and Growth HLS Fund returned 5.65% for the six-month period ended June 30, 2011, underperforming its benchmarks, the S&P 500 Index, which returned 6.01% and the Russell 1000 Value Index, which returned 5.92% for the same period. The Fund also underperformed the 5.85% return of the average fund in the Lipper Equity Income Funds VA-UF peer group, a group of funds with investment strategies similar to those of the Fund.
Why did the Fund perform this way?
U.S. equities moved higher during the period despite a high degree of volatility caused by mounting concerns about unrest in North Africa and the Middle East and the devastating earthquake and nuclear crisis in Japan. Equities were pushed higher by investors’ enthusiasm for additional government debt purchases by the U.S. Federal Reserve, the extension of tax cuts in the U.S., and strong earnings growth. Fears of a global economic slowdown due to sovereign debt troubles in Europe, Japanese supply disruptions, and the end of the Federal Reserve’s quantitative easing program were not enough to offset optimism about the global economy, strong corporate earnings, and a continued accommodative Fed policy.
Overall equity market performance was positive for the period across all market capitalizations: large-cap equities (+6%), mid -aps (+9%), and small-caps (+6%) all rose as represented by the S&P 500, S&P 400 MidCap, and Russell 2000 Indices, respectively. During the six-month period nine of ten sectors within the S&P 500 Index posted positive returns, led by Health Care (+14%) and Energy (+11%), while Financials (-3%) was the only sector to produce negative absolute returns (i.e. total return).
The Fund’s underperformance relative to the S&P 500 was largely due to negative stock selection within Consumer Discretionary, Health Care, and Materials. This was partially offset by stronger selection in Information Technology. Overall sector allocation, a residual of bottom-up (i.e. stock by stock fundamental research) stock selection, was positive driven in part by our overweight (i.e. the Fund’s sector position was greater than the benchmark position) to Health Care and underweight (i.e. the Fund’s sector position was less than the benchmark position) to Information Technology.
The Fund’s top detractors from benchmark-relative (i.e. performance of the Fund as measured against the benchmark) returns were Staples (Consumer Discretionary), Wells Fargo (Financials), and Barrick Gold (Materials). U.S. and international office supply retailer and distributor Staples reported a soft quarter due to a significant operating miss in its international operations, driving shares lower. Concerns over secular changes in office supply needs due to technology devices such as tablets also continue to weigh on the stock. Shares of Wells Fargo, a diversified financial services company, were pressured by uncertainty over regulatory capital requirements and the near-term direction of fee and interest income. Barrick Gold is a gold mining company. Social strife at one of their main assets in Tanzania has escalated into violence recently, negatively impacting the stock's valuation. Cisco Systems (Information Technology) also detracted from absolute returns.
The Fund’s top contributors to benchmark-relative performance during the period were Google (Information Technology), Baker Hughes (Energy), and Accenture (Information Technology). Not owning benchmark component Google, the Internet search engine giant, helped relative results as the company’s first-quarter profit fell short of target due to a surge in operating expenses. Shares of Baker Hughes, a major oil field service company, gained on strong fourth quarter results driven by robust margin expansion and higher energy prices. Global management consulting, technology services and outsourcing company Accenture reported better-than-expected fiscal third quarter results. The stock rose as the increase in bookings and lack of delays or cancellations of projects during the quarter signaled that demand is strong and could translate into strong earnings growth in coming quarters. Chevron (Energy), Pfizer (Health Care), and IBM (Information Technology) were among the top contributors to absolute performance.
What is the outlook?
The stock market ended its two year long rebound from the March 2009 lows during the latter part of the period. Concerns include signs of a slowing economy, U.S. debt ceiling issues that threaten a government shutdown, and the Greek financial crisis, which is causing fears of contagion in Europe.
Our investment discipline is focused on investing in areas of strong demand and avoiding areas of oversupply. At the end of the period, our largest overweights relative to the benchmark were to the Health Care, Energy, and Utilities sectors, while we remained underweight the Information Technology, Consumer Staples, and Consumer Discretionary sectors.
Diversification by Industry
as of June 30, 2011
| Percentage of | ||||
| Industry (Sector) | Net Assets | |||
Automobiles & Components (Consumer Discretionary) | 1.7 | % | ||
| Banks (Financials) | 5.3 | |||
| Capital Goods (Industrials) | 8.7 | |||
| Commercial & Professional Services (Industrials) | 0.9 | |||
| Diversified Financials (Financials) | 5.5 | |||
| Energy (Energy) | 14.4 | |||
| Food & Staples Retailing (Consumer Staples) | 0.9 | |||
| Food, Beverage & Tobacco (Consumer Staples) | 4.6 | |||
| Health Care Equipment & Services (Health Care) | 3.1 | |||
| Household & Personal Products (Consumer Staples) | 1.7 | |||
| Insurance (Financials) | 5.4 | |||
| Materials (Materials) | 2.7 | |||
| Media (Consumer Discretionary) | 4.0 | |||
Pharmaceuticals, Biotechnology & Life Sciences (Health Care) | 11.8 | |||
| Retailing (Consumer Discretionary) | 2.6 | |||
Semiconductors & Semiconductor Equipment (Information Technology) | 3.3 | |||
| Software & Services (Information Technology) | 7.9 | |||
Technology Hardware & Equipment (Information Technology) | 2.5 | |||
| Telecommunication Services (Services) | 4.4 | |||
| Transportation (Industrials) | 2.5 | |||
| Utilities (Utilities) | 4.8 | |||
| Short-Term Investments | 0.9 | |||
| Other Assets and Liabilities | 0.4 | |||
| Total | 100.0 | % | ||
| Schedule of Investments |
| June 30, 2011 (Unaudited) |
(000’s Omitted) |
| Shares or Principal Amount | Market Value ╪ | ||||||
| COMMON STOCKS - 98.7% | |||||||
| Automobiles & Components - 1.7% | |||||||
| 1,696 | Ford Motor Co. · | $ | 23,382 | ||||
| 737 | Honda Motor Co., Ltd. ADR | 28,448 | |||||
| 873 | Johnson Controls, Inc. | 36,373 | |||||
| 88,203 | |||||||
| Banks - 5.3% | |||||||
| 1,080 | PNC Financial Services Group, Inc. | 64,379 | |||||
| 1,533 | US Bancorp | 39,097 | |||||
| 5,932 | Wells Fargo & Co. | 166,463 | |||||
| 269,939 | |||||||
| Capital Goods - 8.7% | |||||||
| 897 | Cooper Industries plc Class A | 53,548 | |||||
| 583 | Deere & Co. | 48,101 | |||||
| 512 | General Dynamics Corp. | 38,125 | |||||
| 3,258 | General Electric Co. | 61,440 | |||||
| 706 | Honeywell International, Inc. | 42,088 | |||||
| 270 | Illinois Tool Works, Inc. | 15,258 | |||||
| 890 | Northrop Grumman Corp. | 61,749 | |||||
| 867 | Pentair, Inc. | 35,008 | |||||
| 642 | Raytheon Co. | 32,004 | |||||
| 370 | Siemens AG ADR | 50,941 | |||||
| 438,262 | |||||||
| Commercial & Professional Services - 0.9% | |||||||
| 1,152 | Waste Management, Inc. | 42,946 | |||||
| Diversified Financials - 5.5% | |||||||
| 4,978 | Bank of America Corp. | 54,555 | |||||
| 231 | Goldman Sachs Group, Inc. | 30,770 | |||||
| 2,922 | JP Morgan Chase & Co. | 119,618 | |||||
| 609 | Morgan Stanley | 14,013 | |||||
| 187 | State Street Corp. | 8,414 | |||||
| 2,835 | UBS AG ADR · | 51,762 | |||||
| 279,132 | |||||||
| Energy - 14.4% | |||||||
| 1,037 | Anadarko Petroleum Corp. | 79,623 | |||||
| 782 | Baker Hughes, Inc. | 56,735 | |||||
| 700 | Cenovus Energy, Inc. | 26,357 | |||||
| 500 | Chesapeake Energy Corp. | 14,833 | |||||
| 1,696 | Chevron Corp. | 174,386 | |||||
| 1,285 | EnCana Corp. ADR | 39,573 | |||||
| 2,210 | Exxon Mobil Corp. | 179,820 | |||||
| 451 | Occidental Petroleum Corp. | 46,933 | |||||
| 937 | Total S.A. ADR | 54,219 | |||||
| 1,197 | Ultra Petroleum Corp. · | 54,836 | |||||
| 727,315 | |||||||
| Food & Staples Retailing - 0.9% | |||||||
| 1,241 | CVS/Caremark Corp. | 46,637 | |||||
| Food, Beverage & Tobacco - 4.6% | |||||||
| 336 | Nestle S.A. ADR | 20,966 | |||||
| 1,315 | PepsiCo, Inc. | 92,580 | |||||
| 1,101 | Philip Morris International, Inc. | 73,494 | |||||
| 1,448 | Unilever N.V. Class NY ADR | 47,580 | |||||
| 234,620 | |||||||
| Health Care Equipment & Services - 3.1% | |||||||
| 1,254 | Cardinal Health, Inc. | 56,934 | |||||
| 1,843 | Medtronic, Inc. | 70,995 | |||||
| 551 | UnitedHealth Group, Inc. | 28,421 | |||||
| 156,350 | |||||||
| Household & Personal Products - 1.7% | |||||||
| 133 | Colgate-Palmolive Co. | 11,617 | |||||
| 1,141 | Procter & Gamble Co. | 72,546 | |||||
| 84,163 | |||||||
| Insurance - 5.4% | |||||||
| 1,023 | ACE Ltd. | 67,347 | |||||
| 652 | Chubb Corp. | 40,847 | |||||
| 383 | Marsh & McLennan Cos., Inc. | 11,955 | |||||
| 1,844 | MetLife, Inc. | 80,874 | |||||
| 798 | Principal Financial Group, Inc. | 24,272 | |||||
| 772 | Prudential Financial, Inc. | 49,085 | |||||
| 274,380 | |||||||
| Materials - 2.7% | |||||||
| 829 | Barrick Gold Corp. | 37,532 | |||||
| 1,177 | Dow Chemical Co. | 42,361 | |||||
| 1,127 | Owens-Illinois, Inc. · | 29,077 | |||||
| 393 | Rio Tinto plc ADR | 28,393 | |||||
| 137,363 | |||||||
| Media - 4.0% | |||||||
| 3,484 | Comcast Corp. Class A | 88,289 | |||||
| 4,160 | News Corp. Class A | 73,623 | |||||
| 1,152 | Time Warner, Inc. | 41,886 | |||||
| 203,798 | |||||||
| Pharmaceuticals, Biotechnology & Life Sciences - 11.8% | |||||||
| 1,227 | AstraZeneca plc ADR | 61,411 | |||||
| 1,358 | Bristol-Myers Squibb Co. | 39,334 | |||||
| 2,668 | Eli Lilly & Co. | 100,134 | |||||
| 417 | Hospira, Inc. · | 23,634 | |||||
| 1,497 | Johnson & Johnson | 99,587 | |||||
| 2,837 | Merck & Co., Inc. | 100,125 | |||||
| 6,621 | Pfizer, Inc. | 136,396 | |||||
| 710 | Teva Pharmaceutical Industries Ltd. ADR | 34,246 | |||||
| 594,867 | |||||||
| Retailing - 2.6% | |||||||
| 375 | J.C. Penney Co., Inc. | 12,947 | |||||
| 2,312 | Lowe's Co., Inc. | 53,900 | |||||
| 1,739 | Staples, Inc. | 27,470 | |||||
| 819 | Target Corp. | 38,424 | |||||
| 132,741 | |||||||
| Semiconductors & Semiconductor Equipment - 3.3% | |||||||
| 781 | Analog Devices, Inc. | 30,568 | |||||
| 1,424 | Intel Corp. | 31,552 | |||||
| 1,993 | Taiwan Semiconductor Manufacturing Co., Ltd. ADR | 25,132 | |||||
| 1,510 | Texas Instruments, Inc. | 49,570 | |||||
| 839 | Xilinx, Inc. | 30,598 | |||||
| 167,420 | |||||||
| Software & Services - 7.9% | |||||||
| 1,022 | Accenture plc | 61,737 | |||||
| 988 | Automatic Data Processing, Inc. | 52,048 | |||||
| 1,371 | eBay, Inc. · | 44,249 | |||||
| 822 | IBM Corp. | 141,048 | |||||
| 3,828 | Microsoft Corp. | 99,515 | |||||
| 398,597 | |||||||
| Technology Hardware & Equipment - 2.5% | |||||||
| 812 | Avnet, Inc. · | 25,871 | |||||
| 2,859 | Cisco Systems, Inc. | 44,635 | |||||
| 1,285 | Nokia Corp. ADR | 8,248 | |||||
| 846 | Qualcomm, Inc. | 48,050 | |||||
| 126,804 | |||||||
The accompanying notes are an integral part of these financial statements.
Schedule of Investments – (continued) June 30, 2011 (Unaudited) |
| (000’s Omitted) |
| Shares or Principal Amount | Market Value ╪ | ||||||||
| COMMON STOCKS - 98.7% - (continued) | |||||||||
| Telecommunication Services - 4.4% | |||||||||
| 6,374 | AT&T, Inc. | $ | 200,206 | ||||||
| 4,362 | Sprint Nextel Corp. · | 23,510 | |||||||
| 223,716 | |||||||||
| Transportation - 2.5% | |||||||||
| 617 | FedEx Corp. | 58,522 | |||||||
| 951 | United Parcel Service, Inc. Class B | 69,364 | |||||||
| 127,886 | |||||||||
| Utilities - 4.8% | |||||||||
| 1,287 | Dominion Resources, Inc. | 62,099 | |||||||
| 996 | Exelon Corp. | 42,657 | |||||||
| 974 | NextEra Energy, Inc. | 55,937 | |||||||
| 927 | PG&E Corp. | 38,975 | |||||||
| 536 | PPL Corp. | 14,925 | |||||||
| 1,124 | Xcel Energy, Inc. | 27,311 | |||||||
| 241,904 | |||||||||
| Total common stocks | |||||||||
| (cost $4,116,909) | $ | 4,997,043 | |||||||
| Total long-term investments | |||||||||
| (cost $4,116,909) | $ | 4,997,043 | |||||||
| SHORT-TERM INVESTMENTS - 0.9% | |||||||||
| Repurchase Agreements - 0.9% | |||||||||
| Bank of America Merrill Lynch TriParty Joint | |||||||||
| Repurchase Agreement (maturing on | |||||||||
| 07/01/2011 in the amount of $4,251, | |||||||||
| collateralized by FHLB 4.91%, 2015, | |||||||||
| GNMA 0.87% - 5.72%, 2025 - 2061, value | |||||||||
| of $4,336) | |||||||||
| $ | 4,251 | 0.05%, 06/30/2011 | $ | 4,251 | |||||
| BNP Paribas Securities Corp. TriParty Joint | |||||||||
| Repurchase Agreement (maturing on | |||||||||
| 07/01/2011 in the amount of $3,200, | |||||||||
| collateralized by FNMA 3.50% - 6.50%, | |||||||||
| 2023 - 2041, value of $3,264) | |||||||||
| 3,200 | 0.05%, 06/30/2011 | 3,200 | |||||||
| Deutsche Bank Securities TriParty Joint | |||||||||
| Repurchase Agreement (maturing on | |||||||||
| 07/01/2011 in the amount of $30,946, | |||||||||
| collateralized by GNMA 4.00% - 7.00%, | |||||||||
| 2035 - 2040, value of $31,565) | |||||||||
| 30,946 | 0.05%, 06/30/2011 | 30,946 | |||||||
| UBS Securities, Inc. Joint Repurchase | |||||||||
| Agreement (maturing on 07/01/2011 in the | |||||||||
| amount of $62, collateralized by U.S. | |||||||||
| Treasury Bill 0.63%, 2012, value of $63) | |||||||||
| 62 | 0.01%, 06/30/2011 | 62 | |||||||
| UBS Securities, Inc. TriParty Joint | |||||||||
| Repurchase Agreement (maturing on | |||||||||
| 07/01/2011 in the amount of $4,723, | |||||||||
| collateralized by FHLMC 4.50%, 2040, | |||||||||
| FNMA 4.50% - 6.00%, 2035 - 2041, value | |||||||||
| of $4,818) | |||||||||
| 4,723 | 0.06%, 06/30/2011 | 4,723 | |||||||
| 43,182 | |||||||||
| Total short-term investments | |||||||||
| (cost $43,182) | $ | 43,182 | |||||||
| Total investments | |||||||||
| (cost $4,160,091) ▲ | 99.6 | % | $ | 5,040,225 | |||||
| Other assets and liabilities | 0.4 | % | 21,975 | ||||||
| Total net assets | 100.0 | % | $ | 5,062,200 | |||||
The accompanying notes are an integral part of these financial statements.
| Note: | Percentage of investments as shown is the ratio of the total market value to total net assets. Market value of investments in foreign securities represents 10.2% of total net assets at June 30, 2011. |
Prices of foreign equities that are principally traded on certain foreign markets may be adjusted daily pursuant to a fair value pricing service approved by the Board of Directors in order to reflect an adjustment for factors occurring after the close of certain foreign markets but before the close of the New York Stock Exchange.
▲ | At June 30, 2011, the cost of securities for federal income tax purposes was $4,171,816 and the aggregate gross unrealized appreciation and depreciation based on that cost were: |
| Unrealized Appreciation | $ | 1,005,801 | ||
| Unrealized Depreciation | (137,392 | ) | ||
| Net Unrealized Appreciation | $ | 868,409 |
· | Currently non-income producing. |
| ╪ | See Significant Accounting Policies of accompanying Notes to Financial Statements regarding valuation of securities. |
The accompanying notes are an integral part of these financial statements.
| Investment Valuation Hierarchy Level Summary |
| June 30, 2011 (Unaudited) |
| (000’s Omitted) |
| Total | Level 1 ♦ | Level 2 ♦ | Level 3 | |||||||||||||
| Assets: | ||||||||||||||||
Common Stocks ‡ | $ | 4,997,043 | $ | 4,997,043 | $ | – | $ | – | ||||||||
| Short-Term Investments | 43,182 | – | 43,182 | – | ||||||||||||
| Total | $ | 5,040,225 | $ | 4,997,043 | $ | 43,182 | $ | – | ||||||||
| ♦ | For the six-month period ended June 30, 2011, there were no significant transfers between Level 1 and Level 2. |
| ‡ | The Fund has all or primarily all of the equity securities categorized in a particular level. Refer to the Schedule of Investments for further industry breakout. |
The accompanying notes are an integral part of these financial statements.
Statement of Assets and Liabilities June 30, 2011 (Unaudited) |
| (000’s Omitted) |
| Assets: | ||||
| Investments in securities, at market value (cost $4,160,091) | $ | 5,040,225 | ||
| Cash | 126 | |||
| Receivables: | ||||
| Investment securities sold | 21,236 | |||
| Fund shares sold | 927 | |||
| Dividends and interest | 8,098 | |||
| Total assets | 5,070,612 | |||
| Liabilities: | ||||
| Payables: | ||||
| Investment securities purchased | 2,387 | |||
| Fund shares redeemed | 5,233 | |||
| Investment management fees | 521 | |||
| Distribution fees | 29 | |||
| Accrued expenses | 242 | |||
| Total liabilities | 8,412 | |||
| Net assets | $ | 5,062,200 | ||
| Summary of Net Assets: | ||||
| Capital stock and paid-in-capital | $ | 4,358,329 | ||
| Accumulated undistributed net investment income | 50,827 | |||
| Accumulated net realized loss on investments and foreign currency transactions | (227,090 | ) | ||
| Unrealized appreciation of investments | 880,134 | |||
| Net assets | $ | 5,062,200 | ||
| Shares authorized | 4,000,000 | |||
| Par value | $ | 0.001 | ||
Class IA: Net asset value per share | $ | 20.60 | ||
| Shares outstanding | 210,424 | |||
| Net assets | $ | 4,334,917 | ||
Class IB: Net asset value per share | $ | 20.53 | ||
| Shares outstanding | 35,426 | |||
| Net assets | $ | 727,283 | ||
The accompanying notes are an integral part of these financial statements.
| Statement of Operations |
| For the Six-Month Period Ended June 30, 2011 (Unaudited) |
| (000’s Omitted) |
| Investment Income: | ||||
| Dividends | $ | 66,536 | ||
| Interest | 39 | |||
| Less: Foreign tax withheld | (898 | ) | ||
| Total investment income, net | 65,677 | |||
| Expenses: | ||||
| Investment management fees | 16,631 | |||
| Transfer agent fees | 1 | |||
| Distribution fees - Class IB | 940 | |||
| Custodian fees | 3 | |||
| Accounting services fees | 361 | |||
| Board of Directors' fees | 51 | |||
| Audit fees | 35 | |||
| Other expenses | 300 | |||
| Total expenses (before fees paid indirectly) | 18,322 | |||
| Commission recapture | (34 | ) | ||
| Total fees paid indirectly | (34 | ) | ||
| Total expenses, net | 18,288 | |||
| Net investment income | 47,389 | |||
| Net Realized Gain on Investments and Foreign Currency Transactions: | ||||
| Net realized gain on investments | 219,851 | |||
| Net realized loss on foreign currency contracts | (2 | ) | ||
| Net realized gain on other foreign currency transactions | 11 | |||
| Net Realized Gain on Investments and Foreign Currency Transactions | 219,860 | |||
| Net Changes in Unrealized Appreciation of Investments and Foreign Currency Transactions: | ||||
| Net unrealized appreciation of investments | 19,924 | |||
| Net unrealized appreciation on translation of other assets and liabilities in foreign currencies | — | |||
| Net Changes in Unrealized Appreciation of Investments and Foreign Currency Transactions | 19,924 | |||
| Net Gain on Investments and Foreign Currency Transactions | 239,784 | |||
| Net Increase in Net Assets Resulting from Operations | $ | 287,173 | ||
The accompanying notes are an integral part of these financial statements.
| Statement of Changes in Net Assets |
| (000’s Omitted) |
For the Six-Month Period Ended June 30, 2011 (Unaudited) | For the Year Ended December 31, 2010 | |||||||
| Operations: | ||||||||
| Net investment income | $ | 47,389 | $ | 90,685 | ||||
| Net realized gain on investments and foreign currency transactions | 219,860 | 249,163 | ||||||
| Net unrealized appreciation of investments | 19,924 | 273,658 | ||||||
| Net Increase In Net Assets Resulting From Operations | 287,173 | 613,506 | ||||||
| Distributions to Shareholders: | ||||||||
| From net investment income | ||||||||
| Class IA | — | (80,337 | ) | |||||
| Class IB | — | (12,013 | ) | |||||
| Total distributions | — | (92,350 | ) | |||||
| Capital Share Transactions: | ||||||||
| Class IA | ||||||||
| Sold | 106,020 | 305,845 | ||||||
| Issued on reinvestment of distributions | — | 80,337 | ||||||
| Redeemed | (426,993 | ) | (667,069 | ) | ||||
| Total capital share transactions | (320,973 | ) | (280,887 | ) | ||||
| Class IB | ||||||||
| Sold | 45,940 | 64,250 | ||||||
| Issued on reinvestment of distributions | — | 12,013 | ||||||
| Redeemed | (115,728 | ) | (213,527 | ) | ||||
| Total capital share transactions | (69,788 | ) | (137,264 | ) | ||||
| Net decrease from capital share transactions | (390,761 | ) | (418,151 | ) | ||||
| Net Increase (Decrease) In Net Assets | (103,588 | ) | 103,005 | |||||
| Net Assets: | ||||||||
| Beginning of period | 5,165,788 | 5,062,783 | ||||||
| End of period | $ | 5,062,200 | $ | 5,165,788 | ||||
Accumulated undistributed (distribution in excess of) net investment income | $ | 50,827 | $ | 3,438 | ||||
| Shares: | ||||||||
| Class IA | ||||||||
| Sold | 5,182 | 17,167 | ||||||
| Issued on reinvestment of distributions | — | 4,216 | ||||||
| Redeemed | (20,910 | ) | (37,226 | ) | ||||
| Total share activity | (15,728 | ) | (15,843 | ) | ||||
| Class IB | ||||||||
| Sold | 2,250 | 3,574 | ||||||
| Issued on reinvestment of distributions | — | 632 | ||||||
| Redeemed | (5,681 | ) | (11,938 | ) | ||||
| Total share activity | (3,431 | ) | (7,732 | ) | ||||
The accompanying notes are an integral part of these financial statements.
Notes to Financial Statements June 30, 2011 (Unaudited) |
| (000’s Omitted) |
| 1. | Organization: |
Hartford Dividend and Growth HLS Fund (the “Fund”) serves as an underlying investment option for certain variable annuity and variable life insurance separate accounts of Hartford Life Insurance Company (“HLIC”) and its affiliates and certain qualified retirement plans. The Fund may also serve as an underlying investment option for certain variable annuity and variable life separate accounts of other insurance companies. Owners of variable annuity contracts and policyholders of variable life insurance contracts may choose the funds permitted in the variable insurance contract prospectus. In addition, participants in certain qualified retirement plans may choose the Fund if permitted by their plans.
Hartford Series Fund, Inc. (the “Company”) is an open-end registered management investment company comprised of thirty portfolios. Financial Statements for the Fund, a series of the Company, are included in this report.
The Company is organized under the laws of the State of Maryland and is registered with the Securities and Exchange Commission (“SEC”) under the Investment Company Act of 1940, as amended (“1940 Act”). The Fund is a diversified open-end management investment company.
The Fund is divided into Class IA and Class IB shares. Each class is offered at the per share net asset value (“NAV”) without a sales charge and is subject to the same expenses, except that the Class IB shares are subject to distribution and service fees charged pursuant to a Distribution Plan adopted in accordance with Rule 12b-1 under the 1940 Act.
| 2. | Significant Accounting Policies: |
The following is a summary of significant accounting policies of the Fund in the preparation of its financial statements, which are in accordance with the United States Generally Accepted Accounting Principles (“U.S. GAAP”). The preparation of financial statements in accordance with U.S. GAAP may require management to make estimates and assumptions that affect the reported amounts of assets and liabilities and disclosure of contingent assets and liabilities at the date of the financial statements and the reported amounts of increases and decreases in net assets from operations during the reporting period. Actual results could differ from those estimates.
| a) | Determination of Net Asset Value – The NAV of each class of the Fund's shares is determined as of the close of regular trading (normally 4:00 p.m. Eastern Time) (the “NYSE Close”) on each day that the New York Stock Exchange (the “Exchange”) is open (“Valuation Date”). Information that becomes known to the Fund after the NAV has been calculated on a particular day will not generally be used to retroactively adjust the NAV determined earlier that day. |
| b) | Investment Valuation and Fair Value Measurements – For purposes of calculating the NAV, portfolio securities and other assets held by the Fund's portfolio for which market quotes are readily available are valued at market value. Market value is generally determined on the basis of last reported sales prices or official close price. If no sales are reported, market value is based on quotes obtained from a quotation reporting system, established market makers, or independent pricing services. If market prices are not readily available or are deemed unreliable, the Fund will use the fair value of the security as determined in good faith under policies and procedures established by and under the supervision of the Company's Board of Directors. Market quotes are considered not readily available where there is an absence of current or reliable market-based data (e.g., trade information or broker quotes), including where events occur after the close of the relevant market, but prior to the NYSE Close that materially affect the values of the Fund's portfolio securities or assets. In addition, market quotes are considered not readily available when, due to extraordinary circumstances, the exchanges or markets on which the securities trade, do not open for trading for the entire day and no other market prices are available. In addition, prices of foreign equities that are principally traded on certain foreign markets are adjusted daily pursuant to a fair value pricing service approved by the Board of Directors in order to reflect an adjustment for the factors occurring after the close of certain foreign markets but before the NYSE Close. Securities |
that are primarily traded on foreign markets may trade on days that are not business days of the Fund. The value of the foreign securities, in which the Fund invests, may change on days when a shareholder will not be able to purchase or redeem shares of the Fund. Fair value pricing is subjective in nature and the use of fair value pricing by the Fund may cause the NAV of its shares to differ significantly from the NAV that would have been calculated using market prices at the close of the exchange on which a portfolio security is primarily traded. There can be no assurance that the Fund could obtain the fair market value assigned to a security if the Fund were to sell the security at approximately the time at which the Fund determines its NAV.
Investments valued in currencies other than U.S. dollars are converted to U.S. dollars using exchange rates obtained from independent pricing services for calculation of the NAV. As a result, the NAV of the Fund’s shares may be affected by changes in the value of currencies in relation to the U.S. dollar. The value of securities traded in markets outside the United States or denominated in currencies other than the U.S. dollar may be affected significantly on a day that the NYSE is closed and the market value may change on days when an investor is not able to purchase, redeem or exchange shares of the Fund.
Foreign currency contracts represent agreements to exchange currencies on specific future dates at predetermined rates. Foreign currency contracts are valued using foreign currency exchange rates and forward rates as provided by an independent pricing service on Valuation Date.
Financial instruments for which prices are not available from an independent pricing service may be valued using market quotations obtained from one or more dealers that make markets in the respective financial instrument in accordance with procedures established by the Company’s Board of Directors.
U.S. GAAP defines fair value as the price that the Fund would receive to sell an asset or pay to transfer a liability in an orderly transaction between market participants. The U.S. GAAP fair value measurement standards require disclosure of a fair value hierarchy for each major category of assets and liabilities. Various inputs are used in determining the fair value of the Fund’s investments. These inputs are summarized into three broad hierarchy levels. This hierarchy is based on whether the valuation inputs are observable or unobservable. These levels are:
| · | Level 1 – Quoted prices in active markets for identical securities. Level 1 may include exchange-traded instruments such as domestic equities, some foreign equities, options, futures, mutual funds, exchange-traded funds, rights and warrants. |
| · | Level 2 – Observable inputs other than Level 1 prices, such as quoted prices for similar securities; quoted prices in markets that are not active; or other inputs that are observable or can be corroborated by observable market data. Level 2 may include debt securities that are traded less frequently than exchange-traded instruments and which are valued using third party pricing services; foreign equities, whose value is determined using a multi-factor regression model with inputs that are observable in the market; and short-term securities, which are valued at amortized cost. |
| · | Level 3 – Significant unobservable inputs that are supported by limited or no market activity. Level 3 may include financial instruments whose values are determined using broker quotes or require significant management judgment or estimation. These unobservable valuation inputs may include estimates for current yields, maturity/duration, prepayment speed, and broker quotes for comparable securities along with other assumptions relating to credit quality, collateral value, complexity of the security structure, general market conditions and liquidity. This category may include securities where trading has been halted or there are certain restrictions on trading. While these securities are priced using unobservable inputs, the valuation of these securities reflects the best available data and management believes the prices are a reasonable representation of exit price. |
| Hartford Dividend and Growth HLS Fund |
Notes to Financial Statements – (continued) June 30, 2011 (Unaudited) |
| (000’s Omitted) |
Valuation levels are not necessarily indicative of the risk associated with investing in such securities. Individual securities within any of the above mentioned asset classes may be assigned a different hierarchical level than those presented above, as individual circumstances dictate.
During the six-month period ended June 30, 2011, the Fund held no Level 3 securities, therefore no reconciliation of Level 3 securities is presented.
For additional information, refer to the Investment Valuation Hierarchy Level Summary which follows the Schedule of Investments.
For purposes of reporting transfers between different hierarchy levels, both transfers in and out of each level, as applicable, are shown as if they occurred at the beginning of the period.
| c) | Security Transactions and Investment Income – Security transactions are recorded as of the trade date (the date the order to buy or sell is executed) for financial reporting purposes. Securities purchased or sold on a when-issued or delayed-delivery basis may be settled a month or more after the trade date. Realized gains and losses are determined on the basis of identified cost. |
| Dividend income is accrued as of the ex-dividend date, except that certain dividends from foreign securities where the ex-dividend date may have passed are recorded as soon as the Fund is informed of the dividend. Interest income, including amortization of premium and accretion of discounts, is accrued on a daily basis. |
| d) | Foreign Currency Transactions – Assets and liabilities denominated in currencies other than U.S. dollars are translated into U.S. dollars at the exchange rates in effect on the valuation date. Purchases and sales of investment securities, income, and expenses are translated into U.S. dollars at the exchange rates on the dates of such transactions. |
The Fund does not isolate that portion of portfolio security valuation resulting from fluctuations in the foreign currency exchange rates from the fluctuations arising from changes in the market prices of securities held. Exchange rate fluctuations are included with the net realized and unrealized gain or loss on investments in the accompanying financial statements.
Net realized foreign exchange gains or losses arise from sales of foreign currencies and the difference between asset and liability amounts initially stated in foreign currencies and the U.S. dollar value of the amounts actually received or paid. Net unrealized foreign exchange gains or losses arise from changes in the value of other assets and liabilities at the end of the reporting period, resulting from changes in the exchange rates.
| e) | Joint Trading Account – The Fund may invest cash balances into a joint trading account that may be invested in one or more repurchase agreements. |
| f) | Fund Share Valuation and Dividend Distributions to Shareholders – Orders for the Fund’s shares are executed in accordance with the investment instructions of the contract holders and plan participants. The NAV of the Fund’s shares is determined as of the close of business on each business day of the Exchange. The NAV is determined separately for each class of shares of the Fund by dividing the Fund’s net assets attributable to that class by the number of shares of the class outstanding. Each class of shares offered by the Fund has equal rights as to assets and voting privileges (except that shareholders of a class have exclusive voting rights regarding any matter relating solely to that class of shares). Income and non-class specific expenses are allocated daily to each class on the basis of the relative net assets of the class. Realized and unrealized capital gains and losses of each class are allocated daily based on the relative net assets of each class of shares of the Fund. |
Orders for the purchase of the Fund’s shares received prior to the close of the Exchange on any day the Exchange is open for business are priced at the NAV determined as of the close of the Exchange. Orders received after the close of the Exchange, or on a day on which the Exchange and/or the Fund is not open for business, are priced at the next determined NAV.
Dividends are declared pursuant to a policy adopted by the Company’s Board of Directors based upon the investment performance of the Fund. The policy of the Fund is to pay dividends from net investment income and realized capital gains, if any, at least once a year.
Distributions from net investment income, net realized capital gains and capital are determined in accordance with federal income tax regulations, which may differ from U.S. GAAP with respect to character and timing. These differences may include but are not limited to losses deferred due to wash sale adjustments, foreign currency gains and losses, adjustments related to Passive Foreign Investment Companies (“PFICs”), Real Estate Investment Trusts (“REITs”), Regulated Investment Companies (“RICs”), certain derivatives and partnerships. Permanent book and federal income tax basis differences relating to shareholder distributions will result in reclassifications to certain of the Fund’s capital accounts (see Federal Income Taxes: Reclassification of Capital Accounts note).
| 3. | Securities and Other Investments: |
| a) | Repurchase Agreements – A repurchase agreement is an agreement by which a counterparty agrees to sell a security and agrees to repurchase the security sold at a mutually agreed upon time and price. At the time the Fund enters into a repurchase agreement, the value of the underlying collateral security(ies), including accrued interest, will be equal to or exceed the value of the repurchase agreement. Repurchase agreements expose the Fund to counterparty risk. To minimize counterparty risk, the securities that serve to collateralize the repurchase agreement are held by the Fund's custodian in book entry or physical form in the custodial account of the Fund or in a third party custodial account. Repurchase agreements are valued at cost plus accrued interest. The Fund, as shown on the Schedule of Investments, had outstanding repurchase agreements as of June 30, 2011. |
| 4. | Financial Derivative Instruments: |
The following disclosures contain information on how and why the Fund uses derivative instruments, the credit-risk-related contingent features in certain derivative instruments, and how derivative instruments affect the Fund’s financial position, results of operations and cash flows. The location and fair value amounts of these instruments on the Statement of Assets and Liabilities and the realized gains and losses and changes in unrealized gains and losses on the Statement of Operations, each categorized by type of derivative contract, are included in the following Additional Derivative Instrument Information footnote. The derivative instruments outstanding as of period-end are disclosed in the Notes to the Schedule of Investments and the amounts of realized gains and losses and changes in unrealized gains and losses on derivative instruments during the period are disclosed in the Statement of Operations.
| a) | Foreign Currency Contracts – The Fund may enter into foreign currency contracts that obligate the Fund to purchase or sell currencies at specified future dates. Foreign currency contracts are used to hedge the currency exposure associated with some or all of the Fund's securities and/or as part of an investment strategy. Foreign currency contracts are marked to market daily and the change in value is recorded by the Fund as an unrealized gain or loss. Realized gains or losses equal to the difference between the value of the contract at the time it was opened and the value at the time it was closed are recorded upon delivery or receipt of the currency. |
Foreign currency contracts involve elements of market risk in excess of the amounts reflected in the Statement of Assets and Liabilities. In addition, risks may arise upon entering into these contracts from the potential inability of the
| Hartford Dividend and Growth HLS Fund |
Notes to Financial Statements – (continued) June 30, 2011 (Unaudited) |
| (000’s Omitted) |
counterparties to meet the terms of the contracts and from unanticipated movements in the value of the foreign currencies relative to the U.S. dollar. The Fund had no outstanding foreign currency contracts as of June 30, 2011.
| b) | Additional Derivative Instrument Information: |
The volume of derivative activity was minimal during the six-month period ended June 30, 2011.
The Effect of Derivative Instruments on the Statement of Operations for the six-month period ended June 30, 2011:
| Risk Exposure Category | ||||||||||||||||||||||||||||
| Foreign | ||||||||||||||||||||||||||||
| Interest Rate | Exchange | Credit | Equity | Commodity | Other | |||||||||||||||||||||||
| Contracts | Contracts | Contracts | Contracts | Contracts | Contracts | Total | ||||||||||||||||||||||
| Realized Gain (Loss) on Derivatives Recognized as a Result from Operations: | ||||||||||||||||||||||||||||
Net realized loss on foreign currency contracts | $ | — | $ | (2 | ) | $ | — | $ | — | $ | — | $ | — | $ | (2 | ) | ||||||||||||
| Total | $ | — | $ | (2 | ) | $ | — | $ | — | $ | — | $ | — | $ | (2 | ) | ||||||||||||
| 5. | Principal Risks: |
| a) | Counterparty Risk – The Fund may be exposed to counterparty risk, or the risk that an institution or other entity with which the Fund has unsettled or open transactions will default. |
| b) | Market Risks – If a Fund invests directly in foreign currencies or in securities that trade in, and receive revenues in, foreign currencies, or in derivatives that provide exposure to foreign currencies, it will be subject to the risk that those currencies will decline in value relative to the base currency of the Fund, or, in the case of hedging positions, that the Fund’s base currency will decline in value relative to the currency being hedged. Currency rates in foreign countries may fluctuate significantly over short periods of time for a number of reasons, including changes in interest rates, intervention (or the failure to intervene) by U.S. or foreign governments, central banks or supranational entities such as the International Monetary Fund, or by the imposition of currency controls or other political developments in the United States or abroad. As a result, the Fund’s investments in foreign currency denominated securities may reduce the returns of the Fund. The market values of equity securities, such as common stocks and preferred stocks or equity related investments such as futures and options, may decline due to general market conditions which are not specifically related to a particular company, such as real or perceived adverse economic conditions, changes in the general outlook for corporate earnings, changes in interest or currency rates or adverse investor sentiment generally. The market value of equity securities may also decline due to factors which affect a particular industry or industries, such as labor shortages or increased production costs and competitive conditions within an industry. Equity securities and equity related investments generally have greater market price volatility than fixed income securities. |
| 6. | Federal Income Taxes: |
| a) | Federal Income Taxes – For federal income tax purposes, the Fund intends to continue to qualify as a RIC under Subchapter M of the Internal Revenue Code (“IRC”) by distributing substantially all of its taxable net investment income and net realized capital gains to its shareholders and otherwise complying with the requirements of RICs. The Fund has distributed substantially all of its income and capital gains in prior years, if applicable, and intends to distribute substantially all of its income and capital gains prior to the next fiscal year-end. Accordingly, no provision for federal income or excise taxes has been made in the accompanying financial statements. Distributions from short-term capital gains are treated as ordinary income distributions for federal income tax purposes. |
| b) | Net Investment Income (Loss), Net Realized Gains (Losses) – Net investment income (loss) and net realized gains (losses) may differ for financial statement and tax purposes primarily because of losses deferred due to wash sale adjustments, foreign currency gains and losses, adjustments related to PFICs, REITs, RICs, certain derivatives and partnerships. The character of distributions made during the year from net investment income or net realized gains may differ from their ultimate characterization for federal income tax purposes. Also, due to the timing of dividend distributions, the fiscal year in which amounts are distributed may differ from the year that the income or realized gains (losses) were recorded by the Fund. |
| c) | Distributions and Components of Distributable Earnings – The tax character of distributions paid by the Fund for the periods indicated is as follows (as adjusted for dividends payable): |
| For the Year Ended | For the Year Ended | |||||||
| December 31, 2010 | December 31, 2009 | |||||||
| Ordinary Income | $ | 92,350 | $ | 98,911 | ||||
As of December 31, 2010, the Fund’s components of distributable earnings (deficit) on a tax basis were as follows:
| Amount | ||||
| Undistributed Ordinary Income | $ | 3,438 | ||
| Accumulated Capital and Other Losses* | (435,225 | ) | ||
Unrealized Appreciation† | 848,485 | |||
| Total Accumulated Earnings | $ | 416,698 | ||
| * | The Fund has capital loss carryforwards that are identified in the Capital Loss Carryforward note that follows. |
| † | The difference between book-basis and tax-basis unrealized appreciation (depreciation) may be attributable to the losses deferred due to wash sale adjustments, foreign currency gains and losses, adjustments related to PFICs, REITs, RICs, certain derivatives and partnerships. |
| d) | Reclassification of Capital Accounts – The Fund may record reclassifications in its capital accounts. These reclassifications have no impact on the total net assets of the Fund. The reclassifications are a result of permanent differences between U.S. GAAP and tax accounting for such items as expiration or utilization of capital loss carryforwards or net operating losses. Adjustments are made to reflect the impact these items have on current and future distributions to shareholders. Therefore, the source of the Fund’s distributable income may be shown in the accompanying Statement of Assets and Liabilities as from accumulated undistributed net investment income, from accumulated net realized gains on investments or from capital depending on the type of book and tax differences that exist. For the year ended December 31, 2010, the Fund recorded reclassifications to increase (decrease) the accounts listed below: |
| Amount | ||||
| Accumulated Undistributed Net Investment Income | $ | (100 | ) | |
| Accumulated Net Realized Gain (Loss) on Investments and Foreign Currency Transactions | 100 | |||
| Hartford Dividend and Growth HLS Fund |
Notes to Financial Statements – (continued) June 30, 2011 (Unaudited) |
| (000’s Omitted) |
| e) | Capital Loss Carryforward – At December 31, 2010 (tax-year-end), the Fund had capital loss carryforwards for U.S. federal income tax purposes of approximately: |
| Year of Expiration | Amount | |||
| 2017 | $ | 435,225 | ||
| Total | $ | 435,225 | ||
As of December 31, 2010, the Fund utilized $243,887 of prior year capital loss carryforwards.
| f) | Accounting for Uncertainty in Income Taxes – The Fund has adopted financial reporting rules that require the Fund to analyze all open tax years, as defined by the Statute of Limitations, for all major jurisdictions. Generally, tax authorities can examine all tax returns filed for the last three years. The Fund does not have an examination in progress. |
The Fund has reviewed all open tax years and major jurisdictions and concluded that these financial reporting rules had no effect on the Fund’s financial position or results of operations. There is no tax liability resulting from unrecognized tax benefits relating to uncertain income tax positions taken or expected to be taken on the tax return for the fiscal year-end December 31, 2010. The Fund is also not aware of any tax positions for which it is reasonably possible that the total amounts of unrecognized tax benefits will significantly change in the next twelve months.
| 7. | Expenses: |
| a) | Investment Management Agreements – HL Investment Advisors, LLC (“HL Advisors”), an indirect wholly owned subsidiary of The Hartford Financial Services Group, Inc. (“The Hartford”), serves as investment manager to the Fund pursuant to an Investment Management Agreement with the Company. As investment manager, HL Advisors has overall investment supervisory responsibility for the Fund. In addition, HL Advisors provides administrative personnel, services, equipment, facilities and office space for proper operation of the Fund. HL Advisors has contracted with Wellington Management Company, LLP (“Wellington Management”) under a sub-advisory agreement for the provision of day-to-day investment management services to the Fund in accordance with the Fund’s investment objective and policies. The Fund pays a fee to HL Advisors, a portion of which may be used to compensate Wellington Management. |
The schedule below reflects the rates of compensation paid to HL Advisors for investment management services rendered as of June 30, 2011; the rates are accrued daily and paid monthly.
| Average Daily Net Assets | Annual Fee | |||
| On first $250 million | 0.7750 | % | ||
| On next $250 million | 0.7250 | % | ||
| On next $500 million | 0.6750 | % | ||
| On next $4 billion | 0.6250 | % | ||
| On next $5 billion | 0.6225 | % | ||
| Over $10 billion | 0.6200 | % | ||
| b) | Accounting Services Agreement – Pursuant to the Fund Accounting Agreement between HLIC and the Company, on behalf of the Fund, HLIC provides accounting services to the Fund and receives monthly compensation based on the Fund’s average net assets at the rates set forth below. The Fund’s accounting services fees are accrued daily and paid monthly. |
| Average Daily Net Assets | Annual Fee | |||
| On first $5 billion | 0.014 | % | ||
| On next $5 billion | 0.012 | % | ||
| Over $10 billion | 0.010 | % | ||
| c) | Operating Expenses – Allocable expenses incurred by the Company are allocated to each Fund and allocated to classes within a Fund in proportion to the average daily net assets of the Fund and each class, except where allocation of certain expenses is more fairly made directly to the Fund or to specific classes within a Fund. |
| d) | Fees Paid Indirectly – The Company, on behalf of the Fund, has entered into agreements with State Street Global Markets, LLC and Russell Implementation Services, Inc. to partially recapture non-discounted trade commissions. Such rebates are used to pay a portion of the Fund’s expenses. In addition, the Fund’s custodian bank has also agreed to reduce its fees when the Fund maintains cash on deposit in a non-interest-bearing custody account. For the six-month period ended June 30, 2011, these amounts are included in the Statement of Operations. |
The ratio of expenses to average net assets in the accompanying financial highlights excludes the reduction in expenses related to fees paid indirectly. The annualized expense ratio for the period listed below including the fees paid indirectly is as follows:
| Annualized Six- | ||||
| Month Period | ||||
| Ended June 30, | ||||
| 2011 | ||||
| Class IA | 0.67 | % | ||
| Class IB | 0.92 | |||
| e) | Distribution Plan for Class IB shares – The Company, on behalf of the Fund, has adopted a Distribution Plan pursuant to Rule 12b-1 of the 1940 Act to compensate the Distributor, Hartford Securities Distribution Company, Inc. (a wholly owned, ultimate subsidiary of The Hartford), from assets attributable to the Class IB shares for services rendered and expenses borne in connection with activities primarily intended to result in the sale of the Class IB shares, subject to the review and approval of the Company’s Board of Directors. |
The Distribution Plan provides that the Fund may pay annually up to 0.25% of the average daily net assets of the Fund attributable to its Class IB shares for activities primarily intended to result in the sale of Class IB shares. The Board has the authority to suspend or reduce these payments at any point in time. Under the terms of the Distribution Plan and the principal underwriting agreement, the Fund is authorized to make payments monthly to the Distributor that may be used to pay or compensate entities providing distribution and shareholder servicing with respect to the Class IB shares for such entities’ fees or expenses incurred or paid in that regard. These fees are accrued daily and paid monthly.
| f) | Other Related Party Transactions – Certain officers of the Fund are directors and/or officers of HL Advisors and/or The Hartford or its subsidiaries. For the six-month period ended June 30, 2011, a portion of the Fund’s chief compliance officer’s salary was paid by all the investment companies in the Hartford fund complex. The portion allocated to the Fund was in the amount of $4. Hartford Administrative Services Company (“HASCO”), an indirect wholly owned subsidiary of The Hartford, provides transfer agent services to the Fund. The amount paid to HASCO can be found in the Statement of Operations. These fees are accrued daily and paid monthly. |
| g) | Payments from Affiliates – In July of 2007, The Hartford entered into a settlement with the Attorneys General of the states of New York, Connecticut and Illinois relating to market timing and the company's individual variable annuity contracts in which certain payments would be made directly to the variable annuity contract holders. The distribution plan provided that unclaimed money from the settlement would be distributed to certain HLS Funds that are investment options through a Hartford individual variable annuity contract. The unclaimed money was distributed to the Fund on September 18, 2009, as follows: |
| Amount | ||||
| Reimbursement | $ | 106 | ||
| Hartford Dividend and Growth HLS Fund |
| Notes to Financial Statements – (continued) June 30, 2011 (Unaudited) |
| (000’s Omitted) |
On November 8, 2006, the SEC issued an order setting forth the terms of a settlement reached with three subsidiaries of The Hartford that resolved the SEC’s Division of Enforcement’s investigation of aspects of The Hartford’s variable annuity and mutual fund operations related to directed brokerage and revenue sharing. The Hartford settled this matter without admitting or denying the findings of the SEC.
The Fund is available for purchase by the separate accounts of different variable universal life policies, variable annuity products, and funding agreements and it is offered directly to certain qualified retirement plans (collectively “Products”). Although existing Products contain transfer restrictions, some Products, particularly older variable annuity products, do not contain restrictions on the frequency of transfers. In addition, as the result of the settlement of litigation against Hartford Life, Inc. (“Hartford Life”) (the issuers of such variable annuity products), the Fund’s ability to restrict transfers by certain owners of older variable annuity products was limited. During 2006, these annuity owners surrendered the older variable annuity contracts that were the subject of prior litigation.
The total return in the accompanying financial highlights includes payments from affiliates. Had the payments from the affiliates been excluded, the impact and total return for the periods listed below would have been as follows:
| For the Year Ended December 31, 2009 | ||||||||
| Class IA | Class IB | |||||||
| Impact from Payment from Affiliate for Attorneys General Settlement | — | % | — | % | ||||
| Total Return Excluding Payment from Affiliate | 24.67 | 24.36 | ||||||
| For the Year Ended December 31, 2006 | ||||||||
| Class IA | Class IB | |||||||
| Impact from Payment from Affiliate for SEC Settlement | 0.06 | % | 0.06 | % | ||||
| Impact from Payment from Affiliate for Unrestricted Transfers | 0.01 | 0.01 | ||||||
| Total Return Excluding Payments from Affiliates | 20.29 | 19.99 | ||||||
| 8. | Investment Transactions: |
For the six-month period ended June 30, 2011, the Fund's aggregate purchases and sales of investment securities (excluding short-term investments) were as follows:
| Amount | ||||
| Cost of Purchases Excluding U.S. Government Obligations | $ | 619,807 | ||
| Sales Proceeds Excluding U.S. Government Obligations | 951,192 | |||
| 9. | Line of Credit: |
The Fund is one of several Hartford funds that participate in a $500 million committed revolving line of credit facility. The facility is to be used for temporary or emergency purposes. Under the arrangement, a fund is required to own securities having a market value in excess of 300% of the total bank borrowings. The interest rate on borrowings varies depending on the nature of the loan. The facility also requires a fee to be paid based on the amount of the commitment. This commitment fee is allocated to all the funds participating in the line of credit based on the average net assets of the funds. During the six-month period ended June 30, 2011, the Fund did not have any borrowings under this facility.
| 10. | Industry Classifications: |
Other than the industry classifications “Other Investment Pools and Funds” and “Exchange Traded Funds,” equity industry classifications used in this report are the Global Industry Classification Standard, which was developed by and is the exclusive property and service mark of MSCI, Inc. and Standard & Poor’s.
| 11. | Indemnifications: |
Under the Company’s organizational documents, the Company shall indemnify its officers and directors to the full extent required or permitted under Maryland General Corporation Law and the federal securities laws. In addition, the Company, on behalf of the Fund, may enter into contracts that contain a variety of indemnifications. The Company’s maximum exposure under these arrangements is unknown. However, as of the date of these financial statements the Company has not had prior claims or losses pursuant to these contracts and expects the risk of loss to be remote.
| Financial Highlights |
| - Selected Per-Share Data (A) - |
| Class | Net Asset Value at Beginning of Period | Net Investment Income (Loss) | Payments from (to) Affiliate | Net Realized and Unrealized Gain (Loss) on Investments | Total from Investment Operations | Dividends from Net Investment Income | Distributions from Realized Capital Gains | Distributions from Capital | Total Distributions | Net Increase (Decrease) in Net Asset Value | Net Asset Value at End of Period | |||||||||||||||||||||||||||||||||
| For the Six-Month Period Ended June 30, 2011 (Unaudited) | ||||||||||||||||||||||||||||||||||||||||||||
| IA | $ | 19.50 | $ | 0.20 | $ | – | $ | 0.90 | $ | 1.10 | $ | – | $ | – | $ | – | $ | – | $ | 1.10 | $ | 20.60 | ||||||||||||||||||||||
| IB | 19.46 | 0.17 | – | 0.90 | 1.07 | – | – | – | – | 1.07 | 20.53 | |||||||||||||||||||||||||||||||||
| For the Year Ended December 31, 2010 | ||||||||||||||||||||||||||||||||||||||||||||
| IA | 17.55 | 0.35 | – | 1.96 | 2.31 | (0.36 | ) | – | – | (0.36 | ) | 1.95 | 19.50 | |||||||||||||||||||||||||||||||
| IB | 17.51 | 0.32 | – | 1.94 | 2.26 | (0.31 | ) | – | – | (0.31 | ) | 1.95 | 19.46 | |||||||||||||||||||||||||||||||
| For the Year Ended December 31, 2009 | ||||||||||||||||||||||||||||||||||||||||||||
| IA | 14.37 | 0.35 | – | 3.19 | 3.54 | (0.36 | ) | – | – | (0.36 | ) | 3.18 | 17.55 | |||||||||||||||||||||||||||||||
| IB | 14.34 | 0.33 | – | 3.16 | 3.49 | (0.32 | ) | – | – | (0.32 | ) | 3.17 | 17.51 | |||||||||||||||||||||||||||||||
| For the Year Ended December 31, 2008 | ||||||||||||||||||||||||||||||||||||||||||||
| IA | 22.35 | 0.44 | – | (7.57 | ) | (7.13 | ) | (0.44 | ) | (0.41 | ) | – | (0.85 | ) | (7.98 | ) | 14.37 | |||||||||||||||||||||||||||
| IB | 22.28 | 0.42 | – | (7.56 | ) | (7.14 | ) | (0.39 | ) | (0.41 | ) | – | (0.80 | ) | (7.94 | ) | 14.34 | |||||||||||||||||||||||||||
| For the Year Ended December 31, 2007 | ||||||||||||||||||||||||||||||||||||||||||||
| IA | 22.79 | 0.42 | – | 1.44 | 1.86 | (0.41 | ) | (1.89 | ) | – | (2.30 | ) | (0.44 | ) | 22.35 | |||||||||||||||||||||||||||||
| IB | 22.72 | 0.37 | – | 1.42 | 1.79 | (0.34 | ) | (1.89 | ) | – | (2.23 | ) | (0.44 | ) | 22.28 | |||||||||||||||||||||||||||||
| For the Year Ended December 31, 2006 | ||||||||||||||||||||||||||||||||||||||||||||
| IA | 20.74 | 0.40 | 0.01 | 3.77 | 4.18 | (0.41 | ) | (1.72 | ) | – | (2.13 | ) | 2.05 | 22.79 | ||||||||||||||||||||||||||||||
| IB | 20.68 | 0.35 | 0.01 | 3.74 | 4.10 | (0.34 | ) | (1.72 | ) | – | (2.06 | ) | 2.04 | 22.72 | ||||||||||||||||||||||||||||||
| (A) | Information presented relates to a share outstanding throughout the indicated period. |
| (B) | The figures do not include sales charges or other fees which may be applied at the variable life insurance, variable annuity or qualified retirement plan product level. Any such additional sales charges or other fees would lower the Fund's performance. |
| (C) | Ratios do not reflect reductions for fees paid indirectly. Please see Fees Paid Indirectly in the Notes to Financial Statements. |
| (D) | Portfolio turnover rate is calculated on the basis of the Fund as a whole without distinguishing between the classes of shares issued. |
| (E) | Not annualized. |
| (F) | Annualized. |
| (G) | Total return without the inclusion of the Payment from (to) Affiliate can be found in Expenses in the accompanying Notes to Financial Statements. |
| - Ratios and Supplemental Data - |
| Ratio of Expenses to Average Net | Ratio of Expenses to Average Net | Ratio of Net Investment Income to | Portfolio Turnover | |||||||||||||||||||
| Total Return(B) | Net Assets at End of Period | Assets Before Waivers(C) | Assets After Waivers(C) | Average Net Assets | Rate(D) | |||||||||||||||||
| 5.65 | %(E) | $ | 4,334,917 | 0.67 | %(F) | 0.67 | %(F) | 1.86 | %(F) | 12 | % | |||||||||||
| 5.52 | (E) | 727,283 | 0.92 | (F) | 0.92 | (F) | 1.61 | (F) | – | |||||||||||||
| 13.21 | 4,409,787 | 0.68 | 0.68 | 1.87 | 32 | |||||||||||||||||
| 12.93 | 756,001 | 0.93 | 0.93 | 1.62 | – | |||||||||||||||||
| 24.68 | (G) | 4,247,031 | 0.69 | 0.69 | 2.24 | 34 | ||||||||||||||||
| 24.36 | (G) | 815,752 | 0.94 | 0.94 | 2.00 | – | ||||||||||||||||
| (32.43 | ) | 3,628,793 | 0.67 | 0.67 | 2.20 | 41 | ||||||||||||||||
| (32.60 | ) | 776,959 | 0.92 | 0.92 | 1.95 | – | ||||||||||||||||
| 8.26 | 5,842,788 | 0.67 | 0.67 | 1.70 | 27 | |||||||||||||||||
| 7.98 | 1,501,363 | 0.92 | 0.92 | 1.45 | – | |||||||||||||||||
| 20.36 | (G) | 5,671,552 | 0.67 | 0.67 | 1.77 | 27 | ||||||||||||||||
| 20.06 | (G) | 1,603,952 | 0.92 | 0.92 | 1.52 | – | ||||||||||||||||
| Directors and Officers (Unaudited) |
The Board of Directors of the Company appoints officers who are responsible for the day-to-day operations of the Fund and who execute policies formulated by the Directors. Each director serves until his or her death, resignation, or retirement or until the next annual meeting of shareholders is held or until his or her successor is elected and qualifies.
Directors and officers who are employed by or who have a financial interest in The Hartford are considered “interested” persons of the Fund pursuant to the 1940 Act. Each officer and two of the Company’s directors, as noted in the chart below, are “interested” persons of the Fund. Each director serves as a director for The Hartford Mutual Funds, Inc., The Hartford Mutual Funds II, Inc., Hartford Series Fund, Inc., and Hartford HLS Series Fund II, Inc., which, as of June 30, 2011, collectively consist of 89 funds. Correspondence may be sent to directors and officers c/o Hartford Mutual Funds, P.O. Box 2999, Hartford, Connecticut 06104-2999, except that correspondence to Ms. Fagely may be sent to 500 Bielenberg Drive, Woodbury, Minnesota 55125.
The table below sets forth, for each director and officer, his or her name, year of birth, current position with the Company and date first elected or appointed to Hartford Series Fund, Inc. (“HSF”), and Hartford HLS Series Fund II, Inc. (“HSF2”), principal occupation, and, for directors, other directorships held. The Fund’s statement of additional information contains further information on the directors and is available free of charge by calling 1-800-862-6668 or writing to Hartford HLS Funds, c/o Individual Annuity Services, P.O. Box 5085, Hartford, CT 06102-5085.
Information on the aggregate remuneration paid to the directors of the Company can be found in the Statement of Operations herein. The Fund pays to The Hartford a portion of the chief compliance officer’s compensation, but does not pay salaries or compensation to any of their other officers or directors who are employed by The Hartford.
Non-Interested Directors
Lynn S. Birdsong (1946) Director since 2003, Co-Chairman of the Investment Committee
Mr. Birdsong is a private investor. Mr. Birdsong currently serves as a Director of the Sovereign High Yield Investment Company (April 2010 to current). Mr. Birdsong currently serves as an Independent Director of Nomura Partners Funds, Inc. (formerly, The Japan Fund) (March 2003 to current). From 2003 to March 2005, Mr. Birdsong was an independent director of the Atlantic Whitehall Funds. From 1979 to 2002, Mr. Birdsong was a managing director of Zurich Scudder Investments, an investment management firm. During his employment with Scudder, Mr. Birdsong was an Interested Director of The Japan Fund. Since 1981, Mr. Birdsong has been a partner in Birdsong Company, an advertising specialty firm.
Robert M. Gavin, Jr. (1940) Director since 2002 (HSF) and 1986 (HSF2), Chairman of the Board since 2004
Dr. Gavin is an educational consultant. Prior to September 1, 2001, he was President of Cranbrook Education Community and prior to July 1996, he was President of Macalester College, St. Paul, Minnesota.
Duane E. Hill (1945) Director since 2001 (HSF) and 2002 (HSF2), Chairman of the Nominating Committee
Mr. Hill is Partner of TSG Ventures L.P., a private equity investment company. Mr. Hill is a former partner of TSG Capital Group, a private equity investment firm that served as sponsor and lead investor in leveraged buyouts of middle market companies.
Sandra S. Jaffee (1941) Director since 2005
Ms. Jaffee served as Chairman (2008 to 2009) and Chief Executive Officer of Fortent (formerly Searchspace Group), a leading provider of compliance/regulatory technology to financial institutions from August 2005 to August 2009. From August 2004 to August 2005, Ms. Jaffee served as an Entrepreneur in Residence with Warburg Pincus, a private equity firm. From September 1995 to July 2004, Ms. Jaffee served as Executive Vice President at Citigroup, where she was President and Chief Executive Officer of Citibank’s Global Securities Services (1995 to 2003). Ms. Jaffe currently serves as a member of the Board of Directors of Broadridge Financial Solutions as well as a Trustee of Muhlenberg College.
William P. Johnston (1944) Director since 2005, Chairman of the Compliance Committee
In June 2006, Mr. Johnston was appointed as Senior Advisor to The Carlyle Group, a global private equity investment firm. In July 2006, Mr. Johnston was elected to the Board of Directors of MultiPlan, Inc. In August 2007, Mr. Johnston was elected to the Board of Directors of LifeCare Holdings, Inc. In February 2008, Mr. Johnston was elected to the Board of Directors of HCR-ManorCare, Inc. In May 2006, Mr. Johnston was elected to the Supervisory Board of Fresenius Medical Care AG & Co. KGaA, after its acquisition of Renal Care Group, Inc. in March 2006. Mr. Johnston joined Renal Care Group in November 2002 as a member of the Board of Directors and served as Chairman of the Board from March 2003 through March 2006. From September 1987 to December 2002, Mr. Johnston was with Equitable Securities Corporation (and its successors, SunTrust Equitable Securities and SunTrust Robinson Humphrey) serving in various investment banking and managerial positions, including Managing Director and Head of Investment Banking, Chief Executive Officer and Vice Chairman.
Phillip O. Peterson (1944) Director since 2002 (HSF) and 2000 (HSF2), Chairman of the Audit Committee
Mr. Peterson is a mutual fund industry consultant. He was a partner of KPMG LLP (an accounting firm) until July 1999. Mr. Peterson joined William Blair Funds in February 2007 as a member of the Board of Trustees. From January 2004 to April 2005, Mr. Peterson served as Independent President of the Strong Mutual Funds.
Lemma W. Senbet (1946) Director since 2005
Dr. Senbet is the William E. Mayer Chair Professor of Finance and Director, Center for Financial Policy, at the University of Maryland, Robert H. Smith School of Business. He was chair of the Finance Department from 1998 to 2006. Previously he was a chaired professor of finance at the University of Wisconsin-Madison. Also, he was director of the Fortis Funds from March 2000 to July 2002. Dr. Senbet served the finance profession in various capacities, including as director of the American Finance Association and President of the Western Finance Association. In 2006, Dr. Senbet was inducted Fellow of Financial Management Association International for his career-long distinguished scholarship and professional service.
Interested Directors and Officers
David N. Levenson (1966) Director since 2010
Mr. Levenson currently serves as President of The Hartford’s Wealth Management business. He was appointed to this role in July 2010. Previously, Mr. Levenson served as Executive Vice President of Legacy Holdings for The Hartford from June 2009 to July 2010. From 2006 to 2009, Mr. Levenson was with Hartford Life Insurance K.K. where he served as President and CEO from 2007 to 2009. He served as Managing Director of Hartford Investment Management Company from 2005 to 2006. Additionally, Mr. Levenson serves as Executive Vice President of The Hartford and as President, Director and Chief Executive Officer of Hartford Life Insurance Company (“HLIC”) and Hartford Life, Inc. (“HL Inc.”).
Lowndes A. Smith (1939) Director since 1996 (HSF) and 2002 (HSF2), Co-Chairman of the Investment Committee
Mr. Smith served as Vice Chairman of The Hartford from February 1997 to January 2002, as President and Chief Executive Officer of HL Inc. from February 1997 to January 2002, and as President and Chief Operating Officer of The Hartford Life Insurance Companies from January 1989 to January 2002. Mr. Smith serves as a Director of White Mountains Insurance Group, Ltd., One Beacon Insurance and Symetra Financial and as a Managing Director of Whittington Gray Associates.
Other Officers
James E. Davey (1964) President and Chief Executive Officer since 2010
Mr. Davey serves as Executive Vice President of HLIC. Additionally, Mr. Davey serves as President, Chief Executive Officer and Manager of Hartford Investment Financial Services, Inc. (“HIFSCO”) and President, Chief Executive Officer and Manager of HL Advisors. Mr. Davey joined The Hartford in 2002.
Tamara L. Fagely (1958) Vice President, Treasurer and Controller since 2002 (HSF) and 1993 (HSF2)
Ms. Fagely has been a Vice President of HASCO since 1998 and Chief Financial Officer since 2006. Currently Ms. Fagely is a Vice President of HLIC. She served as Assistant Vice President of HLIC from December 2001 through March 2005. In addition, Ms. Fagely is Controller and Chief Financial Officer of HIFSCO.
Susan M. Fleege (1959) AML Compliance Officer since 2011
Ms. Fleege currently serves as a Director of Risk Management at The Hartford. She previously served as AML Compliance Officer for the Fund from 2005-2008. Ms. Fleege joined HLIC in 2005 from Amerprise Financial Corporation where she held the position of Counsel from 2000 to 2005. Ms. Fleege is a certified Anti-Money Laundering Specialist.
Dr. Robert J. Froehlich (1953) Senior Managing Director since 2009
Dr. Froehlich joined The Hartford as Senior Managing Director in September 2009. Prior to joining The Hartford, Dr. Froehlich served as Vice Chairman of Deutsche Asset Management from 1997-2009.
Edward P. Macdonald (1967) Vice President, Secretary and Chief Legal Officer since 2005
Mr. Macdonald serves as Vice President of HLIC and Chief Legal Officer of Mutual Funds and Vice President of HIFSCO. He also serves as Vice President and Secretary of HASCO, and Chief Legal Officer, Secretary and Vice President of HL Advisors. Mr. Macdonald joined The Hartford in 2005.
| Hartford Dividend and Growth HLS Fund |
| Directors and Officers (Unaudited) – (continued) |
Vernon J. Meyer (1964) Vice President since 2006
Mr. Meyer serves as Senior Vice President of HLIC. He also serves as Senior Vice President of HIFSCO and HL Advisors. Mr. Meyer joined The Hartford in 2004.
Colleen B. Pernerewski (1969) Vice President and Chief Compliance Officer since 2010
Ms. Pernerewski serves as Vice President and Chief Investment Advisor Compliance Officer of HIFSCO and as Vice President and Chief Compliance Officer of HL Advisors. Ms. Pernerewski joined The Hartford in 2005 from Travelers Life and Annuity where she served as Counsel (2004-2005). Prior to Travelers Life and Annuity, Ms. Pernerewski held the position of Counsel at The Hartford (1998-2004).
Elizabeth L. Schroeder (1966) Vice President since 2010
Ms. Schroeder currently serves as Assistant Vice President of HLIC. Ms. Schroeder joined HLIC in 1991. She is also an Assistant Vice President of HIFSCO and HL Advisers.
Martin Swanson (1962) Vice President since 2010
Mr. Swanson is a Vice President of HLIC. Mr. Swanson also serves as Vice President/Marketing for HIFSCO. Prior to joining HLIC in 1998, Mr. Swanson was a Vice President at PaineWebber, Inc.
Jane Wolak (1961) Vice President since 2009
Ms. Wolak currently serves as Senior Vice President of HLIC. Ms. Wolak joined HLIC as Vice President, Retail Product Services in May 2007. She is also Vice President of HASCO. Previously, Ms. Wolak was with Sun Life Financial where she held the position of Vice President, Service Center Operations from 2001-2007.
A description of the policies and procedures that the Fund uses to determine how to vote proxies relating to portfolio securities and a record of how the Fund voted any proxies for the twelve-month period ended June 30, 2011 are available (1) without charge, upon request, by calling 888-843-7824 and (2) on the SEC’s website at http://www.sec.gov.
The Fund files a complete schedule of portfolio holdings with the SEC for the first and third quarters of each fiscal year on Form N-Q. The Fund’s Forms are available (1) without charge, upon request, by calling 888-843-7824 and (2) on the SEC’s website at http://www.sec.gov. The Form N-Q may be reviewed and copied at the SEC’s Public Reference Room in Washington, DC. Information on the operation of the Public Reference Room may be obtained by calling 1-800-SEC-0330.
| Expense Example (Unaudited) |
Your Fund's Expenses
As a shareholder of the Fund, you incur two types of costs: (1) transaction costs and (2) ongoing costs including investment management fees, distribution fees, and other fund expenses. This example is intended to help you understand your ongoing costs (in dollars) of investing in a Fund and to compare these costs with the ongoing costs of investing in other mutual funds. The example is based on an investment of $1,000 invested at the beginning of the period and held for the period of December 31, 2010 through June 30, 2011.
Actual Expenses
The first set of columns of the table below provides information about actual account values and actual expenses. You may use the information in this column, together with the amount you invested, to estimate the expenses that you paid over the period. Simply divide your account value by $1,000 (for example, an $8,600 account value divided by $1,000 = 8.6), then multiply the result by the number in the line under the heading entitled “Expenses Paid During Period” to estimate the expenses you paid on your account during this period.
Hypothetical Example for Comparison Purposes
The second set of columns of the table below provides information about hypothetical account values and hypothetical expenses based on a Fund's actual expense ratio and an assumed rate of return of 5% per year before expenses, which is not the Fund's actual return. The hypothetical account values and expenses may not be used to estimate the actual ending account balance or expenses you paid for the period. You may use this information to compare the ongoing costs of investing in a Fund and other funds. To do so, compare this 5% hypothetical example with the 5% hypothetical examples that appear in the shareholder reports of the other funds.
Please note that the expenses shown in the table are meant to highlight your ongoing costs only and do not reflect any transactional costs, such as sales charges (loads) and CDSC. Therefore, the second set of columns of the table is useful in comparing ongoing costs only, and will not help you determine the relative total costs of owning different funds. In addition, if these transactional costs were included, your costs would be higher. Expenses are equal to the Fund's annualized expense ratios multiplied by average account value over the period, multiplied by 181/365 (to reflect the one-half year period).
| Actual return | Hypothetical (5% return before expenses) | |||||||||||||||||||||||||||||||||||
| Expenses paid | Expenses paid | Days in | ||||||||||||||||||||||||||||||||||
| during the period | during the period | the | Days | |||||||||||||||||||||||||||||||||
| Beginning | Ending | December 31, 2010 | Beginning | Ending | December 31, 2010 | Annualized | current | in the | ||||||||||||||||||||||||||||
| Account Value | Account Value | through | Account Value | Account Value | through | expense | 1/2 | full | ||||||||||||||||||||||||||||
| December 31, 2010 | June 30, 2011 | June 30, 2011 | December 31, 2010 | June 30, 2011 | June 30, 2011 | ratio | year | year | ||||||||||||||||||||||||||||
| Class IA | $ | 1,000.00 | $ | 1,056.49 | $ | 3.42 | $ | 1,000.00 | $ | 1,021.47 | $ | 3.36 | 0.67 | % | 181 | 365 | ||||||||||||||||||||
| Class IB | $ | 1,000.00 | $ | 1,055.18 | $ | 4.69 | $ | 1,000.00 | $ | 1,020.23 | $ | 4.61 | 0.92 | % | 181 | 365 | ||||||||||||||||||||
27
The Hartford |
P.O. Box 5085 |
Hartford, CT 06102-5085 |
Hartford Series Fund, Inc. is underwritten and distributed by Hartford Securities Distribution Company, Inc.
“The Hartford” is The Hartford Financial Services Group, Inc. and its subsidiaries.
Hartford Series Fund, Inc. inception dates range from 1977 to date. Hartford Series Fund, Inc. is not a subsidiary of The Hartford but is underwritten, distributed by and advised by subsidiaries of The Hartford. Investments in Hartford Series Fund, Inc. are not guaranteed by The Hartford or any other entity.
You should carefully consider investment objectives, risks, and charges and expenses of Hartford HLS Funds before investing. This and other information can be found in the Fund’s prospectus or summary prospectus, which can be obtained by calling 800-862-6668. Please read them carefully before you invest or send money.
HLSSAR-DG11 8-11 | 106632 | Printed in U.S.A ©2011 The Hartford, Hartford, CT 06115 |

A MESSAGE FROM THE PRESIDENT

Dear Fellow Shareholders:
I want to take this opportunity to say thank you for your continued confidence and trust.
We have seen a significant amount of global turbulence in the first half of 2011. Investors have continued to be concerned about the implications of the European sovereign debt crisis, as well as our own high levels of domestic debt. Since January we have witnessed significant political uprisings in the already-volatile Middle East and North Africa region. In addition, the ramifications of Japan's massive earthquake, subsequent tsunami, and nuclear disaster are still being played out in the market.
Although corporate earnings have remained robust, the unemployment picture has been mixed. After adding more than 200,000 jobs from February to April, more recent unemployment reports have shown a pullback in hiring.
While official inflation remains low as measured by the Consumer Price Index (CPI), high oil prices may be indicative of higher inflation in the future. The federal funds rate remains at a historic low, however, the Fed could potentially raise the rate to get it closer to its historical average once the economy strengthens.
Even with these headwinds, domestic, international, and world indices (as measured by the S&P 500, MSCI EAFE and MSCI World) are all up more than 5% through June, 30 2011.
Looking ahead, continued growth in emerging markets is fueling global recovery efforts. Emerging markets comprise about 48 percent of the world’s GDP, and many economists believe they are poised for further expansion. As GDP growth continues in emerging markets, roughly 100 million people are added to the middle class each year. This middle class population growth could potentially drive a considerable shift in consumer purchasing power.
Now that we have reached the midpoint of 2011, perhaps now would be a good time to schedule a meeting with your financial adviser to examine your current investment strategy and determine whether you are on the right track.
| • | Are you concerned about inflation and its effects on your portfolio? |
| • | Is your portfolio prepared for rising interest rates? |
| • | Does your portfolio reflect the global economy with a mix of developed nations and emerging markets? |
Your financial professional’s advice can help you to navigate today’s volatile markets with confidence. You can also rest assured that we will continue to provide you with solid investments and stellar service for the road ahead.
Thank you again for your business.

James Davey
President
Hartford HLS Funds
Hartford Global Growth HLS Fund
| Manager Discussion (Unaudited) | 2 |
| Financial Statements | |
| 5 | |
| 8 | |
| 9 | |
| 10 | |
| 11 | |
| 12 | |
| 22 | |
| 24 | |
| 26 | |
| 26 | |
| 27 |
This report is prepared for the general information of contract owners and qualified retirement plan participants. It is not an offer of contracts or of qualified retirement plans. It should not be used in connection with any offer, except in conjunction with the appropriate product prospectus which contains all pertinent information including the applicable sales, administrative and other charges.
The views expressed in the Fund’s Manager Discussion under ‘‘Why did the Fund perform this way?’’ and ‘‘What is the outlook?’’ are views of the Fund’s sub-adviser and portfolio management team through the end of the reporting period and are subject to change based on market and other conditions.
Hartford Global Growth HLS Fund inception 09/30/1998 |
| (sub-advised by Wellington Management Company, LLP) |
| Investment objective – Seeks growth of capital. |
Performance Overview 6/30/01 - 6/30/11
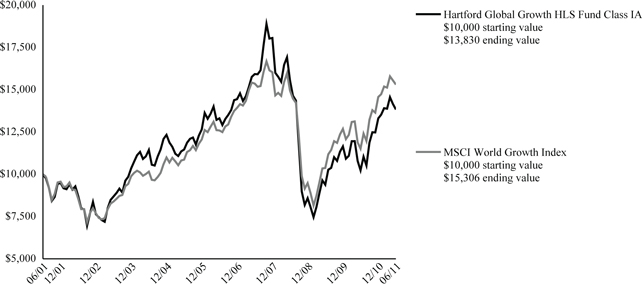
The chart above shows the growth of a $10,000 investment in Class IA. Growth results in classes other than Class IA will vary from what is seen above due to differences in the expenses charged to those share classes.
Average Annual Total Returns (as of 6/30/11) | ||||
6 Month† | 1 Year | 5 year | 10 year | |
| Global Growth IA | 3.95% | 35.20% | 0.78% | 3.30% |
| Global Growth IB | 3.83% | 34.86% | 0.53% | 3.04% |
| MSCI World Growth Index | 5.05% | 32.93% | 3.98% | 4.35% |
| † | Not Annualized |
PAST PERFORMANCE IS NOT INDICATIVE OF FUTURE RESULTS.
Total returns presented above were calculated using the Fund's net asset value available to shareholders for sale or redemption of Fund shares on June 30, 2011, which excludes investment transactions as of this date.
MSCI World Growth Index is a broad-based unmanaged market capitalization-weighted total return index which measures the performance of growth securities in 23 developed-country global equity markets including the United States, Canada, Europe, Australia, New Zealand and the Far East.
You cannot invest directly in an index.
The chart represents a hypothetical investment in the Fund. Performance data represents past performance and current performance could be higher or lower.
Performance information may reflect historical or current expense waivers/reimbursements from the investment adviser, without which performance would have been lower. For information on current expense waivers/reimbursements, please see the prospectus.
The value of the fund will fluctuate so that when redeemed, it may be worth more or less than the original investment. The chart and table do not reflect the deductions of taxes, sales charges or other fees which may be applied at the variable life insurance, variable annuity or qualified retirement plan product level. Any such additional sales charges or other fees or expenses would lower the contract’s or plan’s performance.
| Portfolio Manager |
| Matthew D. Hudson, CFA |
| Vice President |
How did the Fund perform?
The Class IA shares of the Hartford Global Growth HLS Fund returned 3.95% for the six-month period ended June 30, 2011, underperforming its benchmark, the MSCI World Growth Index, which returned 5.05% for the same period. The Fund outperformed the 3.93% return of the average fund in the Lipper Global Growth Funds VP-UF peer group, a group of funds with investment strategies similar to those of the Fund.
Why did the Fund perform this way?
Despite volatility and headline risk, global equities moved higher over the period as investors chose to focus on improving economic data, strong corporate earnings, and robust merger and acquisition activity. Heightened geopolitical risks, a devastating earthquake in Japan, and continued uncertainty surrounding sovereign debt issues in Europe were not enough to offset investors' enthusiasm about the improving health of the global economy. Emerging markets again trailed their developed market counterparts as policy makers in the emerging world worked to fight inflation while developed market policies remained broadly stimulative.
For the period, Growth stocks (+5%) slightly underperformed Value stocks (+6%) as measured by the MSCI World Growth Index and the MSCI World Value Index, respectively. Within the MSCI World Growth Index, eight of ten sectors posted positive returns. Health Care (+13%), Utilities (+9%), and Consumer Staples (+9%) gained the most, while the Financials and Materials sectors lagged with mildly negative returns.
The Fund’s underperformance versus its benchmark was primarily due to underweights (i.e. the Fund’s sector position was less than the benchmark position) to the strong performing Consumer Staples and Health Care sectors. Security selection was positive overall, particularly within the Health Care and Consumer Staples sectors. This was partially offset by weaker selection in Materials and Financials.
The top detractors from the Fund’s absolute (i.e. total return) and benchmark-relative performance were Motorola Mobility (Information Technology), NVIDIA (Information Technology), and Li & Fung (Consumer Discretionary). Shares of Motorola Mobility, the former mobile devices division of Motorola, weakened as sentiment for the company became negative during the period as two headline products, the Motorola Xoom and Motorola Atrix, showed signs of weak demand. Despite delivering solid earnings results, shares of NVIDIA, a leading provider of chips for interactive graphics on consumer and professional computing devices, moved lower as some investors were disappointed by the company's margin guidance. Shares of Li & Fung, one of the largest suppliers of clothes and toys to retailers, fell as investors worried that several large suppliers may leave their system.
Aetna (Health Care), Baidu (Information Technology), and Vertex Pharmaceuticals (Health Care) were positive contributors to benchmark-relative (i..e performance of the Fund as measured against the benchmark) and absolute performance. Shares of Aetna, a large U.S. health maintenance organization, gained during the period after the company announced fiscal year 2011 earnings-per-share above analysts' estimates, driven primarily by improvements in customer enrollment trends. Baidu, a leading internet search provider in China, moved higher after the company posted better-than-expected quarterly earnings and painted a bright near-term outlook. Shares of Vertex Pharmaceuticals, a development stage pharmaceutical company, surged higher after the company reported success in a Phase 3 study of a cystic fibrosis treatment, opening the way for the company to apply for regulatory approval later this year.
What is the outlook?
While the global expansion continues, we believe that it is faced with a growing list of risks, including the crisis in Japan, political tensions in the Middle East and North Africa regions, rekindled concern over sovereign debt contagion in Europe, and recent weakness in both consumer and manufacturing data globally. Despite these macroeconomic headwinds, we feel that corporate earnings remain a bright spot. We believe we are on pace for strong earnings over the next two years, with historically robust balance sheets that are supportive of both investment and a return of capital to shareholders. Within the context of these countervailing forces, we believe that global growth will continue at a pace that can drive the market higher, although the rate of growth could slow.
Portfolio construction is a bottom-up (i.e. stock by stock fundamental research) process based on intensive company research. Allocations among sectors are the result of individual stock decisions. At the end of the period, our stock-by-stock investment process resulted in greater-than-benchmark weights in Information Technology, where our holdings are leveraged to several strong product cycles and emerging product categories, in Industrials, where we favor cyclically oriented firms that should outperform as the
economy recovers, and in Consumer Discretionary, where we favor companies with strong fundamentals which should also benefit from an economic recovery. The Fund held below-benchmark weights in the Consumer Staples and Health Care sectors as we are finding limited opportunities for growth in these sectors relative to companies in other sectors.
| Diversification by Industry | ||||
| as of June 30, 2011 | ||||
| Percentage of | ||||
| Industry (Sector) | Net Assets | |||
| Automobiles & Components (Consumer Discretionary) | 2.7 | % | ||
| Banks (Financials) | 3.4 | |||
| Capital Goods (Industrials) | 16.5 | |||
| Consumer Durables & Apparel (Consumer Discretionary) | 1.1 | |||
| Consumer Services (Consumer Discretionary) | 5.1 | |||
| Diversified Financials (Financials) | 5.5 | |||
| Energy (Energy) | 10.0 | |||
| Food, Beverage & Tobacco (Consumer Staples) | 3.2 | |||
| Health Care Equipment & Services (Health Care) | 1.5 | |||
| Insurance (Financials) | 0.7 | |||
| Materials (Materials) | 7.1 | |||
| Media (Consumer Discretionary) | 2.9 | |||
| Pharmaceuticals, Biotechnology & Life Sciences (Health Care) | 2.7 | |||
| Retailing (Consumer Discretionary) | 5.8 | |||
| Semiconductors & Semiconductor Equipment (Information Technology) | 5.2 | |||
| Software & Services (Information Technology) | 9.0 | |||
| Technology Hardware & Equipment (Information Technology) | 11.4 | |||
| Telecommunication Services (Services) | 1.3 | |||
| Transportation (Industrials) | 3.2 | |||
| Short-Term Investments | 0.4 | |||
| Other Assets and Liabilities | 1.3 | |||
| Total | 100.0 | % | ||
| Diversification by Country | ||||
| as of June 30, 2011 | ||||
| Percentage of | ||||
| Country | Net Assets | |||
| Brazil | 1.0 | % | ||
| Canada | 2.0 | |||
| Cayman Islands | 0.7 | |||
| China | 3.2 | |||
| Denmark | 1.1 | |||
| France | 5.4 | |||
| Germany | 2.8 | |||
| Hong Kong | 2.6 | |||
| Japan | 6.7 | |||
| Jersey | 0.9 | |||
| Netherlands | 1.1 | |||
| Singapore | 1.3 | |||
| South Korea | 0.9 | |||
| Sweden | 1.3 | |||
| Switzerland | 2.4 | |||
| Taiwan | 1.1 | |||
| United Kingdom | 9.8 | |||
| United States | 54.0 | |||
| Short-Term Investments | 0.4 | |||
| Other Assets and Liabilities | 1.3 | |||
| Total | 100.0 | % | ||
Hartford Global Growth HLS Fund |
| June 30, 2011 (Unaudited) |
| (000’s Omitted) |
| Shares or Principal Amount | Market Value ╪ | ||||||
| COMMON STOCKS - 98.3% | |||||||
| Automobiles & Components - 2.7% | |||||||
| 114 | Daimler AG | $ | 8,628 | ||||
| 623 | Nissan Motor Co., Ltd. | 6,546 | |||||
| 15,174 | |||||||
| Banks - 3.4% | |||||||
| 1,229 | Barclays Bank plc | 5,042 | |||||
| 246 | Itau Unibanco Banco Multiplo S.A. ADR | 5,798 | |||||
| 319 | Standard Chartered plc | 8,383 | |||||
| 19,223 | |||||||
| Capital Goods - 16.5% | |||||||
| 3,122 | Changsha Zoomlion Heavy Industry Science | ||||||
| and Technology Co., Ltd. | 5,978 | ||||||
| 523 | General Electric Co. | 9,871 | |||||
| 117 | Honeywell International, Inc. | 6,991 | |||||
| 119 | Ingersoll-Rand plc | 5,409 | |||||
| 239 | JS Group Corp. | 6,177 | |||||
| 196 | Komatsu Ltd. | 6,126 | |||||
| 61 | Parker-Hannifin Corp. | 5,443 | |||||
| 19 | Precision Castparts Corp. | 3,112 | |||||
| 187 | Safran S.A. | 7,996 | |||||
| 411 | Sandvik Ab | 7,199 | |||||
| 50 | Schneider Electric S.A. | 8,327 | |||||
| 54 | Siemens AG | 7,401 | |||||
| 35 | SMC Corp. | 6,286 | |||||
| 61 | Vallourec | 7,422 | |||||
| 93,738 | |||||||
| Consumer Durables & Apparel - 1.1% | |||||||
| 55 | Lululemon Athletica, Inc. ● | 6,128 | |||||
| Consumer Services - 5.1% | |||||||
| 4,557 | Genting Singapore plc ● | 7,185 | |||||
| 448 | MGM Resorts International ● | 5,912 | |||||
| 3,763 | Sands China Ltd. ●§ | 10,199 | |||||
| 154 | Starbucks Corp. | 6,080 | |||||
| 29,376 | |||||||
| Diversified Financials - 5.5% | |||||||
| 165 | American Express Co. | 8,546 | |||||
| 34 | BlackRock, Inc. | 6,452 | |||||
| 246 | JP Morgan Chase & Co. | 10,073 | |||||
| 1,222 | Nomura Holdings, Inc. | 6,030 | |||||
| 31,101 | |||||||
| Energy - 10.0% | |||||||
| 90 | Anadarko Petroleum Corp. | 6,939 | |||||
| 285 | BG Group plc | 6,470 | |||||
| 194 | Chesapeake Energy Corp. | 5,768 | |||||
| 117 | Consol Energy, Inc. | 5,670 | |||||
| 156 | ENSCO International plc | 8,340 | |||||
| 73 | EOG Resources, Inc. | 7,622 | |||||
| 105 | National Oilwell Varco, Inc. | 8,180 | |||||
| 92 | Schlumberger Ltd. | 7,906 | |||||
| 56,895 | |||||||
| Food, Beverage & Tobacco - 3.2% | |||||||
| 57 | Carlsberg A/S Class B | 6,219 | |||||
| 56 | Green Mountain Coffee Roasters, Inc. ● | 4,981 | |||||
| 94 | Groupe Danone | 6,986 | |||||
| 18,186 | |||||||
| Health Care Equipment & Services - 1.5% | |||||||
| 191 | Aetna, Inc. | 8,430 | |||||
| Insurance - 0.7% | |||||||
| 403 | Ping An Insurance (Group) Co. | 4,175 | |||||
| Materials - 7.1% | |||||||
| 175 | Anglo American plc | 8,676 | |||||
| 122 | Barrick Gold Corp. | 5,542 | |||||
| 683 | Glencore International plc ● | 5,382 | |||||
| 90 | Mosaic Co. | 6,096 | |||||
| 21 | Syngenta AG | 7,190 | |||||
| 339 | Xstrata plc | 7,460 | |||||
| 40,346 | |||||||
| Media - 2.9% | |||||||
| 606 | News Corp. Class A | 10,722 | |||||
| 458 | WPP plc | 5,741 | |||||
| 16,463 | |||||||
| Pharmaceuticals, Biotechnology & Life Sciences - 2.7% | |||||||
| 120 | Celgene Corp. ● | 7,253 | |||||
| 43 | Regeneron Pharmaceuticals, Inc. ● | 2,422 | |||||
| 113 | Vertex Pharmaceuticals, Inc. ● | 5,882 | |||||
| 15,557 | |||||||
| Retailing - 5.8% | |||||||
| 32 | Amazon.com, Inc. ● | 6,458 | |||||
| 1,308 | Kingfisher plc | 5,617 | |||||
| 2,331 | Li & Fung Ltd. | 4,658 | |||||
| 360 | Lowe's Co., Inc. | 8,385 | |||||
| 16 | Priceline.com, Inc. ● | 8,108 | |||||
| 33,226 | |||||||
| Semiconductors & Semiconductor Equipment - 5.2% | |||||||
| 167 | ASML Holding N.V. | 6,142 | |||||
| 170 | Broadcom Corp. Class A | 5,726 | |||||
| 437 | NVIDIA Corp. ● | 6,970 | |||||
| 7 | Samsung Electronics Co., Ltd. | 5,106 | |||||
| 258 | Skyworks Solutions, Inc. ● | 5,924 | |||||
| 29,868 | |||||||
| Software & Services - 9.0% | |||||||
| 58 | Baidu, Inc. ADR ● | 8,077 | |||||
| 89 | Citrix Systems, Inc. ● | 7,111 | |||||
| 198 | eBay, Inc. ● | 6,393 | |||||
| 12 | Google, Inc. ● | 5,995 | |||||
| 524 | Oracle Corp. | 17,233 | |||||
| 43 | Salesforce.com, Inc. ● | 6,478 | |||||
| 51,287 | |||||||
| Technology Hardware & Equipment - 11.4% | |||||||
| 46 | Apple, Inc. ● | 15,348 | |||||
| 487 | EMC Corp. ● | 13,407 | |||||
| 178 | High Technology Computer Corp. | 6,027 | |||||
| 1,206 | Hitachi Ltd. | 7,155 | |||||
| 226 | Juniper Networks, Inc. ● | 7,113 | |||||
| 238 | Motorola Mobility Holdings, Inc. ● | 5,238 | |||||
| 116 | Qualcomm, Inc. | 6,561 | |||||
| 138 | TPK Holding Co., Ltd. ● | 4,223 | |||||
| 65,072 | |||||||
| Telecommunication Services - 1.3% | |||||||
| 1,336 | Sprint Nextel Corp. ● | 7,203 | |||||
| Transportation - 3.2% | |||||||
| 549 | Delta Air Lines, Inc. ● | 5,035 | |||||
| 75 | FedEx Corp. | 7,119 | |||||
The accompanying notes are an integral part of these financial statements.
| Hartford Global Growth HLS Fund |
| Schedule of Investments – (continued) |
| June 30, 2011 (Unaudited) |
| (000’s Omitted) |
| Shares or Principal Amount | Market Value ╪ | |||||||||
| COMMON STOCKS - 98.3% - (continued) | ||||||||||
| Transportation - 3.2% - (continued) | ||||||||||
| 42 | Kuehne & Nagel International AG | $ | 6,335 | |||||||
| 18,489 | ||||||||||
| Total common stocks | ||||||||||
| (cost $442,144) | $ | 559,937 | ||||||||
| Total long-term investments | ||||||||||
| (cost $442,144) | $ | 559,937 | ||||||||
| SHORT-TERM INVESTMENTS - 0.4% | ||||||||||
| Repurchase Agreements - 0.4% | ||||||||||
| Bank of America Merrill Lynch TriParty Joint | ||||||||||
| Repurchase Agreement (maturing on | ||||||||||
| 07/01/2011 in the amount of $199, | ||||||||||
| collateralized by FHLB 4.91%, 2015, | ||||||||||
| GNMA 0.87% - 5.72%, 2025 - 2061, value | ||||||||||
| of $203) | ||||||||||
| $ | 199 | 0.05%, 06/30/2011 | $ | 199 | ||||||
| BNP Paribas Securities Corp. TriParty Joint | ||||||||||
| Repurchase Agreement (maturing on | ||||||||||
| 07/01/2011 in the amount of $149, | ||||||||||
| collateralized by FNMA 3.50% - 6.50%, | �� | |||||||||
| 2023 - 2041, value of $152) | ||||||||||
| 149 | 0.05%, 06/30/2011 | 149 | ||||||||
| Deutsche Bank Securities TriParty Joint | ||||||||||
| Repurchase Agreement (maturing on | ||||||||||
| 07/01/2011 in the amount of $1,445, | ||||||||||
| collateralized by GNMA 4.00% - 7.00%, | ||||||||||
| 2035 - 2040, value of $1,474) | ||||||||||
| 1,445 | 0.05%, 06/30/2011 | 1,445 | ||||||||
| UBS Securities, Inc. Joint Repurchase | ||||||||||
| Agreement (maturing on 07/01/2011 in the | ||||||||||
| amount of $3, collateralized by U.S. | ||||||||||
| Treasury Bill 0.63%, 2012, value of $3) | ||||||||||
| 3 | 0.01%, 06/30/2011 | 3 | ||||||||
| UBS Securities, Inc. TriParty Joint Repurchase | ||||||||||
| Agreement (maturing on 07/01/2011 in the | ||||||||||
| amount of $221, collateralized by FHLMC | ||||||||||
| 4.50%, 2040, FNMA 4.50% - 6.00%, 2035 - | ||||||||||
| 2041, value of $225) | ||||||||||
| 221 | 0.06%, 06/30/2011 | 221 | ||||||||
| 2,017 | ||||||||||
| Total short-term investments | ||||||||||
| (cost $2,017) | $ | 2,017 | ||||||||
| Total investments | ||||||||||
(cost $444,161) ▲ | 98.7 | % | $ | 561,954 | ||||||
| Other assets and liabilities | 1.3 | % | 7,420 | |||||||
| Total net assets | 100.0 | % | $ | 569,374 | ||||||
| Note: | Percentage of investments as shown is the ratio of the total market value to total net assets. Market value of investments in foreign securities represents 44.3% of total net assets at June 30, 2011. |
Prices of foreign equities that are principally traded on certain foreign markets may be adjusted daily pursuant to a fair value pricing service approved by the Board of Directors in order to reflect an adjustment for factors occurring after the close of certain foreign markets but before the close of the New York Stock Exchange.
The accompanying notes are an integral part of these financial statements.
| ▲ | At June 30, 2011, the cost of securities for federal income tax purposes was $444,374 and the aggregate gross unrealized appreciation and depreciation based on that cost were: |
| Unrealized Appreciation | $ | 130,505 | ||
| Unrealized Depreciation | (12,925 | ) | ||
| Net Unrealized Appreciation | $ | 117,580 |
| ● | Currently non-income producing. |
| § | These securities were sold to the Fund under Regulation S, rules governing offers and sales made outside the United States without registration under the Securities Act of 1933. The Fund may only be able to resell these securities in the United States if an exemption from registration under the federal and state securities laws is available, or the Fund may only be able to sell these securities outside of the United States (such as on a foreign exchange) to a non-U.S. person. Unless otherwise indicated, these holdings are determined to be liquid. At June 30, 2011, the aggregate value of these securities amounted to $10,199, which represents 1.79% of total net assets. |
Foreign Currency Contracts Outstanding at June 30, 2011
| Unrealized | |||||||||||||||||
| Contract | Appreciation/ | ||||||||||||||||
| Description | Counterparty | Buy / Sell | Market Value ╪ | Amount | Delivery Date | (Depreciation) | |||||||||||
| British Pound | Deutsche Bank Securities | Sell | $ | 391 | $ | 391 | 07/05/2011 | $ | – | ||||||||
| Danish Krone | JP Morgan Securities | Sell | 46 | 46 | 07/05/2011 | – | |||||||||||
| Euro | CS First Boston | Sell | 120 | 119 | 07/01/2011 | (1 | ) | ||||||||||
| Euro | CS First Boston | Sell | 277 | 276 | 07/05/2011 | (1 | ) | ||||||||||
| Hong Kong Dollar | JP Morgan Securities | Sell | 189 | 189 | 07/05/2011 | – | |||||||||||
| Japanese Yen | JP Morgan Securities | Sell | 1,445 | 1,435 | 07/05/2011 | (10 | ) | ||||||||||
| Japanese Yen | Standard Chartered Bank | Sell | 287 | 287 | 07/05/2011 | – | |||||||||||
| Singapore Dollar | JP Morgan Securities | Sell | 54 | 54 | 07/05/2011 | – | |||||||||||
| Swedish Krona | Banc of America Securities | Sell | 54 | 54 | 07/05/2011 | – | |||||||||||
| Swiss Franc | JP Morgan Securities | Sell | 99 | 100 | 07/05/2011 | 1 | |||||||||||
| $ | (11 | ) | |||||||||||||||
| ╪ | See Significant Accounting Policies of accompanying Notes to Financial Statements regarding valuation of securities. |
The accompanying notes are an integral part of these financial statements.
| Hartford Global Growth HLS Fund |
| June 30, 2011 (Unaudited) |
| (000’s Omitted) |
| Total | Level 1 ♦ | Level 2 ♦ | Level 3 | |||||||||||||
| Assets: | ||||||||||||||||
| Common Stocks | ||||||||||||||||
| Automobiles & Components | $ | 15,174 | $ | – | $ | 15,174 | $ | – | ||||||||
| Banks | 19,223 | 5,798 | 13,425 | – | ||||||||||||
| Capital Goods | 93,738 | 30,826 | 62,912 | – | ||||||||||||
| Consumer Durables & Apparel | 6,128 | 6,128 | – | – | ||||||||||||
| Consumer Services | 29,376 | 11,992 | 17,384 | – | ||||||||||||
| Diversified Financials | 31,101 | 25,071 | 6,030 | – | ||||||||||||
| Energy | 56,895 | 50,425 | 6,470 | – | ||||||||||||
| Food, Beverage & Tobacco | 18,186 | 4,981 | 13,205 | – | ||||||||||||
| Health Care Equipment & Services | 8,430 | 8,430 | – | – | ||||||||||||
| Insurance | 4,175 | – | 4,175 | – | ||||||||||||
| Materials | 40,346 | 17,020 | 23,326 | – | ||||||||||||
| Media | 16,463 | 10,722 | 5,741 | – | ||||||||||||
| Pharmaceuticals, Biotechnology & Life Sciences | 15,557 | 15,557 | – | – | ||||||||||||
| Retailing | 33,226 | 22,951 | 10,275 | – | ||||||||||||
| Semiconductors & Semiconductor Equipment | 29,868 | 18,620 | 11,248 | – | ||||||||||||
| Software & Services | 51,287 | 51,287 | – | – | ||||||||||||
| Technology Hardware & Equipment | 65,072 | 47,667 | 17,405 | – | ||||||||||||
| Telecommunication Services | 7,203 | 7,203 | – | – | ||||||||||||
| Transportation | 18,489 | 12,154 | 6,335 | – | ||||||||||||
| Total | 559,937 | 346,832 | 213,105 | – | ||||||||||||
| Short-Term Investments | 2,017 | – | 2,017 | – | ||||||||||||
| Total | $ | 561,954 | $ | 346,832 | $ | 215,122 | $ | – | ||||||||
| Foreign Currency Contracts* | 1 | – | 1 | – | ||||||||||||
| Total | $ | 1 | $ | – | $ | 1 | $ | – | ||||||||
| Liabilities: | ||||||||||||||||
| Foreign Currency Contracts* | 12 | – | 12 | – | ||||||||||||
| Total | $ | 12 | $ | – | $ | 12 | $ | – | ||||||||
| ♦ | For the six-month period ended June 30, 2011, there were no significant transfers between Level 1 and Level 2. |
| * | Derivative instruments not reflected in the Schedule of Investments are valued at the unrealized appreciation/depreciation on the investments. |
The accompanying notes are an integral part of these financial statements.
| Hartford Global Growth HLS Fund |
| June 30, 2011 (Unaudited) |
| (000’s Omitted) |
| Assets: | ||||
| Investments in securities, at market value (cost $444,161) | $ | 561,954 | ||
| Cash | — | |||
| Foreign currency on deposit with custodian (cost $—) | — | |||
| Unrealized appreciation on foreign currency contracts | 1 | |||
| Receivables: | ||||
| Investment securities sold | 9,929 | |||
| Fund shares sold | 273 | |||
| Dividends and interest | 705 | |||
| Total assets | 572,862 | |||
| Liabilities: | ||||
| Unrealized depreciation on foreign currency contracts | 12 | |||
| Payables: | ||||
| Investment securities purchased | 2,831 | |||
| Fund shares redeemed | 498 | |||
| Investment management fees | 67 | |||
| Distribution fees | 4 | |||
| Accrued expenses | 76 | |||
| Total liabilities | 3,488 | |||
| Net assets | $ | 569,374 | ||
| Summary of Net Assets: | ||||
| Capital stock and paid-in-capital | $ | 623,413 | ||
| Accumulated undistributed net investment income | 2,362 | |||
| Accumulated net realized loss on investments and foreign currency transactions | (174,216 | ) | ||
| Unrealized appreciation of investments and the translations of assets and liabilities denominated in foreign currency | 117,815 | |||
| Net assets | $ | 569,374 | ||
| Shares authorized | 3,400,000 | |||
| Par value | $ | 0.001 | ||
Class IA: Net asset value per share | $ | 16.24 | ||
| Shares outstanding | 28,367 | |||
| Net assets | $ | 460,673 | ||
Class IB: Net asset value per share | $ | 16.12 | ||
| Shares outstanding | 6,741 | |||
| Net assets | $ | 108,701 | ||
The accompanying notes are an integral part of these financial statements.
| Hartford Global Growth HLS Fund |
| For the Six-Month Period Ended June 30, 2011 (Unaudited) |
| (000’s Omitted) |
| Investment Income: | ||||
| Dividends | $ | 5,030 | ||
| Interest | 3 | |||
| Less: Foreign tax withheld | (435 | ) | ||
| Total investment income, net | 4,598 | |||
| Expenses: | ||||
| Investment management fees | 2,174 | |||
| Transfer agent fees | 1 | |||
| Distribution fees - Class IB | 143 | |||
| Custodian fees | 12 | |||
| Accounting services fees | 41 | |||
| Board of Directors' fees | 7 | |||
| Audit fees | 7 | |||
| Other expenses | 102 | |||
| Total expenses (before fees paid indirectly) | 2,487 | |||
| Commission recapture | (4 | ) | ||
| Total fees paid indirectly | (4 | ) | ||
| Total expenses, net | 2,483 | |||
| Net investment income | 2,115 | |||
| Net Realized Gain on Investments and Foreign Currency Transactions: | ||||
| Net realized gain on investments | 55,831 | |||
| Net realized gain on foreign currency contracts | 235 | |||
| Net realized loss on other foreign currency transactions | (130 | ) | ||
| Net Realized Gain on Investments and Foreign Currency Transactions | 55,936 | |||
| Net Changes in Unrealized Depreciation of Investments and Foreign Currency Transactions: | ||||
| Net unrealized depreciation of investments | (34,942 | ) | ||
| Net unrealized depreciation of foreign currency contracts | (5 | ) | ||
| Net unrealized appreciation on translation of other assets and liabilities in foreign currencies | 14 | |||
| Net Changes in Unrealized Depreciation of Investments and Foreign Currency Transactions | (34,933 | ) | ||
| Net Gain on Investments and Foreign Currency Transactions | 21,003 | |||
| Net Increase in Net Assets Resulting from Operations | $ | 23,118 | ||
The accompanying notes are an integral part of these financial statements.
| Hartford Global Growth HLS Fund |
| (000’s Omitted) |
| For the | ||||||||
| Six-Month | For the | |||||||
| Period Ended | Year Ended | |||||||
| June 30, 2011 | December 31, | |||||||
| (Unaudited) | 2010 | |||||||
| Operations: | ||||||||
| Net investment income | $ | 2,115 | $ | 1,273 | ||||
| Net realized gain on investments and foreign currency transactions | 55,936 | 30,096 | ||||||
| Net unrealized appreciation (depreciation) of investments and foreign currency transactions | (34,933 | ) | 43,323 | |||||
| Net Increase In Net Assets Resulting From Operations | 23,118 | 74,692 | ||||||
| Distributions to Shareholders: | ||||||||
| From net investment income | ||||||||
| Class IA | — | (1,190 | ) | |||||
| Class IB | — | (60 | ) | |||||
| Total distributions | — | (1,250 | ) | |||||
| Capital Share Transactions: | ||||||||
| Class IA | ||||||||
| Sold | 14,377 | 28,002 | ||||||
| Issued on reinvestment of distributions | — | 1,190 | ||||||
| Redeemed | (57,140 | ) | (92,308 | ) | ||||
| Total capital share transactions | (42,763 | ) | (63,116 | ) | ||||
| Class IB | ||||||||
| Sold | 7,131 | 13,416 | ||||||
| Issued on reinvestment of distributions | — | 60 | ||||||
| Redeemed | (21,690 | ) | (35,503 | ) | ||||
| Total capital share transactions | (14,559 | ) | (22,027 | ) | ||||
| Net decrease from capital share transactions | (57,322 | ) | (85,143 | ) | ||||
| Proceeds from regulatory settlements | — | 239 | ||||||
| Net Decrease In Net Assets | (34,204 | ) | (11,462 | ) | ||||
| Net Assets: | ||||||||
| Beginning of period | 603,578 | 615,040 | ||||||
| End of period | $ | 569,374 | $ | 603,578 | ||||
| Accumulated undistributed (distribution in excess of) net investment income | $ | 2,362 | $ | 247 | ||||
| Shares: | ||||||||
| Class IA | ||||||||
| Sold | 889 | 2,031 | ||||||
| Issued on reinvestment of distributions | — | 81 | ||||||
| Redeemed | (3,552 | ) | (6,732 | ) | ||||
| Total share activity | (2,663 | ) | (4,620 | ) | ||||
| Class IB | ||||||||
| Sold | 444 | 985 | ||||||
| Issued on reinvestment of distributions | — | 5 | ||||||
| Redeemed | (1,354 | ) | (2,603 | ) | ||||
| Total share activity | (910 | ) | (1,613 | ) | ||||
The accompanying notes are an integral part of these financial statements.
| Hartford Global Growth HLS Fund |
| June 30, 2011 (Unaudited) |
| (000’s Omitted) |
| 1. | Organization: |
Hartford Global Growth HLS Fund (the “Fund”) serves as an underlying investment option for certain variable annuity and variable life insurance separate accounts of Hartford Life Insurance Company (“HLIC”) and its affiliates and certain qualified retirement plans. The Fund may also serve as an underlying investment option for certain variable annuity and variable life separate accounts of other insurance companies. Owners of variable annuity contracts and policyholders of variable life insurance contracts may choose the funds permitted in the variable insurance contract prospectus. In addition, participants in certain qualified retirement plans may choose the Fund if permitted by their plans.
Hartford Series Fund, Inc. (the “Company”) is an open-end registered management investment company comprised of thirty portfolios. Financial Statements for the Fund, a series of the Company, are included in this report.
The Company is organized under the laws of the State of Maryland and is registered with the Securities and Exchange Commission (“SEC”) under the Investment Company Act of 1940, as amended (“1940 Act”). The Fund is a diversified open-end management investment company.
The Fund is divided into Class IA and Class IB shares. Each class is offered at the per share net asset value (“NAV”) without a sales charge and is subject to the same expenses, except that the Class IB shares are subject to distribution and service fees charged pursuant to a Distribution Plan adopted in accordance with Rule 12b-1 under the 1940 Act.
| 2. | Significant Accounting Policies: |
The following is a summary of significant accounting policies of the Fund in the preparation of its financial statements, which are in accordance with the United States Generally Accepted Accounting Principles (“U.S. GAAP”). The preparation of financial statements in accordance with U.S. GAAP may require management to make estimates and assumptions that affect the reported amounts of assets and liabilities and disclosure of contingent assets and liabilities at the date of the financial statements and the reported amounts of increases and decreases in net assets from operations during the reporting period. Actual results could differ from those estimates.
| a) | Determination of Net Asset Value – The NAV of each class of the Fund's shares is determined as of the close of regular trading (normally 4:00 p.m. Eastern Time) (the “NYSE Close”) on each day that the New York Stock Exchange (the “Exchange”) is open (“Valuation Date”). Information that becomes known to the Fund after the NAV has been calculated on a particular day will not generally be used to retroactively adjust the NAV determined earlier that day. |
| b) | Investment Valuation and Fair Value Measurements – For purposes of calculating the NAV, portfolio securities and other assets held by the Fund's portfolio for which market quotes are readily available are valued at market value. Market value is generally determined on the basis of last reported sales prices or official close price. If no sales are reported, market value is based on quotes obtained from a quotation reporting system, established market makers, or independent pricing services. If market prices are not readily available or are deemed unreliable, the Fund will use the fair value of the security as determined in good faith under policies and procedures established by and under the supervision of the Company's Board of Directors. Market quotes are considered not readily available where there is an absence of current or reliable market-based data (e.g., trade information or broker quotes), including where events occur after the close of the relevant market, but prior to the NYSE Close that materially affect the values of the Fund's portfolio securities or assets. In addition, market quotes are considered not readily available when, due to extraordinary circumstances, the exchanges or markets on which the securities trade, do not open for trading for the entire day and no other market prices are available. In addition, prices of foreign equities that are principally traded on certain foreign markets are adjusted daily pursuant to a fair value pricing service approved by the Board of Directors in order to reflect an adjustment for the factors occurring after the close of certain foreign markets but before the NYSE Close. Securities that are primarily traded on foreign markets may trade on days that are not business days of the Fund. The value of the foreign securities, in which the Fund invests, may change on days when a shareholder will not be able to purchase or redeem shares of the |
Fund. Fair value pricing is subjective in nature and the use of fair value pricing by the Fund may cause the NAV of its shares to differ significantly from the NAV that would have been calculated using market prices at the close of the exchange on which a portfolio security is primarily traded. There can be no assurance that the Fund could obtain the fair market value assigned to a security if the Fund were to sell the security at approximately the time at which the Fund determines its NAV.
Investments valued in currencies other than U.S. dollars are converted to U.S. dollars using exchange rates obtained from independent pricing services for calculation of the NAV. As a result, the NAV of the Fund’s shares may be affected by changes in the value of currencies in relation to the U.S. dollar. The value of securities traded in markets outside the United States or denominated in currencies other than the U.S. dollar may be affected significantly on a day that the NYSE is closed and the market value may change on days when an investor is not able to purchase, redeem or exchange shares of the Fund.
Foreign currency contracts represent agreements to exchange currencies on specific future dates at predetermined rates. Foreign currency contracts are valued using foreign currency exchange rates and forward rates as provided by an independent pricing service on Valuation Date.
Financial instruments for which prices are not available from an independent pricing service may be valued using market quotations obtained from one or more dealers that make markets in the respective financial instrument in accordance with procedures established by the Company’s Board of Directors.
U.S. GAAP defines fair value as the price that the Fund would receive to sell an asset or pay to transfer a liability in an orderly transaction between market participants. The U.S. GAAP fair value measurement standards require disclosure of a fair value hierarchy for each major category of assets and liabilities. Various inputs are used in determining the fair value of the Fund’s investments. These inputs are summarized into three broad hierarchy levels. This hierarchy is based on whether the valuation inputs are observable or unobservable. These levels are:
| · | Level 1 – Quoted prices in active markets for identical securities. Level 1 may include exchange-traded instruments such as domestic equities, some foreign equities, options, futures, mutual funds, exchange-traded funds, rights and warrants. |
| · | Level 2 – Observable inputs other than Level 1 prices, such as quoted prices for similar securities; quoted prices in markets that are not active; or other inputs that are observable or can be corroborated by observable market data. Level 2 may include debt securities that are traded less frequently than exchange-traded instruments and which are valued using third party pricing services; foreign equities, whose value is determined using a multi-factor regression model with inputs that are observable in the market; and short-term securities, which are valued at amortized cost. |
| · | Level 3 – Significant unobservable inputs that are supported by limited or no market activity. Level 3 may include financial instruments whose values are determined using broker quotes or require significant management judgment or estimation. These unobservable valuation inputs may include estimates for current yields, maturity/duration, prepayment speed, and broker quotes for comparable securities along with other assumptions relating to credit quality, collateral value, complexity of the security structure, general market conditions and liquidity. This category may include securities where trading has been halted or there are certain restrictions on trading. While these securities are priced using unobservable inputs, the valuation of these securities reflects the best available data and management believes the prices are a reasonable representation of exit price. |
Valuation levels are not necessarily indicative of the risk associated with investing in such securities. Individual securities within any of the above mentioned asset classes may be assigned a different hierarchical level than those presented above, as individual circumstances dictate.
| Hartford Global Growth HLS Fund |
| Notes to Financial Statements – (continued) |
| June 30, 2011 (Unaudited) |
| (000’s Omitted) |
During the six-month period ended June 30, 2011, the Fund held no Level 3 securities, therefore no reconciliation of Level 3 securities is presented.
For additional information, refer to the Investment Valuation Hierarchy Level Summary which follows the Schedule of Investments.
For purposes of reporting transfers between different hierarchy levels, both transfers in and out of each level, as applicable, are shown as if they occurred at the beginning of the period.
| c) | Security Transactions and Investment Income – Security transactions are recorded as of the trade date (the date the order to buy or sell is executed) for financial reporting purposes. Securities purchased or sold on a when-issued or delayed-delivery basis may be settled a month or more after the trade date. Realized gains and losses are determined on the basis of identified cost. |
Dividend income is accrued as of the ex-dividend date, except that certain dividends from foreign securities where the ex-dividend date may have passed are recorded as soon as the Fund is informed of the dividend. Interest income, including amortization of premium and accretion of discounts, is accrued on a daily basis.
| d) | Foreign Currency Transactions – Assets and liabilities denominated in currencies other than U.S. dollars are translated into U.S. dollars at the exchange rates in effect on the valuation date. Purchases and sales of investment securities, income, and expenses are translated into U.S. dollars at the exchange rates on the dates of such transactions. |
The Fund does not isolate that portion of portfolio security valuation resulting from fluctuations in the foreign currency exchange rates from the fluctuations arising from changes in the market prices of securities held. Exchange rate fluctuations are included with the net realized and unrealized gain or loss on investments in the accompanying financial statements.
Net realized foreign exchange gains or losses arise from sales of foreign currencies and the difference between asset and liability amounts initially stated in foreign currencies and the U.S. dollar value of the amounts actually received or paid. Net unrealized foreign exchange gains or losses arise from changes in the value of other assets and liabilities at the end of the reporting period, resulting from changes in the exchange rates.
| e) | Joint Trading Account – The Fund may invest cash balances into a joint trading account that may be invested in one or more repurchase agreements. |
| f) | Fund Share Valuation and Dividend Distributions to Shareholders – Orders for the Fund’s shares are executed in accordance with the investment instructions of the contract holders and plan participants. The NAV of the Fund’s shares is determined as of the close of business on each business day of the Exchange. The NAV is determined separately for each class of shares of the Fund by dividing the Fund’s net assets attributable to that class by the number of shares of the class outstanding. Each class of shares offered by the Fund has equal rights as to assets and voting privileges (except that shareholders of a class have exclusive voting rights regarding any matter relating solely to that class of shares). Income and non-class specific expenses are allocated daily to each class on the basis of the relative net assets of the class. Realized and unrealized capital gains and losses of each class are allocated daily based on the relative net assets of each class of shares of the Fund. |
Orders for the purchase of the Fund’s shares received prior to the close of the Exchange on any day the Exchange is open for business are priced at the NAV determined as of the close of the Exchange. Orders received after the close of the Exchange, or on a day on which the Exchange and/or the Fund is not open for business, are priced at the next determined NAV.
Dividends are declared pursuant to a policy adopted by the Company’s Board of Directors based upon the investment performance of the Fund. The policy of the Fund is to pay dividends from net investment income and realized capital gains, if any, at least once a year.
Distributions from net investment income, net realized capital gains and capital are determined in accordance with federal income tax regulations, which may differ from U.S. GAAP with respect to character and timing. These differences may include but are not limited to losses deferred due to wash sale adjustments, foreign currency gains and losses, adjustments related to Passive Foreign Investment Companies (“PFICs”), Real Estate Investment Trusts (“REITs”), Regulated Investment Companies (“RICs”), certain derivatives and partnerships. Permanent book and federal income tax basis differences relating to shareholder distributions will result in reclassifications to certain of the Fund’s capital accounts (see Federal Income Taxes: Reclassification of Capital Accounts note).
| 3. | Securities and Other Investments: |
| a) | Repurchase Agreements – A repurchase agreement is an agreement by which a counterparty agrees to sell a security and agrees to repurchase the security sold at a mutually agreed upon time and price. At the time the Fund enters into a repurchase agreement, the value of the underlying collateral security(ies), including accrued interest, will be equal to or exceed the value of the repurchase agreement. Repurchase agreements expose the Fund to counterparty risk. To minimize counterparty risk, the securities that serve to collateralize the repurchase agreement are held by the Fund's custodian in book entry or physical form in the custodial account of the Fund or in a third party custodial account. Repurchase agreements are valued at cost plus accrued interest. The Fund, as shown on the Schedule of Investments, had outstanding repurchase agreements as of June 30, 2011. |
| b) | Illiquid and Restricted Securities – The Fund is permitted to invest up to 15% of its net assets in illiquid securities. Illiquid securities are those that may not be sold or disposed of in the ordinary course of business within seven days, at approximately the price used to determine the Fund’s NAV. The Fund may not be able to sell illiquid securities or other investments when its sub-adviser considers it desirable to do so or may have to sell such securities or investments at a price that is lower than the price that could be obtained if the securities or investments were more liquid. A sale of illiquid securities or other investments may require more time and may result in higher dealer discounts and other selling expenses than does the sale of those that are liquid. Illiquid securities and investments also may be more difficult to value, due to the unavailability of reliable market quotations for such securities or investments, and an investment in them may have an adverse impact on the Fund’s NAV. The Fund may also purchase certain restricted securities that can only be resold to certain qualified investors and may be determined to be liquid pursuant to policies and guidelines established by the Company’s Board of Directors. The Fund, as shown on the Schedule of Investments, had illiquid and/or restricted securities as of June 30, 2011. |
| 4. | Financial Derivative Instruments: |
The following disclosures contain information on how and why the Fund uses derivative instruments, the credit-risk-related contingent features in certain derivative instruments, and how derivative instruments affect the Fund’s financial position, results of operations and cash flows. The location and fair value amounts of these instruments on the Statement of Assets and Liabilities and the realized gains and losses and changes in unrealized gains and losses on the Statement of Operations, each categorized by type of derivative contract, are included in the following Additional Derivative Instrument Information footnote. The derivative instruments outstanding as of period-end are disclosed in the Notes to the Schedule of Investments and the amounts of realized gains and losses and changes in unrealized gains and losses on derivative instruments during the period are disclosed in the Statement of Operations.
| a) | Foreign Currency Contracts – The Fund may enter into foreign currency contracts that obligate the Fund to purchase or sell currencies at specified future dates. Foreign currency contracts are used to hedge the currency exposure associated with some or all of the Fund's securities and/or as part of an investment strategy. Foreign currency contracts are marked |
| Hartford Global Growth HLS Fund |
| Notes to Financial Statements – (continued) |
| June 30, 2011 (Unaudited) |
| (000’s Omitted) |
to market daily and the change in value is recorded by the Fund as an unrealized gain or loss. Realized gains or losses equal to the difference between the value of the contract at the time it was opened and the value at the time it was closed are recorded upon delivery or receipt of the currency.
Foreign currency contracts involve elements of market risk in excess of the amounts reflected in the Statement of Assets and Liabilities. In addition, risks may arise upon entering into these contracts from the potential inability of the counterparties to meet the terms of the contracts and from unanticipated movements in the value of the foreign currencies relative to the U.S. dollar. The Fund had outstanding foreign currency contracts as shown on the Schedule of Investments as of June 30, 2011.
| b) | Additional Derivative Instrument Information: |
Fair Values of Derivative Instruments on the Statement of Assets and Liabilities as of June 30, 2011:
| Risk Exposure Category | ||||||||||||||||||||||||||||
| Foreign | ||||||||||||||||||||||||||||
| Interest Rate | Exchange | Credit | Equity | Commodity | Other | |||||||||||||||||||||||
| Contracts | Contracts | Contracts | Contracts | Contracts | Contracts | Total | ||||||||||||||||||||||
| Assets: | ||||||||||||||||||||||||||||
Unrealized appreciation on foreign currency contracts | $ | — | $ | 1 | $ | — | $ | — | $ | — | $ | — | $ | 1 | ||||||||||||||
| Total | $ | — | $ | 1 | $ | — | $ | — | $ | — | $ | — | $ | 1 | ||||||||||||||
| Liabilities: | ||||||||||||||||||||||||||||
Unrealized depreciation on foreign currency contracts | $ | — | $ | 12 | $ | — | $ | — | $ | — | $ | — | $ | 12 | ||||||||||||||
| Total | $ | — | $ | 12 | $ | — | $ | — | $ | — | $ | — | $ | 12 | ||||||||||||||
The volume of derivatives that is presented in the Schedule of Investments is consistent with the derivative activity during the six-month period ended June 30, 2011.
The Effect of Derivative Instruments on the Statement of Operations for the six-month period ended June 30, 2011:
| Risk Exposure Category | ||||||||||||||||||||||||||||
| Foreign | ||||||||||||||||||||||||||||
| Interest Rate | Exchange | Credit | Equity | Commodity | Other | |||||||||||||||||||||||
| Contracts | Contracts | Contracts | Contracts | Contracts | Contracts | Total | ||||||||||||||||||||||
| Realized Gain (Loss) on Derivatives Recognized as a Result from Operations: | ||||||||||||||||||||||||||||
| Net realized gain on foreign currency contracts | $ | — | $ | 235 | $ | — | $ | — | $ | — | $ | — | $ | 235 | ||||||||||||||
| Total | $ | — | $ | 235 | $ | — | $ | — | $ | — | $ | — | $ | 235 | ||||||||||||||
| Net Change in Unrealized Appreciation (Depreciation) on Derivatives Recognized as a Result from Operations: | ||||||||||||||||||||||||||||
| Net change in unrealized depreciation of foreign currency contracts | $ | — | $ | (5 | $ | ) — | $ | — | $ | — | $ | — | $ | (5 | ) | |||||||||||||
| Total | $ | — | $ | (5 | $ | ) — | $ | — | $ | — | $ | — | $ | (5 | ) | |||||||||||||
| 5. | Principal Risks: |
| a) | Counterparty Risk – The Fund may be exposed to counterparty risk, or the risk that an institution or other entity with which the Fund has unsettled or open transactions will default. |
| b) | Market Risks – If a Fund invests directly in foreign currencies or in securities that trade in, and receive revenues in, foreign currencies, or in derivatives that provide exposure to foreign currencies, it will be subject to the risk that those currencies will decline in value relative to the base currency of the Fund, or, in the case of hedging positions, that the Fund’s base currency will decline in value relative to the currency being hedged. Currency rates in foreign countries may |
fluctuate significantly over short periods of time for a number of reasons, including changes in interest rates, intervention (or the failure to intervene) by U.S. or foreign governments, central banks or supranational entities such as the International Monetary Fund, or by the imposition of currency controls or other political developments in the United States or abroad. As a result, the Fund’s investments in foreign currency denominated securities may reduce the returns of the Fund. The market values of equity securities, such as common stocks and preferred stocks or equity related investments such as futures and options, may decline due to general market conditions which are not specifically related to a particular company, such as real or perceived adverse economic conditions, changes in the general outlook for corporate earnings, changes in interest or currency rates or adverse investor sentiment generally. The market value of equity securities may also decline due to factors which affect a particular industry or industries, such as labor shortages or increased production costs and competitive conditions within an industry. Equity securities and equity related investments generally have greater market price volatility than fixed income securities.
| 6. | Federal Income Taxes: |
| a) | Federal Income Taxes – For federal income tax purposes, the Fund intends to continue to qualify as a RIC under Subchapter M of the Internal Revenue Code (“IRC”) by distributing substantially all of its taxable net investment income and net realized capital gains to its shareholders and otherwise complying with the requirements of RICs. The Fund has distributed substantially all of its income and capital gains in prior years, if applicable, and intends to distribute substantially all of its income and capital gains prior to the next fiscal year-end. Accordingly, no provision for federal income or excise taxes has been made in the accompanying financial statements. Distributions from short-term capital gains are treated as ordinary income distributions for federal income tax purposes. |
| b) | Net Investment Income (Loss), Net Realized Gains (Losses) – Net investment income (loss) and net realized gains (losses) may differ for financial statement and tax purposes primarily because of losses deferred due to wash sale adjustments, foreign currency gains and losses, adjustments related to PFICs, REITs, RICs, certain derivatives and partnerships. The character of distributions made during the year from net investment income or net realized gains may differ from their ultimate characterization for federal income tax purposes. Also, due to the timing of dividend distributions, the fiscal year in which amounts are distributed may differ from the year that the income or realized gains (losses) were recorded by the Fund. |
| c) | Distributions and Components of Distributable Earnings – The tax character of distributions paid by the Fund for the periods indicated is as follows (as adjusted for dividends payable): |
| For the Year Ended | For the Year Ended | |||||||
| December 31, 2010 | December 31, 2009 | |||||||
| Ordinary Income | $ | 1,250 | $ | 3,693 | ||||
As of December 31, 2010, the Fund’s components of distributable earnings (deficit) on a tax basis were as follows:
| Amount | ||||
| Undistributed Ordinary Income | $ | 247 | ||
| Accumulated Capital and Other Losses* | (229,939 | ) | ||
Unrealized Appreciation† | 152,535 | |||
| Total Accumulated Deficit | $ | (77,157 | ) | |
| * | The Fund has capital loss carryforwards that are identified in the Capital Loss Carryforward note that follows. |
| † | The difference between book-basis and tax-basis unrealized appreciation (depreciation) may be attributable to the losses deferred due to wash sale adjustments, foreign currency gains and losses, adjustments related to PFICs, REITs, RICs, certain derivatives and partnerships. |
| Hartford Global Growth HLS Fund |
| Notes to Financial Statements – (continued) |
| June 30, 2011 (Unaudited) |
| (000’s Omitted) |
| d) | Reclassification of Capital Accounts – The Fund may record reclassifications in its capital accounts. These reclassifications have no impact on the total net assets of the Fund. The reclassifications are a result of permanent differences between U.S. GAAP and tax accounting for such items as expiration or utilization of capital loss carryforwards or net operating losses. Adjustments are made to reflect the impact these items have on current and future distributions to shareholders. Therefore, the source of the Fund’s distributable income may be shown in the accompanying Statement of Assets and Liabilities as from accumulated undistributed net investment income, from accumulated net realized gains on investments or from capital depending on the type of book and tax differences that exist. For the year ended December 31, 2010, the Fund recorded reclassifications to increase (decrease) the accounts listed below: |
| Amount | ||||
| Accumulated Undistributed Net Investment Income | $ | 82 | ||
| Accumulated Net Realized Gain (Loss) on Investments and Foreign Currency Transactions | (82 | ) | ||
| e) | Capital Loss Carryforward – At December 31, 2010 (tax-year-end), the Fund had capital loss carryforwards for U.S. federal income tax purposes of approximately: |
| Year of Expiration | Amount | |||
| 2016 | $ | 67,474 | ||
| 2017 | 162,465 | |||
| Total | $ | 229,939 | ||
As of December 31, 2010, the Fund utilized $24,888 of prior year capital loss carryforwards.
| f) | Accounting for Uncertainty in Income Taxes – The Fund has adopted financial reporting rules that require the Fund to analyze all open tax years, as defined by the Statute of Limitations, for all major jurisdictions. Generally, tax authorities can examine all tax returns filed for the last three years. The Fund does not have an examination in progress. |
The Fund has reviewed all open tax years and major jurisdictions and concluded that these financial reporting rules had no effect on the Fund’s financial position or results of operations. There is no tax liability resulting from unrecognized tax benefits relating to uncertain income tax positions taken or expected to be taken on the tax return for the fiscal year-end December 31, 2010. The Fund is also not aware of any tax positions for which it is reasonably possible that the total amounts of unrecognized tax benefits will significantly change in the next twelve months.
| 7. | Expenses: |
| a) | Investment Management Agreements – HL Investment Advisors, LLC (“HL Advisors”), an indirect wholly owned subsidiary of The Hartford Financial Services Group, Inc. (“The Hartford”), serves as investment manager to the Fund pursuant to an Investment Management Agreement with the Company. As investment manager, HL Advisors has overall investment supervisory responsibility for the Fund. In addition, HL Advisors provides administrative personnel, services, equipment, facilities and office space for proper operation of the Fund. HL Advisors has contracted with Wellington Management Company, LLP (“Wellington Management”) under a sub-advisory agreement for the provision of day-today investment management services to the Fund in accordance with the Fund’s investment objective and policies. The Fund pays a fee to HL Advisors, a portion of which may be used to compensate Wellington Management. |
The schedule below reflects the rates of compensation paid to HL Advisors for investment management services rendered as of June 30, 2011; the rates are accrued daily and paid monthly.
| Average Daily Net Assets | Annual Fee | |||
| On first $250 million | 0.7750 | % | ||
| On next $250 million | 0.7250 | % | ||
| On next $500 million | 0.6750 | % | ||
| On next $4 billion | 0.6250 | % | ||
| On next $5 billion | 0.6225 | % | ||
| Over $10 billion | 0.6200 | % | ||
| b) | Accounting Services Agreement – Pursuant to the Fund Accounting Agreement between HLIC and the Company, on behalf of the Fund, HLIC provides accounting services to the Fund and receives monthly compensation based on the Fund’s average net assets at the rates set forth below. The Fund’s accounting services fees are accrued daily and paid monthly. |
| Average Daily Net Assets | Annual Fee | |||
| On first $5 billion | 0.014 | % | ||
| On next $5 billion | 0.012 | % | ||
| Over $10 billion | 0.010 | % | ||
| c) | Operating Expenses – Allocable expenses incurred by the Company are allocated to each Fund and allocated to classes within a Fund in proportion to the average daily net assets of the Fund and each class, except where allocation of certain expenses is more fairly made directly to the Fund or to specific classes within a Fund. |
| d) | Fees Paid Indirectly – The Company, on behalf of the Fund, has entered into agreements with State Street Global Markets, LLC and Russell Implementation Services, Inc. to partially recapture non-discounted trade commissions. Such rebates are used to pay a portion of the Fund’s expenses. In addition, the Fund’s custodian bank has also agreed to reduce its fees when the Fund maintains cash on deposit in a non-interest-bearing custody account. For the six-month period ended June 30, 2011, these amounts are included in the Statement of Operations. |
The ratio of expenses to average net assets in the accompanying financial highlights excludes the reduction in expenses related to fees paid indirectly. The annualized expense ratio for the period listed below including the fees paid indirectly is as follows:
| Annualized Six- | ||||
| Month Period | ||||
| Ended June 30, | ||||
| 2011 | ||||
| Class IA | 0.80 | % | ||
| Class IB | 1.05 | |||
| e) | Distribution Plan for Class IB shares – The Company, on behalf of the Fund, has adopted a Distribution Plan pursuant to Rule 12b-1 of the 1940 Act to compensate the Distributor, Hartford Securities Distribution Company, Inc. (a wholly owned, ultimate subsidiary of The Hartford), from assets attributable to the Class IB shares for services rendered and expenses borne in connection with activities primarily intended to result in the sale of the Class IB shares, subject to the review and approval of the Company’s Board of Directors. |
The Distribution Plan provides that the Fund may pay annually up to 0.25% of the average daily net assets of the Fund attributable to its Class IB shares for activities primarily intended to result in the sale of Class IB shares. The Board has the authority to suspend or reduce these payments at any point in time. Under the terms of the Distribution Plan and the
| Hartford Global Growth HLS Fund |
| Notes to Financial Statements – (continued) |
| June 30, 2011 (Unaudited) |
| (000’s Omitted) |
principal underwriting agreement, the Fund is authorized to make payments monthly to the Distributor that may be used to pay or compensate entities providing distribution and shareholder servicing with respect to the Class IB shares for such entities’ fees or expenses incurred or paid in that regard. These fees are accrued daily and paid monthly.
| f) | Other Related Party Transactions – Certain officers of the Fund are directors and/or officers of HL Advisors and/or The Hartford or its subsidiaries. For the six-month period ended June 30, 2011, a portion of the Fund’s chief compliance officer’s salary was paid by all the investment companies in the Hartford fund complex. The portion allocated to the Fund rounds to zero. Hartford Administrative Services Company (“HASCO”), an indirect wholly owned subsidiary of The Hartford, provides transfer agent services to the Fund. The amount paid to HASCO can be found in the Statement of Operations. These fees are accrued daily and paid monthly. |
| g) | Payments from Affiliates – In July of 2007, The Hartford entered into a settlement with the Attorneys General of the states of New York, Connecticut and Illinois relating to market timing and the company's individual variable annuity contracts in which certain payments would be made directly to the variable annuity contract holders. The distribution plan provided that unclaimed money from the settlement would be distributed to certain HLS Funds that are investment options through a Hartford individual variable annuity contract. The unclaimed money was distributed to the Fund on September 18, 2009, as follows: |
| Amount | ||||
| Reimbursement | $ | 220 | ||
On November 8, 2006, the SEC issued an order setting forth the terms of a settlement reached with three subsidiaries of The Hartford that resolved the SEC’s Division of Enforcement’s investigation of aspects of The Hartford’s variable annuity and mutual fund operations related to directed brokerage and revenue sharing. The Hartford settled this matter without admitting or denying the findings of the SEC.
The total return in the accompanying financial highlights includes payments from affiliates. Had the payments from the affiliates been excluded, the impact and total return for the periods listed below would have been as follows:
| For the Year Ended December 31, 2009 | ||||||||
| Class IA | Class IB | |||||||
| Impact from Payment from Affiliate for Attorneys General Settlement | 0.04 | % | 0.04 | % | ||||
| Total Return Excluding Payment from Affiliate | 35.59 | 35.26 | ||||||
| For the Year Ended December 31, 2006 | ||||||||
| Class IA | Class IB | |||||||
| Impact from Payment from Affiliate for SEC Settlement | 0.31 | % | 0.32 | % | ||||
| Total Return Excluding Payment from Affiliate | 13.83 | 13.54 | ||||||
| 8. | Investment Transactions: |
For the six-month period ended June 30, 2011, the Fund's aggregate purchases and sales of investment securities (excluding short-term investments) were as follows:
| Amount | ||||
| Cost of Purchases Excluding U.S. Government Obligations | $ | 182,620 | ||
| Sales Proceeds Excluding U.S. Government Obligations | 237,363 | |||
| 9. | Proceeds from Regulatory Settlement: |
During the year ended December 31, 2010, as a result of a settlement of an administrative proceeding brought by the SEC against an unaffiliated third party relating to market timing and/or late trading of mutual funds, the Fund received $239, which represented the Fund’s portion of the proceeds from the settlement (the Fund was not a party to the proceeding). The proceeds received by the Fund were recorded as an increase to additional paid-in-capital. The payment did not have a material impact on the Fund’s NAV.
| 10. | Line of Credit: |
The Fund is one of several Hartford funds that participate in a $500 million committed revolving line of credit facility. The facility is to be used for temporary or emergency purposes. Under the arrangement, a fund is required to own securities having a market value in excess of 300% of the total bank borrowings. The interest rate on borrowings varies depending on the nature of the loan. The facility also requires a fee to be paid based on the amount of the commitment. This commitment fee is allocated to all the funds participating in the line of credit based on the average net assets of the funds. During the six-month period ended June 30, 2011, the Fund did not have any borrowings under this facility.
| 11. | Industry Classifications: |
Other than the industry classifications “Other Investment Pools and Funds” and “Exchange Traded Funds,” equity industry classifications used in this report are the Global Industry Classification Standard, which was developed by and is the exclusive property and service mark of MSCI, Inc. and Standard & Poor’s.
| 12. | Indemnifications: |
Under the Company’s organizational documents, the Company shall indemnify its officers and directors to the full extent required or permitted under Maryland General Corporation Law and the federal securities laws. In addition, the Company, on behalf of the Fund, may enter into contracts that contain a variety of indemnifications. The Company’s maximum exposure under these arrangements is unknown. However, as of the date of these financial statements the Company has not had prior claims or losses pursuant to these contracts and expects the risk of loss to be remote.
| Hartford Global Growth HLS Fund |
| - Selected Per-Share Data (A) - |
| Net Asset | Net Realized | Net Increase | ||||||||||||||||||||||||||||||||||||||||||
| Value at | and Unrealized | Total from | Dividends from | Distributions | (Decrease) in | Net Asset | ||||||||||||||||||||||||||||||||||||||
| Beginning of | Net Investment | Payments from | Gain (Loss) on | Investment | Net Investment | from Realized | Distributions | Total | Net Asset | Value at End of | ||||||||||||||||||||||||||||||||||
| Class | Period | Income (Loss) | (to) Affiliate | Investments | Operations | Income | Capital Gains | from Capital | Distributions | Value | Period | |||||||||||||||||||||||||||||||||
| For the Six-Month Period Ended June 30, 2011 (Unaudited) | ||||||||||||||||||||||||||||||||||||||||||||
| IA | $ | 15.62 | $ | 0.06 | $ | – | $ | 0.56 | $ | 0.62 | $ | – | $ | – | $ | – | $ | – | $ | 0.62 | $ | 16.24 | ||||||||||||||||||||||
| IB | 15.53 | 0.04 | – | 0.55 | 0.59 | – | – | – | – | 0.59 | 16.12 | |||||||||||||||||||||||||||||||||
| For the Year Ended December 31, 2010 | ||||||||||||||||||||||||||||||||||||||||||||
| IA | 13.71 | 0.04 | – | 1.91 | 1.95 | (0.04 | ) | – | – | (0.04 | ) | 1.91 | 15.62 | |||||||||||||||||||||||||||||||
| IB | 13.64 | – | – | 1.90 | 1.90 | (0.01 | ) | – | – | (0.01 | ) | 1.89 | 15.53 | |||||||||||||||||||||||||||||||
| For the Year Ended December 31, 2009 | ||||||||||||||||||||||||||||||||||||||||||||
| IA | 10.17 | 0.08 | – | 3.55 | 3.63 | (0.09 | ) | – | – | (0.09 | ) | 3.54 | 13.71 | |||||||||||||||||||||||||||||||
| IB | 10.12 | 0.05 | – | 3.53 | 3.58 | (0.06 | ) | – | – | (0.06 | ) | 3.52 | 13.64 | |||||||||||||||||||||||||||||||
| For the Year Ended December 31, 2008 | ||||||||||||||||||||||||||||||||||||||||||||
| IA | 22.42 | 0.12 | – | (11.56 | ) | (11.44 | ) | (0.12 | ) | (0.69 | ) | – | (0.81 | ) | (12.25 | ) | 10.17 | |||||||||||||||||||||||||||
| IB | 22.27 | 0.08 | – | (11.47 | ) | (11.39 | ) | (0.07 | ) | (0.69 | ) | – | (0.76 | ) | (12.15 | ) | 10.12 | |||||||||||||||||||||||||||
| For the Year Ended December 31, 2007 | ||||||||||||||||||||||||||||||||||||||||||||
| IA | 20.09 | 0.03 | – | 4.84 | 4.87 | (0.01 | ) | (2.53 | ) | – | (2.54 | ) | 2.33 | 22.42 | ||||||||||||||||||||||||||||||
| IB | 20.02 | (0.02 | ) | – | 4.81 | 4.79 | (0.01 | ) | (2.53 | ) | – | (2.54 | ) | 2.25 | 22.27 | |||||||||||||||||||||||||||||
| For the Year Ended December 31, 2006 | ||||||||||||||||||||||||||||||||||||||||||||
| IA | 18.74 | 0.10 | 0.05 | 2.48 | 2.63 | (0.16 | ) | (1.12 | ) | – | (1.28 | ) | 1.35 | 20.09 | ||||||||||||||||||||||||||||||
| IB | 18.66 | 0.05 | 0.05 | 2.47 | 2.57 | (0.09 | ) | (1.12 | ) | – | (1.21 | ) | 1.36 | 20.02 | ||||||||||||||||||||||||||||||
| (A) | Information presented relates to a share outstanding throughout the indicated period. |
| (B) | The figures do not include sales charges or other fees which may be applied at the variable life insurance, variable annuity or qualified retirement plan product level. Any such additional sales charges or other fees would lower the Fund's performance. |
| (C) | Ratios do not reflect reductions for fees paid indirectly. Please see Fees Paid Indirectly in the Notes to Financial Statements. |
| (D) | Portfolio turnover rate is calculated on the basis of the Fund as a whole without distinguishing between the classes of shares issued. |
| (E) | Not annualized. |
| (F) | Annualized. |
| (G) | Total return without the inclusion of the Payment from (to) Affiliate can be found in Expenses in the accompanying Notes to Financial Statements. |
| - Ratios and Supplemental Data - |
| Ratio of Expenses to Average Net | Ratio of Expenses to Average Net | Ratio of Net Investment Income to | Portfolio Turnover | |||||||||||||||||||
| Total Return(B) | Net Assets at End of Period | Assets Before Waivers(C) | Assets After Waivers(C) | Average Net Assets | Rate(D) | |||||||||||||||||
| 3.95 | %(E) | $ | 460,673 | 0.80 | %(F) | 0.80 | %(F) | 0.77 | %(F) | 31 | % | |||||||||||
| 3.83 | (E) | 108,701 | 1.05 | (F) | 1.05 | (F) | 0.51 | (F) | – | |||||||||||||
| 14.25 | 484,754 | 0.81 | 0.81 | 0.28 | 62 | |||||||||||||||||
| 13.96 | 118,824 | 1.06 | 1.06 | 0.03 | – | |||||||||||||||||
| 35.64 | (G) | 488,720 | 0.81 | 0.81 | 0.67 | 70 | ||||||||||||||||
| 35.31 | (G) | 126,320 | 1.06 | 1.06 | 0.42 | – | ||||||||||||||||
| (52.46 | ) | 419,183 | 0.75 | 0.75 | 0.67 | 76 | ||||||||||||||||
| (52.58 | ) | 112,226 | 1.00 | 1.00 | 0.42 | – | ||||||||||||||||
| 25.05 | 1,028,843 | 0.73 | 0.73 | 0.13 | 75 | |||||||||||||||||
| 24.74 | 299,788 | 0.98 | 0.98 | (0.11 | ) | – | ||||||||||||||||
| 14.14 | (G) | 942,258 | 0.76 | 0.76 | 0.48 | 116 | ||||||||||||||||
| 13.86 | (G) | 280,283 | 1.01 | 1.01 | 0.23 | – | ||||||||||||||||
| Hartford Global Growth HLS Fund |
The Board of Directors of the Company appoints officers who are responsible for the day-to-day operations of the Fund and who execute policies formulated by the Directors. Each director serves until his or her death, resignation, or retirement or until the next annual meeting of shareholders is held or until his or her successor is elected and qualifies.
Directors and officers who are employed by or who have a financial interest in The Hartford are considered “interested” persons of the Fund pursuant to the 1940 Act. Each officer and two of the Company’s directors, as noted in the chart below, are “interested” persons of the Fund. Each director serves as a director for The Hartford Mutual Funds, Inc., The Hartford Mutual Funds II, Inc., Hartford Series Fund, Inc., and Hartford HLS Series Fund II, Inc., which, as of June 30, 2011, collectively consist of 89 funds. Correspondence may be sent to directors and officers c/o Hartford Mutual Funds, P.O. Box 2999, Hartford, Connecticut 06104-2999, except that correspondence to Ms. Fagely may be sent to 500 Bielenberg Drive, Woodbury, Minnesota 55125.
The table below sets forth, for each director and officer, his or her name, year of birth, current position with the Company and date first elected or appointed to Hartford Series Fund, Inc. (“HSF”), and Hartford HLS Series Fund II, Inc. (“HSF2”), principal occupation, and, for directors, other directorships held. The Fund’s statement of additional information contains further information on the directors and is available free of charge by calling 1-800-862-6668 or writing to Hartford HLS Funds, c/o Individual Annuity Services, P.O. Box 5085, Hartford, CT 06102-5085.
Information on the aggregate remuneration paid to the directors of the Company can be found in the Statement of Operations herein. The Fund pays to The Hartford a portion of the chief compliance officer’s compensation, but does not pay salaries or compensation to any of their other officers or directors who are employed by The Hartford.
Non-Interested Directors
Lynn S. Birdsong (1946) Director since 2003, Co-Chairman of the Investment Committee
Mr. Birdsong is a private investor. Mr. Birdsong currently serves as a Director of the Sovereign High Yield Investment Company (April 2010 to current). Mr. Birdsong currently serves as an Independent Director of Nomura Partners Funds, Inc. (formerly, The Japan Fund) (March 2003 to current). From 2003 to March 2005, Mr. Birdsong was an independent director of the Atlantic Whitehall Funds. From 1979 to 2002, Mr. Birdsong was a managing director of Zurich Scudder Investments, an investment management firm. During his employment with Scudder, Mr. Birdsong was an Interested Director of The Japan Fund. Since 1981, Mr. Birdsong has been a partner in Birdsong Company, an advertising specialty firm.
Robert M. Gavin, Jr. (1940) Director since 2002 (HSF) and 1986 (HSF2), Chairman of the Board since 2004
Dr. Gavin is an educational consultant. Prior to September 1, 2001, he was President of Cranbrook Education Community and prior to July 1996, he was President of Macalester College, St. Paul, Minnesota.
Duane E. Hill (1945) Director since 2001 (HSF) and 2002 (HSF2), Chairman of the Nominating Committee
Mr. Hill is Partner of TSG Ventures L.P., a private equity investment company. Mr. Hill is a former partner of TSG Capital Group, a private equity investment firm that served as sponsor and lead investor in leveraged buyouts of middle market companies.
Sandra S. Jaffee (1941) Director since 2005
Ms. Jaffee served as Chairman (2008 to 2009) and Chief Executive Officer of Fortent (formerly Searchspace Group), a leading provider of compliance/regulatory technology to financial institutions from August 2005 to August 2009. From August 2004 to August 2005, Ms. Jaffee served as an Entrepreneur in Residence with Warburg Pincus, a private equity firm. From September 1995 to July 2004, Ms. Jaffee served as Executive Vice President at Citigroup, where she was President and Chief Executive Officer of Citibank’s Global Securities Services (1995 to 2003). Ms. Jaffe currently serves as a member of the Board of Directors of Broadridge Financial Solutions as well as a Trustee of Muhlenberg College.
William P. Johnston (1944) Director since 2005, Chairman of the Compliance Committee
In June 2006, Mr. Johnston was appointed as Senior Advisor to The Carlyle Group, a global private equity investment firm. In July 2006, Mr. Johnston was elected to the Board of Directors of MultiPlan, Inc. In August 2007, Mr. Johnston was elected to the Board of Directors of LifeCare Holdings, Inc. In February 2008, Mr. Johnston was elected to the Board of Directors of HCR-ManorCare, Inc. In May 2006, Mr. Johnston was elected to the Supervisory Board of Fresenius Medical Care AG & Co. KGaA, after its acquisition of Renal Care Group, Inc. in March 2006. Mr. Johnston joined Renal Care Group in November 2002 as a member of the Board of Directors and served as Chairman of the Board from March 2003 through March 2006. From September 1987 to December 2002, Mr. Johnston was with Equitable Securities Corporation (and its successors, SunTrust Equitable Securities and SunTrust Robinson Humphrey) serving in various investment banking and managerial positions, including Managing Director and Head of Investment Banking, Chief Executive Officer and Vice Chairman.
Phillip O. Peterson (1944) Director since 2002 (HSF) and 2000 (HSF2), Chairman of the Audit Committee
Mr. Peterson is a mutual fund industry consultant. He was a partner of KPMG LLP (an accounting firm) until July 1999. Mr. Peterson joined William Blair Funds in February 2007 as a member of the Board of Trustees. From January 2004 to April 2005, Mr. Peterson served as Independent President of the Strong Mutual Funds.
Lemma W. Senbet (1946) Director since 2005
Dr. Senbet is the William E. Mayer Chair Professor of Finance and Director, Center for Financial Policy, at the University of Maryland, Robert H. Smith School of Business. He was chair of the Finance Department from 1998 to 2006. Previously he was a chaired professor of finance at the University of Wisconsin-Madison. Also, he was director of the Fortis Funds from March 2000 to July 2002. Dr. Senbet served the finance profession in various capacities, including as director of the American Finance Association and President of the Western Finance Association. In 2006, Dr. Senbet was inducted Fellow of Financial Management Association International for his career-long distinguished scholarship and professional service.
Interested Directors and Officers
David N. Levenson (1966) Director since 2010
Mr. Levenson currently serves as President of The Hartford’s Wealth Management business. He was appointed to this role in July 2010. Previously, Mr. Levenson served as Executive Vice President of Legacy Holdings for The Hartford from June 2009 to July 2010. From 2006 to 2009, Mr. Levenson was with Hartford Life Insurance K.K. where he served as President and CEO from 2007 to 2009. He served as Managing Director of Hartford Investment Management Company from 2005 to 2006. Additionally, Mr. Levenson serves as Executive Vice President of The Hartford and as President, Director and Chief Executive Officer of Hartford Life Insurance Company (“HLIC”) and Hartford Life, Inc. (“HL Inc.”).
Lowndes A. Smith (1939) Director since 1996 (HSF) and 2002 (HSF2), Co-Chairman of the Investment Committee
Mr. Smith served as Vice Chairman of The Hartford from February 1997 to January 2002, as President and Chief Executive Officer of HL Inc. from February 1997 to January 2002, and as President and Chief Operating Officer of The Hartford Life Insurance Companies from January 1989 to January 2002. Mr. Smith serves as a Director of White Mountains Insurance Group, Ltd., One Beacon Insurance and Symetra Financial and as a Managing Director of Whittington Gray Associates.
Other Officers
James E. Davey (1964) President and Chief Executive Officer since 2010
Mr. Davey serves as Executive Vice President of HLIC. Additionally, Mr. Davey serves as President, Chief Executive Officer and Manager of Hartford Investment Financial Services, Inc. (“HIFSCO”) and President, Chief Executive Officer and Manager of HL Advisors. Mr. Davey joined The Hartford in 2002.
Tamara L. Fagely (1958) Vice President, Treasurer and Controller since 2002 (HSF) and 1993 (HSF2)
Ms. Fagely has been a Vice President of HASCO since 1998 and Chief Financial Officer since 2006. Currently Ms. Fagely is a Vice President of HLIC. She served as Assistant Vice President of HLIC from December 2001 through March 2005. In addition, Ms. Fagely is Controller and Chief Financial Officer of HIFSCO.
Susan M. Fleege (1959) AML Compliance Officer since 2011
Ms. Fleege currently serves as a Director of Risk Management at The Hartford. She previously served as AML Compliance Officer for the Fund from 2005-2008. Ms. Fleege joined HLIC in 2005 from Amerprise Financial Corporation where she held the position of Counsel from 2000 to 2005. Ms. Fleege is a certified Anti-Money Laundering Specialist.
Dr. Robert J. Froehlich (1953) Senior Managing Director since 2009
Dr. Froehlich joined The Hartford as Senior Managing Director in September 2009. Prior to joining The Hartford, Dr. Froehlich served as Vice Chairman of Deutsche Asset Management from 1997-2009.
Edward P. Macdonald (1967) Vice President, Secretary and Chief Legal Officer since 2005
Mr. Macdonald serves as Vice President of HLIC and Chief Legal Officer of Mutual Funds and Vice President of HIFSCO. He also serves as Vice President and Secretary of HASCO, and Chief Legal Officer, Secretary and Vice President of HL Advisors. Mr. Macdonald joined The Hartford in 2005.
| Hartford Global Growth HLS Fund |
| Directors and Officers (Unaudited) – (continued) |
Vernon J. Meyer (1964) Vice President since 2006
Mr. Meyer serves as Senior Vice President of HLIC. He also serves as Senior Vice President of HIFSCO and HL Advisors. Mr. Meyer joined The Hartford in 2004.
Colleen B. Pernerewski (1969) Vice President and Chief Compliance Officer since 2010
Ms. Pernerewski serves as Vice President and Chief Investment Advisor Compliance Officer of HIFSCO and as Vice President and Chief Compliance Officer of HL Advisors. Ms. Pernerewski joined The Hartford in 2005 from Travelers Life and Annuity where she served as Counsel (2004-2005). Prior to Travelers Life and Annuity, Ms. Pernerewski held the position of Counsel at The Hartford (1998-2004).
Elizabeth L. Schroeder (1966) Vice President since 2010
Ms. Schroeder currently serves as Assistant Vice President of HLIC. Ms. Schroeder joined HLIC in 1991. She is also an Assistant Vice President of HIFSCO and HL Advisers.
Martin Swanson (1962) Vice President since 2010
Mr. Swanson is a Vice President of HLIC. Mr. Swanson also serves as Vice President/Marketing for HIFSCO. Prior to joining HLIC in 1998, Mr. Swanson was a Vice President at PaineWebber, Inc.
Jane Wolak (1961) Vice President since 2009
Ms. Wolak currently serves as Senior Vice President of HLIC. Ms. Wolak joined HLIC as Vice President, Retail Product Services in May 2007. She is also Vice President of HASCO. Previously, Ms. Wolak was with Sun Life Financial where she held the position of Vice President, Service Center Operations from 2001-2007.
A description of the policies and procedures that the Fund uses to determine how to vote proxies relating to portfolio securities and a record of how the Fund voted any proxies for the twelve-month period ended June 30, 2011 are available (1) without charge, upon request, by calling 800-862-6668 and (2) on the SEC’s website at http://www.sec.gov.
The Fund files a complete schedule of portfolio holdings with the SEC for the first and third quarters of each fiscal year on Form N-Q. The Fund’s Forms are available (1) without charge, upon request, by calling 800-862-6668 and (2) on the SEC’s website at http://www.sec.gov. The Form N-Q may be reviewed and copied at the SEC’s Public Reference Room in Washington, DC. Information on the operation of the Public Reference Room may be obtained by calling 1-800-SEC-0330.
| Hartford Global Growth HLS Fund |
Your Fund's Expenses
As a shareholder of the Fund, you incur two types of costs: (1) transaction costs and (2) ongoing costs including investment management fees, distribution fees, and other fund expenses. This example is intended to help you understand your ongoing costs (in dollars) of investing in a Fund and to compare these costs with the ongoing costs of investing in other mutual funds. The example is based on an investment of $1,000 invested at the beginning of the period and held for the period of December 31, 2010 through June 30, 2011.
Actual Expenses
The first set of columns of the table below provides information about actual account values and actual expenses. You may use the information in this column, together with the amount you invested, to estimate the expenses that you paid over the period. Simply divide your account value by $1,000 (for example, an $8,600 account value divided by $1,000 = 8.6), then multiply the result by the number in the line under the heading entitled “Expenses Paid During Period” to estimate the expenses you paid on your account during this period.
Hypothetical Example for Comparison Purposes
The second set of columns of the table below provides information about hypothetical account values and hypothetical expenses based on a Fund's actual expense ratio and an assumed rate of return of 5% per year before expenses, which is not the Fund's actual return. The hypothetical account values and expenses may not be used to estimate the actual ending account balance or expenses you paid for the period. You may use this information to compare the ongoing costs of investing in a Fund and other funds. To do so, compare this 5% hypothetical example with the 5% hypothetical examples that appear in the shareholder reports of the other funds.
Please note that the expenses shown in the table are meant to highlight your ongoing costs only and do not reflect any transactional costs, such as sales charges (loads) and CDSC. Therefore, the second set of columns of the table is useful in comparing ongoing costs only, and will not help you determine the relative total costs of owning different funds. In addition, if these transactional costs were included, your costs would be higher. Expenses are equal to the Fund's annualized expense ratios multiplied by average account value over the period, multiplied by 181/365 (to reflect the one-half year period).
| Actual return | Hypothetical (5% return before expenses) | |||||||||||||||||||||||||||||||||||
| Expenses paid | Expenses paid | Days in | ||||||||||||||||||||||||||||||||||
| during the period | during the period | the | Days | |||||||||||||||||||||||||||||||||
| Beginning | Ending | December 31, 2010 | Beginning | Ending | December 31, 2010 | Annualized | current | in the | ||||||||||||||||||||||||||||
| Account Value | Account Value | through | Account Value | Account Value | through | expense | 1/2 | full | ||||||||||||||||||||||||||||
| December 31, 2010 | June 30, 2011 | June 30, 2011 | December 31, 2010 | June 30, 2011 | June 30, 2011 | ratio | year | year | ||||||||||||||||||||||||||||
| Class IA | $ | 1,000.00 | $ | 1,039.54 | $ | 4.05 | $ | 1,000.00 | $ | 1,020.83 | $ | 4.01 | 0.80 | % | 181 | 365 | ||||||||||||||||||||
| Class IB | $ | 1,000.00 | $ | 1,038.25 | $ | 5.31 | $ | 1,000.00 | $ | 1,019.59 | $ | 5.26 | 1.05 | % | 181 | 365 | ||||||||||||||||||||
27
The Hartford P.O. Box 5085 Hartford, CT 06102-5085 |
Hartford Series Fund, Inc. is underwritten and distributed by Hartford Securities Distribution Company, Inc.
"The Hartford" is The Hartford Financial Services Group, Inc. and its subsidiaries.
Hartford Series Fund, Inc. inception dates range from 1977 to date. Hartford Series Fund, Inc. is not a subsidiary of The Hartford but is underwritten, distributed by and advised by subsidiaries of The Hartford. Investments in Hartford Series Fund, Inc. are not guaranteed by The Hartford or any other entity.
You should carefully consider investment objectives, risks, and charges and expenses of Hartford HLS Funds before investing. This and other information can be found in the Fund’s prospectus or summary prospectus, which can be obtained by calling 800-862-6668. Please read them carefully before you invest or send money.
| HLSSAR-GG11 8-11 106632 Printed in U.S.A ©2011 The Hartford, Hartford, CT 06115 |

A MESSAGE FROM THE PRESIDENT

Dear Fellow Shareholders:
I want to take this opportunity to say thank you for your continued confidence and trust.
We have seen a significant amount of global turbulence in the first half of 2011. Investors have continued to be concerned about the implications of the European sovereign debt crisis, as well as our own high levels of domestic debt. Since January we have witnessed significant political uprisings in the already-volatile Middle East and North Africa region. In addition, the ramifications of Japan's massive earthquake, subsequent tsunami, and nuclear disaster are still being played out in the market.
Although corporate earnings have remained robust, the unemployment picture has been mixed. After adding more than 200,000 jobs from February to April, more recent unemployment reports have shown a pullback in hiring.
While official inflation remains low as measured by the Consumer Price Index (CPI), high oil prices may be indicative of higher inflation in the future. The federal funds rate remains at a historic low, however, the Fed could potentially raise the rate to get it closer to its historical average once the economy strengthens.
Even with these headwinds, domestic, international, and world indices (as measured by the S&P 500, MSCI EAFE and MSCI World) are all up more than 5% through June, 30 2011.
Looking ahead, continued growth in emerging markets is fueling global recovery efforts. Emerging markets comprise about 48 percent of the world’s GDP, and many economists believe they are poised for further expansion. As GDP growth continues in emerging markets, roughly 100 million people are added to the middle class each year. This middle class population growth could potentially drive a considerable shift in consumer purchasing power.
Now that we have reached the midpoint of 2011, perhaps now would be a good time to schedule a meeting with your financial adviser to examine your current investment strategy and determine whether you are on the right track.
| • | Are you concerned about inflation and its effects on your portfolio? |
| • | Is your portfolio prepared for rising interest rates? |
| • | Does your portfolio reflect the global economy with a mix of developed nations and emerging markets? |
Your financial professional’s advice can help you to navigate today’s volatile markets with confidence. You can also rest assured that we will continue to provide you with solid investments and stellar service for the road ahead.
Thank you again for your business.

James Davey
President
Hartford HLS Funds
(formerly Hartford Global Health HLS Fund)
Table of Contents
| Manager Discussion (Unaudited) | 2 |
| Financial Statements | |
| 5 | |
| 7 | |
| 8 | |
| 9 | |
| 10 | |
| 11 | |
| 22 | |
| 24 | |
| 26 | |
| 26 | |
| 27 |
This report is prepared for the general information of contract owners and qualified retirement plan participants. It is not an offer of contracts or of qualified retirement plans. It should not be used in connection with any offer, except in conjunction with the appropriate product prospectus which contains all pertinent information including the applicable sales, administrative and other charges.
The views expressed in the Fund’s Manager Discussion under ‘‘Why did the Fund perform this way?’’ and ‘‘What is the outlook?’’ are views of the Fund’s sub-adviser and portfolio management team through the end of the reporting period and are subject to change based on market and other conditions.
Hartford Healthcare HLS Fund inception 05/01/2000 |
| (formerly Hartford Global Health HLS Fund) |
| (sub-advised by Wellington Management Company, LLP) |
Investment objective – Seeks long-term capital appreciation. |
Performance Overview 6/30/01 - 6/30/11

The chart above shows the growth of a $10,000 investment in Class IA. Growth results in classes other than Class IA will vary from what is seen above due to differences in the expenses charged to those share classes.
Average Annual Total Returns (as of 6/30/11)
6 Month† | 1 Year | 5 year | 10 year | |
| Healthcare IA | 18.39% | 35.28% | 6.23% | 7.06% |
| Healthcare IB | 18.25% | 34.94% | 5.96% | 6.80% |
| S&P 500 Index | 6.01% | 30.68% | 2.94% | 2.72% |
| S&P North American Health Care Sector Index | 15.03% | 30.94% | 6.31% | 4.50% |
| † | Not Annualized |
PAST PERFORMANCE IS NOT INDICATIVE OF FUTURE RESULTS.
Total returns presented above were calculated using the Fund's net asset value available to shareholders for sale or redemption of Fund shares on June 30, 2011, which excludes investment transactions as of this date.
S&P 500 Index is a market capitalization-weighted price index composed of 500 widely held common stocks.
S&P North American Health Care Sector Index is a modified capitalization-weighted index based on United States headquartered health care companies. Stocks in the index are weighted such that each stock is no more than 7.5% of the market capitalization as of the most recent reconstitution date. The companies included in the index must be common stocks and be traded on the American Stock Exchange, Nasdaq or the New York Stock Exchange and meet certain established market capitalization levels.
You cannot invest directly in an index.
The chart represents a hypothetical investment in the Fund. Performance data represents past performance and current performance could be higher or lower.
Performance information may reflect historical or current expense waivers/reimbursements from the investment adviser, without which performance would have been lower. For information on current expense waivers/reimbursements, please see the prospectus.
The value of the fund will fluctuate so that when redeemed, it may be worth more or less than the original investment. The chart and table do not reflect the deductions of taxes, sales charges or other fees which may be applied at the variable life insurance, variable annuity or qualified retirement plan product level. Any such additional sales charges or other fees or expenses would lower the contract’s or plan’s performance.
| Portfolio Managers | |||
| Ann C. Gallo | Jean M. Hynes, CFA | Robert L. Deresiewicz | Kirk J. Mayer, CFA |
| Senior Vice President, | Senior Vice President, | Senior Vice President, | Senior Vice President, |
| Global Industry Analyst | Global Industry Analyst | Global Industry Analyst | Global Industry Analyst |
How did the Fund perform?
The Class IA shares of the Hartford Healthcare HLS Fund returned 18.39% for the six-month period ended June 30, 2011, outperforming its benchmark, the S&P North American Health Care Sector Index, which returned 15.03% for the same period. The Fund also outperformed the 14.71% return of the average fund in the Lipper Health and Biotechnology Funds VP-UF peer group, a group of funds with investment strategies similar to those of the Fund.
Why did the Fund perform this way?
U.S. Health Care stocks underperformed the market in 2009 and 2010 as we began the rollout of the Patient Protection and Affordable Care Act (PPACA), which created significant uncertainty, making it difficult for the market to analyze the industry’s prospects for growth and profitability. However, following Congressional election wins by Republicans in November 2010, President Obama’s administration adopted a more centrist policy, and since then many modifications have been made to the PPACA that have been favorable to the industry. These changes provided a tailwind for health care stocks towards the end of 2010 and into 2011.
Health Care stocks (+15%) outperformed both the broader U.S. market (+6%) and the global equity market (+6%) during the period, as measured by the S&P North American Health Care Sector, S&P 500, and the MSCI World Indices, respectively. Within the S&P North American Health Care Sector Index, all four sub-sectors posted positive returns. Health Services (+21%) and Specialty Pharmaceuticals/Biotechnology (+19%) gained the most while Major Pharmaceuticals (+10%) and Medical Technology (+12%) lagged the other sub-sectors.
Strong stock selection in Health Services, Specialty Pharmaceuticals/Biotechnology, and Medical Technology was the primary driver of the Fund’s benchmark-relative (i.e. performance of the Fund as measured against the benchmark) outperformance, more than offsetting weaker security selection in Major Pharmaceuticals. Sub-sector allocation, a fallout of our bottom-up (i.e. stock by stock fundamental research) stock selection process, contributed modestly to relative performance.
Holdings of Elan (Specialty Pharmaceuticals/Biotechnology), Abiomed (Medical Technology), and UnitedHealth Group (Health Services) were the top contributors to benchmark-relative performance during the period. Continued excitement over Elan's tysabri, a drug for the treatment of Multiple Sclerosis and Crohn's disease, and bapineuzumab, a treatment for Alzheimers currently in phase 3 trials, helped drive the stock higher. In addition, the sale of the company’s drug delivery unit to Alkermes, which will allow the company to pay down debt, was viewed favorably by investors. Abiomed, a provider of medical devices for circulatory support and a continuum of care in heart recovery to acute heart failure patients, announced strong quarterly earnings and increased its full year earnings estimates. Shares of Health Care benefits and services provider UnitedHealth Group rose as the company reported strong first quarter earnings, beating analysts' estimates, driven in part by reduced use of services by its members. In addition, investors looked favorably on the increase in enrollments as a potential sign of growth going forward, pushing the stock higher. Top contributors to absolute performance (i.e. total return) also included McKesson (Health Services).
Holdings of Shionogi (Specialty Pharmaceuticals/Biotechnology), Teva Pharmaceutical Industries (Specialty Pharmaceuticals/ Biotechnology), and Biogen (Specialty Pharmaceuticals /Biotechnology) detracted from benchmark-relative performance. Japan-based Shionogi’s shares declined after the earthquake and tsunami in Japan. Additionally, shares continued to fall during the period as the company revised guidance for fiscal year 2011 down for the third time. Poor performance in the company's U.S. business segment continues to weigh on the shares. Shares of Teva Pharmaceutical Industries fell as the company missed earnings for the fourth quarter and lowered 2011 guidance. The miss was driven largely by two plant shutdowns due to production quality issues. Shares of Biogen, a global biotechnology company, gained on strong operating results and positive developments in their drug pipeline. Not owning this stock detracted from benchmark-relative returns. Top detractors from absolute performance also included SIGA Technologies (Specialty Pharmaceuticals/Biotechnology).
What is the outlook?
Health care stocks have outperformed the broader market year-to-date as many modifications have been made to the Patient Protection and Affordable Care Act (PPACA) which have been favorable to the industry, with President Obama’s administration adopting a more centrist policy. We continue to expect additional dilutions to the plan and delays in
implementation which, along with a stabilization in the decline of commercial health insurance numbers, should be positive for the sector. These benefits will likely be somewhat offset by increased pressure on reimbursement rates from Medicare and Medicaid, as the government seeks to reign in spending and reduce the deficit.
While the passage of the PPACA will have an impact on the health care industry in the United States, the bill fails to address the major problem within the industry – rising costs. We expect that some of the proposals to address this issue made by the bi-partisan panel appointed by President Obama will find their way into modifications made to the legislation. While we are confident with the Fund’s positioning, we will continue to closely monitor industry developments and make adjustments to the Fund as needed.
Against this backdrop, the Fund ended the period most overweight (i.e. the Fund’s sector position was greater than the benchmark position) the Specialty Pharmaceuticals/Biotechnology sub-sector and most underweight (i.e. the Fund’s sector position was less than the benchmark position) the Major Pharmaceuticals sub-sector relative to the benchmark.
Diversification by Industry
as of June 30, 2011
| Percentage of | ||||
| Industry | Net Assets | |||
| Biotechnology | 18.4 | % | ||
| Drug Retail | 2.9 | |||
| Health Care Distributors | 11.6 | |||
| Health Care Equipment | 17.5 | |||
| Health Care Facilities | 0.9 | |||
| Health Care Technology | 0.3 | |||
| Life Sciences Tools & Services | 6.1 | |||
| Managed Health Care | 12.0 | |||
| Pharmaceuticals | 30.1 | |||
| Short-Term Investments | 0.2 | |||
| Other Assets and Liabilities | – | |||
| Total | 100.0 | % | ||
Diversification by Country
as of June 30, 2011
| Percentage of | ||||
| Country | Net Assets | |||
| Belgium | 1.0 | % | ||
| China | 1.3 | |||
| Denmark | 0.3 | |||
| Hong Kong | 0.5 | |||
| India | 0.4 | |||
| Ireland | 2.9 | |||
| Israel | 2.9 | |||
| Italy | 0.5 | |||
| Japan | 5.6 | |||
| Netherlands | 1.0 | |||
| Spain | 0.3 | |||
| United Kingdom | 0.7 | |||
| United States | 82.4 | |||
| Short-Term Investments | 0.2 | |||
| Other Assets and Liabilities | – | |||
| Total | 100.0 | % | ||
Schedule of Investments June 30, 2011 (Unaudited) |
(000’s Omitted) |
| Shares or Principal Amount | Market Value ╪ | |||||
| COMMON STOCKS - 99.8% | ||||||
| Biotechnology - 18.4% | ||||||
| 109 | 3SBio, Inc. ADR ● | $ | 1,898 | |||
| 147 | Achillion Pharmaceuticals, Inc. ● | 1,097 | ||||
| 36 | Acorda Therapeutics, Inc. ● | 1,157 | ||||
| 108 | Alkermes, Inc. ● | 2,015 | ||||
| 33 | Amgen, Inc. ● | 1,943 | ||||
| 179 | Amylin Pharmaceuticals, Inc. ● | 2,390 | ||||
| 63 | Ardea Biosciences, Inc. ● | 1,614 | ||||
| 92 | Arena Pharmaceuticals, Inc. ● | 125 | ||||
| 78 | Celgene Corp. ● | 4,705 | ||||
| 9 | Cephalon, Inc. ● | 751 | ||||
| 230 | Exelixis, Inc. ● | 2,063 | ||||
| 95 | Immunogen, Inc. ● | 1,158 | ||||
| 159 | Incyte Corp. ● | 3,018 | ||||
| 113 | Inhibitex, Inc. ● | 445 | ||||
| 31 | Ironwood Pharmaceuticals, Inc. ● | 484 | ||||
| 45 | Onyx Pharmaceuticals, Inc. ● | 1,599 | ||||
| 13 | Pharmasset, Inc. ● | 1,472 | ||||
| 235 | PharmAthene, Inc. ● | 691 | ||||
| 74 | Progenics Pharmaceuticals, Inc. ● | 533 | ||||
| 63 | Regeneron Pharmaceuticals, Inc. ● | 3,595 | ||||
| 84 | Rigel Pharmaceuticals, Inc. ● | 771 | ||||
| 195 | Seattle Genetics, Inc. ● | 4,010 | ||||
| 96 | Siga Technologies, Inc. ● | 940 | ||||
| 15 | Targacept, Inc. ● | 316 | ||||
| 71 | Trius Therapeutics, Inc. ● | 560 | ||||
| 21 | Vertex Pharmaceuticals, Inc. ● | 1,076 | ||||
| 40,426 | ||||||
| Drug Retail - 2.9% | ||||||
| 172 | CVS/Caremark Corp. | 6,455 | ||||
| Health Care Distributors - 11.6% | ||||||
| 110 | Amerisource Bergen Corp. | 4,533 | ||||
| 204 | Cardinal Health, Inc. | 9,266 | ||||
| 141 | McKesson Corp. | 11,803 | ||||
| 25,602 | ||||||
| Health Care Equipment - 17.5% | ||||||
| 197 | Abiomed, Inc. ● | 3,187 | ||||
| 133 | China Medical Technologies, Inc. ADR ● | 1,027 | ||||
| 115 | Covidien plc | 6,106 | ||||
| 36 | Dexcom, Inc. ● | 520 | ||||
| 20 | DiaSorin S.p.A. | 974 | ||||
| 36 | Heartware International, Inc. ● | 2,689 | ||||
| 72 | Hologic, Inc. ● | 1,460 | ||||
| 181 | Medtronic, Inc. | 6,966 | ||||
| 106 | St. Jude Medical, Inc. | 5,064 | ||||
| 130 | Stereotaxis, Inc. ● | 456 | ||||
| 81 | Tornier N.V. ● | 2,194 | ||||
| 2,594 | Trauson Holdings Co., Ltd. | 1,037 | ||||
| 145 | Volcano Corp. ● | 4,672 | ||||
| 32 | Zimmer Holdings, Inc. ● | 2,041 | ||||
| 38,393 | ||||||
| Health Care Facilities - 0.9% | ||||||
| 29 | HCA Holdings, Inc. ● | 954 | ||||
| 60 | Vanguard Health Systems, Inc. ● | 1,028 | ||||
| 1,982 | ||||||
| Health Care Technology - 0.3% | ||||||
| 32 | Allscripts Healthcare Solutions, Inc. ● | 627 | ||||
| Life Sciences Tools & Services - 6.1% | ||||||
| 62 | Agilent Technologies, Inc. ● | 3,184 | ||||
| 51 | Life Technologies Corp. ● | 2,676 | ||||
| 87 | PAREXEL International Corp. ● | 2,059 | ||||
| 8 | PerkinElmer, Inc. | 226 | ||||
| 81 | Thermo Fisher Scientific, Inc. ● | 5,216 | ||||
| 13,361 | ||||||
| Managed Health Care - 12.0% | ||||||
| 95 | Aetna, Inc. | 4,207 | ||||
| 92 | CIGNA Corp. | 4,737 | ||||
| 229 | UnitedHealth Group, Inc. | 11,823 | ||||
| 62 | Wellcare Health Plans, Inc. ● | 3,203 | ||||
| 32 | Wellpoint, Inc. | 2,529 | ||||
| 26,499 | ||||||
| Pharmaceuticals - 30.1% | ||||||
| 10 | Alk-Abello A/S | 636 | ||||
| 62 | Almirall S.A. | 660 | ||||
| 32 | AstraZeneca plc ADR | 1,577 | ||||
| 48 | Auxilium Pharmaceuticals, Inc. ● | 949 | ||||
| 135 | Bristol-Myers Squibb Co. | 3,918 | ||||
| 188 | Daiichi Sankyo Co., Ltd. | 3,674 | ||||
| 28 | Dr. Reddy's Laboratories Ltd. ADR | 965 | ||||
| 89 | Eisai Co., Ltd. | 3,457 | ||||
| 560 | Elan Corp. plc ADR ● | 6,364 | ||||
| 37 | Eli Lilly & Co. | 1,374 | ||||
| 190 | Forest Laboratories, Inc. ● | 7,463 | ||||
| 164 | Medicines Co. ● | 2,714 | ||||
| 196 | Merck & Co., Inc. | 6,899 | ||||
| 79 | Mylan, Inc. ● | 1,951 | ||||
| 10 | Ono Pharmaceutical Co., Ltd. | 535 | ||||
| 75 | Optimer Pharmaceuticals, Inc. ● | 890 | ||||
| 224 | Pfizer, Inc. | 4,604 | ||||
| 282 | Shionogi & Co., Ltd. | 4,615 | ||||
| 27 | Simcere Pharmaceutical Group ● | 266 | ||||
| 132 | Teva Pharmaceutical Industries Ltd. ADR | 6,374 | ||||
| 49 | UCB S.A. | 2,209 | ||||
| 53 | Watson Pharmaceuticals, Inc. ● | 3,670 | ||||
| 75 | Xenoport, Inc. ● | 530 | ||||
| 66,294 | ||||||
| Total common stocks | ||||||
| (cost $179,443) | $ | 219,639 | ||||
| Total long-term investments | ||||||
| (cost $179,443) | $ | 219,639 | ||||
The accompanying notes are an integral part of these financial statements.
Hartford Healthcare HLS Fund (formerly Hartford Global Health HLS Fund) |
Schedule of Investments – (continued) June 30, 2011 (Unaudited) |
(000’s Omitted) |
| Shares or Principal Amount | Market Value ╪ | ||||||||||
| SHORT-TERM INVESTMENTS - 0.2% | |||||||||||
| Repurchase Agreements - 0.2% | |||||||||||
| Bank of America Merrill Lynch TriParty Joint | |||||||||||
| Repurchase Agreement (maturing on | |||||||||||
| 07/01/2011 in the amount of $41, | |||||||||||
| collateralized by FHLB 4.91%, 2015, | |||||||||||
| GNMA 0.87% - 5.72%, 2025 - 2061, value | |||||||||||
| of $42) | |||||||||||
| $ | 41 | 0.05%, 06/30/2011 | $ | 41 | |||||||
| BNP Paribas Securities Corp. TriParty Joint | |||||||||||
| Repurchase Agreement (maturing on | |||||||||||
| 07/01/2011 in the amount of $31, | |||||||||||
| collateralized by FNMA 3.50% - 6.50%, | |||||||||||
| 2023 - 2041, value of $32) | |||||||||||
| 31 | 0.05%, 06/30/2011 | 31 | |||||||||
| Deutsche Bank Securities TriParty Joint | |||||||||||
| Repurchase Agreement (maturing on | |||||||||||
| 07/01/2011 in the amount of $302, | |||||||||||
| collateralized by GNMA 4.00% - 7.00%, | |||||||||||
| 2035 - 2040, value of $308) | |||||||||||
| 302 | 0.05%, 06/30/2011 | 302 | |||||||||
| UBS Securities, Inc. Joint Repurchase | |||||||||||
| Agreement (maturing on 07/01/2011 in the | |||||||||||
| amount of $1, collateralized by U.S. | |||||||||||
| Treasury Bill 0.63%, 2012, value of $1) | |||||||||||
| 1 | 0.01%, 06/30/2011 | 1 | |||||||||
| UBS Securities, Inc. TriParty Joint Repurchase | |||||||||||
| Agreement (maturing on 07/01/2011 in the | |||||||||||
| amount of $46, collateralized by FHLMC | |||||||||||
| 4.50%, 2040, FNMA 4.50% - 6.00%, 2035 - | |||||||||||
2041, value of $47) | |||||||||||
| 46 | 0.06%, 06/30/2011 | 46 | |||||||||
| 421 | |||||||||||
| Total short-term investments | |||||||||||
| (cost $421) | $ | 421 | |||||||||
| Total investments | |||||||||||
(cost $179,864) ▲ | 100.0 | % | $ | 220,060 | |||||||
| Other assets and liabilities | – | % | 38 | ||||||||
| Total net assets | 100.0 | % | $ | 220,098 | |||||||
| Note: | Percentage of investments as shown is the ratio of the total market value to total net assets. Market value of investments in foreign securities represents 17.4% of total net assets at June 30, 2011. |
Prices of foreign equities that are principally traded on certain foreign markets may be adjusted daily pursuant to a fair value pricing service approved by the Board of Directors in order to reflect an adjustment for factors occurring after the close of certain foreign markets but before the close of the New York Stock Exchange.
| ▲ | At June 30, 2011, the cost of securities for federal income tax purposes was $182,140 and the aggregate gross unrealized appreciation and depreciation based on that cost were: |
| Unrealized Appreciation | $ | 48,614 | ||
| Unrealized Depreciation | (10,694 | ) | ||
| Net Unrealized Appreciation | $ | 37,920 |
| ● | Currently non-income producing. |
Foreign Currency Contracts Outstanding at June 30, 2011
| Description | Counterparty | Buy / Sell | Market Value ╪ | Contract Amount | Delivery Date | Unrealized Appreciation/ | |||||||||||
| Japanese Yen | JP Morgan Securities | Sell | $ | 5,706 | $ | 5,631 | 08/05/2011 | $ | (75 | ) | |||||||
| $ | (75 | ) | |||||||||||||||
| ╪ | See Significant Accounting Policies of accompanying Notes to Financial Statements regarding valuation of securities. |
Investment Valuation Hierarchy Level Summary June 30, 2011 (Unaudited) |
(000’s Omitted) |
| Total | Level 1 ♦ | Level 2 ♦ | Level 3 | |||||||||||||
| Assets: | ||||||||||||||||
Common Stocks ‡ | $ | 219,639 | $ | 201,842 | $ | 17,797 | $ | – | ||||||||
| Short-Term Investments | 421 | – | 421 | – | ||||||||||||
| Total | $ | 220,060 | $ | 201,842 | $ | 18,218 | $ | – | ||||||||
| Liabilities: | ||||||||||||||||
| Foreign Currency Contracts * | 75 | – | 75 | – | ||||||||||||
| Total | $ | 75 | $ | – | $ | 75 | $ | – | ||||||||
| ♦ | For the six-month period ended June 30, 2011, there were no significant transfers between Level 1 and Level 2. |
| ‡ | The Fund has all or primarily all of the equity securities categorized in a particular level. Refer to the Schedule of Investments for further industry breakout. |
| * | Derivative instruments not reflected in the Schedule of Investments are valued at the unrealized appreciation/depreciation on the investments. |
The accompanying notes are an integral part of these financial statements.
Statement of Assets and Liabilities June 30, 2011 (Unaudited) |
(000’s Omitted) |
| Assets: | ||||
| Investments in securities, at market value (cost $179,864) | $ | 220,060 | ||
| Cash | — | |||
| Receivables: | ||||
| Fund shares sold | 286 | |||
| Dividends and interest | 240 | |||
| Total assets | 220,586 | |||
| Liabilities: | ||||
| Unrealized depreciation on foreign currency contracts | 75 | |||
| Payables: | ||||
| Investment securities purchased | 28 | |||
| Fund shares redeemed | 326 | |||
| Investment management fees | 31 | |||
| Distribution fees | 3 | |||
| Accrued expenses | 25 | |||
| Total liabilities | 488 | |||
| Net assets | $ | 220,098 | ||
| Summary of Net Assets: | ||||
| Capital stock and paid-in-capital | $ | 197,715 | ||
| Accumulated undistributed net investment income | 1,112 | |||
| Accumulated net realized loss on investments and foreign currency transactions | (18,853 | ) | ||
| Unrealized appreciation of investments and the translations of assets and liabilities denominated in foreign currency | 40,124 | |||
| Net assets | $ | 220,098 | ||
| Shares authorized | 800,000 | |||
| Par value | $ | 0.001 | ||
Class IA: Net asset value per share | $ | 16.45 | ||
| Shares outstanding | 9,744 | |||
| Net assets | $ | 160,257 | ||
Class IB: Net asset value per share | $ | 16.10 | ||
| Shares outstanding | 3,718 | |||
| Net assets | $ | 59,841 | ||
The accompanying notes are an integral part of these financial statements.
Statement of Operations For the Six-Month Period Ended June 30, 2011 (Unaudited) |
(000’s Omitted) |
| Investment Income: | ||||
| Dividends | $ | 1,401 | ||
| Interest | — | |||
| Less: Foreign tax withheld | (39 | ) | ||
| Total investment income, net | 1,362 | |||
| Expenses: | ||||
| Investment management fees | 862 | |||
| Transfer agent fees | 2 | |||
| Distribution fees - Class IB | 71 | |||
| Custodian fees | 4 | |||
| Accounting services fees | 10 | |||
| Board of Directors' fees | 3 | |||
| Audit fees | 4 | |||
| Other expenses | 32 | |||
| Total expenses (before fees paid indirectly) | 988 | |||
| Commission recapture | (1 | ) | ||
| Total fees paid indirectly | (1 | ) | ||
| Total expenses, net | 987 | |||
| Net investment income | 375 | |||
| Net Realized Gain on Investments and Foreign Currency Transactions: | ||||
| Net realized gain on investments | 11,039 | |||
| Net realized loss on foreign currency contracts | (591 | ) | ||
| Net realized loss on other foreign currency transactions | (12 | ) | ||
| Net Realized Gain on Investments and Foreign Currency Transactions | 10,436 | |||
| Net Changes in Unrealized Appreciation of Investments and Foreign Currency Transactions: | ||||
| Net unrealized appreciation of investments | 22,692 | |||
| Net unrealized appreciation of foreign currency contracts | 595 | |||
| Net unrealized appreciation on translation of other assets and liabilities in foreign currencies | 1 | |||
| Net Changes in Unrealized Appreciation of Investments and Foreign Currency Transactions | 23,288 | |||
| Net Gain on Investments and Foreign Currency Transactions | 33,724 | |||
| Net Increase in Net Assets Resulting from Operations | $ | 34,099 | ||
The accompanying notes are an integral part of these financial statements.
Statement of Changes in Net Assets |
(000’s Omitted) |
| For the | ||||||||
| Six-Month | For the | |||||||
| Period Ended | Year Ended | |||||||
| June 30, 2011 | December 31, | |||||||
| (Unaudited) | 2010 | |||||||
| Operations: | ||||||||
| Net investment income | $ | 375 | $ | 958 | ||||
| Net realized gain on investments and foreign currency transactions | 10,436 | 6,222 | ||||||
| Net unrealized appreciation of investments and foreign currency transactions | 23,288 | 5,944 | ||||||
| Net Increase In Net Assets Resulting From Operations | 34,099 | 13,124 | ||||||
| Distributions to Shareholders: | ||||||||
| From net investment income | ||||||||
| Class IA | — | (235 | ) | |||||
| Class IB | — | (15 | ) | |||||
| Total distributions | — | (250 | ) | |||||
| Capital Share Transactions: | ||||||||
| Class IA | ||||||||
| Sold | 19,154 | 15,131 | ||||||
| Issued on reinvestment of distributions | — | 235 | ||||||
| Redeemed | (20,900 | ) | (41,364 | ) | ||||
| Total capital share transactions | (1,746 | ) | (25,998 | ) | ||||
| Class IB | ||||||||
| Sold | 7,256 | 7,720 | ||||||
| Issued on reinvestment of distributions | — | 15 | ||||||
| Redeemed | (11,718 | ) | (19,685 | ) | ||||
| Total capital share transactions | (4,462 | ) | (11,950 | ) | ||||
| Net decrease from capital share transactions | (6,208 | ) | (37,948 | ) | ||||
| Net Increase (Decrease) In Net Assets | 27,891 | (25,074 | ) | |||||
| Net Assets: | ||||||||
| Beginning of period | 192,207 | 217,281 | ||||||
| End of period | $ | 220,098 | $ | 192,207 | ||||
| Accumulated undistributed (distribution in excess of) net investment income | $ | 1,112 | $ | 737 | ||||
| Shares: | ||||||||
| Class IA | ||||||||
| Sold | 1,218 | 1,133 | ||||||
| Issued on reinvestment of distributions | — | 17 | ||||||
| Redeemed | (1,369 | ) | (3,124 | ) | ||||
| Total share activity | (151 | ) | (1,974 | ) | ||||
| Class IB | ||||||||
| Sold | 481 | 593 | ||||||
| Issued on reinvestment of distributions | — | 1 | ||||||
| Redeemed | (785 | ) | (1,520 | ) | ||||
| Total share activity | (304 | ) | (926 | ) | ||||
The accompanying notes are an integral part of these financial statements.
Notes to Financial Statements June 30, 2011 (Unaudited) |
(000’s Omitted) |
| 1. | Organization: |
Hartford Healthcare HLS Fund (the “Fund”) serves as an underlying investment option for certain variable annuity and variable life insurance separate accounts of Hartford Life Insurance Company (“HLIC”) and its affiliates and certain qualified retirement plans. The Fund may also serve as an underlying investment option for certain variable annuity and variable life separate accounts of other insurance companies. Owners of variable annuity contracts and policyholders of variable life insurance contracts may choose the funds permitted in the variable insurance contract prospectus. In addition, participants in certain qualified retirement plans may choose the Fund if permitted by their plans.
Hartford Series Fund, Inc. (the “Company”) is an open-end registered management investment company comprised of thirty portfolios. Financial Statements for the Fund, a series of the Company, are included in this report.
The Company is organized under the laws of the State of Maryland and is registered with the Securities and Exchange Commission (“SEC”) under the Investment Company Act of 1940, as amended (“1940 Act”). The Fund is a diversified open-end management investment company.
The Fund is divided into Class IA and Class IB shares. Each class is offered at the per share net asset value (“NAV”) without a sales charge and is subject to the same expenses, except that the Class IB shares are subject to distribution and service fees charged pursuant to a Distribution Plan adopted in accordance with Rule 12b-1 under the 1940 Act.
| 2. | Significant Accounting Policies: |
The following is a summary of significant accounting policies of the Fund in the preparation of its financial statements, which are in accordance with the United States Generally Accepted Accounting Principles (“U.S. GAAP”). The preparation of financial statements in accordance with U.S. GAAP may require management to make estimates and assumptions that affect the reported amounts of assets and liabilities and disclosure of contingent assets and liabilities at the date of the financial statements and the reported amounts of increases and decreases in net assets from operations during the reporting period. Actual results could differ from those estimates.
| a) | Determination of Net Asset Value – The NAV of each class of the Fund's shares is determined as of the close of regular trading (normally 4:00 p.m. Eastern Time) (the “NYSE Close”) on each day that the New York Stock Exchange (the “Exchange”) is open (“Valuation Date”). Information that becomes known to the Fund after the NAV has been calculated on a particular day will not generally be used to retroactively adjust the NAV determined earlier that day. |
| b) | Investment Valuation and Fair Value Measurements – For purposes of calculating the NAV, portfolio securities and other assets held by the Fund's portfolio for which market quotes are readily available are valued at market value. Market value is generally determined on the basis of last reported sales prices or official close price. If no sales are reported, market value is based on quotes obtained from a quotation reporting system, established market makers, or independent pricing services. If market prices are not readily available or are deemed unreliable, the Fund will use the fair value of the security as determined in good faith under policies and procedures established by and under the supervision of the Company's Board of Directors. Market quotes are considered not readily available where there is an absence of current or reliable market-based data (e.g., trade information or broker quotes), including where events occur after the close of the relevant market, but prior to the NYSE Close that materially affect the values of the Fund's portfolio securities or assets. In addition, market quotes are considered not readily available when, due to extraordinary circumstances, the exchanges or markets on which the securities trade, do not open for trading for the entire day and no other market prices are available. In addition, prices of foreign equities that are principally traded on certain foreign markets are adjusted daily pursuant to a fair value pricing service approved by the Board of Directors in order to reflect an adjustment for the factors occurring after the close of certain foreign markets but before the NYSE Close. Securities that are primarily traded on foreign markets may trade on days that are not business days of the Fund. The value of the foreign securities, in which the Fund invests, may change on days when a shareholder will not be able to purchase or redeem shares of the Fund. Fair value pricing is subjective in nature and the use of fair value pricing by the Fund may cause the NAV of its |
Hartford Healthcare HLS Fund (formerly Hartford Global Health HLS Fund) |
Notes to Financial Statements – (continued) June 30, 2011 (Unaudited) |
(000’s Omitted) |
shares to differ significantly from the NAV that would have been calculated using market prices at the close of the exchange on which a portfolio security is primarily traded. There can be no assurance that the Fund could obtain the fair market value assigned to a security if the Fund were to sell the security at approximately the time at which the Fund determines its NAV.
Investments valued in currencies other than U.S. dollars are converted to U.S. dollars using exchange rates obtained from independent pricing services for calculation of the NAV. As a result, the NAV of the Fund’s shares may be affected by changes in the value of currencies in relation to the U.S. dollar. The value of securities traded in markets outside the United States or denominated in currencies other than the U.S. dollar may be affected significantly on a day that the NYSE is closed and the market value may change on days when an investor is not able to purchase, redeem or exchange shares of the Fund.
Foreign currency contracts represent agreements to exchange currencies on specific future dates at predetermined rates. Foreign currency contracts are valued using foreign currency exchange rates and forward rates as provided by an independent pricing service on Valuation Date.
Financial instruments for which prices are not available from an independent pricing service may be valued using market quotations obtained from one or more dealers that make markets in the respective financial instrument in accordance with procedures established by the Company’s Board of Directors.
U.S. GAAP defines fair value as the price that the Fund would receive to sell an asset or pay to transfer a liability in an orderly transaction between market participants. The U.S. GAAP fair value measurement standards require disclosure of a fair value hierarchy for each major category of assets and liabilities. Various inputs are used in determining the fair value of the Fund’s investments. These inputs are summarized into three broad hierarchy levels. This hierarchy is based on whether the valuation inputs are observable or unobservable. These levels are:
| · | Level 1 – Quoted prices in active markets for identical securities. Level 1 may include exchange-traded instruments such as domestic equities, some foreign equities, options, futures, mutual funds, exchange-traded funds, rights and warrants. |
| · | Level 2 – Observable inputs other than Level 1 prices, such as quoted prices for similar securities; quoted prices in markets that are not active; or other inputs that are observable or can be corroborated by observable market data. Level 2 may include debt securities that are traded less frequently than exchange-traded instruments and which are valued using third party pricing services; foreign equities, whose value is determined using a multi-factor regression model with inputs that are observable in the market; and short-term securities, which are valued at amortized cost. |
| · | Level 3 – Significant unobservable inputs that are supported by limited or no market activity. Level 3 may include financial instruments whose values are determined using broker quotes or require significant management judgment or estimation. These unobservable valuation inputs may include estimates for current yields, maturity/duration, prepayment speed, and broker quotes for comparable securities along with other assumptions relating to credit quality, collateral value, complexity of the security structure, general market conditions and liquidity. This category may include securities where trading has been halted or there are certain restrictions on trading. While these securities are priced using unobservable inputs, the valuation of these securities reflects the best available data and management believes the prices are a reasonable representation of exit price. |
Valuation levels are not necessarily indicative of the risk associated with investing in such securities. Individual securities within any of the above mentioned asset classes may be assigned a different hierarchical level than those presented above, as individual circumstances dictate.
During the six-month period ended June 30, 2011, the Fund held no Level 3 securities, therefore no reconciliation of Level 3 securities is presented.
For additional information, refer to the Investment Valuation Hierarchy Level Summary which follows the Schedule of Investments.
For purposes of reporting transfers between different hierarchy levels, both transfers in and out of each level, as applicable, are shown as if they occurred at the beginning of the period.
| c) | Security Transactions and Investment Income – Security transactions are recorded as of the trade date (the date the order to buy or sell is executed) for financial reporting purposes. Securities purchased or sold on a when-issued or delayed-delivery basis may be settled a month or more after the trade date. Realized gains and losses are determined on the basis of identified cost. |
Dividend income is accrued as of the ex-dividend date, except that certain dividends from foreign securities where the ex-dividend date may have passed are recorded as soon as the Fund is informed of the dividend. Interest income, including amortization of premium and accretion of discounts, is accrued on a daily basis.
| d) | Foreign Currency Transactions – Assets and liabilities denominated in currencies other than U.S. dollars are translated into U.S. dollars at the exchange rates in effect on the valuation date. Purchases and sales of investment securities, income, and expenses are translated into U.S. dollars at the exchange rates on the dates of such transactions. |
The Fund does not isolate that portion of portfolio security valuation resulting from fluctuations in the foreign currency exchange rates from the fluctuations arising from changes in the market prices of securities held. Exchange rate fluctuations are included with the net realized and unrealized gain or loss on investments in the accompanying financial statements.
Net realized foreign exchange gains or losses arise from sales of foreign currencies and the difference between asset and liability amounts initially stated in foreign currencies and the U.S. dollar value of the amounts actually received or paid. Net unrealized foreign exchange gains or losses arise from changes in the value of other assets and liabilities at the end of the reporting period, resulting from changes in the exchange rates.
| e) | Joint Trading Account – The Fund may invest cash balances into a joint trading account that may be invested in one or more repurchase agreements. |
| f) | Fund Share Valuation and Dividend Distributions to Shareholders – Orders for the Fund’s shares are executed in accordance with the investment instructions of the contract holders and plan participants. The NAV of the Fund’s shares is determined as of the close of business on each business day of the Exchange. The NAV is determined separately for each class of shares of the Fund by dividing the Fund’s net assets attributable to that class by the number of shares of the class outstanding. Each class of shares offered by the Fund has equal rights as to assets and voting privileges (except that shareholders of a class have exclusive voting rights regarding any matter relating solely to that class of shares). Income and non-class specific expenses are allocated daily to each class on the basis of the relative net assets of the class. Realized and unrealized capital gains and losses of each class are allocated daily based on the relative net assets of each class of shares of the Fund. |
Orders for the purchase of the Fund’s shares received prior to the close of the Exchange on any day the Exchange is open for business are priced at the NAV determined as of the close of the Exchange. Orders received after the close of the Exchange, or on a day on which the Exchange and/or the Fund is not open for business, are priced at the next determined NAV.
Dividends are declared pursuant to a policy adopted by the Company’s Board of Directors based upon the investment performance of the Fund. The policy of the Fund is to pay dividends from net investment income and realized capital gains, if any, at least once a year.
Hartford Healthcare HLS Fund (formerly Hartford Global Health HLS Fund) |
Notes to Financial Statements – (continued) June 30, 2011 (Unaudited) |
(000’s Omitted) |
Distributions from net investment income, net realized capital gains and capital are determined in accordance with federal income tax regulations, which may differ from U.S. GAAP with respect to character and timing. These differences may include but are not limited to losses deferred due to wash sale adjustments, foreign currency gains and losses, adjustments related to Passive Foreign Investment Companies (“PFICs”), Real Estate Investment Trusts (“REITs”), Regulated Investment Companies (“RICs”), certain derivatives and partnerships. Permanent book and federal income tax basis differences relating to shareholder distributions will result in reclassifications to certain of the Fund’s capital accounts (see Federal Income Taxes: Reclassification of Capital Accounts note).
| 3. | Securities and Other Investments: |
| a) | Repurchase Agreements – A repurchase agreement is an agreement by which a counterparty agrees to sell a security and agrees to repurchase the security sold at a mutually agreed upon time and price. At the time the Fund enters into a repurchase agreement, the value of the underlying collateral security(ies), including accrued interest, will be equal to or exceed the value of the repurchase agreement. Repurchase agreements expose the Fund to counterparty risk. To minimize counterparty risk, the securities that serve to collateralize the repurchase agreement are held by the Fund's custodian in book entry or physical form in the custodial account of the Fund or in a third party custodial account. Repurchase agreements are valued at cost plus accrued interest. The Fund, as shown on the Schedule of Investments, had outstanding repurchase agreements as of June 30, 2011. |
| b) | Illiquid and Restricted Securities – The Fund is permitted to invest up to 15% of its net assets in illiquid securities. Illiquid securities are those that may not be sold or disposed of in the ordinary course of business within seven days, at approximately the price used to determine the Fund’s NAV. The Fund may not be able to sell illiquid securities or other investments when its sub-adviser considers it desirable to do so or may have to sell such securities or investments at a price that is lower than the price that could be obtained if the securities or investments were more liquid. A sale of illiquid securities or other investments may require more time and may result in higher dealer discounts and other selling expenses than does the sale of those that are liquid. Illiquid securities and investments also may be more difficult to value, due to the unavailability of reliable market quotations for such securities or investments, and an investment in them may have an adverse impact on the Fund’s NAV. The Fund may also purchase certain restricted securities that can only be resold to certain qualified investors and may be determined to be liquid pursuant to policies and guidelines established by the Company’s Board of Directors. The Fund had no illiquid or restricted securities as of June 30, 2011. |
| 4. | Financial Derivative Instruments: |
The following disclosures contain information on how and why the Fund uses derivative instruments, the credit-risk-related contingent features in certain derivative instruments, and how derivative instruments affect the Fund’s financial position, results of operations and cash flows. The location and fair value amounts of these instruments on the Statement of Assets and Liabilities and the realized gains and losses and changes in unrealized gains and losses on the Statement of Operations, each categorized by type of derivative contract, are included in the following Additional Derivative Instrument Information footnote. The derivative instruments outstanding as of period-end are disclosed in the Notes to the Schedule of Investments and the amounts of realized gains and losses and changes in unrealized gains and losses on derivative instruments during the period are disclosed in the Statement of Operations.
| a) | Foreign Currency Contracts – The Fund may enter into foreign currency contracts that obligate the Fund to purchase or sell currencies at specified future dates. Foreign currency contracts are used to hedge the currency exposure associated with some or all of the Fund's securities and/or as part of an investment strategy. Foreign currency contracts are marked to market daily and the change in value is recorded by the Fund as an unrealized gain or loss. Realized gains or losses equal to the difference between the value of the contract at the time it was opened and the value at the time it was closed are recorded upon delivery or receipt of the currency. |
Foreign currency contracts involve elements of market risk in excess of the amounts reflected in the Statement of Assets and Liabilities. In addition, risks may arise upon entering into these contracts from the potential inability of the
counterparties to meet the terms of the contracts and from unanticipated movements in the value of the foreign currencies relative to the U.S. dollar. The Fund had outstanding foreign currency contracts as shown on the Schedule of Investments as of June 30, 2011.
| b) | Additional Derivative Instrument Information: |
Fair Values of Derivative Instruments on the Statement of Assets and Liabilities as of June 30, 2011:
| Risk Exposure Category | ||||||||||||||||||||||||||||
| Foreign | ||||||||||||||||||||||||||||
| Interest Rate | Exchange | Credit | Equity | Commodity | Other | |||||||||||||||||||||||
| Contracts | Contracts | Contracts | Contracts | Contracts | Contracts | Total | ||||||||||||||||||||||
| Liabilities: | ||||||||||||||||||||||||||||
| Unrealized depreciation on foreign currency contracts | $ | — | $ | 75 | $ | — | $ | — | $ | — | $ | — | $ | 75 | ||||||||||||||
| Total | $ | — | $ | 75 | $ | — | $ | — | $ | — | $ | — | $ | 75 | ||||||||||||||
The volume of derivatives that is presented in the Schedule of Investments is consistent with the derivative activity during the six-month period ended June 30, 2011.
The Effect of Derivative Instruments on the Statement of Operations for the six-month period ended June 30, 2011:
| Risk Exposure Category | ||||||||||||||||||||||||||||
| Foreign | ||||||||||||||||||||||||||||
| Interest Rate | Exchange | Credit | Equity | Commodity | Other | |||||||||||||||||||||||
| Contracts | Contracts | Contracts | Contracts | Contracts | Contracts | Total | ||||||||||||||||||||||
| Realized Gain (Loss) on Derivatives Recognized as a Result from Operations: | ||||||||||||||||||||||||||||
| Net realized loss on foreign currency contracts | $ | — | $ | (591 | ) | $ | — | $ | — | $ | — | $ | — | $ | (591 | ) | ||||||||||||
| Total | $ | — | $ | (591 | ) | $ | — | $ | — | $ | — | $ | — | $ | (591 | ) | ||||||||||||
| Net Change in Unrealized Appreciation (Depreciation) on Derivatives Recognized as a Result from Operations: | ||||||||||||||||||||||||||||
| Net change in unrealized appreciation of foreign currency contracts | $ | — | $ | 595 | $ | — | $ | — | $ | — | $ | — | $ | 595 | ||||||||||||||
| Total | $ | — | $ | 595 | $ | — | $ | — | $ | — | $ | — | $ | 595 | ||||||||||||||
| 5. | Principal Risks: |
| a) | Counterparty Risk – The Fund may be exposed to counterparty risk, or the risk that an institution or other entity with which the Fund has unsettled or open transactions will default. |
| b) | Market Risks – If a Fund invests directly in foreign currencies or in securities that trade in, and receive revenues in, foreign currencies, or in derivatives that provide exposure to foreign currencies, it will be subject to the risk that those currencies will decline in value relative to the base currency of the Fund, or, in the case of hedging positions, that the Fund’s base currency will decline in value relative to the currency being hedged. Currency rates in foreign countries may fluctuate significantly over short periods of time for a number of reasons, including changes in interest rates, intervention (or the failure to intervene) by U.S. or foreign governments, central banks or supranational entities such as the International Monetary Fund, or by the imposition of currency controls or other political developments in the United States or abroad. As a result, the Fund’s investments in foreign currency denominated securities may reduce the returns of the Fund. The market values of equity securities, such as common stocks and preferred stocks or equity related investments such as futures and options, may decline due to general market conditions which are not specifically related to a particular company, such as real or perceived adverse economic conditions, changes in the general outlook for corporate earnings, changes in interest or currency rates or adverse investor sentiment generally. The market value of equity securities may also decline due to factors which affect a particular industry or industries, such as labor shortages |
Hartford Healthcare HLS Fund (formerly Hartford Global Health HLS Fund) |
Notes to Financial Statements – (continued) June 30, 2011 (Unaudited) |
(000’s Omitted) |
or increased production costs and competitive conditions within an industry. Equity securities and equity related investments generally have greater market price volatility than fixed income securities.
| 6. | Federal Income Taxes: |
| a) | Federal Income Taxes – For federal income tax purposes, the Fund intends to continue to qualify as a RIC under Subchapter M of the Internal Revenue Code (“IRC”) by distributing substantially all of its taxable net investment income and net realized capital gains to its shareholders and otherwise complying with the requirements of RICs. The Fund has distributed substantially all of its income and capital gains in prior years, if applicable, and intends to distribute substantially all of its income and capital gains prior to the next fiscal year-end. Accordingly, no provision for federal income or excise taxes has been made in the accompanying financial statements. Distributions from short-term capital gains are treated as ordinary income distributions for federal income tax purposes. |
| b) | Net Investment Income (Loss), Net Realized Gains (Losses) – Net investment income (loss) and net realized gains (losses) may differ for financial statement and tax purposes primarily because of losses deferred due to wash sale adjustments, foreign currency gains and losses, adjustments related to PFICs, REITs, RICs, certain derivatives and partnerships. The character of distributions made during the year from net investment income or net realized gains may differ from their ultimate characterization for federal income tax purposes. Also, due to the timing of dividend distributions, the fiscal year in which amounts are distributed may differ from the year that the income or realized gains (losses) were recorded by the Fund. |
| c) | Distributions and Components of Distributable Earnings – The tax character of distributions paid by the Fund for the periods indicated is as follows (as adjusted for dividends payable): |
| For the Year Ended | For the Year Ended | |||||||
| December 31, 2010 | December 31, 2009 | |||||||
| Ordinary Income | $ | 250 | $ | 971 | ||||
| Long-Term Capital Gains* | — | 275 | ||||||
| * | The Fund designates these distributions as long-term capital dividends pursuant to IRC code Sec. 852(b)(3)(C). |
As of December 31, 2010, the Fund’s components of distributable earnings (deficit) on a tax basis were as follows:
| Amount | ||||
| Undistributed Ordinary Income | $ | 68 | ||
| Accumulated Capital and Other Losses* | (27,013 | ) | ||
Unrealized Appreciation† | 15,229 | |||
| Total Accumulated Deficit | $ | (11,716 | ) | |
| * | The Fund has capital loss carryforwards that are identified in the Capital Loss Carryforward note that follows. |
| † | The difference between book-basis and tax-basis unrealized appreciation (depreciation) may be attributable to the losses deferred due to wash sale adjustments, foreign currency gains and losses, adjustments related to PFICs, REITs, RICs, certain derivatives and partnerships. |
| d) | Reclassification of Capital Accounts – The Fund may record reclassifications in its capital accounts. These reclassifications have no impact on the total net assets of the Fund. The reclassifications are a result of permanent differences between U.S. GAAP and tax accounting for such items as expiration or utilization of capital loss carryforwards or net operating losses. Adjustments are made to reflect the impact these items have on current and future distributions to shareholders. Therefore, the source of the Fund’s distributable income may be shown in the accompanying Statement of Assets and Liabilities as from accumulated undistributed net investment income, from accumulated net realized gains on investments or from capital depending on the type of book and tax differences that exist. For the year ended December 31, 2010, the Fund had no reclassifications. |
| e) | Capital Loss Carryforward – At December 31, 2010 (tax-year-end), the Fund had capital loss carryforwards for U.S. federal income tax purposes of approximately: |
| Year of Expiration | Amount | |||
| 2017 | $ | 24,376 | ||
| Total | $ | 24,376 | ||
| As of December 31, 2010, the Fund utilized $4,007 of prior year capital loss carryforwards. | ||||
| As of December 31, 2010, the Fund elected to defer the following post-October losses: | ||||
| Amount | ||||
| Long-Term Capital Gain | $ | 2,637 | ||
| f) | Accounting for Uncertainty in Income Taxes – The Fund has adopted financial reporting rules that require the Fund to analyze all open tax years, as defined by the Statute of Limitations, for all major jurisdictions. Generally, tax authorities can examine all tax returns filed for the last three years. The Fund does not have an examination in progress. |
The Fund has reviewed all open tax years and major jurisdictions and concluded that these financial reporting rules had no effect on the Fund’s financial position or results of operations. There is no tax liability resulting from unrecognized tax benefits relating to uncertain income tax positions taken or expected to be taken on the tax return for the fiscal year-end December 31, 2010. The Fund is also not aware of any tax positions for which it is reasonably possible that the total amounts of unrecognized tax benefits will significantly change in the next twelve months.
| 7. | Expenses: |
| a) | Investment Management Agreements – HL Investment Advisors, LLC (“HL Advisors”), an indirect wholly owned subsidiary of The Hartford Financial Services Group, Inc. (“The Hartford”), serves as investment manager to the Fund pursuant to an Investment Management Agreement with the Company. As investment manager, HL Advisors has overall investment supervisory responsibility for the Fund. In addition, HL Advisors provides administrative personnel, services, equipment, facilities and office space for proper operation of the Fund. HL Advisors has contracted with Wellington Management Company, LLP (“Wellington Management”) under a sub-advisory agreement for the provision of day-today investment management services to the Fund in accordance with the Fund’s investment objective and policies. The Fund pays a fee to HL Advisors, a portion of which may be used to compensate Wellington Management. |
The schedule below reflects the rates of compensation paid to HL Advisors for investment management services rendered as of June 30, 2011; the rates are accrued daily and paid monthly.
| Average Daily Net Assets | Annual Fee | |||
| On first $250 million | 0.8500 | % | ||
| On next $250 million | 0.8000 | % | ||
| On next $4.5 billion | 0.7500 | % | ||
| On next $5 billion | 0.7475 | % | ||
| Over $10 billion | 0.7450 | % | ||
Hartford Healthcare HLS Fund (formerly Hartford Global Health HLS Fund) |
Notes to Financial Statements – (continued) June 30, 2011 (Unaudited) |
(000’s Omitted) |
| b) | Accounting Services Agreement – Pursuant to the Fund Accounting Agreement between HLIC and the Company, on behalf of the Fund, HLIC provides accounting services to the Fund and receives monthly compensation based on the Fund’s average net assets at the rates set forth below. The Fund’s accounting services fees are accrued daily and paid monthly. |
| Average Daily Net Assets | Annual Fee | |||
| All Assets | 0.010 | % | ||
| c) | Operating Expenses – Allocable expenses incurred by the Company are allocated to each Fund and allocated to classes within a Fund in proportion to the average daily net assets of the Fund and each class, except where allocation of certain expenses is more fairly made directly to the Fund or to specific classes within a Fund. |
| d) | Fees Paid Indirectly – The Company, on behalf of the Fund, has entered into agreements with State Street Global Markets, LLC and Russell Implementation Services, Inc. to partially recapture non-discounted trade commissions. Such rebates are used to pay a portion of the Fund’s expenses. In addition, the Fund’s custodian bank has also agreed to reduce its fees when the Fund maintains cash on deposit in a non-interest-bearing custody account. For the six-month period ended June 30, 2011, these amounts are included in the Statement of Operations. |
The ratio of expenses to average net assets in the accompanying financial highlights excludes the reduction in expenses related to fees paid indirectly. The annualized expense ratio for the period listed below including the fees paid indirectly is as follows:
| Annualized Six- | ||||
| Month Period | ||||
| Ended June 30, | ||||
| 2011 | ||||
| Class IA | 0.90 | % | ||
| Class IB | 1.15 | |||
| e) | Distribution Plan for Class IB shares – The Company, on behalf of the Fund, has adopted a Distribution Plan pursuant to Rule 12b-1 of the 1940 Act to compensate the Distributor, Hartford Securities Distribution Company, Inc. (a wholly owned, ultimate subsidiary of The Hartford), from assets attributable to the Class IB shares for services rendered and expenses borne in connection with activities primarily intended to result in the sale of the Class IB shares, subject to the review and approval of the Company’s Board of Directors. |
The Distribution Plan provides that the Fund may pay annually up to 0.25% of the average daily net assets of the Fund attributable to its Class IB shares for activities primarily intended to result in the sale of Class IB shares. The Board has the authority to suspend or reduce these payments at any point in time. Under the terms of the Distribution Plan and the principal underwriting agreement, the Fund is authorized to make payments monthly to the Distributor that may be used to pay or compensate entities providing distribution and shareholder servicing with respect to the Class IB shares for such entities’ fees or expenses incurred or paid in that regard. These fees are accrued daily and paid monthly.
| f) | Other Related Party Transactions – Certain officers of the Fund are directors and/or officers of HL Advisors and/or The Hartford or its subsidiaries. For the six-month period ended June 30, 2011, a portion of the Fund’s chief compliance officer’s salary was paid by all the investment companies in the Hartford fund complex. The portion allocated to the Fund rounds to zero. Hartford Administrative Services Company (“HASCO”), an indirect wholly owned subsidiary of The Hartford, provides transfer agent services to the Fund. The amount paid to HASCO can be found in the Statement of Operations. These fees are accrued daily and paid monthly. |
| g) | Payments from Affiliates – In July of 2007, The Hartford entered into a settlement with the Attorneys General of the states of New York, Connecticut and Illinois relating to market timing and the company's individual variable annuity contracts in which certain payments would be made directly to the variable annuity contract holders. The distribution |
plan provided that unclaimed money from the settlement would be distributed to certain HLS Funds that are investment options through a Hartford individual variable annuity contract. The unclaimed money was distributed to the Fund on September 18, 2009, as follows:
| Amount | ||||
| Reimbursement | $ | 23 | ||
On November 8, 2006, the SEC issued an order setting forth the terms of a settlement reached with three subsidiaries of The Hartford that resolved the SEC’s Division of Enforcement’s investigation of aspects of The Hartford’s variable annuity and mutual fund operations related to directed brokerage and revenue sharing. The Hartford settled this matter without admitting or denying the findings of the SEC.
The total return in the accompanying financial highlights includes payments from affiliates. Had the payments from the affiliates been excluded, the impact and total return for the periods listed below would have been as follows:
| For the Year Ended December 31, 2009 | ||||||||
| Class IA | Class IB | |||||||
| Impact from Payment from Affiliate for Attorneys General Settlement | 0.01 | % | 0.01 | % | ||||
| Total Return Excluding Payment from Affiliate | 22.70 | 22.39 | ||||||
| For the Year Ended December 31, 2006 | ||||||||
| Class IA | Class IB | |||||||
| Impact from Payment from Affiliate for SEC Settlement | 0.03 | % | 0.03 | % | ||||
| Total Return Excluding Payment from Affiliate | 10.16 | 10.88 | ||||||
| 8. | Investment Transactions: |
For the six-month period ended June 30, 2011, the Fund's aggregate purchases and sales of investment securities (excluding short-term investments) were as follows:
| Amount | ||||
| Cost of Purchases Excluding U.S. Government Obligations | $ | 57,176 | ||
| Sales Proceeds Excluding U.S. Government Obligations | 64,142 | |||
| 9. | Line of Credit: |
The Fund is one of several Hartford funds that participate in a $500 million committed revolving line of credit facility. The facility is to be used for temporary or emergency purposes. Under the arrangement, a fund is required to own securities having a market value in excess of 300% of the total bank borrowings. The interest rate on borrowings varies depending on the nature of the loan. The facility also requires a fee to be paid based on the amount of the commitment. This commitment fee is allocated to all the funds participating in the line of credit based on the average net assets of the funds. During the six-month period ended June 30, 2011, the Fund did not have any borrowings under this facility.
| 10. | Industry Classifications: |
Other than the industry classifications “Other Investment Pools and Funds” and “Exchange Traded Funds,” equity industry classifications used in this report are the Global Industry Classification Standard, which was developed by and is the exclusive property and service mark of MSCI, Inc. and Standard & Poor’s.
Hartford Healthcare HLS Fund (formerly Hartford Global Health HLS Fund) |
Notes to Financial Statements – (continued) June 30, 2011 (Unaudited) |
(000’s Omitted) |
| 11. | Indemnifications: |
Under the Company’s organizational documents, the Company shall indemnify its officers and directors to the full extent required or permitted under Maryland General Corporation Law and the federal securities laws. In addition, the Company, on behalf of the Fund, may enter into contracts that contain a variety of indemnifications. The Company’s maximum exposure under these arrangements is unknown. However, as of the date of these financial statements the Company has not had prior claims or losses pursuant to these contracts and expects the risk of loss to be remote.
| 12. | Subsequent Events: |
Effective August 5, 2011, the name of the Fund was changed to “Hartford Healthcare HLS Fund.”
[This page is intentionally left blank]
Financial Highlights |
– Selected Per-Share Data – (A) |
| Net Asset | Net Realized | Net Increase | ||||||||||||||||||||||||||||||||||||||||||
| Value at | and Unrealized | Total from | Dividends from | Distributions | (Decrease) in | Net Asset | ||||||||||||||||||||||||||||||||||||||
| Beginning of | Net Investment | Payments from | Gain (Loss) on | Investment | Net Investment | from Realized | Distributions | Total | Net Asset | Value at End of | ||||||||||||||||||||||||||||||||||
| Class | Period | Income (Loss) | (to) Affiliate | Investments | Operations | Income | Capital Gains | from Capital | Distributions | Value | Period | |||||||||||||||||||||||||||||||||
| For the Six-Month Period Ended June 30, 2011 (Unaudited) | ||||||||||||||||||||||||||||||||||||||||||||
| IA | $ | 13.89 | $ | 0.03 | $ | – | $ | 2.53 | $ | 2.56 | $ | – | $ | – | $ | – | $ | – | $ | 2.56 | $ | 16.45 | ||||||||||||||||||||||
| IB | 13.61 | 0.02 | – | 2.47 | 2.49 | – | – | – | – | 2.49 | 16.10 | |||||||||||||||||||||||||||||||||
| For the Year Ended December 31, 2010 | ||||||||||||||||||||||||||||||||||||||||||||
| IA | 12.99 | 0.08 | – | 0.84 | 0.92 | (0.02 | ) | – | – | (0.02 | ) | 0.90 | 13.89 | |||||||||||||||||||||||||||||||
| IB | 12.74 | 0.04 | – | 0.83 | 0.87 | – | – | – | – | 0.87 | 13.61 | |||||||||||||||||||||||||||||||||
| For the Year Ended December 31, 2009 | ||||||||||||||||||||||||||||||||||||||||||||
| IA | 10.66 | 0.07 | – | 2.35 | 2.42 | (0.07 | ) | (0.02 | ) | – | (0.09 | ) | 2.33 | 12.99 | ||||||||||||||||||||||||||||||
| IB | 10.46 | 0.03 | – | 2.31 | 2.34 | (0.04 | ) | (0.02 | ) | – | (0.06 | ) | 2.28 | 12.74 | ||||||||||||||||||||||||||||||
| For the Year Ended December 31, 2008 | ||||||||||||||||||||||||||||||||||||||||||||
| IA | 15.39 | 0.06 | – | (3.99 | ) | (3.93 | ) | (0.06 | ) | (0.74 | ) | – | (0.80 | ) | (4.73 | ) | 10.66 | |||||||||||||||||||||||||||
| IB | 15.11 | 0.02 | – | (3.91 | ) | (3.89 | ) | (0.02 | ) | (0.74 | ) | – | (0.76 | ) | (4.65 | ) | 10.46 | |||||||||||||||||||||||||||
| For the Year Ended December 31, 2007 | ||||||||||||||||||||||||||||||||||||||||||||
| IA | 16.84 | 0.03 | – | 0.99 | 1.02 | (0.02 | ) | (2.45 | ) | – | (2.47 | ) | (1.45 | ) | 15.39 | |||||||||||||||||||||||||||||
| IB | 16.59 | (0.02 | ) | – | 0.99 | 0.97 | – | (2.45 | ) | – | (2.45 | ) | (1.48 | ) | 15.11 | |||||||||||||||||||||||||||||
| For the Year Ended December 31, 2006 | ||||||||||||||||||||||||||||||||||||||||||||
| IA | 17.66 | 0.02 | – | 1.75 | 1.77 | (0.01 | ) | (2.58 | ) | – | (2.59 | ) | (0.82 | ) | 16.84 | |||||||||||||||||||||||||||||
| IB | 17.47 | (0.02 | ) | – | 1.72 | 1.70 | – | (2.58 | ) | – | (2.58 | ) | (0.88 | ) | 16.59 | |||||||||||||||||||||||||||||
| (A) | Information presented relates to a share outstanding throughout the indicated period. |
| (B) | The figures do not include sales charges or other fees which may be applied at the variable life insurance, variable annuity or qualified retirement plan product level. Any such additional sales charges or other fees would lower the Fund's performance. |
| (C) | Ratios do not reflect reductions for fees paid indirectly. Please see Fees Paid Indirectly in the Notes to Financial Statements. |
| (D) | Portfolio turnover rate is calculated on the basis of the Fund as a whole without distinguishing between the classes of shares issued. |
| (E) | Not annualized. |
| (F) | Annualized. |
| (G) | Total return without the inclusion of the Payment from (to) Affiliate can be found in Expenses in the accompanying Notes to Financial Statements. |
| – Ratios and Supplemental Data – |
| Ratio of Expenses to Average Net | Ratio of Expenses to Average Net | Ratio of Net Investment Income to | Portfolio Turnover | |||||||||||||||||||
| Total Return(B) | Net Assets at End of Period | Assets Before Waivers(C) | Assets After Waivers(C) | Average Net Assets | Rate(D) | |||||||||||||||||
| 18.39 | %(E) | $ | 160,257 | 0.90 | %(F) | 0.90 | %(F) | 0.44 | %(F) | 28 | % | |||||||||||
| 18.25 | (E) | 59,841 | 1.15 | (F) | 1.15 | (F) | 0.19 | (F) | – | |||||||||||||
| 7.10 | 137,454 | 0.90 | 0.90 | 0.55 | 32 | |||||||||||||||||
| 6.84 | 54,753 | 1.15 | 1.15 | 0.30 | – | |||||||||||||||||
| 22.72 | (G) | 154,216 | 0.91 | 0.91 | 0.51 | 73 | ||||||||||||||||
| 22.41 | (G) | 63,065 | 1.16 | 1.16 | 0.26 | – | ||||||||||||||||
| (25.56 | ) | 179,087 | 0.88 | 0.88 | 0.42 | 57 | ||||||||||||||||
| (25.75 | ) | 62,080 | 1.13 | 1.13 | 0.17 | – | ||||||||||||||||
| 6.12 | 289,561 | 0.87 | 0.87 | 0.16 | 39 | |||||||||||||||||
| 5.86 | 105,898 | 1.12 | 1.12 | (0.09 | ) | – | ||||||||||||||||
| 11.19 | (G) | 319,896 | 0.88 | 0.88 | 0.11 | 34 | ||||||||||||||||
| 10.91 | (G) | 119,000 | 1.13 | 1.13 | (0.13 | ) | – | |||||||||||||||
Directors and Officers (Unaudited) |
The Board of Directors of the Company appoints officers who are responsible for the day-to-day operations of the Fund and who execute policies formulated by the Directors. Each director serves until his or her death, resignation, or retirement or until the next annual meeting of shareholders is held or until his or her successor is elected and qualifies.
Directors and officers who are employed by or who have a financial interest in The Hartford are considered “interested” persons of the Fund pursuant to the 1940 Act. Each officer and two of the Company’s directors, as noted in the chart below, are “interested” persons of the Fund. Each director serves as a director for The Hartford Mutual Funds, Inc., The Hartford Mutual Funds II, Inc., Hartford Series Fund, Inc., and Hartford HLS Series Fund II, Inc., which, as of June 30, 2011, collectively consist of 89 funds. Correspondence may be sent to directors and officers c/o Hartford Mutual Funds, P.O. Box 2999, Hartford, Connecticut 06104-2999, except that correspondence to Ms. Fagely may be sent to 500 Bielenberg Drive, Woodbury, Minnesota 55125.
The table below sets forth, for each director and officer, his or her name, year of birth, current position with the Company and date first elected or appointed to Hartford Series Fund, Inc. (“HSF”), and Hartford HLS Series Fund II, Inc. (“HSF2”), principal occupation, and, for directors, other directorships held. The Fund’s statement of additional information contains further information on the directors and is available free of charge by calling 1-800-862-6668 or writing to Hartford HLS Funds, c/o Individual Annuity Services, P.O. Box 5085, Hartford, CT 06102-5085.
Information on the aggregate remuneration paid to the directors of the Company can be found in the Statement of Operations herein. The Fund pays to The Hartford a portion of the chief compliance officer’s compensation, but does not pay salaries or compensation to any of their other officers or directors who are employed by The Hartford.
Non-Interested Directors
Lynn S. Birdsong (1946) Director since 2003, Co-Chairman of the Investment Committee
Mr. Birdsong is a private investor. Mr. Birdsong currently serves as a Director of the Sovereign High Yield Investment Company (April 2010 to current). Mr. Birdsong currently serves as an Independent Director of Nomura Partners Funds, Inc. (formerly, The Japan Fund) (March 2003 to current). From 2003 to March 2005, Mr. Birdsong was an independent director of the Atlantic Whitehall Funds. From 1979 to 2002, Mr. Birdsong was a managing director of Zurich Scudder Investments, an investment management firm. During his employment with Scudder, Mr. Birdsong was an Interested Director of The Japan Fund. Since 1981, Mr. Birdsong has been a partner in Birdsong Company, an advertising specialty firm.
Robert M. Gavin, Jr. (1940) Director since 2002 (HSF) and 1986 (HSF2), Chairman of the Board since 2004
Dr. Gavin is an educational consultant. Prior to September 1, 2001, he was President of Cranbrook Education Community and prior to July 1996, he was President of Macalester College, St. Paul, Minnesota.
Duane E. Hill (1945) Director since 2001 (HSF) and 2002 (HSF2), Chairman of the Nominating Committee
Mr. Hill is Partner of TSG Ventures L.P., a private equity investment company. Mr. Hill is a former partner of TSG Capital Group, a private equity investment firm that served as sponsor and lead investor in leveraged buyouts of middle market companies.
Sandra S. Jaffee (1941) Director since 2005
Ms. Jaffee served as Chairman (2008 to 2009) and Chief Executive Officer of Fortent (formerly Searchspace Group), a leading provider of compliance/regulatory technology to financial institutions from August 2005 to August 2009. From August 2004 to August 2005, Ms. Jaffee served as an Entrepreneur in Residence with Warburg Pincus, a private equity firm. From September 1995 to July 2004, Ms. Jaffee served as Executive Vice President at Citigroup, where she was President and Chief Executive Officer of Citibank’s Global Securities Services (1995 to 2003). Ms. Jaffe currently serves as a member of the Board of Directors of Broadridge Financial Solutions as well as a Trustee of Muhlenberg College.
William P. Johnston (1944) Director since 2005, Chairman of the Compliance Committee
In June 2006, Mr. Johnston was appointed as Senior Advisor to The Carlyle Group, a global private equity investment firm. In July 2006, Mr. Johnston was elected to the Board of Directors of MultiPlan, Inc. In August 2007, Mr. Johnston was elected to the Board of Directors of LifeCare Holdings, Inc. In February 2008, Mr. Johnston was elected to the Board of Directors of HCR-ManorCare, Inc. In May 2006, Mr. Johnston was elected to the Supervisory Board of Fresenius Medical Care AG & Co. KGaA, after its acquisition of Renal Care Group, Inc. in March 2006. Mr. Johnston joined Renal Care Group in November 2002 as a member of the Board of Directors and served as Chairman of the Board from March 2003 through March 2006. From September 1987 to December 2002, Mr. Johnston was with Equitable Securities Corporation (and its successors, SunTrust Equitable Securities and SunTrust Robinson Humphrey) serving in various investment banking and managerial positions, including Managing Director and Head of Investment Banking, Chief Executive Officer and Vice Chairman.
Phillip O. Peterson (1944) Director since 2002 (HSF) and 2000 (HSF2), Chairman of the Audit Committee
Mr. Peterson is a mutual fund industry consultant. He was a partner of KPMG LLP (an accounting firm) until July 1999. Mr. Peterson joined William Blair Funds in February 2007 as a member of the Board of Trustees. From January 2004 to April 2005, Mr. Peterson served as Independent President of the Strong Mutual Funds.
Lemma W. Senbet (1946) Director since 2005
Dr. Senbet is the William E. Mayer Chair Professor of Finance and Director, Center for Financial Policy, at the University of Maryland, Robert H. Smith School of Business. He was chair of the Finance Department from 1998 to 2006. Previously he was a chaired professor of finance at the University of Wisconsin-Madison. Also, he was director of the Fortis Funds from March 2000 to July 2002. Dr. Senbet served the finance profession in various capacities, including as director of the American Finance Association and President of the Western Finance Association. In 2006, Dr. Senbet was inducted Fellow of Financial Management Association International for his career-long distinguished scholarship and professional service.
Interested Directors and Officers
David N. Levenson (1966) Director since 2010
Mr. Levenson currently serves as President of The Hartford’s Wealth Management business. He was appointed to this role in July 2010. Previously, Mr. Levenson served as Executive Vice President of Legacy Holdings for The Hartford from June 2009 to July 2010. From 2006 to 2009, Mr. Levenson was with Hartford Life Insurance K.K. where he served as President and CEO from 2007 to 2009. He served as Managing Director of Hartford Investment Management Company from 2005 to 2006. Additionally, Mr. Levenson serves as Executive Vice President of The Hartford and as President, Director and Chief Executive Officer of Hartford Life Insurance Company (“HLIC”) and Hartford Life, Inc. (“HL Inc.”).
Lowndes A. Smith (1939) Director since 1996 (HSF) and 2002 (HSF2), Co-Chairman of the Investment Committee
Mr. Smith served as Vice Chairman of The Hartford from February 1997 to January 2002, as President and Chief Executive Officer of HL Inc. from February 1997 to January 2002, and as President and Chief Operating Officer of The Hartford Life Insurance Companies from January 1989 to January 2002. Mr. Smith serves as a Director of White Mountains Insurance Group, Ltd., One Beacon Insurance and Symetra Financial and as a Managing Director of Whittington Gray Associates.
Other Officers
James E. Davey (1964) President and Chief Executive Officer since 2010
Mr. Davey serves as Executive Vice President of HLIC. Additionally, Mr. Davey serves as President, Chief Executive Officer and Manager of Hartford Investment Financial Services, Inc. (“HIFSCO”) and President, Chief Executive Officer and Manager of HL Advisors. Mr. Davey joined The Hartford in 2002.
Tamara L. Fagely (1958) Vice President, Treasurer and Controller since 2002 (HSF) and 1993 (HSF2)
Ms. Fagely has been a Vice President of HASCO since 1998 and Chief Financial Officer since 2006. Currently Ms. Fagely is a Vice President of HLIC. She served as Assistant Vice President of HLIC from December 2001 through March 2005. In addition, Ms. Fagely is Controller and Chief Financial Officer of HIFSCO.
Susan M. Fleege (1959) AML Compliance Officer since 2011
Ms. Fleege currently serves as a Director of Risk Management at The Hartford. She previously served as AML Compliance Officer for the Fund from 2005-2008. Ms. Fleege joined HLIC in 2005 from Amerprise Financial Corporation where she held the position of Counsel from 2000 to 2005. Ms. Fleege is a certified Anti-Money Laundering Specialist.
Dr. Robert J. Froehlich (1953) Senior Managing Director since 2009
Dr. Froehlich joined The Hartford as Senior Managing Director in September 2009. Prior to joining The Hartford, Dr. Froehlich served as Vice Chairman of Deutsche Asset Management from 1997-2009.
Edward P. Macdonald (1967) Vice President, Secretary and Chief Legal Officer since 2005
Mr. Macdonald serves as Vice President of HLIC and Chief Legal Officer of Mutual Funds and Vice President of HIFSCO. He also serves as Vice President and Secretary of HASCO, and Chief Legal Officer, Secretary and Vice President of HL Advisors. Mr. Macdonald joined The Hartford in 2005.
Hartford Healthcare HLS Fund (formerly Hartford Global Health HLS Fund) |
Directors and Officers (Unaudited) – (continued) |
Vernon J. Meyer (1964) Vice President since 2006
Mr. Meyer serves as Senior Vice President of HLIC. He also serves as Senior Vice President of HIFSCO and HL Advisors. Mr. Meyer joined The Hartford in 2004.
Colleen B. Pernerewski (1969) Vice President and Chief Compliance Officer since 2010
Ms. Pernerewski serves as Vice President and Chief Investment Advisor Compliance Officer of HIFSCO and as Vice President and Chief Compliance Officer of HL Advisors. Ms. Pernerewski joined The Hartford in 2005 from Travelers Life and Annuity where she served as Counsel (2004-2005). Prior to Travelers Life and Annuity, Ms. Pernerewski held the position of Counsel at The Hartford (1998-2004).
Elizabeth L. Schroeder (1966) Vice President since 2010
Ms. Schroeder currently serves as Assistant Vice President of HLIC. Ms. Schroeder joined HLIC in 1991. She is also an Assistant Vice President of HIFSCO and HL Advisers.
Martin Swanson (1962) Vice President since 2010
Mr. Swanson is a Vice President of HLIC. Mr. Swanson also serves as Vice President/Marketing for HIFSCO. Prior to joining HLIC in 1998, Mr. Swanson was a Vice President at PaineWebber, Inc.
Jane Wolak (1961) Vice President since 2009
Ms. Wolak currently serves as Senior Vice President of HLIC. Ms. Wolak joined HLIC as Vice President, Retail Product Services in May 2007. She is also Vice President of HASCO. Previously, Ms. Wolak was with Sun Life Financial where she held the position of Vice President, Service Center Operations from 2001-2007.
A description of the policies and procedures that the Fund uses to determine how to vote proxies relating to portfolio securities and a record of how the Fund voted any proxies for the twelve-month period ended June 30, 2011 are available (1) without charge, upon request, by calling 800-862-6668 and (2) on the SEC’s website at http://www.sec.gov.
The Fund files a complete schedule of portfolio holdings with the SEC for the first and third quarters of each fiscal year on Form N-Q. The Fund’s Forms are available (1) without charge, upon request, by calling 800-862-6668 and (2) on the SEC’s website at http://www.sec.gov. The Form N-Q may be reviewed and copied at the SEC’s Public Reference Room in Washington, DC. Information on the operation of the Public Reference Room may be obtained by calling 1-800-SEC-0330.
Expense Example (Unaudited) |
Your Fund's Expenses
As a shareholder of the Fund, you incur two types of costs: (1) transaction costs and (2) ongoing costs including investment management fees, distribution fees, and other fund expenses. This example is intended to help you understand your ongoing costs (in dollars) of investing in a Fund and to compare these costs with the ongoing costs of investing in other mutual funds. The example is based on an investment of $1,000 invested at the beginning of the period and held for the period of December 31, 2010 through June 30, 2011.
Actual Expenses
The first set of columns of the table below provides information about actual account values and actual expenses. You may use the information in this column, together with the amount you invested, to estimate the expenses that you paid over the period. Simply divide your account value by $1,000 (for example, an $8,600 account value divided by $1,000 = 8.6), then multiply the result by the number in the line under the heading entitled “Expenses Paid During Period” to estimate the expenses you paid on your account during this period.
Hypothetical Example for Comparison Purposes
The second set of columns of the table below provides information about hypothetical account values and hypothetical expenses based on a Fund's actual expense ratio and an assumed rate of return of 5% per year before expenses, which is not the Fund's actual return. The hypothetical account values and expenses may not be used to estimate the actual ending account balance or expenses you paid for the period. You may use this information to compare the ongoing costs of investing in a Fund and other funds. To do so, compare this 5% hypothetical example with the 5% hypothetical examples that appear in the shareholder reports of the other funds.
Please note that the expenses shown in the table are meant to highlight your ongoing costs only and do not reflect any transactional costs, such as sales charges (loads) and CDSC. Therefore, the second set of columns of the table is useful in comparing ongoing costs only, and will not help you determine the relative total costs of owning different funds. In addition, if these transactional costs were included, your costs would be higher. Expenses are equal to the Fund's annualized expense ratios multiplied by average account value over the period, multiplied by 181/365 (to reflect the one-half year period).
| Actual return | Hypothetical (5% return before expenses) | ||||||||||||||||||||||||||||
| Expenses paid | Expenses paid | Days in | |||||||||||||||||||||||||||
| during the period | during the period | the | Days | ||||||||||||||||||||||||||
| Beginning | Ending | December 31, 2010 | Beginning | Ending | December 31, 2010 | Annualized | current | in the | |||||||||||||||||||||
| Account Value | Account Value | through | Account Value | Account Value | through | expense | 1/2 | full | |||||||||||||||||||||
| December 31, 2010 | June 30, 2011 | June 30, 2011 | December 31, 2010 | June 30, 2011 | June 30, 2011 | ratio | year | year | |||||||||||||||||||||
| Class IA | $ | 1,000.00 | $ | 1,183.91 | $ | 4.87 | $ | 1,000.00 | $ | 1,020.33 | $ | 4.51 | 0.90 | % | 181 | 365 | |||||||||||||
| Class IB | $ | 1,000.00 | $ | 1,182.45 | $ | 6.22 | $ | 1,000.00 | $ | 1,019.09 | $ | 5.76 | 1.15 | % | 181 | 365 | |||||||||||||
27
The Hartford P.O. Box 5085 Hartford, CT 06102-5085 |
Hartford Series Fund, Inc. is underwritten and distributed by Hartford Securities Distribution Company, Inc.
“The Hartford” is The Hartford Financial Services Group, Inc. and its subsidiaries.
Hartford Series Fund, Inc. inception dates range from 1977 to date. Hartford Series Fund, Inc. is not a subsidiary of The Hartford but is underwritten, distributed by and advised by subsidiaries of The Hartford. Investments in Hartford Series Fund, Inc. are not guaranteed by The Hartford or any other entity.
You should carefully consider investment objectives, risks, and charges and expenses of Hartford HLS Funds before investing. This and other information can be found in the Fund’s prospectus or summary prospectus, which can be obtained by calling 800-862-6668. Please read them carefully before you invest or send money.
| HLSSAR-GH11 8-11 106632 Printed in U.S.A ©2011 The Hartford, Hartford, CT 06115 |

A MESSAGE FROM THE PRESIDENT

Dear Fellow Shareholders:
I want to take this opportunity to say thank you for your continued confidence and trust.
We have seen a significant amount of global turbulence in the first half of 2011. Investors have continued to be concerned about the implications of the European sovereign debt crisis, as well as our own high levels of domestic debt. Since January we have witnessed significant political uprisings in the already-volatile Middle East and North Africa region. In addition, the ramifications of Japan's massive earthquake, subsequent tsunami, and nuclear disaster are still being played out in the market.
Although corporate earnings have remained robust, the unemployment picture has been mixed. After adding more than 200,000 jobs from February to April, more recent unemployment reports have shown a pullback in hiring.
While official inflation remains low as measured by the Consumer Price Index (CPI), high oil prices may be indicative of higher inflation in the future. The federal funds rate remains at a historic low, however, the Fed could potentially raise the rate to get it closer to its historical average once the economy strengthens.
Even with these headwinds, domestic, international, and world indices (as measured by the S&P 500, MSCI EAFE and MSCI World) are all up more than 5% through June, 30 2011.
Looking ahead, continued growth in emerging markets is fueling global recovery efforts. Emerging markets comprise about 48 percent of the world’s GDP, and many economists believe they are poised for further expansion. As GDP growth continues in emerging markets, roughly 100 million people are added to the middle class each year. This middle class population growth could potentially drive a considerable shift in consumer purchasing power.
Now that we have reached the midpoint of 2011, perhaps now would be a good time to schedule a meeting with your financial adviser to examine your current investment strategy and determine whether you are on the right track.
| • | Are you concerned about inflation and its effects on your portfolio? |
| • | Is your portfolio prepared for rising interest rates? |
| • | Does your portfolio reflect the global economy with a mix of developed nations and emerging markets? |
Your financial professional’s advice can help you to navigate today’s volatile markets with confidence. You can also rest assured that we will continue to provide you with solid investments and stellar service for the road ahead.
Thank you again for your business.

James Davey
President
Hartford HLS Funds
Hartford Global Research HLS Fund
| Manager Discussion (Unaudited) | 2 |
| Financial Statements | |
| 5 | |
| 13 | |
| 15 | |
| 16 | |
| 17 | |
| 18 | |
| 30 | |
| 32 | |
| 34 | |
| 34 | |
| 35 |
This report is prepared for the general information of contract owners and qualified retirement plan participants. It is not an offer of contracts or of qualified retirement plans. It should not be used in connection with any offer, except in conjunction with the appropriate product prospectus which contains all pertinent information including the applicable sales, administrative and other charges.
The views expressed in the Fund’s Manager Discussion under ‘‘Why did the Fund perform this way?’’ and ‘‘What is the outlook?’’ are views of the Fund’s sub-adviser and portfolio management team through the end of the reporting period and are subject to change based on market and other conditions.
Hartford Global Research HLS Fund inception 01/31/2008 |
| (sub-advised by Wellington Management Company, LLP) |
Investment objective – Seeks long-term capital appreciation. |
Performance Overview 1/31/08 - 6/30/11

The chart above shows the growth of a $10,000 investment in Class IA. Growth results in classes other than Class IA will vary from what is seen above due to differences in the expenses charged to those share classes.
Average Annual Total Returns (as of 6/30/11)
| Since | |||||||||
| 6 Month† | 1 Year | Inception | |||||||
| Global Research IA | 5.42% | 34.87% | 2.28% | ||||||
| Global Research IB | 5.29% | 34.53% | 2.03% | ||||||
| MSCI All Country World Index | 4.99% | 30.77% | 0.56% |
| † | Not Annualized |
PAST PERFORMANCE IS NOT INDICATIVE OF FUTURE RESULTS.
Total returns presented above were calculated using the Fund's net asset value available to shareholders for sale or redemption of Fund shares on June 30, 2011, which excludes investment transactions as of this date.
MSCI All Country World Index is a free float-adjusted market capitalization index that measures equity market performance in the global developed and emerging markets, consisting of 45 developed and emerging market country indices. This index is unmanaged, and its results include reinvested dividends and/or distributions, but do not reflect the effect of sales charges, commissions, expenses or taxes.
You cannot invest directly in an index.
The chart represents a hypothetical investment in the Fund. Performance data represents past performance and current performance could be higher or lower.
Performance information may reflect historical or current expense waivers/reimbursements from the investment adviser, without which performance would have been lower. For information on current expense waivers/reimbursements, please see the prospectus.
The value of the fund will fluctuate so that when redeemed, it may be worth more or less than the original investment. The chart and table do not reflect the deductions of taxes, sales charges or other fees which may be applied at the variable life insurance, variable annuity or qualified retirement plan product level. Any such additional sales charges or other fees or expenses would lower the contract’s or plan’s performance.
| Portfolio Managers | |
| Cheryl M. Duckworth, CFA | Mark D. Mandel, CFA* |
| Senior Vice President, Associate Director of Global Industry Research | Director, Director of Global Industry Research |
How did the Fund perform?
The Class IA shares of the Hartford Global Research HLS Fund returned 5.42% for the six-month period ended June 30, 2011, outperforming its benchmark, the MSCI All Country World Index, which returned 4.99% for the same period. The Fund underperformed the 6.05% return of the average fund in the Lipper Global Core Funds VP-UF peer group, a group of funds with investment strategies similar to those of the Fund.
Why did the Fund perform this way?
Despite a period filled with volatility and headline risk, global equities moved higher as investors chose to focus on improving economic data, strong corporate earnings, and robust merger and acquisition activity. Heightened geopolitical risks, a devastating earthquake in Japan, and continued uncertainty surrounding sovereign debt issues in Europe were not enough to offset investors' enthusiasm about the improving health of the global economy. In the latter half of the period, positive returns from strong corporate earnings and generally solid economic data were offset by European sovereign debt concerns and a deteriorating outlook for economic growth later in the period. Investors became increasingly concerned that policy tightening in Europe would negatively impact global economic growth.
All ten sectors of the MSCI All Country World Index rose during the period. Health Care (+13%), Consumer Staples (+8%), and Energy (+8%) rose the most while returns in Information Technology (0%), Materials (+1%), and Financials (+1%) lagged on a relative basis.
The Fund’s outperformance versus the benchmark was driven by security selection, which was positive in seven of ten sectors. Stock selection was strongest in Information Technology, Financials, and Health Care while selection in Materials, Energy, and Consumer Staples detracted the most from relative performance. Sector allocation detracted slightly from relative performance due in part to a slight overweight (i.e. the Fund’s sector position was greater than the benchmark position) to the Information Technology sector.
Top contributors to benchmark-relative (i.e. performance of the Fund as measured against the benchmark) and absolute (i.e. total return) performance during the period included Elan (Health Care), UnitedHealth Group (Health Care), and Lorillard (Consumer Staples). Shares of Elan, a neuroscience-based biotechnology company, rose strongly on the announcement that biotechnology company Alkermes, Inc. plans to acquire Elan's drug delivery business unit, Elan Drug Technologies. Shares of UnitedHealth Group, a health care benefits and services provider, rose as the company reported strong fourth quarter earnings.
UnitedHealth beat analysts' estimates, driven in part by reduced use of services by its members. Investors also looked favorably on the increase in enrollments as a potential sign of growth going forward, pushing the stock higher. Shares of Lorillard, a cigarette producer whose Newport brand is the best-selling menthol cigarette, soared as a report said menthol cigarettes were no more harmful to smokers than non-mentholated cigarettes.
The largest detractors from benchmark-relative and absolute returns were Huabao International Holdings (Materials), Sino-Forest (Materials), and Central European Distribution (Consumer Staples). Shares of Huabao International Holdings, the dominant cigarette flavor manufacturer in China, dropped as the company has been losing share and it recently brought down its growth guidance. Shares of Sino-Forest, a leading commercial forest plantation operator in China, fell after a report raised several questions with regard to Sino-Forest's business practices and asset base. Shares of Central European Distribution, central Europe's largest integrated spirit beverages business and leading vodka producer, dropped sharply as fourth quarter 2010 earnings disappointed investors due to higher than expected investments in Poland and a production stoppage in Russia.
What is the outlook?
While the global expansion continues we believe that it is faced with a growing list of risks, including the tsunami, earthquake, and recovery in Japan, political tensions in the Middle East and North Africa regions, rekindled concern over sovereign debt contagion in Europe, and recent weakness in both consumer and manufacturing data globally. Despite these macroeconomic headwinds, we feel that corporate earnings remain a bright spot.
The Fund ended the period most overweight the Information Technology, Health Care, and Materials sectors and most underweight (i.e. the Fund’s sector position was less than the benchmark position) the Industrials, Energy, and Consumer Discretionary sectors relative to the MSCI All Country World Index. The Fund’s largest absolute weightings were in the Financials, Energy, and Information Technology sectors.
* Mr. Mandel supervises a team of global industry analysts that manage the Fund. Mr. Mandel is not involved in day-to-day management of the Fund.
| Diversification by Industry | ||||
| as of June 30, 2011 | ||||
| Percentage of | ||||
| Industry (Sector) | Net Assets | |||
| Automobiles & Components (Consumer Discretionary) | 2.5 | % | ||
| Banks (Financials) | 10.0 | |||
| Capital Goods (Industrials) | 5.4 | |||
| Commercial & Professional Services (Industrials) | 0.1 | |||
Consumer Durables & Apparel (Consumer Discretionary) | 1.3 | |||
| Consumer Services (Consumer Discretionary) | 0.3 | |||
| Diversified Financials (Financials) | 4.7 | |||
| Energy (Energy) | 10.5 | |||
| Food & Staples Retailing (Consumer Staples) | 1.3 | |||
| Food, Beverage & Tobacco (Consumer Staples) | 7.4 | |||
| Health Care Equipment & Services (Health Care) | 2.9 | |||
| Household & Personal Products (Consumer Staples) | 0.3 | |||
| Insurance (Financials) | 3.5 | |||
| Materials (Materials) | 10.1 | |||
| Media (Consumer Discretionary) | 2.1 | |||
| Other Investment Pools and Funds (Financials) | 0.1 | |||
| Pharmaceuticals, Biotechnology & Life Sciences (Health Care) | 7.0 | |||
| Real Estate (Financials) | 2.5 | |||
| Retailing (Consumer Discretionary) | 3.1 | |||
| Semiconductors & Semiconductor Equipment (Information Technology) | 2.7 | |||
| Software & Services (Information Technology) | 7.3 | |||
| Technology Hardware & Equipment (Information Technology) | 3.3 | |||
| Telecommunication Services (Services) | 4.5 | |||
| Transportation (Industrials) | 2.5 | |||
| Utilities (Utilities) | 4.2 | |||
| Short-Term Investments | 0.3 | |||
| Other Assets and Liabilities | 0.1 | |||
| Total | 100.0 | % | ||
| Diversification by Country | ||||
| as of June 30, 2011 | ||||
| Percentage of | ||||
| Country | Net Assets | |||
| Argentina | 0.1 | % | ||
| Australia | 1.8 | |||
| Austria | 0.1 | |||
| Belgium | 0.5 | |||
| Brazil | 3.9 | |||
| Canada | 4.1 | |||
| China | 0.5 | |||
| Denmark | 0.5 | |||
| Egypt | 0.1 | |||
| Finland | 0.1 | |||
| France | 5.0 | |||
| Germany | 1.8 | |||
| Hong Kong | 3.6 | |||
| India | 1.7 | |||
| Indonesia | 0.3 | |||
| Ireland | 0.6 | |||
| Israel | 0.7 | |||
| Italy | 0.5 | |||
| Japan | 7.2 | |||
| Jersey | 0.3 | |||
| Kazakhstan | 0.1 | |||
| Liechtenstein | 0.2 | |||
| Luxembourg | 0.3 | |||
| Malaysia | 0.4 | |||
| Mexico | 0.4 | |||
| Netherlands | 1.2 | |||
| Norway | 1.5 | |||
| Papua New Guinea | 0.1 | |||
| Philippines | 0.4 | |||
| Poland | 0.2 | |||
| Russia | 0.4 | |||
| Singapore | 1.3 | |||
| South Africa | 0.3 | |||
| South Korea | 1.0 | |||
| Spain | 0.4 | |||
| Sweden | 0.1 | |||
| Switzerland | 2.4 | |||
| Taiwan | 0.4 | |||
| Thailand | 0.3 | |||
| Turkey | 0.1 | |||
| United Kingdom | 6.9 | |||
| United States | 47.8 | |||
| Short-Term Investments | 0.3 | |||
| Other Assets and Liabilities | 0.1 | |||
| Total | 100.0 | % | ||
| Schedule of Investments |
| June 30, 2011 (Unaudited) |
| (000’s Omitted) |
| Shares or Principal Amount | Market Value ╪ | ||||||
| COMMON STOCKS - 99.3% | |||||||
| Argentina - 0.1% | |||||||
| 2 | YPF Sociedad Anonima ADR | $ | 85 | ||||
| Australia - 1.8% | |||||||
| 8 | Aquarius Platinum Ltd. | 39 | |||||
| 31 | Aston Resources Ltd. ● | 294 | |||||
| 8 | Billabong International Ltd. | 55 | |||||
| 17 | Commonwealth Property Office Fund | 17 | |||||
| 34 | Dexus Property Group | 32 | |||||
| 3 | Energy Resources of Australia Ltd. | 12 | |||||
| 15 | Fortescue Metals Group Ltd. | 100 | |||||
| 9 | GPT Group | 31 | |||||
| 30 | Insurance Australia Group | 111 | |||||
| 48 | Karoon Gas Australia Ltd. ● | 272 | |||||
| 2 | Rio Tinto Ltd. | 194 | |||||
| 7 | Transurban Group | 42 | |||||
| 8 | Wesfarmers Ltd. | 269 | |||||
| 4 | Westfield Group | 36 | |||||
| 4 | Westfield Retail Trust | 11 | |||||
| 10 | Woolworths Ltd. | 290 | |||||
| 1,805 | |||||||
| Austria - 0.1% | |||||||
| 2 | OMV AG | 100 | |||||
| Belgium - 0.5% | |||||||
| 143 | Ageas | 386 | |||||
| 4 | UCB S.A. | 172 | |||||
| 558 | |||||||
| Brazil - 3.7% | |||||||
| 1 | Aliansce Shopping | 9 | |||||
| 47 | Banco Santander Brasil S.A. | 552 | |||||
| 15 | BR Malls Participacoes S.A. | 172 | |||||
| 1 | BR Properties S.A. | 10 | |||||
| – | Brasil Insurance Participacoes e Administracao S.A | 119 | |||||
| 5 | Cetip S.A. - Balcao Organizado | 80 | |||||
| – | Cetip S.A. - Balcao Organizado - Receipt Shares ⌂● | 1 | |||||
| 12 | Cia Brasileira de Meios de Pagamentos | 286 | |||||
| 22 | Companhia Energetica de Minas Gerais ADR | 445 | |||||
| 2 | Cyrela Commercial Properties S.A. EmpreendimentoseParticicpacoes | 14 | |||||
| 26 | Itau Unibanco Banco Multiplo S.A. ADR | 609 | |||||
| 9 | Localiza Rent a Car S.A. | 157 | |||||
| 7 | OGX Petroleo e Gas Participacoes S.A. ● | 62 | |||||
| 24 | Petroleo Brasileiro S.A. ADR | 813 | |||||
| 9 | Redecard S.A. | 139 | |||||
| 1 | Rossi Residencial S.A. | 7 | |||||
| 2 | Tim Participacoes S.A. ADR | 89 | |||||
| 8 | Tractebel Energia S.A. | 147 | |||||
| 3,711 | |||||||
| Canada - 4.1% | |||||||
| 3 | Barrick Gold Corp. | 131 | |||||
| 4 | Brookfield Asset Management, Inc. | 139 | |||||
| 1 | Canadian Apartment Properties | 16 | |||||
| 9 | Canadian Natural Resources Ltd. ADR | 393 | |||||
| 22 | Cott Corp. ● | 181 | |||||
| 3 | EnCana Corp. ADR | 102 | |||||
| 1 | First Quantum Minerals Ltd. | 109 | |||||
| 1 | Fortress Paper Ltd. ● | 46 | |||||
| 2 | GLG Life Technology Corp. ● | 14 | |||||
| 4 | Goldcorp, Inc. | 179 | |||||
| 11 | Imperial Oil Ltd. | 519 | |||||
| 19 | Kinross Gold Corp. | 302 | |||||
| 23 | Lundin Mining Corp. ● | 177 | |||||
| 7 | Methanex Corp. | 226 | |||||
| 3 | Methanex Corp. ADR | 100 | |||||
| 6 | National Bank of Canada | 519 | |||||
| 3 | Nexen, Inc. | 70 | |||||
| 1 | RioCan Real Estate Investment Trust | 24 | |||||
| 135 | Sino Forest Corp. Class A ● | 447 | |||||
| 6 | Suncor Energy, Inc. | 216 | |||||
| 3 | Teck Cominco Ltd. Class B | 176 | |||||
| – | Thomson Reuters Corp. | 9 | |||||
| 5 | Vitran Corp., Inc. ● | 58 | |||||
| 4,153 | |||||||
| China - 0.5% | |||||||
| 1 | Baidu, Inc. ADR ● | 167 | |||||
| 7 | BBMG Corp. | 11 | |||||
| 31 | Changsha Zoomlion Heavy Industry Science and Technology Co., Ltd. | 60 | |||||
| 1 | Longtop Financial Technologies Ltd. ⌂●† | 11 | |||||
| 1 | New Oriental Education & Technology Group, Inc. ADR ● | 83 | |||||
| 45 | Stella International | 113 | |||||
| 38 | Zhejiang Expressway Co., Ltd. | 29 | |||||
| 3 | Zhongpin, Inc. ● | 34 | |||||
| 508 | |||||||
| Denmark - 0.5% | |||||||
| – | Alk-Abello A/S | 19 | |||||
| 4 | Bank Nordik P/F | 80 | |||||
| 13 | DSV A/S | 304 | |||||
| 1 | Gronlandsbanken | 106 | |||||
| 1 | H. Lundbeck A/S | 35 | |||||
| 544 | |||||||
| Egypt - 0.1% | |||||||
| 23 | Orascom Telecom Holding SAE GDR | 81 | |||||
| Finland - 0.1% | |||||||
| 3 | Elisa Oyj | 73 | |||||
| 3 | Tikkurila Oy | 58 | |||||
| 131 | |||||||
| France - 5.0% | |||||||
| 16 | AXA S.A. | 360 | |||||
| 11 | BNP Paribas | 857 | |||||
| 2 | Bourbon S.A. | 94 | |||||
| 2 | Electricite de France | 63 | |||||
| 15 | Gaz de France | 536 | |||||
| 11 | Groupe Danone | 858 | |||||
| 1 | Icade | 138 | |||||
| 2 | LVMH Moet Hennessy Louis Vuitton S.A. | 428 | |||||
| 9 | Peugeot S.A. | 397 | |||||
| 3 | Pinault-Printemps-Redoute S.A. | 469 | |||||
| 2 | Publicis Groupe | 123 | |||||
| 6 | Renault S.A. | 327 | |||||
| 3 | Safran S.A. | 148 | |||||
| – | Unibail-Rodamco SE | 60 | |||||
| 2 | Vinci S.A. | 150 | |||||
The accompanying notes are an integral part of these financial statements.
| Hartford Global Research HLS Fund |
| Schedule of Investments – (continued) |
| June 30, 2011 (Unaudited) |
| (000’s Omitted) |
| Shares or Principal Amount | Market Value ╪ | ||||||
| COMMON STOCKS - 99.3% - (continued) | |||||||
| France - 5.0% - (continued) | |||||||
| 2 | Vivendi S.A. | $ | 42 | ||||
| 5,050 | |||||||
| Germany - 1.8% | |||||||
| 1 | Alstria Office REIT AG | 19 | |||||
| 5 | BASF SE | 499 | |||||
| 1 | Brenntag AG | 121 | |||||
| 51 | Commerzbank AG | 221 | |||||
| 5 | E.On AG | 143 | |||||
| – | GSW Immobilien AG ● | 16 | |||||
| 2 | HeidelbergCement AG | 113 | |||||
| 4 | Siemens AG | 598 | |||||
| 1 | Software AG | 44 | |||||
| 1 | Stroer Out-of-Home Media AG ● | 21 | |||||
| 1,795 | |||||||
| Hong Kong - 3.6% | |||||||
| 64 | AAC Acoustic Technologies | 150 | |||||
| 8 | Agile Property Holdings Ltd. | 12 | |||||
| 155 | AMVIG Holdings Ltd. | 117 | |||||
| 104 | Anta Sports Products Ltd. | 187 | |||||
| 18 | ASM Pacific Technology | 247 | |||||
| 41 | Beijing Enterprises Holdings Ltd. | 214 | |||||
| 64 | Belle International Holdings Ltd. | 136 | |||||
| 5 | Cheung Kong Infrastructure | 26 | |||||
| 235 | China Green Holdings Ltd. | 150 | |||||
| 5 | China Overseas Grand Oceans Group Ltd. | 7 | |||||
| 8 | China Overseas Land & Investment Ltd. | 16 | |||||
| 205 | China Unicom Ltd. | 416 | |||||
| 26 | China Yurun Food Group Ltd. | 74 | |||||
| 20 | ENN Energy Holdings Ltd. | 68 | |||||
| 458 | Greenheart Group Ltd. ● | 63 | |||||
| 287 | Guangdong Investment Ltd. | 153 | |||||
| 40 | Hang Lung Properties Ltd. | 165 | |||||
| 13 | HongKong Land Holdings Ltd. | 89 | |||||
| 606 | Huabao International Holdings Ltd. | 551 | |||||
| 98 | International Mining Machinery | 94 | |||||
| 7 | Lifestyle International | 20 | |||||
| 9 | Link REIT | 32 | |||||
| 77 | Mongolian Mining Corp. ● | 95 | |||||
| 91 | Nine Dragons Paper Holdings | 80 | |||||
| 124 | Ontime Department Store | 212 | |||||
| 228 | Rexlot Holdings Ltd. | 22 | |||||
| 34 | Sa Sa International Holdings Ltd. | 22 | |||||
| 4 | Sun Hung Kai Properties Ltd. | 54 | |||||
| 110 | Trinity Ltd. | 111 | |||||
| 21 | Xingda International Holdings | 21 | |||||
| 3,604 | |||||||
| India - 1.7% | |||||||
| 7 | Aban Offshore Ltd. | 86 | |||||
| 10 | Bajaj Hindusthan Ltd. | 15 | |||||
| 48 | Bharti Televentures | 428 | |||||
| 7 | Corp. Bank | 79 | |||||
| 24 | Indian Overseas Bank | 80 | |||||
| 74 | Infrastructure Development Finance Co., Ltd. ● | 217 | |||||
| 51 | Karnataka Bank Ltd. | 150 | |||||
| 20 | Power Grid Corp. of India Ltd. | 49 | |||||
| 7 | Reliance Industries Ltd. | 138 | |||||
| 7 | Reliance Industries Ltd. GDR ■ | 295 | |||||
| 29 | UCO Bank ● | 62 | |||||
| 12 | Union Bank of India | 81 | |||||
| 1,680 | |||||||
| Indonesia - 0.3% | |||||||
| 10 | Indo Tambangraya Megah PT | 52 | |||||
| 268 | PT Bisi International Tbk | 41 | |||||
| 323 | PT Bumi Resources Tbk | 111 | |||||
| 4 | PT Telekomunikasi Indonesia ADR | 121 | |||||
| 325 | |||||||
| Ireland - 0.6% | |||||||
| 4 | CRH plc | 86 | |||||
| 38 | Elan Corp. plc ADR ● | 434 | |||||
| 5 | FBD Holdings | 57 | |||||
| 577 | |||||||
| Israel - 0.7% | |||||||
| 15 | Teva Pharmaceutical Industries Ltd. ADR | 747 | |||||
| Italy - 0.5% | |||||||
| 5 | Banca Popolare dell'Etruria e del Lazio | 15 | |||||
| 52 | Enel S.p.A. | 337 | |||||
| 3 | Eni S.p.A. ADR | 123 | |||||
| 13 | Snam Rete Gas S.p.A. | 74 | |||||
| 549 | |||||||
| Japan - 7.2% | |||||||
| 10 | Asahi Kasei Corp. | 68 | |||||
| 1 | Astellas Pharma, Inc. | 43 | |||||
| 13 | Bridgestone Corp. | 304 | |||||
| 4 | Chubu Electric Power Co., Inc. | 71 | |||||
| 15 | Daiichi Sankyo Co., Ltd. | 288 | |||||
| 4 | Dainippon Screen Manufacturing Co., Ltd. | 30 | |||||
| 1 | Daito Trust Construction Co., Ltd. | 123 | |||||
| 3 | DeNa Co., Ltd. | 142 | |||||
| 2 | Disco Corp. | 138 | |||||
| 10 | Eisai Co., Ltd. | 407 | |||||
| – | Fanuc Corp. | 67 | |||||
| – | Fuji Media Holdings, Inc. | 37 | |||||
| 42 | Hitachi Ltd. | 249 | |||||
| 4 | IBJ Leasing Co., Ltd. | 95 | |||||
| – | Inpex Corp. | 466 | |||||
| 1 | JS Group Corp. | 28 | |||||
| 2 | JSR Corp. | 33 | |||||
| – | Kakaku.com, Inc. | 218 | |||||
| 2 | Komatsu Ltd. | 64 | |||||
| 3 | Matsui Securities Co., Ltd. | 15 | |||||
| 71 | Mazda Motor Corp. | 187 | |||||
| 3 | Mitsubishi Estate Co., Ltd. | 59 | |||||
| 177 | Mitsubishi UFJ Financial Group, Inc. | 860 | |||||
| 6 | Mitsui & Co., Ltd. | 102 | |||||
| 9 | Mitsui Fudosan Co., Ltd. | 149 | |||||
| – | Ono Pharmaceutical Co., Ltd. | 19 | |||||
| – | Rakuten, Inc. | 238 | |||||
| 6 | Shin-Etsu Chemical Co., Ltd. | 321 | |||||
| 14 | Shionogi & Co., Ltd. | �� | 230 | ||||
| 27 | Showa Denko K.K. | 55 | |||||
| – | SMC Corp. | 50 | |||||
| 4 | Softbank Corp. | 153 | |||||
| 12 | Stanley Electric Co., Ltd. | 209 | |||||
| 153 | Sumitomo Metal Industries | 344 | |||||
| 2 | The Okinawa Electric Power Co., Inc. | 95 | |||||
| 14 | Tokai Rika Co., Ltd. | 275 | |||||
The accompanying notes are an integral part of these financial statements.
| Shares or Principal Amount | Market Value ╪ | ||||||
| COMMON STOCKS - 99.3% - (continued) | |||||||
| Japan - 7.2% - (continued) | |||||||
| 40 | Tokyo Gas Co., Ltd. | $ | 179 | ||||
| 10 | Toyoda Gosei Co., Ltd. | 223 | |||||
| 4 | Toyota Boshoku Corp. | 66 | |||||
| 15 | Toyota Motor Corp. | 602 | |||||
| 10 | Ube Industries Ltd. | 30 | |||||
| 7,332 | |||||||
| Jersey - 0.3% | |||||||
| 38 | Glencore International plc ● | 303 | |||||
| Kazakhstan - 0.1% | |||||||
| 5 | Kazmunaigas Exploration § | 110 | |||||
| Liechtenstein - 0.2% | |||||||
| 1 | Verwalt & Privat-Bank AG | 164 | |||||
| Luxembourg - 0.3% | |||||||
| 2 | Millicom International Cellular SDR | 171 | |||||
| 66 | Samsonite International S.A. ● | 125 | |||||
| 1 | SES Global S.A. | 40 | |||||
| 336 | |||||||
| Malaysia - 0.4% | |||||||
| 187 | AirAsia Berhad | 218 | |||||
| 78 | Axiata Group Berhad | 130 | |||||
| 86 | Masterskill Education Group | 56 | |||||
| 404 | |||||||
| Mexico - 0.4% | |||||||
| 4 | America Movil S.A. de C.V. ADR | 194 | |||||
| 27 | Grupo Modelo S.A.B. | 163 | |||||
| 357 | |||||||
| Netherlands - 1.2% | |||||||
| 3 | Akzo Nobel N.V. | 172 | |||||
| 4 | ASML Holding N.V. | 154 | |||||
| 4 | ASML Holding N.V. ADR | 140 | |||||
| 3 | Elsevier N.V. | 36 | |||||
| – | Eurocommercial Properties N.V. | 12 | |||||
| 2 | European Aeronautic Defence and Space Co. N.V. | 57 | |||||
| 20 | ING Groep N.V. ● | 242 | |||||
| 9 | ING Groep N.V. ADR ● | 110 | |||||
| 1 | Koninklijke DSM N.V. | 58 | |||||
| 6 | SBM Offshore N.V. | 158 | |||||
| 5 | VimpelCom Ltd. ADR | 64 | |||||
| 1 | Wolters Kluwer N.V. | 32 | |||||
| 1 | Yandex N.V. ● | 18 | |||||
| 1,253 | |||||||
| Norway - 1.5% | |||||||
| 23 | Aker Drilling ASA ● | 73 | |||||
| 25 | DNB Nor ASA | 352 | |||||
| 6 | Frontline Ltd. | 83 | |||||
| 17 | Statoil ASA | 439 | |||||
| 26 | Storebrand ASA | 221 | |||||
| 21 | Telenor ASA | 352 | |||||
| 1,520 | |||||||
| Papua New Guinea - 0.1% | |||||||
| 20 | Oil Search Ltd. | 144 | |||||
| Philippines - 0.4% | |||||||
| 219 | Metropolitan Bank and Trust | 355 | |||||
| 1 | Philippine Long Distance Telephone Co. ADR | 56 | |||||
| 411 | |||||||
| Poland - 0.2% | |||||||
| 1 | Powszechny Zakland Ubezpieczen S.A. | 171 | |||||
| 1 | Warsaw Stock Exchange ● | 26 | |||||
| 197 | |||||||
| Russia - 0.4% | |||||||
| 6 | Mobile Telesystems OJSC ADR | 108 | |||||
| 24 | OAO Gazprom Class S ADR | 346 | |||||
| 454 | |||||||
| Singapore - 1.3% | |||||||
| 64 | Capitacommercial Trust | 76 | |||||
| 367 | China Minzhong Food Corp., Ltd. ● | 449 | |||||
| 55 | Ezra Holdings Ltd. | 67 | |||||
| 76 | Hutchinson Port Holdings Trust ● | 64 | |||||
| 14 | Indofood Agri Resources Ltd. ● | 19 | |||||
| 11 | Olam International Ltd. | 25 | |||||
| 69 | Oversea-Chinese Banking Corp., Ltd. | 525 | |||||
| 97 | Tiger Airways Holdings Ltd. ● | 94 | |||||
| 1,319 | |||||||
| South Africa - 0.3% | |||||||
| 6 | MTN Group Ltd. | 134 | |||||
| 3 | Sasol Ltd. ADR | 153 | |||||
| 287 | |||||||
| South Korea - 1.0% | |||||||
| 6 | Hana Financial Holdings | 221 | |||||
| 5 | Hynix Semiconductor, Inc. | 115 | |||||
| 3 | KT Corp. ADR | 67 | |||||
| 1 | LG Household & Health Care Ltd. | 280 | |||||
| – | Samsung Electronics Co., Ltd. | 228 | |||||
| 3 | SK Telecom Co., Ltd. ADR | 53 | |||||
| 964 | |||||||
| Spain - 0.4% | |||||||
| 3 | Almirall S.A. | 35 | |||||
| 3 | Industria de Diseno Textil S.A. | 242 | |||||
| 26 | Mapletree Industries NPV | 25 | |||||
| 83 | SOS Corporacion Alimentaria S.A. | 64 | |||||
| 366 | |||||||
| Sweden - 0.1% | |||||||
| 2 | Swedish Match Ab | 56 | |||||
| Switzerland - 2.4% | |||||||
| 7 | Bank Sarasin & Cie AG | 260 | |||||
| 1 | Banque Cantonale Vaudoise | 309 | |||||
| 3 | CIE Financiere Richemont S.A. | 187 | |||||
| 12 | Julius Baer Group Ltd. | 495 | |||||
| – | PSP Swiss Property | 24 | |||||
| 1 | Roche Holding AG | 140 | |||||
| – | Swiss Prime Site AG | 16 | |||||
| 7 | Swiss Re Ltd. ● | 383 | |||||
| 37 | UBS AG | 667 | |||||
| 2,481 | |||||||
| Taiwan - 0.4% | |||||||
| 47 | Advanced Semiconductor Engineering, Inc. | 52 | |||||
| 25 | Chroma Ate, Inc. | 80 | |||||
| 4 | High Technology Computer Corp. | 119 | |||||
| 67 | Synnex Technology International Corp. | 162 | |||||
| 413 | |||||||
The accompanying notes are an integral part of these financial statements.
| Hartford Global Research HLS Fund |
| Schedule of Investments – (continued) |
| June 30, 2011 (Unaudited) |
| (000’s Omitted) |
| Shares or Principal Amount | Market Value ╪ | ||||||
| COMMON STOCKS - 99.3% - (continued) | |||||||
| Thailand - 0.3% | |||||||
| 42 | Bangkok Bank plc | $ | 218 | ||||
| 30 | Thai Oil plc | 73 | |||||
| 291 | |||||||
| Turkey - 0.1% | |||||||
| 80 | Turkiye Sinai Kalkinma Bankasi A.S. | 128 | |||||
| United Kingdom - 6.9% | |||||||
| 58 | Aberdeen Asset Management plc | 208 | |||||
| 15 | Anglo American plc | 768 | |||||
| 4 | Antofagasta | 92 | |||||
| 4 | AstraZeneca plc | 176 | |||||
| 3 | AstraZeneca plc ADR | 173 | |||||
| 104 | Barclays Bank plc | 427 | |||||
| 10 | BBA Aviation plc | 35 | |||||
| 32 | BG Group plc | 717 | |||||
| 6 | BHP Billiton plc | 230 | |||||
| 29 | BP plc | 215 | |||||
| 4 | BP plc ADR | 162 | |||||
| 11 | British American Tobacco plc | 475 | |||||
| 4 | British Land Co. plc | 37 | |||||
| 5 | Britvic plc | 29 | |||||
| 3 | Capital & Counties Properties plc | 11 | |||||
| 2 | Croda International plc | 59 | |||||
| 2 | Great Portland Estates plc | 17 | |||||
| 34 | HSBC Holdings plc | 341 | |||||
| 5 | Imperial Tobacco Group plc | 156 | |||||
| 7 | International Power plc | 35 | |||||
| 9 | Land Securities Group plc | 124 | |||||
| 12 | National Grid plc | 119 | |||||
| 2 | Pearson plc | 43 | |||||
| 14 | Prudential plc | 167 | |||||
| 1 | Reed Elsevier Capital, Inc. | 11 | |||||
| 16 | Rexam plc | 100 | |||||
| 5 | Rio Tinto plc | 370 | |||||
| 8 | Rolls-Royce Holdings plc | 80 | |||||
| 4 | Severn Trent plc | 98 | |||||
| 31 | Standard Chartered plc | 821 | |||||
| 66 | Tesco plc | 428 | |||||
| 80 | Vodafone Group plc | 211 | |||||
| 3 | Xstrata plc | 55 | |||||
| 6,990 | |||||||
| United States - 47.7% | |||||||
| 8 | Accenture plc | 485 | |||||
| 1 | ACE Ltd. | 58 | |||||
| 1 | Acorda Therapeutics, Inc. ● | 42 | |||||
| 3 | Activision Blizzard, Inc. | 29 | |||||
| 1 | ADTRAN, Inc. | 56 | |||||
| 3 | Aetna, Inc. | 113 | |||||
| 3 | Agilent Technologies, Inc. ● | 152 | |||||
| 1 | Air Products and Chemicals, Inc. | 142 | |||||
| 2 | Akamai Technologies, Inc. ● | 66 | |||||
| – | Alexandria Real Estate Equities, Inc. | 23 | |||||
| 10 | Alkermes, Inc. ● | 188 | |||||
| 2 | Alliance Data Systems Corp. ● | 202 | |||||
| 1 | Alpha Natural Resources, Inc. ● | 45 | |||||
| 3 | Amazon.com, Inc. ● | 592 | |||||
| 4 | American Assets Trust, Inc. | 88 | |||||
| – | American Campus Communities, Inc. | 12 | |||||
| 2 | American International Group, Inc. ● | 56 | |||||
| 2 | American Tower Corp. Class A ● | 93 | |||||
| 6 | Ameriprise Financial, Inc. | 345 | |||||
| 1 | Amerisource Bergen Corp. | 55 | |||||
| 1 | AMETEK, Inc. | 65 | |||||
| 1 | Amgen, Inc. ● | 60 | |||||
| 14 | Amylin Pharmaceuticals, Inc. ● | 189 | |||||
| 7 | Anadarko Petroleum Corp. | 548 | |||||
| – | Analog Devices, Inc. | 11 | |||||
| 3 | AON Corp. | 144 | |||||
| 3 | Apple, Inc. ● | 1,088 | |||||
| 10 | Applied Micro Circuits Corp. ● | 87 | |||||
| 5 | Arcos Dorados Holdings, Inc. | 96 | |||||
| 2 | Ariba, Inc. ● | 76 | |||||
| 1 | Aruba Networks, Inc. ● | 32 | |||||
| 13 | Automatic Data Processing, Inc. | 677 | |||||
| 2 | Auxilium Pharmaceuticals, Inc. ● | 31 | |||||
| 6 | Avago Technologies Ltd. | 226 | |||||
| – | Avalonbay Communities, Inc. | 16 | |||||
| 97 | Bank of America Corp. | 1,059 | |||||
| 25 | BB&T Corp. | 674 | |||||
| 1 | BlackRock, Inc. | 113 | |||||
| 3 | BMC Software, Inc. ● | 161 | |||||
| 4 | Boeing Co. | 300 | |||||
| – | Boston Properties, Inc. | 45 | |||||
| 11 | Boston Scientific Corp. ● | 78 | |||||
| – | BRE Properties | 24 | |||||
| 11 | Bristol-Myers Squibb Co. | 318 | |||||
| 1 | Brookdale Senior Living, Inc. ● | 27 | |||||
| 2 | Cabot Oil & Gas Corp. | 131 | |||||
| 3 | Calpine Corp. ● | 44 | |||||
| – | Camden Property Trust | 24 | |||||
| 3 | Cardinal Health, Inc. | 136 | |||||
| 1 | Carlisle Cos., Inc. | 36 | |||||
| 3 | Carpenter Technology Corp. | 178 | |||||
| 1 | Caterpillar, Inc. | 139 | |||||
| 2 | Cavium, Inc. ● | 68 | |||||
| 1 | CBS Corp. Class B | 31 | |||||
| 1 | Celanese Corp. | 40 | |||||
| 2 | Celgene Corp. ● | 135 | |||||
| 23 | Cental Euro Distribution Corp. ● | 252 | |||||
| – | Cephalon, Inc. ● | 35 | |||||
| 1 | CF Industries Holdings, Inc. | 86 | |||||
| 1 | Charm Communications, Inc. ● | 10 | |||||
| 6 | Chesapeake Energy Corp. | 173 | |||||
| 2 | CIGNA Corp. | 91 | |||||
| 2 | Citizens & Northern Corp. | 24 | |||||
| 48 | Citizens Republic Bancorp, Inc. ● | 33 | |||||
| 3 | Citrix Systems, Inc. ● | 228 | |||||
| 2 | Coach, Inc. | 128 | |||||
| 18 | Cobalt International Energy ● | 243 | |||||
| 14 | Comcast Corp. Class A | 358 | |||||
| 6 | Comcast Corp. Special Class A | 156 | |||||
| 6 | Consol Energy, Inc. | 304 | |||||
| 3 | Con-way, Inc. | 108 | |||||
| 3 | Cooper Industries plc Class A | 203 | |||||
| 5 | Covenant Transport ● | 37 | |||||
| 6 | Covidien plc | 338 | |||||
| 1 | Cree, Inc. ● | 45 | |||||
| 3 | Crown Castle International Corp. ● | 110 | |||||
The accompanying notes are an integral part of these financial statements.
| Shares or Principal Amount | Market Value ╪ | ||||||
| COMMON STOCKS - 99.3% - (continued) | |||||||
| United States - 47.7% - (continued) | |||||||
| 10 | CVS/Caremark Corp. | $ | 357 | ||||
| 4 | Danaher Corp. | 206 | |||||
| – | Digital Realty Trust, Inc. | 30 | |||||
| 2 | DirecTV Class A ● | 88 | |||||
| 1 | Discovery Communications, Inc. ● | 41 | |||||
| 1 | Douglas Emmett, Inc. | 23 | |||||
| 1 | Dover Corp. | 50 | |||||
| 7 | Dow Chemical Co. | 235 | |||||
| 1 | DreamWorks Animation SKG, Inc. ● | 22 | |||||
| 1 | Duke Realty, Inc. | 14 | |||||
| 1 | Eastman Chemical Co. | 75 | |||||
| 18 | eBay, Inc. ● | 574 | |||||
| 10 | Eli Lilly & Co. | 370 | |||||
| 18 | EMC Corp. ● | 504 | |||||
| – | Emeritus Corp. ● | 6 | |||||
| 3 | Emerson Electric Co. | 152 | |||||
| 4 | Emulex Corp. ● | 35 | |||||
| 2 | EOG Resources, Inc. | 202 | |||||
| – | Equinix, Inc. ● | 14 | |||||
| – | Equity Lifestyle Properties, Inc. | 13 | |||||
| 6 | Euronet Worldwide, Inc. ● | 91 | |||||
| 7 | Exelixis, Inc. ● | 64 | |||||
| 1 | Exlservice Holdings, Inc. ● | 33 | |||||
| 2 | Expeditors International of Washington, Inc. | 101 | |||||
| 4 | Exxon Mobil Corp. | 344 | |||||
| 1 | F5 Networks, Inc. ● | 71 | |||||
| 4 | FedEx Corp. | 356 | |||||
| 10 | First Horizon National Corp. | 96 | |||||
| 2 | FMC Corp. | 184 | |||||
| 9 | Forest City Enterprises, Inc. Class A ● | 159 | |||||
| 11 | Forest Laboratories, Inc. ● | 426 | |||||
| 1 | Freeport-McMoRan Copper & Gold, Inc. | 26 | |||||
| 28 | Frontier Communications Corp. | 227 | |||||
| 3 | General Dynamics Corp. | 218 | |||||
| 23 | General Electric Co. | 437 | |||||
| 11 | General Mills, Inc. | 428 | |||||
| 1 | Genesee & Wyoming, Inc. Class A ● | 88 | |||||
| 2 | Genpact Ltd. ● | 41 | |||||
| 2 | Gilead Sciences, Inc. ● | 87 | |||||
| 1 | Glimcher Realty Trust | 9 | |||||
| 4 | GNC Holdings, Inc. ● | 85 | |||||
| 3 | Goldman Sachs Group, Inc. | 346 | |||||
| 1 | Google, Inc. ● | 327 | |||||
| 10 | Graphic Packaging Holding Co. ● | 55 | |||||
| 10 | Green Plains Renewable Energy ● | 108 | |||||
| 1 | HCA Holdings, Inc. ● | 24 | |||||
| 1 | HCP, Inc. | 30 | |||||
| 3 | Hisoft Technology International Ltd. ● | 39 | |||||
| 7 | Home Depot, Inc. | 251 | |||||
| 5 | Honeywell International, Inc. | 278 | |||||
| 1 | Host Hotels & Resorts, Inc. | 22 | |||||
| 3 | Huron Consulting Group, Inc. ● | 79 | |||||
| – | Hyatt Hotels Corp. ● | 7 | |||||
| 1 | IBM Corp. | 208 | |||||
| 2 | IDEX Corp. | 79 | |||||
| 4 | Illinois Tool Works, Inc. | 243 | |||||
| 10 | Imperial Holdings, Inc. ● | 104 | |||||
| 3 | Incyte Corp. ● | 64 | |||||
| 3 | Informatica Corp. ● | 202 | |||||
| 6 | Ingersoll-Rand plc | 274 | |||||
| 4 | Invesco Ltd. | 96 | |||||
| 1 | Ironwood Pharmaceuticals, Inc. ● | 14 | |||||
| 1 | ITC Holdings Corp. | 85 | |||||
| 9 | J.B. Hunt Transport Services, Inc. | 410 | |||||
| 3 | James River Coal Co. ● | 61 | |||||
| 3 | Juniper Networks, Inc. ● | 88 | |||||
| 4 | Kansas City Southern ● | 229 | |||||
| 20 | Kraft Foods, Inc. | 704 | |||||
| 23 | Leap Wireless International, Inc. ● | 381 | |||||
| 17 | Lender Processing Services | 365 | |||||
| 3 | Liberty Global, Inc. ● | 132 | |||||
| 2 | Life Technologies Corp. ● | 87 | |||||
| 3 | Linear Technology Corp. | 86 | |||||
| 3 | Lockheed Martin Corp. | 229 | |||||
| 9 | Lorillard, Inc. | 947 | |||||
| 13 | Lowe's Co., Inc. | 311 | |||||
| – | LPL Investment Holdings, Inc. ● | 14 | |||||
| 9 | LSI Corp. ● | 65 | |||||
| 1 | M&T Bank Corp. | 79 | |||||
| 6 | Macy's, Inc. | 163 | |||||
| 1 | Marriott International, Inc. Class A | 20 | |||||
| 5 | Marsh & McLennan Cos., Inc. | 156 | |||||
| 10 | Maxim Integrated Products, Inc. | 263 | |||||
| 6 | McKesson Corp. | 539 | |||||
| 1 | MeadWestvaco Corp. | 37 | |||||
| 3 | Medicines Co. ● | 56 | |||||
| 8 | Medtronic, Inc. | 320 | |||||
| 16 | Merck & Co., Inc. | 558 | |||||
| 12 | MetroPCS Communications, Inc. ● | 199 | |||||
| 3 | Molycorp, Inc. ● | 175 | |||||
| 11 | Mosaic Co. | 745 | |||||
| 4 | Mylan, Inc. ● | 108 | |||||
| 3 | N.V. Energy, Inc. | 47 | |||||
| 3 | Nasdaq OMX Group, Inc. ● | 84 | |||||
| 8 | National Financial Partners Corp. ● | 91 | |||||
| 2 | National Oilwell Varco, Inc. | 181 | |||||
| 4 | NetApp, Inc. ● | 235 | |||||
| 4 | Netlogic Microsystems, Inc. ● | 155 | |||||
| 12 | News Corp. Class A | 217 | |||||
| 9 | NextEra Energy, Inc. | 545 | |||||
| 4 | NII Holdings, Inc. Class B ● | 153 | |||||
| 2 | Nordstrom, Inc. | 110 | |||||
| 9 | Northeast Utilities | 319 | |||||
| 8 | NVIDIA Corp. ● | 121 | |||||
| 2 | Occidental Petroleum Corp. | 178 | |||||
| 10 | Omega Protein Corp. ● | 136 | |||||
| 1 | Omnicom Group, Inc. | 39 | |||||
| 2 | Onyx Pharmaceuticals, Inc. ● | 64 | |||||
| 25 | Oracle Corp. | 812 | |||||
| 8 | Owens-Illinois, Inc. ● | 195 | |||||
| 14 | Pacer International, Inc. ● | 64 | |||||
| 14 | PAETEC Holding Corp. ● | 66 | |||||
| 1 | Parker-Hannifin Corp. | 72 | |||||
| 4 | Pentair, Inc. | 161 | |||||
| 15 | PepsiCo, Inc. | 1,023 | |||||
| 18 | Pfizer, Inc. | 368 | |||||
| 6 | PG&E Corp. | 257 | |||||
| – | Pharmasset, Inc. ● | 30 | |||||
| 11 | Philip Morris International, Inc. | 721 | |||||
| 7 | Pilgrim's Pride Corp. ● | 38 | |||||
The accompanying notes are an integral part of these financial statements.
| Hartford Global Research HLS Fund |
| Schedule of Investments – (continued) |
| June 30, 2011 (Unaudited) |
| (000’s Omitted) |
| Shares or Principal Amount | Market Value ╪ | ||||||
| COMMON STOCKS - 99.3% - (continued) | |||||||
| United States - 47.7% - (continued) | |||||||
| 1 | Pinnacle West Capital Corp. | $ | 59 | ||||
| 3 | Pioneer Natural Resources Co. | 267 | |||||
| 2 | PNC Financial Services Group, Inc. | 117 | |||||
| 1 | Polycom, Inc. ● | 39 | |||||
| 1 | Praxair, Inc. | 146 | |||||
| 1 | Priceline.com, Inc. ● | 295 | |||||
| 4 | Principal Financial Group, Inc. | 116 | |||||
| 16 | Progressive Corp. | 347 | |||||
| 3 | Prudential Financial, Inc. | 210 | |||||
| 2 | Public Service Enterprise Group, Inc. | 67 | |||||
| – | Public Storage | 46 | |||||
| 2 | QLIK Technologies, Inc. ● | 70 | |||||
| 8 | Qualcomm, Inc. | 442 | |||||
| 4 | Quality Distribution, Inc. ● | 52 | |||||
| 2 | Range Resources Corp. | 115 | |||||
| – | Regency Centers Corp. | 17 | |||||
| 4 | Regeneron Pharmaceuticals, Inc. ● | 221 | |||||
| 2 | Rigel Pharmaceuticals, Inc. ● | 22 | |||||
| 2 | Salesforce.com, Inc. ● | 238 | |||||
| 2 | Salix Pharmaceuticals Ltd. ● | 64 | |||||
| 12 | Sapient Corp. ● | 187 | |||||
| – | Saul Centers, Inc. | 10 | |||||
| 1 | SBA Communications Corp. ● | 43 | |||||
| 3 | Schlumberger Ltd. | 218 | |||||
| 5 | Seattle Genetics, Inc. ● | 104 | |||||
| 2 | SEI Investments Co. | 45 | |||||
| 1 | Sherwin-Williams Co. | 50 | |||||
| 1 | Simon Property Group, Inc. | 74 | |||||
| 3 | Sirius XM Radio, Inc. w/ Rights ● | 7 | |||||
| 3 | Skyworks Solutions, Inc. ● | 72 | |||||
| 18 | Smithfield Foods, Inc. ● | 404 | |||||
| 3 | Solutia, Inc. ● | 60 | |||||
| 2 | Southern Co. | 98 | |||||
| 3 | Southwestern Energy Co. ● | 131 | |||||
| 44 | Sprint Nextel Corp. ● | 236 | |||||
| – | St. Joe Co. ● | 8 | |||||
| 3 | St. Jude Medical, Inc. | 124 | |||||
| 1 | Stanley Black & Decker, Inc. | 50 | |||||
| 1 | Stryker Corp. | 84 | |||||
| – | Targacept, Inc. ● | 8 | |||||
| 6 | Temple-Inland, Inc. | 170 | |||||
| 5 | Teradata Corp. ● | 324 | |||||
| 3 | Tesoro Corp. ● | 77 | |||||
| 8 | Texas Instruments, Inc. | 271 | |||||
| 2 | Textron, Inc. | 55 | |||||
| 3 | Thermo Fisher Scientific, Inc. ● | 202 | |||||
| 2 | Tibco Software, Inc. ● | 72 | |||||
| 2 | Time Warner Cable, Inc. | 157 | |||||
| 1 | Time Warner, Inc. | 40 | |||||
| – | Towers Watson & Co. | 26 | |||||
| 1 | Transocean, Inc. | 82 | |||||
| 5 | TW Telecom, Inc. ● | 111 | |||||
| 1 | Tyson Foods, Inc. Class A | 27 | |||||
| 1 | UDR, Inc. | 22 | |||||
| 2 | Ultra Petroleum Corp. ● | 93 | |||||
| 1 | United Parcel Service, Inc. Class B | 50 | |||||
| 4 | United Technologies Corp. | 380 | |||||
| 14 | UnitedHealth Group, Inc. | 730 | |||||
| 15 | Unum Group | 377 | |||||
| 3 | Valero Energy Corp. | 73 | |||||
| 1 | Vanguard Health Systems, Inc. ● | 9 | |||||
| 48 | Vantage Drilling Co. ● | 88 | |||||
| – | VeriSign, Inc. | 15 | |||||
| 1 | Vertex Pharmaceuticals, Inc. ● | 57 | |||||
| – | Viacom, Inc. Class B | 23 | |||||
| 1 | Virgin Media, Inc. | 40 | |||||
| 2 | Visa, Inc. | 196 | |||||
| 1 | VMware, Inc. ● | 60 | |||||
| – | Vornado Realty Trust | 40 | |||||
| 10 | Walt Disney Co. | 400 | |||||
| – | Washington Post Co. Class B | 12 | |||||
| – | Watson Pharmaceuticals, Inc. ● | 34 | |||||
| 1 | Wellcare Health Plans, Inc. ● | 46 | |||||
| – | Wellpoint, Inc. | 30 | |||||
| 33 | Wells Fargo & Co. | 913 | |||||
| 1 | WESCO International, Inc. ● | 71 | |||||
| 29 | Western Union Co. | 579 | |||||
| 2 | Whiting Petroleum Corp. ● | 94 | |||||
| 3 | Williams Cos., Inc. | 76 | |||||
| 15 | Worthington Industries, Inc. | 339 | |||||
| 3 | Xcel Energy, Inc. | 85 | |||||
| 5 | Xilinx, Inc. | 187 | |||||
| 3 | Zimmer Holdings, Inc. ● | 209 | |||||
| 48,342 | |||||||
| Total common stocks | |||||||
| (cost $88,646) | $ | 100,625 | |||||
| PREFERRED STOCKS - 0.2% | |||||||
| Brazil - 0.2% | |||||||
| 10 | Banco Itau Holding | $ | 242 | ||||
| Total preferred stocks | |||||||
| (cost $114) | $ | 242 | |||||
| WARRANTS - 0.0% | |||||||
| Canada - 0.0% | |||||||
| 1 | GLG Life Technology Corp. ⌂ | $ | – | ||||
| 14 | Quest Rare Minerals Ltd. ⌂ | 24 | |||||
| 24 | |||||||
| Total warrants | |||||||
| (cost $–) | $ | 24 | |||||
| EXCHANGE TRADED FUNDS - 0.1% | |||||||
| United States - 0.1% | |||||||
| 3 | Industrial Select Sector SPDR Fund | $ | 108 | ||||
| Total exchange traded funds | |||||||
| (cost $106) | $ | 108 | |||||
| Total long-term investments | |||||||
| (cost $88,866) | $ | 100,999 | |||||
The accompanying notes are an integral part of these financial statements.
| Shares or Principal Amount | Market Value ╪ | |||||||
| SHORT-TERM INVESTMENTS - 0.3% | ||||||||
| Repurchase Agreements - 0.3% | ||||||||
| Bank of America Merrill Lynch TriParty Joint | ||||||||
| Repurchase Agreement (maturing on | ||||||||
| 07/01/2011 in the amount of $29, | ||||||||
| collateralized by FHLB 4.91%, 2015, | ||||||||
| GNMA 0.87% - 5.72%, 2025 - 2061, value | ||||||||
| of $29) | ||||||||
| $ | 29 | 0.05%, 06/30/2011 | $ | 29 | ||||
| BNP Paribas Securities Corp. TriParty Joint | ||||||||
| Repurchase Agreement (maturing on | ||||||||
| 07/01/2011 in the amount of $21, | ||||||||
| collateralized by FNMA 3.50% - 6.50%, | ||||||||
| 2023 - 2041, value of $22) | ||||||||
| 21 | 0.05%, 06/30/2011 | 21 | ||||||
| Deutsche Bank Securities TriParty Joint | ||||||||
| Repurchase Agreement (maturing on | ||||||||
| 07/01/2011 in the amount of $208, | ||||||||
| collateralized by GNMA 4.00% - 7.00%, | ||||||||
| 2035 - 2040, value of $212) | ||||||||
| 208 | 0.05%, 06/30/2011 | 208 | ||||||
| UBS Securities, Inc. Joint Repurchase | ||||||||
| Agreement (maturing on 07/01/2011 in the | ||||||||
| amount of $-, collateralized by U.S. | ||||||||
| Treasury Bill 0.63%, 2012, value of $-) | ||||||||
| – | 0.01%, 06/30/2011 | – | ||||||
| UBS Securities, Inc. TriParty Joint Repurchase | ||||||||
| Agreement (maturing on 07/01/2011 in the | ||||||||
| amount of $32, collateralized by FHLMC | ||||||||
| 4.50%, 2040, FNMA 4.50% - 6.00%, 2035 - | ||||||||
| 2041, value of $32) | ||||||||
| 32 | 0.06%, 06/30/2011 | 32 | ||||||
| 290 | ||||||||
| Total short-term investments | ||||||||
| (cost $290) | $ | 290 | ||||||
| Total investments | ||||||||
| (cost $89,156) ▲ | 99.9 | % | $ | 101,289 | ||||
| Other assets and liabilities | 0.1 | % | 56 | |||||
| Total net assets | 100.0 | % | $ | 101,345 | ||||
| Note: | Percentage of investments as shown is the ratio of the total market value to total net assets. Market value of investments in foreign securities represents 51.8% of total net assets at June 30, 2011. |
Prices of foreign equities that are principally traded on certain foreign markets may be adjusted daily pursuant to a fair value pricing service approved by the Board of Directors in order to reflect an adjustment for factors occurring after the close of certain foreign markets but before the close of the New York Stock Exchange.
| ▲ | At June 30, 2011, the cost of securities for federal income tax purposes was $91,896 and the aggregate gross unrealized appreciation and depreciation based on that cost were: |
| Unrealized Appreciation | $ | 14,772 | ||
| Unrealized Depreciation | (5,379 | ) | ||
| Net Unrealized Appreciation | $ | 9,393 |
The accompanying notes are an integral part of these financial statements.
| Hartford Global Research HLS Fund |
| Schedule of Investments – (continued) |
| June 30, 2011 (Unaudited) |
| (000’s Omitted) |
| † | The aggregate value of securities valued in good faith at fair value as determined under policies and procedures established by and under the supervision of the Company's Board of Directors at June 30, 2011, was $11, which represents 0.01% of total net assets. This amount excludes securities that are principally traded in certain foreign markets and whose prices are adjusted pursuant to a third party pricing service methodology approved by the Board of Directors. |
| ● | Currently non-income producing. |
| ■ | Securities issued within terms of a private placement memorandum, exempt from registration under Rule 144A under the Securities Act of 1933, as amended, and may be sold only to qualified institutional buyers. Pursuant to guidelines adopted by the Board of Directors, these issues are determined to be liquid. At June 30, 2011, the aggregate value of these securities was $295, which represents 0.29% of total net assets. |
| § | These securities were sold to the Fund under Regulation S, rules governing offers and sales made outside the United States without registration under the Securities Act of 1933. The Fund may only be able to resell these securities in the United States if an exemption from registration under the federal and state securities laws is available, or the Fund may only be able to sell these securities outside of the United States (such as on a foreign exchange) to a non-U.S. person. Unless otherwise indicated, these holdings are determined to be liquid. At June 30, 2011, the aggregate value of these securities amounted to $110, which represents 0.11% of total net assets. |
| ⌂ | The following securities are considered illiquid. Illiquid securities are often purchased in private placement transactions, are often not registered under the Securities Act of 1933 and may have contractual restrictions on resale. A security may also be considered illiquid if the security lacks a readily available market or if its valuation has not changed for a certain period of time. |
| Period Acquired | Shares/ Par | Security | Cost Basis | ||||||
| 06/2011 | – | Cetip S.A. - Balcao Organizado - Receipt Shares | $ | 1 | |||||
| 02/2011 | 1 | GLG Life Technology Corp. Warrants | – | ||||||
| 10/2009-04/2011 | 1 | Longtop Financial Technologies Ltd. | 36 | ||||||
| 10/2010 | 14 | Quest Rare Minerals Ltd. Warrants | – | ||||||
The aggregate value of these securities at June 30, 2011, was $36, which represents 0.04% of total net assets.
Foreign Currency Contracts Outstanding at June 30, 2011
| Unrealized | |||||||||||||||||
| Description | Counterparty | Buy / Sell | Market Value ╪ | Contract Amount | Delivery Date | Appreciation/ (Depreciation) | |||||||||||
| British Pound | Deutsche Bank Securities | Buy | $ | 107 | $ | 107 | 07/01/2011 | $ | – | ||||||||
| Canadian Dollar | Citibank | Sell | 132 | 129 | 07/12/2011 | (3 | ) | ||||||||||
| Danish Krone | UBS AG | Sell | 26 | 26 | 07/05/2011 | – | |||||||||||
| Japanese Yen | JP Morgan Securities | Sell | 784 | 773 | 08/05/2011 | (11 | ) | ||||||||||
| Japanese Yen | Westpac International | Buy | 59 | 60 | 08/05/2011 | (1 | ) | ||||||||||
| Japanese Yen | Westpac International | Sell | 41 | 39 | 08/05/2011 | (2 | ) | ||||||||||
| Japanese Yen | Westpac International | Sell | 81 | 77 | 03/15/2012 | (4 | ) | ||||||||||
| Japanese Yen | Westpac International | Sell | 434 | 443 | 03/15/2012 | 9 | |||||||||||
| Norwegian Krone | Goldman Sachs | Buy | 11 | 11 | 07/01/2011 | – | |||||||||||
| $ | (12 | ) | |||||||||||||||
| ╪ | See Significant Accounting Policies of accompanying Notes to Financial Statements regarding valuation of securities. |
The accompanying notes are an integral part of these financial statements.
| Investment Valuation Hierarchy Level Summary |
| June 30, 2011 (Unaudited) |
| (000’s Omitted) |
| Total | Level 1 ♦ | Level 2 ♦ | Level 3 | |||||||||||||
| Assets: | ||||||||||||||||
| Common Stocks | ||||||||||||||||
| Argentina | $ | 85 | $ | 85 | $ | – | $ | – | ||||||||
| Australia | 1,805 | 294 | 1,511 | – | ||||||||||||
| Austria | 100 | – | 100 | – | ||||||||||||
| Belgium | 558 | – | 558 | – | ||||||||||||
| Brazil | 3,711 | 3,711 | – | – | ||||||||||||
| Canada | 4,153 | 4,153 | – | – | ||||||||||||
| China | 508 | 284 | 213 | 11 | ||||||||||||
| Denmark | 544 | 186 | 358 | – | ||||||||||||
| Egypt | 81 | 81 | – | – | ||||||||||||
| Finland | 131 | – | 131 | – | ||||||||||||
| France | 5,050 | – | 5,050 | – | ||||||||||||
| Germany | 1,795 | 56 | 1,739 | – | ||||||||||||
| Hong Kong | 3,604 | 647 | 2,957 | – | ||||||||||||
| India | 1,680 | 375 | 1,305 | – | ||||||||||||
| Indonesia | 325 | 121 | 204 | – | ||||||||||||
| Ireland | 577 | 491 | 86 | – | ||||||||||||
| Israel | 747 | 747 | – | – | ||||||||||||
| Italy | 549 | 123 | 426 | – | ||||||||||||
| Japan | 7,332 | – | 7,332 | – | ||||||||||||
| Jersey | 303 | 303 | – | – | ||||||||||||
| Kazakhstan | 110 | 110 | – | – | ||||||||||||
| Liechtenstein | 164 | 164 | – | – | ||||||||||||
| Luxembourg | 336 | 125 | 211 | – | ||||||||||||
| Malaysia | 404 | – | 404 | – | ||||||||||||
| Mexico | 357 | 357 | – | – | ||||||||||||
| Netherlands | 1,253 | 332 | 921 | – | ||||||||||||
| Norway | 1,520 | 73 | 1,447 | – | ||||||||||||
| Papua New Guinea | 144 | – | 144 | – | ||||||||||||
| Philippines | 411 | 56 | 355 | – | ||||||||||||
| Poland | 197 | – | 197 | – | ||||||||||||
| Russia | 454 | 454 | – | – | ||||||||||||
| Singapore | 1,319 | 64 | 1,255 | – | ||||||||||||
| South Africa | 287 | 153 | 134 | – | ||||||||||||
| South Korea | 964 | 400 | 564 | – | ||||||||||||
| Spain | 366 | 64 | 302 | – | ||||||||||||
| Sweden | 56 | – | 56 | – | ||||||||||||
| Switzerland | 2,481 | 659 | 1,822 | – | ||||||||||||
| Taiwan | 413 | – | 413 | – | ||||||||||||
| Thailand | 291 | 73 | 218 | – | ||||||||||||
| Turkey | 128 | – | 128 | – | ||||||||||||
| United Kingdom | 6,990 | 335 | 6,655 | – | ||||||||||||
| United States | 48,342 | 48,342 | – | – | ||||||||||||
| Total | 100,625 | 63,418 | 37,196 | 11 | ||||||||||||
| Exchange Traded Funds | 108 | 108 | – | – | ||||||||||||
| Preferred Stocks | 242 | 242 | – | – | ||||||||||||
| Warrants | 24 | – | 24 | – | ||||||||||||
| Short-Term Investments | 290 | – | 290 | – | ||||||||||||
| Total | $ | 101,289 | $ | 63,768 | $ | 37,510 | $ | 11 | ||||||||
| Foreign Currency Contracts* | 9 | – | 9 | – | ||||||||||||
| Total | $ | 9 | $ | – | $ | 9 | $ | – | ||||||||
| Liabilities: | ||||||||||||||||
| Foreign Currency Contracts* | 21 | – | 21 | – | ||||||||||||
| Total | $ | 21 | $ | – | $ | 21 | $ | – | ||||||||
| ♦ | For the six-month period ended June 30, 2011, there were no significant transfers between Level 1 and Level 2. |
| * | Derivative instruments not reflected in the Schedule of Investments are valued at the unrealized appreciation/depreciation on the investments. |
The accompanying notes are an integral part of these financial statements.
| Hartford Global Research HLS Fund |
| Investment Valuation Hierarchy Level Summary – (continued) |
| June 30, 2011 (Unaudited) |
| (000’s Omitted) |
Following is a reconciliation of Level 3 assets for which significant unobservable inputs were used to determine fair value:
| Balance as | Change in | |||||||||||||||||||||||||||||||||||
| of | Realized | Unrealized | Transfers | Transfers | Balance | |||||||||||||||||||||||||||||||
| December | Gain | Appreciation | Net | Into | Out of | as of June | ||||||||||||||||||||||||||||||
| 31, 2010 | (Loss) | (Depreciation) | Amortization | Purchases | Sales | Level 3 * | Level 3* | 30, 2011 | ||||||||||||||||||||||||||||
| Assets: | ||||||||||||||||||||||||||||||||||||
| Common Stocks | $ | — | $ | 1 | $ | (33 | )† | $ | — | $ | 20 | $ | (21 | ) | $ | 44 | $ | — | $ | 11 | ||||||||||||||||
| Total | $ | — | $ | 1 | $ | (33 | ) | $ | — | $ | 20 | $ | (21 | ) | $ | 44 | $ | — | $ | 11 | ||||||||||||||||
| * | Securities are transferred into and out of Level 3 for a variety of reasons including, but not limited to: |
1) Securities where trading has been halted (transfer into Level 3) or securities where trading has resumed (transfer out of Level 3).
2) Broker quoted securities (transfer into Level 3) or quoted prices in active markets (transfer out of Level 3).
3) Securities that have certain restrictions on trading (transfer into Level 3) or securities where trading restrictions have expired (transfer out of Level 3).
| † | Change in unrealized appreciation or depreciation in the current period relating to assets still held at June 30, 2011 was $(33). |
The accompanying notes are an integral part of these financial statements.
| Statement of Assets and Liabilities |
| June 30, 2011 (Unaudited) |
| (000’s Omitted) |
| Assets: | ||||
| Investments in securities, at market value (cost $89,156) | $ | 101,289 | ||
| Cash | 6 | |||
| Foreign currency on deposit with custodian (cost $80) | 80 | |||
| Unrealized appreciation on foreign currency contracts | 9 | |||
| Receivables: | ||||
| Investment securities sold | 951 | |||
| Fund shares sold | 25 | |||
| Dividends and interest | 189 | |||
| Other assets | 10 | |||
| Total assets | 102,559 | |||
| Liabilities: | ||||
| Unrealized depreciation on foreign currency contracts | 21 | |||
| Payables: | ||||
| Investment securities purchased | 723 | |||
| Fund shares redeemed | 426 | |||
| Investment management fees | 15 | |||
| Distribution fees | 1 | |||
| Accrued expenses | 28 | |||
| Total liabilities | 1,214 | |||
| Net assets | $ | 101,345 | ||
| Summary of Net Assets: | ||||
| Capital stock and paid-in-capital | $ | 106,444 | ||
| Accumulated undistributed net investment income | 685 | |||
| Accumulated net realized loss on investments and foreign currency transactions | (17,908 | ) | ||
| Unrealized appreciation of investments and the translations of assets and liabilities denominated in foreign currency | 12,124 | |||
| Net assets | $ | 101,345 | ||
| Shares authorized | 800,000 | |||
| Par value | $ | 0.001 | ||
Class IA: Net asset value per share | $ | 10.48 | ||
| Shares outstanding | 6,432 | |||
| Net assets | $ | 67,419 | ||
Class IB: Net asset value per share | $ | 10.45 | ||
| Shares outstanding | 3,246 | |||
| Net assets | $ | 33,926 | ||
The accompanying notes are an integral part of these financial statements.
| Statement of Operations |
| For the Six-Month Period Ended June 30, 2011 (Unaudited) |
| (000’s Omitted) |
| Investment Income: | ||||
| Dividends | $ | 1,359 | ||
| Interest | — | |||
| Less: Foreign tax withheld | (148 | ) | ||
| Total investment income, net | 1,211 | |||
| Expenses: | ||||
| Investment management fees | 470 | |||
| Transfer agent fees | — | |||
| Distribution fees - Class IB | 44 | |||
| Custodian fees | 29 | |||
| Accounting services fees | 8 | |||
| Board of Directors' fees | 2 | |||
| Audit fees | 6 | |||
| Other expenses | 15 | |||
| Total expenses (before fees paid indirectly) | 574 | |||
| Commission recapture | (1 | ) | ||
| Total fees paid indirectly | (1 | ) | ||
| Total expenses, net | 573 | |||
| Net investment income | 638 | |||
| Net Realized Gain on Investments, Other Financial Instruments and Foreign Currency Transactions: | ||||
| Net realized gain on investments | 8,849 | |||
| Net realized gain on futures | 4 | |||
| Net realized loss on foreign currency contracts | (110 | ) | ||
| Net realized gain on other foreign currency transactions | 35 | |||
| Net Realized Gain on Investments, Other Financial Instruments and Foreign Currency Transactions | 8,778 | |||
| Net Changes in Unrealized Depreciation of Investments, Other Financial Instruments and Foreign Currency Transactions: | ||||
| Net unrealized depreciation of investments | (3,988 | ) | ||
| Net unrealized depreciation of futures | (2 | ) | ||
| Net unrealized appreciation of foreign currency contracts | 76 | |||
| Net unrealized appreciation on translation of other assets and liabilities in foreign currencies | 3 | |||
| Net Changes in Unrealized Depreciation of Investments, Other Financial Instruments and Foreign Currency Transactions | (3,911 | ) | ||
| Net Gain on Investments, Other Financial Instruments and Foreign Currency Transactions | 4,867 | |||
| Net Increase in Net Assets Resulting from Operations | $ | 5,505 | ||
The accompanying notes are an integral part of these financial statements.
| Statement of Changes in Net Assets |
| (000’s Omitted) |
| For the | ||||||||
| Six-Month | For the | |||||||
| Period Ended | Year Ended | |||||||
| June 30, 2011 | December 31, | |||||||
| (Unaudited) | 2010 | |||||||
| Operations: | ||||||||
| Net investment income | $ | 638 | $ | 937 | ||||
| Net realized gain on investments, other financial instruments and foreign currency transactions | 8,778 | 10,117 | ||||||
| Net unrealized appreciation (depreciation) of investments, other financial instruments and foreign currency transactions | (3,911 | ) | 3,166 | |||||
| Net Increase In Net Assets Resulting From Operations | 5,505 | 14,220 | ||||||
| Distributions to Shareholders: | ||||||||
| From net investment income | ||||||||
| Class IA | — | (780 | ) | |||||
| Class IB | — | (320 | ) | |||||
| Total distributions | — | (1,100 | ) | |||||
| Capital Share Transactions: | ||||||||
| Class IA | ||||||||
| Sold | 10,002 | 18,546 | ||||||
| Issued on reinvestment of distributions | — | 780 | ||||||
| Redeemed | (15,999 | ) | (25,084 | ) | ||||
| Total capital share transactions | (5,997 | ) | (5,758 | ) | ||||
| Class IB | ||||||||
| Sold | 4,023 | 8,413 | ||||||
| Issued on reinvestment of distributions | — | 320 | ||||||
| Redeemed | (7,700 | ) | (15,288 | ) | ||||
| Total capital share transactions | (3,677 | ) | (6,555 | ) | ||||
| Net decrease from capital share transactions | (9,674 | ) | (12,313 | ) | ||||
| Net Increase (Decrease) In Net Assets | (4,169 | ) | 807 | |||||
| Net Assets: | ||||||||
| Beginning of period | 105,514 | 104,707 | ||||||
| End of period | $ | 101,345 | $ | 105,514 | ||||
| Accumulated undistributed (distribution in excess of) net investment income | $ | 685 | $ | 47 | ||||
| Shares: | ||||||||
| Class IA | ||||||||
| Sold | 963 | 2,074 | ||||||
| Issued on reinvestment of distributions | — | 82 | ||||||
| Redeemed | (1,545 | ) | (2,869 | ) | ||||
| Total share activity | (582 | ) | (713 | ) | ||||
| Class IB | ||||||||
| Sold | 388 | 954 | ||||||
| Issued on reinvestment of distributions | — | 34 | ||||||
| Redeemed | (746 | ) | (1,738 | ) | ||||
| Total share activity | (358 | ) | (750 | ) | ||||
The accompanying notes are an integral part of these financial statements.
| Notes to Financial Statements |
| June 30, 2011 (Unaudited) |
| (000’s Omitted) |
| 1. | Organization: |
Hartford Global Research HLS Fund (the “Fund”) serves as an underlying investment option for certain variable annuity and variable life insurance separate accounts of Hartford Life Insurance Company (“HLIC”) and its affiliates and certain qualified retirement plans. The Fund may also serve as an underlying investment option for certain variable annuity and variable life separate accounts of other insurance companies. Owners of variable annuity contracts and policyholders of variable life insurance contracts may choose the funds permitted in the variable insurance contract prospectus. In addition, participants in certain qualified retirement plans may choose the Fund if permitted by their plans.
Hartford Series Fund, Inc. (the “Company”) is an open-end registered management investment company comprised of thirty portfolios. Financial Statements for the Fund, a series of the Company, are included in this report.
The Company is organized under the laws of the State of Maryland and is registered with the Securities and Exchange Commission (“SEC”) under the Investment Company Act of 1940, as amended (“1940 Act”). The Fund is a diversified open-end management investment company.
The Fund is divided into Class IA and Class IB shares. Each class is offered at the per share net asset value (“NAV”) without a sales charge and is subject to the same expenses, except that the Class IB shares are subject to distribution and service fees charged pursuant to a Distribution Plan adopted in accordance with Rule 12b-1 under the 1940 Act.
| 2. | Significant Accounting Policies: |
The following is a summary of significant accounting policies of the Fund in the preparation of its financial statements, which are in accordance with the United States Generally Accepted Accounting Principles (“U.S. GAAP”). The preparation of financial statements in accordance with U.S. GAAP may require management to make estimates and assumptions that affect the reported amounts of assets and liabilities and disclosure of contingent assets and liabilities at the date of the financial statements and the reported amounts of increases and decreases in net assets from operations during the reporting period. Actual results could differ from those estimates.
| a) | Determination of Net Asset Value – The NAV of each class of the Fund's shares is determined as of the close of regular trading (normally 4:00 p.m. Eastern Time) (the “NYSE Close”) on each day that the New York Stock Exchange (the “Exchange”) is open (“Valuation Date”). Information that becomes known to the Fund after the NAV has been calculated on a particular day will not generally be used to retroactively adjust the NAV determined earlier that day. |
| b) | Investment Valuation and Fair Value Measurements – For purposes of calculating the NAV, portfolio securities and other assets held by the Fund's portfolio for which market quotes are readily available are valued at market value. Market value is generally determined on the basis of last reported sales prices or official close price. If no sales are reported, market value is based on quotes obtained from a quotation reporting system, established market makers, or independent pricing services. If market prices are not readily available or are deemed unreliable, the Fund will use the fair value of the security as determined in good faith under policies and procedures established by and under the supervision of the Company's Board of Directors. Market quotes are considered not readily available where there is an absence of current or reliable market-based data (e.g., trade information or broker quotes), including where events occur after the close of the relevant market, but prior to the NYSE Close that materially affect the values of the Fund's portfolio securities or assets. In addition, market quotes are considered not readily available when, due to extraordinary circumstances, the exchanges or markets on which the securities trade, do not open for trading for the entire day and no other market prices are available. In addition, prices of foreign equities that are principally traded on certain foreign markets are adjusted daily pursuant to a fair value pricing service approved by the Board of Directors in order to reflect an adjustment for the factors occurring after the close of certain foreign markets but before the NYSE Close. Securities that are primarily |
traded on foreign markets may trade on days that are not business days of the Fund. The value of the foreign securities, in which the Fund invests, may change on days when a shareholder will not be able to purchase or redeem shares of the Fund. Fair value pricing is subjective in nature and the use of fair value pricing by the Fund may cause the NAV of its shares to differ significantly from the NAV that would have been calculated using market prices at the close of the exchange on which a portfolio security is primarily traded. There can be no assurance that the Fund could obtain the fair market value assigned to a security if the Fund were to sell the security at approximately the time at which the Fund determines its NAV.
Exchange traded options, futures and options on futures are valued at the settlement price determined by the relevant exchange as of the NYSE Close. If such instruments do not trade on an exchange, values may be supplied by an independent pricing service using a formula or other objective method that may take into consideration the style, direction, expiration, strike price, notional value and volatility or other adjustments.
Investments valued in currencies other than U.S. dollars are converted to U.S. dollars using exchange rates obtained from independent pricing services for calculation of the NAV. As a result, the NAV of the Fund’s shares may be affected by changes in the value of currencies in relation to the U.S. dollar. The value of securities traded in markets outside the United States or denominated in currencies other than the U.S. dollar may be affected significantly on a day that the NYSE is closed and the market value may change on days when an investor is not able to purchase, redeem or exchange shares of the Fund.
Foreign currency contracts represent agreements to exchange currencies on specific future dates at predetermined rates. Foreign currency contracts are valued using foreign currency exchange rates and forward rates as provided by an independent pricing service on Valuation Date.
Investments in open-end mutual funds are valued at the respective NAV of each open-end mutual fund on the Valuation Date.
Financial instruments for which prices are not available from an independent pricing service may be valued using market quotations obtained from one or more dealers that make markets in the respective financial instrument in accordance with procedures established by the Company’s Board of Directors.
U.S. GAAP defines fair value as the price that the Fund would receive to sell an asset or pay to transfer a liability in an orderly transaction between market participants. The U.S. GAAP fair value measurement standards require disclosure of a fair value hierarchy for each major category of assets and liabilities. Various inputs are used in determining the fair value of the Fund’s investments. These inputs are summarized into three broad hierarchy levels. This hierarchy is based on whether the valuation inputs are observable or unobservable. These levels are:
| · | Level 1 – Quoted prices in active markets for identical securities. Level 1 may include exchange-traded instruments such as domestic equities, some foreign equities, options, futures, mutual funds, exchange-traded funds, rights and warrants. |
| · | Level 2 – Observable inputs other than Level 1 prices, such as quoted prices for similar securities; quoted prices in markets that are not active; or other inputs that are observable or can be corroborated by observable market data. Level 2 may include debt securities that are traded less frequently than exchange-traded instruments and which are valued using third party pricing services; foreign equities, whose value is determined using a multi-factor regression model with inputs that are observable in the market; and short-term securities, which are valued at amortized cost. |
| · | Level 3 – Significant unobservable inputs that are supported by limited or no market activity. Level 3 may include financial instruments whose values are determined using broker quotes or require significant management judgment or estimation. These unobservable valuation inputs may include estimates for current yields, maturity/duration, prepayment speed, and broker quotes for comparable securities along with other |
| Hartford Global Research HLS Fund |
| Notes to Financial Statements – (continued) |
| June 30, 2011 (Unaudited) |
| (000’s Omitted) |
assumptions relating to credit quality, collateral value, complexity of the security structure, general market conditions and liquidity. This category may include securities where trading has been halted or there are certain restrictions on trading. While these securities are priced using unobservable inputs, the valuation of these securities reflects the best available data and management believes the prices are a reasonable representation of exit price.
Valuation levels are not necessarily indicative of the risk associated with investing in such securities. Individual securities within any of the above mentioned asset classes may be assigned a different hierarchical level than those presented above, as individual circumstances dictate.
For additional information, refer to the Investment Valuation Hierarchy Level Summary and the Level 3 roll forward reconciliation which follow the Schedule of Investments.
For purposes of reporting transfers between different hierarchy levels, both transfers in and out of each level, as applicable, are shown as if they occurred at the beginning of the period.
| c) | Security Transactions and Investment Income – Security transactions are recorded as of the trade date (the date the order to buy or sell is executed) for financial reporting purposes. Securities purchased or sold on a when-issued or delayed-delivery basis may be settled a month or more after the trade date. Realized gains and losses are determined on the basis of identified cost. |
Dividend income is accrued as of the ex-dividend date, except that certain dividends from foreign securities where the ex-dividend date may have passed are recorded as soon as the Fund is informed of the dividend. Interest income, including amortization of premium and accretion of discounts, is accrued on a daily basis.
| d) | Foreign Currency Transactions – Assets and liabilities denominated in currencies other than U.S. dollars are translated into U.S. dollars at the exchange rates in effect on the valuation date. Purchases and sales of investment securities, income, and expenses are translated into U.S. dollars at the exchange rates on the dates of such transactions. |
The Fund does not isolate that portion of portfolio security valuation resulting from fluctuations in the foreign currency exchange rates from the fluctuations arising from changes in the market prices of securities held. Exchange rate fluctuations are included with the net realized and unrealized gain or loss on investments in the accompanying financial statements.
Net realized foreign exchange gains or losses arise from sales of foreign currencies and the difference between asset and liability amounts initially stated in foreign currencies and the U.S. dollar value of the amounts actually received or paid. Net unrealized foreign exchange gains or losses arise from changes in the value of other assets and liabilities at the end of the reporting period, resulting from changes in the exchange rates.
| e) | Joint Trading Account – The Fund may invest cash balances into a joint trading account that may be invested in one or more repurchase agreements. |
| f) | Fund Share Valuation and Dividend Distributions to Shareholders – Orders for the Fund’s shares are executed in accordance with the investment instructions of the contract holders and plan participants. The NAV of the Fund’s shares is determined as of the close of business on each business day of the Exchange. The NAV is determined separately for each class of shares of the Fund by dividing the Fund’s net assets attributable to that class by the number of shares of the class outstanding. Each class of shares offered by the Fund has equal rights as to assets and voting privileges (except that shareholders of a class have exclusive voting rights regarding any matter relating solely to that class of shares). Income and non-class specific expenses are allocated daily to each class on the basis of the relative net assets of the class. |
Realized and unrealized capital gains and losses of each class are allocated daily based on the relative net assets of each class of shares of the Fund.
Orders for the purchase of the Fund’s shares received prior to the close of the Exchange on any day the Exchange is open for business are priced at the NAV determined as of the close of the Exchange. Orders received after the close of the Exchange, or on a day on which the Exchange and/or the Fund is not open for business, are priced at the next determined NAV.
Dividends are declared pursuant to a policy adopted by the Company’s Board of Directors based upon the investment performance of the Fund. The policy of the Fund is to pay dividends from net investment income and realized capital gains, if any, at least once a year.
Distributions from net investment income, net realized capital gains and capital are determined in accordance with federal income tax regulations, which may differ from U.S. GAAP with respect to character and timing. These differences may include but are not limited to losses deferred due to wash sale adjustments, foreign currency gains and losses, adjustments related to Passive Foreign Investment Companies (“PFICs”), Real Estate Investment Trusts (“REITs”), Regulated Investment Companies (“RICs”), certain derivatives and partnerships. Permanent book and federal income tax basis differences relating to shareholder distributions will result in reclassifications to certain of the Fund’s capital accounts (see Federal Income Taxes: Reclassification of Capital Accounts note).
| 3. | Securities and Other Investments: |
| a) | Repurchase Agreements – A repurchase agreement is an agreement by which a counterparty agrees to sell a security and agrees to repurchase the security sold at a mutually agreed upon time and price. At the time the Fund enters into a repurchase agreement, the value of the underlying collateral security(ies), including accrued interest, will be equal to or exceed the value of the repurchase agreement. Repurchase agreements expose the Fund to counterparty risk. To minimize counterparty risk, the securities that serve to collateralize the repurchase agreement are held by the Fund's custodian in book entry or physical form in the custodial account of the Fund or in a third party custodial account. Repurchase agreements are valued at cost plus accrued interest. The Fund, as shown on the Schedule of Investments, had outstanding repurchase agreements as of June 30, 2011. |
| b) | Illiquid and Restricted Securities – The Fund is permitted to invest up to 15% of its net assets in illiquid securities. Illiquid securities are those that may not be sold or disposed of in the ordinary course of business within seven days, at approximately the price used to determine the Fund’s NAV. The Fund may not be able to sell illiquid securities or other investments when its sub-adviser considers it desirable to do so or may have to sell such securities or investments at a price that is lower than the price that could be obtained if the securities or investments were more liquid. A sale of illiquid securities or other investments may require more time and may result in higher dealer discounts and other selling expenses than does the sale of those that are liquid. Illiquid securities and investments also may be more difficult to value, due to the unavailability of reliable market quotations for such securities or investments, and an investment in them may have an adverse impact on the Fund’s NAV. The Fund may also purchase certain restricted securities that can only be resold to certain qualified investors and may be determined to be liquid pursuant to policies and guidelines established by the Company’s Board of Directors. The Fund, as shown on the Schedule of Investments, had illiquid and/or restricted securities as of June 30, 2011. |
| c) | Securities Purchased on a When-Issued or Delayed-Delivery Basis – Delivery and payment for securities that have been purchased by the Fund on a forward commitment, or when-issued or delayed-delivery basis, take place beyond the customary settlement period. During this period, such securities are subject to market fluctuations, and the Fund identifies securities segregated in its records with value at least equal to the amount of the commitment. The Fund had no outstanding when-issued or delayed delivery securities as of June 30, 2011. |
| Hartford Global Research HLS Fund |
| Notes to Financial Statements – (continued) |
| June 30, 2011 (Unaudited) |
| (000’s Omitted) |
| 4. | Financial Derivative Instruments: |
The following disclosures contain information on how and why the Fund uses derivative instruments, the credit-risk-related contingent features in certain derivative instruments, and how derivative instruments affect the Fund’s financial position, results of operations and cash flows. The location and fair value amounts of these instruments on the Statement of Assets and Liabilities and the realized gains and losses and changes in unrealized gains and losses on the Statement of Operations, each categorized by type of derivative contract, are included in the following Additional Derivative Instrument Information footnote. The derivative instruments outstanding as of period-end are disclosed in the Notes to the Schedule of Investments and the amounts of realized gains and losses and changes in unrealized gains and losses on derivative instruments during the period are disclosed in the Statement of Operations.
| a) | Foreign Currency Contracts – The Fund may enter into foreign currency contracts that obligate the Fund to purchase or sell currencies at specified future dates. Foreign currency contracts are used to hedge the currency exposure associated with some or all of the Fund's securities and/or as part of an investment strategy. Foreign currency contracts are marked to market daily and the change in value is recorded by the Fund as an unrealized gain or loss. Realized gains or losses equal to the difference between the value of the contract at the time it was opened and the value at the time it was closed are recorded upon delivery or receipt of the currency. |
Foreign currency contracts involve elements of market risk in excess of the amounts reflected in the Statement of Assets and Liabilities. In addition, risks may arise upon entering into these contracts from the potential inability of the counterparties to meet the terms of the contracts and from unanticipated movements in the value of the foreign currencies relative to the U.S. dollar. The Fund had outstanding foreign currency contracts as shown on the Schedule of Investments as of June 30, 2011.
| b) | Futures Contracts – The Fund may enter into futures contracts. A futures contract is an agreement between two parties to buy or sell an asset at a set price on a future date. The Fund uses futures contracts to manage or obtain exposure to the securities markets, commodities, or movements in interest rates and currency values. The primary risks associated with the use of futures contracts are the imperfect correlation between the change in market value of the securities held by the Fund and the prices of futures contracts and the possibility of an illiquid market. Upon entering into a futures contract, the Fund is required to deposit with a futures commission merchant (“FCM”), an amount of cash or U.S. Government or Agency Obligations in accordance with the initial margin requirements of the broker or exchange. Futures contracts are marked to market daily at the most recent settlement price reported by an exchange on which, over time, they are traded most extensively, and an appropriate payable or receivable for the change in value (“variation margin”) is recorded by the Fund. Gains or losses are recognized but not considered realized until the contracts expire or are closed. Futures contracts involve, to varying degrees, risk of loss in excess of the variation margin disclosed on the Statement of Assets and Liabilities, however, this risk is reduced through the use of an FCM. As of June 30, 2011, the Fund had no outstanding futures contracts. |
| c) | Additional Derivative Instrument Information: |
Fair Values of Derivative Instruments on the Statement of Assets and Liabilities as of June 30, 2011:
| Risk Exposure Category | ||||||||||||||||||||||||||||
| Foreign | ||||||||||||||||||||||||||||
| Interest Rate | Exchange | Credit | Equity | Commodity | Other | |||||||||||||||||||||||
| Contracts | Contracts | Contracts | Contracts | Contracts | Contracts | Total | ||||||||||||||||||||||
| Assets: | ||||||||||||||||||||||||||||
| Unrealized appreciation on foreign currency contracts | $ | — | $ | 9 | $ | — | $ | — | $ | — | $ | — | $ | 9 | ||||||||||||||
| Total | $ | — | $ | 9 | $ | — | $ | — | $ | — | $ | — | $ | 9 | ||||||||||||||
| Liabilities: | ||||||||||||||||||||||||||||
| Unrealized depreciation on foreign currency contracts | $ | — | $ | 21 | $ | — | $ | — | $ | — | $ | — | $ | 21 | ||||||||||||||
| Total | $ | — | $ | 21 | $ | — | $ | — | $ | — | $ | — | $ | 21 | ||||||||||||||
The volume of derivatives that is presented in the Schedule of Investments is consistent with the derivative activity during the six-month period ended June 30, 2011.
The Effect of Derivative Instruments on the Statement of Operations for the six-month period ended June 30, 2011:
| Risk Exposure Category | ||||||||||||||||||||||||||||
| Foreign | ||||||||||||||||||||||||||||
| Interest Rate | Exchange | Credit | Equity | Commodity | Other | |||||||||||||||||||||||
| Contracts | Contracts | Contracts | Contracts | Contracts | Contracts | Total | ||||||||||||||||||||||
| Realized Gain (Loss) on Derivatives Recognized as a Result from Operations: | ||||||||||||||||||||||||||||
| Net realized gain on futures | $ | — | $ | — $ | — | $ | 4 | $ | — | $ | — | $ | 4 | |||||||||||||||
| Net realized loss on foreign currency contracts | — | (110 | ) | — | — | — | — | (110 | ) | |||||||||||||||||||
| Total | $ | — | $ | (110 | ) | $ | — | $ | 4 | $ | — | $ | — | $ | (106 | ) | ||||||||||||
| Net Change in Unrealized Appreciation (Depreciation) on Derivatives Recognized as a Result from Operations: | ||||||||||||||||||||||||||||
| Net change in unrealized depreciation of futures | $ | — | $ | — | $ | — | $ | (2 | ) | $ | — | $ | — | $ | (2 | ) | ||||||||||||
| Net change in unrealized depreciation of foreign currency contracts | — | 76 | — | — | — | — | 76 | |||||||||||||||||||||
| Total | $ | — | $ | 76 | $ | — | $ | (2 | ) | $ | — | $ | — | $ | 74 | |||||||||||||
| 5. | Principal Risks: |
| a) | Counterparty Risk – The Fund may be exposed to counterparty risk, or the risk that an institution or other entity with which the Fund has unsettled or open transactions will default. |
| b) | Market Risks – If a Fund invests directly in foreign currencies or in securities that trade in, and receive revenues in, foreign currencies, or in derivatives that provide exposure to foreign currencies, it will be subject to the risk that those currencies will decline in value relative to the base currency of the Fund, or, in the case of hedging positions, that the Fund’s base currency will decline in value relative to the currency being hedged. Currency rates in foreign countries may fluctuate significantly over short periods of time for a number of reasons, including changes in interest rates, intervention (or the failure to intervene) by U.S. or foreign governments, central banks or supranational entities such as the International Monetary Fund, or by the imposition of currency controls or other political developments in the United States or abroad. As a result, the Fund’s investments in foreign currency denominated securities may reduce the returns of the Fund. The market values of equity securities, such as common stocks and preferred stocks or equity related investments such as futures and options, may decline due to general market conditions which are not specifically related to a particular company, such as real or perceived adverse economic conditions, changes in the general outlook for |
| Hartford Global Research HLS Fund |
| Notes to Financial Statements – (continued) |
| June 30, 2011 (Unaudited) |
| (000’s Omitted) |
corporate earnings, changes in interest or currency rates or adverse investor sentiment generally. The market value of equity securities may also decline due to factors which affect a particular industry or industries, such as labor shortages or increased production costs and competitive conditions within an industry. Equity securities and equity related investments generally have greater market price volatility than fixed income securities.
| 6. | Federal Income Taxes: |
| a) | Federal Income Taxes – For federal income tax purposes, the Fund intends to continue to qualify as a RIC under Subchapter M of the Internal Revenue Code (“IRC”) by distributing substantially all of its taxable net investment income and net realized capital gains to its shareholders and otherwise complying with the requirements of RICs. The Fund has distributed substantially all of its income and capital gains in prior years, if applicable, and intends to distribute substantially all of its income and capital gains prior to the next fiscal year-end. Accordingly, no provision for federal income or excise taxes has been made in the accompanying financial statements. Distributions from short-term capital gains are treated as ordinary income distributions for federal income tax purposes. |
| b) | Net Investment Income (Loss), Net Realized Gains (Losses) – Net investment income (loss) and net realized gains (losses) may differ for financial statement and tax purposes primarily because of losses deferred due to wash sale adjustments, foreign currency gains and losses, adjustments related to PFICs, REITs, RICs, certain derivatives and partnerships. The character of distributions made during the year from net investment income or net realized gains may differ from their ultimate characterization for federal income tax purposes. Also, due to the timing of dividend distributions, the fiscal year in which amounts are distributed may differ from the year that the income or realized gains (losses) were recorded by the Fund. |
| c) | Distributions and Components of Distributable Earnings – The tax character of distributions paid by the Fund for the periods indicated is as follows (as adjusted for dividends payable): |
| For the Year Ended | For the Year Ended | |||||||
| December 31, 2010 | December 31, 2009 | |||||||
| Ordinary Income | $ | 1,100 | $ | 831 | ||||
As of December 31, 2010, the Fund’s components of distributable earnings (deficit) on a tax basis were as follows:
| Amount | ||||
| Undistributed Ordinary Income | $ | 300 | ||
| Accumulated Capital and Other Losses* | (24,284 | ) | ||
| Unrealized Appreciation† | 13,380 | |||
| Total Accumulated Deficit | $ | (10,604 | ) | |
| * | The Fund has capital loss carryforwards that are identified in the Capital Loss Carryforward note that follows. |
| † | The difference between book-basis and tax-basis unrealized appreciation (depreciation) may be attributable to the losses deferred due to wash sale adjustments, foreign currency gains and losses, adjustments related to PFICs, REITs, RICs, certain derivatives and partnerships. |
| d) | Reclassification of Capital Accounts – The Fund may record reclassifications in its capital accounts. These reclassifications have no impact on the total net assets of the Fund. The reclassifications are a result of permanent differences between U.S. GAAP and tax accounting for such items as expiration or utilization of capital loss carryforwards or net operating losses. Adjustments are made to reflect the impact these items have on current and future distributions to shareholders. Therefore, the source of the Fund’s distributable income may be shown in the accompanying Statement of Assets and Liabilities as from accumulated undistributed net investment income, from |
accumulated net realized gains on investments or from capital depending on the type of book and tax differences that exist. For the year ended December 31, 2010, the Fund recorded reclassifications to increase (decrease) the accounts listed below:
| Amount | ||||
| Accumulated Undistributed Net Investment Income | $ | 109 | ||
| Accumulated Net Realized Gain (Loss) on Investments and Foreign Currency Transactions | (109 | ) | ||
| e) | Capital Loss Carryforward – At December 31, 2010 (tax-year-end), the Fund had capital loss carryforwards for U.S. federal income tax purposes of approximately: |
| Year of Expiration | Amount | |||
| 2016 | $ | 2,669 | ||
| 2017 | 21,614 | |||
| Total | $ | 24,283 | ||
As of December 31, 2010, the Fund utilized $8,109 of prior year capital loss carryforwards.
| As of December 31, 2010, the Fund elected to defer the following post-October losses: | ||||
| Amount | ||||
| Ordinary Income | $ | 1 | ||
| f) | Accounting for Uncertainty in Income Taxes – The Fund has adopted financial reporting rules that require the Fund to analyze all open tax years, as defined by the Statute of Limitations, for all major jurisdictions. Generally, tax authorities can examine all tax returns filed for the last three years. The Fund does not have an examination in progress. |
The Fund has reviewed all open tax years and major jurisdictions and concluded that these financial reporting rules had no effect on the Fund’s financial position or results of operations. There is no tax liability resulting from unrecognized tax benefits relating to uncertain income tax positions taken or expected to be taken on the tax return for the fiscal year-end December 31, 2010. The Fund is also not aware of any tax positions for which it is reasonably possible that the total amounts of unrecognized tax benefits will significantly change in the next twelve months.
| 7. | Expenses: |
| a) | Investment Management Agreements – HL Investment Advisors, LLC (“HL Advisors”), an indirect wholly owned subsidiary of The Hartford Financial Services Group, Inc. (“The Hartford”), serves as investment manager to the Fund pursuant to an Investment Management Agreement with the Company. As investment manager, HL Advisors has overall investment supervisory responsibility for the Fund. In addition, HL Advisors provides administrative personnel, services, equipment, facilities and office space for proper operation of the Fund. HL Advisors has contracted with Wellington Management Company, LLP (“Wellington Management”) under a sub-advisory agreement for the provision of day-today investment management services to the Fund in accordance with the Fund’s investment objective and policies. The Fund pays a fee to HL Advisors, a portion of which may be used to compensate Wellington Management. |
| Hartford Global Research HLS Fund |
| Notes to Financial Statements – (continued) |
| June 30, 2011 (Unaudited) |
| (000’s Omitted) |
The schedule below reflects the rates of compensation paid to HL Advisors for investment management services rendered as of June 30, 2011; the rates are accrued daily and paid monthly.
| Average Daily Net Assets | Annual Fee | |||
| On first $500 million | 0.9000 | % | ||
| On next $500 million | 0.8750 | % | ||
| On next $4 billion | 0.8500 | % | ||
| On next $5 billion | 0.8475 | % | ||
| Over $10 billion | 0.8450 | % | ||
| b) | Accounting Services Agreement – Pursuant to the Fund Accounting Agreement between HLIC and the Company, on behalf of the Fund, HLIC provides accounting services to the Fund and receives monthly compensation based on the Fund’s average net assets at the rates set forth below. The Fund’s accounting services fees are accrued daily and paid monthly. |
| Average Daily Net Assets | Annual Fee | |||
| On first $5 billion | 0.016 | % | ||
| On next $5 billion | 0.014 | % | ||
| Over $10 billion | 0.012 | % | ||
| c) | Operating Expenses – Allocable expenses incurred by the Company are allocated to each Fund and allocated to classes within a Fund in proportion to the average daily net assets of the Fund and each class, except where allocation of certain expenses is more fairly made directly to the Fund or to specific classes within a Fund. |
| d) | Fees Paid Indirectly – The Company, on behalf of the Fund, has entered into agreements with State Street Global Markets, LLC and Russell Implementation Services, Inc. to partially recapture non-discounted trade commissions. Such rebates are used to pay a portion of the Fund’s expenses. In addition, the Fund’s custodian bank has also agreed to reduce its fees when the Fund maintains cash on deposit in a non-interest-bearing custody account. For the six-month period ended June 30, 2011, these amounts are included in the Statement of Operations. |
The ratio of expenses to average net assets in the accompanying financial highlights excludes the reduction in expenses related to fees paid indirectly. The annualized expense ratio for the period listed below including the fees paid indirectly is as follows:
| Annualized Six- | ||||
| Month Period | ||||
| Ended June 30, | ||||
| 2011 | ||||
| Class IA | 1.01 | % | ||
| Class IB | 1.26 | |||
| e) | Distribution Plan for Class IB shares – The Company, on behalf of the Fund, has adopted a Distribution Plan pursuant to Rule 12b-1 of the 1940 Act to compensate the Distributor, Hartford Securities Distribution Company, Inc. (a wholly owned, ultimate subsidiary of The Hartford), from assets attributable to the Class IB shares for services rendered and expenses borne in connection with activities primarily intended to result in the sale of the Class IB shares, subject to the review and approval of the Company’s Board of Directors. |
The Distribution Plan provides that the Fund may pay annually up to 0.25% of the average daily net assets of the Fund attributable to its Class IB shares for activities primarily intended to result in the sale of Class IB shares. The Board has the authority to suspend or reduce these payments at any point in time. Under the terms of the Distribution Plan and the
principal underwriting agreement, the Fund is authorized to make payments monthly to the Distributor that may be used to pay or compensate entities providing distribution and shareholder servicing with respect to the Class IB shares for such entities’ fees or expenses incurred or paid in that regard. These fees are accrued daily and paid monthly.
| f) | Other Related Party Transactions – Certain officers of the Fund are directors and/or officers of HL Advisors and/or The Hartford or its subsidiaries. For the six-month period ended June 30, 2011, a portion of the Fund’s chief compliance officer’s salary was paid by all the investment companies in the Hartford fund complex. The portion allocated to the Fund rounds to zero. Hartford Administrative Services Company (“HASCO”), an indirect wholly owned subsidiary of The Hartford, provides transfer agent services to the Fund. The amount paid to HASCO can be found in the Statement of Operations. These fees are accrued daily and paid monthly. |
| g) | Payment from Affiliate – In July of 2007, The Hartford entered into a settlement with the Attorneys General of the states of New York, Connecticut and Illinois relating to market timing and the company's individual variable annuity contracts in which certain payments would be made directly to the variable annuity contract holders. The distribution plan provided that unclaimed money from the settlement would be distributed to certain HLS Funds that are investment options through a Hartford individual variable annuity contract. The unclaimed money was distributed to the Fund on September 18, 2009, as follows: |
| Amount | ||||
| Reimbursement | $ | 15 | ||
The total return in the accompanying financial highlights includes a payment from an affiliate. Had the payment from the affiliate been excluded, the impact and total return for the period listed below would have been as follows:
| For the Year Ended December 31, 2009 | ||||||||
| Class IA | Class IB | |||||||
| Impact from Payment from Affiliate for Attorneys General Settlement | 0.02 | % | 0.02 | % | ||||
| Total Return Excluding Payment from Affiliate | 42.10 | 41.76 | ||||||
| 8. | Investment Transactions: |
For the six-month period ended June 30, 2011, the Fund's aggregate purchases and sales of investment securities (excluding short-term investments) were as follows:
| Amount | ||||
| Cost of Purchases Excluding U.S. Government Obligations | $ | 49,061 | ||
| Sales Proceeds Excluding U.S. Government Obligations | 56,928 | |||
| 9. | Line of Credit: |
The Fund is one of several Hartford funds that participate in a $500 million committed revolving line of credit facility. The facility is to be used for temporary or emergency purposes. Under the arrangement, a fund is required to own securities having a market value in excess of 300% of the total bank borrowings. The interest rate on borrowings varies depending on the nature of the loan. The facility also requires a fee to be paid based on the amount of the commitment. This commitment fee is allocated to all the funds participating in the line of credit based on the average net assets of the funds. During the six-month period ended June 30, 2011, the Fund did not have any borrowings under this facility.
| Hartford Global Research HLS Fund |
| Notes to Financial Statements – (continued) |
| June 30, 2011 (Unaudited) |
| (000’s Omitted) |
| 10. | Industry Classifications: |
Other than the industry classifications “Other Investment Pools and Funds” and “Exchange Traded Funds,” equity industry classifications used in this report are the Global Industry Classification Standard, which was developed by and is the exclusive property and service mark of MSCI, Inc. and Standard & Poor’s.
| 11. | Indemnifications: |
Under the Company’s organizational documents, the Company shall indemnify its officers and directors to the full extent required or permitted under Maryland General Corporation Law and the federal securities laws. In addition, the Company, on behalf of the Fund, may enter into contracts that contain a variety of indemnifications. The Company’s maximum exposure under these arrangements is unknown. However, as of the date of these financial statements the Company has not had prior claims or losses pursuant to these contracts and expects the risk of loss to be remote.
[This page is intentionally left blank]
| Financial Highlights |
| - Selected Per-Share Data (A) - |
| Net Asset | Net Realized | Net Increase | ||||||||||||||||||||||||||||||||
| Value at | and Unrealized | Total from | Dividends from | Distributions | (Decrease) in | Net Asset | ||||||||||||||||||||||||||||
| Beginning of | Net Investment | Payments from | Gain (Loss) on | Investment | Net Investment | from Realized | Distributions | Total | Net Asset | Value at End of | ||||||||||||||||||||||||
| Class | Period | Income (Loss) | (to) Affiliate | Investments | Operations | Income | Capital Gains | from Capital | Distributions | Value | Period | |||||||||||||||||||||||
| For the Six-Month Period Ended June 30, 2011 (Unaudited) | ||||||||||||||||||||||||||||||||||
| IA | $ | 9.94 | $ | 0.07 | $ | – | $ | 0.47 | $ | 0.54 | $ | – | $ | – | $ | – | $ | – | $ | 0.54 | $ | 10.48 | ||||||||||||
| IB | 9.93 | 0.06 | – | 0.46 | 0.52 | – | – | – | – | 0.52 | 10.45 | |||||||||||||||||||||||
| For the Year Ended December 31, 2010 | ||||||||||||||||||||||||||||||||||
| IA | 8.67 | 0.10 | – | 1.28 | 1.38 | (0.11 | ) | – | – | (0.11 | ) | 1.27 | 9.94 | |||||||||||||||||||||
| IB | 8.66 | 0.08 | – | 1.28 | 1.36 | (0.09 | ) | – | – | (0.09 | ) | 1.27 | 9.93 | |||||||||||||||||||||
| For the Year Ended December 31, 2009 | ||||||||||||||||||||||||||||||||||
| IA | 6.16 | 0.08 | – | 2.51 | 2.59 | (0.08 | ) | – | – | (0.08 | ) | 2.51 | 8.67 | |||||||||||||||||||||
| IB | 6.15 | 0.07 | – | 2.50 | 2.57 | (0.06 | ) | – | – | (0.06 | ) | 2.51 | 8.66 | |||||||||||||||||||||
| From (commencement of operations) January 31, 2008 through December 31, 2008 | ||||||||||||||||||||||||||||||||||
| IA(H) | 10.00 | – | – | (3.78 | ) | (3.78 | ) | (0.05 | ) | – | (0.01 | ) | (0.06 | ) | (3.84 | ) | 6.16 | |||||||||||||||||
| IB(H) | 10.00 | (0.08 | ) | – | (3.72 | ) | (3.80 | ) | (0.04 | ) | – | (0.01 | ) | (0.05 | ) | (3.85 | ) | 6.15 | ||||||||||||||||
| (A) | Information presented relates to a share outstanding throughout the indicated period. |
| (B) | The figures do not include sales charges or other fees which may be applied at the variable life insurance, variable annuity or qualified retirement plan product level. Any such additional sales charges or other fees would lower the Fund's performance. |
| (C) | Ratios do not reflect reductions for fees paid indirectly. Please see Fees Paid Indirectly in the Notes to Financial Statements. |
| (D) | Portfolio turnover rate is calculated on the basis of the Fund as a whole without distinguishing between the classes of shares issued. |
| (E) | Not annualized. |
| (F) | Annualized. |
| (G) | Total return without the inclusion of the Payment from (to) Affiliate can be found in Expenses in the accompanying Notes to Financial Statements. |
| (H) | Commenced operations on January 31, 2008. |
| (I) | During the year ended December 31, 2008, the Fund incurred $95.4 million in sales associated with the transition of assets from Hartford Global Communications HLS Fund, Hartford Global Financial Services HLS Fund and Hartford Global Technology HLS Fund, which merged into the Fund on August 22, 2008. These sales were excluded from the portfolio turnover rate calculation. |
| - Ratios and Supplemental Data - |
| Ratio of Expenses to Average Net | Ratio of Expenses to Average Net | Ratio of Net Investment Income to | Portfolio Turnover | |||||||||||||||||||
| Total Return(B) | Net Assets at End of Period | Assets Before Waivers(C) | Assets After Waivers(C) | Average Net Assets | Rate(D) | |||||||||||||||||
| 5 .42 | %(E) | $ | 67,419 | 1 .01 | %(F) | 1 .01 | %(F) | 1 .30 | %(F) | 47 | % | |||||||||||
| 5 .29 | (E) | 33,926 | 1 .26 | (F) | 1 .26 | (F) | 1 .05 | (F) | – | |||||||||||||
| 16 .01 | 69,740 | 1 .01 | 0 .98 | 1 .03 | 92 | |||||||||||||||||
| 15 .72 | 35,774 | 1 .26 | 1 .23 | 0 .78 | – | |||||||||||||||||
| 42 .13 | (G) | 67,012 | 1 .16 | 1 .06 | 1 .17 | 124 | ||||||||||||||||
| 41 .79 | (G) | 37,695 | 1 .41 | 1 .31 | 0 .93 | – | ||||||||||||||||
| (37 .87 | ) (E) | 48,627 | 1 .02 | (F) | 0 .94 | (F) | 1 .29 | (F) | 335 | (I) | ||||||||||||
| (38 .01 | ) (E) | 31,008 | 1 .27 | (F) | 1 .19 | (F) | 0 .99 | (F) | – | |||||||||||||
| Directors and Officers (Unaudited) |
The Board of Directors of the Company appoints officers who are responsible for the day-to-day operations of the Fund and who execute policies formulated by the Directors. Each director serves until his or her death, resignation, or retirement or until the next annual meeting of shareholders is held or until his or her successor is elected and qualifies.
Directors and officers who are employed by or who have a financial interest in The Hartford are considered “interested” persons of the Fund pursuant to the 1940 Act. Each officer and two of the Company’s directors, as noted in the chart below, are “interested” persons of the Fund. Each director serves as a director for The Hartford Mutual Funds, Inc., The Hartford Mutual Funds II, Inc., Hartford Series Fund, Inc., and Hartford HLS Series Fund II, Inc., which, as of June 30, 2011, collectively consist of 89 funds. Correspondence may be sent to directors and officers c/o Hartford Mutual Funds, P.O. Box 2999, Hartford, Connecticut 06104-2999, except that correspondence to Ms. Fagely may be sent to 500 Bielenberg Drive, Woodbury, Minnesota 55125.
The table below sets forth, for each director and officer, his or her name, year of birth, current position with the Company and date first elected or appointed to Hartford Series Fund, Inc. (“HSF”), and Hartford HLS Series Fund II, Inc. (“HSF2”), principal occupation, and, for directors, other directorships held. The Fund’s statement of additional information contains further information on the directors and is available free of charge by calling 1-800-862-6668 or writing to Hartford HLS Funds, c/o Individual Annuity Services, P.O. Box 5085, Hartford, CT 06102-5085.
Information on the aggregate remuneration paid to the directors of the Company can be found in the Statement of Operations herein. The Fund pays to The Hartford a portion of the chief compliance officer’s compensation, but does not pay salaries or compensation to any of their other officers or directors who are employed by The Hartford.
Non-Interested Directors
Lynn S. Birdsong (1946) Director since 2003, Co-Chairman of the Investment Committee
Mr. Birdsong is a private investor. Mr. Birdsong currently serves as a Director of the Sovereign High Yield Investment Company (April 2010 to current). Mr. Birdsong currently serves as an Independent Director of Nomura Partners Funds, Inc. (formerly, The Japan Fund) (March 2003 to current). From 2003 to March 2005, Mr. Birdsong was an independent director of the Atlantic Whitehall Funds. From 1979 to 2002, Mr. Birdsong was a managing director of Zurich Scudder Investments, an investment management firm. During his employment with Scudder, Mr. Birdsong was an Interested Director of The Japan Fund. Since 1981, Mr. Birdsong has been a partner in Birdsong Company, an advertising specialty firm.
Robert M. Gavin, Jr. (1940) Director since 2002 (HSF) and 1986 (HSF2), Chairman of the Board since 2004
Dr. Gavin is an educational consultant. Prior to September 1, 2001, he was President of Cranbrook Education Community and prior to July 1996, he was President of Macalester College, St. Paul, Minnesota.
Duane E. Hill (1945) Director since 2001 (HSF) and 2002 (HSF2), Chairman of the Nominating Committee
Mr. Hill is Partner of TSG Ventures L.P., a private equity investment company. Mr. Hill is a former partner of TSG Capital Group, a private equity investment firm that served as sponsor and lead investor in leveraged buyouts of middle market companies.
Sandra S. Jaffee (1941) Director since 2005
Ms. Jaffee served as Chairman (2008 to 2009) and Chief Executive Officer of Fortent (formerly Searchspace Group), a leading provider of compliance/regulatory technology to financial institutions from August 2005 to August 2009. From August 2004 to August 2005, Ms. Jaffee served as an Entrepreneur in Residence with Warburg Pincus, a private equity firm. From September 1995 to July 2004, Ms. Jaffee served as Executive Vice President at Citigroup, where she was President and Chief Executive Officer of Citibank’s Global Securities Services (1995 to 2003). Ms. Jaffe currently serves as a member of the Board of Directors of Broadridge Financial Solutions as well as a Trustee of Muhlenberg College.
William P. Johnston (1944) Director since 2005, Chairman of the Compliance Committee
In June 2006, Mr. Johnston was appointed as Senior Advisor to The Carlyle Group, a global private equity investment firm. In July 2006, Mr. Johnston was elected to the Board of Directors of MultiPlan, Inc. In August 2007, Mr. Johnston was elected to the Board of Directors of LifeCare Holdings, Inc. In February 2008, Mr. Johnston was elected to the Board of Directors of HCR-ManorCare, Inc. In May 2006, Mr. Johnston was elected to the Supervisory Board of Fresenius Medical Care AG & Co. KGaA, after its acquisition of Renal Care Group, Inc. in March 2006. Mr. Johnston joined Renal Care Group in November 2002 as a member of the Board of Directors and served as Chairman of the Board from March 2003 through March 2006. From September 1987 to December 2002, Mr. Johnston was with Equitable Securities Corporation (and its successors, SunTrust Equitable Securities and SunTrust Robinson Humphrey) serving in various investment banking and managerial positions, including Managing Director and Head of Investment Banking, Chief Executive Officer and Vice Chairman.
Phillip O. Peterson (1944) Director since 2002 (HSF) and 2000 (HSF2), Chairman of the Audit Committee
Mr. Peterson is a mutual fund industry consultant. He was a partner of KPMG LLP (an accounting firm) until July 1999. Mr. Peterson joined William Blair Funds in February 2007 as a member of the Board of Trustees. From January 2004 to April 2005, Mr. Peterson served as Independent President of the Strong Mutual Funds.
Lemma W. Senbet (1946) Director since 2005
Dr. Senbet is the William E. Mayer Chair Professor of Finance and Director, Center for Financial Policy, at the University of Maryland, Robert H. Smith School of Business. He was chair of the Finance Department from 1998 to 2006. Previously he was a chaired professor of finance at the University of Wisconsin-Madison. Also, he was director of the Fortis Funds from March 2000 to July 2002. Dr. Senbet served the finance profession in various capacities, including as director of the American Finance Association and President of the Western Finance Association. In 2006, Dr. Senbet was inducted Fellow of Financial Management Association International for his career-long distinguished scholarship and professional service.
Interested Directors and Officers
David N. Levenson (1966) Director since 2010
Mr. Levenson currently serves as President of The Hartford’s Wealth Management business. He was appointed to this role in July 2010. Previously, Mr. Levenson served as Executive Vice President of Legacy Holdings for The Hartford from June 2009 to July 2010. From 2006 to 2009, Mr. Levenson was with Hartford Life Insurance K.K. where he served as President and CEO from 2007 to 2009. He served as Managing Director of Hartford Investment Management Company from 2005 to 2006. Additionally, Mr. Levenson serves as Executive Vice President of The Hartford and as President, Director and Chief Executive Officer of Hartford Life Insurance Company (“HLIC”) and Hartford Life, Inc. (“HL Inc.”).
Lowndes A. Smith (1939) Director since 1996 (HSF) and 2002 (HSF2), Co-Chairman of the Investment Committee
Mr. Smith served as Vice Chairman of The Hartford from February 1997 to January 2002, as President and Chief Executive Officer of HL Inc. from February 1997 to January 2002, and as President and Chief Operating Officer of The Hartford Life Insurance Companies from January 1989 to January 2002. Mr. Smith serves as a Director of White Mountains Insurance Group, Ltd., One Beacon Insurance and Symetra Financial and as a Managing Director of Whittington Gray Associates.
Other Officers
James E. Davey (1964) President and Chief Executive Officer since 2010
Mr. Davey serves as Executive Vice President of HLIC. Additionally, Mr. Davey serves as President, Chief Executive Officer and Manager of Hartford Investment Financial Services, Inc. (“HIFSCO”) and President, Chief Executive Officer and Manager of HL Advisors. Mr. Davey joined The Hartford in 2002.
Tamara L. Fagely (1958) Vice President, Treasurer and Controller since 2002 (HSF) and 1993 (HSF2)
Ms. Fagely has been a Vice President of HASCO since 1998 and Chief Financial Officer since 2006. Currently Ms. Fagely is a Vice President of HLIC. She served as Assistant Vice President of HLIC from December 2001 through March 2005. In addition, Ms. Fagely is Controller and Chief Financial Officer of HIFSCO.
Susan M. Fleege (1959) AML Compliance Officer since 2011
Ms. Fleege currently serves as a Director of Risk Management at The Hartford. She previously served as AML Compliance Officer for the Fund from 2005-2008. Ms. Fleege joined HLIC in 2005 from Amerprise Financial Corporation where she held the position of Counsel from 2000 to 2005. Ms. Fleege is a certified Anti-Money Laundering Specialist.
Dr. Robert J. Froehlich (1953) Senior Managing Director since 2009
Dr. Froehlich joined The Hartford as Senior Managing Director in September 2009. Prior to joining The Hartford, Dr. Froehlich served as Vice Chairman of Deutsche Asset Management from 1997-2009.
Edward P. Macdonald (1967) Vice President, Secretary and Chief Legal Officer since 2005
Mr. Macdonald serves as Vice President of HLIC and Chief Legal Officer of Mutual Funds and Vice President of HIFSCO. He also serves as Vice President and Secretary of HASCO, and Chief Legal Officer, Secretary and Vice President of HL Advisors. Mr. Macdonald joined The Hartford in 2005.
| Hartford Global Research HLS Fund |
| Directors and Officers (Unaudited) – (continued) |
Vernon J. Meyer (1964) Vice President since 2006
Mr. Meyer serves as Senior Vice President of HLIC. He also serves as Senior Vice President of HIFSCO and HL Advisors. Mr. Meyer joined The Hartford in 2004.
Colleen B. Pernerewski (1969) Vice President and Chief Compliance Officer since 2010
Ms. Pernerewski serves as Vice President and Chief Investment Advisor Compliance Officer of HIFSCO and as Vice President and Chief Compliance Officer of HL Advisors. Ms. Pernerewski joined The Hartford in 2005 from Travelers Life and Annuity where she served as Counsel (2004-2005). Prior to Travelers Life and Annuity, Ms. Pernerewski held the position of Counsel at The Hartford (1998-2004).
Elizabeth L. Schroeder (1966) Vice President since 2010
Ms. Schroeder currently serves as Assistant Vice President of HLIC. Ms. Schroeder joined HLIC in 1991. She is also an Assistant Vice President of HIFSCO and HL Advisers.
Martin Swanson (1962) Vice President since 2010
Mr. Swanson is a Vice President of HLIC. Mr. Swanson also serves as Vice President/Marketing for HIFSCO. Prior to joining HLIC in 1998, Mr. Swanson was a Vice President at PaineWebber, Inc.
Jane Wolak (1961) Vice President since 2009
Ms. Wolak currently serves as Senior Vice President of HLIC. Ms. Wolak joined HLIC as Vice President, Retail Product Services in May 2007. She is also Vice President of HASCO. Previously, Ms. Wolak was with Sun Life Financial where she held the position of Vice President, Service Center Operations from 2001-2007.
A description of the policies and procedures that the Fund uses to determine how to vote proxies relating to portfolio securities and a record of how the Fund voted any proxies for the twelve-month period ended June 30, 2011 are available (1) without charge, upon request, by calling 800-862-6668 and (2) on the SEC’s website at http://www.sec.gov.
The Fund files a complete schedule of portfolio holdings with the SEC for the first and third quarters of each fiscal year on Form N-Q. The Fund’s Forms are available (1) without charge, upon request, by calling 800-862-6668 and (2) on the SEC’s website at http://www.sec.gov. The Form N-Q may be reviewed and copied at the SEC’s Public Reference Room in Washington, DC. Information on the operation of the Public Reference Room may be obtained by calling 1-800-SEC-0330.
| Expense Example (Unaudited) |
Your Fund's Expenses
As a shareholder of the Fund, you incur two types of costs: (1) transaction costs and (2) ongoing costs including investment management fees, distribution fees, and other fund expenses. This example is intended to help you understand your ongoing costs (in dollars) of investing in a Fund and to compare these costs with the ongoing costs of investing in other mutual funds. The example is based on an investment of $1,000 invested at the beginning of the period and held for the period of December 31, 2010 through June 30, 2011.
Actual Expenses
The first set of columns of the table below provides information about actual account values and actual expenses. You may use the information in this column, together with the amount you invested, to estimate the expenses that you paid over the period. Simply divide your account value by $1,000 (for example, an $8,600 account value divided by $1,000 = 8.6), then multiply the result by the number in the line under the heading entitled “Expenses Paid During Period” to estimate the expenses you paid on your account during this period.
Hypothetical Example for Comparison Purposes
The second set of columns of the table below provides information about hypothetical account values and hypothetical expenses based on a Fund's actual expense ratio and an assumed rate of return of 5% per year before expenses, which is not the Fund's actual return. The hypothetical account values and expenses may not be used to estimate the actual ending account balance or expenses you paid for the period. You may use this information to compare the ongoing costs of investing in a Fund and other funds. To do so, compare this 5% hypothetical example with the 5% hypothetical examples that appear in the shareholder reports of the other funds.
Please note that the expenses shown in the table are meant to highlight your ongoing costs only and do not reflect any transactional costs, such as sales charges (loads) and CDSC. Therefore, the second set of columns of the table is useful in comparing ongoing costs only, and will not help you determine the relative total costs of owning different funds. In addition, if these transactional costs were included, your costs would be higher. Expenses are equal to the Fund's annualized expense ratios multiplied by average account value over the period, multiplied by 181/365 (to reflect the one-half year period).
| Actual return | Hypothetical (5% return before expenses) | |||||||||||||||||||||||||||||||||||
| Expenses paid | Expenses paid | Days in | ||||||||||||||||||||||||||||||||||
| during the period | during the period | the | Days | |||||||||||||||||||||||||||||||||
| Beginning | Ending | December 31, 2010 | Beginning | Ending | December 31, 2010 | Annualized | current | in the | ||||||||||||||||||||||||||||
| Account Value | Account Value | through | Account Value | Account Value | through | expense | 1/2 | full | ||||||||||||||||||||||||||||
| December 31, 2010 | June 30, 2011 | June 30, 2011 | December 31, 2010 | June 30, 2011 | June 30, 2011 | ratio | year | year | ||||||||||||||||||||||||||||
| Class IA | $ | 1,000.00 | $ | 1,054.21 | $ | 5.14 | $ | 1,000.00 | $ | 1,019.79 | $ | 5.06 | 1.01 | % | 181 | 365 | ||||||||||||||||||||
| Class IB | $ | 1,000.00 | $ | 1,052.90 | $ | 6.41 | $ | 1,000.00 | $ | 1,018.55 | $ | 6.31 | 1.26 | % | 181 | 365 | ||||||||||||||||||||
35
| The Hartford | |
| P.O. Box 5085 | |
| Hartford, CT 06102-5085 |
Hartford Series Fund, Inc. is underwritten and distributed by Hartford Securities Distribution Company, Inc.
"The Hartford" is The Hartford Financial Services Group, Inc. and its subsidiaries.
Hartford Series Fund, Inc. inception dates range from 1977 to date. Hartford Series Fund, Inc. is not a subsidiary of The Hartford but is underwritten, distributed by and advised by subsidiaries of The Hartford. Investments in Hartford Series Fund, Inc. are not guaranteed by The Hartford or any other entity.
You should carefully consider investment objectives, risks, and charges and expenses of Hartford HLS Funds before investing. This and other information can be found in the Fund’s prospectus or summary prospectus, which can be obtained by calling 800-862-6668. Please read them carefully before you invest or send money.
HLSSAR-GR11 8-11 | 106632 | Printed in U.S.A ©2011 The Hartford, Hartford, CT 06115 |

A MESSAGE FROM THE PRESIDENT

Dear Fellow Shareholders:
I want to take this opportunity to say thank you for your continued confidence and trust.
We have seen a significant amount of global turbulence in the first half of 2011. Investors have continued to be concerned about the implications of the European sovereign debt crisis, as well as our own high levels of domestic debt. Since January we have witnessed significant political uprisings in the already-volatile Middle East and North Africa region. In addition, the ramifications of Japan's massive earthquake, subsequent tsunami, and nuclear disaster are still being played out in the market.
Although corporate earnings have remained robust, the unemployment picture has been mixed. After adding more than 200,000 jobs from February to April, more recent unemployment reports have shown a pullback in hiring.
While official inflation remains low as measured by the Consumer Price Index (CPI), high oil prices may be indicative of higher inflation in the future. The federal funds rate remains at a historic low, however, the Fed could potentially raise the rate to get it closer to its historical average once the economy strengthens.
Even with these headwinds, domestic, international, and world indices (as measured by the S&P 500, MSCI EAFE and MSCI World) are all up more than 5% through June, 30 2011.
Looking ahead, continued growth in emerging markets is fueling global recovery efforts. Emerging markets comprise about 48 percent of the world’s GDP, and many economists believe they are poised for further expansion. As GDP growth continues in emerging markets, roughly 100 million people are added to the middle class each year. This middle class population growth could potentially drive a considerable shift in consumer purchasing power.
Now that we have reached the midpoint of 2011, perhaps now would be a good time to schedule a meeting with your financial adviser to examine your current investment strategy and determine whether you are on the right track.
| • | Are you concerned about inflation and its effects on your portfolio? |
| • | Is your portfolio prepared for rising interest rates? |
| • | Does your portfolio reflect the global economy with a mix of developed nations and emerging markets? |
Your financial professional’s advice can help you to navigate today’s volatile markets with confidence. You can also rest assured that we will continue to provide you with solid investments and stellar service for the road ahead.
Thank you again for your business.

James Davey
President
Hartford HLS Funds
Hartford Growth HLS Fund
| Manager Discussion (Unaudited) | 2 |
| Financial Statements | |
| 5 | |
| 7 | |
| 8 | |
| 9 | |
| 10 | |
| 11 | |
| 20 | |
| 22 | |
| 24 | |
| 24 | |
| 25 |
This report is prepared for the general information of contract owners and qualified retirement plan participants. It is not an offer of contracts or of qualified retirement plans. It should not be used in connection with any offer, except in conjunction with the appropriate product prospectus which contains all pertinent information including the applicable sales, administrative and other charges.
The views expressed in the Fund’s Manager Discussion under ‘‘Why did the Fund perform this way?’’ and ‘‘What is the outlook?’’ are views of the Fund’s sub-adviser and portfolio management team through the end of the reporting period and are subject to change based on market and other conditions.
Hartford Growth HLS Fund inception 04/30/2002 |
| (sub-advised by Wellington Management Company, LLP) |
| Investment objective – Seeks long-term capital appreciation. |
Performance Overview 4/30/02 - 6/30/11
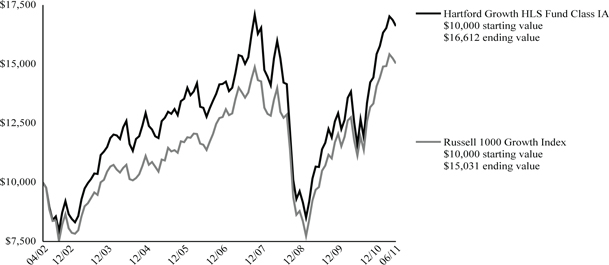
The chart above shows the growth of a $10,000 investment in Class IA. Growth results in classes other than Class IA will vary from what is seen above due to differences in the expenses charged to those share classes.
Average Annual Total Returns (as of 6/30/11)
| 6 Month† | 1 Year | 5 year | Since Inception | |||||
| Growth IA | 7.68 % | 43.40 % | 4.78 % | 5.69 % | ||||
| Growth IB | 7.54 % | 43.04 % | 4.51 % | 5.43 % | ||||
| Russell 1000 Growth Index | 6.83 % | 35.01 % | 5.33 % | 4.54 % |
| † | Not Annualized |
PAST PERFORMANCE IS NOT INDICATIVE OF FUTURE RESULTS.
Total returns presented above were calculated using the Fund's net asset value available to shareholders for sale or redemption of Fund shares on June 30, 2011, which excludes investment transactions as of this date.
Russell 1000 Growth Index is an unmanaged index which measures the performance of those Russell 1000 Index companies with higher price-to-book ratios and higher forecasted growth values. (The Russell 1000 Index is an unmanaged index that measures the performance of the 1,000 largest companies in the Russell 3000 Index, which measures the performance of the 3,000 largest U.S. companies based on total market capitalization.)
You cannot invest directly in an index.
The chart represents a hypothetical investment in the Fund. Performance data represents past performance and current performance could be higher or lower.
Performance information may reflect historical or current expense waivers/reimbursements from the investment adviser, without which performance would have been lower. For information on current expense waivers/reimbursements, please see the prospectus.
The value of the fund will fluctuate so that when redeemed, it may be worth more or less than the original investment. The chart and table do not reflect the deductions of taxes, sales charges or other fees which may be applied at the variable life insurance, variable annuity or qualified retirement plan product level. Any such additional sales charges or other fees or expenses would lower the contract’s or plan’s performance.
| Portfolio Manager |
| Andrew J. Shilling, CFA |
| Senior Vice President |
How did the Fund perform?
The Class IA shares of the Hartford Growth HLS Fund returned 7.68% for the six-month period ended June 30, 2011, outperforming its benchmark, the Russell 1000 Growth Index, which returned 6.83% for the same period. The Fund outperformed the 5.55% return of the average fund in the Lipper Large-Cap Growth Funds VP-UF peer group, a group of funds with investment strategies similar to those of the Fund.
Why did the Fund perform this way?
U.S. equities moved higher in the period despite a high degree of volatility caused by unrest in North Africa and the Middle East, as well as the devastating earthquake and tsunami in Japan. Fears of a global economic slowdown, due to the Japanese earthquake and concerns about heightened geopolitical risks, were not enough to offset strong corporate earnings, generally solid economic data, and a continued accommodative Fed policy. In the latter half of the period, positive returns from strong corporate earnings and generally solid economic data were offset by European sovereign debt concerns and a deteriorating outlook for economic growth.
All ten sectors of the Russell 1000 Growth Index had positive returns for the period. Utilities (+16%), Energy (+12%), and Health Care (+12%) performed the best, while Materials (+3%) and Information Technology (+3%) lagged on a relative basis. Growth stocks (+7%) performed roughly in-line with Value stocks (+6%), as measured by the Russell 1000 Growth and Russell 1000 Value Indices.
Strong security selection in Consumer Staples, Consumer Discretionary, and Information Technology contributed to outperformance relative to the benchmark. This was partially offset by weak security selection in Financials, Industrials, and Energy. Sector allocation, which is a residual of bottom-up (i.e. stock by stock fundamental research) stock selection, hurt relative performance. Positive effects from an overweight (i.e. the Fund’s sector position was greater than the benchmark position) to Consumer Discretionary was not enough to offset the negative effects of the Fund’s overweight exposure to Information Technology and underweight (i.e. the Fund’s sector position was less than the benchmark position) exposure to Health Care.
Green Mountain Coffee Roasters (Consumer Staples), Altera (Information Technology), and Fossil (Consumer Discretionary) were the top contributors to relative performance during the period. Shares of Green Mountain Coffee Roasters surged as core results topped expectations and management raised guidance amid strong sales growth of the firm's Keurig single serving products. Shares of Altera, a semiconductor company specializing in programmable logic devices, rose after the company forecasted higher-than-expected second quarter sales, saying it has been relatively unaffected by supply chain disruptions caused by the Japanese earthquake. Shares of retailer Fossil rose sharply after the company announced strong first quarter earnings. Additionally, EMC (Information Technology) was among the top contributors to absolute performance (i.e. total return).
Top detractors from relative performance during the period were Broadcom (Information Technology), Juniper Networks (Information Technology), and Skyworks Solutions (Information Technology). Despite posting solid first quarter earnings, shares of Broadcom, a semiconductor provider, fell sharply after the company gave tepid second quarter revenue guidance. Shares of Juniper Networks, a leading provider of routing and security solutions, lagged due to estimates coming down on the back of sluggish Japan demand and multiple product transitions. Skyworks Solutions, a producer of standard and custom linear semiconductor products for end-users such as smart phones and other mobile devices, saw its shares fall in response to concerns about potential competitive pressures as well as the firm's exposure to Nokia. Ford Motor (Consumer Discretionary) was also a top detractor from absolute returns.
What is the outlook?
In this environment we continue to focus our efforts on stock-by-stock fundamental research, picking one stock at a time based upon the attractiveness of each company’s fundamentals and valuation. As a result of this bottom-up (i.e. stock by stock fundamental research) stock selection, at the end of the period our largest overweight positions versus the benchmark were Information Technology, Consumer Discretionary, and Utilities. At the end of the period, we had underweight exposure to the defensive Consumer Staples and Health Care sectors as we were finding limited opportunities for growth. We were also underweight Industrials.
At the end of the period, greater-than-benchmark exposure to Information Technology favored Technology Hardware. Our holdings were leveraged to several strong product cycles and emerging product categories. We increased our overweight exposure to Consumer Discretionary during the period. We favored companies with strong fundamentals which should also benefit from an economic recovery. We trimmed our exposure to Financials and had a slight underweight position in the sector at the end of the period. We believe the group may face some headwinds in the near term due to continued weakness in the U.S. housing market and ongoing regulatory concerns.
Diversification by Industry
as of June 30, 2011
| Percentage of | ||||
| Industry (Sector) | Net Assets | |||
Automobiles & Components (Consumer Discretionary) | 3.5 | % | ||
| Capital Goods (Industrials) | 9.3 | |||
Consumer Durables & Apparel (Consumer Discretionary) | 5.4 | |||
| Consumer Services (Consumer Discretionary) | 2.8 | |||
| Diversified Financials (Financials) | 3.8 | |||
| Energy (Energy) | 9.0 | |||
| Food, Beverage & Tobacco (Consumer Staples) | 3.8 | |||
| Health Care Equipment & Services (Health Care) | 3.0 | |||
| Materials (Materials) | 5.1 | |||
| Media (Consumer Discretionary) | 3.9 | |||
Pharmaceuticals, Biotechnology & Life Sciences (Health Care) | 2.0 | |||
| Retailing (Consumer Discretionary) | 4.1 | |||
Semiconductors & Semiconductor Equipment (Information Technology) | 9.1 | |||
| Software & Services (Information Technology) | 17.2 | |||
Technology Hardware & Equipment (Information Technology) | 16.0 | |||
| Transportation (Industrials) | 0.7 | |||
| Short-Term Investments | 0.4 | |||
| Other Assets and Liabilities | 0.9 | |||
| Total | 100.0 | % | ||
| Schedule of Investments |
| June 30, 2011 (Unaudited) |
| (000’s Omitted) |
| Shares or Principal Amount | Market Value ╪ | ||||||
| COMMON STOCKS - 98.7% | |||||||
| Automobiles & Components - 3.5% | |||||||
| 147 | Harley-Davidson, Inc. | $ | 6,016 | ||||
| 205 | Johnson Controls, Inc. | 8,557 | |||||
| 14,573 | |||||||
| Capital Goods - 9.3% | |||||||
| 100 | AMETEK, Inc. | 4,507 | |||||
| 43 | Caterpillar, Inc. | 4,574 | |||||
| 58 | Cummins, Inc. | 5,955 | |||||
| 81 | Eaton Corp. | 4,189 | |||||
| 79 | Illinois Tool Works, Inc. | 4,457 | |||||
| 58 | Joy Global, Inc. | 5,553 | |||||
| 136 | PACCAR, Inc. | 6,934 | |||||
| 15 | Precision Castparts Corp. | 2,388 | |||||
| 38,557 | |||||||
| Consumer Durables & Apparel - 5.4% | |||||||
| 101 | Coach, Inc. | 6,469 | |||||
| 45 | Fossil, Inc. · | 5,339 | |||||
| 33 | Lululemon Athletica, Inc. · | 3,666 | |||||
| 51 | Polo Ralph Lauren Corp. | 6,813 | |||||
| 22,287 | |||||||
| Consumer Services - 2.8% | |||||||
| 92 | Las Vegas Sands Corp. · | 3,879 | |||||
| 308 | MGM Resorts International · | 4,069 | |||||
| 87 | Starbucks Corp. | 3,424 | |||||
| 11,372 | |||||||
| Diversified Financials - 3.8% | |||||||
| 43 | American Express Co. | 2,231 | |||||
| 104 | Ameriprise Financial, Inc. | 6,008 | |||||
| 37 | BlackRock, Inc. | 7,164 | |||||
| 8 | LPL Investment Holdings, Inc. · | 271 | |||||
| 15,674 | |||||||
| Energy - 9.0% | |||||||
| 83 | Anadarko Petroleum Corp. | 6,392 | |||||
| 98 | Consol Energy, Inc. | 4,727 | |||||
| 88 | ENSCO International plc | 4,695 | |||||
| 56 | EOG Resources, Inc. | 5,843 | |||||
| 69 | National Oilwell Varco, Inc. | 5,430 | |||||
| 20 | Occidental Petroleum Corp. | 2,106 | |||||
| 95 | Schlumberger Ltd. | 8,214 | |||||
| 37,407 | |||||||
| Food, Beverage & Tobacco - 3.8% | |||||||
| 176 | Green Mountain Coffee Roasters, Inc. · | 15,687 | |||||
| Health Care Equipment & Services - 3.0% | |||||||
| 70 | Covidien plc | 3,703 | |||||
| 55 | Edwards Lifesciences Corp. · | 4,830 | |||||
| 199 | Hologic, Inc. · | 4,018 | |||||
| 12,551 | |||||||
| Materials - 5.1% | |||||||
| 69 | Freeport-McMoRan Copper & Gold, Inc. | 3,645 | |||||
| 96 | Monsanto Co. | 6,950 | |||||
| 60 | Mosaic Co. | 4,069 | |||||
| 51 | Rio Tinto plc ADR | 3,652 | |||||
| 23 | Walter Energy, Inc. | 2,667 | |||||
| 20,983 | |||||||
| Media - 3.9% | |||||||
| 433 | News Corp. Class A | 7,661 | |||||
| 1,556 | Sirius XM Radio, Inc. w/ Rights · | 3,407 | |||||
| 129 | Walt Disney Co. | 5,052 | |||||
| 16,120 | |||||||
| Pharmaceuticals, Biotechnology & Life Sciences - 2.0% | |||||||
| 159 | Agilent Technologies, Inc. · | 8,114 | |||||
| Retailing - 4.1% | |||||||
| 85 | Abercrombie & Fitch Co. Class A | 5,660 | |||||
| 12 | Amazon.com, Inc. · | 2,374 | |||||
| 5 | Netflix, Inc. · | 1,227 | |||||
| 15 | Priceline.com, Inc. · | 7,812 | |||||
| 17,073 | |||||||
| Semiconductors & Semiconductor Equipment - 9.1% | |||||||
| 349 | Altera Corp. | 16,166 | |||||
| 170 | Analog Devices, Inc. | 6,654 | |||||
| 179 | Broadcom Corp. Class A | 6,022 | |||||
| 143 | Skyworks Solutions, Inc. · | 3,277 | |||||
| 164 | Texas Instruments, Inc. | 5,396 | |||||
| 37,515 | |||||||
| Software & Services - 17.2% | |||||||
| 48 | Accenture plc | 2,897 | |||||
| 65 | Alliance Data Systems Corp. · | 6,128 | |||||
| 122 | BMC Software, Inc. · | 6,648 | |||||
| 146 | Citrix Systems, Inc. · | 11,654 | |||||
| 58 | Cognizant Technology Solutions Corp. · | 4,266 | |||||
| 431 | eBay, Inc. · | 13,900 | |||||
| 416 | Oracle Corp. | 13,679 | |||||
| 71 | Rovi Corp. · | 4,072 | |||||
| 15 | Salesforce.com, Inc. · | 2,233 | |||||
| 101 | VeriSign, Inc. | 3,364 | |||||
| 22 | VMware, Inc. · | 2,210 | |||||
| 71,051 | |||||||
| Technology Hardware & Equipment - 16.0% | |||||||
| 63 | Acme Packet, Inc. · | 4,413 | |||||
| 65 | Apple, Inc. · | 21,730 | |||||
| 37 | Dolby Laboratories, Inc. Class A · | 1,550 | |||||
| 423 | EMC Corp. · | 11,654 | |||||
| 37 | F5 Networks, Inc. · | 4,052 | |||||
| 267 | Juniper Networks, Inc. · | 8,413 | |||||
| 112 | NetApp, Inc. · | 5,898 | |||||
| 152 | Qualcomm, Inc. | 8,659 | |||||
| 66,369 | |||||||
| Transportation - 0.7% | |||||||
| 23 | C.H. Robinson Worldwide, Inc. | 1,828 | |||||
| 26 | J.B. Hunt Transport Services, Inc. | 1,231 | |||||
| 3,059 | |||||||
| Total common stocks | |||||||
| (cost $309,496) | $ | 408,392 | |||||
| Total long-term investments | |||||||
| (cost $309,496) | $ | 408,392 | |||||
| Hartford Growth HLS Fund |
| Schedule of Investments – (continued) |
| June 30, 2011 (Unaudited) |
| (000’s Omitted) |
| SHORT-TERM INVESTMENTS - 0.4% | |||||||||||
| Repurchase Agreements - 0.4% | |||||||||||
| Bank of America Merrill Lynch TriParty Joint | |||||||||||
| Repurchase Agreement (maturing on | |||||||||||
| 07/01/2011 in the amount of $165, | |||||||||||
| collateralized by FHLB 4.91%, 2015, | |||||||||||
| GNMA 0.87% - 5.72%, 2025 - 2061, value | |||||||||||
| of $168) | |||||||||||
| $ | 165 | 0.05%, 06/30/2011 | $ | 165 | |||||||
| BNP Paribas Securities Corp. TriParty Joint | |||||||||||
| Repurchase Agreement (maturing on | |||||||||||
| 07/01/2011 in the amount of $124, | |||||||||||
| collateralized by FNMA 3.50% - 6.50%, | |||||||||||
| 2023 - 2041, value of $126) | |||||||||||
| 124 | 0.05%, 06/30/2011 | 124 | |||||||||
| Deutsche Bank Securities TriParty Joint | |||||||||||
| Repurchase Agreement (maturing on | |||||||||||
| 07/01/2011 in the amount of $1,198, | |||||||||||
| collateralized by GNMA 4.00% - 7.00%, | |||||||||||
| 2035 - 2040, value of $1,222) | |||||||||||
| 1,198 | 0.05%, 06/30/2011 | 1,198 | |||||||||
| UBS Securities, Inc. Joint Repurchase | |||||||||||
| Agreement (maturing on 07/01/2011 in the | |||||||||||
| amount of $2, collateralized by U.S. | |||||||||||
| Treasury Bill 0.63%, 2012, value of $2) | |||||||||||
| 2 | 0.01%, 06/30/2011 | 2 | |||||||||
| UBS Securities, Inc. TriParty Joint Repurchase | |||||||||||
| Agreement (maturing on 07/01/2011 in the | |||||||||||
| amount of $183, collateralized by FHLMC | |||||||||||
| 4.50%, 2040, FNMA 4.50% - 6.00%, 2035 | |||||||||||
| - 2041, value of $187) | |||||||||||
| 183 | 0.06%, 06/30/2011 | 183 | |||||||||
| 1,672 | |||||||||||
| Total short-term investments | |||||||||||
| (cost $1,672) | $ | 1,672 | |||||||||
| Total investments | |||||||||||
(cost $311,168) ▲ | 99.1 | % | $ | 410,064 | |||||||
| Other assets and liabilities | 0.9 | % | 3,827 | ||||||||
| Total net assets | 100.0 | % | $ | 413,891 | |||||||
| Note: | Percentage of investments as shown is the ratio of the total market value to total net assets. Market value of investments in foreign securities represents 2.9% of total net assets at June 30, 2011. |
Prices of foreign equities that are principally traded on certain foreign markets may be adjusted daily pursuant to a fair value pricing service approved by the Board of Directors in order to reflect an adjustment for factors occurring after the close of certain foreign markets but before the close of the New York Stock Exchange.
| ▲ | At June 30, 2011, the cost of securities for federal income tax purposes was $314,360 and the aggregate gross unrealized appreciation and depreciation based on that cost were: |
| Unrealized Appreciation | $ | 103,716 | ||
| Unrealized Depreciation | (8,012 | ) | ||
| Net Unrealized Appreciation | $ | 95,704 |
· | Currently non-income producing. |
| ╪ | See Significant Accounting Policies of accompanying Notes to Financial Statements regarding valuation of securities. |
| Investment Valuation Hierarchy Level Summary |
| June 30, 2011 (Unaudited) |
| (000’s Omitted) |
| Total | Level 1 ♦ | Level 2 ♦ | Level 3 | |||||||||||||
| Assets: | ||||||||||||||||
Common Stocks ‡ | $ | 408,392 | $ | 408,392 | $ | – | $ | – | ||||||||
| Short-Term Investments | 1,672 | – | 1,672 | – | ||||||||||||
| Total | $ | 410,064 | $ | 408,392 | $ | 1,672 | $ | – | ||||||||
| ♦ | For the six-month period ended June 30, 2011, there were no significant transfers between Level 1 and Level 2. |
| ‡ | The Fund has all or primarily all of the equity securities categorized in a particular level. Refer to the Schedule of Investments for further industry breakout. |
| Statement of Assets and Liabilities |
June 30, 2011 (Unaudited) |
| (000’s Omitted) |
| Assets: | ||||
| Investments in securities, at market value (cost $311,168) | $ | 410,064 | ||
| Cash | 1 | |||
| Receivables: | ||||
| Investment securities sold | 4,805 | |||
| Fund shares sold | 1,060 | |||
| Dividends and interest | 144 | |||
| Total assets | 416,074 | |||
| Liabilities: | ||||
| Payables: | ||||
| Investment securities purchased | 1,744 | |||
| Fund shares redeemed | 342 | |||
| Investment management fees | 51 | |||
| Distribution fees | 4 | |||
| Accrued expenses | 42 | |||
| Total liabilities | 2,183 | |||
| Net assets | $ | 413,891 | ||
| Summary of Net Assets: | ||||
| Capital stock and paid-in-capital | $ | 379,758 | ||
| Accumulated undistributed net investment income | 649 | |||
| Accumulated net realized loss on investments | (65,412 | ) | ||
| Unrealized appreciation of investments | 98,896 | |||
| Net assets | $ | 413,891 | ||
| Shares authorized | 800,000 | |||
| Par value | $ | 0.001 | ||
Class IA: Net asset value per share | $ | 12.94 | ||
| Shares outstanding | 24,101 | |||
| Net assets | $ | 311,847 | ||
Class IB: Net asset value per share | $ | 12.70 | ||
| Shares outstanding | 8,035 | |||
| Net assets | $ | 102,044 | ||
| Statement of Operations |
| For the Six-Month Period Ended June 30, 2011 (Unaudited) |
| (000’s Omitted) |
| Investment Income: | ||||
| Dividends | $ | 2,029 | ||
| Interest | 1 | |||
| Less: Foreign tax withheld | (17 | ) | ||
| Total investment income, net | 2,013 | |||
| Expenses: | ||||
| Investment management fees | 1,655 | |||
| Transfer agent fees | 2 | |||
| Distribution fees - Class IB | 133 | |||
| Custodian fees | 6 | |||
| Accounting services fees | 21 | |||
| Board of Directors' fees | 5 | |||
| Audit fees | 5 | |||
| Other expenses | 60 | |||
| Total expenses (before fees paid indirectly) | 1,887 | |||
| Commission recapture | (3 | ) | ||
| Total fees paid indirectly | (3 | ) | ||
| Total expenses, net | 1,884 | |||
| Net investment income | 129 | |||
| Net Realized Gain on Investments and Foreign Currency Transactions: | ||||
| Net realized gain on investments | 25,943 | |||
| Net Realized Gain on Investments and Foreign Currency Transactions | 25,943 | |||
| Net Changes in Unrealized Appreciation of Investments: | ||||
| Net unrealized appreciation of investments | 5,299 | |||
| Net Changes in Unrealized Appreciation of Investments | 5,299 | |||
| Net Gain on Investments and Foreign Currency Transactions | 31,242 | |||
| Net Increase in Net Assets Resulting from Operations | $ | 31,371 | ||
| Statement of Changes in Net Assets |
| (000’s Omitted) |
| For the | ||||||||
| Six-Month | For the | |||||||
| Period Ended | Year Ended | |||||||
| June 30, 2011 | December 31, | |||||||
| (Unaudited) | 2010 | |||||||
| Operations: | ||||||||
| Net investment income | $ | 129 | $ | 539 | ||||
| Net realized gain on investments | 25,943 | 30,396 | ||||||
| Net unrealized appreciation of investments | 5,299 | 32,180 | ||||||
| Net Increase In Net Assets Resulting From Operations | 31,371 | 63,115 | ||||||
| Distributions to Shareholders: | ||||||||
| From net investment income | ||||||||
| Class IA | — | (74 | ) | |||||
| Class IB | — | (26 | ) | |||||
| Total distributions | — | (100 | ) | |||||
| Capital Share Transactions: | ||||||||
| Class IA | ||||||||
| Sold | 29,279 | 43,139 | ||||||
| Issued in merger | — | 54,822 | ||||||
| Issued on reinvestment of distributions | — | 74 | ||||||
| Redeemed | (58,437 | ) | (70,148 | ) | ||||
| Total capital share transactions | (29,158 | ) | 27,887 | |||||
| Class IB | ||||||||
| Sold | 6,989 | 14,660 | ||||||
| Issued in merger | — | 23,402 | ||||||
| Issued on reinvestment of distributions | — | 26 | ||||||
| Redeemed | (21,549 | ) | (31,714 | ) | ||||
| Total capital share transactions | (14,560 | ) | 6,374 | |||||
| Net increase (decrease) from capital share transactions | (43,718 | ) | 34,261 | |||||
| Net Increase (Decrease) In Net Assets | (12,347 | ) | 97,276 | |||||
| Net Assets: | ||||||||
| Beginning of period | 426,238 | 328,962 | ||||||
| End of period | $ | 413,891 | $ | 426,238 | ||||
Accumulated undistributed (distribution in excess of) net investment income | $ | 649 | $ | 520 | ||||
| Shares: | ||||||||
| Class IA | ||||||||
| Sold | 2,318 | 4,106 | ||||||
| Issued in merger | — | 5,038 | ||||||
| Issued on reinvestment of distributions | — | 8 | ||||||
| Redeemed | (4,636 | ) | (6,806 | ) | ||||
| Total share activity | (2,318 | ) | 2,346 | |||||
| Class IB | ||||||||
| Sold | 565 | 1,394 | ||||||
| Issued in merger | — | 2,184 | ||||||
| Issued on reinvestment of distributions | — | 3 | ||||||
| Redeemed | (1,741 | ) | (3,095 | ) | ||||
| Total share activity | (1,176 | ) | 486 | |||||
| Notes to Financial Statements |
| June 30, 2011 (Unaudited) |
| (000’s Omitted) |
| 1. | Organization: |
Hartford Growth HLS Fund (the “Fund”) serves as an underlying investment option for certain variable annuity and variable life insurance separate accounts of Hartford Life Insurance Company (“HLIC”) and its affiliates and certain qualified retirement plans. The Fund may also serve as an underlying investment option for certain variable annuity and variable life separate accounts of other insurance companies. Owners of variable annuity contracts and policyholders of variable life insurance contracts may choose the funds permitted in the variable insurance contract prospectus. In addition, participants in certain qualified retirement plans may choose the Fund if permitted by their plans.
Hartford Series Fund, Inc. (the “Company”) is an open-end registered management investment company comprised of thirty portfolios. Financial Statements for the Fund, a series of the Company, are included in this report.
The Company is organized under the laws of the State of Maryland and is registered with the Securities and Exchange Commission (“SEC”) under the Investment Company Act of 1940, as amended (“1940 Act”). The Fund is a diversified open-end management investment company.
The Fund is divided into Class IA and Class IB shares. Each class is offered at the per share net asset value (“NAV”) without a sales charge and is subject to the same expenses, except that the Class IB shares are subject to distribution and service fees charged pursuant to a Distribution Plan adopted in accordance with Rule 12b-1 under the 1940 Act.
| 2. | Significant Accounting Policies: |
The following is a summary of significant accounting policies of the Fund in the preparation of its financial statements, which are in accordance with the United States Generally Accepted Accounting Principles (“U.S. GAAP”). The preparation of financial statements in accordance with U.S. GAAP may require management to make estimates and assumptions that affect the reported amounts of assets and liabilities and disclosure of contingent assets and liabilities at the date of the financial statements and the reported amounts of increases and decreases in net assets from operations during the reporting period. Actual results could differ from those estimates.
| a) | Determination of Net Asset Value – The NAV of each class of the Fund's shares is determined as of the close of regular trading (normally 4:00 p.m. Eastern Time) (the “NYSE Close”) on each day that the New York Stock Exchange (the “Exchange”) is open (“Valuation Date”). Information that becomes known to the Fund after the NAV has been calculated on a particular day will not generally be used to retroactively adjust the NAV determined earlier that day. |
| b) | Investment Valuation and Fair Value Measurements – For purposes of calculating the NAV, portfolio securities and other assets held by the Fund's portfolio for which market quotes are readily available are valued at market value. Market value is generally determined on the basis of last reported sales prices or official close price. If no sales are reported, market value is based on quotes obtained from a quotation reporting system, established market makers, or independent pricing services. If market prices are not readily available or are deemed unreliable, the Fund will use the fair value of the security as determined in good faith under policies and procedures established by and under the supervision of the Company's Board of Directors. Market quotes are considered not readily available where there is an absence of current or reliable market-based data (e.g., trade information or broker quotes), including where events occur after the close of the relevant market, but prior to the NYSE Close that materially affect the values of the Fund's portfolio securities or assets. In addition, market quotes are considered not readily available when, due to extraordinary circumstances, the exchanges or markets on which the securities trade, do not open for trading for the entire day and no other market prices are available. In addition, prices of foreign equities that are principally traded on certain foreign markets are adjusted daily pursuant to a fair value pricing service approved by the Board of Directors in order to reflect an adjustment for the factors occurring after the close of certain foreign markets but before the NYSE Close. Securities that are primarily |
| Hartford Growth HLS Fund |
| Notes to Financial Statements – (continued) |
| June 30, 2011 (Unaudited) |
| (000’s Omitted) |
traded on foreign markets may trade on days that are not business days of the Fund. The value of the foreign securities, in which the Fund invests, may change on days when a shareholder will not be able to purchase or redeem shares of the Fund. Fair value pricing is subjective in nature and the use of fair value pricing by the Fund may cause the NAV of its shares to differ significantly from the NAV that would have been calculated using market prices at the close of the exchange on which a portfolio security is primarily traded. There can be no assurance that the Fund could obtain the fair market value assigned to a security if the Fund were to sell the security at approximately the time at which the Fund determines its NAV.
Investments valued in currencies other than U.S. dollars are converted to U.S. dollars using exchange rates obtained from independent pricing services for calculation of the NAV. As a result, the NAV of the Fund’s shares may be affected by changes in the value of currencies in relation to the U.S. dollar. The value of securities traded in markets outside the United States or denominated in currencies other than the U.S. dollar may be affected significantly on a day that the NYSE is closed and the market value may change on days when an investor is not able to purchase, redeem or exchange shares of the Fund.
Financial instruments for which prices are not available from an independent pricing service may be valued using market quotations obtained from one or more dealers that make markets in the respective financial instrument in accordance with procedures established by the Company’s Board of Directors.
U.S. GAAP defines fair value as the price that the Fund would receive to sell an asset or pay to transfer a liability in an orderly transaction between market participants. The U.S. GAAP fair value measurement standards require disclosure of a fair value hierarchy for each major category of assets and liabilities. Various inputs are used in determining the fair value of the Fund’s investments. These inputs are summarized into three broad hierarchy levels. This hierarchy is based on whether the valuation inputs are observable or unobservable. These levels are:
| · | Level 1 – Quoted prices in active markets for identical securities. Level 1 may include exchange-traded instruments such as domestic equities, some foreign equities, options, futures, mutual funds, exchange-traded funds, rights and warrants. |
| · | Level 2 – Observable inputs other than Level 1 prices, such as quoted prices for similar securities; quoted prices in markets that are not active; or other inputs that are observable or can be corroborated by observable market data. Level 2 may include debt securities that are traded less frequently than exchange-traded instruments and which are valued using third party pricing services; foreign equities, whose value is determined using a multi-factor regression model with inputs that are observable in the market; and short-term securities, which are valued at amortized cost. |
| · | Level 3 – Significant unobservable inputs that are supported by limited or no market activity. Level 3 may include financial instruments whose values are determined using broker quotes or require significant management judgment or estimation. These unobservable valuation inputs may include estimates for current yields, maturity/duration, prepayment speed, and broker quotes for comparable securities along with other assumptions relating to credit quality, collateral value, complexity of the security structure, general market conditions and liquidity. This category may include securities where trading has been halted or there are certain restrictions on trading. While these securities are priced using unobservable inputs, the valuation of these securities reflects the best available data and management believes the prices are a reasonable representation of exit price. |
Valuation levels are not necessarily indicative of the risk associated with investing in such securities. Individual securities within any of the above mentioned asset classes may be assigned a different hierarchical level than those presented above, as individual circumstances dictate.
During the six-month period ended June 30, 2011, the Fund held no Level 3 securities, therefore no reconciliation of Level 3 securities is presented.
For additional information, refer to the Investment Valuation Hierarchy Level Summary which follows the Schedule of Investments.
For purposes of reporting transfers between different hierarchy levels, both transfers in and out of each level, as applicable, are shown as if they occurred at the beginning of the period.
| c) | Security Transactions and Investment Income – Security transactions are recorded as of the trade date (the date the order to buy or sell is executed) for financial reporting purposes. Securities purchased or sold on a when-issued or delayed-delivery basis may be settled a month or more after the trade date. Realized gains and losses are determined on the basis of identified cost. |
Dividend income is accrued as of the ex-dividend date, except that certain dividends from foreign securities where the ex-dividend date may have passed are recorded as soon as the Fund is informed of the dividend. Interest income, including amortization of premium and accretion of discounts, is accrued on a daily basis.
| d) | Foreign Currency Transactions – Assets and liabilities denominated in currencies other than U.S. dollars are translated into U.S. dollars at the exchange rates in effect on the valuation date. Purchases and sales of investment securities, income, and expenses are translated into U.S. dollars at the exchange rates on the dates of such transactions. |
The Fund does not isolate that portion of portfolio security valuation resulting from fluctuations in the foreign currency exchange rates from the fluctuations arising from changes in the market prices of securities held. Exchange rate fluctuations are included with the net realized and unrealized gain or loss on investments in the accompanying financial statements.
Net realized foreign exchange gains or losses arise from sales of foreign currencies and the difference between asset and liability amounts initially stated in foreign currencies and the U.S. dollar value of the amounts actually received or paid. Net unrealized foreign exchange gains or losses arise from changes in the value of other assets and liabilities at the end of the reporting period, resulting from changes in the exchange rates.
| e) | Joint Trading Account – The Fund may invest cash balances into a joint trading account that may be invested in one or more repurchase agreements. |
| f) | Fund Share Valuation and Dividend Distributions to Shareholders – Orders for the Fund’s shares are executed in accordance with the investment instructions of the contract holders and plan participants. The NAV of the Fund’s shares is determined as of the close of business on each business day of the Exchange. The NAV is determined separately for each class of shares of the Fund by dividing the Fund’s net assets attributable to that class by the number of shares of the class outstanding. Each class of shares offered by the Fund has equal rights as to assets and voting privileges (except that shareholders of a class have exclusive voting rights regarding any matter relating solely to that class of shares). Income and non-class specific expenses are allocated daily to each class on the basis of the relative net assets of the class. Realized and unrealized capital gains and losses of each class are allocated daily based on the relative net assets of each class of shares of the Fund. |
Orders for the purchase of the Fund’s shares received prior to the close of the Exchange on any day the Exchange is open for business are priced at the NAV determined as of the close of the Exchange. Orders received after the close of the Exchange, or on a day on which the Exchange and/or the Fund is not open for business, are priced at the next determined NAV.
| Hartford Growth HLS Fund |
| Notes to Financial Statements – (continued) |
| June 30, 2011 (Unaudited) |
| (000’s Omitted) |
Dividends are declared pursuant to a policy adopted by the Company’s Board of Directors based upon the investment performance of the Fund. The policy of the Fund is to pay dividends from net investment income and realized capital gains, if any, at least once a year.
Distributions from net investment income, net realized capital gains and capital are determined in accordance with federal income tax regulations, which may differ from U.S. GAAP with respect to character and timing. These differences may include but are not limited to losses deferred due to wash sale adjustments, foreign currency gains and losses, adjustments related to Passive Foreign Investment Companies (“PFICs”), Real Estate Investment Trusts (“REITs”), Regulated Investment Companies (“RICs”), certain derivatives and partnerships. Permanent book and federal income tax basis differences relating to shareholder distributions will result in reclassifications to certain of the Fund’s capital accounts (see Federal Income Taxes: Reclassification of Capital Accounts note).
| 3. | Securities and Other Investments: |
| a) | Repurchase Agreements – A repurchase agreement is an agreement by which a counterparty agrees to sell a security and agrees to repurchase the security sold at a mutually agreed upon time and price. At the time the Fund enters into a repurchase agreement, the value of the underlying collateral security(ies), including accrued interest, will be equal to or exceed the value of the repurchase agreement. Repurchase agreements expose the Fund to counterparty risk. To minimize counterparty risk, the securities that serve to collateralize the repurchase agreement are held by the Fund's custodian in book entry or physical form in the custodial account of the Fund or in a third party custodial account. Repurchase agreements are valued at cost plus accrued interest. The Fund, as shown on the Schedule of Investments, had outstanding repurchase agreements as of June 30, 2011. |
| 4. | Principal Risks: |
| a) | Counterparty Risk – The Fund may be exposed to counterparty risk, or the risk that an institution or other entity with which the Fund has unsettled or open transactions will default. |
| b) | Market Risks – If a Fund invests directly in foreign currencies or in securities that trade in, and receive revenues in, foreign currencies, or in derivatives that provide exposure to foreign currencies, it will be subject to the risk that those currencies will decline in value relative to the base currency of the Fund, or, in the case of hedging positions, that the Fund’s base currency will decline in value relative to the currency being hedged. Currency rates in foreign countries may fluctuate significantly over short periods of time for a number of reasons, including changes in interest rates, intervention (or the failure to intervene) by U.S. or foreign governments, central banks or supranational entities such as the International Monetary Fund, or by the imposition of currency controls or other political developments in the United States or abroad. As a result, the Fund’s investments in foreign currency denominated securities may reduce the returns of the Fund. The market values of equity securities, such as common stocks and preferred stocks or equity related investments such as futures and options, may decline due to general market conditions which are not specifically related to a particular company, such as real or perceived adverse economic conditions, changes in the general outlook for corporate earnings, changes in interest or currency rates or adverse investor sentiment generally. The market value of equity securities may also decline due to factors which affect a particular industry or industries, such as labor shortages or increased production costs and competitive conditions within an industry. Equity securities and equity related investments generally have greater market price volatility than fixed income securities. |
| 5. | Federal Income Taxes: |
| a) | Federal Income Taxes – For federal income tax purposes, the Fund intends to continue to qualify as a RIC under Subchapter M of the Internal Revenue Code (“IRC”) by distributing substantially all of its taxable net investment income and net realized capital gains to its shareholders and otherwise complying with the requirements of RICs. The Fund has |
distributed substantially all of its income and capital gains in prior years, if applicable, and intends to distribute substantially all of its income and capital gains prior to the next fiscal year-end. Accordingly, no provision for federal income or excise taxes has been made in the accompanying financial statements. Distributions from short-term capital gains are treated as ordinary income distributions for federal income tax purposes.
| b) | Net Investment Income (Loss), Net Realized Gains (Losses) – Net investment income (loss) and net realized gains (losses) may differ for financial statement and tax purposes primarily because of losses deferred due to wash sale adjustments, foreign currency gains and losses, adjustments related to PFICs, REITs, RICs, certain derivatives and partnerships. The character of distributions made during the year from net investment income or net realized gains may differ from their ultimate characterization for federal income tax purposes. Also, due to the timing of dividend distributions, the fiscal year in which amounts are distributed may differ from the year that the income or realized gains (losses) were recorded by the Fund. |
| c) | Distributions and Components of Distributable Earnings – The tax character of distributions paid by the Fund for the periods indicated is as follows (as adjusted for dividends payable): |
| For the Year Ended | For the Year Ended | |||||||
| December 31, 2010 | December 31, 2009 | |||||||
| Ordinary Income | $ | 100 | $ | 1,118 | ||||
As of December 31, 2010, the Fund’s components of distributable earnings (deficit) on a tax basis were as follows:
| Amount | ||||
| Undistributed Ordinary Income | $ | 520 | ||
| Accumulated Capital and Other Losses* | (88,163 | ) | ||
Unrealized Appreciation† | 90,405 | |||
| Total Accumulated Earnings | $ | 2,762 | ||
| * | The Fund has capital loss carryforwards that are identified in the Capital Loss Carryforward note that follows. |
| † | The difference between book-basis and tax-basis unrealized appreciation (depreciation) may be attributable to the losses deferred due to wash sale adjustments, foreign currency gains and losses, adjustments related to PFICs, REITs, RICs, certain derivatives and partnerships. |
| d) | Reclassification of Capital Accounts – The Fund may record reclassifications in its capital accounts. These reclassifications have no impact on the total net assets of the Fund. The reclassifications are a result of permanent differences between U.S. GAAP and tax accounting for such items as expiration or utilization of capital loss carryforwards or net operating losses. Adjustments are made to reflect the impact these items have on current and future distributions to shareholders. Therefore, the source of the Fund’s distributable income may be shown in the accompanying Statement of Assets and Liabilities as from accumulated undistributed net investment income, from accumulated net realized gains on investments or from capital depending on the type of book and tax differences that exist. For the year ended December 31, 2010, the Fund recorded reclassifications to increase (decrease) the accounts listed below: |
| Amount | ||||
| Accumulated Undistributed Net Investment Income | $ | (7 | ) | |
| Accumulated Net Realized Gain (Loss) on Investments and Foreign Currency Transactions | 7 | |||
| Hartford Growth HLS Fund |
| Notes to Financial Statements – (continued) |
| June 30, 2011 (Unaudited) |
| (000’s Omitted) |
| e) | Capital Loss Carryforward – At December 31, 2010 (tax-year-end), the Fund had capital okloss carryforwards for U.S. federal income tax purposes of approximately: |
| Year of Expiration | Amount | |||
| 2016 | $ | 21,354 | ||
| 2017 | 66,809 | |||
| Total | $ | 88,163 | ||
As a result of current or past mergers in the Fund, certain provisions in the Internal Revenue Code may limit the future utilization of capital losses. As of December 31, 2010, the Fund utilized $24,838 of prior year capital loss carryforwards.
| f) | Accounting for Uncertainty in Income Taxes – The Fund has adopted financial reporting rules that require the Fund to analyze all open tax years, as defined by the Statute of Limitations, for all major jurisdictions. Generally, tax authorities can examine all tax returns filed for the last three years. The Fund does not have an examination in progress. |
The Fund has reviewed all open tax years and major jurisdictions and concluded that these financial reporting rules had no effect on the Fund’s financial position or results of operations. There is no tax liability resulting from unrecognized tax benefits relating to uncertain income tax positions taken or expected to be taken on the tax return for the fiscal year-end December 31, 2010. The Fund is also not aware of any tax positions for which it is reasonably possible that the total amounts of unrecognized tax benefits will significantly change in the next twelve months.
| 6. | Expenses: |
| a) | Investment Management Agreements – HL Investment Advisors, LLC (“HL Advisors”), an indirect wholly owned subsidiary of The Hartford Financial Services Group, Inc. (“The Hartford”), serves as investment manager to the Fund pursuant to an Investment Management Agreement with the Company. As investment manager, HL Advisors has overall investment supervisory responsibility for the Fund. In addition, HL Advisors provides administrative personnel, services, equipment, facilities and office space for proper operation of the Fund. HL Advisors has contracted with Wellington Management Company, LLP (“Wellington Management”) under a sub-advisory agreement for the provision of day-today investment management services to the Fund in accordance with the Fund’s investment objective and policies. The Fund pays a fee to HL Advisors, a portion of which may be used to compensate Wellington Management. |
The schedule below reflects the rates of compensation paid to HL Advisors for investment management services rendered as of June 30, 2011; the rates are accrued daily and paid monthly.
| Average Daily Net Assets | Annual Fee | |||
| On first $250 million | 0.8000 | % | ||
| On next $250 million | 0.7500 | % | ||
| On next $500 million | 0.7000 | % | ||
| On next $4 billion | 0.6750 | % | ||
| On next $5 billion | 0.6725 | % | ||
| Over $10 billion | 0.6700 | % | ||
| b) | Accounting Services Agreement – Pursuant to the Fund Accounting Agreement between HLIC and the Company, on behalf of the Fund, HLIC provides accounting services to the Fund and receives monthly compensation based on the Fund’s average net assets at the rates set forth below. The Fund’s accounting services fees are accrued daily and paid monthly. |
| Average Daily Net Assets | Annual Fee | |||
| All Assets | 0.010 | % | ||
| c) | Operating Expenses – Allocable expenses incurred by the Company are allocated to each Fund and allocated to classes within a Fund in proportion to the average daily net assets of the Fund and each class, except where allocation of certain expenses is more fairly made directly to the Fund or to specific classes within a Fund. |
| d) | Fees Paid Indirectly – The Company, on behalf of the Fund, has entered into agreements with State Street Global Markets, LLC and Russell Implementation Services, Inc. to partially recapture non-discounted trade commissions. Such rebates are used to pay a portion of the Fund’s expenses. In addition, the Fund’s custodian bank has also agreed to reduce its fees when the Fund maintains cash on deposit in a non-interest-bearing custody account. For the six-month period ended June 30, 2011, these amounts are included in the Statement of Operations. |
The ratio of expenses to average net assets in the accompanying financial highlights excludes the reduction in expenses related to fees paid indirectly. The annualized expense ratio for the period listed below including the fees paid indirectly is as follows:
| Annualized Six- | ||||
| Month Period | ||||
| Ended June 30, | ||||
| 2011 | ||||
| Class IA | 0.83 | % | ||
| Class IB | 1.08 | |||
| e) | Distribution Plan for Class IB shares – The Company, on behalf of the Fund, has adopted a Distribution Plan pursuant to Rule 12b-1 of the 1940 Act to compensate the Distributor, Hartford Securities Distribution Company, Inc. (a wholly owned, ultimate subsidiary of The Hartford), from assets attributable to the Class IB shares for services rendered and expenses borne in connection with activities primarily intended to result in the sale of the Class IB shares, subject to the review and approval of the Company’s Board of Directors. |
The Distribution Plan provides that the Fund may pay annually up to 0.25% of the average daily net assets of the Fund attributable to its Class IB shares for activities primarily intended to result in the sale of Class IB shares. The Board has the authority to suspend or reduce these payments at any point in time. Under the terms of the Distribution Plan and the principal underwriting agreement, the Fund is authorized to make payments monthly to the Distributor that may be used to pay or compensate entities providing distribution and shareholder servicing with respect to the Class IB shares for such entities’ fees or expenses incurred or paid in that regard. These fees are accrued daily and paid monthly.
| f) | Other Related Party Transactions – Certain officers of the Fund are directors and/or officers of HL Advisors and/or The Hartford or its subsidiaries. For the six-month period ended June 30, 2011, a portion of the Fund’s chief compliance officer’s salary was paid by all the investment companies in the Hartford fund complex. The portion allocated to the Fund rounds to zero. Hartford Administrative Services Company (“HASCO”), an indirect wholly owned subsidiary of The Hartford, provides transfer agent services to the Fund. The amount paid to HASCO can be found in the Statement of Operations. These fees are accrued daily and paid monthly. |
| Hartford Growth HLS Fund |
| Notes to Financial Statements – (continued) |
| June 30, 2011 (Unaudited) |
| (000’s Omitted) |
| g) | Payments from Affiliates – On November 8, 2006, the SEC issued an order setting forth the terms of a settlement reached with three subsidiaries of The Hartford that resolved the SEC’s Division of Enforcement’s investigation of aspects of The Hartford’s variable annuity and mutual fund operations related to directed brokerage and revenue sharing. The Hartford settled this matter without admitting or denying the findings of the SEC. |
The Fund is available for purchase by the separate accounts of different variable universal life policies, variable annuity products, and funding agreements and it is offered directly to certain qualified retirement plans (collectively “Products”). Although existing Products contain transfer restrictions, some Products, particularly older variable annuity products, do not contain restrictions on the frequency of transfers. In addition, as the result of the settlement of litigation against Hartford Life, Inc. (“Hartford Life”) (the issuers of such variable annuity products), the Fund’s ability to restrict transfers by certain owners of older variable annuity products was limited. During 2006, these annuity owners surrendered the older variable annuity contracts that were the subject of prior litigation. In February 2005, Hartford Life agreed with the Board of Directors of the Company to indemnify the Fund for any material harm caused to the Fund from frequent trading by these contract owners.
The total return in the accompanying financial highlights includes payments from affiliates. Had the payments from the affiliates been excluded, the impact and total return for the periods listed below would have been as follows:
| For the Year Ended December 31, 2006 | ||||||||
| Class IA | Class IB | |||||||
| Impact from Payment from Affiliate for SEC Settlement | 0.01 | % | 0.01 | % | ||||
| Impact from Payment from Affiliate for Unrestricted Transfers | 0.04 | 0.04 | ||||||
| Total Return Excluding Payments from Affiliates | 4.56 | 4.30 | ||||||
| 7. | Investment Transactions: |
For the six-month period ended June 30, 2011, the Fund's aggregate purchases and sales of investment securities (excluding short-term investments) were as follows:
| Amount | ||||
| Cost of Purchases Excluding U.S. Government Obligations | $ | 105,741 | ||
| Sales Proceeds Excluding U.S. Government Obligations | 153,986 | |||
| 8. | Line of Credit: |
The Fund is one of several Hartford funds that participate in a $500 million committed revolving line of credit facility. The facility is to be used for temporary or emergency purposes. Under the arrangement, a fund is required to own securities having a market value in excess of 300% of the total bank borrowings. The interest rate on borrowings varies depending on the nature of the loan. The facility also requires a fee to be paid based on the amount of the commitment. This commitment fee is allocated to all the funds participating in the line of credit based on the average net assets of the funds. During the six-month period ended June 30, 2011, the Fund did not have any borrowings under this facility.
| 9. | Industry Classifications: |
Other than the industry classifications “Other Investment Pools and Funds” and “Exchange Traded Funds,” equity industry classifications used in this report are the Global Industry Classification Standard, which was developed by and is the exclusive property and service mark of MSCI, Inc. and Standard & Poor’s.
| 10. | Indemnifications: |
Under the Company’s organizational documents, the Company shall indemnify its officers and directors to the full extent required or permitted under Maryland General Corporation Law and the federal securities laws. In addition, the Company, on behalf of the Fund, may enter into contracts that contain a variety of indemnifications. The Company’s maximum exposure under these arrangements is unknown. However, as of the date of these financial statements the Company has not had prior claims or losses pursuant to these contracts and expects the risk of loss to be remote.
| Financial Highlights |
| - Selected Per-Share Data (A) - |
| Net Asset | Net Realized | Net Increase | ||||||||||||||||||||||||||||||||||||||||||
| Value at | and Unrealized | Total from | Dividends from | Distributions | (Decrease) in | Net Asset | ||||||||||||||||||||||||||||||||||||||
| Beginning of | Net Investment | Payments from | Gain (Loss) on | Investment | Net Investment | from Realized | Distributions | Total | Net Asset | Value at End of | ||||||||||||||||||||||||||||||||||
| Class | Period | Income (Loss) | (to) Affiliate | Investments | Operations | Income | Capital Gains | from Capital | Distributions | Value | Period | |||||||||||||||||||||||||||||||||
| For the Six-Month Period Ended June 30, 2011 (Unaudited) | ||||||||||||||||||||||||||||||||||||||||||||
| IA | $ | 12.02 | $ | 0.01 | $ | – | $ | 0.91 | $ | 0.92 | $ | – | $ | – | $ | – | $ | – | $ | 0.92 | $ | 12.94 | ||||||||||||||||||||||
| IB | 11.81 | (0.01 | ) | – | 0.90 | 0.89 | – | – | – | – | 0.89 | 12.70 | ||||||||||||||||||||||||||||||||
| For the Year Ended December 31, 2010(G) | ||||||||||||||||||||||||||||||||||||||||||||
| IA | 10.07 | 0.02 | – | 1.93 | 1.95 | – | – | – | – | 1.95 | 12.02 | |||||||||||||||||||||||||||||||||
| IB | 9.92 | – | – | 1.89 | 1.89 | – | – | – | – | 1.89 | 11.81 | |||||||||||||||||||||||||||||||||
| For the Year Ended December 31, 2009 | ||||||||||||||||||||||||||||||||||||||||||||
| IA | 7.53 | 0.04 | ��� | 2.54 | 2.58 | (0.04 | ) | – | – | (0.04 | ) | 2.54 | 10.07 | |||||||||||||||||||||||||||||||
| IB | 7.42 | 0.02 | – | 2.49 | 2.51 | (0.01 | ) | – | – | (0.01 | ) | 2.50 | 9.92 | |||||||||||||||||||||||||||||||
| For the Year Ended December 31, 2008 | ||||||||||||||||||||||||||||||||||||||||||||
| IA | 13.39 | 0.03 | – | (5.47 | ) | (5.44 | ) | (0.03 | ) | (0.39 | ) | – | (0.42 | ) | (5.86 | ) | 7.53 | |||||||||||||||||||||||||||
| IB | 13.18 | – | – | (5.37 | ) | (5.37 | ) | – | (0.39 | ) | – | (0.39 | ) | (5.76 | ) | 7.42 | ||||||||||||||||||||||||||||
| For the Year Ended December 31, 2007 | ||||||||||||||||||||||||||||||||||||||||||||
| IA | 12.32 | 0.01 | – | 2.01 | 2.02 | – | (0.95 | ) | – | (0.95 | ) | 1.07 | 13.39 | |||||||||||||||||||||||||||||||
| IB | 12.17 | (0.02 | ) | – | 1.98 | 1.96 | – | (0.95 | ) | – | (0.95 | ) | 1.01 | 13.18 | ||||||||||||||||||||||||||||||
| For the Year Ended December 31, 2006 | ||||||||||||||||||||||||||||||||||||||||||||
| IA | 12.54 | 0.01 | 0.01 | 0.56 | 0.58 | (0.01 | ) | (0.79 | ) | – | (0.80 | ) | (0.22 | ) | 12.32 | |||||||||||||||||||||||||||||
| IB | 12.42 | (0.02 | ) | 0.01 | 0.55 | 0.54 | – | (0.79 | ) | – | (0.79 | ) | (0.25 | ) | 12.17 | |||||||||||||||||||||||||||||
| (A) | Information presented relates to a share outstanding throughout the indicated period. |
| (B) | The figures do not include sales charges or other fees which may be applied at the variable life insurance, variable annuity or qualified retirement plan product level. Any such additional sales charges or other fees would lower the Fund's performance. |
| (C) | Ratios do not reflect reductions for fees paid indirectly. Please see Fees Paid Indirectly in the Notes to Financial Statements. |
| (D) | Portfolio turnover rate is calculated on the basis of the Fund as a whole without distinguishing between the classes of shares issued. |
| (E) | Not annualized. |
| (F) | Annualized. |
| (G) | Per share amounts have been calculated using the average shares method. |
| (H) | During the year ended December 31, 2010, the Fund incurred $49.9 million in sales associated with the transition of assets from Hartford Fundamental Growth HLS Fund, which merged into the Fund on April 16, 2010. These sales were excluded from the portfolio turnover calculation. |
| (I) | Total return without the inclusion of the Payment from (to) Affiliate can be found in Expenses in the accompanying Notes to Financial Statements. |
| - Ratios and Supplemental Data - |
| Ratio of Expenses to Average Net | Ratio of Expenses to Average Net | Ratio of Net Investment Income to | Portfolio Turnover | |||||||||||||||||||
| Total Return(B) | Net Assets at End of Period | Assets Before Waivers(C) | Assets After Waivers(C) | Average Net Assets | Rate(D) | |||||||||||||||||
| 7.68 | %(E) | $ | 311,847 | 0.83 | %(F) | 0.83 | %(F) | 0.12 | %(F) | 25 | % | |||||||||||
| 7.54 | (E) | 102,044 | 1.08 | (F) | 1.08 | (F) | (0.13 | ) (F) | – | |||||||||||||
| 19.37 | 317,464 | 0.84 | 0.84 | 0.21 | 74 | (H) | ||||||||||||||||
| 19.07 | 108,774 | 1.09 | 1.09 | (0.04 | ) | – | ||||||||||||||||
| 34.24 | �� | 242,406 | 0.88 | 0.88 | 0.44 | 85 | ||||||||||||||||
| 33.90 | 86,556 | 1.13 | 1.13 | 0.20 | – | |||||||||||||||||
| (41.79 | ) | 203,993 | 0.84 | 0.84 | 0.27 | 93 | ||||||||||||||||
| (41.93 | ) | 81,720 | 1.09 | 1.09 | 0.02 | – | ||||||||||||||||
| 16.78 | 388,985 | 0.83 | 0.83 | 0.11 | 101 | |||||||||||||||||
| 16.49 | 189,987 | 1.08 | 1.08 | (0.14 | ) | – | ||||||||||||||||
| 4.61 | (I) | 379,601 | 0.84 | 0.84 | 0.10 | 95 | ||||||||||||||||
| 4.35 | (I) | 190,063 | 1.09 | 1.09 | (0.14 | ) | – | |||||||||||||||
| Directors and Officers (Unaudited) |
The Board of Directors of the Company appoints officers who are responsible for the day-to-day operations of the Fund and who execute policies formulated by the Directors. Each director serves until his or her death, resignation, or retirement or until the next annual meeting of shareholders is held or until his or her successor is elected and qualifies.
Directors and officers who are employed by or who have a financial interest in The Hartford are considered “interested” persons of the Fund pursuant to the 1940 Act. Each officer and two of the Company’s directors, as noted in the chart below, are “interested” persons of the Fund. Each director serves as a director for The Hartford Mutual Funds, Inc., The Hartford Mutual Funds II, Inc., Hartford Series Fund, Inc., and Hartford HLS Series Fund II, Inc., which, as of June 30, 2011, collectively consist of 89 funds. Correspondence may be sent to directors and officers c/o Hartford Mutual Funds, P.O. Box 2999, Hartford, Connecticut 06104-2999, except that correspondence to Ms. Fagely may be sent to 500 Bielenberg Drive, Woodbury, Minnesota 55125.
The table below sets forth, for each director and officer, his or her name, year of birth, current position with the Company and date first elected or appointed to Hartford Series Fund, Inc. (“HSF”), and Hartford HLS Series Fund II, Inc. (“HSF2”), principal occupation, and, for directors, other directorships held. The Fund’s statement of additional information contains further information on the directors and is available free of charge by calling 1-800-862-6668 or writing to Hartford HLS Funds, c/o Individual Annuity Services, P.O. Box 5085, Hartford, CT 06102-5085.
Information on the aggregate remuneration paid to the directors of the Company can be found in the Statement of Operations herein. The Fund pays to The Hartford a portion of the chief compliance officer’s compensation, but does not pay salaries or compensation to any of their other officers or directors who are employed by The Hartford.
Non-Interested Directors
Lynn S. Birdsong (1946) Director since 2003, Co-Chairman of the Investment Committee
Mr. Birdsong is a private investor. Mr. Birdsong currently serves as a Director of the Sovereign High Yield Investment Company (April 2010 to current). Mr. Birdsong currently serves as an Independent Director of Nomura Partners Funds, Inc. (formerly, The Japan Fund) (March 2003 to current). From 2003 to March 2005, Mr. Birdsong was an independent director of the Atlantic Whitehall Funds. From 1979 to 2002, Mr. Birdsong was a managing director of Zurich Scudder Investments, an investment management firm. During his employment with Scudder, Mr. Birdsong was an Interested Director of The Japan Fund. Since 1981, Mr. Birdsong has been a partner in Birdsong Company, an advertising specialty firm.
Robert M. Gavin, Jr. (1940) Director since 2002 (HSF) and 1986 (HSF2), Chairman of the Board since 2004
Dr. Gavin is an educational consultant. Prior to September 1, 2001, he was President of Cranbrook Education Community and prior to July 1996, he was President of Macalester College, St. Paul, Minnesota.
Duane E. Hill (1945) Director since 2001 (HSF) and 2002 (HSF2), Chairman of the Nominating Committee
Mr. Hill is Partner of TSG Ventures L.P., a private equity investment company. Mr. Hill is a former partner of TSG Capital Group, a private equity investment firm that served as sponsor and lead investor in leveraged buyouts of middle market companies.
Sandra S. Jaffee (1941) Director since 2005
Ms. Jaffee served as Chairman (2008 to 2009) and Chief Executive Officer of Fortent (formerly Searchspace Group), a leading provider of compliance/regulatory technology to financial institutions from August 2005 to August 2009. From August 2004 to August 2005, Ms. Jaffee served as an Entrepreneur in Residence with Warburg Pincus, a private equity firm. From September 1995 to July 2004, Ms. Jaffee served as Executive Vice President at Citigroup, where she was President and Chief Executive Officer of Citibank’s Global Securities Services (1995 to 2003). Ms. Jaffe currently serves as a member of the Board of Directors of Broadridge Financial Solutions as well as a Trustee of Muhlenberg College.
William P. Johnston (1944) Director since 2005, Chairman of the Compliance Committee
In June 2006, Mr. Johnston was appointed as Senior Advisor to The Carlyle Group, a global private equity investment firm. In July 2006, Mr. Johnston was elected to the Board of Directors of MultiPlan, Inc. In August 2007, Mr. Johnston was elected to the Board of Directors of LifeCare Holdings, Inc. In February 2008, Mr. Johnston was elected to the Board of Directors of HCR-ManorCare, Inc. In May 2006, Mr. Johnston was elected to the Supervisory Board of Fresenius Medical Care AG & Co. KGaA, after its acquisition of Renal Care Group, Inc. in March 2006. Mr. Johnston joined Renal Care Group in November 2002 as a member of the Board of Directors and served as Chairman of the Board from March 2003 through March 2006. From September 1987 to December 2002, Mr. Johnston was with Equitable Securities Corporation (and its successors, SunTrust Equitable Securities and SunTrust Robinson Humphrey) serving in various investment banking and managerial positions, including Managing Director and Head of Investment Banking, Chief Executive Officer and Vice Chairman.
Phillip O. Peterson (1944) Director since 2002 (HSF) and 2000 (HSF2), Chairman of the Audit Committee
Mr. Peterson is a mutual fund industry consultant. He was a partner of KPMG LLP (an accounting firm) until July 1999. Mr. Peterson joined William Blair Funds in February 2007 as a member of the Board of Trustees. From January 2004 to April 2005, Mr. Peterson served as Independent President of the Strong Mutual Funds.
Lemma W. Senbet (1946) Director since 2005
Dr. Senbet is the William E. Mayer Chair Professor of Finance and Director, Center for Financial Policy, at the University of Maryland, Robert H. Smith School of Business. He was chair of the Finance Department from 1998 to 2006. Previously he was a chaired professor of finance at the University of Wisconsin-Madison. Also, he was director of the Fortis Funds from March 2000 to July 2002. Dr. Senbet served the finance profession in various capacities, including as director of the American Finance Association and President of the Western Finance Association. In 2006, Dr. Senbet was inducted Fellow of Financial Management Association International for his career-long distinguished scholarship and professional service.
Interested Directors and Officers
David N. Levenson (1966) Director since 2010
Mr. Levenson currently serves as President of The Hartford’s Wealth Management business. He was appointed to this role in July 2010. Previously, Mr. Levenson served as Executive Vice President of Legacy Holdings for The Hartford from June 2009 to July 2010. From 2006 to 2009, Mr. Levenson was with Hartford Life Insurance K.K. where he served as President and CEO from 2007 to 2009. He served as Managing Director of Hartford Investment Management Company from 2005 to 2006. Additionally, Mr. Levenson serves as Executive Vice President of The Hartford and as President, Director and Chief Executive Officer of Hartford Life Insurance Company (“HLIC”) and Hartford Life, Inc. (“HL Inc.”).
Lowndes A. Smith (1939) Director since 1996 (HSF) and 2002 (HSF2), Co-Chairman of the Investment Committee
Mr. Smith served as Vice Chairman of The Hartford from February 1997 to January 2002, as President and Chief Executive Officer of HL Inc. from February 1997 to January 2002, and as President and Chief Operating Officer of The Hartford Life Insurance Companies from January 1989 to January 2002. Mr. Smith serves as a Director of White Mountains Insurance Group, Ltd., One Beacon Insurance and Symetra Financial and as a Managing Director of Whittington Gray Associates.
Other Officers
James E. Davey (1964) President and Chief Executive Officer since 2010
Mr. Davey serves as Executive Vice President of HLIC. Additionally, Mr. Davey serves as President, Chief Executive Officer and Manager of Hartford Investment Financial Services, Inc. (“HIFSCO”) and President, Chief Executive Officer and Manager of HL Advisors. Mr. Davey joined The Hartford in 2002.
Tamara L. Fagely (1958) Vice President, Treasurer and Controller since 2002 (HSF) and 1993 (HSF2)
Ms. Fagely has been a Vice President of HASCO since 1998 and Chief Financial Officer since 2006. Currently Ms. Fagely is a Vice President of HLIC. She served as Assistant Vice President of HLIC from December 2001 through March 2005. In addition, Ms. Fagely is Controller and Chief Financial Officer of HIFSCO.
Susan M. Fleege (1959) AML Compliance Officer since 2011
Ms. Fleege currently serves as a Director of Risk Management at The Hartford. She previously served as AML Compliance Officer for the Fund from 2005-2008. Ms. Fleege joined HLIC in 2005 from Amerprise Financial Corporation where she held the position of Counsel from 2000 to 2005. Ms. Fleege is a certified Anti-Money Laundering Specialist.
Dr. Robert J. Froehlich (1953) Senior Managing Director since 2009
Dr. Froehlich joined The Hartford as Senior Managing Director in September 2009. Prior to joining The Hartford, Dr. Froehlich served as Vice Chairman of Deutsche Asset Management from 1997-2009.
Edward P. Macdonald (1967) Vice President, Secretary and Chief Legal Officer since 2005
Mr. Macdonald serves as Vice President of HLIC and Chief Legal Officer of Mutual Funds and Vice President of HIFSCO. He also serves as Vice President and Secretary of HASCO, and Chief Legal Officer, Secretary and Vice President of HL Advisors. Mr. Macdonald joined The Hartford in 2005.
| Hartford Growth HLS Fund |
| Directors and Officers (Unaudited) – (continued) |
Vernon J. Meyer (1964) Vice President since 2006
Mr. Meyer serves as Senior Vice President of HLIC. He also serves as Senior Vice President of HIFSCO and HL Advisors. Mr. Meyer joined The Hartford in 2004.
Colleen B. Pernerewski (1969) Vice President and Chief Compliance Officer since 2010
Ms. Pernerewski serves as Vice President and Chief Investment Advisor Compliance Officer of HIFSCO and as Vice President and Chief Compliance Officer of HL Advisors. Ms. Pernerewski joined The Hartford in 2005 from Travelers Life and Annuity where she served as Counsel (2004-2005). Prior to Travelers Life and Annuity, Ms. Pernerewski held the position of Counsel at The Hartford (1998-2004).
Elizabeth L. Schroeder (1966) Vice President since 2010
Ms. Schroeder currently serves as Assistant Vice President of HLIC. Ms. Schroeder joined HLIC in 1991. She is also an Assistant Vice President of HIFSCO and HL Advisers.
Martin Swanson (1962) Vice President since 2010
Mr. Swanson is a Vice President of HLIC. Mr. Swanson also serves as Vice President/Marketing for HIFSCO. Prior to joining HLIC in 1998, Mr. Swanson was a Vice President at PaineWebber, Inc.
Jane Wolak (1961) Vice President since 2009
Ms. Wolak currently serves as Senior Vice President of HLIC. Ms. Wolak joined HLIC as Vice President, Retail Product Services in May 2007. She is also Vice President of HASCO. Previously, Ms. Wolak was with Sun Life Financial where she held the position of Vice President, Service Center Operations from 2001-2007.
A description of the policies and procedures that the Fund uses to determine how to vote proxies relating to portfolio securities and a record of how the Fund voted any proxies for the twelve-month period ended June 30, 2011 are available (1) without charge, upon request, by calling 800-862-6668 and (2) on the SEC’s website at http://www.sec.gov.
The Fund files a complete schedule of portfolio holdings with the SEC for the first and third quarters of each fiscal year on Form N-Q. The Fund’s Forms are available (1) without charge, upon request, by calling 800-862-6668 and (2) on the SEC’s website at http://www.sec.gov. The Form N-Q may be reviewed and copied at the SEC’s Public Reference Room in Washington, DC. Information on the operation of the Public Reference Room may be obtained by calling 1-800-SEC-0330.
| Expense Example (Unaudited) |
Your Fund's Expenses
As a shareholder of the Fund, you incur two types of costs: (1) transaction costs and (2) ongoing costs including investment management fees, distribution fees, and other fund expenses. This example is intended to help you understand your ongoing costs (in dollars) of investing in a Fund and to compare these costs with the ongoing costs of investing in other mutual funds. The example is based on an investment of $1,000 invested at the beginning of the period and held for the period of December 31, 2010 through June 30, 2011.
Actual Expenses
The first set of columns of the table below provides information about actual account values and actual expenses. You may use the information in this column, together with the amount you invested, to estimate the expenses that you paid over the period. Simply divide your account value by $1,000 (for example, an $8,600 account value divided by $1,000 = 8.6), then multiply the result by the number in the line under the heading entitled “Expenses Paid During Period” to estimate the expenses you paid on your account during this period.
Hypothetical Example for Comparison Purposes
The second set of columns of the table below provides information about hypothetical account values and hypothetical expenses based on a Fund's actual expense ratio and an assumed rate of return of 5% per year before expenses, which is not the Fund's actual return. The hypothetical account values and expenses may not be used to estimate the actual ending account balance or expenses you paid for the period. You may use this information to compare the ongoing costs of investing in a Fund and other funds. To do so, compare this 5% hypothetical example with the 5% hypothetical examples that appear in the shareholder reports of the other funds.
Please note that the expenses shown in the table are meant to highlight your ongoing costs only and do not reflect any transactional costs, such as sales charges (loads) and CDSC. Therefore, the second set of columns of the table is useful in comparing ongoing costs only, and will not help you determine the relative total costs of owning different funds. In addition, if these transactional costs were included, your costs would be higher. Expenses are equal to the Fund's annualized expense ratios multiplied by average account value over the period, multiplied by 181/365 (to reflect the one-half year period).
| Actual return | Hypothetical (5% return before expenses) | |||||||||||||||||||||||||||||||||||
| Expenses paid | Expenses paid | Days in | ||||||||||||||||||||||||||||||||||
| during the period | during the period | the | Days | |||||||||||||||||||||||||||||||||
| Beginning | Ending | December 31, 2010 | Beginning | Ending | December 31, 2010 | Annualized | current | in the | ||||||||||||||||||||||||||||
| Account Value | Account Value | through | Account Value | Account Value | through | expense | 1/2 | full | ||||||||||||||||||||||||||||
| December 31, 2010 | June 30, 2011 | June 30, 2011 | December 31, 2010 | June 30, 2011 | June 30, 2011 | ratio | year | year | ||||||||||||||||||||||||||||
| Class IA | $ | 1,000.00 | $ | 1,076.79 | $ | 4.27 | $ | 1,000.00 | $ | 1,020.68 | $ | 4.16 | 0.83 | % | 181 | 365 | ||||||||||||||||||||
| Class IB | $ | 1,000.00 | $ | 1,075.45 | $ | 5.56 | $ | 1,000.00 | $ | 1,019.44 | $ | 5.41 | 1.08 | % | 181 | 365 | ||||||||||||||||||||
25
| The Hartford | |
| P.O. Box 5085 | |
| Hartford, CT 06102-5085 |
Hartford Series Fund, Inc. is underwritten and distributed by Hartford Securities Distribution Company, Inc.
"The Hartford" is The Hartford Financial Services Group, Inc. and its subsidiaries.
Hartford Series Fund, Inc. inception dates range from 1977 to date. Hartford Series Fund, Inc. is not a subsidiary of The Hartford but is underwritten, distributed by and advised by subsidiaries of The Hartford. Investments in Hartford Series Fund, Inc. are not guaranteed by The Hartford or any other entity.
You should carefully consider investment objectives, risks, and charges and expenses of Hartford HLS Funds before investing. This and other information can be found in the Fund’s prospectus or summary prospectus, which can be obtained by calling 800-862-6668. Please read them carefully before you invest or send money.
HLSSAR-G11 8-11 | 106632 | Printed in U.S.A ©2011 The Hartford, Hartford, CT 06115 |
A MESSAGE FROM THE PRESIDENT

Dear Fellow Shareholders:
I want to take this opportunity to say thank you for your continued confidence and trust.
We have seen a significant amount of global turbulence in the first half of 2011. Investors have continued to be concerned about the implications of the European sovereign debt crisis, as well as our own high levels of domestic debt. Since January we have witnessed significant political uprisings in the already-volatile Middle East and North Africa region. In addition, the ramifications of Japan's massive earthquake, subsequent tsunami, and nuclear disaster are still being played out in the market.
Although corporate earnings have remained robust, the unemployment picture has been mixed. After adding more than 200,000 jobs from February to April, more recent unemployment reports have shown a pullback in hiring.
While official inflation remains low as measured by the Consumer Price Index (CPI), high oil prices may be indicative of higher inflation in the future. The federal funds rate remains at a historic low, however, the Fed could potentially raise the rate to get it closer to its historical average once the economy strengthens.
Even with these headwinds, domestic, international, and world indices (as measured by the S&P 500, MSCI EAFE and MSCI World) are all up more than 5% through June, 30 2011.
Looking ahead, continued growth in emerging markets is fueling global recovery efforts. Emerging markets comprise about 48 percent of the world’s GDP, and many economists believe they are poised for further expansion. As GDP growth continues in emerging markets, roughly 100 million people are added to the middle class each year. This middle class population growth could potentially drive a considerable shift in consumer purchasing power.
Now that we have reached the midpoint of 2011, perhaps now would be a good time to schedule a meeting with your financial adviser to examine your current investment strategy and determine whether you are on the right track.
| · | Are you concerned about inflation and its effects on your portfolio? |
| · | Is your portfolio prepared for rising interest rates? |
| · | Does your portfolio reflect the global economy with a mix of developed nations and emerging markets? |
Your financial professional’s advice can help you to navigate today’s volatile markets with confidence. You can also rest assured that we will continue to provide you with solid investments and stellar service for the road ahead.
Thank you again for your business.

James Davey
President
Hartford HLS Funds
Table of Contents
| Manager Discussion (Unaudited) | 2 |
| Financial Statements | |
| 5 | |
| 11 | |
| 12 | |
| 13 | |
| 14 | |
| 15 | |
| 28 | |
| 30 | |
| 32 | |
| 32 | |
| 33 |
This report is prepared for the general information of contract owners and qualified retirement plan participants. It is not an offer of contracts or of qualified retirement plans. It should not be used in connection with any offer, except in conjunction with the appropriate product prospectus which contains all pertinent information including the applicable sales, administrative and other charges.
The views expressed in the Fund’s Manager Discussion under ‘‘Why did the Fund perform this way?’’ and ‘‘What is the outlook?’’ are views of the Fund’s sub-adviser and portfolio management team through the end of the reporting period and are subject to change based on market and other conditions.
Hartford High Yield HLS Fund inception 09/30/1998 |
| (sub-advised by Hartford Investment Management Company) |
Investment objective – Seeks to provide high current income, and long-term total return. |
Performance Overview 6/30/01 - 6/30/11

The chart above shows the growth of a $10,000 investment in Class IA. Growth results in classes other than Class IA will vary from what is seen above due to differences in the expenses charged to those share classes.
Average Annual Total Returns (as of 6/30/11)
6 Month† | 1 Year | 5 year | 10 year | |||||||||||||
| High Yield IA | 5.45 | % | 16.69 | % | 8.91 | % | 7.31 | % | ||||||||
| High Yield IB | 5.32 | % | 16.40 | % | 8.64 | % | 7.05 | % | ||||||||
Barclays Capital U.S. Corporate High-Yield Index | 4.97 | % | 15.63 | % | 9.30 | % | 8.99 | % | ||||||||
| † | Not Annualized |
PAST PERFORMANCE IS NOT INDICATIVE OF FUTURE RESULTS.
Total returns presented above were calculated using the Fund's net asset value available to shareholders for sale or redemption of Fund shares on June 30, 2011, which excludes investment transactions as of this date.
Barclays Capital U.S. Corporate High-Yield Indexis an unmanaged broad-based market-value-weighted index that tracks the total return performance of non-investment grade, fixed-rate, publicly placed, dollar denominated and nonconvertible debt registered with the Securities and Exchange Commission.
You cannot invest directly in an index.
The chart represents a hypothetical investment in the Fund. Performance data represents past performance and current performance could be higher or lower.
Performance information may reflect historical or current expense waivers/reimbursements from the investment adviser, without which performance would have been lower. For information on current expense waivers/reimbursements, please see the prospectus.
The value of the fund will fluctuate so that when redeemed, it may be worth more or less than the original investment. The chart and table do not reflect the deductions of taxes, sales charges or other fees which may be applied at the variable life insurance, variable annuity or qualified retirement plan product level. Any such additional sales charges or other fees or expenses would lower the contract’s or plan’s performance.
| Portfolio Managers | |
| Carlos Feged, CFA | James Serhant, CFA |
| Senior Vice President | Senior Vice President |
How did the Fund perform?
The Class IA shares of the Hartford High Yield HLS Fund returned 5.45% for the six -month period ended June 30, 2011, outperforming its benchmark, the Barclays Capital U.S. Corporate High-Yield Bond Index, which returned 4.97%, and the average return of the Lipper High Current Yield Funds VP-UF category, a group of funds with investment strategies similar to those of the Fund, which returned 4.38%.
Why did the Fund perform this way?
The Fund’s benchmark-relative (i.e. performance of the Fund as measured against the benchmark) outperformance over the period was primarily driven by strong security selection. The Fund overcame underweights (i.e. the Fund’s sector position was less than the benchmark position) to the Utilities and Information Technology sectors, the two best performing sectors in the Barclays Capital U.S. Corporate High-Yield Bond Index over the period, by demonstrating strong credit selection across all major industry sectors, with particular strength in Information Technology, Telecommunications and Materials.
Significant contributions came from investments in Springleaf Financial (fka American General) (Financials), Level 3 Communications (Telecom Services), MGM Resorts International (Gaming), Affinion Group (Consumer Products) and International Coal Group (Mining) to name a few. The Fund maintained a slightly higher risk profile relative to the index and favored the Consumer Discretionary and Consumer Staples sectors that were expected to benefit from the continued U.S. economic recovery.
The most significant drag on relative performance over the period was an out of benchmark position in General Motors (GM) – both its convertible preferred stock and revolving credit facility. These positions have cost the Fund approximately 11bps year-to-date owing to a 3.7% decline. We think this decline represents a near term valuation challenge arising from strong performance late in 2010, coupled with a spike in oil prices and a weaker than expected U.S. economy in the first half of 2011.
In addition, defensive positioning and a relative underweight to Energy Future Holdings (fka TXU Corp) cost the Fund roughly 8bps as the returns on the company’s bonds significantly exceeded those of the broader market.
What is the outlook?
We expect the economy to be weak, but still strong enough to support a very low default rate for the next 12 months, aided by robust capital markets that have enabled companies to extend their debt maturity profile. Low absolute yields expose the asset class to higher interest rates, but attractive spreads, in our opinion, provide a meaningful cushion, thus in our view making High Yield an attractive asset class within the fixed income landscape. In a rising rate environment, we would expect High Yield spreads to compress to the 500-550bps-area over the next 12 months.
The key risk to the High Yield asset class would be a significant slowing of the U.S. economy, which we believe is an increasing probability following the end of the Federal Reserve’s second round of quantitative easing and as government stimulus rolls off. In that environment, we feel that the low absolute yields of the High Yield Market would likely provide little protection to a widening of credit spreads (i.e. short and long term interest rates moving farther apart) and would also increase the likelihood of an increase in the default rate.
On balance, we continue to believe that the High Yield Market will have positive returns over the next 12-months, albeit with bouts of volatility. At current yields, the market offers little room for error, which means idiosyncratic risk will be the key driver of returns in 2011, and earnings disappointments from companies will likely be punished by the market. Event risk is also a major theme as Merger & Acquisition activity remains robust, with companies continuing to address 2013-2015 debt obligations coming due.
Distribution by Credit Quality
as of June 30, 2011
| Percentage of | ||||
| Credit Rating * | Net Assets | |||
| Baa / BBB | 1.2 | |||
| Ba / BB | 17.8 | |||
| B | 49.7 | |||
| Caa / CCC or Lower | 25.3 | |||
| Unrated | 2.8 | |||
| U.S. Government Securities | 0.1 | |||
| Cash | 4.7 | |||
| Other Assets & Liabilities | (1.6 | ) | ||
| Total | 100.0 | % | ||
| * | Does not apply to the Fund itself. Based upon Moody’s and S&P long-term credit ratings for the Fund’s holdings as of date noted. If Moody's and S&P assign different ratings to a holding, the lower rating is used. "Unrated" includes fixed-income securities (other than cash-like short-term instruments and U.S. Government securities) for which Moody’s and S&P have not issued long-term credit ratings. “Cash” includes non fixed income instruments and other short-term instruments. |
Diversification by Security Type
as of June 30, 2011
| Percentage of | ||||
| Category | Net Assets | |||
| Asset & Commercial Mortgage Backed Securities | 0.5 | % | ||
| Common Stocks | 0.2 | |||
| Corporate Bonds: Investment Grade | 0.7 | |||
| Corporate Bonds: Non-Investment Grade | 87.1 | |||
| Preferred Stocks | 1.5 | |||
| Senior Floating Rate Interests: Non-Investment Grade | 8.5 | |||
| Warrants | 0.0 | |||
| Short-Term Investments | 3.1 | |||
| Other Assets and Liabilities | (1.6 | ) | ||
| Total | 100.0 | % | ||
Diversification by Industry
as of June 30, 2011
| Percentage of | ||||
| Industry | Net Assets | |||
| Fixed Income Securities | ||||
| Accommodation and Food Services | 4.2 | % | ||
Administrative Waste Management and Remediation | 0.5 | |||
| Agriculture, Forestry, Fishing and Hunting | 0.7 | |||
| Air Transportation | 0.6 | |||
| Apparel Manufacturing | 0.4 | |||
| Arts, Entertainment and Recreation | 10.3 | |||
| Chemical Manufacturing | 2.2 | |||
Computer and Electronic Product Manufacturing | 2.8 | |||
| Construction | 1.2 | |||
| Educational Services | 0.3 | |||
| Fabricated Metal Product Manufacturing | 0.3 | |||
| Finance and Insurance | 15.8 | |||
| Food Manufacturing | 1.7 | |||
| Food Services | 0.5 | |||
| Health Care and Social Assistance | 5.8 | |||
| Information | 10.6 | |||
| Machinery Manufacturing | 0.6 | |||
| Mining | 2.1 | |||
| Miscellaneous Manufacturing | 1.1 | |||
| Motor Vehicle & Parts Manufacturing | 3.7 | |||
| Paper Manufacturing | 1.6 | |||
| Petroleum and Coal Products Manufacturing | 7.0 | |||
| Pipeline Transportation | 1.5 | |||
| Plastics and Rubber Products Manufacturing | 0.6 | |||
| Primary Metal Manufacturing | 0.8 | |||
| Printing and Related Support Activities | 0.6 | |||
| Professional, Scientific and Technical Services | 2.9 | |||
| Public Administration | 0.3 | |||
| Rail Transportation | 0.3 | |||
| Real Estate and Rental and Leasing | 2.8 | |||
| Retail Trade | 6.1 | |||
Soap, Cleaning Compound, and Toilet Manufacturing | 0.4 | |||
| Textile Product Mills | 0.3 | |||
| Truck Transportation | 0.9 | |||
| Utilities | 3.7 | |||
| Water Transportation | 0.6 | |||
| Wholesale Trade | 1.0 | |||
| Other Securities | ||||
| Automobiles & Components | 1.5 | |||
| Energy | 0.2 | |||
| Food, Beverage & Tobacco | 0.0 | |||
| Software & Services | 0.0 | |||
| Short-Term Investments | 3.1 | |||
| Other Assets and Liabilities | (1.6 | ) | ||
| Total | 100.0 | % | ||
| Schedule of Investments |
| June 30, 2011 (Unaudited) |
| (000’s Omitted) |
| Shares or Principal Amount | Market Value ╪ | ||||||
| ASSET & COMMERCIAL MORTGAGE BACKED SECURITIES - 0.5% | |||||||
| Finance and Insurance - 0.5% | |||||||
| Banc of America Large Loan | |||||||
| $ | 4,592 | 1.94%, 11/15/2015 ■Δ | $ | 4,260 | |||
| Soundview NIM Trust | |||||||
| 2,490 | 0.00%, 12/25/2036 ⌂● | – | |||||
| 4,260 | |||||||
| Total asset & commercial mortgage backed securities | |||||||
| (cost $6,838) | $ | 4,260 | |||||
| CORPORATE BONDS: INVESTMENT GRADE - 0.7% | |||||||
| Computer and Electronic Product Manufacturing - 0.3% | |||||||
| Seagate Technology International | |||||||
| $ | 2,110 | 10.00%, 05/01/2014 ■ | $ | 2,448 | |||
| Information - 0.4% | |||||||
| Qwest Corp. | |||||||
| 3,042 | 7.25%, 10/15/2035 ‡ | 3,011 | |||||
| Total corporate bonds: investment grade | |||||||
| (cost $4,734) | $ | 5,459 | |||||
| CORPORATE BONDS: NON-INVESTMENT GRADE - 87.1% | |||||||
| Accommodation and Food Services - 4.2% | |||||||
| Harrah's Operating Co., Inc. | |||||||
| $ | 1,058 | 11.25%, 06/01/2017 | $ | 1,168 | |||
| Marina District Finance Co., Inc. | |||||||
| 2,218 | 9.50%, 10/15/2015 ■ | 2,307 | |||||
| MGM Mirage, Inc. | |||||||
| 12,208 | 11.13%, 11/15/2017 | 13,947 | |||||
| MGM Resorts International | |||||||
| 10,585 | 11.38%, 03/01/2018 | 11,882 | |||||
| Sugarhouse HSP Gaming Prop Mezz L.P. | |||||||
| 1,144 | 8.63%, 04/15/2016 ■ | 1,178 | |||||
| Wynn Las Vegas LLC | |||||||
| 1,379 | 7.75%, 08/15/2020 | 1,498 | |||||
| 31,980 | |||||||
| Administrative Waste Management and Remediation - 0.5% | |||||||
| Bankrate, Inc. | |||||||
| 1,132 | 11.75%, 07/15/2015 ■ | 1,290 | |||||
| Energy Solutions, Inc. LLC | |||||||
| 2,773 | 10.75%, 08/15/2018 | 2,926 | |||||
| 4,216 | |||||||
| Agriculture, Forestry, Fishing and Hunting - 0.7% | |||||||
| American Seafood Group LLC | |||||||
| 3,267 | 10.75%, 05/15/2016 ■ | 3,446 | |||||
| 2,194 | 15.00%, 05/15/2017 ■‡ | 2,273 | |||||
| 5,719 | |||||||
| Air Transportation - 0.2% | |||||||
| Continental Airlines, Inc. | |||||||
| 1,168 | 7.37%, 12/15/2015 | 1,174 | |||||
| United Air Lines, Inc. | |||||||
| 507 | 9.88%, 08/01/2013 ■ | 532 | |||||
| 1,706 | |||||||
| Apparel Manufacturing - 0.4% | |||||||
| Quiksilver, Inc. | |||||||
| 3,132 | 6.88%, 04/15/2015 | 3,046 | |||||
| Arts, Entertainment and Recreation - 9.2% | |||||||
| Bresnan Broadband Holdings LLC | |||||||
| 2,227 | 8.00%, 12/15/2018 ■ | 2,297 | |||||
| Cenveo, Inc. | |||||||
| 2,923 | 10.50%, 08/15/2016 ■ | 2,872 | |||||
| Cequel Communication LLC | |||||||
| 2,986 | 8.63%, 11/15/2017 ■ | 3,105 | |||||
| Citadel Broadcasting Corp. | |||||||
| 3,335 | 7.75%, 12/15/2018 ■ | 3,543 | |||||
| Citycenter Holdings LLC | |||||||
| 2,455 | 10.75%, 01/15/2017 ■ | 2,546 | |||||
| Clubcorp Club Operations, Inc. | |||||||
| 3,146 | 10.00%, 12/01/2018 ■ | 3,115 | |||||
| Downstream Development Authority | |||||||
| 1,815 | 10.50%, 07/01/2019 ■☼ | 1,806 | |||||
| 3,369 | 12.00%, 10/15/2015 ■ | 3,748 | |||||
| FireKeepers Development Authority | |||||||
| 7,149 | 13.88%, 05/01/2015 ■ | 8,257 | |||||
| First Data Corp. | |||||||
| 6,060 | 10.55%, 09/24/2015 | 6,126 | |||||
| Knight Ridder, Inc. | |||||||
| 11,481 | 6.88%, 03/15/2029 | 6,860 | |||||
| McClatchy Co. | |||||||
| 5,537 | 11.50%, 02/15/2017 | 5,883 | |||||
| NAI Entertainment Holdings LLC | |||||||
| 1,579 | 8.25%, 12/15/2017 ■ | 1,694 | |||||
| TL Acquisitions, Inc. | |||||||
| 2,920 | 13.25%, 07/15/2015 ■ | 2,628 | |||||
| UPC Germany GMBH | |||||||
| 2,830 | 8.13%, 12/01/2017 ■ | 3,007 | |||||
| Virgin Media Finance plc | |||||||
| 2,355 | 9.50%, 08/15/2016 | 2,661 | |||||
| XM Satellite Radio, Inc. | |||||||
| 2,979 | 7.63%, 11/01/2018 ■ | 3,113 | |||||
| 6,265 | 13.00%, 08/01/2013 ■ | 7,346 | |||||
| 70,607 | |||||||
| Chemical Manufacturing - 2.2% | |||||||
| Eastman Kodak Co. | |||||||
| 3,100 | 10.63%, 03/15/2019 ■ | 3,053 | |||||
| Ferro Corp. | |||||||
| 2,888 | 7.88%, 08/15/2018 | 2,996 | |||||
| Hexion Specialty Chemicals | |||||||
| 2,915 | 8.88%, 02/01/2018 | 3,032 | |||||
| Ineos Group Holdings plc | |||||||
| 3,025 | 8.50%, 02/15/2016 ■ | 2,987 | |||||
| Lyondell Chemical Co. | |||||||
| 4,081 | 11.00%, 05/01/2018 | 4,571 | |||||
| 16,639 | |||||||
| Computer and Electronic Product Manufacturing - 2.5% | |||||||
| Advanced Micro Devices, Inc. | |||||||
| 2,274 | 8.13%, 12/15/2017 ‡ | 2,376 | |||||
| Magnachip Semiconductor | |||||||
| 2,628 | 10.50%, 04/15/2018 | 2,878 | |||||
| Nextel Communications, Inc. | |||||||
| 3,029 | 7.38%, 08/01/2015 | 3,029 | |||||
The accompanying notes are an integral part of these financial statements.
| Hartford High Yield HLS Fund |
| Schedule of Investments – (continued) |
| June 30, 2011 (Unaudited) |
| (000’s Omitted) |
| Shares or Principal Amount | Market Value ╪ | ||||||
| CORPORATE BONDS: NON-INVESTMENT GRADE - 87.1% -(continued) | |||||||
| Computer and Electronic Product Manufacturing - 2.5% - (continued) | |||||||
| Seagate HDD Cayman | |||||||
| $ | 2,945 | 7.75%, 12/15/2018 ■ | $ | 3,092 | |||
| Sorenson Communications | |||||||
| 2,200 | 10.50%, 02/01/2015 ■ | 1,480 | |||||
| Spansion LLC | |||||||
| 2,483 | 7.88%, 11/15/2017 ■ | 2,520 | |||||
| Stratus Technologies, Inc. | |||||||
| 1,651 | 12.00%, 03/29/2015 | 1,622 | |||||
| Viasystems, Inc. | |||||||
| 2,110 | 12.00%, 01/15/2015 ■ | 2,316 | |||||
| 19,313 | |||||||
| Construction - 1.2% | |||||||
| D.R. Horton, Inc. | |||||||
| 2,200 | 6.50%, 04/15/2016 | 2,293 | |||||
| KB Home & Broad Home Corp. | |||||||
| 2,430 | 6.25%, 06/15/2015 | 2,321 | |||||
| Pulte Homes, Inc. | |||||||
| 3,361 | 7.88%, 06/15/2032 | 3,075 | |||||
| Shea Homes L.P. | |||||||
| 1,285 | 8.63%, 05/15/2019 ■ | 1,266 | |||||
| 8,955 | |||||||
| Educational Services - 0.3% | |||||||
| Laureate Education, Inc. | |||||||
| 2,487 | 10.00%, 08/15/2015 ■ | 2,599 | |||||
| Fabricated Metal Product Manufacturing - 0.3% | |||||||
| BWAY Holding Co. | |||||||
| 2,022 | 10.00%, 06/15/2018 | 2,207 | |||||
| Finance and Insurance - 13.4% | |||||||
| Ally Financial, Inc. | |||||||
| 3,710 | 7.50%, 09/15/2020 ‡ | 3,877 | |||||
| 3,423 | 8.30%, 02/12/2015 ‡ | 3,825 | |||||
| CB Richard Ellis Service | |||||||
| 2,580 | 11.63%, 06/15/2017 | 2,990 | |||||
| CIT Group, Inc. | |||||||
| 3,088 | 5.25%, 04/01/2014 ■ | 3,073 | |||||
| 22,179 | 7.00%, 05/01/2017 | 22,123 | |||||
| CNL Lifestyle Properties | |||||||
| 3,366 | 7.25%, 04/15/2019 ■ | 3,046 | |||||
| Ford Motor Credit Co. | |||||||
| 4,160 | 12.00%, 05/15/2015 | 5,159 | |||||
| GMAC LLC | |||||||
| 2,175 | 8.00%, 11/01/2031 | 2,354 | |||||
| Hub International Holdings, Inc. | |||||||
| 1,093 | 9.00%, 12/15/2014 ■ | 1,115 | |||||
| 1,937 | 10.25%, 06/15/2015 ■ | 1,971 | |||||
| LBI Escrow Corp. | |||||||
| 3,634 | 8.00%, 11/01/2017 ■ | 4,043 | |||||
| Liberty Mutual Group, Inc. | |||||||
| 3,941 | 10.75%, 06/15/2058 ■ | 5,232 | |||||
| Offshore Group Investments Ltd. | |||||||
| 2,469 | 11.50%, 08/01/2015 | 2,685 | |||||
| 319 | 11.50%, 08/01/2015 ■ | 347 | |||||
| Penson Worldwide, Inc. | |||||||
| 3,805 | 12.50%, 05/15/2017 ■ | 3,539 | |||||
| Pinafore LLC | |||||||
| 1,885 | 9.00%, 10/01/2018 ■ | 2,031 | |||||
| Provident Funding Associates L.P. | |||||||
| 2,223 | 10.13%, 02/15/2019 ■ | 2,256 | |||||
| 4,881 | 10.25%, 04/15/2017 ■ | 5,345 | |||||
| Residential Capital LLC | |||||||
| 4,630 | 9.63%, 05/15/2015 | 4,595 | |||||
| Springleaf Finance Corp. | |||||||
| 21,696 | 6.90%, 12/15/2017 | 19,906 | |||||
| UPCB Finance III Ltd. | |||||||
| 3,205 | 6.63%, 07/01/2020 ■ | 3,165 | |||||
| 102,677 | |||||||
| Food Manufacturing - 1.7% | |||||||
| Dole Food Co., Inc. | |||||||
| 3,805 | 13.88%, 03/15/2014 | 4,556 | |||||
| JBS USA LLC | |||||||
| 2,228 | 7.25%, 06/01/2021 ■ | 2,167 | |||||
| Smithfield Foods, Inc. | |||||||
| 5,179 | 10.00%, 07/15/2014 | 6,008 | |||||
| 12,731 | |||||||
| Food Services - 0.5% | |||||||
| Landry's Restaurants, Inc. | |||||||
| 4,001 | 11.63%, 12/01/2015 | 4,281 | |||||
| Health Care and Social Assistance - 5.8% | |||||||
| Alere, Inc. | |||||||
| 2,804 | 7.88%, 02/01/2016 | 2,902 | |||||
| Aurora Diagnostics Holdings | |||||||
| 3,122 | 10.75%, 01/15/2018 ■ | 3,231 | |||||
| Biomet, Inc. | |||||||
| 3,444 | 10.38%, 10/15/2017 | 3,797 | |||||
| Endo Pharmaceuticals Holdings, Inc. | |||||||
| 1,241 | 7.00%, 07/15/2019 ■ | 1,272 | |||||
| HCA, Inc. | |||||||
| 11,199 | 7.50%, 11/15/2095 | 9,071 | |||||
| 2,631 | 8.50%, 04/15/2019 | 2,907 | |||||
| 7,175 | 9.25%, 11/15/2016 | 7,615 | |||||
| LifePoint Hospitals, Inc. | |||||||
| 2,971 | 6.63%, 10/01/2020 | 3,060 | |||||
| Rite Aid Corp. | |||||||
| 2,472 | 10.25%, 10/15/2019 | 2,719 | |||||
| Valeant Pharmaceuticals International | |||||||
| 4,788 | 7.00%, 10/01/2020 ■ | 4,633 | |||||
| Warner Chilcott, Inc. | |||||||
| 3,013 | 7.75%, 09/15/2018 ■ | 3,039 | |||||
| 44,246 | |||||||
| Information - 8.5% | |||||||
| Charter Communications Holdings II LLC | |||||||
| 3,746 | 13.50%, 11/30/2016 | 4,411 | |||||
| Citizens Communications Co. | |||||||
| 3,099 | 7.88%, 01/15/2027 | 3,022 | |||||
| Clearwire Corp. | |||||||
| 4,272 | 12.00%, 12/01/2015 ■ | 4,576 | |||||
| DISH DBS Corp. | |||||||
| 3,210 | 6.75%, 06/01/2021 ■ | 3,290 | |||||
| Evertec, Inc. | |||||||
| 2,378 | 11.00%, 10/01/2018 ■ | 2,539 | |||||
The accompanying notes are an integral part of these financial statements.
| Shares or Principal Amount | Market Value ╪ | ||||||
| CORPORATE BONDS: NON-INVESTMENT GRADE - 87.1% - (continued) | |||||||
| Information - 8.5% - (continued) | |||||||
| GXS Worldwide, Inc. | |||||||
| $ | 2,952 | 9.75%, 06/15/2015 | $ | 2,989 | |||
| iGate Corp. | |||||||
| 2,380 | 9.00%, 05/01/2016 ■ | 2,404 | |||||
| Intelsat Bermuda Ltd. | |||||||
| 3,547 | 11.50%, 02/04/2017 | 3,813 | |||||
| Intelsat Jackson Holdings Ltd. | |||||||
| 5,515 | 8.50%, 11/01/2019 | 5,846 | |||||
| Kabel Baden Wurttemberg GMBH & Co. | |||||||
| 2,766 | 7.50%, 03/15/2019 ■ | 2,821 | |||||
| Level 3 Financing, Inc. | |||||||
| 8,438 | 10.00%, 02/01/2018 | 9,060 | |||||
| PAETEC Holding Corp. | |||||||
| 2,247 | 9.88%, 12/01/2018 ■ | 2,328 | |||||
| SoftBrands, Inc. | |||||||
| 1,781 | 11.50%, 07/15/2018 ■ | 1,641 | |||||
| Sprint Capital Corp. | |||||||
| 3,586 | 8.75%, 03/15/2032 | 3,882 | |||||
| Trilogy International Partners LLC | |||||||
| 3,688 | 10.25%, 08/15/2016 ■ | 3,743 | |||||
| Videotron Ltee | |||||||
| 2,705 | 9.13%, 04/15/2018 | 3,019 | |||||
| Wind Acquisition Finance S.A. | |||||||
| 2,087 | 11.75%, 07/15/2017 ■ | 2,364 | |||||
| Windstream Corp. | |||||||
| 3,405 | 7.75%, 10/01/2021 | 3,558 | |||||
| 65,306 | |||||||
| Machinery Manufacturing - 0.6% | |||||||
| Case New Holland, Inc. | |||||||
| 4,251 | 7.88%, 12/01/2017 ■ | 4,676 | |||||
| Mining - 2.1% | |||||||
| Arch Coal, Inc. | |||||||
| 3,136 | 7.25%, 06/15/2021 ■ | 3,140 | |||||
| FMG Resources Pty Ltd. | |||||||
| 4,177 | 7.00%, 11/01/2015 ■ | 4,261 | |||||
| International Coal Group, Inc. | |||||||
| 3,551 | 9.13%, 04/01/2018 | 4,465 | |||||
| Taseko Mines Ltd. | |||||||
| 3,104 | 7.75%, 04/15/2019 | 3,127 | |||||
| Vulcan Materials Co. | |||||||
| 1,191 | 7.50%, 06/15/2021 | 1,190 | |||||
| 16,183 | |||||||
| Miscellaneous Manufacturing - 1.1% | |||||||
| BE Aerospace, Inc. | |||||||
| 2,178 | 6.88%, 10/01/2020 | 2,281 | |||||
| Ducommun, Inc. | |||||||
| 965 | 9.75%, 07/15/2018 ■ | 992 | |||||
| Reynolds Group Issuer, Inc. | |||||||
| 2,066 | 7.13%, 04/15/2019 ■ | 2,050 | |||||
| 2,885 | 9.00%, 04/15/2019 ■ | 2,849 | |||||
| 8,172 | |||||||
| Motor Vehicle & Parts Manufacturing - 1.6% | |||||||
| Ford Motor Co. | |||||||
| 2,190 | 7.50%, 08/01/2026 | 2,218 | |||||
| 4,486 | 9.22%, 09/15/2021 | 5,058 | |||||
| TRW Automotive, Inc. | |||||||
| 2,309 | 3.50%, 12/01/2015 ۞■ | 4,878 | |||||
| 12,154 | |||||||
| Paper Manufacturing - 1.6% | |||||||
| Domtar Corp. | |||||||
| 3,027 | 10.75%, 06/01/2017 | 3,939 | |||||
| Longview Fibre Co. | |||||||
| 862 | 8.00%, 06/01/2016 ■ | 866 | |||||
| Mercer International, Inc. | |||||||
| 3,331 | 9.50%, 12/01/2017 | 3,573 | |||||
| Sappi Papier Holding, Inc. | |||||||
| 2,130 | 6.63%, 04/15/2021 ■ | 2,071 | |||||
| Westvaco Corp. | |||||||
| 2,029 | 8.20%, 01/15/2030 | 2,198 | |||||
| 12,647 | |||||||
| Petroleum and Coal Products Manufacturing - 7.0% | |||||||
| Alon Refinancing Krotz Springs, Inc. | |||||||
| 3,568 | 13.50%, 10/15/2014 | 3,729 | |||||
| Alpha Natural Resources, Inc. | |||||||
| 2,470 | 6.00%, 06/01/2019 | 2,464 | |||||
| Bill Barrett Corp. | |||||||
| 1,925 | 9.88%, 07/15/2016 | 2,156 | |||||
| Chaparral Energy, Inc. | |||||||
| 2,418 | 9.88%, 10/01/2020 | 2,611 | |||||
| Chesapeake Energy Corp. | |||||||
| 3,110 | 6.88%, 08/15/2018 | 3,265 | |||||
| Concho Resources, Inc. | |||||||
| 2,879 | 7.00%, 01/15/2021 | 2,980 | |||||
| Denbury Resources, Inc. | |||||||
| 2,307 | 9.75%, 03/01/2016 | 2,578 | |||||
| Drummond Co., Inc. | |||||||
| 2,803 | 9.00%, 10/15/2014 ■ | 2,950 | |||||
| EV Energy Partners Finance | |||||||
| 2,121 | 8.00%, 04/15/2019 ■ | 2,129 | |||||
| Headwaters, Inc. | |||||||
| 2,090 | 7.63%, 04/01/2019 | 1,902 | |||||
| Key Energy Services, Inc. | |||||||
| 3,126 | 6.75%, 03/01/2021 | 3,126 | |||||
| Plains Exploration & Production Co. | |||||||
| 4,132 | 10.00%, 03/01/2016 | 4,649 | |||||
| Regency Energy Partners L.P. | |||||||
| 2,759 | 9.38%, 06/01/2016 | 3,076 | |||||
| Rosetta Resources, Inc. | |||||||
| 2,733 | 9.50%, 04/15/2018 | 3,027 | |||||
| Sandridge Energy, Inc. | |||||||
| 2,775 | 8.75%, 01/15/2020 | 2,955 | |||||
| Star Gas Partners L.P. | |||||||
| 847 | 8.88%, 12/01/2017 | 882 | |||||
| Targa Resources Partners | |||||||
| 2,586 | 11.25%, 07/15/2017 | 2,974 | |||||
| Venoco, Inc. | |||||||
| 2,144 | 8.88%, 02/15/2019 ■ | 2,144 | |||||
| Western Refining, Inc. | |||||||
| 3,372 | 11.25%, 06/15/2017 ■‡ | 3,794 | |||||
| 53,391 | |||||||
| Pipeline Transportation - 1.5% | |||||||
| Chesapeake Midstream Partners | |||||||
| 1,458 | 5.88%, 04/15/2021 ■ | 1,439 | |||||
The accompanying notes are an integral part of these financial statements.
| Hartford High Yield HLS Fund |
| Schedule of Investments – (continued) |
| June 30, 2011 (Unaudited) |
| (000’s Omitted) |
| Shares or Principal Amount | Market Value ╪ | ||||||
| CORPORATE BONDS: NON-INVESTMENT GRADE - 87.1% - (continued) | |||||||
| Pipeline Transportation - 1.5% - (continued) | |||||||
| Dynegy Holdings, Inc. | |||||||
| $ | 4,753 | 7.75%, 06/01/2019 | $ | 3,458 | |||
| Eagle Rock Energy Partners L.P. | |||||||
| 1,160 | 8.38%, 06/01/2019 ■ | 1,157 | |||||
| El Paso Corp. | |||||||
| 2,890 | 7.80%, 08/01/2031 | 3,373 | |||||
| Energy Transfer Equity L.P. | |||||||
| 2,163 | 7.50%, 10/15/2020 | 2,293 | |||||
| 11,720 | |||||||
| Plastics and Rubber Products Manufacturing - 0.6% | |||||||
| Plastipak Holdings, Inc. | |||||||
| 1,996 | 10.63%, 08/15/2019 ■ | 2,246 | |||||
| Titan International, Inc. | |||||||
| 2,317 | 7.88%, 10/01/2017 ■ | 2,421 | |||||
| 4,667 | |||||||
| Primary Metal Manufacturing - 0.8% | |||||||
| Aleris International, Inc. | |||||||
| 3,000 | 7.63%, 02/15/2018 ■‡ | 2,993 | |||||
| Novelis, Inc. | |||||||
| 2,773 | 8.38%, 12/15/2017 | 2,960 | |||||
| 5,953 | |||||||
| Printing and Related Support Activities - 0.6% | |||||||
| Harland Clarke Holdings | |||||||
| 3,210 | 9.50%, 05/15/2015 | 2,933 | |||||
| Sheridan Group, Inc. | |||||||
| 1,981 | 12.50%, 04/15/2014 ■ | 1,882 | |||||
| 4,815 | |||||||
| Professional, Scientific and Technical Services - 2.9% | |||||||
| Affinion Group, Inc. | |||||||
| 12,475 | 11.50%, 10/15/2015 | 12,880 | |||||
| 6,459 | 11.63%, 11/15/2015 ■ | 6,459 | |||||
| Global Geophysical Services, Inc. | |||||||
| 2,451 | 10.50%, 05/01/2017 | 2,574 | |||||
| 21,913 | |||||||
| Public Administration - 0.3% | |||||||
| CDRT Merger Sub, Inc. | |||||||
| 2,153 | 8.13%, 06/01/2019 ■ | 2,153 | |||||
| Rail Transportation - 0.3% | |||||||
| RailAmerica, Inc. | |||||||
| 2,063 | 9.25%, 07/01/2017 | 2,264 | |||||
| Real Estate and Rental and Leasing - 2.8% | |||||||
| Ashtead Capital, Inc. | |||||||
| 3,420 | 9.00%, 08/15/2016 ■ | 3,566 | |||||
| Avis Budget Car Rental LLC | |||||||
| 3,512 | 9.63%, 03/15/2018 | 3,749 | |||||
| International Lease Finance Corp. | |||||||
| 4,970 | 8.88%, 09/01/2017 | 5,467 | |||||
| Maxim Crane Works L.P. | |||||||
| 2,994 | 12.25%, 04/15/2015 ■ | 2,994 | |||||
| Realogy Corp. | |||||||
| 2,428 | 11.75%, 04/15/2014 | 2,404 | |||||
| United Rentals North America, Inc. | |||||||
| 3,058 | 8.38%, 09/15/2020 | 3,096 | |||||
| 21,276 | |||||||
| Retail Trade - 4.8% | |||||||
| Building Materials Corp. | |||||||
| 4,028 | 7.50%, 03/15/2020 ■ | 4,239 | |||||
| Dollar General Corp. | |||||||
| 3,608 | 11.88%, 07/15/2017 | 4,113 | |||||
| Hillman Group, Inc. | |||||||
| 2,514 | 10.88%, 06/01/2018 | 2,712 | |||||
| 603 | 10.88%, 06/01/2018 ■ | 650 | |||||
| J.C. Penney Co., Inc. | |||||||
| 3,371 | 7.63%, 03/01/2097 | 3,000 | |||||
| Jaguar Land Rover plc | |||||||
| 3,993 | 8.13%, 05/15/2021 ■ | 4,023 | |||||
| Liz Claiborne, Inc. | |||||||
| 2,325 | 10.50%, 04/15/2019 ■ | 2,372 | |||||
| Masonite International Co. | |||||||
| 3,058 | 8.25%, 04/15/2021 ■ | 3,039 | |||||
| Nebraska Book Co. | |||||||
| 3,068 | 10.00%, 12/01/2011 Ψ | 3,045 | |||||
| Sears Holdings Corp. | |||||||
| 3,106 | 6.63%, 10/15/2018 ■ | 2,881 | |||||
| Supervalu, Inc. | |||||||
| 2,347 | 8.00%, 05/01/2016 | 2,394 | |||||
| Toys R Us, Inc. | |||||||
| 2,929 | 7.38%, 09/01/2016 ■ | 2,958 | |||||
| Uncle Acquisition Corp. | |||||||
| 993 | 8.63%, 02/15/2019 | 1,023 | |||||
| 36,449 | |||||||
| Soap, Cleaning Compound, and Toilet Manufacturing - 0.4% | |||||||
| Yankee Candle Co. | |||||||
| 2,942 | 10.25%, 02/15/2016 ■ | 2,949 | |||||
| Textile Product Mills - 0.3% | |||||||
| Interface, Inc. | |||||||
| 2,057 | 7.63%, 12/01/2018 | 2,139 | |||||
| Truck Transportation - 0.9% | |||||||
| Swift Transportation Co., Inc. | |||||||
| 6,436 | 12.50%, 05/15/2017 ■ | 6,838 | |||||
| Utilities - 3.7% | |||||||
| AES Corp. | |||||||
| 2,674 | 9.75%, 04/15/2016 ‡ | 3,035 | |||||
| Calpine Corp. | |||||||
| 3,690 | 7.88%, 01/15/2023 ■ | 3,800 | |||||
| Edison Mission Energy | |||||||
| 6,759 | 7.00%, 05/15/2017 | 5,475 | |||||
| Energy Future Intermediate Holding Co. LLC | |||||||
| 3,991 | 10.00%, 12/01/2020 | 4,256 | |||||
| NRG Energy, Inc. | |||||||
| 7,193 | 8.50%, 06/15/2019 | 7,445 | |||||
| Reliant Energy, Inc. | |||||||
| 2,371 | 9.24%, 07/02/2017 | 2,537 | |||||
| Texas Competitive Electric Co. | |||||||
| 1,718 | 11.50%, 10/01/2020 ■ | 1,688 | |||||
| 28,236 | |||||||
| Water Transportation - 0.6% | |||||||
| NCL Corp., Ltd. | |||||||
| 933 | 11.75%, 11/15/2016 | 1,075 | |||||
The accompanying notes are an integral part of these financial statements.
| Shares or Principal Amount | Market Value ╪ | ||||||
| CORPORATE BONDS: NON-INVESTMENT GRADE - 87.1% - (continued) | |||||||
| Water Transportation - 0.6% - (continued) | |||||||
| Seven Seas Cruises | |||||||
| $ | 432 | 9.13%, 05/15/2019 ■ | $ | 445 | |||
| Ship Finance International Ltd. | |||||||
| 2,812 | 8.50%, 12/15/2013 | 2,816 | |||||
| 4,336 | |||||||
| Wholesale Trade - 1.0% | |||||||
| Harbinger Group, Inc. | |||||||
| 1,199 | 10.63%, 11/15/2015 ■ | 1,211 | |||||
| Spectrum Brands, Inc. | |||||||
| 4,065 | 12.00%, 08/28/2019 | 4,492 | |||||
| U.S. Foodservice, Inc. | |||||||
| 2,123 | 8.50%, 06/30/2019 ■ | 2,060 | |||||
| 7,763 | |||||||
| Total corporate bonds: non-investment grade | |||||||
| (cost $635,003) | $ | 666,922 | |||||
SENIOR FLOATING RATE INTERESTS: NON-INVESTMENT GRADE♦ - 8.5% | |||||||
| Air Transportation - 0.4% | |||||||
| Macquarie Aircraft Leasing Finance S.A., | |||||||
| Second Lien Term Loan | |||||||
| $ | 3,433 | 4.19%, 11/29/2013 ±⌂ | $ | 3,159 | |||
| Arts, Entertainment and Recreation - 1.1% | |||||||
| AMC Entertainment Holdings, Inc. | |||||||
| 6,671 | 5.25%, 06/13/2012 ±☼ | 6,596 | |||||
| Chester Downs and Marina LLC, Loan | |||||||
| 1,496 | 12.38%, 07/31/2016 ± | 1,520 | |||||
| 8,116 | |||||||
| Finance and Insurance - 1.9% | |||||||
| Asurion Corp. | |||||||
| 2,491 | 9.00%, 05/24/2019 ± | 2,496 | |||||
| BNY Convergex Group LLC, 2nd Lien Eze | |||||||
| Borrower Term Loan | |||||||
| 407 | 8.75%, 12/17/2017 ± | 413 | |||||
| BNY Convergex Group LLC, 2nd Lien Top | |||||||
| Borrower Term Loan | |||||||
| 971 | 8.75%, 12/17/2017 ± | 986 | |||||
| Chrysler Group LLC | |||||||
| 3,215 | 6.00%, 05/24/2017 ±☼ | 3,140 | |||||
| Nuveen Investments, Inc., Second Lien Term | |||||||
| Loan | |||||||
| 7,197 | 12.50%, 07/31/2015 ± | 7,655 | |||||
| 14,690 | |||||||
| Information - 1.7% | |||||||
| Level 3 Communications Corp., Tranche Loan | |||||||
| B Add-On | |||||||
| 7,124 | 11.50%, 03/13/2014 ± | 7,522 | |||||
| WideOpenWest Finance LLC, Second Lien | |||||||
| Term Loan | |||||||
| 5,967 | 6.44%, 06/29/2015 ± | 5,704 | |||||
| 13,226 | |||||||
| Motor Vehicle & Parts Manufacturing - 2.1% | |||||||
| General Motors Co. | |||||||
| 17,705 | 0.44%, 10/27/2015 ±☼ | 15,962 | |||||
| Retail Trade - 1.3% | |||||||||
| Easton-Bell Sports, Inc. | |||||||||
| 9,706 | 11.50%, 12/31/2015 ±⌂☼ | 9,706 | |||||||
| Total senior floating rate interests: non- investment grade | |||||||||
| (cost $65,633) | $ | 64,859 | |||||||
| COMMON STOCKS - 0.2% | |||||||||
| Energy - 0.2% | |||||||||
| 207,275 | KCA Deutag ⌂●† | $ | 1,803 | ||||||
| Software & Services - 0.0% | |||||||||
| 38 | Stratus Technologies, Inc. ⌂●† | – | |||||||
| Total common stocks | |||||||||
| (cost $2,796) | $ | 1,803 | |||||||
| PREFERRED STOCKS - 1.5% | |||||||||
| Automobiles & Components - 1.5% | |||||||||
| 20 | Dana Holding Corp. Preferred, 4.00% ۞■ | $ | 3,164 | ||||||
| 165 | General Motors Co. Preferred, 4.75% ۞ | 8,028 | |||||||
| 11,192 | |||||||||
| Software & Services - 0.0% | |||||||||
| 9 | Stratus Technologies, Inc. ⌂† | – | |||||||
| Total preferred stocks | |||||||||
| (cost $11,361) | $ | 11,192 | |||||||
| WARRANTS - 0.0% | |||||||||
| Food, Beverage & Tobacco - 0.0% | |||||||||
| 2 | ASG Consolidated LLC ⌂ | $ | 232 | ||||||
| Total warrants | |||||||||
| (cost $34) | $ | 232 | |||||||
| Total long-term investments | |||||||||
| (cost $726,399) | $ | 754,727 | |||||||
| SHORT-TERM INVESTMENTS - 3.1% | |||||||||
| Investment Pools and Funds - 3.0% | |||||||||
| JP Morgan U.S. Government Money | |||||||||
| 22,867 | Market Fund | $ | 22,867 | ||||||
| U.S. Treasury Bills - 0.1% | |||||||||
| $ | 655 | 0.01%, 7/28/2011 ○‡ | 655 | ||||||
| Total short-term investments | |||||||||
| (cost $23,522) | $ | 23,522 | |||||||
| Total investments | |||||||||
(cost $749,921) ▲ | 101.6 | % | $ | 778,249 | |||||
| Other assets and liabilities | (1.6 | )% | (12,416 | ) | |||||
| Total net assets | 100.0 | % | $ | 765,833 | |||||
The accompanying notes are an integral part of these financial statements.
| Hartford High Yield HLS Fund |
| Schedule of Investments – (continued) |
| June 30, 2011 (Unaudited) |
| (000’s Omitted) |
| Note: | Percentage of investments as shown is the ratio of the total market value to total net assets. Market value of investments in foreign securities represents 4.9% of total net assets at June 30, 2011. |
Prices of foreign equities that are principally traded on certain foreign markets may be adjusted daily pursuant to a fair value pricing service approved by the Board of Directors in order to reflect an adjustment for factors occurring after the close of certain foreign markets but before the close of the New York Stock Exchange.
| ▲ | At June 30, 2011, the cost of securities for federal income tax purposes was $750,994 and the aggregate gross unrealized appreciation and depreciation based on that cost were: |
| Unrealized Appreciation | $ | 36,540 | ||
| Unrealized Depreciation | (9,285 | ) | ||
| Net Unrealized Appreciation | $ | 27,255 |
| † | The aggregate value of securities valued in good faith at fair value as determined under policies and procedures established by and under the supervisionof the Company's Board of Directors at June 30, 2011, was $1,803, which represents 0.24% of total net assets. |
| ● | Currently non-income producing. For long-term debt securities, items identified are in default as to payment of interest and/or principal. |
| Ψ | The company is in bankruptcy. The investment held by the fund is current with respect to interest payments. |
| Δ | Variable rate securities; the rate reported is the coupon rate in effect at June 30, 2011. |
| ○ | The interest rate disclosed for these securities represents the effective yield on the date of the acquisition. |
| ± | The interest rate disclosed for these securities represents the average coupon as of June 30, 2011. |
| ♦ | Senior floating rate interests generally pay interest rates which are periodically adjusted by reference to a base short-term, floating lending rate plus a premium. These base lending rates are generally (i) the lending rate offered by one or more major European banks, such as the London Inter-Bank Offered Rate (LIBOR), (ii) the prime rate offered by one or more major United States Banks, or (iii) the bank's certificate of deposit rate. Senior floating rate interests often require prepayments from excess cash flows or permit the borrower to repay at its election. The rate at which the borrower repays cannot be predicted with accuracy. As a result, the actual remaining maturity may be substantially less than the stated maturities shown. |
| ■ | Securities issued within terms of a private placement memorandum, exempt from registration under Rule 144A under the Securities Act of 1933, as amended, and may be sold only to qualified institutional buyers. Unless otherwise indicated, these holdings are determined to be liquid. At June 30, 2011, the aggregate value of these securities was $267,994, which represents 34.99% of total net assets. |
| ۞ | Convertible security. |
| ☼ | The cost of securities purchased on a when-issued, delayed delivery or delayed draw basis at June 30, 2011 was $19,796. |
| ‡ | This security, or a portion of this security, has been segregated to cover funding requirements on investment transactions settling in the future. |
| ⌂ | The following securities are considered illiquid. Illiquid securities are often purchased in private placement transactions, are often not registered under the Securities Act of 1933 and may have contractual restrictions on resale. A security may also be considered illiquid if the security lacks a readily available market or if its valuation has not changed for a certain period of time. |
| Period Acquired | Shares/ Par | Security | Cost Basis | |||||||
| 04/2010 - 07/2010 | 2 | ASG Consolidated LLC Warrants - 144A | $ | 34 | ||||||
| 09/2010 - 06/2011 | $ | 9,706 | Easton-Bell Sports, Inc., 11.50%, 12/31/2015 | 9,587 | ||||||
| 03/2011 | 207,275 | KCA Deutag | 2,796 | |||||||
| 01/2011 - 03/2011 | $ | 3,433 | Macquarie Aircraft Leasing Finance S.A., Second Lien Term Loan, 4.19%, 11/29/2013 | 3,085 | ||||||
| 02/2007 | $ | 2,490 | Soundview NIM Trust, 0.00%, 12/25/2036 - 144A | 2,479 | ||||||
| 03/2010 - 04/2010 | 38 | Stratus Technologies, Inc. | – | |||||||
| 03/2010 - 04/2010 | 9 | Stratus Technologies, Inc. | – | |||||||
The aggregate value of these securities at June 30, 2011, was $14,900, which represents 1.95% of total net assets.
| ╪ | See Significant Accounting Policies of accompanying Notes to Financial Statements regarding valuation of securities. |
The accompanying notes are an integral part of these financial statements.
| Investment Valuation Hierarchy Level Summary |
| June 30, 2011 (Unaudited) |
| (000’s Omitted) |
| Total | Level 1 ♦ | Level 2 ♦ | Level 3 | |||||||||||||
| Assets: | ||||||||||||||||
| Asset & Commercial Mortgage Backed Securities | $ | 4,260 | $ | – | $ | 4,260 | $ | – | ||||||||
Common Stocks ‡ | 1,803 | – | – | 1,803 | ||||||||||||
| Corporate Bonds: Investment Grade | 5,459 | – | 5,459 | – | ||||||||||||
| Corporate Bonds: Non-Investment Grade | 666,922 | – | 660,359 | 6,563 | ||||||||||||
| Preferred Stocks | 11,192 | 8,028 | 3,164 | – | ||||||||||||
| Senior Floating Rate Interests: Non-Investment Grade | 64,859 | – | 64,859 | – | ||||||||||||
| Warrants | 232 | 232 | – | – | ||||||||||||
| Short-Term Investments | 23,522 | 22,867 | 655 | – | ||||||||||||
| Total | $ | 778,249 | $ | 31,127 | $ | 738,756 | $ | 8,366 | ||||||||
| ♦ | For the six-month period ended June 30, 2011, there were no significant transfers between Level 1 and Level 2. |
| ‡ | The Fund has all or primarily all of the equity securities categorized in a particular level. Refer to the Schedule of Investments for further industry breakout. |
Following is a reconciliation of Level 3 assets for which significant unobservable inputs were used to determine fair value:
| Balance as | Change in | |||||||||||||||||||||||||||||||||||
| of | Realized | Unrealized | Transfers | Transfers | Balance | |||||||||||||||||||||||||||||||
| December | Gain | Appreciation | Net | Into | Out of | as of June | ||||||||||||||||||||||||||||||
| 31, 2010 | (Loss) | (Depreciation) | Amortization | Purchases | Sales | Level 3 * | Level 3* | 30, 2011 | ||||||||||||||||||||||||||||
| Assets: | ||||||||||||||||||||||||||||||||||||
Asset & Commercial Mortgage Backed Securities | $ | — | $ | — | $ | — | † | $ | — | $ | — | $ | — | $ | — | $ | — | $ | — | |||||||||||||||||
| Common Stocks | — | — | (992 | )‡ | — | 2,795 | — | — | — | 1,803 | ||||||||||||||||||||||||||
| Corporate Bonds | 5,606 | (1,456 | ) | 637 | § | 21 | 2,869 | (2,936 | ) | 1,822 | — | 6,563 | ||||||||||||||||||||||||
| Preferred Stocks | — | — | — | † | — | — | — | — | — | — | ||||||||||||||||||||||||||
| Total | $ | 5,606 | $ | (1,456 | ) | $ | (355 | ) | $ | 21 | $ | 5,664 | $ | (2,936 | ) | $ | 1,822 | $ | — | $ | 8,366 | |||||||||||||||
| * | Securities are transferred into and out of Level 3 for a variety of reasons including, but not limited to: |
| 1) | Securities where trading has been halted (transfer into Level 3) or securities where trading has resumed (transfer out of Level 3). |
| 2) | Broker quoted securities (transfer into Level 3) or quoted prices in active markets (transfer out of Level 3). |
| 3) | Securities that have certain restrictions on trading (transfer into Level 3) or securities where trading restrictions have expired (transfer out of Level 3). |
| † | Change in unrealized appreciation or depreciation in the current period relating to assets still held at June 30, 2011 was zero. |
| ‡ | Change in unrealized appreciation or depreciation in the current period relating to assets still held at June 30, 2011 was $(992). |
| § | Change in unrealized appreciation or depreciation in the current period relating to assets still held at June 30, 2011 was $(143). |
The accompanying notes are an integral part of these financial statements.
| Statement of Assets and Liabilities |
June 30, 2011 (Unaudited) |
| (000’s Omitted) |
| Assets: | ||||
| Investments in securities, at market value (cost $749,921) | $ | 778,249 | ||
| Cash | 62 | |||
| Foreign currency on deposit with custodian (cost $—) | — | |||
| Receivables: | ||||
| Investment securities sold | 8,296 | |||
| Fund shares sold | 866 | |||
| Dividends and interest | 14,419 | |||
| Total assets | 801,892 | |||
| Liabilities: | ||||
| Payables: | ||||
| Investment securities purchased | 31,656 | |||
| Fund shares redeemed | 4,246 | |||
| Investment management fees | 87 | |||
| Distribution fees | 7 | |||
| Accrued expenses | 63 | |||
| Total liabilities | 36,059 | |||
| Net assets | $ | 765,833 | ||
| Summary of Net Assets: | ||||
| Capital stock and paid-in-capital | $ | 691,950 | ||
| Accumulated undistributed net investment income | 93,556 | |||
| Accumulated net realized loss on investments and foreign currency transactions | (48,001 | ) | ||
| Unrealized appreciation of investments and the translations of assets and liabilities denominated in foreign currency | 28,328 | |||
| Net assets | $ | 765,833 | ||
| Shares authorized | 2,800,000 | |||
| Par value | $ | 0.001 | ||
Class IA: Net asset value per share | $ | 9.65 | ||
| Shares outstanding | 61,019 | |||
| Net assets | $ | 589,076 | ||
Class IB: Net asset value per share | $ | 9.52 | ||
| Shares outstanding | 18,564 | |||
| Net assets | $ | 176,757 | ||
The accompanying notes are an integral part of these financial statements.
| Statement of Operations |
| For the Six Month Period Ended June 30, 2011 (Unaudited) |
| (000’s Omitted) |
| Investment Income: | ||||
| Dividends | $ | 237 | ||
| Interest | 32,665 | |||
| Total investment income, net | 32,902 | |||
| Expenses: | ||||
| Investment management fees | 2,727 | |||
| Transfer agent fees | 1 | |||
| Distribution fees - Class IB | 230 | |||
| Custodian fees | 8 | |||
| Accounting services fees | 71 | |||
| Board of Directors' fees | 8 | |||
| Audit fees | 7 | |||
| Other expenses | 82 | |||
| Total expenses | 3,134 | |||
| Net investment income | 29,768 | |||
| Net Realized Gain on Investments, Other Financial Instruments and Foreign Currency Transactions: | 20906000 | |||
| Net realized gain on investments | 20,700 | |||
| Net realized gain on written options | 48 | |||
| Net realized gain on swap contracts | 403 | |||
| Net realized loss on foreign currency contracts | (245 | ) | ||
| Net realized gain on other foreign currency transactions | — | |||
| Net Realized Gain on Investments, Other Financial Instruments and Foreign Currency Transactions | 20,906 | |||
| Net Changes in Unrealized Depreciation of Investments, Other Financial Instruments and Foreign Currency Transactions: | ||||
| Net unrealized depreciation of investments | (8,928 | ) | ||
| Net unrealized appreciation of swap contracts | 66 | |||
| Net unrealized appreciation of foreign currency contracts | 245 | |||
| Net unrealized appreciation on translation of other assets and liabilities in foreign currencies | — | |||
| Net Changes in Unrealized Depreciation of Investments, Other Financial Instruments and Foreign Currency Transactions | (8,617 | ) | ||
| Net Gain on Investments, Other Financial Instruments and Foreign Currency Transactions | 12,289 | |||
| Net Increase in Net Assets Resulting from Operations | $ | 42,057 | ||
The accompanying notes are an integral part of these financial statements.
| Statement of Changes in Net Assets |
| (000’s Omitted) |
| For the | ||||||||
| Six-Month | For the | |||||||
| Period Ended | Year Ended | |||||||
| June 30, 2011 | December 31, | |||||||
| (Unaudited) | 2010 | |||||||
| Operations: | ||||||||
| Net investment income | $ | 29,768 | $ | 64,815 | ||||
| Net realized gain on investments and other financial instruments | 20,906 | 63,363 | ||||||
| Net unrealized depreciation of investments and other financial instruments | (8,617 | ) | (17,997 | ) | ||||
| Net Increase In Net Assets Resulting From Operations | 42,057 | 110,181 | ||||||
| Distributions to Shareholders: | ||||||||
| From net investment income | ||||||||
| Class IA | — | (3,774 | ) | |||||
| Class IB | — | (1,226 | ) | |||||
| Total distributions | — | (5,000 | ) | |||||
| Capital Share Transactions: | ||||||||
| Class IA | ||||||||
| Sold | 75,777 | 190,974 | ||||||
| Issued on reinvestment of distributions | — | 3,774 | ||||||
| Redeemed | (121,540 | ) | (198,912 | ) | ||||
| Total capital share transactions | (45,763 | ) | (4,164 | ) | ||||
| Class IB | ||||||||
| Sold | 21,300 | 46,511 | ||||||
| Issued on reinvestment of distributions | — | 1,226 | ||||||
| Redeemed | (40,611 | ) | (75,736 | ) | ||||
| Total capital share transactions | (19,311 | ) | (27,999 | ) | ||||
| Net decrease from capital share transactions | (65,074 | ) | (32,163 | ) | ||||
| Net Increase (Decrease) In Net Assets | (23,017 | ) | 73,018 | |||||
| Net Assets: | ||||||||
| Beginning of period | 788,850 | 715,832 | ||||||
| End of period | $ | 765,833 | $ | 788,850 | ||||
Accumulated undistributed (distribution in excess of) net investment income | $ | 93,556 | $ | 63,788 | ||||
| Shares: | ||||||||
| Class IA | ||||||||
| Sold | 7,946 | 22,498 | ||||||
| Issued on reinvestment of distributions | — | 443 | ||||||
| Redeemed | (12,739 | ) | (23,540 | ) | ||||
| Total share activity | (4,793 | ) | (599 | ) | ||||
| Class IB | ||||||||
| Sold | 2,261 | 5,523 | ||||||
| Issued on reinvestment of distributions | — | 145 | ||||||
| Redeemed | (4,311 | ) | (9,090 | ) | ||||
| Total share activity | (2,050 | ) | (3,422 | ) | ||||
The accompanying notes are an integral part of these financial statements.
| Notes to Financial Statements |
| June 30, 2011 (Unaudited) |
| (000’s Omitted) |
| 1. | Organization: |
Hartford High Yield HLS Fund (the “Fund”) serves as an underlying investment option for certain variable annuity and variable life insurance separate accounts of Hartford Life Insurance Company (“HLIC”) and its affiliates and certain qualified retirement plans. The Fund may also serve as an underlying investment option for certain variable annuity and variable life separate accounts of other insurance companies. Owners of variable annuity contracts and policyholders of variable life insurance contracts may choose the funds permitted in the variable insurance contract prospectus. In addition, participants in certain qualified retirement plans may choose the Fund if permitted by their plans.
Hartford Series Fund, Inc. (the “Company”) is an open-end registered management investment company comprised of thirty portfolios. Financial Statements for the Fund, a series of the Company, are included in this report.
The Company is organized under the laws of the State of Maryland and is registered with the Securities and Exchange Commission (“SEC”) under the Investment Company Act of 1940, as amended (“1940 Act”). The Fund is a diversified open-end management investment company.
The Fund is divided into Class IA and Class IB shares. Each class is offered at the per share net asset value (“NAV”) without a sales charge and is subject to the same expenses, except that the Class IB shares are subject to distribution and service fees charged pursuant to a Distribution Plan adopted in accordance with Rule 12b-1 under the 1940 Act.
| 2. | Significant Accounting Policies: |
The following is a summary of significant accounting policies of the Fund in the preparation of its financial statements, which are in accordance with the United States Generally Accepted Accounting Principles (“U.S. GAAP”). The preparation of financial statements in accordance with U.S. GAAP may require management to make estimates and assumptions that affect the reported amounts of assets and liabilities and disclosure of contingent assets and liabilities at the date of the financial statements and the reported amounts of increases and decreases in net assets from operations during the reporting period. Actual results could differ from those estimates.
| a) | Determination of Net Asset Value – The NAV of each class of the Fund's shares is determined as of the close of regular trading (normally 4:00 p.m. Eastern Time) (the “NYSE Close”) on each day that the New York Stock Exchange (the “Exchange”) is open (“Valuation Date”). Information that becomes known to the Fund after the NAV has been calculated on a particular day will not generally be used to retroactively adjust the NAV determined earlier that day. |
| b) | Investment Valuation and Fair Value Measurements – For purposes of calculating the NAV, portfolio securities and other assets held by the Fund's portfolio for which market quotes are readily available are valued at market value. Market value is generally determined on the basis of last reported sales prices or official close price. If no sales are reported, market value is based on quotes obtained from a quotation reporting system, established market makers, or independent pricing services. If market prices are not readily available or are deemed unreliable, the Fund will use the fair value of the security as determined in good faith under policies and procedures established by and under the supervision of the Company's Board of Directors. Market quotes are considered not readily available where there is an absence of current or reliable market-based data (e.g., trade information or broker quotes), including where events occur after the close of the relevant market, but prior to the NYSE Close that materially affect the values of the Fund's portfolio securities or assets. In addition, market quotes are considered not readily available when, due to extraordinary circumstances, the exchanges or markets on which the securities trade, do not open for trading for the entire day and no other market prices are available. In addition, prices of foreign equities that are principally traded on certain foreign markets are adjusted daily pursuant to a fair value pricing service approved by the Board of Directors in order to reflect an adjustment for the factors occurring after the close of certain foreign markets but before the NYSE Close. Securities that are primarily traded on foreign markets may trade on days that are not business days of the Fund. The value of the foreign securities, |
| Hartford High Yield HLS Fund |
| Notes to Financial Statements – (continued) |
| June 30, 2011 (Unaudited) |
| (000’s Omitted) |
in which the Fund invests, may change on days when a shareholder will not be able to purchase or redeem shares of the Fund. Fair value pricing is subjective in nature and the use of fair value pricing by the Fund may cause the NAV of its shares to differ significantly from the NAV that would have been calculated using market prices at the close of the exchange on which a portfolio security is primarily traded. There can be no assurance that the Fund could obtain the fair market value assigned to a security if the Fund were to sell the security at approximately the time at which the Fund determines its NAV.
Fixed income securities (other than short-term obligations) and non-exchange traded derivatives held by the Fund are normally valued on the basis of quotes obtained from brokers and dealers or independent pricing services in accordance with procedures established by the Company’s Fund’s Board of Directors. Prices obtained from independent pricing services use information provided by market makers or estimates of market values obtained from yield data relating to investments or securities with similar characteristics. Generally, the Fund may use fair valuation in regard to fixed income securities when the Fund holds defaulted or distressed securities or securities in a company in which a reorganization is pending. Short-term investments maturing in 60 days or less are generally valued at amortized cost, if their original term to maturity was 60 days or less, or by amortizing their value on the 61st day prior to maturity, if the original term to maturity exceeded 60 days.
Exchange traded options, futures and options on futures are valued at the settlement price determined by the relevant exchange as of the NYSE Close. If such instruments do not trade on an exchange, values may be supplied by an independent pricing service using a formula or other objective method that may take into consideration the style, direction, expiration, strike price, notional value and volatility or other adjustments.
Investments valued in currencies other than U.S. dollars are converted to U.S. dollars using exchange rates obtained from independent pricing services for calculation of the NAV. As a result, the NAV of the Fund’s shares may be affected by changes in the value of currencies in relation to the U.S. dollar. The value of securities traded in markets outside the United States or denominated in currencies other than the U.S. dollar may be affected significantly on a day that the NYSE is closed and the market value may change on days when an investor is not able to purchase, redeem or exchange shares of the Fund.
Foreign currency contracts represent agreements to exchange currencies on specific future dates at predetermined rates. Foreign currency contracts are valued using foreign currency exchange rates and forward rates as provided by an independent pricing service on Valuation Date.
Investments in open-end mutual funds are valued at the respective NAV of each open-end mutual fund on the Valuation Date.
Financial instruments for which prices are not available from an independent pricing service may be valued using market quotations obtained from one or more dealers that make markets in the respective financial instrument in accordance with procedures established by the Company’s Board of Directors.
U.S. GAAP defines fair value as the price that the Fund would receive to sell an asset or pay to transfer a liability in an orderly transaction between market participants. The U.S. GAAP fair value measurement standards require disclosure of a fair value hierarchy for each major category of assets and liabilities. Various inputs are used in determining the fair value of the Fund’s investments. These inputs are summarized into three broad hierarchy levels. This hierarchy is based on whether the valuation inputs are observable or unobservable. These levels are:
| · | Level 1 – Quoted prices in active markets for identical securities. Level 1 may include exchange-traded instruments such as domestic equities, some foreign equities, options, futures, mutual funds, exchange-traded funds, rights and warrants. |
| · | Level 2 – Observable inputs other than Level 1 prices, such as quoted prices for similar securities; quoted prices in markets that are not active; or other inputs that are observable or can be corroborated by observable market data. Level 2 may include debt securities that are traded less frequently than exchange-traded instruments and which are valued using third party pricing services; foreign equities, whose value is determined using a multi-factor regression model with inputs that are observable in the market; and short-term securities, which are valued at amortized cost. |
| · | Level 3 – Significant unobservable inputs that are supported by limited or no market activity. Level 3 may include financial instruments whose values are determined using broker quotes or require significant management judgment or estimation. These unobservable valuation inputs may include estimates for current yields, maturity/duration, prepayment speed, and broker quotes for comparable securities along with other assumptions relating to credit quality, collateral value, complexity of the security structure, general market conditions and liquidity. This category may include securities where trading has been halted or there are certain restrictions on trading. While these securities are priced using unobservable inputs, the valuation of these securities reflects the best available data and management believes the prices are a reasonable representation of exit price. |
Valuation levels are not necessarily indicative of the risk associated with investing in such securities. Individual securities within any of the above mentioned asset classes may be assigned a different hierarchical level than those presented above, as individual circumstances dictate.
For additional information, refer to the Investment Valuation Hierarchy Level Summary and the Level 3 roll forward reconciliation which follow the Schedule of Investments.
For purposes of reporting transfers between different hierarchy levels, both transfers in and out of each level, as applicable, are shown as if they occurred at the beginning of the period.
| c) | Security Transactions and Investment Income –Security transactions are recorded as of the trade date (the date the order to buy or sell is executed) for financial reporting purposes. Securities purchased or sold on a when-issued or delayed-delivery basis may be settled a month or more after the trade date. Realized gains and losses are determined on the basis of identified cost. |
Trade date for senior floating rate interests purchased in the primary loan market is considered the date on which the loan allocations are determined. Trade date for senior floating rate interests purchased in the secondary loan market is the date on which the transaction is entered into.
Dividend income is recorded on the ex-dividend date, except certain dividends from foreign securities where the ex-dividend date may have passed are recorded as soon as the Fund is informed of the dividend. Interest income, including amortization of premium and accretion of discounts, is accrued on a daily basis. Paydown gains and losses on mortgage-related and other asset-backed securities are included in interest income on the Statement of Operations.
| d) | Foreign Currency Transactions – Assets and liabilities denominated in currencies other than U.S. dollars are translated into U.S. dollars at the exchange rates in effect on the valuation date. Purchases and sales of investment securities, income, and expenses are translated into U.S. dollars at the exchange rates on the dates of such transactions. |
The Fund does not isolate that portion of portfolio security valuation resulting from fluctuations in the foreign currency exchange rates from the fluctuations arising from changes in the market prices of securities held. Exchange rate fluctuations are included with the net realized and unrealized gain or loss on investments in the accompanying financial statements.
Net realized foreign exchange gains or losses arise from sales of foreign currencies and the difference between asset and liability amounts initially stated in foreign currencies and the U.S. dollar value of the amounts actually received or paid.
| Hartford High Yield HLS Fund |
| Notes to Financial Statements – (continued) |
| June 30, 2011 (Unaudited) |
| (000’s Omitted) |
Net unrealized foreign exchange gains or losses arise from changes in the value of other assets and liabilities at the end of the reporting period, resulting from changes in the exchange rates.
| e) | Joint Trading Account – The Fund may invest cash balances into a joint trading account that may be invested in one or more repurchase agreements. |
| f) | Fund Share Valuation and Dividend Distributions to Shareholders – Orders for the Fund’s shares are executed in accordance with the investment instructions of the contract holders and plan participants. The NAV of the Fund’s shares is determined as of the close of business on each business day of the Exchange. The NAV is determined separately for each class of shares of the Fund by dividing the Fund’s net assets attributable to that class by the number of shares of the class outstanding. Each class of shares offered by the Fund has equal rights as to assets and voting privileges (except that shareholders of a class have exclusive voting rights regarding any matter relating solely to that class of shares). Income and non-class specific expenses are allocated daily to each class on the basis of the relative net assets of the class. Realized and unrealized capital gains and losses of each class are allocated daily based on the relative net assets of each class of shares of the Fund. |
Orders for the purchase of the Fund’s shares received prior to the close of the Exchange on any day the Exchange is open for business are priced at the NAV determined as of the close of the Exchange. Orders received after the close of the Exchange, or on a day on which the Exchange and/or the Fund is not open for business, are priced at the next determined NAV.
Dividends are declared pursuant to a policy adopted by the Company’s Board of Directors based upon the investment performance of the Fund. The policy of the Fund is to pay dividends from net investment income and realized capital gains, if any, at least once a year.
Distributions from net investment income, net realized capital gains and capital are determined in accordance with federal income tax regulations, which may differ from U.S. GAAP with respect to character and timing. These differences may include but are not limited to losses deferred due to wash sale adjustments, foreign currency gains and losses, adjustments related to Passive Foreign Investment Companies (“PFICs”), Real Estate Investment Trusts (“REITs”), Regulated Investment Companies (“RICs”), certain derivatives and partnerships. Permanent book and federal income tax basis differences relating to shareholder distributions will result in reclassifications to certain of the Fund’s capital accounts (see Federal Income Taxes: Reclassification of Capital Accounts note).
| 3. | Securities and Other Investments: |
| a) | Repurchase Agreements – A repurchase agreement is an agreement by which a counterparty agrees to sell a security and agrees to repurchase the security sold at a mutually agreed upon time and price. At the time the Fund enters into a repurchase agreement, the value of the underlying collateral security(ies), including accrued interest, will be equal to or exceed the value of the repurchase agreement. Repurchase agreements expose the Fund to counterparty risk. To minimize counterparty risk, the securities that serve to collateralize the repurchase agreement are held by the Fund's custodian in book entry or physical form in the custodial account of the Fund or in a third party custodial account. Repurchase agreements are valued at cost plus accrued interest. The Fund had no outstanding repurchase agreements as of June 30, 2011. |
| b) | Illiquid and Restricted Securities – The Fund is permitted to invest up to 15% of its net assets in illiquid securities. Illiquid securities are those that may not be sold or disposed of in the ordinary course of business within seven days, at approximately the price used to determine the Fund’s NAV. The Fund may not be able to sell illiquid securities or other investments when its sub-adviser considers it desirable to do so or may have to sell such securities or investments at a price that is lower than the price that could be obtained if the securities or investments were more liquid. A sale of illiquid securities or other investments may require more time and may result in higher dealer discounts and other selling |
expenses than does the sale of those that are liquid. Illiquid securities and investments also may be more difficult to value, due to the unavailability of reliable market quotations for such securities or investments, and an investment in them may have an adverse impact on the Fund’s NAV. The Fund may also purchase certain restricted securities that can only be resold to certain qualified investors and may be determined to be liquid pursuant to policies and guidelines established by the Company’s Board of Directors. The Fund, as shown on the Schedule of Investments, had illiquid and/or restricted securities as of June 30, 2011.
| c) | Securities Purchased on a When-Issued or Delayed-Delivery Basis – Delivery and payment for securities that have been purchased by the Fund on a forward commitment, or when-issued or delayed-delivery basis, take place beyond the customary settlement period. During this period, such securities are subject to market fluctuations, and the Fund identifies securities segregated in its records with value at least equal to the amount of the commitment. The Fund, as shown on the Schedule of Investments, had when-issued or delayed delivery securities as of June 30, 2011. |
| d) | Senior Floating Rate Interests – The Fund, as shown on the Schedule of Investments, invests in senior floating rate interests. Senior floating rate interests hold the most senior position in the capital structure of a business entity (the “Borrower”), are typically secured by specific collateral and have a claim on the assets and/or stock of the Borrower that is senior to that held by subordinated debtholders and stockholders of the Borrower. Senior floating rate interests are typically structured and administered by a financial institution that acts as the agent of the lenders participating in the senior floating rate interest. The Fund may invest in multiple series or tranches of a senior floating rate interest, which may have varying terms and carry different associated risks. The Fund may also enter into unfunded loan commitments, which are contractual obligations for future funding. Unfunded loan commitments may include revolving credit facilities, which may obligate the Fund to supply additional cash to the borrower on demand. Unfunded loan commitments represent a future obligation in full. The Fund may receive a commitment fee based on the undrawn portion of the underlying line of credit portion of a senior floating rate interest. In certain circumstances, the Fund may receive various fees upon the restructure of a senior floating rate interest by a borrower. Fees earned/paid are recorded as a component of interest or capital gain in the Statement of Operations. |
Senior floating rate interests are typically rated below-investment-grade, which suggests they are more likely to default and generally pay higher interest rates than investment-grade loans. A default could lead to non-payment of income, which would result in a reduction of income to the Fund and there can be no assurance that the liquidation of any collateral would satisfy the Borrower’s obligation in the event of non-payment of scheduled interest or principal payments, or that such collateral could be readily liquidated.
| e) | Mortgage Related and Other Asset Backed Securities –The Fund may invest in mortgage related and other asset backed securities. These securities include mortgage pass-through securities, collateralized mortgage obligations, commercial mortgage backed securities, stripped mortgage backed securities, asset backed securities, collateralized debt obligations and other securities that directly or indirectly represent a participation in, or are secured by and payable from, mortgage loans on real property. Mortgage related securities are created from pools of residential or commercial mortgage loans, including mortgage loans made by savings and loan institutions, mortgage bankers, commercial banks and others. Asset backed securities are created from many types of assets, including auto loans, credit card receivables, home equity loans, and student loans. These securities provide a monthly payment which consists of both interest and principal payments. Interest payments may be determined by fixed or adjustable rates. The rate of pre-payments on underlying mortgages will affect the price and volatility of a mortgage related security, and may have the effect of shortening or extending the effective duration of the security relative to what was anticipated at the time of purchase. The timely payment of principal and interest of certain mortgage-related securities is guaranteed by the full faith and credit of the United States Government. Pools created and guaranteed by non-governmental issuers, including government-sponsored corporations, may be supported by various forms of insurance or guarantees, but there can be no assurance that the private insurers or guarantors can meet their obligations under the insurance policies or guarantee arrangements. |
| Hartford High Yield HLS Fund |
| Notes to Financial Statements – (continued) |
| June 30, 2011 (Unaudited) |
| (000’s Omitted) |
| 4. | Financial Derivative Instruments: |
The following disclosures contain information on how and why the Fund uses derivative instruments, the credit-risk-related contingent features in certain derivative instruments, and how derivative instruments affect the Fund’s financial position, results of operations and cash flows. The location and fair value amounts of these instruments on the Statement of Assets and Liabilities and the realized gains and losses and changes in unrealized gains and losses on the Statement of Operations, each categorized by type of derivative contract, are included in the following Additional Derivative Instrument Information footnote. The derivative instruments outstanding as of period-end are disclosed in the Notes to the Schedule of Investments and the amounts of realized gains and losses and changes in unrealized gains and losses on derivative instruments during the period are disclosed in the Statement of Operations.
| a) | Foreign Currency Contracts – The Fund may enter into foreign currency contracts that obligate the Fund to purchase or sell currencies at specified future dates. Foreign currency contracts are used to hedge the currency exposure associated with some or all of the Fund's securities and/or as part of an investment strategy. Foreign currency contracts are marked to market daily and the change in value is recorded by the Fund as an unrealized gain or loss. Realized gains or losses equal to the difference between the value of the contract at the time it was opened and the value at the time it was closed are recorded upon delivery or receipt of the currency. |
Foreign currency contracts involve elements of market risk in excess of the amounts reflected in the Statement of Assets and Liabilities. In addition, risks may arise upon entering into these contracts from the potential inability of the counterparties to meet the terms of the contracts and from unanticipated movements in the value of the foreign currencies relative to the U.S. dollar. The Fund had no outstanding foreign currency contracts as of June 30, 2011.
| b) | Options Contracts – An option contract is a contract sold by one party to another party that offers the buyer the right, but not the obligation, to buy (call) or sell (put) a security or other financial asset at an agreed-upon price during a specific period of time or on a specific date. The Fund may write (sell) covered call and put options on futures, swaps (“swaptions”), securities, commodities or currencies. “Covered” means that so long as the Fund is obligated as the writer of an option, it will own either the underlying securities or currency or an option to purchase the same underlying securities or currency having an expiration date of the covered option and an exercise price equal to or less than the exercise price of the covered option, or will pledge cash or other liquid securities having a value equal to or greater than the fluctuating market value of the option security or currency. Writing put options increases the Fund’s exposure to the underlying instrument. Writing call options decreases the Fund’s exposure to the underlying instrument. Premiums received from writing options that expire are treated as realized gains. Premiums received from writing options that are exercised or closed are added to the proceeds or offset against amounts paid on the underlying futures, swap, security or currency transaction to determine the realized gain or loss. The Fund as a writer of an option has no control over whether the underlying instrument may be sold (call) or purchased (put) and as a result bears the market risk of an unfavorable change in the price of the instrument underlying the written option. There is the risk the Fund may not be able to enter into a closing transaction because of an illiquid market. The Fund may also purchase put and call options. Purchasing call options increases the Fund’s exposure to the underlying instrument. Purchasing put options decreases the Fund’s exposure to the underlying instrument. A Fund pays a premium, which is included on the Fund’s Statement of Assets and Liabilities as an investment and is subsequently marked to market to reflect the current value of the option. Premiums paid for purchasing options that expire are treated as realized losses. Certain options may be purchased with premiums to be determined on a future date. The premiums for these options are based upon implied volatility parameters at specified terms. The risk associated with purchasing put and call options is generally limited to the premium paid. Premiums paid for purchasing options that are exercised or closed are added to the amounts paid or offset against the proceeds on the underlying investment transaction to determine the realized gain or loss. As of June 30, 2011, there were no outstanding options contracts. |
| Options Contract Activity During the | ||||||||
| Six-month Period Ended June 30, 2011 | ||||||||
| Call Options Written During the Period | Number of Contracts* | Premium Amounts | ||||||
| Beginning of the period | — | $ | — | |||||
| Written | 16,050,000 | 48 | ||||||
| Expired | (16,050,000 | ) | (48 | ) | ||||
| Closed | — | — | ||||||
| Exercised | — | — | ||||||
| End of period | — | $ | — | |||||
* The number of contracts does not omit 000's.
| c) | Swap Agreements– The Fund may invest in swap agreements. Swap agreements are privately negotiated agreements between the Fund and a counterparty to exchange or swap investment cash flows, assets, foreign currencies or market-linked returns at specified future intervals. The Fund enters into credit default, cross-currency, interest rate, inflation and other forms of swap agreements to manage its exposure to credit, currency, interest rate, commodity and inflation risk. Swap agreements are also used to gain exposure to certain markets. In connection with these agreements, securities or cash may be identified as collateral in accordance with the terms of the respective swap agreements to provide assets of value and recourse in the event of default or bankruptcy/insolvency. Swaps are valued based on custom valuations furnished by an independent pricing service. Swaps for which prices are not available from an independent pricing service are valued in accordance with procedures established by the Company's Board of Directors, and the change in value, if any, is recorded as an unrealized gain or loss on the Statement of Asset and Liabilities. Payments received or made at the beginning of the measurement period are reflected as such on the Statement of Assets and Liabilities and represent payments made or received upon entering into the swap agreement to compensate for differences between the stated terms of the swap agreement and prevailing market conditions (credit spreads, currency exchange rates, interest rates, and other relevant factors). These upfront payments are recorded as realized gains or losses on the Statement of Operations upon termination or maturity of the swap. A liquidation payment received or made at the termination of the swap and net periodic payments received or paid by the Fund are recorded as realized gains or losses on the Statement of Operations. Entering into these agreements involves, to varying degrees, elements of credit, market and documentation risk in excess of the amounts recognized on the Statement of Assets and Liabilities. Such risks involve the possibility that there will be no liquid market for these agreements, that the counterparty to the agreements may default on its obligation to perform or disagree as to the meaning of contractual terms in the agreements and that there may be unfavorable changes in interest rates. The Fund’s maximum risk of loss from counterparty credit risk is the discounted net value of the cash flows to be received from the counterparty over the contract’s remaining life, to the extent that amount is positive. The risk is mitigated by having a master netting arrangement between the Fund and the counterparty, which allows for the netting of payments made or received (although such amounts are presented on a gross basis within the Statement of Assets and Liabilities, as applicable) as well as the posting of collateral to the Fund to cover the Fund’s exposure to the counterparty. |
Credit Default Swap Agreements– The credit default swap market allows the Fund to manage its exposure to the market or certain sectors of the market, to reduce its risk exposure to defaults of corporate and sovereign issuers, or to create exposure to corporate or sovereign issuers to which it is not otherwise exposed. Certain credit default swaps involve the exchange of a fixed rate premium for protection against the loss in value of an underlying security in the event of a credit event, such as payment default or bankruptcy.
Under a credit default swap contract, one party acts as guarantor by receiving the fixed periodic payment in exchange for the commitment to purchase the underlying security at par if the defined credit event occurs. Upon the occurrence of a defined credit event, the difference between the value of the reference obligation and the swap’s notional amount is recorded as realized gain or loss on swap transactions in the Statement of Operations. A “buyer” of credit protection agrees to pay a counterparty to assume the credit risk of an issuer upon the occurrence of certain events. The “seller” of the protection receives periodic payments and agrees to assume the credit risk of an issuer upon the occurrence of certain events. Although specified events are contract specific, credit events are generally defined as bankruptcy, failure to pay, restructuring, obligation acceleration, obligation default, or repudiation/moratorium. A “seller’s” exposure is limited to
| Hartford High Yield HLS Fund |
| Notes to Financial Statements – (continued) |
| June 30, 2011 (Unaudited) |
| (000’s Omitted) |
the total notional amount of the credit default swap contract. These potential amounts would be partially offset by any recovery values of the respective referenced obligations or upfront payments received upon entering into the contract. The Fund will generally not buy protection on issuers that are not currently held by the Fund.
Implied credit spreads, represented in absolute terms, utilized in determining the market value of credit default swap contracts on corporate issues, sovereign issues of an emerging country or U.S. municipal issues as of period end are disclosed in the notes to the Schedule of Investments, as applicable, and serve as an indicator of the current status of the payment/performance risk and represent the likelihood or risk of default for the credit derivative. The implied credit spread of a particular referenced entity reflects the cost of buying/selling protection and may include upfront payments required to be made to enter into the contract. Wider credit spreads represent a deterioration of the referenced entity’s soundness and a greater likelihood or risk of default or other credit event occurring as defined under the terms of the contract. For credit default swap contracts on asset-backed securities and credit indices, the quoted market prices and resulting values serve as the indicator of the current status of the payment/performance risk. Increasing market values, in absolute terms when compared to the notional amount of the swap, represent a deterioration of the referenced equity’s credit soundness and a greater likelihood or risk of default or other credit event occurring as defined under the terms of the contract. The Fund had no outstanding credit default swaps as of June 30, 2011.
| d) | Additional Derivative Instrument Information: |
The volume of derivative activity was minimal during the six-month period ended June 30, 2011.
The Effect of Derivative Instruments on the Statement of Operations for the six-month period ended June 30, 2011:
| Risk Exposure Category | ||||||||||||||||||||||||||||
| Foreign | ||||||||||||||||||||||||||||
| Interest Rate | Exchange | Credit | Equity | Commodity | Other | |||||||||||||||||||||||
| Contracts | Contracts | Contracts | Contracts | Contracts | Contracts | Total | ||||||||||||||||||||||
| Realized Gain (Loss) on Derivatives Recognized as a Result from Operations: | ||||||||||||||||||||||||||||
| Net realized gain on written options | $ | — | $ | — | $ | 48 | $ | — | $ | — | $ | — | $ | 48 | ||||||||||||||
| Net realized gain on swap contracts | — | — | 403 | — | — | — | 403 | |||||||||||||||||||||
Net realized loss on foreign currency contracts | — | (245 | ) | — | — | — | — | (245 | ) | |||||||||||||||||||
| Total | $ | — | $ | (245 | ) | $ | 451 | $ | — | $ | — | $ | — | $ | 206 | |||||||||||||
| Net Change in Unrealized Appreciation (Depreciation) on Derivatives Recognized as a Result from Operations: | ||||||||||||||||||||||||||||
Net change in unrealized appreciation of swap contracts | $ | — | $ | — | $ | 66 | $ | — | $ | — | $ | — | $ | 66 | ||||||||||||||
Net change in unrealized appreciation of foreign currency contracts | — | 245 | — | — | — | — | 245 | |||||||||||||||||||||
| Total | $ | — | $ | 245 | $ | 66 | $ | — | $ | — | $ | — | $ | 311 | ||||||||||||||
| 5. | Principal Risks: |
| a) | Credit and Counterparty Risks – Credit risk depends largely on the perceived financial health of bond issuers. In general, the credit rating is inversely related to the credit risk of the issuer. Higher rated bonds generally are deemed to have less credit risk, while lower or unrated bonds are deemed to have higher risk of default. The share price, yield and total return of a fund that holds securities with higher credit risk may be more volatile than those of a fund that holds bonds with lower credit risk. Similar to credit risk, the Fund may be exposed to counterparty risk, or the risk that an institution or other entity with which the Fund has unsettled or open transactions will default. |
| b) | Market Risks – A Fund’s investments in derivatives and other financial instruments expose the Fund to various risks including, but not limited to, interest rate, prepayment, extension, foreign currency, and equity risks. Interest rate risk is the risk that fixed income securities will decline in value because of changes in interest rates. As nominal interest rates |
rise, the value of certain fixed income securities held by the Fund is likely to decrease. A nominal interest rate can be described as the sum of a real interest rate and an expected inflation rate. Fixed income securities with longer durations tend to be more sensitive to changes in interest rates, usually making them more volatile than securities with shorter durations. Duration is useful primarily as a measure of the sensitivity of a fixed income’s security market price to interest rate (i.e., yield) movements. Senior floating rate interests and securities subject to prepayment and extension risk generally offer less potential for gains when interest rates decline. In addition, securities are subject to extension risk. Rising interest rates may cause prepayments to occur at a slower than expected rate, thereby effectively lengthening the maturity of the security and making the security more sensitive to interest rate changes. Prepayment and extension risk are major risks of mortgage-backed securities, senior floating rate interests, and certain asset-backed securities. For certain asset backed securities, the actual maturity may be less than the stated maturity shown in the Schedule of Investments. As a result, the timing of income recognition relating to these securities may vary based upon the actual maturity. If a Fund invests directly in foreign currencies or in securities that trade in, and receive revenues in, foreign currencies, or in derivatives that provide exposure to foreign currencies, it will be subject to the risk that those currencies will decline in value relative to the base currency of the Fund, or, in the case of hedging positions, that the Fund’s base currency will decline in value relative to the currency being hedged. Currency rates in foreign countries may fluctuate significantly over short periods of time for a number of reasons, including changes in interest rates, intervention (or the failure to intervene) by U.S. or foreign governments, central banks or supranational entities such as the International Monetary Fund, or by the imposition of currency controls or other political developments in the United States or abroad. As a result, the Fund’s investments in foreign currency denominated securities may reduce the returns of the Fund. The market values of equity securities, such as common stocks and preferred stocks or equity related investments such as futures and options, may decline due to general market conditions which are not specifically related to a particular company, such as real or perceived adverse economic conditions, changes in the general outlook for corporate earnings, changes in interest or currency rates or adverse investor sentiment generally. The market value of equity securities may also decline due to factors which affect a particular industry or industries, such as labor shortages or increased production costs and competitive conditions within an industry. Equity securities and equity related investments generally have greater market price volatility than fixed income securities.
| 6. | Federal Income Taxes: |
| a) | Federal Income Taxes – For federal income tax purposes, the Fund intends to continue to qualify as a RIC under Subchapter M of the Internal Revenue Code (“IRC”) by distributing substantially all of its taxable net investment income and net realized capital gains to its shareholders and otherwise complying with the requirements of RICs. The Fund has distributed substantially all of its income and capital gains in prior years, if applicable, and intends to distribute substantially all of its income and capital gains prior to the next fiscal year-end. Accordingly, no provision for federal income or excise taxes has been made in the accompanying financial statements. Distributions from short-term capital gains are treated as ordinary income distributions for federal income tax purposes. |
| b) | Net Investment Income (Loss), Net Realized Gains (Losses) –Net investment income (loss) and net realized gains (losses) may differ for financial statement and tax purposes primarily because of losses deferred due to wash sale adjustments, foreign currency gains and losses, adjustments related to PFICs, REITs, RICs, certain derivatives and partnerships. The character of distributions made during the year from net investment income or net realized gains may differ from their ultimate characterization for federal income tax purposes. Also, due to the timing of dividend distributions, the fiscal year in which amounts are distributed may differ from the year that the income or realized gains (losses) were recorded by the Fund. |
| c) | Distributions and Components of Distributable Earnings – The tax character of distributions paid by the Fund for the periods indicated is as follows (as adjusted for dividends payable): |
| For the Year Ended | For the Year Ended | |||||||
| December 31, 2010 | December 31, 2009 | |||||||
| Ordinary Income | $ | 5,000 | $ | 56,238 | ||||
| Hartford High Yield HLS Fund |
| Notes to Financial Statements – (continued) |
| June 30, 2011 (Unaudited) |
| (000’s Omitted) |
As of December 31, 2010, the Fund’s components of distributable earnings (deficit) on a tax basis were as follows:
| Amount | ||||
| Undistributed Ordinary Income | $ | 63,578 | ||
| Accumulated Capital and Other Losses* | (67,835 | ) | ||
Unrealized Appreciation† | 36,118 | |||
| Total Accumulated Earnings | $ | 31,861 | ||
| * | The Fund has capital loss carryforwards that are identified in the Capital Loss Carryforward note that follows. |
| † | The difference between book-basis and tax-basis unrealized appreciation (depreciation) may be attributable to the losses deferred due to wash sale adjustments, foreign currency gains and losses, adjustments related to PFICs, REITs, RICs, certain derivatives and partnerships. |
| d) | Reclassification of Capital Accounts – The Fund may record reclassifications in its capital accounts. These reclassifications have no impact on the total net assets of the Fund. The reclassifications are a result of permanent differences between U.S. GAAP and tax accounting for such items as expiration or utilization of capital loss carryforwards or net operating losses. Adjustments are made to reflect the impact these items have on current and future distributions to shareholders. Therefore, the source of the Fund’s distributable income may be shown in the accompanying Statement of Assets and Liabilities as from accumulated undistributed net investment income, from accumulated net realized gains on investments or from capital depending on the type of book and tax differences that exist. For the year ended December 31, 2010, the Fund recorded reclassifications to increase (decrease) the accounts listed below: |
| Amount | ||||
| Accumulated Undistributed Net Investment Income | $ | 7 | ||
| Accumulated Net Realized Gain (Loss) on Investments and Foreign Currency Transactions | (7 | ) | ||
| e) | Capital Loss Carryforward – At December 31, 2010 (tax-year-end), the Fund had capital loss carryforwards for U.S. federal income tax purposes of approximately: |
| Year of Expiration | Amount | |||
| 2016 | $ | 15,837 | ||
| 2017 | 51,998 | |||
| Total | $ | 67,835 | ||
As of December 31, 2010, the Fund utilized $62,617 of prior year capital loss carryforwards.
| f) | Accounting for Uncertainty in Income Taxes – The Fund has adopted financial reporting rules that require the Fund to analyze all open tax years, as defined by the Statute of Limitations, for all major jurisdictions. Generally, tax authorities can examine all tax returns filed for the last three years. The Fund does not have an examination in progress. |
The Fund has reviewed all open tax years and major jurisdictions and concluded that these financial reporting rules had no effect on the Fund’s financial position or results of operations. There is no tax liability resulting from unrecognized tax benefits relating to uncertain income tax positions taken or expected to be taken on the tax return for the fiscal year-end December 31, 2010. The Fund is also not aware of any tax positions for which it is reasonably possible that the total amounts of unrecognized tax benefits will significantly change in the next twelve months.
| 7. | Expenses: |
| a) | Investment Management Agreements – HL Investment Advisors, LLC (“HL Advisors”), an indirect wholly owned subsidiary of The Hartford Financial Services Group, Inc. (“The Hartford”), serves as investment manager to the Fund pursuant to an Investment Management Agreement with the Company. As investment manager, HL Advisors has overall investment supervisory responsibility for the Fund. In addition, HL Advisors provides administrative personnel, services, equipment, facilities and office space for proper operation of the Fund. HL Advisors has contracted with Hartford Investment Management Company (“Hartford Investment Management”) under a sub-advisory agreement for the provision of day-to-day investment management services to the Fund in accordance with the Fund’s investment objective and policies. The Fund pays a fee to HL Advisors, a portion of which may be used to compensate Hartford Investment Management. |
The schedule below reflects the rates of compensation paid to HL Advisors for investment management services rendered as of June 30, 2011; the rates are accrued daily and paid monthly.
| Average Daily Net Assets | Annual Fee | |||
| On first $500 million | 0.7000 | % | ||
| On next $500 million | 0.6750 | % | ||
| On next $4 billion | 0.6250 | % | ||
| On next $5 billion | 0.6050 | % | ||
| Over $10 billion | 0.5950 | % | ||
| b) | Accounting Services Agreement –Pursuant to the Fund Accounting Agreement between HLIC and the Company, on behalf of the Fund, HLIC provides accounting services to the Fund and receives monthly compensation based on the Fund’s average net assets at the rates set forth below. The Fund’s accounting services fees are accrued daily and paid monthly. |
| Average Daily Net Assets | Annual Fee | |||
| On first $5 billion | 0.018 | % | ||
| On next $5 billion | 0.016 | % | ||
| Over $10 billion | 0.014 | % | ||
| c) | Operating Expenses – Allocable expenses incurred by the Company are allocated to each Fund and allocated to classes within a Fund in proportion to the average daily net assets of the Fund and each class, except where allocation of certain expenses is more fairly made directly to the Fund or to specific classes within a Fund. |
| d) | Distribution Plan for Class IB shares – The Company, on behalf of the Fund, has adopted a Distribution Plan pursuant to Rule 12b-1 of the 1940 Act to compensate the Distributor, Hartford Securities Distribution Company, Inc. (a wholly owned, ultimate subsidiary of The Hartford), from assets attributable to the Class IB shares for services rendered and expenses borne in connection with activities primarily intended to result in the sale of the Class IB shares, subject to the review and approval of the Company’s Board of Directors. |
The Distribution Plan provides that the Fund may pay annually up to 0.25% of the average daily net assets of the Fund attributable to its Class IB shares for activities primarily intended to result in the sale of Class IB shares. The Board has the authority to suspend or reduce these payments at any point in time. Under the terms of the Distribution Plan and the principal underwriting agreement, the Fund is authorized to make payments monthly to the Distributor that may be used to pay or compensate entities providing distribution and shareholder servicing with respect to the Class IB shares for such entities’ fees or expenses incurred or paid in that regard. These fees are accrued daily and paid monthly.
| e) | Other Related Party Transactions – Certain officers of the Fund are directors and/or officers of HL Advisors and/or The Hartford or its subsidiaries. For the six-month period ended June 30, 2011, a portion of the Fund’s chief compliance |
| Hartford High Yield HLS Fund |
| Notes to Financial Statements – (continued) |
| June 30, 2011 (Unaudited) |
| (000’s Omitted) |
officer’s salary was paid by all the investment companies in the Hartford fund complex. The portion allocated to the Fund was in the amount of $1. Hartford Administrative Services Company (“HASCO”), an indirect wholly owned subsidiary of The Hartford, provides transfer agent services to the Fund. The amount paid to HASCO can be found in the Statement of Operations. These fees are accrued daily and paid monthly.
| f) | Payments from Affiliates – In July of 2007, The Hartford entered into a settlement with the Attorneys General of the states of New York, Connecticut and Illinois relating to market timing and the company's individual variable annuity contracts in which certain payments would be made directly to the variable annuity contract holders. The distribution plan provided that unclaimed money from the settlement would be distributed to certain HLS Funds that are investment options through a Hartford individual variable annuity contract. The unclaimed money was distributed to the Fund on September 18, 2009, as follows: |
| Amount | ||||
| Reimbursement | $ | 201 | ||
The Fund is available for purchase by the separate accounts of different variable universal life policies, variable annuity products, and funding agreements and it is offered directly to certain qualified retirement plans (collectively “Products”). Although existing Products contain transfer restrictions, some Products, particularly older variable annuity products, do not contain restrictions on the frequency of transfers. In addition, as the result of the settlement of litigation against Hartford Life, Inc. (“Hartford Life”) (the issuers of such variable annuity products), the Fund’s ability to restrict transfers by certain owners of older variable annuity products was limited. During 2006, these annuity owners surrendered the older variable annuity contracts that were the subject of prior litigation. In February 2005, Hartford Life agreed with the Board of Directors of the Company to indemnify the Fund for any material harm caused to the Fund from frequent trading by these contract owners.
The total return in the accompanying financial highlights includes payments from affiliates. Had the payments from the affiliates been excluded, the impact and total return for the periods listed below would have been as follows:
| For the Year Ended December 31, 2009 | ||||||||
| Class IA | Class IB | |||||||
| Impact from Payment from Affiliate for Attorneys General Settlement | 0.03 | % | 0.03 | % | ||||
| Total Return Excluding Payment from Affiliate | 50.41 | 50.04 | ||||||
| For the Year Ended December 31, 2006 | ||||||||
| Class IA | Class IB | |||||||
| Impact from Payment from Affiliate for Unrestricted Transfers | 0.02 | % | 0.02 | % | ||||
| Total Return Excluding Payment from Affiliate | 11.15 | 10.87 | ||||||
| 8. | Investment Transactions: |
For the six-month period ended June 30, 2011, the Fund's aggregate purchases and sales of investment securities (excluding short-term investments) were as follows:
| Amount | ||||
| Cost of Purchases Excluding U.S. Government Obligations | $ | 391,969 | ||
| Sales Proceeds Excluding U.S. Government Obligations | 393,072 | |||
| 9. | Line of Credit: |
The Fund is one of several Hartford funds that participate in a $500 million committed revolving line of credit facility. The facility is to be used for temporary or emergency purposes. Under the arrangement, a fund is required to own securities having a market value in excess of 300% of the total bank borrowings. The interest rate on borrowings varies depending on the nature of the loan. The facility also requires a fee to be paid based on the amount of the commitment. This commitment fee is allocated to all the funds participating in the line of credit based on the average net assets of the funds. During the six-month period ended June 30, 2011, the Fund did not have any borrowings under this facility.
| 10. | Industry Classifications: |
Other than the industry classifications “Other Investment Pools and Funds” and “Exchange Traded Funds,” equity industry classifications used in this report are the Global Industry Classification Standard, which was developed by and is the exclusive property and service mark of MSCI, Inc. and Standard & Poor’s.
| 11. | Indemnifications: |
Under the Company’s organizational documents, the Company shall indemnify its officers and directors to the full extent required or permitted under Maryland General Corporation Law and the federal securities laws. In addition, the Company, on behalf of the Fund, may enter into contracts that contain a variety of indemnifications. The Company’s maximum exposure under these arrangements is unknown. However, as of the date of these financial statements the Company has not had prior claims or losses pursuant to these contracts and expects the risk of loss to be remote.
| Financial Highlights |
| - Selected Per-Share Data (A) - |
| Net Asset | Net Realized | Net Increase | ||||||||||||||||||||||||||||||||||||||||||
| Value at | and Unrealized | Total from | Dividends from | Distributions | (Decrease) in | Net Asset | ||||||||||||||||||||||||||||||||||||||
| Beginning of | Net Investment | Payments from | Gain (Loss) on | Investment | Net Investment | from Realized | Distributions | Total | Net Asset | Value at End | ||||||||||||||||||||||||||||||||||
| Class | Period | Income (Loss) | (to) Affiliate | Investments | Operations | Income | Capital Gains | from Capital | Distributions | Value | of Period | |||||||||||||||||||||||||||||||||
| For the Six-Month Period Ended June 30, 2011(D) (Unaudited) | ||||||||||||||||||||||||||||||||||||||||||||
| IA | $ | 9.15 | $ | 0.36 | $ | – | $ | 0.14 | $ | 0.50 | $ | – | $ | – | $ | – | $ | – | $ | 0.50 | $ | 9.65 | ||||||||||||||||||||||
| IB | 9.04 | 0.34 | – | 0.14 | 0.48 | – | – | – | – | 0.48 | 9.52 | |||||||||||||||||||||||||||||||||
| For the Year Ended December 31, 2010(D) | ||||||||||||||||||||||||||||||||||||||||||||
| IA | 7.94 | 0.75 | – | 0.52 | 1.27 | (0.06 | ) | – | – | (0.06 | ) | 1.21 | 9.15 | |||||||||||||||||||||||||||||||
| IB | 7.86 | 0.72 | – | 0.52 | 1.24 | (0.06 | ) | – | – | (0.06 | ) | 1.18 | 9.04 | |||||||||||||||||||||||||||||||
| For the Year Ended December 31, 2009(D) | ||||||||||||||||||||||||||||||||||||||||||||
| IA | 5.73 | 0.73 | – | 2.16 | 2.89 | (0.68 | ) | – | – | (0.68 | ) | 2.21 | 7.94 | |||||||||||||||||||||||||||||||
| IB | 5.68 | 0.70 | – | 2.14 | 2.84 | (0.66 | ) | – | – | (0.66 | ) | 2.18 | 7.86 | |||||||||||||||||||||||||||||||
| For the Year Ended December 31, 2008 | ||||||||||||||||||||||||||||||||||||||||||||
| IA | 8.87 | 0.83 | – | (3.12 | ) | (2.29 | ) | (0.85 | ) | – | – | (0.85 | ) | (3.14 | ) | 5.73 | ||||||||||||||||||||||||||||
| IB | 8.78 | 0.83 | – | (3.11 | ) | (2.28 | ) | (0.82 | ) | – | – | (0.82 | ) | (3.10 | ) | 5.68 | ||||||||||||||||||||||||||||
| For the Year Ended December 31, 2007(D) | ||||||||||||||||||||||||||||||||||||||||||||
| IA | 9.35 | 0.71 | – | (0.45 | ) | 0.26 | (0.74 | ) | – | – | (0.74 | ) | (0.48 | ) | 8.87 | |||||||||||||||||||||||||||||
| IB | 9.27 | 0.68 | – | (0.45 | ) | 0.23 | (0.72 | ) | – | – | (0.72 | ) | (0.49 | ) | 8.78 | |||||||||||||||||||||||||||||
| For the Year Ended December 31, 2006(D) | ||||||||||||||||||||||||||||||||||||||||||||
| IA | 9.80 | 0.72 | – | 0.31 | 1.03 | (1.48 | ) | – | – | (1.48 | ) | (0.45 | ) | 9.35 | ||||||||||||||||||||||||||||||
| IB | 9.70 | 0.69 | – | 0.30 | 0.99 | (1.42 | ) | – | – | (1.42 | ) | (0.43 | ) | 9.27 | ||||||||||||||||||||||||||||||
| (A) | Information presented relates to a share outstanding throughout the indicated period. |
| (B) | The figures do not include sales charges or other fees which may be applied at the variable life insurance, variable annuity or qualified retirement plan product level. Any such additional sales charges or other fees would lower the Fund's performance. |
| (C) | Portfolio turnover rate is calculated on the basis of the Fund as a whole without distinguishing between the classes of shares issued. |
| (D) | Per share amounts have been calculated using the average shares method. |
| (E) | Not annualized. |
| (F) | Annualized. |
| (G) | Total return without the inclusion of the Payment from (to) Affiliate can be found in Expenses in the accompanying Notes to Financial Statements. |
| - Ratios and Supplemental Data - |
| Ratio of Expenses to Average Net | Ratio of Expenses to Average Net | Ratio of Net Investment Income to | Portfolio Turnover | ||||||||||||||||||||
| Total Return(B) | Net Assets at End of Period | Assets Before Waivers | Assets After Waivers | Average Net Assets | Rate(C) | ||||||||||||||||||
| 5.45 | %(E) | $ | 589,076 | 0.74 | %(F) | 0.74 | %(F) | 7.60 | %(F) | 50 | % | ||||||||||||
| 5.32 | (E) | 176,757 | 0.99 | (F) | 0.99 | (F) | 7.35 | (F) | – | ||||||||||||||
| 16.15 | 602,493 | 0.75 | 0.75 | 8.80 | 139 | ||||||||||||||||||
| 15.86 | 186,357 | 1.00 | 1.00 | 8.57 | – | ||||||||||||||||||
| 50.46 | (G) | 527,000 | 0.75 | 0.75 | 10.32 | 173 | |||||||||||||||||
| 50.08 | (G) | 188,832 | 1.00 | 1.00 | 10.08 | – | |||||||||||||||||
| (25.23 | ) | 293,839 | 0.74 | 0.74 | 9.05 | 101 | |||||||||||||||||
| (25.42 | ) | 124,701 | 0.99 | 0.99 | 8.76 | – | |||||||||||||||||
| 2.79 | 460,243 | 0.77 | 0.72 | 7.47 | 148 | ||||||||||||||||||
| 2.53 | 222,712 | 1.02 | 0.97 | 7.20 | – | ||||||||||||||||||
| 11.17 | (G) | 471,327 | 0.77 | 0.72 | 7.39 | 160 | |||||||||||||||||
| 10.89 | (G) | 264,525 | 1.02 | 0.97 | 7.14 | – | |||||||||||||||||
| Directors and Officers (Unaudited) |
The Board of Directors of the Company appoints officers who are responsible for the day-to-day operations of the Fund and who execute policies formulated by the Directors. Each director serves until his or her death, resignation, or retirement or until the next annual meeting of shareholders is held or until his or her successor is elected and qualifies.
Directors and officers who are employed by or who have a financial interest in The Hartford are considered “interested” persons of the Fund pursuant to the 1940 Act. Each officer and two of the Company’s directors, as noted in the chart below, are “interested” persons of the Fund. Each director serves as a director for The Hartford Mutual Funds, Inc., The Hartford Mutual Funds II, Inc., Hartford Series Fund, Inc., and Hartford HLS Series Fund II, Inc., which, as of June 30, 2011, collectively consist of 89 funds. Correspondence may be sent to directors and officers c/o Hartford Mutual Funds, P.O. Box 2999, Hartford, Connecticut 06104-2999, except that correspondence to Ms. Fagely may be sent to 500 Bielenberg Drive, Woodbury, Minnesota 55125.
The table below sets forth, for each director and officer, his or her name, year of birth, current position with the Company and date first elected or appointed to Hartford Series Fund, Inc. (“HSF”), and Hartford HLS Series Fund II, Inc. (“HSF2”), principal occupation, and, for directors, other directorships held. The Fund’s statement of additional information contains further information on the directors and is available free of charge by calling 1-800-862-6668 or writing to Hartford HLS Funds, c/o Individual Annuity Services, P.O. Box 5085, Hartford, CT 06102-5085.
Information on the aggregate remuneration paid to the directors of the Company can be found in the Statement of Operations herein. The Fund pays to The Hartford a portion of the chief compliance officer’s compensation, but does not pay salaries or compensation to any of their other officers or directors who are employed by The Hartford.
Non-Interested Directors
Lynn S. Birdsong (1946) Director since 2003, Co-Chairman of the Investment Committee
Mr. Birdsong is a private investor. Mr. Birdsong currently serves as a Director of the Sovereign High Yield Investment Company (April 2010 to current). Mr. Birdsong currently serves as an Independent Director of Nomura Partners Funds, Inc. (formerly, The Japan Fund) (March 2003 to current). From 2003 to March 2005, Mr. Birdsong was an independent director of the Atlantic Whitehall Funds. From 1979 to 2002, Mr. Birdsong was a managing director of Zurich Scudder Investments, an investment management firm. During his employment with Scudder, Mr. Birdsong was an Interested Director of The Japan Fund. Since 1981, Mr. Birdsong has been a partner in Birdsong Company, an advertising specialty firm.
Robert M. Gavin, Jr. (1940) Director since 2002 (HSF) and 1986 (HSF2), Chairman of the Board since 2004
Dr. Gavin is an educational consultant. Prior to September 1, 2001, he was President of Cranbrook Education Community and prior to July 1996, he was President of Macalester College, St. Paul, Minnesota.
Duane E. Hill (1945) Director since 2001 (HSF) and 2002 (HSF2), Chairman of the Nominating Committee
Mr. Hill is Partner of TSG Ventures L.P., a private equity investment company. Mr. Hill is a former partner of TSG Capital Group, a private equity investment firm that served as sponsor and lead investor in leveraged buyouts of middle market companies.
Sandra S. Jaffee (1941) Director since 2005
Ms. Jaffee served as Chairman (2008 to 2009) and Chief Executive Officer of Fortent (formerly Searchspace Group), a leading provider of compliance/regulatory technology to financial institutions from August 2005 to August 2009. From August 2004 to August 2005, Ms. Jaffee served as an Entrepreneur in Residence with Warburg Pincus, a private equity firm. From September 1995 to July 2004, Ms. Jaffee served as Executive Vice President at Citigroup, where she was President and Chief Executive Officer of Citibank’s Global Securities Services (1995 to 2003). Ms. Jaffe currently serves as a member of the Board of Directors of Broadridge Financial Solutions as well as a Trustee of Muhlenberg College.
William P. Johnston (1944) Director since 2005, Chairman of the Compliance Committee
In June 2006, Mr. Johnston was appointed as Senior Advisor to The Carlyle Group, a global private equity investment firm. In July 2006, Mr. Johnston was elected to the Board of Directors of MultiPlan, Inc. In August 2007, Mr. Johnston was elected to the Board of Directors of LifeCare Holdings, Inc. In February 2008, Mr. Johnston was elected to the Board of Directors of HCR-ManorCare, Inc. In May 2006, Mr. Johnston was elected to the Supervisory Board of Fresenius Medical Care AG & Co. KGaA, after its acquisition of Renal Care Group, Inc. in March 2006. Mr. Johnston joined Renal Care Group in November 2002 as a member of the Board of Directors and served as Chairman of the Board from March 2003 through March 2006. From September 1987 to December 2002, Mr. Johnston was with Equitable Securities Corporation (and its successors, SunTrust Equitable Securities and SunTrust Robinson Humphrey) serving in various investment banking and managerial positions, including Managing Director and Head of Investment Banking, Chief Executive Officer and Vice Chairman.
Phillip O. Peterson (1944) Director since 2002 (HSF) and 2000 (HSF2), Chairman of the Audit Committee
Mr. Peterson is a mutual fund industry consultant. He was a partner of KPMG LLP (an accounting firm) until July 1999. Mr. Peterson joined William Blair Funds in February 2007 as a member of the Board of Trustees. From January 2004 to April 2005, Mr. Peterson served as Independent President of the Strong Mutual Funds.
Lemma W. Senbet (1946) Director since 2005
Dr. Senbet is the William E. Mayer Chair Professor of Finance and Director, Center for Financial Policy, at the University of Maryland, Robert H. Smith School of Business. He was chair of the Finance Department from 1998 to 2006. Previously he was a chaired professor of finance at the University of Wisconsin-Madison. Also, he was director of the Fortis Funds from March 2000 to July 2002. Dr. Senbet served the finance profession in various capacities, including as director of the American Finance Association and President of the Western Finance Association. In 2006, Dr. Senbet was inducted Fellow of Financial Management Association International for his career-long distinguished scholarship and professional service.
Interested Directors and Officers
David N. Levenson (1966) Director since 2010
Mr. Levenson currently serves as President of The Hartford’s Wealth Management business. He was appointed to this role in July 2010. Previously, Mr. Levenson served as Executive Vice President of Legacy Holdings for The Hartford from June 2009 to July 2010. From 2006 to 2009, Mr. Levenson was with Hartford Life Insurance K.K. where he served as President and CEO from 2007 to 2009. He served as Managing Director of Hartford Investment Management Company from 2005 to 2006. Additionally, Mr. Levenson serves as Executive Vice President of The Hartford and as President, Director and Chief Executive Officer of Hartford Life Insurance Company (“HLIC”) and Hartford Life, Inc. (“HL Inc.”).
Lowndes A. Smith (1939) Director since 1996 (HSF) and 2002 (HSF2), Co-Chairman of the Investment Committee
Mr. Smith served as Vice Chairman of The Hartford from February 1997 to January 2002, as President and Chief Executive Officer of HL Inc. from February 1997 to January 2002, and as President and Chief Operating Officer of The Hartford Life Insurance Companies from January 1989 to January 2002. Mr. Smith serves as a Director of White Mountains Insurance Group, Ltd., One Beacon Insurance and Symetra Financial and as a Managing Director of Whittington Gray Associates.
Other Officers
James E. Davey (1964) President and Chief Executive Officer since 2010
Mr. Davey serves as Executive Vice President of HLIC. Additionally, Mr. Davey serves as President, Chief Executive Officer and Manager of Hartford Investment Financial Services, Inc. (“HIFSCO”) and President, Chief Executive Officer and Manager of HL Advisors. Mr. Davey joined The Hartford in 2002.
Tamara L. Fagely (1958) Vice President, Treasurer and Controller since 2002 (HSF) and 1993 (HSF2)
Ms. Fagely has been a Vice President of HASCO since 1998 and Chief Financial Officer since 2006. Currently Ms. Fagely is a Vice President of HLIC. She served as Assistant Vice President of HLIC from December 2001 through March 2005. In addition, Ms. Fagely is Controller and Chief Financial Officer of HIFSCO.
Susan M. Fleege (1959) AML Compliance Officer since 2011
Ms. Fleege currently serves as a Director of Risk Management at The Hartford. She previously served as AML Compliance Officer for the Fund from 2005-2008. Ms. Fleege joined HLIC in 2005 from Amerprise Financial Corporation where she held the position of Counsel from 2000 to 2005. Ms. Fleege is a certified Anti-Money Laundering Specialist.
Dr. Robert J. Froehlich (1953) Senior Managing Director since 2009
Dr. Froehlich joined The Hartford as Senior Managing Director in September 2009. Prior to joining The Hartford, Dr. Froehlich served as Vice Chairman of Deutsche Asset Management from 1997-2009.
Edward P. Macdonald(1967) Vice President, Secretary and Chief Legal Officer since 2005
Mr. Macdonald serves as Vice President of HLIC and Chief Legal Officer of Mutual Funds and Vice President of HIFSCO. He also serves as Vice President and Secretary of HASCO, and Chief Legal Officer, Secretary and Vice President of HL Advisors. Mr. Macdonald joined The Hartford in 2005.
| Hartford High Yield HLS Fund |
| Directors and Officers (Unaudited) – (continued) |
Vernon J. Meyer (1964) Vice President since 2006
Mr. Meyer serves as Senior Vice President of HLIC. He also serves as Senior Vice President of HIFSCO and HL Advisors. Mr. Meyer joined The Hartford in 2004.
Colleen B. Pernerewski (1969) Vice President and Chief Compliance Officer since 2010
Ms. Pernerewski serves as Vice President and Chief Investment Advisor Compliance Officer of HIFSCO and as Vice President and Chief Compliance Officer of HL Advisors. Ms. Pernerewski joined The Hartford in 2005 from Travelers Life and Annuity where she served as Counsel (2004-2005). Prior to Travelers Life and Annuity, Ms. Pernerewski held the position of Counsel at The Hartford (1998-2004).
Elizabeth L. Schroeder (1966) Vice President since 2010
Ms. Schroeder currently serves as Assistant Vice President of HLIC. Ms. Schroeder joined HLIC in 1991. She is also an Assistant Vice President of HIFSCO and HL Advisers.
Martin Swanson (1962) Vice President since 2010
Mr. Swanson is a Vice President of HLIC. Mr. Swanson also serves as Vice President/Marketing for HIFSCO. Prior to joining HLIC in 1998, Mr. Swanson was a Vice President at PaineWebber, Inc.
Jane Wolak(1961) Vice President since 2009
Ms. Wolak currently serves as Senior Vice President of HLIC. Ms. Wolak joined HLIC as Vice President, Retail Product Services in May 2007. She is also Vice President of HASCO. Previously, Ms. Wolak was with Sun Life Financial where she held the position of Vice President, Service Center Operations from 2001-2007.
A description of the policies and procedures that the Fund uses to determine how to vote proxies relating to portfolio securities and a record of how the Fund voted any proxies for the twelve-month period ended June 30, 2011 are available (1) without charge, upon request, by calling 800-862-6668 and (2) on the SEC’s website at http://www.sec.gov.
The Fund files a complete schedule of portfolio holdings with the SEC for the first and third quarters of each fiscal year on Form N-Q. The Fund’s Forms are available (1) without charge, upon request, by calling 800-862-6668 and (2) on the SEC’s website at http://www.sec.gov. The Form N-Q may be reviewed and copied at the SEC’s Public Reference Room in Washington, DC. Information on the operation of the Public Reference Room may be obtained by calling 1-800-SEC-0330.
| Expense Example (Unaudited) |
Your Fund's Expenses
As a shareholder of the Fund, you incur two types of costs: (1) transaction costs and (2) ongoing costs including investment management fees, distribution fees, and other fund expenses. This example is intended to help you understand your ongoing costs (in dollars) of investing in a Fund and to compare these costs with the ongoing costs of investing in other mutual funds. The example is based on an investment of $1,000 invested at the beginning of the period and held for the period of December 31, 2010 through June 30, 2011.
Actual Expenses
The first set of columns of the table below provides information about actual account values and actual expenses. You may use the information in this column, together with the amount you invested, to estimate the expenses that you paid over the period. Simply divide your account value by $1,000 (for example, an $8,600 account value divided by $1,000 = 8.6), then multiply the result by the number in the line under the heading entitled “Expenses Paid During Period” to estimate the expenses you paid on your account during this period.
Hypothetical Example for Comparison Purposes
The second set of columns of the table below provides information about hypothetical account values and hypothetical expenses based on a Fund's actual expense ratio and an assumed rate of return of 5% per year before expenses, which is not the Fund's actual return. The hypothetical account values and expenses may not be used to estimate the actual ending account balance or expenses you paid for the period. You may use this information to compare the ongoing costs of investing in a Fund and other funds. To do so, compare this 5% hypothetical example with the 5% hypothetical examples that appear in the shareholder reports of the other funds.
Please note that the expenses shown in the table are meant to highlight your ongoing costs only and do not reflect any transactional costs, such as sales charges (loads) and CDSC. Therefore, the second set of columns of the table is useful in comparing ongoing costs only, and will not help you determine the relative total costs of owning different funds. In addition, if these transactional costs were included, your costs would be higher. Expenses are equal to the Fund's annualized expense ratios multiplied by average account value over the period, multiplied by 181/365 (to reflect the one-half year period).
| Actual return | Hypothetical (5% return before expenses) | |||||||||||||||||||||||||||||||||||
| Expenses paid | Expenses paid | Days in | ||||||||||||||||||||||||||||||||||
| during the period | during the period | the | Days | |||||||||||||||||||||||||||||||||
| Beginning | Ending | December 31, 2010 | Beginning | Ending | December 31, 2010 | Annualized | current | in the | ||||||||||||||||||||||||||||
| Account Value | Account Value | through | Account Value | Account Value | through | expense | 1/2 | full | ||||||||||||||||||||||||||||
| December 31, 2010 | June 30, 2011 | June 30, 2011 | December 31, 2010 | June 30, 2011 | June 30, 2011 | ratio | year | year | ||||||||||||||||||||||||||||
| Class IA | $ | 1,000.00 | $ | 1,054.53 | $ | 3.77 | $ | 1,000.00 | $ | 1,021.12 | $ | 3.71 | 0.74 | % | 181 | 365 | ||||||||||||||||||||
| Class IB | $ | 1,000.00 | $ | 1,053.23 | $ | 5.04 | $ | 1,000.00 | $ | 1,019.89 | $ | 4.96 | 0.99 | % | 181 | 365 | ||||||||||||||||||||
33
| The Hartford | |
| P.O. Box 5085 | |
| Hartford, CT 06102-5085 |
Hartford Series Fund, Inc. is underwritten and distributed by Hartford Securities Distribution Company, Inc.
“The Hartford” is The Hartford Financial Services Group, Inc. and its subsidiaries.
Hartford Series Fund, Inc. inception dates range from 1977 to date. Hartford Series Fund, Inc. is not a subsidiary of The Hartford but is underwritten, distributed by and advised by subsidiaries of The Hartford. Investments in Hartford Series Fund, Inc. are not guaranteed by The Hartford or any other entity.
You should carefully consider investment objectives, risks, and charges and expenses of Hartford HLS Funds before investing. This and other information can be found in the Fund’s prospectus or summary prospectus, which can be obtained by calling 800-862-6668. Please read them carefully before you invest or send money.
HLSSAR-HY11 8-11 | 106632 | Printed in U.S.A ©2011 The Hartford, Hartford, CT 06115 |

A MESSAGE FROM THE PRESIDENT

Dear Fellow Shareholders:
I want to take this opportunity to say thank you for your continued confidence and trust.
We have seen a significant amount of global turbulence in the first half of 2011. Investors have continued to be concerned about the implications of the European sovereign debt crisis, as well as our own high levels of domestic debt. Since January we have witnessed significant political uprisings in the already-volatile Middle East and North Africa region. In addition, the ramifications of Japan's massive earthquake, subsequent tsunami, and nuclear disaster are still being played out in the market.
Although corporate earnings have remained robust, the unemployment picture has been mixed. After adding more than 200,000 jobs from February to April, more recent unemployment reports have shown a pullback in hiring.
While official inflation remains low as measured by the Consumer Price Index (CPI), high oil prices may be indicative of higher inflation in the future. The federal funds rate remains at a historic low, however, the Fed could potentially raise the rate to get it closer to its historical average once the economy strengthens.
Even with these headwinds, domestic, international, and world indices (as measured by the S&P 500, MSCI EAFE and MSCI World) are all up more than 5% through June, 30 2011.
Looking ahead, continued growth in emerging markets is fueling global recovery efforts. Emerging markets comprise about 48 percent of the world’s GDP, and many economists believe they are poised for further expansion. As GDP growth continues in emerging markets, roughly 100 million people are added to the middle class each year. This middle class population growth could potentially drive a considerable shift in consumer purchasing power.
Now that we have reached the midpoint of 2011, perhaps now would be a good time to schedule a meeting with your financial adviser to examine your current investment strategy and determine whether you are on the right track.
· | Are you concerned about inflation and its effects on your portfolio? |
· | Is your portfolio prepared for rising interest rates? |
· | Does your portfolio reflect the global economy with a mix of developed nations and emerging markets? |
Your financial professional’s advice can help you to navigate today’s volatile markets with confidence. You can also rest assured that we will continue to provide you with solid investments and stellar service for the road ahead.
Thank you again for your business.

James Davey
President
Hartford HLS Funds
Hartford Index HLS Fund
Table of Contents
| Manager Discussion (Unaudited) | 2 |
| Financial Statements | |
| 4 | |
| 10 | |
| 11 | |
| 12 | |
| 13 | |
| 14 | |
| 22 | |
| 24 | |
| 26 | |
| 26 | |
| 27 |
This report is prepared for the general information of contract owners and qualified retirement plan participants. It is not an offer of contracts or of qualified retirement plans. It should not be used in connection with any offer, except in conjunction with the appropriate product prospectus which contains all pertinent information including the applicable sales, administrative and other charges.
The views expressed in the Fund’s Manager Discussion under “Why did the Fund perform this way?” and “What is the outlook?” are views of the Fund’s sub-adviser and portfolio management team through the end of the reporting period and are subject to change based on market and other conditions.
Hartford Index HLS Fund inception 05/01/1987 |
| (sub-advised by Hartford Investment Management Company) |
Investment objective – Seeks to provide investment results which approximate the price and yield performance of publicly traded common stocks in the aggregate. |
Performance Overview 6/30/01 - 6/30/11

The chart above shows the growth of a $10,000 investment in Class IA. Growth results in classes other than Class IA will vary from what is seen above due to differences in the expenses charged to those share classes.
Average Annual Total Returns (as of 6/30/11)
6 Month† | 1 Year | 5 year | 10 year | |||||||||
| Index IA | 5.87% | 30.30% | 2.68% | 2.37% | ||||||||
| Index IB | 5.74% | 29.98% | 2.42% | 2.12% | ||||||||
| S&P 500 Index | 6.01% | 30.68% | 2.94% | 2.72% |
| † | Not Annualized |
PAST PERFORMANCE IS NOT INDICATIVE OF FUTURE RESULTS.
Total returns presented above were calculated using the Fund's net asset value available to shareholders for sale or redemption of Fund shares on June 30, 2011, which excludes investment transactions as of this date.
S&P 500 Index is a market capitalization-weighted price index composed of 500 widely held common stocks.
You cannot invest directly in an index.
The chart represents a hypothetical investment in the Fund. Performance data represents past performance and current performance could be higher or lower.
Performance information may reflect historical or current expense waivers/reimbursements from the investment adviser, without which performance would have been lower. For information on current expense waivers/reimbursements, please see the prospectus.
The value of the fund will fluctuate so that when redeemed, it may be worth more or less than the original investment. The chart and table do not reflect the deductions of taxes, sales charges or other fees which may be applied at the variable life insurance, variable annuity or qualified retirement plan product level. Any such additional sales charges or other fees or expenses would lower the contract’s or plan’s performance.
Portfolio Manager |
| Deane Gyllenhaal |
| Vice President |
The Class IA shares of the Hartford Index HLS Fund returned 5.87% for the six-month period ended June 30, 2011, underperforming its benchmark, the S&P 500 Index, which returned 6.01%. The Fund outperformed the Lipper S&P 500 Index Funds VP-UF category, a group of funds with investment strategies similar to those of the Fund, which returned 5.82%.
Why did the Fund perform this way?
Year to date the Fund slightly underperformed the index. Much of the performance variance is attributable to day to day frictions within the Fund, such as investing cash flows and the impacts of having a cash allocation. Another factor that can contribute to the variance is due to the lack of Hartford Financial Services Group (HIG) exposure within the Fund. The Fund does not invest in HIG and therefore carries an index relative underweight (i.e. the Fund’s position was less than the benchmark position). This exposure is reallocated across the Life/Health Insurance and Property/Casualty Insurance and Multi-line Insurance industries.
The S&P 500 Index was up over 9.0% for the first four months of 2011, then lost over 2.7% in May and June resulting in a first half year to date return of 6.01%. All but one of the ten sectors within the index had positive returns during the first half of 2011, ended June 30, 2011. Health Care led the way up approximately 14%, followed by Energy and Industrials each gaining roughly 11% and 8%, respectively. Financials was the only sector group with a negative return, falling just over 3%. The best individual stock performers in the S&P 500 included National Semiconductor which rallied about 80%, followed by Cabot Oil & Gas, increasing just over 75%. The constituents that declined the most for the half year were AIG Group which fell approximately 39% and Monster Worldwide which declined by nearly 38%.
What is the outlook?
For the remainder of 2011, we expect global growth to remain positive, albeit below long-term averages. After showing improvement in the first quarter, U.S. economic growth has begun to show signs of weakness as the continuing European sovereign debt crisis and weakening growth within the emerging market nations are causing a slower than usual cyclical recovery. Inflation concerns have been driven by rising food and energy prices, while core inflation has remained relatively stable. Although we expect headline inflation to remain at elevated levels, weakness in the global economy has reduced certain commodity costs and core inflation remains in check.
The Fund will continue to be invested in the S&P 500 Index securities, with a focus on risk control and efficient trading. Performance of the Fund is expected to be similar to that of its benchmark.
Diversification by Industry
as of June 30, 2011
| Percentage of | ||||
| Industry (Sector) | Net Assets | |||
Automobiles & Components (Consumer Discretionary) | 0.8 | % | ||
| Banks (Financials) | 2.8 | |||
| Capital Goods (Industrials) | 8.9 | |||
| Commercial & Professional Services (Industrials) | 0.6 | |||
Consumer Durables & Apparel (Consumer Discretionary) | 1.0 | |||
| Consumer Services (Consumer Discretionary) | 2.0 | |||
| Diversified Financials (Financials) | 7.1 | |||
| Energy (Energy) | 13.0 | |||
| Food & Staples Retailing (Consumer Staples) | 2.4 | |||
| Food, Beverage & Tobacco (Consumer Staples) | 6.1 | |||
| Health Care Equipment & Services (Health Care) | 4.3 | |||
| Household & Personal Products (Consumer Staples) | 2.4 | |||
| Insurance (Financials) | 3.8 | |||
| Materials (Materials) | 3.7 | |||
| Media (Consumer Discretionary) | 3.4 | |||
Pharmaceuticals, Biotechnology & Life Sciences (Health Care) | 7.7 | |||
| Real Estate (Financials) | 1.8 | |||
| Retailing (Consumer Discretionary) | 3.7 | |||
Semiconductors & Semiconductor Equipment (Information Technology) | 2.5 | |||
| Software & Services (Information Technology) | 8.8 | |||
Technology Hardware & Equipment (Information Technology) | 6.9 | |||
| Telecommunication Services (Services) | 3.2 | |||
| Transportation (Industrials) | 2.1 | |||
| Utilities (Utilities) | 3.5 | |||
| Short-Term Investments | 1.0 | |||
| Other Assets and Liabilities | (3.5 | ) | ||
| Total | 100.0 | % | ||
| Schedule of Investments |
| June 30, 2011 (Unaudited) |
| (000’s Omitted) |
| Shares or Principal Amount | Market Value ╪ | ||||||
| COMMON STOCKS - 102.5% | |||||||
| Automobiles & Components - 0.8% | |||||||
| 321 | Ford Motor Co. ● | $ | 4,427 | ||||
| 21 | Goodyear Tire & Rubber Co. ● | 346 | |||||
| 20 | Harley-Davidson, Inc. | 819 | |||||
| 57 | Johnson Controls, Inc. | 2,388 | |||||
| 7,980 | |||||||
| Banks - 2.8% | |||||||
| 59 | BB&T Corp. | 1,581 | |||||
| 15 | Comerica, Inc. | 517 | |||||
| 78 | Fifth Third Bankcorp | 989 | |||||
| 22 | First Horizon National Corp. | 212 | |||||
| 45 | Hudson City Bancorp, Inc. | 365 | |||||
| 73 | Huntington Bancshares, Inc. | 479 | |||||
| 80 | Keycorp | 669 | |||||
| 11 | M&T Bank Corp. | 934 | |||||
| 45 | Marshall & Ilsley Corp. | 357 | |||||
| 32 | People's United Financial, Inc. | 429 | |||||
| 45 | PNC Financial Services Group, Inc. | 2,653 | |||||
| 106 | Regions Financial Corp. | 658 | |||||
| 45 | SunTrust Banks, Inc. | 1,172 | |||||
| 163 | US Bancorp | 4,155 | |||||
| 447 | Wells Fargo & Co. | 12,543 | |||||
| 16 | Zion Bancorp | 373 | |||||
| 28,086 | |||||||
| Capital Goods - 8.9% | |||||||
| 60 | 3M Co. | 5,693 | |||||
| 62 | Boeing Co. | 4,616 | |||||
| 54 | Caterpillar, Inc. | 5,795 | |||||
| 17 | Cummins, Inc. | 1,715 | |||||
| 46 | Danaher Corp. | 2,438 | |||||
| 35 | Deere & Co. | 2,925 | |||||
| 16 | Dover Corp. | 1,072 | |||||
| 29 | Eaton Corp. | 1,483 | |||||
| 64 | Emerson Electric Co. | 3,576 | |||||
| 25 | Fastenal Co. | 897 | |||||
| 5 | Flowserve Corp. | 522 | |||||
| 15 | Fluor Corp. | 954 | |||||
| 31 | General Dynamics Corp. | 2,339 | |||||
| 896 | General Electric Co. | 16,905 | |||||
| 11 | Goodrich Corp. | 1,007 | |||||
| 66 | Honeywell International, Inc. | 3,963 | |||||
| 42 | Illinois Tool Works, Inc. | 2,387 | |||||
| 28 | Ingersoll-Rand plc | 1,269 | |||||
| 16 | ITT Corp. | 919 | |||||
| 11 | Jacobs Engineering Group, Inc. ● | 462 | |||||
| 9 | Joy Global, Inc. | 848 | |||||
| 9 | L-3 Communications Holdings, Inc. | 787 | |||||
| 24 | Lockheed Martin Corp. | 1,949 | |||||
| 30 | Masco Corp. | 364 | |||||
| 25 | Northrop Grumman Corp. | 1,716 | |||||
| 31 | PACCAR, Inc. | 1,578 | |||||
| 10 | Pall Corp. | 549 | |||||
| 14 | Parker-Hannifin Corp. | 1,228 | |||||
| 12 | Precision Castparts Corp. | 2,009 | |||||
| 18 | Quanta Services, Inc. ● | 368 | |||||
| 30 | Raytheon Co. | 1,499 | |||||
| 12 | Rockwell Automation, Inc. | 1,058 | |||||
| 13 | Rockwell Collins, Inc. | 802 | |||||
| 8 | Roper Industries, Inc. | 679 | |||||
| 5 | Snap-On, Inc. | 309 | |||||
| 14 | Stanley Black & Decker, Inc. | 1,021 | |||||
| 23 | Textron, Inc. | 551 | |||||
| 40 | Tyco International Ltd. | 1,957 | |||||
| 77 | United Technologies Corp. | 6,847 | |||||
| 5 | W.W. Grainger, Inc. | 753 | |||||
| 87,809 | |||||||
| Commercial & Professional Services - 0.6% | |||||||
| 9 | Avery Dennison Corp. | 343 | |||||
| 11 | Cintas Corp. | 353 | |||||
| 4 | Dun & Bradstreet Corp. | 315 | |||||
| 10 | Equifax, Inc. ● | 360 | |||||
| 17 | Iron Mountain, Inc. | 577 | |||||
| 17 | Pitney Bowes, Inc. | 396 | |||||
| 16 | R.R. Donnelley & Sons Co. | 312 | |||||
| 26 | Republic Services, Inc. | 790 | |||||
| 12 | Robert Half International, Inc. | 336 | |||||
| 7 | Stericycle, Inc. ● | 643 | |||||
| 40 | Waste Management, Inc. | 1,494 | |||||
| 5,919 | |||||||
| Consumer Durables & Apparel - 1.0% | |||||||
| 25 | Coach, Inc. | 1,586 | |||||
| 24 | D.R. Horton, Inc. | 274 | |||||
| 13 | Fortune Brands, Inc. | 832 | |||||
| 6 | Harman International Industries, Inc. | 271 | |||||
| 12 | Hasbro, Inc. | 507 | |||||
| 12 | Leggett & Platt, Inc. | 293 | |||||
| 14 | Lennar Corp. | 246 | |||||
| 29 | Mattel, Inc. | 806 | |||||
| 25 | Newell Rubbermaid, Inc. | 388 | |||||
| 32 | NIKE, Inc. Class B | 2,888 | |||||
| 5 | Polo Ralph Lauren Corp. | 715 | |||||
| 28 | Pulte Group, Inc. ● | 218 | |||||
| 7 | V.F. Corp. | 805 | |||||
| 6 | Whirlpool Corp. | 523 | |||||
| 10,352 | |||||||
| Consumer Services - 2.0% | |||||||
| 10 | Apollo Group, Inc. Class A ● | 450 | |||||
| 36 | Carnival Corp. | 1,372 | |||||
| 3 | Chipotle Mexican Grill, Inc. ● | 817 | |||||
| 12 | Darden Restaurants, Inc. | 573 | |||||
| 5 | DeVry, Inc. | 304 | |||||
| 26 | H & R Block, Inc. | 413 | |||||
| 25 | International Game Technology | 445 | |||||
| 24 | Marriott International, Inc. Class A | 851 | |||||
| 88 | McDonald's Corp. | 7,395 | |||||
| 63 | Starbucks Corp. | 2,503 | |||||
| 17 | Starwood Hotels & Resorts | 925 | |||||
| 14 | Wyndham Worldwide Corp. | 483 | |||||
| 6 | Wynn Resorts Ltd. | 919 | |||||
| 39 | Yum! Brands, Inc. | 2,174 | |||||
| 19,624 | |||||||
| Diversified Financials - 7.1% | |||||||
| 88 | American Express Co. | 4,570 | |||||
| 20 | Ameriprise Financial, Inc. | 1,178 | |||||
| 856 | Bank of America Corp. | 9,386 | |||||
| 105 | Bank of New York Mellon Corp. | 2,688 | |||||
| 8 | BlackRock, Inc. | 1,554 | |||||
| 39 | Capital One Financial Corp. | 2,004 | |||||
| 85 | Charles Schwab Corp. | 1,393 | |||||
The accompanying notes are an integral part of these financial statements.
| Shares or Principal Amount | Market Value ╪ | ||||||
| COMMON STOCKS - 102.5% - (continued) | |||||||
| Diversified Financials - 7.1% - (continued) | |||||||
| 247 | Citigroup, Inc. | $ | 10,280 | ||||
| 6 | CME Group, Inc. | 1,651 | |||||
| 46 | Discover Financial Services, Inc. | 1,233 | |||||
| 21 | E*Trade Financial Corp. ● | 293 | |||||
| 8 | Federated Investors, Inc. | 188 | |||||
| 12 | Franklin Resources, Inc. | 1,602 | |||||
| 44 | Goldman Sachs Group, Inc. | 5,830 | |||||
| 6 | IntercontinentalExchange, Inc. ● | 773 | |||||
| 39 | Invesco Ltd. | 913 | |||||
| 16 | Janus Capital Group, Inc. | 149 | |||||
| 336 | JP Morgan Chase & Co. | 13,750 | |||||
| 13 | Legg Mason, Inc. | 411 | |||||
| 17 | Leucadia National Corp. | 571 | |||||
| 17 | Moody's Corp. | 643 | |||||
| 131 | Morgan Stanley | 3,003 | |||||
| 13 | Nasdaq OMX Group, Inc. ● | 322 | |||||
| 20 | Northern Trust Corp. | 939 | |||||
| 22 | NYSE Euronext | 759 | |||||
| 45 | SLM Corp. | 750 | |||||
| 43 | State Street Corp. | 1,920 | |||||
| 22 | T. Rowe Price Group, Inc. | 1,322 | |||||
| 70,075 | |||||||
| Energy - 13.0% | |||||||
| 19 | Alpha Natural Resources, Inc. ● | 869 | |||||
| 42 | Anadarko Petroleum Corp. | 3,231 | |||||
| 32 | Apache Corp. | 3,999 | |||||
| 37 | Baker Hughes, Inc. | 2,669 | |||||
| 9 | Cabot Oil & Gas Corp. | 587 | |||||
| 21 | Cameron International Corp. ● | 1,041 | |||||
| 56 | Chesapeake Energy Corp. | 1,651 | |||||
| 170 | Chevron Corp. | 17,477 | |||||
| 119 | ConocoPhillips Holding Co. | 8,982 | |||||
| 19 | Consol Energy, Inc. | 930 | |||||
| 34 | Denbury Resources, Inc. ● | 671 | |||||
| 36 | Devon Energy Corp. | 2,814 | |||||
| 6 | Diamond Offshore Drilling, Inc. | 411 | |||||
| 65 | El Paso Corp. | 1,313 | |||||
| 23 | EOG Resources, Inc. | 2,368 | |||||
| 13 | EQT Corp. | 661 | |||||
| 416 | Exxon Mobil Corp. | 33,882 | |||||
| 20 | FMC Technologies, Inc. ● | 909 | |||||
| 77 | Halliburton Co. | 3,944 | |||||
| 9 | Helmerich & Payne, Inc. | 598 | |||||
| 26 | Hess Corp. | 1,908 | |||||
| 60 | Marathon Oil Corp. | 3,169 | |||||
| 16 | Murphy Oil Corp. | 1,075 | |||||
| 24 | Nabors Industries Ltd. ● | 599 | |||||
| 36 | National Oilwell Varco, Inc. | 2,793 | |||||
| 11 | Newfield Exploration Co. ● | 762 | |||||
| 21 | Noble Corp. | 841 | |||||
| 15 | Noble Energy, Inc. | 1,341 | |||||
| 69 | Occidental Petroleum Corp. | 7,146 | |||||
| 23 | Peabody Energy Corp. | 1,350 | |||||
| 10 | Pioneer Natural Resources Co. | 883 | |||||
| 15 | QEP Resources, Inc. | 625 | |||||
| 14 | Range Resources Corp. | 753 | |||||
| 11 | Rowan Companies, Inc. ● | 419 | |||||
| 115 | Schlumberger Ltd. | 9,912 | |||||
| 29 | Southwestern Energy Co. ● | 1,262 | |||||
| 55 | Spectra Energy Corp. | 1,505 | |||||
| 10 | Sunoco, Inc. | 429 | |||||
| 12 | Tesoro Corp. ● | 278 | |||||
| 48 | Valero Energy Corp. | 1,232 | |||||
| 50 | Williams Cos., Inc. | 1,503 | |||||
| 128,792 | |||||||
| Food & Staples Retailing - 2.4% | |||||||
| 37 | Costco Wholesale Corp. | 2,999 | |||||
| 115 | CVS/Caremark Corp. | 4,307 | |||||
| 51 | Kroger Co. | 1,271 | |||||
| 30 | Safeway, Inc. | 700 | |||||
| 18 | Supervalu, Inc. | 168 | |||||
| 49 | Sysco Corp. | 1,536 | |||||
| 77 | Walgreen Co. | 3,287 | |||||
| 161 | Wal-Mart Stores, Inc. | 8,577 | |||||
| 13 | Whole Foods Market, Inc. | 801 | |||||
| 23,646 | |||||||
| Food, Beverage & Tobacco - 6.1% | |||||||
| 177 | Altria Group, Inc. | 4,673 | |||||
| 58 | Archer Daniels Midland Co. | 1,738 | |||||
| 9 | Brown-Forman Corp. | 654 | |||||
| 15 | Campbell Soup Co. | 535 | |||||
| 194 | Coca-Cola Co. | 13,022 | |||||
| 28 | Coca-Cola Enterprises, Inc. | 803 | |||||
| 35 | ConAgra Foods, Inc. | 893 | |||||
| 15 | Constellation Brands, Inc. Class A ● | 315 | |||||
| 16 | Dean Foods Co. ● | 191 | |||||
| 19 | Dr. Pepper Snapple Group | 784 | |||||
| 54 | General Mills, Inc. | 2,010 | |||||
| 27 | H.J. Heinz Co. | 1,449 | |||||
| 13 | Hershey Co. | 736 | |||||
| 12 | Hormel Foods Corp. | 350 | |||||
| 10 | J.M. Smucker Co. | 747 | |||||
| 21 | Kellogg Co. | 1,169 | |||||
| 149 | Kraft Foods, Inc. | 5,235 | |||||
| 12 | Lorillard, Inc. | 1,325 | |||||
| 11 | McCormick & Co., Inc. | 553 | |||||
| 17 | Mead Johnson Nutrition Co. | 1,169 | |||||
| 13 | Molson Coors Brewing Co. | 600 | |||||
| 134 | PepsiCo, Inc. | 9,408 | |||||
| 150 | Philip Morris International, Inc. | 10,035 | |||||
| 29 | Reynolds American, Inc. | 1,059 | |||||
| 49 | Sara Lee Corp. | 938 | |||||
| 25 | Tyson Foods, Inc. Class A | 491 | |||||
| 60,882 | |||||||
| Health Care Equipment & Services - 4.3% | |||||||
| 32 | Aetna, Inc. | 1,412 | |||||
| 23 | Amerisource Bergen Corp. | 958 | |||||
| 7 | Bard (C.R.), Inc. | 791 | |||||
| 48 | Baxter International, Inc. | 2,875 | |||||
| 19 | Becton, Dickinson & Co. | 1,597 | |||||
| 129 | Boston Scientific Corp. ● | 893 | |||||
| 30 | Cardinal Health, Inc. | 1,346 | |||||
| 19 | CareFusion Corp. ● | 514 | |||||
| 12 | Cerner Corp. ● | 752 | |||||
| 23 | CIGNA Corp. | 1,177 | |||||
| 13 | Coventry Health Care, Inc. ● | 457 | |||||
| 42 | Covidien plc | 2,228 | |||||
| 8 | DaVita, Inc. ● | 702 | |||||
| 12 | Dentsply International, Inc. | 451 | |||||
The accompanying notes are an integral part of these financial statements.
| Hartford Index HLS Fund |
| Schedule of Investments – (continued) |
| June 30, 2011 (Unaudited) |
| (000’s Omitted) |
| Shares or Principal Amount | Market Value ╪ | ||||||
| COMMON STOCKS - 102.5% - (continued) | |||||||
| Health Care Equipment & Services - 4.3% - (continued) | |||||||
| 10 | Edwards Lifesciences Corp. ● | $ | 841 | ||||
| 45 | Express Scripts, Inc. ● | 2,416 | |||||
| 14 | Humana, Inc. | 1,149 | |||||
| 3 | Intuitive Surgical, Inc. ● | 1,232 | |||||
| 8 | Laboratory Corp. of America Holdings ● | 821 | |||||
| 21 | McKesson Corp. | 1,779 | |||||
| 34 | Medco Health Solutions, Inc. ● | 1,908 | |||||
| 90 | Medtronic, Inc. | 3,483 | |||||
| 8 | Patterson Cos., Inc. | 267 | |||||
| 13 | Quest Diagnostics, Inc. | 789 | |||||
| 28 | St. Jude Medical, Inc. | 1,326 | |||||
| 28 | Stryker Corp. | 1,653 | |||||
| 41 | Tenet Healthcare Corp. ● | 258 | |||||
| 92 | UnitedHealth Group, Inc. | 4,721 | |||||
| 10 | Varian Medical Systems, Inc. ● | 695 | |||||
| 31 | Wellpoint, Inc. | 2,441 | |||||
| 16 | Zimmer Holdings, Inc. ● | 1,024 | |||||
| 42,956 | |||||||
| Household & Personal Products - 2.4% | |||||||
| 36 | Avon Products, Inc. | 1,019 | |||||
| 11 | Clorox Co. | 759 | |||||
| 41 | Colgate-Palmolive Co. | 3,614 | |||||
| 10 | Estee Lauder Co., Inc. | 1,010 | |||||
| 33 | Kimberly-Clark Corp. | 2,207 | |||||
| 236 | Procter & Gamble Co. | 14,996 | |||||
| 23,605 | |||||||
| Insurance - 3.8% | |||||||
| 29 | ACE Ltd. | 1,909 | |||||
| 41 | Aflac, Inc. | 1,933 | |||||
| 45 | Allstate Corp. | 1,375 | |||||
| 38 | American International Group, Inc. ● | 1,100 | |||||
| 28 | AON Corp. | 1,431 | |||||
| 8 | Assurant, Inc. | 300 | |||||
| 149 | Berkshire Hathaway, Inc. Class B ● | 11,531 | |||||
| 25 | Chubb Corp. | 1,576 | |||||
| 14 | Cincinnati Financial Corp. | 410 | |||||
| 42 | Genworth Financial, Inc. ● | 434 | |||||
| 28 | Lincoln National Corp. | 792 | |||||
| 27 | Loews Corp. | 1,125 | |||||
| 46 | Marsh & McLennan Cos., Inc. | 1,445 | |||||
| 94 | MetLife, Inc. | 4,111 | |||||
| 28 | Principal Financial Group, Inc. | 865 | |||||
| 56 | Progressive Corp. | 1,203 | |||||
| 43 | Prudential Financial, Inc. | 2,751 | |||||
| 7 | Torchmark Corp. | 434 | |||||
| 36 | Travelers Cos., Inc. | 2,106 | |||||
| 27 | Unum Group | 696 | |||||
| 27 | XL Group plc | 586 | |||||
| 38,113 | |||||||
| Materials - 3.7% | |||||||
| 18 | Air Products and Chemicals, Inc. | 1,713 | |||||
| 6 | Airgas, Inc. | 413 | |||||
| 9 | AK Steel Holding Corp. | 147 | |||||
| 90 | Alcoa, Inc. | 1,427 | |||||
| 9 | Allegheny Technologies, Inc. | 570 | |||||
| 14 | Ball Corp. | 547 | |||||
| 9 | Bemis Co., Inc. | 301 | |||||
| 6 | CF Industries Holdings, Inc. | 854 | |||||
| 12 | Cliff's Natural Resources, Inc. | 1,127 | |||||
| 99 | Dow Chemical Co. | 3,579 | |||||
| 78 | E.I. DuPont de Nemours & Co. | 4,241 | |||||
| 6 | Eastman Chemical Co. | 618 | |||||
| 20 | Ecolab, Inc. | 1,106 | |||||
| 6 | FMC Corp. | 519 | |||||
| 80 | Freeport-McMoRan Copper & Gold, Inc. | 4,234 | |||||
| 7 | International Flavors & Fragrances, Inc. | 436 | |||||
| 37 | International Paper Co. | 1,101 | |||||
| 14 | MeadWestvaco Corp. | 478 | |||||
| 45 | Monsanto Co. | 3,286 | |||||
| 42 | Newmont Mining Corp. | 2,250 | |||||
| 27 | Nucor Corp. | 1,100 | |||||
| 14 | Owens-Illinois, Inc. ● | 358 | |||||
| 13 | PPG Industries, Inc. | 1,212 | |||||
| 26 | Praxair, Inc. | 2,784 | |||||
| 14 | Sealed Air Corp. | 322 | |||||
| 7 | Sherwin-Williams Co. | 624 | |||||
| 10 | Sigma-Aldrich Corp. | 758 | |||||
| 8 | Titanium Metals Corp. | 139 | |||||
| 12 | United States Steel Corp. | 562 | |||||
| 11 | Vulcan Materials Co. | 420 | |||||
| 37,226 | |||||||
| Media - 3.4% | |||||||
| 19 | Cablevision Systems Corp. | 704 | |||||
| 56 | CBS Corp. Class B | 1,609 | |||||
| 234 | Comcast Corp. Class A | 5,924 | |||||
| 65 | DirecTV Class A ● | 3,295 | |||||
| 24 | Discovery Communications, Inc. ● | 963 | |||||
| 20 | Gannett Co., Inc. | 290 | |||||
| 41 | Interpublic Group of Cos., Inc. | 517 | |||||
| 26 | McGraw-Hill Cos., Inc. | 1,079 | |||||
| 193 | News Corp. Class A | 3,419 | |||||
| 24 | Omnicom Group, Inc. | 1,142 | |||||
| 8 | Scripps Networks Interactive Class A | 375 | |||||
| 28 | Time Warner Cable, Inc. | 2,220 | |||||
| 91 | Time Warner, Inc. | 3,293 | |||||
| 49 | Viacom, Inc. Class B | 2,520 | |||||
| 160 | Walt Disney Co. | 6,237 | |||||
| – | Washington Post Co. Class B | 189 | |||||
| 33,776 | |||||||
| Pharmaceuticals, Biotechnology & Life Sciences - 7.7% | |||||||
| 131 | Abbott Laboratories | 6,915 | |||||
| 29 | Agilent Technologies, Inc. ● | 1,502 | |||||
| 26 | Allergan, Inc. | 2,147 | |||||
| 79 | Amgen, Inc. ● | 4,587 | |||||
| 20 | Biogen Idec, Inc. ● | 2,186 | |||||
| 144 | Bristol-Myers Squibb Co. | 4,175 | |||||
| 39 | Celgene Corp. ● | 2,359 | |||||
| 7 | Cephalon, Inc. ● | 519 | |||||
| 86 | Eli Lilly & Co. | 3,231 | |||||
| 24 | Forest Laboratories, Inc. ● | 951 | |||||
| 66 | Gilead Sciences, Inc. ● | 2,753 | |||||
| 14 | Hospira, Inc. ● | 805 | |||||
| 232 | Johnson & Johnson | 15,411 | |||||
| 15 | Life Technologies Corp. ● | 789 | |||||
| 261 | Merck & Co., Inc. | 9,205 | |||||
| 37 | Mylan, Inc. ● | 916 | |||||
| 10 | PerkinElmer, Inc. | 257 | |||||
| 668 | Pfizer, Inc. | 13,756 | |||||
| 32 | Thermo Fisher Scientific, Inc. ● | 2,084 | |||||
| 8 | Waters Corp. ● | 742 | |||||
The accompanying notes are an integral part of these financial statements.
| Shares or Principal Amount | Market Value ╪ | ||||||
| COMMON STOCKS - 102.5% - (continued) | |||||||
| Pharmaceuticals, Biotechnology & Life Sciences - 7.7% - | |||||||
| (continued) | |||||||
| 11 | Watson Pharmaceuticals, Inc. ● | $ | 732 | ||||
| 76,022 | |||||||
| Real Estate - 1.8% | |||||||
| 10 | Apartment Investment & Management Co. | 257 | |||||
| 7 | Avalonbay Communities, Inc. | 950 | |||||
| 12 | Boston Properties, Inc. | 1,309 | |||||
| 25 | CB Richard Ellis Group, Inc. Class A ● | 621 | |||||
| 25 | Equity Residential Properties Trust | 1,497 | |||||
| 34 | HCP, Inc. | 1,261 | |||||
| 15 | Health Care, Inc. | 782 | |||||
| 58 | Host Hotels & Resorts, Inc. | 983 | |||||
| 34 | Kimco Realty Corp. | 640 | |||||
| 14 | Plum Creek Timber Co., Inc. | 554 | |||||
| 38 | ProLogis, Inc. | 1,376 | |||||
| 12 | Public Storage | 1,343 | |||||
| 25 | Simon Property Group, Inc. | 2,876 | |||||
| 14 | Ventas, Inc. | 727 | |||||
| 14 | Vornado Realty Trust | 1,294 | |||||
| 46 | Weyerhaeuser Co. | 995 | |||||
| 17,465 | |||||||
| Retailing - 3.7% | |||||||
| 7 | Abercrombie & Fitch Co. Class A | 494 | |||||
| 30 | Amazon.com, Inc. ● | 6,166 | |||||
| 5 | AutoNation, Inc. ● | 196 | |||||
| 2 | AutoZone, Inc. ● | 639 | |||||
| 21 | Bed Bath & Beyond, Inc. ● | 1,228 | |||||
| 27 | Best Buy Co., Inc. | 855 | |||||
| 6 | Big Lots, Inc. ● | 211 | |||||
| 19 | CarMax, Inc. ● | 632 | |||||
| 17 | Expedia, Inc. | 490 | |||||
| 10 | Family Dollar Stores, Inc. | 546 | |||||
| 12 | GameStop Corp. Class A ● | 320 | |||||
| 33 | Gap, Inc. | 598 | |||||
| 13 | Genuine Parts Co. | 725 | |||||
| 135 | Home Depot, Inc. | 4,876 | |||||
| 18 | J.C. Penney Co., Inc. | 622 | |||||
| 24 | Kohl's Corp. | 1,188 | |||||
| 21 | Limited Brands, Inc. | 819 | |||||
| 110 | Lowe's Co., Inc. | 2,565 | |||||
| 36 | Macy's, Inc. | 1,055 | |||||
| 4 | Netflix, Inc. ● | 959 | |||||
| 14 | Nordstrom, Inc. | 666 | |||||
| 12 | O'Reilly Automotive, Inc. ● | 764 | |||||
| 4 | Priceline.com, Inc. ● | 2,145 | |||||
| 10 | Ross Stores, Inc. | 796 | |||||
| 4 | Sears Holdings Corp. ● | 258 | |||||
| 60 | Staples, Inc. | 952 | |||||
| 58 | Target Corp. | 2,731 | |||||
| 11 | Tiffany & Co. | 846 | |||||
| 33 | TJX Cos., Inc. | 1,714 | |||||
| 11 | Urban Outfitters, Inc. ● | 296 | |||||
| 36,352 | |||||||
| Semiconductors & Semiconductor Equipment - 2.5% | |||||||
| 49 | Advanced Micro Devices, Inc. ● | 342 | |||||
| 27 | Altera Corp. | 1,263 | |||||
| 25 | Analog Devices, Inc. | 993 | |||||
| 111 | Applied Materials, Inc. | 1,449 | |||||
| 40 | Broadcom Corp. Class A | 1,357 | |||||
| 5 | First Solar, Inc. ● | 602 | |||||
| 448 | Intel Corp. | 9,930 | |||||
| 14 | KLA-Tencor Corp. | 576 | |||||
| 19 | Linear Technology Corp. | 635 | |||||
| 51 | LSI Corp. ● | 364 | |||||
| 19 | MEMC Electronic Materials, Inc. ● | 166 | |||||
| 16 | Microchip Technology, Inc. | 610 | |||||
| 73 | Micron Technology, Inc. ● | 545 | |||||
| 20 | National Semiconductor Corp. | 501 | |||||
| 8 | Novellus Systems, Inc. ● | 272 | |||||
| 51 | NVIDIA Corp. ● | 809 | |||||
| 16 | Teradyne, Inc. ● | 233 | |||||
| 98 | Texas Instruments, Inc. | 3,223 | |||||
| 22 | Xilinx, Inc. | 817 | |||||
| 24,687 | |||||||
| Software & Services - 8.8% | |||||||
| 43 | Adobe Systems, Inc. ● | 1,341 | |||||
| 16 | Akamai Technologies, Inc. ● | 497 | |||||
| 20 | Autodesk, Inc. ● | 753 | |||||
| 42 | Automatic Data Processing, Inc. | 2,222 | |||||
| 15 | BMC Software, Inc. ● | 816 | |||||
| 32 | CA, Inc. | 733 | |||||
| 16 | Citrix Systems, Inc. ● | 1,270 | |||||
| 26 | Cognizant Technology Solutions Corp. ● | 1,889 | |||||
| 13 | Computer Sciences Corp. | 497 | |||||
| 18 | Compuware Corp. ● | 180 | |||||
| 97 | eBay, Inc. ● | 3,116 | |||||
| 28 | Electronic Arts, Inc. ● | 662 | |||||
| 23 | Fidelity National Information Services, Inc. | 701 | |||||
| 12 | Fiserv, Inc. ● | 757 | |||||
| 21 | Google, Inc. ● | 10,741 | |||||
| 102 | IBM Corp. | 17,566 | |||||
| 23 | Intuit, Inc. ● | 1,198 | |||||
| 8 | Mastercard, Inc. | 2,408 | |||||
| 627 | Microsoft Corp. | 16,307 | |||||
| 11 | Monster Worldwide, Inc. ● | 160 | |||||
| 329 | Oracle Corp. | 10,839 | |||||
| 27 | Paychex, Inc. | 836 | |||||
| 16 | Red Hat, Inc. ● | 748 | |||||
| 24 | SAIC, Inc. ● | 397 | |||||
| 10 | Salesforce.com, Inc. ● | 1,512 | |||||
| 64 | Symantec Corp. ● | 1,260 | |||||
| 14 | Teradata Corp. ● | 857 | |||||
| 14 | Total System Services, Inc. | 253 | |||||
| 14 | VeriSign, Inc. | 475 | |||||
| 40 | Visa, Inc. | 3,410 | |||||
| 53 | Western Union Co. | 1,071 | |||||
| 110 | Yahoo!, Inc. ● | 1,656 | |||||
| 87,128 | |||||||
| Technology Hardware & Equipment - 6.9% | |||||||
| 15 | Amphenol Corp. Class A | 804 | |||||
| 78 | Apple, Inc. ● | 26,239 | |||||
| 465 | Cisco Systems, Inc. | 7,257 | |||||
| 133 | Corning, Inc. | 2,408 | |||||
| 139 | Dell, Inc. ● | 2,313 | |||||
| 174 | EMC Corp. ● | 4,792 | |||||
| 7 | F5 Networks, Inc. ● | 761 | |||||
| 13 | FLIR Systems, Inc. | 455 | |||||
| 11 | Harris Corp. | 483 | |||||
The accompanying notes are an integral part of these financial statements.
| Hartford Index HLS Fund |
| Schedule of Investments – (continued) |
| June 30, 2011 (Unaudited) |
| (000’s Omitted) |
| Shares or Principal Amount | Market Value ╪ | ||||||
| COMMON STOCKS - 102.5% - (continued) | |||||||
| Technology Hardware & Equipment - 6.9% - (continued) | |||||||
| 175 | Hewlett-Packard Co. | $ | 6,383 | ||||
| 17 | Jabil Circuit, Inc. | 336 | |||||
| 19 | JDS Uniphase Corp. ● | 320 | |||||
| 45 | Juniper Networks, Inc. ● | 1,418 | |||||
| 7 | Lexmark International, Inc. ADR ● | 194 | |||||
| 12 | Molex, Inc. | 302 | |||||
| 25 | Motorola Mobility Holdings, Inc. ● | 550 | |||||
| 29 | Motorola Solutions, Inc. ● | 1,320 | |||||
| 31 | NetApp, Inc. ● | 1,642 | |||||
| 141 | Qualcomm, Inc. | 8,011 | |||||
| 20 | SanDisk Corp. ● | 837 | |||||
| 31 | Tellabs, Inc. | 142 | |||||
| 20 | Western Digital Corp. ● | 716 | |||||
| 118 | Xerox Corp. | 1,232 | |||||
| 68,915 | |||||||
| Telecommunication Services - 3.2% | |||||||
| 33 | American Tower Corp. Class A ● | 1,752 | |||||
| 501 | AT&T, Inc. | 15,722 | |||||
| 51 | CenturyLink, Inc. | 2,053 | |||||
| 84 | Frontier Communications Corp. | 679 | |||||
| 22 | MetroPCS Communications, Inc. ● | 386 | |||||
| 253 | Sprint Nextel Corp. ● | 1,362 | |||||
| 239 | Verizon Communications, Inc. | 8,901 | |||||
| 43 | Windstream Corp. | 558 | |||||
| 31,413 | |||||||
| Transportation - 2.1% | |||||||
| 14 | C.H. Robinson Worldwide, Inc. | 1,086 | |||||
| 93 | CSX Corp. | 2,444 | |||||
| 18 | Expeditors International of Washington, Inc.. | 920 | |||||
| 27 | FedEx Corp. | 2,532 | |||||
| 30 | Norfolk Southern Corp. | 2,240 | |||||
| 4 | Ryder System, Inc. | 247 | |||||
| 67 | Southwest Airlines Co. | 764 | |||||
| 41 | Union Pacific Corp. | 4,329 | |||||
| 83 | United Parcel Service, Inc. Class B | 6,078 | |||||
| 20,640 | |||||||
| Utilities - 3.5% | |||||||
| 55 | AES Corp. ● | 707 | |||||
| 20 | Ameren Corp. | 587 | |||||
| 41 | American Electric Power Co., Inc. | 1,534 | |||||
| 36 | CenterPoint Energy, Inc. | 696 | |||||
| 21 | CMS Energy Corp. | 420 | |||||
| 25 | Consolidated Edison, Inc. | 1,315 | |||||
| 17 | Constellation Energy Group, Inc. | 645 | |||||
| 49 | Dominion Resources, Inc. | 2,348 | |||||
| 14 | DTE Energy Co. | 716 | |||||
| 113 | Duke Energy Corp. | 2,119 | |||||
| 28 | Edison International | 1,067 | |||||
| 15 | Entergy Corp. | 1,030 | |||||
| 56 | Exelon Corp. | 2,398 | |||||
| 35 | FirstEnergy Corp. | 1,562 | |||||
| 7 | Integrys Energy Group, Inc. | 342 | |||||
| 36 | NextEra Energy, Inc. | 2,047 | |||||
| 4 | Nicor, Inc. | 211 | |||||
| 24 | NiSource, Inc. | 479 | |||||
| 15 | Northeast Utilities | 526 | |||||
| 20 | NRG Energy, Inc. ● | 500 | |||||
| 9 | Oneok, Inc. | 667 | |||||
| 19 | Pepco Holdings, Inc. | 375 | |||||
| 34 | PG&E Corp. | 1,414 | |||||
| 9 | Pinnacle West Capital Corp. | 412 | |||||
| 49 | PPL Corp. | 1,356 | |||||
| 25 | Progress Energy, Inc. | 1,193 | |||||
| 43 | Public Service Enterprise Group, Inc. | 1,395 | |||||
| 10 | SCANA Corp. | 381 | |||||
| 20 | Sempra Energy | 1,070 | |||||
| 72 | Southern Co. | 2,898 | |||||
| 18 | TECO Energy, Inc. | 343 | |||||
| 20 | Wisconsin Energy Corp. | 619 | |||||
| 41 | Xcel Energy, Inc. | 993 | |||||
| 34,365 | |||||||
| Total common stocks | |||||||
(cost $882,090) | $ | 1,015,828 | |||||
| Total long-term investments | |||||||
(cost $882,090) | $ | 1,015,828 | |||||
| SHORT-TERM INVESTMENTS - 1.0% | |||||||||
| Repurchase Agreements - 0.9% | |||||||||
| BNP Paribas Securities Corp. TriParty Joint | |||||||||
| Repurchase Agreement (maturing on | |||||||||
| 07/01/2011 in the amount of $2,061, | |||||||||
| collateralized by U.S. Treasury Bond | |||||||||
| 5.25%, 2029, value of $2,102) | |||||||||
| $ | 2,061 | 0.01%, 06/30/2011 | $ | 2,061 | |||||
| RBC Capital Markets Corp. TriParty Joint | |||||||||
| Repurchase Agreement (maturing on | |||||||||
| 07/01/2011 in the amount of $2,256, | |||||||||
| collateralized by U.S. Treasury Bill 0.02% | |||||||||
| - 4.50%, 2011 - 2012, U.S. Treasury Bond | |||||||||
| 4.25% - 7.13%, 2023 - 2039, U.S. Treasury | |||||||||
| Note 0.38% - 10.63%, 2012 - 2021, value | |||||||||
of $ 2,301 ) | |||||||||
| 2,256 | 0.01%, 06/30/2011 | 2,256 | |||||||
| RBS Greenwich Capital Markets TriParty | |||||||||
| Joint Repurchase Agreement (maturing on | |||||||||
| 07/01/2011 in the amount of $1,949, | |||||||||
| collateralized by U.S. Treasury Bond | |||||||||
| 4.50%, 2038, U.S. Treasury Note 4.00%, | |||||||||
2015, value of $1,988) | |||||||||
| 1,949 | 0.01%, 06/30/2011 | 1,949 | |||||||
| UBS Securities, Inc. TriParty Joint | |||||||||
| Repurchase Agreement (maturing on | |||||||||
| 07/01/2011 in the amount of $3,012, | |||||||||
| collateralized by U.S. Treasury Bond | |||||||||
2.00% - 3.63%, 2026 - 2028, value of $3,073) | |||||||||
| 3,012 | 0.01%, 06/30/2011 | 3,012 | |||||||
| 9,278 | |||||||||
| U.S. Treasury Bills - 0.1% | |||||||||
| 1,000 | 0.06%, 7/28/2011 □○ | 1,000 | |||||||
| Total short-term investments | |||||||||
| (cost $10,278) | $ | 10,278 | |||||||
| Total investments | |||||||||
| (cost $892,368) ▲ | 103.5 | % | $ | 1,026,106 | |||||
| Other assets and liabilities | (3.5 | )% | (34,534 | ) | |||||
| Total net assets | 100.0 | % | $ | 991,572 | |||||
The accompanying notes are an integral part of these financial statements.
Note: Percentage of investments as shown is the ratio of the total market value to total net assets.
| ▲ | At June 30, 2011, the cost of securities for federal income tax purposes was $923,910 and the aggregate gross unrealized appreciation and depreciation based on that cost were: |
| Unrealized Appreciation | $ | 296,954 | ||
| Unrealized Depreciation | (194,758 | ) | ||
| Net Unrealized Appreciation | $ | 102,196 |
· | Currently non-income producing. |
| ○ | The interest rate disclosed for these securities represents the effective yield on the date of the acquisition. |
| □ | Security pledged as initial margin deposit for open futures contracts at June 30, 2011 as follows: |
| Unrealized | |||||||||||||||||||
| Number of | Expiration | Notional | Appreciation/ | ||||||||||||||||
| Description | Contracts* | Position | Date | Market Value ╪ | Amount | (Depreciation) | |||||||||||||
| S&P 500 Index | 35 | Long | 09/15/2011 | $ | 11,511 | $ | 11,081 | $ | 430 | ||||||||||
| * | The number of contracts does not omit 000's. |
| ╪ | See Significant Accounting Policies of accompanying Notes to Financial Statements regarding valuation of securities. |
The accompanying notes are an integral part of these financial statements.
| Investment Valuation Hierarchy Level Summary |
| June 30, 2011 (Unaudited) |
| (000’s Omitted) |
| Total | Level 1 ♦ | Level 2 ♦ | Level 3 | |||||||||||||
| Assets: | ||||||||||||||||
| Common Stocks ‡ | $ | 1,015,828 | $ | 1,015,828 | $ | – | $ | – | ||||||||
| Short-Term Investments | 10,278 | – | 10,278 | – | ||||||||||||
| Total | $ | 1,026,106 | $ | 1,015,828 | $ | 10,278 | $ | – | ||||||||
| Futures * | 430 | 430 | – | – | ||||||||||||
| Total | $ | 430 | $ | 430 | $ | – | $ | – | ||||||||
| ♦ | For the six-month period ended June 30, 2011, there were no significant transfers between Level 1 and Level 2. |
| ‡ | The Fund has all or primarily all of the equity securities categorized in a particular level. Refer to the Schedule of Investments for further industry breakout. |
| * | Derivative instruments not reflected in the Schedule of Investments are valued at the unrealized appreciation/depreciation on the investments. |
The accompanying notes are an integral part of these financial statements.
| Statement of Assets and Liabilities |
June 30, 2011 (Unaudited) |
| (000’s Omitted) |
| Assets: | ||||
| Investments in securities, at market value (cost $892,368) | $ | 1,026,106 | ||
| Cash | — | |||
| Receivables: | ||||
| Investment securities sold | 122 | |||
| Fund shares sold | 355 | |||
| Dividends and interest | 1,297 | |||
| Variation margin | 105 | |||
| Other assets | 3 | |||
| Total assets | 1,027,988 | |||
| Liabilities: | ||||
| Payables: | ||||
| Investment securities purchased | 22 | |||
| Fund shares redeemed | 36,254 | |||
| Variation margin | 6 | |||
| Investment management fees | 49 | |||
| Distribution fees | 9 | |||
| Accrued expenses | 76 | |||
| Total liabilities | 36,416 | |||
| Net assets | $ | 991,572 | ||
| Summary of Net Assets: | ||||
| Capital stock and paid-in-capital | $ | 901,076 | ||
| Accumulated undistributed net investment income | 8,911 | |||
| Accumulated net realized loss on investments | (52,583 | ) | ||
| Unrealized appreciation of investments | 134,168 | |||
| Net assets | $ | 991,572 | ||
| Shares authorized | 4,000,000 | |||
| Par value | $ | 0.001 | ||
Class IA: Net asset value per share | $ | 27.74 | ||
| Shares outstanding | 27,312 | |||
| Net assets | $ | 757,543 | ||
Class IB: Net asset value per share | $ | 27.58 | ||
| Shares outstanding | 8,486 | |||
| Net assets | $ | 234,029 | ||
The accompanying notes are an integral part of these financial statements.
| Statement of Operations |
| For the Six-Month Period Ended June 30, 2011 (Unaudited) |
| (000’s Omitted) |
| Investment Income: | ||||
| Dividends | $ | 10,121 | ||
| Interest | 4 | |||
| Total investment income, net | 10,125 | |||
| Expenses: | ||||
| Investment management fees | 1,554 | |||
| Distribution fees - Class IB | 284 | |||
| Custodian fees | 9 | |||
| Accounting services fees | 52 | |||
| Board of Directors' fees | 11 | |||
| Audit fees | 9 | |||
| Other expenses | 79 | |||
| Total expenses | 1,998 | |||
| Net investment income | 8,127 | |||
| Net Realized Gain on Investments and Other Financial Instruments: | ||||
| Net realized gain on investments | 2,469 | |||
| Net realized gain on futures | 416 | |||
| Net Realized Gain on Investments and Other Financial Instruments | 2,885 | |||
| Net Changes in Unrealized Appreciation of Investments and Other Financial Instruments: | ||||
| Net unrealized appreciation of investments | 47,729 | |||
| Net unrealized appreciation of futures | 186 | |||
| Net Changes in Unrealized Appreciation of Investments and Other Financial Instruments | 47,915 | |||
| Net Gain on Investments and Other Financial Instruments | 50,800 | |||
| Net Increase in Net Assets Resulting from Operations | $ | 58,927 | ||
The accompanying notes are an integral part of these financial statements.
| Statement of Changes in Net Assets |
| (000’s Omitted) |
| For the | ||||||||
| Six-Month | For the | |||||||
| Period Ended | Year Ended | |||||||
| June 30, 2011 | December 31, | |||||||
| (Unaudited) | 2010 | |||||||
| Operations: | ||||||||
| Net investment income | $ | 8,127 | $ | 16,123 | ||||
| Net realized gain on investments and other financial instruments | 2,885 | 2,457 | ||||||
| Net unrealized appreciation of investments and other financial instruments | 47,915 | 114,628 | ||||||
| Net Increase In Net Assets Resulting From Operations | 58,927 | 133,208 | ||||||
| Distributions to Shareholders: | ||||||||
| From net investment income | ||||||||
| Class IA | — | (13,079 | ) | |||||
| Class IB | — | (2,921 | ) | |||||
| Total distributions | — | (16,000 | ) | |||||
| Capital Share Transactions: | ||||||||
| Class IA | ||||||||
| Sold | 26,248 | 74,931 | ||||||
| Issued on reinvestment of distributions | — | 13,079 | ||||||
| Redeemed | (124,906 | ) | (184,062 | ) | ||||
| Total capital share transactions | (98,658 | ) | (96,052 | ) | ||||
| Class IB | ||||||||
| Sold | 51,224 | 86,663 | ||||||
| Issued on reinvestment of distributions | — | 2,921 | ||||||
| Redeemed | (38,810 | ) | (69,647 | ) | ||||
| Total capital share transactions | 12,414 | 19,937 | ||||||
| Net decrease from capital share transactions | (86,244 | ) | (76,115 | ) | ||||
| Net Increase (Decrease) In Net Assets | (27,317 | ) | 41,093 | |||||
| Net Assets: | ||||||||
| Beginning of period | 1,018,889 | 977,796 | ||||||
| End of period | $ | 991,572 | $ | 1,018,889 | ||||
Accumulated undistributed (distribution in excess of) net investment income | $ | 8,911 | $ | 784 | ||||
| Shares: | ||||||||
| Class IA | ||||||||
| Sold | 954 | 3,164 | ||||||
| Issued on reinvestment of distributions | — | 509 | ||||||
| Redeemed | (4,544 | ) | (7,732 | ) | ||||
| Total share activity | (3,590 | ) | (4,059 | ) | ||||
| Class IB | ||||||||
| Sold | 1,888 | 3,670 | ||||||
| Issued on reinvestment of distributions | — | 114 | ||||||
| Redeemed | (1,425 | ) | (2,948 | ) | ||||
| Total share activity | 463 | 836 | ||||||
The accompanying notes are an integral part of these financial statements.
| Notes to Financial Statements |
| June 30, 2011 (Unaudited) |
| (000’s Omitted) |
| 1. | Organization: |
Hartford Index HLS Fund (the “Fund”) serves as an underlying investment option for certain variable annuity and variable life insurance separate accounts of Hartford Life Insurance Company (“HLIC”) and its affiliates and certain qualified retirement plans. The Fund may also serve as an underlying investment option for certain variable annuity and variable life separate accounts of other insurance companies. Owners of variable annuity contracts and policyholders of variable life insurance contracts may choose the funds permitted in the variable insurance contract prospectus. In addition, participants in certain qualified retirement plans may choose the Fund if permitted by their plans.
Hartford Series Fund, Inc. (the “Company”) is an open-end registered management investment company comprised of thirty portfolios. Financial Statements for the Fund, a series of the Company, are included in this report.
The Company is organized under the laws of the State of Maryland and is registered with the Securities and Exchange Commission (“SEC”) under the Investment Company Act of 1940, as amended (“1940 Act”). The Fund is a diversified open-end management investment company.
The Fund is divided into Class IA and Class IB shares. Each class is offered at the per share net asset value (“NAV”) without a sales charge and is subject to the same expenses, except that the Class IB shares are subject to distribution and service fees charged pursuant to a Distribution Plan adopted in accordance with Rule 12b-1 under the 1940 Act.
| 2. | Significant Accounting Policies: |
The following is a summary of significant accounting policies of the Fund in the preparation of its financial statements, which are in accordance with the United States Generally Accepted Accounting Principles (“U.S. GAAP”). The preparation of financial statements in accordance with U.S. GAAP may require management to make estimates and assumptions that affect the reported amounts of assets and liabilities and disclosure of contingent assets and liabilities at the date of the financial statements and the reported amounts of increases and decreases in net assets from operations during the reporting period. Actual results could differ from those estimates.
| a) | Determination of Net Asset Value – The NAV of each class of the Fund's shares is determined as of the close of regular trading (normally 4:00 p.m. Eastern Time) (the “NYSE Close”) on each day that the New York Stock Exchange (the “Exchange”) is open (“Valuation Date”). Information that becomes known to the Fund after the NAV has been calculated on a particular day will not generally be used to retroactively adjust the NAV determined earlier that day. |
| b) | Investment Valuation and Fair Value Measurements – For purposes of calculating the NAV, portfolio securities and other assets held by the Fund's portfolio for which market quotes are readily available are valued at market value. Market value is generally determined on the basis of last reported sales prices or official close price. If no sales are reported, market value is based on quotes obtained from a quotation reporting system, established market makers, or independent pricing services. If market prices are not readily available or are deemed unreliable, the Fund will use the fair value of the security as determined in good faith under policies and procedures established by and under the supervision of the Company's Board of Directors. Market quotes are considered not readily available where there is an absence of current or reliable market-based data (e.g., trade information or broker quotes), including where events occur after the close of the relevant market, but prior to the NYSE Close that materially affect the values of the Fund's portfolio securities or assets. In addition, market quotes are considered not readily available when, due to extraordinary circumstances, the exchanges or markets on which the securities trade, do not open for trading for the entire day and no other market prices are available. There can be no assurance that the Fund could obtain the fair market value assigned to a security if the Fund were to sell the security at approximately the time at which the Fund determines its NAV. |
Short-term investments with a maturity of more than 60 days when purchased are valued based on market quotations until the remaining days to maturity become less than 61 days. Investments that mature in 60 days or less are generally valued at amortized cost, which approximates market value.
Financial instruments for which prices are not available from an independent pricing service may be valued using market quotations obtained from one or more dealers that make markets in the respective financial instrument in accordance with procedures established by the Company’s Board of Directors.
U.S. GAAP defines fair value as the price that the Fund would receive to sell an asset or pay to transfer a liability in an orderly transaction between market participants. The U.S. GAAP fair value measurement standards require disclosure of a fair value hierarchy for each major category of assets and liabilities. Various inputs are used in determining the fair value of the Fund’s investments. These inputs are summarized into three broad hierarchy levels. This hierarchy is based on whether the valuation inputs are observable or unobservable. These levels are:
| · | Level 1 – Quoted prices in active markets for identical securities. Level 1 may include exchange-traded instruments such as domestic equities, some foreign equities, options, futures, mutual funds, exchange-traded funds, rights and warrants. |
| · | Level 2 – Observable inputs other than Level 1 prices, such as quoted prices for similar securities; quoted prices in markets that are not active; or other inputs that are observable or can be corroborated by observable market data. Level 2 may include debt securities that are traded less frequently than exchange-traded instruments and which are valued using third party pricing services; foreign equities, whose value is determined using a multi-factor regression model with inputs that are observable in the market; and short-term securities, which are valued at amortized cost. |
| · | Level 3 – Significant unobservable inputs that are supported by limited or no market activity. Level 3 may include financial instruments whose values are determined using broker quotes or require significant management judgment or estimation. These unobservable valuation inputs may include estimates for current yields, maturity/duration, prepayment speed, and broker quotes for comparable securities along with other assumptions relating to credit quality, collateral value, complexity of the security structure, general market conditions and liquidity. This category may include securities where trading has been halted or there are certain restrictions on trading. While these securities are priced using unobservable inputs, the valuation of these securities reflects the best available data and management believes the prices are a reasonable representation of exit price. |
Valuation levels are not necessarily indicative of the risk associated with investing in such securities. Individual securities within any of the above mentioned asset classes may be assigned a different hierarchical level than those presented above, as individual circumstances dictate.
During the six-month period ended June 30, 2011, the Fund held no Level 3 securities, therefore no reconciliation of Level 3 securities is presented.
For additional information, refer to the Investment Valuation Hierarchy Level Summary which follows the Schedule of Investments.
For purposes of reporting transfers between different hierarchy levels, both transfers in and out of each level, as applicable, are shown as if they occurred at the beginning of the period.
| c) | Security Transactions and Investment Income – Security transactions are recorded as of the trade date (the date the order to buy or sell is executed) for financial reporting purposes. Securities purchased or sold on a when-issued or delayed-delivery basis may be settled a month or more after the trade date. Realized gains and losses are determined on the basis of identified cost. |
| Hartford Index HLS Fund |
| Notes to Financial Statements – (continued) |
| June 30, 2011 (Unaudited) |
| (000’s Omitted) |
Dividend income is accrued as of the ex-dividend date, except that certain dividends from foreign securities where the ex-dividend date may have passed are recorded as soon as the Fund is informed of the dividend. Interest income, including amortization of premium and accretion of discounts, is accrued on a daily basis.
| d) | Joint Trading Account – The Fund may invest cash balances into a joint trading account that may be invested in one or more repurchase agreements. |
| e) | Fund Share Valuation and Dividend Distributions to Shareholders – Orders for the Fund’s shares are executed in accordance with the investment instructions of the contract holders and plan participants. The NAV of the Fund’s shares is determined as of the close of business on each business day of the Exchange. The NAV is determined separately for each class of shares of the Fund by dividing the Fund’s net assets attributable to that class by the number of shares of the class outstanding. Each class of shares offered by the Fund has equal rights as to assets and voting privileges (except that shareholders of a class have exclusive voting rights regarding any matter relating solely to that class of shares). Income and non-class specific expenses are allocated daily to each class on the basis of the relative net assets of the class. Realized and unrealized capital gains and losses of each class are allocated daily based on the relative net assets of each class of shares of the Fund. |
Orders for the purchase of the Fund’s shares received prior to the close of the Exchange on any day the Exchange is open for business are priced at the NAV determined as of the close of the Exchange. Orders received after the close of the Exchange, or on a day on which the Exchange and/or the Fund is not open for business, are priced at the next determined NAV.
Dividends are declared pursuant to a policy adopted by the Company’s Board of Directors based upon the investment performance of the Fund. The policy of the Fund is to pay dividends from net investment income and realized capital gains, if any, at least once a year.
Distributions from net investment income, net realized capital gains and capital are determined in accordance with federal income tax regulations, which may differ from U.S. GAAP with respect to character and timing. These differences may include but are not limited to losses deferred due to wash sale adjustments, foreign currency gains and losses, adjustments related to Passive Foreign Investment Companies (“PFICs”), Real Estate Investment Trusts (“REITs”), Regulated Investment Companies (“RICs”), certain derivatives and partnerships. Permanent book and federal income tax basis differences relating to shareholder distributions will result in reclassifications to certain of the Fund’s capital accounts (see Federal Income Taxes: Reclassification of Capital Accounts note).
| 3. | Securities and Other Investments: |
| a) | Repurchase Agreements – A repurchase agreement is an agreement by which a counterparty agrees to sell a security and agrees to repurchase the security sold at a mutually agreed upon time and price. At the time the Fund enters into a repurchase agreement, the value of the underlying collateral security(ies), including accrued interest, will be equal to or exceed the value of the repurchase agreement. Repurchase agreements expose the Fund to counterparty risk. To minimize counterparty risk, the securities that serve to collateralize the repurchase agreement are held by the Fund's custodian in book entry or physical form in the custodial account of the Fund or in a third party custodial account. Repurchase agreements are valued at cost plus accrued interest. The Fund, as shown on the Schedule of Investments, had outstanding repurchase agreements as of June 30, 2011. |
| 4. | Financial Derivative Instruments: |
The following disclosures contain information on how and why the Fund uses derivative instruments, the credit-risk-related contingent features in certain derivative instruments, and how derivative instruments affect the Fund’s financial position, results of operations and cash flows. The location and fair value amounts of these instruments on the Statement
of Assets and Liabilities and the realized gains and losses and changes in unrealized gains and losses on the Statement of Operations, each categorized by type of derivative contract, are included in the following Additional Derivative Instrument Information footnote. The derivative instruments outstanding as of period-end are disclosed in the Notes to the Schedule of Investments and the amounts of realized gains and losses and changes in unrealized gains and losses on derivative instruments during the period are disclosed in the Statement of Operations.
| a) | Futures Contracts – The Fund may enter into futures contracts. A futures contract is an agreement between two parties to buy or sell an asset at a set price on a future date. The Fund uses futures contracts to manage or obtain exposure to the securities markets, commodities, or movements in interest rates and currency values. The primary risks associated with the use of futures contracts are the imperfect correlation between the change in market value of the securities held by the Fund and the prices of futures contracts and the possibility of an illiquid market. Upon entering into a futures contract, the Fund is required to deposit with a futures commission merchant (“FCM”), an amount of cash or U.S. Government or Agency Obligations in accordance with the initial margin requirements of the broker or exchange. Futures contracts are marked to market daily at the most recent settlement price reported by an exchange on which, over time, they are traded most extensively, and an appropriate payable or receivable for the change in value (“variation margin”) is recorded by the Fund. Gains or losses are recognized but not considered realized until the contracts expire or are closed. Futures contracts involve, to varying degrees, risk of loss in excess of the variation margin disclosed on the Statement of Assets and Liabilities, however, this risk is reduced through the use of an FCM. The Fund, as shown on the Schedule of Investments, had outstanding futures contracts as of June 30, 2011. |
| b) | Additional Derivative Instrument Information: |
Fair Values of Derivative Instruments on the Statement of Assets and Liabilities as of June 30, 2011:
| Risk Exposure Category | ||||||||||||||||||||||||||||
| Foreign | ||||||||||||||||||||||||||||
| Interest Rate | Exchange | Credit | Equity | Commodity | Other | |||||||||||||||||||||||
| Contracts | Contracts | Contracts | Contracts | Contracts | Contracts | Total | ||||||||||||||||||||||
| Assets: | ||||||||||||||||||||||||||||
| Variation margin receivable * | $ | — | $ | — | $ | — | $ | 105 | $ | — | $ | — | $ | 105 | ||||||||||||||
| Total | $ | — | $ | — | $ | — | $ | 105 | $ | — | $ | — | $ | 105 | ||||||||||||||
| Liabilities: | ||||||||||||||||||||||||||||
| Variation margin payable * | $ | — | $ | — | $ | — | $ | 6 | $ | — | $ | — | $ | 6 | ||||||||||||||
| Total | $ | — | $ | — | $ | — | $ | 6 | $ | — | $ | — | $ | 6 | ||||||||||||||
| * | Only current day's variation margin is reported within the Statement of Assets and Liabilities. The variation margin is included in the open futures cumulative appreciation (depreciation) of $430 as reported in the Schedule of Investments. |
The volume of derivatives that is presented in the Schedule of Investments is consistent with the derivative activity during the six-month period ended June 30, 2011.
The Effect of Derivative Instruments on the Statement of Operations for the six-month period ended June 30, 2011:
| Risk Exposure Category | ||||||||||||||||||||||||||||
| Foreign | ||||||||||||||||||||||||||||
| Interest Rate | Exchange | Credit | Equity | Commodity | Other | |||||||||||||||||||||||
| Contracts | Contracts | Contracts | Contracts | Contracts | Contracts | Total | ||||||||||||||||||||||
| Realized Gain (Loss) on Derivatives Recognized as a Result from Operations: | ||||||||||||||||||||||||||||
| Net realized gain on futures | $ | — | $ | — | $ | — | $ | 416 | $ | — | $ | — | $ | 416 | ||||||||||||||
| Total | $ | — | $ | — | $ | — | $ | 416 | $ | — | $ | — | $ | 416 | ||||||||||||||
| Net Change in Unrealized Appreciation (Depreciation) on Derivatives Recognized as a Result from Operations: | ||||||||||||||||||||||||||||
Net change in unrealized appreciation of futures | $ | — | $ | — | $ | — | $ | 186 | $ | — | $ | — | $ | 186 | ||||||||||||||
| Total | $ | — | $ | — | $ | — | $ | 186 | $ | — | $ | — | $ | 186 | ||||||||||||||
| Hartford Index HLS Fund |
| Notes to Financial Statements – (continued) |
| June 30, 2011 (Unaudited) |
| (000’s Omitted) |
| 5. | Principal Risks: |
| a) | Credit and Counterparty Risks – Credit risk depends largely on the perceived financial health of bond issuers. In general, the credit rating is inversely related to the credit risk of the issuer. Higher rated bonds generally are deemed to have less credit risk, while lower or unrated bonds are deemed to have higher risk of default. The share price, yield and total return of a fund that holds securities with higher credit risk may be more volatile than those of a fund that holds bonds with lower credit risk. Similar to credit risk, the Fund may be exposed to counterparty risk, or the risk that an institution or other entity with which the Fund has unsettled or open transactions will default. |
| b) | Market Risks – The market values of equity securities, such as common stocks and preferred stocks or equity related investments such as futures and options, may decline due to general market conditions which are not specifically related to a particular company, such as real or perceived adverse economic conditions, changes in the general outlook for corporate earnings, changes in interest or currency rates or adverse investor sentiment generally. The market value of equity securities may also decline due to factors which affect a particular industry or industries, such as labor shortages or increased production costs and competitive conditions within an industry. Equity securities and equity related investments generally have greater market price volatility than fixed income securities. |
| 6. | Federal Income Taxes: |
| a) | Federal Income Taxes – For federal income tax purposes, the Fund intends to continue to qualify as a RIC under Subchapter M of the Internal Revenue Code (“IRC”) by distributing substantially all of its taxable net investment income and net realized capital gains to its shareholders and otherwise complying with the requirements of RICs. The Fund has distributed substantially all of its income and capital gains in prior years, if applicable, and intends to distribute substantially all of its income and capital gains prior to the next fiscal year-end. Accordingly, no provision for federal income or excise taxes has been made in the accompanying financial statements. Distributions from short-term capital gains are treated as ordinary income distributions for federal income tax purposes. |
| b) | Net Investment Income (Loss), Net Realized Gains (Losses) – Net investment income (loss) and net realized gains (losses) may differ for financial statement and tax purposes primarily because of losses deferred due to wash sale adjustments, foreign currency gains and losses, adjustments related to PFICs, REITs, RICs, certain derivatives and partnerships. The character of distributions made during the year from net investment income or net realized gains may differ from their ultimate characterization for federal income tax purposes. Also, due to the timing of dividend distributions, the fiscal year in which amounts are distributed may differ from the year that the income or realized gains (losses) were recorded by the Fund. |
| c) | Distributions and Components of Distributable Earnings – The tax character of distributions paid by the Fund for the periods indicated is as follows (as adjusted for dividends payable): |
| For the Year Ended | For the Year Ended | |||||||
| December 31, 2010 | December 31, 2009 | |||||||
| Ordinary Income | $ | 16,000 | $ | 17,214 | ||||
| Long-Term Capital Gains* | — | 413 | ||||||
| * | The Fund designates these distributions as long-term capital dividends pursuant to IRC code Sec. 852(b)(3)(C). |
As of December 31, 2010, the Fund’s components of distributable earnings (deficit) on a tax basis were as follows:
| Amount | ||||
| Undistributed Ordinary Income | $ | 784 | ||
| Accumulated Capital and Other Losses* | (23,681 | ) | ||
| Unrealized Appreciation† | 54,466 | |||
| Total Accumulated Earnings | $ | 31,569 | ||
| * | The Fund has capital loss carryforwards that are identified in the Capital Loss Carryforward note that follows. |
| † | The difference between book-basis and tax-basis unrealized appreciation (depreciation) may be attributable to the losses deferred due to wash sale adjustments, foreign currency gains and losses, adjustments related to PFICs, REITs, RICs, certain derivatives and partnerships. |
| d) | Reclassification of Capital Accounts – The Fund may record reclassifications in its capital accounts. These reclassifications have no impact on the total net assets of the Fund. The reclassifications are a result of permanent differences between U.S. GAAP and tax accounting for such items as expiration or utilization of capital loss carryforwards or net operating losses. Adjustments are made to reflect the impact these items have on current and future distributions to shareholders. Therefore, the source of the Fund’s distributable income may be shown in the accompanying Statement of Assets and Liabilities as from accumulated undistributed net investment income, from accumulated net realized gains on investments or from capital depending on the type of book and tax differences that exist. For the year ended December 31, 2010, the Fund recorded reclassifications to increase (decrease) the accounts listed below: |
| Amount | ||||
| Accumulated Undistributed Net Investment Income | $ | (132 | ) | |
| Accumulated Net Realized Gain (Loss) on Investments | 132 | |||
| e) | Capital Loss Carryforward – At December 31, 2010 (tax-year-end), the Fund had capital loss carryforwards for U.S. federal income tax purposes of approximately: |
| Year of Expiration | Amount | |||
| 2017 | $ | 23,681 | ||
| Total | $ | 23,681 | ||
As of December 31, 2010, the Fund utilized $2,984 of prior year capital loss carryforwards.
| f) | Accounting for Uncertainty in Income Taxes – The Fund has adopted financial reporting rules that require the Fund to analyze all open tax years, as defined by the Statute of Limitations, for all major jurisdictions. Generally, tax authorities can examine all tax returns filed for the last three years. The Fund does not have an examination in progress. |
The Fund has reviewed all open tax years and major jurisdictions and concluded that these financial reporting rules had no effect on the Fund’s financial position or results of operations. There is no tax liability resulting from unrecognized tax benefits relating to uncertain income tax positions taken or expected to be taken on the tax return for the fiscal year-end December 31, 2010. The Fund is also not aware of any tax positions for which it is reasonably possible that the total amounts of unrecognized tax benefits will significantly change in the next twelve months.
| Hartford Index HLS Fund |
| Notes to Financial Statements – (continued) |
| June 30, 2011 (Unaudited) |
| (000’s Omitted) |
| 7. | Expenses: |
| a) | Investment Management Agreements – HL Investment Advisors, LLC (“HL Advisors”), an indirect wholly owned subsidiary of The Hartford Financial Services Group, Inc. (“The Hartford”), serves as investment manager to the Fund pursuant to an Investment Management Agreement with the Company. As investment manager, HL Advisors has overall investment supervisory responsibility for the Fund. In addition, HL Advisors provides administrative personnel, services, equipment, facilities and office space for proper operation of the Fund. HL Advisors has contracted with Hartford Investment Management Company (“Hartford Investment Management”) under a sub-advisory agreement for the provision of day-to-day investment management services to the Fund in accordance with the Fund’s investment objective and policies. The Fund pays a fee to HL Advisors, a portion of which may be used to compensate Hartford Investment Management. |
The schedule below reflects the rates of compensation paid to HL Advisors for investment management services rendered as of June 30, 2011; the rates are accrued daily and paid monthly.
| Average Daily Net Assets | Annual Fee | |||
| On first $2 billion | 0.3000 | % | ||
| On next $3 billion | 0.2000 | % | ||
| On next $5 billion | 0.1800 | % | ||
| Over $10 billion | 0.1700 | % | ||
| b) | Accounting Services Agreement – Pursuant to the Fund Accounting Agreement between HLIC and the Company, on behalf of the Fund, HLIC provides accounting services to the Fund and receives monthly compensation based on the Fund’s average net assets at the rates set forth below. The Fund’s accounting services fees are accrued daily and paid monthly. |
| Average Daily Net Assets | Annual Fee | |||
| All Assets | 0.010 | % | ||
| c) | Operating Expenses – Allocable expenses incurred by the Company are allocated to each Fund and allocated to classes within a Fund in proportion to the average daily net assets of the Fund and each class, except where allocation of certain expenses is more fairly made directly to the Fund or to specific classes within a Fund. |
| d) | Distribution Plan for Class IB shares – The Company, on behalf of the Fund, has adopted a Distribution Plan pursuant to Rule 12b-1 of the 1940 Act to compensate the Distributor, Hartford Securities Distribution Company, Inc. (a wholly owned, ultimate subsidiary of The Hartford), from assets attributable to the Class IB shares for services rendered and expenses borne in connection with activities primarily intended to result in the sale of the Class IB shares, subject to the review and approval of the Company’s Board of Directors. |
The Distribution Plan provides that the Fund may pay annually up to 0.25% of the average daily net assets of the Fund attributable to its Class IB shares for activities primarily intended to result in the sale of Class IB shares. The Board has the authority to suspend or reduce these payments at any point in time. Under the terms of the Distribution Plan and the principal underwriting agreement, the Fund is authorized to make payments monthly to the Distributor that may be used to pay or compensate entities providing distribution and shareholder servicing with respect to the Class IB shares for such entities’ fees or expenses incurred or paid in that regard. These fees are accrued daily and paid monthly.
| e) | Other Related Party Transactions – Certain officers of the Fund are directors and/or officers of HL Advisors and/or The Hartford or its subsidiaries. For the six-month period ended June 30, 2011, a portion of the Fund’s chief compliance officer’s salary was paid by all the investment companies in the Hartford fund complex. The portion allocated to the Funds was in the amount of $1. These fees are accrued daily and paid monthly. |
| f) | Payment from Affiliate – On November 8, 2006, the SEC issued an order setting forth the terms of a settlement reached with three subsidiaries of The Hartford that resolved the SEC’s Division of Enforcement’s investigation of aspects of The Hartford’s variable annuity and mutual fund operations related to directed brokerage and revenue sharing. The Hartford settled this matter without admitting or denying the findings of the SEC. |
The Fund is available for purchase by the separate accounts of different variable universal life policies, variable annuity products, and funding agreements and it is offered directly to certain qualified retirement plans (collectively “Products”). Although existing Products contain transfer restrictions, some Products, particularly older variable annuity products, do not contain restrictions on the frequency of transfers. In addition, as the result of the settlement of litigation against Hartford Life, Inc. (“Hartford Life”) (the issuers of such variable annuity products), the Fund’s ability to restrict transfers by certain owners of older variable annuity products was limited. During 2006, these annuity owners surrendered the older variable annuity contracts that were the subject of prior litigation.
The total return in the accompanying financial highlights includes a payment from an affiliate. Had the payment from the affiliate been excluded, the impact and total return for the period listed below would have been as follows:
| For the Year Ended December 31, 2006 | ||||||||
| Class IA | Class IB | |||||||
| Impact from Payment from Affiliate for Unrestricted Transfers | 0.01 | % | 0.01 | % | ||||
| Total Return Excluding Payment from Affiliate | 15.45 | 15.16 | ||||||
| 8. | Investment Transactions: |
For the six-month period ended June 30, 2011, the Fund's aggregate purchases and sales of investment securities (excluding short-term investments) were as follows:
| Amount | ||||
| Cost of Purchases Excluding U.S. Government Obligations | $ | 15,318 | ||
| Sales Proceeds Excluding U.S. Government Obligations | 56,739 | |||
| 9. | Line of Credit: |
The Fund is one of several Hartford funds that participate in a $500 million committed revolving line of credit facility. The facility is to be used for temporary or emergency purposes. Under the arrangement, a fund is required to own securities having a market value in excess of 300% of the total bank borrowings. The interest rate on borrowings varies depending on the nature of the loan. The facility also requires a fee to be paid based on the amount of the commitment. This commitment fee is allocated to all the funds participating in the line of credit based on the average net assets of the funds. During the six-month period ended June 30, 2011, the Fund did not have any borrowings under this facility.
| 10. | Industry Classifications: |
Other than the industry classifications “Other Investment Pools and Funds” and “Exchange Traded Funds,” equity industry classifications used in this report are the Global Industry Classification Standard, which was developed by and is the exclusive property and service mark of MSCI, Inc. and Standard & Poor’s.
| 11. | Indemnifications: |
Under the Company’s organizational documents, the Company shall indemnify its officers and directors to the full extent required or permitted under Maryland General Corporation Law and the federal securities laws. In addition, the Company, on behalf of the Fund, may enter into contracts that contain a variety of indemnifications. The Company’s maximum exposure under these arrangements is unknown. However, as of the date of these financial statements the Company has not had prior claims or losses pursuant to these contracts and expects the risk of loss to be remote.
| Financial Highlights |
| - Selected Per-Share Data (A) - |
| Net Asset | Net Realized | Net Increase | ||||||||||||||||||||||||||||||||
| Value at | and Unrealized | Total from | Dividends from | Distributions | (Decrease) in | Net Asset | ||||||||||||||||||||||||||||
| Beginning of | Net Investment | Payments from | Gain (Loss) on | Investment | Net Investment | from Realized | Distributions | Total | Net Asset | Value at End of | ||||||||||||||||||||||||
| Class | Period | Income (Loss) | (to) Affiliate | Investments | Operations | Income | Capital Gains | from Capital | Distributions | Value | Period | |||||||||||||||||||||||
| For the Six-Month Period Ended June 30, 2011 (Unaudited) | ||||||||||||||||||||||||||||||||||
| IA | $ | 26 .20 | $ | 0 .24 | $ | – | $ | 1 .30 | $ | 1 .54 | $ | – | $ | – | $ | – | $ | – | $ | 1 .54 | $ | 27 .74 | ||||||||||||
| IB | 26 .08 | 0 .18 | – | 1 .32 | 1 .50 | – | – | – | – | 1 .50 | 27 .58 | |||||||||||||||||||||||
| For the Year Ended December 31, 2010 | ||||||||||||||||||||||||||||||||||
| IA | 23 .22 | 0 .44 | – | 2 .97 | 3 .41 | (0 .43 | ) | – | – | (0 .43 | ) | 2 .98 | 26 .20 | |||||||||||||||||||||
| IB | 23 .12 | 0 .34 | – | 2 .99 | 3 .33 | (0 .37 | ) | – | – | (0 .37 | ) | 2 .96 | 26 .08 | |||||||||||||||||||||
| For the Year Ended December 31, 2009 | ||||||||||||||||||||||||||||||||||
| IA | 18 .75 | 0 .42 | – | 4 .48 | 4 .90 | (0 .42 | ) | (0 .01 | ) | – | (0 .43 | ) | 4 .47 | 23 .22 | ||||||||||||||||||||
| IB | 18 .69 | 0 .35 | – | 4 .46 | 4 .81 | (0 .37 | ) | (0 .01 | ) | – | (0 .38 | ) | 4 .43 | 23 .12 | ||||||||||||||||||||
| For the Year Ended December 31, 2008 | ||||||||||||||||||||||||||||||||||
| IA | 31 .54 | 0 .59 | – | (12 .16 | ) | (11 .57 | ) | (0 .58 | ) | (0 .64 | ) | – | (1 .22 | ) | (12 .79 | ) | 18 .75 | |||||||||||||||||
| IB | 31 .40 | 0 .51 | – | (12 .07 | ) | (11 .56 | ) | (0 .51 | ) | (0 .64 | ) | – | (1 .15 | ) | (12 .71 | ) | 18 .69 | |||||||||||||||||
| For the Year Ended December 31, 2007 | ||||||||||||||||||||||||||||||||||
| IA | 32 .36 | 0 .59 | – | 1 .07 | 1 .66 | (0 .57 | ) | (1 .91 | ) | – | (2 .48 | ) | (0 .82 | ) | 31 .54 | |||||||||||||||||||
| IB | 32 .22 | 0 .48 | – | 1 .09 | 1 .57 | (0 .48 | ) | (1 .91 | ) | – | (2 .39 | ) | (0 .82 | ) | 31 .40 | |||||||||||||||||||
| For the Year Ended December 31, 2006 | ||||||||||||||||||||||||||||||||||
| IA | 31 .97 | 0 .56 | – | 4 .05 | 4 .61 | (0 .56 | ) | (3 .66 | ) | – | (4 .22 | ) | 0 .39 | 32 .36 | ||||||||||||||||||||
| IB | 31 .84 | 0 .44 | – | 4 .06 | 4 .50 | (0 .46 | ) | (3 .66 | ) | – | (4 .12 | ) | 0 .38 | 32 .22 | ||||||||||||||||||||
| (A) | Information presented relates to a share outstanding throughout the indicated period. |
| (B) | The figures do not include sales charges or other fees which may be applied at the variable life insurance, variable annuity or qualified retirement plan product level. Any such additional sales charges or other fees would lower the Fund's performance. |
| (C) | Portfolio turnover rate is calculated on the basis of the Fund as a whole without distinguishing between the classes of shares issued. |
| (D) | Not annualized. |
| (E) | Annualized. |
| (F) | Total return without the inclusion of the Payment from (to) Affiliate can be found in Expenses in the accompanying Notes to Financial Statements. |
| - Ratios and Supplemental Data - |
| Ratio of Expenses to Average Net | Ratio of Expenses to Average Net | Ratio of Net Investment Income to | Portfolio Turnover | |||||||||||||||
| Total Return(B) | Net Assets at End of Period | Assets Before Waivers | Assets After Waivers | Average Net Assets | Rate(C) | |||||||||||||
| 5.87 | %(D) | $ | 757,543 | 0.33 | %(E) | 0.33 | %(E) | 1.62 | %(E) | 1 | % | |||||||
| 5.74 | (D) | 234,029 | 0.58 | (E) | 0.58 | (E) | 1.38 | (E) | – | |||||||||
| 14.73 | 809,629 | 0.34 | 0.34 | 1.73 | 4 | |||||||||||||
| 14.45 | 209,260 | 0.59 | 0.59 | 1.48 | – | |||||||||||||
| 26.15 | 811,634 | 0.35 | 0.35 | 2.00 | 6 | |||||||||||||
| 25.81 | 166,162 | 0.60 | 0.60 | 1.75 | – | |||||||||||||
| (37.11 | ) | 718,081 | 0.32 | 0.32 | 2.02 | 4 | ||||||||||||
| (37.27 | ) | 138,014 | 0.57 | 0.57 | 1.77 | – | ||||||||||||
| 5.20 | 1,390,827 | 0.33 | 0.33 | 1.61 | 4 | |||||||||||||
| 4.94 | 271,967 | 0.58 | 0.58 | 1.36 | – | |||||||||||||
| 15.46 | (F) | 1,598,176 | 0.42 | 0.33 | 1.60 | 4 | ||||||||||||
| 15.17 | (F) | 276,850 | 0.67 | 0.58 | 1.36 | – | ||||||||||||
| Directors and Officers (Unaudited) |
The Board of Directors of the Company appoints officers who are responsible for the day-to-day operations of the Fund and who execute policies formulated by the Directors. Each director serves until his or her death, resignation, or retirement or until the next annual meeting of shareholders is held or until his or her successor is elected and qualifies.
Directors and officers who are employed by or who have a financial interest in The Hartford are considered “interested” persons of the Fund pursuant to the 1940 Act. Each officer and two of the Company’s directors, as noted in the chart below, are “interested” persons of the Fund. Each director serves as a director for The Hartford Mutual Funds, Inc., The Hartford Mutual Funds II, Inc., Hartford Series Fund, Inc., and Hartford HLS Series Fund II, Inc., which, as of June 30, 2011, collectively consist of 89 funds. Correspondence may be sent to directors and officers c/o Hartford Mutual Funds, P.O. Box 2999, Hartford, Connecticut 06104-2999, except that correspondence to Ms. Fagely may be sent to 500 Bielenberg Drive, Woodbury, Minnesota 55125.
The table below sets forth, for each director and officer, his or her name, year of birth, current position with the Company and date first elected or appointed to Hartford Series Fund, Inc. (“HSF”), and Hartford HLS Series Fund II, Inc. (“HSF2”), principal occupation, and, for directors, other directorships held. The Fund’s statement of additional information contains further information on the directors and is available free of charge by calling 1-800-862-6668 or writing to Hartford HLS Funds, c/o Individual Annuity Services, P.O. Box 5085, Hartford, CT 06102-5085.
Information on the aggregate remuneration paid to the directors of the Company can be found in the Statement of Operations herein. The Fund pays to The Hartford a portion of the chief compliance officer’s compensation, but does not pay salaries or compensation to any of their other officers or directors who are employed by The Hartford.
Non-Interested Directors
Lynn S. Birdsong (1946) Director since 2003, Co-Chairman of the Investment Committee
Mr. Birdsong is a private investor. Mr. Birdsong currently serves as a Director of the Sovereign High Yield Investment Company (April 2010 to current). Mr. Birdsong currently serves as an Independent Director of Nomura Partners Funds, Inc. (formerly, The Japan Fund) (March 2003 to current). From 2003 to March 2005, Mr. Birdsong was an independent director of the Atlantic Whitehall Funds. From 1979 to 2002, Mr. Birdsong was a managing director of Zurich Scudder Investments, an investment management firm. During his employment with Scudder, Mr. Birdsong was an Interested Director of The Japan Fund. Since 1981, Mr. Birdsong has been a partner in Birdsong Company, an advertising specialty firm.
Robert M. Gavin, Jr. (1940) Director since 2002 (HSF) and 1986 (HSF2), Chairman of the Board since 2004
Dr. Gavin is an educational consultant. Prior to September 1, 2001, he was President of Cranbrook Education Community and prior to July 1996, he was President of Macalester College, St. Paul, Minnesota.
Duane E. Hill (1945) Director since 2001 (HSF) and 2002 (HSF2), Chairman of the Nominating Committee
Mr. Hill is Partner of TSG Ventures L.P., a private equity investment company. Mr. Hill is a former partner of TSG Capital Group, a private equity investment firm that served as sponsor and lead investor in leveraged buyouts of middle market companies.
Sandra S. Jaffee (1941) Director since 2005
Ms. Jaffee served as Chairman (2008 to 2009) and Chief Executive Officer of Fortent (formerly Searchspace Group), a leading provider of compliance/regulatory technology to financial institutions from August 2005 to August 2009. From August 2004 to August 2005, Ms. Jaffee served as an Entrepreneur in Residence with Warburg Pincus, a private equity firm. From September 1995 to July 2004, Ms. Jaffee served as Executive Vice President at Citigroup, where she was President and Chief Executive Officer of Citibank’s Global Securities Services (1995 to 2003). Ms. Jaffe currently serves as a member of the Board of Directors of Broadridge Financial Solutions as well as a Trustee of Muhlenberg College.
William P. Johnston (1944) Director since 2005, Chairman of the Compliance Committee
In June 2006, Mr. Johnston was appointed as Senior Advisor to The Carlyle Group, a global private equity investment firm. In July 2006, Mr. Johnston was elected to the Board of Directors of MultiPlan, Inc. In August 2007, Mr. Johnston was elected to the Board of Directors of LifeCare Holdings, Inc. In February 2008, Mr. Johnston was elected to the Board of Directors of HCR-ManorCare, Inc. In May 2006, Mr. Johnston was elected to the Supervisory Board of Fresenius Medical Care AG & Co. KGaA, after its acquisition of Renal Care Group, Inc. in March 2006. Mr. Johnston joined Renal Care Group in November 2002 as a member of the Board of Directors and served as Chairman of the Board from March 2003 through March 2006. From September 1987 to December 2002, Mr. Johnston was with Equitable Securities Corporation (and its successors, SunTrust Equitable Securities and SunTrust Robinson Humphrey) serving in various investment banking and managerial positions, including Managing Director and Head of Investment Banking, Chief Executive Officer and Vice Chairman.
Phillip O. Peterson (1944) Director since 2002 (HSF) and 2000 (HSF2), Chairman of the Audit Committee
Mr. Peterson is a mutual fund industry consultant. He was a partner of KPMG LLP (an accounting firm) until July 1999. Mr. Peterson joined William Blair Funds in February 2007 as a member of the Board of Trustees. From January 2004 to April 2005, Mr. Peterson served as Independent President of the Strong Mutual Funds.
Lemma W. Senbet (1946) Director since 2005
Dr. Senbet is the William E. Mayer Chair Professor of Finance and Director, Center for Financial Policy, at the University of Maryland, Robert H. Smith School of Business. He was chair of the Finance Department from 1998 to 2006. Previously he was a chaired professor of finance at the University of Wisconsin-Madison. Also, he was director of the Fortis Funds from March 2000 to July 2002. Dr. Senbet served the finance profession in various capacities, including as director of the American Finance Association and President of the Western Finance Association. In 2006, Dr. Senbet was inducted Fellow of Financial Management Association International for his career-long distinguished scholarship and professional service.
Interested Directors and Officers
David N. Levenson (1966) Director since 2010
Mr. Levenson currently serves as President of The Hartford’s Wealth Management business. He was appointed to this role in July 2010. Previously, Mr. Levenson served as Executive Vice President of Legacy Holdings for The Hartford from June 2009 to July 2010. From 2006 to 2009, Mr. Levenson was with Hartford Life Insurance K.K. where he served as President and CEO from 2007 to 2009. He served as Managing Director of Hartford Investment Management Company from 2005 to 2006. Additionally, Mr. Levenson serves as Executive Vice President of The Hartford and as President, Director and Chief Executive Officer of Hartford Life Insurance Company (“HLIC”) and Hartford Life, Inc. (“HL Inc.”).
Lowndes A. Smith (1939) Director since 1996 (HSF) and 2002 (HSF2), Co-Chairman of the Investment Committee
Mr. Smith served as Vice Chairman of The Hartford from February 1997 to January 2002, as President and Chief Executive Officer of HL Inc. from February 1997 to January 2002, and as President and Chief Operating Officer of The Hartford Life Insurance Companies from January 1989 to January 2002. Mr. Smith serves as a Director of White Mountains Insurance Group, Ltd., One Beacon Insurance and Symetra Financial and as a Managing Director of Whittington Gray Associates.
Other Officers
James E. Davey (1964) President and Chief Executive Officer since 2010
Mr. Davey serves as Executive Vice President of HLIC. Additionally, Mr. Davey serves as President, Chief Executive Officer and Manager of Hartford Investment Financial Services, Inc. (“HIFSCO”) and President, Chief Executive Officer and Manager of HL Advisors. Mr. Davey joined The Hartford in 2002.
Tamara L. Fagely (1958) Vice President, Treasurer and Controller since 2002 (HSF) and 1993 (HSF2)
Ms. Fagely has been a Vice President of HASCO since 1998 and Chief Financial Officer since 2006. Currently Ms. Fagely is a Vice President of HLIC. She served as Assistant Vice President of HLIC from December 2001 through March 2005. In addition, Ms. Fagely is Controller and Chief Financial Officer of HIFSCO.
Susan M. Fleege (1959) AML Compliance Officer since 2011
Ms. Fleege currently serves as a Director of Risk Management at The Hartford. She previously served as AML Compliance Officer for the Fund from 2005-2008. Ms. Fleege joined HLIC in 2005 from Amerprise Financial Corporation where she held the position of Counsel from 2000 to 2005. Ms. Fleege is a certified Anti-Money Laundering Specialist.
Dr. Robert J. Froehlich (1953) Senior Managing Director since 2009
Dr. Froehlich joined The Hartford as Senior Managing Director in September 2009. Prior to joining The Hartford, Dr. Froehlich served as Vice Chairman of Deutsche Asset Management from 1997-2009.
Edward P. Macdonald (1967) Vice President, Secretary and Chief Legal Officer since 2005
Mr. Macdonald serves as Vice President of HLIC and Chief Legal Officer of Mutual Funds and Vice President of HIFSCO. He also serves as Vice President and Secretary of HASCO, and Chief Legal Officer, Secretary and Vice President of HL Advisors. Mr. Macdonald joined The Hartford in 2005.
| Hartford Index HLS Fund |
| Directors and Officers (Unaudited) – (continued) |
Vernon J. Meyer (1964) Vice President since 2006
Mr. Meyer serves as Senior Vice President of HLIC. He also serves as Senior Vice President of HIFSCO and HL Advisors. Mr. Meyer joined The Hartford in 2004.
Colleen B. Pernerewski (1969) Vice President and Chief Compliance Officer since 2010
Ms. Pernerewski serves as Vice President and Chief Investment Advisor Compliance Officer of HIFSCO and as Vice President and Chief Compliance Officer of HL Advisors. Ms. Pernerewski joined The Hartford in 2005 from Travelers Life and Annuity where she served as Counsel (2004-2005). Prior to Travelers Life and Annuity, Ms. Pernerewski held the position of Counsel at The Hartford (1998-2004).
Elizabeth L. Schroeder (1966) Vice President since 2010
Ms. Schroeder currently serves as Assistant Vice President of HLIC. Ms. Schroeder joined HLIC in 1991. She is also an Assistant Vice President of HIFSCO and HL Advisers.
Martin Swanson (1962) Vice President since 2010
Mr. Swanson is a Vice President of HLIC. Mr. Swanson also serves as Vice President/Marketing for HIFSCO. Prior to joining HLIC in 1998, Mr. Swanson was a Vice President at PaineWebber, Inc.
Jane Wolak (1961) Vice President since 2009
Ms. Wolak currently serves as Senior Vice President of HLIC. Ms. Wolak joined HLIC as Vice President, Retail Product Services in May 2007. She is also Vice President of HASCO. Previously, Ms. Wolak was with Sun Life Financial where she held the position of Vice President, Service Center Operations from 2001-2007.
A description of the policies and procedures that the Fund uses to determine how to vote proxies relating to portfolio securities and a record of how the Fund voted any proxies for the twelve-month period ended June 30, 2011 are available (1) without charge, upon request, by calling 800-862-6668 and (2) on the SEC’s website at http://www.sec.gov.
The Fund files a complete schedule of portfolio holdings with the SEC for the first and third quarters of each fiscal year on Form N-Q. The Fund’s Forms are available (1) without charge, upon request, by calling 800-862-6668 and (2) on the SEC’s website at http://www.sec.gov. The Form N-Q may be reviewed and copied at the SEC’s Public Reference Room in Washington, DC. Information on the operation of the Public Reference Room may be obtained by calling 1-800-SEC-0330.
| Expense Example (Unaudited) |
Your Fund's Expenses
As a shareholder of the Fund, you incur two types of costs: (1) transaction costs and (2) ongoing costs including investment management fees, distribution fees, and other fund expenses. This example is intended to help you understand your ongoing costs (in dollars) of investing in a Fund and to compare these costs with the ongoing costs of investing in other mutual funds. The example is based on an investment of $1,000 invested at the beginning of the period and held for the period of December 31, 2010 through June 30, 2011.
Actual Expenses
The first set of columns of the table below provides information about actual account values and actual expenses. You may use the information in this column, together with the amount you invested, to estimate the expenses that you paid over the period. Simply divide your account value by $1,000 (for example, an $8,600 account value divided by $1,000 = 8.6), then multiply the result by the number in the line under the heading entitled “Expenses Paid During Period” to estimate the expenses you paid on your account during this period.
Hypothetical Example for Comparison Purposes
The second set of columns of the table below provides information about hypothetical account values and hypothetical expenses based on a Fund's actual expense ratio and an assumed rate of return of 5% per year before expenses, which is not the Fund's actual return. The hypothetical account values and expenses may not be used to estimate the actual ending account balance or expenses you paid for the period. You may use this information to compare the ongoing costs of investing in a Fund and other funds. To do so, compare this 5% hypothetical example with the 5% hypothetical examples that appear in the shareholder reports of the other funds.
Please note that the expenses shown in the table are meant to highlight your ongoing costs only and do not reflect any transactional costs, such as sales charges (loads) and CDSC. Therefore, the second set of columns of the table is useful in comparing ongoing costs only, and will not help you determine the relative total costs of owning different funds. In addition, if these transactional costs were included, your costs would be higher. Expenses are equal to the Fund's annualized expense ratios multiplied by average account value over the period, multiplied by 181/365 (to reflect the one-half year period).
| Actual return | Hypothetical (5% return before expenses) | |||||||||||||||||||||||||||||||||||
| Expenses paid | Expenses paid | Days in | ||||||||||||||||||||||||||||||||||
| during the period | during the period | the | Days | |||||||||||||||||||||||||||||||||
| Beginning | Ending | December 31, 2010 | Beginning | Ending | December 31, 2010 | Annualized | current | in the | ||||||||||||||||||||||||||||
| Account Value | Account Value | through | Account Value | Account Value | through | expense | 1/2 | full | ||||||||||||||||||||||||||||
| December 31, 2010 | June 30, 2011 | June 30, 2011 | December 31, 2010 | June 30, 2011 | June 30, 2011 | ratio | year | year | ||||||||||||||||||||||||||||
| Class IA | $ | 1,000.00 | $ | 1,058.66 | $ | 1.68 | $ | 1,000.00 | $ | 1,023.16 | $ | 1.66 | 0.33 | % | 181 | 365 | ||||||||||||||||||||
| Class IB | $ | 1,000.00 | $ | 1,057.35 | $ | 2.96 | $ | 1,000.00 | $ | 1,021.92 | $ | 2.91 | 0.58 | % | 181 | 365 | ||||||||||||||||||||
27
| The Hartford | |
| P.O. Box 5085 | |
| Hartford, CT 06102-5085 |
Hartford Series Fund, Inc. is underwritten and distributed by Hartford Securities Distribution Company, Inc.
"The Hartford" is The Hartford Financial Services Group, Inc. and its subsidiaries.
Hartford Series Fund, Inc. inception dates range from 1977 to date. Hartford Series Fund, Inc. is not a subsidiary of The Hartford but is underwritten, distributed by and advised by subsidiaries of The Hartford. Investments in Hartford Series Fund, Inc. are not guaranteed by The Hartford or any other entity.
You should carefully consider investment objectives, risks, and charges and expenses of Hartford HLS Funds before investing. This and other information can be found in the Fund’s prospectus or summary prospectus, which can be obtained by calling 800-862-6668. Please read them carefully before you invest or send money.
HLSSAR-IX11 8-11 | 106632 | Printed in U.S.A © 2011 The Hartford, Hartford, CT 06115 |
A MESSAGE FROM THE PRESIDENT

Dear Fellow Shareholders:
I want to take this opportunity to say thank you for your continued confidence and trust.
We have seen a significant amount of global turbulence in the first half of 2011. Investors have continued to be concerned about the implications of the European sovereign debt crisis, as well as our own high levels of domestic debt. Since January we have witnessed significant political uprisings in the already-volatile Middle East and North Africa region. In addition, the ramifications of Japan's massive earthquake, subsequent tsunami, and nuclear disaster are still being played out in the market.
Although corporate earnings have remained robust, the unemployment picture has been mixed. After adding more than 200,000 jobs from February to April, more recent unemployment reports have shown a pullback in hiring.
While official inflation remains low as measured by the Consumer Price Index (CPI), high oil prices may be indicative of higher inflation in the future. The federal funds rate remains at a historic low, however, the Fed could potentially raise the rate to get it closer to its historical average once the economy strengthens.
Even with these headwinds, domestic, international, and world indices (as measured by the S&P 500, MSCI EAFE and MSCI World) are all up more than 5% through June, 30 2011.
Looking ahead, continued growth in emerging markets is fueling global recovery efforts. Emerging markets comprise about 48 percent of the world’s GDP, and many economists believe they are poised for further expansion. As GDP growth continues in emerging markets, roughly 100 million people are added to the middle class each year. This middle class population growth could potentially drive a considerable shift in consumer purchasing power.
Now that we have reached the midpoint of 2011, perhaps now would be a good time to schedule a meeting with your financial adviser to examine your current investment strategy and determine whether you are on the right track.
| • | Are you concerned about inflation and its effects on your portfolio? |
| • | Is your portfolio prepared for rising interest rates? |
| • | Does your portfolio reflect the global economy with a mix of developed nations and emerging markets? |
Your financial professional’s advice can help you to navigate today’s volatile markets with confidence. You can also rest assured that we will continue to provide you with solid investments and stellar service for the road ahead.
Thank you again for your business.
 |
| James Davey |
| President |
| Hartford HLS Funds |
Table of Contents
| Manager Discussion (Unaudited) | 2 |
| Financial Statements | |
| 5 | |
| 8 | |
| 9 | |
| 10 | |
| 11 | |
| 12 | |
| 24 | |
| 26 | |
| 28 | |
| 28 | |
| 29 |
This report is prepared for the general information of contract owners and qualified retirement plan participants. It is not an offer of contracts or of qualified retirement plans. It should not be used in connection with any offer, except in conjunction with the appropriate product prospectus which contains all pertinent information including the applicable sales, administrative and other charges.
The views expressed in the Fund’s Manager Discussion under ‘‘Why did the Fund perform this way?’’ and ‘‘What is the outlook?’’ are views of the Fund’s sub-adviser and portfolio management team through the end of the reporting period and are subject to change based on market and other conditions.
Hartford International Opportunities HLS Fund inception 07/02/1990 |
| (sub-advised by Wellington Management Company, LLP) |
| �� |
Investment objective – Seeks long-term growth of capital. |
Performance Overview 6/30/01 - 6/30/11
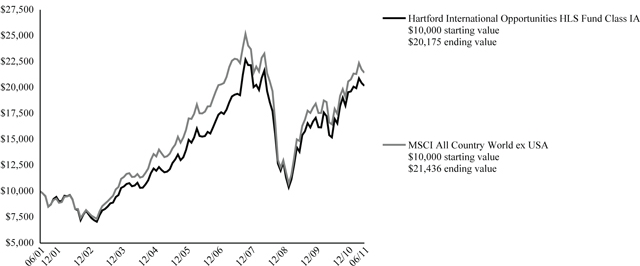
The chart above shows the growth of a $10,000 investment in Class IA. Growth results in classes other than Class IA will vary from what is seen above due to differences in the expenses charged to those share classes.
Average Annual Total Returns (as of 6/30/11) | ||||||||
6 Month† | 1 Year | 5 year | 10 year | |||||
| International Opportunities IA | 3.18% | 32.72% | 5.73% | 7.27% | ||||
| International Opportunities IB | 3.05% | 32.39% | 5.47% | 7.01% | ||||
MSCI All Country World ex USA | 4.11% | 30.27% | 4.14% | 7.92% | ||||
| † | Not Annualized |
PAST PERFORMANCE IS NOT INDICATIVE OF FUTURE RESULTS.
Total returns presented above were calculated using the Fund's net asset value available to shareholders for sale or redemption of Fund shares on June 30, 2011, which excludes investment transactions as of this date.
MSCI All Country World ex USA Index is a broad-based, unmanaged, market capitalization weighted, total return index that measures the performance of both developed and emerging stock markets, excluding the U.S. The index is calculated to exclude companies and share classes which cannot be freely purchased by foreigners.
You cannot invest directly in an index.
The chart represents a hypothetical investment in the Fund. Performance data represents past performance and current performance could be higher or lower.
Performance information may reflect historical or current expense waivers/reimbursements from the investment adviser, without which performance would have been lower. For information on current expense waivers/reimbursements, please see the prospectus.
The value of the fund will fluctuate so that when redeemed, it may be worth more or less than the original investment. The chart and table do not reflect the deductions of taxes, sales charges or other fees which may be applied at the variable life insurance, variable annuity or qualified retirement plan product level. Any such additional sales charges or other fees or expenses would lower the contract’s or plan’s performance.
| Portfolio Managers | |
| Nicolas M. Choumenkovitch | Tara Connolly Stilwell, CFA |
| Senior Vice President | Vice President |
How did the Fund perform?
The Class IA shares of the Hartford International Opportunities HLS Fund returned 3.18% for the six-month period ended June 30, 2011, underperforming its benchmark, the MSCI All Country World ex USA Index, which returned 4.11% for the same period. The Fund underperformed the 4.01% return of the average fund in the Lipper International Growth Funds VP-UF peer group, a group of funds with investment strategies similar to those of the Fund.
Why did the Fund perform this way?
Despite a period filled with volatility and headline risk, global equities moved higher as investors chose to focus on improving economic data, strong corporate earnings, and robust merger and acquisition activity. Heightened geopolitical risks, a devastating earthquake in Japan, and continued uncertainty surrounding sovereign debt issues in Europe were not enough to offset investors' enthusiasm about the improving health of the global economy. In the latter half of the period, positive returns from strong corporate earnings and generally solid economic data were offset by European sovereign debt concerns and a deteriorating outlook for economic growth. Investors became increasingly concerned that policy tightening in Europe would negatively impact global economic growth.
During the six-month period nine of ten sectors in the benchmark posted positive returns, led by Health Care (+11%), Telecommunication Services (+8%), and Consumer Staples (+8%). Information Technology (-4%) was the only sector with negative absolute returns (i.e. total return) during the period.
The Fund’s underperformance versus its benchmark was due in part to weak stock selection, particularly within Materials, Financials, and Energy. This was partially offset by stronger selection in Utilities, Industrials, and Consumer Staples. Allocation among sectors, a result of the bottom-up (i.e. stock by stock fundamental research) stock selection process, also detracted from benchmark-relative (i.e. performance of the Fund as measured against the benchmark) returns, largely due to an overweight (i.e. the Fund’s sector position was greater than the benchmark position) position in Information Technology and underweights (i.e. the Fund’s sector position was less than the benchmark position) to Health Care and Consumer Staples.
The largest detractors from relative returns were Impala Platinum (Materials), Frontline (Energy), and Yara International (Materials). Shares of South-African based platinum producer Impala Platinum fell due to uncertainty around Zimbabwe mining rights, as well as concerns about slowing demand from the auto sector following weak February auto numbers in China as well as supply disruptions from the Japanese earthquake. Frontline is an owner and operator of crude oil transport tankers. Day rates for tankers were under pressure during the period, generating little cash margin, as ships remained in oversupply and newbuilds continued to be delivered, driving the company’s share price lower. Shares of Yara International, a Norwegian-based global producer of nitrogen and complex fertilizer products, underperformed. Nitrogen feedstock costs are largely linked to oil prices; as oil rose during the quarter investors became concerned that margins may be squeezed. We eliminated our holding during the period. Hon Hai Precision (Information Technology) also detracted from absolute performance.
Top contributors to relative performance during the period included Chubu Electric Power (Utilities), Continental AG (Consumer Discretionary), and BNP Paribas (Financials). Chubu Electric Power is a Japanese power company. Shares fell as Japan’s prime minister asked the company to suspend operations as its Hamaoka plant in response to concerns stemming from the earthquake in March. We initiated a position on weakness following the share price decline. Continental AG is a leading provider of various products and services primarily for the automotive industry worldwide. Japan suppliers have quickly recovered from the March earthquake and the automotive demand has been strong, leading to strong second quarter earnings and driving Continental's share prices higher. Shares of France-based bank BNP Paribas rose during the period as the company surprised the market positively with ongoing momentum in their quarterly results, citing positive revenue trends, lower impairments, and healthy capital generation. The strength was broad-based, led by returns in the French retail division, but with good delivery across investment solutions and corporate and investment banking. National Grid (Utilities) also contributed positively to absolute performance.
What is the outlook?
At a macro level, we believe the factors causing a soft patch in global growth are temporary. Certain of these elements are already starting to abate; we are seeing a rapid rebound from
Japan supply issues, the impact of U.S. flooding receding, and oil prices correcting. We expect business investment to be stronger in the second half as companies take advantage of the depreciation tax credit. However, the developed world is likely to rebound to a lower trend growth rate.
As is consistent with the investment approach, we continue to look for opportunities at a company-by-company level, focusing on those companies which can deliver improvements in return on invested capital (ROIC) or sustain ROIC for longer than the market anticipates. At the end of the period, we were most overweight Industrials and Information Technology, and most underweight Financials and Materials, relative to the benchmark. On a regional basis, we ended the period with an overweight to select European countries, including the U.K., Switzerland and France. We maintained underweight positions in select Asian countries, including Australia, South Korea, and Japan.
| Diversification by Industry | ||||
| as of June 30, 2011 | ||||
| Percentage of | ||||
| Industry (Sector) | Net Assets | |||
Automobiles & Components (Consumer Discretionary) | 4.1 | % | ||
| Banks (Financials) | 7.5 | |||
| Capital Goods (Industrials) | 13.7 | |||
| Commercial & Professional Services (Industrials) | 2.7 | |||
Consumer Durables & Apparel (Consumer Discretionary) | 2.0 | |||
| Consumer Services (Consumer Discretionary) | 3.3 | |||
| Diversified Financials (Financials) | 3.6 | |||
| Energy (Energy) | 7.6 | |||
| Food & Staples Retailing (Consumer Staples) | 0.1 | |||
| Food, Beverage & Tobacco (Consumer Staples) | 5.2 | |||
| Health Care Equipment & Services (Health Care) | 1.8 | |||
| Household & Personal Products (Consumer Staples) | 2.3 | |||
| Insurance (Financials) | 3.3 | |||
| Materials (Materials) | 8.4 | |||
| Pharmaceuticals, Biotechnology & Life Sciences (Health Care) | 4.1 | |||
| Real Estate (Financials) | 3.9 | |||
Semiconductors & Semiconductor Equipment (Information Technology) | 4.8 | |||
| Software & Services (Information Technology) | 1.9 | |||
Technology Hardware & Equipment (Information Technology) | 1.0 | |||
| Telecommunication Services (Services) | 5.3 | |||
| Transportation (Industrials) | 3.8 | |||
| Utilities (Utilities) | 5.0 | |||
| Short-Term Investments | 3.9 | |||
| Other Assets and Liabilities | 0.7 | |||
| Total | 100.0 | % | ||
| Diversification by Country | ||||
| as of June 30, 2011 | ||||
| Percentage of | ||||
| Country | Net Assets | |||
| Australia | 0.2 | % | ||
| Belgium | 0.8 | |||
| Brazil | 5.8 | |||
| Canada | 4.5 | |||
| Chile | 0.7 | |||
| China | 2.8 | |||
| Colombia | 0.1 | |||
| Denmark | 1.4 | |||
| Finland | 1.2 | |||
| France | 13.6 | |||
| Germany | 6.0 | |||
| Hong Kong | 5.1 | |||
| India | 1.0 | |||
| Ireland | 2.9 | |||
| Israel | 0.6 | |||
| Italy | 1.4 | |||
| Japan | 11.2 | |||
| Jersey | 1.0 | |||
| Malaysia | 0.3 | |||
| Mexico | 1.0 | |||
| Netherlands | 2.9 | |||
| Norway | 0.3 | |||
| Russia | 0.4 | |||
| South Korea | 1.9 | |||
| Spain | 0.3 | |||
| Sweden | 2.0 | |||
| Switzerland | 8.7 | |||
| Taiwan | 1.9 | |||
| United Kingdom | 14.5 | |||
| United States | 0.9 | |||
| Short-Term Investments | 3.9 | |||
| Other Assets and Liabilities | 0.7 | |||
| Total | 100.0 | % | ||
| Schedule of Investments |
| June 30, 2011 (Unaudited) |
| (000’s Omitted) |
| Shares or Principal Amount | Market Value ╪ | ||||||
| COMMON STOCKS - 95.4% | |||||||
| Australia - 0.2% | |||||||
| 481 | Fortescue Metals Group Ltd. | $ | 3,297 | ||||
| Belgium - 0.8% | |||||||
| 300 | Umicore | 16,356 | |||||
| Brazil - 5.8% | |||||||
| 202 | Banco do Estado do Rio Grande do Sul S.A. | 2,259 | |||||
| 1,163 | Banco Santander Brasil S.A. | 13,621 | |||||
| 535 | CCR S.A. | 15,925 | |||||
| 253 | Cetip S.A. - Balcao Organizado | 3,901 | |||||
| 2 | Cetip S.A. - Balcao Organizado - Receipt Shares ⌂● | 37 | |||||
| 602 | Itau Unibanco Banco Multiplo S.A. ADR | 14,174 | |||||
| 1,288 | JSL S.A. | 9,494 | |||||
| 310 | Localiza Rent a Car S.A. | 5,521 | |||||
| 5,487 | PDG Realty S.A. | 30,902 | |||||
| 488 | Petroleo Brasileiro S.A. ADR | 16,527 | |||||
| 139 | Raia S.A. ● | 2,309 | |||||
| 114,670 | |||||||
| Canada - 4.5% | |||||||
| 885 | Canadian Natural Resources Ltd. | 37,081 | |||||
| 529 | EnCana Corp. | 16,328 | |||||
| 104 | First Quantum Minerals Ltd. | 15,193 | |||||
| 355 | Potash Corp. of Saskatchewan, Inc. | 20,248 | |||||
| 88,850 | |||||||
| Chile - 0.7% | |||||||
| 631 | Enersis S.A. ADR | 14,567 | |||||
| China - 2.8% | |||||||
| 8,148 | Changsha Zoomlion Heavy Industry Science and Technology Co., Ltd. | 15,601 | |||||
| 5,933 | China Shenhua Energy Co., Ltd. | 28,430 | |||||
| 14 | New Oriental Education & Technology Group, Inc. ADR ● | 1,542 | |||||
| 7,160 | Shandong Weigao Group Medical Polymer Co., Ltd. | 10,340 | |||||
| 55,913 | |||||||
| Colombia - 0.1% | |||||||
| 33 | Bancolombia S.A. ADR | 2,169 | |||||
| Denmark - 1.4% | |||||||
| 632 | DSV A/S | 15,169 | |||||
| 141 | FLSmidth & Co. A/S | 11,958 | |||||
| 27,127 | |||||||
| Finland - 1.2% | |||||||
| 83 | Elisa Oyj | 1,795 | |||||
| 305 | Kone Oyj Class B | 19,148 | |||||
| 68 | Nokian Rendaat Oyj | 3,408 | |||||
| 24,351 | |||||||
| France - 13.6% | |||||||
| 513 | Accor S.A. | 22,969 | |||||
| 397 | BNP Paribas | 30,594 | |||||
| 302 | Cie Generale d'Optique Essilor International S.A. | 24,479 | |||||
| 392 | Groupe Danone | 29,275 | |||||
| 348 | Pernod-Ricard | 34,317 | |||||
| 443 | Safran S.A. | 18,894 | |||||
| 225 | Schneider Electric S.A. | 37,617 | |||||
| 122 | Unibail-Rodamco SE | 28,298 | |||||
| 338 | Vallourec | 41,206 | |||||
| 267,649 | |||||||
| Germany - 6.0% | |||||||
| 406 | Beiersdorf AG | 26,356 | |||||
| 238 | Continental AG | 25,116 | |||||
| 175 | HeidelbergCement AG | 11,212 | |||||
| 1,739 | Infineon Technologies AG | 19,545 | |||||
| 594 | SAP AG | 36,005 | |||||
| 118,234 | |||||||
| Hong Kong - 5.1% | |||||||
| 10,093 | AIA Group Ltd. ● | 35,135 | |||||
| 363 | Beijing Enterprises Holdings Ltd. | 1,897 | |||||
| 8,496 | China Gas Holdings Ltd. | 3,417 | |||||
| 1,052 | ENN Energy Holdings Ltd. | 3,580 | |||||
| 5,208 | Hang Lung Properties Ltd. | 21,413 | |||||
| 2,013 | Hengan International Group Co., Ltd. | 18,101 | |||||
| 7,543 | Huabao International Holdings Ltd. | 6,863 | |||||
| 4,380 | Shangri-La Asia Ltd. | 10,753 | |||||
| 101,159 | |||||||
| India - 1.0% | |||||||
| 2,034 | Bharti Televentures | 18,004 | |||||
| 36 | Infosys Ltd. | 2,342 | |||||
| 20,346 | |||||||
| Ireland - 2.9% | |||||||
| 1,525 | CRH plc | 33,985 | |||||
| 1,766 | Experian plc | 22,490 | |||||
| 56,475 | |||||||
| Israel - 0.6% | |||||||
| 233 | Teva Pharmaceutical Industries Ltd. ADR | 11,220 | |||||
| Italy - 1.4% | |||||||
| 3,458 | Snam Rete Gas S.p.A. | 20,468 | |||||
| 3,155 | Unicredit S.p.A. | 6,678 | |||||
| 27,146 | |||||||
| Japan - 11.2% | |||||||
| 815 | Bridgestone Corp. | 18,773 | |||||
| 875 | Chubu Electric Power Co., Inc. | 17,092 | |||||
| 155 | Daito Trust Construction Co., Ltd. | 13,193 | |||||
| 706 | Denso Corp. | 26,239 | |||||
| 276 | Eisai Co., Ltd. | 10,776 | |||||
| 154 | Fanuc Corp. | 25,752 | |||||
| 2 | Inpex Corp. | 15,629 | |||||
| 785 | JS Group Corp. | 20,258 | |||||
| 1,833 | Mitsubishi Electric Corp. | 21,292 | |||||
| 3,331 | Mitsubishi UFJ Financial Group, Inc. | 16,235 | |||||
| 762 | Mitsui Fudosan Co., Ltd. | 13,124 | |||||
| 746 | Nissan Motor Co., Ltd. | 7,840 | |||||
| 706 | Promise Co., Ltd. | 6,013 | |||||
| 452 | Sony Financial Holdings, Inc. | 8,165 | |||||
| 220,381 | |||||||
| Jersey - 1.0% | |||||||
| 2,373 | Glencore International plc ● | 18,700 | |||||
| Malaysia - 0.3% | |||||||
| 4,872 | AirAsia Berhad | 5,697 | |||||
| Mexico - 1.0% | |||||||
| 364 | America Movil S.A. de C.V. ADR | 19,607 | |||||
The accompanying notes are an integral part of these financial statements.
| Schedule of Investments – (continued) |
| June 30, 2011 (Unaudited) |
| (000’s Omitted) |
| Shares or Principal Amount | Market Value ╪ | |||||||||
| COMMON STOCKS - 95.4% - (continued) | ||||||||||
| Netherlands - 2.9% | ||||||||||
| 562 | ASML Holding N.V. ADR | $ | 20,760 | |||||||
| 1,218 | ING Groep N.V. ● | 15,016 | ||||||||
| 1,437 | Koninklijke (Royal) KPN N.V. | 20,897 | ||||||||
| 56,673 | ||||||||||
| Norway - 0.3% | ||||||||||
| 404 | Frontline Ltd. | 5,824 | ||||||||
| Russia - 0.4% | ||||||||||
| 484 | OAO Gazprom Class S ADR | 7,059 | ||||||||
| South Korea - 1.9% | ||||||||||
| 47 | Samsung Electronics Co., Ltd. | 36,485 | ||||||||
| Spain - 0.3% | ||||||||||
| 518 | Banco Bilbao Vizcaya Argentaria S.A. | 6,077 | ||||||||
| Sweden - 2.0% | ||||||||||
| 1,165 | Assa Abloy Ab | 31,320 | ||||||||
| 287 | Atlas Copco Ab | 7,552 | ||||||||
| 38,872 | ||||||||||
| Switzerland - 8.7% | ||||||||||
| 639 | ABB Ltd. | 16,610 | ||||||||
| 131 | CIE Financiere Richemont S.A. | 8,589 | ||||||||
| 151 | Kuehne & Nagel International AG | 23,008 | ||||||||
| 200 | Roche Holding AG | 33,515 | ||||||||
| 11 | SGS S.A. | 21,216 | ||||||||
| 387 | Swiss Re Ltd. ● | 21,742 | ||||||||
| 2,507 | UBS AG | 45,747 | ||||||||
| 170,427 | ||||||||||
| Taiwan - 1.9% | ||||||||||
| 3,825 | Synnex Technology International Corp. | 9,299 | ||||||||
| 6,748 | Taiwan Semiconductor Manufacturing Co., Ltd. | 17,007 | ||||||||
| 6,676 | WPG Holdings Co., Ltd. | 11,352 | ||||||||
| 37,658 | ||||||||||
| United Kingdom - 14.5% | ||||||||||
| 501 | AstraZeneca plc | 25,047 | ||||||||
| 3,777 | Barclays Bank plc | 15,494 | ||||||||
| 230 | BG Group plc | 5,233 | ||||||||
| 794 | Capital Group plc | 9,123 | ||||||||
| 321 | ENSCO International plc | 17,093 | ||||||||
| 2,174 | HSBC Holdings plc | 21,557 | ||||||||
| 1,180 | Imperial Tobacco Group plc | 39,290 | ||||||||
| 577 | Intercontinental Hotels Group | 11,802 | ||||||||
| 4,094 | National Grid plc | 40,305 | ||||||||
| 543 | Rio Tinto plc | 39,221 | ||||||||
| 683 | Standard Chartered plc | 17,952 | ||||||||
| 16,651 | Vodafone Group plc | 44,152 | ||||||||
| 286,269 | ||||||||||
| United States - 0.9% | ||||||||||
| 488 | Carnival Corp. | 18,378 | ||||||||
| Total common stocks | ||||||||||
| (cost $1,732,395) | $ | 1,877,636 | ||||||||
| Total long-term investments | ||||||||||
| (cost $1,732,395) | $ | 1,877,636 | ||||||||
| SHORT-TERM INVESTMENTS - 3.9% | ||||||||||
| Repurchase Agreements - 3.9% | ||||||||||
| Bank of America Merrill Lynch TriParty Joint | ||||||||||
| Repurchase Agreement (maturing on | ||||||||||
| 07/01/2011 in the amount of $7,629, | ||||||||||
| collateralized by FHLB 4.91%, 2015, | ||||||||||
| GNMA 0.87% - 5.72%, 2025 - 2061, value | ||||||||||
| of $7,782) | ||||||||||
| $ | 7,629 | 0.05%, 06/30/2011 | $ | 7,629 | ||||||
| BNP Paribas Securities Corp. TriParty Joint | ||||||||||
| Repurchase Agreement (maturing on | ||||||||||
| 07/01/2011 in the amount of $5,743, | ||||||||||
| collateralized by FNMA 3.50% - 6.50%, | ||||||||||
| 2023 - 2041, value of $5,857) | ||||||||||
| 5,743 | 0.05%, 06/30/2011 | 5,743 | ||||||||
| Deutsche Bank Securities TriParty Joint | ||||||||||
| Repurchase Agreement (maturing on | ||||||||||
| 07/01/2011 in the amount of $55,538, | ||||||||||
| collateralized by GNMA 4.00% - 7.00%, | ||||||||||
| 2035 - 2040, value of $56,649) | ||||||||||
| 55,538 | 0.05%, 06/30/2011 | 55,538 | ||||||||
| UBS Securities, Inc. Joint Repurchase | ||||||||||
| Agreement (maturing on 07/01/2011 in the | ||||||||||
| amount of $111, collateralized by U.S. | ||||||||||
| Treasury Bill 0.63%, 2012, value of $113) | ||||||||||
| 111 | 0.01%, 06/30/2011 | 111 | ||||||||
| UBS Securities, Inc. TriParty Joint | ||||||||||
| Repurchase Agreement (maturing on | ||||||||||
| 07/01/2011 in the amount of $8,477, | ||||||||||
| collateralized by FHLMC 4.50%, 2040, | ||||||||||
| FNMA 4.50% - 6.00%, 2035 - 2041, value | ||||||||||
| of $8,647) | ||||||||||
| 8,477 | 0.06%, 06/30/2011 | 8,477 | ||||||||
| 77,498 | ||||||||||
| Total short-term investments | ||||||||||
| (cost $77,498) | $ | 77,498 | ||||||||
| Total investments | ||||||||||
(cost $1,809,893) ▲ | 99.3 | % | $ | 1,955,134 | ||||||
| Other assets and liabilities | 0.7 | % | 13,770 | |||||||
| Total net assets | 100.0 | % | $ | 1,968,904 | ||||||
The accompanying notes are an integral part of these financial statements.
| Note: | Percentage of investments as shown is the ratio of the total market value to total net assets. Market value of investments in foreign securities represents 94.5% of total net assets at June 30, 2011. |
Prices of foreign equities that are principally traded on certain foreign markets may be adjusted daily pursuant to a fair value pricing service approved by the Board of Directors in order to reflect an adjustment for factors occurring after the close of certain foreign markets but before the close of the New York Stock Exchange.
| ▲ | At June 30, 2011, the cost of securities for federal income tax purposes was $1,824,319 and the aggregate gross unrealized appreciation and depreciation based on that cost were: |
| Unrealized Appreciation | $ | 185,758 | ||
| Unrealized Depreciation | (54,943 | ) | ||
| Net Unrealized Appreciation | $ | 130,815 |
| ● | Currently non-income producing. |
| ⌂ | The following securities are considered illiquid. Illiquid securities are often purchased in private placement transactions, are often not registered under the Securities Act of 1933 and may have contractual restrictions on resale. A security may also be considered illiquid if the security lacks a readily available market or if its valuation has not changed for a certain period of time. |
| Period Acquired | Shares/ Par | Security | Cost Basis | |||||||
| 06/2011 | 2 | Cetip S.A. - Balcao Organizado - Receipt Shares | $ | 33 | ||||||
The aggregate value of these securities at June 30, 2011, was $37, which rounds to zero percent of total net assets.
| Foreign Currency Contracts Outstanding at June 30, 2011 | |||||||||||||||||
| Unrealized | |||||||||||||||||
| Contract | Appreciation/ | ||||||||||||||||
| Description | Counterparty | Buy / Sell | Market Value ╪ | Amount | Delivery Date | (Depreciation) | |||||||||||
| British Pound | Deutsche Bank Securities | Buy | $ | 2,895 | $ | 2,898 | 07/01/2011 | $ | (3 | ) | |||||||
| Hong Kong Dollar | JP Morgan Securities | Sell | 4,562 | 4,562 | 07/05/2011 | – | |||||||||||
| Japanese Yen | Goldman Sachs | Buy | 438 | 436 | 07/01/2011 | 2 | |||||||||||
| Japanese Yen | JP Morgan Securities | Buy | 962 | 955 | 07/01/2011 | 7 | |||||||||||
| $ | 6 | ||||||||||||||||
| ╪ | See Significant Accounting Policies of accompanying Notes to Financial Statements regarding valuation of securities. |
The accompanying notes are an integral part of these financial statements.
| Investment Valuation Hierarchy Level Summary |
| June 30, 2011 (Unaudited) |
| (000’s Omitted) |
| Total | Level 1 ♦ | Level 2 ♦ | Level 3 | |||||||||||||
| Assets: | ||||||||||||||||
| Common Stocks | ||||||||||||||||
| Australia | $ | 3,297 | $ | – | $ | 3,297 | $ | – | ||||||||
| Belgium | 16,356 | – | 16,356 | – | ||||||||||||
| Brazil | 114,670 | 114,670 | – | – | ||||||||||||
| Canada | 88,850 | 88,850 | – | – | ||||||||||||
| Chile | 14,567 | 14,567 | – | – | ||||||||||||
| China | 55,913 | 1,542 | 54,371 | – | ||||||||||||
| Colombia | 2,169 | 2,169 | – | – | ||||||||||||
| Denmark | 27,127 | – | 27,127 | – | ||||||||||||
| Finland | 24,351 | – | 24,351 | – | ||||||||||||
| France | 267,649 | – | 267,649 | – | ||||||||||||
| Germany | 118,234 | – | 118,234 | – | ||||||||||||
| Hong Kong | 101,159 | 6,863 | 94,296 | – | ||||||||||||
| India | 20,346 | 2,342 | 18,004 | – | ||||||||||||
| Ireland | 56,475 | – | 56,475 | – | ||||||||||||
| Israel | 11,220 | 11,220 | – | – | ||||||||||||
| Italy | 27,146 | – | 27,146 | – | ||||||||||||
| Japan | 220,381 | – | 220,381 | – | ||||||||||||
| Jersey | 18,700 | 18,700 | – | – | ||||||||||||
| Malaysia | 5,697 | – | 5,697 | – | ||||||||||||
| Mexico | 19,607 | 19,607 | – | – | ||||||||||||
| Netherlands | 56,673 | 41,657 | 15,016 | – | ||||||||||||
| Norway | 5,824 | – | 5,824 | – | ||||||||||||
| Russia | 7,059 | 7,059 | – | – | ||||||||||||
| South Korea | 36,485 | – | 36,485 | – | ||||||||||||
| Spain | 6,077 | – | 6,077 | – | ||||||||||||
| Sweden | 38,872 | – | 38,872 | – | ||||||||||||
| Switzerland | 170,427 | 21,742 | 148,685 | – | ||||||||||||
| Taiwan | 37,658 | – | 37,658 | – | ||||||||||||
| United Kingdom | 286,269 | 17,093 | 269,176 | – | ||||||||||||
| United States | 18,378 | 18,378 | – | – | ||||||||||||
| Total | 1,877,636 | 386,459 | 1,491,177 | – | ||||||||||||
| Short-Term Investments | 77,498 | – | 77,498 | – | ||||||||||||
| Total | $ | 1,955,134 | $ | 386,459 | $ | 1,568,675 | $ | – | ||||||||
| Foreign Currency Contracts* | 9 | – | 9 | – | ||||||||||||
| Total | $ | 9 | $ | – | $ | 9 | $ | – | ||||||||
| Liabilities: | ||||||||||||||||
| Foreign Currency Contracts* | 3 | – | 3 | – | ||||||||||||
| Total | $ | 3 | $ | – | $ | 3 | $ | – | ||||||||
| ♦ | For the six-month period ended June 30, 2011, there were no significant transfers between Level 1 and Level 2. |
| * | Derivative instruments not reflected in the Schedule of Investments are valued at the unrealized appreciation/depreciation on the investments. |
The accompanying notes are an integral part of these financial statements.
| Statement of Assets and Liabilities |
| June 30, 2011 (Unaudited) |
| (000’s Omitted) |
| Assets: | ||||
| Investments in securities, at market value (cost $1,809,893) | $ | 1,955,134 | ||
| Cash | 41 | |||
| Foreign currency on deposit with custodian (cost $947) | 948 | |||
| Unrealized appreciation on foreign currency contracts | 9 | |||
| Receivables: | ||||
| Investment securities sold | 15,541 | |||
| Fund shares sold | 716 | |||
| Dividends and interest | 7,836 | |||
| Total assets | 1,980,225 | |||
| Liabilities: | ||||
| Unrealized depreciation on foreign currency contracts | 3 | |||
| Payables: | ||||
| Investment securities purchased | 7,820 | |||
| Fund shares redeemed | 3,068 | |||
| Investment management fees | 210 | |||
| Distribution fees | 12 | |||
| Accrued expenses | 208 | |||
| Total liabilities | 11,321 | |||
| Net assets | $ | 1,968,904 | ||
| Summary of Net Assets: | ||||
| Capital stock and paid-in-capital | $ | 2,431,444 | ||
| Accumulated undistributed net investment income | 23,095 | |||
| Accumulated net realized loss on investments and foreign currency transactions | (631,091 | ) | ||
| Unrealized appreciation of investments and the translations of assets and liabilities denominated in foreign currency | 145,456 | |||
| Net assets | $ | 1,968,904 | ||
| Shares authorized | 2,625,000 | |||
| Par value | $ | 0.001 | ||
Class IA: Net asset value per share | $ | 12.86 | ||
| Shares outstanding | 129,649 | |||
| Net assets | $ | 1,666,998 | ||
Class IB: Net asset value per share | $ | 13.00 | ||
| Shares outstanding | 23,225 | |||
| Net assets | $ | 301,906 | ||
The accompanying notes are an integral part of these financial statements.
| Statement of Operations |
| For the Six-Month Period Ended June 30, 2011 (Unaudited) |
| (000’s Omitted) |
| Investment Income: | ||||
| Dividends | $ | 34,010 | ||
| Interest | 19 | |||
| Less: Foreign tax withheld | (3,740 | ) | ||
| Total investment income, net | 30,289 | |||
| Expenses: | ||||
| Investment management fees | 6,715 | |||
| Transfer agent fees | 2 | |||
| Distribution fees - Class IB | 395 | |||
| Custodian fees | 72 | |||
| Accounting services fees | 161 | |||
| Board of Directors' fees | 18 | |||
| Audit fees | 17 | |||
| Other expenses | 281 | |||
| Total expenses (before fees paid indirectly) | 7,661 | |||
| Commission recapture | (37 | ) | ||
| Total fees paid indirectly | (37 | ) | ||
| Total expenses, net | 7,624 | |||
| Net investment income | 22,665 | |||
| Net Realized Gain on Investments and Foreign Currency Transactions: | ||||
| Net realized gain on investments | 115,516 | |||
| Net realized loss on foreign currency contracts | (1,437 | ) | ||
| Net realized gain on other foreign currency transactions | 1,614 | |||
| Net Realized Gain on Investments and Foreign Currency Transactions | 115,693 | |||
| Net Changes in Unrealized Depreciation of Investments and Foreign Currency Transactions: | (75,878 | ) | ||
| Net unrealized depreciation of investments | (75,370 | ) | ||
| Net unrealized depreciation of foreign currency contracts | (620 | ) | ||
| Net unrealized appreciation on translation of other assets and liabilities in foreign currencies | 112 | |||
| Net Changes in Unrealized Depreciation of Investments and Foreign Currency Transactions | (75,878 | ) | ||
| Net Gain on Investments and Foreign Currency Transactions | 39,815 | |||
| Net Increase in Net Assets Resulting from Operations | $ | 62,480 | ||
The accompanying notes are an integral part of these financial statements.
| Statement of Changes in Net Assets |
| (000’s Omitted) |
| For the | ||||||||
| Six-Month | For the | |||||||
| Period Ended | Year Ended | |||||||
| June 30, 2011 | December 31, | |||||||
| (Unaudited) | 2010 | |||||||
| Operations: | ||||||||
| Net investment income | $ | 22,665 | $ | 20,497 | ||||
| Net realized gain on investments and foreign currency transactions | 115,693 | 270,674 | ||||||
| Net unrealized depreciation of investments and foreign currency transactions | (75,878 | ) | (56,880 | ) | ||||
| Net Increase In Net Assets Resulting From Operations | 62,480 | 234,291 | ||||||
| Distributions to Shareholders: | ||||||||
| From net investment income | ||||||||
| Class IA | — | (19,308 | ) | |||||
| Class IB | — | (2,992 | ) | |||||
| Total distributions | — | (22,300 | ) | |||||
| Capital Share Transactions: | ||||||||
| Class IA | ||||||||
| Sold | 98,867 | 114,911 | ||||||
| Issued in merger | — | 453,865 | ||||||
| Issued on reinvestment of distributions | — | 19,308 | ||||||
| Redeemed | (190,566 | ) | (309,369 | ) | ||||
| Total capital share transactions | (91,699 | ) | 278,715 | |||||
| Class IB | ||||||||
| Sold | 17,624 | 33,853 | ||||||
| Issued in merger | — | 142,673 | ||||||
| Issued on reinvestment of distributions | — | 2,992 | ||||||
| Redeemed | (53,929 | ) | (100,545 | ) | ||||
| Total capital share transactions | (36,305 | ) | 78,973 | |||||
| Net increase (decrease) from capital share transactions | (128,004 | ) | 357,688 | |||||
| Proceeds from regulatory settlements | — | 688 | ||||||
| Net Increase (Decrease) In Net Assets | (65,524 | ) | 570,367 | |||||
| Net Assets: | ||||||||
| Beginning of period | 2,034,428 | 1,464,061 | ||||||
| End of period | $ | 1,968,904 | $ | 2,034,428 | ||||
Accumulated undistributed (distribution in excess of) net investment income | $ | 23,095 | $ | 430 | ||||
| Shares: | ||||||||
| Class IA | ||||||||
| Sold | 7,806 | 10,237 | ||||||
| Issued in merger | — | 39,574 | ||||||
| Issued on reinvestment of distributions | — | 1,611 | ||||||
| Redeemed | (15,037 | ) | (27,787 | ) | ||||
| Total share activity | (7,231 | ) | 23,635 | |||||
| Class IB | ||||||||
| Sold | 1,374 | 2,977 | ||||||
| Issued in merger | — | 12,297 | ||||||
| Issued on reinvestment of distributions | — | 248 | ||||||
| Redeemed | (4,205 | ) | (8,918 | ) | ||||
| Total share activity | (2,831 | ) | 6,604 | |||||
The accompanying notes are an integral part of these financial statements.
| Notes to Financial Statements |
| June 30, 2011 (Unaudited) |
| (000’s Omitted) |
| 1. | Organization: |
Hartford International Opportunities HLS Fund (the “Fund”) serves as an underlying investment option for certain variable annuity and variable life insurance separate accounts of Hartford Life Insurance Company (“HLIC”) and its affiliates and certain qualified retirement plans. The Fund may also serve as an underlying investment option for certain variable annuity and variable life separate accounts of other insurance companies. Owners of variable annuity contracts and policyholders of variable life insurance contracts may choose the funds permitted in the variable insurance contract prospectus. In addition, participants in certain qualified retirement plans may choose the Fund if permitted by their plans.
Hartford Series Fund, Inc. (the “Company”) is an open-end registered management investment company comprised of thirty portfolios. Financial Statements for the Fund, a series of the Company, are included in this report.
The Company is organized under the laws of the State of Maryland and is registered with the Securities and Exchange Commission (“SEC”) under the Investment Company Act of 1940, as amended (“1940 Act”). The Fund is a diversified open-end management investment company.
The Fund is divided into Class IA and Class IB shares. Each class is offered at the per share net asset value (“NAV”) without a sales charge and is subject to the same expenses, except that the Class IB shares are subject to distribution and service fees charged pursuant to a Distribution Plan adopted in accordance with Rule 12b-1 under the 1940 Act.
| 2. | Significant Accounting Policies: |
The following is a summary of significant accounting policies of the Fund in the preparation of its financial statements, which are in accordance with the United States Generally Accepted Accounting Principles (“U.S. GAAP”). The preparation of financial statements in accordance with U.S. GAAP may require management to make estimates and assumptions that affect the reported amounts of assets and liabilities and disclosure of contingent assets and liabilities at the date of the financial statements and the reported amounts of increases and decreases in net assets from operations during the reporting period. Actual results could differ from those estimates.
| a) | Determination of Net Asset Value – The NAV of each class of the Fund's shares is determined as of the close of regular trading (normally 4:00 p.m. Eastern Time) (the “NYSE Close”) on each day that the New York Stock Exchange (the “Exchange”) is open (“Valuation Date”). Information that becomes known to the Fund after the NAV has been calculated on a particular day will not generally be used to retroactively adjust the NAV determined earlier that day. |
| b) | Investment Valuation and Fair Value Measurements – For purposes of calculating the NAV, portfolio securities and other assets held by the Fund's portfolio for which market quotes are readily available are valued at market value. Market value is generally determined on the basis of last reported sales prices or official close price. If no sales are reported, market value is based on quotes obtained from a quotation reporting system, established market makers, or independent pricing services. If market prices are not readily available or are deemed unreliable, the Fund will use the fair value of the security as determined in good faith under policies and procedures established by and under the supervision of the Company's Board of Directors. Market quotes are considered not readily available where there is an absence of current or reliable market-based data (e.g., trade information or broker quotes), including where events occur after the close of the relevant market, but prior to the NYSE Close that materially affect the values of the Fund's portfolio securities or assets. In addition, market quotes are considered not readily available when, due to extraordinary circumstances, the exchanges or markets on which the securities trade, do not open for trading for the entire day and no other market prices are available. In addition, prices of foreign equities that are principally traded on certain foreign markets are adjusted daily pursuant to a fair value pricing service approved by the Board of Directors in order to reflect an adjustment for the factors occurring after the close of certain foreign markets but before the NYSE Close. Securities that are primarily traded on foreign markets may trade on days that are not business days of the |
Fund. The value of the foreign securities, in which the Fund invests, may change on days when a shareholder will not be able to purchase or redeem shares of the Fund. Fair value pricing is subjective in nature and the use of fair value pricing by the Fund may cause the NAV of its shares to differ significantly from the NAV that would have been calculated using market prices at the close of the exchange on which a portfolio security is primarily traded. There can be no assurance that the Fund could obtain the fair market value assigned to a security if the Fund were to sell the security at approximately the time at which the Fund determines its NAV.
Investments valued in currencies other than U.S. dollars are converted to U.S. dollars using exchange rates obtained from independent pricing services for calculation of the NAV. As a result, the NAV of the Fund’s shares may be affected by changes in the value of currencies in relation to the U.S. dollar. The value of securities traded in markets outside the United States or denominated in currencies other than the U.S. dollar may be affected significantly on a day that the NYSE is closed and the market value may change on days when an investor is not able to purchase, redeem or exchange shares of the Fund.
Foreign currency contracts represent agreements to exchange currencies on specific future dates at predetermined rates. Foreign currency contracts are valued using foreign currency exchange rates and forward rates as provided by an independent pricing service on Valuation Date.
Financial instruments for which prices are not available from an independent pricing service may be valued using market quotations obtained from one or more dealers that make markets in the respective financial instrument in accordance with procedures established by the Company’s Board of Directors.
U.S. GAAP defines fair value as the price that the Fund would receive to sell an asset or pay to transfer a liability in an orderly transaction between market participants. The U.S. GAAP fair value measurement standards require disclosure of a fair value hierarchy for each major category of assets and liabilities. Various inputs are used in determining the fair value of the Fund’s investments. These inputs are summarized into three broad hierarchy levels. This hierarchy is based on whether the valuation inputs are observable or unobservable. These levels are:
| · | Level 1 – Quoted prices in active markets for identical securities. Level 1 may include exchange-traded instruments such as domestic equities, some foreign equities, options, futures, mutual funds, exchange-traded funds, rights and warrants. |
| · | Level 2 – Observable inputs other than Level 1 prices, such as quoted prices for similar securities; quoted prices in markets that are not active; or other inputs that are observable or can be corroborated by observable market data. Level 2 may include debt securities that are traded less frequently than exchange-traded instruments and which are valued using third party pricing services; foreign equities, whose value is determined using a multi-factor regression model with inputs that are observable in the market; and short-term securities, which are valued at amortized cost. |
| · | Level 3 – Significant unobservable inputs that are supported by limited or no market activity. Level 3 may include financial instruments whose values are determined using broker quotes or require significant management judgment or estimation. These unobservable valuation inputs may include estimates for current yields, maturity/duration, prepayment speed, and broker quotes for comparable securities along with other assumptions relating to credit quality, collateral value, complexity of the security structure, general market conditions and liquidity. This category may include securities where trading has been halted or there are certain restrictions on trading. While these securities are priced using unobservable inputs, the valuation of these securities reflects the best available data and management believes the prices are a reasonable representation of exit price. |
Valuation levels are not necessarily indicative of the risk associated with investing in such securities. Individual securities within any of the above mentioned asset classes may be assigned a different hierarchical level than those presented above, as individual circumstances dictate.
| Notes to Financial Statements – (continued) |
| June 30, 2011 (Unaudited) |
| (000’s Omitted) |
During the six-month period ended June 30, 2011, the Fund held no Level 3 securities, therefore no reconciliation of Level 3 securities is presented.
For additional information, refer to the Investment Valuation Hierarchy Level Summary which follows the Schedule of Investments.
For purposes of reporting transfers between different hierarchy levels, both transfers in and out of each level, as applicable, are shown as if they occurred at the beginning of the period.
| c) | Security Transactions and Investment Income – Security transactions are recorded as of the trade date (the date the order to buy or sell is executed) for financial reporting purposes. Securities purchased or sold on a when-issued or delayed-delivery basis may be settled a month or more after the trade date. Realized gains and losses are determined on the basis of identified cost. |
Dividend income is accrued as of the ex-dividend date, except that certain dividends from foreign securities where the ex-dividend date may have passed are recorded as soon as the Fund is informed of the dividend. Interest income, including amortization of premium and accretion of discounts, is accrued on a daily basis.
| d) | Foreign Currency Transactions – Assets and liabilities denominated in currencies other than U.S. dollars are translated into U.S. dollars at the exchange rates in effect on the valuation date. Purchases and sales of investment securities, income, and expenses are translated into U.S. dollars at the exchange rates on the dates of such transactions. |
The Fund does not isolate that portion of portfolio security valuation resulting from fluctuations in the foreign currency exchange rates from the fluctuations arising from changes in the market prices of securities held. Exchange rate fluctuations are included with the net realized and unrealized gain or loss on investments in the accompanying financial statements.
Net realized foreign exchange gains or losses arise from sales of foreign currencies and the difference between asset and liability amounts initially stated in foreign currencies and the U.S. dollar value of the amounts actually received or paid. Net unrealized foreign exchange gains or losses arise from changes in the value of other assets and liabilities at the end of the reporting period, resulting from changes in the exchange rates.
| e) | Joint Trading Account – The Fund may invest cash balances into a joint trading account that may be invested in one or more repurchase agreements. |
| f) | Fund Share Valuation and Dividend Distributions to Shareholders – Orders for the Fund’s shares are executed in accordance with the investment instructions of the contract holders and plan participants. The NAV of the Fund’s shares is determined as of the close of business on each business day of the Exchange. The NAV is determined separately for each class of shares of the Fund by dividing the Fund’s net assets attributable to that class by the number of shares of the class outstanding. Each class of shares offered by the Fund has equal rights as to assets and voting privileges (except that shareholders of a class have exclusive voting rights regarding any matter relating solely to that class of shares). Income and non-class specific expenses are allocated daily to each class on the basis of the relative net assets of the class. Realized and unrealized capital gains and losses of each class are allocated daily based on the relative net assets of each class of shares of the Fund. |
Orders for the purchase of the Fund’s shares received prior to the close of the Exchange on any day the Exchange is open for business are priced at the NAV determined as of the close of the Exchange. Orders received after the close of the Exchange, or on a day on which the Exchange and/or the Fund is not open for business, are priced at the next determined NAV.
Dividends are declared pursuant to a policy adopted by the Company’s Board of Directors based upon the investment performance of the Fund. The policy of the Fund is to pay dividends from net investment income and realized capital gains, if any, at least once a year.
Distributions from net investment income, net realized capital gains and capital are determined in accordance with federal income tax regulations, which may differ from U.S. GAAP with respect to character and timing. These differences may include but are not limited to losses deferred due to wash sale adjustments, foreign currency gains and losses, adjustments related to Passive Foreign Investment Companies (“PFICs”), Real Estate Investment Trusts (“REITs”), Regulated Investment Companies (“RICs”), certain derivatives and partnerships. Permanent book and federal income tax basis differences relating to shareholder distributions will result in reclassifications to certain of the Fund’s capital accounts (see Federal Income Taxes: Reclassification of Capital Accounts note).
| 3. | Securities and Other Investments: |
| a) | Repurchase Agreements – A repurchase agreement is an agreement by which a counterparty agrees to sell a security and agrees to repurchase the security sold at a mutually agreed upon time and price. At the time the Fund enters into a repurchase agreement, the value of the underlying collateral security(ies), including accrued interest, will be equal to or exceed the value of the repurchase agreement. Repurchase agreements expose the Fund to counterparty risk. To minimize counterparty risk, the securities that serve to collateralize the repurchase agreement are held by the Fund's custodian in book entry or physical form in the custodial account of the Fund or in a third party custodial account. Repurchase agreements are valued at cost plus accrued interest. The Fund, as shown on the Schedule of Investments, had outstanding repurchase agreements as of June 30, 2011. |
| b) | Illiquid and Restricted Securities – The Fund is permitted to invest up to 15% of its net assets in illiquid securities. Illiquid securities are those that may not be sold or disposed of in the ordinary course of business within seven days, at approximately the price used to determine the Fund’s NAV. The Fund may not be able to sell illiquid securities or other investments when its sub-adviser considers it desirable to do so or may have to sell such securities or investments at a price that is lower than the price that could be obtained if the securities or investments were more liquid. A sale of illiquid securities or other investments may require more time and may result in higher dealer discounts and other selling expenses than does the sale of those that are liquid. Illiquid securities and investments also may be more difficult to value, due to the unavailability of reliable market quotations for such securities or investments, and an investment in them may have an adverse impact on the Fund’s NAV. The Fund may also purchase certain restricted securities that can only be resold to certain qualified investors and may be determined to be liquid pursuant to policies and guidelines established by the Company’s Board of Directors. The Fund, as shown on the Schedule of Investments, had illiquid and/or restricted securities as of June 30, 2011. |
| c) | Securities Purchased on a When-Issued or Delayed-Delivery Basis – Delivery and payment for securities that have been purchased by the Fund on a forward commitment, or when-issued or delayed-delivery basis, take place beyond the customary settlement period. During this period, such securities are subject to market fluctuations, and the Fund identifies securities segregated in its records with value at least equal to the amount of the commitment. The Fund had no outstanding when-issued or delayed delivery securities as of June 30, 2011. |
| 4. | Financial Derivative Instruments: |
The following disclosures contain information on how and why the Fund uses derivative instruments, the credit-risk-related contingent features in certain derivative instruments, and how derivative instruments affect the Fund’s financial position, results of operations and cash flows. The location and fair value amounts of these instruments on the Statement of Assets and Liabilities and the realized gains and losses and changes in unrealized gains and losses on the Statement of
| Notes to Financial Statements – (continued) |
| June 30, 2011 (Unaudited) |
| (000’s Omitted) |
Operations, each categorized by type of derivative contract, are included in the following Additional Derivative Instrument Information footnote. The derivative instruments outstanding as of period-end are disclosed in the Notes to the Schedule of Investments and the amounts of realized gains and losses and changes in unrealized gains and losses on derivative instruments during the period are disclosed in the Statement of Operations.
| a) | Foreign Currency Contracts – The Fund may enter into foreign currency contracts that obligate the Fund to purchase or sell currencies at specified future dates. Foreign currency contracts are used to hedge the currency exposure associated with some or all of the Fund's securities and/or as part of an investment strategy. Foreign currency contracts are marked to market daily and the change in value is recorded by the Fund as an unrealized gain or loss. Realized gains or losses equal to the difference between the value of the contract at the time it was opened and the value at the time it was closed are recorded upon delivery or receipt of the currency. |
Foreign currency contracts involve elements of market risk in excess of the amounts reflected in the Statement of Assets and Liabilities. In addition, risks may arise upon entering into these contracts from the potential inability of the counterparties to meet the terms of the contracts and from unanticipated movements in the value of the foreign currencies relative to the U.S. dollar. The Fund had outstanding foreign currency contracts as shown on the Schedule of Investments as of June 30, 2011.
| b) | Additional Derivative Instrument Information: |
Fair Values of Derivative Instruments on the Statement of Assets and Liabilities as of June 30, 2011:
| Risk Exposure Category | ||||||||||||||||||||||||||||
| Foreign | ||||||||||||||||||||||||||||
| Interest Rate | Exchange | Credit | Equity | Commodity | Other | |||||||||||||||||||||||
| Contracts | Contracts | Contracts | Contracts | Contracts | Contracts | Total | ||||||||||||||||||||||
| Assets: | ||||||||||||||||||||||||||||
Unrealized appreciation on foreign currency contracts | $ | — | $ | 9 | $ | — | $ | — | $ | — | $ | — | $ | 9 | ||||||||||||||
| Total | $ | — | $ | 9 | $ | — | $ | — | $ | — | $ | — | $ | 9 | ||||||||||||||
| Liabilities: | ||||||||||||||||||||||||||||
Unrealized depreciation on foreign currency contracts | $ | — | $ | 3 | $ | — | $ | — | $ | — | $ | — | $ | 3 | ||||||||||||||
| Total | $ | — | $ | 3 | $ | — | $ | — | $ | — | $ | — | $ | 3 | ||||||||||||||
The volume of derivatives that is presented in the Schedule of Investments is consistent with the derivative activity during the six-month period ended June 30, 2011.
The Effect of Derivative Instruments on the Statement of Operations for the six-month period ended June 30, 2011:
| Risk Exposure Category | ||||||||||||||||||||||||||||
| Foreign | ||||||||||||||||||||||||||||
| Interest Rate | Exchange | Credit | Equity | Commodity | Other | |||||||||||||||||||||||
| Contracts | Contracts | Contracts | Contracts | Contracts | Contracts | Total | ||||||||||||||||||||||
| Realized Gain (Loss) on Derivatives Recognized as a Result from Operations: | ||||||||||||||||||||||||||||
Net realized loss on foreign currency contracts | $ | — | $ | (1,437 | ) | $ | — | $ | — | $ | — | $ | — | $ | (1,437 | ) | ||||||||||||
| Total | $ | — | $ | (1,437 | ) | $ | — | $ | — | $ | — | $ | — | $ | (1,437 | ) | ||||||||||||
| Net Change in Unrealized Appreciation (Depreciation) on Derivatives Recognized as a Result from Operations: | ||||||||||||||||||||||||||||
Net change in unrealized depreciation of foreign currency contracts | $ | — | $ | (620 | ) | $ | — | $ | — | $ | — | $ | — | $ | (620 | ) | ||||||||||||
| Total | $ | — | $ | (620 | ) | $ | — | $ | — | $ | — | $ | — | $ | (620 | ) | ||||||||||||
| 5. | Principal Risks: |
| a) | Counterparty Risk – The Fund may be exposed to counterparty risk, or the risk that an institution or other entity with which the Fund has unsettled or open transactions will default. |
| b) | Market Risks – If a Fund invests directly in foreign currencies or in securities that trade in, and receive revenues in, foreign currencies, or in derivatives that provide exposure to foreign currencies, it will be subject to the risk that those currencies will decline in value relative to the base currency of the Fund, or, in the case of hedging positions, that the Fund’s base currency will decline in value relative to the currency being hedged. Currency rates in foreign countries may fluctuate significantly over short periods of time for a number of reasons, including changes in interest rates, intervention (or the failure to intervene) by U.S. or foreign governments, central banks or supranational entities such as the International Monetary Fund, or by the imposition of currency controls or other political developments in the United States or abroad. As a result, the Fund’s investments in foreign currency denominated securities may reduce the returns of the Fund. The market values of equity securities, such as common stocks and preferred stocks or equity related investments such as futures and options, may decline due to general market conditions which are not specifically related to a particular company, such as real or perceived adverse economic conditions, changes in the general outlook for corporate earnings, changes in interest or currency rates or adverse investor sentiment generally. The market value of equity securities may also decline due to factors which affect a particular industry or industries, such as labor shortages or increased production costs and competitive conditions within an industry. Equity securities and equity related investments generally have greater market price volatility than fixed income securities. |
| 6. | Federal Income Taxes: |
| a) | Federal Income Taxes – For federal income tax purposes, the Fund intends to continue to qualify as a RIC under Subchapter M of the Internal Revenue Code (“IRC”) by distributing substantially all of its taxable net investment income and net realized capital gains to its shareholders and otherwise complying with the requirements of RICs. The Fund has distributed substantially all of its income and capital gains in prior years, if applicable, and intends to distribute substantially all of its income and capital gains prior to the next fiscal year-end. Accordingly, no provision for federal income or excise taxes has been made in the accompanying financial statements. Distributions from short-term capital gains are treated as ordinary income distributions for federal income tax purposes. |
| b) | Net Investment Income (Loss), Net Realized Gains (Losses) – Net investment income (loss) and net realized gains (losses) may differ for financial statement and tax purposes primarily because of losses deferred due to wash sale adjustments, foreign currency gains and losses, adjustments related to PFICs, REITs, RICs, certain derivatives and partnerships. The character of distributions made during the year from net investment income or net realized gains may differ from their ultimate characterization for federal income tax purposes. Also, due to the timing of dividend distributions, the fiscal year in which amounts are distributed may differ from the year that the income or realized gains (losses) were recorded by the Fund. |
| c) | Distributions and Components of Distributable Earnings – The tax character of distributions paid by the Fund for the periods indicated is as follows (as adjusted for dividends payable): |
| For the Year Ended | For the Year Ended | |||||||
| December 31, 2010 | December 31, 2009 | |||||||
| Ordinary Income | $ | 22,300 | $ | 24,984 | ||||
| Notes to Financial Statements – (continued) |
| June 30, 2011 (Unaudited) |
| (000’s Omitted) |
As of December 31, 2010, the Fund’s components of distributable earnings (deficit) on a tax basis were as follows:
| Amount | ||||
| Undistributed Ordinary Income | $ | 807 | ||
| Accumulated Capital and Other Losses* | (732,113 | ) | ||
Unrealized Appreciation† | 206,286 | |||
| Total Accumulated Deficit | $ | (525,020 | ) | |
| * | The Fund has capital loss carryforwards that are identified in the Capital Loss Carryforward note that follows. |
| † | The difference between book-basis and tax-basis unrealized appreciation (depreciation) may be attributable to the losses deferred due to wash sale adjustments, foreign currency gains and losses, adjustments related to PFICs, REITs, RICs, certain derivatives and partnerships. |
| d) | Reclassification of Capital Accounts – The Fund may record reclassifications in its capital accounts. These reclassifications have no impact on the total net assets of the Fund. The reclassifications are a result of permanent differences between U.S. GAAP and tax accounting for such items as expiration or utilization of capital loss carryforwards or net operating losses. Adjustments are made to reflect the impact these items have on current and future distributions to shareholders. Therefore, the source of the Fund’s distributable income may be shown in the accompanying Statement of Assets and Liabilities as from accumulated undistributed net investment income, from accumulated net realized gains on investments or from capital depending on the type of book and tax differences that exist. For the year ended December 31, 2010, the Fund recorded reclassifications to increase (decrease) the accounts listed below: |
| Amount | ||||
| Accumulated Undistributed Net Investment Income | $ | 3,557 | ||
| Accumulated Net Realized Gain (Loss) on Investments and Foreign Currency Transactions | (3,557 | ) | ||
| e) | Capital Loss Carryforward – At December 31, 2010 (tax-year-end), the Fund had capital loss carryforwards for U.S. federal income tax purposes of approximately: |
| Year of Expiration | Amount | |||
| 2015 | $ | 47,010 | ||
| 2016 | 397,126 | |||
| 2017 | 287,600 | |||
| Total | $ | 731,736 | ||
As a result of current or past mergers in the Fund, certain provisions in the Internal Revenue Code may limit the future utilization of capital losses. As of December 31, 2010, the Fund utilized $255,602 of prior year capital loss carryforwards.
As of December 31, 2010, the Fund elected to defer the following post-October losses:
| Amount | ||||
| Ordinary Income | $ | 377 | ||
| f) | Accounting for Uncertainty in Income Taxes – The Fund has adopted financial reporting rules that require the Fund to analyze all open tax years, as defined by the Statute of Limitations, for all major jurisdictions. Generally, tax authorities can examine all tax returns filed for the last three years. The Fund does not have an examination in progress. |
The Fund has reviewed all open tax years and major jurisdictions and concluded that these financial reporting rules had no effect on the Fund’s financial position or results of operations. There is no tax liability resulting from unrecognized tax benefits relating to uncertain income tax positions taken or expected to be taken on the tax return for the fiscal year-
end December 31, 2010. The Fund is also not aware of any tax positions for which it is reasonably possible that the total amounts of unrecognized tax benefits will significantly change in the next twelve months.
| 7. | Expenses: |
| a) | Investment Management Agreements – HL Investment Advisors, LLC (“HL Advisors”), an indirect wholly owned subsidiary of The Hartford Financial Services Group, Inc. (“The Hartford”), serves as investment manager to the Fund pursuant to an Investment Management Agreement with the Company. As investment manager, HL Advisors has overall investment supervisory responsibility for the Fund. In addition, HL Advisors provides administrative personnel, services, equipment, facilities and office space for proper operation of the Fund. HL Advisors has contracted with Wellington Management Company, LLP (“Wellington Management”) under a sub-advisory agreement for the provision of day-today investment management services to the Fund in accordance with the Fund’s investment objective and policies. The Fund pays a fee to HL Advisors, a portion of which may be used to compensate Wellington Management. |
The schedule below reflects the rates of compensation paid to HL Advisors for investment management services rendered as of June 30, 2011; the rates are accrued daily and paid monthly.
| Average Daily Net Assets | Annual Fee | |||
| On first $250 million | 0.7750 | % | ||
| On next $250 million | 0.7250 | % | ||
| On next $500 million | 0.6750 | % | ||
| On next $4 billion | 0.6250 | % | ||
| On next $5 billion | 0.6225 | % | ||
| Over $10 billion | 0.6200 | % | ||
| b) | Accounting Services Agreement – Pursuant to the Fund Accounting Agreement between HLIC and the Company, on behalf of the Fund, HLIC provides accounting services to the Fund and receives monthly compensation based on the Fund’s average net assets at the rates set forth below. The Fund’s accounting services fees are accrued daily and paid monthly. |
| Average Daily Net Assets | Annual Fee | |||
| On first $5 billion | 0.016 | % | ||
| On next $5 billion | 0.014 | % | ||
| Over $10 billion | 0.012 | % | ||
| c) | Operating Expenses – Allocable expenses incurred by the Company are allocated to each Fund and allocated to classes within a Fund in proportion to the average daily net assets of the Fund and each class, except where allocation of certain expenses is more fairly made directly to the Fund or to specific classes within a Fund. |
| d) | Fees Paid Indirectly – The Company, on behalf of the Fund, has entered into agreements with State Street Global Markets, LLC and Russell Implementation Services, Inc. to partially recapture non-discounted trade commissions. Such rebates are used to pay a portion of the Fund’s expenses. In addition, the Fund’s custodian bank has also agreed to reduce its fees when the Fund maintains cash on deposit in a non-interest-bearing custody account. For the six-month period ended June 30, 2011, these amounts are included in the Statement of Operations. |
| Notes to Financial Statements – (continued) |
| June 30, 2011 (Unaudited) |
| (000’s Omitted) |
The ratio of expenses to average net assets in the accompanying financial highlights excludes the reduction in expenses related to fees paid indirectly. The annualized expense ratio for the period listed below including the fees paid indirectly is as follows:
| Annualized Six- | ||||
| Month Period | ||||
| Ended June 30, | ||||
| 2011 | ||||
| Class IA | 0.72 | % | ||
| Class IB | 0.97 | |||
| e) | Distribution Plan for Class IB shares – The Company, on behalf of the Fund, has adopted a Distribution Plan pursuant to Rule 12b-1 of the 1940 Act to compensate the Distributor, Hartford Securities Distribution Company, Inc. (a wholly owned, ultimate subsidiary of The Hartford), from assets attributable to the Class IB shares for services rendered and expenses borne in connection with activities primarily intended to result in the sale of the Class IB shares, subject to the review and approval of the Company’s Board of Directors. |
The Distribution Plan provides that the Fund may pay annually up to 0.25% of the average daily net assets of the Fund attributable to its Class IB shares for activities primarily intended to result in the sale of Class IB shares. The Board has the authority to suspend or reduce these payments at any point in time. Under the terms of the Distribution Plan and the principal underwriting agreement, the Fund is authorized to make payments monthly to the Distributor that may be used to pay or compensate entities providing distribution and shareholder servicing with respect to the Class IB shares for such entities’ fees or expenses incurred or paid in that regard. These fees are accrued daily and paid monthly.
| f) | Other Related Party Transactions – Certain officers of the Fund are directors and/or officers of HL Advisors and/or The Hartford or its subsidiaries. For the six-month period ended June 30, 2011, a portion of the Fund’s chief compliance officer’s salary was paid by all the investment companies in the Hartford fund complex. The portion allocated to the Fund was in the amount of $2. Hartford Administrative Services Company (“HASCO”), an indirect wholly owned subsidiary of The Hartford, provides transfer agent services to the Fund. The amount paid to HASCO can be found in the Statement of Operations. These fees are accrued daily and paid monthly. |
| g) | Payments from Affiliates – In July of 2007, The Hartford entered into a settlement with the Attorneys General of the states of New York, Connecticut and Illinois relating to market timing and the company's individual variable annuity contracts in which certain payments would be made directly to the variable annuity contract holders. The distribution plan provided that unclaimed money from the settlement would be distributed to certain HLS Funds that are investment options through a Hartford individual variable annuity contract. The unclaimed money was distributed to the Fund on September 18, 2009, as follows: |
| Amount | ||||
| Reimbursement | $ | 3,351 | ||
On November 8, 2006, the SEC issued an order setting forth the terms of a settlement reached with three subsidiaries of The Hartford that resolved the SEC’s Division of Enforcement’s investigation of aspects of The Hartford’s variable annuity and mutual fund operations related to directed brokerage and revenue sharing. The Hartford settled this matter without admitting or denying the findings of the SEC.
The total return in the accompanying financial highlights includes payments from affiliates. Had the payments from the affiliates been excluded, the impact and total return for the periods listed below would have been as follows:
| For the Year Ended December 31, 2009 | ||||||||
| Class IA | Class IB | |||||||
| Impact from Payment from Affiliate for Attorneys General Settlement | 0.23 | % | 0.23 | % | ||||
| Total Return Excluding Payment from Affiliate | 33.15 | 32.83 | ||||||
| For the Year Ended December 31, 2006 | ||||||||
| Class IA | Class IB | |||||||
| Impact from Payment from Affiliate for SEC Settlement | 0.02 | % | 0.02 | % | ||||
| Total Return Excluding Payment from Affiliate | 24.44 | 24.13 | ||||||
| 8. | Investment Transactions: |
For the six-month period ended June 30, 2011, the Fund's aggregate purchases and sales of investment securities (excluding short-term investments) were as follows:
| Amount | ||||
| Cost of Purchases Excluding U.S. Government Obligations | $ | 1,174,127 | ||
| Sales Proceeds Excluding U.S. Government Obligations | 1,352,749 | |||
| 9. | Line of Credit: |
The Fund is one of several Hartford funds that participate in a $500 million committed revolving line of credit facility. The facility is to be used for temporary or emergency purposes. Under the arrangement, a fund is required to own securities having a market value in excess of 300% of the total bank borrowings. The interest rate on borrowings varies depending on the nature of the loan. The facility also requires a fee to be paid based on the amount of the commitment. This commitment fee is allocated to all the funds participating in the line of credit based on the average net assets of the funds. During the six-month period ended June 30, 2011, the Fund did not have any borrowings under this facility.
| 10. | Industry Classifications: |
Other than the industry classifications “Other Investment Pools and Funds” and “Exchange Traded Funds,” equity industry classifications used in this report are the Global Industry Classification Standard, which was developed by and is the exclusive property and service mark of MSCI, Inc. and Standard & Poor’s.
| 11. | Proceeds from Regulatory Settlement: |
During the year ended December 31, 2010, as a result of a settlement of an administrative proceeding brought by the SEC against an unaffiliated third party relating to market timing and/or late trading of mutual funds, the Fund received $668, which represented the Fund’s portion of the proceeds from the settlement (the Fund was not a party to the proceeding). The proceeds received by the Fund were recorded as an increase to additional paid-in-capital. The payment did not have a material impact on the Fund’s NAV.
| 12. | Indemnifications: |
Under the Company’s organizational documents, the Company shall indemnify its officers and directors to the full extent required or permitted under Maryland General Corporation Law and the federal securities laws. In addition, the Company, on
behalf of the Fund, may enter into contracts that contain a variety of indemnifications. The Company’s maximum exposure under these arrangements is unknown. However, as of the date of these financial statements the Company has not had prior claims or losses pursuant to these contracts and expects the risk of loss to be remote.
[This page is intentionally left blank]
| Financial Highlights |
| - Selected Per-Share Data (A) - |
| Net Asset | Net Realized | Net Increase | ||||||||||||||||||||||||||||||||||||||||||
| Value at | and Unrealized | Total from | Dividends from | Distributions | (Decrease) in | Net Asset | ||||||||||||||||||||||||||||||||||||||
| Beginning of | Net Investment | Payments from | Gain (Loss) on | Investment | Net Investment | from Realized | Distributions | Total | Net Asset | Value at End of | ||||||||||||||||||||||||||||||||||
| Class | Period | Income (Loss) | (to) Affiliate | Investments | Operations | Income | Capital Gains | from Capital | Distributions | Value | Period | |||||||||||||||||||||||||||||||||
| For the Six-Month Period Ended June 30, 2011 (Unaudited) | ||||||||||||||||||||||||||||||||||||||||||||
| IA | $ | 12.46 | $ | 0.15 | $ | – | $ | 0.25 | $ | 0.40 | $ | – | $ | – | $ | – | $ | – | $ | 0.40 | $ | 12.86 | ||||||||||||||||||||||
| IB | 12.61 | 0.14 | – | 0.25 | 0.39 | – | – | – | – | 0.39 | 13.00 | |||||||||||||||||||||||||||||||||
| For the Year Ended December 31, 2010(G) | ||||||||||||||||||||||||||||||||||||||||||||
| IA | 11.01 | 0.13 | – | 1.46 | 1.59 | (0.14 | ) | – | – | (0.14 | ) | 1.45 | 12.46 | |||||||||||||||||||||||||||||||
| IB | 11.15 | 0.11 | – | 1.46 | 1.57 | (0.11 | ) | – | – | (0.11 | ) | 1.46 | 12.61 | |||||||||||||||||||||||||||||||
| For the Year Ended December 31, 2009 | ||||||||||||||||||||||||||||||||||||||||||||
| IA | 8.40 | 0.16 | 0.03 | 2.61 | 2.80 | (0.19 | ) | – | – | (0.19 | ) | 2.61 | 11.01 | |||||||||||||||||||||||||||||||
| IB | 8.51 | 0.14 | 0.03 | 2.64 | 2.81 | (0.17 | ) | – | – | (0.17 | ) | 2.64 | 11.15 | |||||||||||||||||||||||||||||||
| For the Year Ended December 31, 2008 | ||||||||||||||||||||||||||||||||||||||||||||
| IA | 15.62 | 0.28 | – | (6.68 | ) | (6.40 | ) | (0.28 | ) | (0.54 | ) | – | (0.82 | ) | (7.22 | ) | 8.40 | |||||||||||||||||||||||||||
| IB | 15.78 | 0.27 | – | (6.76 | ) | (6.49 | ) | (0.24 | ) | (0.54 | ) | – | (0.78 | ) | (7.27 | ) | 8.51 | |||||||||||||||||||||||||||
| For the Year Ended December 31, 2007 | ||||||||||||||||||||||||||||||||||||||||||||
| IA | 15.23 | 0.18 | – | 3.77 | 3.95 | (0.19 | ) | (3.37 | ) | – | (3.56 | ) | 0.39 | 15.62 | ||||||||||||||||||||||||||||||
| IB | 15.36 | 0.16 | – | 3.78 | 3.94 | (0.15 | ) | (3.37 | ) | – | (3.52 | ) | 0.42 | 15.78 | ||||||||||||||||||||||||||||||
| For the Year Ended December 31, 2006 | ||||||||||||||||||||||||||||||||||||||||||||
| IA | 13.59 | 0.22 | – | 3.05 | 3.27 | (0.40 | ) | (1.23 | ) | – | (1.63 | ) | 1.64 | 15.23 | ||||||||||||||||||||||||||||||
| IB | 13.52 | 0.18 | – | 3.07 | 3.25 | (0.18 | ) | (1.23 | ) | – | (1.41 | ) | 1.84 | 15.36 | ||||||||||||||||||||||||||||||
| (A) | Information presented relates to a share outstanding throughout the indicated period. |
| (B) | The figures do not include sales charges or other fees which may be applied at the variable life insurance, variable annuity or qualified retirement plan product level. Any such additional sales charges or other fees would lower the Fund's performance. |
| (C) | Ratios do not reflect reductions for fees paid indirectly. Please see Fees Paid Indirectly in the Notes to Financial Statements. |
| (D) | Portfolio turnover rate is calculated on the basis of the Fund as a whole without distinguishing between the classes of shares issued. |
| (E) | Not annualized. |
| (F) | Annualized. |
| (G) | Per share amounts have been calculated using the average shares method. |
| (H) | During the year ended December 31, 2010, the Fund incurred $456.2 million in sales associated with the transition of assets from Hartford International Growth HLS Fund and Hartford International Small Company HLS Fund, which merged into the Fund on April 16, 2010. These sales were excluded from the portfolio turnover calculation. |
| (I) | Total return without the inclusion of the Payment from (to) Affiliate can be found in Expenses in the accompanying Notes to Financial Statements. |
| - Ratios and Supplemental Data - |
| Ratio of Expenses to Average Net | Ratio of Expenses to Average Net | Ratio of Net Investment Income to | Portfolio Turnover | |||||||||||||||||||
| Total Return(B) | Net Assets at End of Period | Assets Before Waivers(C) | Assets After Waivers(C) | Average Net Assets | Rate(D) | |||||||||||||||||
| 3.18 | %(E) | $ | 1,666,998 | 0.72 | %(F) | 0.72 | %(F) | 2.30 | %(F) | 59 | % | |||||||||||
| 3.05 | (E) | 301,906 | 0.97 | (F) | 0.97 | (F) | 2.03 | (F) | – | |||||||||||||
| 14.49 | 1,705,757 | 0.74 | 0.74 | 1.19 | 128 | (H) | ||||||||||||||||
| 14.20 | 328,671 | 0.99 | 0.99 | 0.94 | – | |||||||||||||||||
| 33.46 | (I) | 1,247,179 | 0.76 | 0.76 | 1.68 | 152 | ||||||||||||||||
| 33.13 | (I) | 216,882 | 1.01 | 1.01 | 1.43 | – | ||||||||||||||||
| (42.25 | ) | 1,046,234 | 0.71 | 0.71 | 2.21 | 158 | ||||||||||||||||
| (42.39 | ) | 189,221 | 0.96 | 0.96 | 1.96 | – | ||||||||||||||||
| 27.43 | 2,027,078 | 0.71 | 0.71 | 1.13 | 135 | |||||||||||||||||
| 27.11 | 417,144 | 0.96 | 0.96 | 0.89 | – | |||||||||||||||||
| 24.46 | (I) | 1,596,055 | 0.75 | 0.75 | 1.47 | 119 | ||||||||||||||||
| 24.15 | (I) | 382,371 | 1.00 | 1.00 | 1.24 | – | ||||||||||||||||
| Directors and Officers (Unaudited) |
The Board of Directors of the Company appoints officers who are responsible for the day-to-day operations of the Fund and who execute policies formulated by the Directors. Each director serves until his or her death, resignation, or retirement or until the next annual meeting of shareholders is held or until his or her successor is elected and qualifies.
Directors and officers who are employed by or who have a financial interest in The Hartford are considered “interested” persons of the Fund pursuant to the 1940 Act. Each officer and two of the Company’s directors, as noted in the chart below, are “interested” persons of the Fund. Each director serves as a director for The Hartford Mutual Funds, Inc., The Hartford Mutual Funds II, Inc., Hartford Series Fund, Inc., and Hartford HLS Series Fund II, Inc., which, as of June 30, 2011, collectively consist of 89 funds. Correspondence may be sent to directors and officers c/o Hartford Mutual Funds, P.O. Box 2999, Hartford, Connecticut 06104-2999, except that correspondence to Ms. Fagely may be sent to 500 Bielenberg Drive, Woodbury, Minnesota 55125.
The table below sets forth, for each director and officer, his or her name, year of birth, current position with the Company and date first elected or appointed to Hartford Series Fund, Inc. (“HSF”), and Hartford HLS Series Fund II, Inc. (“HSF2”), principal occupation, and, for directors, other directorships held. The Fund’s statement of additional information contains further information on the directors and is available free of charge by calling 1-800-862-6668 or writing to Hartford HLS Funds, c/o Individual Annuity Services, P.O. Box 5085, Hartford, CT 06102-5085.
Information on the aggregate remuneration paid to the directors of the Company can be found in the Statement of Operations herein. The Fund pays to The Hartford a portion of the chief compliance officer’s compensation, but does not pay salaries or compensation to any of their other officers or directors who are employed by The Hartford.
Non-Interested Directors
Lynn S. Birdsong (1946) Director since 2003, Co-Chairman of the Investment Committee
Mr. Birdsong is a private investor. Mr. Birdsong currently serves as a Director of the Sovereign High Yield Investment Company (April 2010 to current). Mr. Birdsong currently serves as an Independent Director of Nomura Partners Funds, Inc. (formerly, The Japan Fund) (March 2003 to current). From 2003 to March 2005, Mr. Birdsong was an independent director of the Atlantic Whitehall Funds. From 1979 to 2002, Mr. Birdsong was a managing director of Zurich Scudder Investments, an investment management firm. During his employment with Scudder, Mr. Birdsong was an Interested Director of The Japan Fund. Since 1981, Mr. Birdsong has been a partner in Birdsong Company, an advertising specialty firm.
Robert M. Gavin, Jr. (1940) Director since 2002 (HSF) and 1986 (HSF2), Chairman of the Board since 2004
Dr. Gavin is an educational consultant. Prior to September 1, 2001, he was President of Cranbrook Education Community and prior to July 1996, he was President of Macalester College, St. Paul, Minnesota.
Duane E. Hill (1945) Director since 2001 (HSF) and 2002 (HSF2), Chairman of the Nominating Committee
Mr. Hill is Partner of TSG Ventures L.P., a private equity investment company. Mr. Hill is a former partner of TSG Capital Group, a private equity investment firm that served as sponsor and lead investor in leveraged buyouts of middle market companies.
Sandra S. Jaffee (1941) Director since 2005
Ms. Jaffee served as Chairman (2008 to 2009) and Chief Executive Officer of Fortent (formerly Searchspace Group), a leading provider of compliance/regulatory technology to financial institutions from August 2005 to August 2009. From August 2004 to August 2005, Ms. Jaffee served as an Entrepreneur in Residence with Warburg Pincus, a private equity firm. From September 1995 to July 2004, Ms. Jaffee served as Executive Vice President at Citigroup, where she was President and Chief Executive Officer of Citibank’s Global Securities Services (1995 to 2003). Ms. Jaffe currently serves as a member of the Board of Directors of Broadridge Financial Solutions as well as a Trustee of Muhlenberg College.
William P. Johnston (1944) Director since 2005, Chairman of the Compliance Committee
In June 2006, Mr. Johnston was appointed as Senior Advisor to The Carlyle Group, a global private equity investment firm. In July 2006, Mr. Johnston was elected to the Board of Directors of MultiPlan, Inc. In August 2007, Mr. Johnston was elected to the Board of Directors of LifeCare Holdings, Inc. In February 2008, Mr. Johnston was elected to the Board of Directors of HCR-ManorCare, Inc. In May 2006, Mr. Johnston was elected to the Supervisory Board of Fresenius Medical Care AG & Co. KGaA, after its acquisition of Renal Care Group, Inc. in March 2006. Mr. Johnston joined Renal Care Group in November 2002 as a member of the Board of Directors and served as Chairman of the Board from March 2003 through March 2006. From September 1987 to December 2002, Mr. Johnston was with Equitable Securities Corporation (and its successors, SunTrust Equitable Securities and SunTrust Robinson Humphrey) serving in various investment banking and managerial positions, including Managing Director and Head of Investment Banking, Chief Executive Officer and Vice Chairman.
Phillip O. Peterson (1944) Director since 2002 (HSF) and 2000 (HSF2), Chairman of the Audit Committee
Mr. Peterson is a mutual fund industry consultant. He was a partner of KPMG LLP (an accounting firm) until July 1999. Mr. Peterson joined William Blair Funds in February 2007 as a member of the Board of Trustees. From January 2004 to April 2005, Mr. Peterson served as Independent President of the Strong Mutual Funds.
Lemma W. Senbet (1946) Director since 2005
Dr. Senbet is the William E. Mayer Chair Professor of Finance and Director, Center for Financial Policy, at the University of Maryland, Robert H. Smith School of Business. He was chair of the Finance Department from 1998 to 2006. Previously he was a chaired professor of finance at the University of Wisconsin-Madison. Also, he was director of the Fortis Funds from March 2000 to July 2002. Dr. Senbet served the finance profession in various capacities, including as director of the American Finance Association and President of the Western Finance Association. In 2006, Dr. Senbet was inducted Fellow of Financial Management Association International for his career-long distinguished scholarship and professional service.
Interested Directors and Officers
David N. Levenson (1966) Director since 2010
Mr. Levenson currently serves as President of The Hartford’s Wealth Management business. He was appointed to this role in July 2010. Previously, Mr. Levenson served as Executive Vice President of Legacy Holdings for The Hartford from June 2009 to July 2010. From 2006 to 2009, Mr. Levenson was with Hartford Life Insurance K.K. where he served as President and CEO from 2007 to 2009. He served as Managing Director of Hartford Investment Management Company from 2005 to 2006. Additionally, Mr. Levenson serves as Executive Vice President of The Hartford and as President, Director and Chief Executive Officer of Hartford Life Insurance Company (“HLIC”) and Hartford Life, Inc. (“HL Inc.”).
Lowndes A. Smith (1939) Director since 1996 (HSF) and 2002 (HSF2), Co-Chairman of the Investment Committee
Mr. Smith served as Vice Chairman of The Hartford from February 1997 to January 2002, as President and Chief Executive Officer of HL Inc. from February 1997 to January 2002, and as President and Chief Operating Officer of The Hartford Life Insurance Companies from January 1989 to January 2002. Mr. Smith serves as a Director of White Mountains Insurance Group, Ltd., One Beacon Insurance and Symetra Financial and as a Managing Director of Whittington Gray Associates.
Other Officers
James E. Davey (1964) President and Chief Executive Officer since 2010
Mr. Davey serves as Executive Vice President of HLIC. Additionally, Mr. Davey serves as President, Chief Executive Officer and Manager of Hartford Investment Financial Services, Inc. (“HIFSCO”) and President, Chief Executive Officer and Manager of HL Advisors. Mr. Davey joined The Hartford in 2002.
Tamara L. Fagely (1958) Vice President, Treasurer and Controller since 2002 (HSF) and 1993 (HSF2)
Ms. Fagely has been a Vice President of HASCO since 1998 and Chief Financial Officer since 2006. Currently Ms. Fagely is a Vice President of HLIC. She served as Assistant Vice President of HLIC from December 2001 through March 2005. In addition, Ms. Fagely is Controller and Chief Financial Officer of HIFSCO.
Susan M. Fleege (1959) AML Compliance Officer since 2011
Ms. Fleege currently serves as a Director of Risk Management at The Hartford. She previously served as AML Compliance Officer for the Fund from 2005-2008. Ms. Fleege joined HLIC in 2005 from Amerprise Financial Corporation where she held the position of Counsel from 2000 to 2005. Ms. Fleege is a certified Anti-Money Laundering Specialist.
Dr. Robert J. Froehlich (1953) Senior Managing Director since 2009
Dr. Froehlich joined The Hartford as Senior Managing Director in September 2009. Prior to joining The Hartford, Dr. Froehlich served as Vice Chairman of Deutsche Asset Management from 1997-2009.
Edward P. Macdonald (1967) Vice President, Secretary and Chief Legal Officer since 2005
Mr. Macdonald serves as Vice President of HLIC and Chief Legal Officer of Mutual Funds and Vice President of HIFSCO. He also serves as Vice President and Secretary of HASCO, and Chief Legal Officer, Secretary and Vice President of HL Advisors. Mr. Macdonald joined The Hartford in 2005.
Vernon J. Meyer (1964) Vice President since 2006
Mr. Meyer serves as Senior Vice President of HLIC. He also serves as Senior Vice President of HIFSCO and HL Advisors. Mr. Meyer joined The Hartford in 2004.
Colleen B. Pernerewski (1969) Vice President and Chief Compliance Officer since 2010
Ms. Pernerewski serves as Vice President and Chief Investment Advisor Compliance Officer of HIFSCO and as Vice President and Chief Compliance Officer of HL Advisors. Ms. Pernerewski joined The Hartford in 2005 from Travelers Life and Annuity where she served as Counsel (2004-2005). Prior to Travelers Life and Annuity, Ms. Pernerewski held the position of Counsel at The Hartford (1998-2004).
Elizabeth L. Schroeder (1966) Vice President since 2010
Ms. Schroeder currently serves as Assistant Vice President of HLIC. Ms. Schroeder joined HLIC in 1991. She is also an Assistant Vice President of HIFSCO and HL Advisers.
Martin Swanson (1962) Vice President since 2010
Mr. Swanson is a Vice President of HLIC. Mr. Swanson also serves as Vice President/Marketing for HIFSCO. Prior to joining HLIC in 1998, Mr. Swanson was a Vice President at PaineWebber, Inc.
Jane Wolak (1961) Vice President since 2009
Ms. Wolak currently serves as Senior Vice President of HLIC. Ms. Wolak joined HLIC as Vice President, Retail Product Services in May 2007. She is also Vice President of HASCO. Previously, Ms. Wolak was with Sun Life Financial where she held the position of Vice President, Service Center Operations from 2001-2007.
A description of the policies and procedures that the Fund uses to determine how to vote proxies relating to portfolio securities and a record of how the Fund voted any proxies for the twelve-month period ended June 30, 2011 are available (1) without charge, upon request, by calling 800-862-6668 and (2) on the SEC’s website at http://www.sec.gov.
The Fund files a complete schedule of portfolio holdings with the SEC for the first and third quarters of each fiscal year on Form N-Q. The Fund’s Forms are available (1) without charge, upon request, by calling 800-862-6668 and (2) on the SEC’s website at http://www.sec.gov. The Form N-Q may be reviewed and copied at the SEC’s Public Reference Room in Washington, DC. Information on the operation of the Public Reference Room may be obtained by calling 1-800-SEC-0330.
| Expense Example (Unaudited) |
Your Fund's Expenses
As a shareholder of the Fund, you incur two types of costs: (1) transaction costs and (2) ongoing costs including investment management fees, distribution fees, and other fund expenses. This example is intended to help you understand your ongoing costs (in dollars) of investing in a Fund and to compare these costs with the ongoing costs of investing in other mutual funds. The example is based on an investment of $1,000 invested at the beginning of the period and held for the period of December 31, 2010 through June 30, 2011.
Actual Expenses
The first set of columns of the table below provides information about actual account values and actual expenses. You may use the information in this column, together with the amount you invested, to estimate the expenses that you paid over the period. Simply divide your account value by $1,000 (for example, an $8,600 account value divided by $1,000 = 8.6), then multiply the result by the number in the line under the heading entitled “Expenses Paid During Period” to estimate the expenses you paid on your account during this period.
Hypothetical Example for Comparison Purposes
The second set of columns of the table below provides information about hypothetical account values and hypothetical expenses based on a Fund's actual expense ratio and an assumed rate of return of 5% per year before expenses, which is not the Fund's actual return. The hypothetical account values and expenses may not be used to estimate the actual ending account balance or expenses you paid for the period. You may use this information to compare the ongoing costs of investing in a Fund and other funds. To do so, compare this 5% hypothetical example with the 5% hypothetical examples that appear in the shareholder reports of the other funds.
Please note that the expenses shown in the table are meant to highlight your ongoing costs only and do not reflect any transactional costs, such as sales charges (loads) and CDSC. Therefore, the second set of columns of the table is useful in comparing ongoing costs only, and will not help you determine the relative total costs of owning different funds. In addition, if these transactional costs were included, your costs would be higher. Expenses are equal to the Fund's annualized expense ratios multiplied by average account value over the period, multiplied by 181/365 (to reflect the one-half year period).
| Actual return | Hypothetical (5% return before expenses) | |||||||||||||||||||||||||||||||||||
| Expenses paid | Expenses paid | Days in | ||||||||||||||||||||||||||||||||||
| during the period | during the period | the | Days | |||||||||||||||||||||||||||||||||
| Beginning | Ending | December 31, 2010 | Beginning | Ending | December 31, 2010 | Annualized | current | in the | ||||||||||||||||||||||||||||
| Account Value | Account Value | through | Account Value | Account Value | through | expense | 1/2 | full | ||||||||||||||||||||||||||||
| December 31, 2010 | June 30, 2011 | June 30, 2011 | December 31, 2010 | June 30, 2011 | June 30, 2011 | ratio | year | year | ||||||||||||||||||||||||||||
| Class IA | $ | 1,000.00 | $ | 1,031.79 | $ | 3.63 | $ | 1,000.00 | $ | 1,021.22 | $ | 3.61 | 0.72 | % | 181 | 365 | ||||||||||||||||||||
| Class IB | $ | 1,000.00 | $ | 1,030.50 | $ | 4.88 | $ | 1,000.00 | $ | 1,019.98 | $ | 4.86 | 0.97 | % | 181 | 365 | ||||||||||||||||||||
29
The Hartford
P.O. Box 5085
Hartford, CT 06102-5085
Hartford Series Fund, Inc. is underwritten and distributed by Hartford Securities Distribution Company, Inc.
"The Hartford" is The Hartford Financial Services Group, Inc. and its subsidiaries.
Hartford Series Fund, Inc. inception dates range from 1977 to date. Hartford Series Fund, Inc. is not a subsidiary of The Hartford but is underwritten, distributed by and advised by subsidiaries of The Hartford. Investments in Hartford Series Fund, Inc. are not guaranteed by The Hartford or any other entity.
You should carefully consider investment objectives, risks, and charges and expenses of Hartford HLS Funds before investing. This and other information can be found in the Fund’s prospectus or summary prospectus, which can be obtained by calling 800-862-6668. Please read them carefully before you invest or send money.
| HLSSAR-I011 8-11 106632 Printed in U.S.A ©2011 The Hartford, Hartford, CT 06115 |

A MESSAGE FROM THE PRESIDENT

Dear Fellow Shareholders:
I want to take this opportunity to say thank you for your continued confidence and trust.
We have seen a significant amount of global turbulence in the first half of 2011. Investors have continued to be concerned about the implications of the European sovereign debt crisis, as well as our own high levels of domestic debt. Since January we have witnessed significant political uprisings in the already-volatile Middle East and North Africa region. In addition, the ramifications of Japan's massive earthquake, subsequent tsunami, and nuclear disaster are still being played out in the market.
Although corporate earnings have remained robust, the unemployment picture has been mixed. After adding more than 200,000 jobs from February to April, more recent unemployment reports have shown a pullback in hiring.
While official inflation remains low as measured by the Consumer Price Index (CPI), high oil prices may be indicative of higher inflation in the future. The federal funds rate remains at a historic low, however, the Fed could potentially raise the rate to get it closer to its historical average once the economy strengthens.
Even with these headwinds, domestic, international, and world indices (as measured by the S&P 500, MSCI EAFE and MSCI World) are all up more than 5% through June, 30 2011.
Looking ahead, continued growth in emerging markets is fueling global recovery efforts. Emerging markets comprise about 48 percent of the world’s GDP, and many economists believe they are poised for further expansion. As GDP growth continues in emerging markets, roughly 100 million people are added to the middle class each year. This middle class population growth could potentially drive a considerable shift in consumer purchasing power.
Now that we have reached the midpoint of 2011, perhaps now would be a good time to schedule a meeting with your financial adviser to examine your current investment strategy and determine whether you are on the right track.
| • | Are you concerned about inflation and its effects on your portfolio? |
| • | Is your portfolio prepared for rising interest rates? |
| • | Does your portfolio reflect the global economy with a mix of developed nations and emerging markets? |
Your financial professional’s advice can help you to navigate today’s volatile markets with confidence. You can also rest assured that we will continue to provide you with solid investments and stellar service for the road ahead.
Thank you again for your business.

James Davey
President
Hartford HLS Funds
Hartford MidCap HLS Fund
| Manager Discussion (Unaudited) | 2 |
| Financial Statements | |
| 5 | |
| 8 | |
| 9 | |
| 10 | |
| 11 | |
| 12 | |
| 22 | |
| 24 | |
| 26 | |
| 26 | |
| 27 |
This report is prepared for the general information of contract owners and qualified retirement plan participants. It is not an offer of contracts or of qualified retirement plans. It should not be used in connection with any offer, except in conjunction with the appropriate product prospectus which contains all pertinent information including the applicable sales, administrative and other charges.
The views expressed in the Fund’s Manager Discussion under ‘‘Why did the Fund perform this way?’’ and ‘‘What is the outlook?’’ are views of the Fund’s sub-adviser and portfolio management team through the end of the reporting period and are subject to change based on market and other conditions.
Hartford MidCap HLS Fund* inception 07/14/1997 |
| (sub-advised by Wellington Management Company, LLP) |
Investment objective – Seeks long-term growth of capital. |
Performance Overview 6/30/01 - 6/30/11

The chart above shows the growth of a $10,000 investment in Class IA. Growth results in classes other than Class IA will vary from what is seen above due to differences in the expenses charged to those share classes.
Average Annual Total Returns (as of 6/30/11)
| 6 Month† | 1 Year | 5 year | 10 year | |||||
| MidCap IA | 6.94% | 33.37% | 6.89% | 8.64% | ||||
| MidCap IB | 6.80% | 33.02% | 6.62% | 8.38% | ||||
| S&P MidCap 400 Index | 8.56% | 39.38% | 6.60% | 7.94% |
| † | Not Annualized |
PAST PERFORMANCE IS NOT INDICATIVE OF FUTURE RESULTS.
Total returns presented above were calculated using the Fund's net asset value available to shareholders for sale or redemption of Fund shares on June 30, 2011, which excludes investment transactions as of this date.
S&P MidCap 400 Index is an unmanaged index of common stocks of companies chosen by S&P designed to represent price movements in the mid-cap U.S. equity market.
You cannot invest directly in an index.
The chart represents a hypothetical investment in the Fund. Performance data represents past performance and current performance could be higher or lower.
Performance information may reflect historical or current expense waivers/reimbursements from the investment adviser, without which performance would have been lower. For information on current expense waivers/reimbursements, please see the prospectus.
The value of the fund will fluctuate so that when redeemed, it may be worth more or less than the original investment. The chart and table do not reflect the deductions of taxes, sales charges or other fees which may be applied at the variable life insurance, variable annuity or qualified retirement plan product level. Any such additional sales charges or other fees or expenses would lower the contract’s or plan’s performance.
| * | The Fund has restrictions on the purchase of shares. A description of the restrictions can be found in the prospectus. |
| Portfolio Managers | |
| Philip W. Ruedi, CFA | Mark A. Whitaker, CFA |
| Senior Vice President | Vice President |
How did the Fund perform?
The Class IA shares of the Hartford MidCap HLS Fund returned 6.94% for the six-month period ended June 30, 2011, underperforming its benchmark, the S&P MidCap 400 Index, which returned 8.56% for the same period. The Fund also underperformed the 7.39% return of the average fund in the Lipper Mid-Cap Core Funds VP-UF peer group, a group of funds with investment strategies similar to those of the Fund.
Why did the Fund perform this way?
U.S. equities moved higher during the period despite a high degree of volatility caused by mounting concerns about unrest in North Africa and the Middle East and the devastating earthquake and nuclear crisis in Japan. Fears of a global economic slowdown due to Japanese supply disruptions and concerns about heightened geopolitical risks were not enough to offset strong corporate earnings, generally solid economic data, and a continued accommodative Fed policy. In the latter half of the period, U.S. equities were relatively flat as reactions to better-than-expected corporate earnings were tempered by fears about continuing inflationary pressures and the end of the Federal Reserve's quantitative easing program.
Mid-cap stocks (+9%) outperformed large-cap stocks (+6%) and small-cap stocks (+6%) during the period, as measured by the S&P MidCap 400, S&P 500, and Russell 2000 Indices, respectively. Growth stocks (+10%) outpaced Value stocks (+6%) during the period, as measured by the Russell 2500 Growth and Russell 2500 Value Indices. Within the S&P MidCap 400 Index, all ten sectors posted positive returns. The Consumer Staples (+32%), Health Care (+14%), and Utilities (+11%) sectors performed best while the Telecommunication Services (+1%), Financials (+3%), and Information Technology (+5%) sectors rose the least.
Underperformance versus the benchmark was driven by weak security selection, primarily within Industrials, Energy, and Financials. This more than offset positive stock selection within Information Technology, Consumer Discretionary, and Health Care. Sector allocation, a result of our bottom-up (i.e. stock by stock fundamental research) stock selection process, also detracted from benchmark relative returns during the period, primarily due to an underweight (i.e. the Fund’s sector position was less than the benchmark position) position in Consumer Staples and an overweight (i.e. the Fund’s sector position was greater than the benchmark position) position in Information Technology.
Top detractors from relative performance included Green Mountain Coffee Roasters (Consumer Discretionary), PACCAR (Industrials), and DreamWorks Animation (Consumer Discretionary). Not owning shares of benchmark component Green Mountain Coffee Roasters detracted from relative performance as the company’s shares surged as core results topped expectations and management raised guidance amid strong sales growth of the firm's Keurig single serving products. Shares of PACCAR, a worldwide manufacturer of light, medium, and heavy-duty trucks and after-market parts, declined after management reined in estimates by stating that commodity price increases and higher emissions equipment installation costs would "moderate" 2011 operating margins. Shares of DreamWorks Animation, a computer-generated, animated feature film company, were under pressure during the period due to lower DVD sales and only moderately successful films. Additionally, Skyworks Solutions (Information Technology) and Greenhill & Company (Financials) were among the top detractors from absolute performance (i.e. total return).
Top relative and absolute contributors included Tempur-Pedic International (Consumer Discretionary), Polycom (Information Technology), and Watson Pharmaceuticals (Health Care). International mattress and pillow manufacturer Tempur-Pedic’s shares rose as the company issued fiscal year guidance above expectations and Q1 sales and profits exceeded expectations in both the North American and International segments. Shares of Polycom, a voice and videoconferencing equipment and services company, rose as revenues topped expectations with strong growth across major geographies and product categories. The firm expanded strategic partnerships and grew sales of core network infrastructure solutions. Shares of specialty pharmaceutical company Watson Pharmaceuticals rose after the firm announced results that topped expectations as the firm's global generics business benefited from solid organic growth and margin expansion.
What is the outlook?
We continue to have a favorable outlook on the mid-cap equity market and our efforts are focused on picking stocks based on a bottom-up review of their fundamentals, valuation, and expectations. As a result of these individual stock decisions, we ended the period with our most significant overweight positions relative to the benchmark in the Health Care, Information Technology, and Industrials sectors. Our largest underweights relative to the benchmark were in Financials, Consumer Staples, and Materials.
Diversification by Industry
as of June 30, 2011
| Percentage of | ||||
| Industry (Sector) | Net Assets | |||
| Automobiles & Components (Consumer Discretionary) | 1.7 | % | ||
| Banks (Financials) | 3.7 | |||
| Capital Goods (Industrials) | 10.3 | |||
| Commercial & Professional Services (Industrials) | 3.0 | |||
| Consumer Durables & Apparel (Consumer Discretionary) | 5.0 | |||
| Consumer Services (Consumer Discretionary) | 1.8 | |||
| Diversified Financials (Financials) | 3.8 | |||
| Energy (Energy) | 7.0 | |||
| Food, Beverage & Tobacco (Consumer Staples) | 1.1 | |||
| Health Care Equipment & Services (Health Care) | 8.2 | |||
| Insurance (Financials) | 3.6 | |||
| Materials (Materials) | 5.0 | |||
| Media (Consumer Discretionary) | 1.8 | |||
| Pharmaceuticals, Biotechnology & Life Sciences (Health Care) | 8.0 | |||
| Real Estate (Financials) | 1.0 | |||
| Retailing (Consumer Discretionary) | 3.2 | |||
| Semiconductors & Semiconductor Equipment (Information Technology) | 6.5 | |||
| Software & Services (Information Technology) | 10.5 | |||
| Technology Hardware & Equipment (Information Technology) | 3.3 | |||
| Telecommunication Services (Services) | 1.2 | |||
| Transportation (Industrials) | 4.9 | |||
| Utilities (Utilities) | 4.4 | |||
| Short-Term Investments | 1.0 | |||
| Other Assets and Liabilities | – | |||
| Total | 100.0 | % | ||
| Schedule of Investments |
| June 30, 2011 (Unaudited) |
| (000’s Omitted) |
| Shares or Principal Amount | Market Value ╪ | ||||||
| COMMON STOCKS - 99.0% | |||||||
| Automobiles & Components – 1.7% | |||||||
| 825 | Harley-Davidson, Inc. | $ | 33,784 | ||||
| Banks - 3.7% | |||||||
| 400 | Bankunited, Inc. | 10,608 | |||||
| 168 | Cullen/Frost Bankers, Inc. | 9,573 | |||||
| 2,763 | Huntington Bancshares, Inc. | 18,122 | |||||
| 374 | M&T Bank Corp. | 32,867 | |||||
| 71,170 | |||||||
| Capital Goods - 10.3% | |||||||
| 427 | AMETEK, Inc. | 19,179 | |||||
| 477 | Carlisle Cos., Inc. | 23,502 | |||||
| 193 | Foster Wheeler AG ● | 5,860 | |||||
| 582 | IDEX Corp. | 26,662 | |||||
| 454 | Jacobs Engineering Group, Inc. ● | 19,644 | |||||
| 696 | Lennox International, Inc. | 29,981 | |||||
| 226 | MSC Industrial Direct Co., Inc. | 14,954 | |||||
| 616 | PACCAR, Inc. | 31,482 | |||||
| 446 | Rockwell Collins, Inc. | 27,485 | |||||
| 198,749 | |||||||
| Commercial & Professional Services - 3.0% | |||||||
| 207 | HNI Corp. | 5,205 | |||||
| 429 | Manpower, Inc. | 23,031 | |||||
| 215 | Ritchie Bros. Auctioneers, Inc. | 5,918 | |||||
| 887 | Robert Half International, Inc. | 23,988 | |||||
| 58,142 | |||||||
| Consumer Durables & Apparel - 5.0% | |||||||
| 457 | Hasbro, Inc. | 20,067 | |||||
| 122 | Lululemon Athletica, Inc. ● | 13,639 | |||||
| 38 | NVR, Inc. ● | 27,593 | |||||
| 337 | Tempur-Pedic International, Inc. ● | 22,825 | |||||
| 270 | Timberland Co. Class A ● | 11,615 | |||||
| 95,739 | |||||||
| Consumer Services - 1.8% | |||||||
| 330 | DeVry, Inc. | 19,520 | |||||
| 116 | Strayer Education, Inc. | 14,639 | |||||
| 34,159 | |||||||
| Diversified Financials - 3.8% | |||||||
| 630 | Cetip S.A. - Balcao Organizado | 9,718 | |||||
| 6 | Cetip S.A. - Balcao Organizado - Receipt Shares ⌂● | 92 | |||||
| 303 | Greenhill & Co., Inc. | 16,287 | |||||
| 120 | LPL Investment Holdings, Inc. ● | 4,091 | |||||
| 1,295 | SEI Investments Co. | 29,149 | |||||
| 242 | Stifel Financial ● | 8,691 | |||||
| 105 | T. Rowe Price Group, Inc. | 6,339 | |||||
| 74,367 | |||||||
| Energy - 7.0% | |||||||
| 435 | Alpha Natural Resources, Inc. ● | 19,769 | |||||
| 18 | Atwood Oceanics, Inc. ● | 803 | |||||
| 888 | Cobalt International Energy ● | 12,101 | |||||
| 833 | Denbury Resources, Inc. ● | 16,664 | |||||
| 426 | ENSCO International plc | 22,706 | |||||
| 303 | Pioneer Natural Resources Co. | 27,153 | |||||
| 435 | Ultra Petroleum Corp. ● | 19,934 | |||||
| 286 | Whiting Petroleum Corp. ● | 16,289 | |||||
| 135,419 | |||||||
| Food, Beverage & Tobacco - 1.1% | |||||||
| 489 | Molson Coors Brewing Co. | 21,857 | |||||
| Health Care Equipment & Services - 8.2% | |||||||
| 825 | Amerisource Bergen Corp. | 34,167 | |||||
| 498 | Cardinal Health, Inc. | 22,638 | |||||
| 1,087 | Lincare Holdings, Inc. | 31,814 | |||||
| 768 | Patterson Cos., Inc. | 25,243 | |||||
| 629 | Resmed, Inc. ● | 19,480 | |||||
| 499 | Universal Health Services, Inc. Class B | 25,701 | |||||
| 159,043 | |||||||
| Insurance - 3.6% | |||||||
| 780 | Brown & Brown, Inc. | 20,026 | |||||
| 1,209 | Genworth Financial, Inc. ● | 12,426 | |||||
| 942 | Unum Group | 24,007 | |||||
| 385 | W.R. Berkley Corp. | 12,497 | |||||
| 68,956 | |||||||
| Materials - 5.0% | |||||||
| 296 | Carpenter Technology Corp. | 17,068 | |||||
| 103 | CF Industries Holdings, Inc. | 14,564 | |||||
| 179 | FMC Corp. | 15,417 | |||||
| 178 | Sherwin-Williams Co. | 14,957 | |||||
| 258 | Silgan Holdings, Inc. | 10,574 | |||||
| 294 | Steel Dynamics, Inc. | 4,779 | |||||
| 166 | Walter Energy, Inc. | 19,275 | |||||
| 96,634 | |||||||
| Media - 1.8% | |||||||
| 374 | Discovery Communications, Inc. ● | 15,325 | |||||
| 633 | DreamWorks Animation SKG, Inc. ● | 12,729 | |||||
| 132 | Liberty Global, Inc. ● | 5,929 | |||||
| 33,983 | |||||||
| Pharmaceuticals, Biotechnology & Life Sciences - 8.0% | |||||||
| 1,278 | Amylin Pharmaceuticals, Inc. ● | 17,081 | |||||
| 312 | Incyte Corp. ● | 5,907 | |||||
| 238 | Ironwood Pharmaceuticals, Inc. ● | 3,734 | |||||
| 1,022 | Mylan, Inc. ● | 25,211 | |||||
| 1,003 | Qiagen N.V. ● | 19,083 | |||||
| 269 | Regeneron Pharmaceuticals, Inc. ● | 15,235 | |||||
| 328 | Seattle Genetics, Inc. ● | 6,731 | |||||
| 251 | Waters Corp. ● | 24,055 | |||||
| 561 | Watson Pharmaceuticals, Inc. ● | 38,573 | |||||
| 155,610 | |||||||
| Real Estate - 1.0% | |||||||
| 254 | Alexandria Real Estate Equities, Inc. | 19,688 | |||||
| Retailing - 3.2% | |||||||
| 122 | Joseph A. Bank Clothiers, Inc. ● | 6,091 | |||||
| 79 | Netflix, Inc. ● | 20,825 | |||||
| 156 | O'Reilly Automotive, Inc. ● | 10,239 | |||||
| 762 | Penske Automotive Group, Inc. | 17,319 | |||||
| 159 | Signet Jewelers Ltd. ● | 7,457 | |||||
| 61,931 | |||||||
| Semiconductors & Semiconductor Equipment - 6.5% | |||||||
| 422 | Altera Corp. | 19,561 | |||||
| 511 | Analog Devices, Inc. | 20,013 | |||||
| 769 | Maxim Integrated Products, Inc. | 19,645 | |||||
| 1,403 | NVIDIA Corp. ● | 22,360 | |||||
| 1,038 | Skyworks Solutions, Inc. ● | 23,860 | |||||
| 567 | Xilinx, Inc. | 20,676 | |||||
| 126,115 | |||||||
| Software & Services - 10.5% | |||||||
| 326 | Citrix Systems, Inc. ● | 26,098 | |||||
| 165 | Factset Research Systems, Inc. | 16,862 | |||||
The accompanying notes are an integral part of these financial statements.
| Hartford MidCap HLS Fund |
Schedule of Investments – (continued) |
| June 30, 2011 (Unaudited) |
| (000’s Omitted) |
| Shares or Principal Amount | Market Value ╪ | ||||||||||
| COMMON STOCKS - 99.0% - (continued) | |||||||||||
| Software & Services - 10.5% - (continued) | |||||||||||
| 489 | Gartner, Inc. Class A ● | $ | 19,692 | ||||||||
| 1,608 | Genpact Ltd. ● | 27,723 | |||||||||
| 507 | Global Payments, Inc. | 25,847 | |||||||||
| 243 | QLIK Technologies, Inc. ● | 8,277 | |||||||||
| 308 | Teradata Corp. ● | 18,543 | |||||||||
| 1,072 | VeriSign, Inc. | 35,859 | |||||||||
| 1,160 | Western Union Co. | 23,231 | |||||||||
| 202,132 | |||||||||||
| Technology Hardware & Equipment - 3.3% | |||||||||||
| 627 | ADTRAN, Inc. | 24,272 | |||||||||
| 554 | National Instruments Corp. | 16,439 | |||||||||
| 358 | Polycom, Inc. ● | 23,018 | |||||||||
| 63,729 | |||||||||||
| Telecommunication Services - 1.2% | |||||||||||
| 435 | American Tower Corp. Class A ● | 22,743 | |||||||||
| Transportation - 4.9% | |||||||||||
| 215 | C.H. Robinson Worldwide, Inc. | 16,929 | |||||||||
| 415 | Con-way, Inc. | 16,105 | |||||||||
| 494 | Expeditors International of Washington, Inc. | 25,292 | |||||||||
| 496 | J.B. Hunt Transport Services, Inc. | 23,339 | |||||||||
| 229 | Kansas City Southern ● | 13,601 | |||||||||
| 95,266 | |||||||||||
| Utilities - 4.4% | |||||||||||
| 777 | Northeast Utilities | 27,331 | |||||||||
| 641 | NRG Energy, Inc. ● | 15,745 | |||||||||
| 707 | UGI Corp. | 22,530 | |||||||||
| 638 | Wisconsin Energy Corp. | 19,998 | |||||||||
| 85,604 | |||||||||||
| Total common stocks | |||||||||||
| (cost $1,572,332) | $ | 1,914,820 | |||||||||
| Total long-term investments | |||||||||||
| (cost $1,572,332) | $ | 1,914,820 | |||||||||
| SHORT-TERM INVESTMENTS - 1.0% | |||||||||||
| Repurchase Agreements - 1.0% | |||||||||||
| Bank of America Merrill Lynch TriParty Joint | |||||||||||
| Repurchase Agreement (maturing on | |||||||||||
| 07/01/2011 in the amount of $1,836, | |||||||||||
| collateralized by FHLB 4.91%, 2015, | |||||||||||
| GNMA 0.87% - 5.72%, 2025 - 2061, value | |||||||||||
| of $1,873) | |||||||||||
| $ | 1,836 | 0.05%, 06/30/2011 | $ | 1,836 | |||||||
| BNP Paribas Securities Corp. TriParty Joint | |||||||||||
| Repurchase Agreement (maturing on | |||||||||||
| 07/01/2011 in the amount of $1,382, | |||||||||||
| collateralized by FNMA 3.50% - 6.50%, | |||||||||||
| 2023 - 2041, value of $1,409) | |||||||||||
| 1,382 | 0.05%, 06/30/2011 | 1,382 | |||||||||
| Deutsche Bank Securities TriParty Joint | |||||||||||
| Repurchase Agreement (maturing on | |||||||||||
| 07/01/2011 in the amount of $13,364, | |||||||||||
| collateralized by GNMA 4.00% - 7.00%, | |||||||||||
| 2035 - 2040, value of $13,631) | |||||||||||
| 13,364 | 0.05%, 06/30/2011 | 13,364 | |||||||||
| UBS Securities, Inc. Joint Repurchase | |||||||||||
| Agreement (maturing on 07/01/2011 in the | |||||||||||
| amount of $27, collateralized by U.S. | |||||||||||
| Treasury Bill 0.63%, 2012, value of $27) | |||||||||||
| 27 | 0.01%, 06/30/2011 | 26 | |||||||||
| UBS Securities, Inc. TriParty Joint | |||||||||||
| Repurchase Agreement (maturing on | |||||||||||
| 07/01/2011 in the amount of $2,040, | |||||||||||
| collateralized by FHLMC 4.50%, 2040, | |||||||||||
| FNMA 4.50% - 6.00%, 2035 - 2041, value | |||||||||||
| of $2,081) | |||||||||||
| 2,040 | 0.06%, 06/30/2011 | 2,040 | |||||||||
| 18,648 | |||||||||||
| Total short-term investments | |||||||||||
| (cost $18,648) | $ | 18,648 | |||||||||
| Total investments | |||||||||||
| (cost $1,590,980) ▲ | 100.0 | % | $ | 1,933,468 | |||||||
| Other assets and liabilities | – | % | 448 | ||||||||
| Total net assets | 100.0 | % | $ | 1,933,916 | |||||||
The accompanying notes are an integral part of these financial statements.
| Note: | Percentage of investments as shown is the ratio of the total market value to total net assets. Market value of investments in foreign securities represents 3.7% of total net assets at June 30, 2011. |
Prices of foreign equities that are principally traded on certain foreign markets may be adjusted daily pursuant to a fair value pricing service approved by the Board of Directors in order to reflect an adjustment for factors occurring after the close of certain foreign markets but before the close of the New York Stock Exchange.
| ▲ | At June 30, 2011, the cost of securities for federal income tax purposes was $1,599,986 and the aggregate gross unrealized appreciation and depreciation based on that cost were: |
| Unrealized Appreciation | $ | 398,504 | ||
| Unrealized Depreciation | (65,022 | ) | ||
| Net Unrealized Appreciation | $ | 333,482 |
| ● | Currently non-income producing. |
| ⌂ | The following securities are considered illiquid. Illiquid securities are often purchased in private placement transactions, are often not registered under the Securities Act of 1933 and may have contractual restrictions on resale. A security may also be considered illiquid if the security lacks a readily available market or if its valuation has not changed for a certain period of time. |
| Period Acquired | Shares/ Par | Security | Cost Basis | |||||||
| 06/2011 | 6 | Cetip S.A. - Balcao Organizado - Receipt Shares | $ | 82 | ||||||
The aggregate value of these securities at June 30, 2011, was $92, which rounds to zero percent of total net assets.
| ╪ | See Significant Accounting Policies of accompanying Notes to Financial Statements regarding valuation of securities. |
The accompanying notes are an integral part of these financial statements.
Investment Valuation Hierarchy Level Summary |
| June 30, 2011 (Unaudited) |
| (000’s Omitted) |
| Total | Level 1 ♦ | Level 2 ♦ | Level 3 | |||||||||||||
| Assets: | ||||||||||||||||
| Common Stocks ‡ | $ | 1,914,820 | $ | 1,914,820 | $ | – | $ | – | ||||||||
| Short-Term Investments | 18,648 | – | 18,648 | – | ||||||||||||
| Total | $ | 1,933,468 | $ | 1,914,820 | $ | 18,648 | $ | – | ||||||||
| ♦ | For the six-month period ended June 30, 2011, there were no significant transfers between Level 1 and Level 2. |
| ‡ | The Fund has all or primarily all of the equity securities categorized in a particular level. Refer to the Schedule of Investments for further industry breakout. |
The accompanying notes are an integral part of these financial statements.
Statement of Assets and Liabilities |
| June 30, 2011 (Unaudited) |
| (000’s Omitted) |
| Assets: | ||||
| Investments in securities, at market value (cost $1,590,980) | $ | 1,933,468 | ||
| Cash | — | |||
| Foreign currency on deposit with custodian (cost $—) | — | |||
| Receivables: | ||||
| Investment securities sold | 13,757 | |||
| Fund shares sold | 2,034 | |||
| Dividends and interest | 841 | |||
| Other assets | 19 | |||
| Total assets | 1,950,119 | |||
| Liabilities: | ||||
| Payables: | ||||
| Investment securities purchased | 13,947 | |||
| Fund shares redeemed | 1,990 | |||
| Investment management fees | 208 | |||
| Distribution fees | 4 | |||
| Accrued expenses | 54 | |||
| Total liabilities | 16,203 | |||
| Net assets | $ | 1,933,916 | ||
| Summary of Net Assets: | ||||
| Capital stock and paid-in-capital | $ | 1,692,169 | ||
| Accumulated undistributed net investment income | 8,139 | |||
| Accumulated net realized loss on investments and foreign currency transactions | (108,881 | ) | ||
| Unrealized appreciation of investments and the translations of assets and liabilities denominated in foreign currency | 342,489 | |||
| Net assets | $ | 1,933,916 | ||
| Shares authorized | 2,400,000 | |||
| Par value | $ | 0.001 | ||
Class IA: Net asset value per share | $ | 27.82 | ||
| Shares outstanding | 66,124 | |||
| Net assets | $ | 1,839,585 | ||
Class IB: Net asset value per share | $ | 27.49 | ||
| Shares outstanding | 3,431 | |||
| Net assets | $ | 94,331 | ||
The accompanying notes are an integral part of these financial statements.
Statement of Operations |
| For the Six-Month Period Ended June 30, 2011 (Unaudited) |
| (000’s Omitted) |
| Investment Income: | ||||
| Dividends | $ | 11,167 | ||
| Interest | 13 | |||
| Less: Foreign tax withheld | (2 | ) | ||
| Total investment income, net | 11,178 | |||
| Expenses: | ||||
| Investment management fees | 6,397 | |||
| Transfer agent fees | 3 | |||
| Distribution fees - Class IB | 146 | |||
| Custodian fees | 5 | |||
| Accounting services fees | 115 | |||
| Board of Directors' fees | 18 | |||
| Audit fees | 15 | |||
| Other expenses | 96 | |||
| Total expenses (before fees paid indirectly) | 6,795 | |||
| Commission recapture | (14 | ) | ||
| Total fees paid indirectly | (14 | ) | ||
| Total expenses, net | 6,781 | |||
| Net investment income | 4,397 | |||
| Net Realized Gain on Investments and Foreign Currency Transactions: | ||||
| Net realized gain on investments | 211,197 | |||
| Net realized gain on foreign currency contracts | 15 | |||
| Net realized loss on other foreign currency transactions | (13 | ) | ||
| Net Realized Gain on Investments and Foreign Currency Transactions | 211,199 | |||
| Net Changes in Unrealized Depreciation of Investments and Foreign Currency Transactions: | ||||
| Net unrealized depreciation of investments | (87,339 | ) | ||
| Net unrealized appreciation on translation of other assets and liabilities in foreign currencies | 1 | |||
| Net Changes in Unrealized Depreciation of Investments and Foreign Currency Transactions | (87,338 | ) | ||
| Net Gain on Investments and Foreign Currency Transactions | 123,861 | |||
| Net Increase in Net Assets Resulting from Operations | $ | 128,258 | ||
The accompanying notes are an integral part of these financial statements.
Statement of Changes in Net Assets |
| (000’s Omitted) |
| For the | ||||||||
| Six-Month | For the | |||||||
| Period Ended | Year Ended | |||||||
| June 30, 2011 | December 31, | |||||||
| (Unaudited) | 2010 | |||||||
| Operations: | ||||||||
| Net investment income | $ | 4,397 | $ | 7,034 | ||||
| Net realized gain on investments and foreign currency transactions | 211,199 | 165,120 | ||||||
| Net unrealized appreciation (depreciation) of investments and foreign currency transactions | (87,338 | ) | 197,571 | |||||
| Net Increase In Net Assets Resulting From Operations | 128,258 | 369,725 | ||||||
| Distributions to Shareholders: | ||||||||
| From net investment income | ||||||||
| Class IA | — | (3,951 | ) | |||||
| Class IB | — | (69 | ) | |||||
| Total distributions | — | (4,020 | ) | |||||
| Capital Share Transactions: | ||||||||
| Class IA | ||||||||
| Sold | 147,019 | 180,263 | ||||||
| Issued on reinvestment of distributions | — | 3,951 | ||||||
| Redeemed | (148,480 | ) | (288,847 | ) | ||||
| Total capital share transactions | (1,461 | ) | (104,633 | ) | ||||
| Class IB | ||||||||
| Sold | 13,071 | 21,429 | ||||||
| Issued on reinvestment of distributions | — | 69 | ||||||
| Redeemed | (52,599 | ) | (99,980 | ) | ||||
| Total capital share transactions | (39,528 | ) | (78,482 | ) | ||||
| Net decrease from capital share transactions | (40,989 | ) | (183,115 | ) | ||||
| Net Increase In Net Assets | 87,269 | 182,590 | ||||||
| Net Assets: | ||||||||
| Beginning of period | 1,846,647 | 1,664,057 | ||||||
| End of period | $ | 1,933,916 | $ | 1,846,647 | ||||
| Accumulated undistributed (distribution in excess of) net investment income | $ | 8,139 | $ | 3,742 | ||||
| Shares: | ||||||||
| Class IA | ||||||||
| Sold | 5,345 | 7,950 | ||||||
| Issued on reinvestment of distributions | — | 161 | ||||||
| Redeemed | (5,424 | ) | (12,489 | ) | ||||
| Total share activity | (79 | ) | (4,378 | ) | ||||
| Class IB | ||||||||
| Sold | 484 | 953 | ||||||
| Issued on reinvestment of distributions | — | 3 | ||||||
| Redeemed | (1,888 | ) | (4,402 | ) | ||||
| Total share activity | (1,404 | ) | (3,446 | ) | ||||
The accompanying notes are an integral part of these financial statements.
Notes to Financial Statements |
| June 30, 2011 (Unaudited) |
| (000’s Omitted) |
| 1. | Organization: |
Hartford MidCap HLS Fund (the “Fund”) serves as an underlying investment option for certain variable annuity and variable life insurance separate accounts of Hartford Life Insurance Company (“HLIC”) and its affiliates and certain qualified retirement plans. The Fund may also serve as an underlying investment option for certain variable annuity and variable life separate accounts of other insurance companies. Owners of variable annuity contracts and policyholders of variable life insurance contracts may choose the funds permitted in the variable insurance contract prospectus. In addition, participants in certain qualified retirement plans may choose the Fund if permitted by their plans.
Hartford Series Fund, Inc. (the “Company”) is an open-end registered management investment company comprised of thirty portfolios. Financial Statements for the Fund, a series of the Company, are included in this report.
The Company is organized under the laws of the State of Maryland and is registered with the Securities and Exchange Commission (“SEC”) under the Investment Company Act of 1940, as amended (“1940 Act”). The Fund is a diversified open-end management investment company
The Fund is divided into Class IA and Class IB shares. Each class is offered at the per share net asset value (“NAV”) without a sales charge and is subject to the same expenses, except that the Class IB shares are subject to distribution and service fees charged pursuant to a Distribution Plan adopted in accordance with Rule 12b-1 under the 1940 Act.
| 2. | Significant Accounting Policies: |
The following is a summary of significant accounting policies of the Fund in the preparation of its financial statements, which are in accordance with the United States Generally Accepted Accounting Principles (“U.S. GAAP”). The preparation of financial statements in accordance with U.S. GAAP may require management to make estimates and assumptions that affect the reported amounts of assets and liabilities and disclosure of contingent assets and liabilities at the date of the financial statements and the reported amounts of increases and decreases in net assets from operations during the reporting period. Actual results could differ from those estimates.
| a) | Determination of Net Asset Value – The NAV of each class of the Fund's shares is determined as of the close of regular trading (normally 4:00 p.m. Eastern Time) (the “NYSE Close”) on each day that the New York Stock Exchange (the “Exchange”) is open (“Valuation Date”). Information that becomes known to the Fund after the NAV has been calculated on a particular day will not generally be used to retroactively adjust the NAV determined earlier that day. |
| b) | Investment Valuation and Fair Value Measurements – For purposes of calculating the NAV, portfolio securities and other assets held by the Fund's portfolio for which market quotes are readily available are valued at market value. Market value is generally determined on the basis of last reported sales prices or official close price. If no sales are reported, market value is based on quotes obtained from a quotation reporting system, established market makers, or independent pricing services. If market prices are not readily available or are deemed unreliable, the Fund will use the fair value of the security as determined in good faith under policies and procedures established by and under the supervision of the Company's Board of Directors. Market quotes are considered not readily available where there is an absence of current or reliable market-based data (e.g., trade information or broker quotes), including where events occur after the close of the relevant market, but prior to the NYSE Close that materially affect the values of the Fund's portfolio securities or assets. In addition, market quotes are considered not readily available when, due to extraordinary circumstances, the exchanges or markets on which the securities trade, do not open for trading for the entire day and no other market prices are available. In addition, prices of foreign equities that are principally traded on certain foreign markets are adjusted daily pursuant to a fair value pricing service approved by the Board of Directors in order to reflect an adjustment for the factors occurring after the close of certain foreign markets but before the NYSE Close. Securities that are primarily traded on foreign markets may trade on days that are not business days of the Fund. The value of the foreign securities, |
in which the Fund invests, may change on days when a shareholder will not be able to purchase or redeem shares of the Fund. Fair value pricing is subjective in nature and the use of fair value pricing by the Fund may cause the NAV of its shares to differ significantly from the NAV that would have been calculated using market prices at the close of the exchange on which a portfolio security is primarily traded. There can be no assurance that the Fund could obtain the fair market value assigned to a security if the Fund were to sell the security at approximately the time at which the Fund determines its NAV.
Investments valued in currencies other than U.S. dollars are converted to U.S. dollars using exchange rates obtained from independent pricing services for calculation of the NAV. As a result, the NAV of the Fund’s shares may be affected by changes in the value of currencies in relation to the U.S. dollar. The value of securities traded in markets outside the United States or denominated in currencies other than the U.S. dollar may be affected significantly on a day that the NYSE is closed and the market value may change on days when an investor is not able to purchase, redeem or exchange shares of the Fund.
Foreign currency contracts represent agreements to exchange currencies on specific future dates at predetermined rates. Foreign currency contracts are valued using foreign currency exchange rates and forward rates as provided by an independent pricing service on Valuation Date.
Financial instruments for which prices are not available from an independent pricing service may be valued using market quotations obtained from one or more dealers that make markets in the respective financial instrument in accordance with procedures established by the Company’s Board of Directors.
U.S. GAAP defines fair value as the price that the Fund would receive to sell an asset or pay to transfer a liability in an orderly transaction between market participants. The U.S. GAAP fair value measurement standards require disclosure of a fair value hierarchy for each major category of assets and liabilities. Various inputs are used in determining the fair value of the Fund’s investments. These inputs are summarized into three broad hierarchy levels. This hierarchy is based on whether the valuation inputs are observable or unobservable. These levels are:
| · | Level 1 – Quoted prices in active markets for identical securities. Level 1 may include exchange-traded instruments such as domestic equities, some foreign equities, options, futures, mutual funds, exchange-traded funds, rights and warrants. |
| · | Level 2 – Observable inputs other than Level 1 prices, such as quoted prices for similar securities; quoted prices in markets that are not active; or other inputs that are observable or can be corroborated by observable market data. Level 2 may include debt securities that are traded less frequently than exchange-traded instruments and which are valued using third party pricing services; foreign equities, whose value is determined using a multi-factor regression model with inputs that are observable in the market; and short-term securities, which are valued at amortized cost. |
| · | Level 3 – Significant unobservable inputs that are supported by limited or no market activity. Level 3 may include financial instruments whose values are determined using broker quotes or require significant management judgment or estimation. These unobservable valuation inputs may include estimates for current yields, maturity/duration, prepayment speed, and broker quotes for comparable securities along with other assumptions relating to credit quality, collateral value, complexity of the security structure, general market conditions and liquidity. This category may include securities where trading has been halted or there are certain restrictions on trading. While these securities are priced using unobservable inputs, the valuation of these securities reflects the best available data and management believes the prices are a reasonable representation of exit price. |
Valuation levels are not necessarily indicative of the risk associated with investing in such securities. Individual securities within any of the above mentioned asset classes may be assigned a different hierarchical level than those presented above, as individual circumstances dictate.
| Hartford MidCap HLS Fund |
Notes to Financial Statements – (continued) |
| June 30, 2011 (Unaudited) |
| (000’s Omitted) |
During the six-month period ended June 30, 2011, the Fund held no Level 3 securities, therefore no reconciliation of Level 3 securities is presented.
For additional information, refer to the Investment Valuation Hierarchy Level Summary which follows the Schedule of Investments.
For purposes of reporting transfers between different hierarchy levels, both transfers in and out of each level, as applicable, are shown as if they occurred at the beginning of the period.
| c) | Security Transactions and Investment Income – Security transactions are recorded as of the trade date (the date the order to buy or sell is executed) for financial reporting purposes. Securities purchased or sold on a when-issued or delayed-delivery basis may be settled a month or more after the trade date. Realized gains and losses are determined on the basis of identified cost. |
Dividend income is accrued as of the ex-dividend date, except that certain dividends from foreign securities where the ex-dividend date may have passed are recorded as soon as the Fund is informed of the dividend. Interest income, including amortization of premium and accretion of discounts, is accrued on a daily basis.
| d) | Foreign Currency Transactions – Assets and liabilities denominated in currencies other than U.S. dollars are translated into U.S. dollars at the exchange rates in effect on the valuation date. Purchases and sales of investment securities, income, and expenses are translated into U.S. dollars at the exchange rates on the dates of such transactions. |
The Fund does not isolate that portion of portfolio security valuation resulting from fluctuations in the foreign currency exchange rates from the fluctuations arising from changes in the market prices of securities held. Exchange rate fluctuations are included with the net realized and unrealized gain or loss on investments in the accompanying financial statements.
Net realized foreign exchange gains or losses arise from sales of foreign currencies and the difference between asset and liability amounts initially stated in foreign currencies and the U.S. dollar value of the amounts actually received or paid. Net unrealized foreign exchange gains or losses arise from changes in the value of other assets and liabilities at the end of the reporting period, resulting from changes in the exchange rates.
| e) | Joint Trading Account – The Fund may invest cash balances into a joint trading account that may be invested in one or more repurchase agreements. |
| f) | Fund Share Valuation and Dividend Distributions to Shareholders – Orders for the Fund’s shares are executed in accordance with the investment instructions of the contract holders and plan participants. The NAV of the Fund’s shares is determined as of the close of business on each business day of the Exchange. The NAV is determined separately for each class of shares of the Fund by dividing the Fund’s net assets attributable to that class by the number of shares of the class outstanding. Each class of shares offered by the Fund has equal rights as to assets and voting privileges (except that shareholders of a class have exclusive voting rights regarding any matter relating solely to that class of shares). Income and non-class specific expenses are allocated daily to each class on the basis of the relative net assets of the class. Realized and unrealized capital gains and losses of each class are allocated daily based on the relative net assets of each class of shares of the Fund. |
Orders for the purchase of the Fund’s shares received prior to the close of the Exchange on any day the Exchange is open for business are priced at the NAV determined as of the close of the Exchange. Orders received after the close of the Exchange, or on a day on which the Exchange and/or the Fund is not open for business, are priced at the next determined NAV.
Dividends are declared pursuant to a policy adopted by the Company’s Board of Directors based upon the investment performance of the Fund. The policy of the Fund is to pay dividends from net investment income and realized capital gains, if any, at least once a year.
Distributions from net investment income, net realized capital gains and capital are determined in accordance with federal income tax regulations, which may differ from U.S. GAAP with respect to character and timing. These differences may include but are not limited to losses deferred due to wash sale adjustments, foreign currency gains and losses, adjustments related to Passive Foreign Investment Companies (“PFICs”), Real Estate Investment Trusts (“REITs”), Regulated Investment Companies (“RICs”), certain derivatives and partnerships. Permanent book and federal income tax basis differences relating to shareholder distributions will result in reclassifications to certain of the Fund’s capital accounts (see Federal Income Taxes: Reclassification of Capital Accounts note).
| 3. | Securities and Other Investments: |
| a) | Repurchase Agreements – A repurchase agreement is an agreement by which a counterparty agrees to sell a security and agrees to repurchase the security sold at a mutually agreed upon time and price. At the time the Fund enters into a repurchase agreement, the value of the underlying collateral security(ies), including accrued interest, will be equal to or exceed the value of the repurchase agreement. Repurchase agreements expose the Fund to counterparty risk. To minimize counterparty risk, the securities that serve to collateralize the repurchase agreement are held by the Fund's custodian in book entry or physical form in the custodial account of the Fund or in a third party custodial account. Repurchase agreements are valued at cost plus accrued interest. The Fund, as shown on the Schedule of Investments, had outstanding repurchase agreements as of June 30, 2011. |
| b) | Illiquid and Restricted Securities – The Fund is permitted to invest up to 15% of its net assets in illiquid securities. Illiquid securities are those that may not be sold or disposed of in the ordinary course of business within seven days, at approximately the price used to determine the Fund’s NAV. The Fund may not be able to sell illiquid securities or other investments when its sub-adviser considers it desirable to do so or may have to sell such securities or investments at a price that is lower than the price that could be obtained if the securities or investments were more liquid. A sale of illiquid securities or other investments may require more time and may result in higher dealer discounts and other selling expenses than does the sale of those that are liquid. Illiquid securities and investments also may be more difficult to value, due to the unavailability of reliable market quotations for such securities or investments, and an investment in them may have an adverse impact on the Fund’s NAV. The Fund may also purchase certain restricted securities that can only be resold to certain qualified investors and may be determined to be liquid pursuant to policies and guidelines established by the Company’s Board of Directors. The Fund, as shown on the Schedule of Investments, had illiquid and/or restricted securities as of June 30, 2011. |
| c) | Securities Purchased on a When-Issued or Delayed-Delivery Basis – Delivery and payment for securities that have been purchased by the Fund on a forward commitment, or when-issued or delayed-delivery basis, take place beyond the customary settlement period. During this period, such securities are subject to market fluctuations, and the Fund identifies securities segregated in its records with value at least equal to the amount of the commitment. The Fund had no outstanding when-issued or delayed delivery securities as of June 30, 2011. |
| 4. | Financial Derivative Instruments: |
The following disclosures contain information on how and why the Fund uses derivative instruments, the credit-risk-related contingent features in certain derivative instruments, and how derivative instruments affect the Fund’s financial position, results of operations and cash flows. The location and fair value amounts of these instruments on the Statement of Assets and Liabilities and the realized gains and losses and changes in unrealized gains and losses on the Statement of Operations, each categorized by type of derivative contract, are included in the following Additional Derivative Instrument Information footnote. The derivative instruments outstanding as of period-end are disclosed in the Notes to
| Hartford MidCap HLS Fund |
Notes to Financial Statements – (continued) |
| June 30, 2011 (Unaudited) |
| (000’s Omitted) |
the Schedule of Investments and the amounts of realized gains and losses and changes in unrealized gains and losses on derivative instruments during the period are disclosed in the Statement of Operations.
| a) | Foreign Currency Contracts – The Fund may enter into foreign currency contracts that obligate the Fund to purchase or sell currencies at specified future dates. Foreign currency contracts are used to hedge the currency exposure associated with some or all of the Fund's securities and/or as part of an investment strategy. Foreign currency contracts are marked to market daily and the change in value is recorded by the Fund as an unrealized gain or loss. Realized gains or losses equal to the difference between the value of the contract at the time it was opened and the value at the time it was closed are recorded upon delivery or receipt of the currency. |
Foreign currency contracts involve elements of market risk in excess of the amounts reflected in the Statement of Assets and Liabilities. In addition, risks may arise upon entering into these contracts from the potential inability of the counterparties to meet the terms of the contracts and from unanticipated movements in the value of the foreign currencies relative to the U.S. dollar. The Fund had no outstanding foreign currency contracts as of June 30, 2011.
| b) | Additional Derivative Instrument Information: |
The volume of derivative activity was minimal during the six-month period ended June 30, 2011.
The Effect of Derivative Instruments on the Statement of Operations for the six-month period ended June 30, 2011:
| Risk Exposure Category | ||||||||||||||||||||||||||||
| Foreign | ||||||||||||||||||||||||||||
| Interest Rate | Exchange | Credit | Equity | Commodity | Other | |||||||||||||||||||||||
| Contracts | Contracts | Contracts | Contracts | Contracts | Contracts | Total | ||||||||||||||||||||||
| Realized Gain (Loss) on Derivatives Recognized as a Result from Operations: | ||||||||||||||||||||||||||||
| Net realized gain on foreign currency contracts | $ | — | $ | 15 | $ | — | $ | — | $ | — | $ | — | $ | 15 | ||||||||||||||
| Total | $ | — | $ | 15 | $ | — | $ | — | $ | — | $ | — | $ | 15 | ||||||||||||||
| 5. | Principal Risks: |
| a) | Counterparty Risk – The Fund may be exposed to counterparty risk, or the risk that an institution or other entity with which the Fund has unsettled or open transactions will default. |
| b) | Market Risks – If a Fund invests directly in foreign currencies or in securities that trade in, and receive revenues in, foreign currencies, or in derivatives that provide exposure to foreign currencies, it will be subject to the risk that those currencies will decline in value relative to the base currency of the Fund, or, in the case of hedging positions, that the Fund’s base currency will decline in value relative to the currency being hedged. Currency rates in foreign countries may fluctuate significantly over short periods of time for a number of reasons, including changes in interest rates, intervention (or the failure to intervene) by U.S. or foreign governments, central banks or supranational entities such as the International Monetary Fund, or by the imposition of currency controls or other political developments in the United States or abroad. As a result, the Fund’s investments in foreign currency denominated securities may reduce the returns of the Fund. The market values of equity securities, such as common stocks and preferred stocks or equity related investments such as futures and options, may decline due to general market conditions which are not specifically related to a particular company, such as real or perceived adverse economic conditions, changes in the general outlook for corporate earnings, changes in interest or currency rates or adverse investor sentiment generally. The market value of equity securities may also decline due to factors which affect a particular industry or industries, such as labor shortages or increased production costs and competitive conditions within an industry. Equity securities and equity related investments generally have greater market price volatility than fixed income securities. |
| 6. | Federal Income Taxes: |
| a) | Federal Income Taxes – For federal income tax purposes, the Fund intends to continue to qualify as a RIC under Subchapter M of the Internal Revenue Code (“IRC”) by distributing substantially all of its taxable net investment income and net realized capital gains to its shareholders and otherwise complying with the requirements of RICs. The Fund has distributed substantially all of its income and capital gains in prior years, if applicable, and intends to distribute substantially all of its income and capital gains prior to the next fiscal year-end. Accordingly, no provision for federal income or excise taxes has been made in the accompanying financial statements. Distributions from short-term capital gains are treated as ordinary income distributions for federal income tax purposes. |
| b) | Net Investment Income (Loss), Net Realized Gains (Losses) – Net investment income (loss) and net realized gains (losses) may differ for financial statement and tax purposes primarily because of losses deferred due to wash sale adjustments, foreign currency gains and losses, adjustments related to PFICs, REITs, RICs, certain derivatives and partnerships. The character of distributions made during the year from net investment income or net realized gains may differ from their ultimate characterization for federal income tax purposes. Also, due to the timing of dividend distributions, the fiscal year in which amounts are distributed may differ from the year that the income or realized gains (losses) were recorded by the Fund. |
| c) | Distributions and Components of Distributable Earnings – The tax character of distributions paid by the Fund for the periods indicated is as follows (as adjusted for dividends payable): |
For the Year Ended December 31, 2010 | For the Year Ended December 31, 2009 | |||||||
| Ordinary Income | $ | 4,020 | $ | 7,790 | ||||
As of December 31, 2010, the Fund’s components of distributable earnings (deficit) on a tax basis were as follows:
| Amount | ||||
| Undistributed Ordinary Income | $ | 3,742 | ||
| Accumulated Capital and Other Losses* | (311,073 | ) | ||
| Unrealized Appreciation† | 420,820 | |||
| Total Accumulated Earnings | $ | 113,489 | ||
| * | The Fund has capital loss carryforwards that are identified in the Capital Loss Carryforward note that follows. |
| † | The difference between book-basis and tax-basis unrealized appreciation (depreciation) may be attributable to the losses deferred due to wash sale adjustments, foreign currency gains and losses, adjustments related to PFICs, REITs, RICs, certain derivatives and partnerships. |
| d) | Reclassification of Capital Accounts – The Fund may record reclassifications in its capital accounts. These reclassifications have no impact on the total net assets of the Fund. The reclassifications are a result of permanent differences between U.S. GAAP and tax accounting for such items as expiration or utilization of capital loss carryforwards or net operating losses. Adjustments are made to reflect the impact these items have on current and future distributions to shareholders. Therefore, the source of the Fund’s distributable income may be shown in the accompanying Statement of Assets and Liabilities as from accumulated undistributed net investment income, from accumulated net realized gains on investments or from capital depending on the type of book and tax differences that exist. For the year ended December 31, 2010, the Fund recorded reclassifications to increase (decrease) the accounts listed below: |
| Amount | ||||
| Accumulated Undistributed Net Investment Income | $ | (223 | ) | |
| Accumulated Net Realized Gain (Loss) on Investments and Foreign Currency Transactions | 223 | |||
| Hartford MidCap HLS Fund |
Notes to Financial Statements – (continued) |
| June 30, 2011 (Unaudited) |
| (000’s Omitted) |
| e) | Capital Loss Carryforward – At December 31, 2010 (tax-year-end), the Fund had capital loss carryforwards for U.S. federal income tax purposes of approximately: |
| Year of Expiration | Amount | |||
| 2017 | $ | 311,073 | ||
| Total | $ | 311,073 | ||
As of December 31, 2010, the Fund utilized $161,487 of prior year capital loss carryforwards.
| f) | Accounting for Uncertainty in Income Taxes – The Fund has adopted financial reporting rules that require the Fund to analyze all open tax years, as defined by the Statute of Limitations, for all major jurisdictions. Generally, tax authorities can examine all tax returns filed for the last three years. The Fund does not have an examination in progress. |
The Fund has reviewed all open tax years and major jurisdictions and concluded that these financial reporting rules had no effect on the Fund’s financial position or results of operations. There is no tax liability resulting from unrecognized tax benefits relating to uncertain income tax positions taken or expected to be taken on the tax return for the fiscal year-end December 31, 2010. The Fund is also not aware of any tax positions for which it is reasonably possible that the total amounts of unrecognized tax benefits will significantly change in the next twelve months.
| 7. | Expenses: |
| a) | Investment Management Agreements – HL Investment Advisors, LLC (“HL Advisors”), an indirect wholly owned subsidiary of The Hartford Financial Services Group, Inc. (“The Hartford”), serves as investment manager to the Fund pursuant to an Investment Management Agreement with the Company. As investment manager, HL Advisors has overall investment supervisory responsibility for the Fund. In addition, HL Advisors provides administrative personnel, services, equipment, facilities and office space for proper operation of the Fund. HL Advisors has contracted with Wellington Management Company, LLP (“Wellington Management”) under a sub-advisory agreement for the provision of day-today investment management services to the Fund in accordance with the Fund’s investment objective and policies. The Fund pays a fee to HL Advisors, a portion of which may be used to compensate Wellington Management. |
The schedule below reflects the rates of compensation paid to HL Advisors for investment management services rendered as of June 30, 2011; the rates are accrued daily and paid monthly.
| Average Daily Net Assets | Annual Fee | |||
| On first $250 million | 0.7750 | % | ||
| On next $250 million | 0.7250 | % | ||
| On next $500 million | 0.6750 | % | ||
| On next $4 billion | 0.6250 | % | ||
| On next $5 billion | 0.6225 | % | ||
| Over $10 billion | 0.6200 | % | ||
| b) | Accounting Services Agreement – Pursuant to the Fund Accounting Agreement between HLIC and the Company, on behalf of the Fund, HLIC provides accounting services to the Fund and receives monthly compensation based on the Fund’s average net assets at the rates set forth below. The Fund’s accounting services fees are accrued daily and paid monthly. |
| Average Daily Net Assets | Annual Fee | |||
| On first $5 billion | 0.012 | % | ||
| Over $5 billion | 0.010 | % | ||
| c) | Operating Expenses – Allocable expenses incurred by the Company are allocated to each Fund and allocated to classes within a Fund in proportion to the average daily net assets of the Fund and each class, except where allocation of certain expenses is more fairly made directly to the Fund or to specific classes within a Fund. |
| d) | Fees Paid Indirectly – The Company, on behalf of the Fund, has entered into agreements with State Street Global Markets, LLC and Russell Implementation Services, Inc. to partially recapture non-discounted trade commissions. Such rebates are used to pay a portion of the Fund’s expenses. In addition, the Fund’s custodian bank has also agreed to reduce its fees when the Fund maintains cash on deposit in a non-interest-bearing custody account. For the six-month period ended June 30, 2011, these amounts are included in the Statement of Operations. |
The ratio of expenses to average net assets in the accompanying financial highlights excludes the reduction in expenses related to fees paid indirectly. The annualized expense ratio for the period listed below including the fees paid indirectly is as follows:
| Annualized Six- | ||||
| Month Period | ||||
| Ended June 30, | ||||
| 2011 | ||||
| Class IA | 0.70 | % | ||
| Class IB | 0.95 | |||
| e) | Distribution Plan for Class IB shares – The Company, on behalf of the Fund, has adopted a Distribution Plan pursuant to Rule 12b-1 of the 1940 Act to compensate the Distributor, Hartford Securities Distribution Company, Inc. (a wholly owned, ultimate subsidiary of The Hartford), from assets attributable to the Class IB shares for services rendered and expenses borne in connection with activities primarily intended to result in the sale of the Class IB shares, subject to the review and approval of the Company’s Board of Directors. |
The Distribution Plan provides that the Fund may pay annually up to 0.25% of the average daily net assets of the Fund attributable to its Class IB shares for activities primarily intended to result in the sale of Class IB shares. The Board has the authority to suspend or reduce these payments at any point in time. Under the terms of the Distribution Plan and the principal underwriting agreement, the Fund is authorized to make payments monthly to the Distributor that may be used to pay or compensate entities providing distribution and shareholder servicing with respect to the Class IB shares for such entities’ fees or expenses incurred or paid in that regard. These fees are accrued daily and paid monthly.
| f) | Other Related Party Transactions – Certain officers of the Fund are directors and/or officers of HL Advisors and/or The Hartford or its subsidiaries. For the six-month period ended June 30, 2011, a portion of the Fund’s chief compliance officer’s salary was paid by all the investment companies in the Hartford fund complex. The portion allocated to the Fund was in the amount of $1. Hartford Administrative Services Company (“HASCO”), an indirect wholly owned subsidiary of The Hartford, provides transfer agent services to the Fund. The amount paid to HASCO can be found in the Statement of Operations. These fees are accrued daily and paid monthly. |
| g) | Payments from Affiliates – In July of 2007, The Hartford entered into a settlement with the Attorneys General of the states of New York, Connecticut and Illinois relating to market timing and the company's individual variable annuity contracts in which certain payments would be made directly to the variable annuity contract holders. The distribution plan provided that unclaimed money from the settlement would be distributed to certain HLS Funds that are investment options through a Hartford individual variable annuity contract. The unclaimed money was distributed to the Fund on September 18, 2009, as follows: |
| Amount | ||||
| Reimbursement | $ | 499 | ||
| Hartford MidCap HLS Fund |
Notes to Financial Statements – (continued) |
| June 30, 2011 (Unaudited) |
| (000’s Omitted) |
On November 8, 2006, the SEC issued an order setting forth the terms of a settlement reached with three subsidiaries of The Hartford that resolved the SEC’s Division of Enforcement’s investigation of aspects of The Hartford’s variable annuity and mutual fund operations related to directed brokerage and revenue sharing. The Hartford settled this matter without admitting or denying the findings of the SEC.
The Fund is available for purchase by the separate accounts of different variable universal life policies, variable annuity products, and funding agreements and it is offered directly to certain qualified retirement plans (collectively “Products”). Although existing Products contain transfer restrictions, some Products, particularly older variable annuity products, do not contain restrictions on the frequency of transfers. In addition, as the result of the settlement of litigation against Hartford Life, Inc. (“Hartford Life”) (the issuers of such variable annuity products), the Fund’s ability to restrict transfers by certain owners of older variable annuity products was limited. During 2006, these annuity owners surrendered the older variable annuity contracts that were the subject of prior litigation. In February 2005, Hartford Life agreed with the Board of Directors of the Company to indemnify the Fund for any material harm caused to the Fund from frequent trading by these contract owners.
The total return in the accompanying financial highlights includes payments from affiliates. Had the payments from the affiliates been excluded, the impact and total return for the periods listed below would have been as follows:
| For the Year Ended December 31, 2009 | ||||||||
| Class IA | Class IB | |||||||
| Impact from Payment from Affiliate for Attorneys General Settlement | 0.03 | % | 0.03 | % | ||||
| Total Return Excluding Payment from Affiliate | 30.92 | 30.59 | ||||||
| For the Year Ended December 31, 2006 | ||||||||
| Class IA | Class IB | |||||||
| Impact from Payment from Affiliate for SEC Settlement | 0.15 | % | 0.15 | % | ||||
| Total Return Excluding Payment from Affiliate | 11.59 | 11.31 | ||||||
| 8. | Investment Transactions: |
For the six-month period ended June 30, 2011, the Fund's aggregate purchases and sales of investment securities (excluding short-term investments) were as follows:
| Amount | ||||
| Cost of Purchases Excluding U.S. Government Obligations | $ | 644,796 | ||
| Sales Proceeds Excluding U.S. Government Obligations | 692,294 | |||
| 9. | Line of Credit: |
The Fund is one of several Hartford funds that participate in a $500 million committed revolving line of credit facility. The facility is to be used for temporary or emergency purposes. Under the arrangement, a fund is required to own securities having a market value in excess of 300% of the total bank borrowings. The interest rate on borrowings varies depending on the nature of the loan. The facility also requires a fee to be paid based on the amount of the commitment. This commitment fee is allocated to all the funds participating in the line of credit based on the average net assets of the funds. During the six-month period ended June 30, 2011, the Fund did not have any borrowings under this facility.
| 10. | Industry Classifications: |
Other than the industry classifications “Other Investment Pools and Funds” and “Exchange Traded Funds,” equity industry classifications used in this report are the Global Industry Classification Standard, which was developed by and is the exclusive property and service mark of MSCI, Inc. and Standard & Poor’s.
| 11. | Indemnifications: |
Under the Company’s organizational documents, the Company shall indemnify its officers and directors to the full extent required or permitted under Maryland General Corporation Law and the federal securities laws. In addition, the Company, on behalf of the Fund, may enter into contracts that contain a variety of indemnifications. The Company’s maximum exposure under these arrangements is unknown. However, as of the date of these financial statements the Company has not had prior claims or losses pursuant to these contracts and expects the risk of loss to be remote.
Financial Highlights |
| - Selected Per-Share Data (A) - |
| Net Asset | Net Realized | Net Increase | ||||||||||||||||||||||||||||||||||||||||||
| Value at | and Unrealized | Total from | Dividends from | Distributions | (Decrease) in | Net Asset | ||||||||||||||||||||||||||||||||||||||
| Beginning of | Net Investment | Payments from | Gain (Loss) on | Investment | Net Investment | from Realized | Distributions | Total | Net Asset | Value at End of | ||||||||||||||||||||||||||||||||||
| Class | Period | Income (Loss) | (to) Affiliate | Investments | Operations | Income | Capital Gains | from Capital | Distributions | Value | Period | |||||||||||||||||||||||||||||||||
| For the Six-Month Period Ended June 30, 2011 (Unaudited) | ||||||||||||||||||||||||||||||||||||||||||||
| IA | $ | 26.01 | $ | 0.07 | $ | – | $ | 1.74 | $ | 1.81 | $ | – | $ | – | $ | – | $ | – | $ | 1.81 | $ | 27.82 | ||||||||||||||||||||||
| IB | 25.74 | 0.03 | – | 1.72 | 1.75 | – | – | – | – | 1.75 | 27.49 | |||||||||||||||||||||||||||||||||
| For the Year Ended December 31, 2010 | ||||||||||||||||||||||||||||||||||||||||||||
| IA | 21.12 | 0.10 | – | 4.85 | 4.95 | (0.06 | ) | – | – | (0.06 | ) | 4.89 | 26.01 | |||||||||||||||||||||||||||||||
| IB | 20.92 | 0.04 | – | 4.79 | 4.83 | (0.01 | ) | – | – | (0.01 | ) | 4.82 | 25.74 | |||||||||||||||||||||||||||||||
| For the Year Ended December 31, 2009 | ||||||||||||||||||||||||||||||||||||||||||||
| IA | 16.21 | 0.11 | 0.01 | 4.89 | 5.01 | (0.10 | ) | – | – | (0.10 | ) | 4.91 | 21.12 | |||||||||||||||||||||||||||||||
| IB | 16.06 | 0.04 | 0.01 | 4.86 | 4.91 | (0.05 | ) | – | – | (0.05 | ) | 4.86 | 20.92 | |||||||||||||||||||||||||||||||
| For the Year Ended December 31, 2008 | ||||||||||||||||||||||||||||||||||||||||||||
| IA | 26.34 | 0.12 | – | (9.03 | ) | (8.91 | ) | (0.12 | ) | (1.10 | ) | – | (1.22 | ) | (10.13 | ) | 16.21 | |||||||||||||||||||||||||||
| IB | 26.08 | 0.06 | – | (8.92 | ) | (8.86 | ) | (0.06 | ) | (1.10 | ) | – | (1.16 | ) | (10.02 | ) | 16.06 | |||||||||||||||||||||||||||
| For the Year Ended December 31, 2007(H) | ||||||||||||||||||||||||||||||||||||||||||||
| IA | 26.99 | 0.06 | – | 3.99 | 4.05 | (0.15 | ) | (4.55 | ) | – | (4.70 | ) | (0.65 | ) | 26.34 | |||||||||||||||||||||||||||||
| IB | 26.76 | (0.01 | ) | – | 3.95 | 3.94 | (0.07 | ) | (4.55 | ) | – | (4.62 | ) | (0.68 | ) | 26.08 | ||||||||||||||||||||||||||||
| For the Year Ended December 31, 2006 | ||||||||||||||||||||||||||||||||||||||||||||
| IA | 28.73 | 0.33 | 0.04 | 2.92 | 3.29 | (0.33 | ) | (4.70 | ) | – | (5.03 | ) | (1.74 | ) | 26.99 | |||||||||||||||||||||||||||||
| IB | 28.53 | 0.25 | 0.04 | 2.89 | 3.18 | (0.25 | ) | (4.70 | ) | – | (4.95 | ) | (1.77 | ) | 26.76 | |||||||||||||||||||||||||||||
| (A) | Information presented relates to a share outstanding throughout the indicated period. |
| (B) | The figures do not include sales charges or other fees which may be applied at the variable life insurance, variable annuity or qualified retirement plan product level. Any such additional sales charges or other fees would lower the Fund's performance. |
| (C) | Ratios do not reflect reductions for fees paid indirectly. Please see Fees Paid Indirectly in the Notes to Financial Statements. |
| (D) | Portfolio turnover rate is calculated on the basis of the Fund as a whole without distinguishing between the classes of shares issued. |
| (E) | Not annualized. |
| (F) | Annualized. |
| (G) | Total return without the inclusion of the Payment from (to) Affiliate can be found in Expenses in the accompanying Notes to Financial Statements. |
| (H) | Per share amounts have been calculated using the average shares method. |
| - Ratios and Supplemental Data - |
| Ratio of Expenses to Average Net | Ratio of Expenses to Average Net | Ratio of Net Investment Income to | Portfolio Turnover | |||||||||||||||||||
| Total Return(B) | Net Assets at End of Period | Assets Before Waivers(C) | Assets After Waivers(C) | Average Net Assets | Rate(D) | |||||||||||||||||
| 6.94 | %(E) | $ | 1,839,585 | 0.70 | %(F) | 0.70 | %(F) | 0.48 | %(F) | 34 | % | |||||||||||
| 6.80 | (E) | 94,331 | 0.95 | (F) | 0.95 | (F) | 0.14 | (F) | – | |||||||||||||
| 23.45 | 1,722,182 | 0.70 | 0.70 | 0.44 | 52 | |||||||||||||||||
| 23.15 | 124,465 | 0.95 | 0.95 | 0.12 | – | |||||||||||||||||
| 30.96 | (G) | 1,490,852 | 0.72 | 0.72 | 0.48 | 82 | ||||||||||||||||
| 30.62 | (G) | 173,205 | 0.97 | 0.97 | 0.23 | – | ||||||||||||||||
| (35.32 | ) | 1,552,741 | 0.69 | 0.69 | 0.51 | 92 | ||||||||||||||||
| (35.49 | ) | 169,328 | 0.94 | 0.94 | 0.26 | – | ||||||||||||||||
| 15.30 | 2,716,285 | 0.69 | 0.69 | 0.22 | 79 | |||||||||||||||||
| 15.01 | 302,151 | 0.94 | 0.94 | (0.03 | ) | – | ||||||||||||||||
| 11.74 | (G) | 2,606,275 | 0.68 | 0.68 | 1.06 | 89 | ||||||||||||||||
| 11.46 | (G) | 274,695 | 0.93 | 0.93 | 0.82 | – | ||||||||||||||||
| Directors and Officers (Unaudited) |
The Board of Directors of the Company appoints officers who are responsible for the day-to-day operations of the Fund and who execute policies formulated by the Directors. Each director serves until his or her death, resignation, or retirement or until the next annual meeting of shareholders is held or until his or her successor is elected and qualifies.
Directors and officers who are employed by or who have a financial interest in The Hartford are considered “interested” persons of the Fund pursuant to the 1940 Act. Each officer and two of the Company’s directors, as noted in the chart below, are “interested” persons of the Fund. Each director serves as a director for The Hartford Mutual Funds, Inc., The Hartford Mutual Funds II, Inc., Hartford Series Fund, Inc., and Hartford HLS Series Fund II, Inc., which, as of June 30, 2011, collectively consist of 89 funds. Correspondence may be sent to directors and officers c/o Hartford Mutual Funds, P.O. Box 2999, Hartford, Connecticut 06104-2999, except that correspondence to Ms. Fagely may be sent to 500 Bielenberg Drive, Woodbury, Minnesota 55125.
The table below sets forth, for each director and officer, his or her name, year of birth, current position with the Company and date first elected or appointed to Hartford Series Fund, Inc. (“HSF”), and Hartford HLS Series Fund II, Inc. (“HSF2”), principal occupation, and, for directors, other directorships held. The Fund’s statement of additional information contains further information on the directors and is available free of charge by calling 1-800-862-6668 or writing to Hartford HLS Funds, c/o Individual Annuity Services, P.O. Box 5085, Hartford, CT 06102-5085.
Information on the aggregate remuneration paid to the directors of the Company can be found in the Statement of Operations herein. The Fund pays to The Hartford a portion of the chief compliance officer’s compensation, but does not pay salaries or compensation to any of their other officers or directors who are employed by The Hartford.
Non-Interested Directors
Lynn S. Birdsong (1946) Director since 2003, Co-Chairman of the Investment Committee
Mr. Birdsong is a private investor. Mr. Birdsong currently serves as a Director of the Sovereign High Yield Investment Company (April 2010 to current). Mr. Birdsong currently serves as an Independent Director of Nomura Partners Funds, Inc. (formerly, The Japan Fund) (March 2003 to current). From 2003 to March 2005, Mr. Birdsong was an independent director of the Atlantic Whitehall Funds. From 1979 to 2002, Mr. Birdsong was a managing director of Zurich Scudder Investments, an investment management firm. During his employment with Scudder, Mr. Birdsong was an Interested Director of The Japan Fund. Since 1981, Mr. Birdsong has been a partner in Birdsong Company, an advertising specialty firm.
Robert M. Gavin, Jr. (1940) Director since 2002 (HSF) and 1986 (HSF2), Chairman of the Board since 2004
Dr. Gavin is an educational consultant. Prior to September 1, 2001, he was President of Cranbrook Education Community and prior to July 1996, he was President of Macalester College, St. Paul, Minnesota.
Duane E. Hill (1945) Director since 2001 (HSF) and 2002 (HSF2), Chairman of the Nominating Committee
Mr. Hill is Partner of TSG Ventures L.P., a private equity investment company. Mr. Hill is a former partner of TSG Capital Group, a private equity investment firm that served as sponsor and lead investor in leveraged buyouts of middle market companies.
Sandra S. Jaffee (1941) Director since 2005
Ms. Jaffee served as Chairman (2008 to 2009) and Chief Executive Officer of Fortent (formerly Searchspace Group), a leading provider of compliance/regulatory technology to financial institutions from August 2005 to August 2009. From August 2004 to August 2005, Ms. Jaffee served as an Entrepreneur in Residence with Warburg Pincus, a private equity firm. From September 1995 to July 2004, Ms. Jaffee served as Executive Vice President at Citigroup, where she was President and Chief Executive Officer of Citibank’s Global Securities Services (1995 to 2003). Ms. Jaffe currently serves as a member of the Board of Directors of Broadridge Financial Solutions as well as a Trustee of Muhlenberg College.
William P. Johnston (1944) Director since 2005, Chairman of the Compliance Committee
In June 2006, Mr. Johnston was appointed as Senior Advisor to The Carlyle Group, a global private equity investment firm. In July 2006, Mr. Johnston was elected to the Board of Directors of MultiPlan, Inc. In August 2007, Mr. Johnston was elected to the Board of Directors of LifeCare Holdings, Inc. In February 2008, Mr. Johnston was elected to the Board of Directors of HCR-ManorCare, Inc. In May 2006, Mr. Johnston was elected to the Supervisory Board of Fresenius Medical Care AG & Co. KGaA, after its acquisition of Renal Care Group, Inc. in March 2006. Mr. Johnston joined Renal Care Group in November 2002 as a member of the Board of Directors and served as Chairman of the Board from March 2003 through March 2006. From September 1987 to December 2002, Mr. Johnston was with Equitable Securities Corporation (and its successors, SunTrust Equitable Securities and SunTrust Robinson Humphrey) serving in various investment banking and managerial positions, including Managing Director and Head of Investment Banking, Chief Executive Officer and Vice Chairman.
Phillip O. Peterson (1944) Director since 2002 (HSF) and 2000 (HSF2), Chairman of the Audit Committee
Mr. Peterson is a mutual fund industry consultant. He was a partner of KPMG LLP (an accounting firm) until July 1999. Mr. Peterson joined William Blair Funds in February 2007 as a member of the Board of Trustees. From January 2004 to April 2005, Mr. Peterson served as Independent President of the Strong Mutual Funds.
Lemma W. Senbet (1946) Director since 2005
Dr. Senbet is the William E. Mayer Chair Professor of Finance and Director, Center for Financial Policy, at the University of Maryland, Robert H. Smith School of Business. He was chair of the Finance Department from 1998 to 2006. Previously he was a chaired professor of finance at the University of Wisconsin-Madison. Also, he was director of the Fortis Funds from March 2000 to July 2002. Dr. Senbet served the finance profession in various capacities, including as director of the American Finance Association and President of the Western Finance Association. In 2006, Dr. Senbet was inducted Fellow of Financial Management Association International for his career-long distinguished scholarship and professional service.
Interested Directors and Officers
David N. Levenson (1966) Director since 2010
Mr. Levenson currently serves as President of The Hartford’s Wealth Management business. He was appointed to this role in July 2010. Previously, Mr. Levenson served as Executive Vice President of Legacy Holdings for The Hartford from June 2009 to July 2010. From 2006 to 2009, Mr. Levenson was with Hartford Life Insurance K.K. where he served as President and CEO from 2007 to 2009. He served as Managing Director of Hartford Investment Management Company from 2005 to 2006. Additionally, Mr. Levenson serves as Executive Vice President of The Hartford and as President, Director and Chief Executive Officer of Hartford Life Insurance Company (“HLIC”) and Hartford Life, Inc. (“HL Inc.”).
Lowndes A. Smith (1939) Director since 1996 (HSF) and 2002 (HSF2), Co-Chairman of the Investment Committee
Mr. Smith served as Vice Chairman of The Hartford from February 1997 to January 2002, as President and Chief Executive Officer of HL Inc. from February 1997 to January 2002, and as President and Chief Operating Officer of The Hartford Life Insurance Companies from January 1989 to January 2002. Mr. Smith serves as a Director of White Mountains Insurance Group, Ltd., One Beacon Insurance and Symetra Financial and as a Managing Director of Whittington Gray Associates.
Other Officers
James E. Davey (1964) President and Chief Executive Officer since 2010
Mr. Davey serves as Executive Vice President of HLIC. Additionally, Mr. Davey serves as President, Chief Executive Officer and Manager of Hartford Investment Financial Services, Inc. (“HIFSCO”) and President, Chief Executive Officer and Manager of HL Advisors. Mr. Davey joined The Hartford in 2002.
Tamara L. Fagely (1958) Vice President, Treasurer and Controller since 2002 (HSF) and 1993 (HSF2)
Ms. Fagely has been a Vice President of HASCO since 1998 and Chief Financial Officer since 2006. Currently Ms. Fagely is a Vice President of HLIC. She served as Assistant Vice President of HLIC from December 2001 through March 2005. In addition, Ms. Fagely is Controller and Chief Financial Officer of HIFSCO.
Susan M. Fleege (1959) AML Compliance Officer since 2011
Ms. Fleege currently serves as a Director of Risk Management at The Hartford. She previously served as AML Compliance Officer for the Fund from 2005-2008. Ms. Fleege joined HLIC in 2005 from Amerprise Financial Corporation where she held the position of Counsel from 2000 to 2005. Ms. Fleege is a certified Anti-Money Laundering Specialist.
Dr. Robert J. Froehlich (1953) Senior Managing Director since 2009
Dr. Froehlich joined The Hartford as Senior Managing Director in September 2009. Prior to joining The Hartford, Dr. Froehlich served as Vice Chairman of Deutsche Asset Management from 1997-2009.
Edward P. Macdonald (1967) Vice President, Secretary and Chief Legal Officer since 2005
Mr. Macdonald serves as Vice President of HLIC and Chief Legal Officer of Mutual Funds and Vice President of HIFSCO. He also serves as Vice President and Secretary of HASCO, and Chief Legal Officer, Secretary and Vice President of HL Advisors. Mr. Macdonald joined The Hartford in 2005.
Hartford MidCap HLS Fund |
| Directors and Officers (Unaudited) – (continued) |
Vernon J. Meyer (1964) Vice President since 2006
Mr. Meyer serves as Senior Vice President of HLIC. He also serves as Senior Vice President of HIFSCO and HL Advisors. Mr. Meyer joined The Hartford in 2004.
Colleen B. Pernerewski (1969) Vice President and Chief Compliance Officer since 2010
Ms. Pernerewski serves as Vice President and Chief Investment Advisor Compliance Officer of HIFSCO and as Vice President and Chief Compliance Officer of HL Advisors. Ms. Pernerewski joined The Hartford in 2005 from Travelers Life and Annuity where she served as Counsel (2004-2005). Prior to Travelers Life and Annuity, Ms. Pernerewski held the position of Counsel at The Hartford (1998-2004).
Elizabeth L. Schroeder (1966) Vice President since 2010
Ms. Schroeder currently serves as Assistant Vice President of HLIC. Ms. Schroeder joined HLIC in 1991. She is also an Assistant Vice President of HIFSCO and HL Advisers.
Martin Swanson (1962) Vice President since 2010
Mr. Swanson is a Vice President of HLIC. Mr. Swanson also serves as Vice President/Marketing for HIFSCO. Prior to joining HLIC in 1998, Mr. Swanson was a Vice President at PaineWebber, Inc.
Jane Wolak (1961) Vice President since 2009
Ms. Wolak currently serves as Senior Vice President of HLIC. Ms. Wolak joined HLIC as Vice President, Retail Product Services in May 2007. She is also Vice President of HASCO. Previously, Ms. Wolak was with Sun Life Financial where she held the position of Vice President, Service Center Operations from 2001-2007.
A description of the policies and procedures that the Fund uses to determine how to vote proxies relating to portfolio securities and a record of how the Fund voted any proxies for the twelve-month period ended June 30, 2011 are available (1) without charge, upon request, by calling 800-862-6668 and (2) on the SEC’s website at http://www.sec.gov.
The Fund files a complete schedule of portfolio holdings with the SEC for the first and third quarters of each fiscal year on Form N-Q. The Fund’s Forms are available (1) without charge, upon request, by calling 800-862-6668 and (2) on the SEC’s website at http://www.sec.gov. The Form N-Q may be reviewed and copied at the SEC’s Public Reference Room in Washington, DC. Information on the operation of the Public Reference Room may be obtained by calling 1-800-SEC-0330.
| Expense Example (Unaudited) |
Your Fund's Expenses
As a shareholder of the Fund, you incur two types of costs: (1) transaction costs and (2) ongoing costs including investment management fees, distribution fees, and other fund expenses. This example is intended to help you understand your ongoing costs (in dollars) of investing in a Fund and to compare these costs with the ongoing costs of investing in other mutual funds. The example is based on an investment of $1,000 invested at the beginning of the period and held for the period of December 31, 2010 through June 30, 2011.
Actual Expenses
The first set of columns of the table below provides information about actual account values and actual expenses. You may use the information in this column, together with the amount you invested, to estimate the expenses that you paid over the period. Simply divide your account value by $1,000 (for example, an $8,600 account value divided by $1,000 = 8.6), then multiply the result by the number in the line under the heading entitled “Expenses Paid During Period” to estimate the expenses you paid on your account during this period.
Hypothetical Example for Comparison Purposes
The second set of columns of the table below provides information about hypothetical account values and hypothetical expenses based on a Fund's actual expense ratio and an assumed rate of return of 5% per year before expenses, which is not the Fund's actual return. The hypothetical account values and expenses may not be used to estimate the actual ending account balance or expenses you paid for the period. You may use this information to compare the ongoing costs of investing in a Fund and other funds. To do so, compare this 5% hypothetical example with the 5% hypothetical examples that appear in the shareholder reports of the other funds.
Please note that the expenses shown in the table are meant to highlight your ongoing costs only and do not reflect any transactional costs, such as sales charges (loads) and CDSC. Therefore, the second set of columns of the table is useful in comparing ongoing costs only, and will not help you determine the relative total costs of owning different funds. In addition, if these transactional costs were included, your costs would be higher. Expenses are equal to the Fund's annualized expense ratios multiplied by average account value over the period, multiplied by 181/365 (to reflect the one-half year period).
| Actual return | Hypothetical (5% return before expenses) | |||||||||||||||||||||||||||||||||||
| Expenses paid | Expenses paid | Days in | ||||||||||||||||||||||||||||||||||
| during the period | during the period | the | Days | |||||||||||||||||||||||||||||||||
| Beginning | Ending | December 31, 2010 | Beginning | Ending | December 31, 2010 | Annualized | current | in the | ||||||||||||||||||||||||||||
| Account Value | Account Value | through | Account Value | Account Value | through | expense | 1/2 | full | ||||||||||||||||||||||||||||
| December 31, 2010 | June 30, 2011 | June 30, 2011 | December 31, 2010 | June 30, 2011 | June 30, 2011 | ratio | year | year | ||||||||||||||||||||||||||||
| Class IA | $ | 1,000.00 | $ | 1,069.45 | $ | 3.59 | $ | 1,000.00 | $ | 1,021.32 | $ | 3.51 | 0.70 | % | 181 | 365 | ||||||||||||||||||||
| Class IB | $ | 1,000.00 | $ | 1,068.00 | $ | 4.87 | $ | 1,000.00 | $ | 1,020.08 | $ | 4.76 | 0.95 | % | 181 | 365 | ||||||||||||||||||||
27
| The Hartford | |
| P.O. Box 5085 | |
| Hartford, CT 06102-5085 |
Hartford Series Fund, Inc. is underwritten and distributed by Hartford Securities Distribution Company, Inc.
"The Hartford" is The Hartford Financial Services Group, Inc. and its subsidiaries.
Hartford Series Fund, Inc. inception dates range from 1977 to date. Hartford Series Fund, Inc. is not a subsidiary of The Hartford but is underwritten, distributed by and advised by subsidiaries of The Hartford. Investments in Hartford Series Fund, Inc. are not guaranteed by The Hartford or any other entity.
You should carefully consider investment objectives, risks, and charges and expenses of Hartford HLS Funds before investing. This and other information can be found in the Fund’s prospectus or summary prospectus, which can be obtained by calling 800-862-6668. Please read them carefully before you invest or send money.
HLSSAR-MC11 8-11 | 106632 | Printed in U.S.A ©2011 The Hartford, Hartford, CT 06115 |

A MESSAGE FROM THE PRESIDENT

Dear Fellow Shareholders:
I want to take this opportunity to say thank you for your continued confidence and trust.
We have seen a significant amount of global turbulence in the first half of 2011. Investors have continued to be concerned about the implications of the European sovereign debt crisis, as well as our own high levels of domestic debt. Since January we have witnessed significant political uprisings in the already-volatile Middle East and North Africa region. In addition, the ramifications of Japan's massive earthquake, subsequent tsunami, and nuclear disaster are still being played out in the market.
Although corporate earnings have remained robust, the unemployment picture has been mixed. After adding more than 200,000 jobs from February to April, more recent unemployment reports have shown a pullback in hiring.
While official inflation remains low as measured by the Consumer Price Index (CPI), high oil prices may be indicative of higher inflation in the future. The federal funds rate remains at a historic low, however, the Fed could potentially raise the rate to get it closer to its historical average once the economy strengthens.
Even with these headwinds, domestic, international, and world indices (as measured by the S&P 500, MSCI EAFE and MSCI World) are all up more than 5% through June, 30 2011.
Looking ahead, continued growth in emerging markets is fueling global recovery efforts. Emerging markets comprise about 48 percent of the world’s GDP, and many economists believe they are poised for further expansion. As GDP growth continues in emerging markets, roughly 100 million people are added to the middle class each year. This middle class population growth could potentially drive a considerable shift in consumer purchasing power.
Now that we have reached the midpoint of 2011, perhaps now would be a good time to schedule a meeting with your financial adviser to examine your current investment strategy and determine whether you are on the right track.
| • | Are you concerned about inflation and its effects on your portfolio? |
| • | Is your portfolio prepared for rising interest rates? |
| • | Does your portfolio reflect the global economy with a mix of developed nations and emerging markets? |
Your financial professional’s advice can help you to navigate today’s volatile markets with confidence. You can also rest assured that we will continue to provide you with solid investments and stellar service for the road ahead.
Thank you again for your business.

James Davey
President
Hartford HLS Funds
Hartford MidCap Value HLS Fund
| Manager Discussion (Unaudited) | 2 | |
| Financial Statements | ||
| 5 | ||
| 8 | ||
| 9 | ||
| 10 | ||
| 11 | ||
| 12 | ||
| 22 | ||
| 24 | ||
| 26 | ||
| 26 | ||
| 27 |
This report is prepared for the general information of contract owners and qualified retirement plan participants. It is not an offer of contracts or of qualified retirement plans. It should not be used in connection with any offer, except in conjunction with the appropriate product prospectus which contains all pertinent information including the applicable sales, administrative and other charges.
The views expressed in the Fund’s Manager Discussion under ‘‘Why did the Fund perform this way?’’ and ‘‘What is the outlook?’’ are views of the Fund’s sub-adviser and portfolio management team through the end of the reporting period and are subject to change based on market and other conditions.
Hartford MidCap Value HLS Fund* inception 04/30/2001 |
| (sub-advised by Wellington Management Company, LLP) |
| Investment objective – Seeks long-term capital appreciation. |
Performance Overview 6/30/01 - 6/30/11

The chart above shows the growth of a $10,000 investment in Class IA. Growth results in classes other than Class IA will vary from what is seen above due to differences in the expenses charged to those share classes.
Average Annual Total Returns (as of 6/30/11)
6 Month† | 1 Year | 5 year | 10 year | |
| MidCap Value IA | 4.02% | 34.45% | 4.79% | 7.74% |
| MidCap Value IB | 3.89% | 34.11% | 4.53% | 7.48% |
| Russell 2500 Value Index | 6.10% | 34.54% | 3.54% | 8.36% |
| Russell MidCap Value Index | 6.69% | 34.28% | 4.01% | 8.42% |
| † | Not Annualized |
PAST PERFORMANCE IS NOT INDICATIVE OF FUTURE RESULTS.
Total returns presented above were calculated using the Fund's net asset value available to shareholders for sale or redemption of Fund shares on June 30, 2011, which excludes investment transactions as of this date.
Russell 2500 Value Index is an unmanaged index measuring the performance of those Russell 2500 Index companies with lower price-to-book ratios and lower forecasted growth values. (The Russell 2500 Index is an unmanaged index that measures the performance of the 2,500 smallest U.S. companies based on total market capitalization.)
Russell MidCap Value Index measures the performance of the mid-cap value segment of the U.S. equity universe. It includes those Russell Midcap Index companies with lower price-to-book ratios and lower forecasted growth values.
The Fund has added an additional benchmark, the Russell MidCap Value Index. The Fund’s investment manager believes that the Russell MidCap Value index, along with the Fund’s current benchmark Russell 2500 Value Index, comprises the universe of securities in which the Fund primarily invests.
You cannot invest directly in an index.
The chart represents a hypothetical investment in the Fund. Performance data represents past performance and current performance could be higher or lower.
Performance information may reflect historical or current expense waivers/reimbursements from the investment adviser, without which performance would have been lower. For information on current expense waivers/reimbursements, please see the prospectus.
The value of the fund will fluctuate so that when redeemed, it may be worth more or less than the original investment. The chart and table do not reflect the deductions of taxes, sales charges or other fees which may be applied at the variable life insurance, variable annuity or qualified retirement plan product level. Any such additional sales charges or other fees or expenses would lower the contract’s or plan’s performance.
| * | The Fund has restrictions on the purchase of shares. A description of the restrictions can be found in the prospectus. |
| Portfolio Manager |
| James N. Mordy |
| Senior Vice President |
How did the Fund perform?
The Class IA shares of the Hartford MidCap Value HLS Fund returned 4.02% for the six-month period ended June 30, 2011, underperforming its benchmarks, the Russell 2500 Value Index, which returned 6.10% and the Russell MidCap Value Index, which returned 6.69% for the same period. The Fund also underperformed the 5.66% return of the average fund in the Lipper Mid-Cap Value Funds VP-UF peer group, a group of funds with investment strategies similar to those of the Fund.
Why did the Fund perform this way?
U.S. equities moved higher during the period despite a high degree of volatility caused by mounting concerns about unrest in North Africa and the Middle East and the devastating earthquake and nuclear crisis in Japan. Equities were pushed higher by investors’ enthusiasm for additional government debt purchases by the U.S. Federal Reserve, the extension of tax cuts in the U.S., and strong earnings growth. Fears of a global economic slowdown due to sovereign debt troubles in Europe, Japanese supply disruptions, and the end of the Federal Reserve’s quantitative easing program were not enough to offset optimism about the global economy, strong corporate earnings, and a continued accommodative Fed policy.
During the period, mid-cap equities (+9%) outperformed large-caps (+6%) and small-caps (+6%) as represented by the S&P 400 MidCap, S&P 500, and Russell 2000 Indices, respectively. All ten sectors in the Russell 2500 Value Index gained during the period, with Energy (+18%), Health Care (+17%), and Utilities (+13%) performing the best. Financials (+2%) and Information Technology (+3%) lagged on a relative basis during the period.
The Fund’s relative underperformance versus the index was primarily driven by weaker stock selection within Materials, Financials, and Consumer Staples, which overshadowed strong positive stock selection within Information Technology and Consumer Discretionary. Overall sector allocation, a result of bottom-up (i.e. stock by stock fundamental research) security selection, was a modest contributor to relative returns, in part due to our underweight (i.e. the Fund’s sector position was less than the benchmark position) position in Financials and overweight (i.e. the Fund’s sector position was greater than the benchmark position) within Health Care. A modest cash position was a mild detractor in an upward trending market.
The largest detractors from benchmark-relative (i.e. performance of the Fund as measured against the benchmark) returns included Sino-Forest (Materials), Delta Air Lines (Industrials), and PHH Corp. (Financials). Sino Forest is a leading Chinese timber company. The stock collapsed on allegations of fraud by an independent research firm. Management denied all accusations and the Board assembled an independent committee to investigate. We are actively monitoring ongoing developments in this fluid situation and continue to pursue our own checks. Shares of Delta Air Lines fell during the period as rising oil prices and the tsunami in Japan weighed on the stock. Management lowered guidance at the end of March to account for the impact of these events. Shares of PHH Corp., a mortgage originator, declined despite the company exceeding its market share gain and EPS goals for 2010. The immediate outlook for the industry is reduced refinance volumes on higher mortgage rates and lower production margins. In addition, Platinum Underwriters (Financials) was among the top detractors from absolute returns (i.e. total return).
The largest contributors to absolute and benchmark-relative performance included Varian Semiconductor Equipment (Information Technology), CIGNA (Health Care), and Cabot Oil & Gas (Energy). Varian Semiconductor Equipment, a supplier of semiconductor equipment, agreed to be acquired by Applied Materials at more than a 50% premium to its stock price just prior to the announcement. Shares of CIGNA, a provider of medical and other health insurance to groups and individuals, rose as the company’s quarterly earnings came in above expectations. CIGNA’s pricing improvements stayed ahead of decelerating medical cost trends. Shale gas producer Cabot Oil & Gas's share price soared after rising productivity of new wells in its Susquehanna County, PA Marcellus acreage resulted in multiple revisions to production guidance.
What is the outlook?
Economic momentum remained sluggish in recent months, with the most notable disappointments being the lack of jobs growth in the U.S. and the tenuous economic and political climate in Europe. Relative to three months ago, equity markets have more fully discounted these concerns, and we now can anticipate some developments which could lead to improved sentiment and a somewhat firmer economic tone. These would include rebuilding efforts in Japan, an easing of commodity price pressure, less uncertainty around banking reform, higher U.S. auto production, stronger U.S. capital
spending in the second half of 2011 while tax incentives remain in place, and potential progress from Congress toward long-term fiscal deficit reduction.
The annual rebalancing of our benchmark index near the end of the quarter did impact our relative sector weightings. At June 30 we were underweight the more cyclical sectors, led by Financials, Consumer Discretionary, and Information Technology. We ended the period overweight Materials with a more modest overweight in Consumer Staples and Health Care.
| Diversification by Industry | ||||
| as of June 30, 2011 | ||||
| Percentage of | ||||
| Industry (Sector) | Net Assets | |||
| Banks (Financials) | 5.2 | % | ||
| Capital Goods (Industrials) | 14.2 | |||
| Consumer Durables & Apparel (Consumer Discretionary) | 3.6 | |||
| Consumer Services (Consumer Discretionary) | 0.7 | |||
| Diversified Financials (Financials) | 5.0 | |||
| Energy (Energy) | 6.4 | |||
| Food, Beverage & Tobacco (Consumer Staples) | 6.1 | |||
| Health Care Equipment & Services (Health Care) | 5.7 | |||
| Insurance (Financials) | 9.2 | |||
| Materials (Materials) | 10.0 | |||
| Media (Consumer Discretionary) | 2.0 | |||
| Pharmaceuticals, Biotechnology & Life Sciences (Health Care) | 3.0 | |||
| Real Estate (Financials) | 6.8 | |||
| Retailing (Consumer Discretionary) | 4.9 | |||
| Semiconductors & Semiconductor Equipment (Information Technology) | 3.0 | |||
| Software & Services (Information Technology) | 0.9 | |||
| Technology Hardware & Equipment (Information Technology) | 2.9 | |||
| Transportation (Industrials) | 1.5 | |||
| Utilities (Utilities) | 7.0 | |||
| Short-Term Investments | 1.5 | |||
| Other Assets and Liabilities | 0.4 | |||
| Total | 100.0 | % | ||
Schedule of Investments June 30, 2011 (Unaudited) |
| (000’s Omitted) |
| Shares or Principal Amount | Market Value ╪ | ||||||
| COMMON STOCKS - 98.1% | |||||||
| Banks - 5.2% | |||||||
| 218 | Bankunited, Inc. | $ | 5,797 | ||||
| 345 | Beneficial Mutual Bancorp, Inc. ● | 2,835 | |||||
| 199 | Comerica, Inc. | 6,862 | |||||
| 221 | First Midwest Bancorp, Inc. | 2,720 | |||||
| 488 | Huntington Bancshares, Inc. | 3,199 | |||||
| 2,409 | Popular, Inc. ● | 6,648 | |||||
| 170 | Umpqua Holdings Corp. | 1,969 | |||||
| 30,030 | |||||||
| Capital Goods - 14.2% | |||||||
| 102 | AGCO Corp. ● | 5,040 | |||||
| 73 | AMETEK, Inc. | 3,262 | |||||
| 386 | Barnes Group, Inc. | 9,573 | |||||
| 95 | Dover Corp. | 6,414 | |||||
| 77 | Esterline Technologies Corp. ● | 5,912 | |||||
| 127 | Hubbell, Inc. Class B | 8,268 | |||||
| 248 | Pentair, Inc. | 10,005 | |||||
| 129 | Teledyne Technologies, Inc. ● | 6,501 | |||||
| 136 | Terex Corp. ● | 3,864 | |||||
| 303 | Textron, Inc. | 7,144 | |||||
| 190 | Thomas & Betts Corp. ● | 10,226 | |||||
| 132 | URS Corp. ● | 5,892 | |||||
| 82,101 | |||||||
| Consumer Durables & Apparel - 3.6% | |||||||
| 268 | Mattel, Inc. | 7,376 | |||||
| 266 | MDC Holdings, Inc. | 6,549 | |||||
| 339 | Toll Brothers, Inc. ● | 7,031 | |||||
| 20,956 | |||||||
| Consumer Services - 0.7% | |||||||
| 63 | DeVry, Inc. | 3,695 | |||||
| Diversified Financials - 5.0% | |||||||
| 40 | Affiliated Managers Group, Inc. ● | 4,068 | |||||
| 210 | Invesco Ltd. | 4,909 | |||||
| 44 | LPL Investment Holdings, Inc. ● | 1,509 | |||||
| 652 | PHH Corp. ● | 13,379 | |||||
| 198 | Solar Capital Ltd. | 4,894 | |||||
| 452 | Solar Cayman Ltd. ⌂●† | 41 | |||||
| 28,800 | |||||||
| Energy - 6.4% | |||||||
| 39 | Cabot Oil & Gas Corp. | 2,606 | |||||
| 303 | Cobalt International Energy ● | 4,134 | |||||
| 78 | Consol Energy, Inc. | 3,762 | |||||
| 77 | ENSCO International plc | 4,104 | |||||
| 122 | Japan Petroleum Exploration Co., Ltd. | 5,746 | |||||
| 280 | Lone Pine Resources, Inc. ● | 2,973 | |||||
| 88 | Newfield Exploration Co. ● | 5,972 | |||||
| 103 | Overseas Shipholding Group, Inc. | 2,775 | |||||
| 94 | Tidewater, Inc. | 5,042 | |||||
| 37,114 | |||||||
| Food, Beverage & Tobacco - 6.1% | |||||||
| 35 | Bunge Ltd. Finance Corp. | 2,393 | |||||
| 4,431 | China Agri-Industries Holdings | 4,708 | |||||
| 295 | Cosan Ltd. | 3,630 | |||||
| 426 | Maple Leaf Foods, Inc. | 5,254 | |||||
| 197 | Molson Coors Brewing Co. | 8,832 | |||||
| 70 | Sanderson Farms, Inc. | 3,361 | |||||
| 357 | Tyson Foods, Inc. Class A | 6,937 | |||||
| 35,115 | |||||||
| Health Care Equipment & Services - 5.7% | |||||||
| 255 | Amerisource Bergen Corp. | 10,574 | |||||
| 305 | Brookdale Senior Living, Inc. ● | 7,391 | |||||
| 274 | CIGNA Corp. | 14,066 | |||||
| 55 | Vanguard Health Systems, Inc. ● | 936 | |||||
| 32,967 | |||||||
| Insurance - 9.2% | |||||||
| 105 | Everest Re Group Ltd. | 8,559 | |||||
| 340 | Fidelity National Financial, Inc. | 5,350 | |||||
| 160 | Platinum Underwriters Holdings Ltd. | 5,304 | |||||
| 230 | Principal Financial Group, Inc. | 7,000 | |||||
| 207 | Reinsurance Group of America, Inc. | 12,568 | |||||
| 48 | StanCorp Financial Group, Inc. | 2,021 | |||||
| 487 | Unum Group | 12,419 | |||||
| 53,221 | |||||||
| Materials - 10.0% | |||||||
| 59 | CF Industries Holdings, Inc. | 8,288 | |||||
| 101 | FMC Corp. | 8,714 | |||||
| 94 | Greif, Inc. | 6,106 | |||||
| 1,164 | Incitec Pivot Ltd. | 4,846 | |||||
| 646 | Louisiana-Pacific Corp. ● | 5,256 | |||||
| 308 | Methanex Corp. ADR | 9,652 | |||||
| 243 | Owens-Illinois, Inc. ● | 6,259 | |||||
| 724 | Rexam plc | 4,452 | |||||
| 132 | Sino Forest Corp. ■● | 438 | |||||
| 220 | Sino Forest Corp. Class A ● | 730 | |||||
| 197 | Steel Dynamics, Inc. | 3,203 | |||||
| 57,944 | |||||||
| Media - 2.0% | |||||||
| 386 | Virgin Media, Inc. | 11,562 | |||||
| Pharmaceuticals, Biotechnology & Life Sciences - 3.0% | |||||||
| 659 | Almirall S.A. | 7,048 | |||||
| 335 | Impax Laboratories, Inc. ● | 7,304 | |||||
| 62 | UCB S.A. | 2,806 | |||||
| 17,158 | |||||||
| Real Estate - 6.8% | |||||||
| 127 | American Assets Trust, Inc. | 2,843 | |||||
| 1,027 | BR Properties S.A. | 11,582 | |||||
| 422 | Duke Realty, Inc. | 5,908 | |||||
| 283 | Forest City Enterprises, Inc. Class A ● | 5,276 | |||||
| 111 | Iguatemi Emp de Shopping | 2,714 | |||||
| 176 | Multiplan Empreendimentos Imobiliarios S.A. | 3,852 | |||||
| 177 | Plum Creek Timber Co., Inc. | 7,159 | |||||
| 39,334 | |||||||
| Retailing - 4.9% | |||||||
| 206 | Ann, Inc. ● | 5,385 | |||||
| 5,788 | Buck Holdings L.P. ⌂●† | 14,324 | |||||
| 109 | Ross Stores, Inc. | 8,741 | |||||
| 28,450 | |||||||
| Semiconductors & Semiconductor Equipment - 3.0% | |||||||
| 243 | Avago Technologies Ltd. | 9,215 | |||||
| 387 | Microsemi Corp. ● | 7,937 | |||||
| 17,152 | |||||||
| Software & Services - 0.9% | |||||||
| 94 | BMC Software, Inc. ● | 5,164 | |||||
| Technology Hardware & Equipment - 2.9% | |||||||
| 355 | Arrow Electronics, Inc. ● | 14,720 | |||||
The accompanying notes are an integral part of these financial statements.
| Hartford MidCap Value HLS Fund |
| Schedule of Investments – (continued) |
| June 30, 2011 (Unaudited) |
| (000’s Omitted) |
| Shares or Principal Amount | Market Value ╪ | |||||||||
| COMMON STOCKS - 98.1% - (continued) | ||||||||||
| Technology Hardware & Equipment - 2.9% - (continued) | ||||||||||
| 278 | Flextronics International Ltd. ● | $ | 1,786 | |||||||
| 16,506 | ||||||||||
| Transportation - 1.5% | ||||||||||
| 438 | Delta Air Lines, Inc. ● | 4,018 | ||||||||
| 335 | Swift Transportation Co. ● | 4,545 | ||||||||
| 8,563 | ||||||||||
| Utilities - 7.0% | ||||||||||
| 748 | N.V. Energy, Inc. | 11,479 | ||||||||
| 300 | Northeast Utilities | 10,533 | ||||||||
| 181 | UGI Corp. | 5,772 | ||||||||
| 260 | Westar Energy, Inc. | 6,986 | ||||||||
| 184 | Wisconsin Energy Corp. | 5,775 | ||||||||
| 40,545 | ||||||||||
| Total common stocks | ||||||||||
| (cost $464,912) | $ | 566,377 | ||||||||
| Total long-term investments | ||||||||||
| (cost $464,912) | $ | 566,377 | ||||||||
| SHORT-TERM INVESTMENTS - 1.5% | ||||||||||
| Repurchase Agreements - 1.5% | ||||||||||
| Bank of America Merrill Lynch TriParty Joint | ||||||||||
| Repurchase Agreement (maturing on | ||||||||||
| 07/01/2011 in the amount of $869, | ||||||||||
| collateralized by FHLB 4.91%, 2015, | ||||||||||
| GNMA 0.87% - 5.72%, 2025 - 2061, value | ||||||||||
| of $886) | ||||||||||
| $ | 869 | 0.05%, 06/30/2011 | $ | 869 | ||||||
| BNP Paribas Securities Corp. TriParty Joint | ||||||||||
| Repurchase Agreement (maturing on | ||||||||||
| 07/01/2011 in the amount of $654, | ||||||||||
| collateralized by FNMA 3.50% - 6.50%, | ||||||||||
| 2023 - 2041, value of $667) | ||||||||||
| 654 | 0.05%, 06/30/2011 | 654 | ||||||||
| Deutsche Bank Securities TriParty Joint | ||||||||||
| Repurchase Agreement (maturing on | ||||||||||
| 07/01/2011 in the amount of $6,327, | ||||||||||
| collateralized by GNMA 4.00% - 7.00%, | ||||||||||
| 2035 - 2040, value of $6,453) | ||||||||||
| 6,326 | 0.05%, 06/30/2011 | 6,326 | ||||||||
| UBS Securities, Inc. Joint Repurchase | ||||||||||
| Agreement (maturing on 07/01/2011 in the | ||||||||||
| amount of $13, collateralized by U.S. | ||||||||||
| Treasury Bill 0.63%, 2012, value of $13) | ||||||||||
| 13 | 0.01%, 06/30/2011 | 13 | ||||||||
| UBS Securities, Inc. TriParty Joint Repurchase | ||||||||||
| Agreement (maturing on 07/01/2011 in the | ||||||||||
| amount of $966, collateralized by FHLMC | ||||||||||
| 4.50%, 2040, FNMA 4.50% - 6.00%, 2035 - | ||||||||||
2041, value of $985) | ||||||||||
| 966 | 0.06%, 06/30/2011 | 966 | ||||||||
| 8,828 | ||||||||||
| Total short-term investments | ||||||||||
| (cost $8,828) | $ | 8,828 | ||||||||
| Total investments | ||||||||||
(cost $473,740) ▲ | 99.6 | % | $ | 575,205 | ||||||
| Other assets and liabilities | 0.4 | % | 2,312 | |||||||
| Total net assets | 100.0 | % | $ | 577,517 | ||||||
| Note: | Percentage of investments as shown is the ratio of the total market value to total net assets. Market value of investments in foreign securities represents 12.4% of total net assets at June 30, 2011. |
Prices of foreign equities that are principally traded on certain foreign markets may be adjusted daily pursuant to a fair value pricing service approved by the Board of Directors in order to reflect an adjustment for factors occurring after the close of certain foreign markets but before the close of the New York Stock Exchange.
The accompanying notes are an integral part of these financial statements.
| ▲ | At June 30, 2011, the cost of securities for federal income tax purposes was $485,798 and the aggregate gross unrealized appreciation and depreciation based on that cost were: |
| Unrealized Appreciation | $ | 119,989 | ||
| Unrealized Depreciation | (30,582 | ) | ||
| Net Unrealized Appreciation | $ | 89,407 |
| † | The aggregate value of securities valued in good faith at fair value as determined under policies and procedures established by and under the supervisionof the Company's Board of Directors at June 30, 2011, was $14,365, which represents 2.49% of total net assets. This amount excludes securities that are principally traded in certain foreign markets and whose prices are adjusted pursuant to a third party pricing service methodology approved by the Board of Directors. |
| ● | Currently non-income producing. |
| ■ | Securities issued within terms of a private placement memorandum, exempt from registration under Rule 144A under the Securities Act of 1933, as amended, and may be sold only to qualified institutional buyers. Pursuant to guidelines adopted by the Board of Directors, these issues are determined to be liquid. At June 30, 2011, the aggregate value of these securities was $438, which represents 0.08% of total net assets. |
| ⌂ | The following securities are considered illiquid. Illiquid securities are often purchased in private placement transactions, are often not registered under the Securities Act of 1933 and may have contractual restrictions on resale. A security may also be considered illiquid if the security lacks a readily available market or if its valuation has not changed for a certain period of time. |
| Period Acquired | Shares/ Par | Security | Cost Basis | ||||||
| 06/2007 | 5,788 | Buck Holdings L.P. | $ | 4,439 | |||||
| 03/2007 | 452 | Solar Cayman Ltd. - 144A | 336 | ||||||
The aggregate value of these securities at June 30, 2011, was $14,365, which represents 2.49% of total net assets.
Foreign Currency Contracts Outstanding at June 30, 2011
| Description | Counterparty | Buy / Sell | Market Value ╪ | Contract Amount | Delivery Date | Unrealized Appreciation/ (Depreciation) | |||||||||||
| British Pound | Morgan Stanley | Buy | $ | 20 | $ | 20 | 07/05/2011 | $ | – | ||||||||
| Canadian Dollar | Banc of America Securities | Buy | 24 | 24 | 07/06/2011 | – | |||||||||||
| Euro | Banc of America Securities | Buy | 35 | 35 | 07/05/2011 | – | |||||||||||
| Euro | CS First Boston | Buy | 94 | 94 | 07/01/2011 | – | |||||||||||
| $ | – | ||||||||||||||||
| ╪ | See Significant Accounting Policies of accompanying Notes to Financial Statements regarding valuation of securities. |
The accompanying notes are an integral part of these financial statements.
| Investment Valuation Hierarchy Level Summary |
| June 30, 2011 (Unaudited) |
| (000’s Omitted) |
| Total | Level 1 ♦ | Level 2 ♦ | Level 3 | |||||||||||||
| Assets: | ||||||||||||||||
Common Stocks ‡ | $ | 566,377 | $ | 522,406 | $ | 29,606 | $ | 14,365 | ||||||||
| Short-Term Investments | 8,828 | – | 8,828 | – | ||||||||||||
| Total | $ | 575,205 | $ | 522,406 | $ | 38,434 | $ | 14,365 | ||||||||
| Foreign Currency Contracts * | – | – | – | – | ||||||||||||
| Total | $ | – | $ | – | $ | – | $ | – | ||||||||
| Liabilities: | ||||||||||||||||
| Foreign Currency Contracts * | – | – | – | – | ||||||||||||
| Total | $ | – | $ | – | $ | – | $ | – | ||||||||
| ♦ | For the six-month period ended June 30, 2011, there were no significant transfers between Level 1 and Level 2. |
| ‡ | The Fund has all or primarily all of the equity securities categorized in a particular level. Refer to the Schedule of Investments for further industry breakout. |
| * | Derivative instruments not reflected in the Schedule of Investments are valued at the unrealized appreciation/depreciation on the investments. |
Following is a reconciliation of Level 3 assets for which significant unobservable inputs were used to determine fair value:
| Balance as | Change in | |||||||||||||||||||||||||||||||||||
| of | Realized | Unrealized | Transfers | Transfers | Balance as | |||||||||||||||||||||||||||||||
| December | Gain | Appreciation | Net | Into | Out of | of June | ||||||||||||||||||||||||||||||
| 31, 2010 | (Loss) | (Depreciation) | Amortization | Purchases | Sales | Level 3 | Level 3 | 30, 2011 | ||||||||||||||||||||||||||||
| Assets: | ||||||||||||||||||||||||||||||||||||
| Common Stocks | $ | 13,180 | $ | — | $ | 1,185 | * | $ | — | $ | — | $ | — | $ | — | $ | — | $ | 14,365 | |||||||||||||||||
| Total | $ | 13,180 | $ | — | $ | 1,185 | $ | — | $ | — | $ | — | $ | — | $ | — | $ | 14,365 | ||||||||||||||||||
| * | Change in unrealized appreciation or depreciation in the current period relating to assets still held at June 30, 2011 was $1,185. |
The accompanying notes are an integral part of these financial statements.
| Statement of Assets and Liabilities |
| June 30, 2011 (Unaudited) |
| (000’s Omitted) |
| Assets: | ||||
| Investments in securities, at market value (cost $473,740) | $ | 575,205 | ||
| Cash | 34 | |||
| Unrealized appreciation on foreign currency contracts | — | |||
| Receivables: | ||||
| Investment securities sold | 8,467 | |||
| Fund shares sold | 132 | |||
| Dividends and interest | 474 | |||
| Total assets | 584,312 | |||
| Liabilities: | ||||
| Unrealized depreciation on foreign currency contracts | — | |||
| Bank overdraft — foreign cash | 32 | |||
| Payables: | ||||
| Investment securities purchased | 5,889 | |||
| Fund shares redeemed | 723 | |||
| Investment management fees | 73 | |||
| Distribution fees | 6 | |||
| Accrued expenses | 72 | |||
| Total liabilities | 6,795 | |||
| Net assets | $ | 577,517 | ||
| Summary of Net Assets: | ||||
| Capital stock and paid-in-capital | $ | 554,588 | ||
| Accumulated undistributed net investment income | 1,817 | |||
| Accumulated net realized loss on investments and foreign currency transactions | (80,353 | ) | ||
| Unrealized appreciation of investments and the translations of assets and liabilities denominated in foreign currency | 101,465 | |||
| Net assets | $ | 577,517 | ||
| Shares authorized | 1,200,000 | |||
| Par value | $ | 0.001 | ||
Class IA: Net asset value per share | $ | 10.74 | ||
| Shares outstanding | 39,994 | |||
| Net assets | $ | 429,447 | ||
Class IB: Net asset value per share | $ | 10.69 | ||
| Shares outstanding | 13,857 | |||
| Net assets | $ | 148,070 | ||
The accompanying notes are an integral part of these financial statements.
| Statement of Operations |
| For the Six-Month Period Ended June 30, 2011 (Unaudited) |
| (000’s Omitted) |
| Investment Income: | ||||
| Dividends | $ | 4,332 | ||
| Interest | 4 | |||
| Less: Foreign tax withheld | (98 | ) | ||
| Total investment income, net | 4,238 | |||
| Expenses: | ||||
| Investment management fees | 2,410 | |||
| Transfer agent fees | 1 | |||
| Distribution fees - Class IB | 199 | |||
| Custodian fees | 18 | |||
| Accounting services fees | 31 | |||
| Board of Directors' fees | 6 | |||
| Audit fees | 6 | |||
| Other expenses | 85 | |||
| Total expenses (before fees paid indirectly) | 2,756 | |||
| Commission recapture | (5 | ) | ||
| Total fees paid indirectly | (5 | ) | ||
| Total expenses, net | 2,751 | |||
| Net investment income | 1,487 | |||
| Net Realized Gain on Investments and Foreign Currency Transactions: | ||||
| Net realized gain on investments | 62,211 | |||
| Net realized gain on foreign currency contracts | 52 | |||
| Net realized loss on other foreign currency transactions | (22 | ) | ||
| Net Realized Gain on Investments and Foreign Currency Transactions | 62,241 | |||
| Net Changes in Unrealized Depreciation of Investments and Foreign Currency Transactions: | ||||
| Net unrealized depreciation of investments | (38,706 | ) | ||
| Net unrealized depreciation on translation of other assets and liabilities in foreign currencies | (1 | ) | ||
| Net Changes in Unrealized Depreciation of Investments and Foreign Currency Transactions | (38,707 | ) | ||
| Net Gain on Investments and Foreign Currency Transactions | 23,534 | |||
| Net Increase in Net Assets Resulting from Operations | $ | 25,021 | ||
The accompanying notes are an integral part of these financial statements.
| Statement of Changes in Net Assets |
| (000’s Omitted) |
| For the | ||||||||
| Six-Month | For the | |||||||
| Period Ended | Year Ended | |||||||
| June 30, 2011 | December 31, | |||||||
| (Unaudited) | 2010 | |||||||
| Operations: | ||||||||
| Net investment income | $ | 1,486 | $ | 2,566 | ||||
| Net realized gain on investments and foreign currency transactions | 62,242 | 50,326 | ||||||
| Net unrealized appreciation (depreciation) of investments and foreign currency transactions | (38,707 | ) | 71,976 | |||||
| Net Increase In Net Assets Resulting From Operations | 25,021 | 124,868 | ||||||
| Distributions to Shareholders: | ||||||||
| From net investment income | ||||||||
| Class IA | — | (2,489 | ) | |||||
| Class IB | — | (531 | ) | |||||
| Total distributions | — | (3,020 | ) | |||||
| Capital Share Transactions: | ||||||||
| Class IA | ||||||||
| Sold | 19,431 | 30,002 | ||||||
| Issued in merger | — | 82,281 | ||||||
| Issued on reinvestment of distributions | — | 2,489 | ||||||
| Redeemed | (70,871 | ) | (90,281 | ) | ||||
| Total capital share transactions | (51,440 | ) | 24,491 | |||||
| Class IB | ||||||||
| Sold | 7,536 | 11,740 | ||||||
| Issued in merger | — | 14,050 | ||||||
| Issued on reinvestment of distributions | — | 531 | ||||||
| Redeemed | (29,379 | ) | (41,543 | ) | ||||
| Total capital share transactions | (21,843 | ) | (15,222 | ) | ||||
| Net increase (decrease) from capital share transactions | (73,283 | ) | 9,269 | |||||
| Net Increase (Decrease) In Net Assets | (48,262 | ) | 131,117 | |||||
| Net Assets: | ||||||||
| Beginning of period | 625,779 | 494,662 | ||||||
| End of period | $ | 577,517 | $ | 625,779 | ||||
| Accumulated undistributed (distribution in excess of) net investment income | $ | 1,817 | $ | 331 | ||||
| Shares: | ||||||||
| Class IA | ||||||||
| Sold | 1,808 | 3,223 | ||||||
| Issued in merger | — | 9,542 | ||||||
| Issued on reinvestment of distributions | — | 264 | ||||||
| Redeemed | (6,598 | ) | (10,118 | ) | ||||
| Total share activity | (4,790 | ) | 2,911 | |||||
| Class IB | ||||||||
| Sold | 703 | 1,277 | ||||||
| Issued in merger | — | 1,637 | ||||||
| Issued on reinvestment of distributions | — | 59 | ||||||
| Redeemed | (2,743 | ) | (4,656 | ) | ||||
| Total share activity | (2,040 | ) | (1,683 | ) | ||||
The accompanying notes are an integral part of these financial statements.
Notes to Financial Statements June 30, 2011 (Unaudited) |
| (000’s Omitted) |
| 1. | Organization: |
Hartford MidCap Value HLS Fund (the “Fund”) serves as an underlying investment option for certain variable annuity and variable life insurance separate accounts of Hartford Life Insurance Company (“HLIC”) and its affiliates and certain qualified retirement plans. The Fund may also serve as an underlying investment option for certain variable annuity and variable life separate accounts of other insurance companies. Owners of variable annuity contracts and policyholders of variable life insurance contracts may choose the funds permitted in the variable insurance contract prospectus. In addition, participants in certain qualified retirement plans may choose the Fund if permitted by their plans.
Hartford Series Fund, Inc. (the “Company”) is an open-end registered management investment company comprised of thirty portfolios. Financial Statements for the Fund, a series of the Company, are included in this report.
The Company is organized under the laws of the State of Maryland and is registered with the Securities and Exchange Commission (“SEC”) under the Investment Company Act of 1940, as amended (“1940 Act”). The Fund is a diversified open-end management investment company.
The Fund is divided into Class IA and Class IB shares. Each class is offered at the per share net asset value (“NAV”) without a sales charge and is subject to the same expenses, except that the Class IB shares are subject to distribution and service fees charged pursuant to a Distribution Plan adopted in accordance with Rule 12b-1 under the 1940 Act.
| 2. | Significant Accounting Policies: |
The following is a summary of significant accounting policies of the Fund in the preparation of its financial statements, which are in accordance with the United States Generally Accepted Accounting Principles (“U.S. GAAP”). The preparation of financial statements in accordance with U.S. GAAP may require management to make estimates and assumptions that affect the reported amounts of assets and liabilities and disclosure of contingent assets and liabilities at the date of the financial statements and the reported amounts of increases and decreases in net assets from operations during the reporting period. Actual results could differ from those estimates.
| a) | Determination of Net Asset Value – The NAV of each class of the Fund's shares is determined as of the close of regular trading (normally 4:00 p.m. Eastern Time) (the “NYSE Close”) on each day that the New York Stock Exchange (the “Exchange”) is open (“Valuation Date”). Information that becomes known to the Fund after the NAV has been calculated on a particular day will not generally be used to retroactively adjust the NAV determined earlier that day. |
| b) | Investment Valuation and Fair Value Measurements – For purposes of calculating the NAV, portfolio securities and other assets held by the Fund's portfolio for which market quotes are readily available are valued at market value. Market value is generally determined on the basis of last reported sales prices or official close price. If no sales are reported, market value is based on quotes obtained from a quotation reporting system, established market makers, or independent pricing services. If market prices are not readily available or are deemed unreliable, the Fund will use the fair value of the security as determined in good faith under policies and procedures established by and under the supervision of the Company's Board of Directors. Market quotes are considered not readily available where there is an absence of current or reliable market-based data (e.g., trade information or broker quotes), including where events occur after the close of the relevant market, but prior to the NYSE Close that materially affect the values of the Fund's portfolio securities or assets. In addition, market quotes are considered not readily available when, due to extraordinary circumstances, the exchanges or markets on which the securities trade, do not open for trading for the entire day and no other market prices are available. In addition, prices of foreign equities that are principally traded on certain foreign markets are adjusted daily pursuant to a fair value pricing service approved by the Board of Directors in order to reflect an adjustment for the factors occurring after the close of certain foreign markets but before the NYSE Close. Securities that are primarily traded on foreign markets may trade on days that are not business days of the Fund. The value of the foreign securities, |
in which the Fund invests, may change on days when a shareholder will not be able to purchase or redeem shares of the Fund. Fair value pricing is subjective in nature and the use of fair value pricing by the Fund may cause the NAV of its shares to differ significantly from the NAV that would have been calculated using market prices at the close of the exchange on which a portfolio security is primarily traded. There can be no assurance that the Fund could obtain the fair market value assigned to a security if the Fund were to sell the security at approximately the time at which the Fund determines its NAV.
Investments valued in currencies other than U.S. dollars are converted to U.S. dollars using exchange rates obtained from independent pricing services for calculation of the NAV. As a result, the NAV of the Fund’s shares may be affected by changes in the value of currencies in relation to the U.S. dollar. The value of securities traded in markets outside the United States or denominated in currencies other than the U.S. dollar may be affected significantly on a day that the NYSE is closed and the market value may change on days when an investor is not able to purchase, redeem or exchange shares of the Fund.
Foreign currency contracts represent agreements to exchange currencies on specific future dates at predetermined rates. Foreign currency contracts are valued using foreign currency exchange rates and forward rates as provided by an independent pricing service on Valuation Date.
Financial instruments for which prices are not available from an independent pricing service may be valued using market quotations obtained from one or more dealers that make markets in the respective financial instrument in accordance with procedures established by the Company’s Board of Directors.
U.S. GAAP defines fair value as the price that the Fund would receive to sell an asset or pay to transfer a liability in an orderly transaction between market participants. The U.S. GAAP fair value measurement standards require disclosure of a fair value hierarchy for each major category of assets and liabilities. Various inputs are used in determining the fair value of the Fund’s investments. These inputs are summarized into three broad hierarchy levels. This hierarchy is based on whether the valuation inputs are observable or unobservable. These levels are:
| · | Level 1 – Quoted prices in active markets for identical securities. Level 1 may include exchange-traded instruments such as domestic equities, some foreign equities, options, futures, mutual funds, exchange-traded funds, rights and warrants. |
| · | Level 2 – Observable inputs other than Level 1 prices, such as quoted prices for similar securities; quoted prices in markets that are not active; or other inputs that are observable or can be corroborated by observable market data. Level 2 may include debt securities that are traded less frequently than exchange-traded instruments and which are valued using third party pricing services; foreign equities, whose value is determined using a multi-factor regression model with inputs that are observable in the market; and short-term securities, which are valued at amortized cost. |
| · | Level 3 – Significant unobservable inputs that are supported by limited or no market activity. Level 3 may include financial instruments whose values are determined using broker quotes or require significant management judgment or estimation. These unobservable valuation inputs may include estimates for current yields, maturity/duration, prepayment speed, and broker quotes for comparable securities along with other assumptions relating to credit quality, collateral value, complexity of the security structure, general market conditions and liquidity. This category may include securities where trading has been halted or there are certain restrictions on trading. While these securities are priced using unobservable inputs, the valuation of these securities reflects the best available data and management believes the prices are a reasonable representation of exit price. |
Valuation levels are not necessarily indicative of the risk associated with investing in such securities. Individual securities within any of the above mentioned asset classes may be assigned a different hierarchical level than those presented above, as individual circumstances dictate.
Hartford MidCap Value HLS Fund |
Notes to Financial Statements – (continued) June 30, 2011 (Unaudited) |
| (000’s Omitted) |
For additional information, refer to the Investment Valuation Hierarchy Level Summary and the Level 3 roll forward reconciliation which follow the Schedule of Investments.
For purposes of reporting transfers between different hierarchy levels, both transfers in and out of each level, as applicable, are shown as if they occurred at the beginning of the period.
| c) | Security Transactions and Investment Income – Security transactions are recorded as of the trade date (the date the order to buy or sell is executed) for financial reporting purposes. Securities purchased or sold on a when-issued or delayed-delivery basis may be settled a month or more after the trade date. Realized gains and losses are determined on the basis of identified cost. |
Dividend income is accrued as of the ex-dividend date, except that certain dividends from foreign securities where the ex-dividend date may have passed are recorded as soon as the Fund is informed of the dividend. Interest income, including amortization of premium and accretion of discounts, is accrued on a daily basis.
| d) | Foreign Currency Transactions – Assets and liabilities denominated in currencies other than U.S. dollars are translated into U.S. dollars at the exchange rates in effect on the valuation date. Purchases and sales of investment securities, income, and expenses are translated into U.S. dollars at the exchange rates on the dates of such transactions. |
The Fund does not isolate that portion of portfolio security valuation resulting from fluctuations in the foreign currency exchange rates from the fluctuations arising from changes in the market prices of securities held. Exchange rate fluctuations are included with the net realized and unrealized gain or loss on investments in the accompanying financial statements.
Net realized foreign exchange gains or losses arise from sales of foreign currencies and the difference between asset and liability amounts initially stated in foreign currencies and the U.S. dollar value of the amounts actually received or paid. Net unrealized foreign exchange gains or losses arise from changes in the value of other assets and liabilities at the end of the reporting period, resulting from changes in the exchange rates.
| e) | Joint Trading Account – The Fund may invest cash balances into a joint trading account that may be invested in one or more repurchase agreements. |
| f) | Fund Share Valuation and Dividend Distributions to Shareholders – Orders for the Fund’s shares are executed in accordance with the investment instructions of the contract holders and plan participants. The NAV of the Fund’s shares is determined as of the close of business on each business day of the Exchange. The NAV is determined separately for each class of shares of the Fund by dividing the Fund’s net assets attributable to that class by the number of shares of the class outstanding. Each class of shares offered by the Fund has equal rights as to assets and voting privileges (except that shareholders of a class have exclusive voting rights regarding any matter relating solely to that class of shares). Income and non-class specific expenses are allocated daily to each class on the basis of the relative net assets of the class. Realized and unrealized capital gains and losses of each class are allocated daily based on the relative net assets of each class of shares of the Fund. |
Orders for the purchase of the Fund’s shares received prior to the close of the Exchange on any day the Exchange is open for business are priced at the NAV determined as of the close of the Exchange. Orders received after the close of the Exchange, or on a day on which the Exchange and/or the Fund is not open for business, are priced at the next determined NAV.
Dividends are declared pursuant to a policy adopted by the Company’s Board of Directors based upon the investment performance of the Fund. The policy of the Fund is to pay dividends from net investment income and realized capital gains, if any, at least once a year.
Distributions from net investment income, net realized capital gains and capital are determined in accordance with federal income tax regulations, which may differ from U.S. GAAP with respect to character and timing. These differences may include but are not limited to losses deferred due to wash sale adjustments, foreign currency gains and losses, adjustments related to Passive Foreign Investment Companies (“PFICs”), Real Estate Investment Trusts (“REITs”), Regulated Investment Companies (“RICs”), certain derivatives and partnerships. Permanent book and federal income tax basis differences relating to shareholder distributions will result in reclassifications to certain of the Fund’s capital accounts (see Federal Income Taxes: Reclassification of Capital Accounts note).
| 3. | Securities and Other Investments: |
| a) | Repurchase Agreements – A repurchase agreement is an agreement by which a counterparty agrees to sell a security and agrees to repurchase the security sold at a mutually agreed upon time and price. At the time the Fund enters into a repurchase agreement, the value of the underlying collateral security(ies), including accrued interest, will be equal to or exceed the value of the repurchase agreement. Repurchase agreements expose the Fund to counterparty risk. To minimize counterparty risk, the securities that serve to collateralize the repurchase agreement are held by the Fund's custodian in book entry or physical form in the custodial account of the Fund or in a third party custodial account. Repurchase agreements are valued at cost plus accrued interest. The Fund, as shown on the Schedule of Investments, had outstanding repurchase agreements as of June 30, 2011. |
| b) | Illiquid and Restricted Securities – The Fund is permitted to invest up to 15% of its net assets in illiquid securities. Illiquid securities are those that may not be sold or disposed of in the ordinary course of business within seven days, at approximately the price used to determine the Fund’s NAV. The Fund may not be able to sell illiquid securities or other investments when its sub-adviser considers it desirable to do so or may have to sell such securities or investments at a price that is lower than the price that could be obtained if the securities or investments were more liquid. A sale of illiquid securities or other investments may require more time and may result in higher dealer discounts and other selling expenses than does the sale of those that are liquid. Illiquid securities and investments also may be more difficult to value, due to the unavailability of reliable market quotations for such securities or investments, and an investment in them may have an adverse impact on the Fund’s NAV. The Fund may also purchase certain restricted securities that can only be resold to certain qualified investors and may be determined to be liquid pursuant to policies and guidelines established by the Company’s Board of Directors. The Fund, as shown on the Schedule of Investments, had illiquid and/or restricted securities as of June 30, 2011. |
| c) | Securities Purchased on a When-Issued or Delayed-Delivery Basis – Delivery and payment for securities that have been purchased by the Fund on a forward commitment, or when-issued or delayed-delivery basis, take place beyond the customary settlement period. During this period, such securities are subject to market fluctuations, and the Fund identifies securities segregated in its records with value at least equal to the amount of the commitment. The Fund had no outstanding when-issued or delayed delivery securities as of June 30, 2011. |
| 4. | Financial Derivative Instruments: |
The following disclosures contain information on how and why the Fund uses derivative instruments, the credit-risk-related contingent features in certain derivative instruments, and how derivative instruments affect the Fund’s financial position, results of operations and cash flows. The location and fair value amounts of these instruments on the Statement of Assets and Liabilities and the realized gains and losses and changes in unrealized gains and losses on the Statement of Operations, each categorized by type of derivative contract, are included in the following Additional Derivative Instrument Information footnote. The derivative instruments outstanding as of period-end are disclosed in the Notes to
Hartford MidCap Value HLS Fund |
| Notes to Financial Statements – (continued) |
| June 30, 2011 (Unaudited) |
| (000’s Omitted) |
the Schedule of Investments and the amounts of realized gains and losses and changes in unrealized gains and losses on derivative instruments during the period are disclosed in the Statement of Operations.
| a) | Foreign Currency Contracts – The Fund may enter into foreign currency contracts that obligate the Fund to purchase or sell currencies at specified future dates. Foreign currency contracts are used to hedge the currency exposure associated with some or all of the Fund's securities and/or as part of an investment strategy. Foreign currency contracts are marked to market daily and the change in value is recorded by the Fund as an unrealized gain or loss. Realized gains or losses equal to the difference between the value of the contract at the time it was opened and the value at the time it was closed are recorded upon delivery or receipt of the currency. |
Foreign currency contracts involve elements of market risk in excess of the amounts reflected in the Statement of Assets and Liabilities. In addition, risks may arise upon entering into these contracts from the potential inability of the counterparties to meet the terms of the contracts and from unanticipated movements in the value of the foreign currencies relative to the U.S. dollar. The Fund had outstanding foreign currency contracts as shown on the Schedule of Investments as of June 30, 2011.
| b) | Additional Derivative Instrument Information: |
Fair Values of Derivative Instruments on the Statement of Assets and Liabilities as of June 30, 2011:
| Risk Exposure Category | ||||||||||||||||||||||||||||
| Foreign | ||||||||||||||||||||||||||||
| Interest Rate | Exchange | Credit | Equity | Commodity | Other | |||||||||||||||||||||||
| Contracts | Contracts | Contracts | Contracts | Contracts | Contracts | Total | ||||||||||||||||||||||
| Assets: | ||||||||||||||||||||||||||||
Unrealized appreciation on foreign currency contracts | $ | — | $ | — | $ | — | $ | — | $ | — | $ | — | $ | — | ||||||||||||||
| Total | $ | — | $ | — | $ | — | $ | — | $ | — | $ | — | $ | — | ||||||||||||||
| Liabilities: | ||||||||||||||||||||||||||||
Unrealized depreciation on foreign currency contracts | $ | — | $ | — | $ | — | $ | — | $ | — | $ | — | $ | — | ||||||||||||||
| Total | $ | — | $ | — | $ | — | $ | — | $ | — | $ | — | $ | — | ||||||||||||||
The volume of derivative activity was minimal during the six-month period ended June 30, 2011.
The Effect of Derivative Instruments on the Statement of Operations for the six-month period ended June 30, 2011:
| Risk Exposure Category | ||||||||||||||||||||||||||||
| Foreign | ||||||||||||||||||||||||||||
| Interest Rate | Exchange | Credit | Equity | Commodity | Other | |||||||||||||||||||||||
Contracts | Contracts | Contracts | Contracts | Contracts | Contracts | Total | ||||||||||||||||||||||
| Realized Gain (Loss) on Derivatives Recognized as a Result from Operations: | ||||||||||||||||||||||||||||
Net realized gain on foreign currency contracts | $ | — | $ | 52 | $ | — | $ | — | $ | — | $ | — | $ | 52 | ||||||||||||||
| Total | $ | — | $ | 52 | $ | — | $ | — | $ | — | $ | — | $ | 52 | ||||||||||||||
| 5. | Principal Risks: |
| a) | Counterparty Risk – The Fund may be exposed to counterparty risk, or the risk that an institution or other entity with which the Fund has unsettled or open transactions will default. |
| b) | Market Risks – If a Fund invests directly in foreign currencies or in securities that trade in, and receive revenues in, foreign currencies, or in derivatives that provide exposure to foreign currencies, it will be subject to the risk that those currencies will decline in value relative to the base currency of the Fund, or, in the case of hedging positions, that the Fund’s base currency will decline in value relative to the currency being hedged. Currency rates in foreign countries may fluctuate significantly over short periods of time for a number of reasons, including changes in interest rates, intervention (or the failure to intervene) by U.S. or foreign governments, central banks or supranational entities such as the International Monetary Fund, or by the imposition of currency controls or other political developments in the United States or abroad. As a result, the Fund’s investments in foreign currency denominated securities may reduce the returns of the Fund. The market values of equity securities, such as common stocks and preferred stocks or equity related investments such as futures and options, may decline due to general market conditions which are not specifically related to a particular company, such as real or perceived adverse economic conditions, changes in the general outlook for corporate earnings, changes in interest or currency rates or adverse investor sentiment generally. The market value of equity securities may also decline due to factors which affect a particular industry or industries, such as labor shortages or increased production costs and competitive conditions within an industry. Equity securities and equity related investments generally have greater market price volatility than fixed income securities. |
| 6. | Federal Income Taxes: |
| a) | Federal Income Taxes – For federal income tax purposes, the Fund intends to continue to qualify as a RIC under Subchapter M of the Internal Revenue Code (“IRC”) by distributing substantially all of its taxable net investment income and net realized capital gains to its shareholders and otherwise complying with the requirements of RICs. The Fund has distributed substantially all of its income and capital gains in prior years, if applicable, and intends to distribute substantially all of its income and capital gains prior to the next fiscal year-end. Accordingly, no provision for federal income or excise taxes has been made in the accompanying financial statements. Distributions from short-term capital gains are treated as ordinary income distributions for federal income tax purposes. |
| b) | Net Investment Income (Loss), Net Realized Gains (Losses) – Net investment income (loss) and net realized gains (losses) may differ for financial statement and tax purposes primarily because of losses deferred due to wash sale adjustments, foreign currency gains and losses, adjustments related to PFICs, REITs, RICs, certain derivatives and partnerships. The character of distributions made during the year from net investment income or net realized gains may differ from their ultimate characterization for federal income tax purposes. Also, due to the timing of dividend distributions, the fiscal year in which amounts are distributed may differ from the year that the income or realized gains (losses) were recorded by the Fund. |
| c) | Distributions and Components of Distributable Earnings – The tax character of distributions paid by the Fund for the periods indicated is as follows (as adjusted for dividends payable): |
| For the Year Ended | For the Year Ended | |||||||
| December 31, 2010 | December 31, 2009 | |||||||
| Ordinary Income | $ | 3,020 | $ | 3,059 | ||||
As of December 31, 2010, the Fund’s components of distributable earnings (deficit) on a tax basis were as follows:
| Amount | ||||
| Undistributed Ordinary Income | $ | 331 | ||
| Accumulated Capital and Other Losses* | (130,537 | ) | ||
Unrealized Appreciation† | 128,114 | |||
| Total Accumulated Deficit | $ | (2,092 | ) | |
| Hartford MidCap Value HLS Fund |
| Notes to Financial Statements – (continued) |
| June 30, 2011 (Unaudited) |
| (000’s Omitted) |
| * | The Fund has capital loss carryforwards that are identified in the Capital Loss Carryforward note that follows. |
| † | The difference between book-basis and tax-basis unrealized appreciation (depreciation) may be attributable to the losses deferred due to wash sale adjustments, foreign currency gains and losses, adjustments related to PFICs, REITs, RICs, certain derivatives and partnerships. |
| d) | Reclassification of Capital Accounts – The Fund may record reclassifications in its capital accounts. These reclassifications have no impact on the total net assets of the Fund. The reclassifications are a result of permanent differences between U.S. GAAP and tax accounting for such items as expiration or utilization of capital loss carryforwards or net operating losses. Adjustments are made to reflect the impact these items have on current and future distributions to shareholders. Therefore, the source of the Fund’s distributable income may be shown in the accompanying Statement of Assets and Liabilities as from accumulated undistributed net investment income, from accumulated net realized gains on investments or from capital depending on the type of book and tax differences that exist. For the year ended December 31, 2010, the Fund recorded reclassifications to increase (decrease) the accounts listed below: |
| Amount | ||||
| Accumulated Undistributed Net Investment Income | $ | (91 | ) | |
| Accumulated Net Realized Gain (Loss) on Investments and Foreign Currency Transactions | 91 | |||
| e) | Capital Loss Carryforward – At December 31, 2010 (tax-year-end), the Fund had capital loss carryforwards for U.S. federal income tax purposes of approximately: |
| Year of Expiration | Amount | |||
| 2015 | $ | 1,120 | ||
| 2016 | 39,842 | |||
| 2017 | 89,575 | |||
| Total | $ | 130,537 | ||
As a result of current or past mergers in the Fund, certain provisions in the Internal Revenue Code may limit the future utilization of capital losses. As of December 31, 2010, the Fund utilized $45,504 of prior year capital loss carryforwards.
| f) | Accounting for Uncertainty in Income Taxes – The Fund has adopted financial reporting rules that require the Fund to analyze all open tax years, as defined by the Statute of Limitations, for all major jurisdictions. Generally, tax authorities can examine all tax returns filed for the last three years. The Fund does not have an examination in progress. |
The Fund has reviewed all open tax years and major jurisdictions and concluded that these financial reporting rules had no effect on the Fund’s financial position or results of operations. There is no tax liability resulting from unrecognized tax benefits relating to uncertain income tax positions taken or expected to be taken on the tax return for the fiscal year-end December 31, 2010. The Fund is also not aware of any tax positions for which it is reasonably possible that the total amounts of unrecognized tax benefits will significantly change in the next twelve months.
| 7. | Expenses: |
| a) | Investment Management Agreements – HL Investment Advisors, LLC (“HL Advisors”), an indirect wholly owned subsidiary of The Hartford Financial Services Group, Inc. (“The Hartford”), serves as investment manager to the Fund pursuant to an Investment Management Agreement with the Company. As investment manager, HL Advisors has overall investment supervisory responsibility for the Fund. In addition, HL Advisors provides administrative personnel, services, equipment, facilities and office space for proper operation of the Fund. HL Advisors has contracted with Wellington Management Company, LLP (“Wellington Management”) under a sub-advisory agreement for the provision of day-to- |
day investment management services to the Fund in accordance with the Fund’s investment objective and policies. The Fund pays a fee to HL Advisors, a portion of which may be used to compensate Wellington Management.
The schedule below reflects the rates of compensation paid to HL Advisors for investment management services rendered as of June 30, 2011; the rates are accrued daily and paid monthly.
| Average Daily Net Assets | Annual Fee | |||
| On first $250 million | 0.8250 | % | ||
| On next $250 million | 0.7750 | % | ||
| On next $500 million | 0.7250 | % | ||
| On next $4 billion | 0.6750 | % | ||
| On next $5 billion | 0.6725 | % | ||
| Over $10 billion | 0.6700 | % | ||
| b) | Accounting Services Agreement – Pursuant to the Fund Accounting Agreement between HLIC and the Company, on behalf of the Fund, HLIC provides accounting services to the Fund and receives monthly compensation based on the Fund’s average net assets at the rates set forth below. The Fund’s accounting services fees are accrued daily and paid monthly. |
| Average Daily Net Assets | Annual Fee | |||
| All Assets | 0.010 | % | ||
| c) | Operating Expenses – Allocable expenses incurred by the Company are allocated to each Fund and allocated to classes within a Fund in proportion to the average daily net assets of the Fund and each class, except where allocation of certain expenses is more fairly made directly to the Fund or to specific classes within a Fund. |
| d) | Fees Paid Indirectly – The Company, on behalf of the Fund, has entered into agreements with State Street Global Markets, LLC and Russell Implementation Services, Inc. to partially recapture non-discounted trade commissions. Such rebates are used to pay a portion of the Fund’s expenses. In addition, the Fund’s custodian bank has also agreed to reduce its fees when the Fund maintains cash on deposit in a non-interest-bearing custody account. For the six-month period ended June 30, 2011, these amounts are included in the Statement of Operations. |
The ratio of expenses to average net assets in the accompanying financial highlights excludes the reduction in expenses related to fees paid indirectly. The annualized expense ratio for the period listed below including the fees paid indirectly is as follows:
| Annualized Six- | ||||
| Month Period | ||||
| Ended June 30, | ||||
| 2011 | ||||
| Class IA | 0.83 | % | ||
| Class IB | 1.08 | |||
| e) | Distribution Plan for Class IB shares – The Company, on behalf of the Fund, has adopted a Distribution Plan pursuant to Rule 12b-1 of the 1940 Act to compensate the Distributor, Hartford Securities Distribution Company, Inc. (a wholly owned, ultimate subsidiary of The Hartford), from assets attributable to the Class IB shares for services rendered and expenses borne in connection with activities primarily intended to result in the sale of the Class IB shares, subject to the review and approval of the Company’s Board of Directors. |
The Distribution Plan provides that the Fund may pay annually up to 0.25% of the average daily net assets of the Fund attributable to its Class IB shares for activities primarily intended to result in the sale of Class IB shares. The Board has the authority to suspend or reduce these payments at any point in time. Under the terms of the Distribution Plan and the
Hartford MidCap Value HLS Fund |
| Notes to Financial Statements – (continued) |
| June 30, 2011 (Unaudited) |
| (000’s Omitted) |
principal underwriting agreement, the Fund is authorized to make payments monthly to the Distributor that may be used to pay or compensate entities providing distribution and shareholder servicing with respect to the Class IB shares for such entities’ fees or expenses incurred or paid in that regard. These fees are accrued daily and paid monthly.
| f) | Other Related Party Transactions – Certain officers of the Fund are directors and/or officers of HL Advisors and/or The Hartford or its subsidiaries. For the six-month period ended June 30, 2011, a portion of the Fund’s chief compliance officer’s salary was paid by all the investment companies in the Hartford fund complex. The portion allocated to the Fund rounds to zero. Hartford Administrative Services Company (“HASCO”), an indirect wholly owned subsidiary of The Hartford, provides transfer agent services to the Fund. The amount paid to HASCO can be found in the Statement of Operations. These fees are accrued daily and paid monthly. |
| g) | Payments from Affiliates – In July of 2007, The Hartford entered into a settlement with the Attorneys General of the states of New York, Connecticut and Illinois relating to market timing and the company's individual variable annuity contracts in which certain payments would be made directly to the variable annuity contract holders. The distribution plan provided that unclaimed money from the settlement would be distributed to certain HLS Funds that are investment options through a Hartford individual variable annuity contract. The unclaimed money was distributed to the Fund on September 18, 2009, as follows: |
| Amount | ||||
| Reimbursement | $ | 29 | ||
On November 8, 2006, the SEC issued an order setting forth the terms of a settlement reached with three subsidiaries of The Hartford that resolved the SEC’s Division of Enforcement’s investigation of aspects of The Hartford’s variable annuity and mutual fund operations related to directed brokerage and revenue sharing. The Hartford settled this matter without admitting or denying the findings of the SEC.
The Fund is available for purchase by the separate accounts of different variable universal life policies, variable annuity products, and funding agreements and it is offered directly to certain qualified retirement plans (collectively “Products”). Although existing Products contain transfer restrictions, some Products, particularly older variable annuity products, do not contain restrictions on the frequency of transfers. In addition, as the result of the settlement of litigation against Hartford Life, Inc. (“Hartford Life”) (the issuers of such variable annuity products), the Fund’s ability to restrict transfers by certain owners of older variable annuity products was limited. During 2006, these annuity owners surrendered the older variable annuity contracts that were the subject of prior litigation. In February 2005, Hartford Life agreed with the Board of Directors of the Company to indemnify the Fund for any material harm caused to the Fund from frequent trading by these contract owners.
The total return in the accompanying financial highlights includes payments from affiliates. Had the payments from the affiliates been excluded, the impact and total return for the periods listed below would have been as follows:
| For the Year Ended December 31, 2009 | ||||||||
| Class IA | Class IB | |||||||
| Impact from Payment from Affiliate for Attorneys General Settlement | 0.01 | % | 0.01 | % | ||||
| Total Return Excluding Payment from Affiliate | 44.18 | 43.82 | ||||||
| For the Year Ended December 31, 2006 | ||||||||
| Class IA | Class IB | |||||||
| Impact from Payment from Affiliate for SEC Settlement | 0.02 | % | 0.02 | % | ||||
| Impact from Payment from Affiliate for Unrestricted Transfers | 0.08 | 0.09 | ||||||
| Total Return Excluding Payments from Affiliates | 17.78 | 17.48 | ||||||
| 8. | Investment Transactions: |
For the six-month period ended June 30, 2011, the Fund's aggregate purchases and sales of investment securities (excluding short-term investments) were as follows:
| Amount | ||||
| Cost of Purchases Excluding U.S. Government Obligations | $ | 145,526 | ||
| Sales Proceeds Excluding U.S. Government Obligations | 219,969 | |||
| 9. | Line of Credit: |
The Fund is one of several Hartford funds that participate in a $500 million committed revolving line of credit facility. The facility is to be used for temporary or emergency purposes. Under the arrangement, a fund is required to own securities having a market value in excess of 300% of the total bank borrowings. The interest rate on borrowings varies depending on the nature of the loan. The facility also requires a fee to be paid based on the amount of the commitment. This commitment fee is allocated to all the funds participating in the line of credit based on the average net assets of the funds. During the six-month period ended June 30, 2011, the Fund did not have any borrowings under this facility.
| 10. | Industry Classifications: |
Other than the industry classifications “Other Investment Pools and Funds” and “Exchange Traded Funds,” equity industry classifications used in this report are the Global Industry Classification Standard, which was developed by and is the exclusive property and service mark of MSCI, Inc. and Standard & Poor’s.
| 11. | Indemnifications: |
Under the Company’s organizational documents, the Company shall indemnify its officers and directors to the full extent required or permitted under Maryland General Corporation Law and the federal securities laws. In addition, the Company, on behalf of the Fund, may enter into contracts that contain a variety of indemnifications. The Company’s maximum exposure under these arrangements is unknown. However, as of the date of these financial statements the Company has not had prior claims or losses pursuant to these contracts and expects the risk of loss to be remote.
| Financial Highlights |
| - Selected Per-Share Data (A) - |
| Net Asset | Net Realized | Net Increase | ||||||||||||||||||||||||||||||||||||||||||
| Value at | and Unrealized | Total from | Dividends from | Distributions | (Decrease) in | Net Asset | ||||||||||||||||||||||||||||||||||||||
Beginning of | Net Investment | Payments from | Gain (Loss) on | Investment | Net Investment | from Realized | Distributions | Total | Net Asset | Value at End of | ||||||||||||||||||||||||||||||||||
Class | Period | Income (Loss) | (to) Affiliate | Investments | Operations | Income | Capital Gains | from Capital | Distributions | Value | Period | |||||||||||||||||||||||||||||||||
| For the Six-Month Period Ended June 30, 2011 (Unaudited) | ||||||||||||||||||||||||||||||||||||||||||||
| IA | $ | 10.32 | $ | 0.03 | $ | – | $ | 0.39 | $ | 0.42 | $ | – | $ | – | $ | – | $ | – | $ | 0.42 | $ | 10.74 | ||||||||||||||||||||||
| IB | 10.29 | 0.02 | – | 0.38 | 0.40 | – | – | – | – | 0.40 | 10.69 | |||||||||||||||||||||||||||||||||
| For the Year Ended December 31, 2010(G) | ||||||||||||||||||||||||||||||||||||||||||||
| IA | 8.33 | 0.05 | – | 2.00 | 2.05 | (0.06 | ) | – | – | (0.06 | ) | 1.99 | 10.32 | |||||||||||||||||||||||||||||||
| IB | 8.30 | 0.03 | – | 1.99 | 2.02 | (0.03 | ) | – | – | (0.03 | ) | 1.99 | 10.29 | |||||||||||||||||||||||||||||||
| For the Year Ended December 31, 2009 | ||||||||||||||||||||||||||||||||||||||||||||
| IA | 5.82 | 0.07 | – | 2.50 | 2.57 | (0.06 | ) | – | – | (0.06 | ) | 2.51 | 8.33 | |||||||||||||||||||||||||||||||
| IB | 5.80 | 0.05 | – | 2.49 | 2.54 | (0.04 | ) | – | – | (0.04 | ) | 2.50 | 8.30 | |||||||||||||||||||||||||||||||
| For the Year Ended December 31, 2008 | ||||||||||||||||||||||||||||||||||||||||||||
| IA | 12.34 | 0.07 | – | (4.35 | ) | (4.28 | ) | (0.06 | ) | (2.18 | ) | – | (2.24 | ) | (6.52 | ) | 5.82 | |||||||||||||||||||||||||||
| IB | 12.30 | 0.05 | – | (4.33 | ) | (4.28 | ) | (0.04 | ) | (2.18 | ) | – | (2.22 | ) | (6.50 | ) | 5.80 | |||||||||||||||||||||||||||
| For the Year Ended December 31, 2007 | ||||||||||||||||||||||||||||||||||||||||||||
| IA | 14.18 | 0.08 | – | 0.51 | 0.59 | (0.07 | ) | (2.36 | ) | – | (2.43 | ) | (1.84 | ) | 12.34 | |||||||||||||||||||||||||||||
| IB | 14.13 | 0.04 | – | 0.53 | 0.57 | (0.04 | ) | (2.36 | ) | – | (2.40 | ) | (1.83 | ) | 12.30 | |||||||||||||||||||||||||||||
| For the Year Ended December 31, 2006 | ||||||||||||||||||||||||||||||||||||||||||||
| IA | 14.01 | 0.10 | 0.01 | 2.11 | 2.22 | (0.12 | ) | (1.93 | ) | – | (2.05 | ) | 0.17 | 14.18 | ||||||||||||||||||||||||||||||
| IB | 13.96 | 0.07 | 0.01 | 2.10 | 2.18 | (0.08 | ) | (1.93 | ) | – | (2.01 | ) | 0.17 | 14.13 | ||||||||||||||||||||||||||||||
| (A) | Information presented relates to a share outstanding throughout the indicated period. |
| (B) | The figures do not include sales charges or other fees which may be applied at the variable life insurance, variable annuity or qualified retirement plan product level. Any such additional sales charges or other fees would lower the Fund's performance. |
| (C) | Ratios do not reflect reductions for fees paid indirectly. Please see Fees Paid Indirectly in the Notes to Financial Statements. |
| (D) | Portfolio turnover rate is calculated on the basis of the Fund as a whole without distinguishing between the classes of shares issued. |
| (E) | Not annualized. |
| (F) | Annualized. |
| (G) | Per share amounts have been calculated using the average shares method. |
| (H) | During the year ended December 31, 2010, the Fund incurred $89.7 million in purchases associated with the transition of assets from Hartford SmallCap Value HLS Fund, which merged into the Fund on July 30, 2010. These purchases were excluded from the portfolio turnover calculation. |
| (I) | Total return without the inclusion of the Payment from (to) Affiliate can be found in Expenses in the accompanying Notes to Financial Statements. |
| - Ratios and Supplemental Data - |
| Ratio of Expenses to Average Net | Ratio of Expenses to Average Net | Ratio of Net Investment Income to | Portfolio Turnover | |||||||||||||||||||
| Total Return(B) | Net Assets at End of Period | Assets Before Waivers(C) | Assets After Waivers(C) | Average Net Assets | Rate(D) | |||||||||||||||||
| 4.02 | %(E) | $ | 429,447 | 0.83 | %(F) | 0.83 | %(F) | 0.55 | %(F) | 24 | % | |||||||||||
| 3.89 | (E) | 148,070 | 1.08 | (F) | 1.08 | (F) | 0.30 | (F) | – | |||||||||||||
| 24.67 | 462,281 | 0.85 | 0.85 | 0.57 | 57 | (H) | ||||||||||||||||
| 24.36 | 163,498 | 1.10 | 1.10 | 0.30 | – | |||||||||||||||||
| 44.19 | (I) | 348,742 | 0.86 | 0.86 | 0.87 | 50 | ||||||||||||||||
| 43.83 | (I) | 145,920 | 1.11 | 1.11 | 0.62 | – | ||||||||||||||||
| (40.21 | ) | 301,896 | 0.81 | 0.81 | 0.82 | 51 | ||||||||||||||||
| (40.36 | ) | 128,483 | 1.06 | 1.06 | 0.57 | – | ||||||||||||||||
| 2.13 | 615,430 | 0.79 | 0.79 | 0.53 | 50 | |||||||||||||||||
| 1.87 | 300,502 | 1.04 | 1.04 | 0.28 | – | |||||||||||||||||
| 17.88 | (I) | 721,469 | 0.78 | 0.78 | 0.73 | 41 | ||||||||||||||||
| 17.59 | (I) | 370,771 | 1.03 | 1.03 | 0.51 | – | ||||||||||||||||
The Board of Directors of the Company appoints officers who are responsible for the day-to-day operations of the Fund and who execute policies formulated by the Directors. Each director serves until his or her death, resignation, or retirement or until the next annual meeting of shareholders is held or until his or her successor is elected and qualifies.
Directors and officers who are employed by or who have a financial interest in The Hartford are considered “interested” persons of the Fund pursuant to the 1940 Act. Each officer and two of the Company’s directors, as noted in the chart below, are “interested” persons of the Fund. Each director serves as a director for The Hartford Mutual Funds, Inc., The Hartford Mutual Funds II, Inc., Hartford Series Fund, Inc., and Hartford HLS Series Fund II, Inc., which, as of June 30, 2011, collectively consist of 89 funds. Correspondence may be sent to directors and officers c/o Hartford Mutual Funds, P.O. Box 2999, Hartford, Connecticut 06104-2999, except that correspondence to Ms. Fagely may be sent to 500 Bielenberg Drive, Woodbury, Minnesota 55125.
The table below sets forth, for each director and officer, his or her name, year of birth, current position with the Company and date first elected or appointed to Hartford Series Fund, Inc. (“HSF”), and Hartford HLS Series Fund II, Inc. (“HSF2”), principal occupation, and, for directors, other directorships held. The Fund’s statement of additional information contains further information on the directors and is available free of charge by calling 1-800-862-6668 or writing to Hartford HLS Funds, c/o Individual Annuity Services, P.O. Box 5085, Hartford, CT 06102-5085.
Information on the aggregate remuneration paid to the directors of the Company can be found in the Statement of Operations herein. The Fund pays to The Hartford a portion of the chief compliance officer’s compensation, but does not pay salaries or compensation to any of their other officers or directors who are employed by The Hartford.
Non-Interested Directors
Lynn S. Birdsong (1946) Director since 2003, Co-Chairman of the Investment Committee
Mr. Birdsong is a private investor. Mr. Birdsong currently serves as a Director of the Sovereign High Yield Investment Company (April 2010 to current). Mr. Birdsong currently serves as an Independent Director of Nomura Partners Funds, Inc. (formerly, The Japan Fund) (March 2003 to current). From 2003 to March 2005, Mr. Birdsong was an independent director of the Atlantic Whitehall Funds. From 1979 to 2002, Mr. Birdsong was a managing director of Zurich Scudder Investments, an investment management firm. During his employment with Scudder, Mr. Birdsong was an Interested Director of The Japan Fund. Since 1981, Mr. Birdsong has been a partner in Birdsong Company, an advertising specialty firm.
Robert M. Gavin, Jr. (1940) Director since 2002 (HSF) and 1986 (HSF2), Chairman of the Board since 2004
Dr. Gavin is an educational consultant. Prior to September 1, 2001, he was President of Cranbrook Education Community and prior to July 1996, he was President of Macalester College, St. Paul, Minnesota.
Duane E. Hill (1945) Director since 2001 (HSF) and 2002 (HSF2), Chairman of the Nominating Committee
Mr. Hill is Partner of TSG Ventures L.P., a private equity investment company. Mr. Hill is a former partner of TSG Capital Group, a private equity investment firm that served as sponsor and lead investor in leveraged buyouts of middle market companies.
Sandra S. Jaffee (1941) Director since 2005
Ms. Jaffee served as Chairman (2008 to 2009) and Chief Executive Officer of Fortent (formerly Searchspace Group), a leading provider of compliance/regulatory technology to financial institutions from August 2005 to August 2009. From August 2004 to August 2005, Ms. Jaffee served as an Entrepreneur in Residence with Warburg Pincus, a private equity firm. From September 1995 to July 2004, Ms. Jaffee served as Executive Vice President at Citigroup, where she was President and Chief Executive Officer of Citibank’s Global Securities Services (1995 to 2003). Ms. Jaffe currently serves as a member of the Board of Directors of Broadridge Financial Solutions as well as a Trustee of Muhlenberg College.
William P. Johnston (1944) Director since 2005, Chairman of the Compliance Committee
In June 2006, Mr. Johnston was appointed as Senior Advisor to The Carlyle Group, a global private equity investment firm. In July 2006, Mr. Johnston was elected to the Board of Directors of MultiPlan, Inc. In August 2007, Mr. Johnston was elected to the Board of Directors of LifeCare Holdings, Inc. In February 2008, Mr. Johnston was elected to the Board of Directors of HCR-ManorCare, Inc. In May 2006, Mr. Johnston was elected to the Supervisory Board of Fresenius Medical Care AG & Co. KGaA, after its acquisition of Renal Care Group, Inc. in March 2006. Mr. Johnston joined Renal Care Group in November 2002 as a member of the Board of Directors and served as Chairman of the Board from March 2003 through March 2006. From September 1987 to December 2002, Mr. Johnston was with Equitable Securities Corporation (and its successors, SunTrust Equitable Securities and SunTrust Robinson Humphrey) serving in various investment banking and managerial positions, including Managing Director and Head of Investment Banking, Chief Executive Officer and Vice Chairman.
Phillip O. Peterson (1944) Director since 2002 (HSF) and 2000 (HSF2), Chairman of the Audit Committee
Mr. Peterson is a mutual fund industry consultant. He was a partner of KPMG LLP (an accounting firm) until July 1999. Mr. Peterson joined William Blair Funds in February 2007 as a member of the Board of Trustees. From January 2004 to April 2005, Mr. Peterson served as Independent President of the Strong Mutual Funds.
Lemma W. Senbet (1946) Director since 2005
Dr. Senbet is the William E. Mayer Chair Professor of Finance and Director, Center for Financial Policy, at the University of Maryland, Robert H. Smith School of Business. He was chair of the Finance Department from 1998 to 2006. Previously he was a chaired professor of finance at the University of Wisconsin-Madison. Also, he was director of the Fortis Funds from March 2000 to July 2002. Dr. Senbet served the finance profession in various capacities, including as director of the American Finance Association and President of the Western Finance Association. In 2006, Dr. Senbet was inducted Fellow of Financial Management Association International for his career-long distinguished scholarship and professional service.
Interested Directors and Officers
David N. Levenson (1966) Director since 2010
Mr. Levenson currently serves as President of The Hartford’s Wealth Management business. He was appointed to this role in July 2010. Previously, Mr. Levenson served as Executive Vice President of Legacy Holdings for The Hartford from June 2009 to July 2010. From 2006 to 2009, Mr. Levenson was with Hartford Life Insurance K.K. where he served as President and CEO from 2007 to 2009. He served as Managing Director of Hartford Investment Management Company from 2005 to 2006. Additionally, Mr. Levenson serves as Executive Vice President of The Hartford and as President, Director and Chief Executive Officer of Hartford Life Insurance Company (“HLIC”) and Hartford Life, Inc. (“HL Inc.”).
Lowndes A. Smith (1939) Director since 1996 (HSF) and 2002 (HSF2), Co-Chairman of the Investment Committee
Mr. Smith served as Vice Chairman of The Hartford from February 1997 to January 2002, as President and Chief Executive Officer of HL Inc. from February 1997 to January 2002, and as President and Chief Operating Officer of The Hartford Life Insurance Companies from January 1989 to January 2002. Mr. Smith serves as a Director of White Mountains Insurance Group, Ltd., One Beacon Insurance and Symetra Financial and as a Managing Director of Whittington Gray Associates.
Other Officers
James E. Davey (1964) President and Chief Executive Officer since 2010
Mr. Davey serves as Executive Vice President of HLIC. Additionally, Mr. Davey serves as President, Chief Executive Officer and Manager of Hartford Investment Financial Services, Inc. (“HIFSCO”) and President, Chief Executive Officer and Manager of HL Advisors. Mr. Davey joined The Hartford in 2002.
Tamara L. Fagely (1958) Vice President, Treasurer and Controller since 2002 (HSF) and 1993 (HSF2)
Ms. Fagely has been a Vice President of HASCO since 1998 and Chief Financial Officer since 2006. Currently Ms. Fagely is a Vice President of HLIC. She served as Assistant Vice President of HLIC from December 2001 through March 2005. In addition, Ms. Fagely is Controller and Chief Financial Officer of HIFSCO.
Susan M. Fleege (1959) AML Compliance Officer since 2011
Ms. Fleege currently serves as a Director of Risk Management at The Hartford. She previously served as AML Compliance Officer for the Fund from 2005-2008. Ms. Fleege joined HLIC in 2005 from Amerprise Financial Corporation where she held the position of Counsel from 2000 to 2005. Ms. Fleege is a certified Anti-Money Laundering Specialist.
Dr. Robert J. Froehlich (1953) Senior Managing Director since 2009
Dr. Froehlich joined The Hartford as Senior Managing Director in September 2009. Prior to joining The Hartford, Dr. Froehlich served as Vice Chairman of Deutsche Asset Management from 1997-2009.
Edward P. Macdonald (1967) Vice President, Secretary and Chief Legal Officer since 2005
Mr. Macdonald serves as Vice President of HLIC and Chief Legal Officer of Mutual Funds and Vice President of HIFSCO. He also serves as Vice President and Secretary of HASCO, and Chief Legal Officer, Secretary and Vice President of HL Advisors. Mr. Macdonald joined The Hartford in 2005.
| Hartford MidCap Value HLS Fund |
| Directors and Officers (Unaudited) – (continued) |
Vernon J. Meyer (1964) Vice President since 2006
Mr. Meyer serves as Senior Vice President of HLIC. He also serves as Senior Vice President of HIFSCO and HL Advisors. Mr. Meyer joined The Hartford in 2004.
Colleen B. Pernerewski (1969) Vice President and Chief Compliance Officer since 2010
Ms. Pernerewski serves as Vice President and Chief Investment Advisor Compliance Officer of HIFSCO and as Vice President and Chief Compliance Officer of HL Advisors. Ms. Pernerewski joined The Hartford in 2005 from Travelers Life and Annuity where she served as Counsel (2004-2005). Prior to Travelers Life and Annuity, Ms. Pernerewski held the position of Counsel at The Hartford (1998-2004).
Elizabeth L. Schroeder (1966) Vice President since 2010
Ms. Schroeder currently serves as Assistant Vice President of HLIC. Ms. Schroeder joined HLIC in 1991. She is also an Assistant Vice President of HIFSCO and HL Advisers.
Martin Swanson (1962) Vice President since 2010
Mr. Swanson is a Vice President of HLIC. Mr. Swanson also serves as Vice President/Marketing for HIFSCO. Prior to joining HLIC in 1998, Mr. Swanson was a Vice President at PaineWebber, Inc.
Jane Wolak (1961) Vice President since 2009
Ms. Wolak currently serves as Senior Vice President of HLIC. Ms. Wolak joined HLIC as Vice President, Retail Product Services in May 2007. She is also Vice President of HASCO. Previously, Ms. Wolak was with Sun Life Financial where she held the position of Vice President, Service Center Operations from 2001-2007.
A description of the policies and procedures that the Fund uses to determine how to vote proxies relating to portfolio securities and a record of how the Fund voted any proxies for the twelve-month period ended June 30, 2011 are available (1) without charge, upon request, by calling 800-862-6668 and (2) on the SEC’s website at http://www.sec.gov.
The Fund files a complete schedule of portfolio holdings with the SEC for the first and third quarters of each fiscal year on Form N-Q. The Fund’s Forms are available (1) without charge, upon request, by calling 800-862-6668 and (2) on the SEC’s website at http://www.sec.gov. The Form N-Q may be reviewed and copied at the SEC’s Public Reference Room in Washington, DC. Information on the operation of the Public Reference Room may be obtained by calling 1-800-SEC-0330.
Hartford MidCap Value HLS Fund |
Your Fund's Expenses
As a shareholder of the Fund, you incur two types of costs: (1) transaction costs and (2) ongoing costs including investment management fees, distribution fees, and other fund expenses. This example is intended to help you understand your ongoing costs (in dollars) of investing in a Fund and to compare these costs with the ongoing costs of investing in other mutual funds. The example is based on an investment of $1,000 invested at the beginning of the period and held for the period of December 31, 2010 through June 30, 2011.
Actual Expenses
The first set of columns of the table below provides information about actual account values and actual expenses. You may use the information in this column, together with the amount you invested, to estimate the expenses that you paid over the period. Simply divide your account value by $1,000 (for example, an $8,600 account value divided by $1,000 = 8.6), then multiply the result by the number in the line under the heading entitled “Expenses Paid During Period” to estimate the expenses you paid on your account during this period.
Hypothetical Example for Comparison Purposes
The second set of columns of the table below provides information about hypothetical account values and hypothetical expenses based on a Fund's actual expense ratio and an assumed rate of return of 5% per year before expenses, which is not the Fund's actual return. The hypothetical account values and expenses may not be used to estimate the actual ending account balance or expenses you paid for the period. You may use this information to compare the ongoing costs of investing in a Fund and other funds. To do so, compare this 5% hypothetical example with the 5% hypothetical examples that appear in the shareholder reports of the other funds.
Please note that the expenses shown in the table are meant to highlight your ongoing costs only and do not reflect any transactional costs, such as sales charges (loads) and CDSC. Therefore, the second set of columns of the table is useful in comparing ongoing costs only, and will not help you determine the relative total costs of owning different funds. In addition, if these transactional costs were included, your costs would be higher. Expenses are equal to the Fund's annualized expense ratios multiplied by average account value over the period, multiplied by 181/365 (to reflect the one-half year period).
| Actual return | Hypothetical (5% return before expenses) | |||||||||||||||||||||||||||||||||||
| Expenses paid | Expenses paid | Days in | ||||||||||||||||||||||||||||||||||
| during the period | during the period | the | Days | |||||||||||||||||||||||||||||||||
| Beginning | Ending | December 31, 2010 | Beginning | Ending | December 31, 2010 | Annualized | current | in the | ||||||||||||||||||||||||||||
| Account Value | Account Value | through | Account Value | Account Value | through | expense | 1/2 | full | ||||||||||||||||||||||||||||
| December 31, 2010 | June 30, 2011 | June 30, 2011 | December 31, 2010 | June 30, 2011 | June 30, 2011 | ratio | year | year | ||||||||||||||||||||||||||||
| Class IA | $ | 1,000.00 | $ | 1,040.23 | $ | 4.20 | $ | 1,000.00 | $ | 1,020.68 | $ | 4.16 | 0.83 | % | 181 | 365 | ||||||||||||||||||||
| Class IB | $ | 1,000.00 | $ | 1,038.94 | $ | 5.46 | $ | 1,000.00 | $ | 1,019.44 | $ | 5.41 | 1.08 | % | 181 | 365 | ||||||||||||||||||||
27
| The Hartford | |
| P.O. Box 5085 | |
| Hartford, CT 06102-5085 |
Hartford Series Fund, Inc. is underwritten and distributed by Hartford Securities Distribution Company, Inc.
“The Hartford” is The Hartford Financial Services Group, Inc. and its subsidiaries.
Hartford Series Fund, Inc. inception dates range from 1977 to date. Hartford Series Fund, Inc. is not a subsidiary of The Hartford but is underwritten, distributed by and advised by subsidiaries of The Hartford. Investments in Hartford Series Fund, Inc. are not guaranteed by The Hartford or any other entity.
You should carefully consider investment objectives, risks, and charges and expenses of Hartford HLS Funds before investing. This and other information can be found in the Fund’s prospectus or summary prospectus, which can be obtained by calling 800-862-6668. Please read them carefully before you invest or send money.
HLSSAR-MCV11 8-11 | 106632 | Printed in U.S.A ©2011 The Hartford, Hartford, CT 06115 |
A MESSAGE FROM THE PRESIDENT

Dear Fellow Shareholders:
I want to take this opportunity to say thank you for your continued confidence and trust.
We have seen a significant amount of global turbulence in the first half of 2011. Investors have continued to be concerned about the implications of the European sovereign debt crisis, as well as our own high levels of domestic debt. Since January we have witnessed significant political uprisings in the already-volatile Middle East and North Africa region. In addition, the ramifications of Japan's massive earthquake, subsequent tsunami, and nuclear disaster are still being played out in the market.
Although corporate earnings have remained robust, the unemployment picture has been mixed. After adding more than 200,000 jobs from February to April, more recent unemployment reports have shown a pullback in hiring.
While official inflation remains low as measured by the Consumer Price Index (CPI), high oil prices may be indicative of higher inflation in the future. The federal funds rate remains at a historic low, however, the Fed could potentially raise the rate to get it closer to its historical average once the economy strengthens.
Even with these headwinds, domestic, international, and world indices (as measured by the S&P 500, MSCI EAFE and MSCI World) are all up more than 5% through June, 30 2011.
Looking ahead, continued growth in emerging markets is fueling global recovery efforts. Emerging markets comprise about 48 percent of the world’s GDP, and many economists believe they are poised for further expansion. As GDP growth continues in emerging markets, roughly 100 million people are added to the middle class each year. This middle class population growth could potentially drive a considerable shift in consumer purchasing power.
Now that we have reached the midpoint of 2011, perhaps now would be a good time to schedule a meeting with your financial adviser to examine your current investment strategy and determine whether you are on the right track.
| • | Are you concerned about inflation and its effects on your portfolio? |
| • | Is your portfolio prepared for rising interest rates? |
| • | Does your portfolio reflect the global economy with a mix of developed nations and emerging markets? |
Your financial professional’s advice can help you to navigate today’s volatile markets with confidence. You can also rest assured that we will continue to provide you with solid investments and stellar service for the road ahead.
Thank you again for your business.

James Davey
President
Hartford HLS Funds
Hartford Money Market HLS Fund
| Financial Statements | |
| 2 | |
| 6 | |
| 7 | |
| 8 | |
| 9 | |
| 10 | |
| 16 | |
| 18 | |
| 20 | |
| 20 | |
| 21 |
This report is prepared for the general information of contract owners and qualified retirement plan participants. It is not an offer of contracts or of qualified retirement plans. It should not be used in connection with any offer, except in conjunction with the appropriate product prospectus which contains all pertinent information including the applicable sales, administrative and other charges.
| Schedule of Investments |
| June 30, 2011 (Unaudited) |
| (000’s Omitted) |
| Shares or Principal Amount | Market Value ╪ | |||||||||
| CERTIFICATES OF DEPOSIT- 6.5% | ||||||||||
| Commercial Banking - 3.2% | ||||||||||
| Bank of Nova Scotia Houston | ||||||||||
| $ | 8,000 | 0.47%, 10/31/2011 Δ | $ | 8,006 | ||||||
| 21,200 | 0.49%, 01/06/2012 Δ | 21,221 | ||||||||
| Svenska Handelsbanken AB | ||||||||||
| 11,750 | 0.20%, 07/13/2011 | 11,750 | ||||||||
| Svenska Handelsbanken, Inc. | ||||||||||
| 24,250 | 0.18%, 09/15/2011 | 24,250 | ||||||||
| UBS AG Stamford CT | ||||||||||
| 11,750 | 0.29%, 10/27/2011 | 11,750 | ||||||||
| 76,977 | ||||||||||
| Depository Credit - Banking - 1.5% | ||||||||||
| Royal Bank of Canada New York | ||||||||||
| 16,000 | 0.24%, 02/14/2012 Δ | 16,000 | ||||||||
| 8,400 | 0.27%, 10/03/2011 Δ | 8,401 | ||||||||
| Toronto-Dominion Bank New York | ||||||||||
| 12,000 | 0.27%, 01/12/2012 Δ | 12,000 | ||||||||
| 36,401 | ||||||||||
| Monetary Authorities - Central Banks - 1.0% | ||||||||||
| Deutsche Bank AG New York | ||||||||||
| 12,000 | 0.29%, 07/25/2011 Δ | 12,000 | ||||||||
| 12,500 | 0.45%, 08/24/2011 Δ | 12,503 | ||||||||
| 24,503 | ||||||||||
| Securities and Commodity Contracts and Brokerage - 0.8% | ||||||||||
| Credit Suisse First Boston New York | ||||||||||
| 17,500 | 0.33%, 07/22/2011 Δ | 17,501 | ||||||||
| Total certificates of deposit | ||||||||||
| (cost $155,382) | $ | 155,382 | ||||||||
| COMMERCIAL PAPER - 50.4% | ||||||||||
| Beverage Manufacturing - 2.4% | ||||||||||
| Coca Cola Co. | ||||||||||
| $ | 12,750 | 0.11%, 08/30/2011 | $ | 12,747 | ||||||
| 13,250 | 0.17%, 09/19/2011 | 13,245 | ||||||||
| 4,250 | 0.19%, 07/05/2011 | 4,250 | ||||||||
| Pepsico, Inc. | ||||||||||
| 9,750 | 0.09%, 08/11/2011 ■ | 9,749 | ||||||||
| 18,000 | 0.10%, 07/26/2011 ■ | 17,999 | ||||||||
| 57,990 | ||||||||||
| Commercial Banking - 13.8% | ||||||||||
| Barclays U.S. Funding Corp. | ||||||||||
| 12,000 | 0.15%, 08/15/2011 | 11,998 | ||||||||
| 14,250 | 0.18%, 09/16/2011 | 14,245 | ||||||||
| 9,500 | 0.22%, 09/19/2011 | 9,495 | ||||||||
| Commonwealth Bank of Australia | ||||||||||
| 13,000 | 0.17%, 08/23/2011 | 12,997 | ||||||||
| Nordea North America | ||||||||||
| 11,000 | 0.19%, 07/12/2011 | 10,999 | ||||||||
| 12,250 | 0.26%, 07/18/2011 | 12,249 | ||||||||
| Old Line Funding LLC | ||||||||||
| 11,750 | 0.17%, 09/12/2011 ■ | 11,746 | ||||||||
| 12,750 | 0.17%, 09/13/2011 | 12,745 | ||||||||
| 22,500 | 0.19%, 07/15/2011 - 08/08/2011 ■ | 22,497 | ||||||||
| Rabobank USA | ||||||||||
| 12,500 | 0.21%, 09/09/2011 | 12,495 | ||||||||
| 12,500 | 0.22%, 07/05/2011 | 12,499 | ||||||||
| Standard Chartered Bank | ||||||||||
| 11,500 | 0.26%, 09/06/2011 ■ | 11,494 | ||||||||
| 11,750 | 0.27%, 08/31/2011 ■ | 11,745 | ||||||||
| 11,500 | 0.32%, 08/15/2011 ■ | 11,495 | ||||||||
| State Street Corp. | ||||||||||
| 14,500 | 0.20%, 11/03/2011 | 14,490 | ||||||||
| 16,000 | 0.22%, 07/05/2011 | 16,000 | ||||||||
| 15,500 | 0.23%, 08/09/2011 | 15,496 | ||||||||
| U.S. Bank | ||||||||||
| 17,250 | 0.14%, 08/09/2011 | 17,247 | ||||||||
| 17,750 | 0.15%, 08/16/2011 | 17,747 | ||||||||
| United Technology Corp. | ||||||||||
| 35,000 | 0.06%, 07/05/2011 ■ | 35,000 | ||||||||
| Westpac Banking Corp. | ||||||||||
| 11,500 | 0.22%, 08/19/2011 ■ | 11,496 | ||||||||
| 10,750 | 0.25%, 10/06/2011 ■ | 10,743 | ||||||||
| 12,257 | 0.28%, 10/28/2011 ■ Δ | 12,257 | ||||||||
| 329,175 | ||||||||||
Computer and Peripheral Equipment Manufacturing - 2.3 % | ||||||||||
| Hewlett-Packard Co. | ||||||||||
| 36,000 | 0.08%, 07/14/2011 ■ | 35,999 | ||||||||
| International Business Machines Co. | ||||||||||
| 7,750 | 0.06%, 07/25/2011 ■ | 7,749 | ||||||||
| John Deere Capital Corp. | ||||||||||
| 11,000 | 0.11%, 07/08/2011 ■ | 11,000 | ||||||||
| 54,748 | ||||||||||
| �� | ||||||||||
| Consumer Lending - 2.3% | ||||||||||
| Straight-A Funding LLC | ||||||||||
| 30,500 | 0.16%, 07/05/2011 - 09/01/2011 ■ | 30,495 | ||||||||
| 13,250 | 0.17%, 08/17/2011 ■ | 13,247 | ||||||||
| 11,750 | 0.18%, 08/03/2011 ■ | 11,748 | ||||||||
| 55,490 | ||||||||||
| Depository Credit - Banking - 2.7% | ||||||||||
| Bank of Nova Scotia | ||||||||||
| 5,750 | 0.18%, 09/06/2011 | 5,748 | ||||||||
| 11,500 | 0.19%, 09/19/2011 | 11,495 | ||||||||
| Deutsche Bank Financial LLC | ||||||||||
| 11,500 | 0.24%, 08/31/2011 | 11,495 | ||||||||
| Toronto-Dominion Holdings USA | ||||||||||
| 17,250 | 0.16%, 08/10/2011 ■ | 17,247 | ||||||||
| 17,250 | 0.17%, 08/25/2011 ■ | 17,246 | ||||||||
| 63,231 | ||||||||||
| International Trade Financing (Foreign Banks) - 1.7% | ||||||||||
| Kreditanstalt fuer Wiederaufbau | ||||||||||
| 16,500 | 0.14%, 09/08/2011 ■ | 16,496 | ||||||||
| 23,000 | 0.15%, 07/14/2011 - 08/17/2011 ■ | 22,997 | ||||||||
| 39,493 | ||||||||||
| Motor Vehicle Parts Manufacturing - 2.0% | ||||||||||
| Wal-Mart Stores, Inc. | ||||||||||
| 15,500 | 0.06%, 07/11/2011 | 15,500 | ||||||||
The accompanying notes are an integral part of these financial statements.
| Shares or Principal Amount | Market Value ╪ | |||||||||
| COMMERCIAL PAPER - 50.4% - (continued) | ||||||||||
| Motor Vehicle Parts Manufacturing - 2.0% - (continued) | ||||||||||
| Wal-Mart Stores, Inc. - (continued) | ||||||||||
| $ | 15,000 | 0.07%, 07/08/2011 ■ | $ | 15,000 | ||||||
| 17,750 | 0.08%, 07/25/2011 | 17,749 | ||||||||
| 48,249 | ||||||||||
| Nondepository Credit Banking - 2.7% | ||||||||||
| General Electric Capital Corp. | ||||||||||
| 14,500 | 0.10%, 08/03/2011 | 14,499 | ||||||||
| 15,500 | 0.17%, 07/27/2011 | 15,498 | ||||||||
| 10,750 | 0.19%, 10/07/2011 | 10,744 | ||||||||
| John Deere Credit, Inc. | ||||||||||
| 24,250 | 0.10%, 07/11/2011 - 07/20/2011 | 24,249 | ||||||||
| 64,990 | ||||||||||
| Other Financial Investment Activities - 5.2% | ||||||||||
| Alpine Securitization Corp. | ||||||||||
| 15,000 | 0.16%, 08/04/2011 | 14,998 | ||||||||
| 15,750 | 0.16%, 08/12/2011 ■ | 15,747 | ||||||||
| Falcon Asset Securitization Co. | ||||||||||
| 22,750 | 0.16%, 08/04/2011 ■ | 22,746 | ||||||||
| 12,000 | 0.17%, 07/05/2011 ■ | 12,000 | ||||||||
| 11,250 | 0.19%, 08/01/2011 ■ | 11,248 | ||||||||
| Sheffield Receivables Corp. | ||||||||||
| 11,500 | 0.14%, 07/12/2011 | 11,499 | ||||||||
| 10,750 | 0.15%, 08/09/2011 | 10,748 | ||||||||
| 11,750 | 0.19%, 07/19/2011 | 11,749 | ||||||||
| 12,000 | 0.20%, 07/06/2011 ■ | 12,000 | ||||||||
| 122,735 | ||||||||||
| Pharmaceutical & Medicine Manufacturing - 7.6% | ||||||||||
| Abbott Laboratories | ||||||||||
| 6,900 | 0.11%, 07/25/2011 ■ | 6,900 | ||||||||
| 15,750 | 0.12%, 08/23/2011 ■ | 15,747 | ||||||||
| 23,250 | 0.13%, 08/09/2011 ■ | 23,247 | ||||||||
| Johnson & Johnson | ||||||||||
| 34,000 | 0.05%, 07/14/2011 ■ | 33,999 | ||||||||
| 14,000 | 0.10%, 09/02/2011 ■ | 13,998 | ||||||||
| Merck & Co., Inc. | ||||||||||
| 12,000 | 0.10%, 08/26/2011 | 11,998 | ||||||||
| 47,000 | 0.11%, 08/18/2011 ■ | 46,993 | ||||||||
| Sanofi-Aventis S.A. | ||||||||||
| 16,500 | 0.22%, 12/15/2011 ■ | 16,483 | ||||||||
| 12,500 | 0.35%, 10/18/2011 ■ | 12,487 | ||||||||
| 181,852 | ||||||||||
| Securities and Commodity Contracts and Brokerage - 1.8% | ||||||||||
| Credit Suisse First Boston New York | ||||||||||
| 17,500 | 0.21%, 07/27/2011 | 17,497 | ||||||||
| JP Morgan Chase & Co. | ||||||||||
| 24,500 | 0.05%, 07/19/2011 | 24,500 | ||||||||
| 41,997 | ||||||||||
| Soap, Cleaning Compound, Toiletries Manufacturing - 3.0% | ||||||||||
| Colgate-Palmolive Co. | ||||||||||
| 12,000 | 0.07%, 07/25/2011 | 12,000 | ||||||||
| Procter & Gamble Co. | ||||||||||
| 17,000 | 0.06%, 07/06/2011 ■ | 17,000 | ||||||||
| 12,000 | 0.07%, 07/15/2011 ■ | 11,999 | ||||||||
| 31,000 | 0.08%, 07/20/2011 ■ | 30,999 | ||||||||
| 71,998 | ||||||||||
| Sovereign Foreign Governments - 2.9% | ||||||||||
| Ontario (Province of) | ||||||||||
| 19,000 | 0.08%, 07/18/2011 | 18,999 | ||||||||
| 21,750 | 0.10%, 08/31/2011 | 21,747 | ||||||||
| Quebec (Province of) | ||||||||||
| 28,000 | 0.14%, 08/02/2011 - 09/15/2011 ■ | 27,994 | ||||||||
| 68,740 | ||||||||||
| Total commercial paper | ||||||||||
| (cost $1,200,688) | $ | 1,200,688 | ||||||||
| CORPORATE NOTES - 14.5% | ||||||||||
| Beverage Manufacturing - 1.9% | ||||||||||
| Coca-Cola Co. | ||||||||||
| $ | 29,800 | 0.31%, 05/15/2012 Δ | $ | 29,823 | ||||||
| Pepsico, Inc. | ||||||||||
| 14,380 | 0.31%, 07/15/2011 Δ | 14,381 | ||||||||
| 44,204 | ||||||||||
| Commercial Banking - 2.4% | ||||||||||
| Commonwealth Bank of Australia | ||||||||||
| 9,500 | 0.57%, 11/04/2011 ■ Δ | 9,510 | ||||||||
| Rabobank Netherlands | ||||||||||
| 22,500 | 0.47%, 08/05/2011 ■ Δ | 22,505 | ||||||||
| UBS AG Stamford CT | ||||||||||
| 24,300 | 1.50%, 09/29/2011 Δ | 24,372 | ||||||||
| 56,387 | ||||||||||
| Computer and Peripheral Equipment Manufacturing -1.7% | ||||||||||
| IBM Corp. | ||||||||||
| 18,500 | 0.31%, 11/04/2011 Δ | 18,508 | ||||||||
| 21,750 | 0.85%, 07/28/2011 Δ | 21,760 | ||||||||
| 40,268 | ||||||||||
| Depository Credit - Banking - 1.0% | ||||||||||
| Wells Fargo & Co. | ||||||||||
| 24,000 | 0.90%, 08/29/2011 Δ | 24,026 | ||||||||
| Insurance Carriers - 3.0% | ||||||||||
| Met Life Global Funding I | ||||||||||
| 12,000 | 0.38%, 07/06/2012 ■ Δ | 12,000 | ||||||||
| 41,480 | 0.68%, 07/13/2011 ■ Δ | 41,486 | ||||||||
| 18,450 | 0.79%, 04/10/2012 ■ Δ | 18,509 | ||||||||
| 71,995 | ||||||||||
| International Trade Financing (Foreign Banks) - 1.1% | ||||||||||
Australia & New Zealand Banking Group Ltd. | ||||||||||
| 15,750 | 0.57%, 10/21/2011 ■ Δ | 15,767 | ||||||||
The accompanying notes are an integral part of these financial statements.
| Schedule of Investments – (continued) |
| June 30, 2011 (Unaudited) |
| (000’s Omitted) |
| Shares or Principal Amount | Market Value ╪ | |||||||||
| CORPORATE NOTES - 14.5% - (continued) | ||||||||||
International Trade Financing (Foreign Banks) - 1.1% - (continued) | ||||||||||
International Bank for Reconstruction & Development | ||||||||||
| $ | 11,500 | 0.05%, 07/14/2011 | $ | 11,500 | ||||||
| 27,267 | ||||||||||
| Nondepository Credit Banking - 0.3% | ||||||||||
| General Electric Capital Corp. | ||||||||||
| 7,057 | 0.33%, 08/15/2011 Δ | 7,058 | ||||||||
| Other Financial Investment Activities - 1.3% | ||||||||||
| International Finance Corp. | ||||||||||
| 30,750 | 0.07%, 07/12/2011 | 30,749 | ||||||||
| Securities and Commodity Contracts and Brokerage - 1.8% | ||||||||||
| Goldman Sachs Group, Inc. | ||||||||||
| 20,000 | 0.49%, 08/05/2011 Δ | 20,004 | ||||||||
| JP Morgan Chase & Co. | ||||||||||
| 15,750 | 0.30%, 07/17/2012 Δ | 15,750 | ||||||||
| 8,000 | 0.37%, 12/21/2011 Δ | 8,004 | ||||||||
| 43,758 | ||||||||||
| Total corporate notes | ||||||||||
| (cost $345,712) | $ | 345,712 | ||||||||
| OTHER POOLS AND FUNDS - 0.0% | ||||||||||
| – | JP Morgan U.S. Government Money Market Fund | $ | – | |||||||
| Total other pools and funds | ||||||||||
| (cost $–) | $ | – | ||||||||
| REPURCHASE AGREEMENTS - 10.8% | ||||||||||
| BNP Paribas Securities Corp. TriParty | ||||||||||
| Joint Repurchase Agreement (maturing | ||||||||||
| on 07/01/2011 in the amount of | ||||||||||
| $56,995, collateralized by U.S. Treasury | ||||||||||
| Bond 5.25%, 2029, value of $58,135) | ||||||||||
| $ | 56,995 | 0.01% dated 06/30/2011 | $ | 56,995 | ||||||
| RBC Capital Markets Corp. TriParty Joint | ||||||||||
| Repurchase Agreement (maturing on | ||||||||||
| 07/01/2011 in the amount of $62,387, | ||||||||||
| collateralized by U.S. Treasury Bill | ||||||||||
| 0.02% - 4.50%, 2011 - 2012, U.S. | ||||||||||
| Treasury Bond 4.25% - 7.13%, 2023 - | ||||||||||
| 2039, U.S. Treasury Note 0.38% - | ||||||||||
| 10.63%, 2012 - 2021, value of $63,635) | ||||||||||
| 62,387 | 0.01% dated 06/30/2011 | 62,387 | ||||||||
| RBS Greenwich Capital Markets TriParty | ||||||||||
| Joint Repurchase Agreement (maturing | ||||||||||
| on 07/01/2011 in the amount of | ||||||||||
| $53,914, collateralized by U.S. Treasury | ||||||||||
| Bond 4.50%, 2038, U.S. Treasury Note | ||||||||||
| 4.00%, 2015, value of $54,993) | ||||||||||
| 53,914 | 0.01% dated 06/30/2011 | 53,914 | ||||||||
| UBS Securities, Inc. TriParty Joint | ||||||||||
| Repurchase Agreement (maturing on | ||||||||||
| 07/01/2011 in the amount of $83,318, | ||||||||||
| collateralized by U.S. Treasury Bond | ||||||||||
2.00% - 3.63%, 2026 - 2028, value of $84,984) | ||||||||||
| 83,318 | 0.01% dated 06/30/2011 | 83,318 | ||||||||
| Total repurchase agreements | ||||||||||
| (cost $256,614) | $ | 256,614 | ||||||||
| U.S. GOVERNMENT AGENCIES - 10.8% | ||||||||||
| Federal Home Loan Mortgage Corp. - 4.9% | ||||||||||
| $ | 28,000 | 0.03%, 07/07/2011 | $ | 28,000 | ||||||
| 77,250 | 0.04%, 07/15/2011 | 77,248 | ||||||||
| 10,900 | 0.05%, 07/01/2011 ○ | 10,900 | ||||||||
| 116,148 | ||||||||||
| Federal National Mortgage Association - 5.9% | ||||||||||
| 42,850 | 0.04%, 08/09/2011 - 08/10/2011 | 42,848 | ||||||||
| 52,500 | 0.05%, 07/06/2011 - 07/21/2011 | 52,499 | ||||||||
| 36,250 | 0.06%, 07/13/2011 | 36,249 | ||||||||
| 8,750 | 0.07%, 07/20/2011 | 8,750 | ||||||||
| 140,346 | ||||||||||
| Total U.S. government agencies | ||||||||||
| (cost $256,494) | $ | 256,494 | ||||||||
| U.S. GOVERNMENT SECURITIES - 7.5% | ||||||||||
| Other Direct Federal Obligations - 7.5% | ||||||||||
| Federal Home Loan Bank | ||||||||||
| $ | 116,250 | 0.03%, 07/22/2011 | $ | 116,248 | ||||||
| 34,500 | 0.04%, 07/13/2011 | 34,499 | ||||||||
| 28,750 | 0.08%, 07/20/2011 | 28,749 | ||||||||
| 179,496 | ||||||||||
| Total U.S. government securities | ||||||||||
| (cost $179,496) | $ | 179,496 | ||||||||
| Total investments | ||||||||||
(cost $2,394,386) ▲ | 100.5 | % | $ | 2,394,386 | ||||||
| Other assets and liabilities | (0.5) | % | (11,188 | ) | ||||||
| Total net assets | 100.0 | % | $ | 2,383,198 | ||||||
The accompanying notes are an integral part of these financial statements.
| Note: | Percentage of investments as shown is the ratio of the total market value to total net assets. The rates presented in this Schedule of Investments are yields, unless otherwise noted. Market value of investments in U.S. dollar denominated securities of foreign issuers represents 16.7% of total net assets at June 30, 2011. |
| ▲ | Also represents cost for tax purposes. |
| Δ | Variable rate securities; the rate reported is the coupon rate in effect at June 30, 2011. |
| ○ | The interest rate disclosed for these securities represents the effective yield on the date of the acquisition. |
| ■ | Securities issued within terms of a private placement memorandum, exempt from registration under Rule 144A under the Securities Act of 1933, as amended, and may be sold only to qualified institutional buyers. Pursuant to guidelines adopted by the Board of Directors, these issues are determined to be liquid. At June 30, 2011, the aggregate value of these securities was $816,809, which represents 34.27% of total net assets. |
| ╪ | See Significant Accounting Policies of accompanying Notes to Financial Statements regarding valuation of securities. |
The accompanying notes are an integral part of these financial statements.
| Investment Valuation Hierarchy Level Summary |
June 30, 2011 (Unaudited) |
| (000’s Omitted) |
| Total | Level 1 ♦ | Level 2 ♦ | Level 3 | |||||||||||||
| Assets: | ||||||||||||||||
| Certificates of Deposit | $ | 155,382 | $ | – | $ | 155,382 | $ | – | ||||||||
| Commercial Paper | 1,200,688 | – | 1,200,688 | – | ||||||||||||
| Corporate Notes | 345,712 | – | 345,712 | – | ||||||||||||
| Other Pools and Funds | – | – | – | – | ||||||||||||
| Repurchase Agreements | 256,614 | – | 256,614 | – | ||||||||||||
| U.S. Government Agencies | 256,494 | – | 256,494 | – | ||||||||||||
| U.S. Government Securities | 179,496 | – | 179,496 | – | ||||||||||||
| Total | $ | 2,394,386 | $ | – | $ | 2,394,386 | $ | – | ||||||||
| ♦ | For the six-month period ended June 30, 2011, there were no significant transfers between Level 1 and Level 2. |
The accompanying notes are an integral part of these financial statements.
| Statement of Assets and Liabilities |
June 30, 2011 (Unaudited) |
| (000’s Omitted) |
| Assets: | ||||
| Investments in securities, at market value (cost $2,394,386) | $ | 2,394,386 | ||
| Receivables: | ||||
| Fund shares sold | 5,810 | |||
| Dividends and interest | 329 | |||
| Other assets | 103 | |||
| Total assets | 2,400,628 | |||
| Liabilities: | ||||
| Payables: | ||||
| Fund shares redeemed | 17,072 | |||
| Investment management fees | 157 | |||
| Accrued expenses | 201 | |||
| Total liabilities | 17,430 | |||
| Net assets | $ | 2,383,198 | ||
| Summary of Net Assets: | ||||
| Capital stock and paid-in-capital | $ | 2,383,181 | ||
| Accumulated net realized gain on investments | 17 | |||
| Net assets | $ | 2,383,198 | ||
| Shares authorized | 14,000,000 | |||
| Par value | $ | 0.001 | ||
Class IA: Net asset value per share | $ | 1.00 | ||
| Shares outstanding | 2,000,585 | |||
| Net assets | $ | 2,000,599 | ||
Class IB: Net asset value per share | $ | 1.00 | ||
| Shares outstanding | 382,596 | |||
| Net assets | $ | 382,599 | ||
The accompanying notes are an integral part of these financial statements.
| Statement of Operations |
| For the Six-Month Period Ended June 30, 2011 (Unaudited) |
(000’s Omitted) |
| Investment Income: | ||||
| Dividends | $ | — | ||
| Interest | 2,396 | |||
| Total investment income, net | 2,396 | |||
| Expenses: | ||||
| Investment management fees | 4,746 | |||
| Transfer agent fees | 1 | |||
| Custodian fees | 2 | |||
| Accounting services fees | 119 | |||
| Board of Directors' fees | 30 | |||
| Audit fees | 19 | |||
| Other expenses | 99 | |||
| Total expenses (before waivers) | 5,016 | |||
| Expense waivers | (2,620 | ) | ||
| Total waivers | (2,620 | ) | ||
| Total expenses, net | 2,396 | |||
| Net investment income | — | |||
| Net Realized Gain on Investments: | ||||
| Net realized gain on investments | 17 | |||
| Net Realized Gain on Investments | 17 | |||
| Net Gain on Investments | 17 | |||
| Net Increase in Net Assets Resulting from Operations | $ | 17 | ||
The accompanying notes are an integral part of these financial statements.
Statement of Changes in Net Assets |
(000’s Omitted) |
| For the | ||||||||
| Six-Month | For the | |||||||
| Period Ended | Year Ended | |||||||
| June 30, 2011 | December 31, | |||||||
| (Unaudited) | 2010 | |||||||
| Operations: | ||||||||
| Net realized gain on investments | 17 | 4 | ||||||
| Payment from affiliate | — | 9,496 | ||||||
| Net Increase In Net Assets Resulting From Operations | 17 | 9,500 | ||||||
| Capital Share Transactions: | ||||||||
| Class IA | ||||||||
| Sold | 808,857 | 1,278,776 | ||||||
| Redeemed | (894,286 | ) | (2,020,865 | ) | ||||
| Total capital share transactions | (85,429 | ) | (742,089 | ) | ||||
| Class IB | ||||||||
| Sold | 120,520 | 222,037 | ||||||
| Redeemed | (157,443 | ) | (352,170 | ) | ||||
| Total capital share transactions | (36,923 | ) | (130,133 | ) | ||||
| Net decrease from capital share transactions | (122,352 | ) | (872,222 | ) | ||||
| Net Decrease In Net Assets | (122,335 | ) | (862,722 | ) | ||||
| Net Assets: | ||||||||
| Beginning of period | 2,505,533 | 3,368,255 | ||||||
| End of period | $ | 2,383,198 | $ | 2,505,533 | ||||
Accumulated undistributed (distribution in excess of) net investment income | $ | — | $ | — | ||||
| Shares: | ||||||||
| Class IA | ||||||||
| Sold | 808,857 | 1,278,814 | ||||||
| Redeemed | (894,286 | ) | (2,020,865 | ) | ||||
| Total share activity | (85,429 | ) | (742,051 | ) | ||||
| Class IB | ||||||||
| Sold | 120,520 | 222,045 | ||||||
| Redeemed | (157,443 | ) | (352,170 | ) | ||||
| Total share activity | (36,923 | ) | (130,125 | ) | ||||
The accompanying notes are an integral part of these financial statements.
| Notes to Financial Statements |
| June 30, 2011 (Unaudited) |
| (000’s Omitted) |
| 1. | Organization: |
Hartford Money Market HLS Fund (the “Fund”) serves as an underlying investment option for certain variable annuity and variable life insurance separate accounts of Hartford Life Insurance Company (“HLIC”) and its affiliates and certain qualified retirement plans. The Fund may also serve as an underlying investment option for certain variable annuity and variable life separate accounts of other insurance companies. Owners of variable annuity contracts and policyholders of variable life insurance contracts may choose the funds permitted in the variable insurance contract prospectus. In addition, participants in certain qualified retirement plans may choose the Fund if permitted by their plans.
Hartford Series Fund, Inc. (the “Company”) is an open-end registered management investment company comprised of thirty portfolios. Financial Statements for the Fund, a series of the Company, are included in this report.
The Company is organized under the laws of the State of Maryland and is registered with the Securities and Exchange Commission (“SEC”) under the Investment Company Act of 1940, as amended (“1940 Act”). The Fund is a diversified open-end management investment company.
The Fund is divided into Class IA and Class IB shares. Each class is offered at the per share net asset value (“NAV”) without a sales charge and is subject to the same expenses, except that the Class IB shares are subject to distribution and service fees charged pursuant to a Distribution Plan adopted in accordance with Rule 12b-1 under the 1940 Act.
| 2. | Significant Accounting Policies: |
The following is a summary of significant accounting policies of the Fund in the preparation of its financial statements, which are in accordance with the United States Generally Accepted Accounting Principles (“U.S. GAAP”). The preparation of financial statements in accordance with U.S. GAAP may require management to make estimates and assumptions that affect the reported amounts of assets and liabilities and disclosure of contingent assets and liabilities at the date of the financial statements and the reported amounts of increases and decreases in net assets from operations during the reporting period. Actual results could differ from those estimates.
| a) | Determination of Net Asset Value – The NAV of each class of the Fund's shares is determined as of the close of regular trading (normally 4:00 p.m. Eastern Time) (the “NYSE Close”) on each day that the New York Stock Exchange (the “Exchange”) is open (“Valuation Date”). Information that becomes known to the Fund after the NAV has been calculated on a particular day will not generally be used to retroactively adjust the NAV determined earlier that day. |
| b) | Investment Valuation – The Fund’s investments are valued at amortized cost, which approximates market value. Investments in open-end mutual funds are valued at the respective NAV of each open-end mutual fund as determined on the Valuation Date. |
U.S. GAAP defines fair value as the price that the Fund would receive to sell an asset or pay to transfer a liability in an orderly transaction between market participants. The U.S. GAAP fair value measurement standards require disclosure of a fair value hierarchy for each major category of assets and liabilities. Various inputs are used in determining the fair value of the Fund’s investments. These inputs are summarized into three broad hierarchy levels. This hierarchy is based on whether the valuation inputs are observable or unobservable. These levels are:
| · | Level 1 – Quoted prices in active markets for identical securities. Level 1 may include exchange-traded instruments such as domestic equities, some foreign equities, options, futures, mutual funds, exchange-traded funds, rights and warrants. |
| · | Level 2 – Observable inputs other than Level 1 prices, such as quoted prices for similar securities; quoted prices in markets that are not active; or other inputs that are observable or can be corroborated by observable market |
data. Level 2 may include debt securities that are traded less frequently than exchange-traded instruments and which are valued using third party pricing services; foreign equities, whose value is determined using a multi-factor regression model with inputs that are observable in the market; and short-term securities, which are valued at amortized cost.
| · | Level 3 – Significant unobservable inputs that are supported by limited or no market activity. Level 3 may include financial instruments whose values are determined using broker quotes or require significant management judgment or estimation. These unobservable valuation inputs may include estimates for current yields, maturity/duration, prepayment speed, and broker quotes for comparable securities along with other assumptions relating to credit quality, collateral value, complexity of the security structure, general market conditions and liquidity. This category may include securities where trading has been halted or there are certain restrictions on trading. While these securities are priced using unobservable inputs, the valuation of these securities reflects the best available data and management believes the prices are a reasonable representation of exit price. |
Valuation levels are not necessarily indicative of the risk associated with investing in such securities. Individual securities within any of the above mentioned asset classes may be assigned a different hierarchical level than those presented above, as individual circumstances dictate.
During the six-month period ended June 30, 2011, the Fund held no Level 3 securities, therefore no reconciliation of Level 3 securities is presented.
For additional information, refer to the Investment Valuation Hierarchy Level Summary which follows the Schedule of Investments.
For purposes of reporting transfers between different hierarchy levels, both transfers in and out of each level, as applicable, are shown as if they occurred at the beginning of the period.
| c) | Security Transactions and Investment Income – Security transactions are recorded as of the trade date (the date the order to buy or sell is executed) for financial reporting purposes. Realized gains and losses are determined on the basis of identified cost. |
Interest income, including amortization of premium and accretion of discounts, is accrued on a daily basis.
| d) | Joint Trading Account – The Fund may invest cash balances into a joint trading account that may be invested in one or more repurchase agreements. |
| e) | Fund Share Valuation and Dividend Distributions to Shareholders – Orders for the Fund’s shares are executed in accordance with the investment instructions of the contract holders and plan participants. The NAV of the Fund’s shares is determined as of the close of business on each business day of the Exchange. The NAV is determined separately for each class of shares of the Fund by dividing the Fund’s net assets attributable to that class by the number of shares of the class outstanding. Each class of shares offered by the Fund has equal rights as to assets and voting privileges (except that shareholders of a class have exclusive voting rights regarding any matter relating solely to that class of shares). Income and non-class specific expenses are allocated daily to each class on the basis of the relative net assets of the class. Realized and unrealized capital gains and losses of each class are allocated daily based on the relative net assets of each class of shares of the Fund. |
Orders for the purchase of the Fund’s shares received prior to the close of the Exchange on any day the Exchange is open for business are priced at the NAV determined as of the close of the Exchange. Orders received after the close of the Exchange, or on a day on which the Exchange and/or the Fund is not open for business, are priced at the next determined NAV.
| Notes to Financial Statements – (continued) |
| June 30, 2011 (Unaudited) |
| (000’s Omitted) |
Dividends are declared pursuant to a policy adopted by the Company’s Board of Directors based upon the investment performance of the Fund. Normally, dividends from net investment income are declared daily and paid monthly. Dividends from realized capital gains, if any, are paid at least once a year.
Distributions from net investment income, net realized capital gains and capital are determined in accordance with federal income tax regulations, which may differ from U.S. GAAP with respect to character and timing. These differences may include but are not limited to losses deferred due to wash sale adjustments, foreign currency gains and losses, adjustments related to Passive Foreign Investment Companies (“PFICs”), Real Estate Investment Trusts (“REITs”), Regulated Investment Companies (“RICs”), certain derivatives and partnerships. Permanent book and federal income tax basis differences relating to shareholder distributions will result in reclassifications to certain of the Fund’s capital accounts (see Federal Income Taxes: Reclassification of Capital Accounts note).
| 3. | Securities and Other Investments: |
| a) | Repurchase Agreements – A repurchase agreement is an agreement by which a counterparty agrees to sell a security and agrees to repurchase the security sold at a mutually agreed upon time and price. At the time the Fund enters into a repurchase agreement, the value of the underlying collateral security(ies), including accrued interest, will be equal to or exceed the value of the repurchase agreement. Repurchase agreements expose the Fund to counterparty risk. To minimize counterparty risk, the securities that serve to collateralize the repurchase agreement are held by the Fund's custodian in book entry or physical form in the custodial account of the Fund or in a third party custodial account. Repurchase agreements are valued at cost plus accrued interest. The Fund, as shown on the Schedule of Investments, had outstanding repurchase agreements as of June 30, 2011. |
| b) | Illiquid and Restricted Securities – The Fund is permitted to invest up to 15% of its net assets in illiquid securities. Illiquid securities are those that may not be sold or disposed of in the ordinary course of business within seven days, at approximately the price used to determine the Fund’s NAV. The Fund may not be able to sell illiquid securities or other investments when its sub-adviser considers it desirable to do so or may have to sell such securities or investments at a price that is lower than the price that could be obtained if the securities or investments were more liquid. A sale of illiquid securities or other investments may require more time and may result in higher dealer discounts and other selling expenses than does the sale of those that are liquid. Illiquid securities and investments also may be more difficult to value, due to the unavailability of reliable market quotations for such securities or investments, and an investment in them may have an adverse impact on the Fund’s NAV. The Fund may also purchase certain restricted securities that can only be resold to certain qualified investors and may be determined to be liquid pursuant to policies and guidelines established by the Company’s Board of Directors. The Fund, as shown on the Schedule of Investments, had illiquid and/or restricted securities as of June 30, 2011. |
| 4. | Principal Risks: |
| a) | Credit and Counterparty Risks – Credit risk depends largely on the perceived financial health of bond issuers. In general, the credit rating is inversely related to the credit risk of the issuer. Higher rated bonds generally are deemed to have less credit risk, while lower or unrated bonds are deemed to have higher risk of default. The share price, yield and total return of a fund that holds securities with higher credit risk may be more volatile than those of a fund that holds bonds with lower credit risk. Similar to credit risk, the Fund may be exposed to counterparty risk, or the risk that an institution or other entity with which the Fund has unsettled or open transactions will default. |
| b) | Market Risks – A Fund’s investments in derivatives and other financial instruments expose the Fund to various risks including, but not limited to, interest rate, prepayment and extension risks. Interest rate risk is the risk that fixed income securities will decline in value because of changes in interest rates. As nominal interest rates rise, the value of certain fixed income securities held by the Fund is likely to decrease. A nominal interest rate can be described as the sum of a real interest rate and an expected inflation rate. |
| 5. | Federal Income Taxes: |
| a) | Federal Income Taxes – For federal income tax purposes, the Fund intends to continue to qualify as a RIC under Subchapter M of the Internal Revenue Code (“IRC”) by distributing substantially all of its taxable net investment income and net realized capital gains to its shareholders and otherwise complying with the requirements of RICs. The Fund has distributed substantially all of its income and capital gains in prior years, if applicable, and intends to distribute substantially all of its income and capital gains prior to the next fiscal year-end. Accordingly, no provision for federal income or excise taxes has been made in the accompanying financial statements. Distributions from short-term capital gains are treated as ordinary income distributions for federal income tax purposes. |
| b) | Net Investment Income (Loss), Net Realized Gains (Losses) – Net investment income (loss) and net realized gains (losses) may differ for financial statement and tax purposes primarily because of losses deferred due to wash sale adjustments, foreign currency gains and losses, adjustments related to PFICs, REITs, RICs, certain derivatives and partnerships. The character of distributions made during the year from net investment income or net realized gains may differ from their ultimate characterization for federal income tax purposes. Also, due to the timing of dividend distributions, the fiscal year in which amounts are distributed may differ from the year that the income or realized gains (losses) were recorded by the Fund. |
| c) | Distributions and Components of Distributable Earnings – The tax character of distributions paid by the Fund for the periods indicated is as follows (as adjusted for dividends payable): |
| For the Year Ended | For the Year Ended | |||||||
| December 31, 2010 | December 31, 2009 | |||||||
| Ordinary Income | $ | — | $ | 2,818 | ||||
| d) | Reclassification of Capital Accounts – The Fund may record reclassifications in its capital accounts. These reclassifications have no impact on the total net assets of the Fund. The reclassifications are a result of permanent differences between U.S. GAAP and tax accounting for such items as expiration or utilization of capital loss carryforwards or net operating losses. Adjustments are made to reflect the impact these items have on current and future distributions to shareholders. Therefore, the source of the Fund’s distributable income may be shown in the accompanying Statement of Assets and Liabilities as from accumulated undistributed net investment income, from accumulated net realized gains on investments or from capital depending on the type of book and tax differences that exist. For the year ended December 31, 2010, the Fund had no reclassifications. |
| e) | Capital Loss Carryforward – The Fund had no capital loss carryforward for U.S. federal income tax purposes as of December 31, 2010. |
As of December 31, 2010, the Fund utilized $4 of prior year capital loss carryforwards.
| f) | Accounting for Uncertainty in Income Taxes – The Fund has adopted financial reporting rules that require the Fund to analyze all open tax years, as defined by the Statute of Limitations, for all major jurisdictions. Generally, tax authorities can examine all tax returns filed for the last three years. The Fund does not have an examination in progress. |
The Fund has reviewed all open tax years and major jurisdictions and concluded that these financial reporting rules had no effect on the Fund’s financial position or results of operations. There is no tax liability resulting from unrecognized tax benefits relating to uncertain income tax positions taken or expected to be taken on the tax return for the fiscal year-end December 31, 2010. The Fund is also not aware of any tax positions for which it is reasonably possible that the total amounts of unrecognized tax benefits will significantly change in the next twelve months.
| Notes to Financial Statements – (continued) |
| June 30, 2011 (Unaudited) |
| (000’s Omitted) |
| 6. | Expenses: |
| a) | Investment Management Agreements – HL Investment Advisors, LLC (“HL Advisors”), an indirect wholly owned subsidiary of The Hartford Financial Services Group, Inc. (“The Hartford”), serves as investment manager to the Fund pursuant to an Investment Management Agreement with the Company. As investment manager, HL Advisors has overall investment supervisory responsibility for the Fund. In addition, HL Advisors provides administrative personnel, services, equipment, facilities and office space for proper operation of the Fund. HL Advisors has contracted with Hartford Investment Management Company (“Hartford Investment Management”) under a sub-advisory agreement for the provision of day-to-day investment management services to the Fund in accordance with the Fund’s investment objective and policies. The Fund pays a fee to HL Advisors, a portion of which may be used to compensate Hartford Investment Management. |
The schedule below reflects the rates of compensation paid to HL Advisors for investment management services rendered as of June 30, 2011; the rates are accrued daily and paid monthly.
| Average Daily Net Assets | Annual Fee | |||
| On first $5 billion | 0.4000 | % | ||
| On next $5 billion | 0.3800 | % | ||
| Over $10 billion | 0.3700 | % | ||
| b) | Accounting Services Agreement – Pursuant to the Fund Accounting Agreement between HLIC and the Company, on behalf of the Fund, HLIC provides accounting services to the Fund and receives monthly compensation based on the Fund’s average net assets at the rates set forth below. The Fund’s accounting services fees are accrued daily and paid monthly. |
| Average Daily Net Assets | Annual Fee | |||
| All Assets | 0.010 | % | ||
| c) | Operating Expenses – Allocable expenses incurred by the Company are allocated to each Fund and allocated to classes within a Fund in proportion to the average daily net assets of the Fund and each class, except where allocation of certain expenses is more fairly made directly to the Fund or to specific classes within a Fund. |
| d) | Distribution Plan for Class IB shares – The Company, on behalf of the Fund, has adopted a Distribution Plan pursuant to Rule 12b-1 of the 1940 Act to compensate the Distributor, Hartford Securities Distribution Company, Inc. (a wholly owned, ultimate subsidiary of The Hartford), from assets attributable to the Class IB shares for services rendered and expenses borne in connection with activities primarily intended to result in the sale of the Class IB shares, subject to the review and approval of the Company’s Board of Directors. |
The Distribution Plan provides that the Fund may pay annually up to 0.25% of the average daily net assets of the Fund attributable to its Class IB shares for activities primarily intended to result in the sale of Class IB shares. The Board has the authority to suspend or reduce these payments at any point in time. Under the terms of the Distribution Plan and the principal underwriting agreement, the Fund is authorized to make payments monthly to the Distributor that may be used to pay or compensate entities providing distribution and shareholder servicing with respect to the Class IB shares for such entities’ fees or expenses incurred or paid in that regard. These fees are accrued daily and paid monthly.
At a meeting held on February 4, 2009, the Board of Directors approved the temporary reduction of distribution and service fees under the Fund’s Distribution Plan of the Company to zero for Class IB for a period of six months, effective March 1, 2009. Effective September 1, 2009, the Board of Directors approved a six month extension of this reduction of distribution and service fees under the Fund’s Distribution Plan. The Board of Directors then continued to approve these six month extentions of the reduction of distribution and service fees to zero for class IB through February 29, 2012. The Fund’s actions will result in a corresponding temporary reduction of 12b-1 payments of amounts paid to financial
intermediaries by the Fund’s distributor to zero for Class IB during this time period. The Board of Directors’ action can be changed at any time. The Hartford may be required to pay, out of its own resources, the equivalent of the 12b-1 fees to financial intermediaries notwithstanding the reduction of 12b-1 fees.
| e) | Other Related Party Transactions – Certain officers of the Fund are directors and/or officers of HL Advisors and/or The Hartford or its subsidiaries. For the six-month period ended June 30, 2011, a portion of the Fund’s chief compliance officer’s salary was paid by all the investment companies in the Hartford fund complex. The portion allocated to the Fund was in the amount of $2. Hartford Administrative Services Company (“HASCO”), an indirect wholly owned subsidiary of The Hartford, provides transfer agent services to the Fund. The amount paid to HASCO can be found in the Statement of Operations. These fees are accrued daily and paid monthly. |
On September 16, 2010, due to the realized losses incurred by the Fund, HL Advisers paid $9,496 to the Fund to provide support to the Fund’s $1.00 NAV. The payments had no impact on the Fund’s total return. These amounts are shown as an increase from payment from affiliate on the Statement of Changes in Net Assets.
| 7. | Investment Transactions: |
For the six-month period ended June 30, 2011, the costs of purchases and sales of securities (including U.S. Government Obligations) for the Fund were $52,501,148 and $52,612,366, respectively.
| 8. | Indemnifications: |
Under the Company’s organizational documents, the Company shall indemnify its officers and directors to the full extent required or permitted under Maryland General Corporation Law and the federal securities laws. In addition, the Company, on behalf of the Fund, may enter into contracts that contain a variety of indemnifications. The Company’s maximum exposure under these arrangements is unknown. However, as of the date of these financial statements the Company has not had prior claims or losses pursuant to these contracts and expects the risk of loss to be remote.
| Financial Highlights |
| - Selected Per-Share Data (A) - |
| Net Asset | Net Realized | Net Increase | ||||||||||||||||||||||||||||||||||||||||||
| Value at | and Unrealized | Total from | Dividends from | Distributions | (Decrease) in | Net Asset | ||||||||||||||||||||||||||||||||||||||
| Beginning of | Net Investment | Payments from | Gain (Loss) on | Investment | Net Investment | from Realized | Distributions | Total | Net Asset | Value at End | ||||||||||||||||||||||||||||||||||
| Class | Period | Income (Loss) | (to) Affiliate | Investments | Operations | Income | Capital Gains | from Capital | Distributions | Value | of Period | |||||||||||||||||||||||||||||||||
| For the Six-Month Period Ended June 30, 2011 (Unaudited) | ||||||||||||||||||||||||||||||||||||||||||||
| IA | $ | 1.00 | $ | – | $ | – | $ | – | $ | – | $ | – | $ | – | $ | – | $ | – | $ | – | $ | 1.00 | ||||||||||||||||||||||
| IB | 1.00 | – | – | – | – | – | – | – | – | – | 1.00 | |||||||||||||||||||||||||||||||||
| For the Year Ended December 31, 2010 | ||||||||||||||||||||||||||||||||||||||||||||
| IA | 1.00 | – | – | – | – | – | – | – | – | – | 1.00 | |||||||||||||||||||||||||||||||||
| IB | 1.00 | – | – | – | – | – | – | – | – | – | 1.00 | |||||||||||||||||||||||||||||||||
| For the Year Ended December 31, 2009 | ||||||||||||||||||||||||||||||||||||||||||||
| IA | 1.00 | – | – | – | – | – | – | – | – | – | 1.00 | |||||||||||||||||||||||||||||||||
| IB | 1.00 | – | – | – | – | – | – | – | – | – | 1.00 | |||||||||||||||||||||||||||||||||
| For the Year Ended December 31, 2008 | ||||||||||||||||||||||||||||||||||||||||||||
| IA | 1.00 | 0.02 | – | – | 0.02 | (0.02 | ) | – | – | (0.02 | ) | – | 1.00 | |||||||||||||||||||||||||||||||
| IB | 1.00 | 0.02 | – | – | 0.02 | (0.02 | ) | – | – | (0.02 | ) | – | 1.00 | |||||||||||||||||||||||||||||||
| For the Year Ended December 31, 2007 | ||||||||||||||||||||||||||||||||||||||||||||
| IA | 1.00 | 0.05 | – | – | 0.05 | (0.05 | ) | – | – | (0.05 | ) | – | 1.00 | |||||||||||||||||||||||||||||||
| IB | 1.00 | 0.05 | – | – | 0.05 | (0.05 | ) | – | – | (0.05 | ) | – | 1.00 | |||||||||||||||||||||||||||||||
| For the Year Ended December 31, 2006 | ||||||||||||||||||||||||||||||||||||||||||||
| IA | 1.00 | 0.05 | – | – | 0.05 | (0.05 | ) | – | – | (0.05 | ) | – | 1.00 | |||||||||||||||||||||||||||||||
| IB | 1.00 | 0.04 | – | – | 0.04 | (0.04 | ) | – | – | (0.04 | ) | – | 1.00 | |||||||||||||||||||||||||||||||
| (A) | Information presented relates to a share outstanding throughout the indicated period. |
| (B) | The figures do not include sales charges or other fees which may be applied at the variable life insurance, variable annuity or qualified retirement plan product level. Any such additional sales charges or other fees would lower the Fund's performance. |
| (C) | Portfolio turnover rate is calculated on the basis of the Fund as a whole without distinguishing between the classes of shares issued. |
| (D) | Not annualized. |
| (E) | Annualized. |
| - Ratios and Supplemental Data - |
| Ratio of Expenses to Average Net | Ratio of Expenses to Average Net | Ratio of Net Investment Income to | Portfolio Turnover | |||||||||||||||||||
| Total Return(B) | Net Assets at End of Period | Assets Before Waivers | Assets After Waivers | Average Net Assets | Rate(C) | |||||||||||||||||
| – | %(D) | $ | 2,000,599 | 0.42 | %(E) | 0.20 | %(E) | – | %(E) | N/A | ||||||||||||
| – | (D) | 382,599 | 0.42 | (E) | 0.20 | (E) | – | (E) | – | |||||||||||||
| – | 2,086,014 | 0.43 | 0.22 | – | N/A | |||||||||||||||||
| – | 419,519 | 0.43 | 0.22 | – | – | |||||||||||||||||
| 0.06 | 2,820,121 | 0.48 | 0.32 | 0.02 | N/A | |||||||||||||||||
| 0.05 | 548,134 | 0.53 | 0.34 | 0.00 | – | |||||||||||||||||
| 2.15 | 4,427,230 | 0.47 | 0.42 | 2.01 | N/A | |||||||||||||||||
| 1.89 | 774,432 | 0.72 | 0.67 | 1.80 | – | |||||||||||||||||
| 4.95 | 2,224,124 | 0.47 | 0.42 | 4.83 | N/A | |||||||||||||||||
| 4.69 | 452,976 | 0.72 | 0.67 | 4.58 | – | |||||||||||||||||
| 4.69 | 1,558,433 | 0.48 | 0.48 | 4.63 | N/A | |||||||||||||||||
| 4.43 | 319,926 | 0.73 | 0.73 | 4.38 | – | |||||||||||||||||
| Directors and Officers (Unaudited) |
The Board of Directors of the Company appoints officers who are responsible for the day-to-day operations of the Fund and who execute policies formulated by the Directors. Each director serves until his or her death, resignation, or retirement or until the next annual meeting of shareholders is held or until his or her successor is elected and qualifies.
Directors and officers who are employed by or who have a financial interest in The Hartford are considered “interested” persons of the Fund pursuant to the 1940 Act. Each officer and two of the Company’s directors, as noted in the chart below, are “interested” persons of the Fund. Each director serves as a director for The Hartford Mutual Funds, Inc., The Hartford Mutual Funds II, Inc., Hartford Series Fund, Inc., and Hartford HLS Series Fund II, Inc., which, as of June 30, 2011, collectively consist of 89 funds. Correspondence may be sent to directors and officers c/o Hartford Mutual Funds, P.O. Box 2999, Hartford, Connecticut 06104-2999, except that correspondence to Ms. Fagely may be sent to 500 Bielenberg Drive, Woodbury, Minnesota 55125.
The table below sets forth, for each director and officer, his or her name, year of birth, current position with the Company and date first elected or appointed to Hartford Series Fund, Inc. (“HSF”), and Hartford HLS Series Fund II, Inc. (“HSF2”), principal occupation, and, for directors, other directorships held. The Fund’s statement of additional information contains further information on the directors and is available free of charge by calling 1-800-862-6668 or writing to Hartford HLS Funds, c/o Individual Annuity Services, P.O. Box 5085, Hartford, CT 06102-5085.
Information on the aggregate remuneration paid to the directors of the Company can be found in the Statement of Operations herein. The Fund pays to The Hartford a portion of the chief compliance officer’s compensation, but does not pay salaries or compensation to any of their other officers or directors who are employed by The Hartford.
Non-Interested Directors
Lynn S. Birdsong (1946) Director since 2003, Co-Chairman of the Investment Committee
Mr. Birdsong is a private investor. Mr. Birdsong currently serves as a Director of the Sovereign High Yield Investment Company (April 2010 to current). Mr. Birdsong currently serves as an Independent Director of Nomura Partners Funds, Inc. (formerly, The Japan Fund) (March 2003 to current). From 2003 to March 2005, Mr. Birdsong was an independent director of the Atlantic Whitehall Funds. From 1979 to 2002, Mr. Birdsong was a managing director of Zurich Scudder Investments, an investment management firm. During his employment with Scudder, Mr. Birdsong was an Interested Director of The Japan Fund. Since 1981, Mr. Birdsong has been a partner in Birdsong Company, an advertising specialty firm.
Robert M. Gavin, Jr. (1940) Director since 2002 (HSF) and 1986 (HSF2), Chairman of the Board since 2004
Dr. Gavin is an educational consultant. Prior to September 1, 2001, he was President of Cranbrook Education Community and prior to July 1996, he was President of Macalester College, St. Paul, Minnesota.
Duane E. Hill (1945) Director since 2001 (HSF) and 2002 (HSF2), Chairman of the Nominating Committee
Mr. Hill is Partner of TSG Ventures L.P., a private equity investment company. Mr. Hill is a former partner of TSG Capital Group, a private equity investment firm that served as sponsor and lead investor in leveraged buyouts of middle market companies.
Sandra S. Jaffee (1941) Director since 2005
Ms. Jaffee served as Chairman (2008 to 2009) and Chief Executive Officer of Fortent (formerly Searchspace Group), a leading provider of compliance/regulatory technology to financial institutions from August 2005 to August 2009. From August 2004 to August 2005, Ms. Jaffee served as an Entrepreneur in Residence with Warburg Pincus, a private equity firm. From September 1995 to July 2004, Ms. Jaffee served as Executive Vice President at Citigroup, where she was President and Chief Executive Officer of Citibank’s Global Securities Services (1995 to 2003). Ms. Jaffe currently serves as a member of the Board of Directors of Broadridge Financial Solutions as well as a Trustee of Muhlenberg College.
William P. Johnston (1944) Director since 2005, Chairman of the Compliance Committee
In June 2006, Mr. Johnston was appointed as Senior Advisor to The Carlyle Group, a global private equity investment firm. In July 2006, Mr. Johnston was elected to the Board of Directors of MultiPlan, Inc. In August 2007, Mr. Johnston was elected to the Board of Directors of LifeCare Holdings, Inc. In February 2008, Mr. Johnston was elected to the Board of Directors of HCR-ManorCare, Inc. In May 2006, Mr. Johnston was elected to the Supervisory Board of Fresenius Medical Care AG & Co. KGaA, after its acquisition of Renal Care Group, Inc. in March 2006. Mr. Johnston joined Renal Care Group in November 2002 as a member of the Board of Directors and served as Chairman of the Board from March 2003 through March 2006. From September 1987 to December 2002, Mr. Johnston was with Equitable Securities Corporation (and its successors, SunTrust Equitable Securities and SunTrust Robinson Humphrey) serving in various investment banking and managerial positions, including Managing Director and Head of Investment Banking, Chief Executive Officer and Vice Chairman.
Phillip O. Peterson (1944) Director since 2002 (HSF) and 2000 (HSF2), Chairman of the Audit Committee
Mr. Peterson is a mutual fund industry consultant. He was a partner of KPMG LLP (an accounting firm) until July 1999. Mr. Peterson joined William Blair Funds in February 2007 as a member of the Board of Trustees. From January 2004 to April 2005, Mr. Peterson served as Independent President of the Strong Mutual Funds.
Lemma W. Senbet (1946) Director since 2005
Dr. Senbet is the William E. Mayer Chair Professor of Finance and Director, Center for Financial Policy, at the University of Maryland, Robert H. Smith School of Business. He was chair of the Finance Department from 1998 to 2006. Previously he was a chaired professor of finance at the University of Wisconsin-Madison. Also, he was director of the Fortis Funds from March 2000 to July 2002. Dr. Senbet served the finance profession in various capacities, including as director of the American Finance Association and President of the Western Finance Association. In 2006, Dr. Senbet was inducted Fellow of Financial Management Association International for his career-long distinguished scholarship and professional service.
Interested Directors and Officers
David N. Levenson (1966) Director since 2010
Mr. Levenson currently serves as President of The Hartford’s Wealth Management business. He was appointed to this role in July 2010. Previously, Mr. Levenson served as Executive Vice President of Legacy Holdings for The Hartford from June 2009 to July 2010. From 2006 to 2009, Mr. Levenson was with Hartford Life Insurance K.K. where he served as President and CEO from 2007 to 2009. He served as Managing Director of Hartford Investment Management Company from 2005 to 2006. Additionally, Mr. Levenson serves as Executive Vice President of The Hartford and as President, Director and Chief Executive Officer of Hartford Life Insurance Company (“HLIC”) and Hartford Life, Inc. (“HL Inc.”).
Lowndes A. Smith (1939) Director since 1996 (HSF) and 2002 (HSF2), Co-Chairman of the Investment Committee
Mr. Smith served as Vice Chairman of The Hartford from February 1997 to January 2002, as President and Chief Executive Officer of HL Inc. from February 1997 to January 2002, and as President and Chief Operating Officer of The Hartford Life Insurance Companies from January 1989 to January 2002. Mr. Smith serves as a Director of White Mountains Insurance Group, Ltd., One Beacon Insurance and Symetra Financial and as a Managing Director of Whittington Gray Associates.
Other Officers
James E. Davey (1964) President and Chief Executive Officer since 2010
Mr. Davey serves as Executive Vice President of HLIC. Additionally, Mr. Davey serves as President, Chief Executive Officer and Manager of Hartford Investment Financial Services, Inc. (“HIFSCO”) and President, Chief Executive Officer and Manager of HL Advisors. Mr. Davey joined The Hartford in 2002.
Tamara L. Fagely (1958) Vice President, Treasurer and Controller since 2002 (HSF) and 1993 (HSF2)
Ms. Fagely has been a Vice President of HASCO since 1998 and Chief Financial Officer since 2006. Currently Ms. Fagely is a Vice President of HLIC. She served as Assistant Vice President of HLIC from December 2001 through March 2005. In addition, Ms. Fagely is Controller and Chief Financial Officer of HIFSCO.
Susan M. Fleege (1959) AML Compliance Officer since 2011
Ms. Fleege currently serves as a Director of Risk Management at The Hartford. She previously served as AML Compliance Officer for the Fund from 2005-2008. Ms. Fleege joined HLIC in 2005 from Amerprise Financial Corporation where she held the position of Counsel from 2000 to 2005. Ms. Fleege is a certified Anti-Money Laundering Specialist.
Dr. Robert J. Froehlich (1953) Senior Managing Director since 2009
Dr. Froehlich joined The Hartford as Senior Managing Director in September 2009. Prior to joining The Hartford, Dr. Froehlich served as Vice Chairman of Deutsche Asset Management from 1997-2009.
Edward P. Macdonald (1967) Vice President, Secretary and Chief Legal Officer since 2005
Mr. Macdonald serves as Vice President of HLIC and Chief Legal Officer of Mutual Funds and Vice President of HIFSCO. He also serves as Vice President and Secretary of HASCO, and Chief Legal Officer, Secretary and Vice President of HL Advisors. Mr. Macdonald joined The Hartford in 2005.
| Directors and Officers (Unaudited) – (continued) |
Vernon J. Meyer (1964) Vice President since 2006
Mr. Meyer serves as Senior Vice President of HLIC. He also serves as Senior Vice President of HIFSCO and HL Advisors. Mr. Meyer joined The Hartford in 2004.
Colleen B. Pernerewski (1969) Vice President and Chief Compliance Officer since 2010
Ms. Pernerewski serves as Vice President and Chief Investment Advisor Compliance Officer of HIFSCO and as Vice President and Chief Compliance Officer of HL Advisors. Ms. Pernerewski joined The Hartford in 2005 from Travelers Life and Annuity where she served as Counsel (2004-2005). Prior to Travelers Life and Annuity, Ms. Pernerewski held the position of Counsel at The Hartford (1998-2004).
Elizabeth L. Schroeder (1966) Vice President since 2010
Ms. Schroeder currently serves as Assistant Vice President of HLIC. Ms. Schroeder joined HLIC in 1991. She is also an Assistant Vice President of HIFSCO and HL Advisers.
Martin Swanson (1962) Vice President since 2010
Mr. Swanson is a Vice President of HLIC. Mr. Swanson also serves as Vice President/Marketing for HIFSCO. Prior to joining HLIC in 1998, Mr. Swanson was a Vice President at PaineWebber, Inc.
Jane Wolak (1961) Vice President since 2009
Ms. Wolak currently serves as Senior Vice President of HLIC. Ms. Wolak joined HLIC as Vice President, Retail Product Services in May 2007. She is also Vice President of HASCO. Previously, Ms. Wolak was with Sun Life Financial where she held the position of Vice President, Service Center Operations from 2001-2007.
A description of the policies and procedures that the Fund uses to determine how to vote proxies relating to portfolio securities and a record of how the Fund voted any proxies for the twelve-month period ended June 30, 2011 are available (1) without charge, upon request, by calling 800-862-6668 and (2) on the SEC’s website at http://www.sec.gov.
QUARTERLY PORTFOLIO HOLDINGS INFORMATION (UNAUDITED)
The Fund files a complete schedule of portfolio holdings with the SEC for the first and third quarters of each fiscal year on Form N-Q. The Fund’s Forms are available (1) without charge, upon request, by calling 800-862-6668 and (2) on the SEC’s website at http://www.sec.gov. The Form N-Q may be reviewed and copied at the SEC’s Public Reference Room in Washington, DC. Information on the operation of the Public Reference Room may be obtained by calling 1-800-SEC-0330.
| Expense Example (Unaudited) |
Your Fund's Expenses
As a shareholder of the Fund, you incur two types of costs: (1) transaction costs and (2) ongoing costs including investment management fees, distribution fees, and other fund expenses. This example is intended to help you understand your ongoing costs (in dollars) of investing in a Fund and to compare these costs with the ongoing costs of investing in other mutual funds. The example is based on an investment of $1,000 invested at the beginning of the period and held for the period of December 31, 2010 through June 30, 2011.
Actual Expenses
The first set of columns of the table below provides information about actual account values and actual expenses. You may use the information in this column, together with the amount you invested, to estimate the expenses that you paid over the period. Simply divide your account value by $1,000 (for example, an $8,600 account value divided by $1,000 = 8.6), then multiply the result by the number in the line under the heading entitled “Expenses Paid During Period” to estimate the expenses you paid on your account during this period.
Hypothetical Example for Comparison Purposes
The second set of columns of the table below provides information about hypothetical account values and hypothetical expenses based on a Fund's actual expense ratio and an assumed rate of return of 5% per year before expenses, which is not the Fund's actual return. The hypothetical account values and expenses may not be used to estimate the actual ending account balance or expenses you paid for the period. You may use this information to compare the ongoing costs of investing in a Fund and other funds. To do so, compare this 5% hypothetical example with the 5% hypothetical examples that appear in the shareholder reports of the other funds.
Please note that the expenses shown in the table are meant to highlight your ongoing costs only and do not reflect any transactional costs, such as sales charges (loads) and CDSC. Therefore, the second set of columns of the table is useful in comparing ongoing costs only, and will not help you determine the relative total costs of owning different funds. In addition, if these transactional costs were included, your costs would be higher. Expenses are equal to the Fund's annualized expense ratios multiplied by average account value over the period, multiplied by 181/365 (to reflect the one-half year period).
| Actual return | Hypothetical (5% return before expenses) | |||||||||||||||||||||||||||||||||||
| Expenses paid | Expenses paid | Days in | ||||||||||||||||||||||||||||||||||
| during the period | during the period | the | Days | |||||||||||||||||||||||||||||||||
| Beginning | Ending | December 31, 2010 | Beginning | Ending | December 31, 2010 | Annualized | current | in the | ||||||||||||||||||||||||||||
| Account Value | Account Value | through | Account Value | Account Value | through | expense | 1/2 | full | ||||||||||||||||||||||||||||
| December 31, 2010 | June 30, 2011 | June 30, 2011 | December 31, 2010 | June 30, 2011 | June 30, 2011 | ratio | year | year | ||||||||||||||||||||||||||||
| Class IA | $ | 1,000.00 | $ | 1,000.00 | $ | 0.99 | $ | 1,000.00 | $ | 1,023.80 | $ | 1.00 | 0.20 | % | 181 | 365 | ||||||||||||||||||||
| Class IB | $ | 1,000.00 | $ | 1,000.00 | $ | 0.99 | $ | 1,000.00 | $ | 1,023.80 | $ | 1.00 | 0.20 | % | 181 | 365 | ||||||||||||||||||||
21
| The Hartford | |
P.O. Box 5085 | |
Hartford, CT 06102-5085 |
Hartford Series Fund, Inc. is underwritten and distributed by Hartford Securities Distribution Company, Inc.
"The Hartford" is The Hartford Financial Services Group, Inc. and its subsidiaries.
Hartford Series Fund, Inc. inception dates range from 1977 to date. Hartford Series Fund, Inc. is not a subsidiary of The Hartford but is underwritten, distributed by and advised by subsidiaries of The Hartford. Investments in Hartford Series Fund, Inc. are not guaranteed by The Hartford or any other entity.
You should carefully consider investment objectives, risks, and charges and expenses of Hartford HLS Funds before investing. This and other information can be found in the Fund’s prospectus or summary prospectus, which can be obtained by calling 800-862-6668. Please read them carefully before you invest or send money.
| HLSSAR-MM11 8-11 | 106632 | Printed in U.S.A ©2011 The Hartford, Hartford, CT 06115 |

A MESSAGE FROM THE PRESIDENT

Dear Fellow Shareholders:
I want to take this opportunity to say thank you for your continued confidence and trust.
We have seen a significant amount of global turbulence in the first half of 2011. Investors have continued to be concerned about the implications of the European sovereign debt crisis, as well as our own high levels of domestic debt. Since January we have witnessed significant political uprisings in the already-volatile Middle East and North Africa region. In addition, the ramifications of Japan's massive earthquake, subsequent tsunami, and nuclear disaster are still being played out in the market.
Although corporate earnings have remained robust, the unemployment picture has been mixed. After adding more than 200,000 jobs from February to April, more recent unemployment reports have shown a pullback in hiring.
While official inflation remains low as measured by the Consumer Price Index (CPI), high oil prices may be indicative of higher inflation in the future. The federal funds rate remains at a historic low, however, the Fed could potentially raise the rate to get it closer to its historical average once the economy strengthens.
Even with these headwinds, domestic, international, and world indices (as measured by the S&P 500, MSCI EAFE and MSCI World) are all up more than 5% through June, 30 2011.
Looking ahead, continued growth in emerging markets is fueling global recovery efforts. Emerging markets comprise about 48 percent of the world’s GDP, and many economists believe they are poised for further expansion. As GDP growth continues in emerging markets, roughly 100 million people are added to the middle class each year. This middle class population growth could potentially drive a considerable shift in consumer purchasing power.
Now that we have reached the midpoint of 2011, perhaps now would be a good time to schedule a meeting with your financial adviser to examine your current investment strategy and determine whether you are on the right track.
| • | Are you concerned about inflation and its effects on your portfolio? |
| • | Is your portfolio prepared for rising interest rates? |
| • | Does your portfolio reflect the global economy with a mix of developed nations and emerging markets? |
Your financial professional’s advice can help you to navigate today’s volatile markets with confidence. You can also rest assured that we will continue to provide you with solid investments and stellar service for the road ahead.
Thank you again for your business.

James Davey
President
Hartford HLS Funds
Hartford Portfolio Diversifier HLS Fund
| Financial Statements | |
| 2 | |
| 13 | |
| 14 | |
| 15 | |
| 16 | |
| 17 | |
| 28 | |
| 30 | |
| 32 | |
| 32 | |
| 33 | |
| 34 |
This report is prepared for the general information of contract owners. It is not an offer of contracts. It should not be used in connection with any offer, except in conjunction with the appropriate product prospectus which contains all pertinent information including the applicable sales, administrative and other charges.
| Schedule of Investments |
| June 30, 2011 (Unaudited) |
| (000’s Omitted) |
| Shares or Principal Amount | Market Value ╪ | ||||||
| COMMON STOCKS - 23.0% | |||||||
| Automobiles & Components - 0.2% | |||||||
| 4 | Ford Motor Co. ● | $ | 59 | ||||
| – | Goodyear Tire & Rubber Co. ● | 5 | |||||
| – | Harley-Davidson, Inc. | 11 | |||||
| 1 | Johnson Controls, Inc. | 32 | |||||
| 107 | |||||||
| Banks - 0.6% | |||||||
| 1 | BB&T Corp. | 21 | |||||
| – | Comerica, Inc. | 7 | |||||
| 1 | Fifth Third Bankcorp | 13 | |||||
| – | First Horizon National Corp. | 3 | |||||
| 1 | Hudson City Bancorp, Inc. | 5 | |||||
| 1 | Huntington Bancshares, Inc. | 6 | |||||
| 1 | Keycorp | 9 | |||||
| – | M&T Bank Corp. | 12 | |||||
| 1 | Marshall & Ilsley Corp. | 5 | |||||
| – | People's United Financial, Inc. | 6 | |||||
| 1 | PNC Financial Services Group, Inc. | 36 | |||||
| 1 | Regions Financial Corp. | 9 | |||||
| 1 | SunTrust Banks, Inc. | 16 | |||||
| 2 | US Bancorp | 56 | |||||
| 6 | Wells Fargo & Co. | 169 | |||||
| – | Zion Bancorp | 5 | |||||
| 378 | |||||||
| Capital Goods - 2.0% | |||||||
| 1 | 3M Co. | 77 | |||||
| 1 | Boeing Co. | 62 | |||||
| 1 | Caterpillar, Inc. | 78 | |||||
| – | Cummins, Inc. | 23 | |||||
| 1 | Danaher Corp. | 33 | |||||
| – | Deere & Co. | 39 | |||||
| – | Dover Corp. | 14 | |||||
| – | Eaton Corp. | 20 | |||||
| 1 | Emerson Electric Co. | 48 | |||||
| – | Fastenal Co. | 12 | |||||
| – | Flowserve Corp. | 7 | |||||
| – | Fluor Corp. | 13 | |||||
| – | General Dynamics Corp. | 32 | |||||
| 12 | General Electric Co. | 227 | |||||
| – | Goodrich Corp. | 14 | |||||
| 1 | Honeywell International, Inc. | 53 | |||||
| 1 | Illinois Tool Works, Inc. | 32 | |||||
| – | Ingersoll-Rand plc | 17 | |||||
| – | ITT Corp. | 12 | |||||
| – | Jacobs Engineering Group, Inc. ● | 6 | |||||
| – | Joy Global, Inc. | 11 | |||||
| – | L-3 Communications Holdings, Inc. | 11 | |||||
| – | Lockheed Martin Corp. | 26 | |||||
| – | Masco Corp. | 5 | |||||
| – | Northrop Grumman Corp. | 23 | |||||
| – | PACCAR, Inc. | 21 | |||||
| – | Pall Corp. | 8 | |||||
| – | Parker-Hannifin Corp. | 17 | |||||
| – | Precision Castparts Corp. | 27 | |||||
| – | Quanta Services, Inc. ● | 5 | |||||
| – | Raytheon Co. | 20 | |||||
| – | Rockwell Automation, Inc. | 14 | |||||
| – | Rockwell Collins, Inc. | 11 | |||||
| – | Roper Industries, Inc. | 9 | |||||
| – | Snap-On, Inc. | 4 | |||||
| – | Stanley Black & Decker, Inc. | 14 | |||||
| – | Textron, Inc. | 7 | |||||
| 1 | Tyco International Ltd. | 26 | |||||
| 1 | United Technologies Corp. | 92 | |||||
| – | W.W. Grainger, Inc. | 10 | |||||
| 1,180 | |||||||
| Commercial & Professional Services - 0.1% | |||||||
| – | Avery Dennison Corp. | 5 | |||||
| – | Cintas Corp. | 5 | |||||
| – | Dun & Bradstreet Corp. | 4 | |||||
| – | Equifax, Inc. ● | 5 | |||||
| – | Iron Mountain, Inc. | 8 | |||||
| – | Pitney Bowes, Inc. | 5 | |||||
| – | R.R. Donnelley & Sons Co. | 4 | |||||
| – | Republic Services, Inc. | 11 | |||||
| – | Robert Half International, Inc. | 4 | |||||
| – | Stericycle, Inc. ● | 9 | |||||
| 1 | Waste Management, Inc. | 20 | |||||
| 80 | |||||||
| Consumer Durables & Apparel - 0.2% | |||||||
| – | Coach, Inc. | 21 | |||||
| – | D.R. Horton, Inc. | 4 | |||||
| – | Fortune Brands, Inc. | 11 | |||||
| – | Harman International Industries, Inc. | 3 | |||||
| – | Hasbro, Inc. | 7 | |||||
| – | Leggett & Platt, Inc. | 4 | |||||
| – | Lennar Corp. | 3 | |||||
| – | Mattel, Inc. | 11 | |||||
| – | Newell Rubbermaid, Inc. | 5 | |||||
| – | NIKE, Inc. Class B | 39 | |||||
| – | Polo Ralph Lauren Corp. | 10 | |||||
| – | Pulte Group, Inc. ● | 3 | |||||
| – | V.F. Corp. | 11 | |||||
| – | Whirlpool Corp. | 7 | |||||
| 139 | |||||||
| Consumer Services - 0.4% | |||||||
| – | Apollo Group, Inc. Class A ● | 6 | |||||
| – | Carnival Corp. | 19 | |||||
| – | Chipotle Mexican Grill, Inc. ● | 11 | |||||
| – | Darden Restaurants, Inc. | 8 | |||||
| – | DeVry, Inc. | 4 | |||||
| – | H & R Block, Inc. | 6 | |||||
| – | International Game Technology | 6 | |||||
| – | Marriott International, Inc. Class A | 11 | |||||
| 1 | McDonald's Corp. | 99 | |||||
| 1 | Starbucks Corp. | 34 | |||||
| – | Starwood Hotels & Resorts | 12 | |||||
| – | Wyndham Worldwide Corp. | 7 | |||||
| – | Wynn Resorts Ltd. | 12 | |||||
| 1 | Yum! Brands, Inc. | 29 | |||||
| 264 | |||||||
| Diversified Financials - 1.6% | |||||||
| 1 | American Express Co. | 61 | |||||
| – | Ameriprise Financial, Inc. | 16 | |||||
| 12 | Bank of America Corp. | 126 | |||||
| 1 | Bank of New York Mellon Corp. | 36 | |||||
| – | BlackRock, Inc. | 21 | |||||
| 1 | Capital One Financial Corp. | 27 | |||||
| 1 | Charles Schwab Corp. | 19 | |||||
The accompanying notes are an integral part of these financial statements.
| Shares or Principal Amount | Market Value ╪ | ||||||
| COMMON STOCKS - 23.0% - (continued) | |||||||
| Diversified Financials - 1.6% - (continued) | |||||||
| 3 | Citigroup, Inc. | $ | 138 | ||||
| – | CME Group, Inc. | 22 | |||||
| 1 | Discover Financial Services, Inc. | 17 | |||||
| – | E*Trade Financial Corp. ● | 4 | |||||
| – | Federated Investors, Inc. | 2 | |||||
| – | Franklin Resources, Inc. | 22 | |||||
| 1 | Goldman Sachs Group, Inc. | 78 | |||||
| – | IntercontinentalExchange, Inc. ● | 10 | |||||
| 1 | Invesco Ltd. | 12 | |||||
| – | Janus Capital Group, Inc. | 2 | |||||
| 5 | JP Morgan Chase & Co. | 185 | |||||
| – | Legg Mason, Inc. | 6 | |||||
| – | Leucadia National Corp. | 8 | |||||
| – | Moody's Corp. | 9 | |||||
| 2 | Morgan Stanley | 40 | |||||
| – | Nasdaq OMX Group, Inc. ● | 4 | |||||
| – | Northern Trust Corp. | 13 | |||||
| – | NYSE Euronext | 10 | |||||
| 1 | SLM Corp. | 10 | |||||
| 1 | State Street Corp. | 26 | |||||
| – | T. Rowe Price Group, Inc. | 18 | |||||
| 942 | |||||||
| Energy - 2.9% | |||||||
| – | Alpha Natural Resources, Inc. ● | 12 | |||||
| 1 | Anadarko Petroleum Corp. | 43 | |||||
| – | Apache Corp. | 54 | |||||
| – | Baker Hughes, Inc. | 36 | |||||
| – | Cabot Oil & Gas Corp. | 8 | |||||
| – | Cameron International Corp. ● | 14 | |||||
| 1 | Chesapeake Energy Corp. | 22 | |||||
| 2 | Chevron Corp. | 235 | |||||
| 2 | ConocoPhillips Holding Co. | 121 | |||||
| – | Consol Energy, Inc. | 12 | |||||
| – | Denbury Resources, Inc. ● | 9 | |||||
| – | Devon Energy Corp. | 38 | |||||
| – | Diamond Offshore Drilling, Inc. | 5 | |||||
| 1 | El Paso Corp. | 18 | |||||
| – | EOG Resources, Inc. | 32 | |||||
| – | EQT Corp. | 9 | |||||
| 6 | Exxon Mobil Corp. | 455 | |||||
| – | FMC Technologies, Inc. ● | 12 | |||||
| 1 | Halliburton Co. | 53 | |||||
| – | Helmerich & Payne, Inc. | 8 | |||||
| – | Hess Corp. | 26 | |||||
| 1 | Marathon Oil Corp. | 43 | |||||
| – | Murphy Oil Corp. | 14 | |||||
| – | Nabors Industries Ltd. ● | 8 | |||||
| – | National Oilwell Varco, Inc. | 38 | |||||
| – | Newfield Exploration Co. ● | 10 | |||||
| – | Noble Corp. | 11 | |||||
| – | Noble Energy, Inc. | 18 | |||||
| 1 | Occidental Petroleum Corp. | 96 | |||||
| – | Peabody Energy Corp. | 18 | |||||
| – | Pioneer Natural Resources Co. | 12 | |||||
| – | QEP Resources, Inc. | 8 | |||||
| – | Range Resources Corp. | 10 | |||||
| – | Rowan Companies, Inc. ● | 6 | |||||
| 2 | Schlumberger Ltd. | 133 | |||||
| – | Southwestern Energy Co. ● | 17 | |||||
| 1 | Spectra Energy Corp. | 20 | |||||
| – | Sunoco, Inc. | 6 | |||||
| – | Tesoro Corp. ● | 4 | |||||
| 1 | Valero Energy Corp. | 17 | |||||
| 1 | Williams Cos., Inc. | 20 | |||||
| 1,731 | |||||||
| Food & Staples Retailing - 0.5% | |||||||
| – | Costco Wholesale Corp. | 40 | |||||
| 2 | CVS/Caremark Corp. | 58 | |||||
| 1 | Kroger Co. | 17 | |||||
| – | Safeway, Inc. | 10 | |||||
| – | Supervalu, Inc. | 2 | |||||
| 1 | Sysco Corp. | 21 | |||||
| 1 | Walgreen Co. | 44 | |||||
| 2 | Wal-Mart Stores, Inc. | 115 | |||||
| – | Whole Foods Market, Inc. | 11 | |||||
| 318 | |||||||
| Food, Beverage & Tobacco - 1.4% | |||||||
| 2 | Altria Group, Inc. | 63 | |||||
| 1 | Archer Daniels Midland Co. | 23 | |||||
| – | Brown-Forman Corp. | 9 | |||||
| – | Campbell Soup Co. | 7 | |||||
| 3 | Coca-Cola Co. | 175 | |||||
| – | Coca-Cola Enterprises, Inc. | 11 | |||||
| – | ConAgra Foods, Inc. | 12 | |||||
| – | Constellation Brands, Inc. Class A ● | 4 | |||||
| – | Dean Foods Co. ● | 3 | |||||
| – | Dr. Pepper Snapple Group | 10 | |||||
| 1 | General Mills, Inc. | 27 | |||||
| – | H.J. Heinz Co. | 19 | |||||
| – | Hershey Co. | 10 | |||||
| – | Hormel Foods Corp. | 5 | |||||
| – | J.M. Smucker Co. | 10 | |||||
| – | Kellogg Co. | 16 | |||||
| 2 | Kraft Foods, Inc. | 70 | |||||
| – | Lorillard, Inc. | 18 | |||||
| – | McCormick & Co., Inc. | 7 | |||||
| – | Mead Johnson Nutrition Co. | 16 | |||||
| – | Molson Coors Brewing Co. | 8 | |||||
| 2 | PepsiCo, Inc. | 126 | |||||
| 2 | Philip Morris International, Inc. | 135 | |||||
| – | Reynolds American, Inc. | 14 | |||||
| 1 | Sara Lee Corp. | 13 | |||||
| – | Tyson Foods, Inc. Class A | 7 | |||||
| 818 | |||||||
| Health Care Equipment & Services - 1.0% | |||||||
| – | Aetna, Inc. | 19 | |||||
| – | Amerisource Bergen Corp. | 13 | |||||
| – | Bard (C.R.), Inc. | 11 | |||||
| 1 | Baxter International, Inc. | 39 | |||||
| – | Becton, Dickinson & Co. | 21 | |||||
| 2 | Boston Scientific Corp. ● | 12 | |||||
| – | Cardinal Health, Inc. | 18 | |||||
| – | CareFusion Corp. ● | 7 | |||||
| – | Cerner Corp. ● | 10 | |||||
| – | CIGNA Corp. | 16 | |||||
| – | Coventry Health Care, Inc. ● | 6 | |||||
| 1 | Covidien plc | 30 | |||||
| – | DaVita, Inc. ● | 9 | |||||
| – | Dentsply International, Inc. | 6 | |||||
| – | Edwards Lifesciences Corp. ● | 11 | |||||
The accompanying notes are an integral part of these financial statements.
| Hartford Portfolio Diversifier HLS Fund |
| Schedule of Investments – (continued) |
| June 30, 2011 (Unaudited) |
| (000’s Omitted) |
| Shares or Principal Amount | Market Value ╪ | ||||||
| COMMON STOCKS - 23.0% - (continued) | |||||||
| Health Care Equipment & Services - 1.0% - (continued) | |||||||
| 1 | Express Scripts, Inc. ● | $ | 32 | ||||
| – | Humana, Inc. | 15 | |||||
| – | Intuitive Surgical, Inc. ● | 17 | |||||
| – | Laboratory Corp. of America Holdings ● | 11 | |||||
| – | McKesson Corp. | 24 | |||||
| – | Medco Health Solutions, Inc. ● | 26 | |||||
| 1 | Medtronic, Inc. | 47 | |||||
| – | Patterson Cos., Inc. | 4 | |||||
| – | Quest Diagnostics, Inc. | 11 | |||||
| – | St. Jude Medical, Inc. | 18 | |||||
| – | Stryker Corp. | 22 | |||||
| 1 | Tenet Healthcare Corp. ● | 3 | |||||
| 1 | UnitedHealth Group, Inc. | 63 | |||||
| – | Varian Medical Systems, Inc. ● | 9 | |||||
| – | Wellpoint, Inc. | 33 | |||||
| – | Zimmer Holdings, Inc. ● | 14 | |||||
| 577 | |||||||
| Household & Personal Products - 0.5% | |||||||
| – | Avon Products, Inc. | 14 | |||||
| – | Clorox Co. | 10 | |||||
| 1 | Colgate-Palmolive Co. | 48 | |||||
| – | Estee Lauder Co., Inc. | 14 | |||||
| – | Kimberly-Clark Corp. | 30 | |||||
| 3 | Procter & Gamble Co. | 201 | |||||
| 317 | |||||||
| Insurance - 0.9% | |||||||
| – | ACE Ltd. | 26 | |||||
| 1 | Aflac, Inc. | 26 | |||||
| 1 | Allstate Corp. | 18 | |||||
| 1 | American International Group, Inc. ● | 15 | |||||
| – | AON Corp. | 19 | |||||
| – | Assurant, Inc. | 4 | |||||
| 2 | Berkshire Hathaway, Inc. Class B ● | 155 | |||||
| – | Chubb Corp. | 21 | |||||
| – | Cincinnati Financial Corp. | 6 | |||||
| 1 | Genworth Financial, Inc. ● | 6 | |||||
| – | Lincoln National Corp. | 11 | |||||
| – | Loews Corp. | 15 | |||||
| 1 | Marsh & McLennan Cos., Inc. | 19 | |||||
| 1 | MetLife, Inc. | 55 | |||||
| – | Principal Financial Group, Inc. | 12 | |||||
| 1 | Progressive Corp. | 16 | |||||
| 1 | Prudential Financial, Inc. | 37 | |||||
| – | Torchmark Corp. | 6 | |||||
| – | Travelers Cos., Inc. | 28 | |||||
| – | Unum Group | 9 | |||||
| – | XL Group plc | 8 | |||||
| 512 | |||||||
| Materials - 0.8% | |||||||
| – | Air Products and Chemicals, Inc. | 23 | |||||
| – | Airgas, Inc. | 6 | |||||
| – | AK Steel Holding Corp. | 2 | |||||
| 1 | Alcoa, Inc. | 19 | |||||
| – | Allegheny Technologies, Inc. | 8 | |||||
| – | Ball Corp. | 7 | |||||
| – | Bemis Co., Inc. | 4 | |||||
| – | CF Industries Holdings, Inc. | 12 | |||||
| – | Cliff's Natural Resources, Inc. | 15 | |||||
| 1 | Dow Chemical Co. | 48 | |||||
| 1 | E.I. DuPont de Nemours & Co. | 57 | |||||
| – | Eastman Chemical Co. | 8 | |||||
| – | Ecolab, Inc. | 15 | |||||
| – | FMC Corp. | 7 | |||||
| 1 | Freeport-McMoRan Copper & Gold, Inc. | 57 | |||||
| – | International Flavors & Fragrances, Inc. | 6 | |||||
| – | International Paper Co. | 15 | |||||
| – | MeadWestvaco Corp. | 6 | |||||
| 1 | Monsanto Co. | 44 | |||||
| 1 | Newmont Mining Corp. | 30 | |||||
| – | Nucor Corp. | 15 | |||||
| – | Owens-Illinois, Inc. ● | 5 | |||||
| – | PPG Industries, Inc. | 16 | |||||
| – | Praxair, Inc. | 37 | |||||
| – | Sealed Air Corp. | 4 | |||||
| – | Sherwin-Williams Co. | 8 | |||||
| – | Sigma-Aldrich Corp. | 10 | |||||
| – | Titanium Metals Corp. | 2 | |||||
| – | United States Steel Corp. | 8 | |||||
| – | Vulcan Materials Co. | 6 | |||||
| 500 | |||||||
| Media - 0.8% | |||||||
| – | Cablevision Systems Corp. | 9 | |||||
| 1 | CBS Corp. Class B | 22 | |||||
| 3 | Comcast Corp. Class A | 80 | |||||
| 1 | DirecTV Class A ● | 44 | |||||
| – | Discovery Communications, Inc. ● | 13 | |||||
| – | Gannett Co., Inc. | 4 | |||||
| 1 | Interpublic Group of Cos., Inc. | 7 | |||||
| – | McGraw-Hill Cos., Inc. | 14 | |||||
| 3 | News Corp. Class A | 46 | |||||
| – | Omnicom Group, Inc. | 15 | |||||
| – | Scripps Networks Interactive Class A | 5 | |||||
| – | Time Warner Cable, Inc. | 30 | |||||
| 1 | Time Warner, Inc. | 44 | |||||
| 1 | Viacom, Inc. Class B | 34 | |||||
| 2 | Walt Disney Co. | 84 | |||||
| – | Washington Post Co. Class B | 3 | |||||
| 454 | |||||||
| Pharmaceuticals, Biotechnology & Life Sciences - 1.7% | |||||||
| 2 | Abbott Laboratories | 93 | |||||
| – | Agilent Technologies, Inc. ● | 20 | |||||
| – | Allergan, Inc. | 29 | |||||
| 1 | Amgen, Inc. ● | 62 | |||||
| – | Biogen Idec, Inc. ● | 29 | |||||
| 2 | Bristol-Myers Squibb Co. | 56 | |||||
| 1 | Celgene Corp. ● | 32 | |||||
| – | Cephalon, Inc. ● | 7 | |||||
| 1 | Eli Lilly & Co. | 43 | |||||
| – | Forest Laboratories, Inc. ● | 13 | |||||
| 1 | Gilead Sciences, Inc. ● | 37 | |||||
| – | Hospira, Inc. ● | 11 | |||||
| 3 | Johnson & Johnson | 207 | |||||
| – | Life Technologies Corp. ● | 11 | |||||
| 4 | Merck & Co., Inc. | 124 | |||||
| – | Mylan, Inc. ● | 12 | |||||
| – | PerkinElmer, Inc. | 3 | |||||
| 9 | Pfizer, Inc. | 185 | |||||
| – | Thermo Fisher Scientific, Inc. ● | 28 | |||||
The accompanying notes are an integral part of these financial statements.
| Shares or Principal Amount | Market Value ╪ | ||||||
| COMMON STOCKS - 23.0% - (continued) | |||||||
| Pharmaceuticals, Biotechnology & Life Sciences - 1.7% - | |||||||
| (continued) | |||||||
| – | Waters Corp. ● | $ | 10 | ||||
| – | Watson Pharmaceuticals, Inc. ● | 10 | |||||
| 1,022 | |||||||
| Real Estate - 0.4% | |||||||
| – | Apartment Investment & Management Co. | 3 | |||||
| – | Avalonbay Communities, Inc. | 13 | |||||
| – | Boston Properties, Inc. | 18 | |||||
| – | CB Richard Ellis Group, Inc. Class A ● | 8 | |||||
| – | Equity Residential Properties Trust | 20 | |||||
| – | HCP, Inc. | 17 | |||||
| – | Health Care, Inc. | 11 | |||||
| 1 | Host Hotels & Resorts, Inc. | 13 | |||||
| – | Kimco Realty Corp. | 9 | |||||
| – | Plum Creek Timber Co., Inc. | 7 | |||||
| 1 | ProLogis, Inc. | 19 | |||||
| – | Public Storage | 18 | |||||
| – | Simon Property Group, Inc. | 39 | |||||
| – | Ventas, Inc. | 10 | |||||
| – | Vornado Realty Trust | 17 | |||||
| 1 | Weyerhaeuser Co. | 13 | |||||
| 235 | |||||||
| Retailing - 0.8% | |||||||
| – | Abercrombie & Fitch Co. Class A | 7 | |||||
| – | Amazon.com, Inc. ● | 83 | |||||
| – | AutoNation, Inc. ● | 3 | |||||
| – | AutoZone, Inc. ● | 9 | |||||
| – | Bed Bath & Beyond, Inc. ● | 16 | |||||
| – | Best Buy Co., Inc. | 12 | |||||
| – | Big Lots, Inc. ● | 3 | |||||
| – | CarMax, Inc. ● | 8 | |||||
| – | Expedia, Inc. | 7 | |||||
| – | Family Dollar Stores, Inc. | 7 | |||||
| – | GameStop Corp. Class A ● | 4 | |||||
| – | Gap, Inc. | 8 | |||||
| – | Genuine Parts Co. | 10 | |||||
| 2 | Home Depot, Inc. | 66 | |||||
| – | J.C. Penney Co., Inc. | 8 | |||||
| – | Kohl's Corp. | 16 | |||||
| – | Limited Brands, Inc. | 11 | |||||
| 1 | Lowe's Co., Inc. | 34 | |||||
| – | Macy's, Inc. | 14 | |||||
| – | Netflix, Inc. ● | 13 | |||||
| – | Nordstrom, Inc. | 9 | |||||
| – | O'Reilly Automotive, Inc. ● | 10 | |||||
| – | Priceline.com, Inc. ● | 29 | |||||
| – | Ross Stores, Inc. | 11 | |||||
| – | Sears Holdings Corp. ● | 3 | |||||
| 1 | Staples, Inc. | 13 | |||||
| 1 | Target Corp. | 37 | |||||
| – | Tiffany & Co. | 11 | |||||
| – | TJX Cos., Inc. | 23 | |||||
| – | Urban Outfitters, Inc. ● | 4 | |||||
| 489 | |||||||
| Semiconductors & Semiconductor Equipment - 0.6% | |||||||
| 1 | Advanced Micro Devices, Inc. ● | 5 | |||||
| – | Altera Corp. | 17 | |||||
| – | Analog Devices, Inc. | 13 | |||||
| 1 | Applied Materials, Inc. | 20 | |||||
| 1 | Broadcom Corp. Class A | 18 | |||||
| – | First Solar, Inc. ● | 8 | |||||
| 6 | Intel Corp. | 133 | |||||
| – | KLA-Tencor Corp. | 8 | |||||
| – | Linear Technology Corp. | 9 | |||||
| 1 | LSI Corp. ● | 5 | |||||
| – | MEMC Electronic Materials, Inc. ● | 2 | |||||
| – | Microchip Technology, Inc. | 8 | |||||
| 1 | Micron Technology, Inc. ● | 7 | |||||
| – | National Semiconductor Corp. | 7 | |||||
| – | Novellus Systems, Inc. ● | 4 | |||||
| 1 | NVIDIA Corp. ● | 11 | |||||
| – | Teradyne, Inc. ● | 3 | |||||
| 1 | Texas Instruments, Inc. | 43 | |||||
| – | Xilinx, Inc. | 11 | |||||
| 332 | |||||||
| Software & Services - 2.0% | |||||||
| 1 | Adobe Systems, Inc. ● | 18 | |||||
| – | Akamai Technologies, Inc. ● | 7 | |||||
| – | Autodesk, Inc. ● | 10 | |||||
| 1 | Automatic Data Processing, Inc. | 30 | |||||
| – | BMC Software, Inc. ● | 11 | |||||
| – | CA, Inc. | 10 | |||||
| – | Citrix Systems, Inc. ● | 17 | |||||
| – | Cognizant Technology Solutions Corp. ● | 25 | |||||
| – | Computer Sciences Corp. | 7 | |||||
| – | Compuware Corp. ● | 3 | |||||
| 1 | eBay, Inc. ● | 42 | |||||
| – | Electronic Arts, Inc. ● | 9 | |||||
| – | Fidelity National Information Services, Inc. | 10 | |||||
| – | Fiserv, Inc. ● | 10 | |||||
| – | Google, Inc. ● | 145 | |||||
| 1 | IBM Corp. | 236 | |||||
| – | Intuit, Inc. ● | 16 | |||||
| – | Mastercard, Inc. | 32 | |||||
| 8 | Microsoft Corp. | 219 | |||||
| – | Monster Worldwide, Inc. ● | 2 | |||||
| 4 | Oracle Corp. | 146 | |||||
| – | Paychex, Inc. | 11 | |||||
| – | Red Hat, Inc. ● | 10 | |||||
| – | SAIC, Inc. ● | 5 | |||||
| – | Salesforce.com, Inc. ● | 20 | |||||
| 1 | Symantec Corp. ● | 17 | |||||
| – | Teradata Corp. ● | 12 | |||||
| – | Total System Services, Inc. | 4 | |||||
| – | VeriSign, Inc. | 6 | |||||
| 1 | Visa, Inc. | 46 | |||||
| 1 | Western Union Co. | 14 | |||||
| 1 | Yahoo!, Inc. ● | 22 | |||||
| 1,172 | |||||||
| Technology Hardware & Equipment - 1.6% | |||||||
| – | Amphenol Corp. Class A | 11 | |||||
| 1 | Apple, Inc. ● | 352 | |||||
| 6 | Cisco Systems, Inc. | 98 | |||||
| 2 | Corning, Inc. | 32 | |||||
| 2 | Dell, Inc. ● | 31 | |||||
| 2 | EMC Corp. ● | 64 | |||||
| – | F5 Networks, Inc. ● | 10 | |||||
| – | FLIR Systems, Inc. | 6 | |||||
| – | Harris Corp. | 6 | |||||
The accompanying notes are an integral part of these financial statements.
| Hartford Portfolio Diversifier HLS Fund |
| Schedule of Investments – (continued) |
| June 30, 2011 (Unaudited) |
| (000’s Omitted) |
| Shares or Principal Amount | Market Value ╪ | ||||||
| COMMON STOCKS - 23.0% - (continued) | |||||||
| Technology Hardware & Equipment - 1.6% - (continued) | |||||||
| 2 | Hewlett-Packard Co. | $ | 86 | ||||
| – | Jabil Circuit, Inc. | 5 | |||||
| – | JDS Uniphase Corp. ● | 4 | |||||
| 1 | Juniper Networks, Inc. ● | 19 | |||||
| – | Lexmark International, Inc. ADR ● | 3 | |||||
| – | Molex, Inc. | 4 | |||||
| – | Motorola Mobility Holdings, Inc. ● | 7 | |||||
| – | Motorola Solutions, Inc. ● | 18 | |||||
| – | NetApp, Inc. ● | 22 | |||||
| 2 | Qualcomm, Inc. | 108 | |||||
| – | SanDisk Corp. ● | 11 | |||||
| – | Tellabs, Inc. | 2 | |||||
| – | Western Digital Corp. ● | 10 | |||||
| 2 | Xerox Corp. | 17 | |||||
| 926 | |||||||
| Telecommunication Services - 0.7% | |||||||
| – | American Tower Corp. Class A ● | 24 | |||||
| 7 | AT&T, Inc. | 211 | |||||
| 1 | CenturyLink, Inc. | 28 | |||||
| 1 | Frontier Communications Corp. | 9 | |||||
| – | MetroPCS Communications, Inc. ● | 5 | |||||
| 3 | Sprint Nextel Corp. ● | 18 | |||||
| 3 | Verizon Communications, Inc. | 120 | |||||
| 1 | Windstream Corp. | 7 | |||||
| 422 | |||||||
| Transportation - 0.5% | |||||||
| – | C.H. Robinson Worldwide, Inc. | 15 | |||||
| 1 | CSX Corp. | 33 | |||||
| – | Expeditors International of Washington, Inc. | 12 | |||||
| – | FedEx Corp. | 34 | |||||
| – | Norfolk Southern Corp. | 30 | |||||
| – | Ryder System, Inc. | 3 | |||||
| 1 | Southwest Airlines Co. | 10 | |||||
| 1 | Union Pacific Corp. | 58 | |||||
| 1 | United Parcel Service, Inc. Class B | 82 | |||||
| 277 | |||||||
| Utilities - 0.8% | |||||||
| 1 | AES Corp. ● | 9 | |||||
| – | Ameren Corp. | 8 | |||||
| 1 | American Electric Power Co., Inc. | 21 | |||||
| – | CenterPoint Energy, Inc. | 9 | |||||
| – | CMS Energy Corp. | 6 | |||||
| – | Consolidated Edison, Inc. | 18 | |||||
| – | Constellation Energy Group, Inc. | 9 | |||||
| 1 | Dominion Resources, Inc. | 32 | |||||
| – | DTE Energy Co. | 10 | |||||
| 2 | Duke Energy Corp. | 28 | |||||
| – | Edison International | 14 | |||||
| – | Entergy Corp. | 14 | |||||
| 1 | Exelon Corp. | 32 | |||||
| – | FirstEnergy Corp. | 21 | |||||
| – | Integrys Energy Group, Inc. | 5 | |||||
| – | NextEra Energy, Inc. | 27 | |||||
| – | Nicor, Inc. | 3 | |||||
| – | NiSource, Inc. | 6 | |||||
| – | Northeast Utilities | 7 | |||||
| – | NRG Energy, Inc. ● | 7 | |||||
| – | Oneok, Inc. | 9 | |||||
| – | Pepco Holdings, Inc. | 5 | |||||
| – | PG&E Corp. | 19 | |||||
| – | Pinnacle West Capital Corp. | 6 | |||||
| 1 | PPL Corp. | 18 | |||||
| – | Progress Energy, Inc. | 16 | |||||
| 1 | Public Service Enterprise Group, Inc. | 19 | |||||
| – | SCANA Corp. | 5 | |||||
| – | Sempra Energy | 14 | |||||
| 1 | Southern Co. | 39 | |||||
| – | TECO Energy, Inc. | 5 | |||||
| – | Wisconsin Energy Corp. | 8 | |||||
| 1 | Xcel Energy, Inc. | 13 | |||||
| 462 | |||||||
| Total common stocks | |||||||
| (cost $13,296) | $ | 13,654 | |||||
| EXCHANGE TRADED FUNDS - 0.3% | |||||||
| Other Investment Pools and Funds - 0.3% | |||||||
| 3 | Vanguard S&P 500 ETF | $ | 183 | ||||
| Total exchange traded funds | |||||||
| (cost $179) | $ | 183 | |||||
| ASSET & COMMERCIAL MORTGAGE BACKED SECURITIES - 0.8% | |||||||
| Finance and Insurance - 0.8% | |||||||
| Banc of America Commercial Mortgage, Inc. | |||||||
| $ | 25 | 5.41%, 09/10/2047 | $ | 27 | |||
Citigroup/Deutsche Bank Commercial Mortgage Trust | |||||||
| 35 | 5.22%, 07/15/2044 Δ | 38 | |||||
| 25 | 5.32%, 12/11/2049 | 27 | |||||
| 25 | 5.62%, 10/15/2048 | 27 | |||||
| Credit Suisse Mortgage Capital Certificates | |||||||
| 30 | 5.47%, 09/15/2039 | 32 | |||||
| Goldman Sachs Mortgage Securities Corp. II | |||||||
| 35 | 4.75%, 07/10/2039 | 37 | |||||
| 25 | 5.56%, 11/10/2039 | 27 | |||||
| Goldman Sachs Mortgage Securities Corp. II | |||||||
| Class A4 | |||||||
| 45 | 5.81%, 08/10/2045 Δ | 48 | |||||
| Greenwich Capital Commercial Funding Corp. | |||||||
| 35 | 5.44%, 03/10/2039 Δ | 38 | |||||
| JP Morgan Chase Commercial Mortgage | |||||||
| Securities Corp. | |||||||
| 25 | 5.34%, 05/15/2047 | 27 | |||||
| 35 | 5.44%, 06/12/2047 Δ | 37 | |||||
| Wachovia Bank Commercial Mortgage Trust | |||||||
| 25 | 5.27%, 12/15/2044 Δ | 27 | |||||
| 25 | 5.31%, 11/15/2048 | 27 | |||||
| 25 | 5.34%, 12/15/2043 | 26 | |||||
| 25 | 5.74%, 06/15/2049 Δ | 27 | |||||
| 472 | |||||||
Total asset & commercial mortgage backed securities | |||||||
| (cost $474) | $ | 472 | |||||
The accompanying notes are an integral part of these financial statements.
| Shares or Principal Amount | Market Value ╪ | ||||||
| CORPORATE BONDS: INVESTMENT GRADE - 10.9% | |||||||
| Arts, Entertainment and Recreation - 0.5% | |||||||
| Comcast Corp. | |||||||
| $ | 65 | 5.15%, 03/01/2020 | $ | 70 | |||
| DirecTV Holdings LLC | |||||||
| 30 | 3.50%, 03/01/2016 | 31 | |||||
| NBC Universal, Inc. | |||||||
| 30 | 4.38%, 04/01/2021 ■ | 30 | |||||
| News America, Inc. | |||||||
| 35 | 6.40%, 12/15/2035 | 36 | |||||
| Time Warner, Inc. | |||||||
| 50 | 4.88%, 03/15/2020 | 52 | |||||
| 65 | 6.75%, 07/01/2018 | 75 | |||||
| Walt Disney Co. | |||||||
| 25 | 5.63%, 09/15/2016 | 29 | |||||
| 323 | |||||||
| Beverage and Tobacco Product Manufacturing - 0.3% | |||||||
| Altria Group, Inc. | |||||||
| 25 | 9.70%, 11/10/2018 | 33 | |||||
| Anheuser-Busch InBev N.V. | |||||||
| 60 | 5.38%, 01/15/2020 | 66 | |||||
| PepsiCo, Inc. | |||||||
| 55 | 3.13%, 11/01/2020 | 52 | |||||
| Philip Morris International, Inc. | |||||||
| 25 | 4.50%, 03/26/2020 | 26 | |||||
| 177 | |||||||
| Chemical Manufacturing - 0.1% | |||||||
| Dow Chemical Co. | |||||||
| 45 | 8.55%, 05/15/2019 | 58 | |||||
| E.I. DuPont de Nemours & Co. | |||||||
| 25 | 3.63%, 01/15/2021 | 24 | |||||
| 82 | |||||||
| Computer and Electronic Product Manufacturing - 0.2% | |||||||
| Cisco Systems, Inc. | |||||||
| 70 | 5.50%, 02/22/2016 | 79 | |||||
| Lockheed Martin Corp. | |||||||
| 25 | 4.25%, 11/15/2019 | 26 | |||||
| 105 | |||||||
| Couriers and Messengers - 0.1% | |||||||
| United Parcel Service, Inc. | |||||||
| 45 | 3.88%, 04/01/2014 | 49 | |||||
| Electrical Equipment, Appliance Manufacturing - 0.1% | |||||||
| General Electric Co. | |||||||
| 25 | 5.25%, 12/06/2017 | 28 | |||||
| Finance and Insurance - 4.4% | |||||||
| All State Corp. | |||||||
| 35 | 5.00%, 08/15/2014 | 38 | |||||
| American Express Credit Corp. | |||||||
| 75 | 2.75%, 09/15/2015 | 75 | |||||
| American International Group, Inc. | |||||||
| 25 | 6.40%, 12/15/2020 | 27 | |||||
| Bank of America Corp. | |||||||
| 160 | 5.65%, 05/01/2018 | 169 | |||||
| Barclays Bank plc | |||||||
| 100 | 5.20%, 07/10/2014 | 108 | |||||
| Berkshire Hathaway Finance Corp. | |||||||
| 50 | 5.40%, 05/15/2018 | 55 | |||||
| Blackrock, Inc. | |||||||
| 25 | 5.00%, 12/10/2019 | 27 | |||||
| Caterpillar Financial Services Corp. | |||||||
| 75 | 6.13%, 02/17/2014 | 84 | |||||
| Citigroup, Inc. | |||||||
| 75 | 5.00%, 09/15/2014 | 79 | |||||
| 75 | 5.38%, 08/09/2020 | 78 | |||||
| Credit Suisse New York | |||||||
| 75 | 6.00%, 02/15/2018 | 81 | |||||
| European Investment Bank | |||||||
| 200 | 3.13%, 06/04/2014 | 212 | |||||
| General Electric Capital Corp. | |||||||
| 125 | 4.38%, 09/16/2020 | 124 | |||||
| Goldman Sachs Group, Inc. | |||||||
| 120 | 5.38%, 03/15/2020 | 124 | |||||
| HSBC Finance Corp. | |||||||
| 50 | 4.75%, 07/15/2013 | 53 | |||||
| HSBC Holdings plc | |||||||
| 50 | 5.10%, 04/05/2021 | 51 | |||||
| Inter-American Development Bank | |||||||
| 75 | 2.25%, 07/15/2015 | 77 | |||||
| John Deere Capital Corp. | |||||||
| 35 | 2.80%, 09/18/2017 | 35 | |||||
| JP Morgan Chase & Co. | |||||||
| 75 | 5.13%, 09/15/2014 | 81 | |||||
| 100 | 6.30%, 04/23/2019 | 113 | |||||
| Kreditanstalt fuer Wiederaufbau | |||||||
| 200 | 1.25%, 10/26/2015 | 196 | |||||
| Landwirtschaftliche Rentenbank | |||||||
| 25 | 3.13%, 07/15/2015 | 26 | |||||
| MetLife, Inc. | |||||||
| 50 | 7.72%, 02/15/2019 | 60 | |||||
| Morgan Stanley | |||||||
| 50 | 4.75%, 04/01/2014 | 52 | |||||
| 100 | 5.45%, 01/09/2017 | 106 | |||||
| Prudential Financial, Inc. | |||||||
| 150 | 2.75%, 01/14/2013 | 153 | |||||
| Royal Bank of Scotland plc | |||||||
| 75 | 3.95%, 09/21/2015 | 75 | |||||
| Simon Property Group L.P. | |||||||
| 50 | 5.65%, 02/01/2020 | 54 | |||||
| Toyota Motor Credit Corp. | |||||||
| 40 | 3.20%, 06/17/2015 | 42 | |||||
| Travelers Cos., Inc. | |||||||
| 25 | 3.90%, 11/01/2020 | 24 | |||||
| UnitedHealth Group, Inc. | |||||||
| 25 | 6.88%, 02/15/2038 | 29 | |||||
| Wellpoint, Inc. | |||||||
| 25 | 5.25%, 01/15/2016 | 28 | |||||
| Wells Fargo & Co. | |||||||
| 90 | 4.60%, 04/01/2021 | 90 | |||||
| 2,626 | |||||||
| Food Manufacturing - 0.1% | |||||||
| Kraft Foods, Inc. | |||||||
| 50 | 5.38%, 02/10/2020 | 55 | |||||
| Food Services - 0.0% | |||||||
| McDonald's Corp. | |||||||
| 25 | 5.35%, 03/01/2018 | 28 | |||||
The accompanying notes are an integral part of these financial statements.
| Hartford Portfolio Diversifier HLS Fund |
| Schedule of Investments – (continued) |
| June 30, 2011 (Unaudited) |
| (000’s Omitted) |
| Shares or Principal Amount | Market Value ╪ | ||||||
| CORPORATE BONDS: INVESTMENT GRADE - 10.9% - (continued) | |||||||
| Foreign Governments - 1.1% | |||||||
| Brazil (Republic of) | |||||||
| $ | 125 | 5.88%, 01/15/2019 | $ | 145 | |||
| Italy (Republic of) | |||||||
| 125 | 3.13%, 01/26/2015 | 127 | |||||
| Manitoba (Province of) | |||||||
| 75 | 2.63%, 07/15/2015 | 78 | |||||
| Ontario (Province of) | |||||||
| 85 | 4.40%, 04/14/2020 | 90 | |||||
| Peru (Republic of) | |||||||
| 30 | 7.13%, 03/30/2019 | 36 | |||||
| Quebec (Province of) | |||||||
| 60 | 3.50%, 07/29/2020 | 59 | |||||
| United Mexican States | |||||||
| 100 | 5.13%, 01/15/2020 | 108 | |||||
| 643 | |||||||
| Health Care and Social Assistance - 0.5% | |||||||
| Abbott Laboratories | |||||||
| 50 | 5.13%, 04/01/2019 | 55 | |||||
| Amgen, Inc. | |||||||
| 25 | 5.75%, 03/15/2040 | 26 | |||||
| Baxter International, Inc. | |||||||
| 30 | 4.50%, 08/15/2019 | 32 | |||||
| Covidien International | |||||||
| 25 | 6.00%, 10/15/2017 | 29 | |||||
| Glaxosmithkline Capital, Inc. | |||||||
| 25 | 5.65%, 05/15/2018 | 28 | |||||
| Medtronic, Inc. | |||||||
| 25 | 4.45%, 03/15/2020 | 26 | |||||
| Merck & Co., Inc. | |||||||
| 45 | 3.88%, 01/15/2021 | 45 | |||||
| Pfizer, Inc. | |||||||
| 65 | 6.20%, 03/15/2019 | 76 | |||||
| 317 | |||||||
| Information - 0.8% | |||||||
| AT&T, Inc. | |||||||
| 25 | 5.35%, 09/01/2040 | 24 | |||||
| 75 | 5.80%, 02/15/2019 | 84 | |||||
| Cellco Partnership - Verizon Wireless Capital | |||||||
| 50 | 5.55%, 02/01/2014 | 55 | |||||
| Microsoft Corp. | |||||||
| 60 | 1.63%, 09/25/2015 | 59 | |||||
| Oracle Corp. | |||||||
| 60 | 5.75%, 04/15/2018 | 69 | |||||
| Telefonica Emisiones SAU | |||||||
| 35 | 5.46%, 02/16/2021 | 36 | |||||
| Verizon Communications, Inc. | |||||||
| 25 | 6.00%, 04/01/2041 | 26 | |||||
| 75 | 6.35%, 04/01/2019 | 87 | |||||
| Vodafone Group plc | |||||||
| 40 | 5.45%, 06/10/2019 | 45 | |||||
| 485 | |||||||
| Mining - 0.1% | |||||||
| Rio Tinto Finance USA Ltd. | |||||||
| 40 | 6.50%, 07/15/2018 | 47 | |||||
| Vale Overseas Ltd. | |||||||
| 25 | 6.88%, 11/10/2039 | 27 | |||||
| 74 | |||||||
| Miscellaneous Manufacturing - 0.2% | |||||||
| Boeing Co. | |||||||
| 40 | 4.88%, 02/15/2020 | 43 | |||||
| Honeywell International, Inc. | |||||||
| 25 | 4.25%, 03/01/2021 | 26 | |||||
| United Technologies Corp. | |||||||
| 25 | 4.50%, 04/15/2020 | 26 | |||||
| 95 | |||||||
| Paper Manufacturing - 0.1% | |||||||
| International Paper Co. | |||||||
| 25 | 7.50%, 08/15/2021 | 29 | |||||
| Petroleum and Coal Products Manufacturing - 0.7% | |||||||
| Apache Corp. | |||||||
| 25 | 5.10%, 09/01/2040 | 24 | |||||
| Canadian Natural Resources Ltd. | |||||||
| 30 | 5.70%, 05/15/2017 | 34 | |||||
| ConocoPhillips | |||||||
| 35 | 6.50%, 02/01/2039 | 41 | |||||
| EnCana Corp. | |||||||
| 25 | 6.50%, 02/01/2038 | 27 | |||||
| Pemex Project Funding Master Trust | |||||||
| 50 | 5.75%, 03/01/2018 | 55 | |||||
| Petrobras International Finance Co. | |||||||
| 25 | 6.75%, 01/27/2041 | 27 | |||||
| Sempra Energy | |||||||
| 35 | 6.50%, 06/01/2016 | 41 | |||||
| Shell International Finance B.V. | |||||||
| 50 | 4.30%, 09/22/2019 | 52 | |||||
| Suncor Energy, Inc. | |||||||
| 25 | 6.50%, 06/15/2038 | 27 | |||||
| Transocean, Inc. | |||||||
| 25 | 6.50%, 11/15/2020 | 28 | |||||
| Valero Energy Corp. | |||||||
| 25 | 6.13%, 02/01/2020 | 27 | |||||
| Weatherford International Ltd. | |||||||
| 30 | 5.13%, 09/15/2020 | 31 | |||||
| Williams Partners L.P. | |||||||
| 25 | 5.25%, 03/15/2020 | 26 | |||||
| 440 | |||||||
| Pipeline Transportation - 0.2% | |||||||
| Enterprise Products Operating L.P. | |||||||
| 30 | 5.20%, 09/01/2020 | 32 | |||||
| Kinder Morgan Energy Partners L.P. | |||||||
| 25 | 6.38%, 03/01/2041 | 25 | |||||
| TransCanada Pipelines Ltd. | |||||||
| 35 | 3.80%, 10/01/2020 | 35 | |||||
| 92 | |||||||
| Primary Metal Manufacturing - 0.1% | |||||||
| Alcoa, Inc. | |||||||
| 25 | 6.15%, 08/15/2020 | 27 | |||||
| ArcelorMittal | |||||||
| 35 | 5.50%, 03/01/2021 | 35 | |||||
| 62 | |||||||
| Professional, Scientific and Technical Services - 0.0% | |||||||
| IBM Corp. | |||||||
| 25 | 5.60%, 11/30/2039 | 26 | |||||
The accompanying notes are an integral part of these financial statements.
| Shares or Principal Amount | Market Value ╪ | ||||||
| CORPORATE BONDS: INVESTMENT GRADE - 10.9% - (continued) | |||||||
| Public Administration - 0.2% | |||||||
International Bank for Reconstruction & Development | |||||||
| $ | 100 | 1.13%, 08/25/2014 | $ | 101 | |||
| Waste Management, Inc. | |||||||
| 25 | 4.75%, 06/30/2020 | 26 | |||||
| 127 | |||||||
| Rail Transportation - 0.1% | |||||||
| Burlington Northern Santa Fe Corp. | |||||||
| 25 | 4.70%, 10/01/2019 | 27 | |||||
| Norfolk Southern Corp. | |||||||
| 25 | 7.05%, 05/01/2037 | 30 | |||||
| 57 | |||||||
| Retail Trade - 0.4% | |||||||
| Home Depot, Inc. | |||||||
| 30 | 4.40%, 04/01/2021 | 30 | |||||
| Kroger Co. | |||||||
| 40 | 3.90%, 10/01/2015 | 42 | |||||
| Target Corp. | |||||||
| 40 | 3.88%, 07/15/2020 | 40 | |||||
| Wal-Mart Stores, Inc. | |||||||
| 100 | 3.25%, 10/25/2020 | 95 | |||||
| 207 | |||||||
Soap, Cleaning Compound and Toilet Manufacturing - 0.1% | |||||||
| Procter & Gamble Co. | |||||||
| 50 | 4.70%, 02/15/2019 | 55 | |||||
| Utilities - 0.5% | |||||||
| Dominion Resources, Inc. | |||||||
| 50 | 4.45%, 03/15/2021 | 51 | |||||
| Duke Energy Corp. | |||||||
| 25 | 5.30%, 02/15/2040 | 25 | |||||
| Exelon Generation Co. LLC | |||||||
| 30 | 4.00%, 10/01/2020 | 28 | |||||
| Florida Power & Light Co. | |||||||
| 25 | 5.69%, 03/01/2040 | 27 | |||||
| Georgia Power Co. | |||||||
| 25 | 4.75%, 09/01/2040 | 23 | |||||
| MidAmerican Energy Holdings Co. | |||||||
| 30 | 6.13%, 04/01/2036 | 32 | |||||
| Pacific Gas & Electric Co. | |||||||
| 25 | 6.05%, 03/01/2034 | 27 | |||||
| Progress Energy, Inc. | |||||||
| 25 | 4.40%, 01/15/2021 | 25 | |||||
| PSEG Power LLC | |||||||
| 25 | 5.13%, 04/15/2020 | 26 | |||||
| Southern California Edison Co. | |||||||
| 25 | 4.50%, 09/01/2040 | 23 | |||||
| 287 | |||||||
| Total corporate bonds: investment grade | |||||||
| (cost $6,529) | $ | 6,469 | |||||
| MUNICIPAL BONDS - 0.2% | |||||||
| General Obligations - 0.2% | |||||||
| California State, | |||||||
| $ | 30 | 7.60%, 11/01/2040 | $ | 35 | |||
| Mississippi State, | |||||||
| 25 | 5.25%, 11/01/2034 | 25 | |||||
| State of Illinois, Taxable Pension, | |||||||
| 30 | 5.10%, 06/01/2033 | 25 | |||||
| 85 | |||||||
| Higher Education (Univ., Dorms, etc.) - 0.0% | |||||||
| University of Texas Fin Dept, | |||||||
| 25 | 4.79%, 08/15/2046 | 24 | |||||
| Total municipal bonds | |||||||
| (cost $112) | $ | 109 | |||||
| U.S. GOVERNMENT AGENCIES - 16.4% | |||||||
| Federal Home Loan Mortgage Corporation - 5.5% | |||||||
| $ | 200 | 1.63%, 04/15/2013 | $ | 204 | |||
| 150 | 2.13%, 09/21/2012 | 153 | |||||
| 70 | 2.88%, 02/09/2015 | 74 | |||||
| 160 | 3.50%, 04/01/2026 | 163 | |||||
| 20 | 3.75%, 03/27/2019 | 21 | |||||
| 378 | 4.00%, 03/01/2025 - 05/01/2041 ☼ | 388 | |||||
| 849 | 4.50%, 10/01/2039 - 10/01/2040 | 879 | |||||
| 523 | 5.00%, 11/01/2033 - 07/15/2038 ☼ | 558 | |||||
| 110 | 5.13%, 10/18/2016 | 126 | |||||
| 393 | 5.50%, 05/01/2038 | 426 | |||||
| 232 | 6.00%, 06/01/2036 | 256 | |||||
| 3,248 | |||||||
| Federal National Mortgage Association - 7.8% | |||||||
| 70 | 0.50%, 10/30/2012 | 70 | |||||
| 70 | 1.00%, 09/23/2013 | 71 | |||||
| 110 | 1.63%, 10/26/2015 | 110 | |||||
| 200 | 2.63%, 11/20/2014 | 210 | |||||
| 70 | 2.75%, 03/13/2014 | 74 | |||||
| 209 | 3.50%, 05/01/2026 - 07/15/2041 ☼ | 209 | |||||
| 852 | 4.00%, 09/01/2025 - 09/01/2040 | 870 | |||||
| 100 | 4.38%, 09/15/2012 | 105 | |||||
| 749 | 4.50%, 01/01/2039 | 777 | |||||
| 697 | 5.00%, 11/01/2033 - 07/01/2035 | 745 | |||||
| 552 | 5.50%, 06/01/2038 - 07/15/2040 ☼ | 597 | |||||
| 437 | 6.00%, 07/01/2037 | 480 | |||||
| 272 | 6.50%, 06/01/2039 | 309 | |||||
| 20 | 6.63%, 11/15/2030 | 25 | |||||
| 4,652 | |||||||
| Government National Mortgage Association - 3.1% | |||||||
| 230 | 4.00%, 12/15/2040 | 235 | |||||
| 515 | 4.50%, 09/15/2039 - 07/15/2041 ☼ | 546 | |||||
| 607 | 5.00%, 09/15/2039 - 02/20/2041 | 660 | |||||
| 345 | 5.50%, 07/15/2038 | 380 | |||||
| 1,821 | |||||||
| Total U.S. government agencies | |||||||
| (cost $9,770) | $ | 9,721 | |||||
| U.S. GOVERNMENT SECURITIES - 15.8% | |||||||
| Other Direct Federal Obligations - 0.8% | |||||||
| Federal Farm Credit Bank - 0.0% | |||||||
| $ | 20 | 3.88%, 10/07/2013 | $ | 21 | |||
The accompanying notes are an integral part of these financial statements.
| Hartford Portfolio Diversifier HLS Fund |
| Schedule of Investments – (continued) |
| June 30, 2011 (Unaudited) |
| (000’s Omitted) |
| Shares or Principal Amount | Market Value ╪ | ||||||||||
| U.S. GOVERNMENT SECURITIES - 15.8% - (continued) | |||||||||||
| Other Direct Federal Obligations - 0.8% - (continued) | |||||||||||
| Federal Home Loan Bank - 0.7% | |||||||||||
| $ | 150 | 1.75%, 08/22/2012 | $ | 152 | |||||||
| 110 | 1.88%, 06/21/2013 | 113 | |||||||||
| 70 | 4.75%, 12/16/2016 | 80 | |||||||||
| 40 | 5.00%, 11/17/2017 | 46 | |||||||||
| 391 | |||||||||||
| Other Direct Federal Obligations - 0.1% | |||||||||||
| 40 | 6.75%, 11/01/2025 | 51 | |||||||||
| 463 | |||||||||||
| U.S. Treasury Securities - 15.0% | |||||||||||
| U.S. Treasury Bonds - 2.8% | |||||||||||
| 875 | 4.25%, 11/15/2040 | 855 | |||||||||
| 679 | 5.38%, 02/15/2031 | 796 | |||||||||
| 1,651 | |||||||||||
| U.S. Treasury Notes - 12.2% | |||||||||||
| 1,435 | 0.63%, 06/30/2012 | 1,440 | |||||||||
| 2,023 | 1.00%, 07/15/2013 | 2,044 | |||||||||
| 970 | 1.25%, 08/31/2015 ‡ | 966 | |||||||||
| 175 | 1.50%, 07/15/2012 | 177 | |||||||||
| 584 | 1.75%, 05/31/2016 | 585 | |||||||||
| 955 | 1.88%, 09/30/2017 | 934 | |||||||||
| 990 | 2.38%, 08/31/2014 | 1,036 | |||||||||
| 60 | 3.13%, 05/15/2021 | 60 | |||||||||
| 7,242 | |||||||||||
| 8,893 | |||||||||||
| Total U.S. government securities | |||||||||||
| (cost $9,411) | $ | 9,356 | |||||||||
| Contracts | Market Value ╪ | ||||||||||
| PUT OPTIONS PURCHASED - 21.8% | |||||||||||
| Index Option Contract - 21.8% | |||||||||||
| S&P 500 Option | |||||||||||
| 61 | Expiration: 06/06/2016, Exercise Price: | ||||||||||
$170.00 Ø | $ | 11,422 | |||||||||
| 15 | Expiration: 06/06/2012, Exercise Price: | ||||||||||
| $300.00 | 1,489 | ||||||||||
| 12,911 | |||||||||||
| Total put options purchased | |||||||||||
| (cost $14,811) | $ | 12,911 | |||||||||
| Total long-term investments | |||||||||||
| (cost $54,582) | $ | 52,875 | |||||||||
| Shares or Principal Amount | Market Value ╪ | ||||||||||
| SHORT-TERM INVESTMENTS - 24.0% | |||||||||||
| Investment Pools and Funds - 0.0% | |||||||||||
| JP Morgan U.S. Government Money | |||||||||||
| 2 | Market Fund | $ | 2 | ||||||||
| Repurchase Agreements - 2.4% | |||||||||||
| BNP Paribas Securities Corp. TriParty Joint | |||||||||||
| Repurchase Agreement (maturing on | |||||||||||
| 07/01/2011 in the amount of $312, | |||||||||||
| collateralized by U.S. Treasury Bond | |||||||||||
| 5.25%, 2029, value of $318) | |||||||||||
| $ | 312 | 0.01%, 06/30/2011 | 312 | ||||||||
| RBC Capital Markets Corp. TriParty Joint | |||||||||||
| Repurchase Agreement (maturing on | |||||||||||
| 07/01/2011 in the amount of $341, | |||||||||||
| collateralized by U.S. Treasury Bill 0.02% - | |||||||||||
| 4.50%, 2011 - 2012, U.S. Treasury Bond | |||||||||||
| 4.25% - 7.13%, 2023 - 2039, U.S. Treasury | |||||||||||
| Note 0.38% - 10.63%, 2012 - 2021, value | |||||||||||
| of $348) | |||||||||||
| 341 | 0.01%, 06/30/2011 | 341 | |||||||||
| RBS Greenwich Capital Markets TriParty | |||||||||||
| Joint Repurchase Agreement (maturing on | |||||||||||
| 07/01/2011 in the amount of $295, | |||||||||||
| collateralized by U.S. Treasury Bond | |||||||||||
| 4.50%, 2038, U.S. Treasury Note 4.00%, | |||||||||||
| 2015, value of $301) | |||||||||||
| 295 | 0.01%, 06/30/2011 | 295 | |||||||||
| UBS Securities, Inc. TriParty Joint | |||||||||||
| Repurchase Agreement (maturing on | |||||||||||
| 07/01/2011 in the amount of $456, | |||||||||||
| collateralized by U.S. Treasury Bond 2.00% | |||||||||||
| -3.63%, 2026 - 2028, value of $465) | |||||||||||
| 455 | 0.01%, 06/30/2011 | 455 | |||||||||
| 1,403 | |||||||||||
| U.S. Treasury Bills - 21.6% | |||||||||||
| 12,796 | 0.01%, 8/4/2011 □○ | 12,795 | |||||||||
| Total short-term investments | |||||||||||
| (cost $14,200) | $ | 14,200 | |||||||||
| Total investments | |||||||||||
(cost $68,782) ▲ | 113.2 | % | $ | 67,075 | |||||||
| Other assets and liabilities | (13.2 | )% | (7,796 | ) | |||||||
| Total net assets | 100.0 | % | $ | 59,279 | |||||||
The accompanying notes are an integral part of these financial statements.
| Note: | Percentage of investments as shown is the ratio of the total market value to total net assets. Market value of investments in foreign securities represents 2.7% of total net assets at June 30, 2011. |
| ▲ | At June 30, 2011, the cost of securities for federal income tax purposes was $68,782 and the aggregate gross unrealized appreciation and depreciation based on that cost were: |
| Unrealized Appreciation | $ | 417 | ||
| Unrealized Depreciation | (2,124 | ) | ||
| Net Unrealized Depreciation | $ | (1,707 | ) |
| ● | Currently non-income producing. |
| Δ | Variable rate securities; the rate reported is the coupon rate in effect at June 30, 2011. |
| ○ | The interest rate disclosed for these securities represents the effective yield on the date of the acquisition. |
| ■ | Securities issued within terms of a private placement memorandum, exempt from registration under Rule 144A under the Securities Act of 1933, as amended, and may be sold only to qualified institutional buyers. Unless otherwise indicated, these issues are determined to be liquid. At June 30, 2011, the aggregate value of these securities was $30, which represents 0.05% of total net assets. |
| ☼ | The cost of securities purchased on a when-issued, delayed delivery or delayed draw basis at June 30, 2011 was $280. |
| ‡ | This security, or a portion of this security, has been segregated to cover funding requirements on investment transactions settling in the future. |
| □ | Security pledged as initial margin deposit for open futures contracts at June 30, 2011 as follows: |
| Unrealized | |||||||||||||||||||
| Number of | Expiration | Notional | Appreciation/ | ||||||||||||||||
| Description | Contracts* | Position | Date | Market Value ╪ | Amount | (Depreciation) | |||||||||||||
| S&P 500 E-Mini | 292 | Short | 09/16/2011 | $ | 19,206 | $ | 18,566 | $ | (640 | ) | |||||||||
| * | The number of contracts does not omit 000's. |
| Ø | Securities valued at $6,564 collateralized the written put options in the table below. At June 30, 2011, the maximum delivery obligation of the written put options is $55,370. |
| Unrealized | |||||||||||||||||||||||
| Exercise Price/ | Expiration | Number of | Market | Premiums | Appreciation | ||||||||||||||||||
| Issuer | Option Type | Rate | Date | Contracts* | Value ╪ | Received | (Depreciation) | ||||||||||||||||
| S&P 500 Option | Index | $ | 910.00 | 06/06/2016 | 60,846 | $ | 6,564 | $ | 7,537 | $ | 973 | ||||||||||||
| $ | 6,564 | $ | 7,537 | $ | 973 | ||||||||||||||||||
| * | The number of contracts does not omit 000's. |
| ╪ | See Significant Accounting Policies of accompanying Notes to Financial Statements regarding valuation of securities. |
The accompanying notes are an integral part of these financial statements.
| Hartford Portfolio Diversifier HLS Fund |
| Schedule of Investments |
| June 30, 2011 (Unaudited) |
| (000’s Omitted) |
| Diversification by Industry | ||||
| as of June 30, 2011 | ||||
| Percentage of | ||||
| Industry (Sector) | Net Assets | |||
| Equity Securities | ||||
| Automobiles & Components (Consumer Discretionary) | 0.2 | % | ||
| Banks (Financials) | 0.6 | |||
| Capital Goods (Industrials) | 2.0 | |||
| Commercial & Professional Services (Industrials) | 0.1 | |||
| Consumer Durables & Apparel (Consumer Discretionary) | 0.2 | |||
| Consumer Services (Consumer Discretionary) | 0.4 | |||
| Diversified Financials (Financials) | 1.6 | |||
| Energy (Energy) | 2.9 | |||
| Food & Staples Retailing (Consumer Staples) | 0.5 | |||
| Food, Beverage & Tobacco (Consumer Staples) | 1.4 | |||
| Health Care Equipment & Services (Health Care) | 1.0 | |||
| Household & Personal Products (Consumer Staples) | 0.5 | |||
| Index Option Contract (Index Option Contract) | 21.8 | |||
| Insurance (Financials) | 0.9 | |||
| Materials (Materials) | 0.8 | |||
| Media (Consumer Discretionary) | 0.8 | |||
| Other Investment Pools and Funds (Financials) | 0.3 | |||
| Pharmaceuticals, Biotechnology & Life Sciences (Health Care) | 1.7 | |||
| Real Estate (Financials) | 0.4 | |||
| Retailing (Consumer Discretionary) | 0.8 | |||
| Semiconductors & Semiconductor Equipment (Information Technology) | 0.6 | |||
| Software & Services (Information Technology) | 2.0 | |||
| Technology Hardware & Equipment (Information Technology) | 1.6 | |||
| Telecommunication Services (Services) | 0.7 | |||
| Transportation (Industrials) | 0.5 | |||
| Utilities (Utilities) | 0.8 | |||
| Total | 45.1 | % | ||
| Percentage of Net | ||||
| Industry (Sector) | Assets | |||
| Fixed Income Securities | ||||
| Arts, Entertainment and Recreation (Services) | 0.5 | % | ||
| Beverage and Tobacco Product Manufacturing (Consumer Staples) | 0.3 | |||
| Chemical Manufacturing (Basic Materials) | 0.1 | |||
| Computer and Electronic Product Manufacturing (Technology) | 0.2 | |||
| Couriers and Messengers (Services) | 0.1 | |||
| Electrical Equipment, Appliance Manufacturing (Technology) | 0.1 | |||
| Finance and Insurance (Finance) | 5.2 | |||
| Food Manufacturing (Consumer Staples) | 0.1 | |||
| Food Services (Consumer Cyclical) | 0.0 | |||
| Foreign Governments (Foreign Governments) | 1.1 | |||
| General Obligations (General Obligations) | 0.2 | |||
| Health Care and Social Assistance (Health Care) | 0.5 | |||
| Higher Education (Univ., Dorms, etc.) (Higher Education (Univ., Dorms, etc.)) | 0.0 | |||
| Information (Technology) | 0.8 | |||
| Mining (Basic Materials) | 0.1 | |||
| Miscellaneous Manufacturing (Capital Goods) | 0.2 | |||
| Paper Manufacturing (Basic Materials) | 0.1 | |||
| Petroleum and Coal Products Manufacturing (Energy) | 0.7 | |||
| Pipeline Transportation (Utilities) | 0.2 | |||
| Primary Metal Manufacturing (Basic Materials) | 0.1 | |||
| Professional, Scientific and Technical Services (Services) | 0.0 | |||
| Public Administration (Services) | 0.2 | |||
| Rail Transportation (Transportation) | 0.1 | |||
| Retail Trade (Consumer Cyclical) | 0.4 | |||
| Soap, Cleaning Compound and Toilet Manufacturing (Consumer Staples) | 0.1 | |||
| U.S. Government Agencies (U.S. Government Agencies) | 16.4 | |||
| U.S. Government Securities (U.S. Government Securities) | 15.8 | |||
| Utilities (Utilities) | 0.5 | |||
| Total | 44.1 | % | ||
| Short-Term Investments | 24.0 | % | ||
| Other Assets and Liabilities | (13.2 | ) | ||
| Total | 100.0 | % | ||
The accompanying notes are an integral part of these financial statements.
| Investment Valuation Hierarchy Level Summary |
| June 30, 2011 (Unaudited) |
| (000’s Omitted) |
| Total | Level 1 ♦ | Level 2 ♦ | Level 3 | |||||||||||||
| Assets: | ||||||||||||||||
| Asset & Commercial Mortgage Backed Securities | $ | 472 | $ | – | $ | 472 | $ | – | ||||||||
Common Stocks ‡ | 13,654 | 13,654 | – | – | ||||||||||||
| Corporate Bonds: Investment Grade | 6,469 | – | 6,469 | – | ||||||||||||
| Exchange Traded Funds | 183 | 183 | – | – | ||||||||||||
| Municipal Bonds | 109 | – | 109 | – | ||||||||||||
| Put Options Purchased | 12,911 | 12,911 | – | – | ||||||||||||
| U.S. Government Agencies | 9,721 | – | 9,721 | – | ||||||||||||
| U.S. Government Securities | 9,356 | 60 | 9,296 | – | ||||||||||||
| Short-Term Investments | 14,200 | 2 | 14,198 | – | ||||||||||||
| Total | $ | 67,075 | $ | 26,810 | $ | 40,265 | $ | – | ||||||||
| Written Options * | 973 | 973 | – | – | ||||||||||||
| Total | $ | 973 | $ | 973 | $ | – | $ | – | ||||||||
| Liabilities: | ||||||||||||||||
| Futures * | 640 | 640 | – | – | ||||||||||||
| Total | $ | 640 | $ | 640 | $ | – | $ | – | ||||||||
| ♦ | For the period ended June 30, 2011, there were no significant transfers between Level 1 and Level 2. |
| ‡ | The Fund has all or primarily all of the equity securities categorized in a particular level. Refer to the Schedule of Investments for further industry breakout. |
| * | Derivative instruments not reflected in the Schedule of Investments are valued at the unrealized appreciation/depreciation on the investments. |
The accompanying notes are an integral part of these financial statements.
| Statement of Assets and Liabilities |
| June 30, 2011 (Unaudited) |
| (000’s Omitted) |
| Assets: | ||||
| Investments in securities, at market value (cost $68,782) | $ | 67,075 | ||
| Receivables: | ||||
| Investment securities sold | 127 | |||
| Fund shares sold | 47 | |||
| Dividends and interest | 187 | |||
| Variation margin | 2 | |||
| Other assets | 2 | |||
| Total assets | 67,440 | |||
| Liabilities: | ||||
| Bank overdraft — U.S. Dollars | — | |||
| Payables: | ||||
| Investment securities purchased | 1,423 | |||
| Fund shares redeemed | — | |||
| Variation margin | �� | 165 | ||
| Investment management fees | 6 | |||
| Distribution fees | 2 | |||
| Accrued expenses | 1 | |||
| Written options (proceeds $7,537) | 6,564 | |||
| Total liabilities | 8,161 | |||
| Net assets | $ | 59,279 | ||
| Summary of Net Assets: | ||||
| Capital stock and paid-in-capital | $ | 60,520 | ||
| Accumulated undistributed net investment income | 25 | |||
| Accumulated net realized gain on investments | 108 | |||
| Unrealized depreciation of investments | (1,374 | ) | ||
| Net assets | $ | 59,279 | ||
| Shares authorized | 1,000,000 | |||
| Par value | $ | 0.001 | ||
Class IB: Net asset value per share | $ | 9.79 | ||
| Shares outstanding | 6,052 | |||
| Net assets | $ | 59,279 | ||
The accompanying notes are an integral part of these financial statements.
| Statement of Operations |
| For the Period June 6, 2011 (commencement of operations) through June 30, 2011 (Unaudited) |
| (000’s Omitted) |
| Investment Income: | ||||
| Dividends | $ | 18 | ||
| Interest | 40 | |||
| Total investment income, net | 58 | |||
| Expenses: | ||||
| Investment management fees | 24 | |||
| Distribution fees - Class IB | 10 | |||
| Custodian fees | — | |||
| Accounting services fees | 1 | |||
| Board of Directors' fees | — | |||
| Audit fees | — | |||
| Other expenses | — | |||
| Total expenses (before waivers) | 35 | |||
| Expense waivers | (2 | ) | ||
| Total waivers | (2 | ) | ||
| Total expenses, net | 33 | |||
| Net investment income | 25 | |||
| Net Realized Gain on Investments and Other Financial Instruments: | ||||
| Net realized loss on investments | (6 | ) | ||
| Net realized gain on futures | 114 | |||
| Net Realized Gain on Investments and Other Financial Instruments | 108 | |||
| Net Changes in Unrealized Depreciation of Investments and Other Financial Instruments: | ||||
| Net unrealized depreciation of investments | (1,707 | ) | ||
| Net unrealized depreciation of futures | (640 | ) | ||
| Net unrealized appreciation of written options | 973 | |||
| Net Changes in Unrealized Depreciation of Investments and Other Financial Instruments | (1,374 | ) | ||
| Net Loss on Investments and Other Financial Instruments | (1,266 | ) | ||
| Net Decrease in Net Assets Resulting from Operations | $ | (1,241 | ) | |
The accompanying notes are an integral part of these financial statements.
| Statement of Changes in Net Assets |
| (000’s Omitted) |
| For the Period | ||||
| June 6, 2011* | ||||
| through | ||||
| June 30, 2011 | ||||
| (Unaudited) | ||||
| Operations: | ||||
| Net investment income | $ | 25 | ||
| Net realized gain on investments and other financial instruments | 108 | |||
| Net unrealized depreciation of investments and other financial instruments | (1,374 | ) | ||
| Net Decrease In Net Assets Resulting From Operations | (1,241 | ) | ||
| Capital Share Transactions: | ||||
| Class IB | ||||
| Sold | 60,520 | |||
| Redeemed | — | |||
| Total capital share transactions | 60,520 | |||
| Net increase from capital share transactions | 60,520 | |||
| Net Increase In Net Assets | 59,279 | |||
| Net Assets: | ||||
| Beginning of period | — | |||
| End of period | $ | 59,279 | ||
| Accumulated undistributed (distribution in excess of) net investment income | $ | 25 | ||
| Shares: | ||||
| Class IB | ||||
| Sold | 6,052 | |||
| Redeemed | — | |||
| Total share activity | 6,052 | |||
* Commencement of operations
The accompanying notes are an integral part of these financial statements.
| Notes to Financial Statements |
| June 30, 2011 (Unaudited) |
| (000’s Omitted) |
| 1. | Organization: |
Hartford Portfolio Diversifier HLS Fund (the “Fund”) serves as an underlying investment option for certain variable annuity separate accounts of Hartford Life Insurance Company (“HLIC”) and its affiliates. The Fund’s shares are available only to separate accounts of HLIC and its affiliates as a required investment option for variable annuity contracts whose holders have selected a guaranteed benefit rider subject to a allocation requiring investment in the Fund.
Hartford Series Fund, Inc. (the “Company”) is an open-end registered management investment company comprised of thirty portfolios. Financial Statements for the Fund, a series of the Company, are included in this report.
The Company is organized under the laws of the State of Maryland and is registered with the Securities and Exchange Commission (“SEC”) under the Investment Company Act of 1940, as amended (“1940 Act”). The Fund is a diversified open-end management investment company.
Class IB shares of the Fund are offered at the per share net asset value (“NAV”) without a sales charge and are subject to distribution and service fees charged pursuant to a Distribution Plan adopted in accordance with Rule 12b-1 under the 1940 Act.
The investment objective of the Fund is to seek to produce investment performance that mitigates against significant declines in the aggregate value of investment allocations to equity mutual funds under certain variable annuity contracts issued by HLIC and its affiliates, while also preserving the potential for modest appreciation in the Fund’s net asset value when markets are appreciating.
The Fund commenced operations on June 6, 2011.
The portfolio managers for the Fund are as follows:
Paul Bukowski, CFA; Senior Vice President and Head of Quantitative Equities; Hartford Investment Management Company James Ong, CFA; Vice President; Hartford Investment Management Company
| 2. | Significant Accounting Policies: |
The following is a summary of significant accounting policies of the Fund in the preparation of its financial statements, which are in accordance with the United States Generally Accepted Accounting Principles (“U.S. GAAP”). The preparation of financial statements in accordance with U.S. GAAP may require management to make estimates and assumptions that affect the reported amounts of assets and liabilities and disclosure of contingent assets and liabilities at the date of the financial statements and the reported amounts of increases and decreases in net assets from operations during the reporting period. Actual results could differ from those estimates.
| a) | Determination of Net Asset Value – The NAV of each class of the Fund's shares is determined as of the close of regular trading (normally 4:00 p.m. Eastern Time) (the “NYSE Close”) on each day that the New York Stock Exchange (the “Exchange”) is open (“Valuation Date”). Information that becomes known to the Fund after the NAV has been calculated on a particular day will not generally be used to retroactively adjust the NAV determined earlier that day. |
| b) | Investment Valuation and Fair Value Measurements – For purposes of calculating the NAV, portfolio securities and other assets held by the Fund's portfolio for which market quotes are readily available are valued at market value. Market value is generally determined on the basis of last reported sales prices or official close price. If no sales are reported, market value is based on quotes obtained from a quotation reporting system, established market makers, or independent pricing services. If market prices are not readily available or are deemed unreliable, the Fund will use the fair value of the security as determined in good faith under policies and procedures established by and under the supervision of the |
| Hartford Portfolio Diversifier HLS Fund |
| Notes to Financial Statements – (continued) |
| June 30, 2011 (Unaudited) |
| (000’s Omitted) |
Company's Board of Directors. Market quotes are considered not readily available where there is an absence of current or reliable market-based data (e.g., trade information or broker quotes), including where events occur after the close of the relevant market, but prior to the NYSE Close that materially affect the values of the Fund's portfolio securities or assets. In addition, market quotes are considered not readily available when, due to extraordinary circumstances, the exchanges or markets on which the securities trade, do not open for trading for the entire day and no other market prices are available. In addition, prices of foreign equities that are principally traded on certain foreign markets are adjusted daily pursuant to a fair value pricing service approved by the Board of Directors in order to reflect an adjustment for the factors occurring after the close of certain foreign markets but before the NYSE Close. Securities that are primarily traded on foreign markets may trade on days that are not business days of the Fund. The value of the foreign securities, in which the Fund invests, may change on days when a shareholder will not be able to purchase or redeem shares of the Fund. Fair value pricing is subjective in nature and the use of fair value pricing by the Fund may cause the NAV of its shares to differ significantly from the NAV that would have been calculated using market prices at the close of the exchange on which a portfolio security is primarily traded. There can be no assurance that the Fund could obtain the fair market value assigned to a security if the Fund were to sell the security at approximately the time at which the Fund determines its NAV.
Fixed income securities (other than short term obligations) and non-exchange traded derivatives held by the Fund are normally valued on the basis of quotes obtained from brokers and dealers or independent pricing services in accordance with procedures established by the Company’s Board of Directors. Prices obtained from independent pricing services use information provided by market makers or estimates of market values obtained from yield data relating to investments or securities with similar characteristics. Generally, the Fund may use fair valuation in regard to fixed income securities when the Fund holds defaulted or distressed securities or securities in a company in which a reorganization is pending. Short-term investments maturing in 60 days or less are generally valued at amortized cost, if their original term to maturity was 60 days or less, or by amortizing their value on the 61st day prior to maturity, if the original term to maturity exceeded 60 days.
Exchange traded options, futures and options on futures are valued at the settlement price determined by the relevant exchange as of the NYSE Close. If such instruments do not trade on an exchange, values may be supplied by an independent pricing service using a formula or other objective method that may take into consideration the style, direction, expiration, strike price, notional value and volatility or other adjustments.
Investments in open-end mutual funds are valued at the respective NAV of each open-end mutual fund on the Valuation Date.
Financial instruments for which prices are not available from an independent pricing service may be valued using market quotations obtained from one or more dealers that make markets in the respective financial instrument in accordance with procedures established by the Company’s Board of Directors.
U.S. GAAP defines fair value as the price that the Fund would receive to sell an asset or pay to transfer a liability in an orderly transaction between market participants. The U.S. GAAP fair value measurement standards require disclosure of a fair value hierarchy for each major category of assets and liabilities. Various inputs are used in determining the fair value of the Fund’s investments. These inputs are summarized into three broad hierarchy levels. This hierarchy is based on whether the valuation inputs are observable or unobservable. These levels are:
| · | Level 1 – Quoted prices in active markets for identical securities. Level 1 may include exchange-traded instruments such as domestic equities, some foreign equities, options, futures, mutual funds, exchange-traded funds, rights and warrants. |
| · | Level 2 – Observable inputs other than Level 1 prices, such as quoted prices for similar securities; quoted prices in markets that are not active; or other inputs that are observable or can be corroborated by observable market data. Level 2 may include debt securities that are traded less frequently than exchange-traded instruments and |
which are valued using third party pricing services; foreign equities, whose value is determined using a multi-factor regression model with inputs that are observable in the market; and short-term securities, which are valued at amortized cost.
| · | Level 3 – Significant unobservable inputs that are supported by limited or no market activity. Level 3 may include financial instruments whose values are determined using broker quotes or require significant management judgment or estimation. These unobservable valuation inputs may include estimates for current yields, maturity/duration, prepayment speed, and broker quotes for comparable securities along with other assumptions relating to credit quality, collateral value, complexity of the security structure, general market conditions and liquidity. This category may include securities where trading has been halted or there are certain restrictions on trading. While these securities are priced using unobservable inputs, the valuation of these securities reflects the best available data and management believes the prices are a reasonable representation of exit price. |
Valuation levels are not necessarily indicative of the risk associated with investing in such securities. Individual securities within any of the above mentioned asset classes may be assigned a different hierarchical level than those presented above, as individual circumstances dictate.
During the six-month period ended June 30, 2011, the Fund held no Level 3 securities, therefore no reconciliation of Level 3 securities is presented.
For additional information, refer to the Investment Valuation Hierarchy Level Summary which follows the Schedule of Investments.
For purposes of reporting transfers between different hierarchy levels, both transfers in and out of each level, as applicable, are shown as if they occurred at the beginning of the period.
| c) | Security Transactions and Investment Income – Security transactions are recorded as of the trade date (the date the order to buy or sell is executed) for financial reporting purposes. Securities purchased or sold on a when-issued or delayed-delivery basis may be settled a month or more after the trade date. Realized gains and losses are determined on the basis of identified cost. |
Trade date for senior floating rate interests purchased in the primary loan market is considered the date on which the loan allocations are determined. Trade date for senior floating rate interests purchased in the secondary loan market is the date on which the transaction is entered into.
Dividend income is recorded on the ex-dividend date, except certain dividends from foreign securities where the ex-dividend date may have passed are recorded as soon as the Fund is informed of the dividend. Interest income, including amortization of premium and accretion of discounts, is accrued on a daily basis. Paydown gains and losses on mortgage-related and other asset-backed securities are included in interest income on the Statement of Operations.
| d) | Joint Trading Account – The Fund may invest cash balances into a joint trading account that may be invested in one or more repurchase agreements. |
| e) | Fund Share Valuation and Dividend Distributions to Shareholders – Orders for the Fund’s shares are executed in accordance with the investment instructions of the contract holders and plan participants. The NAV of the Fund’s shares is determined as of the close of business on each business day of the Exchange. The NAV is determined by dividing the Fund’s net assets by the number of shares outstanding. |
Orders for the purchase of the Fund’s shares received prior to the close of the Exchange on any day the Exchange is open for business are priced at the NAV determined as of the close of the Exchange. Orders received after the close of the
| Hartford Portfolio Diversifier HLS Fund |
| Notes to Financial Statements – (continued) |
| June 30, 2011 (Unaudited) |
| (000’s Omitted) |
Exchange, or on a day on which the Exchange and/or the Fund is not open for business, are priced at the next determined NAV.
Dividends are declared pursuant to a policy adopted by the Company’s Board of Directors based upon the investment performance of the Fund. The policy of the Fund is to pay dividends from net investment income and realized capital gains, if any, at least once a year.
Distributions from net investment income, net realized capital gains and capital are determined in accordance with federal income tax regulations, which may differ from U.S. GAAP with respect to character and timing. These differences may include but are not limited to losses deferred due to wash sale adjustments, foreign currency gains and losses, adjustments related to Passive Foreign Investment Companies (“PFICs”), Real Estate Investment Trusts (“REITs”), Regulated Investment Companies (“RICs”), certain derivatives and partnerships. Permanent book and federal income tax basis differences relating to shareholder distributions will result in reclassifications to certain of the Fund’s capital accounts (see Federal Income Taxes: Reclassification of Capital Accounts note).
| 3. | Securities and Other Investments: |
| a) | Repurchase Agreements – A repurchase agreement is an agreement by which a counterparty agrees to sell a security and agrees to repurchase the security sold at a mutually agreed upon time and price. At the time the Fund enters into a repurchase agreement, the value of the underlying collateral security(ies), including accrued interest, will be equal to or exceed the value of the repurchase agreement. Repurchase agreements expose the Fund to counterparty risk. To minimize counterparty risk, the securities that serve to collateralize the repurchase agreement are held by the Fund's custodian in book entry or physical form in the custodial account of the Fund or in a third party custodial account. Repurchase agreements are valued at cost plus accrued interest. The Fund, as shown on the Schedule of Investments, had outstanding repurchase agreements as of June 30, 2011. |
| b) | Illiquid and Restricted Securities – The Fund is permitted to invest up to 15% of its net assets in illiquid securities. Illiquid securities are those that may not be sold or disposed of in the ordinary course of business within seven days, at approximately the price used to determine the Fund’s NAV. The Fund may not be able to sell illiquid securities or other investments when its sub-adviser considers it desirable to do so or may have to sell such securities or investments at a price that is lower than the price that could be obtained if the securities or investments were more liquid. A sale of illiquid securities or other investments may require more time and may result in higher dealer discounts and other selling expenses than does the sale of those that are liquid. Illiquid securities and investments also may be more difficult to value, due to the unavailability of reliable market quotations for such securities or investments, and an investment in them may have an adverse impact on the Fund’s NAV. The Fund may also purchase certain restricted securities that can only be resold to certain qualified investors and may be determined to be liquid pursuant to policies and guidelines established by the Company’s Board of Directors. The Fund, as shown on the Schedule of Investments, had illiquid and/or restricted securities as of June 30, 2011. |
| c) | Securities Purchased on a When-Issued or Delayed-Delivery Basis – Delivery and payment for securities that have been purchased by the Fund on a forward commitment, or when-issued or delayed-delivery basis, take place beyond the customary settlement period. During this period, such securities are subject to market fluctuations, and the Fund identifies securities segregated in its records with value at least equal to the amount of the commitment. The Fund, as shown on the Schedule of Investments, had when-issued or delayed delivery securities as of June 30, 2011. |
| d) | Mortgage Related and Other Asset Backed Securities – The Fund may invest in mortgage related and other asset backed securities. These securities include mortgage pass-through securities, collateralized mortgage obligations, commercial mortgage backed securities, stripped mortgage backed securities, asset backed securities, collateralized debt obligations and other securities that directly or indirectly represent a participation in, or are secured by and payable from, mortgage loans on real property. Mortgage related securities are created from pools of residential or commercial mortgage loans, |
including mortgage loans made by savings and loan institutions, mortgage bankers, commercial banks and others. Asset backed securities are created from many types of assets, including auto loans, credit card receivables, home equity loans, and student loans. These securities provide a monthly payment which consists of both interest and principal payments. Interest payments may be determined by fixed or adjustable rates. The rate of pre-payments on underlying mortgages will affect the price and volatility of a mortgage related security, and may have the effect of shortening or extending the effective duration of the security relative to what was anticipated at the time of purchase. The timely payment of principal and interest of certain mortgage-related securities is guaranteed by the full faith and credit of the United States Government. Pools created and guaranteed by non-governmental issuers, including government-sponsored corporations, may be supported by various forms of insurance or guarantees, but there can be no assurance that the private insurers or guarantors can meet their obligations under the insurance policies or guarantee arrangements.
| 4. | Financial Derivative Instruments: |
The following disclosures contain information on how and why the Fund uses derivative instruments, the credit-risk-related contingent features in certain derivative instruments, and how derivative instruments affect the Fund’s financial position, results of operations and cash flows. The location and fair value amounts of these instruments on the Statement of Assets and Liabilities and the realized gains and losses and changes in unrealized gains and losses on the Statement of Operations, each categorized by type of derivative contract, are included in the following Additional Derivative Instrument Information footnote. The derivative instruments outstanding as of period-end are disclosed in the Notes to the Schedule of Investments and the amounts of realized gains and losses and changes in unrealized gains and losses on derivative instruments during the period are disclosed in the Statement of Operations.
| a) | Futures Contracts – The Fund may enter into futures contracts. A futures contract is an agreement between two parties to buy or sell an asset at a set price on a future date. The Fund uses futures contracts to manage or obtain exposure to the securities markets, commodities, or movements in interest rates. The primary risks associated with the use of futures contracts are the imperfect correlation between the change in market value of the securities held by the Fund and the prices of futures contracts and the possibility of an illiquid market. Upon entering into a futures contract, the Fund is required to deposit with a futures commission merchant (“FCM”), an amount of cash or U.S. Government or Agency Obligations in accordance with the initial margin requirements of the broker or exchange. Futures contracts are marked to market daily at the most recent settlement price reported by an exchange on which, over time, they are traded most extensively, and an appropriate payable or receivable for the change in value (“variation margin”) is recorded by the Fund. Gains or losses are recognized but not considered realized until the contracts expire or are closed. Futures contracts involve, to varying degrees, risk of loss in excess of the variation margin disclosed on the Statement of Assets and Liabilities, however, this risk is reduced through the use of an FCM. The Fund, as shown on the Schedule of Investments, had outstanding futures contracts as of June 30, 2011. |
| b) | Options Contracts – An option contract is a contract sold by one party to another party that offers the buyer the right, but not the obligation, to buy (call) or sell (put) a security or other financial asset at an agreed-upon price during a specific period of time or on a specific date. The Fund may write (sell) covered call and put options on futures, swaps (“swaptions”), securities or commodities. “Covered” means that so long as the Fund is obligated as the writer of an option, it will own either the underlying securities or currency or an option to purchase the same underlying securities or currency having an expiration date of the covered option and an exercise price equal to or less than the exercise price of the covered option, or will pledge cash or other liquid securities having a value equal to or greater than the fluctuating market value of the option security or currency. Writing put options increases the Fund’s exposure to the underlying instrument. Writing call options decreases the Fund’s exposure to the underlying instrument. Premiums received from writing options that expire are treated as realized gains. Premiums received from writing options that are exercised or closed are added to the proceeds or offset against amounts paid on the underlying futures, swap or security transaction to determine the realized gain or loss. The Fund as a writer of an option has no control over whether the underlying instrument may be sold (call) or purchased (put) and as a result bears the market risk of an unfavorable change in the price of the instrument underlying the written option. There is the risk the Fund may not be able to enter into a closing transaction because of an illiquid market. The Fund may also purchase put and call options. Purchasing call options |
| Hartford Portfolio Diversifier HLS Fund |
| Notes to Financial Statements – (continued) |
| June 30, 2011 (Unaudited) |
| (000’s Omitted) |
increases the Fund’s exposure to the underlying instrument. Purchasing put options decreases the Fund’s exposure to the underlying instrument. A Fund pays a premium, which is included on the Fund’s Statement of Assets and Liabilities as an investment and is subsequently marked to market to reflect the current value of the option. Premiums paid for purchasing options that expire are treated as realized losses. Certain options may be purchased with premiums to be determined on a future date. The premiums for these options are based upon implied volatility parameters at specified terms. The risk associated with purchasing put and call options is generally limited to the premium paid. Premiums paid for purchasing options that are exercised or closed are added to the amounts paid or offset against the proceeds on the underlying investment transaction to determine the realized gain or loss. The Fund, as shown on the Schedule of Investments, had outstanding purchased options contracts as of June 30, 2011. Transactions involving written options contracts during the period ended June 30, 2011, are summarized below:
| Options Contract Activity During the | ||||||||
| Period June 6, 2011 (commencement of operations) through | ||||||||
| June 30, 2011 | ||||||||
| Put Options Written During the Period | Number of Contracts* | Premium Amounts | ||||||
| Beginning of the period | — | — | ||||||
| Written | 60,846 | 7,537 | ||||||
| Expired | — | — | ||||||
| Closed | — | — | ||||||
| Exercised | — | — | ||||||
| End of period | 60,846 | 7,537 | ||||||
| * | The number of contracts does not omit 000's. |
| c) | Additional Derivative Instrument Information: |
Fair Values of Derivative Instruments on the Statement of Assets and Liabilities as of June 30, 2011:
| Risk Exposure Category | ||||||||||||||||||||||||||||
| Foreign | ||||||||||||||||||||||||||||
| Interest Rate | Exchange | Credit | Equity | Commodity | Other | |||||||||||||||||||||||
| Contracts | Contracts | Contracts | Contracts | Contracts | Contracts | Total | ||||||||||||||||||||||
| Assets: | ||||||||||||||||||||||||||||
| Investments in securities, at value (purchased options), market value | $ | — | $ | — | $ | — | $ | 12,911 | $ | — | $ | — | $ | 12,911 | ||||||||||||||
| Variation margin receivable * | — | — | — | 2 | — | — | 2 | |||||||||||||||||||||
| Total | $ | — | $ | — | $ | — | $ | 12,913 | $ | — | $ | — | $ | 12,913 | ||||||||||||||
| Liabilities: | ||||||||||||||||||||||||||||
| Variation margin payable * | $ | — | $ | — | $ | — | $ | 165 | $ | — | $ | — | $ | 165 | ||||||||||||||
| Written options, market value | — | — | — | 6,564 | — | — | 6,564 | |||||||||||||||||||||
| Total | $ | — | $ | — | $ | — | $ | 6,729 | $ | — | $ | — | $ | 6,729 | ||||||||||||||
| * | Only current day's variation margin is reported within the Statement of Assets and Liabilities. The variation margin is included in the open futures cumulative appreciation (depreciation) of $(640) as reported in the Schedule of Investments. |
The volume of derivatives that is presented in the Schedule of Investments is consistent with the derivative activity during the period June 6, 2011 through June 30, 2011.
The Effect of Derivative Instruments on the Statement of Operations for the period June 6, 2011 through June 30, 2011:
| Risk Exposure Category | ||||||||||||||||||||||||||||
| Foreign | ||||||||||||||||||||||||||||
| Interest Rate | Exchange | Credit | Equity | Commodity | Other | |||||||||||||||||||||||
| Contracts | Contracts | Contracts | Contracts | Contracts | Contracts | Total | ||||||||||||||||||||||
| Realized Gain (Loss) on Derivatives Recognized as a Result from Operations: | ||||||||||||||||||||||||||||
| Net realized gain on futures | $ | — | $ | — | $ | — | $ | 114 | $ | — | $ | — | $ | 114 | ||||||||||||||
| Total | $ | — | $ | — | $ | — | $ | 114 | $ | — | $ | — | $ | 114 | ||||||||||||||
| Net Change in Unrealized Appreciation (Depreciation) on Derivatives Recognized as a Result from Operations: | ||||||||||||||||||||||||||||
| Net change in unrealized depreciation of investments in purchased options | $ | — | $ | — | $ | — | $ | (1,900 | ) | $ | — | $ | — | $ | (1,900 | ) | ||||||||||||
| Net change in unrealized depreciation of futures | — | — | — | (640 | ) | — | — | (640 | ) | |||||||||||||||||||
| Net change in unrealized appreciation of written options | — | — | — | 973 | — | — | 973 | |||||||||||||||||||||
| Total | $ | — | $ | — | $ | — | $ | (1,567 | ) | $ | — | $ | — | $ | (1,567 | ) | ||||||||||||
| 5. | Principal Risks: |
| a) | Credit and Counterparty Risks – Credit risk depends largely on the perceived financial health of bond issuers. In general, the credit rating is inversely related to the credit risk of the issuer. Higher rated bonds generally are deemed to have less credit risk, while lower or unrated bonds are deemed to have higher risk of default. The share price, yield and total return of a fund that holds securities with higher credit risk may be more volatile than those of a fund that holds bonds with lower credit risk. Similar to credit risk, the Fund may be exposed to counterparty risk, or the risk that an institution or other entity with which the Fund has unsettled or open transactions will default. |
| b) | Market Risks – A Fund’s investments in derivatives and other financial instruments expose the Fund to various risks including, but not limited to, interest rate, prepayment, extension, foreign currency, and equity risks. Interest rate risk is the risk that fixed income securities will decline in value because of changes in interest rates. As nominal interest rates rise, the value of certain fixed income securities held by the Fund is likely to decrease. A nominal interest rate can be described as the sum of a real interest rate and an expected inflation rate. Fixed income securities with longer durations tend to be more sensitive to changes in interest rates, usually making them more volatile than securities with shorter durations. Duration is useful primarily as a measure of the sensitivity of a fixed income security’s market price to interest rate (i.e., yield) movements. In addition, securities are subject to extension risk. Rising interest rates may cause prepayments to occur at a slower than expected rate, thereby effectively lengthening the maturity of the security and making the security more sensitive to interest rate changes. Prepayment and extension risk are major risks of mortgage-backed securities, and certain asset-backed securities. For certain asset-backed securities, the actual maturity may be less than the stated maturity shown in the Schedule of Investments. As a result, the timing of income recognition relating to these securities may vary based upon the actual maturity. If a Fund invests directly in foreign currencies or in securities that trade in, and receive revenues in, foreign currencies, or in derivatives that provide exposure to foreign currencies, it will be subject to the risk that those currencies will decline in value relative to the base currency of the Fund, or, in the case of hedging positions, that the Fund’s base currency will decline in value relative to the currency being hedged. Currency rates in foreign countries may fluctuate significantly over short periods of time for a number of reasons, including changes in interest rates, intervention (or the failure to intervene) by U.S. or foreign governments, central banks or supranational entities such as the International Monetary Fund, or by the imposition of currency controls or other political developments in the United States or abroad. As a result, the Fund’s investments in foreign currency denominated securities may reduce the returns of the Fund. The market values of equity securities, such as common stocks and preferred stocks or equity related investments such as futures and options, may decline due to general market conditions which are not specifically related to a particular company, such as real or perceived adverse economic conditions, changes in the general outlook for corporate earnings, changes in interest or currency rates or adverse investor sentiment generally. The market value of equity securities may also decline due to factors which affect a particular industry or industries, such as labor shortages or increased production costs and competitive conditions within |
| Hartford Portfolio Diversifier HLS Fund |
| Notes to Financial Statements – (continued) |
| June 30, 2011 (Unaudited) |
| (000’s Omitted) |
an industry. Equity securities and equity related investments generally have greater market price volatility than fixed income securities.
| 6. | Federal Income Taxes: |
| a) | Federal Income Taxes – For federal income tax purposes, the Fund intends to continue to qualify as a RIC under Subchapter M of the Internal Revenue Code (“IRC”) by distributing substantially all of its taxable net investment income and net realized capital gains to its shareholders and otherwise complying with the requirements of RICs. The Fund has distributed substantially all of its income and capital gains in prior years, if applicable, and intends to distribute substantially all of its income and capital gains prior to the next fiscal year-end. Accordingly, no provision for federal income or excise taxes has been made in the accompanying financial statements. Distributions from short-term capital gains are treated as ordinary income distributions for federal income tax purposes. |
| b) | Net Investment Income (Loss), Net Realized Gains (Losses) – Net investment income (loss) and net realized gains (losses) may differ for financial statement and tax purposes primarily because of losses deferred due to wash sale adjustments, foreign currency gains and losses, adjustments related to PFICs, REITs, RICs, certain derivatives and partnerships. The character of distributions made during the year from net investment income or net realized gains may differ from their ultimate characterization for federal income tax purposes. Also, due to the timing of dividend distributions, the fiscal year in which amounts are distributed may differ from the year that the income or realized gains (losses) were recorded by the Fund. |
| c) | Accounting for Uncertainty in Income Taxes – The Fund has adopted financial reporting rules that require the Fund to analyze all open tax years, as defined by the Statute of Limitations, for all major jurisdictions. Generally, tax authorities can examine all tax returns filed for the last three years. The Fund does not have an examination in progress. |
The Fund is also not aware of any tax positions for which it is reasonably possible that the total amounts of unrecognized tax benefits will significantly change in the next twelve months.
| 7. | Expenses: |
| a) | Investment Management Agreements – HL Investment Advisors, LLC (“HL Advisors”), an indirect wholly owned subsidiary of The Hartford Financial Services Group, Inc. (“The Hartford”), serves as investment manager to the Fund pursuant to an Investment Management Agreement with the Company. As investment manager, HL Advisors has overall investment supervisory responsibility for the Fund. In addition, HL Advisors provides administrative personnel, services, equipment, facilities and office space for proper operation of the Fund. HL Advisors has contracted with Hartford Investment Management Company (“Hartford Investment Management”) under a sub-advisory agreement for the provision of day-to-day investment management services to the Fund in accordance with the Fund’s investment objective and policies. The Fund pays a fee to HL Advisors, a portion of which may be used to compensate Hartford Investment Management. |
The schedule below reflects the rates of compensation paid to HL Advisors for investment management services rendered as of June 30, 2011; the rates are accrued daily and paid monthly.
| Average Daily Net Assets | Annual Fee | |||
| On first $500 million | 0.60 | % | ||
| On next $500 million | 0.55 | % | ||
| On next $4 billion | 0.50 | % | ||
| On next $5 billion | 0.48 | % | ||
| Over $10 billion | 0.47 | % | ||
| b) | Accounting Services Agreement – Pursuant to the Fund Accounting Agreement between HLIC and the Company, on behalf of the Fund, HLIC provides accounting services to the Fund and receives monthly compensation based on the Fund’s average net assets at the rates set forth below. The Fund’s accounting services fees are accrued daily and paid monthly. |
| Average Daily Net Assets | Annual Fee | |||
| On first $5 billion | 0.018 | % | ||
| On next $5 billion | 0.016 | % | ||
| Over $10 billion | 0.014 | % | ||
| c) | Operating Expenses – Allocable expenses incurred by the Company are allocated to each Fund in proportion to the average daily net assets of the Fund, except where allocation of certain expenses is more fairly made directly to the Fund. HL Advisors has contractually agreed to reimburse expenses (exclusive of taxes, interest expense, brokerage commissions, acquired fund fees and expenses and extraordinary expenses) to the extent necessary to maintain total annual operating expenses for the Class IB shares of the Fund at the annual rate of 0.85% of the Fund’s average daily net assets. This contractual arrangement will remain in effect until April 30, 2013, and shall renew automatically for one-year terms unless HL Advisors provides written notice of termination prior to the start date of the next term or upon approval of the Board of Directors of the Company. |
| d) | Distribution Plan for Class IB shares – The Company, on behalf of the Fund, has adopted a Distribution Plan pursuant to Rule 12b-1 of the 1940 Act to compensate the Distributor, Hartford Securities Distribution Company, Inc. (a wholly owned, ultimate subsidiary of The Hartford), from assets attributable to the Class IB shares for services rendered and expenses borne in connection with activities primarily intended to result in the sale of the Class IB shares, subject to the review and approval of the Company’s Board of Directors. |
The Distribution Plan provides that the Fund may pay annually up to 0.25% of the average daily net assets of the Fund attributable to its Class IB shares for activities primarily intended to result in the sale of Class IB shares. The Board has the authority to suspend or reduce these payments at any point in time. Under the terms of the Distribution Plan and the principal underwriting agreement, the Fund is authorized to make payments monthly to the Distributor that may be used to pay or compensate entities providing distribution and shareholder servicing with respect to the Class IB shares for such entities’ fees or expenses incurred or paid in that regard. These fees are accrued daily and paid monthly.
| 8. | Affiliate Holdings: |
As of June 30, 2011, affiliates of The Hartford had ownership of shares in the Funds as follows:
| Shares | ||||
| Class IB | 6,000 | |||
| 9. | Investment Transactions: |
For the period June 6, 2011 (commencement of operations) through June 30, 2011, the Fund's aggregate purchases and sales of investment securities (excluding short-term investments) were as follows:
| Amount | ||||
| Cost of Purchases Excluding U.S. Government Obligations | $ | 46,329 | ||
| Sales Proceeds Excluding U.S. Government Obligations | 692 | |||
| Cost of Purchases for U.S. Government Obligations | 10,258 | |||
| Sales Proceeds for U.S. Government Obligations | 1,307 | |||
| Hartford Portfolio Diversifier HLS Fund |
| Notes to Financial Statements – (continued) |
| June 30, 2011 (Unaudited) |
| (000’s Omitted) |
| 10. | Industry Classifications: |
Other than the industry classifications “Other Investment Pools and Funds” and “Exchange Traded Funds,” equity industry classifications used in this report are the Global Industry Classification Standard, which was developed by and is the exclusive property and service mark of MSCI, Inc. and Standard & Poor’s.
| 11. | Indemnifications: |
Under the Company’s organizational documents, the Company shall indemnify its officers and directors to the full extent required or permitted under Maryland General Corporation Law and the federal securities laws. In addition, the Company, on behalf of the Fund, may enter into contracts that contain a variety of indemnifications. The Company’s maximum exposure under these arrangements is unknown. However, as of the date of these financial statements the Company has not had prior claims or losses pursuant to these contracts and expects the risk of loss to be remote.
[This page is intentionally blank]
| Financial Highlights |
| - Selected Per-Share Date (A) - |
| Net Asset | Net Realized | Net Increase | |||||||||||||||||||||||||||||||||||||||||
| Value at | and Unrealized | Total from | Dividends from | Distributions | (Decrease) in | Net Asset | |||||||||||||||||||||||||||||||||||||
| Beginning of | Net Investment | Payments from | Gain (Loss) on | Investment | Net Investment | from Realized | Distributions | Total | Net Asset | Value at End | |||||||||||||||||||||||||||||||||
| Class | Period | Income (Loss) | (to) Affiliate | Investments | Operations | Income | Capital Gains | from Capital | Distributions | Value | of Period | ||||||||||||||||||||||||||||||||
| From June 6, 2011 (commencement of operations) through June 30, 2011 (Unaudited) | |||||||||||||||||||||||||||||||||||||||||||
| IB(D) | $ | 10.00 | $ | – | $ | – | $ | (0.21 | ) | $ | (0.21 | ) | $ | – | $ | – | $ | – | $ | – | $ | (0.21 | ) | $ | 9.79 | ||||||||||||||||||
| (A) | Information presented relates to a share outstanding throughout the indicated period. |
| (B) | The figures do not include sales charges or other fees which may be applied at the variable annuity product level. Any such additional sales charges or other fees would lower the Fund's performance. |
| (C) | Portfolio turnover rate is calculated on the basis of the Fund as a whole without distinguishing between the classes of shares issued. |
| (D) | Commenced operations on June 6, 2011. |
| (E) | Not annualized. |
| (F) | Annualized. |
| - Ratios and Supplemental Data - |
| Ratio of Expenses to Average Net | Ratio of Expenses to Average Net | Ratio of Net Investment Income to | Portfolio Turnover | |||||||||||||||||
| Total Return(B) | Net Assets at End of Period | Assets Before Waivers | Assets After Waivers | Average Net Assets | Rate(C) | |||||||||||||||
| (2.06 | )%(E) | $ | 59,279 | 0.89 | %(F) | 0.85 | %(F) | 0.63 | %(F) | 4 | % | |||||||||
| Directors and Officers (Unaudited) |
The Board of Directors of the Company appoints officers who are responsible for the day-to-day operations of the Fund and who execute policies formulated by the Directors. Each director serves until his or her death, resignation, or retirement or until the next annual meeting of shareholders is held or until his or her successor is elected and qualifies.
Directors and officers who are employed by or who have a financial interest in The Hartford are considered “interested” persons of the Fund pursuant to the 1940 Act. Each officer and two of the Company’s directors, as noted in the chart below, are “interested” persons of the Fund. Each director serves as a director for The Hartford Mutual Funds, Inc., The Hartford Mutual Funds II, Inc., Hartford Series Fund, Inc., and Hartford HLS Series Fund II, Inc., which, as of June 30, 2011, collectively consist of 89 funds. Correspondence may be sent to directors and officers c/o Hartford Mutual Funds, P.O. Box 2999, Hartford, Connecticut 06104-2999, except that correspondence to Ms. Fagely may be sent to 500 Bielenberg Drive, Woodbury, Minnesota 55125.
The table below sets forth, for each director and officer, his or her name, year of birth, current position with the Company and date first elected or appointed to Hartford Series Fund, Inc. (“HSF”), and Hartford HLS Series Fund II, Inc. (“HSF2”), principal occupation, and, for directors, other directorships held. The Fund’s statement of additional information contains further information on the directors and is available free of charge by calling 1-800-862-6668 or writing to Hartford HLS Funds, c/o Individual Annuity Services, P.O. Box 5085, Hartford, CT 06102-5085.
Information on the aggregate remuneration paid to the directors of the Company can be found in the Statement of Operations herein. The Fund pays to The Hartford a portion of the chief compliance officer’s compensation, but does not pay salaries or compensation to any of their other officers or directors who are employed by The Hartford.
Non-Interested Directors
Lynn S. Birdsong (1946) Director since 2003, Co-Chairman of the Investment Committee
Mr. Birdsong is a private investor. Mr. Birdsong currently serves as a Director of the Sovereign High Yield Investment Company (April 2010 to current). Mr. Birdsong currently serves as an Independent Director of Nomura Partners Funds, Inc. (formerly, The Japan Fund) (March 2003 to current). From 2003 to March 2005, Mr. Birdsong was an independent director of the Atlantic Whitehall Funds. From 1979 to 2002, Mr. Birdsong was a managing director of Zurich Scudder Investments, an investment management firm. During his employment with Scudder, Mr. Birdsong was an Interested Director of The Japan Fund. Since 1981, Mr. Birdsong has been a partner in Birdsong Company, an advertising specialty firm.
Robert M. Gavin, Jr. (1940) Director since 2002 (HSF) and 1986 (HSF2), Chairman of the Board since 2004
Dr. Gavin is an educational consultant. Prior to September 1, 2001, he was President of Cranbrook Education Community and prior to July 1996, he was President of Macalester College, St. Paul, Minnesota.
Duane E. Hill (1945) Director since 2001 (HSF) and 2002 (HSF2), Chairman of the Nominating Committee
Mr. Hill is Partner of TSG Ventures L.P., a private equity investment company. Mr. Hill is a former partner of TSG Capital Group, a private equity investment firm that served as sponsor and lead investor in leveraged buyouts of middle market companies.
Sandra S. Jaffee (1941) Director since 2005
Ms. Jaffee served as Chairman (2008 to 2009) and Chief Executive Officer of Fortent (formerly Searchspace Group), a leading provider of compliance/regulatory technology to financial institutions from August 2005 to August 2009. From August 2004 to August 2005, Ms. Jaffee served as an Entrepreneur in Residence with Warburg Pincus, a private equity firm. From September 1995 to July 2004, Ms. Jaffee served as Executive Vice President at Citigroup, where she was President and Chief Executive Officer of Citibank’s Global Securities Services (1995 to 2003). Ms. Jaffe currently serves as a member of the Board of Directors of Broadridge Financial Solutions as well as a Trustee of Muhlenberg College.
William P. Johnston (1944) Director since 2005, Chairman of the Compliance Committee
In June 2006, Mr. Johnston was appointed as Senior Advisor to The Carlyle Group, a global private equity investment firm. In July 2006, Mr. Johnston was elected to the Board of Directors of MultiPlan, Inc. In August 2007, Mr. Johnston was elected to the Board of Directors of LifeCare Holdings, Inc. In February 2008, Mr. Johnston was elected to the Board of Directors of HCR-ManorCare, Inc. In May 2006, Mr. Johnston was elected to the Supervisory Board of Fresenius Medical Care AG & Co. KGaA, after its acquisition of Renal Care Group, Inc. in March 2006. Mr. Johnston joined Renal Care Group in November 2002 as a member of the Board of Directors and served as Chairman of the Board from March 2003 through March 2006. From September 1987 to December 2002, Mr. Johnston was with Equitable Securities Corporation (and its successors, SunTrust Equitable Securities and SunTrust Robinson Humphrey) serving in various investment banking and managerial positions, including Managing Director and Head of Investment Banking, Chief Executive Officer and Vice Chairman.
Phillip O. Peterson (1944) Director since 2002 (HSF) and 2000 (HSF2), Chairman of the Audit Committee
Mr. Peterson is a mutual fund industry consultant. He was a partner of KPMG LLP (an accounting firm) until July 1999. Mr. Peterson joined William Blair Funds in February 2007 as a member of the Board of Trustees. From January 2004 to April 2005, Mr. Peterson served as Independent President of the Strong Mutual Funds.
Lemma W. Senbet (1946) Director since 2005
Dr. Senbet is the William E. Mayer Chair Professor of Finance and Director, Center for Financial Policy, at the University of Maryland, Robert H. Smith School of Business. He was chair of the Finance Department from 1998 to 2006. Previously he was a chaired professor of finance at the University of Wisconsin-Madison. Also, he was director of the Fortis Funds from March 2000 to July 2002. Dr. Senbet served the finance profession in various capacities, including as director of the American Finance Association and President of the Western Finance Association. In 2006, Dr. Senbet was inducted Fellow of Financial Management Association International for his career-long distinguished scholarship and professional service.
Interested Directors and Officers
David N. Levenson (1966) Director since 2010
Mr. Levenson currently serves as President of The Hartford’s Wealth Management business. He was appointed to this role in July 2010. Previously, Mr. Levenson served as Executive Vice President of Legacy Holdings for The Hartford from June 2009 to July 2010. From 2006 to 2009, Mr. Levenson was with Hartford Life Insurance K.K. where he served as President and CEO from 2007 to 2009. He served as Managing Director of Hartford Investment Management Company from 2005 to 2006. Additionally, Mr. Levenson serves as Executive Vice President of The Hartford and as President, Director and Chief Executive Officer of Hartford Life Insurance Company (“HLIC”) and Hartford Life, Inc. (“HL Inc.”).
Lowndes A. Smith (1939) Director since 1996 (HSF) and 2002 (HSF2), Co-Chairman of the Investment Committee
Mr. Smith served as Vice Chairman of The Hartford from February 1997 to January 2002, as President and Chief Executive Officer of HL Inc. from February 1997 to January 2002, and as President and Chief Operating Officer of The Hartford Life Insurance Companies from January 1989 to January 2002. Mr. Smith serves as a Director of White Mountains Insurance Group, Ltd., One Beacon Insurance and Symetra Financial and as a Managing Director of Whittington Gray Associates.
Other Officers
James E. Davey (1964) President and Chief Executive Officer since 2010
Mr. Davey serves as Executive Vice President of HLIC. Additionally, Mr. Davey serves as President, Chief Executive Officer and Manager of Hartford Investment Financial Services, Inc. (“HIFSCO”) and President, Chief Executive Officer and Manager of HL Advisors. Mr. Davey joined The Hartford in 2002.
Tamara L. Fagely (1958) Vice President, Treasurer and Controller since 2002 (HSF) and 1993 (HSF2)
Ms. Fagely has been a Vice President of HASCO since 1998 and Chief Financial Officer since 2006. Currently Ms. Fagely is a Vice President of HLIC. She served as Assistant Vice President of HLIC from December 2001 through March 2005. In addition, Ms. Fagely is Controller and Chief Financial Officer of HIFSCO.
Susan M. Fleege (1959) AML Compliance Officer since 2011
Ms. Fleege currently serves as a Director of Risk Management at The Hartford. She previously served as AML Compliance Officer for the Fund from 2005-2008. Ms. Fleege joined HLIC in 2005 from Amerprise Financial Corporation where she held the position of Counsel from 2000 to 2005. Ms. Fleege is a certified Anti-Money Laundering Specialist.
Dr. Robert J. Froehlich (1953) Senior Managing Director since 2009
Dr. Froehlich joined The Hartford as Senior Managing Director in September 2009. Prior to joining The Hartford, Dr. Froehlich served as Vice Chairman of Deutsche Asset Management from 1997-2009.
Edward P. Macdonald (1967) Vice President, Secretary and Chief Legal Officer since 2005
Mr. Macdonald serves as Vice President of HLIC and Chief Legal Officer of Mutual Funds and Vice President of HIFSCO. He also serves as Vice President and Secretary of HASCO, and Chief Legal Officer, Secretary and Vice President of HL Advisors. Mr. Macdonald joined The Hartford in 2005.
| Hartford Portfolio Diversifier HLS Fund |
| Directors and Officers (Unaudited) – (continued) |
Vernon J. Meyer (1964) Vice President since 2006
Mr. Meyer serves as Senior Vice President of HLIC. He also serves as Senior Vice President of HIFSCO and HL Advisors. Mr. Meyer joined The Hartford in 2004.
Colleen B. Pernerewski (1969) Vice President and Chief Compliance Officer since 2010
Ms. Pernerewski serves as Vice President and Chief Investment Advisor Compliance Officer of HIFSCO and as Vice President and Chief Compliance Officer of HL Advisors. Ms. Pernerewski joined The Hartford in 2005 from Travelers Life and Annuity where she served as Counsel (2004-2005). Prior to Travelers Life and Annuity, Ms. Pernerewski held the position of Counsel at The Hartford (1998-2004).
Elizabeth L. Schroeder (1966) Vice President since 2010
Ms. Schroeder currently serves as Assistant Vice President of HLIC. Ms. Schroeder joined HLIC in 1991. She is also an Assistant Vice President of HIFSCO and HL Advisers.
Martin Swanson (1962) Vice President since 2010
Mr. Swanson is a Vice President of HLIC. Mr. Swanson also serves as Vice President/Marketing for HIFSCO. Prior to joining HLIC in 1998, Mr. Swanson was a Vice President at PaineWebber, Inc.
Jane Wolak (1961) Vice President since 2009
Ms. Wolak currently serves as Senior Vice President of HLIC. Ms. Wolak joined HLIC as Vice President, Retail Product Services in May 2007. She is also Vice President of HASCO. Previously, Ms. Wolak was with Sun Life Financial where she held the position of Vice President, Service Center Operations from 2001-2007.
A description of the policies and procedures that the Fund uses to determine how to vote proxies relating to portfolio securities and a record of how the Fund voted any proxies for the twelve-month period ended June 30, 2011 are available (1) without charge, upon request, by calling 800-862-6668 and (2) on the SEC’s website at http://www.sec.gov.
The Fund files a complete schedule of portfolio holdings with the SEC for the first and third quarters of each fiscal year on Form N-Q. The Fund’s Forms are available (1) without charge, upon request, by calling 800-862-6668 and (2) on the SEC’s website at http://www.sec.gov. The Form N-Q may be reviewed and copied at the SEC’s Public Reference Room in Washington, DC. Information on the operation of the Public Reference Room may be obtained by calling 1-800-SEC-0330.
| Expense Example (Unaudited) |
Your Fund's Expenses
As a shareholder of the Fund, you incur two types of costs: (1) transaction costs and (2) ongoing costs including investment management fees, distribution fees, and other fund expenses. This example is intended to help you understand your ongoing costs (in dollars) of investing in a Fund and to compare these costs with the ongoing costs of investing in other mutual funds. The example is based on an investment of $1,000 invested at the beginning of the period and held for the period of June 6, 2011 (commencement of operations) through June 30, 2011.
Actual Expenses
The first set of columns of the table below provides information about actual account values and actual expenses. You may use the information in this column, together with the amount you invested, to estimate the expenses that you paid over the period. Simply divide your account value by $1,000 (for example, an $8,600 account value divided by $1,000 = 8.6), then multiply the result by the number in the line under the heading entitled “Expenses Paid During Period” to estimate the expenses you paid on your account during this period.
Hypothetical Example for Comparison Purposes
The second set of columns of the table below provides information about hypothetical account values and hypothetical expenses based on a Fund's actual expense ratio and an assumed rate of return of 5% per year before expenses, which is not the Fund's actual return. The hypothetical account values and expenses may not be used to estimate the actual ending account balance or expenses you paid for the period. You may use this information to compare the ongoing costs of investing in a Fund and other funds. To do so, compare this 5% hypothetical example with the 5% hypothetical examples that appear in the shareholder reports of the other funds.
Please note that the expenses shown in the table are meant to highlight your ongoing costs only and do not reflect any transactional costs, such as sales charges (loads) and CDSC. Therefore, the second set of columns of the table is useful in comparing ongoing costs only, and will not help you determine the relative total costs of owning different funds. In addition, if these transactional costs were included, your costs would be higher. Expenses are equal to the Fund's annualized expense ratios multiplied by average account value over the period, multiplied by 24/365 (to reflect the period of operations).
| Actual return | Hypothetical (5% return before expenses) | ||||||||||||||||||||||||||||||||||
| Expenses paid | Expenses paid | Days in | |||||||||||||||||||||||||||||||||
| during the period | during the period | the | Days | ||||||||||||||||||||||||||||||||
| Beginning | Ending | June 6, 2011 | Beginning | Ending | June 6, 2011 | Annualized | current | in the | |||||||||||||||||||||||||||
| Account Value | Account Value | through | Account Value | Account Value | Through | expense | 1/2 | full | |||||||||||||||||||||||||||
| June 6, 2011 | June 30, 2011 | June 30, 2011 | June 6,2011 | June 30, 2011 | June 30, 2011 | ratio | year | year | |||||||||||||||||||||||||||
| Class IB | $ | 1,000.00 | $ | 979.40 | $ | 0.62 | $ | 1,000.00 | $ | 1,003.07 | $ | 0.63 | 0.85 | % | 24 | 365 | |||||||||||||||||||
Approval of Investment Management and Investment Sub-Advisory Agreements (Unaudited) |
Section 15(c) of the Investment Company Act of 1940, as amended (the “1940 Act”), requires that each mutual fund’s board of directors, including a majority of those directors who are not “interested persons” of the mutual fund, as defined in the 1940 Act (the “Independent Directors”), initially approve, and annually review and consider the continuation of, the mutual fund’s investment advisory and sub-advisory agreements. At its meeting held on March 1, 2011, the Board of Directors (the “Board”) of Hartford Series Fund, Inc., including each of the Independent Directors, unanimously voted to approve an investment management agreement for Hartford Portfolio Diversifier HLS Fund (the “Fund”) with HL Investment Advisors, LLC (“HL Advisors”) and an investment sub-advisory agreement between HL Advisors and the Fund’s sub-adviser, Hartford Investment Management Company (“Sub-adviser,” and together with HL Advisors, “Advisers”) (collectively, the “Agreements”).
In the months preceding the March 1, 2011 meeting, the Board requested, received, and reviewed written responses from the Advisers to questions posed to them on behalf of the Independent Directors and supporting materials relating to those questions and responses (the “Adviser Materials”). In addition, the Board and Investment Committee received several in-person presentations by representatives of the Advisers regarding the Fund and the proposed investment strategy. During those presentations, the Advisers disclosed, among other things, the nature of the Fund’s strategy of replicating the performance of the Portfolio Diversifier Index (the “Index”), its anticipated effect on the Fund’s performance, the expected benefits to the beneficial owners of the Fund’s shares, the expected benefits to affiliates of the Advisers, and compliance considerations reviewed in connection with the Fund’s proposed strategy.
In determining to approve the Agreements for the Fund, the members of the Board reviewed and evaluated information and factors they believed to be relevant and appropriate in light of the information that the Board deemed necessary and appropriate and through the exercise of their reasonable business judgment. While individual members of the Board may have weighed certain factors differently, the Board’s determination to approve the Agreements was based on a comprehensive consideration of all information provided to the Board with respect to the approval of the Agreements. A more detailed discussion of the factors the Board considered with respect to its approval of the Agreements is provided below.
Nature, Extent and Quality of Services to be Provided by the Advisers
The Board requested and considered information and data concerning the nature, extent and quality of the services to be provided to the Fund by the Advisers. The Board considered, among other things, the terms of the Agreements, the range of services to be provided, and HL Advisors’ and the Sub-adviser’s organizational structure, systems and personnel. The Board considered HL Advisors’ and the Sub-adviser’s reputation, and the Board’s past experience with the Sub-adviser as sub-adviser for other Hartford-sponsored funds.
With respect to HL Advisors, the Board noted that under the Agreements, HL Advisors will be responsible for the management of the Fund, including overseeing fund operations and service providers, as well as investment advisory services in connection with selecting, monitoring, and supervising the Sub-adviser. The Board also considered that HL Advisors had recommended to the Board that the Sub-adviser be appointed as the sub-adviser to the Fund. The Board noted HL Advisors has recommended Hartford Life Insurance Company (“HLIC”) provide administrative services to the Fund. The Board considered HL Advisors ongoing monitoring of people, process and performance, including its ongoing commitment to review and rationalize The Hartford Fund Family’s product line-up, and its experience with HL Advisors and HLIC with respect to each of these services. The Board considered that HL Advisors or its affiliates will be responsible for providing the Fund’s officers and paying their salaries and expenses. With respect to the day-to-day portfolio management services to be provided by the Sub-adviser, the Investment Committee met with members of the proposed portfolio management team. The Board considered the Sub-Adviser’s investment philosophy and process, and its investment research capabilities and resources, performance record, and experience.
The Board also considered information previously provided by the Advisers regarding their compliance policies and procedures and compliance history and received a written representation from HL Advisors that the written compliance policies and procedures of HL Advisors and the Sub-adviser are reasonably designed to prevent violations of the federal securities laws. In addition, the Board noted that it had approved a compliance policy and procedures specific to the Fund to provide safeguards and controls designed to assure that the Fund will be operated in accordance with its stated objectives and strategies, and not in a manner intended to inappropriately benefit the Advisers’ affiliates to the detriment of the Fund and its shareholders.
In considering this information, the Board evaluated not only the information presented to the Board and the Investment Committee in connection with its consideration of the Agreements, but also the Board’s experience through past interactions with the Advisers. Based on these considerations, the Board concluded that it was satisfied with the nature, extent and quality of the services to be provided to the Fund by HL Advisors and the Sub-adviser.
Performance of the Sub-adviser
The Board considered the investment performance of the Sub-adviser and its portfolio management team. The Board noted that given the Fund’s unique strategy, the Sub-adviser does not manage any comparable accounts or funds. The Board considered information provided by the Advisers about the broad range of the portfolio management team’s investment experience and their investment philosophy and process.
Based on these considerations, the Board concluded that while there could be no guarantee of future results, the Board was satisfied that the Advisers have the capability of providing satisfactory investment performance for the Fund.
Costs of the Services and Profitability of the Advisers
In considering the proposed advisory and sub-advisory fee schedules for the Fund, the Board reviewed information regarding HL Advisors’ estimated costs to provide investment management and related services to the Fund and the estimated profitability to HL Advisors and its affiliates from all services to be provided to the Fund and all aspects of their relationships with the Fund. In evaluating HL Advisors’ estimated profitability, the Board considered HL Advisors’ representation that the level of estimated profitability was fair and appropriate based on the nature and quality of the services to be provided to shareholders. The Board also noted that the actual profitability of the Fund to the Advisers would depend on the growth of assets under management. The Board noted that the fees payable to the Sub-adviser are equal to its estimated costs in providing sub-advisory services. Accordingly, the estimated costs and profitability for HL Advisors and the Sub-adviser were considered in the aggregate.
Based on these considerations, the Board concluded that the profits anticipated to be realized by the Advisers and their affiliates from their relationships with the Fund would not be excessive.
Comparison of Fees and Services to be Provided by the Advisers
The Board considered comparative information with respect to the investment management fees to be paid by the Fund to HL Advisors, the investment sub-advisory fees to be paid by HL Advisors to the Sub-adviser, and the total expense ratios of the Fund. In this regard, the Board requested and reviewed information from HL Advisors and the Sub-adviser relating to the proposed management and sub-advisory fees and total operating expenses for the Fund. The Board considered that the proposed management fee for the Fund includes a fee to be paid to HLIC for providing certain administrative services to the Fund. The Board also reviewed information comparing the Fund’s proposed management fees and total expenses to those of a peer universe of funds identified by Lipper Inc., an independent provider of investment company data (“Lipper”). The Board considered that HL Advisors had contractually agreed to limit the expenses for the Fund’s Class IB shares to 0.85%.
In considering the reasonableness of the Fund’s fees and total expense ratios, the Board considered that, according to the information provided by Lipper, the Fund’s proposed weighted management fees were below the Lipper peer group average and median for all asset levels, and the Fund’s estimated total expenses, less Rule 12b-1 fees, were also below the Lipper peer group average and median. The Board noted, however, that due to the Fund’s unique investment strategy, there is currently no clear Lipper peer group for the Fund.
Based on these considerations, the Board concluded that the Fund’s proposed fees and total operating expenses, in conjunction with the information about quality of services, profitability, economies of scale, and other matters discussed, were reasonable in light of the services to be provided.
| The Hartford Portfolio Diversifier HLS Fund |
Approval of Investment Management and Investment Sub-Advisory Agreements (Unaudited – (continued) |
Economies of Scale
The Board considered the extent to which economies of scale would be realized as the Fund grows and whether fee levels reflect these economies of scale for the benefit of Fund investors. The Board reviewed the breakpoints in HL Advisors’ management fee schedule. The Board considered HL Advisors’ representation that the Fund could be expected to achieve some economies of scale as assets in the Fund grow. Based on these considerations, the Board concluded that it was satisfied with the extent to which economies of scale would be shared for the benefit of the Fund’s investors. The Board noted, however, that it would review future growth in Fund assets and the appropriateness of the breakpoints as part of its future annual review of the Agreements.
Other Benefits
The Board considered other benefits to the Advisers and their affiliates from their relationships with the Fund, including the role of the Fund in supporting the variable annuity products offered by The Hartford. The Board noted that HLIC and its affiliates were expected to benefit from the Fund’s strategy of seeking to replicate the performance of the Index through a reduced need to hedge their obligations under certain guaranteed benefit riders (each, a “Rider”) in their general accounts, the reduced potential risk of loss, and the potential for additional assets garnered due to the appeal to investors of the Riders combined with a particular asset allocation model. The Board also noted, on the other hand, that investors are expected to benefit from the ability to elect the Rider at a comparatively reduced guarantee price (in light of the performance profile of the Fund) and on comparatively better terms, than would be available in the absence of the Fund, while maintaining a decreased possibility of downside risk as well as decreased volatility of an investor’s overall fund allocation.
The Board reviewed information noting that HLIC, an affiliate of HL Advisors, will receive fees from HL Advisors for providing certain administrative services to the Fund, and that HLIC will also receive fees for fund accounting and related services from the Fund, and the Board considered information on expected profits to HLIC or its affiliates for such services. The Board also considered that Hartford Administrative Services Company, the Fund’s transfer agent and an affiliate of HL Advisors, will receive transfer agency compensation from the Fund.
The Board also considered that Hartford Securities Distribution Company, Inc., as principal underwriter of the Fund, will receive 12b-1 fees from the Fund. The Board also noted that certain affiliates of HL Advisors will distribute shares of the Fund and will receive compensation in that connection.
* * * *
Based upon its review of these various factors, among others, the Board concluded that it is in the best interests of the Fund and its shareholders for the Board to approve the Agreements. In reaching this decision, the Board did not assign relative weights to the factors discussed above or deem any one or group of them to be controlling in and of themselves. In connection with their deliberations, the Independent Directors met separately in executive session, with independent legal counsel, to review the relevant materials and consider their responsibilities under relevant laws and regulations.
36
| The Hartford | |
| P.O. Box 5085 | |
| Hartford, CT 06102-5085 |
Hartford Series Fund, Inc. is underwritten and distributed by Hartford Securities Distribution Company, Inc.
“The Hartford” is The Hartford Financial Services Group, Inc. and its subsidiaries.
Hartford Series Fund, Inc. inception dates range from 1977 to date. Hartford Series Fund, Inc. is not a subsidiary of The Hartford but is underwritten, distributed by and advised by subsidiaries of The Hartford. Investments in Hartford Series Fund, Inc. are not guaranteed by The Hartford or any other entity.
You should carefully consider investment objectives, risks, and charges and expenses of Hartford HLS Funds before investing. This and other information can be found in the Fund’s prospectus or summary prospectus, which can be obtained by calling 800-862-6668. Please read them carefully before you invest or send money.
HLSSAR-PD11 8-11 | 106632 | Printed in U.S.A ©2011 The Hartford, Hartford, CT 06115 |

A MESSAGE FROM THE PRESIDENT

Dear Fellow Shareholders:
I want to take this opportunity to say thank you for your continued confidence and trust.
We have seen a significant amount of global turbulence in the first half of 2011. Investors have continued to be concerned about the implications of the European sovereign debt crisis, as well as our own high levels of domestic debt. Since January we have witnessed significant political uprisings in the already-volatile Middle East and North Africa region. In addition, the ramifications of Japan's massive earthquake, subsequent tsunami, and nuclear disaster are still being played out in the market.
Although corporate earnings have remained robust, the unemployment picture has been mixed. After adding more than 200,000 jobs from February to April, more recent unemployment reports have shown a pullback in hiring.
While official inflation remains low as measured by the Consumer Price Index (CPI), high oil prices may be indicative of higher inflation in the future. The federal funds rate remains at a historic low, however, the Fed could potentially raise the rate to get it closer to its historical average once the economy strengthens.
Even with these headwinds, domestic, international, and world indices (as measured by the S&P 500, MSCI EAFE and MSCI World) are all up more than 5% through June, 30 2011.
Looking ahead, continued growth in emerging markets is fueling global recovery efforts. Emerging markets comprise about 48 percent of the world’s GDP, and many economists believe they are poised for further expansion. As GDP growth continues in emerging markets, roughly 100 million people are added to the middle class each year. This middle class population growth could potentially drive a considerable shift in consumer purchasing power.
Now that we have reached the midpoint of 2011, perhaps now would be a good time to schedule a meeting with your financial adviser to examine your current investment strategy and determine whether you are on the right track.
| • | Are you concerned about inflation and its effects on your portfolio? |
| • | Is your portfolio prepared for rising interest rates? |
| • | Does your portfolio reflect the global economy with a mix of developed nations and emerging markets? |
Your financial professional’s advice can help you to navigate today’s volatile markets with confidence. You can also rest assured that we will continue to provide you with solid investments and stellar service for the road ahead.
Thank you again for your business.

James Davey
President
Hartford HLS Funds
Hartford Small Company HLS Fund
| Manager Discussion (Unaudited) | 2 |
| Financial Statements | |
| 5 | |
| 10 | |
| 11 | |
| 12 | |
| 13 | |
| 14 | |
| 24 | |
| 26 | |
| 28 | |
| 28 | |
| 29 |
This report is prepared for the general information of contract owners and qualified retirement plan participants. It is not an offer of contracts or of qualified retirement plans. It should not be used in connection with any offer, except in conjunction with the appropriate product prospectus which contains all pertinent information including the applicable sales, administrative and other charges.
The views expressed in the Fund’s Manager Discussion under ‘‘Why did the Fund perform this way?’’ and ‘‘What is the outlook?’’ are views of the Fund’s sub-adviser and portfolio management team through the end of the reporting period and are subject to change based on market and other conditions.
Hartford Small Company HLS Fund inception 08/09/1996
(sub-advised by Wellington Management Company, LLP)
Investment objective – Seeks growth of capital.
Performance Overview 6/30/01 - 6/30/11

The chart above shows the growth of a $10,000 investment in Class IA. Growth results in classes other than Class IA will vary from what is seen above due to differences in the expenses charged to those share classes.
Average Annual Total Returns (as of 6/30/11)
6 Month† | 1 Year | 5 year | 10 year | |
| Small Company IA | 12.96% | 45.24% | 5.70% | 7.10% |
| Small Company IB | 12.79% | 44.84% | 5.45% | 6.84% |
| Russell 2000 Growth Index | 8.59% | 43.50% | 5.79% | 4.63% |
| † | Not Annualized |
PAST PERFORMANCE IS NOT INDICATIVE OF FUTURE RESULTS.
Total returns presented above were calculated using the Fund's net asset value available to shareholders for sale or redemption of Fund shares on June 30, 2011, which excludes investment transactions as of this date.
Russell 2000 Growth Index is an unmanaged index of those Russell 2000 Index growth companies with higher price-to-book ratios and higher forecasted growth values. (The Russell 2000 Index is a broad-based unmanaged index comprised of 2,000 of the smallest U.S.-domiciled company common stocks (on the basis of capitalization) that are traded in the United States on the New York Stock Exchange, American Stock Exchange and Nasdaq.)
You cannot invest directly in an index.
The chart represents a hypothetical investment in the Fund. Performance data represents past performance and current performance could be higher or lower.
Performance information may reflect historical or current expense waivers/reimbursements from the investment adviser, without which performance would have been lower. For information on current expense waivers/reimbursements, please see the prospectus.
The value of the fund will fluctuate so that when redeemed, it may be worth more or less than the original investment. The chart and table do not reflect the deductions of taxes, sales charges or other fees which may be applied at the variable life insurance, variable annuity or qualified retirement plan product level. Any such additional sales charges or other fees or expenses would lower the contract’s or plan’s performance.
| Portfolio Managers | ||
| Steven C. Angeli, CFA | Stephen C. Mortimer | Jamie A. Rome, CFA |
| Senior Vice President | Senior Vice President | Senior Vice President |
| Mario E. Abularach, CFA | Mammen Chally, CFA | |
| Vice President, Equity Research Analyst | Vice President | |
How did the Fund perform?
The Class IA shares of the Hartford Small Company HLS Fund returned 12.96% for the six-month period ended June 30, 2011, outperforming its benchmark, the Russell 2000 Growth Index which returned 8.59% for the same period. The Fund also outperformed the 10.47% return of the average fund in the Lipper Small-Cap Growth Funds VP-UF peer group, a group of funds with investment strategies similar to those of the Fund.
Why did the Fund perform this way?
The six-month period ended June 30, 2011 was a volatile period. Despite political upheaval in the Middle East and the impact of Japan’s natural disaster and resulting nuclear crisis, U.S. equities posted gains in the first quarter fueled by strong earnings results. However, in the second quarter, with renewed focus on the U.S. deficit and the prospect of slowing global growth, U.S. equities were mixed.
In this environment, small-cap, mid-cap and large-cap stocks all registered positive returns over the six-month period, as measured by the Russell 2000 (+6%), S&P MidCap 400 (+9%) and S&P 500 (+6%) Indices, respectively. Nine of ten sectors within the Russell 2000 Growth Index increased during the period. Telecommunication Services (+20%), Consumer Staples (+15%), and Health Care (+11%) sectors gained the most while Utilities (-6%) was the only sector to post a negative return.
The Fund outperformed its benchmark during the period due to strong stock selection primarily in Health Care, Consumer Discretionary, and Consumer Staples. This more than offset weak selection in Financials. Sector allocation, which is the residual result of bottom-up (i.e. stock by stock fundamental research) stock selection, was unfavorable during the period. In particular, an overweight (i.e. the Fund’s sector position was greater than the benchmark position) position in Energy and an underweight (i.e. the Fund’s sector position was less than the benchmark position) in Telecommunication Services detracted from benchmark relative performance. A modest cash position hurt relative returns in a rising equity market.
Top contributors to relative performance during the period included Green Mountain Coffee Roasters (Consumer Staples), Tempur-Pedic International (Consumer Discretionary), and Polycom (Information Technology).
Shares of Green Mountain Coffee Roasters, a specialty coffee and brewing systems company, soared as core results topped expectations and management raised guidance amid strong sales growth of the firms’ Keurig single serving products. Shares of Tempur-Pedic International, a leading global manufacturer of premium mattresses and pillows, rose as sales and profits exceeded expectations and the firm made progress in enhancing its product range and consumer marketing efforts. Shares of Polycom, a voice and video conferencing equipment and service provider, rallied after results exceeded market expectations with broad-based bookings momentum and revenue growth across major geographies and product categories. Additionally, Pharmasset (Health Care) was among the top contributors to absolute performance (i.e. total return).
Stocks that detracted the most from relative returns during the period were QuinStreet (Information Technology), Demand Media (Information Technology), and Dominos Pizza U.K. & Ireland (Consumer Discretionary). Shares of QuinStreet, an internet marketing and media firm, declined after the company forecasted weaker-than-expected revenue and growth for fiscal year 2012. Shares of online news and content provider Demand Media declined after a report that the company’s flagship website had seen its exposure on Google’s search engine fall sharply. Shares of Dominos Pizza U.K. & Ireland, the largest U.K. home delivery pizza operator, came under pressure after the company posted weaker-than-expected same store sales early in the year. Additionally Salix Pharmaceutical (Health Care) was among the top detractors from absolute performance.
What is the outlook?
While the global expansion continues, it is faced with a growing list of risks, including the crisis in Japan, political tensions in the Middle East/North Africa region, rekindled concern over sovereign debt contagion in Europe, and recent weakness in both consumer and manufacturing data globally. Despite these macroeconomic headwinds, corporate earnings remain a bright spot. We believe we are on pace for record earnings by 2012, with historically robust balance sheets that are supportive of both investment and a return of capital to shareholders. Within the context of these countervailing forces, we believe that global growth will continue although the rate of growth could slow.
The Fund continues to focus on stocks of companies that we see as having unique business models or special market opportunities that should allow them to deliver superior growth regardless of the pace of economic recovery. The annual Russell 2000 Growth Index re-balance in June impacted our relative weightings in certain sectors. Our bottom-up, fundamental research-driven stock-by-stock investment decisions combined with the Index rebalance led to overweights in Consumer Discretionary, Industrials, and Information Technology relative to the Russell 2000 Growth Index at the end of the period. The Fund ended the period most underweight Financials, Energy, and Materials.
| Diversification by Industry | ||||
| as of June 30, 2011 | ||||
| Percentage of | ||||
| Industry (Sector) | Net Assets | |||
Automobiles & Components (Consumer Discretionary) | 1.4 | % | ||
| Banks (Financials) | 1.4 | |||
| Capital Goods (Industrials) | 9.8 | |||
| Commercial & Professional Services (Industrials) | 2.8 | |||
Consumer Durables & Apparel (Consumer Discretionary) | 4.5 | |||
| Consumer Services (Consumer Discretionary) | 4.4 | |||
| Diversified Financials (Financials) | 2.1 | |||
| Energy (Energy) | 6.5 | |||
| Food & Staples Retailing (Consumer Staples) | 0.4 | |||
| Food, Beverage & Tobacco (Consumer Staples) | 2.4 | |||
| Health Care Equipment & Services (Health Care) | 9.7 | |||
| Household & Personal Products (Consumer Staples) | 0.5 | |||
| Insurance (Financials) | 0.4 | |||
| Materials (Materials) | 3.7 | |||
| Media (Consumer Discretionary) | 0.6 | |||
| Other Investment Pools and Funds (Financials) | 0.7 | |||
Pharmaceuticals, Biotechnology & Life Sciences (Health Care) | 9.5 | |||
| Real Estate (Financials) | 0.8 | |||
| Retailing (Consumer Discretionary) | 5.8 | |||
Semiconductors & Semiconductor Equipment (Information Technology) | 5.0 | |||
| Software & Services (Information Technology) | 13.5 | |||
Technology Hardware & Equipment (Information Technology) | 6.6 | |||
| Telecommunication Services (Services) | 0.5 | |||
| Transportation (Industrials) | 4.2 | |||
| Utilities (Utilities) | 0.5 | |||
| Short-Term Investments | 2.4 | |||
| Other Assets and Liabilities | (0.1 | ) | ||
| Total | 100.0 | % | ||
Schedule of Investments June 30, 2011 (Unaudited) |
| (000’s Omitted) |
| Shares or Principal Amount | Market Value ╪ | ||||||
| COMMON STOCKS - 96.9% | |||||||
| Automobiles & Components - 1.4% | |||||||
| 174 | Amerigon, Inc. ● | $ | 3,021 | ||||
| 66 | Autometal S.A. | 637 | |||||
| 154 | Dana Holding Corp. ● | 2,816 | |||||
| 115 | Tenneco Automotive, Inc. ● | 5,055 | |||||
| 74 | Tesla Motors, Inc. ● | 2,157 | |||||
| 304 | Thor Industries, Inc. | 8,753 | |||||
| 22,439 | |||||||
| Banks - 1.4% | |||||||
| 264 | Boston Private Financial Holdings, Inc. | 1,740 | |||||
| 66 | Columbia Banking Systems, Inc. | 1,133 | |||||
| 99 | First Midwest Bancorp, Inc. | 1,215 | |||||
| 231 | Flushing Financial Corp. | 3,003 | |||||
| 68 | Hudson Valley Holding Corp. | 1,321 | |||||
| 118 | MGIC Investment Corp. ● | 701 | |||||
| 130 | Northwest Bancshares, Inc. | 1,635 | |||||
| 156 | Signature Bank ● | 8,900 | |||||
| 41 | Southside Bancshares, Inc. | 807 | |||||
| 43 | Wintrust Financial Corp. | 1,381 | |||||
| 21,836 | |||||||
| Capital Goods - 9.8% | |||||||
| 85 | A.O. Smith Corp. | 3,585 | |||||
| 56 | Aaon, Inc. | 1,219 | |||||
| 53 | Acuity Brands, Inc. | 2,965 | |||||
| 214 | Aecom Technology Corp. ● | 5,854 | |||||
| 24 | AGCO Corp. ● | 1,180 | |||||
| 161 | Altra Holdings, Inc. ● | 3,867 | |||||
| 125 | Applied Industrial Technologies, Inc. | 4,437 | |||||
| 53 | AZZ, Inc. | 2,428 | |||||
| 219 | Beacon Roofing Supply, Inc. ● | 5,000 | |||||
| 37 | Carlisle Cos., Inc. | 1,818 | |||||
| 118 | Ceradyne, Inc. ● | 4,597 | |||||
| 101 | Chart Industries, Inc. ● | 5,467 | |||||
| 423 | Commercial Vehicles Group, Inc. ● | 6,004 | |||||
| 35 | Crane Co. | 1,747 | |||||
| 404 | DigitalGlobe, Inc. ● | 10,269 | |||||
| 51 | EMCOR Group, Inc. ● | 1,505 | |||||
| 58 | Esterline Technologies Corp. ● | 4,446 | |||||
| 60 | Franklin Electric Co., Inc. | 2,826 | |||||
| 192 | GrafTech International Ltd. ● | 3,890 | |||||
| 49 | Harsco Corp. | 1,597 | |||||
| 148 | Kratos Defense & Security ● | 1,801 | |||||
| 45 | Lennox International, Inc. | 1,942 | |||||
| 23 | Lindsay Corp. | 1,586 | |||||
| 692 | Meritor, Inc. ● | 11,105 | |||||
| 66 | Michael Baker Corp. ● | 1,396 | |||||
| 223 | Moog, Inc. Class A ● | 9,701 | |||||
| 128 | Nordson Corp. | 7,002 | |||||
| 315 | RSC Holdings, Inc. ● | 3,770 | |||||
| 46 | SauerDanfoss, Inc. ● | 2,296 | |||||
| 47 | Sun Hydraulics Corp. | 2,238 | |||||
| 49 | TAL International Group, Inc. | 1,682 | |||||
| 65 | Teledyne Technologies, Inc. ● | 3,255 | |||||
| 52 | Textainer Group Holdings Ltd. | 1,611 | |||||
| 45 | TransDigm Group, Inc. ● | 4,085 | |||||
| 97 | Trex Co., Inc. ● | 2,375 | |||||
| 146 | Trimas Corp. ● | 3,618 | |||||
| 603 | United Rentals, Inc. ● | 15,306 | |||||
| 158 | Wabash National Corp. ● | 1,480 | |||||
| 41 | Woodward, Inc. | 1,438 | |||||
| 152,388 | |||||||
| Commercial & Professional Services - 2.8% | |||||||
| 11 | Advisory Board Co. ● | 650 | |||||
| 319 | APAC TeleServices, Inc. ● | 1,701 | |||||
| 22 | Consolidated Graphics, Inc. ● | 1,187 | |||||
| 484 | Corrections Corp. of America ● | 10,482 | |||||
| 82 | Deluxe Corp. | 2,029 | |||||
| 409 | Geo Group, Inc. ● | 9,408 | |||||
| 2 | Interface, Inc. | 42 | |||||
| 89 | Knoll, Inc. | 1,793 | |||||
| 531 | Sykes Enterprises, Inc. ● | 11,440 | |||||
| 35 | Towers Watson & Co. | 2,288 | |||||
| 58 | TrueBlue, Inc. ● | 843 | |||||
| 48 | United Stationers, Inc. | 1,709 | |||||
| 43,572 | |||||||
| Consumer Durables & Apparel - 4.4% | |||||||
| 436 | Brunswick Corp. | 8,896 | |||||
| 50 | Carter's, Inc. ● | 1,530 | |||||
| 111 | Columbia Sportswear Co. | 7,030 | |||||
| 402 | Eastman Kodak Co. ● | 1,438 | |||||
| 447 | Hanesbrands, Inc. ● | 12,772 | |||||
| 105 | Iconix Brand Group, Inc. ● | 2,534 | |||||
| 56 | Maidenform Brands, Inc. ● | 1,536 | |||||
| 68 | Polaris Industries, Inc. | 7,524 | |||||
| 120 | Skechers USA, Inc. Class A ● | 1,730 | |||||
| 231 | Steven Madden Ltd. ● | 8,665 | |||||
| 124 | Tempur-Pedic International, Inc. ● | 8,402 | |||||
| 125 | Warnaco Group, Inc. ● | 6,519 | |||||
| 68,576 | |||||||
| Consumer Services - 4.4% | |||||||
| 46 | Bally Technologies, Inc. ● | 1,855 | |||||
| 464 | Cheesecake Factory, Inc. ● | 14,570 | |||||
| 1,278 | Domino's Pizza UK & IRL plc | 8,276 | |||||
| 619 | Estacio Participacoes S.A. | 7,968 | |||||
| 49 | Gaylord Entertainment Co. ● | 1,470 | |||||
| 124 | Grand Canyon Education, Inc. ● | 1,751 | |||||
| 126 | K12, Inc. ● | 4,182 | |||||
| 97 | Lincoln Educational Services Corp. | 1,669 | |||||
| 86 | P.F. Chang's China Bistro, Inc. | 3,454 | |||||
| 89 | Regis Corp. | 1,367 | |||||
| 36 | Steiner Leisure Ltd. ● | 1,622 | |||||
| 13 | Strayer Education, Inc. | 1,618 | |||||
| 234 | Texas Roadhouse, Inc. | 4,109 | |||||
| 178 | Weight Watchers International, Inc. | 13,448 | |||||
| 127 | Whistler Blackcomb Holdings, Inc. | 1,526 | |||||
| 68,885 | |||||||
| Diversified Financials - 2.1% | |||||||
| 199 | BGC Partners, Inc. | 1,539 | |||||
| 123 | Compass Diversified Holdings | 2,027 | |||||
| 393 | Cowen Group, Inc. Class A ● | 1,478 | |||||
| 253 | Dollar Financial Corp. ● | 5,467 | |||||
| 186 | Evercore Partners, Inc. | 6,181 | |||||
| 136 | Fifth Street Finance Corp. | 1,574 | |||||
| 279 | Gain Capital Holdings, Inc. ● | 1,900 | |||||
| 64 | Green Dot Corp. ● | 2,180 | |||||
| 411 | Justice Holdings Ltd. ● | 6,460 | |||||
| 124 | Knight Capital Group, Inc. ● | 1,368 | |||||
| 168 | Netspend Holdings, Inc. ● | 1,677 | |||||
The accompanying notes are an integral part of these financial statements.
| Hartford Small Company HLS Fund |
| Schedule of Investments – (continued) |
| June 30, 2011 (Unaudited) |
| (000’s Omitted) |
| Shares or Principal Amount | Market Value ╪ | ||||||
| COMMON STOCKS - 96.9% - (continued) | |||||||
| Diversified Financials - 2.1% - (continued) | |||||||
| 219 | Uranium Participation Corp. ● | $ | 1,446 | ||||
| 33,297 | |||||||
| Energy - 6.5% | |||||||
| 67 | Approach Resources, Inc. ● | 1,508 | |||||
| 114 | Berry Petroleum Co. | 6,051 | |||||
| 401 | BPZ Resources, Inc. ● | 1,315 | |||||
| 154 | C&J Energy Services, Inc. ⌂●† | 2,387 | |||||
| 23 | Clayton Williams Energy, Inc. ● | 1,381 | |||||
| 104 | Complete Production Services, Inc. ● | 3,479 | |||||
| 138 | CVR Energy, Inc. ● | 3,388 | |||||
| 336 | Gulfmark Offshore, Inc. ● | 14,844 | |||||
| 158 | Hornbeck Offshore Services, Inc. ● | 4,334 | |||||
| 711 | ION Geophysical Corp. ● | 6,730 | |||||
| 474 | James River Coal Co. ● | 9,872 | |||||
| 222 | Karoon Gas Australia Ltd. ● | 1,253 | |||||
| 604 | Kodiak Oil & Gas Corp. ● | 3,487 | |||||
| 75 | Northern Oil and Gas, Inc. ● | 1,650 | |||||
| 3,196 | Oilsands Quest, Inc. ● | 1,023 | |||||
| 150 | Petroleum Development Corp. ● | 4,491 | |||||
| 366 | Rosetta Resources, Inc. ● | 18,886 | |||||
| 39 | Swift Energy Co. ● | 1,461 | |||||
| 176 | Tidewater, Inc. | 9,481 | |||||
| 280 | Vaalco Energy, Inc. ● | 1,685 | |||||
| 802 | Vantage Drilling Co. ● | 1,460 | |||||
| 100,166 | |||||||
| Food & Staples Retailing - 0.4% | |||||||
| 145 | Fresh Market, Inc. ● | 5,617 | |||||
| Food, Beverage & Tobacco - 2.4% | |||||||
| 12 | Boston Beer Co., Inc. Class A ● | 1,047 | |||||
| 109 | Cosan S.A. Industria E Comercio | 1,710 | |||||
| 335 | Darling International, Inc. ● | 5,935 | |||||
| 39 | Diamond Foods, Inc. | 2,962 | |||||
| 186 | GrainCorp Ltd. | 1,658 | |||||
| 258 | Green Mountain Coffee Roasters, Inc. ● | 23,021 | |||||
| 142 | Viterra, Inc. | 1,544 | |||||
| 37,877 | |||||||
| Health Care Equipment & Services - 9.7% | |||||||
| 333 | Abiomed, Inc. ● | 5,387 | |||||
| 407 | Allscripts Healthcare Solutions, Inc. ● | 7,895 | |||||
| 60 | AmSurg Corp. ● | 1,565 | |||||
| 184 | Angiodynamics, Inc. ● | 2,612 | |||||
| 193 | Catalyst Health Solutions ● | 10,747 | |||||
| 54 | Corvel Corp. ● | 2,533 | |||||
| 89 | Cyberonics, Inc. ● | 2,478 | |||||
| 236 | Dexcom, Inc. ● | 3,415 | |||||
| 49 | Ensign Group, Inc. | 1,492 | |||||
| 154 | Gen-Probe, Inc. ● | 10,617 | |||||
| 57 | Greatbatch, Inc. ● | 1,539 | |||||
| 61 | Hanger Orthopedic Group, Inc. ● | 1,488 | |||||
| 81 | HealthSouth Corp. ● | 2,127 | |||||
| 150 | Healthspring, Inc. ● | 6,898 | |||||
| 122 | Heartware International, Inc. ● | 9,040 | |||||
| 38 | ICU Medical, Inc. ● | 1,648 | |||||
| 229 | Insulet Corp. ● | 5,069 | |||||
| 53 | LHC Group, Inc. ● | 1,231 | |||||
| 104 | Masimo Corp. | 3,072 | |||||
| 22 | MEDNAX, Inc. ● | 1,581 | |||||
| 273 | NuVasive, Inc. ● | 8,985 | |||||
| 91 | Orthofix International N.V. ● | 3,853 | |||||
| 140 | Owens & Minor, Inc. | 4,832 | |||||
| 188 | SXC Health Solutions Corp. ● | 11,105 | |||||
| 90 | U.S. Physical Therapy, Inc. | 2,221 | |||||
| 342 | Volcano Corp. ● | 11,038 | |||||
| 239 | Wellcare Health Plans, Inc. ● | 12,310 | |||||
| 241 | Zoll Medical Corp. ● | 13,656 | |||||
| 150,434 | |||||||
| Household & Personal Products - 0.5% | |||||||
| 159 | China-Biotics, Inc. ⌂●† | 274 | |||||
| 185 | Nu Skin Enterprises, Inc. Class A | 6,958 | |||||
| 7,232 | |||||||
| Insurance - 0.4% | |||||||
| 36 | Allied World Assurance Holdings Ltd. | 2,090 | |||||
| 114 | Amerisafe, Inc. ● | 2,588 | |||||
| 39 | Platinum Underwriters Holdings Ltd. | 1,310 | |||||
| 5,988 | |||||||
| Materials - 3.7% | |||||||
| 41 | Allied Nevada Gold Corp. ● | 1,436 | |||||
| 32 | AptarGroup, Inc. | 1,654 | |||||
| 2,745 | Aurcana Corp. ● | 1,707 | |||||
| 217 | Detour Gold Corp. ● | 6,283 | |||||
| 108 | Georgia Gulf Corp. ● | 2,595 | |||||
| 446 | Graphic Packaging Holding Co. ● | 2,427 | |||||
| 89 | Kraton Performance Polymers ● | 3,485 | |||||
| 316 | Methanex Corp. ADR | 9,901 | |||||
| 33 | Molycorp, Inc. ● | 2,039 | |||||
| 170 | New Gold, Inc. ● | 1,753 | |||||
| 137 | Olin Corp. | 3,105 | |||||
| 50 | Rock Tenn Co. Class A | 3,319 | |||||
| 794 | Romarco Minerals, Inc. ● | 1,349 | |||||
| 204 | Silgan Holdings, Inc. | 8,346 | |||||
| 138 | Stillwater Mining Co. ● | 3,044 | |||||
| 46 | TPC Group, Inc. ● | 1,812 | |||||
| 42 | Universal Stainless & Alloy Products ● | 1,941 | |||||
| 110 | Winpak Ltd. | 1,379 | |||||
| 57,575 | |||||||
| Media - 0.6% | |||||||
| 450 | Cinemark Holdings, Inc. | 9,322 | |||||
| Pharmaceuticals, Biotechnology & Life Sciences - 9.5% | |||||||
| 330 | Alkermes, Inc. ● | 6,142 | |||||
| 150 | Ardea Biosciences, Inc. ● | 3,819 | |||||
| 898 | Arena Pharmaceuticals, Inc. ● | 1,221 | |||||
| 240 | Bruker Corp. ● | 4,881 | |||||
| 303 | Cadence Pharmaceuticals, Inc. ● | 2,785 | |||||
| 177 | Cubist Pharmaceuticals, Inc. ● | 6,368 | |||||
| 659 | Exelixis, Inc. ● | 5,904 | |||||
| 464 | Immunogen, Inc. ● | 5,651 | |||||
| 544 | Incyte Corp. ● | 10,311 | |||||
| 643 | Ironwood Pharmaceuticals, Inc. ● | 10,112 | |||||
| 346 | Medicines Co. ● | 5,706 | |||||
| 68 | Momenta Pharmaceuticals, Inc. ● | 1,323 | |||||
| 276 | NPS Pharmaceuticals, Inc. ● | 2,605 | |||||
| 309 | Onyx Pharmaceuticals, Inc. ● | 10,917 | |||||
| 423 | PAREXEL International Corp. ● | 9,967 | |||||
| 455 | Pharmaceutical Product Development, Inc. | 12,204 | |||||
| 41 | Pharmasset, Inc. ● | 4,601 | |||||
| 76 | Regeneron Pharmaceuticals, Inc. ● | 4,303 | |||||
The accompanying notes are an integral part of these financial statements.
| Shares or Principal Amount | Market Value ╪ | ||||||
| COMMON STOCKS - 96.9% - (continued) | |||||||
Pharmaceuticals, Biotechnology & Life Sciences - 9.5% - (continued) | |||||||
| 494 | Rigel Pharmaceuticals, Inc. ● | $ | 4,527 | ||||
| 351 | Salix Pharmaceuticals Ltd. ● | 14,000 | |||||
| 685 | Seattle Genetics, Inc. ● | 14,062 | |||||
| 326 | WuXi PharmaTech Cayman, Inc. ● | 5,718 | |||||
| 147,127 | |||||||
| Real Estate - 0.8% | |||||||
| 198 | Anworth Mortgage Asset Corp. | 1,489 | |||||
| 106 | Capstead Mortgage Corp. | 1,414 | |||||
| 106 | Colonial Properties Trust | 2,158 | |||||
| 51 | Hatteras Financial Corp. | 1,431 | |||||
| 136 | Medical Properties Trust, Inc. | 1,565 | |||||
| 296 | MFA Mortgage Investments, Inc. | 2,377 | |||||
| 139 | Summit Hotel Properties, Inc. | 1,572 | |||||
| 38 | Whitestone REIT | 489 | |||||
| 12,495 | |||||||
| Retailing - 5.8% | |||||||
| 358 | Brown (N) Group plc | 1,512 | |||||
| 65 | Cato Corp. | 1,858 | |||||
| 105 | Children's Place Retail Stores, Inc. ● | 4,694 | |||||
| 92 | Core-Mark Holding Co., Inc. ● | 3,285 | |||||
| 1,402 | Debenhams plc | 1,552 | |||||
| 71 | DSW, Inc. ● | 3,608 | |||||
| 584 | Express, Inc. | 12,726 | |||||
| 349 | GNC Holdings, Inc. ● | 7,614 | |||||
| 41 | Guess?, Inc. | 1,720 | |||||
| 209 | Hot Topic, Inc. | 1,551 | |||||
| 69 | Joseph A. Bank Clothiers, Inc. ● | 3,462 | |||||
| 34 | LKQ Corp. ● | 889 | |||||
| 342 | Lumber Liquidators Holdings, Inc. ● | 8,697 | |||||
| 154 | PetMed Express, Inc. | 1,825 | |||||
| 105 | rue21, Inc. ● | 3,405 | |||||
| 275 | Shutterfly, Inc. ● | 15,795 | |||||
| 253 | Ulta Salon, Cosmetics & Fragrances, Inc. ● | 16,347 | |||||
| 90,540 | |||||||
| Semiconductors & Semiconductor Equipment - 5.0% | |||||||
| 805 | Applied Micro Circuits Corp. ● | 7,131 | |||||
| 35 | Cabot Microelectronics Corp. ● | 1,604 | |||||
| 192 | Cavium, Inc. ● | 8,348 | |||||
| 182 | Cymer, Inc. ● | 9,010 | |||||
| 357 | GT Solar International, Inc. ● | 5,787 | |||||
| 263 | Integrated Device Technology, Inc. ● | 2,070 | |||||
| 389 | Mindspeed Technologies, Inc. ● | 3,114 | |||||
| 167 | MIPS Technologies, Inc. Class A ● | 1,153 | |||||
| 124 | Nanometrics, Inc. ● | 2,357 | |||||
| 239 | Netlogic Microsystems, Inc. ● | 9,658 | |||||
| 64 | OmniVision Technologies, Inc. ● | 2,238 | |||||
| 160 | ON Semiconductor Corp. ● | 1,674 | |||||
| 204 | PMC - Sierra, Inc. ● | 1,541 | |||||
| 264 | Silicon Image, Inc. ● | 1,707 | |||||
| 475 | Skyworks Solutions, Inc. ● | 10,906 | |||||
| 50 | Tessera Technologies, Inc. ● | 855 | |||||
| 530 | TriQuint Semiconductor, Inc. ● | 5,405 | |||||
| 79 | Ultratech Stepper, Inc. ● | 2,395 | |||||
| 76,953 | |||||||
| Software & Services - 13.5% | |||||||
| 315 | Ancestry.com, Inc. ● | 13,058 | |||||
| 18 | Ariba, Inc. ● | 620 | |||||
| 248 | Broadsoft, Inc. ● | 9,451 | |||||
| 1,448 | Cadence Design Systems, Inc. ● | 15,290 | |||||
| 306 | Commvault Systems, Inc. ● | 13,623 | |||||
| 182 | Concur Technologies, Inc. ● | 9,097 | |||||
| 101 | Constant Contact, Inc. ● | 2,561 | |||||
| 113 | CSG Systems International, Inc. ● | 2,082 | |||||
| 445 | Demand Media, Inc. ● | 6,036 | |||||
| 514 | Dice Holdings, Inc. ● | 6,945 | |||||
| 193 | Fortinet, Inc. ● | 5,278 | |||||
| 183 | j2 Global Communications, Inc. ● | 5,175 | |||||
| 133 | JDA Software Group, Inc. ● | 4,103 | |||||
| 158 | Kit Digital, Inc. ● | 1,889 | |||||
| 484 | LivePerson, Inc. ● | 6,843 | |||||
| 516 | Magma Design Automation, Inc. ● | 4,126 | |||||
| 18 | Mercadolibre, Inc. | 1,452 | |||||
| 76 | Nuance Communications, Inc. ● | 1,625 | |||||
| 91 | Opnet Technologies, Inc. | 3,733 | |||||
| 293 | Parametric Technology Corp. ● | 6,715 | |||||
| 51 | Progress Software Corp. ● | 1,234 | |||||
| 158 | QLIK Technologies, Inc. ● | 5,388 | |||||
| 121 | Quest Software, Inc. ● | 2,740 | |||||
| 162 | Quinstreet, Inc. ● | 2,099 | |||||
| 258 | RealPage, Inc. ● | 6,842 | |||||
| 91 | RightNow Technologies, Inc. ● | 2,952 | |||||
| 1,143 | Sapient Corp. ● | 17,185 | |||||
| 211 | Solarwinds, Inc. ● | 5,518 | |||||
| 100 | Solera Holdings, Inc. | 5,909 | |||||
| 70 | Sourcefire, Inc. ● | 2,077 | |||||
| 137 | SuccessFactors, Inc. ● | 4,040 | |||||
| 143 | Syntel, Inc. | 8,441 | |||||
| 157 | Tibco Software, Inc. ● | 4,560 | |||||
| 549 | Velti plc ● | 9,279 | |||||
| 92 | VeriFone Systems, Inc. ● | 4,100 | |||||
| 109 | Wright Express Corp. ● | 5,660 | |||||
| 145 | XO Group, Inc. ● | 1,446 | |||||
| 209,172 | |||||||
| Technology Hardware & Equipment - 6.6% | |||||||
| 144 | Acme Packet, Inc. ● | 10,132 | |||||
| 146 | ADTRAN, Inc. | 5,653 | |||||
| 140 | Arris Group, Inc. ● | 1,628 | |||||
| 478 | Aruba Networks, Inc. ● | 14,134 | |||||
| 216 | Brocade Communications Systems, Inc. ● | 1,397 | |||||
| 95 | Coherent, Inc. ● | 5,252 | |||||
| 124 | Comverse Technology, Inc. ● | 961 | |||||
| 130 | Emulex Corp. ● | 1,114 | |||||
| 83 | Fabrinet ● | 2,006 | |||||
| 178 | Finisar Corp. ● | 3,213 | |||||
| 81 | Interdigital, Inc. | 3,327 | |||||
| 926 | Jabil Circuit, Inc. | 18,697 | |||||
| 417 | Mitel Networks Corp. ● | 1,827 | |||||
| 44 | Netgear, Inc. ● | 1,941 | |||||
| 165 | Oplink Communications, Inc. ● | 3,076 | |||||
| 57 | Park Electrochemical Corp. | 1,593 | |||||
| 87 | Plantronics, Inc. | 3,176 | |||||
| 193 | Polycom, Inc. ● | 12,390 | |||||
| 62 | Riverbed Technology, Inc. ● | 2,466 | |||||
| 106 | Super Micro Computer, Inc. ● | 1,698 | |||||
| 171 | Universal Display Corp. ● | 6,017 | |||||
| 101,698 | |||||||
| Telecommunication Services - 0.5% | |||||||
| 30 | AboveNet, Inc. | 2,122 | |||||
The accompanying notes are an integral part of these financial statements.
| Hartford Small Company HLS Fund |
| Schedule of Investments – (continued) |
| June 30, 2011 (Unaudited) |
| (000’s Omitted) |
Shares or Principal Amount | Market Value ╪ | |||||||||||
| COMMON STOCKS - 96.9% - (continued) | ||||||||||||
| Telecommunication Services - 0.5% - (continued) | ||||||||||||
| 346 | Leap Wireless International, Inc. ● | $ | 5,614 | |||||||||
| 7,736 | ||||||||||||
| Transportation - 4.2% | ||||||||||||
| 209 | Con-way, Inc. | 8,124 | ||||||||||
| 197 | Copa Holdings S.A. Class A | 13,154 | ||||||||||
| 214 | J.B. Hunt Transport Services, Inc. | 10,057 | ||||||||||
| 26 | Kirby Corp. ● | 1,462 | ||||||||||
| 394 | Localiza Rent a Car S.A. | 7,001 | ||||||||||
| 66 | Marten Transport Ltd. | 1,417 | ||||||||||
| 327 | Old Dominion Freight Line, Inc. ● | 12,199 | ||||||||||
| 485 | Werner Enterprises, Inc. | 12,139 | ||||||||||
| 2 | Zipcar, Inc. ● | 37 | ||||||||||
| 65,590 | ||||||||||||
| Utilities - 0.5% | ||||||||||||
| 65 | Portland General Electric Co. | 1,648 | ||||||||||
| 122 | UniSource Energy Corp. | 4,566 | ||||||||||
| 57 | Westar Energy, Inc. | 1,531 | ||||||||||
| 7,745 | ||||||||||||
| Total common stocks | ||||||||||||
| (cost $1,237,473) | $ | 1,504,260 | ||||||||||
| PREFERRED STOCKS - 0.1% | ||||||||||||
| Consumer Durables & Apparel - 0.1% | ||||||||||||
| 15 | Callaway Golf Co., 7.50% ۞ | $ | 1,591 | |||||||||
| Total preferred stocks | ||||||||||||
| (cost $1,699) | $ | 1,591 | ||||||||||
| EXCHANGE TRADED FUNDS - 0.7% | ||||||||||||
| Other Investment Pools and Funds - 0.7% | ||||||||||||
| 119 | iShares Russell 2000 Growth Index Fund | $ | 11,287 | |||||||||
| Total exchange traded funds | ||||||||||||
| (cost $9,882) | $ | 11,287 | ||||||||||
| Total long-term investments | ||||||||||||
| (cost $1,249,054) | $ | 1,517,138 | ||||||||||
| SHORT-TERM INVESTMENTS - 2.4% | ||||||||||||
| Repurchase Agreements - 2.4% | ||||||||||||
| Bank of America Merrill Lynch TriParty Joint | ||||||||||||
| Repurchase Agreement (maturing on | ||||||||||||
| 07/01/2011 in the amount of $3,653, | ||||||||||||
| collateralized by FHLB 4.91%, 2015, | ||||||||||||
| GNMA 0.87% - 5.72%, 2025 - 2061, value | ||||||||||||
| of $3,726) | ||||||||||||
| $ | 3,653 | 0.05%, 06/30/2011 | $ | 3,653 | ||||||||
| BNP Paribas Securities Corp. TriParty Joint | ||||||||||||
| Repurchase Agreement (maturing on | ||||||||||||
| 07/01/2011 in the amount of $2,749, | ||||||||||||
| collateralized by FNMA 3.50% - 6.50%, | ||||||||||||
| 2023 - 2041, value of $2,804) | ||||||||||||
| 2,749 | 0.05%, 06/30/2011 | 2,749 | ||||||||||
| Deutsche Bank Securities TriParty Joint | ||||||||||||
| Repurchase Agreement (maturing on | ||||||||||||
| 07/01/2011 in the amount of $26,589, | ||||||||||||
| collateralized by GNMA 4.00% - 7.00%, | ||||||||||||
| 2035 - 2040, value of $27,121) | ||||||||||||
| 26,589 | 0.05%, 06/30/2011 | 26,589 | ||||||||||
| UBS Securities, Inc. Joint Repurchase | ||||||||||||
| Agreement (maturing on 07/01/2011 in the | ||||||||||||
| amount of $53, collateralized by U.S. | ||||||||||||
| Treasury Bill 0.63%, 2012, value of $54) | ||||||||||||
| 53 | 0.01%, 06/30/2011 | 53 | ||||||||||
| UBS Securities, Inc. TriParty Joint | ||||||||||||
| Repurchase Agreement (maturing on | ||||||||||||
| 07/01/2011 in the amount of $4,058, | ||||||||||||
| collateralized by FHLMC 4.50%, 2040, | ||||||||||||
| FNMA 4.50% - 6.00%, 2035 - 2041, value | ||||||||||||
| of $4,140) | ||||||||||||
| 4,058 | 0.06%, 06/30/2011 | 4,058 | ||||||||||
| 37,102 | ||||||||||||
| Total short-term investments | ||||||||||||
| (cost $37,102) | $ | 37,102 | ||||||||||
| Total investments | ||||||||||||
(cost $1,286,156) ▲ | 100.1 | % | $ | 1,554,240 | ||||||||
| Other assets and liabilities | (0.1 | )% | (1,255 | ) | ||||||||
| Total net assets | 100.0 | % | $ | 1,552,985 | ||||||||
The accompanying notes are an integral part of these financial statements.
| Note: | Percentage of investments as shown is the ratio of the total market value to total net assets. Market value of investments in foreign securities represents 5.4% of total net assets at June 30, 2011. |
Prices of foreign equities that are principally traded on certain foreign markets may be adjusted daily pursuant to a fair value pricing service approved by the Board of Directors in order to reflect an adjustment for factors occurring after the close of certain foreign markets but before the close of the New York Stock Exchange.
| ▲ | At June 30, 2011, the cost of securities for federal income tax purposes was $1,292,689 and the aggregate gross unrealized appreciation and depreciation based on that cost were: |
| Unrealized Appreciation | $ | 302,539 | ||
| Unrealized Depreciation | (40,988 | ) | ||
| Net Unrealized Appreciation | $ | 261,551 |
| † | The aggregate value of securities valued in good faith at fair value as determined under policies and procedures established by and under the supervision of the Company's Board of Directors at June 30, 2011, was $2,661, which represents 0.17% of total net assets. This amount excludes securities that are principally traded in certain foreign markets and whose prices are adjusted pursuant to a third party pricing service methodology approved by the Board of Directors. |
| ● | Currently non-income producing. |
| ۞ | Convertible security. |
| ⌂ | The following securities are considered illiquid. Illiquid securities are often purchased in private placement transactions, are often not registered under the Securities Act of 1933 and may have contractual restrictions on resale. A security may also be considered illiquid if the security lacks a readily available market or if its valuation has not changed for a certain period of time. |
| Period Acquired | Shares/ Par | Security | Cost Basis | |||||||
| 12/2010 | 154 | C&J Energy Services, Inc. - 144A | $ | 1,540 | ||||||
| 07/2010 - 04/2011 | 159 | China-Biotics, Inc. | 1,564 | |||||||
The aggregate value of these securities at June 30, 2011, was $2,661, which represents 0.17% of total net assets.
Foreign Currency Contracts Outstanding at June 30, 2011
| Unrealized | |||||||||||||||||
| Contract | Appreciation/ | ||||||||||||||||
| Description | Counterparty | Buy / Sell | Market Value ╪ | Amount | Delivery Date | (Depreciation) | |||||||||||
| Canadian Dollar | Banc of America Securities | Sell | $ | 18 | $ | 18 | 07/08/2011 | $ | – | ||||||||
| $ | – | ||||||||||||||||
| ╪ | See Significant Accounting Policies of accompanying Notes to Financial Statements regarding valuation of securities. |
The accompanying notes are an integral part of these financial statements.
| Investment Valuation Hierarchy Level Summary |
| June 30, 2011 (Unaudited) |
| (000’s Omitted) |
| Total | Level 1 ♦ | Level 2 ♦ | Level 3 | |||||||||||||
| Assets: | ||||||||||||||||
Common Stocks ‡ | $ | 1,504,260 | $ | 1,488,860 | $ | 12,739 | $ | 2,661 | ||||||||
| Exchange Traded Funds | 11,287 | 11,287 | – | – | ||||||||||||
| Preferred Stocks | 1,591 | 1,591 | – | – | ||||||||||||
| Short-Term Investments | 37,102 | – | 37,102 | – | ||||||||||||
| Total | $ | 1,554,240 | $ | 1,501,738 | $ | 49,841 | $ | 2,661 | ||||||||
| Liabilities: | ||||||||||||||||
| Foreign Currency Contracts * | – | – | – | – | ||||||||||||
| Total | $ | – | $ | – | $ | – | $ | – | ||||||||
| ♦ | For the six-month period ended June 30, 2011, there were no significant transfers between Level 1 and Level 2. |
| ‡ | The Fund has all or primarily all of the equity securities categorized in a particular level. Refer to the Schedule of Investments for further industry breakout. |
| * | Derivative instruments not reflected in the Schedule of Investments are valued at the unrealized appreciation/depreciation on the investments. |
Following is a reconciliation of Level 3 assets for which significant unobservable inputs were used to determine fair value:
| Balance as | Change in | |||||||||||||||||||||||||||||||||||
| of | Realized | Unrealized | Transfers | Transfers | Balance | |||||||||||||||||||||||||||||||
| December | Gain | Appreciation | Net | Into | Out of | as of June | ||||||||||||||||||||||||||||||
| 31, 2010 | (Loss) | (Depreciation) | Amortization | Purchases | Sales | Level 3 * | Level 3* | 30, 2011 | ||||||||||||||||||||||||||||
| Assets: | ||||||||||||||||||||||||||||||||||||
| Common Stocks | $ | 1,690 | $ | 44 | $ | (878 | )† | $ | — | $ | 810 | $ | (937 | ) | $ | 1,932 | $ | — | $ | 2,661 | ||||||||||||||||
| Total | $ | 1,690 | $ | 44 | $ | (878 | ) | $ | — | $ | 810 | $ | (937 | ) | $ | 1,932 | $ | — | $ | 2,661 | ||||||||||||||||
| * | Securities are transferred into and out of Level 3 for a variety of reasons including, but not limited to: |
| 1) | Securities where trading has been halted (transfer into Level 3) or securities where trading has resumed (transfer out of Level 3). |
| 2) | Broker quoted securities (transfer into Level 3) or quoted prices in active markets (transfer out of Level 3). |
| 3) | Securities that have certain restrictions on trading (transfer into Level 3) or securities where trading restrictions have expired (transfer out of Level 3). |
| † | Change in unrealized appreciation or depreciation in the current period relating to assets still held at June 30, 2011 was $(878). |
The accompanying notes are an integral part of these financial statements.
| Statement of Assets and Liabilities |
June 30, 2011 (Unaudited) |
| (000’s Omitted) |
| Assets: | ||||
| Investments in securities, at market value (cost $1,286,156) | $ | 1,554,240 | ||
| Cash | 2 | |||
| Foreign currency on deposit with custodian (cost $38) | 38 | |||
| Receivables: | ||||
| Investment securities sold | 24,789 | |||
| Fund shares sold | 1,178 | |||
| Dividends and interest | 488 | |||
| Total assets | 1,580,735 | |||
| Liabilities: | ||||
| Unrealized depreciation on foreign currency contracts | — | |||
| Payables: | ||||
| Investment securities purchased | 22,282 | |||
| Fund shares redeemed | 5,230 | |||
| Investment management fees | 168 | |||
| Distribution fees | 9 | |||
| Accrued expenses | 61 | |||
| Total liabilities | 27,750 | |||
| Net assets | $ | 1,552,985 | ||
| Summary of Net Assets: | ||||
| Capital stock and paid-in-capital | $ | 1,321,442 | ||
| Accumulated distributions in excess of net investment loss | (2,114 | ) | ||
| Accumulated net realized loss on investments and foreign currency transactions | (34,430 | ) | ||
| Unrealized appreciation of investments and the translations of assets and liabilities denominated in foreign currency | 268,087 | |||
| Net assets | $ | 1,552,985 | ||
| Shares authorized | 1,500,000 | |||
| Par value | $ | 0.001 | ||
Class IA: Net asset value per share | $ | 19.95 | ||
| Shares outstanding | 66,475 | |||
| Net assets | $ | 1,326,254 | ||
Class IB: Net asset value per share | $ | 19.38 | ||
| Shares outstanding | 11,698 | |||
| Net assets | $ | 226,731 | ||
The accompanying notes are an integral part of these financial statements.
| Statement of Operations |
| For the Six-Month Period Ended June 30, 2011 (Unaudited) |
(000’s Omitted) |
| Investment Income: | ||||
| Dividends | $ | 3,992 | ||
| Interest | 20 | |||
| Less: Foreign tax withheld | (54 | ) | ||
| Total investment income, net | 3,958 | |||
| Expenses: | ||||
| Investment management fees | 5,031 | |||
| Transfer agent fees | 3 | |||
| Distribution fees - Class IB | 284 | |||
| Custodian fees | 15 | |||
| Accounting services fees | 90 | |||
| Board of Directors' fees | 13 | |||
| Audit fees | 11 | |||
| Other expenses | 98 | |||
| Total expenses (before fees paid indirectly) | 5,545 | |||
| Commission recapture | (25 | ) | ||
| Total fees paid indirectly | (25 | ) | ||
| Total expenses, net | 5,520 | |||
| Net investment loss | (1,562 | ) | ||
| Net Realized Gain on Investments and Foreign Currency Transactions: | ||||
| Net realized gain on investments | 176,761 | |||
| Net realized loss on foreign currency contracts | (135 | ) | ||
| Net realized gain on other foreign currency transactions | 40 | |||
| Net Realized Gain on Investments and Foreign Currency Transactions | 176,666 | |||
| Net Changes in Unrealized Appreciation of Investments and Foreign Currency Transactions: | ||||
| Net unrealized appreciation of investments | 3,106 | |||
| Net unrealized appreciation of foreign currency contracts | 54 | |||
| Net unrealized appreciation on translation of other assets and liabilities in foreign currencies | 2 | |||
| Net Changes in Unrealized Appreciation of Investments and Foreign Currency Transactions | 3,162 | |||
| Net Gain on Investments and Foreign Currency Transactions | 179,828 | |||
| Net Increase in Net Assets Resulting from Operations | $ | 178,266 | ||
The accompanying notes are an integral part of these financial statements.
| Statement of Changes in Net Assets |
| (000’s Omitted) |
| For the | ||||||||
| Six-Month | For the | |||||||
| Period Ended | Year Ended | |||||||
| June 30, 2011 | December 31, | |||||||
| (Unaudited) | 2010 | |||||||
| Operations: | ||||||||
| Net investment loss | $ | (1,562 | ) | $ | (1,521 | ) | ||
| Net realized gain on investments and foreign currency transactions | 176,666 | 197,288 | ||||||
| Net unrealized appreciation of investments and foreign currency transactions | 3,162 | 82,021 | ||||||
| Net Increase In Net Assets Resulting From Operations | 178,266 | 277,788 | ||||||
| Capital Share Transactions: | ||||||||
| Class IA | ||||||||
| Sold | 148,881 | 139,355 | ||||||
| Redeemed | (153,865 | ) | (221,319 | ) | ||||
| Total capital share transactions | (4,984 | ) | (81,964 | ) | ||||
| Class IB | ||||||||
| Sold | 31,432 | 33,442 | ||||||
| Redeemed | (44,055 | ) | (71,448 | ) | ||||
| Total capital share transactions | (12,623 | ) | (38,006 | ) | ||||
| Net decrease from capital share transactions | (17,607 | ) | (119,970 | ) | ||||
| Net Increase In Net Assets | 160,659 | 157,818 | ||||||
| Net Assets: | ||||||||
| Beginning of period | 1,392,326 | 1,234,508 | ||||||
| End of period | $ | 1,552,985 | $ | 1,392,326 | ||||
Accumulated undistributed (distribution in excess of) net investment income | $ | (2,114 | ) | $ | (552 | ) | ||
| Shares: | ||||||||
| Class IA | ||||||||
| Sold | 7,683 | 9,164 | ||||||
| Redeemed | (8,018 | ) | (14,470 | ) | ||||
| Total share activity | (335 | ) | (5,306 | ) | ||||
| Class IB | ||||||||
| Sold | 1,681 | 2,221 | ||||||
| Redeemed | (2,337 | ) | (4,882 | ) | ||||
| Total share activity | (656 | ) | (2,661 | ) | ||||
The accompanying notes are an integral part of these financial statements.
Notes to Financial Statements |
| June 30, 2011 (Unaudited) |
| (000’s Omitted) |
| 1. | Organization: |
Hartford Small Company HLS Fund (the “Fund”) serves as an underlying investment option for certain variable annuity and variable life insurance separate accounts of Hartford Life Insurance Company (“HLIC”) and its affiliates and certain qualified retirement plans. The Fund may also serve as an underlying investment option for certain variable annuity and variable life separate accounts of other insurance companies. Owners of variable annuity contracts and policyholders of variable life insurance contracts may choose the funds permitted in the variable insurance contract prospectus. In addition, participants in certain qualified retirement plans may choose the Fund if permitted by their plans.
Hartford Series Fund, Inc. (the “Company”) is an open-end registered management investment company comprised of thirty portfolios. Financial Statements for the Fund, a series of the Company, are included in this report.
The Company is organized under the laws of the State of Maryland and is registered with the Securities and Exchange Commission (“SEC”) under the Investment Company Act of 1940, as amended (“1940 Act”). The Fund is a diversified open-end management investment company.
The Fund is divided into Class IA and Class IB shares. Each class is offered at the per share net asset value (“NAV”) without a sales charge and is subject to the same expenses, except that the Class IB shares are subject to distribution and service fees charged pursuant to a Distribution Plan adopted in accordance with Rule 12b-1 under the 1940 Act.
| 2. | Significant Accounting Policies: |
The following is a summary of significant accounting policies of the Fund in the preparation of its financial statements, which are in accordance with the United States Generally Accepted Accounting Principles (“U.S. GAAP”). The preparation of financial statements in accordance with U.S. GAAP may require management to make estimates and assumptions that affect the reported amounts of assets and liabilities and disclosure of contingent assets and liabilities at the date of the financial statements and the reported amounts of increases and decreases in net assets from operations during the reporting period. Actual results could differ from those estimates.
| a) | Determination of Net Asset Value – The NAV of each class of the Fund's shares is determined as of the close of regular trading (normally 4:00 p.m. Eastern Time) (the “NYSE Close”) on each day that the New York Stock Exchange (the “Exchange”) is open (“Valuation Date”). Information that becomes known to the Fund after the NAV has been calculated on a particular day will not generally be used to retroactively adjust the NAV determined earlier that day. |
| b) | Investment Valuation and Fair Value Measurements – For purposes of calculating the NAV, portfolio securities and other assets held by the Fund's portfolio for which market quotes are readily available are valued at market value. Market value is generally determined on the basis of last reported sales prices or official close price. If no sales are reported, market value is based on quotes obtained from a quotation reporting system, established market makers, or independent pricing services. If market prices are not readily available or are deemed unreliable, the Fund will use the fair value of the security as determined in good faith under policies and procedures established by and under the supervision of the Company's Board of Directors. Market quotes are considered not readily available where there is an absence of current or reliable market-based data (e.g., trade information or broker quotes), including where events occur after the close of the relevant market, but prior to the NYSE Close that materially affect the values of the Fund's portfolio securities or assets. In addition, market quotes are considered not readily available when, due to extraordinary circumstances, the exchanges or markets on which the securities trade, do not open for trading for the entire day and no other market prices are available. In addition, prices of foreign equities that are principally traded on certain foreign markets are adjusted daily pursuant to a fair value pricing service approved by the Board of Directors in order to reflect an adjustment for the factors occurring after the close of certain foreign markets but before the NYSE Close. Securities that are primarily traded on foreign markets may trade on days that are not business days of the Fund. The value of the foreign securities, |
in which the Fund invests, may change on days when a shareholder will not be able to purchase or redeem shares of the Fund. Fair value pricing is subjective in nature and the use of fair value pricing by the Fund may cause the NAV of its shares to differ significantly from the NAV that would have been calculated using market prices at the close of the exchange on which a portfolio security is primarily traded. There can be no assurance that the Fund could obtain the fair market value assigned to a security if the Fund were to sell the security at approximately the time at which the Fund determines its NAV.
Investments valued in currencies other than U.S. dollars are converted to U.S. dollars using exchange rates obtained from independent pricing services for calculation of the NAV. As a result, the NAV of the Fund’s shares may be affected by changes in the value of currencies in relation to the U.S. dollar. The value of securities traded in markets outside the United States or denominated in currencies other than the U.S. dollar may be affected significantly on a day that the NYSE is closed and the market value may change on days when an investor is not able to purchase, redeem or exchange shares of the Fund.
Foreign currency contracts represent agreements to exchange currencies on specific future dates at predetermined rates. Foreign currency contracts are valued using foreign currency exchange rates and forward rates as provided by an independent pricing service on Valuation Date.
Investments in open-end mutual funds are valued at the respective NAV of each open-end mutual fund on the Valuation Date.
Financial instruments for which prices are not available from an independent pricing service may be valued using market quotations obtained from one or more dealers that make markets in the respective financial instrument in accordance with procedures established by the Company’s Board of Directors.
U.S. GAAP defines fair value as the price that the Fund would receive to sell an asset or pay to transfer a liability in an orderly transaction between market participants. The U.S. GAAP fair value measurement standards require disclosure of a fair value hierarchy for each major category of assets and liabilities. Various inputs are used in determining the fair value of the Fund’s investments. These inputs are summarized into three broad hierarchy levels. This hierarchy is based on whether the valuation inputs are observable or unobservable. These levels are:
| · | Level 1 – Quoted prices in active markets for identical securities. Level 1 may include exchange-traded instruments such as domestic equities, some foreign equities, options, futures, mutual funds, exchange-traded funds, rights and warrants. |
| · | Level 2 – Observable inputs other than Level 1 prices, such as quoted prices for similar securities; quoted prices in markets that are not active; or other inputs that are observable or can be corroborated by observable market data. Level 2 may include debt securities that are traded less frequently than exchange-traded instruments and which are valued using third party pricing services; foreign equities, whose value is determined using a multi-factor regression model with inputs that are observable in the market; and short-term securities, which are valued at amortized cost. |
| · | Level 3 – Significant unobservable inputs that are supported by limited or no market activity. Level 3 may include financial instruments whose values are determined using broker quotes or require significant management judgment or estimation. These unobservable valuation inputs may include estimates for current yields, maturity/duration, prepayment speed, and broker quotes for comparable securities along with other assumptions relating to credit quality, collateral value, complexity of the security structure, general market conditions and liquidity. This category may include securities where trading has been halted or there are certain restrictions on trading. While these securities are priced using unobservable inputs, the valuation of these securities reflects the best available data and management believes the prices are a reasonable representation of exit price. |
| Hartford Small Company HLS Fund |
Notes to Financial Statements – (continued) |
| June 30, 2011 (Unaudited) |
| (000’s Omitted) |
Valuation levels are not necessarily indicative of the risk associated with investing in such securities. Individual securities within any of the above mentioned asset classes may be assigned a different hierarchical level than those presented above, as individual circumstances dictate.
For additional information, refer to the Investment Valuation Hierarchy Level Summary and the Level 3 roll forward reconciliation which follow the Schedule of Investments.
For purposes of reporting transfers between different hierarchy levels, both transfers in and out of each level, as applicable, are shown as if they occurred at the beginning of the period.
| c) | Security Transactions and Investment Income – Security transactions are recorded as of the trade date (the date the order to buy or sell is executed) for financial reporting purposes. Securities purchased or sold on a when-issued or delayed-delivery basis may be settled a month or more after the trade date. Realized gains and losses are determined on the basis of identified cost. |
Dividend income is accrued as of the ex-dividend date, except that certain dividends from foreign securities where the ex-dividend date may have passed are recorded as soon as the Fund is informed of the dividend. Interest income, including amortization of premium and accretion of discounts, is accrued on a daily basis.
| d) | Foreign Currency Transactions – Assets and liabilities denominated in currencies other than U.S. dollars are translated into U.S. dollars at the exchange rates in effect on the valuation date. Purchases and sales of investment securities, income, and expenses are translated into U.S. dollars at the exchange rates on the dates of such transactions. |
The Fund does not isolate that portion of portfolio security valuation resulting from fluctuations in the foreign currency exchange rates from the fluctuations arising from changes in the market prices of securities held. Exchange rate fluctuations are included with the net realized and unrealized gain or loss on investments in the accompanying financial statements.
Net realized foreign exchange gains or losses arise from sales of foreign currencies and the difference between asset and liability amounts initially stated in foreign currencies and the U.S. dollar value of the amounts actually received or paid. Net unrealized foreign exchange gains or losses arise from changes in the value of other assets and liabilities at the end of the reporting period, resulting from changes in the exchange rates.
| e) | Joint Trading Account – The Fund may invest cash balances into a joint trading account that may be invested in one or more repurchase agreements. |
| f) | Fund Share Valuation and Dividend Distributions to Shareholders – Orders for the Fund’s shares are executed in accordance with the investment instructions of the contract holders and plan participants. The NAV of the Fund’s shares is determined as of the close of business on each business day of the Exchange. The NAV is determined separately for each class of shares of the Fund by dividing the Fund’s net assets attributable to that class by the number of shares of the class outstanding. Each class of shares offered by the Fund has equal rights as to assets and voting privileges (except that shareholders of a class have exclusive voting rights regarding any matter relating solely to that class of shares). Income and non-class specific expenses are allocated daily to each class on the basis of the relative net assets of the class. Realized and unrealized capital gains and losses of each class are allocated daily based on the relative net assets of each class of shares of the Fund. |
Orders for the purchase of the Fund’s shares received prior to the close of the Exchange on any day the Exchange is open for business are priced at the NAV determined as of the close of the Exchange. Orders received after the close of the Exchange, or on a day on which the Exchange and/or the Fund is not open for business, are priced at the next determined NAV.
Dividends are declared pursuant to a policy adopted by the Company’s Board of Directors based upon the investment performance of the Fund. The policy of the Fund is to pay dividends from net investment income and realized capital gains, if any, at least once a year.
Distributions from net investment income, net realized capital gains and capital are determined in accordance with federal income tax regulations, which may differ from U.S. GAAP with respect to character and timing. These differences may include but are not limited to losses deferred due to wash sale adjustments, foreign currency gains and losses, adjustments related to Passive Foreign Investment Companies (“PFICs”), Real Estate Investment Trusts (“REITs”), Regulated Investment Companies (“RICs”), certain derivatives and partnerships. Permanent book and federal income tax basis differences relating to shareholder distributions will result in reclassifications to certain of the Fund’s capital accounts (see Federal Income Taxes: Reclassification of Capital Accounts note).
| 3. | Securities and Other Investments: |
| a) | Repurchase Agreements – A repurchase agreement is an agreement by which a counterparty agrees to sell a security and agrees to repurchase the security sold at a mutually agreed upon time and price. At the time the Fund enters into a repurchase agreement, the value of the underlying collateral security(ies), including accrued interest, will be equal to or exceed the value of the repurchase agreement. Repurchase agreements expose the Fund to counterparty risk. To minimize counterparty risk, the securities that serve to collateralize the repurchase agreement are held by the Fund's custodian in book entry or physical form in the custodial account of the Fund or in a third party custodial account. Repurchase agreements are valued at cost plus accrued interest. The Fund, as shown on the Schedule of Investments, had outstanding repurchase agreements as of June 30, 2011. |
| b) | Illiquid and Restricted Securities – The Fund is permitted to invest up to 15% of its net assets in illiquid securities. Illiquid securities are those that may not be sold or disposed of in the ordinary course of business within seven days, at approximately the price used to determine the Fund’s NAV. The Fund may not be able to sell illiquid securities or other investments when its sub-adviser considers it desirable to do so or may have to sell such securities or investments at a price that is lower than the price that could be obtained if the securities or investments were more liquid. A sale of illiquid securities or other investments may require more time and may result in higher dealer discounts and other selling expenses than does the sale of those that are liquid. Illiquid securities and investments also may be more difficult to value, due to the unavailability of reliable market quotations for such securities or investments, and an investment in them may have an adverse impact on the Fund’s NAV. The Fund may also purchase certain restricted securities that can only be resold to certain qualified investors and may be determined to be liquid pursuant to policies and guidelines established by the Company’s Board of Directors. The Fund, as shown on the Schedule of Investments, had illiquid and/or restricted securities as of June 30, 2011. |
| c) | Securities Purchased on a When-Issued or Delayed-Delivery Basis – Delivery and payment for securities that have been purchased by the Fund on a forward commitment, or when-issued or delayed-delivery basis, take place beyond the customary settlement period. During this period, such securities are subject to market fluctuations, and the Fund identifies securities segregated in its records with value at least equal to the amount of the commitment. The Fund had no outstanding when-issued or delayed delivery securities as of June 30, 2011. |
| 4. | Financial Derivative Instruments: |
The following disclosures contain information on how and why the Fund uses derivative instruments, the credit-risk-related contingent features in certain derivative instruments, and how derivative instruments affect the Fund’s financial position, results of operations and cash flows. The location and fair value amounts of these instruments on the Statement of Assets and Liabilities and the realized gains and losses and changes in unrealized gains and losses on the Statement of Operations, each categorized by type of derivative contract, are included in the following Additional Derivative Instrument Information footnote. The derivative instruments outstanding as of period-end are disclosed in the Notes to
| Hartford Small Company HLS Fund |
Notes to Financial Statements – (continued) |
| June 30, 2011 (Unaudited) |
| (000’s Omitted) |
the Schedule of Investments and the amounts of realized gains and losses and changes in unrealized gains and losses on derivative instruments during the period are disclosed in the Statement of Operations.
| a) | Foreign Currency Contracts – The Fund may enter into foreign currency contracts that obligate the Fund to purchase or sell currencies at specified future dates. Foreign currency contracts are used to hedge the currency exposure associated with some or all of the Fund's securities and/or as part of an investment strategy. Foreign currency contracts are marked to market daily and the change in value is recorded by the Fund as an unrealized gain or loss. Realized gains or losses equal to the difference between the value of the contract at the time it was opened and the value at the time it was closed are recorded upon delivery or receipt of the currency. |
Foreign currency contracts involve elements of market risk in excess of the amounts reflected in the Statement of Assets and Liabilities. In addition, risks may arise upon entering into these contracts from the potential inability of the counterparties to meet the terms of the contracts and from unanticipated movements in the value of the foreign currencies relative to the U.S. dollar. The Fund had outstanding foreign currency contracts as shown on the Schedule of Investments as of June 30, 2011.
| b) | Additional Derivative Instrument Information: |
Fair Values of Derivative Instruments on the Statement of Assets and Liabilities as of June 30, 2011:
| Risk Exposure Category | ||||||||||||||||||||||||||||
| Foreign | ||||||||||||||||||||||||||||
| Interest Rate | Exchange | Credit | Equity | Commodity | Other | |||||||||||||||||||||||
| Contracts | Contracts | Contracts | Contracts | Contracts | Contracts | Total | ||||||||||||||||||||||
| Liabilities: | ||||||||||||||||||||||||||||
Unrealized depreciation on foreign currency contracts | $ | — | $ | — | $ | — | $ | — | $ | — | $ | — | $ | — | ||||||||||||||
| Total | $ | — | $ | — | $ | — | $ | — | $ | — | $ | — | $ | — | ||||||||||||||
The volume of derivative activity was minimal during the six-month period ended June 30, 2011.
The Effect of Derivative Instruments on the Statement of Operations for the six-month period ended June 30, 2011:
| Risk Exposure Category | ||||||||||||||||||||||||||||
| Foreign | ||||||||||||||||||||||||||||
| Interest Rate | Exchange | Credit | Equity | Commodity | Other | |||||||||||||||||||||||
| Contracts | Contracts | Contracts | Contracts | Contracts | Contracts | Total | ||||||||||||||||||||||
| Realized Gain (Loss) on Derivatives Recognized as a Result from Operations: | ||||||||||||||||||||||||||||
Net realized loss on foreign currency contracts | $ | — | $ | (135 | ) | $ | — | $ | — | $ | — | $ | — | $ | (135 | ) | ||||||||||||
| Total | $ | — | $ | (135 | ) | $ | — | $ | — | $ | — | $ | — | $ | (135 | ) | ||||||||||||
| Net Change in Unrealized Appreciation (Depreciation) on Derivatives Recognized as a Result from Operations: | ||||||||||||||||||||||||||||
Net change in unrealized appreciation of foreign currency contracts | $ | — | $ | 54 | $ | — | $ | — | $ | — | $ | — | $ | 54 | ||||||||||||||
| Total | $ | — | $ | 54 | $ | — | $ | — | $ | — | $ | — | $ | 54 | ||||||||||||||
| 5. | Principal Risks: |
| a) | Counterparty Risk – The Fund may be exposed to counterparty risk, or the risk that an institution or other entity with which the Fund has unsettled or open transactions will default. |
| b) | Market Risks – If a Fund invests directly in foreign currencies or in securities that trade in, and receive revenues in, foreign currencies, or in derivatives that provide exposure to foreign currencies, it will be subject to the risk that those currencies will decline in value relative to the base currency of the Fund, or, in the case of hedging positions, that the Fund’s base currency will decline in value relative to the currency being hedged. Currency rates in foreign countries may fluctuate significantly over short periods of time for a number of reasons, including changes in interest rates, intervention (or the failure to intervene) by U.S. or foreign governments, central banks or supranational entities such as the International Monetary Fund, or by the imposition of currency controls or other political developments in the United States or abroad. As a result, the Fund’s investments in foreign currency denominated securities may reduce the returns of the Fund. The market values of equity securities, such as common stocks and preferred stocks or equity related investments such as futures and options, may decline due to general market conditions which are not specifically related to a particular company, such as real or perceived adverse economic conditions, changes in the general outlook for corporate earnings, changes in interest or currency rates or adverse investor sentiment generally. The market value of equity securities may also decline due to factors which affect a particular industry or industries, such as labor shortages or increased production costs and competitive conditions within an industry. Equity securities and equity related investments generally have greater market price volatility than fixed income securities. |
| 6. | Federal Income Taxes: |
| a) | Federal Income Taxes – For federal income tax purposes, the Fund intends to continue to qualify as a RIC under Subchapter M of the Internal Revenue Code (“IRC”) by distributing substantially all of its taxable net investment income and net realized capital gains to its shareholders and otherwise complying with the requirements of RICs. The Fund has distributed substantially all of its income and capital gains in prior years, if applicable, and intends to distribute substantially all of its income and capital gains prior to the next fiscal year-end. Accordingly, no provision for federal income or excise taxes has been made in the accompanying financial statements. Distributions from short-term capital gains are treated as ordinary income distributions for federal income tax purposes. |
| b) | Net Investment Income (Loss), Net Realized Gains (Losses) – Net investment income (loss) and net realized gains (losses) may differ for financial statement and tax purposes primarily because of losses deferred due to wash sale adjustments, foreign currency gains and losses, adjustments related to PFICs, REITs, RICs, certain derivatives and partnerships. The character of distributions made during the year from net investment income or net realized gains may differ from their ultimate characterization for federal income tax purposes. Also, due to the timing of dividend distributions, the fiscal year in which amounts are distributed may differ from the year that the income or realized gains (losses) were recorded by the Fund. |
| c) | Distributions and Components of Distributable Earnings – The tax character of distributions paid by the Fund for the periods indicated is as follows (as adjusted for dividends payable): |
| For the Year Ended | For the Year Ended | |||||||
| December 31, 2010 | December 31, 2009 | |||||||
| Ordinary Income | $ | — | $ | 117 | ||||
| Hartford Small Company HLS Fund |
Notes to Financial Statements – (continued) |
| June 30, 2011 (Unaudited) |
| (000’s Omitted) |
As of December 31, 2010, the Fund’s components of distributable earnings (deficit) on a tax basis were as follows:
| Amount | ||||
| Accumulated Capital and Other Losses* | $ | (205,169 | ) | |
Unrealized Appreciation† | 258,446 | |||
| Total Accumulated Earnings | $ | 53,277 | ||
| * | The Fund has capital loss carryforwards that are identified in the Capital Loss Carryforward note that follows. |
| † | The difference between book-basis and tax-basis unrealized appreciation (depreciation) may be attributable to the losses deferred due to wash sale adjustments, foreign currency gains and losses, adjustments related to PFICs, REITs, RICs, certain derivatives and partnerships. |
| d) | Reclassification of Capital Accounts – The Fund may record reclassifications in its capital accounts. These reclassifications have no impact on the total net assets of the Fund. The reclassifications are a result of permanent differences between U.S. GAAP and tax accounting for such items as expiration or utilization of capital loss carryforwards or net operating losses. Adjustments are made to reflect the impact these items have on current and future distributions to shareholders. Therefore, the source of the Fund’s distributable income may be shown in the accompanying Statement of Assets and Liabilities as from accumulated undistributed net investment income, from accumulated net realized gains on investments or from capital depending on the type of book and tax differences that exist. For the year ended December 31, 2010, the Fund recorded reclassifications to increase (decrease) the accounts listed below: |
| Amount | ||||
| Accumulated Undistributed Net Investment Income | $ | 1,464 | ||
| Accumulated Net Realized Gain (Loss) on Investments and Foreign Currency Transactions | 970 | |||
| Capital Stock and Paid-in-Capital | (2,434 | ) | ||
| e) | Capital Loss Carryforward – At December 31, 2010 (tax-year-end), the Fund had capital loss carryforwards for U.S. federal income tax purposes of approximately: |
| Year of Expiration | Amount | |||
| 2017 | $ | 205,067 | ||
| Total | $ | 205,067 | ||
As of December 31, 2010, the Fund utilized $182,845 of prior year capital loss carryforwards.
As of December 31, 2010, the Fund elected to defer the following post-October losses:
| Amount | ||||
| Ordinary Income | $ | 102 | ||
| f) | Accounting for Uncertainty in Income Taxes – The Fund has adopted financial reporting rules that require the Fund to analyze all open tax years, as defined by the Statute of Limitations, for all major jurisdictions. Generally, tax authorities can examine all tax returns filed for the last three years. The Fund does not have an examination in progress. |
The Fund has reviewed all open tax years and major jurisdictions and concluded that these financial reporting rules had no effect on the Fund’s financial position or results of operations. There is no tax liability resulting from unrecognized tax benefits relating to uncertain income tax positions taken or expected to be taken on the tax return for the fiscal year-end December 31, 2010. The Fund is also not aware of any tax positions for which it is reasonably possible that the total amounts of unrecognized tax benefits will significantly change in the next twelve months.
| 7. | Expenses: |
| a) | Investment Management Agreements – HL Investment Advisors, LLC (“HL Advisors”), an indirect wholly owned subsidiary of The Hartford Financial Services Group, Inc. (“The Hartford”), serves as investment manager to the Fund pursuant to an Investment Management Agreement with the Company. As investment manager, HL Advisors has overall investment supervisory responsibility for the Fund. In addition, HL Advisors provides administrative personnel, services, equipment, facilities and office space for proper operation of the Fund. HL Advisors has contracted with Wellington Management Company, LLP (“Wellington Management”) under a sub-advisory agreement for the provision of day-today investment management services to the Fund in accordance with the Fund’s investment objective and policies. The Fund pays a fee to HL Advisors, a portion of which may be used to compensate Wellington Management. |
The schedule below reflects the rates of compensation paid to HL Advisors for investment management services rendered as of June 30, 2011; the rates are accrued daily and paid monthly.
| Average Daily Net Assets | Annual Fee | |||
| On first $250 million | 0.7750 | % | ||
| On next $250 million | 0.7250 | % | ||
| On next $500 million | 0.6750 | % | ||
| On next $500 million | 0.6000 | % | ||
| On next $3.5 billion | 0.5500 | % | ||
| On next $5 billion | 0.5300 | % | ||
| Over $10 billion | 0.5200 | % | ||
| b) | Accounting Services Agreement – Pursuant to the Fund Accounting Agreement between HLIC and the Company, on behalf of the Fund, HLIC provides accounting services to the Fund and receives monthly compensation based on the Fund’s average net assets at the rates set forth below. The Fund’s accounting services fees are accrued daily and paid monthly. |
| Average Daily Net Assets | Annual Fee | |||
| On first $5 billion | 0.012 | % | ||
| Over $5 billion | 0.010 | % | ||
| c) | Operating Expenses – Allocable expenses incurred by the Company are allocated to each Fund and allocated to classes within a Fund in proportion to the average daily net assets of the Fund and each class, except where allocation of certain expenses is more fairly made directly to the Fund or to specific classes within a Fund. |
| d) | Fees Paid Indirectly – The Company, on behalf of the Fund, has entered into agreements with State Street Global Markets, LLC and Russell Implementation Services, Inc. to partially recapture non-discounted trade commissions. Such rebates are used to pay a portion of the Fund’s expenses. In addition, the Fund’s custodian bank has also agreed to reduce its fees when the Fund maintains cash on deposit in a non-interest-bearing custody account. For the six-month period ended June 30, 2011, these amounts are included in the Statement of Operations. |
| Hartford Small Company HLS Fund |
Notes to Financial Statements – (continued) |
| June 30, 2011 (Unaudited) |
| (000’s Omitted) |
The ratio of expenses to average net assets in the accompanying financial highlights excludes the reduction in expenses related to fees paid indirectly. The annualized expense ratio for the period listed below including the fees paid indirectly is as follows:
| Annualized Six- | ||||
| Month Period | ||||
| Ended June 30, | ||||
| 2011 | ||||
| Class IA | 0.70 | % | ||
| Class IB | 0.95 | |||
| e) | Distribution Plan for Class IB shares – The Company, on behalf of the Fund, has adopted a Distribution Plan pursuant to Rule 12b-1 of the 1940 Act to compensate the Distributor, Hartford Securities Distribution Company, Inc. (a wholly owned, ultimate subsidiary of The Hartford), from assets attributable to the Class IB shares for services rendered and expenses borne in connection with activities primarily intended to result in the sale of the Class IB shares, subject to the review and approval of the Company’s Board of Directors. |
The Distribution Plan provides that the Fund may pay annually up to 0.25% of the average daily net assets of the Fund attributable to its Class IB shares for activities primarily intended to result in the sale of Class IB shares. The Board has the authority to suspend or reduce these payments at any point in time. Under the terms of the Distribution Plan and the principal underwriting agreement, the Fund is authorized to make payments monthly to the Distributor that may be used to pay or compensate entities providing distribution and shareholder servicing with respect to the Class IB shares for such entities’ fees or expenses incurred or paid in that regard. These fees are accrued daily and paid monthly.
| f) | Other Related Party Transactions – Certain officers of the Fund are directors and/or officers of HL Advisors and/or The Hartford or its subsidiaries. For the six-month period ended June 30, 2011, a portion of the Fund’s chief compliance officer’s salary was paid by all the investment companies in the Hartford fund complex. The portion allocated to the Fund was in the amount of $1. Hartford Administrative Services Company (“HASCO”), an indirect wholly owned subsidiary of The Hartford, provides transfer agent services to the Fund. The amount paid to HASCO can be found in the Statement of Operations. These fees are accrued daily and paid monthly. |
| g) | Payments from Affiliates – In July of 2007, The Hartford entered into a settlement with the Attorneys General of the states of New York, Connecticut and Illinois relating to market timing and the company's individual variable annuity contracts in which certain payments would be made directly to the variable annuity contract holders. The distribution plan provided that unclaimed money from the settlement would be distributed to certain HLS Funds that are investment options through a Hartford individual variable annuity contract. The unclaimed money was distributed to the Fund on September 18, 2009, as follows: |
| Amount | ||||
| Reimbursement | $ | 1,017 | ||
On June 8, 2007, the Fund was reimbursed for incorrect IPO allocations to the Fund.
On May 2, 2007, the Fund had trading reimbursements relating to the change in portfolio managers of the Fund.
On November 8, 2006, the SEC issued an order setting forth the terms of a settlement reached with three subsidiaries of The Hartford that resolved the SEC’s Division of Enforcement’s investigation of aspects of The Hartford’s variable annuity and mutual fund operations related to directed brokerage and revenue sharing. The Hartford settled this matter without admitting or denying the findings of the SEC.
The total return in the accompanying financial highlights includes payments from affiliates. Had the payments from the affiliates been excluded, the impact and total return for the periods listed below would have been as follows:
| For the Year Ended December 31, 2009 | ||||||||
| Class IA | Class IB | |||||||
| Impact from Payment from Affiliate for Attorneys General Settlement | 0.08 | % | 0.09 | % | ||||
| Total Return Excluding Payment from Affiliate | 29.18 | 28.90 | ||||||
| For the Year Ended December 31, 2007 | ||||||||
| Class IA | Class IB | |||||||
| Impact from Payment from Affiliate for Trading Reimbursements | 0.16 | % | 0.16 | % | ||||
| Impact from Payment from Affiliate for Incorrect IPO Allocations | 0.03 | 0.03 | ||||||
| Total Return Excluding Payments from Affiliates | 14.01 | 13.73 | ||||||
| For the Year Ended December 31, 2006 | ||||||||
| Class IA | Class IB | |||||||
| Impact from Payment from Affiliate for SEC Settlement | 0.14 | % | 0.14 | % | ||||
| Total Return Excluding Payment from Affiliate | 14.29 | 14.00 | ||||||
| 8. | Investment Transactions: |
For the six-month period ended June 30, 2011, the Fund's aggregate purchases and sales of investment securities (excluding short-term investments) were as follows:
| Amount | ||||
| Cost of Purchases Excluding U.S. Government Obligations | $ | 725,901 | ||
| Sales Proceeds Excluding U.S. Government Obligations | 751,857 | |||
| 9. | Line of Credit: |
The Fund is one of several Hartford funds that participate in a $500 million committed revolving line of credit facility. The facility is to be used for temporary or emergency purposes. Under the arrangement, a fund is required to own securities having a market value in excess of 300% of the total bank borrowings. The interest rate on borrowings varies depending on the nature of the loan. The facility also requires a fee to be paid based on the amount of the commitment. This commitment fee is allocated to all the funds participating in the line of credit based on the average net assets of the funds. During the six-month period ended June 30, 2011, the Fund did not have any borrowings under this facility.
| 10. | Industry Classifications: |
Other than the industry classifications “Other Investment Pools and Funds” and “Exchange Traded Funds,” equity industry classifications used in this report are the Global Industry Classification Standard, which was developed by and is the exclusive property and service mark of MSCI, Inc. and Standard & Poor’s.
| 11. | Indemnifications: |
Under the Company’s organizational documents, the Company shall indemnify its officers and directors to the full extent required or permitted under Maryland General Corporation Law and the federal securities laws. In addition, the Company, on behalf of the Fund, may enter into contracts that contain a variety of indemnifications. The Company’s maximum exposure under these arrangements is unknown. However, as of the date of these financial statements the Company has not had prior claims or losses pursuant to these contracts and expects the risk of loss to be remote.
| Financial Highlights |
| - Selected Per-Share Data (A) - |
| Net Asset | Net Realized | Net Increase | ||||||||||||||||||||||||||||||||||||||||||
| Value at | and Unrealized | Total from | Dividends from | Distributions | (Decrease) in | Net Asset | ||||||||||||||||||||||||||||||||||||||
| Beginning of | Net Investment | Payments from | Gain (Loss) on | Investment | Net Investment | from Realized | Distributions | Total | Net Asset | Value at End of | ||||||||||||||||||||||||||||||||||
| Class | Period | Income (Loss) | (to) Affiliate | Investments | Operations | Income | Capital Gains | from Capital | Distributions | Value | Period | |||||||||||||||||||||||||||||||||
| For the Six-Month Period Ended June 30, 2011 (Unaudited) | ||||||||||||||||||||||||||||||||||||||||||||
| IA | $ | 17.66 | $ | (0.02 | ) | $ | – | $ | 2.31 | $ | 2.29 | $ | – | $ | – | $ | – | $ | – | $ | 2.29 | $ | 19.95 | |||||||||||||||||||||
| IB | 17.18 | (0.04 | ) | – | 2.24 | 2.20 | – | – | – | – | 2.20 | 19.38 | ||||||||||||||||||||||||||||||||
| For the Year Ended December 31, 2010 | ||||||||||||||||||||||||||||||||||||||||||||
| IA | 14.23 | (0.01 | ) | – | 3.44 | 3.43 | – | – | – | – | 3.43 | 17.66 | ||||||||||||||||||||||||||||||||
| IB | 13.88 | (0.06 | ) | – | 3.36 | 3.30 | – | – | – | – | 3.30 | 17.18 | ||||||||||||||||||||||||||||||||
| For the Year Ended December 31, 2009 | ||||||||||||||||||||||||||||||||||||||||||||
| IA | 11.01 | (0.01 | ) | 0.01 | 3.22 | 3.22 | – | – | – | – | 3.22 | 14.23 | ||||||||||||||||||||||||||||||||
| IB | 10.76 | (0.04 | ) | 0.01 | 3.15 | 3.12 | – | – | – | – | 3.12 | 13.88 | ||||||||||||||||||||||||||||||||
| For the Year Ended December 31, 2008 | ||||||||||||||||||||||||||||||||||||||||||||
| IA | 18.62 | 0.02 | – | (7.56 | ) | (7.54 | ) | (0.02 | ) | (0.05 | ) | – | (0.07 | ) | (7.61 | ) | 11.01 | |||||||||||||||||||||||||||
| IB | 18.20 | (0.01 | ) | – | (7.38 | ) | (7.39 | ) | – | (0.05 | ) | – | (0.05 | ) | (7.44 | ) | 10.76 | |||||||||||||||||||||||||||
| For the Year Ended December 31, 2007(H) | ||||||||||||||||||||||||||||||||||||||||||||
| IA | 19.07 | – | 0.04 | 2.57 | 2.61 | (0.05 | ) | (3.01 | ) | – | (3.06 | ) | (0.45 | ) | 18.62 | |||||||||||||||||||||||||||||
| IB | 18.71 | (0.05 | ) | 0.04 | 2.51 | 2.50 | – | (3.01 | ) | – | (3.01 | ) | (0.51 | ) | 18.20 | |||||||||||||||||||||||||||||
| For the Year Ended December 31, 2006 | ||||||||||||||||||||||||||||||||||||||||||||
| IA | 19.66 | 0.05 | 0.02 | 2.75 | 2.82 | (0.04 | ) | (3.37 | ) | – | (3.41 | ) | (0.59 | ) | 19.07 | |||||||||||||||||||||||||||||
| IB | 19.38 | – | 0.02 | 2.70 | 2.72 | (0.02 | ) | (3.37 | ) | – | (3.39 | ) | (0.67 | ) | 18.71 | |||||||||||||||||||||||||||||
| (A) | Information presented relates to a share outstanding throughout the indicated period. |
| (B) | The figures do not include sales charges or other fees which may be applied at the variable life insurance, variable annuity or qualified retirement plan product level. Any such additional sales charges or other fees would lower the Fund's performance. |
| (C) | Ratios do not reflect reductions for fees paid indirectly. Please see Fees Paid Indirectly in the Notes to Financial Statements. |
| (D) | Portfolio turnover rate is calculated on the basis of the Fund as a whole without distinguishing between the classes of shares issued. |
| (E) | Not annualized. |
| (F) | Annualized. |
| (G) | Total return without the inclusion of the Payment from (to) Affiliate can be found in Expenses in the accompanying Notes to Financial Statements. |
| (H) | Per share amounts have been calculated using the average shares method. |
| (I) | During the year ended December 31, 2007, Hartford Small Company HLS Fund received a $12.6 million in-kind subscription of securities from a shareholder in exchange for shares of this fund. This payment-in-kind was excluded from the portfolio turnover rate calculation. |
| Ratio of Expenses to Average | Ratio of Expenses to Average | Ratio of Net Investment Income to | Portfolio Turnover | |||||||||||||||||||
| Total Return(B) | Net Assets at End of Period | Net Assets Before Waivers(C) | Net Assets After Waivers(C) | Average Net Assets | Rate(D) | |||||||||||||||||
| 12.96 | %(E) | $ | 1,326,254 | 0.70 | %(F) | 0.70 | %(F) | (0.17 | )%(F) | 49 | % | |||||||||||
| 12.79 | (E) | 226,731 | 0.95 | (F) | 0.95 | (F) | (0.42 | ) (F) | – | |||||||||||||
| 24.13 | 1,180,045 | 0.73 | 0.73 | (0.08 | ) | 171 | ||||||||||||||||
| 23.83 | 212,281 | 0.98 | 0.98 | (0.33 | ) | – | ||||||||||||||||
| 29.29 | (G) | 1,026,150 | 0.75 | 0.75 | (0.07 | ) | 184 | |||||||||||||||
| 29.01 | (G) | 208,358 | 1.00 | 1.00 | (0.32 | ) | – | |||||||||||||||
| (40.60 | ) | 793,078 | 0.71 | 0.71 | 0.16 | 194 | ||||||||||||||||
| (40.73 | ) | 179,411 | 0.96 | 0.96 | (0.09 | ) | – | |||||||||||||||
| 14.23 | (G) | 1,292,444 | 0.70 | 0.70 | (0.02 | ) | 167 | (I) | ||||||||||||||
| 13.94 | (G) | 312,775 | 0.95 | 0.95 | (0.27 | ) | – | |||||||||||||||
| 14.43 | (G) | 1,138,830 | 0.73 | 0.73 | 0.21 | 177 | ||||||||||||||||
| 14.14 | (G) | 304,757 | 0.98 | 0.98 | (0.03 | ) | – | |||||||||||||||
| Directors and Officers (Unaudited) |
The Board of Directors of the Company appoints officers who are responsible for the day-to-day operations of the Fund and who execute policies formulated by the Directors. Each director serves until his or her death, resignation, or retirement or until the next annual meeting of shareholders is held or until his or her successor is elected and qualifies.
Directors and officers who are employed by or who have a financial interest in The Hartford are considered “interested” persons of the Fund pursuant to the 1940 Act. Each officer and two of the Company’s directors, as noted in the chart below, are “interested” persons of the Fund. Each director serves as a director for The Hartford Mutual Funds, Inc., The Hartford Mutual Funds II, Inc., Hartford Series Fund, Inc., and Hartford HLS Series Fund II, Inc., which, as of June 30, 2011, collectively consist of 89 funds. Correspondence may be sent to directors and officers c/o Hartford Mutual Funds, P.O. Box 2999, Hartford, Connecticut 06104-2999, except that correspondence to Ms. Fagely may be sent to 500 Bielenberg Drive, Woodbury, Minnesota 55125.
The table below sets forth, for each director and officer, his or her name, year of birth, current position with the Company and date first elected or appointed to Hartford Series Fund, Inc. (“HSF”), and Hartford HLS Series Fund II, Inc. (“HSF2”), principal occupation, and, for directors, other directorships held. The Fund’s statement of additional information contains further information on the directors and is available free of charge by calling 1-800-862-6668 or writing to Hartford HLS Funds, c/o Individual Annuity Services, P.O. Box 5085, Hartford, CT 06102-5085.
Information on the aggregate remuneration paid to the directors of the Company can be found in the Statement of Operations herein. The Fund pays to The Hartford a portion of the chief compliance officer’s compensation, but does not pay salaries or compensation to any of their other officers or directors who are employed by The Hartford.
Non-Interested Directors
Lynn S. Birdsong (1946) Director since 2003, Co-Chairman of the Investment Committee
Mr. Birdsong is a private investor. Mr. Birdsong currently serves as a Director of the Sovereign High Yield Investment Company (April 2010 to current). Mr. Birdsong currently serves as an Independent Director of Nomura Partners Funds, Inc. (formerly, The Japan Fund) (March 2003 to current). From 2003 to March 2005, Mr. Birdsong was an independent director of the Atlantic Whitehall Funds. From 1979 to 2002, Mr. Birdsong was a managing director of Zurich Scudder Investments, an investment management firm. During his employment with Scudder, Mr. Birdsong was an Interested Director of The Japan Fund. Since 1981, Mr. Birdsong has been a partner in Birdsong Company, an advertising specialty firm.
Robert M. Gavin, Jr. (1940) Director since 2002 (HSF) and 1986 (HSF2), Chairman of the Board since 2004
Dr. Gavin is an educational consultant. Prior to September 1, 2001, he was President of Cranbrook Education Community and prior to July 1996, he was President of Macalester College, St. Paul, Minnesota.
Duane E. Hill (1945) Director since 2001 (HSF) and 2002 (HSF2), Chairman of the Nominating Committee
Mr. Hill is Partner of TSG Ventures L.P., a private equity investment company. Mr. Hill is a former partner of TSG Capital Group, a private equity investment firm that served as sponsor and lead investor in leveraged buyouts of middle market companies.
Sandra S. Jaffee (1941) Director since 2005
Ms. Jaffee served as Chairman (2008 to 2009) and Chief Executive Officer of Fortent (formerly Searchspace Group), a leading provider of compliance/regulatory technology to financial institutions from August 2005 to August 2009. From August 2004 to August 2005, Ms. Jaffee served as an Entrepreneur in Residence with Warburg Pincus, a private equity firm. From September 1995 to July 2004, Ms. Jaffee served as Executive Vice President at Citigroup, where she was President and Chief Executive Officer of Citibank’s Global Securities Services (1995 to 2003). Ms. Jaffe currently serves as a member of the Board of Directors of Broadridge Financial Solutions as well as a Trustee of Muhlenberg College.
William P. Johnston (1944) Director since 2005, Chairman of the Compliance Committee
In June 2006, Mr. Johnston was appointed as Senior Advisor to The Carlyle Group, a global private equity investment firm. In July 2006, Mr. Johnston was elected to the Board of Directors of MultiPlan, Inc. In August 2007, Mr. Johnston was elected to the Board of Directors of LifeCare Holdings, Inc. In February 2008, Mr. Johnston was elected to the Board of Directors of HCR-ManorCare, Inc. In May 2006, Mr. Johnston was elected to the Supervisory Board of Fresenius Medical Care AG & Co. KGaA, after its acquisition of Renal Care Group, Inc. in March 2006. Mr. Johnston joined Renal Care Group in November 2002 as a member of the Board of Directors and served as Chairman of the Board from March 2003 through March 2006. From September 1987 to December 2002, Mr. Johnston was with Equitable Securities Corporation (and its successors, SunTrust Equitable Securities and SunTrust Robinson Humphrey) serving in various investment banking and managerial positions, including Managing Director and Head of Investment Banking, Chief Executive Officer and Vice Chairman.
Phillip O. Peterson (1944) Director since 2002 (HSF) and 2000 (HSF2), Chairman of the Audit Committee
Mr. Peterson is a mutual fund industry consultant. He was a partner of KPMG LLP (an accounting firm) until July 1999. Mr. Peterson joined William Blair Funds in February 2007 as a member of the Board of Trustees. From January 2004 to April 2005, Mr. Peterson served as Independent President of the Strong Mutual Funds.
Lemma W. Senbet (1946) Director since 2005
Dr. Senbet is the William E. Mayer Chair Professor of Finance and Director, Center for Financial Policy, at the University of Maryland, Robert H. Smith School of Business. He was chair of the Finance Department from 1998 to 2006. Previously he was a chaired professor of finance at the University of Wisconsin-Madison. Also, he was director of the Fortis Funds from March 2000 to July 2002. Dr. Senbet served the finance profession in various capacities, including as director of the American Finance Association and President of the Western Finance Association. In 2006, Dr. Senbet was inducted Fellow of Financial Management Association International for his career-long distinguished scholarship and professional service.
Interested Directors and Officers
David N. Levenson (1966) Director since 2010
Mr. Levenson currently serves as President of The Hartford’s Wealth Management business. He was appointed to this role in July 2010. Previously, Mr. Levenson served as Executive Vice President of Legacy Holdings for The Hartford from June 2009 to July 2010. From 2006 to 2009, Mr. Levenson was with Hartford Life Insurance K.K. where he served as President and CEO from 2007 to 2009. He served as Managing Director of Hartford Investment Management Company from 2005 to 2006. Additionally, Mr. Levenson serves as Executive Vice President of The Hartford and as President, Director and Chief Executive Officer of Hartford Life Insurance Company (“HLIC”) and Hartford Life, Inc. (“HL Inc.”).
Lowndes A. Smith (1939) Director since 1996 (HSF) and 2002 (HSF2), Co-Chairman of the Investment Committee
Mr. Smith served as Vice Chairman of The Hartford from February 1997 to January 2002, as President and Chief Executive Officer of HL Inc. from February 1997 to January 2002, and as President and Chief Operating Officer of The Hartford Life Insurance Companies from January 1989 to January 2002. Mr. Smith serves as a Director of White Mountains Insurance Group, Ltd., One Beacon Insurance and Symetra Financial and as a Managing Director of Whittington Gray Associates.
Other Officers
James E. Davey (1964) President and Chief Executive Officer since 2010
Mr. Davey serves as Executive Vice President of HLIC. Additionally, Mr. Davey serves as President, Chief Executive Officer and Manager of Hartford Investment Financial Services, Inc. (“HIFSCO”) and President, Chief Executive Officer and Manager of HL Advisors. Mr. Davey joined The Hartford in 2002.
Tamara L. Fagely (1958) Vice President, Treasurer and Controller since 2002 (HSF) and 1993 (HSF2)
Ms. Fagely has been a Vice President of HASCO since 1998 and Chief Financial Officer since 2006. Currently Ms. Fagely is a Vice President of HLIC. She served as Assistant Vice President of HLIC from December 2001 through March 2005. In addition, Ms. Fagely is Controller and Chief Financial Officer of HIFSCO.
Susan M. Fleege (1959) AML Compliance Officer since 2011
Ms. Fleege currently serves as a Director of Risk Management at The Hartford. She previously served as AML Compliance Officer for the Fund from 2005-2008. Ms. Fleege joined HLIC in 2005 from Amerprise Financial Corporation where she held the position of Counsel from 2000 to 2005. Ms. Fleege is a certified Anti-Money Laundering Specialist.
Dr. Robert J. Froehlich (1953) Senior Managing Director since 2009
Dr. Froehlich joined The Hartford as Senior Managing Director in September 2009. Prior to joining The Hartford, Dr. Froehlich served as Vice Chairman of Deutsche Asset Management from 1997-2009.
Edward P. Macdonald (1967) Vice President, Secretary and Chief Legal Officer since 2005
Mr. Macdonald serves as Vice President of HLIC and Chief Legal Officer of Mutual Funds and Vice President of HIFSCO. He also serves as Vice President and Secretary of HASCO, and Chief Legal Officer, Secretary and Vice President of HL Advisors. Mr. Macdonald joined The Hartford in 2005.
| Hartford Small Company HLS Fund |
| Directors and Officers (Unaudited) – (continued) |
Vernon J. Meyer (1964) Vice President since 2006
Mr. Meyer serves as Senior Vice President of HLIC. He also serves as Senior Vice President of HIFSCO and HL Advisors. Mr. Meyer joined The Hartford in 2004.
Colleen B. Pernerewski (1969) Vice President and Chief Compliance Officer since 2010
Ms. Pernerewski serves as Vice President and Chief Investment Advisor Compliance Officer of HIFSCO and as Vice President and Chief Compliance Officer of HL Advisors. Ms. Pernerewski joined The Hartford in 2005 from Travelers Life and Annuity where she served as Counsel (2004-2005). Prior to Travelers Life and Annuity, Ms. Pernerewski held the position of Counsel at The Hartford (1998-2004).
Elizabeth L. Schroeder (1966) Vice President since 2010
Ms. Schroeder currently serves as Assistant Vice President of HLIC. Ms. Schroeder joined HLIC in 1991. She is also an Assistant Vice President of HIFSCO and HL Advisers.
Martin Swanson (1962) Vice President since 2010
Mr. Swanson is a Vice President of HLIC. Mr. Swanson also serves as Vice President/Marketing for HIFSCO. Prior to joining HLIC in 1998, Mr. Swanson was a Vice President at PaineWebber, Inc.
Jane Wolak (1961) Vice President since 2009
Ms. Wolak currently serves as Senior Vice President of HLIC. Ms. Wolak joined HLIC as Vice President, Retail Product Services in May 2007. She is also Vice President of HASCO. Previously, Ms. Wolak was with Sun Life Financial where she held the position of Vice President, Service Center Operations from 2001-2007.
A description of the policies and procedures that the Fund uses to determine how to vote proxies relating to portfolio securities and a record of how the Fund voted any proxies for the twelve-month period ended June 30, 2011 are available (1) without charge, upon request, by calling 800-862-6668 and (2) on the SEC’s website at http://www.sec.gov.
The Fund files a complete schedule of portfolio holdings with the SEC for the first and third quarters of each fiscal year on Form N-Q. The Fund’s Forms are available (1) without charge, upon request, by calling 800-862-6668 and (2) on the SEC’s website at http://www.sec.gov. The Form N-Q may be reviewed and copied at the SEC’s Public Reference Room in Washington, DC. Information on the operation of the Public Reference Room may be obtained by calling 1-800-SEC-0330.
| Expense Example (Unaudited) |
Your Fund's Expenses
As a shareholder of the Fund, you incur two types of costs: (1) transaction costs and (2) ongoing costs including investment management fees, distribution fees, and other fund expenses. This example is intended to help you understand your ongoing costs (in dollars) of investing in a Fund and to compare these costs with the ongoing costs of investing in other mutual funds. The example is based on an investment of $1,000 invested at the beginning of the period and held for the period of December 31, 2010 through June 30, 2011.
Actual Expenses
The first set of columns of the table below provides information about actual account values and actual expenses. You may use the information in this column, together with the amount you invested, to estimate the expenses that you paid over the period. Simply divide your account value by $1,000 (for example, an $8,600 account value divided by $1,000 = 8.6), then multiply the result by the number in the line under the heading entitled “Expenses Paid During Period” to estimate the expenses you paid on your account during this period.
Hypothetical Example for Comparison Purposes
The second set of columns of the table below provides information about hypothetical account values and hypothetical expenses based on a Fund's actual expense ratio and an assumed rate of return of 5% per year before expenses, which is not the Fund's actual return. The hypothetical account values and expenses may not be used to estimate the actual ending account balance or expenses you paid for the period. You may use this information to compare the ongoing costs of investing in a Fund and other funds. To do so, compare this 5% hypothetical example with the 5% hypothetical examples that appear in the shareholder reports of the other funds.
Please note that the expenses shown in the table are meant to highlight your ongoing costs only and do not reflect any transactional costs, such as sales charges (loads) and CDSC. Therefore, the second set of columns of the table is useful in comparing ongoing costs only, and will not help you determine the relative total costs of owning different funds. In addition, if these transactional costs were included, your costs would be higher. Expenses are equal to the Fund's annualized expense ratios multiplied by average account value over the period, multiplied by 181/365 (to reflect the one-half year period).
| Actual return | Hypothetical (5% return before expenses) | |||||||||||||||||||||||||||||||||||
| Expenses paid | Expenses paid | Days in | ||||||||||||||||||||||||||||||||||
| during the period | during the period | the | Days | |||||||||||||||||||||||||||||||||
| Beginning | Ending | December 31, 2010 | Beginning | Ending | December 31, 2010 | Annualized | current | in the | ||||||||||||||||||||||||||||
| Account Value | Account Value | through | Account Value | Account Value | through | expense | 1/2 | full | ||||||||||||||||||||||||||||
| December 31, 2010 | June 30, 2011 | June 30, 2011 | December 31, 2010 | June 30, 2011 | June 30, 2011 | ratio | year | year | ||||||||||||||||||||||||||||
| Class IA | $ | 1,000.00 | $ | 1,129.55 | $ | 3.70 | $ | 1,000.00 | $ | 1,021.32 | $ | 3.51 | 0.70 | % | 181 | 365 | ||||||||||||||||||||
| Class IB | $ | 1,000.00 | $ | 1,127.93 | $ | 5.01 | $ | 1,000.00 | $ | 1,020.08 | $ | 4.76 | 0.95 | % | 181 | 365 | ||||||||||||||||||||
29
| The Hartford | |
| P.O. Box 5085 | |
| Hartford, CT 06102-5085 | |
Hartford Series Fund, Inc. is underwritten and distributed by Hartford Securities Distribution Company, Inc.
“The Hartford” is The Hartford Financial Services Group, Inc. and its subsidiaries.
Hartford Series Fund, Inc. inception dates range from 1977 to date. Hartford Series Fund, Inc. is not a subsidiary of The Hartford but is underwritten, distributed by and advised by subsidiaries of The Hartford. Investments in Hartford Series Fund, Inc. are not guaranteed by The Hartford or any other entity.
You should carefully consider investment objectives, risks, and charges and expenses of Hartford HLS Funds before investing. This and other information can be found in the Fund’s prospectus or summary prospectus, which can be obtained by calling 800-862-6668. Please read them carefully before you invest or send money.
HLSSAR-SC11 8-11 | 106632 | Printed in U.S.A ©2011 The Hartford, Hartford, CT 06115 |

A MESSAGE FROM THE PRESIDENT

Dear Fellow Shareholders:
I want to take this opportunity to say thank you for your continued confidence and trust.
We have seen a significant amount of global turbulence in the first half of 2011. Investors have continued to be concerned about the implications of the European sovereign debt crisis, as well as our own high levels of domestic debt. Since January we have witnessed significant political uprisings in the already-volatile Middle East and North Africa region. In addition, the ramifications of Japan's massive earthquake, subsequent tsunami, and nuclear disaster are still being played out in the market.
Although corporate earnings have remained robust, the unemployment picture has been mixed. After adding more than 200,000 jobs from February to April, more recent unemployment reports have shown a pullback in hiring.
While official inflation remains low as measured by the Consumer Price Index (CPI), high oil prices may be indicative of higher inflation in the future. The federal funds rate remains at a historic low, however, the Fed could potentially raise the rate to get it closer to its historical average once the economy strengthens.
Even with these headwinds, domestic, international, and world indices (as measured by the S&P 500, MSCI EAFE and MSCI World) are all up more than 5% through June, 30 2011.
Looking ahead, continued growth in emerging markets is fueling global recovery efforts. Emerging markets comprise about 48 percent of the world’s GDP, and many economists believe they are poised for further expansion. As GDP growth continues in emerging markets, roughly 100 million people are added to the middle class each year. This middle class population growth could potentially drive a considerable shift in consumer purchasing power.
Now that we have reached the midpoint of 2011, perhaps now would be a good time to schedule a meeting with your financial adviser to examine your current investment strategy and determine whether you are on the right track.
| • | Are you concerned about inflation and its effects on your portfolio? |
| • | Is your portfolio prepared for rising interest rates? |
| • | Does your portfolio reflect the global economy with a mix of developed nations and emerging markets? |
Your financial professional’s advice can help you to navigate today’s volatile markets with confidence. You can also rest assured that we will continue to provide you with solid investments and stellar service for the road ahead.
Thank you again for your business.

James Davey
President
Hartford HLS Funds
Hartford Stock HLS Fund
| Manager Discussion (Unaudited) | 2 |
| Financial Statements | |
| 5 | |
| 8 | |
| 9 | |
| 10 | |
| 11 | |
| 12 | |
| 22 | |
| 24 | |
| 26 | |
| 26 | |
| 27 |
This report is prepared for the general information of contract owners and qualified retirement plan participants. It is not an offer of contracts or of qualified retirement plans. It should not be used in connection with any offer, except in conjunction with the appropriate product prospectus which contains all pertinent information including the applicable sales, administrative and other charges.
The views expressed in the Fund’s Manager Discussion under ‘‘Why did the Fund perform this way?’’ and ‘‘What is the outlook?’’ are views of the Fund’s sub-adviser and portfolio management team through the end of the reporting period and are subject to change based on market and other conditions.
Hartford Stock HLS Fund inception 08/31/1977 |
| (sub-advised by Wellington Management Company, LLP) |
| Investment objective – Seeks long-term growth of capital. |
Performance Overview 6/30/01 - 6/30/11

The chart above shows the growth of a $10,000 investment in Class IA. Growth results in classes other than Class IA will vary from what is seen above due to differences in the expenses charged to those share classes.
Average Annual Total Returns (as of 6/30/11) | ||||
6 Month† | 1 Year | 5 year | 10 year | |
| Stock IA | 4.26 % | 30.91 % | 2.99 % | 2.00 % |
| Stock IB | 4.13 % | 30.58 % | 2.74 % | 1.75 % |
| S&P 500 Index | 6.01 % | 30.68 % | 2.94 % | 2.72 % |
| † | Not Annualized |
PAST PERFORMANCE IS NOT INDICATIVE OF FUTURE RESULTS.
Total returns presented above were calculated using the Fund's net asset value available to shareholders for sale or redemption of Fund shares on June 30, 2011, which excludes investment transactions as of this date.
S&P 500 Index is a market capitalization-weighted price index composed of 500 widely held common stocks.
You cannot invest directly in an index.
The chart represents a hypothetical investment in the Fund. Performance data represents past performance and current performance could be higher or lower.
Performance information may reflect historical or current expense waivers/reimbursements from the investment adviser, without which performance would have been lower. For information on current expense waivers/reimbursements, please see the prospectus.
The value of the fund will fluctuate so that when redeemed, it may be worth more or less than the original investment. The chart and table do not reflect the deductions of taxes, sales charges or other fees which may be applied at the variable life insurance, variable annuity or qualified retirement plan product level. Any such additional sales charges or other fees or expenses would lower the contract’s or plan’s performance.
| Portfolio Managers | |
| Steven T. Irons, CFA | Peter I. Higgins, CFA |
| Senior Vice President | Senior Vice President |
How did the Fund perform?
The Class IA shares of the Hartford Stock HLS Fund returned 4.26% for the six-month period ended June 30, 2011, underperforming its benchmark, the S&P 500 Index, which returned 6.01% for the same period. The Fund underperformed the 4.93% return of the average fund in the Lipper Large-Cap Core Funds VP-UF peer group, a group of funds with investment strategies similar to those of the Fund.
Why did the Fund perform this way?
U.S. equities moved higher during the period despite a high degree of volatility caused by mounting concerns about unrest in North Africa and the Middle East and the devastating earthquake and nuclear crisis in Japan. Equities were pushed higher by investors’ enthusiasm for additional government debt purchases by the U.S. Federal Reserve, the extension of tax cuts in the U.S., and strong earnings growth. Fears of a global economic slowdown due to sovereign debt troubles in Europe, Japanese supply disruptions, and the end of the Federal Reserve’s quantitative easing program were not enough to offset optimism about the global economy, strong corporate earnings, and a continued accommodative Fed policy.
Overall equity market performance was positive for the period across all market capitalizations: large-cap equities (+6%), mid-caps (+9%), and small-caps (+6%) all rose as represented by the S&P 500, S&P 400 MidCap, and Russell 2000 Indices, respectively. During the six-month period nine of ten sectors within the S&P 500 Index posted positive returns, led by Health Care (+14%) and Energy (+11%), while Financials (-3%) was the only sector to produce negative absolute returns (i.e. total return).
The Fund’s underperformance versus the benchmark was driven by weak security selection in Consumer Discretionary, Industrials, and Energy, as well as an overweight (i.e. the Fund’s sector position was greater than the benchmark position) exposure to the Financials sector. This was partially offset by stronger selection in Materials, as well as an overweight exposure to Health Care. Note that sector positioning is a result of bottom-up (i.e. stock by stock fundamental research) security selection.
Stocks that detracted the most from both benchmark-relative (i.e. performance of the Fund as measure against the benchmark) and absolute returns during the period were Cisco Systems (Information Technology), Hewlett-Packard (Information Technology) and Google (Information Technology). Shares of Cisco Systems fell as the networking equipment provider disappointed investors with its margin guidance, stoking concerns that the company is being forced to cut prices to protect share. Shortfalls in consumer and set-top-box divisions also raised concerns regarding management distraction with non-core businesses. Global technology company Hewlett-Packard, a leader in printing and PCs, saw its stock sell off as its new CEO was forced to restructure numerous acquisitions of his predecessors and concerns mounted that the printing franchise is vulnerable to tablet computers. Shares of software company Google fell as headline news surrounding antitrust and patent-related lawsuits from their major competitors weighed on the stock price.
Top contributors to relative performance during the period were UCB (Health Care), Vertex Pharmaceuticals (Health Care), and UnitedHealth Group (Health Care). UCB, a Swiss pharmaceutical company, saw its shares rise as two potential blockbuster drugs, Cimzia, for arthritis, and Vimpat for epilepsy, proved successful in the marketplace. Earnings growth is also expected to accelerate in 2012 as Keppra generic erosion stabilizes in the U.S. Shares of Vertex Pharmaceuticals, a development stage pharmaceutical company, surged higher after the company reported success in a Phase 3 study of a cystic fibrosis treatment, opening the way for the company to apply for regulatory approval later this year. UnitedHealth Group, a health care benefits and services provider, saw its shares rise after the company reported strong first quarter earnings, beating analysts' estimates, driven in part by reduced use of services by its members. Investors looked favorably on the increase in enrollments as a potential sign of growth going forward, pushing the stock higher. Pfizer (Health Care) and Exxon Mobil (Energy) also contributed positively to the Fund’s returns on an absolute basis.
What is the outlook?
We see a recovering economy with solid corporate profit growth (and companies with a lot of cash on their balance sheets) slated to bring accelerating capital spending in 2011. Improving business confidence, an easier credit environment, the recently legislated 100% depreciation allowance for capital goods purchases in 2012, and a likelihood of significant pent up demand should result in a positive story.
We continue to focus our efforts on stock-by-stock fundamental research to construct a diversified large-cap core portfolio. We screen for companies on specific valuation, return on capital, and earnings characteristics and we focus on understanding how returns on capital are being created, employing a disciplined valuation methodology for both purchases and sales. At the end of the period, our bottom-up investment approach resulted in the largest overweight exposures in Health Care, Information Technology, and Financials, as we found a number of attractive investment opportunities in these sectors. The Fund’s largest underweights (i.e. the Fund’s sector position was less than the benchmark position) relative to the S&P 500 Index were in Consumer Staples, Utilities, and Telecommunication Services.
| Diversification by Industry | ||||
| as of June 30, 2011 | ||||
| Percentage of | ||||
| Industry (Sector) | Net Assets | |||
Automobiles & Components (Consumer Discretionary) | 2.8 | % | ||
| Banks (Financials) | 5.4 | |||
| Capital Goods (Industrials) | 7.4 | |||
Consumer Durables & Apparel (Consumer Discretionary) | 0.3 | |||
| Consumer Services (Consumer Discretionary) | 0.8 | |||
| Diversified Financials (Financials) | 9.9 | |||
| Energy (Energy) | 11.0 | |||
| Food & Staples Retailing (Consumer Staples) | 1.5 | |||
| Food, Beverage & Tobacco (Consumer Staples) | 4.6 | |||
| Health Care Equipment & Services (Health Care) | 3.2 | |||
| Household & Personal Products (Consumer Staples) | 1.0 | |||
| Insurance (Financials) | 2.4 | |||
| Materials (Materials) | 3.8 | |||
| Media (Consumer Discretionary) | 2.5 | |||
Pharmaceuticals, Biotechnology & Life Sciences (Health Care) | 12.1 | |||
| Retailing (Consumer Discretionary) | 4.8 | |||
| Semiconductors & Semiconductor Equipment | ||||
| (Information Technology) | 1.8 | |||
| Software & Services (Information Technology) | 10.4 | |||
Technology Hardware & Equipment (Information Technology) | 9.1 | |||
| Telecommunication Services (Services) | 1.0 | |||
| Transportation (Industrials) | 3.1 | |||
| Utilities (Utilities) | 0.9 | |||
| Other Assets and Liabilities | 0.2 | |||
| Total | 100.0 | % | ||
| Schedule of Investments |
| June 30, 2011 (Unaudited) |
| (000’s Omitted) |
| Shares or Principal Amount | Market Value ╪ | ||||||
| COMMON STOCKS - 99.8% | |||||||
| Automobiles & Components - 2.8% | |||||||
| 1,404 | Ford Motor Co. ● | $ | 19,367 | ||||
| 662 | Harley-Davidson, Inc. | 27,102 | |||||
| 315 | Johnson Controls, Inc. | 13,114 | |||||
| 59,583 | |||||||
| Banks - 5.4% | |||||||
| 826 | BB&T Corp. | 22,173 | |||||
| 4,103 | Mitsubishi UFJ Financial Group, Inc. | 19,993 | |||||
| 1,033 | US Bancorp | 26,339 | |||||
| 1,677 | Wells Fargo & Co. | 47,062 | |||||
| 115,567 | |||||||
| Capital Goods - 7.4% | |||||||
| 320 | 3M Co. | 30,343 | |||||
| 286 | Boeing Co. | 21,151 | |||||
| 410 | Ingersoll-Rand plc | 18,609 | |||||
| 131 | Masco Corp. | 1,575 | |||||
| 653 | PACCAR, Inc. | 33,382 | |||||
| 231 | Rockwell Collins, Inc. | 14,250 | |||||
| 219 | Stanley Black & Decker, Inc. | 15,772 | |||||
| 920 | Textron, Inc. | 21,718 | |||||
| 156,800 | |||||||
| Consumer Durables & Apparel - 0.3% | |||||||
| 426 | Newell Rubbermaid, Inc. | 6,722 | |||||
| Consumer Services - 0.8% | |||||||
| 288 | DeVry, Inc. | 17,006 | |||||
| Diversified Financials - 9.9% | |||||||
| 4,158 | Bank of America Corp. | 45,572 | |||||
| 70 | BlackRock, Inc. | 13,388 | |||||
| 154 | Goldman Sachs Group, Inc. | 20,429 | |||||
| 822 | Invesco Ltd. | 19,232 | |||||
| 1,313 | JP Morgan Chase & Co. | 53,746 | |||||
| 525 | SEI Investments Co. | 11,813 | |||||
| 335 | T. Rowe Price Group, Inc. | 20,208 | |||||
| 1,485 | UBS AG ADR ● | 27,122 | |||||
| 211,510 | |||||||
| Energy - 11.0% | |||||||
| 335 | Anadarko Petroleum Corp. | 25,684 | |||||
| 701 | Chesapeake Energy Corp. | 20,810 | |||||
| 986 | Exxon Mobil Corp. | 80,208 | |||||
| 727 | OAO Gazprom Class S ADR | 10,606 | |||||
| 263 | Occidental Petroleum Corp. | 27,404 | |||||
| 322 | Petroleo Brasileiro S.A. ADR | 10,893 | |||||
| 1,146 | Petroleum Geo-Services ● | 16,366 | |||||
| 726 | Statoilhydro ASA ADR | 18,469 | |||||
| 349 | Suncor Energy, Inc. | 13,642 | |||||
| 218 | Ultra Petroleum Corp. ● | 9,961 | |||||
| 234,043 | |||||||
| Food & Staples Retailing - 1.5% | |||||||
| 520 | CVS/Caremark Corp. | 19,542 | |||||
| 407 | Sysco Corp. | 12,693 | |||||
| 32,235 | |||||||
| Food, Beverage & Tobacco - 4.6% | |||||||
| 656 | General Mills, Inc. | 24,398 | |||||
| 739 | Kraft Foods, Inc. | 26,038 | |||||
| 663 | PepsiCo, Inc. | 46,695 | |||||
| 97,131 | |||||||
| Health Care Equipment & Services - 3.2% | |||||||
| 401 | HCA Holdings, Inc. ● | 13,233 | |||||
| 728 | Medtronic, Inc. | 28,035 | |||||
| 301 | UnitedHealth Group, Inc. | 15,520 | |||||
| 192 | Zimmer Holdings, Inc. ● | 12,122 | |||||
| 68,910 | |||||||
| Household & Personal Products - 1.0% | |||||||
| 321 | Procter & Gamble Co. | 20,419 | |||||
| Insurance - 2.4% | |||||||
| 3,385 | Ageas | 9,168 | |||||
| 992 | Genworth Financial, Inc. ● | 10,193 | |||||
| 579 | Marsh & McLennan Cos., Inc. | 18,056 | |||||
| 511 | Unum Group | 13,028 | |||||
| 50,445 | |||||||
| Materials - 3.8% | |||||||
| 168 | Airgas, Inc. | 11,767 | |||||
| 87 | CF Industries Holdings, Inc. | 12,311 | |||||
| 302 | Dow Chemical Co. | 10,875 | |||||
| 376 | Monsanto Co. | 27,260 | |||||
| 278 | Nucor Corp. | 11,476 | |||||
| 122 | Potash Corp. of Saskatchewan, Inc. | 6,930 | |||||
| 80,619 | |||||||
| Media - 2.5% | |||||||
| 957 | Comcast Corp. Class A | 24,248 | |||||
| 735 | Walt Disney Co. | 28,698 | |||||
| 52,946 | |||||||
| Pharmaceuticals, Biotechnology & Life Sciences - 12.1% | |||||||
| 334 | Agilent Technologies, Inc. ● | 17,086 | |||||
| 580 | Amgen, Inc. ● | 33,843 | |||||
| 500 | Celgene Corp. ● | 30,136 | |||||
| 1,102 | Daiichi Sankyo Co., Ltd. | 21,530 | |||||
| 163 | Life Technologies Corp. ● | 8,482 | |||||
| 1,300 | Merck & Co., Inc. | 45,881 | |||||
| 2,019 | Pfizer, Inc. | 41,581 | |||||
| 68 | Roche Holding AG | 11,430 | |||||
| 949 | Shionogi & Co., Ltd. | 15,547 | |||||
| 564 | UCB S.A. | 25,365 | |||||
| 149 | Vertex Pharmaceuticals, Inc. ● | 7,740 | |||||
| 258,621 | |||||||
| Retailing - 4.8% | |||||||
| 10,986 | Buck Holdings L.P. ⌂●† | 27,186 | |||||
| 374 | Kohl's Corp. | 18,694 | |||||
| 1,607 | Lowe's Co., Inc. | 37,463 | |||||
| 392 | Nordstrom, Inc. | 18,377 | |||||
| 101,720 | |||||||
| Semiconductors & Semiconductor Equipment - 1.8% | |||||||
| 153 | Cree, Inc. ● | 5,140 | |||||
| 759 | Maxim Integrated Products, Inc. | 19,405 | |||||
| 368 | Xilinx, Inc. | 13,436 | |||||
| 37,981 | |||||||
| Software & Services - 10.4% | |||||||
| 454 | Accenture plc | 27,455 | |||||
| 571 | Automatic Data Processing, Inc. | 30,086 | |||||
| 323 | Check Point Software Technologies Ltd. ADR ● | 18,334 | |||||
| 618 | eBay, Inc. ● | 19,946 | |||||
| 117 | Google, Inc. ● | 59,198 | |||||
| 360 | Lender Processing Services | 7,532 | |||||
| 797 | Microsoft Corp. | 20,719 | |||||
The accompanying notes are an integral part of these financial statements.
Hartford Stock HLS Fund |
| Schedule of Investments – (continued) |
| June 30, 2011 (Unaudited) |
| (000’s Omitted) |
| Shares or Principal Amount | Market Value ╪ | ||||||||
| COMMON STOCKS - 99.8% - (continued) | |||||||||
| Software & Services - 10.4% - (continued) | |||||||||
| 1,945 | Western Union Co. | $ | 38,954 | ||||||
| 222,224 | |||||||||
| Technology Hardware & Equipment - 9.1% | |||||||||
| 147 | Apple, Inc. ● | 49,176 | |||||||
| 2,568 | Cisco Systems, Inc. | 40,083 | |||||||
| 1,020 | EMC Corp. ● | 28,087 | |||||||
| 1,138 | Hewlett-Packard Co. | 41,420 | |||||||
| 622 | Qualcomm, Inc. | 35,323 | |||||||
| 194,089 | |||||||||
| Telecommunication Services - 1.0% | |||||||||
| 819 | Vodafone Group plc ADR | 21,884 | |||||||
| Transportation - 3.1% | |||||||||
| 253 | Con-way, Inc. | 9,828 | |||||||
| 129 | FedEx Corp. | 12,236 | |||||||
| 321 | Kansas City Southern ● | 19,015 | |||||||
| 345 | United Parcel Service, Inc. Class B | 25,132 | |||||||
| 66,211 | |||||||||
| Utilities - 0.9% | |||||||||
| 215 | NextEra Energy, Inc. | 12,342 | |||||||
| 265 | PPL Corp. | 7,367 | |||||||
| 19,709 | |||||||||
| Total common stocks | |||||||||
| (cost $1,873,156) | $ | 2,126,375 | |||||||
| Total long-term investments | |||||||||
| (cost $1,873,156) | $ | 2,126,375 | |||||||
| Total investments | |||||||||
(cost $1,873,156) ▲ | 99.8 | % | $ | 2,126,375 | |||||
| Other assets and liabilities | 0.2 | % | 3,864 | ||||||
| Total net assets | 100.0 | % | $ | 2,130,239 | |||||
| Note: | Percentage of investments as shown is the ratio of the total market value to total net assets. Market value of investments in foreign securities represents 11.6% of total net assets at June 30, 2011. |
Prices of foreign equities that are principally traded on certain foreign markets may be adjusted daily pursuant to a fair value pricing service approved by the Board of Directors in order to reflect an adjustment for factors occurring after the close of certain foreign markets but before the close of the New York Stock Exchange.
| ▲ | At June 30, 2011, the cost of securities for federal income tax purposes was $1,920,306 and the aggregate gross unrealized appreciation and depreciation based on that cost were: |
| Unrealized Appreciation | $ | 313,396 | ||
| Unrealized Depreciation | (107,327 | ) | ||
| Net Unrealized Appreciation | $ | 206,069 |
| † | The aggregate value of securities valued in good faith at fair value as determined under policies and procedures established by and under the supervisionof the Company's Board of Directors at June 30, 2011, was $27,186, which represents 1.28% of total net assets. This amount excludes securities that are principally traded in certain foreign markets and whose prices are adjusted pursuant to a third party pricing service methodology approved by the Board of Directors. |
| ● | Currently non-income producing. |
The accompanying notes are an integral part of these financial statements.
| ⌂ | The following securities are considered illiquid. Illiquid securities are often purchased in private placement transactions, are often not registered under the Securities Act of 1933 and may have contractual restrictions on resale. A security may also be considered illiquid if the security lacks a readily available market or if its valuation has not changed for a certain period of time. |
| Period Acquired | Shares/ Par | Security | Cost Basis | ||||||
| 06/2007 | 10,986 | Buck Holdings L.P. | $ | 8,422 | |||||
The aggregate value of these securities at June 30, 2011, was $27,186, which represents 1.28% of total net assets.
Foreign Currency Contracts Outstanding at June 30, 2011
| Unrealized | |||||||||||||||||
| Contract | Appreciation/ | ||||||||||||||||
| Description | Counterparty | Buy / Sell | Market Value ╪ | Amount | Delivery Date | (Depreciation) | |||||||||||
| Japanese Yen | BNP Paribas Securities | Buy | $ | 17,276 | $ | 16,300 | 09/02/2011 | $ | 976 | ||||||||
| Japanese Yen | Citibank | Sell | 20,564 | 20,397 | 10/21/2011 | (167 | ) | ||||||||||
| Japanese Yen | Goldman Sachs | Buy | 20,281 | 19,132 | 09/02/2011 | 1,149 | |||||||||||
| Japanese Yen | Goldman Sachs | Sell | 37,557 | 35,993 | 09/02/2011 | (1,564 | ) | ||||||||||
| Japanese Yen | Goldman Sachs | Sell | 21,403 | 21,228 | 10/21/2011 | (175 | ) | ||||||||||
| $ | 219 | ||||||||||||||||
| ╪ | See Significant Accounting Policies of accompanying Notes to Financial Statements regarding valuation of securities. |
The accompanying notes are an integral part of these financial statements.
| Investment Valuation Hierarchy Level Summary |
| June 30, 2011 (Unaudited) |
| (000’s Omitted) |
| Total | Level 1 ♦ | Level 2 ♦ | Level 3 | |||||||||||||
| Assets: | ||||||||||||||||
Common Stocks ‡ | $ | 2,126,375 | $ | 1,979,790 | $ | 119,399 | $ | 27,186 | ||||||||
| Total | $ | 2,126,375 | $ | 1,979,790 | $ | 119,399 | $ | 27,186 | ||||||||
| Foreign Currency Contracts * | 2,125 | – | 2,125 | – | ||||||||||||
| Total | $ | 2,125 | $ | – | $ | 2,125 | $ | – | ||||||||
| Liabilities: | ||||||||||||||||
| Foreign Currency Contracts * | 1,906 | – | 1,906 | – | ||||||||||||
| Total | $ | 1,906 | $ | – | $ | 1,906 | $ | – | ||||||||
| ♦ | For the six-month period ended June 30, 2011, there were no significant transfers between Level 1 and Level 2. |
| ‡ | The Fund has all or primarily all of the equity securities categorized in a particular level. Refer to the Schedule of Investments for further industry breakout. |
| * | Derivative instruments not reflected in the Schedule of Investments are valued at the unrealized appreciation/depreciation on the investments. |
Following is a reconciliation of Level 3 assets for which significant unobservable inputs were used to determine fair value:
| Balance as | Change in | |||||||||||||||||||||||||||||||||||
| Of | Realized | Unrealized | Transfers | Transfers | Balance as | |||||||||||||||||||||||||||||||
| December | Gain | Appreciation | Net | Into | Out of | of June | ||||||||||||||||||||||||||||||
| 31, 2010 | (Loss) | (Depreciation) | Amortization | Purchases | Sales | Level 3 | Level 3 | 30, 2011 | ||||||||||||||||||||||||||||
| Assets: | ||||||||||||||||||||||||||||||||||||
| Common Stocks | $ | 24,675 | $ | — | $ | 2,511 | * | $ | — | $ | — | $ | — | $ | — | $ | — | $ | 27,186 | |||||||||||||||||
| Total | $ | 24,675 | $ | — | $ | 2,511 | $ | — | $ | — | $ | — | $ | — | $ | — | $ | 27,186 | ||||||||||||||||||
| * | Change in unrealized appreciation or depreciation in the current period relating to assets still held at June 30, 2011 was $2,511. |
The accompanying notes are an integral part of these financial statements.
| Statement of Assets and Liabilities |
June 30, 2011 (Unaudited) |
| (000’s Omitted) |
| Assets: | ||||
| Investments in securities, at market value (cost $1,873,156) | $ | 2,126,375 | ||
| Foreign currency on deposit with custodian (cost $34) | 34 | |||
| Unrealized appreciation on foreign currency contracts | 2,125 | |||
| Receivables: | ||||
| Investment securities sold | 6,949 | |||
| Fund shares sold | 188 | |||
| Dividends and interest | 3,019 | |||
| Other assets | — | |||
| Total assets | 2,138,690 | |||
| Liabilities: | ||||
| Unrealized depreciation on foreign currency contracts | 1,906 | |||
| Bank overdraft — U.S. Dollars | 3,096 | |||
| Payables: | ||||
| Fund shares redeemed | 3,139 | |||
| Investment management fees | 160 | |||
| Distribution fees | 11 | |||
| Accrued expenses | 139 | |||
| Total liabilities | 8,451 | |||
| Net assets | $ | 2,130,239 | ||
| Summary of Net Assets: | ||||
| Capital stock and paid-in-capital | $ | 2,817,358 | ||
| Accumulated undistributed net investment income | 15,055 | |||
| Accumulated net realized loss on investments and foreign currency transactions | (955,645 | ) | ||
| Unrealized appreciation of investments and the translations of assets and liabilities denominated in foreign currency | 253,471 | |||
| Net assets | $ | 2,130,239 | ||
| Shares authorized | 4,000,000 | |||
| Par value | $ | 0.001 | ||
Class IA: Net asset value per share | $ | 42.73 | ||
| Shares outstanding | 43,484 | |||
| Net assets | $ | 1,858,133 | ||
Class IB: Net asset value per share | $ | 42.63 | ||
| Shares outstanding | 6,383 | |||
| Net assets | $ | 272,106 | ||
The accompanying notes are an integral part of these financial statements.
| Statement of Operations |
| For the Six-Month Period Ended June 30, 2011 (Unaudited) |
(000’s Omitted) |
| Investment Income: | ||||
| Dividends | $ | 20,924 | ||
| Interest | 12 | |||
| Less: Foreign tax withheld | (587 | ) | ||
| Total investment income, net | 20,349 | |||
| Expenses: | ||||
| Investment management fees | 5,266 | |||
| Distribution fees - Class IB | 362 | |||
| Custodian fees | 6 | |||
| Accounting services fees | 112 | |||
| Board of Directors' fees | 24 | |||
| Audit fees | 18 | |||
| Other expenses | 168 | |||
| Total expenses (before fees paid indirectly) | 5,956 | |||
| Commission recapture | (7 | ) | ||
| Total fees paid indirectly | (7 | ) | ||
| Total expenses, net | 5,949 | |||
| Net investment income | 14,400 | |||
| Net Realized Gain on Investments and Foreign Currency Transactions: | ||||
| Net realized gain on investments | 141,351 | |||
| Net realized loss on foreign currency contracts | (143 | ) | ||
| Net realized gain on other foreign currency transactions | 172 | |||
| Net Realized Gain on Investments and Foreign Currency Transactions | 141,380 | |||
| Net Changes in Unrealized Depreciation of Investments and Foreign Currency Transactions: | ||||
| Net unrealized depreciation of investments | (58,601 | ) | ||
| Net unrealized depreciation of foreign currency contracts | (196 | ) | ||
| Net unrealized appreciation on translation of other assets and liabilities in foreign currencies | 22 | |||
| Net Changes in Unrealized Depreciation of Investments and Foreign Currency Transactions | (58,775 | ) | ||
| Net Gain on Investments and Foreign Currency Transactions | 82,605 | |||
| Net Increase in Net Assets Resulting from Operations | $ | 97,005 | ||
The accompanying notes are an integral part of these financial statements.
| Statement of Changes in Net Assets |
| (000’s Omitted) |
| For the | ||||||||
| Six-Month | For the | |||||||
| Period Ended | Year Ended | |||||||
| June 30, 2011 | December 31, | |||||||
| (Unaudited) | 2010 | |||||||
| Operations: | ||||||||
| Net investment income | $ | 14,400 | $ | 23,525 | ||||
| Net realized gain on investments and foreign currency transactions | 141,380 | 186,374 | ||||||
| Net unrealized appreciation (depreciation) of investments and foreign currency transactions | (58,775 | ) | 93,630 | |||||
| Net Increase In Net Assets Resulting From Operations | 97,005 | 303,529 | ||||||
| Distributions to Shareholders: | ||||||||
| From net investment income | ||||||||
| Class IA | — | (21,729 | ) | |||||
| Class IB | — | (2,570 | ) | |||||
| Total distributions | — | (24,299 | ) | |||||
| Capital Share Transactions: | ||||||||
| Class IA | ||||||||
| Sold | 17,778 | 42,056 | ||||||
| Issued on reinvestment of distributions | — | 21,729 | ||||||
| Redeemed | (224,664 | ) | (380,269 | ) | ||||
| Total capital share transactions | (206,886 | ) | (316,484 | ) | ||||
| Class IB | ||||||||
| Sold | 9,679 | 19,460 | ||||||
| Issued on reinvestment of distributions | — | 2,570 | ||||||
| Redeemed | (50,340 | ) | (87,497 | ) | ||||
| Total capital share transactions | (40,661 | ) | (65,467 | ) | ||||
| Net decrease from capital share transactions | (247,547 | ) | (381,951 | ) | ||||
| Net Decrease In Net Assets | (150,542 | ) | (102,721 | ) | ||||
| Net Assets: | ||||||||
| Beginning of period | 2,280,781 | 2,383,502 | ||||||
| End of period | $ | 2,130,239 | $ | 2,280,781 | ||||
Accumulated undistributed (distribution in excess of) net investment income | $ | 15,055 | $ | 655 | ||||
| Shares: | ||||||||
| Class IA | ||||||||
| Sold | 414 | 1,143 | ||||||
| Issued on reinvestment of distributions | — | 544 | ||||||
| Redeemed | (5,254 | ) | (10,290 | ) | ||||
| Total share activity | (4,840 | ) | (8,603 | ) | ||||
| Class IB | ||||||||
| Sold | 226 | 535 | ||||||
| Issued on reinvestment of distributions | — | 65 | ||||||
| Redeemed | (1,178 | ) | (2,368 | ) | ||||
| Total share activity | (952 | ) | (1,768 | ) | ||||
The accompanying notes are an integral part of these financial statements.
| Notes to Financial Statements |
| June 30, 2011 (Unaudited) |
| (000’s Omitted) |
| 1. | Organization: |
Hartford Stock HLS Fund (the “Fund”) serves as an underlying investment option for certain variable annuity and variable life insurance separate accounts of Hartford Life Insurance Company (“HLIC”) and its affiliates and certain qualified retirement plans. The Fund may also serve as an underlying investment option for certain variable annuity and variable life separate accounts of other insurance companies. Owners of variable annuity contracts and policyholders of variable life insurance contracts may choose the funds permitted in the variable insurance contract prospectus. In addition, participants in certain qualified retirement plans may choose the Fund if permitted by their plans.
Hartford Series Fund, Inc. (the “Company”) is an open-end registered management investment company comprised of thirty portfolios. Financial Statements for the Fund, a series of the Company, are included in this report.
The Company is organized under the laws of the State of Maryland and is registered with the Securities and Exchange Commission (“SEC”) under the Investment Company Act of 1940, as amended (“1940 Act”). The Fund is a diversified open-end management investment company.
The Fund is divided into Class IA and Class IB shares. Each class is offered at the per share net asset value (“NAV”) without a sales charge and is subject to the same expenses, except that the Class IB shares are subject to distribution and service fees charged pursuant to a Distribution Plan adopted in accordance with Rule 12b-1 under the 1940 Act.
| 2. | Significant Accounting Policies: |
The following is a summary of significant accounting policies of the Fund in the preparation of its financial statements, which are in accordance with the United States Generally Accepted Accounting Principles (“U.S. GAAP”). The preparation of financial statements in accordance with U.S. GAAP may require management to make estimates and assumptions that affect the reported amounts of assets and liabilities and disclosure of contingent assets and liabilities at the date of the financial statements and the reported amounts of increases and decreases in net assets from operations during the reporting period. Actual results could differ from those estimates.
| a) | Determination of Net Asset Value – The NAV of each class of the Fund's shares is determined as of the close of regular trading (normally 4:00 p.m. Eastern Time) (the “NYSE Close”) on each day that the New York Stock Exchange (the “Exchange”) is open (“Valuation Date”). Information that becomes known to the Fund after the NAV has been calculated on a particular day will not generally be used to retroactively adjust the NAV determined earlier that day. |
| b) | Investment Valuation and Fair Value Measurements – For purposes of calculating the NAV, portfolio securities and other assets held by the Fund's portfolio for which market quotes are readily available are valued at market value. Market value is generally determined on the basis of last reported sales prices or official close price. If no sales are reported, market value is based on quotes obtained from a quotation reporting system, established market makers, or independent pricing services. If market prices are not readily available or are deemed unreliable, the Fund will use the fair value of the security as determined in good faith under policies and procedures established by and under the supervision of the Company's Board of Directors. Market quotes are considered not readily available where there is an absence of current or reliable market-based data (e.g., trade information or broker quotes), including where events occur after the close of the relevant market, but prior to the NYSE Close that materially affect the values of the Fund's portfolio securities or assets. In addition, market quotes are considered not readily available when, due to extraordinary circumstances, the exchanges or markets on which the securities trade, do not open for trading for the entire day and no other market prices are available. In addition, prices of foreign equities that are principally traded on certain foreign markets are adjusted daily pursuant to a fair value pricing service approved by the Board of Directors in order to reflect an adjustment for the factors occurring after the close of certain foreign markets but before the NYSE Close. Securities that are primarily traded on foreign markets may trade on days that are not business days of the Fund. The value of the foreign securities, in which the Fund invests, may change on days when a shareholder will not be able to purchase or redeem shares of the |
Fund. Fair value pricing is subjective in nature and the use of fair value pricing by the Fund may cause the NAV of its shares to differ significantly from the NAV that would have been calculated using market prices at the close of the exchange on which a portfolio security is primarily traded. There can be no assurance that the Fund could obtain the fair market value assigned to a security if the Fund were to sell the security at approximately the time at which the Fund determines its NAV.
Investments valued in currencies other than U.S. dollars are converted to U.S. dollars using exchange rates obtained from independent pricing services for calculation of the NAV. As a result, the NAV of the Fund’s shares may be affected by changes in the value of currencies in relation to the U.S. dollar. The value of securities traded in markets outside the United States or denominated in currencies other than the U.S. dollar may be affected significantly on a day that the NYSE is closed and the market value may change on days when an investor is not able to purchase, redeem or exchange shares of the Fund.
Foreign currency contracts represent agreements to exchange currencies on specific future dates at predetermined rates. Foreign currency contracts are valued using foreign currency exchange rates and forward rates as provided by an independent pricing service on Valuation Date.
Financial instruments for which prices are not available from an independent pricing service may be valued using market quotations obtained from one or more dealers that make markets in the respective financial instrument in accordance with procedures established by the Company’s Board of Directors.
U.S. GAAP defines fair value as the price that the Fund would receive to sell an asset or pay to transfer a liability in an orderly transaction between market participants. The U.S. GAAP fair value measurement standards require disclosure of a fair value hierarchy for each major category of assets and liabilities. Various inputs are used in determining the fair value of the Fund’s investments. These inputs are summarized into three broad hierarchy levels. This hierarchy is based on whether the valuation inputs are observable or unobservable. These levels are:
| · | Level 1 – Quoted prices in active markets for identical securities. Level 1 may include exchange-traded instruments such as domestic equities, some foreign equities, options, futures, mutual funds, exchange-traded funds, rights and warrants. |
| · | Level 2 – Observable inputs other than Level 1 prices, such as quoted prices for similar securities; quoted prices in markets that are not active; or other inputs that are observable or can be corroborated by observable market data. Level 2 may include debt securities that are traded less frequently than exchange-traded instruments and which are valued using third party pricing services; foreign equities, whose value is determined using a multi-factor regression model with inputs that are observable in the market; and short-term securities, which are valued at amortized cost. |
| · | Level 3 – Significant unobservable inputs that are supported by limited or no market activity. Level 3 may include financial instruments whose values are determined using broker quotes or require significant management judgment or estimation. These unobservable valuation inputs may include estimates for current yields, maturity/duration, prepayment speed, and broker quotes for comparable securities along with other assumptions relating to credit quality, collateral value, complexity of the security structure, general market conditions and liquidity. This category may include securities where trading has been halted or there are certain restrictions on trading. While these securities are priced using unobservable inputs, the valuation of these securities reflects the best available data and management believes the prices are a reasonable representation of exit price. |
Valuation levels are not necessarily indicative of the risk associated with investing in such securities. Individual securities within any of the above mentioned asset classes may be assigned a different hierarchical level than those presented above, as individual circumstances dictate.
Hartford Stock HLS Fund |
| Notes to Financial Statements – (continued) |
| June 30, 2011 (Unaudited) |
| (000’s Omitted) |
For additional information, refer to the Investment Valuation Hierarchy Level Summary and the Level 3 roll forward reconciliation which follow the Schedule of Investments.
For purposes of reporting transfers between different hierarchy levels, both transfers in and out of each level, as applicable, are shown as if they occurred at the beginning of the period.
| c) | Security Transactions and Investment Income – Security transactions are recorded as of the trade date (the date the order to buy or sell is executed) for financial reporting purposes. Securities purchased or sold on a when-issued or delayed-delivery basis may be settled a month or more after the trade date. Realized gains and losses are determined on the basis of identified cost. |
Dividend income is accrued as of the ex-dividend date, except that certain dividends from foreign securities where the ex-dividend date may have passed are recorded as soon as the Fund is informed of the dividend. Interest income, including amortization of premium and accretion of discounts, is accrued on a daily basis.
| d) | Foreign Currency Transactions – Assets and liabilities denominated in currencies other than U.S. dollars are translated into U.S. dollars at the exchange rates in effect on the valuation date. Purchases and sales of investment securities, income, and expenses are translated into U.S. dollars at the exchange rates on the dates of such transactions. |
The Fund does not isolate that portion of portfolio security valuation resulting from fluctuations in the foreign currency exchange rates from the fluctuations arising from changes in the market prices of securities held. Exchange rate fluctuations are included with the net realized and unrealized gain or loss on investments in the accompanying financial statements.
Net realized foreign exchange gains or losses arise from sales of foreign currencies and the difference between asset and liability amounts initially stated in foreign currencies and the U.S. dollar value of the amounts actually received or paid. Net unrealized foreign exchange gains or losses arise from changes in the value of other assets and liabilities at the end of the reporting period, resulting from changes in the exchange rates.
| e) | Joint Trading Account – The Fund may invest cash balances into a joint trading account that may be invested in one or more repurchase agreements. |
| f) | Fund Share Valuation and Dividend Distributions to Shareholders – Orders for the Fund’s shares are executed in accordance with the investment instructions of the contract holders and plan participants. The NAV of the Fund’s shares is determined as of the close of business on each business day of the Exchange. The NAV is determined separately for each class of shares of the Fund by dividing the Fund’s net assets attributable to that class by the number of shares of the class outstanding. Each class of shares offered by the Fund has equal rights as to assets and voting privileges (except that shareholders of a class have exclusive voting rights regarding any matter relating solely to that class of shares). Income and non-class specific expenses are allocated daily to each class on the basis of the relative net assets of the class. Realized and unrealized capital gains and losses of each class are allocated daily based on the relative net assets of each class of shares of the Fund. |
Orders for the purchase of the Fund’s shares received prior to the close of the Exchange on any day the Exchange is open for business are priced at the NAV determined as of the close of the Exchange. Orders received after the close of the Exchange, or on a day on which the Exchange and/or the Fund is not open for business, are priced at the next determined NAV.
Dividends are declared pursuant to a policy adopted by the Company’s Board of Directors based upon the investment performance of the Fund. The policy of the Fund is to pay dividends from net investment income and realized capital gains, if any, at least once a year.
Distributions from net investment income, net realized capital gains and capital are determined in accordance with federal income tax regulations, which may differ from U.S. GAAP with respect to character and timing. These differences may include but are not limited to losses deferred due to wash sale adjustments, foreign currency gains and losses, adjustments related to Passive Foreign Investment Companies (“PFICs”), Real Estate Investment Trusts (“REITs”), Regulated Investment Companies (“RICs”), certain derivatives and partnerships. Permanent book and federal income tax basis differences relating to shareholder distributions will result in reclassifications to certain of the Fund’s capital accounts (see Federal Income Taxes: Reclassification of Capital Accounts note).
| 3. | Securities and Other Investments: |
| a) | Repurchase Agreements – A repurchase agreement is an agreement by which a counterparty agrees to sell a security and agrees to repurchase the security sold at a mutually agreed upon time and price. At the time the Fund enters into a repurchase agreement, the value of the underlying collateral security(ies), including accrued interest, will be equal to or exceed the value of the repurchase agreement. Repurchase agreements expose the Fund to counterparty risk. To minimize counterparty risk, the securities that serve to collateralize the repurchase agreement are held by the Fund's custodian in book entry or physical form in the custodial account of the Fund or in a third party custodial account. Repurchase agreements are valued at cost plus accrued interest. The Fund had no outstanding repurchase agreements as of June 30, 2011. |
| b) | Illiquid and Restricted Securities – The Fund is permitted to invest up to 15% of its net assets in illiquid securities. Illiquid securities are those that may not be sold or disposed of in the ordinary course of business within seven days, at approximately the price used to determine the Fund’s NAV. The Fund may not be able to sell illiquid securities or other investments when its sub-adviser considers it desirable to do so or may have to sell such securities or investments at a price that is lower than the price that could be obtained if the securities or investments were more liquid. A sale of illiquid securities or other investments may require more time and may result in higher dealer discounts and other selling expenses than does the sale of those that are liquid. Illiquid securities and investments also may be more difficult to value, due to the unavailability of reliable market quotations for such securities or investments, and an investment in them may have an adverse impact on the Fund’s NAV. The Fund may also purchase certain restricted securities that can only be resold to certain qualified investors and may be determined to be liquid pursuant to policies and guidelines established by the Company’s Board of Directors. The Fund, as shown on the Schedule of Investments, had illiquid and/or restricted securities as of June 30, 2011. |
| c) | Securities Purchased on a When-Issued or Delayed-Delivery Basis – Delivery and payment for securities that have been purchased by the Fund on a forward commitment, or when-issued or delayed-delivery basis, take place beyond the customary settlement period. During this period, such securities are subject to market fluctuations, and the Fund identifies securities segregated in its records with value at least equal to the amount of the commitment. The Fund had no outstanding when-issued or delayed delivery securities as of June 30, 2011. |
| 4. | Financial Derivative Instruments: |
The following disclosures contain information on how and why the Fund uses derivative instruments, the credit-risk-related contingent features in certain derivative instruments, and how derivative instruments affect the Fund’s financial position, results of operations and cash flows. The location and fair value amounts of these instruments on the Statement of Assets and Liabilities and the realized gains and losses and changes in unrealized gains and losses on the Statement of Operations, each categorized by type of derivative contract, are included in the following Additional Derivative Instrument Information footnote. The derivative instruments outstanding as of period-end are disclosed in the Notes to the Schedule of Investments and the amounts of realized gains and losses and changes in unrealized gains and losses on derivative instruments during the period are disclosed in the Statement of Operations.
Hartford Stock HLS Fund |
| Notes to Financial Statements – (continued) |
| June 30, 2011 (Unaudited) |
| (000’s Omitted) |
| a) | Foreign Currency Contracts – The Fund may enter into foreign currency contracts that obligate the Fund to purchase or sell currencies at specified future dates. Foreign currency contracts are used to hedge the currency exposure associated with some or all of the Fund's securities and/or as part of an investment strategy. Foreign currency contracts are marked to market daily and the change in value is recorded by the Fund as an unrealized gain or loss. Realized gains or losses equal to the difference between the value of the contract at the time it was opened and the value at the time it was closed are recorded upon delivery or receipt of the currency. |
Foreign currency contracts involve elements of market risk in excess of the amounts reflected in the Statement of Assets and Liabilities. In addition, risks may arise upon entering into these contracts from the potential inability of the counterparties to meet the terms of the contracts and from unanticipated movements in the value of the foreign currencies relative to the U.S. dollar. The Fund had outstanding foreign currency contracts as shown on the Schedule of Investments as of June 30, 2011.
| b) | Additional Derivative Instrument Information: |
Fair Values of Derivative Instruments on the Statement of Assets and Liabilities as of June 30, 2011:
| Risk Exposure Category | ||||||||||||||||||||||||||||
| Foreign | ||||||||||||||||||||||||||||
| Interest Rate | Exchange | Credit | Equity | Commodity | Other | |||||||||||||||||||||||
| Contracts | Contracts | Contracts | Contracts | Contracts | Contracts | Total | ||||||||||||||||||||||
| Assets: | ||||||||||||||||||||||||||||
Unrealized appreciation on foreign currency contracts | $ | — | $ | 2,125 | $ | — | $ | — | $ | — | $ | — | $ | 2,125 | ||||||||||||||
| Total | $ | — | $ | 2,125 | $ | — | $ | — | $ | — | $ | — | $ | 2,125 | ||||||||||||||
| Liabilities: | ||||||||||||||||||||||||||||
Unrealized depreciation on foreign currency contracts | $ | — | $ | 1,906 | $ | — | $ | — | $ | — | $ | — | $ | 1,906 | ||||||||||||||
| Total | $ | — | $ | 1,906 | $ | — | $ | — | $ | — | $ | — | $ | 1,906 | ||||||||||||||
The volume of derivatives that is presented in the Schedule of Investments is consistent with the derivative activity during the six-month period ended June 30, 2011.
The Effect of Derivative Instruments on the Statement of Operations for the six-month period ended June 30, 2011:
| Risk Exposure Category | ||||||||||||||||||||||||||||
| Foreign | ||||||||||||||||||||||||||||
| Interest Rate | Exchange | Credit | Equity | Commodity | Other | |||||||||||||||||||||||
| Contracts | Contracts | Contracts | Contracts | Contracts | Contracts | Total | ||||||||||||||||||||||
| Realized Gain (Loss) on Derivatives Recognized as a Result from Operations: | ||||||||||||||||||||||||||||
Net realized loss on foreign currency contracts | $ | — | $ | (143 | ) | $ | — | $ | — | $ | — | $ | — | $ | (143 | ) | ||||||||||||
| Total | $ | — | $ | (143 | ) | $ | — | $ | — | $ | — | $ | — | $ | (143 | ) | ||||||||||||
| Net Change in Unrealized Appreciation (Depreciation) on Derivatives Recognized as a Result from Operations: | ||||||||||||||||||||||||||||
Net change in unrealized depreciation of foreign currency contracts | $ | — | $ | (196 | ) | $ | — | $ | — | $ | — | $ | — | $ | (196 | ) | ||||||||||||
| Total | $ | — | $ | (196 | ) | $ | — | $ | — | $ | — | $ | — | $ | (196 | ) | ||||||||||||
| 5. | Principal Risks: |
| a) | Counterparty Risk – The Fund may be exposed to counterparty risk, or the risk that an institution or other entity with which the Fund has unsettled or open transactions will default. |
| b) | Market Risks – If a Fund invests directly in foreign currencies or in securities that trade in, and receive revenues in, foreign currencies, or in derivatives that provide exposure to foreign currencies, it will be subject to the risk that those currencies will decline in value relative to the base currency of the Fund, or, in the case of hedging positions, that the Fund’s base currency will decline in value relative to the currency being hedged. Currency rates in foreign countries may fluctuate significantly over short periods of time for a number of reasons, including changes in interest rates, intervention (or the failure to intervene) by U.S. or foreign governments, central banks or supranational entities such as the International Monetary Fund, or by the imposition of currency controls or other political developments in the United States or abroad. As a result, the Fund’s investments in foreign currency denominated securities may reduce the returns of the Fund. The market values of equity securities, such as common stocks and preferred stocks or equity related investments such as futures and options, may decline due to general market conditions which are not specifically related to a particular company, such as real or perceived adverse economic conditions, changes in the general outlook for corporate earnings, changes in interest or currency rates or adverse investor sentiment generally. The market value of equity securities may also decline due to factors which affect a particular industry or industries, such as labor shortages or increased production costs and competitive conditions within an industry. Equity securities and equity related investments generally have greater market price volatility than fixed income securities. |
| 6. | Federal Income Taxes: |
| a) | Federal Income Taxes – For federal income tax purposes, the Fund intends to continue to qualify as a RIC under Subchapter M of the Internal Revenue Code (“IRC”) by distributing substantially all of its taxable net investment income and net realized capital gains to its shareholders and otherwise complying with the requirements of RICs. The Fund has distributed substantially all of its income and capital gains in prior years, if applicable, and intends to distribute substantially all of its income and capital gains prior to the next fiscal year-end. Accordingly, no provision for federal income or excise taxes has been made in the accompanying financial statements. Distributions from short-term capital gains are treated as ordinary income distributions for federal income tax purposes. |
| b) | Net Investment Income (Loss), Net Realized Gains (Losses) – Net investment income (loss) and net realized gains (losses) may differ for financial statement and tax purposes primarily because of losses deferred due to wash sale adjustments, foreign currency gains and losses, adjustments related to PFICs, REITs, RICs, certain derivatives and partnerships. The character of distributions made during the year from net investment income or net realized gains may differ from their ultimate characterization for federal income tax purposes. Also, due to the timing of dividend distributions, the fiscal year in which amounts are distributed may differ from the year that the income or realized gains (losses) were recorded by the Fund. |
| c) | Distributions and Components of Distributable Earnings – The tax character of distributions paid by the Fund for the periods indicated is as follows (as adjusted for dividends payable): |
| For the Year Ended | For the Year Ended | |||||||
| December 31, 2010 | December 31, 2009 | |||||||
| Ordinary Income | $ | 24,299 | $ | 31,722 | ||||
Hartford Stock HLS Fund |
| Notes to Financial Statements – (continued) |
| June 30, 2011 (Unaudited) |
| (000’s Omitted) |
As of December 31, 2010, the Fund’s components of distributable earnings (deficit) on a tax basis were as follows:
| Amount | ||||
| Undistributed Ordinary Income | $ | 1,216 | ||
| Accumulated Capital and Other Losses* | (1,050,022 | ) | ||
Unrealized Appreciation† | 264,682 | |||
| Total Accumulated Deficit | $ | (784,124 | ) | |
| * | The Fund has capital loss carryforwards that are identified in the Capital Loss Carryforward note that follows. |
| † | The difference between book-basis and tax-basis unrealized appreciation (depreciation) may be attributable to the losses deferred due to wash sale adjustments, foreign currency gains and losses, adjustments related to PFICs, REITs, RICs, certain derivatives and partnerships. |
| d) | Reclassification of Capital Accounts – The Fund may record reclassifications in its capital accounts. These reclassifications have no impact on the total net assets of the Fund. The reclassifications are a result of permanent differences between U.S. GAAP and tax accounting for such items as expiration or utilization of capital loss carryforwards or net operating losses. Adjustments are made to reflect the impact these items have on current and future distributions to shareholders. Therefore, the source of the Fund’s distributable income may be shown in the accompanying Statement of Assets and Liabilities as from accumulated undistributed net investment income, from accumulated net realized gains on investments or from capital depending on the type of book and tax differences that exist. For the year ended December 31, 2010, the Fund recorded reclassifications to increase (decrease) the accounts listed below: |
| Amount | ||||
| Accumulated Undistributed Net Investment Income | $ | (220 | ) | |
| Accumulated Net Realized Gain (Loss) on Investments and Foreign Currency Transactions | 220 | |||
| e) | Capital Loss Carryforward – At December 31, 2010 (tax-year-end), the Fund had capital loss carryforwards for U.S. federal income tax purposes of approximately: |
| Year of Expiration | Amount | |||
| 2016 | $ | 311,745 | ||
| 2017 | 738,277 | |||
| Total | $ | 1,050,022 | ||
As of December 31, 2010, the Fund utilized $120,235 of prior year capital loss carryforwards.
| f) | Accounting for Uncertainty in Income Taxes – The Fund has adopted financial reporting rules that require the Fund to analyze all open tax years, as defined by the Statute of Limitations, for all major jurisdictions. Generally, tax authorities can examine all tax returns filed for the last three years. The Fund does not have an examination in progress. |
The Fund has reviewed all open tax years and major jurisdictions and concluded that these financial reporting rules had no effect on the Fund’s financial position or results of operations. There is no tax liability resulting from unrecognized tax benefits relating to uncertain income tax positions taken or expected to be taken on the tax return for the fiscal year-end December 31, 2010. The Fund is also not aware of any tax positions for which it is reasonably possible that the total amounts of unrecognized tax benefits will significantly change in the next twelve months.
| 7. | Expenses: |
| a) | Investment Management Agreements – HL Investment Advisors, LLC (“HL Advisors”), an indirect wholly owned subsidiary of The Hartford Financial Services Group, Inc. (“The Hartford”), serves as investment manager to the Fund pursuant to an Investment Management Agreement with the Company. As investment manager, HL Advisors has overall investment supervisory responsibility for the Fund. In addition, HL Advisors provides administrative personnel, services, equipment, facilities and office space for proper operation of the Fund. HL Advisors has contracted with Wellington Management Company, LLP (“Wellington Management”) under a sub-advisory agreement for the provision of day-today investment management services to the Fund in accordance with the Fund’s investment objective and policies. The Fund pays a fee to HL Advisors, a portion of which may be used to compensate Wellington Management. |
The schedule below reflects the rates of compensation paid to HL Advisors for investment management services rendered as of June 30, 2011; the rates are accrued daily and paid monthly.
| Average Daily Net Assets | Annual Fee | |||
| On first $250 million | 0.5250 | % | ||
| On next $250 million | 0.5000 | % | ||
| On next $500 million | 0.4750 | % | ||
| On next $4 billion | 0.4500 | % | ||
| On next $5 billion | 0.4475 | % | ||
| Over $10 billion | 0.4450 | % | ||
| b) | Accounting Services Agreement – Pursuant to the Fund Accounting Agreement between HLIC and the Company, on behalf of the Fund, HLIC provides accounting services to the Fund and receives monthly compensation based on the Fund’s average net assets at the rates set forth below. The Fund’s accounting services fees are accrued daily and paid monthly. |
| Average Daily Net Assets | Annual Fee | |||
| All Assets | 0.010 | % | ||
| c) | Operating Expenses – Allocable expenses incurred by the Company are allocated to each Fund and allocated to classes within a Fund in proportion to the average daily net assets of the Fund and each class, except where allocation of certain expenses is more fairly made directly to the Fund or to specific classes within a Fund. |
| d) | Fees Paid Indirectly – The Company, on behalf of the Fund, has entered into agreements with State Street Global Markets, LLC and Russell Implementation Services, Inc. to partially recapture non discounted trade commissions. Such rebates are used to pay a portion of the Fund’s expenses. In addition, the Fund’s custodian bank has also agreed to reduce its fees when the Fund maintains cash on deposit in a non-interest-bearing custody account. For the six-month period ended June 30, 2011, these amounts are included in the Statement of Operations. |
The ratio of expenses to average net assets in the accompanying financial highlights excludes the reduction in expenses related to fees paid indirectly. The annualized expense ratio for the period listed below including the fees paid indirectly is as follows:
| Annualized Six- | ||||
| Month Period | ||||
| Ended June 30, | ||||
| 2011 | ||||
| Class IA | 0.50 | % | ||
| Class IB | 0.75 | |||
Hartford Stock HLS Fund |
| Notes to Financial Statements – (continued) |
| June 30, 2011 (Unaudited) |
| (000’s Omitted) |
| e) | Distribution Plan for Class IB shares – The Company, on behalf of the Fund, has adopted a Distribution Plan pursuant to Rule 12b-1 of the 1940 Act to compensate the Distributor, Hartford Securities Distribution Company, Inc. (a wholly owned, ultimate subsidiary of The Hartford), from assets attributable to the Class IB shares for services rendered and expenses borne in connection with activities primarily intended to result in the sale of the Class IB shares, subject to the review and approval of the Company’s Board of Directors. |
The Distribution Plan provides that the Fund may pay annually up to 0.25% of the average daily net assets of the Fund attributable to its Class IB shares for activities primarily intended to result in the sale of Class IB shares. The Board has the authority to suspend or reduce these payments at any point in time. Under the terms of the Distribution Plan and the principal underwriting agreement, the Fund is authorized to make payments monthly to the Distributor that may be used to pay or compensate entities providing distribution and shareholder servicing with respect to the Class IB shares for such entities’ fees or expenses incurred or paid in that regard. These fees are accrued daily and paid monthly.
| f) | Other Related Party Transactions – Certain officers of the Fund are directors and/or officers of HL Advisors and/or The Hartford or its subsidiaries. For the six-month period ended June 30, 2011, a portion of the Fund’s chief compliance officer’s salary was paid by all the investment companies in the Hartford fund complex. The portion allocated to the Fund was in the amount of $2. These fees are accrued daily and paid monthly. |
| g) | Payments from Affiliates – In July of 2007, The Hartford entered into a settlement with the Attorneys General of the states of New York, Connecticut and Illinois relating to market timing and the company's individual variable annuity contracts in which certain payments would be made directly to the variable annuity contract holders. The distribution plan provided that unclaimed money from the settlement would be distributed to certain HLS Funds that are investment options through a Hartford individual variable annuity contract. The unclaimed money was distributed to the Fund on September 18, 2009, as follows: |
| Amount | ||||
| Reimbursement | $ | 90 | ||
On November 8, 2006, the SEC issued an order setting forth the terms of a settlement reached with three subsidiaries of The Hartford that resolved the SEC’s Division of Enforcement’s investigation of aspects of The Hartford’s variable annuity and mutual fund operations related to directed brokerage and revenue sharing. The Hartford settled this matter without admitting or denying the findings of the SEC.
The Fund is available for purchase by the separate accounts of different variable universal life policies, variable annuity products, and funding agreements and it is offered directly to certain qualified retirement plans (collectively “Products”). Although existing Products contain transfer restrictions, some Products, particularly older variable annuity products, do not contain restrictions on the frequency of transfers. In addition, as the result of the settlement of litigation against Hartford Life, Inc. (“Hartford Life”) (the issuers of such variable annuity products), the Fund’s ability to restrict transfers by certain owners of older variable annuity products was limited. During 2006, these annuity owners surrendered the older variable annuity contracts that were the subject of prior litigation.
The total return in the accompanying financial highlights includes payments from affiliates. Had the payments from the affiliates been excluded, the impact and total return for the periods listed below would have been as follows:
| For the Year Ended December 31, 2009 | ||||||||
| Class IA | Class IB | |||||||
| Impact from Payment from Affiliate for Attorneys General Settlement | — | % | — | % | ||||
| Total Return Excluding Payment from Affiliate | 41.53 | 41.18 | ||||||
| For the Year Ended December 31, 2006 | ||||||||
| Class IA | Class IB | |||||||
| Impact from Payment from Affiliate for SEC Settlement | 0.11 | % | 0.12 | % | ||||
| Impact from Payment from Affiliate for Unrestricted Transfers | 0.01 | 0.01 | ||||||
| Total Return Excluding Payments from Affiliates | 14.53 | 14.24 | ||||||
| 8. | Investment Transactions: |
For the six-month period ended June 30, 2011, the Fund's aggregate purchases and sales of investment securities (excluding short-term investments) were as follows:
| Amount | ||||
| Cost of Purchases Excluding U.S. Government Obligations | $ | 631,839 | ||
| Sales Proceeds Excluding U.S. Government Obligations | 848,018 | |||
| 9. | Line of Credit: |
The Fund is one of several Hartford funds that participate in a $500 million committed revolving line of credit facility. The facility is to be used for temporary or emergency purposes. Under the arrangement, a fund is required to own securities having a market value in excess of 300% of the total bank borrowings. The interest rate on borrowings varies depending on the nature of the loan. The facility also requires a fee to be paid based on the amount of the commitment. This commitment fee is allocated to all the funds participating in the line of credit based on the average net assets of the funds. During the six-month period ended June 30, 2011, the Fund did not have any borrowings under this facility.
| 10. | Industry Classifications: |
Other than the industry classifications “Other Investment Pools and Funds” and “Exchange Traded Funds,” equity industry classifications used in this report are the Global Industry Classification Standard, which was developed by and is the exclusive property and service mark of MSCI, Inc. and Standard & Poor’s.
| 11. | Indemnifications: |
Under the Company’s organizational documents, the Company shall indemnify its officers and directors to the full extent required or permitted under Maryland General Corporation Law and the federal securities laws. In addition, the Company, on behalf of the Fund, may enter into contracts that contain a variety of indemnifications. The Company’s maximum exposure under these arrangements is unknown. However, as of the date of these financial statements the Company has not had prior claims or losses pursuant to these contracts and expects the risk of loss to be remote.
| Financial Highlights |
| - Selected Per-Share Data (A) - |
| Net Asset | Net Realized | Net Increase | ||||||||||||||||||||||||||||||||||||||||||
| Value at | and Unrealized | Total from | Dividends from | Distributions | (Decrease) in | Net Asset | ||||||||||||||||||||||||||||||||||||||
| Beginning of | Net Investment | Payments from | Gain (Loss) on | Investment | Net Investment | from Realized | Distributions | Total | Net Asset | Value at End of | ||||||||||||||||||||||||||||||||||
| Class | Period | Income (Loss) | (to) Affiliate | Investments | Operations | Income | Capital Gains | from Capital | Distributions | Value | Period | |||||||||||||||||||||||||||||||||
| For the Six-Month Period Ended June 30, 2011 (Unaudited) | ||||||||||||||||||||||||||||||||||||||||||||
| IA | $ | 40.98 | $ | 0.30 | $ | – | $ | 1.45 | $ | 1.75 | $ | – | $ | – | $ | – | $ | – | $ | 1.75 | $ | 42.73 | ||||||||||||||||||||||
| IB | 40.94 | 0.24 | – | 1.45 | 1.69 | – | – | – | – | 1.69 | 42.63 | |||||||||||||||||||||||||||||||||
| For the Year Ended December 31, 2010 | ||||||||||||||||||||||||||||||||||||||||||||
| IA | 36.10 | 0.44 | – | 4.89 | 5.33 | (0.45 | ) | – | – | (0.45 | ) | 4.88 | 40.98 | |||||||||||||||||||||||||||||||
| IB | 36.06 | 0.35 | – | 4.88 | 5.23 | (0.35 | ) | – | – | (0.35 | ) | 4.88 | 40.94 | |||||||||||||||||||||||||||||||
| For the Year Ended December 31, 2009 | ||||||||||||||||||||||||||||||||||||||||||||
| IA | 25.86 | 0.48 | – | 10.25 | 10.73 | (0.49 | ) | – | – | (0.49 | ) | 10.24 | 36.10 | |||||||||||||||||||||||||||||||
| IB | 25.84 | 0.39 | – | 10.24 | 10.63 | (0.41 | ) | – | – | (0.41 | ) | 10.22 | 36.06 | |||||||||||||||||||||||||||||||
| For the Year Ended December 31, 2008 | ||||||||||||||||||||||||||||||||||||||||||||
| IA | 47.11 | 0.59 | – | (20.79 | ) | (20.20 | ) | (0.81 | ) | (0.24 | ) | – | (1.05 | ) | (21.25 | ) | 25.86 | |||||||||||||||||||||||||||
| IB | 47.00 | 0.50 | – | (20.72 | ) | (20.22 | ) | (0.70 | ) | (0.24 | ) | – | (0.94 | ) | (21.16 | ) | 25.84 | |||||||||||||||||||||||||||
| For the Year Ended December 31, 2007 | ||||||||||||||||||||||||||||||||||||||||||||
| IA | 52.57 | 0.60 | – | 2.43 | 3.03 | (0.57 | ) | (7.92 | ) | – | (8.49 | ) | (5.46 | ) | 47.11 | |||||||||||||||||||||||||||||
| IB | 52.45 | 0.45 | – | 2.44 | 2.89 | (0.42 | ) | (7.92 | ) | – | (8.34 | ) | (5.45 | ) | 47.00 | |||||||||||||||||||||||||||||
| For the Year Ended December 31, 2006 | ||||||||||||||||||||||||||||||||||||||||||||
| IA | 49.21 | 0.72 | 0.06 | 6.41 | 7.19 | (0.71 | ) | (3.12 | ) | – | (3.83 | ) | 3.36 | 52.57 | ||||||||||||||||||||||||||||||
| IB | 49.10 | 0.56 | 0.06 | 6.42 | 7.04 | (0.57 | ) | (3.12 | ) | – | (3.69 | ) | 3.35 | 52.45 | ||||||||||||||||||||||||||||||
| (A) | Information presented relates to a share outstanding throughout the indicated period. |
| (B) | The figures do not include sales charges or other fees which may be applied at the variable life insurance, variable annuity or qualified retirement plan product level. Any such additional sales charges or other fees would lower the Fund's performance. |
| (C) | Ratios do not reflect reductions for fees paid indirectly. Please see Fees Paid Indirectly in the Notes to Financial Statements. |
| (D) | Portfolio turnover rate is calculated on the basis of the Fund as a whole without distinguishing between the classes of shares issued. |
| (E) | Not annualized. |
| (F) | Annualized. |
| (G) | Total return without the inclusion of the Payment from (to) Affiliate can be found in Expenses in the accompanying Notes to Financial Statements. |
| - Ratios and Supplemental Data - |
| Ratio of Expenses to Average Net | Ratio of Expenses to Average Net | Ratio of Net Investment Income to | Portfolio Turnover | |||||||||||||||||||
| Total Return(B) | Net Assets at End of Period | Assets Before Waivers(C) | Assets After Waivers(C) | Average Net Assets | Rate(D) | |||||||||||||||||
| 4.26 | %(E) | $ | 1,858,133 | 0.50 | %(F) | 0.50 | %(F) | 1.32 | %(F) | 28 | % | |||||||||||
| 4.13 | (E) | 272,106 | 0.75 | (F) | 0.75 | (F) | 1.06 | (F) | – | |||||||||||||
| 14.80 | 1,980,502 | 0.50 | 0.50 | 1.09 | 77 | |||||||||||||||||
| 14.51 | 300,279 | 0.75 | 0.75 | 0.84 | – | |||||||||||||||||
| 41.54 | (G) | 2,055,227 | 0.51 | 0.51 | 1.43 | 84 | ||||||||||||||||
| 41.18 | (G) | 328,275 | 0.76 | 0.76 | 1.19 | – | ||||||||||||||||
| (43.13 | ) | 1,810,864 | 0.49 | 0.49 | 1.38 | 89 | ||||||||||||||||
| (43.27 | ) | 287,794 | 0.74 | 0.74 | 1.13 | – | ||||||||||||||||
| 5.90 | 3,909,045 | 0.49 | 0.49 | 1.01 | 96 | |||||||||||||||||
| 5.64 | 652,838 | 0.74 | 0.74 | 0.76 | – | |||||||||||||||||
| 14.65 | (G) | 4,498,001 | 0.49 | 0.49 | 1.27 | 97 | ||||||||||||||||
| 14.37 | (G) | 758,802 | 0.74 | 0.74 | 1.02 | – | ||||||||||||||||
| Directors and Officers (Unaudited) |
The Board of Directors of the Company appoints officers who are responsible for the day-to-day operations of the Fund and who execute policies formulated by the Directors. Each director serves until his or her death, resignation, or retirement or until the next annual meeting of shareholders is held or until his or her successor is elected and qualifies.
Directors and officers who are employed by or who have a financial interest in The Hartford are considered “interested” persons of the Fund pursuant to the 1940 Act. Each officer and two of the Company’s directors, as noted in the chart below, are “interested” persons of the Fund. Each director serves as a director for The Hartford Mutual Funds, Inc., The Hartford Mutual Funds II, Inc., Hartford Series Fund, Inc., and Hartford HLS Series Fund II, Inc., which, as of June 30, 2011, collectively consist of 89 funds. Correspondence may be sent to directors and officers c/o Hartford Mutual Funds, P.O. Box 2999, Hartford, Connecticut 06104-2999, except that correspondence to Ms. Fagely may be sent to 500 Bielenberg Drive, Woodbury, Minnesota 55125.
The table below sets forth, for each director and officer, his or her name, year of birth, current position with the Company and date first elected or appointed to Hartford Series Fund, Inc. (“HSF”), and Hartford HLS Series Fund II, Inc. (“HSF2”), principal occupation, and, for directors, other directorships held. The Fund’s statement of additional information contains further information on the directors and is available free of charge by calling 1-800-862-6668 or writing to Hartford HLS Funds, c/o Individual Annuity Services, P.O. Box 5085, Hartford, CT 06102-5085.
Information on the aggregate remuneration paid to the directors of the Company can be found in the Statement of Operations herein. The Fund pays to The Hartford a portion of the chief compliance officer’s compensation, but does not pay salaries or compensation to any of their other officers or directors who are employed by The Hartford.
Non-Interested Directors
Lynn S. Birdsong (1946) Director since 2003, Co-Chairman of the Investment Committee
Mr. Birdsong is a private investor. Mr. Birdsong currently serves as a Director of the Sovereign High Yield Investment Company (April 2010 to current). Mr. Birdsong currently serves as an Independent Director of Nomura Partners Funds, Inc. (formerly, The Japan Fund) (March 2003 to current). From 2003 to March 2005, Mr. Birdsong was an independent director of the Atlantic Whitehall Funds. From 1979 to 2002, Mr. Birdsong was a managing director of Zurich Scudder Investments, an investment management firm. During his employment with Scudder, Mr. Birdsong was an Interested Director of The Japan Fund. Since 1981, Mr. Birdsong has been a partner in Birdsong Company, an advertising specialty firm.
Robert M. Gavin, Jr. (1940) Director since 2002 (HSF) and 1986 (HSF2), Chairman of the Board since 2004
Dr. Gavin is an educational consultant. Prior to September 1, 2001, he was President of Cranbrook Education Community and prior to July 1996, he was President of Macalester College, St. Paul, Minnesota.
Duane E. Hill (1945) Director since 2001 (HSF) and 2002 (HSF2), Chairman of the Nominating Committee
Mr. Hill is Partner of TSG Ventures L.P., a private equity investment company. Mr. Hill is a former partner of TSG Capital Group, a private equity investment firm that served as sponsor and lead investor in leveraged buyouts of middle market companies.
Sandra S. Jaffee (1941) Director since 2005
Ms. Jaffee served as Chairman (2008 to 2009) and Chief Executive Officer of Fortent (formerly Searchspace Group), a leading provider of compliance/regulatory technology to financial institutions from August 2005 to August 2009. From August 2004 to August 2005, Ms. Jaffee served as an Entrepreneur in Residence with Warburg Pincus, a private equity firm. From September 1995 to July 2004, Ms. Jaffee served as Executive Vice President at Citigroup, where she was President and Chief Executive Officer of Citibank’s Global Securities Services (1995 to 2003). Ms. Jaffe currently serves as a member of the Board of Directors of Broadridge Financial Solutions as well as a Trustee of Muhlenberg College.
William P. Johnston (1944) Director since 2005, Chairman of the Compliance Committee
In June 2006, Mr. Johnston was appointed as Senior Advisor to The Carlyle Group, a global private equity investment firm. In July 2006, Mr. Johnston was elected to the Board of Directors of MultiPlan, Inc. In August 2007, Mr. Johnston was elected to the Board of Directors of LifeCare Holdings, Inc. In February 2008, Mr. Johnston was elected to the Board of Directors of HCR-ManorCare, Inc. In May 2006, Mr. Johnston was elected to the Supervisory Board of Fresenius Medical Care AG & Co. KGaA, after its acquisition of Renal Care Group, Inc. in March 2006. Mr. Johnston joined Renal Care Group in November 2002 as a member of the Board of Directors and served as Chairman of the Board from March 2003 through March 2006. From September 1987 to December 2002, Mr. Johnston was with Equitable Securities Corporation (and its successors, SunTrust Equitable Securities and SunTrust Robinson Humphrey) serving in various investment banking and managerial positions, including Managing Director and Head of Investment Banking, Chief Executive Officer and Vice Chairman.
Phillip O. Peterson (1944) Director since 2002 (HSF) and 2000 (HSF2), Chairman of the Audit Committee
Mr. Peterson is a mutual fund industry consultant. He was a partner of KPMG LLP (an accounting firm) until July 1999. Mr. Peterson joined William Blair Funds in February 2007 as a member of the Board of Trustees. From January 2004 to April 2005, Mr. Peterson served as Independent President of the Strong Mutual Funds.
Lemma W. Senbet (1946) Director since 2005
Dr. Senbet is the William E. Mayer Chair Professor of Finance and Director, Center for Financial Policy, at the University of Maryland, Robert H. Smith School of Business. He was chair of the Finance Department from 1998 to 2006. Previously he was a chaired professor of finance at the University of Wisconsin-Madison. Also, he was director of the Fortis Funds from March 2000 to July 2002. Dr. Senbet served the finance profession in various capacities, including as director of the American Finance Association and President of the Western Finance Association. In 2006, Dr. Senbet was inducted Fellow of Financial Management Association International for his career-long distinguished scholarship and professional service.
Interested Directors and Officers
David N. Levenson (1966) Director since 2010
Mr. Levenson currently serves as President of The Hartford’s Wealth Management business. He was appointed to this role in July 2010. Previously, Mr. Levenson served as Executive Vice President of Legacy Holdings for The Hartford from June 2009 to July 2010. From 2006 to 2009, Mr. Levenson was with Hartford Life Insurance K.K. where he served as President and CEO from 2007 to 2009. He served as Managing Director of Hartford Investment Management Company from 2005 to 2006. Additionally, Mr. Levenson serves as Executive Vice President of The Hartford and as President, Director and Chief Executive Officer of Hartford Life Insurance Company (“HLIC”) and Hartford Life, Inc. (“HL Inc.”).
Lowndes A. Smith (1939) Director since 1996 (HSF) and 2002 (HSF2), Co-Chairman of the Investment Committee
Mr. Smith served as Vice Chairman of The Hartford from February 1997 to January 2002, as President and Chief Executive Officer of HL Inc. from February 1997 to January 2002, and as President and Chief Operating Officer of The Hartford Life Insurance Companies from January 1989 to January 2002. Mr. Smith serves as a Director of White Mountains Insurance Group, Ltd., One Beacon Insurance and Symetra Financial and as a Managing Director of Whittington Gray Associates.
Other Officers
James E. Davey (1964) President and Chief Executive Officer since 2010
Mr. Davey serves as Executive Vice President of HLIC. Additionally, Mr. Davey serves as President, Chief Executive Officer and Manager of Hartford Investment Financial Services, Inc. (“HIFSCO”) and President, Chief Executive Officer and Manager of HL Advisors. Mr. Davey joined The Hartford in 2002.
Tamara L. Fagely (1958) Vice President, Treasurer and Controller since 2002 (HSF) and 1993 (HSF2)
Ms. Fagely has been a Vice President of HASCO since 1998 and Chief Financial Officer since 2006. Currently Ms. Fagely is a Vice President of HLIC. She served as Assistant Vice President of HLIC from December 2001 through March 2005. In addition, Ms. Fagely is Controller and Chief Financial Officer of HIFSCO.
Susan M. Fleege (1959) AML Compliance Officer since 2011
Ms. Fleege currently serves as a Director of Risk Management at The Hartford. She previously served as AML Compliance Officer for the Fund from 2005-2008. Ms. Fleege joined HLIC in 2005 from Amerprise Financial Corporation where she held the position of Counsel from 2000 to 2005. Ms. Fleege is a certified Anti-Money Laundering Specialist.
Dr. Robert J. Froehlich (1953) Senior Managing Director since 2009
Dr. Froehlich joined The Hartford as Senior Managing Director in September 2009. Prior to joining The Hartford, Dr. Froehlich served as Vice Chairman of Deutsche Asset Management from 1997-2009.
Edward P. Macdonald (1967) Vice President, Secretary and Chief Legal Officer since 2005
Mr. Macdonald serves as Vice President of HLIC and Chief Legal Officer of Mutual Funds and Vice President of HIFSCO. He also serves as Vice President and Secretary of HASCO, and Chief Legal Officer, Secretary and Vice President of HL Advisors. Mr. Macdonald joined The Hartford in 2005.
Hartford Stock HLS Fund |
| Directors and Officers (Unaudited) – (continued) |
Vernon J. Meyer (1964) Vice President since 2006
Mr. Meyer serves as Senior Vice President of HLIC. He also serves as Senior Vice President of HIFSCO and HL Advisors. Mr. Meyer joined The Hartford in 2004.
Colleen B. Pernerewski (1969) Vice President and Chief Compliance Officer since 2010
Ms. Pernerewski serves as Vice President and Chief Investment Advisor Compliance Officer of HIFSCO and as Vice President and Chief Compliance Officer of HL Advisors. Ms. Pernerewski joined The Hartford in 2005 from Travelers Life and Annuity where she served as Counsel (2004-2005). Prior to Travelers Life and Annuity, Ms. Pernerewski held the position of Counsel at The Hartford (1998-2004).
Elizabeth L. Schroeder (1966) Vice President since 2010
Ms. Schroeder currently serves as Assistant Vice President of HLIC. Ms. Schroeder joined HLIC in 1991. She is also an Assistant Vice President of HIFSCO and HL Advisers.
Martin Swanson (1962) Vice President since 2010
Mr. Swanson is a Vice President of HLIC. Mr. Swanson also serves as Vice President/Marketing for HIFSCO. Prior to joining HLIC in 1998, Mr. Swanson was a Vice President at PaineWebber, Inc.
Jane Wolak (1961) Vice President since 2009
Ms. Wolak currently serves as Senior Vice President of HLIC. Ms. Wolak joined HLIC as Vice President, Retail Product Services in May 2007. She is also Vice President of HASCO. Previously, Ms. Wolak was with Sun Life Financial where she held the position of Vice President, Service Center Operations from 2001-2007.
A description of the policies and procedures that the Fund uses to determine how to vote proxies relating to portfolio securities and a record of how the Fund voted any proxies for the twelve-month period ended June 30, 2011 are available (1) without charge, upon request, by calling 800-862-6668 and (2) on the SEC’s website at http://www.sec.gov.
The Fund files a complete schedule of portfolio holdings with the SEC for the first and third quarters of each fiscal year on Form N-Q. The Fund’s Forms are available (1) without charge, upon request, by calling 800-862-6668 and (2) on the SEC’s website at http://www.sec.gov. The Form N-Q may be reviewed and copied at the SEC’s Public Reference Room in Washington, DC. Information on the operation of the Public Reference Room may be obtained by calling 1-800-SEC-0330.
| Expense Example (Unaudited) |
Your Fund's Expenses
As a shareholder of the Fund, you incur two types of costs: (1) transaction costs and (2) ongoing costs including investment management fees, distribution fees, and other fund expenses. This example is intended to help you understand your ongoing costs (in dollars) of investing in a Fund and to compare these costs with the ongoing costs of investing in other mutual funds. The example is based on an investment of $1,000 invested at the beginning of the period and held for the period of December 31, 2010 through June 30, 2011.
Actual Expenses
The first set of columns of the table below provides information about actual account values and actual expenses. You may use the information in this column, together with the amount you invested, to estimate the expenses that you paid over the period. Simply divide your account value by $1,000 (for example, an $8,600 account value divided by $1,000 = 8.6), then multiply the result by the number in the line under the heading entitled “Expenses Paid During Period” to estimate the expenses you paid on your account during this period.
Hypothetical Example for Comparison Purposes
The second set of columns of the table below provides information about hypothetical account values and hypothetical expenses based on a Fund's actual expense ratio and an assumed rate of return of 5% per year before expenses, which is not the Fund's actual return. The hypothetical account values and expenses may not be used to estimate the actual ending account balance or expenses you paid for the period. You may use this information to compare the ongoing costs of investing in a Fund and other funds. To do so, compare this 5% hypothetical example with the 5% hypothetical examples that appear in the shareholder reports of the other funds.
Please note that the expenses shown in the table are meant to highlight your ongoing costs only and do not reflect any transactional costs, such as sales charges (loads) and CDSC. Therefore, the second set of columns of the table is useful in comparing ongoing costs only, and will not help you determine the relative total costs of owning different funds. In addition, if these transactional costs were included, your costs would be higher. Expenses are equal to the Fund's annualized expense ratios multiplied by average account value over the period, multiplied by 181/365 (to reflect the one-half year period).
| Actual return | Hypothetical (5% return before expenses) | |||||||||||||||||||||||||||||||||||
| Expenses paid | Expenses paid | Days in | ||||||||||||||||||||||||||||||||||
| during the period | during the period | the | Days | |||||||||||||||||||||||||||||||||
| Beginning | Ending | December 31, 2010 | Beginning | Ending | December 31, 2010 | Annualized | current | in the | ||||||||||||||||||||||||||||
| Account Value | Account Value | through | Account Value | Account Value | through | expense | 1/2 | full | ||||||||||||||||||||||||||||
| December 31, 2010 | June 30, 2011 | June 30, 2011 | December 31, 2010 | June 30, 2011 | June 30, 2011 | ratio | year | year | ||||||||||||||||||||||||||||
| Class IA | $ | 1,000.00 | $ | 1,042.64 | $ | 2.53 | $ | 1,000.00 | $ | 1,022.32 | $ | 2.51 | 0.50 | % | 181 | 365 | ||||||||||||||||||||
| Class IB | $ | 1,000.00 | $ | 1,041.35 | $ | 3.80 | $ | 1,000.00 | $ | 1,021.08 | $ | 3.76 | 0.75 | % | 181 | 365 | ||||||||||||||||||||
27
| The Hartford | |
| P.O. Box 5085 | |
| Hartford, CT 06102-5085 |
Hartford Series Fund, Inc. is underwritten and distributed by Hartford Securities Distribution Company, Inc.
“The Hartford” is The Hartford Financial Services Group, Inc. and its subsidiaries.
Hartford Series Fund, Inc. inception dates range from 1977 to date. Hartford Series Fund, Inc. is not a subsidiary of The Hartford but is underwritten, distributed by and advised by subsidiaries of The Hartford. Investments in Hartford Series Fund, Inc. are not guaranteed by The Hartford or any other entity.
You should carefully consider investment objectives, risks, and charges and expenses of Hartford HLS Funds before investing. This and other information can be found in the Fund’s prospectus or summary prospectus, which can be obtained by calling 800-862-6668. Please read them carefully before you invest or send money.
| HLSSAR-S11 8-11 | 106632 | Printed in U.S.A ©2011 The Hartford, Hartford, CT 06115 |
A MESSAGE FROM THE PRESIDENT

Dear Fellow Shareholders:
I want to take this opportunity to say thank you for your continued confidence and trust.
We have seen a significant amount of global turbulence in the first half of 2011. Investors have continued to be concerned about the implications of the European sovereign debt crisis, as well as our own high levels of domestic debt. Since January we have witnessed significant political uprisings in the already-volatile Middle East and North Africa region. In addition, the ramifications of Japan's massive earthquake, subsequent tsunami, and nuclear disaster are still being played out in the market.
Although corporate earnings have remained robust, the unemployment picture has been mixed. After adding more than 200,000 jobs from February to April, more recent unemployment reports have shown a pullback in hiring.
While official inflation remains low as measured by the Consumer Price Index (CPI), high oil prices may be indicative of higher inflation in the future. The federal funds rate remains at a historic low, however, the Fed could potentially raise the rate to get it closer to its historical average once the economy strengthens.
Even with these headwinds, domestic, international, and world indices (as measured by the S&P 500, MSCI EAFE and MSCI World) are all up more than 5% through June, 30 2011.
Looking ahead, continued growth in emerging markets is fueling global recovery efforts. Emerging markets comprise about 48 percent of the world’s GDP, and many economists believe they are poised for further expansion. As GDP growth continues in emerging markets, roughly 100 million people are added to the middle class each year. This middle class population growth could potentially drive a considerable shift in consumer purchasing power.
Now that we have reached the midpoint of 2011, perhaps now would be a good time to schedule a meeting with your financial adviser to examine your current investment strategy and determine whether you are on the right track.
| • | Are you concerned about inflation and its effects on your portfolio? |
| • | Is your portfolio prepared for rising interest rates? |
| • | Does your portfolio reflect the global economy with a mix of developed nations and emerging markets? |
Your financial professional’s advice can help you to navigate today’s volatile markets with confidence. You can also rest assured that we will continue to provide you with solid investments and stellar service for the road ahead.
Thank you again for your business.

James Davey
President
Hartford HLS Funds
Hartford Total Return Bond HLS Fund
| Manager Discussion (Unaudited) | 2 |
| Financial Statements | |
| 6 | |
| 21 | |
| 22 | |
| 23 | |
| 24 | |
| 25 | |
| 40 | |
| 42 | |
| 44 | |
| 44 | |
| 45 |
This report is prepared for the general information of contract owners and qualified retirement plan participants. It is not an offer of contracts or of qualified retirement plans. It should not be used in connection with any offer, except in conjunction with the appropriate product prospectus which contains all pertinent information including the applicable sales, administrative and other charges.
The views expressed in the Fund’s Manager Discussion under “Why did the Fund perform this way?” and “What is the outlook?” are views of the Fund’s sub-adviser and portfolio management team through the end of the reporting period and are subject to change based on market and other conditions.
Hartford Total Return Bond HLS Fund inception 08/31/1977 |
| (sub-advised by Hartford Investment Management Company) |
Investment objective – Seeks a competitive total return, with income as a secondary objective. |
Performance Overview 6/30/10 - 6/30/11
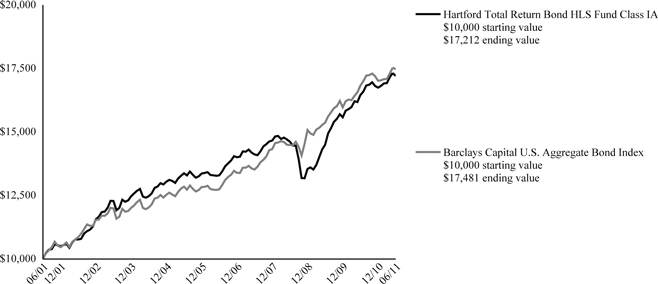
The chart above shows the growth of a $10,000 investment in Class IA. Growth results in classes other than Class IA will vary from what is seen above due to differences in the expenses charged to those share classes.
Average Annual Total Returns (as of 6/30/11)
| 6 Month† | 1 Year | 5 year | 10 year | |||||||||
| Total Return Bond IA | 2.76% | 4.61% | 5.30% | 5.58% | ||||||||
| Total Return Bond IB | 2.63% | 4.35% | 5.04% | 5.32% | ||||||||
| Barclays Capital U.S. Aggregate Bond Index | 2.72% | 3.90% | 6.52% | 5.74% |
| † | Not Annualized |
PAST PERFORMANCE IS NOT INDICATIVE OF FUTURE RESULTS.
Total returns presented above were calculated using the Fund's net asset value available to shareholders for sale or redemption of Fund shares on June 30, 2011, which excludes investment transactions as of this date.
Barclays Capital U.S. Aggregate Bond Index is an unmanaged index and is composed of securities from the Barclays Capital Government/Credit Bond Index, Mortgage-Backed Securities Index, Asset-Backed Securities Index and Commercial Mortgage-Backed Securities Index.
You cannot invest directly in an index.
The chart represents a hypothetical investment in the Fund. Performance data represents past performance and current performance could be higher or lower.
Performance information may reflect historical or current expense waivers/reimbursements from the investment adviser, without which performance would have been lower. For information on current expense waivers/reimbursements, please see the prospectus.
The value of the fund will fluctuate so that when redeemed, it may be worth more or less than the original investment. The chart and table do not reflect the deductions of taxes, sales charges or other fees which may be applied at the variable life insurance, variable annuity or qualified retirement plan product level. Any such additional sales charges or other fees or expenses would lower the contract’s or plan’s performance.
Portfolio Managers | ||
| Nasri Toutoungi | Joseph Portera | Christopher J. Zeppieri, CFA |
| Managing Director | Executive Vice President | Vice President |
How did the Fund perform?
The Class IA shares of the Hartford Total Return Bond HLS Fund returned 2.76% for the six-month period ended June 30, 2011, outperforming its benchmark, the Barclays Capital U.S. Aggregate Bond Index, which returned 2.72%, and the Lipper Intermediate Investment Grade Debt Funds VP-UF category, a group of funds with investment strategies similar to those of the Fund, which returned 2.69%.
Why did the Fund perform this way?
The year began with economic optimism and market confidence, however the first half concluded with a much more uncertain tone. To start the year, rates rose and credit and equities improved reflecting a robust global economy. However, revolutionary uprisings in the Middle-East threatened oil supply and stymied investor enthusiasm. Compounding that uncertainty was the tsunami catastrophe in Japan which threatened global production supply chains. These events sent spreads wider (i.e. short and long term interest rates moving farther apart) and rates lower, but the move proved only temporary. Market confidence returned in late March, as equities retested their ‘highs’ and fixed income spreads retested their ‘tights’, but this sentiment too was short lived. As the probability of a Greek default increased in April, the market turned its focus to the potential for a ‘crisis level’ financial and economic contagion. Meanwhile, the looming deadline for the U.S. debt ceiling legislation and fiscal reform weighed on investor risk appetite. The yield on the U.S. ten year Treasury Note opened the year at 3.29% then peaked mid-February at 3.74% but closed the period at 3.16%. Spreads on the Barclays Capital High-Yield and CMBS Indices opened at 526 and 254 basis points, respectively, and saw their April lows at 443 and 193 basis points, only to finish the quarter at 525 and 249 basis points. The first half of the year produced positive returns in Treasuries and modest positive excess returns in credit.
The Fund outperformed its benchmark primarily due to overweights (i.e. the Fund’s position was greater than the benchmark position) in spread sectors and effective tactical yield curve positioning. The Fund began the year with significant overweight positions to High Yield, Commercial Mortgage Backed Securities (CMBS) and Investment Grade Credit. These positions produced very good results through the market rebound following the negative effects of the tsunami catastrophe in Japan. Despite reducing exposure to High Yield and CMBS starting early in the second quarter, the Fund still carried more spread risk than the index. Both the CMBS and High Yield sectors gave up most of their spread tightening in the last two months of the period. Still, the yield advantage and allocation impact was advantageous to the Fund’s performance results. Conversely, some of the resulting outperformance was mitigated with non-dollar exposure that did not perform as expected. The Fund was positioned throughout the period to benefit from a declining Euro but, despite a worsening sovereign debt crisis, the Euro ended the six month period at higher levels than it had started. The Fund tactically traded interest rate exposure throughout the period contributing to roughly half of the Fund’s benchmark-relative (i.e. performance of the Fund as measure against the benchmark) outperformance.
What is the outlook?
Credit and issues that trade with spread have cheapened over the quarter but there seems to be room to get cheaper. We believe that spreads are attractive relative to other non-recession time periods in the last decade but, that said, the environment today is far more uncertain than prior periods. We believe that austerity measures, particularly those made by the U.S. government, will have a marginally negative impact on growth over the long term; however this may not manifest itself in markets in the coming quarter. Brinksmanship among the negotiators of the debt ceiling legislation has the potential to roil global markets, but the very apparent and severe consequences of a deadline failure should motivate Congress to compromise. A debt restructuring in peripheral Europe poses the greatest near term risk. That said, the European Central Bank (ECB) has demonstrated that it will do everything necessary to avoid a sovereign default or, at the very least, postpone the likelihood of a default long enough for banks to prepare for the ensuing crisis. Given the continued global market uncertainty, we believe that there is a strong likelihood that the U.S. economy and financial markets will muddle along through the remainder of the year. As such, it is difficult to get very optimistic or aggressively bullish and have positioned the portfolio consistent with this view, being particularly cautious in the investment grade and below investment grade spaces.
Distribution by Credit Quality
as of June 30, 2011
| Percentage of | ||||
| Credit Rating * | Net Assets | |||
| Aaa / AAA | 3.6 | % | ||
| Aa / AA | 3.3 | |||
| A | 10.6 | |||
| Baa / BBB | 17.3 | |||
| Ba / BB | 3.1 | |||
| B | 3.0 | |||
| Caa / CCC or Lower | 2.5 | |||
| Unrated | 0.5 | |||
| U.S. Government Securities | 54.1 | |||
| Cash | 3.9 | |||
| Other Assets & Liabilities | (1.9 | ) | ||
| Total | 100.0 | % | ||
| * | Does not apply to the Fund itself. Based upon Moody’s and S&P long-term credit ratings for the Fund’s holdings as of date noted. If Moody's and S&P assign different ratings to a holding, the lower rating is used. "Unrated" includes fixed-income securities (other than cash-like short-term instruments and U.S. Government securities) for which Moody’s and S&P have not issued long-term credit ratings. “Cash” includes non fixed income instruments and other short-term instruments. |
Diversification by Security Type
as of June 30, 2011
| Percentage of | ||||
| Category | Net Assets | |||
| Asset & Commercial Mortgage Backed Securities | 6.8 | % | ||
| Call Options Purchased | 0.0 | |||
| Common Stocks | 0.0 | |||
| Corporate Bonds: Investment Grade | 27.6 | |||
| Corporate Bonds: Non-Investment Grade | 7.3 | |||
| Municipal Bonds | 1.5 | |||
| Preferred Stocks | 0.2 | |||
| Put Options Purchased | 0.1 | |||
| Senior Floating Rate Interests: Non-Investment Grade | 0.7 | |||
| U.S. Government Agencies | 35.7 | |||
| U.S. Government Securities | 17.9 | |||
| Short-Term Investments | 4.1 | |||
| Other Assets and Liabilities | (1.9 | ) | ||
| Total | 100.0 | % | ||
Diversification by Industry
as of June 30, 2011
| Percentage of | ||||
| Industry | Net Assets | |||
| Fixed Income Securities | ||||
| Administration of Human Resource Programs | 0.0 | % | ||
| Advertising and Related Services | 0.4 | |||
| Aerospace Product and Parts Manufacturing | 0.2 | |||
| Agencies, Brokerages, and Other Insurance | 0.0 | |||
| Agricultural Chemical Manufacturing | 0.5 | |||
| Agriculture, Construction, Mining and Machinery | 0.1 | |||
| Alumina and Aluminum Production and Processing | 0.3 | |||
| Animal Slaughtering and Processing | 0.0 | |||
| Automobile Dealers | 0.1 | |||
| Automotive Equipment Rental and Leasing | 0.0 | |||
| Automotive Parts, Accessories, and Tire Stores | 0.0 | |||
| Basic Chemical Manufacturing | 0.5 | |||
| Beverage Manufacturing | 0.3 | |||
| Building Material and Supplies Dealers | 0.1 | |||
| Cable and Other Program Distribution | 0.4 | |||
| Cable and Other Subscription Programming | 1.1 | |||
| Captive Auto Finance | 1.0 | |||
| Captive Retail Finance | 0.1 | |||
| Clothing Stores | 0.2 | |||
| Coal Mining | 0.1 | |||
| Commercial Banking | 0.9 | |||
| Communications Equipment Manufacturing | 0.0 | |||
| Computer and Peripheral Equipment Manufacturing | 0.1 | |||
| Credit Card Issuing | 0.9 | |||
| Data Processing Services | 0.0 | |||
| Data Processing, Hosting, and Related Services | 0.1 | |||
| Deep Sea, Coastal, Great Lakes Water Transportation | 0.0 | |||
| Department Stores | 0.1 | |||
| Depository Credit Banking | 2.9 | |||
| Direct Selling Establishments | 0.2 | |||
| Drugs and Druggists' Sundries Merchant Wholesalers | 0.0 | |||
| Electric Generation, Transmission and Distribution | 1.9 | |||
| Electrical Equipment Manufacturing | 0.2 | |||
| Fruit and Vegetable Preserving and Specialty Food | 0.1 | |||
| Full-Service Restaurants | 0.2 | |||
| Gambling Industries | 0.1 | |||
| General Medical and Surgical Hospitals | 0.2 | |||
| General Obligations | 0.4 | |||
| General Rental Centers | 0.2 | |||
| Grocery and Related Product Wholesalers | 0.0 | |||
| Grocery Stores | 0.3 | |||
| Health and Personal Care Stores | 0.3 | |||
| Higher Education (Univ., Dorms, etc.) | 0.3 | |||
| Industrial Machinery and Equipment Rental and Leasing | 0.1 | |||
| Insurance Carriers | 2.0 | |||
| International Trade Financing (Foreign Banks) | 0.5 | |||
| Internet Service Providers and Web Search Portals | 0.1 | |||
| Iron and Steel Mills and Ferroalloy Manufacturing | 0.5 | |||
| Jewelry, Luggage, and Leather Goods Stores | 0.0 | |||
| Medical and Diagnostic Laboratories | 0.1 | |||
| Medical Equipment and Supplies Manufacturing | 0.1 | |||
| Metal Ore Mining | 0.9 | |||
| Miscellaneous | 0.1 | |||
| Miscellaneous Durable Goods Wholesalers | 0.0 | |||
| Monetary Authorities - Central Bank | 0.5 | |||
| Motion Picture and Video Industries | 0.0 | |||
| Motor Vehicle Manufacturing | 0.2 | |||
| Motor Vehicle Parts Manufacturing | 0.1 | |||
| Natural Gas Distribution | 0.9 | |||
| Newspaper, Periodical, Book and Database Publisher | 0.3 | |||
| Nondepository Credit Banking | 2.2 | |||
| Nonmetallic Mineral Mining and Quarrying | 0.7 | |||
| Oil and Gas Extraction | 1.6 | |||
| Other Amusement and Recreation Industries | 0.0 | |||
| Other Chemical and Preparation Manufacturing | 0.1 | |||
| Other Financial Investment Activities | 1.3 | |||
| Other Food Manufacturing | 0.4 | |||
| Other Heavy and Civil Engineering Construction | 0.2 | |||
| Other Miscellaneous Manufacturing | 0.6 | |||
| Other Motor Vehicle Dealers | 0.1 | |||
| Other Support Services | 0.1 | |||
| Petroleum and Coal Products Manufacturing | 0.8 | |||
| Pharmaceutical and Medicine Manufacturing | 0.0 | |||
| Pipeline Transportation of Crude Oil | 0.1 | |||
| Pipeline Transportation of Natural Gas | 0.4 | |||
| Printing and Related Support Activities | 0.1 | |||
| Pulp, Paper, and Paperboard Mills | 0.1 | |||
| Radio and Television Broadcasting | 0.5 | |||
| Rail Transportation | 0.3 | |||
| Real Estate Credit (Mortgage Banking) | 4.9 | |||
| Real Estate Investment Trust (REIT) | 0.5 | |||
| Residential Building Construction | 0.2 | |||
| Rubber Product Manufacturing | 0.1 | |||
| Satellite Telecommunications | 0.1 | |||
| Scheduled Air Transportation | 0.0 | |||
| Securities and Commodity Contracts and Brokerage | 2.8 | |||
| Fixed Income Securities | ||||
| Semiconductor, Electronic Component Manufacturing | 0.1 | % | ||
| Soap, Cleaning Compound, Toilet Manufacturing | 0.0 | |||
| Software Publishers | 0.0 | |||
| Sovereign Foreign Governments | 0.3 | |||
| Sporting Goods, Hobby and Musical Instrument Store | 0.2 | |||
| Sugar and Confectionery Product Manufacturing | 0.2 | |||
| Support Activities For Mining | 0.3 | |||
| Tax Allocation | 0.1 | |||
| Telecommunications - Other | 0.9 | |||
| Telecommunications - Wired Carriers | 0.7 | |||
| Telecommunications - Wireless Carriers | 0.2 | |||
| Textile Furnishings Mills | 0.0 | |||
| Tobacco Manufacturing | 0.2 | |||
| Transportation | 0.2 | |||
| Traveler Accommodation | 0.2 | |||
| U.S. Government Agencies | 35.7 | |||
| U.S. Government Securities | 17.9 | |||
| Utilities - Electric | 0.2 | |||
| Utilities - Water and Sewer | 0.2 | |||
| Waste Treatment and Disposal | 0.0 | |||
| Wireless Communications Services | 0.5 | |||
| Other Securities | ||||
| Auto Parts & Equipment | 0.0 | |||
| Automobile Manufacturers | 0.1 | |||
| Credit Option Contracts | 0.0 | |||
| Diversified Banks | 0.1 | |||
| Foreign Currency Option Contract | 0.1 | |||
| Integrated Telecommunication Services | 0.0 | |||
| Interest Rate Option Contracts | 0.0 | |||
| Thrifts & Mortgage Finance | 0.0 | |||
| Short-Term Investments | 4.1 | |||
| Other Assets and Liabilities | (1.9 | ) | ||
| Total | 100.0 | % | ||
| Schedule of Investments |
| June 30, 2011 (Unaudited) |
| (000’s Omitted) |
| Shares or Principal Amount | Market Value ╪ | ||||||
| ASSET & COMMERCIAL MORTGAGE BACKED SECURITIES - 6.8 % | |||||||
| Captive Auto Finance - 0.8% | |||||||
| Ally Automotive Receivables Trust | |||||||
| $ | 1,900 | 3.00%, 10/15/2015 ■ | $ | 1,959 | |||
| 4,600 | 3.29%, 03/15/2015 ■ | 4,788 | |||||
| 5,675 | 3.38%, 09/15/2017 ■ | 5,740 | |||||
| 5,650 | 3.61%, 08/15/2016 ■ | 5,907 | |||||
| Bank of America Automotive Trust | |||||||
| 6,700 | 3.03%, 10/15/2016 ■ | 6,881 | |||||
| Ford Credit Automotive Owner Trust | |||||||
| 3,680 | 3.21%, 07/15/2017 | 3,728 | |||||
| 1,730 | 5.53%, 05/15/2016 ■ | 1,862 | |||||
| Hyundai Automotive Receivables Trust | |||||||
| 6,710 | 2.27%, 02/15/2017 | 6,738 | |||||
| 37,603 | |||||||
| Captive Retail Finance - 0.1% | |||||||
| CNH Equipment Trust | |||||||
| 6,322 | 2.90%, 11/17/2014 ○ | 6,280 | |||||
| Credit Card Issuing - 0.9% | |||||||
| Chase Issuance Trust | |||||||
| 6,920 | 5.12%, 10/15/2014 | 7,326 | |||||
| Citibank Credit Card Issuance Trust | |||||||
| 8,955 | 6.30%, 06/20/2014 | 9,392 | |||||
| GE Capital Credit Card Master Note Trust | |||||||
| 17,050 | 2.21%, 06/15/2016 | 17,453 | |||||
| 3,565 | 3.69%, 07/15/2015 | 3,666 | |||||
| 37,837 | |||||||
| Real Estate Credit (Mortgage Banking) - 4.9% | |||||||
| Banc of America Commercial Mortgage, Inc. | |||||||
| 5,185 | 5.48%, 01/15/2049 | 5,050 | |||||
| 2,595 | 5.62%, 06/10/2049 Δ | 2,792 | |||||
| Banc of America Large Loan | |||||||
| 2,243 | 1.94%, 11/15/2015 ■Δ | 2,081 | |||||
| 7,726 | 5.33%, 12/16/2043 ■ | 7,866 | |||||
| 6,370 | 5.65%, 06/15/2049 ■Δ | 6,369 | |||||
| Bear Stearns Commercial Mortgage | |||||||
| Securities, Inc. | |||||||
| 35,341 | 0.61%, 11/11/2041 ⌂► | 344 | |||||
| 41,639 | 0.80%, 07/11/2042 ⌂► | 446 | |||||
| CFCRE Commercial Mortgage Trust | |||||||
| 31,610 | 1.51%, 04/15/2044 ■► | 2,253 | |||||
| Citigroup Commercial Mortgage Trust | |||||||
| 5,360 | 5.89%, 12/10/2049 Δ | 5,852 | |||||
| Citigroup/Deutsche Bank Commercial | |||||||
| Mortgage Trust | |||||||
| 4,456 | 5.32%, 12/11/2049 | 4,728 | |||||
| Commercial Mortgage Pass-Through | |||||||
| Certificates | |||||||
| 31,818 | 0.70%, 10/01/2020 ■► | 1,327 | |||||
| 29,171 | 2.47%, 07/10/2046 ■► | 3,189 | |||||
| Countrywide Home Loans, Inc. | |||||||
| 25,765 | 6.00%, 10/25/2037 ⌂ | 24,079 | |||||
| Credit Suisse Mortgage Capital Certificates | |||||||
| 4,389 | 5.31%, 12/15/2039 | 4,701 | |||||
| Credit-Based Asset Servicing and | |||||||
| Securitization | |||||||
| 2,334 | 0.46%, 05/25/2036 ■Δ | 2,032 | |||||
| Cwcapital Cobalt | |||||||
| 5,230 | 5.48%, 04/15/2047 | 5,552 | |||||
| 6,500 | 5.53%, 04/15/2047 | 6,022 | |||||
| DBUBS Mortgage Trust | |||||||
| 32,933 | 0.25%, 02/01/2021 ■► | 603 | |||||
| 27,414 | 1.40%, 01/01/2021 ■► | 1,736 | |||||
| Ford Credit Floorplan Master Owner Trust | |||||||
| 6,225 | 1.50%, 09/15/2015 | 6,250 | |||||
| GE Business Loan Trust | |||||||
| 7,555 | 1.19%, 05/15/2034 ■Δ | 2,532 | |||||
| GMAC Mortgage Servicer Advance Funding | |||||||
| 12,085 | 3.72%, 03/15/2023 ■ | 12,176 | |||||
| Goldman Sachs Mortgage Securities Corp. II | |||||||
| 45,766 | 1.58%, 08/10/2020 ■► | 4,295 | |||||
| 4,347 | 5.56%, 11/10/2039 | 4,710 | |||||
| JP Morgan Automotive Receivable Trust | |||||||
| 1,675 | 12.85%, 03/15/2012 ⌂† | 356 | |||||
| JP Morgan Chase Commercial Mortgage | |||||||
| Securities Corp. | |||||||
| 426,016 | 0.09%, 08/12/2037 ► | 394 | |||||
| 336,233 | 0.50%, 05/12/2045 ► | 3,590 | |||||
| 15,315 | 0.67%, 10/15/2020 ■► | 691 | |||||
| 50,292 | 1.36%, 02/15/2021 ■► | 3,677 | |||||
| 48,370 | 1.64%, 05/15/2021 ■ | 4,053 | |||||
| 16,858 | 1.97%, 09/15/2020 ■► | 1,812 | |||||
| 3,615 | 5.32%, 12/15/2044 Δ | 3,468 | |||||
| 5,898 | 5.34%, 05/15/2047 | 6,159 | |||||
| 4,380 | 5.42%, 01/15/2049 | 4,696 | |||||
| 3,090 | 5.44%, 06/12/2047 Δ | 3,302 | |||||
| 4,986 | 5.46%, 01/15/2049 Δ | 4,493 | |||||
| 4,315 | 5.88%, 02/15/2051 Δ | 4,692 | |||||
| 5,855 | 5.93%, 02/12/2051 Δ | 5,790 | |||||
| LB-UBS Commercial Mortgage Trust | |||||||
| 4,350 | 5.43%, 02/15/2040 | 4,636 | |||||
| Lehman Brothers Small Balance Commercial | |||||||
| 2,944 | 5.52%, 09/25/2030 ■ | 2,745 | |||||
| 1,537 | 5.62%, 09/25/2036 ■ | 1,380 | |||||
| Merrill Lynch Mortgage Trust | |||||||
| 32,617 | 0.74%, 10/12/2041 ⌂► | 244 | |||||
| Merrill Lynch/Countrywide Commercial | |||||||
| Mortgage Trust | |||||||
| 4,377 | 5.38%, 08/12/2048 | 4,621 | |||||
| Morgan Stanley Capital I | |||||||
| 103,920 | 1.00%, 09/15/2047 ■► | 4,506 | |||||
| 2,253 | 5.77%, 04/12/2049 Δ | 2,287 | |||||
| Morgan Stanley Dean Witter Capital I | |||||||
| 15,286 | 0.01%, 08/25/2032 ⌂►† | – | |||||
| Morgan Stanley Re-Remic Trust | |||||||
| 6,970 | 6.46%, 07/17/2056 ■○ | 5,646 | |||||
| National Credit Union Administration | |||||||
| 6,727 | 1.84%, 10/07/2020 Δ | 6,802 | |||||
| Nationstar Home Equity Loan Trust | |||||||
| 211 | 0.00%, 03/25/2037 ⌂● | 2 | |||||
| RBSCF Trust | |||||||
| 7,205 | 5.51%, 04/16/2047 ■Δ | 7,505 | |||||
| Renaissance Home Equity Loan Trust | |||||||
| 3,566 | 5.36%, 05/25/2035 | 2,097 | |||||
| 2,677 | 5.58%, 11/25/2036 Δ | 1,840 | |||||
The accompanying notes are an integral part of these financial statements.
| Shares or Principal Amount | Market Value ╪ | ||||||
ASSET & COMMERCIAL MORTGAGE BACKED SECURITIES - 6.8% - (continued) | |||||||
Real Estate Credit (Mortgage Banking) - 4.9% - (continued) | |||||||
Residential Funding Mortgage Securities, Inc. | |||||||
| $ | 2,232 | 6.00%, 07/25/2037 ⌂ | $ | 1,859 | |||
| Sovereign Commercial Mortgage Securities | |||||||
| 4,448 | 5.94%, 07/22/2030 ■Δ | 4,622 | |||||
| Wamu Commercial Mortgage Securities | |||||||
| Trust | |||||||
| 7,170 | 6.31%, 03/23/2045 ■ΔΨ | 4,598 | |||||
| Wells Fargo Alternative Loan Trust | |||||||
| 9,509 | 6.25%, 11/25/2037 ⌂ | 8,066 | |||||
| 227,614 | |||||||
| Real Estate Investment Trust (REIT) - 0.1% | |||||||
| Crest Clarendon Street | |||||||
| 4,378 | 0.73%, 12/28/2017 ■Δ | 4,251 | |||||
Total asset & commercial mortgage backed securities | |||||||
| (cost $317,346) | $ | 313,585 | |||||
| CORPORATE BONDS: INVESTMENT GRADE - 27.6% | |||||||
| Aerospace Product and Parts Manufacturing - 0.2% | |||||||
| Meccanica Holdings USA, Inc. | |||||||
| $ | 10,489 | 6.25%, 07/15/2019 - 01/15/2040 ■ | $ | 9,875 | |||
| 9,875 | |||||||
| Agricultural Chemical Manufacturing - 0.5% | |||||||
| Incitec Pivot Finance LLC | |||||||
| 13,535 | 6.00%, 12/10/2019 ■ | 14,496 | |||||
| Yara International ASA | |||||||
| 6,770 | 7.88%, 06/11/2019 ■ | 8,275 | |||||
| 22,771 | |||||||
| Alumina and Aluminum Production and Processing - 0.3% | |||||||
| Alcoa, Inc. | |||||||
| 3,805 | 5.40%, 04/15/2021 | 3,817 | |||||
| 8,260 | 6.15%, 08/15/2020 | 8,750 | |||||
| 12,567 | |||||||
| Basic Chemical Manufacturing - 0.4% | |||||||
| Dow Chemical Co. | |||||||
| 13,580 | 8.55%, 05/15/2019 | 17,511 | |||||
| Beverage Manufacturing - 0.3% | |||||||
| Anheuser-Busch InBev N.V. | |||||||
| 8,890 | 7.75%, 01/15/2019 | 11,184 | |||||
| Cable and Other Program Distribution - 0.2% | |||||||
| Rogers Cable, Inc. | |||||||
| 2,920 | 8.75%, 05/01/2032 | 3,796 | |||||
| TCI Communications, Inc. | |||||||
| 4,025 | 8.75%, 08/01/2015 | 4,940 | |||||
| 8,736 | |||||||
| Cable and Other Subscription Programming - 1.0% | |||||||
| Comcast Corp. | |||||||
| 100 | 10.63%, 07/15/2012 | 110 | |||||
| DirecTV Holdings LLC | |||||||
| 11,175 | 3.50%, 03/01/2016 | 11,535 | |||||
| 4,200 | 5.00%, 03/01/2021 | 4,350 | |||||
| 8,570 | 7.63%, 05/15/2016 | 9,341 | |||||
| Time Warner Entertainment Co., L.P. | |||||||
| 8,175 | 8.38%, 07/15/2033 | 10,449 | |||||
| Time Warner, Inc. | |||||||
| 7,665 | 6.25%, 03/29/2041 | 7,962 | |||||
| 43,747 | |||||||
| Commercial Banking - 0.9% | |||||||
| American Express Centurion Bank | |||||||
| 3,337 | 5.95%, 06/12/2017 | 3,793 | |||||
| Huntington Bancshares, Inc. | |||||||
| 943 | 7.00%, 12/15/2020 | 1,063 | |||||
| Icici Bank Ltd. | |||||||
| 6,575 | 4.75%, 11/25/2016 ■ | 6,560 | |||||
| Rabobank Netherlands | |||||||
| 9,023 | 11.00%, 06/30/2019 ■♠ | 11,513 | |||||
| Santander Holdings USA | |||||||
| 3,006 | 4.63%, 04/19/2016 | 3,021 | |||||
| State Street Bank & Trust Co. | |||||||
| 3,935 | 5.25%, 10/15/2018 | 4,259 | |||||
| Union Bank NA | |||||||
| 11,235 | 3.00%, 06/06/2016 | 11,196 | |||||
| VTB Capital S.A. | |||||||
| 2,200 | 6.55%, 10/13/2020 ■ | 2,233 | |||||
| 43,638 | |||||||
| Computer and Peripheral Equipment Manufacturing - | |||||||
| 0.1% | |||||||
| Hewlett-Packard Co. | |||||||
| 5,070 | 4.30%, 06/01/2021 | 5,120 | |||||
| Seagate Technology International | |||||||
| 1,259 | 10.00%, 05/01/2014 ■ | 1,460 | |||||
| 6,580 | |||||||
| Depository Credit Banking - 2.8% | |||||||
| Bank of America Corp. | |||||||
| 13,800 | 5.65%, 05/01/2018 | 14,550 | |||||
| 8,665 | 5.75%, 12/01/2017 | 9,213 | |||||
| BB&T Corp. | |||||||
| 8,825 | 3.20%, 03/15/2016 | 9,028 | |||||
| Citigroup, Inc. | |||||||
| 10,185 | 2.13%, 04/30/2012 | 10,346 | |||||
| 33,951 | 4.59%, 12/15/2015 | 35,703 | |||||
| 8,887 | 6.38%, 08/12/2014 | 9,826 | |||||
| 4,839 | 8.50%, 05/22/2019 | 5,999 | |||||
| HSBC Holdings plc | |||||||
| 5,973 | 5.10%, 04/05/2021 | 6,121 | |||||
| Wells Fargo & Co. | |||||||
| 7,044 | 3.68%, 06/15/2016 | 7,237 | |||||
| Wells Fargo Bank NA | |||||||
| 8,015 | 0.47%, 05/16/2016 Δ | 7,467 | |||||
| 12,775 | 4.75%, 02/09/2015 | 13,664 | |||||
| 129,154 | |||||||
| Direct Selling Establishments - 0.2% | |||||||
| Energy Transfer Partners | |||||||
| 10,555 | 4.65%, 06/01/2021 | 10,326 | |||||
| Electric Generation, Transmission and Distribution - 1.4% | |||||||
| Comision Federal de Electricdad | |||||||
| 3,800 | 4.88%, 05/26/2021 ■ | 3,795 | |||||
| Commonwealth Edison Co. | |||||||
| 5,836 | 5.80%, 03/15/2018 | 6,542 | |||||
The accompanying notes are an integral part of these financial statements.
| Hartford Total Return Bond HLS Fund |
| Schedule of Investments – (continued) |
| June 30, 2011 (Unaudited) |
| (000’s Omitted) |
| Shares or Principal Amount | Market Value ╪ | ||||||
| CORPORATE BONDS: INVESTMENT GRADE - 27.6% - (continued) | |||||||
Electric Generation, Transmission and Distribution - 1.4% - (continued) | |||||||
| E.CL S.A. | |||||||
| $ | 2,100 | 5.63%, 01/15/2021 ■ | $ | 2,157 | |||
| Empresas Public Medellin | |||||||
| 3,910 | 7.63%, 07/29/2019 § | 4,545 | |||||
| LG & E & KU Energy LLC | |||||||
| 7,190 | 2.13%, 11/15/2015 ■ | 7,016 | |||||
| Northeast Utilities | |||||||
| 4,375 | 5.65%, 06/01/2013 | 4,706 | |||||
| Pacific Gas & Electric Co. | |||||||
| 5,711 | 5.63%, 11/30/2017 | 6,483 | |||||
| Pacific Gas & Electric Energy Recovery | |||||||
| Funding LLC | |||||||
| 6,208 | 8.25%, 10/15/2018 | 7,968 | |||||
| Progress Energy, Inc. | |||||||
| 8,405 | 4.40%, 01/15/2021 | 8,498 | |||||
| PSEG Power | |||||||
| 4,534 | 5.00%, 04/01/2014 | 4,864 | |||||
| Virginia Electric & Power Co. | |||||||
| 6,327 | 5.10%, 11/30/2012 | 6,701 | |||||
| 63,275 | |||||||
| Electrical Equipment Manufacturing - 0.2% | |||||||
| General Electric Co. | |||||||
| 10,740 | 5.00%, 02/01/2013 | 11,399 | |||||
| General Rental Centers - 0.2% | |||||||
| ERAC USA Finance Co. | |||||||
| 6,130 | 6.38%, 10/15/2017 ■ | 7,050 | |||||
| Grocery Stores - 0.3% | |||||||
| Ahold Lease USA, Inc. | |||||||
| 9,513 | 8.62%, 01/02/2025 | 11,107 | |||||
| Health and Personal Care Stores - 0.3% | |||||||
| CVS Caremark Corp. | |||||||
| 2,742 | 6.30%, 06/01/2037 Δ | 2,670 | |||||
| CVS Corp. | |||||||
| 9,275 | 8.35%, 07/10/2031 ■ | 11,349 | |||||
| 14,019 | |||||||
| Insurance Carriers - 2.0% | |||||||
| Aetna, Inc. | |||||||
| 5,755 | 4.13%, 06/01/2021 | 5,698 | |||||
| American International Group, Inc. | |||||||
| 2,593 | 3.65%, 01/15/2014 | 2,643 | |||||
| Americo Life, Inc. | |||||||
| 75 | 7.88%, 05/01/2013 ⌂ | 79 | |||||
| CNA Financial Corp. | |||||||
| 4,492 | 5.75%, 08/15/2021 | 4,638 | |||||
| Guardian Life Insurance Co. | |||||||
| 6,291 | 7.38%, 09/30/2039 ■ | 7,442 | |||||
| Massachusetts Mutual Life Insurance Co. | |||||||
| 4,148 | 8.88%, 06/01/2039 ■ | 5,747 | |||||
| MetLife Global Funding I | |||||||
| 6,515 | 0.50%, 03/15/2012 ■Δ | 6,518 | |||||
| 3,400 | 5.13%, 06/10/2014 ■ | 3,715 | |||||
| Nationwide Financial Services, Inc. | |||||||
| 4,280 | 5.38%, 03/25/2021 ■ | 4,299 | |||||
| Nationwide Mutual Insurance Co. | |||||||
| 6,425 | 9.38%, 08/15/2039 ■ | 7,971 | |||||
| New York Life Global Funding | |||||||
| 12,295 | 3.00%, 05/04/2015 ■ | 12,716 | |||||
| Ohio National Financial Services, Inc. | |||||||
| 6,672 | 6.38%, 04/30/2020 ■ | 7,168 | |||||
| Prudential Financial, Inc. | |||||||
| 8,810 | 3.00%, 05/12/2016 | 8,732 | |||||
| Prudential Holdings LLC | |||||||
| 200 | 7.25%, 12/18/2023 ■ | 233 | |||||
| Teachers Insurance & Annuity Association | |||||||
| 6,248 | 6.85%, 12/16/2039 ■ | 7,110 | |||||
| 84,709 | |||||||
| International Trade Financing (Foreign Banks) - 0.5% | |||||||
| Corpoacion Andina De Fomento | |||||||
| 9,175 | 3.75%, 01/15/2016 | 9,302 | |||||
| 530 | 8.13%, 06/04/2019 | 646 | |||||
| Royal Bank of Scotland plc | |||||||
| 6,825 | 3.95%, 09/21/2015 | 6,857 | |||||
| Standard Chartered plc | |||||||
| 8,017 | 3.20%, 05/12/2016 ■ | 7,940 | |||||
| 24,745 | |||||||
| Iron and Steel Mills and Ferroalloy Manufacturing - 0.5% | |||||||
| ArcelorMittal | |||||||
| 14,495 | 5.50%, 03/01/2021 | 14,518 | |||||
| 6,025 | 9.00%, 02/15/2015 | 7,191 | |||||
| 3,430 | 9.85%, 06/01/2019 | 4,348 | |||||
| 26,057 | |||||||
| Metal Ore Mining - 0.9% | |||||||
| Barrick Gold Corp. | |||||||
| 4,215 | 2.90%, 05/30/2016 ■ | 4,212 | |||||
| Cliff's Natural Resources, Inc. | |||||||
| 4,065 | 4.80%, 10/01/2020 | 4,087 | |||||
| 2,675 | 4.88%, 04/01/2021 | 2,682 | |||||
| 6,135 | 5.90%, 03/15/2020 | 6,642 | |||||
| Rio Tinto Finance USA Ltd. | |||||||
| 4,965 | 9.00%, 05/01/2019 | 6,579 | |||||
| Southern Copper Corp. | |||||||
| 4,200 | 6.75%, 04/16/2040 | 4,086 | |||||
| Teck Resources Ltd. | |||||||
| 7,515 | 10.75%, 05/15/2019 | 9,497 | |||||
| 37,785 | |||||||
| Monetary Authorities - Central Bank - 0.5% | |||||||
| Bank of New York Institutional Capital Trust | |||||||
| 200 | 7.78%, 12/01/2026 ■ | 204 | |||||
| Lloyds Banking Group plc | |||||||
| 15,635 | 4.38%, 01/12/2015 ■ | 15,868 | |||||
| Santander U.S. Debt S.A. | |||||||
| 10,500 | 3.72%, 01/20/2015 ■ | 10,164 | |||||
| 26,236 | |||||||
| Natural Gas Distribution - 0.8% | |||||||
| AGL Capital Corp. | |||||||
| 3,155 | 5.88%, 03/15/2041 | 3,280 | |||||
| Consumers Energy Co. | |||||||
| 4,000 | 5.15%, 02/15/2017 | 4,437 | |||||
| 4,620 | 6.70%, 09/15/2019 | 5,542 | |||||
| Sempra Energy | |||||||
| 5,218 | 6.50%, 06/01/2016 | 6,043 | |||||
| 9,495 | 9.80%, 02/15/2019 | 12,737 | |||||
The accompanying notes are an integral part of these financial statements.
| Shares or Principal Amount | Market Value ╪ | ||||||
| CORPORATE BONDS: INVESTMENT GRADE - 27.6% - (continued) | |||||||
| Natural Gas Distribution - 0.8% - (continued) | |||||||
| Williams Partners L.P. | |||||||
| $ | 4,160 | 4.13%, 11/15/2020 | $ | 3,993 | |||
| 36,032 | |||||||
| Newspaper, Periodical, Book and Database Publisher - | |||||||
| 0.2 % | |||||||
| News America, Inc. | |||||||
| 10,150 | 6.15%, 02/15/2041 ■ | 10,055 | |||||
| Nondepository Credit Banking - 1.0% | |||||||
| American Express Co. | |||||||
| 8,385 | 5.50%, 04/16/2013 | 8,970 | |||||
| 8,587 | 5.55%, 10/17/2012 | 9,060 | |||||
| General Electric Capital Corp. | |||||||
| 6,690 | 2.10%, 01/07/2014 | 6,785 | |||||
| 10,479 | 4.38%, 09/16/2020 | 10,359 | |||||
| 8,785 | 5.63%, 05/01/2018 | 9,608 | |||||
| 44,782 | |||||||
| Nonmetallic Mineral Mining and Quarrying - 0.6% | |||||||
| Anglo American Capital plc | |||||||
| 16,188 | 9.38%, 04/08/2014 - 04/08/2019 ■ | 19,605 | |||||
| Vale Overseas Ltd. | |||||||
| 8,985 | 6.25%, 01/23/2017 | 10,164 | |||||
| 29,769 | |||||||
| Oil and Gas Extraction - 1.3% | |||||||
| ENN Energy Holdings Ltd. | |||||||
| 2,200 | 6.00%, 05/13/2021 ■ | 2,162 | |||||
| Ensco plc | |||||||
| 8,180 | 3.25%, 03/15/2016 | 8,305 | |||||
| 5,590 | 4.70%, 03/15/2021 | 5,647 | |||||
| Gazprom International S.A. | |||||||
| 1,736 | 7.20%, 02/01/2020 § | 1,905 | |||||
| KazMunayGas National Co. | |||||||
| 1,825 | 11.75%, 01/23/2015 § | 2,268 | |||||
| Nabors Industries, Inc. | |||||||
| 3,850 | 5.00%, 09/15/2020 | 3,895 | |||||
| 7,183 | 9.25%, 01/15/2019 | 9,105 | |||||
| Noble Energy, Inc. | |||||||
| 5,670 | 6.00%, 03/01/2041 | 5,846 | |||||
| Pemex Project Funding Master Trust | |||||||
| 6,205 | 6.63%, 06/15/2035 | 6,540 | |||||
| Petrobras International Finance Co. | |||||||
| 4,120 | 3.88%, 01/27/2016 | 4,196 | |||||
| 11,675 | 5.75%, 01/20/2020 | 12,454 | |||||
| 62,323 | |||||||
| Other Financial Investment Activities - 1.2% | |||||||
| Army Hawaii Family Housing Trust | |||||||
| Certificates | |||||||
| 5,370 | 5.52%, 06/15/2050 ■ | 4,769 | |||||
| Asciano Finance Ltd. | |||||||
| 2,936 | 3.13%, 09/23/2015 ■ | 2,897 | |||||
| 3,698 | 5.00%, 04/07/2018 ■ | 3,796 | |||||
| BAE Systems Holdings, Inc. | |||||||
| 10,204 | 5.20%, 08/15/2015 ■ | 11,079 | |||||
| CDP Financial, Inc. | |||||||
| 10,860 | 3.00%, 11/25/2014 ■ | 11,297 | |||||
| Myriad International Holdings B.V. | |||||||
| 3,900 | 6.38%, 07/28/2017 ■ | 4,212 | |||||
| State Street Corp. | |||||||
| 7,610 | 4.96%, 03/15/2018 | 8,070 | |||||
| Temasek Financial I Ltd. | |||||||
| 8,850 | 4.30%, 10/25/2019 ■ | 9,106 | |||||
| ZFS Finance USA Trust I | |||||||
| 3,193 | 6.50%, 05/09/2037 ■Δ | 3,177 | |||||
| 58,403 | |||||||
| Other Food Manufacturing - 0.4% | |||||||
| Kraft Foods, Inc. | |||||||
| 4,520 | 4.13%, 02/09/2016 | 4,833 | |||||
| 7,095 | 5.38%, 02/10/2020 | 7,756 | |||||
| 4,699 | 6.13%, 02/01/2018 | 5,406 | |||||
| 17,995 | |||||||
| Other Miscellaneous Manufacturing - 0.5% | |||||||
| Tyco Electronics Group S.A. | |||||||
| 5,292 | 4.88%, 01/15/2021 | 5,486 | |||||
| 6,787 | 6.55%, 10/01/2017 | 7,997 | |||||
| Tyco International Ltd. | |||||||
| 7,791 | 8.50%, 01/15/2019 | 9,877 | |||||
| 23,360 | |||||||
| Other Motor Vehicle Dealers - 0.1% | |||||||
| Harley-Davidson Financial Services, Inc. | |||||||
| 4,800 | 3.88%, 03/15/2016 ■ | 4,882 | |||||
| Other Support Services - 0.1% | |||||||
| Brambles USA, Inc. | |||||||
| 5,478 | 3.95%, 04/01/2015 ■ | 5,651 | |||||
| Petroleum and Coal Products Manufacturing - 0.7% | |||||||
| Marathon Petroleum Corp. | |||||||
| 6,255 | 5.13%, 03/01/2021 ■ | 6,430 | |||||
| 9,410 | 6.50%, 03/01/2041 ■ | 9,726 | |||||
| Valero Energy Corp. | |||||||
| 9,686 | 9.38%, 03/15/2019 | 12,372 | |||||
| 28,528 | |||||||
| Pipeline Transportation of Crude Oil - 0.1% | |||||||
| Plains All American Pipeline L.P. | |||||||
| 2,485 | 5.00%, 02/01/2021 | 2,527 | |||||
| Pipeline Transportation of Natural Gas - 0.3% | |||||||
| DCP Midstream LLC | |||||||
| 3,318 | 5.35%, 03/15/2020 ■ | 3,517 | |||||
| Enterprise Products Operating L.P. | |||||||
| 3,750 | 5.95%, 02/01/2041 | 3,724 | |||||
| TransCanada Pipelines Ltd. | |||||||
| 5,616 | 7.25%, 08/15/2038 | 6,749 | |||||
| 13,990 | |||||||
| Radio and Television Broadcasting - 0.3% | |||||||
| NBC Universal, Inc. | |||||||
| 3,745 | 3.65%, 04/30/2015 ■ | 3,932 | |||||
| 6,700 | 4.38%, 04/01/2021 ■ | 6,630 | |||||
| 4,665 | 5.15%, 04/30/2020 ■ | 4,926 | |||||
| 15,488 | |||||||
| Rail Transportation - 0.3% | |||||||
| Norfolk Southern Corp. | |||||||
| 10,230 | 5.75%, 04/01/2018 | 11,581 | |||||
| Real Estate Investment Trust (REIT) - 0.4% | |||||||
| HCP, Inc. | |||||||
| 12,834 | 3.75%, 02/01/2016 | 13,051 | |||||
The accompanying notes are an integral part of these financial statements.
| Hartford Total Return Bond HLS Fund |
| Schedule of Investments – (continued) |
| June 30, 2011 (Unaudited) |
| (000’s Omitted) |
| Shares or Principal Amount | Market Value ╪ | ||||||
| CORPORATE BONDS: INVESTMENT GRADE - 27.6% - (continued) | |||||||
| Real Estate Investment Trust (REIT) - 0.4% - (continued) | |||||||
| Health Care REIT, Inc. | |||||||
| $ | 4,802 | 3.63%, 03/15/2016 | $ | 4,832 | |||
| 17,883 | |||||||
| Residential Building Construction - 0.1% | |||||||
| CRH America, Inc. | |||||||
| 3,590 | 5.30%, 10/15/2013 | 3,842 | |||||
Securities and Commodity Contracts and Brokerage - 2.8 % | |||||||
| Goldman Sachs Group, Inc. | |||||||
| 20,371 | 3.63%, 02/07/2016 | 20,592 | |||||
| 2,437 | 6.00%, 06/15/2020 | 2,622 | |||||
| Jefferies Group, Inc. | |||||||
| 3,858 | 8.50%, 07/15/2019 | 4,563 | |||||
| JP Morgan Chase & Co. | |||||||
| 9,185 | 4.63%, 05/10/2021 | 9,111 | |||||
| 6,375 | 6.00%, 01/15/2018 | 7,090 | |||||
| JP Morgan Chase Capital II | |||||||
| 3,880 | 0.77%, 02/01/2027 Δ | 3,191 | |||||
| JP Morgan Chase Capital XXV | |||||||
| 4,288 | 6.80%, 10/01/2037 | 4,241 | |||||
| Macquarie Bank Ltd. | |||||||
| 5,920 | 6.63%, 04/07/2021 ■ | 5,956 | |||||
| Merrill Lynch & Co., Inc. | |||||||
| 16,355 | 6.05%, 05/16/2016 | 17,146 | |||||
| Morgan Stanley | |||||||
| 9,445 | 3.80%, 04/29/2016 | 9,335 | |||||
| 4,302 | 5.75%, 10/18/2016 | 4,569 | |||||
| 25,957 | 6.25%, 08/28/2017 | 28,071 | |||||
| UBS AG Stamford CT | |||||||
| 9,730 | 2.25%, 01/28/2014 | 9,832 | |||||
| 126,319 | |||||||
| Sovereign Foreign Governments - 0.1% | |||||||
| Banco Nacional De Desenvolvimento | |||||||
| 4,800 | 5.50%, 07/12/2020 ■ | 5,082 | |||||
| Sugar and Confectionery Product Manufacturing - 0.2% | |||||||
| Wrigley Jr., William Co. | |||||||
| 10,070 | 3.70%, 06/30/2014 ■ | 10,463 | |||||
| Support Activities For Mining - 0.3% | |||||||
| Rowan Cos., Inc. | |||||||
| 5,548 | 7.88%, 08/01/2019 | 6,593 | |||||
| Transocean, Inc. | |||||||
| 11,630 | 1.50%, 12/15/2037 ۞ | 11,397 | |||||
| 17,990 | |||||||
| Telecommunications - Other - 0.6% | |||||||
| Telecom Italia Capital | |||||||
| 5,000 | 7.18%, 06/18/2019 | 5,520 | |||||
| 214 | 7.72%, 06/04/2038 | 213 | |||||
| Telefonica Emisiones SAU | |||||||
| 11,220 | 3.99%, 02/16/2016 | 11,349 | |||||
| 5,295 | 4.95%, 01/15/2015 | 5,635 | |||||
| 3,755 | 5.13%, 04/27/2020 | 3,722 | |||||
| 26,439 | |||||||
| Telecommunications - Wired Carriers - 0.6% | |||||||
| AT&T, Inc. | |||||||
| 15,520 | 5.35%, 09/01/2040 | 14,711 | |||||
Deutsche Telekom International Finance B.V. | |||||||
| 13,315 | 3.13%, 04/11/2016 ■ | 13,496 | |||||
| 28,207 | |||||||
| Telecommunications - Wireless Carriers - 0.2% | |||||||
| Qwest Corp. | |||||||
| 4,835 | 7.20%, 11/10/2026 | 4,738 | |||||
| 3,656 | 7.25%, 10/15/2035 | 3,620 | |||||
| 8,358 | |||||||
| Tobacco Manufacturing - 0.2% | |||||||
| Altria Group, Inc. | |||||||
| 7,418 | 10.20%, 02/06/2039 | 10,639 | |||||
| Wireless Communications Services – 0.5% | |||||||
| Cellco Partnership - Verizon Wireless | |||||||
| Capital LLC | |||||||
| 7,280 | 8.50%, 11/15/2018 | 9,454 | |||||
| GTE Corp. | |||||||
| 165 | 8.75%, 11/01/2021 | 220 | |||||
| Verizon Maryland, Inc. | |||||||
| 1,500 | 8.30%, 08/01/2031 | 1,806 | |||||
| Verizon Virginia, Inc. | |||||||
| 13,805 | 4.63%, 03/15/2013 | 14,560 | |||||
| 26,040 | |||||||
| Total corporate bonds: investment grade | |||||||
| (cost $1,196,184) | $ | 1,269,099 | |||||
| CORPORATE BONDS: NON-INVESTMENT GRADE - 7.3% | |||||||
| Administration of Human Resource Programs - 0.0% | |||||||
| CDRT Merger Sub, Inc. | |||||||
| $ | 971 | 8.13%, 06/01/2019 ■ | $ | 971 | |||
| Advertising and Related Services - 0.4% | |||||||
| Affinion Group, Inc. | |||||||
| 15,769 | 11.50%, 10/15/2015 | 16,281 | |||||
| 3,639 | 11.63%, 11/15/2015 ■ | 3,639 | |||||
| 19,920 | |||||||
| Aerospace Product and Parts Manufacturing - 0.0% | |||||||
| Ducommun, Inc. | |||||||
| 311 | 9.75%, 07/15/2018 ■ | 319 | |||||
| Agencies, Brokerages, and Other Insurance - 0.0% | |||||||
| Hub International Holdings, Inc. | |||||||
| 914 | 10.25%, 06/15/2015 ■ | 930 | |||||
| Agriculture, Construction, Mining and Machinery - 0.1% | |||||||
| Case New Holland, Inc. | |||||||
| 2,091 | 7.75%, 09/01/2013 | 2,263 | |||||
| 1,336 | 7.88%, 12/01/2017 ■ | 1,470 | |||||
| 3,733 | |||||||
| Alumina and Aluminum Production and Processing - 0.0% | |||||||
| Aleris International, Inc. | |||||||
| 930 | 7.63%, 02/15/2018 ■ | 928 | |||||
| Novelis, Inc. | |||||||
| 946 | 8.38%, 12/15/2017 | 1,010 | |||||
| 1,938 | |||||||
The accompanying notes are an integral part of these financial statements.
| Shares or Principal Amount | Market Value ╪ | ||||||
CORPORATE BONDS: NON-INVESTMENT GRADE - 7.3% - (continued) | |||||||
| Animal Slaughtering and Processing - 0.0% | |||||||
| JBS USA LLC | |||||||
| $ | 901 | 7.25%, 06/01/2021 ■ | $ | 876 | |||
| Automobile Dealers - 0.1% | |||||||
| Automotores Gildemeister | |||||||
| 4,400 | 8.25%, 05/24/2021 ■ | 4,532 | |||||
| Jaguar Land Rover plc | |||||||
| 1,247 | 8.13%, 05/15/2021 ■ | 1,256 | |||||
| 5,788 | |||||||
| Automotive Equipment Rental and Leasing - 0.0% | |||||||
| Avis Budget Car Rental LLC | |||||||
| 1,500 | 9.63%, 03/15/2018 | 1,601 | |||||
| United Rentals North America, Inc. | |||||||
| 1,005 | 8.38%, 09/15/2020 | 1,018 | |||||
| 2,619 | |||||||
| Automotive Parts, Accessories, and Tire Stores - 0.0% | |||||||
| Uncle Acquisition Corp. | |||||||
| 494 | 8.63%, 02/15/2019 | 509 | |||||
| Basic Chemical Manufacturing - 0.1% | |||||||
| Hexion Specialty Chemicals | |||||||
| 940 | 8.88%, 02/01/2018 | 978 | |||||
| Lyondell Chemical Co. | |||||||
| 3,965 | 11.00%, 05/01/2018 | 4,441 | |||||
| 5,419 | |||||||
| Building Material and Supplies Dealers - 0.1% | |||||||
| Building Materials Corp. | |||||||
| 1,205 | 7.50%, 03/15/2020 ■ | 1,268 | |||||
| Hillman Group, Inc. | |||||||
| 933 | 10.88%, 06/01/2018 ■ | 1,007 | |||||
| Masonite International Co. | |||||||
| 965 | 8.25%, 04/15/2021 ■ | 959 | |||||
| 3,234 | |||||||
| Cable and Other Program Distribution - 0.1% | |||||||
| Charter Communications Holdings II LLC | |||||||
| 3,460 | 13.50%, 11/30/2016 | 4,074 | |||||
| DISH DBS Corp. | |||||||
| 1,470 | 6.75%, 06/01/2021 ■ | 1,507 | |||||
| 5,581 | |||||||
| Cable and Other Subscription Programming - 0.1% | |||||||
| Bresnan Broadband Holdings LLC | |||||||
| 630 | 8.00%, 12/15/2018 ■ | 650 | |||||
| Cequel Communication LLC | |||||||
| 1,031 | 8.63%, 11/15/2017 ■ | 1,072 | |||||
| Virgin Media Finance plc | |||||||
| 3,955 | 9.50%, 08/15/2016 | 4,469 | |||||
| 6,191 | |||||||
| Clothing Stores - 0.2% | |||||||
| Gap, Inc. | |||||||
| 7,675 | 5.95%, 04/12/2021 | 7,373 | |||||
| Coal Mining - 0.1% | |||||||
| Arch Coal, Inc. | |||||||
| 990 | 7.25%, 06/15/2021 ■ | 991 | |||||
| International Coal Group, Inc. | |||||||
| 1,601 | 9.13%, 04/01/2018 | 2,013 | |||||
| 3,004 | |||||||
| Communications Equipment Manufacturing - 0.0% | |||||||
| Sorenson Communications | |||||||
| 2,006 | 10.50%, 02/01/2015 ■ | 1,349 | |||||
Computer and Peripheral Equipment Manufacturing - 0.0 % | |||||||
| Seagate HDD Cayman | |||||||
| 1,420 | 7.75%, 12/15/2018 ■ | 1,491 | |||||
| Data Processing Services - 0.0% | |||||||
| iGate Corp. | |||||||
| 1,127 | 9.00%, 05/01/2016 ■ | 1,138 | |||||
| Data Processing, Hosting, and Related Services - 0.1% | |||||||
| First Data Corp. | |||||||
| 1,906 | 10.55%, 09/24/2015 | 1,927 | |||||
Deep Sea, Coastal, Great Lakes Water Transportation - 0.0 % | |||||||
| NCL Corp., Ltd. | |||||||
| 480 | 11.75%, 11/15/2016 | 553 | |||||
| Seven Seas Cruises | |||||||
| 194 | 9.13%, 05/15/2019 ■ | 200 | |||||
| 753 | |||||||
| Department Stores - 0.1% | |||||||
| Dollar General Corp. | |||||||
| 4,020 | 10.63%, 07/15/2015 | 4,241 | |||||
| Sears Holdings Corp. | |||||||
| 1,321 | 6.63%, 10/15/2018 ■ | 1,225 | |||||
| 5,466 | |||||||
| Depository Credit Banking - 0.1% | |||||||
| Bank of America Capital II | |||||||
| 2,610 | 8.00%, 12/15/2026 | 2,656 | |||||
Drugs and Druggists' Sundries Merchant Wholesalers - 0.0 % | |||||||
| Endo Pharmaceuticals Holdings, Inc. | |||||||
| 367 | 7.00%, 07/15/2019 ■ | 376 | |||||
| Electric Generation, Transmission and Distribution - 0.5% | |||||||
| AES Corp. | |||||||
| 1,365 | 9.75%, 04/15/2016 | 1,549 | |||||
| AES El Salvador Trust | |||||||
| 2,300 | 6.75%, 02/01/2016 § | 2,334 | |||||
| Calpine Corp. | |||||||
| 3,004 | 7.25%, 10/15/2017 ■ | 3,049 | |||||
| 1,150 | 7.88%, 01/15/2023 ■ | 1,185 | |||||
| CenterPoint Energy, Inc. | |||||||
| 7,475 | 6.85%, 06/01/2015 | 8,626 | |||||
| Edison Mission Energy | |||||||
| 3,430 | 7.00%, 05/15/2017 | 2,778 | |||||
Energy Future Intermediate Holding Co. LLC | |||||||
| 2,267 | 10.00%, 12/01/2020 | 2,418 | |||||
| NRG Energy, Inc. | |||||||
| 2,215 | 8.50%, 06/15/2019 | 2,293 | |||||
| Texas Competitive Electric Co. | |||||||
| 800 | 11.50%, 10/01/2020 ■ | 786 | |||||
| 25,018 | |||||||
The accompanying notes are an integral part of these financial statements.
| Hartford Total Return Bond HLS Fund |
| Schedule of Investments – (continued) |
| June 30, 2011 (Unaudited) |
| (000’s Omitted) |
| Shares or Principal Amount | Market Value ╪ | ||||||
CORPORATE BONDS: NON-INVESTMENT GRADE - 7.3% - (continued) | |||||||
| Fruit and Vegetable Preserving and Specialty Food - 0.1% | |||||||
| Smithfield Foods, Inc. | |||||||
| $ | 3,810 | 10.00%, 07/15/2014 | $ | 4,420 | |||
| Full-Service Restaurants - 0.2% | |||||||
| Arcos Dorados S.A. | |||||||
| 4,800 | 7.50%, 10/01/2019 ■ | 5,208 | |||||
| Landry's Restaurants, Inc. | |||||||
| 1,950 | 11.63%, 12/01/2015 | 2,086 | |||||
| 7,294 | |||||||
| Gambling Industries - 0.1% | |||||||
| Citycenter Holdings LLC | |||||||
| 1,265 | 10.75%, 01/15/2017 ■ | 1,312 | |||||
| Downstream Development Authority | |||||||
| 578 | 10.50%, 07/01/2019 ■☼ | 575 | |||||
| 1,296 | 12.00%, 10/15/2015 ■ | 1,442 | |||||
| FireKeepers Development Authority | |||||||
| 439 | 13.88%, 05/01/2015 ■ | 507 | |||||
| 3,836 | |||||||
| General Medical and Surgical Hospitals - 0.2% | |||||||
| HCA, Inc. | |||||||
| 2,047 | 7.50%, 11/15/2095 | 1,658 | |||||
| 7,840 | 9.25%, 11/15/2016 | 8,321 | |||||
| LifePoint Hospitals, Inc. | |||||||
| 935 | 6.63%, 10/01/2020 | 963 | |||||
| 10,942 | |||||||
| Grocery and Related Product Wholesalers - 0.0% | |||||||
| Harbinger Group, Inc. | |||||||
| 396 | 10.63%, 11/15/2015 ■ | 400 | |||||
| U.S. Foodservice, Inc. | |||||||
| 997 | 8.50%, 06/30/2019 ■ | 967 | |||||
| 1,367 | |||||||
| Grocery Stores - 0.0% | |||||||
| Supervalu, Inc. | |||||||
| 990 | 8.00%, 05/01/2016 | 1,010 | |||||
Industrial Machinery and Equipment Rental and Leasing - 0.1 % | |||||||
| International Lease Finance Corp. | |||||||
| 1,597 | 8.88%, 09/01/2017 | 1,757 | |||||
| Insurance Carriers - 0.0% | |||||||
| Liberty Mutual Group, Inc. | |||||||
| 1,540 | 10.75%, 06/15/2058 ■ | 2,044 | |||||
| Internet Service Providers and Web Search Portals - 0.1% | |||||||
| GXS Worldwide, Inc. | |||||||
| 2,460 | 9.75%, 06/15/2015 | 2,491 | |||||
| Jewelry, Luggage, and Leather Goods Stores - 0.0% | |||||||
| Liz Claiborne, Inc. | |||||||
| 1,100 | 10.50%, 04/15/2019 ■ | 1,122 | |||||
| Medical and Diagnostic Laboratories - 0.1% | |||||||
| Aurora Diagnostics Holdings | |||||||
| 1,402 | 10.75%, 01/15/2018 �� | 1,451 | |||||
| Medical Equipment and Supplies Manufacturing - 0.1% | |||||||
| Biomet, Inc. | |||||||
| 1,765 | 10.38%, 10/15/2017 | 1,946 | |||||
| Metal Ore Mining - 0.0% | |||||||
| Taseko Mines Ltd. | |||||||
| 974 | 7.75%, 04/15/2019 | 982 | |||||
| Miscellaneous Durable Goods Wholesalers - 0.0% | |||||||
| Spectrum Brands, Inc. | |||||||
| 549 | 12.00%, 08/28/2019 | 607 | |||||
| Motion Picture and Video Industries - 0.0% | |||||||
| NAI Entertainment Holdings LLC | |||||||
| 813 | 8.25%, 12/15/2017 ■ | 872 | |||||
| Motor Vehicle Manufacturing - 0.0% | |||||||
| Ford Motor Co. | |||||||
| 1,380 | 7.50%, 08/01/2026 | 1,397 | |||||
| Motor Vehicle Parts Manufacturing - 0.1% | |||||||
| TRW Automotive, Inc. | |||||||
| 983 | 3.50%, 12/01/2015 ۞■ | 2,077 | |||||
| Natural Gas Distribution - 0.1% | |||||||
| Regency Energy Partners L.P. | |||||||
| 1,440 | 9.38%, 06/01/2016 | 1,606 | |||||
| Star Gas Partners L.P. | |||||||
| 407 | 8.88%, 12/01/2017 | 424 | |||||
| 2,030 | |||||||
Newspaper, Periodical, Book and Database Publisher - 0.1% | |||||||
| Cenveo, Inc. | |||||||
| 1,465 | 10.50%, 08/15/2016 ■ | 1,439 | |||||
| Knight Ridder, Inc. | |||||||
| 5,503 | 6.88%, 03/15/2029 | 3,288 | |||||
| McClatchy Co. | |||||||
| 1,724 | 11.50%, 02/15/2017 | 1,832 | |||||
| TL Acquisitions, Inc. | |||||||
| 1,290 | 13.25%, 07/15/2015 ■ | 1,161 | |||||
| 7,720 | |||||||
| Nondepository Credit Banking - 1.2% | |||||||
| Ally Financial, Inc. | |||||||
| 1,190 | 7.50%, 09/15/2020 | 1,244 | |||||
| 1,090 | 8.30%, 02/12/2015 | 1,218 | |||||
| CIT Group, Inc. | |||||||
| 960 | 5.25%, 04/01/2014 ■ | 955 | |||||
| 7,065 | 7.00%, 05/01/2017 | 7,047 | |||||
| Discover Financial Services, Inc. | |||||||
| 5,970 | 10.25%, 07/15/2019 | 7,714 | |||||
| Ford Motor Credit Co. | |||||||
| 6,545 | 6.63%, 08/15/2017 | 6,958 | |||||
| GMAC LLC | |||||||
| 705 | 8.00%, 11/01/2031 | 763 | |||||
| Provident Funding Associates L.P. | |||||||
| 1,031 | 10.13%, 02/15/2019 ■ | 1,046 | |||||
| 2,116 | 10.25%, 04/15/2017 ■ | 2,317 | |||||
| Residential Capital LLC | |||||||
| 1,840 | 9.63%, 05/15/2015 | 1,826 | |||||
The accompanying notes are an integral part of these financial statements.
| Shares or Principal Amount | Market Value ╪ | ||||||
CORPORATE BONDS: NON-INVESTMENT GRADE - 7.3% - (continued) | |||||||
| Nondepository Credit Banking - 1.2% - (continued) | |||||||
| SLM Corp. | |||||||
| $ | 6,630 | 6.25%, 01/25/2016 | $ | 6,879 | |||
| Springleaf Finance Corp. | |||||||
| 10,565 | 6.90%, 12/15/2017 | 9,693 | |||||
| 47,660 | |||||||
| Nonmetallic Mineral Mining and Quarrying - 0.1% | |||||||
| Alrosa Finance S.A. | |||||||
| 5,100 | 7.75%, 11/03/2020 ■ | 5,546 | |||||
| FMG Resources Pty Ltd. | |||||||
| 1,299 | 7.00%, 11/01/2015 ■ | 1,325 | |||||
| Vulcan Materials Co. | |||||||
| 353 | 7.50%, 06/15/2021 | 353 | |||||
| 7,224 | |||||||
| Oil and Gas Extraction - 0.3% | |||||||
| Anadarko Petroleum Corp. | |||||||
| 3,565 | 6.38%, 09/15/2017 | 4,087 | |||||
| Chaparral Energy, Inc. | |||||||
| 755 | 9.88%, 10/01/2020 | 815 | |||||
| Chesapeake Energy Corp. | |||||||
| 968 | 6.88%, 08/15/2018 | 1,016 | |||||
| 2,041 | 9.50%, 02/15/2015 | 2,368 | |||||
| Concho Resources, Inc. | |||||||
| 1,530 | 7.00%, 01/15/2021 | 1,584 | |||||
| EV Energy Partners Finance | |||||||
| 1,055 | 8.00%, 04/15/2019 ■ | 1,059 | |||||
| Plains Exploration & Production Co. | |||||||
| 1,935 | 10.00%, 03/01/2016 | 2,177 | |||||
| Sandridge Energy, Inc. | |||||||
| 865 | 8.75%, 01/15/2020 | 921 | |||||
| Venoco, Inc. | |||||||
| 1,005 | 8.88%, 02/15/2019 ■ | 1,005 | |||||
| 15,032 | |||||||
| Other Amusement and Recreation Industries - 0.0% | |||||||
| Clubcorp Club Operations, Inc. | |||||||
| 1,188 | 10.00%, 12/01/2018 ■ | 1,176 | |||||
| Other Chemical and Preparation Manufacturing - 0.1% | |||||||
| Eastman Kodak Co. | |||||||
| 1,570 | 10.63%, 03/15/2019 ■ | 1,546 | |||||
| Other Financial Investment Activities - 0.0% | |||||||
| LBI Escrow Corp. | |||||||
| 1,768 | 8.00%, 11/01/2017 ■ | 1,967 | |||||
| Offshore Group Investments Ltd. | |||||||
| 1,149 | 11.50%, 08/01/2015 | 1,250 | |||||
| 160 | 11.50%, 08/01/2015 ■ | 174 | |||||
| UPCB Finance III Ltd. | |||||||
| 1,520 | 6.63%, 07/01/2020 ■ | 1,501 | |||||
| 4,892 | |||||||
| Other Heavy and Civil Engineering Construction - 0.2% | |||||||
| Odebrecht Finance Ltd. | |||||||
| 9,340 | 7.00%, 04/21/2020 § | 10,274 | |||||
| Other Miscellaneous Manufacturing - 0.1% | |||||||
| Reynolds Group Issuer, Inc. | |||||||
| 3,389 | 7.13%, 04/15/2019 ■ | 3,364 | |||||
| Petroleum and Coal Products Manufacturing - 0.1% | |||||||
| Alpha Natural Resources, Inc. | |||||||
| 1,161 | 6.00%, 06/01/2019 | 1,158 | |||||
| Drummond Co., Inc. | |||||||
| 2,000 | 7.38%, 02/15/2016 | 2,055 | |||||
| Headwaters, Inc. | |||||||
| 975 | 7.63%, 04/01/2019 | 887 | |||||
| Western Refining, Inc. | |||||||
| 897 | 11.25%, 06/15/2017 ■ | 1,009 | |||||
| 5,109 | |||||||
| Pharmaceutical and Medicine Manufacturing - 0.0% | |||||||
| Valeant Pharmaceuticals International | |||||||
| 1,479 | 7.00%, 10/01/2020 ■ | 1,431 | |||||
| Warner Chilcott, Inc. | |||||||
| 931 | 7.75%, 09/15/2018 ■ | 939 | |||||
| 2,370 | |||||||
| Pipeline Transportation of Natural Gas - 0.1% | |||||||
| Dynegy Holdings, Inc. | |||||||
| 3,920 | 7.75%, 06/01/2019 | 2,852 | |||||
| El Paso Corp. | |||||||
| 642 | 7.80%, 08/01/2031 | 749 | |||||
| Energy Transfer Equity L.P. | |||||||
| 672 | 7.50%, 10/15/2020 | 712 | |||||
| 4,313 | |||||||
| Pipeline Transportation of Crude Oil - 0.0% | |||||||
| Chesapeake Midstream Partners | |||||||
| 680 | 5.88%, 04/15/2021 ■ | 672 | |||||
| Eagle Rock Energy Partners L.P. | |||||||
| 404 | 8.38%, 06/01/2019 ■ | 403 | |||||
| 1,075 | |||||||
| Printing and Related Support Activities - 0.1% | |||||||
| Harland Clarke Holdings Corp. | |||||||
| 1,790 | 6.00%, 05/15/2015 Δ | 1,495 | |||||
| Sheridan Group, Inc. | |||||||
| 1,012 | 12.50%, 04/15/2014 ■ | 961 | |||||
| 2,456 | |||||||
| Pulp, Paper, and Paperboard Mills - 0.1% | |||||||
| Domtar Corp. | |||||||
| 955 | 10.75%, 06/01/2017 | 1,243 | |||||
| Longview Fibre Co. | |||||||
| 388 | 8.00%, 06/01/2016 ■ | 390 | |||||
| Mercer International, Inc. | |||||||
| 1,644 | 9.50%, 12/01/2017 | 1,763 | |||||
| Sappi Papier Holding, Inc. | |||||||
| 984 | 6.63%, 04/15/2021 ■ | 957 | |||||
| 4,353 | |||||||
| Radio and Television Broadcasting - 0.2% | |||||||
| Citadel Broadcasting Corp. | |||||||
| 1,975 | 7.75%, 12/15/2018 ■ | 2,098 | |||||
| XM Satellite Radio, Inc. | |||||||
| 1,916 | 13.00%, 08/01/2013 ■ | 2,247 | |||||
| 4,345 | |||||||
| Rail Transportation - 0.0% | |||||||
| RailAmerica, Inc. | |||||||
| 1,025 | 9.25%, 07/01/2017 | 1,125 | |||||
The accompanying notes are an integral part of these financial statements.
| Hartford Total Return Bond HLS Fund |
| Schedule of Investments – (continued) |
| June 30, 2011 (Unaudited) |
| (000’s Omitted) |
| Shares or Principal Amount | Market Value ╪ | ||||||
CORPORATE BONDS: NON-INVESTMENT GRADE - 7.3% - (continued) | |||||||
| Real Estate Investment Trust (REIT) - 0.0% | |||||||
| CNL Lifestyle Properties | |||||||
| $ | 1,594 | 7.25%, 04/15/2019 ■ | $ | 1,443 | |||
| Residential Building Construction - 0.1% | |||||||
| Shea Homes L.P. | |||||||
| 588 | 8.63%, 05/15/2019 ■ | 579 | |||||
| Urbi Desarrollos Urbanos | |||||||
| 1,500 | 9.50%, 01/21/2020 § | 1,631 | |||||
| 2,210 | |||||||
| Rubber Product Manufacturing - 0.1% | |||||||
| Titan International, Inc. | |||||||
| 2,022 | 7.88%, 10/01/2017 ■ | 2,113 | |||||
| Satellite Telecommunications - 0.1% | |||||||
| Intelsat Bermuda Ltd. | |||||||
| 1,750 | 11.50%, 02/04/2017 | 1,881 | |||||
| Intelsat Jackson Holdings Ltd. | |||||||
| 2,710 | 8.50%, 11/01/2019 | 2,873 | |||||
| 4,754 | |||||||
Securities and Commodity Contracts and Brokerage - 0.0 % | |||||||
| Penson Worldwide, Inc. | |||||||
| 2,211 | 12.50%, 05/15/2017 ■ | 2,056 | |||||
Semiconductor, Electronic Component Manufacturing - 0.1 % | |||||||
| Magnachip Semiconductor | |||||||
| 1,405 | 10.50%, 04/15/2018 | 1,538 | |||||
| Spansion LLC | |||||||
| 785 | 7.88%, 11/15/2017 ■ | 797 | |||||
| 2,335 | |||||||
| Soap, Cleaning Compound, Toilet Manufacturing - 0.0% | |||||||
| Yankee Candle Co. | |||||||
| 1,094 | 10.25%, 02/15/2016 ■ | 1,097 | |||||
| Software Publishers - 0.0% | |||||||
| SoftBrands, Inc. | |||||||
| 570 | 11.50%, 07/15/2018 ■ | 525 | |||||
| Sovereign Foreign Governments - 0.2% | |||||||
| Colombia (Republic of) | |||||||
| 3,800 | 7.38%, 03/18/2019 | 4,737 | |||||
| El Salvador (Republic of) | |||||||
| 2,465 | 7.65%, 06/15/2035 § | 2,551 | |||||
| 7,288 | |||||||
Sporting Goods, Hobby and Musical Instrument Store - 0.1 % | |||||||
| Toys R Us, Inc. | |||||||
| 1,490 | 7.38%, 09/01/2016 ■ | 1,505 | |||||
| Support Activities For Mining - 0.0% | |||||||
| Key Energy Services, Inc. | |||||||
| 1,069 | 6.75%, 03/01/2021 | 1,069 | |||||
| Telecommunications - Other - 0.3% | |||||||
| Level 3 Financing, Inc. | |||||||
| 2,654 | 10.00%, 02/01/2018 | 2,850 | |||||
| MTS International Funding Ltd. | |||||||
| 2,060 | 8.63%, 06/22/2020 ■ | 2,351 | |||||
| Sprint Capital Corp. | |||||||
| 1,050 | 8.75%, 03/15/2032 | 1,137 | |||||
| Wind Acquisition Finance S.A. | |||||||
| 2,335 | 11.75%, 07/15/2017 ■ | 2,644 | |||||
| 8,982 | |||||||
| Telecommunications - Wired Carriers - 0.1% | |||||||
| Frontier Communications Corp. | |||||||
| 2,550 | 7.88%, 04/15/2015 | 2,767 | |||||
| Kabel Baden Wurttemberg GMBH & Co. | |||||||
| 1,269 | 7.50%, 03/15/2019 ■ | 1,294 | |||||
| PAETEC Holding Corp. | |||||||
| 698 | 9.88%, 12/01/2018 ■ | 723 | |||||
| Videotron Ltee | |||||||
| 1,295 | 9.13%, 04/15/2018 | 1,445 | |||||
| Windstream Corp. | |||||||
| 1,070 | 7.75%, 10/01/2021 | 1,118 | |||||
| 7,347 | |||||||
| Telecommunications - Wireless Carriers - 0.0% | |||||||
| Clearwire Corp. | |||||||
| 1,400 | 12.00%, 12/01/2015 ■ | 1,500 | |||||
| Trilogy International Partners LLC | |||||||
| 1,979 | 10.25%, 08/15/2016 ■ | 2,009 | |||||
| 3,509 | |||||||
| Textile Furnishings Mills - 0.0% | |||||||
| Interface, Inc. | |||||||
| 1,029 | 7.63%, 12/01/2018 | 1,070 | |||||
| Traveler Accommodation - 0.2% | |||||||
| Harrah's Operating Co., Inc. | |||||||
| 425 | 11.25%, 06/01/2017 | 469 | |||||
| MGM Mirage, Inc. | |||||||
| 3,865 | 11.13%, 11/15/2017 | 4,416 | |||||
| MGM Resorts International | |||||||
| 3,242 | 11.38%, 03/01/2018 | 3,639 | |||||
| Sugarhouse HSP Gaming Prop Mezz L.P. | |||||||
| 528 | 8.63%, 04/15/2016 ■ | 544 | |||||
| Wynn Las Vegas LLC | |||||||
| 625 | 7.75%, 08/15/2020 | 679 | |||||
| 9,747 | |||||||
| Waste Treatment and Disposal - 0.0% | |||||||
| Energy Solutions, Inc. LLC | |||||||
| 1,185 | 10.75%, 08/15/2018 | 1,250 | |||||
| Total corporate bonds: non-investment grade | |||||||
| (cost $325,861) | $ | 338,558 | |||||
| MUNICIPAL BONDS - 1.5% | |||||||
| General Obligations - 0.4% | |||||||
| Illinois (State of) | |||||||
| $ | 13,005 | 4.96%, 03/01/2016 | $ | 13,445 | |||
| Oregon School Boards Association, Taxable | |||||||
| Pension | |||||||
| 7,325 | 4.76%, 06/30/2028 | 6,793 | |||||
| 20,238 | |||||||
The accompanying notes are an integral part of these financial statements.
| Shares or Principal Amount | Market Value ╪ | ||||||
| MUNICIPAL BONDS - 1.5% - (continued) | |||||||
| Higher Education (Univ., Dorms, etc.) - 0.3% | |||||||
| Curators University, MO, System Fac Rev | |||||||
| $ | 2,270 | 5.79%, 11/01/2041 | $ | 2,487 | |||
| New York State Dormitory Auth Rev Non | |||||||
| State | |||||||
| 9,030 | 5.00%, 10/01/2041 | 9,447 | |||||
| 11,934 | |||||||
| Miscellaneous - 0.1% | |||||||
| Colorado Bridge Enterprise Rev Build | |||||||
| America Bond | |||||||
| 4,000 | 6.08%, 12/01/2040 | 4,307 | |||||
| Tax Allocation - 0.1% | |||||||
| California Urban IDA Taxable | |||||||
| 275 | 6.10%, 05/01/2024 | 240 | |||||
| Regional Transportation Dist | |||||||
| 5,225 | 5.84%, 11/01/2050 | 5,569 | |||||
| 5,809 | |||||||
| Transportation - 0.2% | |||||||
| Connecticut State Special Tax Obligation | |||||||
| Rev | |||||||
| 7,005 | 5.46%, 11/01/2030 | 6,937 | |||||
| Utilities - Electric - 0.2% | |||||||
| Georgia Municipal Elec Auth | |||||||
| 10,565 | 6.64%, 04/01/2057 | 10,128 | |||||
| Utilities - Water and Sewer - 0.2% | |||||||
| San Francisco City & County Public Utilities | |||||||
| Commission | |||||||
| 8,520 | 6.00%, 11/01/2040 | 8,737 | |||||
| Total municipal bonds | |||||||
| (cost $67,379) | $ | 68,090 | |||||
SENIOR FLOATING RATE INTERESTS: NON-INVESTMENT GRADE♦ - 0.7% | |||||||
| Cable and Other Program Distribution - 0.1% | |||||||
| WideOpenWest Finance LLC, Second Lien | |||||||
| Term Loan | |||||||
| $ | 5,623 | 6.44%, 06/29/2015 ± | $ | 5,374 | |||
| Captive Auto Finance - 0.2% | |||||||
| Chrysler Group LLC | |||||||
| 9,335 | 6.00%, 05/24/2017 ± | 9,116 | |||||
| Insurance Carriers - 0.0% | |||||||
| Asurion Corp. | |||||||
| 1,176 | 9.00%, 05/24/2019 ± | 1,178 | |||||
| Motor Vehicle Manufacturing - 0.2% | |||||||
| General Motors Co. | |||||||
| 8,480 | 0.44%, 10/27/2015 ±☼ | 7,645 | |||||
| Other Financial Investment Activities - 0.1% | |||||||
| BNY Convergex Group LLC, 2nd Lien Eze | |||||||
| Borrower Term Loan | |||||||
| 217 | 8.75%, 12/17/2017 ± | 221 | |||||
| BNY Convergex Group LLC, 2nd Lien Top | |||||||
| Borrower Term Loan | |||||||
| 518 | 8.75%, 12/17/2017 ± | 526 | |||||
| Nuveen Investments, Inc., Second Lien Term | |||||||
| Loan | |||||||
| 3,495 | 12.50%, 07/31/2015 ± | 3,718 | |||||
| 4,465 | |||||||
| Scheduled Air Transportation - 0.0% | |||||||
| Macquarie Aircraft Leasing Finance S.A., | |||||||
| Second Lien Term Loan | |||||||
| 1,758 | 4.19%, 11/29/2013 ±⌂ | 1,617 | |||||
Sporting Goods, Hobby and Musical Instrument Store - 0.1 % | |||||||
| Easton-Bell Sports, Inc. | |||||||
| 4,635 | 11.50%, 12/31/2015 ±⌂ | 4,635 | |||||
Total senior floating rate interests: non-investment grade | |||||||
| (cost $35,092) | $ | 34,030 | |||||
| U.S. GOVERNMENT AGENCIES - 35.7% | |||||||
| Federal Home Loan Mortgage Corporation - 6.3% | |||||||
| $ | 77,191 | 0.42%, 10/25/2020 ► | $ | 1,909 | |||
| 23,918 | 1.52%, 08/25/2020 ► | 2,165 | |||||
| 143,883 | 4.00%, 08/01/2025 - 07/15/2040 ☼ | 144,702 | |||||
| 16,222 | 5.50%, 10/01/2018 - 05/01/2037 | 17,621 | |||||
| 105,555 | 6.00%, 04/01/2017 - 05/01/2038 | 116,375 | |||||
| 8,874 | 6.50%, 07/01/2031 - 08/01/2038 | 10,007 | |||||
| 6 | 7.50%, 09/01/2029 - 11/01/2031 | 7 | |||||
| 292,786 | |||||||
| Federal National Mortgage Association - 14.7% | |||||||
| 58,721 | 4.00%, 06/01/2025 - 10/01/2025 | 61,337 | |||||
| 49,585 | 4.50%, 09/01/2024 - 08/01/2040 | 52,172 | |||||
| 238,161 | 5.00%, 02/01/2018 - 04/25/2038 | 254,539 | |||||
| 256,062 | 5.50%, 12/01/2013 - 09/01/2040 ☼ | 277,870 | |||||
| 24,071 | 6.00%, 07/01/2012 - 02/01/2037 | 26,590 | |||||
| 68 | 6.50%, 11/01/2014 - 07/01/2032 | 74 | |||||
| 1,875 | 7.00%, 02/01/2016 - 10/01/2037 | 2,158 | |||||
| 609 | 7.50%, 11/01/2015 - 05/01/2032 | 714 | |||||
| 2 | 8.00%, 04/01/2032 | 3 | |||||
| 675,457 | |||||||
| Government National Mortgage Association - 14.7% | |||||||
| 81,276 | 4.00%, 08/20/2040 - 12/20/2040 | 82,705 | |||||
| 410,454 | 4.50%, 05/15/2040 - 10/20/2040 ‡ | 432,914 | |||||
| 123,170 | 5.00%, 06/15/2039 - 09/20/2040 | 133,936 | |||||
| 14,337 | 5.50%, 03/15/2033 - 10/20/2034 | 15,869 | |||||
| 9,259 | 6.50%, 06/15/2028 - 09/15/2032 | 10,564 | |||||
| 27 | 7.00%, 06/20/2030 - 08/15/2031 | 32 | |||||
| 4 | 8.50%, 11/15/2024 | 5 | |||||
| 676,025 | |||||||
| Total U.S. government agencies | |||||||
| (cost $1,606,194) | $ | 1,644,268 | |||||
The accompanying notes are an integral part of these financial statements.
| Hartford Total Return Bond HLS Fund |
| Schedule of Investments – (continued) |
| June 30, 2011 (Unaudited) |
| (000’s Omitted) |
| Shares or Principal Amount | Market Value ╪ | ||||||
| U.S. GOVERNMENT SECURITIES - 17.9% | |||||||
| U.S. Treasury Securities - 17.9% | |||||||
| U.S. Treasury Bonds - 4.5% | |||||||
| $ | 25,947 | 4.38%, 05/15/2041 | $ | 25,906 | |||
| 124,270 | 4.75%, 02/15/2041 | 132,095 | |||||
| 41,369 | 5.38%, 02/15/2031 | 48,486 | |||||
| 206,487 | |||||||
| U.S. Treasury Notes - 13.4% | |||||||
| 125,078 | 0.38%, 10/31/2012 | 125,200 | |||||
| 83,116 | 0.50%, 05/31/2013 | 83,204 | |||||
| 14,882 | 0.63%, 04/30/2013 | 14,935 | |||||
| 2,120 | 0.75%, 06/15/2014 | 2,118 | |||||
| 158,792 | 1.75%, 05/31/2016 | 159,040 | |||||
| 55,272 | 2.00%, 04/30/2016 | 56,110 | |||||
| 7,267 | 2.38%, 05/31/2018 | 7,228 | |||||
| 143,455 | 2.50%, 04/30/2015 ╦ | 150,448 | |||||
| 17,597 | 3.13%, 05/15/2021 | 17,548 | |||||
| 615,831 | |||||||
| 822,318 | |||||||
| Total U.S. government securities | |||||||
| (cost $823,394) | $ | 822,318 | |||||
| Contracts | Market Value ╪ | ||||||
| CALL OPTIONS PURCHASED - 0.0% | |||||||
| Foreign Currency Option Contract - 0.0% | |||||||
| CHF/MXN | |||||||
| 56,735 | Expiration: 01/05/2012 Ø | $ | 348 | ||||
| 56,735 | Expiration: 03/15/2012 Ø | 820 | |||||
| EUR/USD Binary | |||||||
| 4,786 | Expiration: 11/24/2011 β | 40 | |||||
| 1,208 | |||||||
| Total call options purchased | |||||||
| (cost $4,605) | $ | 1,208 | |||||
| Contracts | Market Value ╪ | ||||||
| PUT OPTIONS PURCHASED - 0.1% | |||||||
| Foreign Currency Option Contract - 0.1% | |||||||
| JPY/MXN | |||||||
| 56,455 | Expiration: 03/26/2012 Θ | $ | 2,717 | ||||
| USD/JPY | |||||||
| 47,000 | Expiration: 07/12/2011 | 80 | |||||
| 2,797 | |||||||
| Interest Rate Option Contract - 0.0% | |||||||
| 90 Day Euro Future | |||||||
| 3 | Expiration: 09/20/2011, Exercise Rate: | ||||||
| 99.37% Ø | 227 | ||||||
| Credit Option Contract - 0.0% | |||||||
| Credit Default Swaption CDX.NA.IG.16 | |||||||
| 101,760 | Expiration: 07/21/2011, Exercise Rate: | ||||||
| 1.05% Ø | 77 | ||||||
| Europe Senior Financials | |||||||
| 95,710 | Expiration: 09/22/2011, Exercise Price: | ||||||
| $ 1.20 Ø | 395 | ||||||
| 98,437 | Expiration: 09/22/2011, Exercise Price: | ||||||
| $ 1.80 Ø | 724 | ||||||
| 1,196 | |||||||
| Total put options purchased | |||||||
| (cost $5,083) | $ | 4,220 | |||||
| COMMON STOCKS - 0.0% | |||||||
| Integrated Telecommunication Services - 0.0% | |||||||
| – | XO Holdings, Inc. ● | $ | – | ||||
| Total common stocks | |||||||
| (cost $–) | $ | – | |||||
| PREFERRED STOCKS - 0.2% | |||||||
| Auto Parts & Equipment - 0.0% | |||||||
| 9 | Dana Holding Corp. Preferred, 4.00% ۞■ | $ | 1,419 | ||||
| Automobile Manufacturers - 0.1% | |||||||
| 76 | General Motors Co. Preferred, 4.75% ۞ | 3,709 | |||||
| Diversified Banks - 0.1% | |||||||
| 2 | US Bancorp, 7.19% | 1,883 | |||||
| Thrifts & Mortgage Finance - 0.0% | |||||||
| 330 | Federal Home Loan Mortgage Corp., 8.38% | 973 | |||||
| Total preferred stocks | |||||||
| (cost $15,083) | $ | 7,984 | |||||
| Total long-term investments | |||||||
| (cost $4,396,221) | $ | 4,503,360 | |||||
| SHORT-TERM INVESTMENTS - 4.1% | |||||||
| Investment Pools and Funds - 0.0% | |||||||
| JP Morgan U.S. Government Money | |||||||
| 531 | Market Fund | $ | 531 | ||||
| Repurchase Agreements - 3.6% | |||||||
| BNP Paribas Securities Corp. TriParty Joint | |||||||
| Repurchase Agreement (maturing on | |||||||
| 07/01/2011 in the amount of $36,390, | |||||||
| collateralized by U.S. Treasury Bond | |||||||
| 5.25%, 2029, value of $37,118) | |||||||
| $ | 36,390 | 0.01%, 06/30/2011 | 36,390 | ||||
| RBC Capital Markets Corp. TriParty Joint | |||||||
| Repurchase Agreement (maturing on | |||||||
| 07/01/2011 in the amount of $39,832, | |||||||
| collateralized by U.S. Treasury Bill 0.02% | |||||||
| - 4.50%, 2011 - 2012, U.S. Treasury Bond | |||||||
| 4.25% - 7.13%, 2023 - 2039, U.S. | |||||||
| Treasury Note 0.38% - 10.63%, 2012 - | |||||||
| 2021, value of $40,629) | |||||||
| 39,832 | 0.01%, 06/30/2011 | 39,832 | |||||
| RBS Greenwich Capital Markets TriParty | |||||||
| Joint Repurchase Agreement (maturing on | |||||||
| 07/01/2011 in the amount of $34,423, | |||||||
| collateralized by U.S. Treasury Bond | |||||||
| 4.50%, 2038, U.S. Treasury Note 4.00%, | |||||||
| 2015, value of $35,112) | |||||||
| 34,423 | 0.01%, 06/30/2011 | 34,423 | |||||
The accompanying notes are an integral part of these financial statements.
| Shares or Principal Amount | Market Value ╪ | ||||||||||
| SHORT-TERM INVESTMENTS - 4.1% - (continued) | |||||||||||
| Repurchase Agreements - 3.6% - (continued) | |||||||||||
| UBS Securities, Inc. TriParty Joint | |||||||||||
| Repurchase Agreement (maturing on | |||||||||||
| 07/01/2011 in the amount of $53,195, | |||||||||||
| collateralized by U.S. Treasury Bond | |||||||||||
| 2.00% - 3.63%, 2026 - 2028, value of | |||||||||||
| $ 54,260) | |||||||||||
| $ | 53,195 | 0.01%, 06/30/2011 | $ | 53,195 | |||||||
| 163,840 | |||||||||||
| U.S. Treasury Bills - 0.5% | |||||||||||
| 24,140 | 0.01%, 7/28/2011□○ØΘ | 24,139 | |||||||||
| Total short-term investments | |||||||||||
| (cost $188,510) | $ | 188,510 | |||||||||
| Total investments | |||||||||||
| (cost $4,584,731) ▲ | 101.9 | % | $ | 4,691,870 | |||||||
| Other assets and liabilities | (1.9 | )% | (86,789 | ) | |||||||
| Total net assets | 100.0 | % | $ | 4,605,081 | |||||||
| Note: | Percentage of investments as shown is the ratio of the total market value to total net assets. Market value of investments in foreign securities represents 6.5% of total net assets at June 30, 2011. |
| ▲ | At June 30, 2011, the cost of securities for federal income tax purposes was $4,585,278 and the aggregate gross unrealized appreciation and depreciation based on that cost were: |
| Unrealized Appreciation | $ | 149,852 | ||
| Unrealized Depreciation | (43,260 | ) | ||
| Net Unrealized Appreciation | $ | 106,592 |
| † | The aggregate value of securities valued in good faith at fair value as determined under policies and procedures established by and under the supervision of the Company's Board of Directors at June 30, 2011, was $356, which represents 0.01% of total net assets. |
| ● | Currently non-income producing. For long-term debt securities, items identified are in default as to payment of interest and/or principal. |
| Ψ | The company is in bankruptcy. The investment held by the fund is current with respect to interest payments. |
| Δ | Variable rate securities; the rate reported is the coupon rate in effect at June 30, 2011. |
| ○ | The interest rate disclosed for these securities represents the effective yield on the date of the acquisition. |
| ► | Securities disclosed are interest-only strips. The interest rates represent effective yields based upon estimated future cash flows at June 30, 2011. |
| ± | The interest rate disclosed for these securities represents the average coupon as of June 30, 2011. |
| ♦ | Senior floating rate interests generally pay interest rates which are periodically adjusted by reference to a base short-term, floating lending rate plus a premium. These base lending rates are generally (i) the lending rate offered by one or more major European banks, such as the London Inter-Bank Offered Rate (LIBOR), (ii) the prime rate offered by one or more major United States Banks, or (iii) the bank's certificate of deposit rate. Senior floating rate interests often require prepayments from excess cash flows or permit the borrower to repay at its election. The rate at which the borrower repays cannot be predicted with accuracy. As a result, the actual remaining maturity may be substantially less than the stated maturities shown. |
| ■ | Securities issued within terms of a private placement memorandum, exempt from registration under Rule 144A under the Securities Act of 1933, as amended, and may be sold only to qualified institutional buyers. Unless otherwise indicated, these issues are determined to be liquid. At June 30, 2011, the aggregate value of these securities was $579,452, which represents 12.58% of total net assets. |
The accompanying notes are an integral part of these financial statements.
| Hartford Total Return Bond HLS Fund |
| Schedule of Investments – (continued) |
| June 30, 2011 (Unaudited) |
| (000’s Omitted) |
| § | These securities were sold to the Fund under Regulation S, rules governing offers and sales made outside the United States without registration under the Securities Act of 1933. The Fund may only be able to resell these securities in the United States if an exemption from registration under the federal and state securities laws is available, or the Fund may only be able to sell these securities outside of the United States (such as on a foreign exchange) to a non-U.S. person. Unless otherwise indicated, these holdings are determined to be liquid. At June 30, 2011, the aggregate value of these securities amounted to $25,508, which represents 0.55% of total net assets. |
| ۞ | Convertible security. |
| ♠ | Perpetual maturity security. Maturity date shown is the first call date. |
| β | This security has limitations. If the Euro to U.S. Dollar exchange rate as less than or equal to 1.10 on expiration date, the counterparty will be required to pay the Fund the equivalent of par on the number of contracts traded. |
| ☼ | The cost of securities purchased on a when-issued, delayed delivery or delayed draw basis at June 30, 2011 was $152,866. |
| ‡ | This security, or a portion of this security, has been segregated to cover funding requirements on investment transactions settling in the future. |
| ╦ | This security, or a portion of this security, has been pledged as collateral in connection with swap contracts. |
| □ | Security pledged as initial margin deposit for open futures contracts at June 30, 2011 as follows: |
| Unrealized | |||||||||||||||||||
| Number of | Expiration | Notional | Appreciation/ | ||||||||||||||||
| Description | Contracts* | Position | Date | Market Value ╪ | Amount | (Depreciation) | |||||||||||||
| U.S. 10 Year Note | 581 | Long | 09/21/2011 | $ | 71,073 | $ | 71,473 | $ | (400 | ) | |||||||||
| U.S. 2 Year Note | 1,864 | Long | 09/30/2011 | $ | 408,857 | $ | 408,982 | $ | (125 | ) | |||||||||
| U.S. 5 Year Note | 1,008 | Short | 09/30/2011 | $ | 120,149 | $ | 120,639 | $ | 490 | ||||||||||
| U.S. Treasury Bond | 275 | Short | 09/21/2011 | $ | 33,834 | $ | 34,425 | $ | 591 | ||||||||||
| $ | 556 | ||||||||||||||||||
| * | The number of contracts does not omit 000's. |
| Θ | At June 30, 2011, these securities were designated to cover written call options in the table below: |
| Unrealized | |||||||||||||||||||||||
| Exercise Price/ | Expiration | Number of | Market | Premiums | Appreciation | ||||||||||||||||||
| Issuer | Option Type | Rate | Date | Contracts* | Value ╪ | Received | (Depreciation) | ||||||||||||||||
| MXN/JPY | Foreign Currency | $ | 6.05 | 03/26/2012 | 56,454,712 | $ | 1,520 | $ | 2,519 | $ | 999 | ||||||||||||
| USD/EUR | Foreign Currency | $ | 1.44 | 07/05/2011 | 96,435,511 | 408 | 436 | 28 | |||||||||||||||
| $ | 1,928 | $ | 2,955 | $ | 1,027 | ||||||||||||||||||
| * | The number of contracts does not omit 000's. |
| Ø | Securities valued at $5,979 collateralized the written put options in the table below. |
| Unrealized | |||||||||||||||||||||||
| Exercise Price/ | Expiration | Number of | Market | Premiums | Appreciation | ||||||||||||||||||
| Issuer | Option Type | Rate | Date | Contracts* | Value ╪ | Received | (Depreciation) | ||||||||||||||||
| 90 Day Euro Future | Interest Rate | $ | 99.00 | 09/20/2011 | 3,022 | $ | 113 | $ | 143 | $ | 30 | ||||||||||||
Credit Default Swaption CDX.NA.IG.16 | Credit | 1.20 | % | 07/21/2011 | 203,515,000 | 43 | 214 | 171 | |||||||||||||||
| Europe Senior Financials | Credit | $ | 2.20 | 09/22/2011 | 98,436,730 | 349 | 679 | 330 | |||||||||||||||
| MXN/CHF | Foreign Currency | 14.10 (MXN/CHF) | 01/05/2012 | 56,735,058 | 2,522 | 2,046 | (476 | ) | |||||||||||||||
| MXN/CHF | Foreign Currency | 14.49 (MXN/CHF) | 03/15/2012 | 56,735,058 | 2,567 | 2,141 | (426 | ) | |||||||||||||||
| USD/EUR Binary | Foreign Currency | 1.60 (USD/EUR) | 12/02/2011 | 109,109,893 | 385 | 601 | 216 | ||||||||||||||||
| $ | 5,979 | $ | 5,824 | $ | (155 | ) | |||||||||||||||||
| * | The number of contracts does not omit 000's. |
The accompanying notes are an integral part of these financial statements.
| ⌂ | The following securities are considered illiquid. Illiquid securities are often purchased in private placement transactions, are often not registered under the Securities Act of 1933 and may have contractual restrictions on resale. A security may also be considered illiquid if the security lacks a readily available market or if its valuation has not changed for a certain period of time. |
| Period Acquired | Shares/ Par | Security | Cost Basis | ||||||
| 04/2003 | $ | 75 | Americo Life, Inc., 7.88%, 05/01/2013 - 144A | $ | 74 | ||||
| 12/2004 | $ | 35,341 | Bear Stearns Commercial Mortgage Securities, Inc., 0.61%, 11/11/2041 | 294 | |||||
| 10/2004 | $ | 41,639 | Bear Stearns Commercial Mortgage Securities, Inc., 0.80%, 07/11/2042 | 385 | |||||
| 08/2007 | $ | 25,765 | Countrywide Home Loans, Inc., 6.00%, 10/25/2037 | 25,298 | |||||
| 11/2010 - 05/2011 | $ | 4,635 | Easton-Bell Sports, Inc., 11.50%, 12/31/2015 | 4,584 | |||||
| 03/2007 | $ | 1,675 | JP Morgan Automotive Receivable Trust, 12.85%, 03/15/2012 | 1,675 | |||||
| 01/2011 | $ | 1,758 | Macquarie Aircraft Leasing Finance S.A., Second Lien Term Loan, 4.19%, 11/29/2013 | 1,579 | |||||
| 11/2004 | $ | 32,617 | Merrill Lynch Mortgage Trust, 0.74%, 10/12/2041 - 144A | 216 | |||||
| 10/2005 - 08/2006 | $ | 15,286 | Morgan Stanley Dean Witter Capital I, 0.01%, 08/25/2032 - Reg D | 321 | |||||
| 04/2007 | $ | 211 | Nationstar Home Equity Loan Trust, 0.00%, 03/25/2037 - 144A | 211 | |||||
| 06/2009 | $ | 2,232 | Residential Funding Mortgage Securities, Inc., 6.00%, 07/25/2037 | 1,641 | |||||
| 03/2008 | $ | 9,509 | Wells Fargo Alternative Loan Trust, 6.25%, 11/25/2037 | 7,712 | |||||
The aggregate value of these securities at June 30, 2011, was $41,727, which represents 0.91% of total net assets.
Foreign Currency Contracts Outstanding at June 30, 2011
| Unrealized | |||||||||||||||||
| Contract | Appreciation/ | ||||||||||||||||
| Description | Counterparty | Buy / Sell | Market Value ╪ | Amount | Delivery Date | (Depreciation) | |||||||||||
| Australian Dollar | JP Morgan Securities | Sell | $ | 46,945 | $ | 45,947 | 07/05/2011 | $ | (998 | ) | |||||||
| Australian Dollar | Morgan Stanley | Buy | 46,945 | 46,472 | 07/05/2011 | 473 | |||||||||||
| British Pound | Deutsche Bank Securities | Sell | 46,528 | 46,425 | 07/19/2011 | (103 | ) | ||||||||||
| British Pound | Wells Fargo | Buy | 93,038 | 92,973 | 07/29/2011 | 65 | |||||||||||
| British Pound | Wells Fargo | Sell | 93,038 | 92,720 | 07/29/2011 | (318 | ) | ||||||||||
| Canadian Dollar | Wells Fargo | Buy | 46,020 | 46,020 | 07/19/2011 | – | |||||||||||
| Euro | Citigroup Global Markets | Buy | 92,067 | 91,157 | 07/06/2011 | 910 | |||||||||||
| Euro | Deutsche Bank Securities | Sell | 46,388 | 45,516 | 07/11/2011 | (872 | ) | ||||||||||
| Euro | JP Morgan Securities | Buy | 394 | 394 | 07/05/2011 | – | |||||||||||
| Euro | Morgan Stanley | Sell | 46,034 | 45,113 | 07/06/2011 | (921 | ) | ||||||||||
| Euro | Wells Fargo | Sell | 46,034 | 45,263 | 07/06/2011 | (771 | ) | ||||||||||
| Euro | Wells Fargo | Sell | 46,087 | 46,020 | 07/19/2011 | (67 | ) | ||||||||||
| Euro | Wells Fargo | Buy | 46,389 | 45,943 | 07/11/2011 | 446 | |||||||||||
| Japanese Yen | Goldman Sachs | Sell | 47,503 | 47,254 | 07/15/2011 | (249 | ) | ||||||||||
| Mexican New Peso | Morgan Stanley | Buy | 47,789 | 46,971 | 07/20/2011 | 818 | |||||||||||
| Mexican New Peso | Morgan Stanley | Sell | 47,789 | 46,500 | 07/20/2011 | (1,289 | ) | ||||||||||
| Singapore Dollar | Goldman Sachs | Buy | 47,630 | 47,255 | 07/15/2011 | 375 | |||||||||||
| $ | (2,501 | ) | |||||||||||||||
The accompanying notes are an integral part of these financial statements.
| Hartford Total Return Bond HLS Fund |
| Schedule of Investments – (continued) |
| June 30, 2011 (Unaudited) |
| (000’s Omitted) |
Credit Default Swap Contracts Outstanding at June 30, 2011
| (Pay)/Receive Fixed | Unrealized | |||||||||||||||||||||||
| Notional | Buy/Sell | Rate / Implied | Expiration | Market | Appreciation/ | |||||||||||||||||||
| Reference Entity | Counterparty | Amount (a) | Protection | Credit Spread (b) | Date | Cost | Value ╪ | (Depreciation) | ||||||||||||||||
| CDX North American Investment Grade Index | Morgan Stanley | $ | 90,385 | Buy | 1.00 | % | 12/20/15 | $ | (953 | ) | $ | (815 | ) | $ | 138 | |||||||||
| (a) | The maximum potential amount the Fund could be required to pay as a seller of credit protection or receive as a buyer of credit protection if a credit event occurs as defined under the terms of that particular swap agreement. |
| (b) | Implied credit spreads, represented in absolute terms, utilized in determining the market value of credit default swap agreements on corporate issues, U.S. municipal issues or sovereign issues of an emerging country as of period end serve as an indicator of the current status of the payment/performance risk and represent the likelihood or risk of default for the credit derivative. The implied credit spread of a particular referenced entity reflects the cost of buying/selling protection and may include upfront payments required to be made to enter into the agreement. Wider credit spreads represent a deterioration of the referenced entity’s credit soundness and a greater likelihood or risk of default or other credit event occurring as defined under the terms of the agreement The percentage shown is the implied credit spread on June 30, 2011. |
IDA – Industrial Development Authority Bond
| ╪ | See Significant Accounting Policies of accompanying Notes to Financial Statements regarding valuation of securities. |
The accompanying notes are an integral part of these financial statements.
| Investment Valuation Hierarchy Level Summary |
| June 30, 2011 (Unaudited) |
| (000’s Omitted) |
| Total | Level 1 ♦ | Level 2 ♦ | Level 3 | |||||||||||||
| Assets: | ||||||||||||||||
| Asset & Commercial Mortgage Backed Securities | $ | 313,585 | $ | – | $ | 291,930 | $ | 21,655 | ||||||||
| Call Options Purchased | 1,208 | – | 1,208 | – | ||||||||||||
| Common Stocks ‡ | – | – | – | – | ||||||||||||
| Corporate Bonds: Investment Grade | 1,269,099 | – | 1,257,992 | 11,107 | ||||||||||||
| Corporate Bonds: Non-Investment Grade | 338,558 | – | 337,633 | 925 | ||||||||||||
| Municipal Bonds | 68,090 | – | 68,090 | – | ||||||||||||
| Preferred Stocks | 7,984 | 4,682 | 3,302 | – | ||||||||||||
| Put Options Purchased | 4,220 | 227 | 3,993 | – | ||||||||||||
| Senior Floating Rate Interests: Non-Investment Grade | 34,030 | – | 34,030 | – | ||||||||||||
| U.S. Government Agencies | 1,644,268 | – | 1,644,268 | – | ||||||||||||
| U.S. Government Securities | 822,318 | 45,572 | 776,746 | – | ||||||||||||
| Short-Term Investments | 188,510 | 531 | 187,979 | – | ||||||||||||
| Total | $ | 4,691,870 | $ | 51,012 | $ | 4,607,171 | $ | 33,687 | ||||||||
| Credit Default Swaps * | 138 | – | 138 | – | ||||||||||||
| Foreign Currency Contracts * | 3,087 | – | 3,087 | – | ||||||||||||
| Futures * | 1,081 | 1,081 | – | – | ||||||||||||
| Written Options * | 1,774 | 30 | 1,744 | – | ||||||||||||
| Total | $ | 6,080 | $ | 1,111 | $ | 4,969 | $ | – | ||||||||
| Liabilities: | ||||||||||||||||
| Foreign Currency Contracts * | 5,588 | – | 5,588 | – | ||||||||||||
| Futures * | 525 | 525 | – | – | ||||||||||||
| Written Options * | 902 | – | 902 | – | ||||||||||||
| Total | $ | 7,015 | $ | 525 | $ | 6,490 | $ | – | ||||||||
| ♦ | For the six-month period ended June 30, 2011, there were no significant transfers between Level 1 and Level 2. |
| ‡ | The Fund has all or primarily all of the equity securities categorized in a particular level. Refer to the Schedule of Investments for further industry breakout. |
| * | Derivative instruments not reflected in the Schedule of Investments are valued at the unrealized appreciation/depreciation on the investments. |
Following is a reconciliation of Level 3 assets for which significant unobservable inputs were used to determine fair value:
| Balance as | Change in | |||||||||||||||||||||||||||||||||||
| of | Realized | Unrealized | Transfers | Transfers | Balance as | |||||||||||||||||||||||||||||||
| December | Gain | Appreciation | Net | Into | Out of | of June | ||||||||||||||||||||||||||||||
| 31, 2010 | (Loss) | (Depreciation) | Amortization | Purchases | Sales | Level 3 * | Level 3* | 30, 2011 | ||||||||||||||||||||||||||||
| Assets: | ||||||||||||||||||||||||||||||||||||
| Asset & Commercial Mortgage Backed Securities | $ | 32,960 | $ | 7,916 | $ | (3,814 | )† | $ | 207 | $ | 5,768 | $ | (28,009 | ) | $ | 8,355 | $ | (1,728 | ) | $ | 21,655 | |||||||||||||||
| Corporate Bonds | 11,035 | — | 104 | ‡ | (33 | ) | 926 | — | — | — | 12,032 | |||||||||||||||||||||||||
| Total | $ | 43,995 | $ | 7,916 | $ | (3,710 | ) | $ | 174 | $ | 6,694 | $ | (28,009 | ) | $ | 8,355 | $ | (1,728 | ) | $ | 33,687 | |||||||||||||||
| * | Securities are transferred into and out of Level 3 for a variety of reasons including, but not limited to: |
1) Securities where trading has been halted (transfer into Level 3) or securities where trading has resumed (transfer out of Level 3).
2) Broker quoted securities (transfer into Level 3) or quoted prices in active markets (transfer out of Level 3).
3) Securities that have certain restrictions on trading (transfer into Level 3) or securities where trading restrictions have expired (transfer out of Level 3).
| † | Change in unrealized appreciation or depreciation in the current period relating to assets still held at June 30, 2011 was $4,503. |
| ‡ | Change in unrealized appreciation or depreciation in the current period relating to assets still held at June 30, 2011 was $104. |
The accompanying notes are an integral part of these financial statements.
| Statement of Assets and Liabilities |
| June 30, 2011 (Unaudited) |
| (000’s Omitted) |
| Assets: | ||||
| Investments in securities, at market value (cost $4,584,731) | $ | 4,691,870 | ||
| Cash | 8 | |||
| Foreign currency on deposit with custodian (cost $1,741) | 1,755 | |||
| Unrealized appreciation on foreign currency contracts | 3,087 | |||
| Unrealized appreciation on swap contracts | 138 | |||
| Receivables: | ||||
| Investment securities sold | 75,013 | |||
| Fund shares sold | 3,125 | |||
| Dividends and interest | 36,962 | |||
| Variation margin | 454 | |||
| Total assets | 4,812,412 | |||
| Liabilities: | ||||
| Unrealized depreciation on foreign currency contracts | 5,588 | |||
| Payables: | ||||
| Investment securities purchased | 177,429 | |||
| Fund shares redeemed | 14,289 | |||
| Variation margin | 470 | |||
| Investment management fees | 351 | |||
| Distribution fees | 28 | |||
| Accrued expenses | 316 | |||
| Swap premiums received | 953 | |||
| Written options (proceeds $8,779) | 7,907 | |||
| Total liabilities | 207,331 | |||
| Net assets | $ | 4,605,081 | ||
| Summary of Net Assets: | ||||
| Capital stock and paid-in-capital | $ | 4,614,210 | ||
| Accumulated undistributed net investment income | 98,276 | |||
| Accumulated net realized loss on investments and foreign currency transactions | (213,625 | ) | ||
| Unrealized appreciation of investments and the translations of assets and liabilities denominated in foreign currency | 106,220 | |||
| Net assets | $ | 4,605,081 | ||
| Shares authorized | 5,000,000 | |||
| Par value | $ | 0.001 | ||
Class IA: Net asset value per share | $ | 11.20 | ||
| Shares outstanding | 351,445 | |||
| Net assets | $ | 3,934,943 | ||
Class IB: Net asset value per share | $ | 11.13 | ||
| Shares outstanding | 60,212 | |||
| Net assets | $ | 670,138 | ||
The accompanying notes are an integral part of these financial statements.
| Statement of Operations |
| For the Six-Month Period Ended June 30, 2011 (Unaudited) |
| (000’s Omitted) |
| Investment Income: | ||||
| Dividends | $ | 226 | ||
| Interest | 100,800 | |||
| Total investment income, net | 101,026 | |||
| Expenses: | ||||
| Investment management fees | 10,723 | |||
| Transfer agent fees | 2 | |||
| Distribution fees - Class IB | 862 | |||
| Custodian fees | 10 | |||
| Accounting services fees | 420 | |||
| Board of Directors' fees | 50 | |||
| Audit fees | 33 | |||
| Other expenses | 353 | |||
| Total expenses (before fees paid indirectly) | 12,453 | |||
| Custodian fee offset | — | |||
| Total fees paid indirectly | — | |||
| Total expenses, net | 12,453 | |||
| Net investment income | 88,573 | |||
| Net Realized Gain on Investments, Other Financial Instruments and Foreign Currency Transactions: | ||||
| Net realized gain on investments | 69,197 | |||
| Net realized loss on futures | (3,905 | ) | ||
| Net realized gain on written options | 1,935 | |||
| Net realized gain on swap contracts | 2,936 | |||
| Net realized loss on foreign currency contracts | (10,418 | ) | ||
| Net realized gain on other foreign currency transactions | 997 | |||
| Net Realized Gain on Investments, Other Financial Instruments and Foreign Currency Transactions | 60,742 | |||
| Net Changes in Unrealized Depreciation of Investments, Other Financial Instruments and Foreign Currency Transactions: | ||||
| Net unrealized depreciation of investments | (21,031 | ) | ||
| Net unrealized depreciation of futures | (1,451 | ) | ||
| Net unrealized appreciation of written options | 900 | |||
| Net unrealized appreciation of swap contracts | 138 | |||
| Net unrealized depreciation of foreign currency contracts | (1,102 | ) | ||
| Net unrealized depreciation on translation of other assets and liabilities in foreign currencies | (6 | ) | ||
| Net Changes in Unrealized Depreciation of Investments, Other Financial Instruments and Foreign Currency Transactions | (22,552 | ) | ||
| Net Gain on Investments, Other Financial Instruments and Foreign Currency Transactions | 38,190 | |||
| Net Increase in Net Assets Resulting from Operations | $ | 126,763 | ||
The accompanying notes are an integral part of these financial statements.
| Statement of Changes in Net Assets |
| (000’s Omitted) |
| For the | ||||||||
| Six-Month | For the | |||||||
| Period Ended | Year Ended | |||||||
| June 30, 2011 | December 31, | |||||||
| (Unaudited) | 2010 | |||||||
| Operations: | ||||||||
| Net investment income | $ | 88,573 | $ | 187,476 | ||||
| Net realized gain on investments, other financial instruments and foreign currency transactions | 60,742 | 111,753 | ||||||
| Net unrealized appreciation (depreciation) of investments, other financial instruments and foreign currency transactions | (22,552 | ) | 48,815 | |||||
| Net Increase In Net Assets Resulting From Operations | 126,763 | 348,044 | ||||||
| Distributions to Shareholders: | ||||||||
| From net investment income | ||||||||
| Class IA | — | (169,465 | ) | |||||
| Class IB | — | (29,035 | ) | |||||
| Total distributions | — | (198,500 | ) | |||||
| Capital Share Transactions: | ||||||||
| Class IA | ||||||||
| Sold | 261,919 | 638,697 | ||||||
| Issued on reinvestment of distributions | — | 169,465 | ||||||
| Redeemed | (462,318 | ) | (808,117 | ) | ||||
| Total capital share transactions | (200,399 | ) | 45 | |||||
| Class IB | ||||||||
| Sold | 51,038 | 122,194 | ||||||
| Issued on reinvestment of distributions | — | 29,035 | ||||||
| Redeemed | (121,221 | ) | (244,416 | ) | ||||
| Total capital share transactions | (70,183 | ) | (93,187 | ) | ||||
| Net decrease from capital share transactions | (270,582 | ) | (93,142 | ) | ||||
| Net Increase (Decrease) In Net Assets | (143,819 | ) | 56,402 | |||||
| Net Assets: | ||||||||
| Beginning of period | 4,748,900 | 4,692,498 | ||||||
| End of period | $ | 4,605,081 | $ | 4,748,900 | ||||
| Accumulated undistributed (distribution in excess of) net investment income | $ | 98,276 | $ | 9,703 | ||||
| Shares: | ||||||||
| Class IA | ||||||||
| Sold | 23,710 | 57,674 | ||||||
| Issued on reinvestment of distributions | — | 15,563 | ||||||
| Redeemed | (41,815 | ) | (72,705 | ) | ||||
| Total share activity | (18,105 | ) | 532 | |||||
| Class IB | ||||||||
| Sold | 4,634 | 11,115 | ||||||
| Issued on reinvestment of distributions | — | 2,678 | ||||||
| Redeemed | (11,029 | ) | (22,189 | ) | ||||
| Total share activity | (6,395 | ) | (8,396 | ) | ||||
The accompanying notes are an integral part of these financial statements.
| Notes to Financial Statements |
| June 30, 2011 (Unaudited) |
| (000’s Omitted) |
| 1. | Organization: |
Hartford Total Return Bond HLS Fund (the “Fund”) serves as an underlying investment option for certain variable annuity and variable life insurance separate accounts of Hartford Life Insurance Company (“HLIC”) and its affiliates and certain qualified retirement plans. The Fund may also serve as an underlying investment option for certain variable annuity and variable life separate accounts of other insurance companies. Owners of variable annuity contracts and policyholders of variable life insurance contracts may choose the funds permitted in the variable insurance contract prospectus. In addition, participants in certain qualified retirement plans may choose the Fund if permitted by their plans.
Hartford Series Fund, Inc. (the “Company”) is an open-end registered management investment company comprised of thirty portfolios. Financial Statements for the Fund, a series of the Company, are included in this report.
The Company is organized under the laws of the State of Maryland and is registered with the Securities and Exchange Commission (“SEC”) under the Investment Company Act of 1940, as amended (“1940 Act”). The Fund is a diversified open-end management investment company.
The Fund is divided into Class IA and Class IB shares. Each class is offered at the per share net asset value (“NAV”) without a sales charge and is subject to the same expenses, except that the Class IB shares are subject to distribution and service fees charged pursuant to a Distribution Plan adopted in accordance with Rule 12b-1 under the 1940 Act.
| 2. | Significant Accounting Policies: |
The following is a summary of significant accounting policies of the Fund in the preparation of its financial statements, which are in accordance with the United States Generally Accepted Accounting Principles (“U.S. GAAP”). The preparation of financial statements in accordance with U.S. GAAP may require management to make estimates and assumptions that affect the reported amounts of assets and liabilities and disclosure of contingent assets and liabilities at the date of the financial statements and the reported amounts of increases and decreases in net assets from operations during the reporting period. Actual results could differ from those estimates.
| a) | Determination of Net Asset Value – The NAV of each class of the Fund's shares is determined as of the close of regular trading (normally 4:00 p.m. Eastern Time) (the “NYSE Close”) on each day that the New York Stock Exchange (the “Exchange”) is open (“Valuation Date”). Information that becomes known to the Fund after the NAV has been calculated on a particular day will not generally be used to retroactively adjust the NAV determined earlier that day. |
| b) | Investment Valuation and Fair Value Measurements – For purposes of calculating the NAV, portfolio securities and other assets held by the Fund's portfolio for which market quotes are readily available are valued at market value. Market value is generally determined on the basis of last reported sales prices or official close price. If no sales are reported, market value is based on quotes obtained from a quotation reporting system, established market makers, or independent pricing services. If market prices are not readily available or are deemed unreliable, the Fund will use the fair value of the security as determined in good faith under policies and procedures established by and under the supervision of the Company's Board of Directors. Market quotes are considered not readily available where there is an absence of current or reliable market-based data (e.g., trade information or broker quotes), including where events occur after the close of the relevant market, but prior to the NYSE Close that materially affect the values of the Fund's portfolio securities or assets. In addition, market quotes are considered not readily available when, due to extraordinary circumstances, the exchanges or markets on which the securities trade, do not open for trading for the entire day and no other market prices are available. In addition, prices of foreign equities that are principally traded on certain foreign markets are adjusted daily pursuant to a fair value pricing service approved by the Board of Directors in order to reflect an adjustment for the factors occurring after the close of certain foreign markets but before the NYSE Close. Securities that are primarily traded on foreign markets may trade on days that are not business days of the Fund. The value of the foreign securities, in which the Fund invests, may change on days when a shareholder will not be able to purchase or redeem shares of the |
| Hartford Total Return Bond HLS Fund |
| Notes to Financial Statements – (continued) |
| June 30, 2011 (Unaudited) |
| (000’s Omitted) |
Fund. Fair value pricing is subjective in nature and the use of fair value pricing by the Fund may cause the NAV of its shares to differ significantly from the NAV that would have been calculated using market prices at the close of the exchange on which a portfolio security is primarily traded. There can be no assurance that the Fund could obtain the fair market value assigned to a security if the Fund were to sell the security at approximately the time at which the Fund determines its NAV.
Fixed income securities (other than short-term obligations) and non-exchange traded derivatives held by the Fund are normally valued on the basis of quotes obtained from brokers and dealers or independent pricing services in accordance with procedures established by the Company’s Fund’s Board of Directors. Prices obtained from independent pricing services use information provided by market makers or estimates of market values obtained from yield data relating to investments or securities with similar characteristics. Generally, the Fund may use fair valuation in regard to fixed income securities when the Fund holds defaulted or distressed securities or securities in a company in which a reorganization is pending. Short-term investments maturing in 60 days or less are generally valued at amortized cost, if their original term to maturity was 60 days or less, or by amortizing their value on the 61st day prior to maturity, if the original term to maturity exceeded 60 days.
Exchange traded options, futures and options on futures are valued at the settlement price determined by the relevant exchange as of the NYSE Close. If such instruments do not trade on an exchange, values may be supplied by an independent pricing service using a formula or other objective method that may take into consideration the style, direction, expiration, strike price, notional value and volatility or other adjustments.
Investments valued in currencies other than U.S. dollars are converted to U.S. dollars using exchange rates obtained from independent pricing services for calculation of the NAV. As a result, the NAV of the Fund’s shares may be affected by changes in the value of currencies in relation to the U.S. dollar. The value of securities traded in markets outside the United States or denominated in currencies other than the U.S. dollar may be affected significantly on a day that the NYSE is closed and the market value may change on days when an investor is not able to purchase, redeem or exchange shares of the Fund.
Foreign currency contracts represent agreements to exchange currencies on specific future dates at predetermined rates. Foreign currency contracts are valued using foreign currency exchange rates and forward rates as provided by an independent pricing service on Valuation Date.
Investments in open-end mutual funds are valued at the respective NAV of each open-end mutual fund on the Valuation Date.
Financial instruments for which prices are not available from an independent pricing service may be valued using market quotations obtained from one or more dealers that make markets in the respective financial instrument in accordance with procedures established by the Company’s Board of Directors.
U.S. GAAP defines fair value as the price that the Fund would receive to sell an asset or pay to transfer a liability in an orderly transaction between market participants. The U.S. GAAP fair value measurement standards require disclosure of a fair value hierarchy for each major category of assets and liabilities. Various inputs are used in determining the fair value of the Fund’s investments. These inputs are summarized into three broad hierarchy levels. This hierarchy is based on whether the valuation inputs are observable or unobservable. These levels are:
| · | Level 1 – Quoted prices in active markets for identical securities. Level 1 may include exchange-traded instruments such as domestic equities, some foreign equities, options, futures, mutual funds, exchange-traded funds, rights and warrants. |
| · | Level 2 – Observable inputs other than Level 1 prices, such as quoted prices for similar securities; quoted prices in markets that are not active; or other inputs that are observable or can be corroborated by observable market |
data. Level 2 may include debt securities that are traded less frequently than exchange-traded instruments and which are valued using third party pricing services; foreign equities, whose value is determined using a multi-factor regression model with inputs that are observable in the market; and short-term securities, which are valued at amortized cost.
| · | Level 3 – Significant unobservable inputs that are supported by limited or no market activity. Level 3 may include financial instruments whose values are determined using broker quotes or require significant management judgment or estimation. These unobservable valuation inputs may include estimates for current yields, maturity/duration, prepayment speed, and broker quotes for comparable securities along with other assumptions relating to credit quality, collateral value, complexity of the security structure, general market conditions and liquidity. This category may include securities where trading has been halted or there are certain restrictions on trading. While these securities are priced using unobservable inputs, the valuation of these securities reflects the best available data and management believes the prices are a reasonable representation of exit price. |
Valuation levels are not necessarily indicative of the risk associated with investing in such securities. Individual securities within any of the above mentioned asset classes may be assigned a different hierarchical level than those presented above, as individual circumstances dictate.
For additional information, refer to the Investment Valuation Hierarchy Level Summary and the Level 3 roll forward reconciliation which follow the Schedule of Investments.
For purposes of reporting transfers between different hierarchy levels, both transfers in and out of each level, as applicable, are shown as if they occurred at the beginning of the period.
| c) | Security Transactions and Investment Income – Security transactions are recorded as of the trade date (the date the order to buy or sell is executed) for financial reporting purposes. Securities purchased or sold on a when-issued or delayed-delivery basis may be settled a month or more after the trade date. Realized gains and losses are determined on the basis of identified cost. |
Trade date for senior floating rate interests purchased in the primary loan market is considered the date on which the loan allocations are determined. Trade date for senior floating rate interests purchased in the secondary loan market is the date on which the transaction is entered into.
Dividend income is recorded on the ex-dividend date, except certain dividends from foreign securities where the ex-dividend date may have passed are recorded as soon as the Fund is informed of the dividend. Interest income, including amortization of premium and accretion of discounts, is accrued on a daily basis. Paydown gains and losses on mortgage-related and other asset-backed securities are included in interest income on the Statement of Operations.
| d) | Foreign Currency Transactions – Assets and liabilities denominated in currencies other than U.S. dollars are translated into U.S. dollars at the exchange rates in effect on the valuation date. Purchases and sales of investment securities, income, and expenses are translated into U.S. dollars at the exchange rates on the dates of such transactions. |
The Fund does not isolate that portion of portfolio security valuation resulting from fluctuations in the foreign currency exchange rates from the fluctuations arising from changes in the market prices of securities held. Exchange rate fluctuations are included with the net realized and unrealized gain or loss on investments in the accompanying financial statements.
Net realized foreign exchange gains or losses arise from sales of foreign currencies and the difference between asset and liability amounts initially stated in foreign currencies and the U.S. dollar value of the amounts actually received or paid. Net unrealized foreign exchange gains or losses arise from changes in the value of other assets and liabilities at the end of the reporting period, resulting from changes in the exchange rates.
| Hartford Total Return Bond HLS Fund |
| Notes to Financial Statements – (continued) |
| June 30, 2011 (Unaudited) |
| (000’s Omitted) |
| e) | Joint Trading Account – The Fund may invest cash balances into a joint trading account that may be invested in one or more repurchase agreements. |
| f) | Fund Share Valuation and Dividend Distributions to Shareholders – Orders for the Fund’s shares are executed in accordance with the investment instructions of the contract holders and plan participants. The NAV of the Fund’s shares is determined as of the close of business on each business day of the Exchange. The NAV is determined separately for each class of shares of the Fund by dividing the Fund’s net assets attributable to that class by the number of shares of the class outstanding. Each class of shares offered by the Fund has equal rights as to assets and voting privileges (except that shareholders of a class have exclusive voting rights regarding any matter relating solely to that class of shares). Income and non-class specific expenses are allocated daily to each class on the basis of the relative net assets of the class. Realized and unrealized capital gains and losses of each class are allocated daily based on the relative net assets of each class of shares of the Fund. |
Orders for the purchase of the Fund’s shares received prior to the close of the Exchange on any day the Exchange is open for business are priced at the NAV determined as of the close of the Exchange. Orders received after the close of the Exchange, or on a day on which the Exchange and/or the Fund is not open for business, are priced at the next determined NAV.
Dividends are declared pursuant to a policy adopted by the Company’s Board of Directors based upon the investment performance of the Fund. The policy of the Fund is to pay dividends from net investment income and realized capital gains, if any, at least once a year.
Distributions from net investment income, net realized capital gains and capital are determined in accordance with federal income tax regulations, which may differ from U.S. GAAP with respect to character and timing. These differences may include but are not limited to losses deferred due to wash sale adjustments, foreign currency gains and losses, adjustments related to Passive Foreign Investment Companies (“PFICs”), Real Estate Investment Trusts (“REITs”), Regulated Investment Companies (“RICs”), certain derivatives and partnerships. Permanent book and federal income tax basis differences relating to shareholder distributions will result in reclassifications to certain of the Fund’s capital accounts (see Federal Income Taxes: Reclassification of Capital Accounts note).
| 3. | Securities and Other Investments: |
| a) | Repurchase Agreements – A repurchase agreement is an agreement by which a counterparty agrees to sell a security and agrees to repurchase the security sold at a mutually agreed upon time and price. At the time the Fund enters into a repurchase agreement, the value of the underlying collateral security(ies), including accrued interest, will be equal to or exceed the value of the repurchase agreement. Repurchase agreements expose the Fund to counterparty risk. To minimize counterparty risk, the securities that serve to collateralize the repurchase agreement are held by the Fund's custodian in book entry or physical form in the custodial account of the Fund or in a third party custodial account. Repurchase agreements are valued at cost plus accrued interest. The Fund, as shown on the Schedule of Investments, had outstanding repurchase agreements as of June 30, 2011. |
| b) | Illiquid and Restricted Securities – The Fund is permitted to invest up to 15% of its net assets in illiquid securities. Illiquid securities are those that may not be sold or disposed of in the ordinary course of business within seven days, at approximately the price used to determine the Fund’s NAV. The Fund may not be able to sell illiquid securities or other investments when its sub-adviser considers it desirable to do so or may have to sell such securities or investments at a price that is lower than the price that could be obtained if the securities or investments were more liquid. A sale of illiquid securities or other investments may require more time and may result in higher dealer discounts and other selling expenses than does the sale of those that are liquid. Illiquid securities and investments also may be more difficult to value, due to the unavailability of reliable market quotations for such securities or investments, and an investment in them may have an adverse impact on the Fund’s NAV. The Fund may also purchase certain restricted securities that can |
only be resold to certain qualified investors and may be determined to be liquid pursuant to policies and guidelines established by the Company’s Board of Directors. The Fund, as shown on the Schedule of Investments, had illiquid and/or restricted securities as of June 30, 2011.
| c) | Securities Purchased on a When-Issued or Delayed-Delivery Basis – Delivery and payment for securities that have been purchased by the Fund on a forward commitment, or when-issued or delayed-delivery basis, take place beyond the customary settlement period. During this period, such securities are subject to market fluctuations, and the Fund identifies securities segregated in its records with value at least equal to the amount of the commitment. The Fund, as shown on the Schedule of Investments, had when-issued or delayed delivery securities as of June 30, 2011. |
| d) | Senior Floating Rate Interests – The Fund, as shown on the Schedule of Investments, invests in senior floating rate interests. Senior floating rate interests hold the most senior position in the capital structure of a business entity (the “Borrower”), are typically secured by specific collateral and have a claim on the assets and/or stock of the Borrower that is senior to that held by subordinated debtholders and stockholders of the Borrower. Senior floating rate interests are typically structured and administered by a financial institution that acts as the agent of the lenders participating in the senior floating rate interest. The Fund may invest in multiple series or tranches of a senior floating rate interest, which may have varying terms and carry different associated risks. The Fund may also enter into unfunded loan commitments, which are contractual obligations for future funding. Unfunded loan commitments may include revolving credit facilities, which may obligate the Fund to supply additional cash to the borrower on demand. Unfunded loan commitments represent a future obligation in full. The Fund may receive a commitment fee based on the undrawn portion of the underlying line of credit portion of a senior floating rate interest. In certain circumstances, the Fund may receive various fees upon the restructure of a senior floating rate interest by a borrower. Fees earned/paid are recorded as a component of interest or capital gain in the Statement of Operations. |
Senior floating rate interests are typically rated below-investment-grade, which suggests they are more likely to default and generally pay higher interest rates than investment-grade loans. A default could lead to non-payment of income, which would result in a reduction of income to the Fund and there can be no assurance that the liquidation of any collateral would satisfy the Borrower’s obligation in the event of non-payment of scheduled interest or principal payments, or that such collateral could be readily liquidated.
| e) | Mortgage Related and Other Asset Backed Securities – The Fund may invest in mortgage related and other asset backed securities. These securities include mortgage pass-through securities, collateralized mortgage obligations, commercial mortgage backed securities, stripped mortgage backed securities, asset backed securities, collateralized debt obligations and other securities that directly or indirectly represent a participation in, or are secured by and payable from, mortgage loans on real property. Mortgage related securities are created from pools of residential or commercial mortgage loans, including mortgage loans made by savings and loan institutions, mortgage bankers, commercial banks and others. Asset backed securities are created from many types of assets, including auto loans, credit card receivables, home equity loans, and student loans. These securities provide a monthly payment which consists of both interest and principal payments. Interest payments may be determined by fixed or adjustable rates. The rate of pre-payments on underlying mortgages will affect the price and volatility of a mortgage related security, and may have the effect of shortening or extending the effective duration of the security relative to what was anticipated at the time of purchase. The timely payment of principal and interest of certain mortgage-related securities is guaranteed by the full faith and credit of the United States Government. Pools created and guaranteed by non-governmental issuers, including government-sponsored corporations, may be supported by various forms of insurance or guarantees, but there can be no assurance that the private insurers or guarantors can meet their obligations under the insurance policies or guarantee arrangements. |
| Hartford Total Return Bond HLS Fund |
| Notes to Financial Statements – (continued) |
| June 30, 2011 (Unaudited) |
| (000’s Omitted) |
| 4. | Financial Derivative Instruments: |
The following disclosures contain information on how and why the Fund uses derivative instruments, the credit-risk-related contingent features in certain derivative instruments, and how derivative instruments affect the Fund’s financial position, results of operations and cash flows. The location and fair value amounts of these instruments on the Statement of Assets and Liabilities and the realized gains and losses and changes in unrealized gains and losses on the Statement of Operations, each categorized by type of derivative contract, are included in the following Additional Derivative Instrument Information footnote. The derivative instruments outstanding as of period-end are disclosed in the Notes to the Schedule of Investments and the amounts of realized gains and losses and changes in unrealized gains and losses on derivative instruments during the period are disclosed in the Statement of Operations.
| a) | Foreign Currency Contracts – The Fund may enter into foreign currency contracts that obligate the Fund to purchase or sell currencies at specified future dates. Foreign currency contracts are used to hedge the currency exposure associated with some or all of the Fund's securities and/or as part of an investment strategy. Foreign currency contracts are marked to market daily and the change in value is recorded by the Fund as an unrealized gain or loss. Realized gains or losses equal to the difference between the value of the contract at the time it was opened and the value at the time it was closed are recorded upon delivery or receipt of the currency. |
Foreign currency contracts involve elements of market risk in excess of the amounts reflected in the Statement of Assets and Liabilities. In addition, risks may arise upon entering into these contracts from the potential inability of the counterparties to meet the terms of the contracts and from unanticipated movements in the value of the foreign currencies relative to the U.S. dollar. The Fund had outstanding foreign currency contracts as shown on the Schedule of Investments as of June 30, 2011.
| b) | Futures Contracts – The Fund may enter into futures contracts. A futures contract is an agreement between two parties to buy or sell an asset at a set price on a future date. The Fund uses futures contracts to manage or obtain exposure to the securities markets, commodities, or movements in interest rates and currency values. The primary risks associated with the use of futures contracts are the imperfect correlation between the change in market value of the securities held by the Fund and the prices of futures contracts and the possibility of an illiquid market. Upon entering into a futures contract, the Fund is required to deposit with a futures commission merchant (“FCM”), an amount of cash or U.S. Government or Agency Obligations in accordance with the initial margin requirements of the broker or exchange. Futures contracts are marked to market daily at the most recent settlement price reported by an exchange on which, over time, they are traded most extensively, and an appropriate payable or receivable for the change in value (“variation margin”) is recorded by the Fund. Gains or losses are recognized but not considered realized until the contracts expire or are closed. Futures contracts involve, to varying degrees, risk of loss in excess of the variation margin disclosed on the Statement of Assets and Liabilities, however, this risk is reduced through the use of an FCM. The Fund, as shown on the Schedule of Investments, had outstanding futures contracts as of June 30, 2011. |
| c) | Options Contracts – An option contract is a contract sold by one party to another party that offers the buyer the right, but not the obligation, to buy (call) or sell (put) a security or other financial asset at an agreed-upon price during a specific period of time or on a specific date. The Fund may write (sell) covered call and put options on futures, swaps (“swaptions”), securities, commodities or currencies. “Covered” means that so long as the Fund is obligated as the writer of an option, it will own either the underlying securities or currency or an option to purchase the same underlying securities or currency having an expiration date of the covered option and an exercise price equal to or less than the exercise price of the covered option, or will pledge cash or other liquid securities having a value equal to or greater than the fluctuating market value of the option security or currency. Writing put options increases the Fund’s exposure to the underlying instrument. Writing call options decreases the Fund’s exposure to the underlying instrument. Premiums received from writing options that expire are treated as realized gains. Premiums received from writing options that are exercised or closed are added to the proceeds or offset against amounts paid on the underlying futures, swap, security or currency transaction to determine the realized gain or loss. The Fund as a writer of an option has no control over whether the underlying instrument may be sold (call) or purchased (put) and as a result bears the market risk of an unfavorable |
change in the price of the instrument underlying the written option. There is the risk the Fund may not be able to enter into a closing transaction because of an illiquid market. The Fund may also purchase put and call options. Purchasing call options increases the Fund’s exposure to the underlying instrument. Purchasing put options decreases the Fund’s exposure to the underlying instrument. A Fund pays a premium, which is included on the Fund’s Statement of Assets and Liabilities as an investment and is subsequently marked to market to reflect the current value of the option. Premiums paid for purchasing options that expire are treated as realized losses. Certain options may be purchased with premiums to be determined on a future date. The premiums for these options are based upon implied volatility parameters at specified terms. The risk associated with purchasing put and call options is generally limited to the premium paid. Premiums paid for purchasing options that are exercised or closed are added to the amounts paid or offset against the proceeds on the underlying investment transaction to determine the realized gain or loss. The Fund, as shown on the Schedule of Investments, had outstanding purchased options contracts as of June 30, 2011. Transactions involving written options contracts during the six-month period ended June 30, 2011, are summarized below:
| Options Contract Activity During the | ||||||||
| Six-month Period Ended June 30, 2011 | ||||||||
| Call Options Written During the Period | Number of Contracts* | Premium Amounts | ||||||
| Beginning of the period | — | $ | — | |||||
| Written | 333,996,734 | 3,901 | ||||||
| Expired | (181,105,000 | ) | (313 | ) | ||||
| Closed | (1,511 | ) | (633 | ) | ||||
| Exercised | — | — | ||||||
| End of period | 152,890,223 | $ | 2,955 | |||||
| Put Options Written During the Period | Number of Contracts* | Premium Amounts | ||||||
| Beginning of the period | 4,409,819 | 418 | ||||||
| Written | 982,811,207 | 8,146 | ||||||
| Expired | (359,839,716 | ) | (1,643 | ) | ||||
| Closed | (102,846,549 | ) | (1,097 | ) | ||||
| Exercised | — | — | ||||||
| End of period | 524,534,761 | 5,824 | ||||||
* The number of contracts does not omit 000's.
| d) | Swap Agreements – The Fund may invest in swap agreements. Swap agreements are privately negotiated agreements between the Fund and a counterparty to exchange or swap investment cash flows, assets, foreign currencies or market-linked returns at specified future intervals. The Fund enters into credit default, total return, cross-currency, interest rate, inflation and other forms of swap agreements to manage its exposure to credit, currency, interest rate, commodity and inflation risk. Swap agreements are also used to gain exposure to certain markets. In connection with these agreements, securities or cash may be identified as collateral in accordance with the terms of the respective swap agreements to provide assets of value and recourse in the event of default or bankruptcy/insolvency. Swaps are valued based on custom valuations furnished by an independent pricing service. Swaps for which prices are not available from an independent pricing service are valued in accordance with procedures established by the Company's Board of Directors, and the change in value, if any, is recorded as an unrealized gain or loss on the Statement of Asset and Liabilities. Payments received or made at the beginning of the measurement period are reflected as such on the Statement of Assets and Liabilities and represent payments made or received upon entering into the swap agreement to compensate for differences between the stated terms of the swap agreement and prevailing market conditions (credit spreads, currency exchange rates, interest rates, and other relevant factors). These upfront payments are recorded as realized gains or losses on the Statement of Operations upon termination or maturity of the swap. A liquidation payment received or made at the termination of the swap and some net periodic payments received or paid by the Fund are recorded as realized gains or losses on the Statement of Operations. Net periodic payments received or paid by the Fund with regard to interest rate swaps are recorded as increases or decreases to income on the Statement of Operations. Entering into these agreements involves, to varying degrees, elements of credit, market and documentation risk in excess of the amounts recognized on the Statement of Assets and Liabilities. Such risks involve the possibility that there will be no liquid market for these agreements, that the counterparty to the agreements may default on its obligation to perform or disagree as to the |
| Hartford Total Return Bond HLS Fund |
| Notes to Financial Statements – (continued) |
| June 30, 2011 (Unaudited) |
| (000’s Omitted) |
meaning of contractual terms in the agreements and that there may be unfavorable changes in interest rates. The Fund’s maximum risk of loss from counterparty credit risk is the discounted net value of the cash flows to be received from the counterparty over the contract’s remaining life, to the extent that amount is positive. The risk is mitigated by having a master netting arrangement between the Fund and the counterparty, which allows for the netting of payments made or received (although such amounts are presented on a gross basis within the Statement of Assets and Liabilities, as applicable) as well as the posting of collateral to the Fund to cover the Fund’s exposure to the counterparty.
Credit Default Swap Agreements – The credit default swap market allows the Fund to manage its exposure to the market or certain sectors of the market, to reduce its risk exposure to defaults of corporate and sovereign issuers, or to create exposure to corporate or sovereign issuers to which it is not otherwise exposed. Certain credit default swaps involve the exchange of a fixed rate premium for protection against the loss in value of an underlying security in the event of a credit event, such as payment default or bankruptcy.
Under a credit default swap contract, one party acts as guarantor by receiving the fixed periodic payment in exchange for the commitment to purchase the underlying security at par if the defined credit event occurs. Upon the occurrence of a defined credit event, the difference between the value of the reference obligation and the swap’s notional amount is recorded as realized gain or loss on swap transactions in the Statement of Operations. A “buyer” of credit protection agrees to pay a counterparty to assume the credit risk of an issuer upon the occurrence of certain events. The “seller” of the protection receives periodic payments and agrees to assume the credit risk of an issuer upon the occurrence of certain events. Although specified events are contract specific, credit events are generally defined as bankruptcy, failure to pay, restructuring, obligation acceleration, obligation default, or repudiation/moratorium. A “seller’s” exposure is limited to the total notional amount of the credit default swap contract. These potential amounts would be partially offset by any recovery values of the respective referenced obligations or upfront payments received upon entering into the contract. The Fund will generally not buy protection on issuers that are not currently held by the Fund.
Implied credit spreads, represented in absolute terms, utilized in determining the market value of credit default swap contracts on corporate issues, sovereign issues of an emerging country or U.S. municipal issues as of period end are disclosed in the notes to the Schedule of Investments, as applicable, and serve as an indicator of the current status of the payment/performance risk and represent the likelihood or risk of default for the credit derivative. The implied credit spread of a particular referenced entity reflects the cost of buying/selling protection and may include upfront payments required to be made to enter into the contract. Wider credit spreads represent a deterioration of the referenced entity’s soundness and a greater likelihood or risk of default or other credit event occurring as defined under the terms of the contract. For credit default swap contracts on asset-backed securities and credit indices, the quoted market prices and resulting values serve as the indicator of the current status of the payment/performance risk. Increasing market values, in absolute terms when compared to the notional amount of the swap, represent a deterioration of the referenced equity’s credit soundness and a greater likelihood or risk of default or other credit event occurring as defined under the terms of the contract. The Fund, as shown on the Schedule of Investments, had outstanding credit default swaps as of June 30, 2011.
Interest Rate Swap Agreements – The Fund is subject to interest rate risk in the normal course of pursuing its investment objectives. Because the Fund holds fixed rate bonds, the value of these bonds may decrease if interest rates rise. To help hedge against this risk and to maintain its ability to generate income at prevailing market rates, the Fund may enter into interest rate swap agreements. In a typical interest rate swap, one party agrees to make regular payments equal to a floating interest rate, based on a specified interest rate benchmark (e.g., London Interbank Offered Rate (“LIBOR”)) or index (e.g., U.S. Consumer Price Index), multiplied by a “notional principal amount”, in return for payments equal to a fixed rate multiplied by the same amount, for a specific period of time. The net interest received or paid on interest rate swap contracts is accrued daily as interest income/expense. Interest rate swaps are marked to market daily and the change, if any, is recorded as an unrealized gain or loss in the Statement of Operations. When the interest rate swap agreement is terminated early, the Fund records a realized gain or loss equal to the difference between the current realized value and the expected cash flows.
If an interest rate swap contract provides for payments in different currencies, the parties might agree to exchange the notional principal amount as well. Interest rate swaps may also depend on other prices or rates, such as the value of an index or mortgage prepayments rates. The risks of interest rate swaps include changes in market conditions which will affect the value of the contract or the cash flows and the possible inability of the counterparty to fulfill its obligations under the agreement. The Fund’s maximum risk of loss from counterparty credit risk is the discounted net value of the cash flows to be received from/paid to the counterparty over the agreement’s remaining life, to the extent that the amount is positive. This risk may be mitigated by having a master netting arrangement between the Fund and the counterparty (although such amounts are presented on a gross basis within the Statement of Assets and Liabilities, as applicable) or by posting collateral by the counterparty to the Fund to cover the Fund’s exposure to the counterparty. As of June 30, 2011, the Fund did not hold any interest swap agreements.
| e) | Additional Derivative Instrument Information: |
Fair Values of Derivative Instruments on the Statement of Assets and Liabilities as of June 30, 2011:
| Risk Exposure Category | ||||||||||||||||||||||||||||
| Foreign | ||||||||||||||||||||||||||||
| Interest Rate | Exchange | Credit | Equity | Commodity | Other | |||||||||||||||||||||||
| Contracts | Contracts | Contracts | Contracts | Contracts | Contracts | Total | ||||||||||||||||||||||
| Assets: | ||||||||||||||||||||||||||||
| Investments in securities, at value (purchased options), market value | $ | 227 | $ | 4,005 | $ | 1,196 | $ | — | $ | — | $ | — | $ | 5,428 | ||||||||||||||
| Unrealized appreciation on foreign currency contracts | — | 3,087 | — | — | — | — | 3,087 | |||||||||||||||||||||
| Unrealized appreciation on swap contracts | — | — | 138 | — | — | — | 138 | |||||||||||||||||||||
| Variation margin receivable * | 454 | — | — | — | — | — | 454 | |||||||||||||||||||||
| Total | $ | 681 | $ | 7,092 | $ | 1,334 | $ | — | $ | — | $ | — | $ | 9,107 | ||||||||||||||
| Liabilities: | ||||||||||||||||||||||||||||
| Unrealized depreciation on foreign currency contracts | $ | — | $ | 5,588 | $ | — | $ | — | $ | — | $ | — | $ | 5,588 | ||||||||||||||
| Variation margin payable * | 470 | — | — | — | — | — | 470 | |||||||||||||||||||||
| Written options, market value | 113 | 7,402 | 392 | — | — | — | 7,907 | |||||||||||||||||||||
| Total | $ | 583 | $ | 1,814 | $ | 392 | $ | — | $ | — | $ | — | $ | 13,965 | ||||||||||||||
* Only current day's variation margin is reported within the Statement of Assets and Liabilities. The variation margin is included in the open futures cumulative appreciation (depreciation) of $556 as reported in the Schedule of Investments.
The volume of derivatives that is presented in the Schedule of Investments is consistent with the derivative activity during the six-month period ended June 30, 2011.
| Hartford Total Return Bond HLS Fund |
| Notes to Financial Statements – (continued) |
| June 30, 2011 (Unaudited) |
| (000’s Omitted) |
The Effect of Derivative Instruments on the Statement of Operations for the six-month period ended June 30, 2011:
| Risk Exposure Category | ||||||||||||||||||||||||||||
| Foreign | ||||||||||||||||||||||||||||
| Interest Rate | Exchange | Credit | Equity | Commodity | Other | |||||||||||||||||||||||
| Contracts | Contracts | Contracts | Contracts | Contracts | Contracts | Total | ||||||||||||||||||||||
| Realized Gain (Loss) on Derivatives Recognized as a Result from Operations: | ||||||||||||||||||||||||||||
Net realized gain (loss) on investments in purchased options | $ | 469 | $ | (1,504 | ) | $ | (1,298 | ) | $ | — | $ | — | $ | — | $ | (2,333 | ) | |||||||||||
| Net realized loss on futures | (3,905 | ) | — | — | — | — | — | (3,905 | ) | |||||||||||||||||||
| Net realized gain (loss) on written options | (127 | ) | (179 | ) | 2,241 | — | — | — | 1,935 | |||||||||||||||||||
| Net realized gain on swap contracts | 798 | 214 | 1,924 | — | — | — | 2,936 | |||||||||||||||||||||
Net realized loss on foreign currency contracts | — | (10,418 | ) | — | — | — | — | (10,418 | ) | |||||||||||||||||||
| Total | $ | (2,765 | ) | $ | (11,887 | ) | $ | 2,867 | $ | — | $ | — | $ | — | $ | (11,785 | ) | |||||||||||
| Net Change in Unrealized Appreciation (Depreciation) on Derivatives Recognized as a Result from Operations: | ||||||||||||||||||||||||||||
Net change in unrealized appreciation (depreciation) of investments in purchased options | $ | 89 | $ | (3,125 | ) | $ | (851 | ) | $ | — | $ | — | $ | — | $ | (3,887 | ) | |||||||||||
Net change in unrealized depreciation of futures | (1,451 | ) | — | — | — | — | — | (1,451 | ) | |||||||||||||||||||
Net change in unrealized appreciation of written options | 30 | 369 | 501 | — | — | — | 900 | |||||||||||||||||||||
Net change in unrealized appreciation of swap contracts | — | — | 138 | — | — | — | 138 | |||||||||||||||||||||
Net change in unrealized depreciation of foreign currency contracts | — | (1,102 | ) | — | — | — | — | (1,102 | ) | |||||||||||||||||||
| Total | $ | (1,332 | ) | $ | (3,858 | ) | $ | (212 | ) | $ | — | $ | — | $ | — | $ | (5,402 | ) | ||||||||||
| 5. | Principal Risks: |
| a) | Credit and Counterparty Risks – Credit risk depends largely on the perceived financial health of bond issuers. In general, the credit rating is inversely related to the credit risk of the issuer. Higher rated bonds generally are deemed to have less credit risk, while lower or unrated bonds are deemed to have higher risk of default. The share price, yield and total return of a fund that holds securities with higher credit risk may be more volatile than those of a fund that holds bonds with lower credit risk. Similar to credit risk, the Fund may be exposed to counterparty risk, or the risk that an institution or other entity with which the Fund has unsettled or open transactions will default. |
| b) | Market Risks – A Fund’s investments in derivatives and other financial instruments expose the Fund to various risks including, but not limited to, interest rate, prepayment, extension, foreign currency, and equity risks. Interest rate risk is the risk that fixed income securities will decline in value because of changes in interest rates. As nominal interest rates rise, the value of certain fixed income securities held by the Fund is likely to decrease. A nominal interest rate can be described as the sum of a real interest rate and an expected inflation rate. Fixed income securities with longer durations tend to be more sensitive to changes in interest rates, usually making them more volatile than securities with shorter durations. Duration is useful primarily as a measure of the sensitivity of a fixed income security’s market price to interest rate (i.e., yield) movements. Senior floating rate interests and securities subject to prepayment and extension risk generally offer less potential for gains when interest rates decline. In addition, securities are subject to extension risk. Rising interest rates may cause prepayments to occur at a slower than expected rate, thereby effectively lengthening the maturity of the security and making the security more sensitive to interest rate changes. Prepayment and extension risk are major risks of mortgage-backed securities, senior floating rate interests, and certain asset-backed securities. For certain asset-backed securities, the actual maturity may be less than the stated maturity shown in the Schedule of Investments. As a result, the timing of income recognition relating to these securities may vary based upon the actual maturity. If a Fund invests directly in foreign currencies or in securities that trade in, and receive revenues in, foreign currencies, or in derivatives that provide exposure to foreign currencies, it will be subject to the risk that those currencies will decline in value relative to the base currency of the Fund, or, in the case of hedging positions, that the Fund’s base currency will decline in value relative to the currency being hedged. Currency rates in foreign countries may fluctuate |
significantly over short periods of time for a number of reasons, including changes in interest rates, intervention (or the failure to intervene) by U.S. or foreign governments, central banks or supranational entities such as the International Monetary Fund, or by the imposition of currency controls or other political developments in the United States or abroad. As a result, the Fund’s investments in foreign currency denominated securities may reduce the returns of the Fund. The market values of equity securities, such as common stocks and preferred stocks or equity related investments such as futures and options, may decline due to general market conditions which are not specifically related to a particular company, such as real or perceived adverse economic conditions, changes in the general outlook for corporate earnings, changes in interest or currency rates or adverse investor sentiment generally. The market value of equity securities may also decline due to factors which affect a particular industry or industries, such as labor shortages or increased production costs and competitive conditions within an industry. Equity securities and equity related investments generally have greater market price volatility than fixed income securities.
| 6. | Federal Income Taxes: |
| a) | Federal Income Taxes – For federal income tax purposes, the Fund intends to continue to qualify as a RIC under Subchapter M of the Internal Revenue Code (“IRC”) by distributing substantially all of its taxable net investment income and net realized capital gains to its shareholders and otherwise complying with the requirements of RICs. The Fund has distributed substantially all of its income and capital gains in prior years, if applicable, and intends to distribute substantially all of its income and capital gains prior to the next fiscal year-end. Accordingly, no provision for federal income or excise taxes has been made in the accompanying financial statements. Distributions from short-term capital gains are treated as ordinary income distributions for federal income tax purposes. |
| b) | Net Investment Income (Loss), Net Realized Gains (Losses) – Net investment income (loss) and net realized gains (losses) may differ for financial statement and tax purposes primarily because of losses deferred due to wash sale adjustments, foreign currency gains and losses, adjustments related to PFICs, REITs, RICs, certain derivatives and partnerships. The character of distributions made during the year from net investment income or net realized gains may differ from their ultimate characterization for federal income tax purposes. Also, due to the timing of dividend distributions, the fiscal year in which amounts are distributed may differ from the year that the income or realized gains (losses) were recorded by the Fund. |
| c) | Distributions and Components of Distributable Earnings – The tax character of distributions paid by the Fund for the periods indicated is as follows (as adjusted for dividends payable): |
| For the Year Ended | For the Year Ended | |||||||
| December 31, 2010 | December 31, 2009 | |||||||
| Ordinary Income | $ | 198,500 | $ | 170,000 | ||||
As of December 31, 2010, the Fund’s components of distributable earnings (deficit) on a tax basis were as follows:
| Amount | ||||
| Undistributed Ordinary Income | $ | 9,706 | ||
| Accumulated Capital and Other Losses* | (273,240 | ) | ||
| Unrealized Appreciation† | 127,645 | |||
| Total Accumulated Deficit | $ | (135,889 | ) | |
| * | The Fund has capital loss carryforwards that are identified in the Capital Loss Carryforward note that follows. |
| † | The difference between book-basis and tax-basis unrealized appreciation (depreciation) may be attributable to the losses deferred due to wash sale adjustments, foreign currency gains and losses, adjustments related to PFICs, REITs, RICs, certain derivatives and partnerships. |
| Hartford Total Return Bond HLS Fund |
| Notes to Financial Statements – (continued) |
| June 30, 2011 (Unaudited) |
| (000’s Omitted) |
| d) | Reclassification of Capital Accounts – The Fund may record reclassifications in its capital accounts. These reclassifications have no impact on the total net assets of the Fund. The reclassifications are a result of permanent differences between U.S. GAAP and tax accounting for such items as expiration or utilization of capital loss carryforwards or net operating losses. Adjustments are made to reflect the impact these items have on current and future distributions to shareholders. Therefore, the source of the Fund’s distributable income may be shown in the accompanying Statement of Assets and Liabilities as from accumulated undistributed net investment income, from accumulated net realized gains on investments or from capital depending on the type of book and tax differences that exist. For the year ended December 31, 2010, the Fund recorded reclassifications to increase (decrease) the accounts listed below: |
| Amount | ||||
| Accumulated Undistributed Net Investment Income | $ | 8,700 | ||
| Accumulated Net Realized Gain (Loss) on Investments and Foreign Currency Transactions | (8,700 | ) | ||
| e) | Capital Loss Carryforward – At December 31, 2010 (tax-year-end), the Fund had capital loss carryforwards for U.S. federal income tax purposes of approximately: |
| Year of Expiration | Amount | |||
| 2016 | $ | 47,209 | ||
| 2017 | 215,953 | |||
| Total | $ | 263,162 | ||
As of December 31, 2010, the Fund utilized $116,743 of prior year capital loss carryforwards.
As of December 31, 2010, the Fund elected to defer the following post-October losses:
| Amount | ||||
| Long-Term Capital Gain | $ | 10,078 | ||
| f) | Accounting for Uncertainty in Income Taxes – The Fund has adopted financial reporting rules that require the Fund to analyze all open tax years, as defined by the Statute of Limitations, for all major jurisdictions. Generally, tax authorities can examine all tax returns filed for the last three years. The Fund does not have an examination in progress. |
The Fund has reviewed all open tax years and major jurisdictions and concluded that these financial reporting rules had no effect on the Fund’s financial position or results of operations. There is no tax liability resulting from unrecognized tax benefits relating to uncertain income tax positions taken or expected to be taken on the tax return for the fiscal year-end December 31, 2010. The Fund is also not aware of any tax positions for which it is reasonably possible that the total amounts of unrecognized tax benefits will significantly change in the next twelve months.
| 7. | Expenses: |
| a) | Investment Management Agreements – HL Investment Advisors, LLC (“HL Advisors”), an indirect wholly owned subsidiary of The Hartford Financial Services Group, Inc. (“The Hartford”), serves as investment manager to the Fund pursuant to an Investment Management Agreement with the Company. As investment manager, HL Advisors has overall investment supervisory responsibility for the Fund. In addition, HL Advisors provides administrative personnel, services, equipment, facilities and office space for proper operation of the Fund. HL Advisors has contracted with Hartford Investment Management Company (“Hartford Investment Management”) under a sub-advisory agreement for the provision of day-to-day investment management services to the Fund in accordance with the Fund’s investment objective and policies. The Fund pays a fee to HL Advisors, a portion of which may be used to compensate Hartford Investment Management. |
The schedule below reflects the rates of compensation paid to HL Advisors for investment management services rendered as of June 30, 2011; the rates are accrued daily and paid monthly.
| Average Daily Net Assets | Annual Fee | |||
| On first $250 million | 0.5250 | % | ||
| On next $250 million | 0.5000 | % | ||
| On next $500 million | 0.4750 | % | ||
| On next $4 billion | 0.4500 | % | ||
| On next $5 billion | 0.4300 | % | ||
| Over $10 billion | 0.4200 | % | ||
| b) | Accounting Services Agreement – Pursuant to the Fund Accounting Agreement between HLIC and the Company, on behalf of the Fund, HLIC provides accounting services to the Fund and receives monthly compensation based on the Fund’s average net assets at the rates set forth below. The Fund’s accounting services fees are accrued daily and paid monthly. |
| Average Daily Net Assets | Annual Fee | |||
| On first $5 billion | 0.018 | % | ||
| On next $5 billion | 0.016 | % | ||
| Over $10 billion | 0.014 | % | ||
| c) | Operating Expenses – Allocable expenses incurred by the Company are allocated to each Fund and allocated to classes within a Fund in proportion to the average daily net assets of the Fund and each class, except where allocation of certain expenses is more fairly made directly to the Fund or to specific classes within a Fund. |
| d) | Fees Paid Indirectly – The Fund’s custodian bank has agreed to reduce its fees when the Fund maintains cash on deposit in a non-interest-bearing custody account. For the six-month period ended June 30, 2011, the Fund had no fee reductions. |
The ratio of expenses to average net assets in the accompanying financial highlights excludes the reduction in expenses related to fees paid indirectly. The annualized expense ratio for the period listed below including the fees paid indirectly is as follows:
| Annualized Six- | ||||
| Month Period | ||||
| Ended June 30, | ||||
| 2011 | ||||
| Class IA | 0.50 | % | ||
| Class IB | 0.75 | |||
| e) | Distribution Plan for Class IB shares – The Company, on behalf of the Fund, has adopted a Distribution Plan pursuant to Rule 12b-1 of the 1940 Act to compensate the Distributor, Hartford Securities Distribution Company, Inc. (a wholly owned, ultimate subsidiary of The Hartford), from assets attributable to the Class IB shares for services rendered and expenses borne in connection with activities primarily intended to result in the sale of the Class IB shares, subject to the review and approval of the Company’s Board of Directors. |
The Distribution Plan provides that the Fund may pay annually up to 0.25% of the average daily net assets of the Fund attributable to its Class IB shares for activities primarily intended to result in the sale of Class IB shares. The Board has the authority to suspend or reduce these payments at any point in time. Under the terms of the Distribution Plan and the principal underwriting agreement, the Fund is authorized to make payments monthly to the Distributor that may be used to pay or compensate entities providing distribution and shareholder servicing with respect to the Class IB shares for such entities’ fees or expenses incurred or paid in that regard. These fees are accrued daily and paid monthly.
| Hartford Total Return Bond HLS Fund |
| Notes to Financial Statements – (continued) |
| June 30, 2011 (Unaudited) |
| (000’s Omitted) |
| f) | Other Related Party Transactions – Certain officers of the Fund are directors and/or officers of HL Advisors and/or The Hartford or its subsidiaries. For the six-month period ended June 30, 2011, a portion of the Fund’s chief compliance officer’s salary was paid by all the investment companies in the Hartford fund complex. The portion allocated to the Fund was in the amount of $4. Hartford Administrative Services Company (“HASCO”), an indirect wholly owned subsidiary of The Hartford, provides transfer agent services to the Fund. The amount paid to HASCO can be found in the Statement of Operations. These fees are accrued daily and paid monthly. |
| g) | Payment from Affiliate – On November 8, 2006, the SEC issued an order setting forth the terms of a settlement reached with three subsidiaries of The Hartford that resolved the SEC’s Division of Enforcement’s investigation of aspects of The Hartford’s variable annuity and mutual fund operations related to directed brokerage and revenue sharing. The Hartford settled this matter without admitting or denying the findings of the SEC. |
The total return in the accompanying financial highlights includes a payment from an affiliate. Had the payment from the affiliate been excluded, the impact and total return for the period listed below would have been as follows:
| For the Year Ended December 31, 2006 | ||||||||
| Class IA | Class IB | |||||||
| Impact from Payment from Affiliate for SEC Settlement | — | % | — | % | ||||
| Total Return Excluding Payment from Affiliate | 4 .80 | 4 .54 | ||||||
| 8. | Investment Transactions: |
For the six-month period ended June 30, 2011, the Fund's aggregate purchases and sales of investment securities (excluding short-term investments) were as follows:
| Amount | ||||
| Cost of Purchases Excluding U.S. Government Obligations | $ | 1,895,043 | ||
| Sales Proceeds Excluding U.S. Government Obligations | 2,077,059 | |||
| Cost of Purchases for U.S. Government Obligations | 1,593,300 | |||
| Sales Proceeds for U.S. Government Obligations | 1,533,679 | |||
| 9. | Line of Credit: |
The Fund is one of several Hartford funds that participate in a $500 million committed revolving line of credit facility. The facility is to be used for temporary or emergency purposes. Under the arrangement, a fund is required to own securities having a market value in excess of 300% of the total bank borrowings. The interest rate on borrowings varies depending on the nature of the loan. The facility also requires a fee to be paid based on the amount of the commitment. This commitment fee is allocated to all the funds participating in the line of credit based on the average net assets of the funds. During the six-month period ended June 30, 2011, the Fund did not have any borrowings under this facility.
| 10. | Industry Classifications: |
Other than the industry classifications “Other Investment Pools and Funds” and “Exchange Traded Funds,” equity industry classifications used in this report are the Global Industry Classification Standard, which was developed by and is the exclusive property and service mark of MSCI, Inc. and Standard & Poor’s.
| 11. | Indemnifications: |
Under the Company’s organizational documents, the Company shall indemnify its officers and directors to the full extent required or permitted under Maryland General Corporation Law and the federal securities laws. In addition, the Company, on behalf of the Fund, may enter into contracts that contain a variety of indemnifications. The Company’s maximum exposure under these arrangements is unknown. However, as of the date of these financial statements the Company has not had prior claims or losses pursuant to these contracts and expects the risk of loss to be remote.
Financial Highlights |
| - Selected Per-Share Data (A) - |
| Net Asset | Net Realized | Net Increase | ||||||||||||||||||||||||||||||||||||||||||
| Value at | and Unrealized | Total from | Dividends from | Distributions | (Decrease) in | Net Asset | ||||||||||||||||||||||||||||||||||||||
| Beginning of | Net Investment | Payments from | Gain (Loss) on | Investment | Net Investment | from Realized | Distributions | Total | Net Asset | Value at End of | ||||||||||||||||||||||||||||||||||
| Class | Period | Income (Loss) | (to) Affiliate | Investments | Operations | Income | Capital Gains | from Capital | Distributions | Value | Period | |||||||||||||||||||||||||||||||||
| For the Six-Month Period Ended June 30, 2011 (Unaudited) | ||||||||||||||||||||||||||||||||||||||||||||
| IA | $ | 10.90 | $ | 0.22 | $ | – | $ | 0.08 | $ | 0.30 | $ | – | $ | – | $ | – | $ | – | $ | 0.30 | $ | 11.20 | ||||||||||||||||||||||
| IB | 10.84 | 0.21 | – | 0.08 | 0.29 | – | – | – | – | 0.29 | 11.13 | |||||||||||||||||||||||||||||||||
| For the Year Ended December 31, 2010 | ||||||||||||||||||||||||||||||||||||||||||||
| IA | 10.58 | 0.45 | – | 0.34 | 0.79 | (0.47 | ) | – | – | (0.47 | ) | 0.32 | 10.90 | |||||||||||||||||||||||||||||||
| IB | 10.53 | 0.44 | – | 0.31 | 0.75 | (0.44 | ) | – | – | (0.44 | ) | 0.31 | 10.84 | |||||||||||||||||||||||||||||||
| For the Year Ended December 31, 2009 | ||||||||||||||||||||||||||||||||||||||||||||
| IA | 9.54 | 0.46 | – | 0.98 | 1.44 | (0.40 | ) | – | – | (0.40 | ) | 1.04 | 10.58 | |||||||||||||||||||||||||||||||
| IB | 9.50 | 0.46 | – | 0.95 | 1.41 | (0.38 | ) | – | – | (0.38 | ) | 1.03 | 10.53 | |||||||||||||||||||||||||||||||
| For the Year Ended December 31, 2008 | ||||||||||||||||||||||||||||||||||||||||||||
| IA | 11.15 | 0.62 | – | (1.49 | ) | (0.87 | ) | (0.74 | ) | – | – | (0.74 | ) | (1.61 | ) | 9.54 | ||||||||||||||||||||||||||||
| IB | 11.09 | 0.67 | – | (1.55 | ) | (0.88 | ) | (0.71 | ) | – | – | (0.71 | ) | (1.59 | ) | 9.50 | ||||||||||||||||||||||||||||
| For the Year Ended December 31, 2007(G) | ||||||||||||||||||||||||||||||||||||||||||||
| IA | 11.24 | 0.60 | – | (0.08 | ) | 0.52 | (0.61 | ) | – | – | (0.61 | ) | (0.09 | ) | 11.15 | |||||||||||||||||||||||||||||
| IB | 11.19 | 0.57 | – | (0.09 | ) | 0.48 | (0.58 | ) | – | – | (0.58 | ) | (0.10 | ) | 11.09 | |||||||||||||||||||||||||||||
| For the Year Ended December 31, 2006(G) | ||||||||||||||||||||||||||||||||||||||||||||
| IA | 11.27 | 0.55 | – | (0.01 | ) | 0.54 | (0.57 | ) | – | – | (0.57 | ) | (0.03 | ) | 11.24 | |||||||||||||||||||||||||||||
| IB | 11.20 | 0.51 | – | – | 0.51 | (0.52 | ) | – | – | (0.52 | ) | (0.01 | ) | 11.19 | ||||||||||||||||||||||||||||||
| (A) | Information presented relates to a share outstanding throughout the indicated period. |
| (B) | The figures do not include sales charges or other fees which may be applied at the variable life insurance, variable annuity or qualified retirement plan product level. Any such additional sales charges or other fees would lower the Fund's performance. |
| (C) | Ratios do not reflect reductions for fees paid indirectly. Please see Fees Paid Indirectly in the Notes to Financial Statements. |
| (D) | Portfolio turnover rate is calculated on the basis of the Fund as a whole without distinguishing between the classes of shares issued. |
| (E) | Not annualized. |
| (F) | Annualized. |
| (G) | Per share amounts have been calculated using the average shares method. |
| (H) | Total return without the inclusion of the Payment from (to) Affiliate can be found in Expenses in the accompanying Notes to Financial Statements. |
| - Ratios and Supplemental Data - |
| Ratio of Expenses to Average Net | Ratio of Expenses to Average Net | Ratio of Net Investment Income to | Portfolio Turnover | |||||||||||||||||||
| Total Return(B) | Net Assets at End of Period | Assets Before Waivers(C) | Assets After Waivers(C) | Average Net Assets | Rate(D) | |||||||||||||||||
| 2.76 | %(E) | $ | 3,934,943 | 0.50 | %(F) | 0.50 | %(F) | 3.83 | %(F) | 69 | % | |||||||||||
| 2.63 | (E) | 670,138 | 0.75 | (F) | 0.75 | (F) | 3.58 | (F) | – | |||||||||||||
| 7.51 | 4,026,583 | 0.50 | 0.50 | 3.90 | 188 | |||||||||||||||||
| 7.25 | 722,317 | 0.75 | 0.75 | 3.65 | – | |||||||||||||||||
| 15.01 | 3,902,957 | 0.51 | 0.51 | 4.67 | 215 | |||||||||||||||||
| 14.72 | 789,541 | 0.76 | 0.76 | 4.42 | – | |||||||||||||||||
| (7.62 | ) | 3,167,919 | 0.49 | 0.49 | 5.54 | 173 | ||||||||||||||||
| (7.85 | ) | 740,580 | 0.74 | 0.74 | 5.27 | – | ||||||||||||||||
| 4.67 | 3,458,709 | 0.49 | 0.49 | 5.27 | 223 | |||||||||||||||||
| 4.41 | 1,036,331 | 0.74 | 0.74 | 5.01 | – | |||||||||||||||||
| 4.80 | (H) | 3,041,321 | 0.50 | 0.50 | 4.82 | 344 | ||||||||||||||||
| 4.54 | (H) | 1,040,408 | 0.75 | 0.75 | 4.56 | – | ||||||||||||||||
| Directors and Officers (Unaudited) |
The Board of Directors of the Company appoints officers who are responsible for the day-to-day operations of the Fund and who execute policies formulated by the Directors. Each director serves until his or her death, resignation, or retirement or until the next annual meeting of shareholders is held or until his or her successor is elected and qualifies.
Directors and officers who are employed by or who have a financial interest in The Hartford are considered “interested” persons of the Fund pursuant to the 1940 Act. Each officer and two of the Company’s directors, as noted in the chart below, are “interested” persons of the Fund. Each director serves as a director for The Hartford Mutual Funds, Inc., The Hartford Mutual Funds II, Inc., Hartford Series Fund, Inc., and Hartford HLS Series Fund II, Inc., which, as of June 30, 2011, collectively consist of 89 funds. Correspondence may be sent to directors and officers c/o Hartford Mutual Funds, P.O. Box 2999, Hartford, Connecticut 06104-2999, except that correspondence to Ms. Fagely may be sent to 500 Bielenberg Drive, Woodbury, Minnesota 55125.
The table below sets forth, for each director and officer, his or her name, year of birth, current position with the Company and date first elected or appointed to Hartford Series Fund, Inc. (“HSF”), and Hartford HLS Series Fund II, Inc. (“HSF2”), principal occupation, and, for directors, other directorships held. The Fund’s statement of additional information contains further information on the directors and is available free of charge by calling 1-800-862-6668 or writing to Hartford HLS Funds, c/o Individual Annuity Services, P.O. Box 5085, Hartford, CT 06102-5085.
Information on the aggregate remuneration paid to the directors of the Company can be found in the Statement of Operations herein. The Fund pays to The Hartford a portion of the chief compliance officer’s compensation, but does not pay salaries or compensation to any of their other officers or directors who are employed by The Hartford.
Non-Interested Directors
Lynn S. Birdsong (1946) Director since 2003, Co-Chairman of the Investment Committee
Mr. Birdsong is a private investor. Mr. Birdsong currently serves as a Director of the Sovereign High Yield Investment Company (April 2010 to current). Mr. Birdsong currently serves as an Independent Director of Nomura Partners Funds, Inc. (formerly, The Japan Fund) (March 2003 to current). From 2003 to March 2005, Mr. Birdsong was an independent director of the Atlantic Whitehall Funds. From 1979 to 2002, Mr. Birdsong was a managing director of Zurich Scudder Investments, an investment management firm. During his employment with Scudder, Mr. Birdsong was an Interested Director of The Japan Fund. Since 1981, Mr. Birdsong has been a partner in Birdsong Company, an advertising specialty firm.
Robert M. Gavin, Jr. (1940) Director since 2002 (HSF) and 1986 (HSF2), Chairman of the Board since 2004
Dr. Gavin is an educational consultant. Prior to September 1, 2001, he was President of Cranbrook Education Community and prior to July 1996, he was President of Macalester College, St. Paul, Minnesota.
Duane E. Hill (1945) Director since 2001 (HSF) and 2002 (HSF2), Chairman of the Nominating Committee
Mr. Hill is Partner of TSG Ventures L.P., a private equity investment company. Mr. Hill is a former partner of TSG Capital Group, a private equity investment firm that served as sponsor and lead investor in leveraged buyouts of middle market companies.
Sandra S. Jaffee (1941) Director since 2005
Ms. Jaffee served as Chairman (2008 to 2009) and Chief Executive Officer of Fortent (formerly Searchspace Group), a leading provider of compliance/regulatory technology to financial institutions from August 2005 to August 2009. From August 2004 to August 2005, Ms. Jaffee served as an Entrepreneur in Residence with Warburg Pincus, a private equity firm. From September 1995 to July 2004, Ms. Jaffee served as Executive Vice President at Citigroup, where she was President and Chief Executive Officer of Citibank’s Global Securities Services (1995 to 2003). Ms. Jaffe currently serves as a member of the Board of Directors of Broadridge Financial Solutions as well as a Trustee of Muhlenberg College.
William P. Johnston (1944) Director since 2005, Chairman of the Compliance Committee
In June 2006, Mr. Johnston was appointed as Senior Advisor to The Carlyle Group, a global private equity investment firm. In July 2006, Mr. Johnston was elected to the Board of Directors of MultiPlan, Inc. In August 2007, Mr. Johnston was elected to the Board of Directors of LifeCare Holdings, Inc. In February 2008, Mr. Johnston was elected to the Board of Directors of HCR-ManorCare, Inc. In May 2006, Mr. Johnston was elected to the Supervisory Board of Fresenius Medical Care AG & Co. KGaA, after its acquisition of Renal Care Group, Inc. in March 2006. Mr. Johnston joined Renal Care Group in November 2002 as a member of the Board of Directors and served as Chairman of the Board from March 2003 through March 2006. From September 1987 to December 2002, Mr. Johnston was with Equitable Securities Corporation (and its successors, SunTrust Equitable Securities and SunTrust Robinson Humphrey) serving in various investment banking and managerial positions, including Managing Director and Head of Investment Banking, Chief Executive Officer and Vice Chairman.
Phillip O. Peterson (1944) Director since 2002 (HSF) and 2000 (HSF2), Chairman of the Audit Committee
Mr. Peterson is a mutual fund industry consultant. He was a partner of KPMG LLP (an accounting firm) until July 1999. Mr. Peterson joined William Blair Funds in February 2007 as a member of the Board of Trustees. From January 2004 to April 2005, Mr. Peterson served as Independent President of the Strong Mutual Funds.
Lemma W. Senbet (1946) Director since 2005
Dr. Senbet is the William E. Mayer Chair Professor of Finance and Director, Center for Financial Policy, at the University of Maryland, Robert H. Smith School of Business. He was chair of the Finance Department from 1998 to 2006. Previously he was a chaired professor of finance at the University of Wisconsin-Madison. Also, he was director of the Fortis Funds from March 2000 to July 2002. Dr. Senbet served the finance profession in various capacities, including as director of the American Finance Association and President of the Western Finance Association. In 2006, Dr. Senbet was inducted Fellow of Financial Management Association International for his career-long distinguished scholarship and professional service.
Interested Directors and Officers
David N. Levenson (1966) Director since 2010
Mr. Levenson currently serves as President of The Hartford’s Wealth Management business. He was appointed to this role in July 2010. Previously, Mr. Levenson served as Executive Vice President of Legacy Holdings for The Hartford from June 2009 to July 2010. From 2006 to 2009, Mr. Levenson was with Hartford Life Insurance K.K. where he served as President and CEO from 2007 to 2009. He served as Managing Director of Hartford Investment Management Company from 2005 to 2006. Additionally, Mr. Levenson serves as Executive Vice President of The Hartford and as President, Director and Chief Executive Officer of Hartford Life Insurance Company (“HLIC”) and Hartford Life, Inc. (“HL Inc.”).
Lowndes A. Smith (1939) Director since 1996 (HSF) and 2002 (HSF2), Co-Chairman of the Investment Committee
Mr. Smith served as Vice Chairman of The Hartford from February 1997 to January 2002, as President and Chief Executive Officer of HL Inc. from February 1997 to January 2002, and as President and Chief Operating Officer of The Hartford Life Insurance Companies from January 1989 to January 2002. Mr. Smith serves as a Director of White Mountains Insurance Group, Ltd., One Beacon Insurance and Symetra Financial and as a Managing Director of Whittington Gray Associates.
Other Officers
James E. Davey (1964) President and Chief Executive Officer since 2010
Mr. Davey serves as Executive Vice President of HLIC. Additionally, Mr. Davey serves as President, Chief Executive Officer and Manager of Hartford Investment Financial Services, Inc. (“HIFSCO”) and President, Chief Executive Officer and Manager of HL Advisors. Mr. Davey joined The Hartford in 2002.
Tamara L. Fagely (1958) Vice President, Treasurer and Controller since 2002 (HSF) and 1993 (HSF2)
Ms. Fagely has been a Vice President of HASCO since 1998 and Chief Financial Officer since 2006. Currently Ms. Fagely is a Vice President of HLIC. She served as Assistant Vice President of HLIC from December 2001 through March 2005. In addition, Ms. Fagely is Controller and Chief Financial Officer of HIFSCO.
Susan M. Fleege (1959) AML Compliance Officer since 2011
Ms. Fleege currently serves as a Director of Risk Management at The Hartford. She previously served as AML Compliance Officer for the Fund from 2005-2008. Ms. Fleege joined HLIC in 2005 from Amerprise Financial Corporation where she held the position of Counsel from 2000 to 2005. Ms. Fleege is a certified Anti-Money Laundering Specialist.
Dr. Robert J. Froehlich (1953) Senior Managing Director since 2009
Dr. Froehlich joined The Hartford as Senior Managing Director in September 2009. Prior to joining The Hartford, Dr. Froehlich served as Vice Chairman of Deutsche Asset Management from 1997-2009.
Edward P. Macdonald (1967) Vice President, Secretary and Chief Legal Officer since 2005
Mr. Macdonald serves as Vice President of HLIC and Chief Legal Officer of Mutual Funds and Vice President of HIFSCO. He also serves as Vice President and Secretary of HASCO, and Chief Legal Officer, Secretary and Vice President of HL Advisors. Mr. Macdonald joined The Hartford in 2005.
| Hartford Total Return Bond HLS Fund |
| Directors and Officers (Unaudited) – (continued) |
Vernon J. Meyer (1964) Vice President since 2006
Mr. Meyer serves as Senior Vice President of HLIC. He also serves as Senior Vice President of HIFSCO and HL Advisors. Mr. Meyer joined The Hartford in 2004.
Colleen B. Pernerewski (1969) Vice President and Chief Compliance Officer since 2010
Ms. Pernerewski serves as Vice President and Chief Investment Advisor Compliance Officer of HIFSCO and as Vice President and Chief Compliance Officer of HL Advisors. Ms. Pernerewski joined The Hartford in 2005 from Travelers Life and Annuity where she served as Counsel (2004-2005). Prior to Travelers Life and Annuity, Ms. Pernerewski held the position of Counsel at The Hartford (1998-2004).
Elizabeth L. Schroeder (1966) Vice President since 2010
Ms. Schroeder currently serves as Assistant Vice President of HLIC. Ms. Schroeder joined HLIC in 1991. She is also an Assistant Vice President of HIFSCO and HL Advisers.
Martin Swanson (1962) Vice President since 2010
Mr. Swanson is a Vice President of HLIC. Mr. Swanson also serves as Vice President/Marketing for HIFSCO. Prior to joining HLIC in 1998, Mr. Swanson was a Vice President at PaineWebber, Inc.
Jane Wolak (1961) Vice President since 2009
Ms. Wolak currently serves as Senior Vice President of HLIC. Ms. Wolak joined HLIC as Vice President, Retail Product Services in May 2007. She is also Vice President of HASCO. Previously, Ms. Wolak was with Sun Life Financial where she held the position of Vice President, Service Center Operations from 2001-2007.
A description of the policies and procedures that the Fund uses to determine how to vote proxies relating to portfolio securities and a record of how the Fund voted any proxies for the twelve-month period ended June 30, 2011 are available (1) without charge, upon request, by calling 800-862-6668 and (2) on the SEC’s website at http://www.sec.gov.
The Fund files a complete schedule of portfolio holdings with the SEC for the first and third quarters of each fiscal year on Form N-Q. The Fund’s Forms are available (1) without charge, upon request, by calling 800-862-6668 and (2) on the SEC’s website at http://www.sec.gov. The Form N-Q may be reviewed and copied at the SEC’s Public Reference Room in Washington, DC. Information on the operation of the Public Reference Room may be obtained by calling 1-800-SEC-0330.
| Expense Example (Unaudited) |
Your Fund's Expenses
As a shareholder of the Fund, you incur two types of costs: (1) transaction costs and (2) ongoing costs including investment management fees, distribution fees, and other fund expenses. This example is intended to help you understand your ongoing costs (in dollars) of investing in a Fund and to compare these costs with the ongoing costs of investing in other mutual funds. The example is based on an investment of $1,000 invested at the beginning of the period and held for the period of December 31, 2010 through June 30, 2011.
Actual Expenses
The first set of columns of the table below provides information about actual account values and actual expenses. You may use the information in this column, together with the amount you invested, to estimate the expenses that you paid over the period. Simply divide your account value by $1,000 (for example, an $8,600 account value divided by $1,000 = 8.6), then multiply the result by the number in the line under the heading entitled “Expenses Paid During Period” to estimate the expenses you paid on your account during this period.
Hypothetical Example for Comparison Purposes
The second set of columns of the table below provides information about hypothetical account values and hypothetical expenses based on a Fund's actual expense ratio and an assumed rate of return of 5% per year before expenses, which is not the Fund's actual return. The hypothetical account values and expenses may not be used to estimate the actual ending account balance or expenses you paid for the period. You may use this information to compare the ongoing costs of investing in a Fund and other funds. To do so, compare this 5% hypothetical example with the 5% hypothetical examples that appear in the shareholder reports of the other funds.
Please note that the expenses shown in the table are meant to highlight your ongoing costs only and do not reflect any transactional costs, such as sales charges (loads) and CDSC. Therefore, the second set of columns of the table is useful in comparing ongoing costs only, and will not help you determine the relative total costs of owning different funds. In addition, if these transactional costs were included, your costs would be higher. Expenses are equal to the Fund's annualized expense ratios multiplied by average account value over the period, multiplied by 181/365 (to reflect the one-half year period).
| Actual return | Hypothetical (5% return before expenses) | |||||||||||||||||||||||||||||||||||
| Expenses paid | Expenses paid | Days in | ||||||||||||||||||||||||||||||||||
| during the period | during the period | the | Days | |||||||||||||||||||||||||||||||||
| Beginning | Ending | December 31, 2010 | Beginning | Ending | December 31, 2010 | Annualized | current | in the | ||||||||||||||||||||||||||||
| Account Value | Account Value | through | Account Value | Account Value | through | expense | 1/2 | full | ||||||||||||||||||||||||||||
| December 31, 2010 | June 30, 2011 | June 30, 2011 | December 31, 2010 | June 30, 2011 | June 30, 2011 | ratio | year | year | ||||||||||||||||||||||||||||
| Class IA | $ | 1,000.00 | $ | 1,027.58 | $ | 2.51 | $ | 1,000.00 | $ | 1,022.32 | $ | 2.51 | 0.50 | % | 181 | 365 | ||||||||||||||||||||
| Class IB | $ | 1,000.00 | $ | 1,026.30 | $ | 3.77 | $ | 1,000.00 | $ | 1,021.08 | $ | 3.76 | 0.75 | % | 181 | 365 | ||||||||||||||||||||
45
The Hartford | |
| P.O. Box 5085 | |
Hartford, CT 06102-5085 |
Hartford Series Fund, Inc. is underwritten and distributed by Hartford Securities Distribution Company, Inc.
“The Hartford” is The Hartford Financial Services Group, Inc. and its subsidiaries.
Hartford Series Fund, Inc. inception dates range from 1977 to date. Hartford Series Fund, Inc. is not a subsidiary of The Hartford but is underwritten, distributed by and advised by subsidiaries of The Hartford. Investments in Hartford Series Fund, Inc. are not guaranteed by The Hartford or any other entity.
You should carefully consider investment objectives, risks, and charges and expenses of Hartford HLS Funds before investing. This and other information can be found in the Fund’s prospectus or summary prospectus, which can be obtained by calling 800-862-6668. Please read them carefully before you invest or send money.
| HLSSAR-TRB11 8-11 | 106632 | Printed in U.S.A ©2011 The Hartford, Hartford, CT 06115 |

A MESSAGE FROM THE PRESIDENT

Dear Fellow Shareholders:
I want to take this opportunity to say thank you for your continued confidence and trust.
We have seen a significant amount of global turbulence in the first half of 2011. Investors have continued to be concerned about the implications of the European sovereign debt crisis, as well as our own high levels of domestic debt. Since January we have witnessed significant political uprisings in the already-volatile Middle East and North Africa region. In addition, the ramifications of Japan's massive earthquake, subsequent tsunami, and nuclear disaster are still being played out in the market.
Although corporate earnings have remained robust, the unemployment picture has been mixed. After adding more than 200,000 jobs from February to April, more recent unemployment reports have shown a pullback in hiring.
While official inflation remains low as measured by the Consumer Price Index (CPI), high oil prices may be indicative of higher inflation in the future. The federal funds rate remains at a historic low, however, the Fed could potentially raise the rate to get it closer to its historical average once the economy strengthens.
Even with these headwinds, domestic, international, and world indices (as measured by the S&P 500, MSCI EAFE and MSCI World) are all up more than 5% through June, 30 2011.
Looking ahead, continued growth in emerging markets is fueling global recovery efforts. Emerging markets comprise about 48 percent of the world’s GDP, and many economists believe they are poised for further expansion. As GDP growth continues in emerging markets, roughly 100 million people are added to the middle class each year. This middle class population growth could potentially drive a considerable shift in consumer purchasing power.
Now that we have reached the midpoint of 2011, perhaps now would be a good time to schedule a meeting with your financial adviser to examine your current investment strategy and determine whether you are on the right track.
| · | Are you concerned about inflation and its effects on your portfolio? |
| · | Is your portfolio prepared for rising interest rates? |
| · | Does your portfolio reflect the global economy with a mix of developed nations and emerging markets? |
Your financial professional’s advice can help you to navigate today’s volatile markets with confidence. You can also rest assured that we will continue to provide you with solid investments and stellar service for the road ahead.
Thank you again for your business.

James Davey
President
Hartford HLS Funds
Hartford Value HLS Fund
| Manager Discussion (Unaudited) | 2 |
| Financial Statements | |
| 5 | |
| 8 | |
| 9 | |
| 10 | |
| 11 | |
| 12 | |
| 22 | |
| 24 | |
| 26 | |
| 26 | |
| 27 |
This report is prepared for the general information of contract owners and qualified retirement plan participants. It is not an offer of contracts or of qualified retirement plans. It should not be used in connection with any offer, except in conjunction with the appropriate product prospectus which contains all pertinent information including the applicable sales, administrative and other charges.
The views expressed in the Fund’s Manager Discussion under ‘‘Why did the Fund perform this way?’’ and ‘‘What is the outlook?’’ are views of the Fund’s sub-adviser and portfolio management team through the end of the reporting period and are subject to change based on market and other conditions.
Hartford Value HLS Fund inception 04/30/2001 |
| (sub-advised by Wellington Management Company, LLP) |
| Investment objective – Seeks long-term total return. |
Performance Overview 6/30/01 - 6/30/11

The chart above shows the growth of a $10,000 investment in Class IA. Growth results in classes other than Class IA will vary from what is seen above due to differences in the expenses charged to those share classes.
Average Annual Total Returns (as of 6/30/11)
6 Month† | 1 Year | 5 year | 10 year | |
| Value IA | 4.17% | 28.49% | 3.87% | 4.41% |
| Value IB | 4.04% | 28.17% | 3.61% | 4.16% |
| Russell 1000 Value Index | 5.92% | 28.94% | 1.15% | 3.99% |
| † | Not Annualized |
PAST PERFORMANCE IS NOT INDICATIVE OF FUTURE RESULTS.
Total returns presented above were calculated using the Fund's net asset value available to shareholders for sale or redemption of Fund shares on June 30, 2011, which excludes investment transactions as of this date.
Russell 1000 Value Index is an unmanaged index measuring the performance of those Russell 1000 Index companies with lower price-to-book ratios and lower forecasted growth values. (The Russell 1000 Index is an unmanaged index that measures the performance of the 1,000 largest companies in the Russell 3000 Index, which measures the performance of the 3,000 largest U.S. companies, based on total market capitalizations.)
You cannot invest directly in an index.
The chart represents a hypothetical investment in the Fund. Performance data represents past performance and current performance could be higher or lower.
Performance information may reflect historical or current expense waivers/reimbursements from the investment adviser, without which performance would have been lower. For information on current expense waivers/reimbursements, please see the prospectus.
The value of the fund will fluctuate so that when redeemed, it may be worth more or less than the original investment. The chart and table do not reflect the deductions of taxes, sales charges or other fees which may be applied at the variable life insurance, variable annuity or qualified retirement plan product level. Any such additional sales charges or other fees or expenses would lower the contract’s or plan’s performance.
| Portfolio Managers | ||
| Karen H. Grimes, CFA | W. Michael Reckmeyer, III, CFA | Ian R. Link, CFA |
| Senior Vice President | Senior Vice President | Director |
How did the Fund perform?
The Class A shares of the Hartford Value HLS Fund returned 4.17% for the six-month period ended June 30, 2011, underperforming its benchmark, the Russell 1000 Value Index, which returned 5.92% for the same period. The Fund underperformed the 5.34% return of the average fund in the Lipper Large-Cap Value Funds VP-UF peer group, a group of funds with investment strategies similar to those of the Fund.
Why did the Fund perform this way?
U.S. equities moved higher during the period despite a high degree of volatility caused by mounting concerns about unrest in the Middle East and North Africa (MENA) region and the devastating earthquake and nuclear crisis in Japan. Fears of a global economic slowdown due to Japanese supply disruptions and concerns about heightened geopolitical risks were not enough to offset strong corporate earnings, generally solid economic data, and a continued accommodative Fed policy. In the latter half of the period, U.S. equities were relatively flat as fears about continuing inflationary pressures and the end of the Federal Reserve's quantitative easing program were tempered by better-than-expected corporate earnings.
Nine of the ten sectors within the Russell 1000 Value Index posted positive returns. Health Care (+16%), Energy (+11%), and Consumer Discretionary (+10%) gained the most while Financials (-3%) was the one sector to decline during the period.
The Fund’s underperformance versus its benchmark was primarily due to weak stock selection. Stock selection detracted most in Consumer Discretionary, Industrials, and Health Care, more than offsetting strong selection in Energy and Financials. Sector positioning, which is a result of bottom-up (i.e. stock by stock fundamental research) stock selection decisions, detracted slightly during the period. The Fund’s overweight (i.e. the Fund’s sector position was greater than the benchmark position) to Information Technology detracted while an underweight (i.e. the Fund’s sector position was less than the benchmark position) to Financials contributed positively to benchmark-relative (i.e. performance of the Fund as measured against the benchmark) results.
Holdings of Cisco Systems (Information Technology), Staples (Consumer Discretionary), and Nokia OYJ (Information Technology) detracted most from benchmark-relative returns during the period. Shares of Cisco Systems, a leading supplier of networking equipment, software, and services, were pressured by a sharp decline in gross margins due to higher sales of lower margin products. Shares of Staples, a U.S. and international office supply retailer and distributor, fell as the company reported a soft quarter due to a significant operating miss in its international operations. Nokia OYJ, a Finland-based handset maker, saw its shares fall after the company announced that it was partnering with Microsoft instead of using Android for the operating system for new smartphones. Financials stocks Goldman Sachs, Bank of America, and Wells Fargo were among the top detractors from absolute performance (i.e. total return).
Among the top contributors to benchmark-relative returns were Marathon Oil (Energy), Citigroup (Financials), and Xilinx (Information Technology). Marathon Oil, a large U.S. refiner and oil exploration company, saw its shares gain after the company announced a separation of refining and oil production. Not owning benchmark component Citigroup benefitted the Fund as shares were pressured by concerns over the extent of capital requirements and a continuing trend of rising expenses. Shares of Xilinx, a developer and marketer of complete programmable logic chips for semiconductor end users, rose following a strong earnings report driven by robust demand from the communications industry, particularly in Europe. Top absolute contributors for the period also included UnitedHealth Group (Health Care) and Chevron (Energy).
What is the outlook?
The global expansion continues but faces a growing list of risks, including the crisis in Japan, political tensions in the MENA region, rekindled concern over sovereign debt contagion in Europe, and recent weakness in both consumer and manufacturing data globally. Despite these macroeconomic headwinds, corporate earnings remain a bright spot. We believe we are on pace for record earnings by 2012, with historically robust balance sheets that are supportive of both investment and a return of capital to shareholders.
Within the context of these countervailing forces, we believe that global growth will continue at a pace that can drive the market higher, although the rate of growth could slow and be volatile. This thinking factors into our evaluation of all companies - those we hold and those we consider for purchase. We remain focused on company-level fundamentals, which, as noted above, remain solid in many areas of the market. These bottom-up decisions, in aggregate, have resulted in an overweight to cyclical areas of the economy as global demand remains healthy and the relative attractiveness of these companies is still compelling.
Based on bottom-up stock decisions, we ended the period most overweight the Materials, Industrials, and Energy sectors relative to the Russell 1000 Value Index; our largest underweights were in Utilities, Financials, and Telecommunication Services.
Diversification by Industry
as of June 30, 2011
| Percentage of | ||||
| Industry (Sector) | Net Assets | |||
| Automobiles & Components (Consumer Discretionary) | 1.0 | % | ||
| Banks (Financials) | 6.8 | |||
| Capital Goods (Industrials) | 12.0 | |||
| Commercial & Professional Services (Industrials) | 0.7 | |||
| Consumer Durables & Apparel (Consumer Discretionary) | 1.0 | |||
| Diversified Financials (Financials) | 9.3 | |||
| Energy (Energy) | 13.2 | |||
| Food & Staples Retailing (Consumer Staples) | 1.7 | |||
| Food, Beverage & Tobacco (Consumer Staples) | 5.1 | |||
| Health Care Equipment & Services (Health Care) | 5.8 | |||
| Insurance (Financials) | 7.8 | |||
| Materials (Materials) | 6.6 | |||
| Media (Consumer Discretionary) | 2.7 | |||
| Pharmaceuticals, Biotechnology & Life Sciences (Health Care) | 7.3 | |||
| Retailing (Consumer Discretionary) | 4.2 | |||
| Semiconductors & Semiconductor Equipment (Information Technology) | 4.9 | |||
| Software & Services (Information Technology) | 1.2 | |||
| Technology Hardware & Equipment (Information Technology) | 2.1 | |||
| Telecommunication Services (Services) | 3.0 | |||
| Utilities (Utilities) | 3.5 | |||
| Short-Term Investments | 0.1 | |||
| Other Assets and Liabilities | – | |||
| Total | 100.0 | % | ||
| Hartford Value HLS Fund |
June 30, 2011 (Unaudited) |
| (000’s Omitted) |
| Shares or Principal Amount | Market Value ╪ | |||||||
| COMMON STOCKS - 99.9% | ||||||||
| Automobiles & Components - 1.0% | ||||||||
| 104 | General Motors Co. ● | $ | 3,168 | |||||
| 292 | Goodyear Tire & Rubber Co. ● | 4,892 | ||||||
| 8,060 | ||||||||
| Banks - 6.8% | ||||||||
| 280 | PNC Financial Services Group, Inc. | 16,664 | ||||||
| 472 | US Bancorp | 12,046 | ||||||
| 962 | Wells Fargo & Co. | 26,984 | ||||||
| 55,694 | ||||||||
| Capital Goods - 12.0% | ||||||||
| 82 | 3M Co. | 7,820 | ||||||
| 109 | Boeing Co. | 8,036 | ||||||
| 955 | General Electric Co. | 18,015 | ||||||
| 163 | Illinois Tool Works, Inc. | 9,197 | ||||||
| 282 | Ingersoll-Rand plc | 12,817 | ||||||
| 159 | PACCAR, Inc. | 8,121 | ||||||
| 186 | Stanley Black & Decker, Inc. | 13,429 | ||||||
| 327 | Textron, Inc. | 7,722 | ||||||
| 267 | Tyco International Ltd. | 13,205 | ||||||
| 98,362 | ||||||||
| Commercial & Professional Services - 0.7% | ||||||||
| 195 | Republic Services, Inc. | 6,016 | ||||||
| Consumer Durables & Apparel - 1.0% | ||||||||
| 308 | Mattel, Inc. | 8,476 | ||||||
| Diversified Financials - 9.3% | ||||||||
| 153 | Ameriprise Financial, Inc. | 8,832 | ||||||
| 1,045 | Bank of America Corp. | 11,452 | ||||||
| 64 | BlackRock, Inc. | 12,351 | ||||||
| 189 | Credit Suisse Group ADR | 7,369 | ||||||
| 83 | Goldman Sachs Group, Inc. | 10,984 | ||||||
| 618 | JP Morgan Chase & Co. | 25,291 | ||||||
| 230 | Solar Cayman Ltd. ⌂●† | 21 | ||||||
| 76,300 | ||||||||
| Energy - 13.2% | ||||||||
| 72 | Apache Corp. | 8,872 | ||||||
| 153 | Baker Hughes, Inc. | 11,096 | ||||||
| 250 | Chevron Corp. | 25,696 | ||||||
| 57 | EOG Resources, Inc. | 5,926 | ||||||
| 145 | Exxon Mobil Corp. | 11,761 | ||||||
| 221 | Marathon Oil Corp. | 11,660 | ||||||
| 183 | Occidental Petroleum Corp. | 19,002 | ||||||
| 104 | Royal Dutch Shell plc ADR | 7,491 | ||||||
| 154 | Southwestern Energy Co. ● | 6,583 | ||||||
| 108,087 | ||||||||
| Food & Staples Retailing - 1.7% | ||||||||
| 241 | CVS/Caremark Corp. | 9,074 | ||||||
| 146 | Sysco Corp. | 4,547 | ||||||
| 13,621 | ||||||||
| Food, Beverage & Tobacco - 5.1% | ||||||||
| 173 | General Mills, Inc. | 6,427 | ||||||
| 213 | Kraft Foods, Inc. | 7,520 | ||||||
| 177 | Molson Coors Brewing Co. | 7,920 | ||||||
| 136 | PepsiCo, Inc. | 9,554 | ||||||
| 156 | Philip Morris International, Inc. | 10,424 | ||||||
| 41,845 | ||||||||
| Health Care Equipment & Services - 5.8% | ||||||||
| 143 | Baxter International, Inc. | 8,533 | ||||||
| 198 | Covidien plc | 10,521 | ||||||
| 305 | HCA Holdings, Inc. ● | 10,051 | ||||||
| 249 | UnitedHealth Group, Inc. | 12,863 | ||||||
| 89 | Zimmer Holdings, Inc. ● | 5,615 | ||||||
| 47,583 | ||||||||
| Insurance - 7.8% | ||||||||
| 250 | ACE Ltd. | 16,437 | ||||||
| 167 | Chubb Corp. | 10,448 | ||||||
| 418 | Marsh & McLennan Cos., Inc. | 13,037 | ||||||
| 226 | Principal Financial Group, Inc. | 6,886 | ||||||
| 114 | Swiss Re Ltd. ● | 6,376 | ||||||
| 410 | Unum Group | 10,448 | ||||||
| 63,632 | ||||||||
Materials - 6.6% | ||||||||
| 48 | CF Industries Holdings, Inc. | 6,769 | ||||||
| 315 | Dow Chemical Co. | 11,336 | ||||||
| 158 | E.I. DuPont de Nemours & Co. | 8,527 | ||||||
| 139 | Mosaic Co. | 9,402 | ||||||
| 100 | Nucor Corp. | 4,120 | ||||||
| 596 | Rexam plc | 3,665 | ||||||
| 62 | Rexam plc ADR | 1,967 | ||||||
| 530 | Steel Dynamics, Inc. | 8,607 | ||||||
| 54,393 | ||||||||
| Media - 2.7% | ||||||||
| 151 | CBS Corp. Class B | 4,309 | ||||||
| 695 | Comcast Corp. Class A | 17,616 | ||||||
| 21,925 | ||||||||
| Pharmaceuticals, Biotechnology & Life Sciences - 7.3% | ||||||||
| 110 | Abbott Laboratories | 5,777 | ||||||
| 148 | Amgen, Inc. ● | 8,641 | ||||||
| 122 | Johnson & Johnson | 8,123 | ||||||
| 292 | Merck & Co., Inc. | 10,316 | ||||||
| 815 | Pfizer, Inc. | 16,782 | ||||||
| 209 | Teva Pharmaceutical Industries Ltd. ADR | 10,083 | ||||||
| 59,722 | ||||||||
| Retailing - 4.2% | ||||||||
| 3,040 | Buck Holdings L.P. ⌂●† | 7,524 | ||||||
| 253 | Home Depot, Inc. | 9,147 | ||||||
| 137 | Kohl's Corp. | 6,843 | ||||||
| 136 | Nordstrom, Inc. | 6,374 | ||||||
| 285 | Staples, Inc. | 4,506 | ||||||
| 34,394 | ||||||||
| Semiconductors & Semiconductor Equipment - 4.9% | ||||||||
| 233 | Analog Devices, Inc. | 9,131 | ||||||
| 515 | Intel Corp. | 11,422 | ||||||
| 274 | Maxim Integrated Products, Inc. | 6,994 | ||||||
| 340 | Xilinx, Inc. | 12,417 | ||||||
| 39,964 | ||||||||
| Software & Services - 1.2% | ||||||||
| 383 | Microsoft Corp. | 9,952 | ||||||
| Technology Hardware & Equipment - 2.1% | ||||||||
| 431 | Cisco Systems, Inc. | 6,734 | ||||||
| 195 | Hewlett-Packard Co. | 7,096 | ||||||
| 447 | Nokia Corp. ADR | 2,871 | ||||||
| 16,701 | ||||||||
| Telecommunication Services - 3.0% | ||||||||
| 781 | AT&T, Inc. | 24,540 | ||||||
The accompanying notes are an integral part of these financial statements.
| Hartford Value HLS Fund |
Schedule of Investments – (continued) June 30, 2011 (Unaudited) |
| (000’s Omitted) |
| Shares or Principal Amount | Market Value ╪ | |||||||
| COMMON STOCKS - 99.9% - (continued) | ||||||||
| Utilities - 3.5% | ||||||||
| 183 | Edison International | $ | 7,085 | |||||
| 107 | Entergy Corp. | 7,327 | ||||||
| 67 | NextEra Energy, Inc. | 3,825 | ||||||
| 222 | Northeast Utilities | 7,819 | ||||||
| 100 | PPL Corp. | 2,778 | ||||||
| 28,834 | ||||||||
| Total common stocks | ||||||||
| (cost $705,393) | $ | 818,101 | ||||||
| Total long-term investments | ||||||||
| (cost $705,393) | $ | 818,101 | ||||||
| SHORT-TERM INVESTMENTS - 0.1% | ||||||||
| Repurchase Agreements - 0.1% | ||||||||
| Bank of America Merrill Lynch TriParty Joint | ||||||||
| Repurchase Agreement (maturing on | ||||||||
| 07/01/2011 in the amount of $116, | ||||||||
| collateralized by FHLB 4.91%, 2015, | ||||||||
| GNMA 0.87% - 5.72%, 2025 - 2061, value | ||||||||
| of $119) | ||||||||
| $ | 116 | 0.05%, 06/30/2011 | $ | 116 | ||||
| BNP Paribas Securities Corp. TriParty Joint | ||||||||
| Repurchase Agreement (maturing on | ||||||||
| 07/01/2011 in the amount of $88, | ||||||||
| collateralized by FNMA 3.50% - 6.50%, | ||||||||
| 2023 - 2041, value of $89) | ||||||||
| 88 | 0.05%, 06/30/2011 | 88 | ||||||
| Deutsche Bank Securities TriParty Joint | ||||||||
| Repurchase Agreement (maturing on | ||||||||
| 07/01/2011 in the amount of $847, | ||||||||
| collateralized by GNMA 4.00% - 7.00%, | ||||||||
| 2035 - 2040, value of $864) | ||||||||
| 847 | 0.05%, 06/30/2011 | 847 | ||||||
| UBS Securities, Inc. Joint Repurchase | ||||||||
| Agreement (maturing on 07/01/2011 in the | ||||||||
| amount of $2, collateralized by U.S. | ||||||||
| Treasury Bill 0.63%, 2012, value of $2) | ||||||||
| 2 | 0.01%, 06/30/2011 | 2 | ||||||
| UBS Securities, Inc. TriParty Joint Repurchase | ||||||||
| Agreement (maturing on 07/01/2011 in the | ||||||||
| amount of $129, collateralized by FHLMC | ||||||||
| 4.50%, 2040, FNMA 4.50% - 6.00%, 2035 - | ||||||||
2041, value of $132) | ||||||||
| 129 | 0.06%, 06/30/2011 | 129 | ||||||
| 1,182 | ||||||||
| Total short-term investments | ||||||||
| (cost $1,182) | $ | 1,182 | ||||||
| Total investments | ||||||||
(cost $706,575) ▲ | 100.0 | % | $ | 819,283 | ||||
| Other assets and liabilities | – | % | 388 | |||||
| Total net assets | 100.0 | % | $ | 819,671 | ||||
The accompanying notes are an integral part of these financial statements.
| Note: | Percentage of investments as shown is the ratio of the total market value to total net assets. Market value of investments in foreign securities represents 4.9% of total net assets at June 30, 2011. |
Prices of foreign equities that are principally traded on certain foreign markets may be adjusted daily pursuant to a fair value pricing service approved by the Board of Directors in order to reflect an adjustment for factors occurring after the close of certain foreign markets but before the close of the New York Stock Exchange.
| ▲ | At June 30, 2011, the cost of securities for federal income tax purposes was $714,801 and the aggregate gross unrealized appreciation and depreciation based on that cost were: |
| Unrealized Appreciation | $ | 137,533 | ||
| Unrealized Depreciation | (33,051 | ) | ||
| Net Unrealized Appreciation | $ | 104,482 |
| † | The aggregate value of securities valued in good faith at fair value as determined under policies and procedures established by and under the supervision of the Company's Board of Directors at June 30, 2011, was $7,545, which represents 0.92% of total net assets. This amount excludes securities that are principally traded in certain foreign markets and whose prices are adjusted pursuant to a third party pricing service methodology approved by the Board of Directors. |
| ● | Currently non-income producing. |
| ⌂ | The following securities are considered illiquid. Illiquid securities are often purchased in private placement transactions, are often not registered under the Securities Act of 1933 and may have contractual restrictions on resale. A security may also be considered illiquid if the security lacks a readily available market or if its valuation has not changed for a certain period of time. |
| Period Acquired | Shares/ Par | Security | Cost Basis | ||||||
| 06/2007 | 3,040 | Buck Holdings L.P. | $ | 2,334 | |||||
| 03/2007 | 230 | Solar Cayman Ltd. - 144A | 171 | ||||||
The aggregate value of these securities at June 30, 2011, was $7,545, which represents 0.92% of total net assets.
| ╪ | See Significant Accounting Policies of accompanying Notes to Financial Statements regarding valuation of securities. |
The accompanying notes are an integral part of these financial statements.
| Hartford Value HLS Fund |
June 30, 2011 (Unaudited) |
| (000’s Omitted) |
| Total | Level 1 ♦ | Level 2 ♦ | Level 3 | |||||||||||||
| Assets: | ||||||||||||||||
Common Stocks ‡ | $ | 818,101 | $ | 806,891 | $ | 3,665 | $ | 7,545 | ||||||||
| Short-Term Investments | 1,182 | – | 1,182 | – | ||||||||||||
Total | $ | 819,283 | $ | 806,891 | $ | 4,847 | $ | 7,545 | ||||||||
| ♦ | For the six-month period ended June 30, 2011, there were no significant transfers between Level 1 and Level 2. |
| ‡ | The Fund has all or primarily all of the equity securities categorized in a particular level. Refer to the Schedule of Investments for further industry breakout. |
Following is a reconciliation of Level 3 assets for which significant unobservable inputs were used to determine fair value:
| Balance as | Change in | |||||||||||||||||||||||||||||||||||
| of | Realized | Unrealized | Transfers | Transfers | Balance | |||||||||||||||||||||||||||||||
| December | Gain | Appreciation | Net | Into | Out of | as of June | ||||||||||||||||||||||||||||||
| 31, 2010 | (Loss) | (Depreciation) | Amortization | Purchases | Sales | Level 3 | Level 3 | 30, 2011 | ||||||||||||||||||||||||||||
| Assets: | ||||||||||||||||||||||||||||||||||||
| Common Stocks | $ | 6,920 | $ | — | $ | 625 | * | $ | — | $ | — | $ | — | $ | — | $ | — | $ | 7,545 | |||||||||||||||||
| Total | $ | 6,920 | $ | — | $ | 625 | $ | — | $ | — | $ | — | $ | — | $ | — | $ | 7,545 | ||||||||||||||||||
| * | Change in unrealized appreciation or depreciation in the current period relating to assets still held at June 30, 2011 was $625. |
The accompanying notes are an integral part of these financial statements.
Hartford Value HLS Fund |
June 30, 2011 (Unaudited) |
| (000’s Omitted) |
| Assets: | ||||
| Investments in securities, at market value (cost $706,575) | $ | 819,283 | ||
| Cash | 1 | |||
| Receivables: | ||||
| Fund shares sold | 272 | |||
| Dividends and interest | 1,231 | |||
| Other assets | 5 | |||
| Total assets | 820,792 | |||
| Liabilities: | ||||
| Payables: | ||||
| Fund shares redeemed | 963 | |||
| Investment management fees | 95 | |||
| Distribution fees | 5 | |||
| Accrued expenses | 58 | |||
| Total liabilities | 1,121 | |||
| Net assets | $ | 819,671 | ||
| Summary of Net Assets: | ||||
| Capital stock and paid-in-capital | $ | 878,873 | ||
| Accumulated undistributed net investment income | 7,487 | |||
| Accumulated net realized loss on investments and foreign currency transactions | (179,397 | ) | ||
| Unrealized appreciation of investments | 112,708 | |||
| Net assets | $ | 819,671 | ||
| Shares authorized | 800,000 | |||
| Par value | $ | 0.001 | ||
Class IA: Net asset value per share | $ | 11.22 | ||
| Shares outstanding | 61,198 | |||
| Net assets | $ | 686,721 | ||
Class IB: Net asset value per share | $ | 11.19 | ||
| Shares outstanding | 11,879 | |||
| Net assets | $ | 132,950 | ||
The accompanying notes are an integral part of these financial statements.
Hartford Value HLS Fund |
| For the Six-Month Period Ended June 30, 2011 (Unaudited) |
| (000’s Omitted) |
| Investment Income: | ||||
| Dividends | $ | 10,251 | ||
| Interest | 2 | |||
| Less: Foreign tax withheld | (55 | ) | ||
| Total investment income, net | 10,198 | |||
| Expenses: | ||||
| Investment management fees | 3,130 | |||
| Transfer agent fees | — | |||
| Distribution fees - Class IB | 183 | |||
| Custodian fees | 3 | |||
| Accounting services fees | 44 | |||
| Board of Directors' fees | 8 | |||
| Audit fees | 7 | |||
| Other expenses | 73 | |||
| Total expenses (before fees paid indirectly) | 3,448 | |||
| Commission recapture | (2 | ) | ||
| Total fees paid indirectly | (2 | ) | ||
| Total expenses, net | 3,446 | |||
| Net investment income | 6,752 | |||
| Net Realized Gain on Investments and Foreign Currency Transactions: | ||||
| Net realized gain on investments | 28,190 | |||
| Net realized gain on foreign currency contracts | 122 | |||
| Net realized loss on other foreign currency transactions | (113 | ) | ||
| Net Realized Gain on Investments and Foreign Currency Transactions | 28,199 | |||
| Net Changes in Unrealized Appreciation of Investments: | ||||
| Net unrealized appreciation of investments | 2,339 | |||
| Net Changes in Unrealized Appreciation of Investments | 2,339 | |||
| Net Gain on Investments and Foreign Currency Transactions | 30,538 | |||
| Net Increase in Net Assets Resulting from Operations | $ | 37,290 | ||
The accompanying notes are an integral part of these financial statements.
Hartford Value HLS Fund |
| (000’s Omitted) |
| For the | ||||||||
| Six-Month | For the | |||||||
| Period Ended | Year Ended | |||||||
| June 30, 2011 | December 31, | |||||||
| (Unaudited) | 2010 | |||||||
| Operations: | ||||||||
| Net investment income | $ | 6,752 | $ | 9,863 | ||||
| Net realized gain on investments and foreign currency transactions | 28,199 | 49,485 | ||||||
| Net unrealized appreciation of investments | 2,339 | 25,336 | ||||||
| Net Increase In Net Assets Resulting From Operations | 37,290 | 84,684 | ||||||
| Distributions to Shareholders: | ||||||||
| From net investment income | ||||||||
| Class IA | — | (8,406 | ) | |||||
| Class IB | — | (1,444 | ) | |||||
| Total distributions | — | (9,850 | ) | |||||
| Capital Share Transactions: | ||||||||
| Class IA | ||||||||
| Sold | 16,366 | 58,470 | ||||||
| Issued in merger | — | 531,323 | ||||||
| Issued on reinvestment of distributions | — | 8,406 | ||||||
| Redeemed | (101,835 | ) | (163,665 | ) | ||||
| Total capital share transactions | (85,469 | ) | 434,534 | |||||
| Class IB | ||||||||
| Sold | 7,626 | 23,470 | ||||||
| Issued in merger | — | 97,765 | ||||||
| Issued on reinvestment of distributions | — | 1,444 | ||||||
| Redeemed | (35,737 | ) | (43,998 | ) | ||||
| Total capital share transactions | (28,111 | ) | 78,681 | |||||
| Net increase (decrease) from capital share transactions | (113,580 | ) | 513,215 | |||||
| Net Increase (Decrease) In Net Assets | (76,290 | ) | 588,049 | |||||
| Net Assets: | ||||||||
| Beginning of period | 895,961 | 307,912 | ||||||
| End of period | $ | 819,671 | $ | 895,961 | ||||
| Accumulated undistributed (distribution in excess of) | ||||||||
| net investment income | $ | 7,487 | $ | 735 | ||||
| Shares: | ||||||||
| Class IA | ||||||||
| Sold | 1,459 | 5,916 | ||||||
| Issued in merger | — | 52,973 | ||||||
| Issued on reinvestment of distributions | — | 813 | ||||||
| Redeemed | (9,071 | ) | (16,659 | ) | ||||
| Total share activity | (7,612 | ) | 43,043 | |||||
| Class IB | ||||||||
| Sold | 678 | 2,336 | ||||||
| Issued in merger | — | 9,763 | ||||||
| Issued on reinvestment of distributions | — | 141 | ||||||
| Redeemed | (3,183 | ) | (4,491 | ) | ||||
| Total share activity | (2,505 | ) | 7,749 | |||||
The accompanying notes are an integral part of these financial statements.
Hartford Value HLS Fund |
| June 30, 2011 (Unaudited) |
| (000’s Omitted) |
| 1. | Organization: |
Hartford Value HLS Fund (the “Fund”) serves as an underlying investment option for certain variable annuity and variable life insurance separate accounts of Hartford Life Insurance Company (“HLIC”) and its affiliates and certain qualified retirement plans. The Fund may also serve as an underlying investment option for certain variable annuity and variable life separate accounts of other insurance companies. Owners of variable annuity contracts and policyholders of variable life insurance contracts may choose the funds permitted in the variable insurance contract prospectus. In addition, participants in certain qualified retirement plans may choose the Fund if permitted by their plans.
Hartford Series Fund, Inc. (the “Company”) is an open-end registered management investment company comprised of thirty portfolios. Financial Statements for the Fund, a series of the Company, are included in this report.
The Company is organized under the laws of the State of Maryland and is registered with the Securities and Exchange Commission (“SEC”) under the Investment Company Act of 1940, as amended (“1940 Act”). The Fund is a diversified open-end management investment company.
The Fund is divided into Class IA and Class IB shares. Each class is offered at the per share net asset value (“NAV”) without a sales charge and is subject to the same expenses, except that the Class IB shares are subject to distribution and service fees charged pursuant to a Distribution Plan adopted in accordance with Rule 12b-1 under the 1940 Act.
| 2. | Significant Accounting Policies: |
The following is a summary of significant accounting policies of the Fund in the preparation of its financial statements, which are in accordance with the United States Generally Accepted Accounting Principles (“U.S. GAAP”). The preparation of financial statements in accordance with U.S. GAAP may require management to make estimates and assumptions that affect the reported amounts of assets and liabilities and disclosure of contingent assets and liabilities at the date of the financial statements and the reported amounts of increases and decreases in net assets from operations during the reporting period. Actual results could differ from those estimates.
| a) | Determination of Net Asset Value – The NAV of each class of the Fund's shares is determined as of the close of regular trading (normally 4:00 p.m. Eastern Time) (the “NYSE Close”) on each day that the New York Stock Exchange (the “Exchange”) is open (“Valuation Date”). Information that becomes known to the Fund after the NAV has been calculated on a particular day will not generally be used to retroactively adjust the NAV determined earlier that day. |
| b) | Investment Valuation and Fair Value Measurements – For purposes of calculating the NAV, portfolio securities and other assets held by the Fund's portfolio for which market quotes are readily available are valued at market value. Market value is generally determined on the basis of last reported sales prices or official close price. If no sales are reported, market value is based on quotes obtained from a quotation reporting system, established market makers, or independent pricing services. If market prices are not readily available or are deemed unreliable, the Fund will use the fair value of the security as determined in good faith under policies and procedures established by and under the supervision of the Company's Board of Directors. Market quotes are considered not readily available where there is an absence of current or reliable market-based data (e.g., trade information or broker quotes), including where events occur after the close of the relevant market, but prior to the NYSE Close that materially affect the values of the Fund's portfolio securities or assets. In addition, market quotes are considered not readily available when, due to extraordinary circumstances, the exchanges or markets on which the securities trade, do not open for trading for the entire day and no other market prices are available. In addition, prices of foreign equities that are principally traded on certain foreign markets are adjusted daily pursuant to a fair value pricing service approved by the Board of Directors in order to reflect an adjustment for the factors occurring after the close of certain foreign markets but before the NYSE Close. Securities that are primarily traded on foreign markets may trade on days that are not business days of the Fund. The value of the foreign securities, in which the Fund invests, may change on days when a shareholder will not be able to purchase or redeem shares of the Fund. Fair value pricing is subjective in nature and the use of fair value pricing by the Fund may cause the NAV of its |
shares to differ significantly from the NAV that would have been calculated using market prices at the close of the exchange on which a portfolio security is primarily traded. There can be no assurance that the Fund could obtain the fair market value assigned to a security if the Fund were to sell the security at approximately the time at which the Fund determines its NAV.
Investments valued in currencies other than U.S. dollars are converted to U.S. dollars using exchange rates obtained from independent pricing services for calculation of the NAV. As a result, the NAV of the Fund’s shares may be affected by changes in the value of currencies in relation to the U.S. dollar. The value of securities traded in markets outside the United States or denominated in currencies other than the U.S. dollar may be affected significantly on a day that the NYSE is closed and the market value may change on days when an investor is not able to purchase, redeem or exchange shares of the Fund.
Foreign currency contracts represent agreements to exchange currencies on specific future dates at predetermined rates. Foreign currency contracts are valued using foreign currency exchange rates and forward rates as provided by an independent pricing service on Valuation Date.
Financial instruments for which prices are not available from an independent pricing service may be valued using market quotations obtained from one or more dealers that make markets in the respective financial instrument in accordance with procedures established by the Company’s Board of Directors.
U.S. GAAP defines fair value as the price that the Fund would receive to sell an asset or pay to transfer a liability in an orderly transaction between market participants. The U.S. GAAP fair value measurement standards require disclosure of a fair value hierarchy for each major category of assets and liabilities. Various inputs are used in determining the fair value of the Fund’s investments. These inputs are summarized into three broad hierarchy levels. This hierarchy is based on whether the valuation inputs are observable or unobservable. These levels are:
| · | Level 1 – Quoted prices in active markets for identical securities. Level 1 may include exchange-traded instruments such as domestic equities, some foreign equities, options, futures, mutual funds, exchange-traded funds, rights and warrants. |
| · | Level 2 – Observable inputs other than Level 1 prices, such as quoted prices for similar securities; quoted prices in markets that are not active; or other inputs that are observable or can be corroborated by observable market data. Level 2 may include debt securities that are traded less frequently than exchange-traded instruments and which are valued using third party pricing services; foreign equities, whose value is determined using a multi-factor regression model with inputs that are observable in the market; and short-term securities, which are valued at amortized cost. |
| · | Level 3 – Significant unobservable inputs that are supported by limited or no market activity. Level 3 may include financial instruments whose values are determined using broker quotes or require significant management judgment or estimation. These unobservable valuation inputs may include estimates for current yields, maturity/duration, prepayment speed, and broker quotes for comparable securities along with other assumptions relating to credit quality, collateral value, complexity of the security structure, general market conditions and liquidity. This category may include securities where trading has been halted or there are certain restrictions on trading. While these securities are priced using unobservable inputs, the valuation of these securities reflects the best available data and management believes the prices are a reasonable representation of exit price. |
Valuation levels are not necessarily indicative of the risk associated with investing in such securities. Individual securities within any of the above mentioned asset classes may be assigned a different hierarchical level than those presented above, as individual circumstances dictate.
For additional information, refer to the Investment Valuation Hierarchy Level Summary and the Level 3 roll forward reconciliation which follow the Schedule of Investments.
Hartford Value HLS Fund |
| Notes to Financial Statements – (continued) |
| June 30, 2011 (Unaudited) |
| (000’s Omitted) |
For purposes of reporting transfers between different hierarchy levels, both transfers in and out of each level, as applicable, are shown as if they occurred at the beginning of the period.
| c) | Security Transactions and Investment Income – Security transactions are recorded as of the trade date (the date the order to buy or sell is executed) for financial reporting purposes. Securities purchased or sold on a when-issued or delayed-delivery basis may be settled a month or more after the trade date. Realized gains and losses are determined on the basis of identified cost. |
Dividend income is accrued as of the ex-dividend date, except that certain dividends from foreign securities where the ex-dividend date may have passed are recorded as soon as the Fund is informed of the dividend. Interest income, including amortization of premium and accretion of discounts, is accrued on a daily basis.
| d) | Foreign Currency Transactions – Assets and liabilities denominated in currencies other than U.S. dollars are translated into U.S. dollars at the exchange rates in effect on the valuation date. Purchases and sales of investment securities, income, and expenses are translated into U.S. dollars at the exchange rates on the dates of such transactions. |
The Fund does not isolate that portion of portfolio security valuation resulting from fluctuations in the foreign currency exchange rates from the fluctuations arising from changes in the market prices of securities held. Exchange rate fluctuations are included with the net realized and unrealized gain or loss on investments in the accompanying financial statements.
Net realized foreign exchange gains or losses arise from sales of foreign currencies and the difference between asset and liability amounts initially stated in foreign currencies and the U.S. dollar value of the amounts actually received or paid. Net unrealized foreign exchange gains or losses arise from changes in the value of other assets and liabilities at the end of the reporting period, resulting from changes in the exchange rates.
| e) | Joint Trading Account – The Fund may invest cash balances into a joint trading account that may be invested in one or more repurchase agreements. |
| f) | Fund Share Valuation and Dividend Distributions to Shareholders – Orders for the Fund’s shares are executed in accordance with the investment instructions of the contract holders and plan participants. The NAV of the Fund’s shares is determined as of the close of business on each business day of the Exchange. The NAV is determined separately for each class of shares of the Fund by dividing the Fund’s net assets attributable to that class by the number of shares of the class outstanding. Each class of shares offered by the Fund has equal rights as to assets and voting privileges (except that shareholders of a class have exclusive voting rights regarding any matter relating solely to that class of shares). Income and non-class specific expenses are allocated daily to each class on the basis of the relative net assets of the class. Realized and unrealized capital gains and losses of each class are allocated daily based on the relative net assets of each class of shares of the Fund. |
Orders for the purchase of the Fund’s shares received prior to the close of the Exchange on any day the Exchange is open for business are priced at the NAV determined as of the close of the Exchange. Orders received after the close of the Exchange, or on a day on which the Exchange and/or the Fund is not open for business, are priced at the next determined NAV.
Dividends are declared pursuant to a policy adopted by the Company’s Board of Directors based upon the investment performance of the Fund. The policy of the Fund is to pay dividends from net investment income and realized capital gains, if any, at least once a year.
Distributions from net investment income, net realized capital gains and capital are determined in accordance with federal income tax regulations, which may differ from U.S. GAAP with respect to character and timing. These differences may include but are not limited to losses deferred due to wash sale adjustments, foreign currency gains and
losses, adjustments related to Passive Foreign Investment Companies (“PFICs”), Real Estate Investment Trusts (“REITs”), Regulated Investment Companies (“RICs”), certain derivatives and partnerships. Permanent book and federal income tax basis differences relating to shareholder distributions will result in reclassifications to certain of the Fund’s capital accounts (see Federal Income Taxes: Reclassification of Capital Accounts note).
| 3. | Securities and Other Investments: |
| a) | Repurchase Agreements – A repurchase agreement is an agreement by which a counterparty agrees to sell a security and agrees to repurchase the security sold at a mutually agreed upon time and price. At the time the Fund enters into a repurchase agreement, the value of the underlying collateral security(ies), including accrued interest, will be equal to or exceed the value of the repurchase agreement. Repurchase agreements expose the Fund to counterparty risk. To minimize counterparty risk, the securities that serve to collateralize the repurchase agreement are held by the Fund's custodian in book entry or physical form in the custodial account of the Fund or in a third party custodial account. Repurchase agreements are valued at cost plus accrued interest. The Fund, as shown on the Schedule of Investments, had outstanding repurchase agreements as of June 30, 2011. |
| b) | Illiquid and Restricted Securities – The Fund is permitted to invest up to 15% of its net assets in illiquid securities. Illiquid securities are those that may not be sold or disposed of in the ordinary course of business within seven days, at approximately the price used to determine the Fund’s NAV. The Fund may not be able to sell illiquid securities or other investments when its sub-adviser considers it desirable to do so or may have to sell such securities or investments at a price that is lower than the price that could be obtained if the securities or investments were more liquid. A sale of illiquid securities or other investments may require more time and may result in higher dealer discounts and other selling expenses than does the sale of those that are liquid. Illiquid securities and investments also may be more difficult to value, due to the unavailability of reliable market quotations for such securities or investments, and an investment in them may have an adverse impact on the Fund’s NAV. The Fund may also purchase certain restricted securities that can only be resold to certain qualified investors and may be determined to be liquid pursuant to policies and guidelines established by the Company’s Board of Directors. The Fund, as shown on the Schedule of Investments, had illiquid and/or restricted securities as of June 30, 2011. |
| c) | Securities Purchased on a When-Issued or Delayed-Delivery Basis – Delivery and payment for securities that have been purchased by the Fund on a forward commitment, or when-issued or delayed-delivery basis, take place beyond the customary settlement period. During this period, such securities are subject to market fluctuations, and the Fund identifies securities segregated in its records with value at least equal to the amount of the commitment. The Fund had no outstanding when-issued or delayed delivery securities as of June 30, 2011. |
| 4. | Financial Derivative Instruments: |
The following disclosures contain information on how and why the Fund uses derivative instruments, the credit-risk-related contingent features in certain derivative instruments, and how derivative instruments affect the Fund’s financial position, results of operations and cash flows. The location and fair value amounts of these instruments on the Statement of Assets and Liabilities and the realized gains and losses and changes in unrealized gains and losses on the Statement of Operations, each categorized by type of derivative contract, are included in the following Additional Derivative Instrument Information footnote. The derivative instruments outstanding as of period-end are disclosed in the Notes to the Schedule of Investments and the amounts of realized gains and losses and changes in unrealized gains and losses on derivative instruments during the period are disclosed in the Statement of Operations.
| a) | Foreign Currency Contracts – The Fund may enter into foreign currency contracts that obligate the Fund to purchase or sell currencies at specified future dates. Foreign currency contracts are used to hedge the currency exposure associated with some or all of the Fund's securities and/or as part of an investment strategy. Foreign currency contracts are marked to market daily and the change in value is recorded by the Fund as an unrealized gain or loss. Realized gains or losses equal to the difference between the value of the contract at the time it was opened and the value at the time it was closed are recorded upon delivery or receipt of the currency. |
Hartford Value HLS Fund |
| Notes to Financial Statements – (continued) |
| June 30, 2011 (Unaudited) |
| (000’s Omitted) |
Foreign currency contracts involve elements of market risk in excess of the amounts reflected in the Statement of Assets and Liabilities. In addition, risks may arise upon entering into these contracts from the potential inability of the counterparties to meet the terms of the contracts and from unanticipated movements in the value of the foreign currencies relative to the U.S. dollar. The Fund had no outstanding foreign currency contracts as of June 30, 2011.
| b) | Additional Derivative Instrument Information: |
The volume of derivative activity was minimal during the six-month period ended June 30, 2011.
The Effect of Derivative Instruments on the Statement of Operations for the six-month period ended June 30, 2011:
| Risk Exposure Category | ||||||||||||||||||||||||||||
| Foreign | ||||||||||||||||||||||||||||
| Interest Rate | Exchange | Credit | Equity | Commodity | Other | |||||||||||||||||||||||
| Contracts | Contracts | Contracts | Contracts | Contracts | Contracts | Total | ||||||||||||||||||||||
| Realized Gain (Loss) on Derivatives Recognized as a Result from Operations: | ||||||||||||||||||||||||||||
Net realized gain on foreign currency contracts | $ | — | $ | 122 | $ | — | $ | — | $ | — | $ | — | $ | 122 | ||||||||||||||
| Total | $ | — | $ | 122 | $ | — | $ | — | $ | — | $ | — | $ | 122 | ||||||||||||||
| 5. | Principal Risks: |
| a) | Counterparty Risk – The Fund may be exposed to counterparty risk, or the risk that an institution or other entity with which the Fund has unsettled or open transactions will default. |
| b) | Market Risks – If a Fund invests directly in foreign currencies or in securities that trade in, and receive revenues in, foreign currencies, or in derivatives that provide exposure to foreign currencies, it will be subject to the risk that those currencies will decline in value relative to the base currency of the Fund, or, in the case of hedging positions, that the Fund’s base currency will decline in value relative to the currency being hedged. Currency rates in foreign countries may fluctuate significantly over short periods of time for a number of reasons, including changes in interest rates, intervention (or the failure to intervene) by U.S. or foreign governments, central banks or supranational entities such as the International Monetary Fund, or by the imposition of currency controls or other political developments in the United States or abroad. As a result, the Fund’s investments in foreign currency denominated securities may reduce the returns of the Fund. The market values of equity securities, such as common stocks and preferred stocks or equity related investments such as futures and options, may decline due to general market conditions which are not specifically related to a particular company, such as real or perceived adverse economic conditions, changes in the general outlook for corporate earnings, changes in interest or currency rates or adverse investor sentiment generally. The market value of equity securities may also decline due to factors which affect a particular industry or industries, such as labor shortages or increased production costs and competitive conditions within an industry. Equity securities and equity related investments generally have greater market price volatility than fixed income securities. |
| 6. | Federal Income Taxes: |
| a) | Federal Income Taxes – For federal income tax purposes, the Fund intends to continue to qualify as a RIC under Subchapter M of the Internal Revenue Code (“IRC”) by distributing substantially all of its taxable net investment income and net realized capital gains to its shareholders and otherwise complying with the requirements of RICs. The Fund has distributed substantially all of its income and capital gains in prior years, if applicable, and intends to distribute substantially all of its income and capital gains prior to the next fiscal year-end. Accordingly, no provision for federal income or excise taxes has been made in the accompanying financial statements. Distributions from short-term capital gains are treated as ordinary income distributions for federal income tax purposes. |
| b) | Net Investment Income (Loss), Net Realized Gains (Losses) – Net investment income (loss) and net realized gains (losses) may differ for financial statement and tax purposes primarily because of losses deferred due to wash sale |
adjustments, foreign currency gains and losses, adjustments related to PFICs, REITs, RICs, certain derivatives and partnerships. The character of distributions made during the year from net investment income or net realized gains may differ from their ultimate characterization for federal income tax purposes. Also, due to the timing of dividend distributions, the fiscal year in which amounts are distributed may differ from the year that the income or realized gains (losses) were recorded by the Fund.
| c) | Distributions and Components of Distributable Earnings – The tax character of distributions paid by the Fund for the periods indicated is as follows (as adjusted for dividends payable): |
| For the Year Ended | For the Year Ended | |||||||
| December 31, 2010 | December 31, 2009 | |||||||
| Ordinary Income | $ | 9,850 | $ | 5,020 | ||||
As of December 31, 2010, the Fund’s components of distributable earnings (deficit) on a tax basis were as follows:
| Amount | ||||
| Undistributed Ordinary Income | $ | 735 | ||
| Accumulated Capital and Other Losses* | (199,370 | ) | ||
Unrealized Appreciation† | 102,143 | |||
| Total Accumulated Deficit | $ | (96,492 | ) | |
| * | The Fund has capital loss carryforwards that are identified in the Capital Loss Carryforward note that follows. |
| † | The difference between book-basis and tax-basis unrealized appreciation (depreciation) may be attributable to the losses deferred due to wash sale adjustments, foreign currency gains and losses, adjustments related to PFICs, REITs, RICs, certain derivatives and partnerships. |
| d) | Reclassification of Capital Accounts – The Fund may record reclassifications in its capital accounts. These reclassifications have no impact on the total net assets of the Fund. The reclassifications are a result of permanent differences between U.S. GAAP and tax accounting for such items as expiration or utilization of capital loss carryforwards or net operating losses. Adjustments are made to reflect the impact these items have on current and future distributions to shareholders. Therefore, the source of the Fund’s distributable income may be shown in the accompanying Statement of Assets and Liabilities as from accumulated undistributed net investment income, from accumulated net realized gains on investments or from capital depending on the type of book and tax differences that exist. For the year ended December 31, 2010, the Fund recorded reclassifications to increase (decrease) the accounts listed below: |
| Amount | ||||
| Accumulated Undistributed Net Investment Income | $ | 249 | ||
| Accumulated Net Realized Gain (Loss) on Investments and Foreign Currency Transactions | (231 | ) | ||
| Capital Stock and Paid-in-Capital | (18 | ) | ||
Hartford Value HLS Fund |
| Notes to Financial Statements – (continued) |
| June 30, 2011 (Unaudited) |
| (000’s Omitted) |
| e) | Capital Loss Carryforward – At December 31, 2010 (tax-year-end), the Fund had capital loss carryforwards for U.S. federal income tax purposes of approximately: |
| Year of Expiration | Amount | |||
| 2015 | $ | 48,441 | ||
| 2016 | 106,920 | |||
| 2017 | 44,009 | |||
| Total | $ | 199,370 | ||
As a result of current or past mergers in the Fund, certain provisions in the Internal Revenue Code may limit the future utilization of capital losses. As of December 31, 2010, the Fund utilized $47,916 of prior year capital loss carryforwards.
| f) | Accounting for Uncertainty in Income Taxes – The Fund has adopted financial reporting rules that require the Fund to analyze all open tax years, as defined by the Statute of Limitations, for all major jurisdictions. Generally, tax authorities can examine all tax returns filed for the last three years. The Fund does not have an examination in progress. |
The Fund has reviewed all open tax years and major jurisdictions and concluded that these financial reporting rules had no effect on the Fund’s financial position or results of operations. There is no tax liability resulting from unrecognized tax benefits relating to uncertain income tax positions taken or expected to be taken on the tax return for the fiscal year-end December 31, 2010. The Fund is also not aware of any tax positions for which it is reasonably possible that the total amounts of unrecognized tax benefits will significantly change in the next twelve months.
| 7. | Expenses: |
| a) | Investment Management Agreements – HL Investment Advisors, LLC (“HL Advisors”), an indirect wholly owned subsidiary of The Hartford Financial Services Group, Inc. (“The Hartford”), serves as investment manager to the Fund pursuant to an Investment Management Ag reement with the Company. As investment manager, HL Advisors has overall investment supervisory responsibility for the Fund. In addition, HL Advisors provides administrative personnel, services, equipment, facilities and office space for proper operation of the Fund. HL Advisors has contracted with Wellington Management Company, LLP (“Wellington Management”) under a sub-advisory agreement for the provision of day-today investment management services to the Fund in accordance with the Fund’s investment objective and policies. The Fund pays a fee to HL Advisors, a portion of which may be used to compensate Wellington Management. |
The schedule below reflects the rates of compensation paid to HL Advisors for investment management services rendered as of June 30, 2011; the rates are accrued daily and paid monthly.
| Average Daily Net Assets | Annual Fee | |||
| On first $250 million | 0.7750 | % | ||
| On next $250 million | 0.7250 | % | ||
| On next $500 million | 0.6750 | % | ||
| On next $4 billion | 0.6250 | % | ||
| On next $5 billion | 0.6225 | % | ||
| Over $10 billion | 0.6200 | % | ||
| b) | Accounting Services Agreement – Pursuant to the Fund Accounting Agreement between HLIC and the Company, on behalf of the Fund, HLIC provides accounting services to the Fund and receives monthly compensation based on the Fund’s average net assets at the rates set forth below. The Fund’s accounting services fees are accrued daily and paid monthly. |
| Average Daily Net Assets | Annual Fee | |||
| All Assets | 0.010 | % | ||
| c) | Operating Expenses – Allocable expenses incurred by the Company are allocated to each Fund and allocated to classes within a Fund in proportion to the average daily net assets of the Fund and each class, except where allocation of certain expenses is more fairly made directly to the Fund or to specific classes within a Fund. |
| d) | Fees Paid Indirectly – The Company, on behalf of the Fund, has entered into agreements with State Street Global Markets, LLC and Russell Implementation Services, Inc. to partially recapture non-discounted trade commissions. Such rebates are used to pay a portion of the Fund’s expenses. In addition, the Fund’s custodian bank has also agreed to reduce its fees when the Fund maintains cash on deposit in a non-interest-bearing custody account. For the six-month period ended June 30, 2011, these amounts are included in the Statement of Operations. |
The ratio of expenses to average net assets in the accompanying financial highlights excludes the reduction in expenses related to fees paid indirectly. The annualized expense ratio for the period listed below including the fees paid indirectly is as follows:
| Annualized Six- | ||||
| Month Period | ||||
| Ended June 30, | ||||
| 2011 | ||||
| Class IA | 0.75 | % | ||
| Class IB | 1.00 | |||
| e) | Distribution Plan for Class IB shares – The Company, on behalf of the Fund, has adopted a Distribution Plan pursuant to Rule 12b-1 of the 1940 Act to compensate the Distributor, Hartford Securities Distribution Company, Inc. (a wholly owned, ultimate subsidiary of The Hartford), from assets attributable to the Class IB shares for services rendered and expenses borne in connection with activities primarily intended to result in the sale of the Class IB shares, subject to the review and approval of the Company’s Board of Directors. |
The Distribution Plan provides that the Fund may pay annually up to 0.25% of the average daily net assets of the Fund attributable to its Class IB shares for activities primarily intended to result in the sale of Class IB shares. The Board has the authority to suspend or reduce these payments at any point in time. Under the terms of the Distribution Plan and the principal underwriting agreement, the Fund is authorized to make payments monthly to the Distributor that may be used to pay or compensate entities providing distribution and shareholder servicing with respect to the Class IB shares for such entities’ fees or expenses incurred or paid in that regard. These fees are accrued daily and paid monthly.
| f) | Other Related Party Transactions – Certain officers of the Fund are directors and/or officers of HL Advisors and/or The Hartford or its subsidiaries. For the six-month period ended June 30, 2011, a portion of the Fund’s chief compliance officer’s salary was paid by all the investment companies in the Hartford fund complex. The portion allocated to the Fund was in the amount of $1. Hartford Administrative Services Company (“HASCO”), an indirect wholly owned subsidiary of The Hartford, provides transfer agent services to the Fund. The amount paid to HASCO can be found in the Statement of Operations. These fees are accrued daily and paid monthly. |
| g) | Payments from Affiliates – In July of 2007, The Hartford entered into a settlement with the Attorneys General of the states of New York, Connecticut and Illinois relating to market timing and the company's individual variable annuity contracts in which certain payments would be made directly to the variable annuity contract holders. The distribution |
| Hartford Value HLS Fund |
| Notes to Financial Statements – (continued) |
| June 30, 2011 (Unaudited) |
| (000’s Omitted) |
plan provided that unclaimed money from the settlement would be distributed to certain HLS Funds that are investment options through a Hartford individual variable annuity contract. The unclaimed money was distributed to the Fund on September 18, 2009, as follows:
| Amount | ||||
| Reimbursement | $ | 13 | ||
On November 8, 2006, the SEC issued an order setting forth the terms of a settlement reached with three subsidiaries of The Hartford that resolved the SEC’s Division of Enforcement’s investigation of aspects of The Hartford’s variable annuity and mutual fund operations related to directed brokerage and revenue sharing. The Hartford settled this matter without admitting or denying the findings of the SEC.
The total return in the accompanying financial highlights includes payments from affiliates. Had the payments from the affiliates been excluded, the impact and total return for the periods listed below would have been as follows:
| For the Year Ended December 31, 2009 | ||||||||
| Class IA | Class IB | |||||||
| Impact from Payment from Affiliate for Attorneys General Settlement | — | % | — | % | ||||
| Total Return Excluding Payment from Affiliate | 24.37 | 24.05 | ||||||
| For the Year Ended December 31, 2006 | ||||||||
| Class IA | Class IB | |||||||
| Impact from Payment from Affiliate for SEC Settlement | 0.01 | % | 0.01 | % | ||||
| Total Return Excluding Payment from Affiliate | 21.81 | 21.51 | ||||||
| 8. | Investment Transactions: |
For the six-month period ended June 30, 2011, the Fund's aggregate purchases and sales of investment securities (excluding short-term investments) were as follows:
| Amount | ||||
| Cost of Purchases Excluding U.S. Government Obligations | $ | 89,371 | ||
| Sales Proceeds Excluding U.S. Government Obligations | 190,995 | |||
| 9. | Line of Credit: |
The Fund is one of several Hartford funds that participate in a $500 million committed revolving line of credit facility. The facility is to be used for temporary or emergency purposes. Under the arrangement, a fund is required to own securities having a market value in excess of 300% of the total bank borrowings. The interest rate on borrowings varies depending on the nature of the loan. The facility also requires a fee to be paid based on the amount of the commitment. This commitment fee is allocated to all the funds participating in the line of credit based on the average net assets of the funds. During the six-month period ended June 30, 2011, the Fund did not have any borrowings under this facility.
| 10. | Industry Classifications: |
Other than the industry classifications “Other Investment Pools and Funds” and “Exchange Traded Funds,” equity industry classifications used in this report are the Global Industry Classification Standard, which was developed by and is the exclusive property and service mark of MSCI, Inc. and Standard & Poor’s.
| 11. | Indemnifications: |
Under the Company’s organizational documents, the Company shall indemnify its officers and directors to the full extent required or permitted under Maryland General Corporation Law and the federal securities laws. In addition, the Company, on behalf of the Fund, may enter into contracts that contain a variety of indemnifications. The Company’s maximum exposure under these arrangements is unknown. However, as of the date of these financial statements the Company has not had prior claims or losses pursuant to these contracts and expects the risk of loss to be remote.
| Hartford Value HLS Fund |
| - Selected Per-Share Data (A) - |
| Net Asset | Net Realized | Net Increase | ||||||||||||||||||||||||||||||||||||||||||
| Value at | and Unrealized | Total from | Dividends from | Distributions | (Decrease) in | Net Asset | ||||||||||||||||||||||||||||||||||||||
| Beginning of | Net Investment | Payments from | Gain (Loss) on | Investment | Net Investment | from Realized | Distributions | Total | Net Asset | Value at End of | ||||||||||||||||||||||||||||||||||
| Class | Period | Income (Loss) | (to) Affiliate | Investments | Operations | Income | Capital Gains | from Capital | Distributions | Value | Period | |||||||||||||||||||||||||||||||||
| For the Six-Month Period Ended June 30, 2011 (Unaudited) | ||||||||||||||||||||||||||||||||||||||||||||
| IA | $ | 10.77 | $ | 0.10 | $ | – | $ | 0.35 | $ | 0.45 | $ | – | $ | – | $ | – | $ | – | $ | 0.45 | $ | 11.22 | ||||||||||||||||||||||
| IB | 10.76 | 0.08 | – | 0.35 | 0.43 | – | – | – | – | 0.43 | 11.19 | |||||||||||||||||||||||||||||||||
| For the Year Ended December 31, 2010(G) | ||||||||||||||||||||||||||||||||||||||||||||
| IA | 9.50 | 0.13 | – | 1.26 | 1.39 | (0.12 | ) | – | – | (0.12 | ) | 1.27 | 10.77 | |||||||||||||||||||||||||||||||
| IB | 9.50 | 0.11 | – | 1.25 | 1.36 | (0.10 | ) | – | – | (0.10 | ) | 1.26 | 10.76 | |||||||||||||||||||||||||||||||
| For the Year Ended December 31, 2009 | ||||||||||||||||||||||||||||||||||||||||||||
| IA | 7.77 | 0.14 | – | 1.75 | 1.89 | (0.16 | ) | – | – | (0.16 | ) | 1.73 | 9.50 | |||||||||||||||||||||||||||||||
| IB | 7.77 | 0.13 | – | 1.74 | 1.87 | (0.14 | ) | – | – | (0.14 | ) | 1.73 | 9.50 | |||||||||||||||||||||||||||||||
| For the Year Ended December 31, 2008 | ||||||||||||||||||||||||||||||||||||||||||||
| IA | 12.83 | 0.20 | – | (4.36 | ) | (4.16 | ) | (0.20 | ) | (0.70 | ) | – | (0.90 | ) | (5.06 | ) | 7.77 | |||||||||||||||||||||||||||
| IB | 12.81 | 0.20 | – | (4.37 | ) | (4.17 | ) | (0.17 | ) | (0.70 | ) | – | (0.87 | ) | (5.04 | ) | 7.77 | |||||||||||||||||||||||||||
| For the Year Ended December 31, 2007 | ||||||||||||||||||||||||||||||||||||||||||||
| IA | 13.06 | 0.17 | – | 1.02 | 1.19 | (0.17 | ) | (1.25 | ) | – | (1.42 | ) | (0.23 | ) | 12.83 | |||||||||||||||||||||||||||||
| IB | 13.03 | 0.16 | – | 1.00 | 1.16 | (0.13 | ) | (1.25 | ) | – | (1.38 | ) | (0.22 | ) | 12.81 | |||||||||||||||||||||||||||||
| For the Year Ended December 31, 2006 | ||||||||||||||||||||||||||||||||||||||||||||
| IA | 11.18 | 0.15 | – | 2.23 | 2.38 | (0.15 | ) | (0.35 | ) | – | (0.50 | ) | 1.88 | 13.06 | ||||||||||||||||||||||||||||||
| IB | 11.14 | 0.13 | – | 2.21 | 2.34 | (0.10 | ) | (0.35 | ) | – | (0.45 | ) | 1.89 | 13.03 | ||||||||||||||||||||||||||||||
| (A) | Information presented relates to a share outstanding throughout the indicated period. |
| (B) | The figures do not include sales charges or other fees which may be applied at the variable life insurance, variable annuity or qualified retirement plan product level. Any such additional sales charges or other fees would lower the Fund's performance. |
| (C) | Ratios do not reflect reductions for fees paid indirectly. Please see Fees Paid Indirectly in the Notes to Financial Statements. |
| (D) | Portfolio turnover rate is calculated on the basis of the Fund as a whole without distinguishing between the classes of shares issued. |
| (E) | Not annualized. |
| (F) | Annualized. |
| (G) | Per share amounts have been calculated using the average shares method. |
| (H) | During the year ended December 31, 2010, the Fund incurred $269.8 million in sales associated with the transition of assets from Hartford Equity Income HLS Fund and Hartford Value Opportunities HLS Fund, which merged into the Fund on March 19, 2010. These sales were excluded from the portfolio turnover calculation. |
| (I) | Total return without the inclusion of the Payment from (to) Affiliate can be found in Expenses in the accompanying Notes to Financial Statements. |
| - Ratios and Supplemental Data - |
| Ratio of Expenses to Average Net | Ratio of Expenses to Average Net | Ratio of Net Investment Income to | Portfolio Turnover | |||||||||||||||||||
| Total Return(B) | Net Assets at End of Period | Assets Before Waivers(C) | Assets After Waivers(C) | Average Net Assets | Rate(D) | |||||||||||||||||
| 4.17 | %(E) | $ | 686,721 | 0.75 | %(F) | 0.75 | %(F) | 1.59 | %(F) | 10 | % | |||||||||||
| 4.04 | (E) | 132,950 | 1.00 | (F) | 1.00 | (F) | 1.34 | (F) | – | |||||||||||||
| 14.67 | 741,230 | 0.78 | 0.78 | 1.36 | 47 | (H) | ||||||||||||||||
| 14.38 | 154,731 | 1.03 | 1.03 | 1.11 | – | |||||||||||||||||
| 24.37 | (I) | 244,909 | 0.87 | 0.87 | 1.65 | 50 | ||||||||||||||||
| 24.06 | (I) | 63,003 | 1.12 | 1.12 | 1.40 | – | ||||||||||||||||
| (34.03 | ) | 217,460 | 0.84 | 0.84 | 1.87 | 57 | ||||||||||||||||
| (34.20 | ) | 63,338 | 1.09 | 1.09 | 1.62 | – | ||||||||||||||||
| 8.98 | 327,689 | 0.84 | 0.84 | 1.42 | 35 | |||||||||||||||||
| 8.70 | 131,651 | 1.09 | 1.09 | 1.14 | – | |||||||||||||||||
| 21.82 | (I) | 277,982 | 0.85 | 0.85 | 1.37 | 40 | ||||||||||||||||
| 21.52 | (I) | 148,135 | 1.10 | 1.10 | 1.10 | – | ||||||||||||||||
| Hartford Value HLS Fund |
The Board of Directors of the Company appoints officers who are responsible for the day-to-day operations of the Fund and who execute policies formulated by the Directors. Each director serves until his or her death, resignation, or retirement or until the next annual meeting of shareholders is held or until his or her successor is elected and qualifies.
Directors and officers who are employed by or who have a financial interest in The Hartford are considered “interested” persons of the Fund pursuant to the 1940 Act. Each officer and two of the Company’s directors, as noted in the chart below, are “interested” persons of the Fund. Each director serves as a director for The Hartford Mutual Funds, Inc., The Hartford Mutual Funds II, Inc., Hartford Series Fund, Inc., and Hartford HLS Series Fund II, Inc., which, as of June 30, 2011, collectively consist of 89 funds. Correspondence may be sent to directors and officers c/o Hartford Mutual Funds, P.O. Box 2999, Hartford, Connecticut 06104-2999, except that correspondence to Ms. Fagely may be sent to 500 Bielenberg Drive, Woodbury, Minnesota 55125.
The table below sets forth, for each director and officer, his or her name, year of birth, current position with the Company and date first elected or appointed to Hartford Series Fund, Inc. (“HSF”), and Hartford HLS Series Fund II, Inc. (“HSF2”), principal occupation, and, for directors, other directorships held. The Fund’s statement of additional information contains further information on the directors and is available free of charge by calling 1-800-862-6668 or writing to Hartford HLS Funds, c/o Individual Annuity Services, P.O. Box 5085, Hartford, CT 06102-5085.
Information on the aggregate remuneration paid to the directors of the Company can be found in the Statement of Operations herein. The Fund pays to The Hartford a portion of the chief compliance officer’s compensation, but does not pay salaries or compensation to any of their other officers or directors who are employed by The Hartford.
Non-Interested Directors
Lynn S. Birdsong (1946) Director since 2003, Co-Chairman of the Investment Committee
Mr. Birdsong is a private investor. Mr. Birdsong currently serves as a Director of the Sovereign High Yield Investment Company (April 2010 to current). Mr. Birdsong currently serves as an Independent Director of Nomura Partners Funds, Inc. (formerly, The Japan Fund) (March 2003 to current). From 2003 to March 2005, Mr. Birdsong was an independent director of the Atlantic Whitehall Funds. From 1979 to 2002, Mr. Birdsong was a managing director of Zurich Scudder Investments, an investment management firm. During his employment with Scudder, Mr. Birdsong was an Interested Director of The Japan Fund. Since 1981, Mr. Birdsong has been a partner in Birdsong Company, an advertising specialty firm.
Robert M. Gavin, Jr. (1940) Director since 2002 (HSF) and 1986 (HSF2), Chairman of the Board since 2004
Dr. Gavin is an educational consultant. Prior to September 1, 2001, he was President of Cranbrook Education Community and prior to July 1996, he was President of Macalester College, St. Paul, Minnesota.
Duane E. Hill (1945) Director since 2001 (HSF) and 2002 (HSF2), Chairman of the Nominating Committee
Mr. Hill is Partner of TSG Ventures L.P., a private equity investment company. Mr. Hill is a former partner of TSG Capital Group, a private equity investment firm that served as sponsor and lead investor in leveraged buyouts of middle market companies.
Sandra S. Jaffee (1941) Director since 2005
Ms. Jaffee served as Chairman (2008 to 2009) and Chief Executive Officer of Fortent (formerly Searchspace Group), a leading provider of compliance/regulatory technology to financial institutions from August 2005 to August 2009. From August 2004 to August 2005, Ms. Jaffee served as an Entrepreneur in Residence with Warburg Pincus, a private equity firm. From September 1995 to July 2004, Ms. Jaffee served as Executive Vice President at Citigroup, where she was President and Chief Executive Officer of Citibank’s Global Securities Services (1995 to 2003). Ms. Jaffe currently serves as a member of the Board of Directors of Broadridge Financial Solutions as well as a Trustee of Muhlenberg College.
William P. Johnston (1944) Director since 2005, Chairman of the Compliance Committee
In June 2006, Mr. Johnston was appointed as Senior Advisor to The Carlyle Group, a global private equity investment firm. In July 2006, Mr. Johnston was elected to the Board of Directors of MultiPlan, Inc. In August 2007, Mr. Johnston was elected to the Board of Directors of LifeCare Holdings, Inc. In February 2008, Mr. Johnston was elected to the Board of Directors of HCR-ManorCare, Inc. In May 2006, Mr. Johnston was elected to the Supervisory Board of Fresenius Medical Care AG & Co. KGaA, after its acquisition of Renal Care Group, Inc. in March 2006. Mr. Johnston joined Renal Care Group in November 2002 as a member of the Board of Directors and served as Chairman of the Board from March 2003 through March 2006. From September 1987 to December 2002, Mr. Johnston was with Equitable Securities Corporation (and its successors, SunTrust Equitable Securities and SunTrust Robinson Humphrey) serving in various investment banking and managerial positions, including Managing Director and Head of Investment Banking, Chief Executive Officer and Vice Chairman.
Phillip O. Peterson (1944) Director since 2002 (HSF) and 2000 (HSF2), Chairman of the Audit Committee
Mr. Peterson is a mutual fund industry consultant. He was a partner of KPMG LLP (an accounting firm) until July 1999. Mr. Peterson joined William Blair Funds in February 2007 as a member of the Board of Trustees. From January 2004 to April 2005, Mr. Peterson served as Independent President of the Strong Mutual Funds.
Lemma W. Senbet (1946) Director since 2005
Dr. Senbet is the William E. Mayer Chair Professor of Finance and Director, Center for Financial Policy, at the University of Maryland, Robert H. Smith School of Business. He was chair of the Finance Department from 1998 to 2006. Previously he was a chaired professor of finance at the University of Wisconsin-Madison. Also, he was director of the Fortis Funds from March 2000 to July 2002. Dr. Senbet served the finance profession in various capacities, including as director of the American Finance Association and President of the Western Finance Association. In 2006, Dr. Senbet was inducted Fellow of Financial Management Association International for his career-long distinguished scholarship and professional service.
Interested Directors and Officers
David N. Levenson (1966) Director since 2010
Mr. Levenson currently serves as President of The Hartford’s Wealth Management business. He was appointed to this role in July 2010. Previously, Mr. Levenson served as Executive Vice President of Legacy Holdings for The Hartford from June 2009 to July 2010. From 2006 to 2009, Mr. Levenson was with Hartford Life Insurance K.K. where he served as President and CEO from 2007 to 2009. He served as Managing Director of Hartford Investment Management Company from 2005 to 2006. Additionally, Mr. Levenson serves as Executive Vice President of The Hartford and as President, Director and Chief Executive Officer of Hartford Life Insurance Company (“HLIC”) and Hartford Life, Inc. (“HL Inc.”).
Lowndes A. Smith (1939) Director since 1996 (HSF) and 2002 (HSF2), Co-Chairman of the Investment Committee
Mr. Smith served as Vice Chairman of The Hartford from February 1997 to January 2002, as President and Chief Executive Officer of HL Inc. from February 1997 to January 2002, and as President and Chief Operating Officer of The Hartford Life Insurance Companies from January 1989 to January 2002. Mr. Smith serves as a Director of White Mountains Insurance Group, Ltd., One Beacon Insurance and Symetra Financial and as a Managing Director of Whittington Gray Associates.
Other Officers
James E. Davey (1964) President and Chief Executive Officer since 2010
Mr. Davey serves as Executive Vice President of HLIC. Additionally, Mr. Davey serves as President, Chief Executive Officer and Manager of Hartford Investment Financial Services, Inc. (“HIFSCO”) and President, Chief Executive Officer and Manager of HL Advisors. Mr. Davey joined The Hartford in 2002.
Tamara L. Fagely (1958) Vice President, Treasurer and Controller since 2002 (HSF) and 1993 (HSF2)
Ms. Fagely has been a Vice President of HASCO since 1998 and Chief Financial Officer since 2006. Currently Ms. Fagely is a Vice President of HLIC. She served as Assistant Vice President of HLIC from December 2001 through March 2005. In addition, Ms. Fagely is Controller and Chief Financial Officer of HIFSCO.
Susan M. Fleege (1959) AML Compliance Officer since 2011
Ms. Fleege currently serves as a Director of Risk Management at The Hartford. She previously served as AML Compliance Officer for the Fund from 2005-2008. Ms. Fleege joined HLIC in 2005 from Amerprise Financial Corporation where she held the position of Counsel from 2000 to 2005. Ms. Fleege is a certified Anti-Money Laundering Specialist.
Dr. Robert J. Froehlich (1953) Senior Managing Director since 2009
Dr. Froehlich joined The Hartford as Senior Managing Director in September 2009. Prior to joining The Hartford, Dr. Froehlich served as Vice Chairman of Deutsche Asset Management from 1997-2009.
Edward P. Macdonald (1967) Vice President, Secretary and Chief Legal Officer since 2005
Mr. Macdonald serves as Vice President of HLIC and Chief Legal Officer of Mutual Funds and Vice President of HIFSCO. He also serves as Vice President and Secretary of HASCO, and Chief Legal Officer, Secretary and Vice President of HL Advisors. Mr. Macdonald joined The Hartford in 2005.
| Hartford Value HLS Fund |
| Directors and Officers (Unaudited) – (continued) |
Vernon J. Meyer (1964) Vice President since 2006
Mr. Meyer serves as Senior Vice President of HLIC. He also serves as Senior Vice President of HIFSCO and HL Advisors. Mr. Meyer joined The Hartford in 2004.
Colleen B. Pernerewski (1969) Vice President and Chief Compliance Officer since 2010
Ms. Pernerewski serves as Vice President and Chief Investment Advisor Compliance Officer of HIFSCO and as Vice President and Chief Compliance Officer of HL Advisors. Ms. Pernerewski joined The Hartford in 2005 from Travelers Life and Annuity where she served as Counsel (2004-2005). Prior to Travelers Life and Annuity, Ms. Pernerewski held the position of Counsel at The Hartford (1998-2004).
Elizabeth L. Schroeder (1966) Vice President since 2010
Ms. Schroeder currently serves as Assistant Vice President of HLIC. Ms. Schroeder joined HLIC in 1991. She is also an Assistant Vice President of HIFSCO and HL Advisers.
Martin Swanson (1962) Vice President since 2010
Mr. Swanson is a Vice President of HLIC. Mr. Swanson also serves as Vice President/Marketing for HIFSCO. Prior to joining HLIC in 1998, Mr. Swanson was a Vice President at PaineWebber, Inc.
Jane Wolak (1961) Vice President since 2009
Ms. Wolak currently serves as Senior Vice President of HLIC. Ms. Wolak joined HLIC as Vice President, Retail Product Services in May 2007. She is also Vice President of HASCO. Previously, Ms. Wolak was with Sun Life Financial where she held the position of Vice President, Service Center Operations from 2001-2007.
A description of the policies and procedures that the Fund uses to determine how to vote proxies relating to portfolio securities and a record of how the Fund voted any proxies for the twelve-month period ended June 30, 2011 are available (1) without charge, upon request, by calling 800-862-6668 and (2) on the SEC’s website at http://www.sec.gov.
The Fund files a complete schedule of portfolio holdings with the SEC for the first and third quarters of each fiscal year on Form N-Q. The Fund’s Forms are available (1) without charge, upon request, by calling 800-862-6668 and (2) on the SEC’s website at http://www.sec.gov. The Form N-Q may be reviewed and copied at the SEC’s Public Reference Room in Washington, DC. Information on the operation of the Public Reference Room may be obtained by calling 1-800-SEC-0330.
| Hartford Value HLS Fund |
Your Fund's Expenses
As a shareholder of the Fund, you incur two types of costs: (1) transaction costs and (2) ongoing costs including investment management fees, distribution fees, and other fund expenses. This example is intended to help you understand your ongoing costs (in dollars) of investing in a Fund and to compare these costs with the ongoing costs of investing in other mutual funds. The example is based on an investment of $1,000 invested at the beginning of the period and held for the period of December 31, 2010 through June 30, 2011.
Actual Expenses
The first set of columns of the table below provides information about actual account values and actual expenses. You may use the information in this column, together with the amount you invested, to estimate the expenses that you paid over the period. Simply divide your account value by $1,000 (for example, an $8,600 account value divided by $1,000 = 8.6), then multiply the result by the number in the line under the heading entitled “Expenses Paid During Period” to estimate the expenses you paid on your account during this period.
Hypothetical Example for Comparison Purposes
The second set of columns of the table below provides information about hypothetical account values and hypothetical expenses based on a Fund's actual expense ratio and an assumed rate of return of 5% per year before expenses, which is not the Fund's actual return. The hypothetical account values and expenses may not be used to estimate the actual ending account balance or expenses you paid for the period. You may use this information to compare the ongoing costs of investing in a Fund and other funds. To do so, compare this 5% hypothetical example with the 5% hypothetical examples that appear in the shareholder reports of the other funds.
Please note that the expenses shown in the table are meant to highlight your ongoing costs only and do not reflect any transactional costs, such as sales charges (loads) and CDSC. Therefore, the second set of columns of the table is useful in comparing ongoing costs only, and will not help you determine the relative total costs of owning different funds. In addition, if these transactional costs were included, your costs would be higher. Expenses are equal to the Fund's annualized expense ratios multiplied by average account value over the period, multiplied by 181/365 (to reflect the one-half year period).
| Actual return | Hypothetical (5% return before expenses) | |||||||||||||||||||||||||||||||||||
| Expenses paid | Expenses paid | Days in | ||||||||||||||||||||||||||||||||||
| during the period | during the period | the | Days | |||||||||||||||||||||||||||||||||
| Beginning | Ending | December 31, 2010 | Beginning | Ending | December 31, 2010 | Annualized | current | in the | ||||||||||||||||||||||||||||
| Account Value | Account Value | through | Account Value | Account Value | through | expense | 1/2 | full | ||||||||||||||||||||||||||||
| December 31, 2010 | June 30, 2011 | June 30, 2011 | December 31, 2010 | June 30, 2011 | June 30, 2011 | ratio | year | year | ||||||||||||||||||||||||||||
| Class IA | $ | 1,000.00 | $ | 1,041.69 | $ | 3.80 | $ | 1,000.00 | $ | 1,021.08 | $ | 3.76 | 0.75 | % | 181 | 365 | ||||||||||||||||||||
| Class IB | $ | 1,000.00 | $ | 1,040.40 | $ | 5.06 | $ | 1,000.00 | $ | 1,019.84 | $ | 5.01 | 1.00 | % | 181 | 365 | ||||||||||||||||||||
27
| The Hartford | |
| P.O. Box 5085 | |
| Hartford, CT 06102-5085 |
Hartford Series Fund, Inc. is underwritten and distributed by Hartford Securities Distribution Company, Inc.
“The Hartford” is The Hartford Financial Services Group, Inc. and its subsidiaries.
Hartford Series Fund, Inc. inception dates range from 1977 to date. Hartford Series Fund, Inc. is not a subsidiary of The Hartford but is underwritten, distributed by and advised by subsidiaries of The Hartford. Investments in Hartford Series Fund, Inc. are not guaranteed by The Hartford or any other entity.
You should carefully consider investment objectives, risks, and charges and expenses of Hartford HLS Funds before investing. This and other information can be found in the Fund’s prospectus or summary prospectus, which can be obtained by calling 800-862-6668. Please read them carefully before you invest or send money.
HLSSAR-V11 8-11 | 106632 | Printed in U.S.A ©2011 The Hartford, Hartford, CT 06115 |
Item 2. Code of Ethics.
Not applicable to this semi-annual filing.
Item 3. Audit Committee Financial Expert.
Not applicable to this semi-annual filing.
Item 4. Principal Accountant Fees and Services.
Not applicable to this semi-annual filing.
Item 5. Audit Committee of Listed Registrants.
Not applicable to this semi-annual filing.
Item 6. Schedule of Investments
The Schedule of Investments is included as part of the semi-annual report filed under Item 1 of this form.
Item 7. Disclosure of Proxy Voting Policies and Procedures for Closed-End Management Investment Companies.
Not applicable.
Item 8. Portfolio Managers of Closed-End Management Investment Companies.
Not applicable.
Item 9. Purchases of Equity Securities by Closed-End Management Investment Company and Affiliated Purchasers.
Not applicable.
Item 10. Submission of Matters to a Vote of Security Holders
There have been no material changes to the procedures by which shareholders may recommend nominees to the registrant’s board of directors since registrant last provided disclosure in response to this requirement.
Item 11. Controls and Procedures.
| (a) | Based on an evaluation of the Registrant's Disclosure Controls and Procedures as of a date within 90 days of the filing date of this report, the Disclosure Controls and Procedures are effectively designed to ensure that information required to be disclosed by the Registrant is recorded, processed, summarized and reported by the date of this report, including ensuring that information required to be disclosed in the report is accumulated and communicated to the Registrant's management, including the Registrant's officers, as appropriate, to allow timely decisions regarding required disclosure. |
| (b) | There was no change in the Registrant's internal control over financial reporting that occurred during the Registrant’s last fiscal half year that has materially affected, or is reasonably likely to materially affect, the registrant’s internal control over financial reporting. |
Item 12. Exhibits.
| 11(a)(2) | Section 302 certifications of the principal executive officer and principal financial officer of Registrant. |
| (b) | Section 906 certification. |
SIGNATURES
Pursuant to the requirements of the Securities Exchange Act of 1934 and the Investment Company Act of 1940, the registrant has duly caused this report to be signed on its behalf by the undersigned, thereunto duly authorized.
HARTFORD SERIES FUND, INC.
Date: August 16, 2011 By: /s/ James E. Davey
James E. Davey
Its: President
Pursuant to the requirements of the Securities Exchange Act of 1934 and the Investment Company Act of 1940, this report has been signed below by the following persons on behalf of the registrant and in the capacities and on the dates indicated.
Date: August 16, 2011 By: /s/ James E. Davey
James E. Davey
Its: President
Date: August 16, 2011 By: /s/ Tamara L. Fagely
Tamara L. Fagely
Its: Vice President, Controller and Treasurer
EXHIBIT LIST
| 99.CERT | 11(a)(2) | Certifications |
| (i) Section 302 certification of principal executive officer | ||
| (ii) Section 302 certification of principal financial officer | ||
| 99.906CERT | 11(b) | Section 906 certification of principal executive officer and principal financial officer |