UNITED STATES
SECURITIES AND EXCHANGE COMMISSION
Washington, D.C. 20549
FORM N-CSR
CERTIFIED SHAREHOLDER REPORT OF REGISTERED MANAGEMENT INVESTMENT COMPANIES
Investment Company Act file number: 811-08629
HARTFORD SERIES FUND, INC.
(Exact name of registrant as specified in charter)
P. O. Box 2999, Hartford, Connecticut 06104-2999
(Address of Principal Executive Offices)
Edward P. Macdonald, Esquire
Life Law Unit
The Hartford Financial Services Group, Inc.
200 Hopmeadow Street
Simsbury, Connecticut 06089
(Name and Address of Agent for Service)
Registrant’s telephone number, including area code: (860) 843-9934
Date of fiscal year end: December 31st
Date of reporting period: January 1, 2012 – June 30, 2012
Form N-CSR is to be used by management investment companies to file reports with the Commission not later than 10 days after the transmission to stockholders of any report that is required to be transmitted to stockholders under Rule 30e-1 under the Investment Company Act of 1940 (17 CFR 270.30e-1). The Commission may use the information provided on Form N-CSR in its regulatory, disclosure review, inspection, and policymaking roles.
A registrant is required to disclose the information specified by Form N-CSR, and the Commission will make this information public. A registrant is not required to respond to the collection of information contained in Form N-CSR unless the Form displays a currently valid Office of Management and Budget ("OMB") control number. Please direct comments concerning the accuracy of the information collection burden estimate and any suggestions for reducing the burden to Secretary, Securities and Exchange Commission, 450 Fifth Street, NW, Washington, DC 20549-0609. The OMB has reviewed this collection of information under the clearance requirements of 44 U.S.C. § 3507.
Item 1. Reports to Stockholders.


A MESSAGE FROM THE PRESIDENT
Dear Fellow Shareholders:
I want to take this opportunity to say thank you for investing in the Hartford HLS Funds. We’ve seen continued market volatility throughout the first half of 2012, and there will likely be continued uncertainty until the Presidential election in November, but we are still optimistic about the markets in 2012.
Market Review
In the first quarter of 2012, the S&P 500 Index turned in its best quarterly performance since the third quarter of 2009. U.S. equities showed signs of improvement as investors focused on improving economic data and strong corporate earnings news and the Federal Reserve’s pledge to keep interest rates low buoyed investors’ appetites.
The second quarter ended on a high note for the stock market—the S&P 500 had its strongest June in more than a decade and the Dow Jones Industrial Average had its best month since October—but those gains weren’t enough to offset losses from April and May, and equities finished the quarter in the red. Although the S&P 500 was -2.75 for the second quarter, it was up 9.49% for the first half of 2012.
Concerns about domestic and European unemployment are having an effect on our economy. The unemployment rate in the euro zone's 17 nations rose to a record 11.1% in May, the highest level since the euro launched as a common currency more than 10 years ago. In the U.S., the labor market has been fickle this year, with job growth starting off strong in the first couple months of 2012 but slowing down in the spring, which has led many to wonder about the status of the economic recovery.
On a positive note, home prices are rising again after falling for more than five years, new and existing home sales are increasing, and home builders are ramping up construction.
The Hartford HLS Funds Expands Relationship with Wellington Management
We’re very pleased that we are expanding our relationship with Wellington Management, which will now serve as the primary sub-adviser for the Hartford HLS Funds including equity, fixed-income,* and asset-allocation funds. One of America’s oldest and largest investment management firms, Wellington Management has resources that span the entire globe, with multiple offices across the U.S. and numerous offices abroad. Wellington Management’s most distinctive strength is its proprietary research, which is shared across the entire organization.
We believe that aligning more closely with a well-respected money manager like Wellington Management puts us in a strong position to drive significant growth and to continue delivering innovative fund strategies to help our investors meet their financial goals.
Thank you again for investing with the Hartford HLS Funds.

James Davey
President
Hartford HLS Funds
*Several fixed-income funds will continue to be sub-advised by Hartford Investment Management Company.
Table of Contents
This report is prepared for the general information of contract owners and is not an offer of contracts. It should not be used in connection with any offer, except in conjunction with the appropriate product prospectus which contains all pertinent product information including the applicable sales, administrative and other charges.
| American Funds Asset Allocation HLS Fund inception 4/30/2008 | |
| (advised by HL Investment Advisors, LLC) Investment Goal: Seeks high total return (including income and capital gains) consistent with preservation of capital over the long term. | |
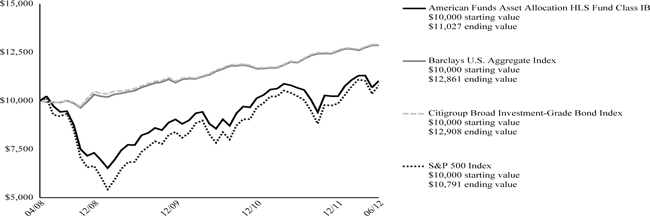
Performance Overview 4/30/08 - 6/30/12
Average Annual Total Returns (as of 6/30/12)
| 6 Month† | 1 Year | Since Inception | ||||||||||
| American Funds Asset Allocation HLS Fund IB | 7.72 | % | 3.38 | % | 2.37 | % | ||||||
| Barclays U.S. Aggregate Index | 2.37 | % | 7.47 | % | 6.22 | % | ||||||
| Citigroup Broad Investment-Grade Bond Index | 2.33 | % | 7.51 | % | 6.31 | % | ||||||
| S&P 500 Index | 9.48 | % | 5.43 | % | 1.84 | % | ||||||
| † | Not Annualized |
PAST PERFORMANCE IS NOT INDICATIVE OF FUTURE RESULTS.
Total returns presented above were calculated using the Fund's net asset value available to shareholders for sale or redemption of Fund shares on June 30, 2012, which may exclude investment transactions as of this date.
Barclays U.S. Aggregate Index (formerly know as Barclays Capital U.S. Aggregate Index) represents the U.S. investment-grade fixed-rate bond market. This index is unmanaged, and its results include reinvested dividends and/or distributions, but do not reflect the effect of sales charges, commissions, expenses or taxes.
Citigroup Broad Investment-Grade Bond Index is a market capitalization-weighted index that includes fixed-rate U.S. Treasury, government-sponsored, mortgage, asset-backed and investment-grade corporates with a maturity of one year or longer. This index is unmanaged, and its results include reinvested dividends and/or distributions, but do not reflect the effect of sales charges, commissions, expenses or taxes.
S&P 500 Index is a market capitalization-weighted price index composed of 500 widely held common stocks.
You cannot invest directly in an index.
The chart represents a hypothetical investment in the Fund. Performance data represents past performance and current performance could be higher or lower.
Performance information may reflect historical or current expense waivers/reimbursements from the investment adviser, without which performance would have been lower. For information on current expense waivers/reimbursements, please see the prospectus.
The value of the Fund will fluctuate so that when redeemed, it may be worth more or less than the original investment. The chart and table do not reflect the deductions of taxes, sales charges or other fees which may be applied at the variable life insurance, variable annuity or qualified retirement plan product level. Any such additional sales charges or other fees or expenses would lower the contract’s or plan’s performance.
How did the Fund perform?
The Class IB Shares of the American Funds Asset Allocation HLS Fund returned 7.72% for the six-month period ended June 30, 2012, versus the returns of 9.48% for the S&P 500 Index, 2.33% for the Citigroup Broad Investment-Grade Bond Index and 2.37% for the Barclays U.S. Aggregate Index. The Fund outperformed the 6.19% average return of the Lipper Mixed Asset Target Allocation Growth Funds VP-UF peer group, a group of funds with investment strategies similar to those of the Fund.
The performance of the American Funds Asset Allocation HLS Fund is directly related to the performance of the American Funds Insurance Series – Asset Allocation Fund Class 1, in which the Fund invests. The financial statements of the American Funds Insurance Series – Asset Allocation Fund Class 1, including the Schedule of Investments, are provided in the accompanying report and should be read in conjunction with the American Funds Asset Allocation HLS Fund’s financial statements.
| 2 |
| American Funds Blue Chip Income and Growth HLS Fund inception 4/30/2008 | |
| (advised by HL Investment Advisors, LLC) | |
| Investment Goal: Seeks to produce income exceeding theaverage yield of U.S. stocks generally (as represented by the average yield on the S&P Index) and to provide an opportunity for growth of principal consistent with sound common stock investing. | |
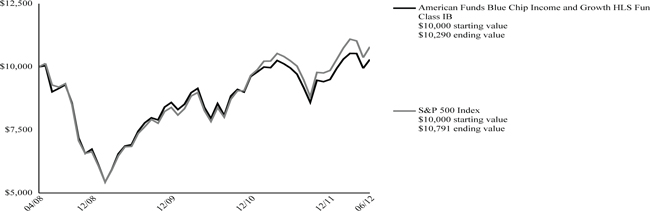
Performance Overview 4/30/08 - 6/30/12
Average Annual Total Returns (as of 6/30/12)
| 6 Month† | 1 Year | Since Inception | ||||||||||
| American Funds Blue Chip Income and Growth HLS Fund IB | 8.32 | % | 3.39 | % | 0.69 | % | ||||||
| S&P 500 Index | 9.48 | % | 5.43 | % | 1.84 | % | ||||||
| † | Not Annualized |
PAST PERFORMANCE IS NOT INDICATIVE OF FUTURE RESULTS.
Total returns presented above were calculated using the Fund's net asset value available to shareholders for sale or redemption of Fund shares on June 30, 2012, which may exclude investment transactions as of this date.
S&P 500 Index is a market capitalization-weighted price index composed of 500 widely held common stocks.
You cannot invest directly in an index.
The chart represents a hypothetical investment in the Fund. Performance data represents past performance and current performance could be higher or lower.
Performance information may reflect historical or current expense waivers/reimbursements from the investment adviser, without which performance would have been lower. For information on current expense waivers/reimbursements, please see the prospectus.
The value of the Fund will fluctuate so that when redeemed, it may be worth more or less than the original investment. The chart and table do not reflect the deductions of taxes, sales charges or other fees which may be applied at the variable life insurance, variable annuity or qualified retirement plan product level. Any such additional sales charges or other fees or expenses would lower the contract’s or plan’s performance.
How did the Fund perform?
The Class IB Shares of the American Funds Blue Chip Income and Growth HLS Fund returned 8.32% for the six-month period ended June 30, 2012, versus the return of 9.48% for the S&P 500 Index. The Fund outperformed the 7.71% average return of the Lipper Large Cap Core Funds VP-UF peer group, a group of funds with investment strategies similar to those of the Fund.
The performance of the American Funds Blue Chip Income and Growth HLS Fund is directly related to the performance of the American Funds Insurance Series – Blue Chip Income and Growth Fund Class 1, in which the Fund invests. The financial statements of the American Funds Insurance Series – Blue Chip Income and Growth Fund Class 1, including the Schedule of Investments, are provided in the accompanying report and should be read in conjunction with the American Funds Blue Chip Income and Growth HLS Fund’s financial statements.
| 3 |
| American Funds Bond HLS Fund inception 4/30/2008 | |
| (advised by HL Investment Advisors, LLC) | |
| Investment Goal: Seeks to maximize current income and preservation of capital. | |
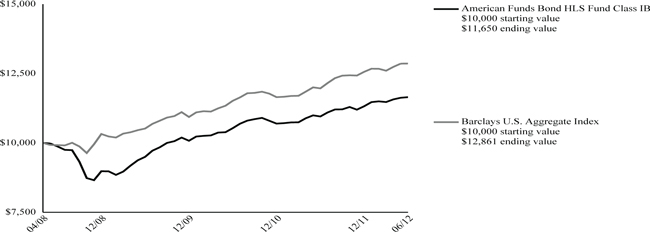
Performance Overview 4/30/08 - 6/30/12
Average Annual Total Returns (as of 6/30/12)
| 6 Month† | 1 Year | Since Inception | ||||||||||
| American Funds Bond HLS Fund IB | 2.89 | % | 6.36 | % | 3.73 | % | ||||||
| Barclays U.S. Aggregate Index | 2.37 | % | 7.47 | % | 6.22 | % | ||||||
| † | Not Annualized |
PAST PERFORMANCE IS NOT INDICATIVE OF FUTURE RESULTS.
Total returns presented above were calculated using the Fund's net asset value available to shareholders for sale or redemption of Fund shares on June 30, 2012, which may exclude investment transactions as of this date.
Barclays U.S. Aggregate Index (formerly know as Barclays Capital U.S. Aggregate Index) represents the U.S. investment-grade fixed-rate bond market. This index is unmanaged, and its results include reinvested dividends and/or distributions, but do not reflect the effect of sales charges, commissions, expenses or taxes.
You cannot invest directly in an index.
The chart represents a hypothetical investment in the Fund. Performance data represents past performance and current performance could be higher or lower.
Performance information may reflect historical or current expense waivers/reimbursements from the investment adviser, without which performance would have been lower. For information on current expense waivers/reimbursements, please see the prospectus.
The value of the Fund will fluctuate so that when redeemed, it may be worth more or less than the original investment. The chart and table do not reflect the deductions of taxes, sales charges or other fees which may be applied at the variable life insurance, variable annuity or qualified retirement plan product level. Any such additional sales charges or other fees or expenses would lower the contract’s or plan’s performance.
How did the Fund perform?
The Class IB Shares of the American Funds Bond HLS Fund returned 2.89% for the six-month period ended June 30, 2012, versus the return of 2.37% for the Barclays U.S. Aggregate Index. The Fund underperformed the 3.88% average return of the Lipper Corporate Debt Funds BBB-Rated VP-UF peer group, a group of funds with investment strategies similar to those of the Fund.
The performance of the American Funds Bond HLS Fund is directly related to the performance of the American Funds Insurance Series – Bond Fund Class 1, in which the Fund invests. The financial statements of the American Funds Insurance Series – Bond Fund Class 1, including the Schedule of Investments, are provided in the accompanying report and should be read in conjunction with the American Funds Bond HLS Fund’s financial statements.
| 4 |
| American Funds Global Bond HLS Fund inception 4/30/2008 | |
| (advised by HL Investment Advisors, LLC) | |
| Investment Goal: Seeks a high level of total return over the long term. | |
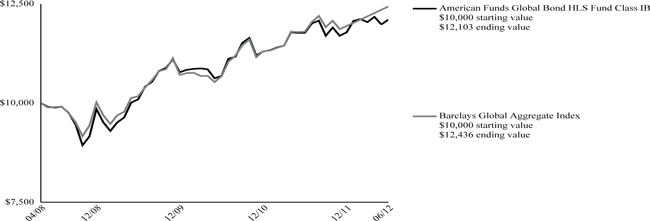
Performance Overview 4/30/08 - 6/30/12
Average Annual Total Returns (as of 6/30/12)
| 6 Month† | 1 Year | Since Inception | ||||||||||
| American Funds Global Bond HLS Fund IB | 2.71 | % | 2.81 | % | 4.68 | % | ||||||
| Barclays Global Aggregate Index | 4.11 | % | 5.37 | % | 5.37 | % | ||||||
| † | Not Annualized |
PAST PERFORMANCE IS NOT INDICATIVE OF FUTURE RESULTS.
Total returns presented above were calculated using the Fund's net asset value available to shareholders for sale or redemption of Fund shares on June 30, 2012, which may exclude investment transactions as of this date.
Barclays Global Aggregate Index (formerly know as Barclays Capital Aggregate Index) represents the global investment-grade fixed-income markets. This index is unmanaged and its results include reinvested dividends and/or distributions, but do not reflect the effect of sales charges, commissions, expenses or taxes.
You cannot invest directly in an index.
The chart represents a hypothetical investment in the Fund. Performance data represents past performance and current performance could be higher or lower.
Performance information may reflect historical or current expense waivers/reimbursements from the investment adviser, without which performance would have been lower. For information on current expense waivers/reimbursements, please see the prospectus.
The value of the Fund will fluctuate so that when redeemed, it may be worth more or less than the original investment. The chart and table do not reflect the deductions of taxes, sales charges or other fees which may be applied at the variable life insurance, variable annuity or qualified retirement plan product level. Any such additional sales charges or other fees or expenses would lower the contract’s or plan’s performance.
How did the Fund perform?
The Class IB Shares of the American Funds Global Bond HLS Fund returned 2.71% for the six-month period ended June 30, 2012, versus the return of 4.11% for the Barclays Global Aggregate Index. The Fund underperformed the 3.73% average return of the Lipper Global Income Funds VP-UF peer group, a group of funds with investment strategies similar to those of the Fund.
The performance of the American Funds Global Bond HLS Fund is directly related to the performance of the American Funds Insurance Series – Global Bond Fund Class 1, in which the Fund invests. The financial statements of the American Funds Insurance Series – Global Bond Fund Class 1, including the Schedule of Investments, are provided in the accompanying report and should be read in conjunction with the American Funds Global Bond HLS Fund’s financial statements.
| 5 |
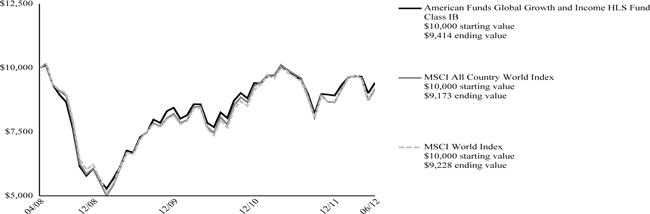
| American Funds Global Growth and Income HLS Fund inception 4/30/2008 | |
| (advised by HL Investment Advisors, LLC) | |
| Investment Goal: Seeks growth of capital over time and current income. | |
Performance Overview 4/30/08 - 6/30/12
Average Annual Total Returns (as of 6/30/12)
| 6 Month† | 1 Year | Since Inception | ||||||||||
| American Funds Global Growth and Income HLS Fund IB | 5.58 | % | -2.80 | % | -1.44 | % | ||||||
| MSCI All Country World Index | 6.01 | % | -5.96 | % | -2.05 | % | ||||||
| MSCI World Index | 6.29 | % | -4.41 | % | -1.91 | % | ||||||
| † | Not Annualized |
PAST PERFORMANCE IS NOT INDICATIVE OF FUTURE RESULTS.
Total returns presented above were calculated using the Fund's net asset value available to shareholders for sale or redemption of Fund shares on June 30, 2012, which may exclude investment transactions as of this date.
MSCI All Country World Index is a free float-adjusted market capitalization index that measures equity market performance in the global developed and emerging markets, consisting of 45 developed and emerging market country indices. This index is unmanaged, and its results include reinvested dividends and/or distributions, but do not reflect the effect of sales charges, commissions, expenses or taxes.
MSCI World Index is a free float-adjusted market capitalization index that is designed to measure global-developed market equity performance. The index consists of 23 developed-market country indices, including the United States. This index is unmanaged, and its results include reinvested dividends and/or distributions, but do not reflect the effect of sales charges, commissions, expenses or taxes.
You cannot invest directly in an index.
The chart represents a hypothetical investment in the Fund. Performance data represents past performance and current performance could be higher or lower.
Performance information may reflect historical or current expense waivers/reimbursements from the investment adviser, without which performance would have been lower. For information on current expense waivers/reimbursements, please see the prospectus.
The value of the Fund will fluctuate so that when redeemed, it may be worth more or less than the original investment. The chart and table do not reflect the deductions of taxes, sales charges or other fees which may be applied at the variable life insurance, variable annuity or qualified retirement plan product level. Any such additional sales charges or other fees or expenses would lower the contract’s or plan’s performance.
How did the Fund perform?
The Class IB Shares of the American Funds Global Growth and Income HLS Fund returned 5.58% for the six-month period ended June 30, 2012, versus the return of 6.01% for the MSCI All Country World Index and 6.29% for the MSCI World Index. The Fund underperformed the 6.34% average return of the Lipper Global Growth Funds VP-UF peer group, a group of funds with investment strategies similar to those of the Fund.
The performance of the American Funds Global Growth and Income HLS Fund is directly related to the performance of the American Funds Insurance Series – Global Growth and Income Fund Class 1, in which the Fund invests. The financial statements of the American Funds Insurance Series – Global Growth and Income Fund Class 1, including the Schedule of Investments, are provided in the accompanying report and should be read in conjunction with the American Funds Global Growth and Income HLS Fund’s financial statements.
| 6 |
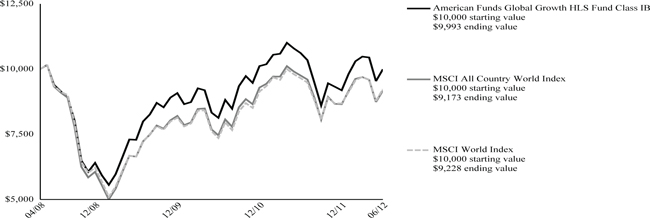
| American Funds Global Growth HLS Fund inception 4/30/2008 | |
| (advised by HL Investment Advisors, LLC) | |
| Investment Goal: Seeks long-term growth of capital. | |
Performance Overview 4/30/08 - 6/30/12
Average Annual Total Returns (as of 6/30/12)
| 6 Month† | 1 Year | Since Inception | ||||||||||
| American Funds Global Growth HLS Fund IB | 8.77 | % | -5.87 | % | -0.02 | % | ||||||
| MSCI All Country World Index | 6.01 | % | -5.96 | % | -2.05 | % | ||||||
| MSCI World Index | 6.29 | % | -4.41 | % | -1.91 | % | ||||||
| † | Not Annualized |
PAST PERFORMANCE IS NOT INDICATIVE OF FUTURE RESULTS.
Total returns presented above were calculated using the Fund's net asset value available to shareholders for sale or redemption of Fund shares on June 30, 2012, which may exclude investment transactions as of this date.
MSCI All Country World Index is a free float-adjusted market capitalization index that measures equity market performance in the global developed and emerging markets, consisting of 45 developed and emerging market country indices. This index is unmanaged, and its results include reinvested dividends and/or distributions, but do not reflect the effect of sales charges, commissions, expenses or taxes.
MSCI World Index is a free float-adjusted market capitalization index that is designed to measure global-developed market equity performance. The index consists of 23 developed-market country indices, including the United States. This index is unmanaged, and its results include reinvested dividends and/or distributions, but do not reflect the effect of sales charges, commissions, expenses or taxes.
You cannot invest directly in an index.
The chart represents a hypothetical investment in the Fund. Performance data represents past performance and current performance could be higher or lower.
Performance information may reflect historical or current expense waivers/reimbursements from the investment adviser, without which performance would have been lower. For information on current expense waivers/reimbursements, please see the prospectus.
The value of the Fund will fluctuate so that when redeemed, it may be worth more or less than the original investment. The chart and table do not reflect the deductions of taxes, sales charges or other fees which may be applied at the variable life insurance, variable annuity or qualified retirement plan product level. Any such additional sales charges or other fees or expenses would lower the contract’s or plan’s performance.
How did the Fund perform?
The Class IB Shares of the American Funds Global Growth HLS Fund returned 8.77% for the six-month period ended June 30, 2012, versus the return of 6.01% for the MSCI All Country World Index and 6.29% for the MSCI World Index. The Fund outperformed the 6.23% average return of the Lipper Global Core Funds VP-UF peer group, a group of funds with investment strategies similar to those of the Fund.
The performance of the American Funds Global Growth HLS Fund is directly related to the performance of the American Funds Insurance Series – Global Growth Fund Class 1, in which the Fund invests. The financial statements of the American Funds Insurance Series – Global Growth Fund Class 1, including the Schedule of Investments, are provided in the accompanying report and should be read in conjunction with the American Funds Global Growth HLS Fund’s financial statements.
| 7 |
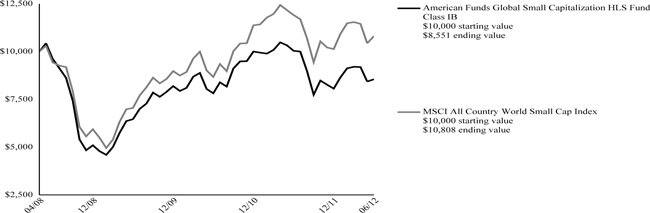
| American Funds Global Small Capitalization HLS Fund inception 4/30/2008 | |
| (advised by HL Investment Advisors, LLC) | |
| Investment Goal: Seeks growth of capital over time. | |
Performance Overview 4/30/08 - 6/30/12
Average Annual Total Returns (as of 6/30/12)
| 6 Month† | 1 Year | Since Inception | ||||||||||
| American Funds Global Small Capitalization HLS Fund IB | 6.08 | % | -14.83 | % | -3.68 | % | ||||||
| MSCI All Country World Small Cap Index | 6.69 | % | -9.27 | % | 1.88 | % | ||||||
| † | Not Annualized |
PAST PERFORMANCE IS NOT INDICATIVE OF FUTURE RESULTS.
Total returns presented above were calculated using the Fund's net asset value available to shareholders for sale or redemption of Fund shares on June 30, 2012, which may exclude investment transactions as of this date.
MSCI All Country World Small Cap Index is a free float-adjusted market capitalization-weighted index that is designed to measure equity market performance of smaller capitalization companies in both developed and emerging markets. This index is unmanaged and its results include reinvested dividends and/or distributions, but do not reflect the effect of sales charges, commissions, expenses or taxes.
You cannot invest directly in an index.
The chart represents a hypothetical investment in the Fund. Performance data represents past performance and current performance could be higher or lower.
Performance information may reflect historical or current expense waivers/reimbursements from the investment adviser, without which performance would have been lower. For information on current expense waivers/reimbursements, please see the prospectus.
The value of the Fund will fluctuate so that when redeemed, it may be worth more or less than the original investment. The chart and table do not reflect the deductions of taxes, sales charges or other fees which may be applied at the variable life insurance, variable annuity or qualified retirement plan product level. Any such additional sales charges or other fees or expenses would lower the contract’s or plan’s performance.
How did the Fund perform?
The Class IB Shares of the American Funds Global Small Capitalization HLS Fund returned 6.08% for the six-month period ended June 30, 2012, versus the return of 6.69% for the MSCI All Country World Small Cap Index. The Fund underperformed the 6.34% average return of the Lipper Global Growth Funds VP-UF peer group, a group of funds with investment strategies similar to those of the Fund.
The performance of the American Funds Global Small Capitalization HLS Fund is directly related to the performance of the American Funds Insurance Series – Global Small Capitalization Fund Class 1, in which the Fund invests. The financial statements of the American Funds Insurance Series – Global Small Capitalization Fund Class 1, including the Schedule of Investments, are provided in the accompanying report and should be read in conjunction with the American Funds Global Small Capitalization HLS Fund’s financial statements.
| 8 |
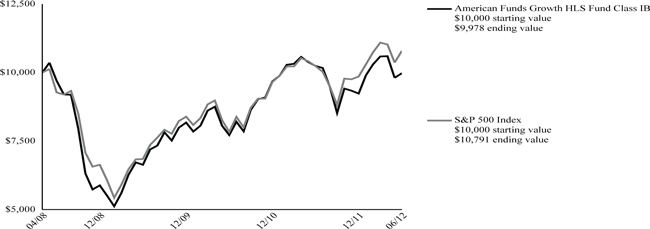
| American Funds Growth HLS Fund inception 4/30/2008 | |
| (advised by HL Investment Advisors, LLC) | |
| Investment Goal: Seeks growth of capital. | |
Performance Overview 4/30/08 - 6/30/12
Average Annual Total Returns (as of 6/30/12)
| 6 Month† | 1 Year | Since Inception | ||||||||||
| American Funds Growth HLS Fund IB | 8.04 | % | -2.58 | % | -0.05 | % | ||||||
| S&P 500 Index | 9.48 | % | 5.43 | % | 1.84 | % | ||||||
| † | Not Annualized |
PAST PERFORMANCE IS NOT INDICATIVE OF FUTURE RESULTS.
Total returns presented above were calculated using the Fund's net asset value available to shareholders for sale or redemption of Fund shares on June 30, 2012, which may exclude investment transactions as of this date.
S&P 500 Index is a market capitalization-weighted price index composed of 500 widely held common stocks.
You cannot invest directly in an index.
The chart represents a hypothetical investment in the Fund. Performance data represents past performance and current performance could be higher or lower.
Performance information may reflect historical or current expense waivers/reimbursements from the investment adviser, without which performance would have been lower. For information on current expense waivers/reimbursements, please see the prospectus.
The value of the Fund will fluctuate so that when redeemed, it may be worth more or less than the original investment. The chart and table do not reflect the deductions of taxes, sales charges or other fees which may be applied at the variable life insurance, variable annuity or qualified retirement plan product level. Any such additional sales charges or other fees or expenses would lower the contract’s or plan’s performance.
How did the Fund perform?
The Class IB Shares of the American Funds Growth HLS Fund returned 8.04% for the six-month period ended June 30, 2012, versus the return of 9.48% for the S&P 500 Index. The Fund underperformed the 10.17% average return of the Lipper Large Cap Growth Funds VP-UF peer group, a group of funds with investment strategies similar to those of the Fund.
The performance of the American Funds Growth HLS Fund is directly related to the performance of the American Funds Insurance Series – Growth Fund Class 1, in which the Fund invests. The financial statements of the American Funds Insurance Series – Growth Fund Class 1, including the Schedule of Investments, are provided in the accompanying report and should be read in conjunction with the American Funds Growth HLS Fund’s financial statements.
| 9 |
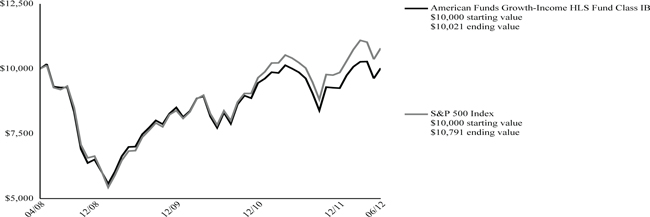
| American Funds Growth-Income HLS Fund inception 4/30/2008 | ||
| (advised by HL Investment Advisors, LLC) | ||
| Investment Goal: Seeks long-term growth of capital and income over time. | ||
Performance Overview 4/30/08 - 6/30/12
Average Annual Total Returns (as of 6/30/12)
| 6 Month† | 1 Year | Since Inception | ||||||||||
| American Funds Growth-Income HLS Fund IB | 8.30 | % | 1.60 | % | 0.05 | % | ||||||
| S&P 500 Index | 9.48 | % | 5.43 | % | 1.84 | % | ||||||
| † | Not Annualized |
PAST PERFORMANCE IS NOT INDICATIVE OF FUTURE RESULTS.
Total returns presented above were calculated using the Fund's net asset value available to shareholders for sale or redemption of Fund shares on June 30, 2012, which may exclude investment transactions as of this date.
S&P 500 Index is a market capitalization-weighted price index composed of 500 widely held common stocks.
You cannot invest directly in an index.
The chart represents a hypothetical investment in the Fund. Performance data represents past performance and current performance could be higher or lower.
Performance information may reflect historical or current expense waivers/reimbursements from the investment adviser, without which performance would have been lower. For information on current expense waivers/reimbursements, please see the prospectus.
The value of the Fund will fluctuate so that when redeemed, it may be worth more or less than the original investment. The chart and table do not reflect the deductions of taxes, sales charges or other fees which may be applied at the variable life insurance, variable annuity or qualified retirement plan product level. Any such additional sales charges or other fees or expenses would lower the contract’s or plan’s performance.
How did the Fund perform?
The Class IB Shares of the American Funds Growth-Income HLS Fund returned 8.30% for the six-month period ended June 30, 2012, versus the return of 9.48% for the S&P 500 Index. The Fund outperformed the 7.71% average return of the Lipper Large Cap Core Funds VP-UF peer group, a group of funds with investment strategies similar to those of the Fund.
The performance of the American Funds Growth-Income HLS Fund is directly related to the performance of the American Funds Insurance Series – Growth-Income Fund Class 1, in which the Fund invests. The financial statements of the American Funds Insurance Series – Growth-Income Fund Class 1, including the Schedule of Investments, are provided in the accompanying report and should be read in conjunction with the American Funds Growth-Income HLS Fund’s financial statements.
| 10 |
| American Funds International HLS Fund inception 4/30/2008 | |
| (advised by HL Investment Advisors, LLC) | |
| Investment Goal: Seeks long-term growth of capital over time. | |
Performance Overview 4/30/08 - 6/30/12

Average Annual Total Returns (as of 6/30/12)
| 6 Month† | 1 Year | Since Inception | ||||||||||
| American Funds International HLS Fund IB | 4.29 | % | -14.21 | % | -4.33 | % | ||||||
| MSCI All Country World ex USA Index | 3.13 | % | -14.15 | % | -5.09 | % | ||||||
| † | Not Annualized |
PAST PERFORMANCE IS NOT INDICATIVE OF FUTURE RESULTS.
Total returns presented above were calculated using the Fund's net asset value available to shareholders for sale or redemption of Fund shares on June 30, 2012, which may exclude investment transactions as of this date.
MSCI All Country World ex USA Index is a broad-based, unmanaged, market capitalization weighted, total return index that measures the performance of both developed and emerging stock markets, excluding the U.S. The index is calculated to exclude companies and share classes which cannot be freely purchased by foreigners.
You cannot invest directly in an index.
The chart represents a hypothetical investment in the Fund. Performance data represents past performance and current performance could be higher or lower.
Performance information may reflect historical or current expense waivers/reimbursements from the investment adviser, without which performance would have been lower. For information on current expense waivers/reimbursements, please see the prospectus.
The value of the Fund will fluctuate so that when redeemed, it may be worth more or less than the original investment. The chart and table do not reflect the deductions of taxes, sales charges or other fees which may be applied at the variable life insurance, variable annuity or qualified retirement plan product level. Any such additional sales charges or other fees or expenses would lower the contract’s or plan’s performance.
How did the Fund perform?
The Class IB Shares of the American Funds International HLS Fund returned 4.29% for the six-month period ended June 30, 2012, versus the return of 3.13% for the MSCI All Country World ex USA Index. The Fund outperformed the 3.83% average return of the Lipper International Core Funds VP-UF peer group, a group of funds with investment strategies similar to those of the Fund.
The performance of the American Funds International HLS Fund is directly related to the performance of the American Funds Insurance Series – International Fund Class 1, in which the Fund invests. The financial statements of the American Funds Insurance Series – International Fund Class 1, including the Schedule of Investments, are provided in the accompanying report and should be read in conjunction with the American Funds International HLS Fund’s financial statements.
| 11 |
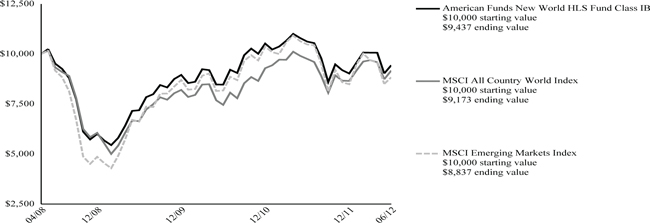
| American Funds New World HLS Fund inception 4/30/2008 | ||
| (advised by HL Investment Advisors, LLC) | ||
| Investment Goal: Seeks long-term capital appreciation. | ||
Performance Overview 4/30/08 - 6/30/12
Average Annual Total Returns (as of 6/30/12)
| 6 Month† | 1 Year | Since Inception | ||||||||||
| American Funds New World HLS Fund IB | 4.55 | % | -11.14 | % | -1.38 | % | ||||||
| MSCI All Country World Index | 6.01 | % | -5.96 | % | -2.05 | % | ||||||
| MSCI Emerging Markets Index | 4.12 | % | -15.67 | % | -2.92 | % | ||||||
| † | Not Annualized |
PAST PERFORMANCE IS NOT INDICATIVE OF FUTURE RESULTS.
Total returns presented above were calculated using the Fund's net asset value available to shareholders for sale or redemption of Fund shares on June 30, 2012, which may exclude investment transactions as of this date.
MSCI All Country World Index is a free float-adjusted market capitalization index that measures equity market performance in the global developed and emerging markets, consisting of 45 developed and emerging market country indices. This index is unmanaged, and its results include reinvested dividends and/or distributions, but do not reflect the effect of sales charges, commissions, expenses or taxes.
MSCI Emerging Markets Index is a free float-adjusted market capitalization-weighted index that is designed to measure equity market performance in the global emerging markets, consisting of 24 emerging market country indices. This index is unmanaged and its results include reinvested dividends and/or distributions, but do not reflect the effect of sales charges, commissions, expenses or taxes.
You cannot invest directly in an index.
The chart represents a hypothetical investment in the Fund. Performance data represents past performance and current performance could be higher or lower.
Performance information may reflect historical or current expense waivers/reimbursements from the investment adviser, without which performance would have been lower. For information on current expense waivers/reimbursements, please see the prospectus.
The value of the Fund will fluctuate so that when redeemed, it may be worth more or less than the original investment. The chart and table do not reflect the deductions of taxes, sales charges or other fees which may be applied at the variable life insurance, variable annuity or qualified retirement plan product level. Any such additional sales charges or other fees or expenses would lower the contract’s or plan’s performance.
How did the Fund perform?
The Class IB Shares of the American Funds New World HLS Fund returned 4.55% for the six-month period ended June 30, 2012, versus the returns of 6.01% for the MSCI All Country World Index and 4.12% for the MSCI Emerging Markets Index. The Fund outperformed the 4.21% average return of the Lipper Emerging Markets Funds VP-UF peer group, a group of funds with investment strategies similar to those of the Fund.
The performance of the American Funds New World HLS Fund is directly related to the performance of the American Funds Insurance Series – New World Fund Class 1, in which the Fund invests. The financial statements of the American Funds Insurance Series – New World Fund Class 1, including the Schedule of Investments, are provided in the accompanying report and should be read in conjunction with the American Funds New World HLS Fund’s financial statements.
| 12 |
| American Funds Asset Allocation HLS Fund |
| Schedule of Investments |
| June 30, 2012 (Unaudited) |
| (000’s Omitted) |
| Shares | Market Value ╪ | |||||||||||
| INVESTMENT COMPANIES - 100.0% | ||||||||||||
| 3,858 | American Funds Insurance Series - Asset Allocation Fund Class 1 | $ | 67,049 | |||||||||
| Total investment companies | ||||||||||||
| (cost $54,407) | $ | 67,049 | ||||||||||
| Total investments | ||||||||||||
| (cost $54,407) ▲ | 100 .0 | % | $ | 67,049 | ||||||||
| Other assets and liabilities | – | % | (13 | ) | ||||||||
| Total net assets | 100 .0 | % | $ | 67,036 | ||||||||
| Note: | Percentage of investments as shown is the ratio of the total market value to total net assets. |
| ▲ | At June 30, 2012, the cost of securities for federal income tax purposes was $56,238 and the aggregate gross unrealized appreciation and depreciation based on that cost were: |
| Unrealized Appreciation | $ | 10,811 | ||
| Unrealized Depreciation | — | |||
| Net Unrealized Appreciation | $ | 10,811 |
| ╪ | See Significant Accounting Policies of accompanying Notes to Financial Statements regarding valuation of securities. |
At June 30, 2012, the investment valuation hierarchy levels were:
| Assets: | ||||
| Investment in Securities - Level 1 | $ | 67,049 | ||
| Total | $ | 67,049 |
| American Funds Blue Chip Income and Growth HLS Fund |
| Schedule of Investments |
| June 30, 2012 (Unaudited) |
| (000’s Omitted) |
| Shares | Market Value ╪ | |||||||||||
| INVESTMENT COMPANIES - 100.0% | ||||||||||||
| 3,728 | American Funds Insurance Series - Blue Chip Income and Growth Fund Class 1 | $ | 36,314 | |||||||||
| Total investment companies | ||||||||||||
| (cost $28,531) | $ | 36,314 | ||||||||||
| Total investments | ||||||||||||
| (cost $28,531) ▲ | 100 .0 | % | $ | 36,314 | ||||||||
| Other assets and liabilities | – | % | (9 | ) | ||||||||
| Total net assets | 100 .0 | % | $ | 36,305 | ||||||||
| Note: | Percentage of investments as shown is the ratio of the total market value to total net assets. |
| ▲ | At June 30, 2012, the cost of securities for federal income tax purposes was $29,538 and the aggregate gross unrealized appreciation and depreciation based on that cost were: |
| Unrealized Appreciation | $ | 6,776 | ||
| Unrealized Depreciation | — | |||
| Net Unrealized Appreciation | $ | 6,776 |
| ╪ | See Significant Accounting Policies of accompanying Notes to Financial Statements regarding valuation of securities. |
At June 30, 2012, the investment valuation hierarchy levels were:
| Assets: | ||||
| Investment in Securities - Level 1 | $ | 36,314 | ||
| Total | $ | 36,314 |
The accompanying notes are an integral part of these financial statements.
| 13 |
| American Funds Bond HLS Fund |
| Schedule of Investments |
| June 30, 2012 (Unaudited) |
| (000’s Omitted) |
| Shares | Market Value ╪ | |||||||||||
| INVESTMENT COMPANIES - 100.0% | ||||||||||||
| 18,478 | American Funds Insurance Series - Bond Fund Class 1 | $ | 208,435 | |||||||||
| Total investment companies | ||||||||||||
| (cost $192,611) | $ | 208,435 | ||||||||||
| Total investments | ||||||||||||
| (cost $192,611) ▲ | 100 .0% | $ | 208,435 | |||||||||
| Other assets and liabilities | –% | (32 | ) | |||||||||
| Total net assets | 100 .0% | $ | 208,403 | |||||||||
| Note: | Percentage of investments as shown is the ratio of the total market value to total net assets. |
| ▲ | At June 30, 2012, the cost of securities for federal income tax purposes was $193,538 and the aggregate gross unrealized appreciation and depreciation based on that cost were: |
| Unrealized Appreciation | $ | 14,897 | ||
| Unrealized Depreciation | — | |||
| Net Unrealized Appreciation | $ | 14,897 |
╪ See Significant Accounting Policies of accompanying Notes to Financial Statements regarding valuation of securities.
At June 30, 2012, the investment valuation hierarchy levels were:
| Assets: | ||||
| Investment in Securities - Level 1 | $ | 208,435 | ||
| Total | $ | 208,435 |
| American Funds Global Bond HLS Fund |
| Schedule of Investments |
| June 30, 2012 (Unaudited) |
| (000’s Omitted) |
| Shares | Market Value ╪ | |||||||||||
| INVESTMENT COMPANIES - 100.0% | ||||||||||||
| 3,393 | American Funds Insurance Series - Global Bond Fund Class 1 | $ | 41,057 | |||||||||
| Total investment companies | ||||||||||||
| (cost $38,983) | $ | 41,057 | ||||||||||
| Total investments | ||||||||||||
| (cost $38,983) ▲ | 100 .0 | % | $ | 41,057 | ||||||||
| Other assets and liabilities | – | % | (11 | ) | ||||||||
| Total net assets | 100 .0 | % | $ | 41,046 | ||||||||
| Note: | Percentage of investments as shown is the ratio of the total market value to total net assets. |
| ▲ | At June 30, 2012, the cost of securities for federal income tax purposes was $39,133 and the aggregate gross unrealized appreciation and depreciation based on that cost were: |
| Unrealized Appreciation | $ | 1,924 | ||
| Unrealized Depreciation | — | |||
| Net Unrealized Appreciation | $ | 1,924 |
| ╪ | See Significant Accounting Policies of accompanying Notes to Financial Statements regarding valuation of securities. |
At June 30, 2012, the investment valuation hierarchy levels were:
| Assets: | ||||
| Investment in Securities - Level 1 | $ | 41,057 | ||
| Total | $ | 41,057 |
The accompanying notes are an integral part of these financial statements.
| 14 |
| American Funds Global Growth and Income HLS Fund |
| Schedule of Investments |
| June 30, 2012 (Unaudited) |
| (000’s Omitted) |
| Shares | Market Value ╪ | |||||||||||
| INVESTMENT COMPANIES - 100.0% | ||||||||||||
| 7,946 | American Funds Insurance Series - Global Growth and Income Fund Class 1 | $ | 76,919 | |||||||||
| Total investment companies | ||||||||||||
| (cost $58,901) | $ | 76,919 | ||||||||||
| Total investments | ||||||||||||
| (cost $58,901) ▲ | 100 .0% | $ | 76,919 | |||||||||
| Other assets and liabilities | –% | (15 | ) | |||||||||
| Total net assets | 100 .0% | $ | 76,904 | |||||||||
| Note: | Percentage of investments as shown is the ratio of the total market value to total net assets. |
| ▲ | At June 30, 2012, the cost of securities for federal income tax purposes was $60,786 and the aggregate gross unrealized appreciation and depreciation based on that cost were: |
| Unrealized Appreciation | $ | 16,133 | ||
| Unrealized Depreciation | — | |||
| Net Unrealized Appreciation | $ | 16,133 |
| ╪ | See Significant Accounting Policies of accompanying Notes to Financial Statements regarding valuation of securities. |
At June 30, 2012, the investment valuation hierarchy levels were:
| Assets: | ||||
| Investment in Securities - Level 1 | $ | 76,919 | ||
| Total | $ | 76,919 |
| American Funds Global Growth HLS Fund |
| Schedule of Investments |
| June 30, 2012 (Unaudited) |
| (000’s Omitted) |
| Shares | Market Value ╪ | |||||||||||
| INVESTMENT COMPANIES - 100.0% | ||||||||||||
| 1,409 | American Funds Insurance Series - Global Growth Fund Class 1 | $ | 29,794 | |||||||||
| Total investment companies | ||||||||||||
| (cost $23,497) | $ | 29,794 | ||||||||||
| Total investments | ||||||||||||
| (cost $23,497) ▲ | 100 .0 | % | $ | 29,794 | ||||||||
| Other assets and liabilities | – | % | (12 | ) | ||||||||
| Total net assets | 100 .0 | % | $ | 29,782 | ||||||||
| Note: | Percentage of investments as shown is the ratio of the total market value to total net assets. |
| ▲ | At June 30, 2012, the cost of securities for federal income tax purposes was $25,090 and the aggregate gross unrealized appreciation and depreciation based on that cost were: |
| Unrealized Appreciation | $ | 4,704 | ||
| Unrealized Depreciation | — | |||
| Net Unrealized Appreciation | $ | 4,704 |
| ╪ | See Significant Accounting Policies of accompanying Notes to Financial Statements regarding valuation of securities. |
At June 30, 2012, the investment valuation hierarchy levels were:
| Assets: | ||||
| Investment in Securities - Level 1 | $ | 29,794 | ||
| Total | $ | 29,794 |
The accompanying notes are an integral part of these financial statements.
| 15 |
| American Funds Global Small Capitalization HLS Fund |
| Schedule of Investments |
| June 30, 2012 (Unaudited) |
| (000’s Omitted) |
| Shares | Market Value ╪ | |||||||||||
| INVESTMENT COMPANIES - 100.0% | ||||||||||||
| 2,980 | American Funds Insurance Series - Global Small Capitalization Fund Class 1 | $ | 54,109 | |||||||||
| Total investment companies | ||||||||||||
| (cost $46,353) | $ | 54,109 | ||||||||||
| Total investments | ||||||||||||
| (cost $46,353) ▲ | 100 .0 | % | $ | 54,109 | ||||||||
| Other assets and liabilities | – | % | (16 | ) | ||||||||
| Total net assets | 100 .0 | % | $ | 54,093 | ||||||||
| Note: | Percentage of investments as shown is the ratio of the total market value to total net assets. |
| ▲ | At June 30, 2012, the cost of securities for federal income tax purposes was $48,766 and the aggregate gross unrealized appreciation and depreciation based on that cost were: |
| Unrealized Appreciation | $ | 5,343 | ||
| Unrealized Depreciation | — | |||
| Net Unrealized Appreciation | $ | 5,343 |
| ╪ | See Significant Accounting Policies of accompanying Notes to Financial Statements regarding valuation of securities. |
At June 30, 2012, the investment valuation hierarchy levels were:
| Assets: | ||||
| Investment in Securities - Level 1 | $ | 54,109 | ||
| Total | $ | 54,109 |
| American Funds Growth HLS Fund |
| Schedule of Investments |
| June 30, 2012 (Unaudited) |
| (000’s Omitted) |
| Shares | Market Value ╪ | |||||||||||
| INVESTMENT COMPANIES - 100.0% | ||||||||||||
| 5,884 | American Funds Insurance Series - Growth Fund Class 1 | $ | 330,841 | |||||||||
| Total investment companies | ||||||||||||
| (cost $228,440) | $ | 330,841 | ||||||||||
| Total investments | ||||||||||||
| (cost $228,440) ▲ | 100 .0 | % | $ | 330,841 | ||||||||
| Other assets and liabilities | – | % | (52 | ) | ||||||||
| Total net assets | 100 .0 | % | $ | 330,789 | ||||||||
| Note: | Percentage of investments as shown is the ratio of the total market value to total net assets. |
| ▲ | At June 30, 2012, the cost of securities for federal income tax purposes was $237,583 and the aggregate gross unrealized appreciation and depreciation based on that cost were: |
| Unrealized Appreciation | $ | 93,258 | ||
| Unrealized Depreciation | — | |||
| Net Unrealized Appreciation | $ | 93,258 |
| ╪ | See Significant Accounting Policies of accompanying Notes to Financial Statements regarding valuation of securities. |
At June 30, 2012, the investment valuation hierarchy levels were:
| Assets: | ||||
| Investment in Securities - Level 1 | $ | 330,841 | ||
| Total | $ | 330,841 |
The accompanying notes are an integral part of these financial statements.
| 16 |
| American Funds Growth-Income HLS Fund |
| Schedule of Investments |
| June 30, 2012 (Unaudited) |
| (000’s Omitted) |
| Shares | Market Value ╪ | |||||||||||
| INVESTMENT COMPANIES - 100.0% | ||||||||||||
| 4,964 | American Funds Insurance Series - Growth-Income Fund Class 1 | $ | 178,704 | |||||||||
| Total investment companies | ||||||||||||
| (cost $134,335) | $ | 178,704 | ||||||||||
| Total investments | ||||||||||||
| (cost $134,335) ▲ | 100 .0 | % | $ | 178,704 | ||||||||
| Other assets and liabilities | – | % | (24 | ) | ||||||||
| Total net assets | 100 .0 | % | $ | 178,680 | ||||||||
| Note: | Percentage of investments as shown is the ratio of the total market value to total net assets. |
| ▲ | At June 30, 2012, the cost of securities for federal income tax purposes was $138,085 and the aggregate gross unrealized appreciation and depreciation based on that cost were: |
| Unrealized Appreciation | $ | 40,619 | ||
| Unrealized Depreciation | — | |||
| Net Unrealized Appreciation | $ | 40,619 |
| ╪ | See Significant Accounting Policies of accompanying Notes to Financial Statements regarding valuation of securities. |
At June 30, 2012, the investment valuation hierarchy levels were:
| Assets: | ||||
| Investment in Securities - Level 1 | $ | 178,704 | ||
| Total | $ | 178,704 |
| American Funds International HLS Fund |
| Schedule of Investments |
| June 30, 2012 (Unaudited) |
| (000’s Omitted) |
| Shares | Market Value ╪ | |||||||||||
| INVESTMENT COMPANIES - 100.0% | ||||||||||||
| 13,275 | American Funds Insurance Series - International Fund Class 1 | $ | 210,937 | |||||||||
| Total investment companies | ||||||||||||
| (cost $190,606) | $ | 210,937 | ||||||||||
| Total investments | ||||||||||||
| (cost $190,606) ▲ | 100 .0 | % | $ | 210,937 | ||||||||
| Other assets and liabilities | – | % | (39 | ) | ||||||||
| Total net assets | 100 .0 | % | $ | 210,898 | ||||||||
| Note: | Percentage of investments as shown is the ratio of the total market value to total net assets. |
| ▲ | At June 30, 2012, the cost of securities for federal income tax purposes was $196,285 and the aggregate gross unrealized appreciation and depreciation based on that cost were: |
| Unrealized Appreciation | $ | 14,652 | ||
| Unrealized Depreciation | — | |||
| Net Unrealized Appreciation | $ | 14,652 |
| ╪ | See Significant Accounting Policies of accompanying Notes to Financial Statements regarding valuation of securities. |
At June 30, 2012, the investment valuation hierarchy levels were:
| Assets: | ||||
| Investment in Securities - Level 1 | $ | 210,937 | ||
| Total | $ | 210,937 |
The accompanying notes are an integral part of these financial statements.
| 17 |
| American Funds New World HLS Fund |
| Schedule of Investments |
| June 30, 2012 (Unaudited) |
| (000’s Omitted) |
| Shares | Market Value ╪ | |||||||||||
| INVESTMENT COMPANIES - 100.0% | ||||||||||||
| 2,506 | American Funds Insurance Series - New World Fund Class 1 | $ | 51,581 | |||||||||
| Total investment companies | ||||||||||||
| (cost $44,598) | $ | 51,581 | ||||||||||
| Total investments | ||||||||||||
| (cost $44,598) ▲ | 100 .0 | % | $ | 51,581 | ||||||||
| Other assets and liabilities | – | % | (15 | ) | ||||||||
| Total net assets | 100 .0 | % | $ | 51,566 | ||||||||
| Note: | Percentage of investments as shown is the ratio of the total market value to total net assets. |
| ▲ | At June 30, 2012, the cost of securities for federal income tax purposes was $46,661 and the aggregate gross unrealized appreciation and depreciation based on that cost were: |
| Unrealized Appreciation | $ | 4,920 | ||
| Unrealized Depreciation | — | |||
| Net Unrealized Appreciation | $ | 4,920 |
| ╪ | See Significant Accounting Policies of accompanying Notes to Financial Statements regarding valuation of securities. |
At June 30, 2012, the investment valuation hierarchy levels were:
| Assets: | ||||
| Investment in Securities - Level 1 | $ | 51,581 | ||
| Total | $ | 51,581 |
The accompanying notes are an integral part of these financial statements.
| 18 |
[This page is intentionally left blank]
| 19 |
| Hartford Series Fund, Inc. |
| Statements of Assets and Liabilities |
| June 30, 2012 (Unaudited) |
| (000’s Omitted) |
| American Funds Asset Allocation HLS Fund | American Funds Blue Chip Income and Growth HLS Fund | American Funds Bond HLS Fund | ||||||||||
| Assets: | ||||||||||||
| Investments in underlying funds, at market value @ | $ | 67,049 | $ | 36,314 | $ | 208,435 | ||||||
| Receivables: | ||||||||||||
| Investment securities sold | 376 | 82 | — | |||||||||
| Fund shares sold | 2 | 45 | 323 | |||||||||
| Other assets | 4 | 2 | 7 | |||||||||
| Total assets | 67,431 | 36,443 | 208,765 | |||||||||
| Liabilities: | ||||||||||||
| Payables: | ||||||||||||
| Investment securities purchased | — | — | 297 | |||||||||
| Fund shares redeemed | 377 | 126 | 22 | |||||||||
| Investment management fees | 6 | 4 | 14 | |||||||||
| Distribution fees | 2 | 1 | 7 | |||||||||
| Accrued expenses | 10 | 7 | 22 | |||||||||
| Total liabilities | 395 | 138 | 362 | |||||||||
| Net assets | $ | 67,036 | $ | 36,305 | $ | 208,403 | ||||||
| Summary of Net Assets: | ||||||||||||
| Capital stock and paid-in-capital | $ | 53,979 | $ | 27,638 | $ | 181,303 | ||||||
| Undistributed net investment income | 1,175 | 498 | 5,858 | |||||||||
| Accumulated net realized gain (loss) | (760 | ) | 386 | 5,418 | ||||||||
| Unrealized appreciation of investments | 12,642 | 7,783 | 15,824 | |||||||||
| Net assets | $ | 67,036 | $ | 36,305 | $ | 208,403 | ||||||
| Shares authorized | 200,000 | 200,000 | 200,000 | |||||||||
| Par value | $ | 0.001 | $ | 0.001 | $ | 0.001 | ||||||
| Class IB: Net asset value per share | $ | 10.45 | $ | 9.82 | $ | 10.83 | ||||||
| Shares outstanding | 6,415 | 3,696 | 19,248 | |||||||||
| Net assets | $ | 67,036 | $ | 36,305 | $ | 208,403 | ||||||
| @ Cost of underlying funds | $ | 54,407 | $ | 28,531 | $ | 192,611 | ||||||
The accompanying notes are an integral part of these financial statements.
| 20 |
| American Funds Global Bond HLS Fund | American Funds Global Growth and Income HLS Fund | American Funds Global Growth HLS Fund | American Funds Global Small Capitalization HLS Fund | American Funds Growth HLS Fund | American Funds Growth-Income HLS Fund | American Funds International HLS Fund | American Funds New World HLS Fund | |||||||||||||||||||||||
| $ | 41,057 | $ | 76,919 | $ | 29,794 | $ | 54,109 | $ | 330,841 | $ | 178,704 | $ | 210,937 | $ | 51,581 | |||||||||||||||
| 29 | 111 | — | 95 | 230 | 172 | 22 | 174 | |||||||||||||||||||||||
| 3 | 3 | 2 | 2 | 50 | 61 | 26 | 5 | |||||||||||||||||||||||
| 3 | 6 | 3 | 4 | 23 | 11 | 17 | 6 | |||||||||||||||||||||||
| 41,092 | 77,039 | 29,799 | 54,210 | 331,144 | 178,948 | 211,002 | 51,766 | |||||||||||||||||||||||
| — | — | — | — | — | — | — | — | |||||||||||||||||||||||
| 31 | 113 | 2 | 95 | 274 | 230 | 43 | 178 | |||||||||||||||||||||||
| 4 | 8 | 4 | 6 | 33 | 17 | 24 | 8 | |||||||||||||||||||||||
| 2 | 2 | 1 | 2 | 11 | 6 | 7 | 2 | |||||||||||||||||||||||
| 9 | 12 | 10 | 14 | 37 | 15 | 30 | 12 | |||||||||||||||||||||||
| 46 | 135 | 17 | 117 | 355 | 268 | 104 | 200 | |||||||||||||||||||||||
| $ | 41,046 | $ | 76,904 | $ | 29,782 | $ | 54,093 | $ | 330,789 | $ | 178,680 | $ | 210,898 | $ | 51,566 | |||||||||||||||
| $ | 35,717 | $ | 60,224 | $ | 24,243 | $ | 40,106 | $ | 233,293 | $ | 136,354 | $ | 193,906 | $ | 41,231 | |||||||||||||||
| 1,346 | 2,230 | 240 | 1,176 | 1,225 | 2,384 | 3,077 | 734 | |||||||||||||||||||||||
| 1,909 | (3,568 | ) | (998 | ) | 5,055 | (6,130 | ) | (4,427 | ) | (6,416 | ) | 2,618 | ||||||||||||||||||
| 2,074 | 18,018 | 6,297 | 7,756 | 102,401 | 44,369 | 20,331 | 6,983 | |||||||||||||||||||||||
| $ | 41,046 | $ | 76,904 | $ | 29,782 | $ | 54,093 | $ | 330,789 | $ | 178,680 | $ | 210,898 | $ | 51,566 | |||||||||||||||
| 200,000 | 200,000 | 200,000 | 200,000 | 200,000 | 200,000 | 200,000 | 200,000 | |||||||||||||||||||||||
| $ | 0.001 | $ | 0.001 | $ | 0.001 | $ | 0.001 | $ | 0.001 | $ | 0.001 | $ | 0.001 | $ | 0.001 | |||||||||||||||
| $ | 11.31 | $ | 8.85 | $ | 9.50 | $ | 8.30 | $ | 9.67 | $ | 9.54 | $ | 7.87 | $ | 9.05 | |||||||||||||||
| 3,628 | 8,693 | 3,134 | 6,514 | 34,218 | 18,723 | 26,805 | 5,698 | |||||||||||||||||||||||
| $ | 41,046 | $ | 76,904 | $ | 29,782 | $ | 54,093 | $ | 330,789 | $ | 178,680 | $ | 210,898 | $ | 51,566 | |||||||||||||||
| $ | 38,983 | $ | 58,901 | $ | 23,497 | $ | 46,353 | $ | 228,440 | $ | 134,335 | $ | 190,606 | $ | 44,598 | |||||||||||||||
The accompanying notes are an integral part of these financial statements.
| 21 |
| Hartford Series Fund, Inc. |
| Statements of Operations |
| For the Six-Month Period Ended June 30, 2012 (Unaudited) |
| (000’s Omitted) |
| American Funds Asset Allocation HLS Fund | American Funds Blue Chip Income and Growth HLS Fund | American Funds Bond HLS Fund | ||||||||||
| Investment Income: | ||||||||||||
| Dividends from underlying funds | $ | 331 | $ | 132 | $ | 1,039 | ||||||
| Total investment income | 331 | 132 | 1,039 | |||||||||
| Expenses: | ||||||||||||
| Investment management fees | 217 | 134 | 503 | |||||||||
| Distribution fees - Class IB | 84 | 45 | 252 | |||||||||
| Custodian fees | — | — | — | |||||||||
| Accounting services fees | 3 | 2 | 10 | |||||||||
| Board of Directors' fees | 1 | — | 2 | |||||||||
| Audit fees | 5 | 5 | 6 | |||||||||
| Other expenses | 6 | 4 | 20 | |||||||||
| Total expenses (before waivers) | 316 | 190 | 793 | |||||||||
| Expense waivers | (134 | ) | (89 | ) | (252 | ) | ||||||
| Total waivers | (134 | ) | (89 | ) | (252 | ) | ||||||
| Total expenses, net | 182 | 101 | 541 | |||||||||
| Net investment income (loss) | 149 | 31 | 498 | |||||||||
| Net Realized Gain (Loss) on Investments: | ||||||||||||
| Capital gain distribution received from underlying funds | — | — | — | |||||||||
| Net realized gain (loss) on investments in underlying funds | 931 | 1,126 | 1,946 | |||||||||
| Net Realized Gain (Loss) on Investments | 931 | 1,126 | 1,946 | |||||||||
| Net Changes in Unrealized Appreciation of Investments: | ||||||||||||
| Net unrealized appreciation (depreciation) of investments in underlying funds | 3,900 | 1,689 | 3,337 | |||||||||
| Net Gain on Investments | 4,831 | 2,815 | 5,283 | |||||||||
| Net Increase in Net Assets Resulting from Operations | $ | 4,980 | $ | 2,846 | $ | 5,781 | ||||||
The accompanying notes are an integral part of these financial statements.
| 22 |
| American Funds Global Bond HLS Fund | American Funds Global Growth and Income HLS Fund | American Funds Global Growth HLS Fund | American Funds Global Small Capitalization HLS Fund | American Funds Growth HLS Fund | American Funds Growth-Income HLS Fund | American Funds International HLS Fund | American Funds New World HLS Fund | |||||||||||||||||||||||
| $ | 378 | $ | 472 | $ | 17 | $ | 692 | $ | 1,024 | $ | 619 | $ | 200 | $ | 53 | |||||||||||||||
| 378 | 472 | 17 | 692 | 1,024 | 619 | 200 | 53 | |||||||||||||||||||||||
| 164 | 317 | 153 | 232 | 1,276 | 625 | 935 | 300 | |||||||||||||||||||||||
| 55 | 99 | 38 | 72 | 425 | 223 | 275 | 68 | |||||||||||||||||||||||
| — | — | — | — | — | — | — | — | |||||||||||||||||||||||
| 2 | 4 | 2 | 3 | 17 | 9 | 11 | 3 | |||||||||||||||||||||||
| 1 | 1 | 1 | 1 | 4 | 2 | 3 | 1 | |||||||||||||||||||||||
| 5 | 6 | 6 | 5 | 6 | 6 | 6 | 5 | |||||||||||||||||||||||
| 6 | 8 | 5 | 10 | 37 | 15 | 27 | 8 | |||||||||||||||||||||||
| 233 | 435 | 205 | 323 | 1,765 | 880 | 1,257 | 385 | |||||||||||||||||||||||
| (110 | ) | (218 | ) | (115 | ) | (159 | ) | (850 | ) | (402 | ) | (660 | ) | (231 | ) | |||||||||||||||
| (110 | ) | (218 | ) | (115 | ) | (159 | ) | (850 | ) | (402 | ) | (660 | ) | (231 | ) | |||||||||||||||
| 123 | 217 | 90 | 164 | 915 | 478 | 597 | 154 | |||||||||||||||||||||||
| 255 | 255 | (73 | ) | 528 | 109 | 141 | (397 | ) | (101 | ) | ||||||||||||||||||||
| 385 | — | — | — | — | — | — | — | |||||||||||||||||||||||
| 849 | 122 | 271 | 2,512 | 2,040 | 155 | (311 | ) | 1,886 | ||||||||||||||||||||||
| 1,234 | 122 | 271 | 2,512 | 2,040 | 155 | (311 | ) | 1,886 | ||||||||||||||||||||||
| (312 | ) | 3,966 | 2,373 | 471 | 23,581 | 13,768 | 9,902 | 684 | ||||||||||||||||||||||
| 922 | 4,088 | 2,644 | 2,983 | 25,621 | 13,923 | 9,591 | 2,570 | |||||||||||||||||||||||
| $ | 1,177 | $ | 4,343 | $ | 2,571 | $ | 3,511 | $ | 25,730 | $ | 14,064 | $ | 9,194 | $ | 2,469 | |||||||||||||||
The accompanying notes are an integral part of these financial statements.
| 23 |
| Hartford Series Fund, Inc. |
| Statements of Changes in Net Assets |
| (000’s Omitted) |
| American Funds Asset Allocation HLS Fund | American Funds Blue Chip Income and Growth HLS Fund | |||||||||||||||
| For the Six-Month Period Ended June 30, 2012 (Unaudited) | For the Year Ended December 31, 2011 | For the Six-Month Period Ended June 30, 2012 (Unaudited) | For the Year Ended December 31, 2011 | |||||||||||||
| Operations: | ||||||||||||||||
| Net investment income (loss) | $ | 149 | $ | 1,027 | $ | 31 | $ | 467 | ||||||||
| Net realized gain (loss) on investments | 931 | 68 | 1,126 | 322 | ||||||||||||
| Net unrealized appreciation (depreciation) of investments | 3,900 | (605 | ) | 1,689 | (1,140 | ) | ||||||||||
| Net increase (decrease) in net assets resulting from operations | 4,980 | 490 | 2,846 | (351 | ) | |||||||||||
| Distributions to Shareholders: | ||||||||||||||||
| From net investment income | ||||||||||||||||
| Class IB | — | (863 | ) | — | (8 | ) | ||||||||||
| From net realized gain on investments | ||||||||||||||||
| Class IB | — | (5 | ) | — | — | |||||||||||
| Total distributions | — | (868 | ) | — | (8 | ) | ||||||||||
| Capital Share Transactions: | ||||||||||||||||
| Class IB | ||||||||||||||||
| Sold | 5,799 | 13,867 | 6,091 | 5,896 | ||||||||||||
| Issued on reinvestment of distributions | — | 868 | — | 8 | ||||||||||||
| Redeemed | (8,099 | ) | (8,327 | ) | (5,057 | ) | (7,150 | ) | ||||||||
| Net increase (decrease) from capital share transactions | (2,300 | ) | 6,408 | 1,034 | (1,246 | ) | ||||||||||
| Net increase (decrease) in net assets | 2,680 | 6,030 | 3,880 | (1,605 | ) | |||||||||||
| Net Assets: | ||||||||||||||||
| Beginning of period | 64,356 | 58,326 | 32,425 | 34,030 | ||||||||||||
| End of period | $ | 67,036 | $ | 64,356 | $ | 36,305 | $ | 32,425 | ||||||||
| Undistributed (distribution in excess of) net investment income | $ | 1,175 | $ | 1,026 | $ | 498 | $ | 467 | ||||||||
| Shares: | ||||||||||||||||
| Class IB | ||||||||||||||||
| Sold | 564 | 1,409 | 638 | 650 | ||||||||||||
| Issued on reinvestment of distributions | — | 94 | — | 1 | ||||||||||||
| Redeemed | (783 | ) | (857 | ) | (518 | ) | (782 | ) | ||||||||
| Total share activity | (219 | ) | 646 | 120 | (131 | ) | ||||||||||
The accompanying notes are an integral part of these financial statements.
| 24 |
| American Funds Bond HLS Fund | American Funds Global Bond HLS Fund | American Funds Global Growth and Income HLS Fund | American Funds Global Growth HLS Fund | |||||||||||||||||||||||||||
| For the Six-Month Period Ended June 30, 2012 (Unaudited) | For the Year Ended December 31, 2011 | For the Six-Month Period Ended June 30, 2012 (Unaudited) | For the Year Ended December 31, 2011 | For the Six-Month Period Ended June 30, 2012 (Unaudited) | For the Year Ended December 31, 2011 | For the Six-Month Period Ended June 30, 2012 (Unaudited) | For the Year Ended December 31, 2011 | |||||||||||||||||||||||
| $ | 498 | $ | 5,360 | $ | 255 | $ | 1,075 | $ | 255 | $ | 1,975 | $ | (73 | ) | $ | 313 | ||||||||||||||
| 1,946 | 4,436 | 1,234 | 1,051 | 122 | (365 | ) | 271 | 309 | ||||||||||||||||||||||
| 3,337 | 2,021 | (312 | ) | (542 | ) | 3,966 | (6,146 | ) | 2,373 | (3,627 | ) | |||||||||||||||||||
| 5,781 | 11,817 | 1,177 | 1,584 | 4,343 | (4,536 | ) | 2,571 | (3,005 | ) | |||||||||||||||||||||
| — | (5,572 | ) | — | (962 | ) | — | (1,921 | ) | — | (363 | ) | |||||||||||||||||||
| — | (62 | ) | — | (316 | ) | — | — | — | — | |||||||||||||||||||||
| — | (5,634 | ) | — | (1,278 | ) | — | (1,921 | ) | — | (363 | ) | |||||||||||||||||||
| 20,310 | 34,811 | 1,897 | 13,479 | 2,019 | 4,913 | 1,157 | 4,927 | |||||||||||||||||||||||
| — | 5,634 | — | 1,278 | — | 1,921 | — | 363 | |||||||||||||||||||||||
| (15,891 | ) | (54,785 | ) | (6,380 | ) | (9,365 | ) | (8,097 | ) | (12,992 | ) | (3,265 | ) | (6,848 | ) | |||||||||||||||
| 4,419 | (14,340 | ) | (4,483 | ) | 5,392 | (6,078 | ) | (6,158 | ) | (2,108 | ) | (1,558 | ) | |||||||||||||||||
| 10,200 | (8,157 | ) | (3,306 | ) | 5,698 | (1,735 | ) | (12,615 | ) | 463 | (4,926 | ) | ||||||||||||||||||
| 198,203 | 206,360 | 44,352 | 38,654 | 78,639 | 91,254 | 29,319 | 34,245 | |||||||||||||||||||||||
| $ | 208,403 | $ | 198,203 | $ | 41,046 | $ | 44,352 | $ | 76,904 | $ | 78,639 | $ | 29,782 | $ | 29,319 | |||||||||||||||
| $ | 5,858 | $ | 5,360 | $ | 1,346 | $ | 1,091 | $ | 2,230 | $ | 1,975 | $ | 240 | $ | 313 | |||||||||||||||
| 1,897 | 3,348 | 169 | 1,191 | 229 | 547 | 122 | 508 | |||||||||||||||||||||||
| — | 541 | — | 113 | — | 234 | — | 42 | |||||||||||||||||||||||
| (1,484 | ) | (5,267 | ) | (567 | ) | (839 | ) | (921 | ) | (1,473 | ) | (344 | ) | (710 | ) | |||||||||||||||
| 413 | (1,378 | ) | (398 | ) | 465 | (692 | ) | (692 | ) | (222 | ) | (160 | ) | |||||||||||||||||
The accompanying notes are an integral part of these financial statements.
| 25 |
| Hartford Series Fund, Inc. |
| Statements of Changes in Net Assets – (continued) |
| (000’s Omitted) |
| American Funds Global Small Capitalization HLS Fund | American Funds Growth HLS Fund | |||||||||||||||
| For the Six-Month Period Ended June 30, 2012 (Unaudited) | For the Year Ended December 31, 2011 | For the Six-Month Period Ended June 30, 2012 (Unaudited) | For the Year Ended December 31, 2011 | |||||||||||||
| Operations: | ||||||||||||||||
| Net investment income (loss) | $ | 528 | $ | 649 | $ | 109 | $ | 1,116 | ||||||||
| Net realized gain (loss) on investments | 2,512 | 4,956 | 2,040 | 1,657 | ||||||||||||
| Net unrealized appreciation (depreciation) of investments | 471 | (18,721 | ) | 23,581 | (16,989 | ) | ||||||||||
| Net increase (decrease) in net assets resulting from operations | 3,511 | (13,116 | ) | 25,730 | (14,216 | ) | ||||||||||
| Distributions to Shareholders: | ||||||||||||||||
| From net investment income | ||||||||||||||||
| Class IB | — | (866 | ) | — | (10 | ) | ||||||||||
| From net realized gain on investments | ||||||||||||||||
| Class IB | — | (360 | ) | — | — | |||||||||||
| Total distributions | — | (1,226 | ) | — | (10 | ) | ||||||||||
| Capital Share Transactions: | ||||||||||||||||
| Class IB | ||||||||||||||||
| Sold | 1,419 | 9,505 | 16,433 | 32,641 | ||||||||||||
| Issued on reinvestment of distributions | — | 1,226 | — | 10 | ||||||||||||
| Redeemed | (6,495 | ) | (15,730 | ) | (29,342 | ) | (56,619 | ) | ||||||||
| Net increase (decrease) from capital share transactions | (5,076 | ) | (4,999 | ) | (12,909 | ) | (23,968 | ) | ||||||||
| Net increase (decrease) in net assets | (1,565 | ) | (19,341 | ) | 12,821 | (38,194 | ) | |||||||||
| Net Assets: | ||||||||||||||||
| Beginning of period | 55,658 | 74,999 | 317,968 | 356,162 | ||||||||||||
| End of period | $ | 54,093 | $ | 55,658 | $ | 330,789 | $ | 317,968 | ||||||||
| Undistributed (distribution in excess of) net investment income | $ | 1,176 | $ | 648 | $ | 1,225 | $ | 1,116 | ||||||||
| Shares: | ||||||||||||||||
| Class IB | ||||||||||||||||
| Sold | 168 | 1,071 | 1,679 | 3,537 | ||||||||||||
| Issued on reinvestment of distributions | — | 147 | — | 1 | ||||||||||||
| Redeemed | (764 | ) | (1,667 | ) | (2,996 | ) | (5,986 | ) | ||||||||
| Total share activity | (596 | ) | (449 | ) | (1,317 | ) | (2,448 | ) | ||||||||
The accompanying notes are an integral part of these financial statements.
| 26 |
| American Funds Growth-Income HLS Fund | American Funds International HLS Fund | American Funds New World HLS Fund | ||||||||||||||||||||
| For the Six-Month Period Ended June 30, 2012 (Unaudited) | For the Year Ended December 31, 2011 | For the Six-Month Period Ended June 30, 2012 (Unaudited) | For the Year Ended December 31, 2011 | For the Six-Month Period Ended June 30, 2012 (Unaudited) | For the Year Ended December 31, 2011 | |||||||||||||||||
| $ | 141 | $ | 2,243 | $ | (397 | ) | $ | 3,474 | $ | (101 | ) | $ | 836 | |||||||||
| 155 | (381 | ) | (311 | ) | (625 | ) | 1,886 | 3,019 | ||||||||||||||
| 13,768 | (5,655 | ) | 9,902 | (35,372 | ) | 684 | (13,070 | ) | ||||||||||||||
| 14,064 | (3,793 | ) | 9,194 | (32,523 | ) | 2,469 | (9,215 | ) | ||||||||||||||
| — | (2 | ) | — | (3,792 | ) | — | (797 | ) | ||||||||||||||
| — | — | — | — | — | — | |||||||||||||||||
| — | (2 | ) | — | (3,792 | ) | — | (797 | ) | ||||||||||||||
| 12,470 | 15,378 | 8,155 | 35,399 | 2,783 | 9,630 | |||||||||||||||||
| — | 2 | — | 3,792 | — | 797 | |||||||||||||||||
| (17,913 | ) | (27,362 | ) | (14,850 | ) | (30,179 | ) | (6,255 | ) | (20,103 | ) | |||||||||||
| (5,443 | ) | (11,982 | ) | (6,695 | ) | 9,012 | (3,472 | ) | (9,676 | ) | ||||||||||||
| 8,621 | (15,777 | ) | 2,499 | (27,303 | ) | (1,003 | ) | (19,688 | ) | |||||||||||||
| 170,059 | 185,836 | 208,399 | 235,702 | 52,569 | 72,257 | |||||||||||||||||
| $ | 178,680 | $ | 170,059 | $ | 210,898 | $ | 208,399 | $ | 51,566 | $ | 52,569 | |||||||||||
| $ | 2,384 | $ | 2,243 | $ | 3,077 | $ | 3,474 | $ | 734 | $ | 835 | |||||||||||
| 1,326 | 1,719 | 1,025 | 4,305 | 301 | 982 | |||||||||||||||||
| — | — | — | 488 | — | 88 | |||||||||||||||||
| (1,901 | ) | (3,063 | ) | (1,843 | ) | (3,471 | ) | (676 | ) | (2,055 | ) | |||||||||||
| (575 | ) | (1,344 | ) | (818 | ) | 1,322 | (375 | ) | (985 | ) | ||||||||||||
The accompanying notes are an integral part of these financial statements.
| 27 |
| Hartford Series Fund, Inc. |
| Notes to Financial Statements |
| June 30, 2012 (Unaudited) |
| (000’s Omitted) |
| 1. | Organization: |
The Hartford HLS Funds serve as underlying investment options for certain variable annuity and variable life insurance separate accounts of Hartford Life Insurance Company (“HLIC”) and its affiliates and certain qualified retirement plans. Certain Hartford HLS Funds may also serve as underlying investment options for certain variable annuity and variable life separate accounts of other insurance companies. Owners of variable annuity contracts and policyholders of variable life insurance contracts may choose the funds permitted in the variable insurance contract prospectus. In addition, participants in certain qualified retirement plans may choose the funds if permitted by their plans.
Hartford Series Fund, Inc. (the “Company”) is an open-end management investment company comprised of thirty portfolios, eleven portfolios of which are included in these financial statements (each a “Fund” or together the “Funds”). These eleven portfolios of the Company are American Funds Asset Allocation HLS Fund, American Funds Blue Chip Income and Growth HLS Fund, American Funds Bond HLS Fund, American Funds Global Bond HLS Fund, American Funds Global Growth and Income HLS Fund, American Funds Global Growth HLS Fund, American Funds Global Small Capitalization HLS Fund, American Funds Growth HLS Fund, American Funds Growth-Income HLS Fund, American Funds International HLS Fund and American Funds New World HLS Fund.
The Company is organized under the laws of the State of Maryland and is registered with the Securities and Exchange Commission (“SEC”) under the Investment Company Act of 1940, as amended (“1940 Act”). Each Fund is organized as a diversified open-end management investment company, except for American Funds Global Bond HLS Fund, which is non-diversified.
Each Fund operates in the manner of a fund of funds, investing in shares of underlying mutual funds (the “Underlying Funds”). Each Underlying Fund is offered by American Funds Insurance Series, and is a registered open-end investment company. The Funds and their related Underlying Funds are listed below:
| Fund | Underlying Fund | |
| American Funds Asset Allocation HLS Fund | Asset Allocation Fund Class 1 | |
| American Funds Blue Chip Income and Growth HLS Fund | Blue Chip Income and Growth Fund Class 1 | |
| American Funds Bond HLS Fund | Bond Fund Class 1 | |
| American Funds Global Bond HLS Fund | Global Bond Fund Class 1 | |
| American Funds Global Growth and Income HLS Fund | Global Growth and Income Fund Class 1 | |
| American Funds Global Growth HLS Fund | Global Growth Fund Class 1 | |
| American Funds Global Small Capitalization HLS Fund | Global Small Capitalization Fund Class 1 | |
| American Funds Growth HLS Fund | �� | Growth Fund Class 1 |
| American Funds Growth-Income HLS Fund | Growth-Income Fund Class 1 | |
| American Funds International HLS Fund | International Fund Class 1 | |
| American Funds New World HLS Fund | New World Fund Class 1 |
The Underlying Funds’ accounting policies are outlined in the Underlying Funds’ shareholder report, which accompanies this report.
Class IB shares of the Funds are offered at the per share net asset value (“NAV”) without a sales charge and are subject to distribution fees charged pursuant to a Distribution and Service Plan. The Distribution and Service Plan has been adopted in accordance with Rule 12b-1 under the 1940 Act.
| 28 |
| 2. | Significant Accounting Policies: |
The following is a summary of significant accounting policies of the Funds in the preparation of their financial statements, which are in accordance with the United States Generally Accepted Accounting Principles (“U.S. GAAP”). The preparation of financial statements in accordance with U.S. GAAP may require management to make estimates and assumptions that affect the reported amounts of assets and liabilities and disclosure of contingent assets and liabilities at the date of the financial statements and the reported amounts of increases and decreases in net assets from operations during the reporting period. Actual results could differ from those estimates.
| a) | Determination of Net Asset Value – The NAV of each class of the Funds’ shares is determined as of the close of regular trading (normally 4:00 p.m. Eastern Time) (the “NYSE Close”) on each day that the New York Stock Exchange (the “Exchange”) is open (“Valuation Date”). Information that becomes known to the Funds after the NAV has been calculated on a particular day will not generally be used to retroactively adjust the NAV determined earlier that day. |
| b) | Investment Valuation – Investments in the Underlying Funds are valued at the respective NAV of each Underlying Fund as determined as of the NYSE Close on Valuation Date. Valuation of investments held by the Underlying Funds is discussed in Notes to Financial Statements of the Underlying Funds, which are included in the Underlying Funds’ shareholder report, accompanying this report. |
U.S. GAAP defines fair value as the price that the Fund would receive to sell an asset or pay to transfer a liability in an orderly transaction between market participants. The U.S. GAAP fair value measurement standards require disclosure of a fair value hierarchy for each major category of assets and liabilities. Various inputs are used in determining the fair value of each Fund’s investments. These inputs are summarized into three broad hierarchy levels. This hierarchy is based on whether the valuation inputs are observable or unobservable. These levels are:
| · | Level 1 – Quoted prices in active markets for identical investments. |
| · | Level 2 – Observable inputs other than Level 1 prices, such as quoted prices for similar investments; quoted prices in markets that are not active; or other inputs that are observable or can be corroborated by observable market data. |
| · | Level 3 – Significant unobservable inputs that are supported by limited or no market activity. Level 3 may include financial instruments whose values are determined using broker quotes or require significant management judgment or estimation. |
Valuation levels are not necessarily indicative of the risk associated with investing in such securities. Individual securities within any of the above mentioned asset classes may be assigned a different hierarchical level than those presented above, as individual circumstances dictate.
During the six-month period ended June 30, 2012, the Funds held no Level 3 securities, therefore no reconciliations of Level 3 securities are presented.
For additional information, refer to the investment valuation hierarchy level summary which follows the Schedule of Investments for each Fund.
For purposes of reporting transfers between different hierarchy levels, both transfers in and out of each level, as applicable, are shown as if they occurred at the beginning of the period.
| c) | Investment Transactions and Investment Income – Investment transactions are recorded as of the trade date (the date the order to buy or sell is executed) for financial reporting purposes. Realized gains and losses are determined on the basis of identified cost. |
| 29 |
| Hartford Series Fund, Inc. |
| Notes to Financial Statements – (continued) |
| June 30, 2012 (Unaudited) |
| (000’s Omitted) |
Income and capital gain distributions from Underlying Funds are recorded on the ex-dividend date.
| d) | Fund Share Valuation and Dividend Distributions to Shareholders – Orders for the Funds’ shares are executed in accordance with the investment instructions of the contract holders. The NAV of each Fund’s shares is determined as of the close of each business day of the Exchange. The NAV is determined for each Fund by dividing the Fund’s net assets by the number of shares outstanding. Orders for the purchase of a Fund’s shares received by an insurance company prior to the close of the Exchange on any day on which the Exchange is open for business are priced at the NAV determined as of the close of the Exchange. Orders received by an insurance company after the close of the Exchange, or on a day on which the Exchange and/or the Fund is not open for business, are priced at the next determined NAV. |
Dividends are declared pursuant to a policy adopted by the Company’s Board of Directors based upon the investment performance of the Funds The policy of the all Funds is to pay dividends from net investment income and realized capital gains, if any, at least once a year.
Distributions from net investment income, realized capital gains and capital are determined in accordance with federal income tax regulations, which may differ from U.S. GAAP with respect to character and timing. These differences may include but are not limited to losses deferred due to wash sale adjustments and short-term capital gain adjustments. Permanent book and federal income tax basis differences relating to shareholder distributions will result in reclassifications to certain of the Funds’ capital accounts (see Federal Income Taxes: Reclassification of Capital Accounts note).
| 3. | Principal Risks: |
| a) | Market Risks – The Fund’s are exposed to the risks of the Underlying Funds in direct proportion to the amount of assets each Fund allocates to each Underlying Fund. The market values of the Underlying Funds may decline due to general market conditions which are not specifically related to a particular fund, such as real or perceived adverse economic conditions or adverse investor sentiment generally. |
| 4. | Federal Income Taxes: |
| a) | Federal Income Taxes – For federal income tax purposes, the Funds intend to continue to qualify as Regulated Investment Companies (“RIC”) under Subchapter M of the Internal Revenue Code (“IRC”) by distributing substantially all of their taxable net investment income and net realized capital gains to their shareholders and otherwise complying with the requirements of RIC. The Funds have distributed substantially all of their income and capital gains in the prior year and each Fund intends to distribute substantially all of its income and gains prior to the next fiscal year end. Accordingly, no provision for federal income or excise taxes has been made in the accompanying financial statements. Distributions from short-term capital gains are treated as ordinary income distributions for federal income tax purposes. |
| b) | Net Investment Income (Loss), Net Realized Gains (Losses) – Net investment income (loss) and net realized gains (losses) may differ for financial statement and tax purposes primarily because of losses deferred due to wash sale adjustments and short-term capital gain adjustments. The character of distributions made during the year from net investment income or net realized gains may differ from their ultimate characterization for federal income tax purposes. Also, due to the timing of dividend distributions, the fiscal year in which amounts are distributed may differ from the year that the net investment income (loss) or net realized gains (losses) were recorded by a Fund. |
| 30 |
| c) | Distributions and Components of Distributable Earnings – The tax character of distributions paid by the Funds for the periods indicated is as follows (as adjusted for dividends payable): |
| For the Year Ended December 31, 2011 | For the Year Ended December 31, 2010 | |||||||||||||||||||||||
| Ordinary Income | Long- Term Capital Gains(a) | Tax return of capital | Ordinary Income | Long- Term Capital Gains(a) | Tax return of capital | |||||||||||||||||||
| American Funds Asset Allocation HLS Fund | $ | 863 | $ | 5 | $ | — | $ | 881 | $ | — | $ | — | ||||||||||||
| American Funds Blue Chip Income and Growth HLS Fund | 8 | — | — | 871 | — | — | ||||||||||||||||||
| American Funds Bond HLS Fund | 5,572 | 62 | — | 4,625 | — | — | ||||||||||||||||||
| American Funds Global Bond HLS Fund | 962 | 316 | — | 405 | 31 | — | ||||||||||||||||||
| American Funds Global Growth and Income HLS Fund | 1,921 | — | — | 1,600 | — | — | ||||||||||||||||||
| American Funds Global Growth HLS Fund | 363 | — | — | 286 | — | — | ||||||||||||||||||
| American Funds Global Small Capitalization HLS Fund | 866 | 360 | — | 10 | — | — | ||||||||||||||||||
| American Funds Growth HLS Fund | 10 | — | — | 1,529 | — | — | ||||||||||||||||||
| American Funds Growth-Income HLS Fund | 2 | — | — | 2,183 | — | — | ||||||||||||||||||
| American Funds International HLS Fund | 3,792 | — | — | 2,100 | 715 | — | ||||||||||||||||||
| American Funds New World HLS Fund | 797 | — | — | 584 | — | — | ||||||||||||||||||
| (a) | The Funds designate these distributions as long-term capital dividends per IRC code Sec. 852(b) (3) (C). |
As of December 31, 2011, the components of distributable earnings (deficit) on a tax basis were as follows:
| Undistributed Ordinary Income | Undistributed Long-Term Capital Gain | Accumulated Capital and Other Losses | Unrealized Appreciation (Depreciation)@ | Total Accumulated Earnings (Deficit) | ||||||||||||||||
| American Funds Asset Allocation HLS Fund | $ | 1,026 | $ | 140 | $ | – | $ | 6,911 | $ | 8,077 | ||||||||||
| American Funds Blue Chip Income and Growth HLS Fund | 467 | 267 | – | 5,087 | 5,821 | |||||||||||||||
| American Funds Bond HLS Fund | 5,360 | 4,399 | – | 11,560 | 21,319 | |||||||||||||||
| American Funds Global Bond HLS Fund | 1,091 | 825 | – | 2,236 | 4,152 | |||||||||||||||
| American Funds Global Growth and Income HLS Fund | 1,975 | – | (1,805 | ) | 12,167 | 12,337 | ||||||||||||||
| American Funds Global Growth HLS Fund | 313 | 324 | – | 2,331 | 2,968 | |||||||||||||||
| American Funds Global Small Capitalization HLS Fund | 648 | 4,956 | – | 4,872 | 10,476 | |||||||||||||||
| American Funds Growth HLS Fund | 1,116 | 973 | – | 69,677 | 71,766 | |||||||||||||||
| American Funds Growth-Income HLS Fund | 2,243 | – | (832 | ) | 26,851 | 28,262 | ||||||||||||||
| American Funds International HLS Fund | 3,474 | – | (426 | ) | 4,750 | 7,798 | ||||||||||||||
| American Funds New World HLS Fund | 835 | 2,795 | – | 4,236 | 7,866 | |||||||||||||||
| @ | The difference between book-basis and tax-basis unrealized appreciation (depreciation) is attributable primarily to the tax deferral of wash sale losses. |
| d) | Reclassification of Capital Accounts – The Funds may record reclassifications in their capital accounts. These reclassifications have no impact on the total net assets of the Funds. The reclassifications are a result of permanent differences between U.S. GAAP and tax accounting for such items as net operating losses that reduce distribution requirements. Adjustments are made to reflect the impact these items have on current and future distributions to shareholders. Therefore, the source of a Fund’s distributable income may be shown in the accompanying Statement of |
| 31 |
| Hartford Series Fund, Inc. |
| Notes to Financial Statements – (continued) |
| June 30, 2012 (Unaudited) |
| (000’s Omitted) |
Assets and Liabilities as from net investment income, from net realized gains on investments or from capital depending on the type of book and tax differences that exist. For the year ended December 31, 2011, the Funds recorded the following reclassifications to increase (decrease) the accounts listed below.
| Net Investment Income | Net Realized Gain (Loss) | Paid-in- Capital | ||||||||||
| American Funds Global Bond HLS Fund | $ | 16 | $ | (16 | ) | $ | – | |||||
| e) | Capital Loss Carryforward – On December 22, 2010, the Regulated Investment Company Modernization Act of 2010 (the “Act”) was enacted, which made changes to the capital loss carryforward rules. The changes are effective for taxable years beginning after the date of enactment. Under the Act, funds are permitted to carry forward capital losses for an unlimited period. However, any losses incurred during those future taxable years will be required to be utilized prior to the losses incurred in pre-enactment taxable years, which carry an expiration date. As a result of this ordering rule, pre-enactment capital loss carryforwards may be more likely to expire unused. Additionally, post-enactment capital loss carryforwards retain their character as either short-term or long-term capital losses rather than being considered all short-term as permitted under prior regulation. |
At December 31, 2011 (tax-year-end), the Funds had capital loss carryforwards for U.S. federal income tax purposes as follows:
Capital loss carryforwards with expiration:
| 2012 | 2013 | 2014 | 2015 | 2016 | 2017 | 2018 | Total | |||||||||||||||||||||||||
| American Funds Global Growth and Income HLS Fund | $ | — | $ | — | $ | — | $ | — | $ | — | $ | — | $ | 1,457 | $ | 1,457 | ||||||||||||||||
| American Funds Growth-Income HLS Fund | — | — | — | — | — | — | 701 | 701 | ||||||||||||||||||||||||
| American Funds International HLS Fund | — | — | — | — | — | — | 332 | 332 | ||||||||||||||||||||||||
Capital loss carryforwards without expiration:
| Short-Term Capital Loss Carryforwards | Long-Term Capital Loss Carryfowards | Total | ||||||||||
| American Funds Global Growth and Income HLS Fund | $ | — | $ | 348 | $ | 348 | ||||||
| American Funds Growth-Income HLS Fund | — | 131 | 131 | |||||||||
| American Funds International HLS Fund | — | 94 | 94 | |||||||||
During the year ended December 31, 2011, the following Funds utilized prior year capital loss carryforwards:
| Amount | ||||
| American Funds Blue Chip Income and Growth HLS Fund | $ | 45 | ||
| American Funds Global Growth HLS Fund | 20 | |||
| American Funds Growth HLS Fund | 848 | |||
| American Funds New World HLS Fund | 209 | |||
| f) | Accounting for Uncertainty in Income Taxes – The Funds have adopted financial reporting rules that require the Funds to analyze all open tax years, as defined by the Statute of Limitations, for all major jurisdictions. Generally, tax authorities can examine all tax returns filed for the last three years. The Funds do not have an examination in progress. |
| 32 |
The Funds have reviewed all open tax years and major jurisdictions and concluded that these financial reporting rules have no effect on the Funds’ financial positions or results of operations. There is no tax liability resulting from unrecognized tax benefits relating to uncertain income tax positions taken or expected to be taken on the tax returns for the fiscal year-end December 31, 2011. The Funds are also not aware of any tax positions for which it is reasonably possible that the total amounts of unrecognized tax benefits will significantly change in the next twelve months.
| 5. | Expenses: |
| a) | Investment Management Agreement – HL Investment Advisors, LLC (“HL Advisors”), an indirect wholly owned subsidiary of The Hartford Financial Services Group, Inc. (“The Hartford”), serves as investment manager to the Funds pursuant to an Investment Management Agreement with the Company. As investment manager, HL Advisors has overall investment supervisory responsibility for each Fund. In addition, HL Advisors provides administrative personnel, services, equipment, facilities and office space for proper operation of the Funds. |
The schedule below reflects the rates of compensation as a percentage of each Fund’s average daily net assets paid to HL Advisors for investment management services rendered during the six-month period ended June 30, 2012. The rates are accrued daily and paid monthly:
| Fund | Annual Rate* | |||
| American Funds Asset Allocation HLS Fund | 0.65 | % | ||
| American Funds Blue Chip Income and Growth HLS Fund | 0.75 | % | ||
| American Funds Bond HLS Fund | 0.50 | % | ||
| American Funds Global Bond HLS Fund | 0.75 | % | ||
| American Funds Global Growth and Income HLS Fund | 0.80 | % | ||
| American Funds Global Growth HLS Fund | 1.00 | % | ||
| American Funds Global Small Capitalization HLS Fund | 0.80 | % | ||
| American Funds Growth HLS Fund | 0.75 | % | ||
| American Funds Growth-Income HLS Fund | 0.70 | % | ||
| American Funds International HLS Fund | 0.85 | % | ||
| American Funds New World HLS Fund | 1.10 | % | ||
| * | HL Advisors has entered into an agreement under which it will waive a portion of its investment management fee with respect to each Fund for as long as that Fund is invested in its corresponding Underlying Fund. The net investment management fee under the agreement with HL Advisors, after giving effect to the waiver, is 0.25% of the average daily net assets for each Fund. |
| b) | Accounting Services Agreement – Pursuant to the Fund Accounting Agreement between HLIC and the Company, on behalf of the Funds, HLIC provides accounting services to the Funds and receives monthly compensation of 0.01% of each Fund’s average daily net assets. These fees are accrued daily and paid monthly. |
| c) | Other Related Party Transactions – Certain officers of the Funds are directors and/or officers of HL Advisors and/or The Hartford or its subsidiaries. For the six-month period ended June 30, 2012, a portion of the Funds’ chief compliance officer’s salary was paid by all the investment companies in the Hartford fund complex. The portion allocated to the Funds was in the amount of $1. These fees are accrued daily and paid monthly. |
| d) | Operating Expenses – Allocable expenses incurred by the Company are allocated to each Fund in proportion to the average daily net assets of each Fund, except where allocation of certain expenses is more fairly made directly to the Fund. |
| e) | Distribution Plan for Class IB shares – The Company, on behalf of the Funds, has adopted a Distribution Plan pursuant to Rule 12b-1 of the 1940 Act to compensate the Distributor, Hartford Securities Distribution Company, Inc. (a wholly owned, ultimate subsidiary of The Hartford), from assets attributable to the Class IB shares for services rendered and |
| 33 |
| Hartford Series Fund, Inc. |
| Notes to Financial Statements – (continued) |
| June 30, 2012 (Unaudited) |
| (000’s Omitted) |
expenses borne in connection with activities primarily intended to result in the sale of the Class IB shares, subject to the review and approval of the Company’s Board of Directors.
The Distribution Plan provides that the Fund may pay annually up to 0.25% of the average daily net assets of the Fund attributable to its Class IB shares for activities primarily intended to result in the sale of Class IB shares. The Board has the authority to suspend or reduce these payments at any point in time. Under the terms of the Distribution Plan and the principal underwriting agreement, each Fund is authorized to make payments monthly to the Distributor that may be used to pay or compensate entities providing distribution and shareholder servicing with respect to the Class IB shares for such entities’ fees or expenses incurred or paid in that regard. These fees are accrued daily and paid monthly.
| 6. | Investment Transactions: |
For the six-month period ended June 30, 2012, aggregate purchases and sales of investments in underlying funds (excluding short-term investments) were as follows:
| Cost of Purchases Excluding U.S. Government Obligations | Sales Proceeds Excluding U.S. Government Obligations | |||||||
| American Funds Asset Allocation HLS Fund | $ | 4,498 | $ | 6,654 | ||||
| American Funds Blue Chip Income and Growth HLS Fund | 4,729 | 3,669 | ||||||
| American Funds Bond HLS Fund | 17,533 | 12,618 | ||||||
| American Funds Global Bond HLS Fund | 1,593 | 5,440 | ||||||
| American Funds Global Growth and Income HLS Fund | 1,170 | 6,997 | ||||||
| American Funds Global Growth HLS Fund | 507 | 2,689 | ||||||
| American Funds Global Small Capitalization HLS Fund | 1,198 | 5,748 | ||||||
| American Funds Growth HLS Fund | 5,599 | 18,396 | ||||||
| American Funds Growth-Income HLS Fund | 6,588 | 11,896 | ||||||
| American Funds International HLS Fund | 3,577 | 10,666 | ||||||
| American Funds New World HLS Fund | 1,574 | 5,149 | ||||||
| 7. | Line of Credit: |
The Funds, along with several other Hartford funds, participate in a $500 million committed revolving line of credit facility. The facility is to be used for temporary or emergency purposes. Under the arrangement, a fund is required to own securities having a market value in excess of 300% of the total bank borrowings. The interest rate on borrowings varies depending on the nature of the loan. The facility also requires a fee to be paid based on the amount of the commitment. This commitment fee is allocated to all the funds participating in the line of credit based on the average net assets of the funds. During the six-month period ended June 30, 2012, the Funds did not have any borrowings under this facility.
| 8. | Indemnifications: |
Under the Company’s organizational documents, the Company shall indemnify its officers and directors to the full extent required or permitted under Maryland General Corporation Law and the federal securities laws. In addition, the Company, on behalf of the Fund, may enter into contracts that contain a variety of indemnifications. The Company’s maximum exposure under these arrangements is unknown. However, as of the date of these financial statements, the Company has not had prior claims or losses pursuant to these contracts and expects the risk of loss to be remote.
| 34 |
| Hartford Series Fund, Inc. |
| Financial Highlights |
| ─ Selected Per-Share Data(A) ─ | ─ Ratios and Supplemental Data ─ | |||||||||||||||||||||||||||||||||||||||||||||||||||||||||||
| Class | Net Asset Value at Beginning of Period | Net Investment Income (Loss) | Net Realized and Unrealized Gain (Loss) on Investments | Total from Investment Operations | Dividends from Net Investment Income | Distributions from Realized Capital Gains | Total Distributions | Net Increase (Decrease) in Net Asset Value | Net Asset Value at End of Period | Total Return(B) | Net Assets at End of Period | Ratio of Expenses to Average Net Assets Before Waivers(C) | Ratio of Expenses to Average Net Assets After Waivers(C) | Ratio of Net Investment Income to Average Net Assets | Portfolio Turnover Rate | |||||||||||||||||||||||||||||||||||||||||||||
| American Funds Asset Allocation HLS Fund | ||||||||||||||||||||||||||||||||||||||||||||||||||||||||||||
| For the Six-Month Period Ended June 30, 2012 (Unaudited) | ||||||||||||||||||||||||||||||||||||||||||||||||||||||||||||
| IB | $ | 9.70 | $ | 0.03 | $ | 0.72 | $ | 0.75 | $ | – | $ | – | $ | – | $ | 0.75 | $ | 10.45 | 7.72 | %(D) | $ | 67,036 | 0.95 | %(E) | 0.55 | %(E) | 0.45 | %(E) | 7 | % | ||||||||||||||||||||||||||||||
| For the Year Ended December 31, 2011 | ||||||||||||||||||||||||||||||||||||||||||||||||||||||||||||
| IB | 9.74 | 0.14 | (0.05 | ) | 0.09 | (0.13 | ) | – | (0.13 | ) | (0.04 | ) | 9.70 | 1.02 | 64,356 | 0.95 | 0.55 | 1.61 | 9 | |||||||||||||||||||||||||||||||||||||||||
| For the Year Ended December 31, 2010 | ||||||||||||||||||||||||||||||||||||||||||||||||||||||||||||
| IB | 8.85 | 0.14 | 0.91 | 1.05 | (0.16 | ) | – | (0.16 | ) | 0.89 | 9.74 | 12.13 | 58,326 | 0.95 | 0.55 | 1.73 | 11 | |||||||||||||||||||||||||||||||||||||||||||
| For the Year Ended December 31, 2009(F) | ||||||||||||||||||||||||||||||||||||||||||||||||||||||||||||
| IB | 7.31 | 0.18 | 1.53 | 1.71 | (0.14 | ) | (0.03 | ) | (0.17 | ) | 1.54 | 8.85 | 23.59 | 48,568 | 0.95 | 0.55 | 2.33 | 8 | ||||||||||||||||||||||||||||||||||||||||||
| From (commencement of operations) April 30, 2008 through December 31, 2008 | ||||||||||||||||||||||||||||||||||||||||||||||||||||||||||||
| IB | 10.00 | 0.19 | (2.88 | ) | (2.69 | ) | – | – | – | (2.69 | ) | 7.31 | (26.88 | )(D) | 26,312 | 0.99 | (E) | 0.59 | (E) | 8.02 | (E) | – | ||||||||||||||||||||||||||||||||||||||
| American Funds Blue Chip Income and Growth HLS Fund | ||||||||||||||||||||||||||||||||||||||||||||||||||||||||||||
| For the Six-Month Period Ended June 30, 2012 (Unaudited) | ||||||||||||||||||||||||||||||||||||||||||||||||||||||||||||
| IB | 9.07 | – | 0.75 | 0.75 | – | – | – | 0.75 | 9.82 | 8.32 | (D) | 36,305 | 1.07 | (E) | 0.57 | (E) | 0.17 | (E) | 10 | |||||||||||||||||||||||||||||||||||||||||
| For the Year Ended December 31, 2011 | ||||||||||||||||||||||||||||||||||||||||||||||||||||||||||||
| IB | 9.18 | 0.13 | (0.24 | ) | (0.11 | ) | – | – | – | (0.11 | ) | 9.07 | (1.19 | ) | 32,425 | 1.07 | 0.57 | 1.44 | 14 | |||||||||||||||||||||||||||||||||||||||||
| For the Year Ended December 31, 2010 | ||||||||||||||||||||||||||||||||||||||||||||||||||||||||||||
| IB | 8.44 | 0.12 | 0.86 | 0.98 | (0.24 | ) | – | (0.24 | ) | 0.74 | 9.18 | 11.98 | 34,030 | 1.07 | 0.57 | 1.48 | 11 | |||||||||||||||||||||||||||||||||||||||||||
| For the Year Ended December 31, 2009(F) | ||||||||||||||||||||||||||||||||||||||||||||||||||||||||||||
| IB | 6.74 | 0.15 | 1.68 | 1.83 | (0.09 | ) | (0.04 | ) | (0.13 | ) | 1.70 | 8.44 | 27.46 | 29,030 | 1.07 | 0.57 | 2.06 | 6 | ||||||||||||||||||||||||||||||||||||||||||
| From (commencement of operations) April 30, 2008 through December 31, 2008 | ||||||||||||||||||||||||||||||||||||||||||||||||||||||||||||
| IB | 10.00 | 0.14 | (3.40 | ) | (3.26 | ) | – | – | – | (3.26 | ) | 6.74 | (32.64 | )(D) | 13,182 | 1.17 | (E) | 0.67 | (E) | 6.79 | (E) | 3 | ||||||||||||||||||||||||||||||||||||||
| American Funds Bond HLS Fund | ||||||||||||||||||||||||||||||||||||||||||||||||||||||||||||
| For the Six-Month Period Ended June 30, 2012 (Unaudited) | ||||||||||||||||||||||||||||||||||||||||||||||||||||||||||||
| IB | 10.52 | 0.02 | 0.29 | 0.31 | – | – | – | 0.31 | 10.83 | 2.89 | (D) | 208,403 | 0.79 | (E) | 0.54 | (E) | 0.49 | (E) | 6 | |||||||||||||||||||||||||||||||||||||||||
| For the Year Ended December 31, 2011 | ||||||||||||||||||||||||||||||||||||||||||||||||||||||||||||
| IB | 10.21 | 0.29 | 0.30 | 0.59 | (0.28 | ) | – | (0.28 | ) | 0.31 | 10.52 | 5.84 | 198,203 | 0.79 | 0.54 | 2.57 | 15 | |||||||||||||||||||||||||||||||||||||||||||
| For the Year Ended December 31, 2010 | ||||||||||||||||||||||||||||||||||||||||||||||||||||||||||||
| IB | 9.84 | 0.26 | 0.35 | 0.61 | (0.24 | ) | – | (0.24 | ) | 0.37 | 10.21 | 6.15 | 206,360 | 0.80 | 0.55 | 2.75 | 13 | |||||||||||||||||||||||||||||||||||||||||||
| For the Year Ended December 31, 2009(F) | ||||||||||||||||||||||||||||||||||||||||||||||||||||||||||||
| IB | 8.98 | 0.35 | 0.74 | 1.09 | (0.23 | ) | – | (0.23 | ) | 0.86 | 9.84 | 12.23 | 181,550 | 0.78 | 0.53 | 3.75 | 2 | |||||||||||||||||||||||||||||||||||||||||||
| From (commencement of operations) April 30, 2008 through December 31, 2008 | ||||||||||||||||||||||||||||||||||||||||||||||||||||||||||||
| IB | 10.00 | 0.44 | (1.46 | ) | (1.02 | ) | – | – | – | (1.02 | ) | 8.98 | (10.21 | )(D) | 67,597 | 0.80 | (E) | 0.55 | (E) | 16.32 | (E) | 5 | ||||||||||||||||||||||||||||||||||||||
| American Funds Global Bond HLS Fund | ||||||||||||||||||||||||||||||||||||||||||||||||||||||||||||
| For the Six-Month Period Ended June 30, 2012 (Unaudited) | ||||||||||||||||||||||||||||||||||||||||||||||||||||||||||||
| IB | 11.02 | 0.10 | 0.19 | 0.29 | – | – | – | 0.29 | 11.31 | 2.71 | (D) | 41,046 | 1.06 | (E) | 0.56 | (E) | 1.16 | (E) | 4 | |||||||||||||||||||||||||||||||||||||||||
| For the Year Ended December 31, 2011 | ||||||||||||||||||||||||||||||||||||||||||||||||||||||||||||
| IB | 10.86 | 0.23 | 0.24 | 0.47 | (0.23 | ) | (0.08 | ) | (0.31 | ) | 0.16 | 11.02 | 4.28 | 44,352 | 1.06 | 0.56 | 2.56 | 16 | ||||||||||||||||||||||||||||||||||||||||||
| For the Year Ended December 31, 2010 | ||||||||||||||||||||||||||||||||||||||||||||||||||||||||||||
| IB | 10.47 | 0.27 | 0.24 | 0.51 | (0.11 | ) | (0.01 | ) | (0.12 | ) | 0.39 | 10.86 | 4.85 | 38,654 | 1.07 | 0.57 | 2.49 | 17 | ||||||||||||||||||||||||||||||||||||||||||
| For the Year Ended December 31, 2009(F) | ||||||||||||||||||||||||||||||||||||||||||||||||||||||||||||
| IB | 9.85 | 0.13 | 0.79 | 0.92 | (0.30 | ) | – | (0.30 | ) | 0.62 | 10.47 | 9.43 | 38,533 | 1.06 | 0.56 | 1.29 | 5 | |||||||||||||||||||||||||||||||||||||||||||
| From (commencement of operations) April 30, 2008 through December 31, 2008 | ||||||||||||||||||||||||||||||||||||||||||||||||||||||||||||
| IB | 10.00 | 0.42 | (0.57 | ) | (0.15 | ) | – | – | – | (0.15 | ) | 9.85 | (1.51 | )(D) | 22,386 | 1.10 | (E) | 0.60 | (E) | 13.11 | (E) | 42 | ||||||||||||||||||||||||||||||||||||||
| 35 |
| Hartford Series Fund, Inc. |
| Financial Highlights – (continued) |
| ─ Selected Per-Share Data(A) ─ | ─ Ratios and Supplemental Data ─ | |||||||||||||||||||||||||||||||||||||||||||||||||||||||||||
| Class | Net Asset Value at Beginning of Period | Net Investment Income (Loss) | Net Realized and Unrealized Gain (Loss) on Investments | Total from Investment Operations | Dividends from Net Investment Income | Distributions from Realized Capital Gains | Total Distributions | Net Increase (Decrease) in Net Asset Value | Net Asset Value at End of Period | Total Return(B) | Net Assets at End of Period | Ratio of Expenses to Average Net Assets Before Waivers(C) | Ratio of Expenses to Average Net Assets After Waivers(C) | Ratio of Net Investment Income to Average Net Assets | Portfolio Turnover Rate | |||||||||||||||||||||||||||||||||||||||||||||
| American Funds Global Growth and Income HLS Fund | ||||||||||||||||||||||||||||||||||||||||||||||||||||||||||||
| For the Six-Month Period Ended June 30, 2012 (Unaudited) | ||||||||||||||||||||||||||||||||||||||||||||||||||||||||||||
| IB | $ | 8.38 | $ | 0.05 | $ | 0.42 | $ | 0.47 | $ | – | $ | – | $ | – | $ | 0.47 | $ | 8.85 | 5.58 | %(D) | $ | 76,904 | 1.10 | %(E) | 0.55 | %(E) | 0.64 | %(E) | 1 | % | ||||||||||||||||||||||||||||||
| For the Year Ended December 31, 2011 | ||||||||||||||||||||||||||||||||||||||||||||||||||||||||||||
| IB | 9.06 | 0.22 | (0.70 | ) | (0.48 | ) | (0.20 | ) | – | (0.20 | ) | (0.68 | ) | 8.38 | (5.19 | ) | 78,639 | 1.09 | 0.54 | 2.30 | 5 | |||||||||||||||||||||||||||||||||||||||
| For the Year Ended December 31, 2010 | ||||||||||||||||||||||||||||||||||||||||||||||||||||||||||||
| IB | 8.30 | 0.20 | 0.72 | 0.92 | (0.16 | ) | – | (0.16 | ) | 0.76 | 9.06 | 11.41 | 91,254 | 1.10 | 0.55 | 2.25 | 8 | |||||||||||||||||||||||||||||||||||||||||||
| For the Year Ended December 31, 2009(F) | ||||||||||||||||||||||||||||||||||||||||||||||||||||||||||||
| IB | 6.06 | 0.16 | 2.21 | 2.37 | (0.13 | ) | – | (0.13 | ) | 2.24 | 8.30 | 39.37 | 88,762 | 1.09 | 0.54 | 2.39 | 3 | |||||||||||||||||||||||||||||||||||||||||||
| From (commencement of operations) April 30, 2008 through December 31, 2008 | ||||||||||||||||||||||||||||||||||||||||||||||||||||||||||||
| IB | 10.00 | 0.17 | (4.11 | ) | (3.94 | ) | – | – | – | (3.94 | ) | 6.06 | (39.43 | )(D) | 44,065 | 1.11 | (E) | 0.56 | (E) | 8.24 | (E) | – | ||||||||||||||||||||||||||||||||||||||
| American Funds Global Growth HLS Fund | ||||||||||||||||||||||||||||||||||||||||||||||||||||||||||||
| For the Six-Month Period Ended June 30, 2012 (Unaudited) | ||||||||||||||||||||||||||||||||||||||||||||||||||||||||||||
| IB | 8.74 | (0.02 | ) | 0.78 | 0.76 | – | – | – | 0.76 | 9.50 | 8.77 | (D) | 29,782 | 1.34 | (E) | 0.59 | (E) | (0.48 | )(E) | 2 | ||||||||||||||||||||||||||||||||||||||||
| For the Year Ended December 31, 2011 | ||||||||||||||||||||||||||||||||||||||||||||||||||||||||||||
| IB | 9.74 | 0.10 | (0.99 | ) | (0.89 | ) | (0.11 | ) | – | (0.11 | ) | (1.00 | ) | 8.74 | (9.18 | ) | 29,319 | 1.32 | 0.57 | 0.95 | 11 | |||||||||||||||||||||||||||||||||||||||
| For the Year Ended December 31, 2010 | ||||||||||||||||||||||||||||||||||||||||||||||||||||||||||||
| IB | 8.83 | 0.10 | 0.89 | 0.99 | (0.08 | ) | – | (0.08 | ) | 0.91 | 9.74 | 11.41 | 34,245 | 1.32 | 0.57 | 1.17 | 11 | |||||||||||||||||||||||||||||||||||||||||||
| For the Year Ended December 31, 2009(F) | ||||||||||||||||||||||||||||||||||||||||||||||||||||||||||||
| IB | 6.40 | 0.09 | 2.57 | 2.66 | (0.12 | ) | (0.11 | ) | (0.23 | ) | 2.43 | 8.83 | 41.78 | 30,457 | 1.32 | 0.57 | 1.24 | 12 | ||||||||||||||||||||||||||||||||||||||||||
| From (commencement of operations) April 30, 2008 through December 31, 2008 | ||||||||||||||||||||||||||||||||||||||||||||||||||||||||||||
| IB | 10.00 | 0.15 | (3.75 | ) | (3.60 | ) | – | – | – | (3.60 | ) | 6.40 | (35.95 | )(D) | 15,490 | 1.37 | (E) | 0.62 | (E) | 5.68 | (E) | – | ||||||||||||||||||||||||||||||||||||||
| American Funds Global Small Capitalization HLS Fund | ||||||||||||||||||||||||||||||||||||||||||||||||||||||||||||
| For the Six-Month Period Ended June 30, 2012 (Unaudited) | ||||||||||||||||||||||||||||||||||||||||||||||||||||||||||||
| IB | 7.83 | 0.09 | 0.38 | 0.47 | – | – | – | 0.47 | 8.30 | 6.08 | (D) | 54,093 | 1.12 | (E) | 0.57 | (E) | 1.82 | (E) | 2 | |||||||||||||||||||||||||||||||||||||||||
| For the Year Ended December 31, 2011 | ||||||||||||||||||||||||||||||||||||||||||||||||||||||||||||
| IB | 9.92 | 0.10 | (2.01 | ) | (1.91 | ) | (0.13 | ) | (0.05 | ) | (0.18 | ) | (2.09 | ) | 7.83 | (19.40 | ) | 55,658 | 1.11 | 0.56 | 0.98 | 11 | ||||||||||||||||||||||||||||||||||||||
| For the Year Ended December 31, 2010 | ||||||||||||||||||||||||||||||||||||||||||||||||||||||||||||
| IB | 8.13 | 0.11 | 1.68 | 1.79 | – | – | – | 1.79 | 9.92 | 22.06 | 74,999 | 1.12 | 0.57 | 1.35 | 16 | |||||||||||||||||||||||||||||||||||||||||||||
| For the Year Ended December 31, 2009(F) | ||||||||||||||||||||||||||||||||||||||||||||||||||||||||||||
| IB | 5.10 | – | 3.08 | 3.08 | – | (0.05 | ) | (0.05 | ) | 3.03 | 8.13 | 60.77 | 61,519 | 1.10 | 0.55 | 0.02 | 10 | |||||||||||||||||||||||||||||||||||||||||||
| From (commencement of operations) April 30, 2008 through December 31, 2008 | ||||||||||||||||||||||||||||||||||||||||||||||||||||||||||||
| IB | 10.00 | (0.01 | ) | (4.89 | ) | (4.90 | ) | – | – | – | (4.90 | ) | 5.10 | (49.04 | )(D) | 19,807 | 1.16 | (E) | 0.61 | (E) | (0.62 | )(E) | – | |||||||||||||||||||||||||||||||||||||
| American Funds Growth HLS Fund | ||||||||||||||||||||||||||||||||||||||||||||||||||||||||||||
| For the Six-Month Period Ended June 30, 2012 (Unaudited) | ||||||||||||||||||||||||||||||||||||||||||||||||||||||||||||
| IB | 8.95 | – | 0.72 | 0.72 | – | – | – | 0.72 | 9.67 | 8.04 | (D) | 330,789 | 1.04 | (E) | 0.54 | (E) | 0.06 | (E) | 2 | |||||||||||||||||||||||||||||||||||||||||
| For the Year Ended December 31, 2011 | ||||||||||||||||||||||||||||||||||||||||||||||||||||||||||||
| IB | 9.38 | 0.03 | (0.46 | ) | (0.43 | ) | – | – | – | (0.43 | ) | 8.95 | (4.57 | ) | 317,968 | 1.04 | 0.54 | 0.33 | 5 | |||||||||||||||||||||||||||||||||||||||||
| For the Year Ended December 31, 2010 | ||||||||||||||||||||||||||||||||||||||||||||||||||||||||||||
| IB | 7.96 | 0.04 | 1.42 | 1.46 | (0.04 | ) | – | (0.04 | ) | 1.42 | 9.38 | 18.36 | 356,162 | 1.05 | 0.55 | 0.43 | 7 | |||||||||||||||||||||||||||||||||||||||||||
| For the Year Ended December 31, 2009(F) | ||||||||||||||||||||||||||||||||||||||||||||||||||||||||||||
| IB | 5.81 | 0.03 | 2.22 | 2.25 | (0.03 | ) | (0.07 | ) | (0.10 | ) | 2.15 | 7.96 | 39.02 | 296,659 | 1.03 | 0.53 | 0.47 | 3 | ||||||||||||||||||||||||||||||||||||||||||
| From (commencement of operations) April 30, 2008 through December 31, 2008 | ||||||||||||||||||||||||||||||||||||||||||||||||||||||||||||
| IB | 10.00 | 0.07 | (4.18 | ) | (4.11 | ) | (0.08 | ) | – | (0.08 | ) | (4.19 | ) | 5.81 | (41.18 | )(D) | 122,888 | 1.03 | (E) | 0.53 | (E) | 3.39 | (E) | – | ||||||||||||||||||||||||||||||||||||
| 36 |
| ─ Selected Per-Share Data(A) ─ | ─ Ratios and Supplemental Data ─ | |||||||||||||||||||||||||||||||||||||||||||||||||||||||||||
| Class | Net Asset Value at Beginning of Period | Net Investment Income (Loss) | Net Realized and Unrealized Gain (Loss) on Investments | Total from Investment Operations | Dividends from Net Investment Income | Distributions from Realized Capital Gains | Total Distributions | Net Increase (Decrease) in Net Asset Value | Net Asset Value at End of Period | Total Return(B) | Net Assets at End of Period | Ratio of Expenses to Average Net Assets Before Waivers(C) | Ratio of Expenses to Average Net Assets After Waivers(C) | Ratio of Net Investment Income to Average Net Assets | Portfolio Turnover Rate | |||||||||||||||||||||||||||||||||||||||||||||
| American Funds Growth-Income HLS Fund | ||||||||||||||||||||||||||||||||||||||||||||||||||||||||||||
| For the Six-Month Period Ended June 30, 2012 (Unaudited) | ||||||||||||||||||||||||||||||||||||||||||||||||||||||||||||
| IB | $ | 8.81 | $ | 0.01 | $ | 0.72 | $ | 0.73 | $ | – | $ | – | $ | – | $ | 0.73 | $ | 9.54 | 8.30 | %(D) | $ | 178,680 | 0.99 | %(E) | 0.54 | %(E) | 0.16 | %(E) | 4 | % | ||||||||||||||||||||||||||||||
| For the Year Ended December 31, 2011 | ||||||||||||||||||||||||||||||||||||||||||||||||||||||||||||
| IB | 9.00 | 0.12 | (0.31 | ) | (0.19 | ) | – | – | – | (0.19 | ) | 8.81 | (2.12 | ) | 170,059 | 0.98 | 0.53 | 1.26 | 5 | |||||||||||||||||||||||||||||||||||||||||
| For the Year Ended December 31, 2010 | ||||||||||||||||||||||||||||||||||||||||||||||||||||||||||||
| IB | 8.20 | 0.10 | 0.81 | 0.91 | (0.11 | ) | – | (0.11 | ) | 0.80 | 9.00 | 11.11 | 185,836 | 0.99 | 0.54 | 1.19 | 8 | |||||||||||||||||||||||||||||||||||||||||||
| For the Year Ended December 31, 2009(F) | ||||||||||||||||||||||||||||||||||||||||||||||||||||||||||||
| IB | 6.39 | 0.11 | 1.86 | 1.97 | (0.11 | ) | (0.05 | ) | (0.16 | ) | 1.81 | 8.20 | 30.85 | 168,690 | 0.98 | 0.53 | 1.56 | 1 | ||||||||||||||||||||||||||||||||||||||||||
| From (commencement of operations) April 30, 2008 through December 31, 2008 | ||||||||||||||||||||||||||||||||||||||||||||||||||||||||||||
| IB | 10.00 | 0.13 | (3.63 | ) | (3.50 | ) | (0.11 | ) | – | (0.11 | ) | (3.61 | ) | 6.39 | (34.98 | )(D) | 74,039 | 0.99 | (E) | 0.54 | (E) | 5.87 | (E) | – | ||||||||||||||||||||||||||||||||||||
| American Funds International HLS Fund | ||||||||||||||||||||||||||||||||||||||||||||||||||||||||||||
| For the Six-Month Period Ended June 30, 2012 (Unaudited) | ||||||||||||||||||||||||||||||||||||||||||||||||||||||||||||
| IB | 7.54 | (0.01 | ) | 0.34 | 0.33 | – | – | – | 0.33 | 7.87 | 4.29 | (D) | 210,898 | 1.14 | (E) | 0.54 | (E) | (0.36 | )(E) | 2 | ||||||||||||||||||||||||||||||||||||||||
| For the Year Ended December 31, 2011 | ||||||||||||||||||||||||||||||||||||||||||||||||||||||||||||
| IB | 8.96 | 0.13 | (1.40 | ) | (1.27 | ) | (0.15 | ) | – | (0.15 | ) | (1.42 | ) | 7.54 | (14.23 | ) | 208,399 | 1.14 | 0.54 | 1.52 | 9 | |||||||||||||||||||||||||||||||||||||||
| For the Year Ended December 31, 2010 | ||||||||||||||||||||||||||||||||||||||||||||||||||||||||||||
| IB | 8.50 | 0.13 | 0.44 | 0.57 | (0.08 | ) | (0.03 | ) | (0.11 | ) | 0.46 | 8.96 | 6.92 | 235,702 | 1.16 | 0.56 | 1.78 | 7 | ||||||||||||||||||||||||||||||||||||||||||
| For the Year Ended December 31, 2009(F) | ||||||||||||||||||||||||||||||||||||||||||||||||||||||||||||
| IB | 6.09 | 0.11 | 2.48 | 2.59 | (0.11 | ) | (0.07 | ) | (0.18 | ) | 2.41 | 8.50 | 42.75 | 197,258 | 1.13 | 0.53 | 1.53 | 7 | ||||||||||||||||||||||||||||||||||||||||||
| From (commencement of operations) April 30, 2008 through December 31, 2008 | ||||||||||||||||||||||||||||||||||||||||||||||||||||||||||||
| IB | 10.00 | 0.16 | (4.07 | ) | (3.91 | ) | – | – | – | (3.91 | ) | 6.09 | (39.10 | )(D) | 78,825 | 1.14 | (E) | 0.54 | (E) | 8.05 | (E) | – | ||||||||||||||||||||||||||||||||||||||
| American Funds New World HLS Fund | ||||||||||||||||||||||||||||||||||||||||||||||||||||||||||||
| For the Six-Month Period Ended June 30, 2012 (Unaudited) | ||||||||||||||||||||||||||||||||||||||||||||||||||||||||||||
| IB | 8.66 | (0.01 | ) | 0.40 | 0.39 | – | – | – | 0.39 | 9.05 | 4.55 | (D) | 51,566 | 1.41 | (E) | 0.56 | (E) | (0.37 | )(E) | 3 | ||||||||||||||||||||||||||||||||||||||||
| For the Year Ended December 31, 2011 | ||||||||||||||||||||||||||||||||||||||||||||||||||||||||||||
| IB | 10.24 | 0.15 | (1.60 | ) | (1.45 | ) | (0.13 | ) | – | (0.13 | ) | (1.58 | ) | 8.66 | (14.23 | ) | 52,569 | 1.41 | 0.56 | 1.33 | 9 | |||||||||||||||||||||||||||||||||||||||
| For the Year Ended December 31, 2010 | ||||||||||||||||||||||||||||||||||||||||||||||||||||||||||||
| IB | 8.80 | 0.11 | 1.42 | 1.53 | (0.09 | ) | – | (0.09 | ) | 1.44 | 10.24 | 17.54 | 72,257 | 1.42 | 0.57 | 1.30 | 12 | |||||||||||||||||||||||||||||||||||||||||||
| For the Year Ended December 31, 2009(F) | ||||||||||||||||||||||||||||||||||||||||||||||||||||||||||||
| IB | 6.00 | 0.10 | 2.84 | 2.94 | (0.08 | ) | (0.06 | ) | (0.14 | ) | 2.80 | 8.80 | 49.14 | 58,578 | 1.40 | 0.55 | 1.44 | 8 | ||||||||||||||||||||||||||||||||||||||||||
| From (commencement of operations) April 30, 2008 through December 31, 2008 | ||||||||||||||||||||||||||||||||||||||||||||||||||||||||||||
| IB | 10.00 | 0.11 | (4.11 | ) | (4.00 | ) | – | – | – | (4.00 | ) | 6.00 | (39.97 | )(D) | 23,933 | 1.44 | (E) | 0.59 | (E) | 5.06 | (E) | 1 | ||||||||||||||||||||||||||||||||||||||
| (A) | Information presented relates to a share outstanding throughout the indicated period. |
| (B) | The figures do not include sales charges or other fees which may be applied at the variable life insurance, variable annuity or qualified retirement plan product level. Any such additional sales charges or other fees would lower the Fund's performance. |
| (C) | Expense ratios do not include expenses of the underlying funds. |
| (D) | Not annualized. |
| (E) | Annualized. |
| (F) | Per share amounts have been calculated using average shares method. |
| 37 |
| Hartford Series Fund, Inc. |
| Directors and Officers (Unaudited) |
The Board of Directors of the Company appoints officers who are responsible for the day-to-day operations of the Funds and who execute policies formulated by the Directors. Each director serves until his or her death, resignation, or retirement or until the next annual meeting of shareholders is held or until his or her successor is elected and qualifies.
Directors and officers who are employed by or who have a financial interest in The Hartford are considered “interested” persons of the Funds pursuant to the 1940 Act. Each officer and two of the Company’s directors, as noted in the chart below, are “interested” persons of the Funds. Each director serves as a director for The Hartford Mutual Funds, Inc., The Hartford Mutual Funds II, Inc., Hartford Series Fund, Inc., Hartford HLS Series Fund II, Inc., and as a trustee for The Hartford Alternative Strategies Fund, which, as of June 30, 2012, collectively consist of 89 funds. Correspondence may be sent to directors and officers c/o Hartford Mutual Funds, P.O. Box 2999, Hartford, Connecticut 06104-2999, except that correspondence to Mr. Annoni, Mr. Dressen and Ms. Fagely may be sent to 500 Bielenberg Drive, Woodbury, Minnesota 55125.
The table below sets forth, for each director and officer, his or her name, year of birth, current position with the Company and date first elected or appointed to Hartford Series Fund, Inc. (“HSF”), and Hartford HLS Series Fund II, Inc. (“HSF2”), principal occupation, and, for directors, other directorships held. The Funds’ statement of additional information contains further information on the directors and is available free of charge by calling 1-800-862-6668 or writing to Hartford HLS Funds, c/o Individual Annuity Services, P.O. Box 5085, Hartford, CT 06102-5085.
Information on the aggregate remuneration paid to the directors of the Company can be found in the Statement of Operations herein. The Funds pay to The Hartford a portion of the Chief Compliance Officer’s compensation, but do not pay salaries or compensation to any of their other officers or directors who are employed by The Hartford.
Non-Interested Directors
Lynn S. Birdsong (1946) Director since 2003, Co-Chairman of the Investment Committee
Mr. Birdsong is a private investor. Mr. Birdsong currently serves as a Director of the Sovereign High Yield Investment Company (April 2010 to current). Mr. Birdsong currently serves as an Independent Director of Nomura Partners Funds, Inc. (formerly, The Japan Fund) (March 2003 to current). From 1979 to 2002, Mr. Birdsong was a managing director of Zurich Scudder Investments, an investment management firm. During his employment with Scudder, Mr. Birdsong was an Interested Director of The Japan Fund. Since 1981, Mr. Birdsong has been a partner in Birdsong Company, an advertising specialty firm.
Robert M. Gavin, Jr. (1940) Director since 2002 (HSF) and 1986 (HSF2), Chairman of the Board since 2004
Dr. Gavin is an educational consultant. Prior to September 1, 2001, he was President of Cranbrook Education Community and prior to July 1996, he was President of Macalester College, St. Paul, Minnesota.
Duane E. Hill (1945) Director since 2001 (HSF) and 2002 (HSF2), Chairman of the Nominating Committee
Mr. Hill is Partner of TSG Ventures L.P., a private equity investment company. Mr. Hill is a former partner of TSG Capital Group, a private equity investment firm that served as sponsor and lead investor in leveraged buyouts of middle market companies.
Sandra S. Jaffee (1941) Director since 2005
Ms. Jaffee is the founder and Chief Executive Officer of a private company, Homeworks Concierge, LLC, which provides residential property management services in Westchester County, New York (January 2012 to present). Ms. Jaffee served as Chairman (2008 to 2009) and Chief Executive Officer of Fortent (formerly Searchspace Group), a leading provider of compliance/regulatory technology to financial institutions from August 2005 to August 2009. Ms. Jaffe currently serves as a member of the Board of Directors of Broadridge Financial Solutions as well as a Trustee of Muhlenberg College.
William P. Johnston (1944) Director since 2005, Chairman of the Compliance Committee
In June 2006, Mr. Johnston was appointed as Senior Advisor to The Carlyle Group, a global private equity investment firm. In August 2007, Mr. Johnston was elected to the Board of Directors of LifeCare Holdings, Inc. In February 2008, Mr. Johnston was elected to the Board of Directors of HCR-ManorCare, Inc. In May 2006, Mr. Johnston was elected to the Supervisory Board of Fresenius Medical Care AG & Co. KGaA, after its acquisition of Renal Care Group, Inc. in March 2006.
Phillip O. Peterson (1944) Director since 2002 (HSF) and 2000 (HSF2), Chairman of the Audit Committee
Mr. Peterson is a mutual fund industry consultant. He was a partner of KPMG LLP (an accounting firm) until July 1999. Mr. Peterson joined William Blair Funds in February 2007 as a member of the Board of Trustees. Mr. Peterson also joined the Board of Trustees of Symetra Variable Mutual Funds Trust as a trustee in February 2012.
| 38 |
Lemma W. Senbet (1946) Director since 2005
Dr. Senbet is the William E. Mayer Chair Professor of Finance and Director, Center for Financial Policy, at the University of Maryland, Robert H. Smith School of Business. He was chair of the Finance Department from 1998 to 2006. Previously he was a chaired professor of finance at the University of Wisconsin-Madison. Also, he was director of the Fortis Funds from March 2000 to July 2002. Dr. Senbet served the finance profession in various capacities, including as director of the American Finance Association and President of the Western Finance Association. In 2006, Dr. Senbet was inducted Fellow of Financial Management Association International for his career-long distinguished scholarship and professional service.
Interested Directors and Officers
David N. Levenson (1966) Director since 2010(1)
Mr. Levenson currently serves as President of The Hartford’s Wealth Management business. He was appointed to this role in July 2010. Previously, Mr. Levenson served as Executive Vice President of Legacy Holdings for The Hartford from June 2009 to July 2010. From 2006 to 2009, Mr. Levenson was with Hartford Life Insurance K.K. where he served as President and Chief Executive Officer from 2007 to 2009. He served as Managing Director of Hartford Investment Management Company from 2005 to 2006. Additionally, Mr. Levenson serves as Executive Vice President of The Hartford and as President, Director and Chief Executive Officer of Hartford Life Insurance Company (“HLIC”) and Hartford Life, Inc. (“HL Inc.”).
(1) Mr. Levenson served as Interested Director until August 2, 2012.
Lowndes A. Smith (1939) Director since 1996 (HSF) and 2002 (HSF2), Co-Chairman of the Investment Committee
Mr. Smith served as Vice Chairman of The Hartford from February 1997 to January 2002, as President and Chief Executive Officer of HL Inc. from February 1997 to January 2002, and as President and Chief Operating Officer of The Hartford Life Insurance Companies from January 1989 to January 2002. Mr. Smith serves as a Director of White Mountains Insurance Group, Ltd., One Beacon Insurance and Symetra Financial and as Managing Director of Whittington Gray Associates.
Other Officers
James E. Davey (1964) President and Chief Executive Officer since 2010(2)
Mr. Davey serves as Executive Vice President of HLIC. Additionally, Mr. Davey serves as President, Chief Executive Officer and Manager of HIFSCO and President, Chief Executive Officer and Manager of HL Investment Advisors, LLC (“HL Advisors”). Mr. Davey joined The Hartford in 2002.
(2) Mr. Davey became an Interested Director effective August 2, 2012.
Mark A. Annoni (1964) Vice President, Controller and Treasurer since 2012(3)
Mr. Annoni serves as the Assistant Vice President and Director of Investment Finance (February 2004 to present). Mr. Annoni joined The Hartford in April 2001 as part of The Hartford’s acquisition of Fortis Financial Group. Prior to joining The Hartford, Mr. Annoni served as Manager of Mutual Fund Accounting at Fortis Financial Group (July 1997 to April 2001).
(3) Mr. Annoni was named Vice President, Controller and Treasurer on May 8, 2012.
Michael R. Dressen (1963) AML Compliance Officer since 2011
Mr. Dressen currently serves as Assistant Vice President of HLIC. He also serves as Chief Compliance Officer and AML Compliance Officer of Hartford Administrative Services Company (“HASCO”) and as Assistant Secretary and Compliance Officer of HIFSCO. Mr Dressen joined The Hartford in 2005 from State Farm Insurance Companies where he held various positions related to mutual funds, variable products, and property casualty insurance.
Tamara L. Fagely (1958) Vice President, since 2002 (HSF) and 1993 (HSF2)(4)
Ms. Fagely has been a Vice President of HASCO since 1998 and Chief Financial Officer since 2006. Currently Ms. Fagely is a Vice President of HLIC. She served as Assistant Vice President of HLIC from December 2001 through March 2005. In addition, Ms. Fagely is Controller and Chief Financial Officer of HIFSCO.
(4) Ms. Fagely served as Vice President, Controller and Treasurer until May 8, 2012.
Dr. Robert J. Froehlich (1953) Senior Managing Director since 2009(5)
Dr. Froehlich joined The Hartford as Senior Managing Director in September 2009. Prior to joining The Hartford, Dr. Froehlich served as Vice Chairman of Deutsche Asset Management from 1997-2009.
(5) Dr. Froehlich served as Senior Managing Director until March 26, 2012.
| 39 |
| Hartford Series Fund, Inc. |
| Directors and Officers (Unaudited) – (continued) |
Edward P. Macdonald (1967) Vice President, Secretary and Chief Legal Officer since 2005
Mr. Macdonald serves as Vice President of HLIC and Chief Legal Officer of Mutual Funds and Vice President of HIFSCO. He also serves as Vice President and Secretary of HASCO, and Chief Legal Officer, Secretary and Vice President of HL Advisors. Mr. Macdonald joined The Hartford in 2005.
Vernon J. Meyer (1964) Vice President since 2006
Mr. Meyer serves as Senior Vice President of HLIC. He also serves as Senior Vice President of HIFSCO and HL Advisors. Mr. Meyer joined The Hartford in 2004.
Colleen B. Pernerewski (1969) Vice President and Chief Compliance Officer since 2010
Ms. Pernerewski serves as Vice President and Chief Investment Advisor Compliance Officer of HIFSCO and as Vice President and Chief Compliance Officer of HL Advisors. Ms. Pernerewski serves as Vice President and Chief Compliance Officer of Individual Annuity of HLIC. Ms. Pernerewski joined The Hartford in 2005 from Travelers Life and Annuity where she served as Counsel (2004-2005). Prior to Travelers Life and Annuity, Ms. Pernerewski held the position of Counsel at The Hartford (1998-2004).
Elizabeth L. Schroeder (1966) Vice President since 2010
Ms. Schroeder currently serves as Assistant Vice President of HLIC. Ms. Schroeder joined HLIC in 1991. She is also an Assistant Vice President of HASCO, HIFSCO and HL Advisors.
Martin Swanson (1962) Vice President since 2010
Mr. Swanson is a Vice President of HLIC. Mr. Swanson also serves as Vice President/Marketing for HIFSCO. Prior to joining HLIC in 1998, Mr. Swanson was a Vice President at PaineWebber, Inc.
Jane Wolak (1961) Vice President since 2009
Ms. Wolak currently serves as Senior Vice President of HLIC. Ms. Wolak joined HLIC as Vice President, Retail Product Services in May 2007. She is also Vice President of HASCO. Previously, Ms. Wolak was with Sun Life Financial where she held the position of Vice President, Service Center Operations from 2001-2007.
HOW TO OBTAIN A COPY OF THE FUND’S PROXY VOTING POLICIES AND VOTING RECORDS (UNAUDITED)
A description of the policies and procedures that the Funds use to determine how to vote proxies relating to portfolio securities and a record of how the Funds voted any proxies for the twelve-month period ended June 30, 2012 are available (1) without charge, upon request, by calling 800-862-6668 and (2) on the SEC’s website at http://www.sec.gov.
QUARTERLY PORTFOLIO HOLDINGS INFORMATION (UNAUDITED)
The Funds file a complete schedule of portfolio holdings with the SEC for the first and third quarters of each fiscal year on Form N-Qs. The Funds’ Forms are available (1) without charge, upon request, by calling 800-862-6668 and (2) on the SEC’s website at http://www.sec.gov. The Form N-Q may be reviewed and copied at the SEC’s Public Reference Room in Washington, DC. Information on the operation of the Public Reference Room may be obtained by calling 1-800-SEC-0330.
| 40 |
| Hartford Series Fund, Inc. |
| Expense Example (Unaudited) |
Your Fund's Expenses
As a shareholder of a Fund, you incur two types of costs: (1) transaction costs and (2) ongoing costs including investment management fees, distribution fees, and other fund expenses. This example is intended to help you understand your ongoing costs (in dollars) of investing in a Fund and to compare these costs with the ongoing costs of investing in other mutual funds. The example is based on an investment of $1,000 invested at the beginning of the period and held for the period of December 31, 2011 through June 30, 2012.
Actual Expenses
The first set of columns of the table below provides information about actual account values and actual expenses. You may use the information in this column, together with the amount you invested, to estimate the expenses that you paid over the period. Simply divide your account value by $1,000 (for example, an $8,600 account value divided by $1,000 = 8.6), then multiply the result by the number in the line under the heading entitled “Expenses Paid During Period” to estimate the expenses you paid on your account during this period.
Hypothetical Example for Comparison Purposes
The second set of columns of the table below provides information about hypothetical account values and hypothetical expenses based on a Fund’s actual expense ratio and an assumed rate of return of 5% per year before expenses, which is not the Fund’s actual return. The hypothetical account values and expenses may not be used to estimate the actual ending account balance or expenses you paid for the period. You may use this information to compare the ongoing costs of investing in a Fund and other funds. To do so, compare this 5% hypothetical example with the 5% hypothetical examples that appear in the shareholder reports of the other funds.
Please note that the expenses shown in the table are meant to highlight your ongoing costs only and do not reflect any transactional costs, such as sales charges (loads) and CDSC. Therefore, the second set of columns of the table is useful in comparing ongoing costs only, and will not help you determine the relative total costs of owning different funds. In addition, if these transactional costs were included, your costs would be higher. Expenses are equal to the Fund's annualized expense ratios multiplied by average account value over the period, multiplied by 182/366 (to reflect the one-half year period).
| Beginning Account Value December 31, 2011 | Ending Account Value June 30, 2012 | Expenses paid during the period December 31, 2011 through June 30, 2012 | Beginning Account Value December 31, 2011 | Ending Account Value June 30, 2012 | Expenses paid during the period December 31, 2011 through June 30, 2012 | Annualized expense ratio | Days in the current 1/2 year | Days in the full year | ||||||||||||||||||||||||||||
| American Funds Asset Allocation HLS Fund | ||||||||||||||||||||||||||||||||||||
| Class IB | $ | 1,000.00 | $ | 1,077.22 | $ | 2.84 | $ | 1,000.00 | $ | 1,022.13 | $ | 2.77 | 0.55 | % | 182 | 366 | ||||||||||||||||||||
| American Funds Blue Chip Income and Growth HLS Fund | ||||||||||||||||||||||||||||||||||||
| Class IB | $ | 1,000.00 | $ | 1,083.22 | $ | 2.95 | $ | 1,000.00 | $ | 1,022.03 | $ | 2.87 | 0.57 | % | 182 | 366 | ||||||||||||||||||||
| American Funds Bond HLS Fund | ||||||||||||||||||||||||||||||||||||
| Class IB | $ | 1,000.00 | $ | 1,028.93 | $ | 2.72 | $ | 1,000.00 | $ | 1,022.18 | $ | 2.72 | 0.54 | % | 182 | 366 | ||||||||||||||||||||
| American Funds Global Bond HLS Fund | ||||||||||||||||||||||||||||||||||||
| Class IB | $ | 1,000.00 | $ | 1,027.06 | $ | 2.82 | $ | 1,000.00 | $ | 1,022.08 | $ | 2.82 | 0.56 | % | 182 | 366 | ||||||||||||||||||||
| American Funds Global Growth and Income HLS Fund | ||||||||||||||||||||||||||||||||||||
| Class IB | $ | 1,000.00 | $ | 1,055.80 | $ | 2.81 | $ | 1,000.00 | $ | 1,022.13 | $ | 2.77 | 0.55 | % | 182 | 366 | ||||||||||||||||||||
| American Funds Global Growth HLS Fund | ||||||||||||||||||||||||||||||||||||
| Class IB | $ | 1,000.00 | $ | 1,087.70 | $ | 3.06 | $ | 1,000.00 | $ | 1,021.93 | $ | 2.97 | 0.59 | % | 182 | 366 | ||||||||||||||||||||
| American Funds Global Small Capitalization HLS Fund | ||||||||||||||||||||||||||||||||||||
| Class IB | $ | 1,000.00 | $ | 1,060.83 | $ | 2.92 | $ | 1,000.00 | $ | 1,022.03 | $ | 2.87 | 0.57 | % | 182 | 366 | ||||||||||||||||||||
| American Funds Growth HLS Fund | ||||||||||||||||||||||||||||||||||||
| Class IB | $ | 1,000.00 | $ | 1,080.37 | $ | 2.79 | $ | 1,000.00 | $ | 1,022.18 | $ | 2.72 | 0.54 | % | 182 | 366 | ||||||||||||||||||||
| American Funds Growth-Income HLS Fund | ||||||||||||||||||||||||||||||||||||
| Class IB | $ | 1,000.00 | $ | 1,082.98 | $ | 2.80 | $ | 1,000.00 | $ | 1,022.18 | $ | 2.72 | 0.54 | % | 182 | 366 | ||||||||||||||||||||
| American Funds International HLS Fund | ||||||||||||||||||||||||||||||||||||
| Class IB | $ | 1,000.00 | $ | 1,042.90 | $ | 2.74 | $ | 1,000.00 | $ | 1,022.18 | $ | 2.72 | 0.54 | % | 182 | 366 | ||||||||||||||||||||
| American Funds New World HLS Fund | ||||||||||||||||||||||||||||||||||||
| Class IB | $ | 1,000.00 | $ | 1,045.49 | $ | 2.85 | $ | 1,000.00 | $ | 1,022.08 | $ | 2.82 | 0.56 | % | 182 | 366 | ||||||||||||||||||||
| 41 |
HARTFORD HLS FUNDS
c/o The Hartford Wealth Management - Global Annuities
P.O. Box 14293
Lexington, KY 40512-4293
Hartford Series Fund, Inc. is underwritten and distributed by Hartford Securities Distribution Company, Inc.
"The Hartford" is The Hartford Financial Services Group, Inc. and its subsidiaries.
Hartford Series Fund, Inc. inception dates range from 1977 to date. Hartford Series Fund, Inc. is not a subsidiary of The Hartford but is underwritten, distributed by and advised by subsidiaries of The Hartford. Investments in Hartford Series Fund, Inc. are not guaranteed by The Hartford or any other entity.
You should carefully consider investment objectives, risks, and charges and expenses of Hartford HLS Funds before investing. This and other information can be found in the Fund’s prospectus or summary prospectus, which can be obtained by calling 800-862-6668. Please read them carefully before you invest or send money.
| AFHLSSAR-12 8-12 111647 Printed in U.S.A ©2012 The Hartford, Hartford, CT 06115 |  |

A MESSAGE FROM THE PRESIDENT
Dear Fellow Shareholders:
I want to take this opportunity to say thank you for investing in the Hartford HLS Funds. We’ve seen continued market volatility throughout the first half of 2012, and there will likely be continued uncertainty until the Presidential election in November, but we are still optimistic about the markets in 2012.
Market Review
In the first quarter of 2012, the S&P 500 Index turned in its best quarterly performance since the third quarter of 2009. U.S. equities showed signs of improvement as investors focused on improving economic data and strong corporate earnings news and the Federal Reserve’s pledge to keep interest rates low buoyed investors’ appetites.
The second quarter ended on a high note for the stock market—the S&P 500 had its strongest June in more than a decade and the Dow Jones Industrial Average had its best month since October—but those gains weren’t enough to offset losses from April and May, and equities finished the quarter in the red. Although the S&P 500 was -2.75 for the second quarter, it was up 9.49% for the first half of 2012.
Concerns about domestic and European unemployment are having an effect on our economy. The unemployment rate in the euro zone's 17 nations rose to a record 11.1% in May, the highest level since the euro launched as a common currency more than 10 years ago. In the U.S., the labor market has been fickle this year, with job growth starting off strong in the first couple months of 2012 but slowing down in the spring, which has led many to wonder about the status of the economic recovery.
On a positive note, home prices are rising again after falling for more than five years, new and existing home sales are increasing, and home builders are ramping up construction.
The Hartford HLS Funds Expands Relationship with Wellington Management
We’re very pleased that we are expanding our relationship with Wellington Management, which will now serve as the primary sub-adviser for the Hartford HLS Funds including equity, fixed-income,* and asset-allocation funds. One of America’s oldest and largest investment management firms, Wellington Management has resources that span the entire globe, with multiple offices across the U.S. and numerous offices abroad. Wellington Management’s most distinctive strength is its proprietary research, which is shared across the entire organization.
We believe that aligning more closely with a well-respected money manager like Wellington Management puts us in a strong position to drive significant growth and to continue delivering innovative fund strategies to help our investors meet their financial goals.
Thank you again for investing with the Hartford HLS Funds.
James Davey
President
Hartford HLS Funds
*Several fixed-income funds will continue to be sub-advised by Hartford Investment Management Company.
(formerly Hartford Advisers HLS Fund)
Table of Contents
This report is prepared for the general information of contract owners and qualified retirement plan participants. It is not an offer of contracts or of qualified retirement plans. It should not be used in connection with any offer, except in conjunction with the appropriate product prospectus which contains all pertinent information including the applicable sales, administrative and other charges.
The views expressed in the Fund’s Manager Discussion under ‘‘Why did the Fund perform this way?’’ and ‘‘What is the outlook?’’ are views of the Fund’s sub-adviser and portfolio management team through the end of the period and are subject to change based on market and other conditions.
Hartford Balanced HLS Fund inception 03/31/1983
| (formerly Hartford Advisers HLS Fund) | |
| (sub-advised by Wellington Management Company, LLP) | |
| Investment objective – Seeks long-term total return. |
Performance Overview 6/30/02 - 6/30/12
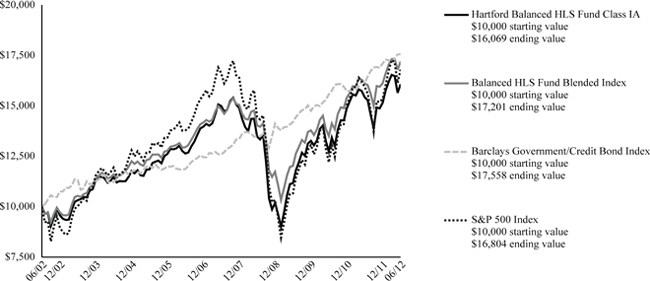
The chart above shows the growth of a $10,000 investment in Class IA. Growth results in classes other than Class IA will vary from what is seen above due to differences in the expenses charged to those share classes.
Average Annual Total Returns (as of 6/30/12)
| 6 Month† | 1 Year | 5 year | 10 year | |||||||||||||
| Balanced IA | 6.05 | % | 4.15 | % | 1.39 | % | 4.86 | % | ||||||||
| Balanced IB | 5.92 | % | 3.89 | % | 1.14 | % | 4.60 | % | ||||||||
| Balanced HLS Fund Blended Index | 6.71 | % | 6.77 | % | 3.01 | % | 5.57 | % | ||||||||
| Barclays Government/Credit Bond Index | 2.65 | % | 8.78 | % | 6.90 | % | 5.79 | % | ||||||||
| S&P 500 Index | 9.48 | % | 5.43 | % | 0.21 | % | 5.33 | % | ||||||||
| † | Not Annualized |
PAST PERFORMANCE IS NOT INDICATIVE OF FUTURE RESULTS.
Total returns presented above were calculated using the Fund's net asset value available to shareholders for sale or redemption of Fund shares on June 30, 2012, which may exclude investment transactions as of this date.
Balanced HLS Fund Blended Index is a blended index comprised of the following indices: S&P 500 (60%), Barclays Capital U.S. Government/Credit Bond (35%) and 90 day Treasury Bill (5%).
Barclays Government/Credit Bond Index (formerly known as Barclays Capital Government/Credit Bond Index) is an unmanaged, market-value-weighted index of all debt obligations of the U.S. Treasury and U.S. Government agencies (excluding mortgaged-backed securities) and of all publicly-issued fixed-rate, nonconvertible, investment grade domestic corporate debt.
S&P 500 Index is a market capitalization-weighted price index composed of 500 widely held common stocks.
You cannot invest directly in an index.
The chart represents a hypothetical investment in the Fund. Performance data represents past performance and current performance could be higher or lower.
Performance information may reflect historical or current expense waivers/reimbursements from the investment adviser, without which performance would have been lower. For information on current expense waivers/reimbursements, please see the prospectus.
The value of the Fund will fluctuate so that when redeemed, it may be worth more or less than the original investment. The chart and table do not reflect the deductions of taxes, sales charges or other fees which may be applied at the variable life insurance, variable annuity or qualified retirement plan product level. Any such additional sales charges or other fees or expenses would lower the contract’s or plan’s performance.
| 2 |
Hartford Balanced HLS Fund (formerly Hartford Advisers HLS Fund)
Manager Discussion
June 30, 2012 (Unaudited)
| Portfolio Managers | |
| John C. Keogh | Karen H. Grimes, CFA* |
| Senior Vice President and Fixed Income Portfolio Manager | Senior Vice President and Equity Portfolio Manager |
* Appointed as a Portfolio Manager for the Fund as of April 30, 2012. As of the same date, Steven T. Irons and Peter I. Higgins no longer serve as portfolio managers for the Fund.
| |
How did the Fund perform?
The Class IA shares of the Hartford Balanced HLS Fund returned 6.05% for the six-month period ended June 30, 2012, underperforming its blended benchmark, 60% S&P 500 Index, 35% Barclays U.S. Government/Credit, and 5% 90 day Treasury Bill, which returned 6.71% for the same period. The Fund underperformed the 6.19% return of the average fund in the Lipper Mixed-Asset Target Allocation Growth VP-UF Funds peer group, a group of funds that hold between 60%-80% in equity securities, with the remainder invested in bonds, cash, and cash equivalents.
Why did the Fund perform this way?
U.S. equities rose at the start of the year based on improving macroeconomic data including employment data and consumer confidence. Following a strong first quarter, equities retreated in April, fell sharply in May, and recovered modestly in June. Fears surrounding European sovereign debt took center stage. Equity markets as measured by the S&P 500 returned 9.48% during the period. Telecommunication Services (+17%), Financials (+14%), and Information Technology (+13%) posted the largest gains while Energy (-2%) was the only sector to post a negative absolute (i.e. total return) performance return.
The bond market, as measured by the Barclays Government/Credit Bond Index, returned 2.65% during the period. All risk segments of the fixed income market outperformed duration-equivalent Treasuries for the period.
The Fund has three primary levers to generate investment performance: equity investments, fixed income investments, and asset allocation among stocks, bonds, and cash. During the period, the equity portion of the Fund underperformed its benchmark, while the fixed income portion of the Fund outperformed its benchmark. Asset allocation contributed positively to benchmark-relative results as the Fund was generally overweight in equities and underweight in fixed income and cash relative to the benchmark.
Equity underperformance versus the benchmark was driven by security selection, which was weakest in Information Technology, Financials, and Consumer Staples. This was partially offset by stronger selection in Consumer Discretionary. Sector positioning, which is a result of bottom-up (i.e. stock by stock fundamental research) security selection, contributed positively to relative performance due to an overweight (i.e. the Fund’s sector position was greater than the benchmark position) to Information Technology and underweight exposure to Utilities.
Stocks that detracted the most from relative returns (i.e. performance of the Fund as measured against the benchmark) in the equity portion of the Fund during the period were Google (Information Technology), Western Union (Information Technology), and Hewlett-Packard (Information Technology). Google, a leading provider of online search, internet content services, and web-based software applications, saw its shares decline in the face of a potential slow down in advertising expenditure in a lower global growth environment. Shares of U.S.-based global money transfer and payments company Western Union fell after the company issued lower-than-expected earnings guidance. Shares of Hewlett-Packard, a computer and technology provider, declined after the company issued first quarter results that included declining revenues in its key commercial printing segment and near-term earnings guidance that was below analysts’ expectations in the midst of economic uncertainty in Europe. Anadarko Petroleum (Energy) also detracted from the Fund’s returns on an absolute basis.
Top contributors to relative performance of the equity portion of the Fund during the period were Harley-Davidson (Consumer Discretionary), Ingersoll-Rand (Industrials), and eBay (Information Technology). Motorcycle manufacturer Harley-Davidson saw its shares rise in the first four months of the year as it announced strong earnings which exceeded expectations. Shares of Ingersoll-Rand, a provider of industrial machinery, climate control systems and security products, surged higher after residential markets strengthened and the company beat consensus fourth quarter earnings estimates. Shares of eBay, a U.S.-based global provider of online marketplaces and payment solutions, rose after the company reported better-than-expected first quarter results due to strong growth in its marketplace segment and higher
| 3 |
Hartford Balanced HLS Fund (formerly Hartford Advisers HLS Fund)
Manager Discussion – (continued)
June 30, 2012 (Unaudited)
transaction margins in the payments segment. Apple (Information Technology), Wells Fargo (Financials), and Comcast (Consumer Discretionary) also contributed positively to the Fund’s returns on an absolute basis.
The fixed income portion of the Fund outperformed its benchmark during the period. Security selection within the Investment Grade corporate bond sector was the primary driver of the outperformance. An allocation to agency mortgage-backed securities (MBS) was also modestly additive. Our duration and yield curve positioning had minimal impact on relative performance. Despite a challenging second quarter due to the escalation of the European sovereign debt crisis, investment grade corporate bonds posted strong performance for the period. Outperformance came during the first quarter, in reaction to the release of encouraging U.S. economic releases and some positive developments out of Europe. Within the sector, financials benefitted early on from the confidence-boosting Long Term Refinancing Operation in Europe which alleviated liquidity and funding concerns for European financial firms in general. The Fund’s overweight to Financials, particularly Banks, was a positive for relative performance. The Fund held an allocation to the agency MBS sector based on what we considered attractive valuations. Market expectations of additional MBS purchases by the Federal Reserve under any future quantitative easing program seemed to have helped agency MBS to outperform.
What is the outlook?
We expect global economic growth to continue, but at a subpar recovery rate and with varying degrees of recovery by region. Investor focus on potential problem areas, such as the European debt crisis and a slowdown in China, are likely to generate a moderate level of volatility, particularly in a low-growth environment.
Within the equity portion of the Fund we continue to focus our efforts on stock-by-stock fundamental research to construct a diversified large-cap core portfolio. We look for stocks of what we believe are financially sound but out-of-favor companies that provide above-average potential total returns and sell at below-average price/earnings multiples. At the end of the period, our bottom-up investment approach resulted in the largest overweight exposures in Information Technology, Health Care, and Energy. The largest underweights of the equity portion of the Fund to the S&P 500 were in Industrials, Consumer Staples, and Utilities.
Overall within the fixed income portion of the Fund, we are tactically managing the Fund’s duration around neutral and are positioned for a flattening yield curve. We continue to be positioned with an underweight to the Government sector, as we believe that there are more compelling opportunities in other sectors. We believe that corporate fundamentals remain strong, financial companies have de-levered significantly, and that communications issuers have solid balance sheets. We also maintained our overweight posture to the corporate sector at the end of the period. We also maintained our modest allocation to agency MBS.
The equity and fixed income managers will continue to work collaboratively to make decisions regarding portfolio weights in stocks, bonds, and cash. As of June 30, 2012, the Fund’s equity exposure was at 67% compared to 60% in its benchmark and at the upper end of the Fund’s 50-70% range.
| 4 |
| Diversification by Industry | ||||
| as of June 30, 2012 | ||||
| Industry (Sector) | Percentage of Net Assets | |||
| Equity Securities | ||||
| Automobiles & Components (Consumer Discretionary) | 0.5 | % | ||
| Banks (Financials) | 4.1 | |||
| Capital Goods (Industrials) | 4.2 | |||
| Consumer Durables & Apparel (Consumer Discretionary) | 0.6 | |||
| Diversified Financials (Financials) | 4.6 | |||
| Energy (Energy) | 7.9 | |||
| Food & Staples Retailing (Consumer Staples) | 1.0 | |||
| Food, Beverage & Tobacco (Consumer Staples) | 4.7 | |||
| Health Care Equipment & Services (Health Care) | 2.3 | |||
| Insurance (Financials) | 1.3 | |||
| Materials (Materials) | 2.2 | |||
| Media (Consumer Discretionary) | 3.2 | |||
| Pharmaceuticals, Biotechnology & Life Sciences (Health Care) | 7.7 | |||
| Retailing (Consumer Discretionary) | 3.6 | |||
| Semiconductors & Semiconductor Equipment (Information Technology) | 2.9 | |||
| Software & Services (Information Technology) | 6.3 | |||
| Technology Hardware & Equipment (Information Technology) | 7.0 | |||
| Telecommunication Services (Services) | 0.9 | |||
| Transportation (Industrials) | 0.6 | |||
| Utilities (Utilities) | 1.2 | |||
| Total | 66.8 | % | ||
| Fixed Income Securities | ||||
| Air Transportation (Transportation) | 0.3 | % | ||
| Arts, Entertainment and Recreation (Services) | 0.8 | |||
| Beverage and Tobacco Product Manufacturing (Consumer Staples) | 0.4 | |||
| Chemical Manufacturing (Basic Materials) | 0.0 | |||
| Computer and Electronic Product Manufacturing (Technology) | 0.1 | |||
| Electrical Equipment and Appliance Manufacturing (Technology) | 0.2 | |||
| Finance and Insurance (Finance) | 6.5 | |||
| Food Manufacturing (Consumer Staples) | 0.4 | |||
| General Obligations (General Obligations) | 0.4 | |||
| Health Care and Social Assistance (Health Care) | 0.5 | |||
| Health Care/Services (Health Care/Services) | 0.1 | |||
| Higher Education (Univ., Dorms, etc.) (Higher Education (Univ., Dorms, etc.)) | 0.1 | |||
| Information (Technology) | 0.4 | |||
| Miscellaneous Manufacturing (Capital Goods) | 0.1 | |||
| Motor Vehicle and Parts Manufacturing (Consumer Cyclical) | 0.2 | |||
| Petroleum and Coal Products Manufacturing (Energy) | 0.5 | |||
| Pipeline Transportation (Utilities) | 0.2 | |||
| Real Estate, Rental and Leasing (Finance) | 0.4 | |||
| Refunded (Refunded) | 0.1 | |||
| Retail Trade (Consumer Cyclical) | 0.3 | |||
| Soap, Cleaning Compound and Toilet Manufacturing (Consumer Staples) | 0.4 | |||
| Tax Allocation (Tax Allocation) | 0.1 | |||
| Transportation (Transportation) | 0.4 | % | ||
| Utilities (Utilities) | 0.8 | |||
| Total | 13.7 | % | ||
| U.S. Government Agencies | 1.3 | |||
| U.S. Government Securities | 15.4 | |||
| Short-Term Investments | 2.6 | |||
| Other Assets and Liabilities | 0.2 | |||
| Total | 100.0 | % | ||
| Distribution by Credit Quality | ||||
| as of June 30, 2012 | ||||
| Credit Rating * | Percentage of Net Assets | |||
| Aaa / AAA | 0.2 | |||
| Aa / AA | 2.2 | |||
| A | 4.8 | |||
| Baa / BBB | 5.5 | |||
| Ba / BB | 0.4 | |||
| Unrated | 0.6 | |||
| U.S. Government Agencies and Securities | 16.7 | |||
| Non Debt Securities and Other Short-Term Instruments | 69.4 | |||
| Other Assets & Liabilities | 0.2 | |||
| Total | 100.0 | % | ||
| * | Does not apply to the Fund itself. Based upon Moody’s and S&P long-term credit ratings for the Fund’s holdings as of the date noted. If Moody's and S&P assign different ratings to a holding, the lower rating is used. "Unrated" includes fixed-income securities (other than cash-like short-term instruments and U.S. Government securities) for which Moody’s and S&P have not issued long-term credit ratings. |
| 5 |
Hartford Balanced HLS Fund (formerly Hartford Advisers HLS Fund)
Schedule of Investments
June 30, 2012 (Unaudited)
(000’s Omitted)
| Shares or Principal Amount | Market Value ╪ | |||||||
| COMMON STOCKS - 66.8% | ||||||||
| Automobiles & Components - 0.5% | ||||||||
| 1,846 | Ford Motor Co. w/ Rights | $ | 17,698 | |||||
| Banks - 4.1% | ||||||||
| 1,088 | BB&T Corp. | 33,571 | ||||||
| 490 | PNC Financial Services Group, Inc. | 29,956 | ||||||
| 2,121 | Wells Fargo & Co. | 70,921 | ||||||
| 134,448 | ||||||||
| Capital Goods - 4.2% | ||||||||
| 424 | 3M Co. | 37,999 | ||||||
| 334 | Boeing Co. | 24,809 | ||||||
| 648 | Ingersoll-Rand plc | 27,320 | ||||||
| 667 | PACCAR, Inc. | 26,132 | ||||||
| 346 | Stanley Black & Decker, Inc. | 22,249 | ||||||
| 138,509 | ||||||||
| Consumer Durables & Apparel - 0.6% | ||||||||
| 621 | Mattel, Inc. | 20,158 | ||||||
| Diversified Financials - 4.6% | ||||||||
| 211 | Ameriprise Financial, Inc. | 11,027 | ||||||
| 132 | BlackRock, Inc. | 22,416 | ||||||
| 851 | Citigroup, Inc. | 23,326 | ||||||
| 197 | Goldman Sachs Group, Inc. | 18,884 | ||||||
| 956 | Invesco Ltd. | 21,615 | ||||||
| 1,541 | JP Morgan Chase & Co. | �� | 55,046 | |||||
| 152,314 | ||||||||
| Energy - 7.9% | ||||||||
| 387 | Anadarko Petroleum Corp. | 25,619 | ||||||
| 578 | Baker Hughes, Inc. | 23,752 | ||||||
| 497 | BP plc ADR | 20,156 | ||||||
| 115 | Chevron Corp. | 12,080 | ||||||
| 1,105 | Exxon Mobil Corp. | 94,572 | ||||||
| 506 | Noble Corp. | 16,463 | ||||||
| 314 | Occidental Petroleum Corp. | 26,889 | ||||||
| 401 | Southwestern Energy Co. ● | 12,794 | ||||||
| 1,188 | Statoilhydro ASA ADR | 28,339 | ||||||
| 260,664 | ||||||||
| Food & Staples Retailing - 1.0% | ||||||||
| 663 | CVS Caremark Corp. | 30,987 | ||||||
| Food, Beverage & Tobacco - 4.7% | ||||||||
| 386 | Archer Daniels Midland Co. | 11,401 | ||||||
| 814 | General Mills, Inc. | 31,371 | ||||||
| 843 | Kraft Foods, Inc. | 32,557 | ||||||
| 454 | PepsiCo, Inc. | 32,087 | ||||||
| 267 | Philip Morris International, Inc. | 23,324 | ||||||
| 699 | Unilever N.V. NY Shares ADR | 23,305 | ||||||
| 154,045 | ||||||||
| Health Care Equipment & Services - 2.3% | ||||||||
| 370 | Baxter International, Inc. | 19,687 | ||||||
| 489 | Covidien plc | 26,167 | ||||||
| 511 | UnitedHealth Group, Inc. | 29,876 | ||||||
| 75,730 | ||||||||
| Insurance - 1.3% | ||||||||
| 940 | Marsh & McLennan Cos., Inc. | 30,296 | ||||||
| 608 | Unum Group | 11,622 | ||||||
| 41,918 | ||||||||
| Materials - 2.2% | ||||||||
| 691 | Dow Chemical Co. | 21,779 | ||||||
| 567 | International Paper Co. | 16,401 | ||||||
| 383 | Mosaic Co. | 20,973 | ||||||
| 353 | Nucor Corp. | 13,379 | ||||||
| 72,532 | ||||||||
| Media - 3.2% | ||||||||
| 394 | CBS Corp. Class B | 12,899 | ||||||
| 1,258 | Comcast Corp. Class A | 40,202 | ||||||
| 650 | Thomson Reuters Corp. | 18,484 | ||||||
| 665 | Walt Disney Co. | 32,238 | ||||||
| 103,823 | ||||||||
| Pharmaceuticals, Biotechnology & Life Sciences - 7.7% | ||||||||
| 530 | Agilent Technologies, Inc. | 20,809 | ||||||
| 486 | Amgen, Inc. | 35,512 | ||||||
| 409 | Celgene Corp. ● | 26,235 | ||||||
| 1,180 | Daiichi Sankyo Co., Ltd. | 19,892 | ||||||
| 1,258 | Merck & Co., Inc. | 52,525 | ||||||
| 2,198 | Pfizer, Inc. | 50,552 | ||||||
| 145 | Roche Holding AG | 25,107 | ||||||
| 465 | UCB S.A. | 23,467 | ||||||
| 254,099 | ||||||||
| Retailing - 3.6% | ||||||||
| 11,702 | Allstar Co. ⌂† | 17,222 | ||||||
| 11,241 | Buck Holdings L.P. ⌂●† | 20,476 | ||||||
| 428 | Kohl's Corp. | 19,479 | ||||||
| 1,529 | Lowe's Co., Inc. | 43,496 | ||||||
| 359 | Nordstrom, Inc. | 17,829 | ||||||
| 118,502 | ||||||||
| Semiconductors & Semiconductor Equipment - 2.9% | ||||||||
| 666 | Analog Devices, Inc. | 25,077 | ||||||
| 1,100 | Intel Corp. | 29,304 | ||||||
| 1,001 | Maxim Integrated Products, Inc. | 25,668 | ||||||
| 462 | Xilinx, Inc. | 15,523 | ||||||
| 95,572 | ||||||||
| Software & Services - 6.3% | ||||||||
| 390 | Accenture plc | 23,417 | ||||||
| 458 | Automatic Data Processing, Inc. | 25,475 | ||||||
| 763 | eBay, Inc. ● | 32,033 | ||||||
| 83 | Google, Inc. ● | 48,088 | ||||||
| 1,120 | Microsoft Corp. | 34,270 | ||||||
| 2,475 | Western Union Co. | 41,681 | ||||||
| 204,964 | ||||||||
| Technology Hardware & Equipment - 7.0% | ||||||||
| 173 | Apple, Inc. ● | 100,857 | ||||||
| 3,029 | Cisco Systems, Inc. | 52,008 | ||||||
| 1,070 | EMC Corp. ● | 27,419 | ||||||
| 970 | Hewlett-Packard Co. | 19,504 | ||||||
| 527 | Qualcomm, Inc. | 29,360 | ||||||
| 229,148 | ||||||||
| Telecommunication Services - 0.9% | ||||||||
| 1,005 | Vodafone Group plc ADR | 28,318 | ||||||
| Transportation - 0.6% | ||||||||
| 225 | FedEx Corp. | 20,652 | ||||||
| Utilities - 1.2% | ||||||||
| 556 | NextEra Energy, Inc. | 38,258 | ||||||
| Total common stocks | ||||||||
| (cost $1,933,117) | $ | 2,192,339 | ||||||
The accompanying notes are an integral part of these financial statements.
| 6 |
| Shares or Principal Amount | Market Value ╪ | |||||||
| ASSET & COMMERCIAL MORTGAGE BACKED SECURITIES - 0.1% | ||||||||
| Finance and Insurance - 0.1% | ||||||||
| CS First Boston Mortgage Securities Corp. | ||||||||
| $ | 421 | 3.94%, 05/15/2038 | $ | 428 | ||||
| Goldman Sachs Mortgage Securities Corp. II | ||||||||
| 110 | 2.79%, 03/06/2020 ■Δ | 109 | ||||||
| Marriott Vacation Club Owner Trust | ||||||||
| 349 | 5.36%, 10/20/2028 ■ | 354 | ||||||
| New Century Home Equity Loan Trust | ||||||||
| 8 | 0.54%, 03/25/2035 Δ | 7 | ||||||
| Prudential Commercial Mortgage Trust | ||||||||
| 570 | 4.49%, 02/11/2036 | 579 | ||||||
| 1,477 | ||||||||
| Total asset & commercial mortgage backed securities | ||||||||
| (cost $1,453) | $ | 1,477 | ||||||
| CORPORATE BONDS - 12.4% | ||||||||
| Air Transportation - 0.3% | ||||||||
| Continental Airlines, Inc. | ||||||||
| $ | 3,776 | 5.98%, 04/19/2022 | $ | 4,096 | ||||
| Southwest Airlines Co. | ||||||||
| 2,700 | 5.75%, 12/15/2016 | 3,120 | ||||||
| 2,901 | 6.15%, 08/01/2022 | 3,302 | ||||||
| 10,518 | ||||||||
| Arts, Entertainment and Recreation - 0.8% | ||||||||
| CBS Corp. | ||||||||
| 6,860 | 3.38%, 03/01/2022 | 6,834 | ||||||
| 575 | 5.75%, 04/15/2020 | 669 | ||||||
| Comcast Corp. | ||||||||
| 1,740 | 4.65%, 07/15/2042 ☼ | 1,741 | ||||||
| 4,500 | 5.90%, 03/15/2016 | 5,182 | ||||||
| DirecTV Holdings LLC | ||||||||
| 3,310 | 6.38%, 03/01/2041 | 3,790 | ||||||
| Discovery Communications, Inc. | ||||||||
| 250 | 4.95%, 05/15/2042 | 261 | ||||||
| News America, Inc. | ||||||||
| 1,275 | 4.50%, 02/15/2021 | 1,398 | ||||||
| Time Warner Cable, Inc. | ||||||||
| 4,870 | 5.85%, 05/01/2017 | 5,723 | ||||||
| Viacom, Inc. | ||||||||
| 835 | 3.88%, 12/15/2021 | 887 | ||||||
| Virgin Media Secured Finance plc | ||||||||
| 1,255 | 5.25%, 01/15/2021 | 1,390 | ||||||
| 27,875 | ||||||||
| Beverage and Tobacco Product Manufacturing - 0.4% | ||||||||
| Altria Group, Inc. | ||||||||
| 2,445 | 4.75%, 05/05/2021 | 2,773 | ||||||
| Anheuser-Busch InBev Worldwide, Inc. | ||||||||
| 4,200 | 7.75%, 01/15/2019 | 5,547 | ||||||
| BAT International Finance plc | ||||||||
| 2,775 | 3.25%, 06/07/2022 ■ | 2,742 | ||||||
| Coca-Cola Co. | ||||||||
| 500 | 3.30%, 09/01/2021 | 536 | ||||||
| Diageo Capital plc | ||||||||
| 430 | 5.20%, 01/30/2013 | 442 | ||||||
| Molson Coors Brewing Co. | ||||||||
| 60 | 2.00%, 05/01/2017 | 61 | ||||||
| 165 | 3.50%, 05/01/2022 | 169 | ||||||
| 495 | 5.00%, 05/01/2042 | 535 | ||||||
| Philip Morris International, Inc. | ||||||||
| 270 | 5.65%, 05/16/2018 | 326 | ||||||
| 13,131 | ||||||||
| Chemical Manufacturing - 0.0% | ||||||||
| Agrium, Inc. | ||||||||
| 660 | 6.13%, 01/15/2041 | 808 | ||||||
| Computer and Electronic Product Manufacturing - 0.1% | ||||||||
| Dell, Inc. | ||||||||
| 2,735 | 5.88%, 06/15/2019 | 3,218 | ||||||
| Thermo Fisher Scientific, Inc. | ||||||||
| 845 | 3.20%, 05/01/2015 | 898 | ||||||
| 4,116 | ||||||||
| Electrical Equipment and Appliance Manufacturing - 0.2% | ||||||||
| General Electric Co. | ||||||||
| 6,925 | 5.00%, 02/01/2013 | 7,102 | ||||||
| Finance and Insurance - 6.4% | ||||||||
| ACE INA Holdings, Inc. | ||||||||
| 700 | 5.88%, 06/15/2014 | 763 | ||||||
| American Express Centurion Bank | ||||||||
| 6,350 | 6.00%, 09/13/2017 | 7,499 | ||||||
| Bank of America Corp. | ||||||||
| 200 | 7.38%, 05/15/2014 | 215 | ||||||
| Barclays Bank plc | ||||||||
| 2,150 | 2.38%, 01/13/2014 | 2,155 | ||||||
| BP Capital Markets plc | ||||||||
| 2,850 | 4.75%, 03/10/2019 | 3,225 | ||||||
| Brandywine Operating Partnership | ||||||||
| 2,010 | 6.00%, 04/01/2016 | 2,146 | ||||||
| Capital One Financial Corp. | ||||||||
| 2,460 | 2.15%, 03/23/2015 | 2,479 | ||||||
| CDP Financial, Inc. | ||||||||
| 3,475 | 4.40%, 11/25/2019 ■ | 3,928 | ||||||
| Citigroup, Inc. | ||||||||
| 3,000 | 5.85%, 08/02/2016 | 3,257 | ||||||
| 2,700 | 6.13%, 05/15/2018 | 3,015 | ||||||
| 1,700 | 6.88%, 03/05/2038 | 2,079 | ||||||
| 520 | 8.13%, 07/15/2039 | 694 | ||||||
| Credit Agricole | ||||||||
| 3,950 | 3.50%, 04/13/2015 ■ | 3,873 | ||||||
| Discover Financial Services, Inc. | ||||||||
| 3,620 | 6.45%, 06/12/2017 | 4,062 | ||||||
| Eaton Vance Corp. | ||||||||
| 3,305 | 6.50%, 10/02/2017 | 3,776 | ||||||
| Everest Reinsurance Holdings, Inc. | ||||||||
| 4,525 | 5.40%, 10/15/2014 | 4,721 | ||||||
| Ford Motor Credit Co. | ||||||||
| 2,665 | 3.00%, 06/12/2017 | 2,650 | ||||||
| General Electric Capital Corp. | ||||||||
| 4,300 | 4.38%, 09/16/2020 | 4,652 | ||||||
| 5,000 | 5.88%, 01/14/2038 | 5,740 | ||||||
| Goldman Sachs Group, Inc. | ||||||||
| 6,000 | 5.63%, 01/15/2017 | 6,293 | ||||||
| 1,700 | 6.15%, 04/01/2018 | 1,843 | ||||||
| 2,590 | 6.25%, 02/01/2041 | 2,701 | ||||||
| Health Care Properties | ||||||||
| 2,030 | 6.00%, 01/30/2017 | 2,274 | ||||||
The accompanying notes are an integral part of these financial statements.
| 7 |
Hartford Balanced HLS Fund (formerly Hartford Advisers HLS Fund)
Schedule of Investments – (continued)
June 30, 2012 (Unaudited)
(000’s Omitted)
| Shares or Principal Amount | Market Value ╪ | |||||||
| CORPORATE BONDS - 12.4% - (continued) | ||||||||
| Finance and Insurance - 6.4% - (continued) | ||||||||
| HSBC Holdings plc | ||||||||
| $ | 4,000 | 6.10%, 01/14/2042 | $ | 4,899 | ||||
| ING Bank N.V. | ||||||||
| 5,200 | 3.75%, 03/07/2017 ■ | 5,176 | ||||||
| Jackson National Life Insurance Co. | ||||||||
| 6,250 | 8.15%, 03/15/2027 ■ | 7,613 | ||||||
| JP Morgan Chase & Co. | ||||||||
| 2,000 | 4.95%, 03/25/2020 | 2,205 | ||||||
| 10,375 | 5.13%, 09/15/2014 | 11,022 | ||||||
| 1,080 | 5.40%, 01/06/2042 | 1,186 | ||||||
| Merrill Lynch & Co., Inc. | ||||||||
| 11,000 | 5.00%, 02/03/2014 | 11,376 | ||||||
| 1,000 | 6.40%, 08/28/2017 | 1,088 | ||||||
| 6,000 | 6.88%, 04/25/2018 | 6,714 | ||||||
| Morgan Stanley | ||||||||
| 6,000 | 5.38%, 10/15/2015 | 6,133 | ||||||
| 250 | 5.63%, 09/23/2019 | 248 | ||||||
| National City Corp. | ||||||||
| 4,250 | 6.88%, 05/15/2019 | 5,129 | ||||||
| New England Mutual Life Insurance Co. | ||||||||
| 6,000 | 7.88%, 02/15/2024 ■ | 7,746 | ||||||
| Nordea Bank Ab | ||||||||
| 1,790 | 3.70%, 11/13/2014 ■ | 1,862 | ||||||
| Postal Square L.P. | ||||||||
| 13,683 | 8.95%, 06/15/2022 | 18,911 | ||||||
| Prudential Financial, Inc. | ||||||||
| 8,000 | 5.50%, 03/15/2016 | 8,859 | ||||||
| Rabobank Netherlands | ||||||||
| 3,900 | 3.20%, 03/11/2015 ■ | 4,015 | ||||||
| Republic New York Capital I | ||||||||
| 500 | 7.75%, 11/15/2026 | 504 | ||||||
| Royal Bank of Scotland plc | ||||||||
| 2,600 | 4.88%, 03/16/2015 | 2,690 | ||||||
| Southern Capital Corp. | ||||||||
| 54 | 5.70%, 06/30/2022 ■ | 56 | ||||||
| Sovereign Bancorp, Inc. | ||||||||
| 4,795 | 8.75%, 05/30/2018 | 5,199 | ||||||
| Sovereign Capital Trust IV | ||||||||
| 7,250 | 7.91%, 06/13/2036 | 6,957 | ||||||
| Svenska Handelsbanken Ab | ||||||||
| 2,900 | 4.88%, 06/10/2014 ■ | 3,061 | ||||||
| UBS AG Stamford | ||||||||
| 235 | 5.88%, 12/20/2017 | 262 | ||||||
| Wachovia Corp. | ||||||||
| 10,000 | 5.25%, 08/01/2014 | 10,668 | ||||||
| 1,000 | 5.75%, 06/15/2017 | 1,164 | ||||||
| WEA Finance LLC | ||||||||
| 1,450 | 7.13%, 04/15/2018 ■ | 1,718 | ||||||
| 210,501 | ||||||||
| Food Manufacturing - 0.4% | ||||||||
| Kellogg Co. | ||||||||
| 3,900 | 4.00%, 12/15/2020 | 4,293 | ||||||
| Kraft Foods, Inc. | ||||||||
| 555 | 2.25%, 06/05/2017 ■ | 568 | ||||||
| 535 | 3.50%, 06/06/2022 ■ | 549 | ||||||
| 3,800 | 4.13%, 02/09/2016 | 4,138 | ||||||
| 605 | 5.00%, 06/04/2042 ■ | 641 | ||||||
| 285 | 5.38%, 02/10/2020 | 337 | ||||||
| William Wrigley Jr. Co. | ||||||||
| 3,900 | 3.70%, 06/30/2014 ■ | 4,029 | ||||||
| 14,555 | ||||||||
| Health Care and Social Assistance - 0.5% | ||||||||
| Amgen, Inc. | ||||||||
| 3,300 | 5.15%, 11/15/2041 | 3,445 | ||||||
| CVS Caremark Corp. | ||||||||
| 7,725 | 6.13%, 08/15/2016 | 9,036 | ||||||
| Express Scripts, Inc. | ||||||||
| 1,020 | 6.25%, 06/15/2014 | 1,115 | ||||||
| Kaiser Permanente | ||||||||
| 326 | 3.50%, 04/01/2022 | 339 | ||||||
| 640 | 4.88%, 04/01/2042 | 705 | ||||||
| McKesson Corp. | ||||||||
| 475 | 3.25%, 03/01/2016 | 510 | ||||||
| Merck & Co., Inc. | ||||||||
| 2,100 | 4.00%, 06/30/2015 | 2,291 | ||||||
| 17,441 | ||||||||
| Information - 0.4% | ||||||||
| AT&T, Inc. | ||||||||
| 2,510 | 6.80%, 05/15/2036 | 3,254 | ||||||
| BellSouth Telecommunications | ||||||||
| 650 | 7.00%, 12/01/2095 | 789 | ||||||
| France Telecom S.A. | ||||||||
| 1,300 | 4.13%, 09/14/2021 | 1,360 | ||||||
| SBA Tower Trust | ||||||||
| 2,035 | 4.25%, 04/15/2015 ■ | 2,128 | ||||||
| Verizon Communications, Inc. | ||||||||
| 2,415 | 3.50%, 11/01/2021 | 2,571 | ||||||
| 240 | 4.35%, 02/15/2013 | 246 | ||||||
| 715 | 4.75%, 11/01/2041 | 786 | ||||||
| Verizon Wireless Capital LLC | ||||||||
| 395 | 5.55%, 02/01/2014 | 423 | ||||||
| 11,557 | ||||||||
| Miscellaneous Manufacturing - 0.1% | ||||||||
| United Technologies Corp. | ||||||||
| 405 | 1.80%, 06/01/2017 | 414 | ||||||
| 365 | 3.10%, 06/01/2022 | 382 | ||||||
| 875 | 4.50%, 06/01/2042 | 961 | ||||||
| 1,757 | ||||||||
| Motor Vehicle and Parts Manufacturing - 0.2% | ||||||||
| Daimler Finance NA LLC | ||||||||
| 5,600 | 2.63%, 09/15/2016 ■ | 5,763 | ||||||
| Petroleum and Coal Products Manufacturing - 0.5% | ||||||||
| Atmos Energy Corp. | ||||||||
| 5,875 | 6.35%, 06/15/2017 | 6,975 | ||||||
| EnCana Corp. | ||||||||
| 305 | 5.90%, 12/01/2017 | 348 | ||||||
| Motiva Enterprises LLC | ||||||||
| 420 | 5.75%, 01/15/2020 ■ | 491 | ||||||
| Ras Laffan Liquefied Natural Gas Co., Ltd. | ||||||||
| 1,200 | 5.50%, 09/30/2014 ■ | 1,293 | ||||||
| Shell International Finance B.V. | ||||||||
| 6,400 | 4.38%, 03/25/2020 | 7,452 | ||||||
| 16,559 | ||||||||
The accompanying notes are an integral part of these financial statements.
| 8 |
| Shares or Principal Amount | Market Value ╪ | |||||||
| CORPORATE BONDS - 12.4% - (continued) | ||||||||
| Pipeline Transportation - 0.2% | ||||||||
| Kinder Morgan Energy Partners L.P. | ||||||||
| $ | 5,000 | 6.95%, 01/15/2038 | $ | 5,913 | ||||
| Real Estate, Rental and Leasing - 0.4% | ||||||||
| COX Communications, Inc. | ||||||||
| 7,000 | 5.45%, 12/15/2014 | 7,703 | ||||||
| ERAC USA Finance Co. | ||||||||
| 1,121 | 2.25%, 01/10/2014 ■ | 1,127 | ||||||
| 340 | 2.75%, 03/15/2017 ■ | 345 | ||||||
| 1,800 | 4.50%, 08/16/2021 ■ | 1,915 | ||||||
| 1,500 | 5.63%, 03/15/2042 ■ | 1,530 | ||||||
| 12,620 | ||||||||
| Retail Trade - 0.3% | ||||||||
| AutoZone, Inc. | ||||||||
| 1,908 | 3.70%, 04/15/2022 | 1,965 | ||||||
| Lowe's Co., Inc. | ||||||||
| 3,400 | 4.63%, 04/15/2020 | 3,841 | ||||||
| Staples, Inc. | ||||||||
| 2,525 | 9.75%, 01/15/2014 | 2,822 | ||||||
| 8,628 | ||||||||
| Soap, Cleaning Compound and Toilet Manufacturing - 0.4% | ||||||||
| Procter & Gamble Co. | ||||||||
| 9,690 | 9.36%, 01/01/2021 | 12,902 | ||||||
| Utilities - 0.8% | ||||||||
| Consolidated Edison Co. of NY | ||||||||
| 4,605 | 5.30%, 12/01/2016 | 5,365 | ||||||
| Enel Finance International S.A. | ||||||||
| 300 | 3.88%, 10/07/2014 ■ | 295 | ||||||
| Indianapolis Power and Light | ||||||||
| 8,000 | 6.60%, 06/01/2037 ■ | 10,592 | ||||||
| Niagara Mohawk Power Corp. | ||||||||
| 2,510 | 3.55%, 10/01/2014 ■ | 2,645 | ||||||
| Southern California Edison Co. | ||||||||
| 4,000 | 5.55%, 01/15/2037 | 5,031 | ||||||
| Wisconsin Electric Power Co. | ||||||||
| 1,960 | 4.25%, 12/15/2019 | 2,248 | ||||||
| 26,176 | ||||||||
| Total corporate bonds | ||||||||
| (cost $366,426) | $ | 407,922 | ||||||
| MUNICIPAL BONDS - 1.2% | ||||||||
| General Obligations - 0.4% | ||||||||
| California State GO, Taxable, | ||||||||
| $ | 1,235 | 7.55%, 04/01/2039 | $ | 1,588 | ||||
| Chicago, IL, Metropolitan Water Reclamation GO, | ||||||||
| 685 | 5.72%, 12/01/2038 | 865 | ||||||
| Los Angeles, CA, USD GO, | ||||||||
| 4,300 | 5.75%, 07/01/2034 | 5,041 | ||||||
| Oregon State GO, | ||||||||
| 6,000 | 4.76%, 06/30/2028 | 7,031 | ||||||
| 14,525 | ||||||||
| Health Care/Services - 0.1% | ||||||||
| University of California, Regents MedCenter Pooled Rev, | ||||||||
| 1,935 | 6.58%, 05/15/2049 | 2,536 | ||||||
| Higher Education (Univ., Dorms, etc.) - 0.1% | ||||||||
| University of California, Build America Bonds Rev, | ||||||||
| 1,960 | 5.77%, 05/15/2043 | 2,405 | ||||||
| Refunded - 0.1% | ||||||||
| Irvine Ranch, CA, Water Dist, | ||||||||
| 2,870 | 2.61%, 03/15/2014 | 2,970 | ||||||
| Tax Allocation - 0.1% | ||||||||
| Dallas, TX, Area Rapid Transit Taxable Sales Tax Rev, | ||||||||
| 2,200 | 6.00%, 12/01/2044 | 2,998 | ||||||
| Transportation - 0.4% | ||||||||
| Bay Area, CA, Toll Auth Bridge Rev, | ||||||||
| 3,100 | 6.26%, 04/01/2049 | 4,133 | ||||||
| Illinois State Toll Highway Auth, Taxable Rev, | ||||||||
| 1,875 | 6.18%, 01/01/2034 | 2,325 | ||||||
| Maryland State Transportation Auth, | ||||||||
| 1,350 | 5.89%, 07/01/2043 | 1,752 | ||||||
| New York and New Jersey PA, Taxable Rev, | ||||||||
| 975 | 5.86%, 12/01/2024 | 1,230 | ||||||
| 570 | 6.04%, 12/01/2029 | 731 | ||||||
| North Texas Tollway Auth Rev, | ||||||||
| 3,400 | 6.72%, 01/01/2049 | 4,545 | ||||||
| 14,716 | ||||||||
| Total municipal bonds | ||||||||
| (cost $32,793) | $ | 40,150 | ||||||
| U.S. GOVERNMENT AGENCIES - 1.3% | ||||||||
| Federal Home Loan Mortgage Corporation - 0.8% | ||||||||
| $ | 153 | 2.28%, 04/01/2029 Δ | $ | 159 | ||||
| 57 | 4.00%, 03/01/2041 | 60 | ||||||
| 7,907 | 5.00%, 07/01/2028 - 05/01/2041 | 8,532 | ||||||
| 17,074 | 5.50%, 12/01/2036 - 06/01/2041 | 18,579 | ||||||
| 27,330 | ||||||||
| Federal National Mortgage Association - 0.1% | ||||||||
| 864 | 4.78%, 02/01/2014 | 898 | ||||||
| 1,345 | 4.97%, 12/01/2013 | 1,403 | ||||||
| 242 | 5.00%, 02/01/2019 - 04/01/2019 | 262 | ||||||
| 126 | 5.50%, 09/01/2037 | 138 | ||||||
| 12 | 6.50%, 11/01/2013 | 12 | ||||||
| 1 | 7.00%, 02/01/2029 | 2 | ||||||
| 2,715 | ||||||||
| Government National Mortgage Association - 0.4% | ||||||||
| 3,748 | 6.00%, 06/15/2024 - 06/15/2035 | 4,253 | ||||||
| 1,202 | 6.50%, 03/15/2026 - 02/15/2035 | 1,403 | ||||||
| 5,157 | 7.00%, 11/15/2031 - 11/15/2033 | 6,143 | ||||||
| 245 | 7.50%, 09/16/2035 | 283 | ||||||
| 932 | 8.00%, 09/15/2026 - 02/15/2031 | 1,061 | ||||||
| 64 | 9.00%, 06/20/2016 - 06/15/2022 | 68 | ||||||
| 13,211 | ||||||||
| Total U.S. government agencies | ||||||||
| (cost $41,472) | $ | 43,256 | ||||||
The accompanying notes are an integral part of these financial statements.
| 9 |
Hartford Balanced HLS Fund (formerly Hartford Advisers HLS Fund)
Schedule of Investments – (continued)
June 30, 2012 (Unaudited)
(000’s Omitted)
| Shares or Principal Amount | Market Value ╪ | |||||||||||
| U.S. GOVERNMENT SECURITIES - 15.4% | ||||||||||||
| Other Direct Federal Obligations - 2.9% | ||||||||||||
| Federal Financing Corporation - 0.5% | ||||||||||||
| $ | 17,617 | 4.40%, 12/06/2013 - 12/27/2013 ○ | $ | 17,428 | ||||||||
| Tennessee Valley Authority - 2.4% | ||||||||||||
| 22,300 | 4.38%, 06/15/2015 | 24,751 | ||||||||||
| 50,000 | 6.00%, 03/15/2013 | 52,028 | ||||||||||
| 76,779 | ||||||||||||
| 94,207 | ||||||||||||
| U.S. Treasury Securities - 12.5% | ||||||||||||
| U.S. Treasury Bonds - 3.8% | ||||||||||||
| 4,000 | 3.00%, 05/15/2042 | 4,189 | ||||||||||
| 44,088 | 4.38%, 02/15/2038 - 11/15/2039 | 58,613 | ||||||||||
| 18,000 | 6.00%, 02/15/2026 | 26,387 | ||||||||||
| 25,650 | 6.25%, 08/15/2023 | 37,257 | ||||||||||
| 126,446 | ||||||||||||
| U.S. Treasury Notes - 8.7% | ||||||||||||
| 10,350 | 0.25%, 03/31/2014 - 04/30/2014 | 10,338 | ||||||||||
| 19,600 | 0.63%, 12/31/2012 - 05/31/2017 | 19,615 | ||||||||||
| 5,343 | 0.88%, 01/31/2017 | 5,389 | ||||||||||
| 4,800 | 1.00%, 09/30/2016 | 4,875 | ||||||||||
| 113,200 | 1.25%, 10/31/2015 | 116,021 | ||||||||||
| 3,600 | 1.38%, 01/15/2013 ‡ | 3,623 | ||||||||||
| 28,700 | 1.50%, 06/30/2016 | 29,731 | ||||||||||
| 5,000 | 1.75%, 05/15/2022 | 5,041 | ||||||||||
| 23,000 | 2.75%, 02/15/2019 | 25,525 | ||||||||||
| 18,935 | 3.50%, 05/15/2020 | 22,124 | ||||||||||
| 25,000 | 3.88%, 05/15/2018 | 29,268 | ||||||||||
| 13,000 | 4.25%, 08/15/2013 | 13,579 | ||||||||||
| 285,129 | ||||||||||||
| 411,575 | ||||||||||||
| Total U.S. government securities | ||||||||||||
| (cost $456,823) | $ | 505,782 | ||||||||||
| Total long-term investments | ||||||||||||
| (cost $2,832,084) | $ | 3,190,926 | ||||||||||
| SHORT-TERM INVESTMENTS - 2.6% | ||||||||||||
| Repurchase Agreements - 2.6% | ||||||||||||
| Bank of America Merrill Lynch TriParty Joint Repurchase Agreement (maturing on 07/02/2012 in the amount of $46,385, collateralized by FHLMC 5.50% - 6.50%, 2035 - 2036, FNMA 5.00% - 6.00%, 2033 - 2039, value of $47,312) | ||||||||||||
| $ | 46,384 | 0.13%, 06/29/2012 | $ | 46,384 | ||||||||
| Barclays Capital TriParty Joint Repurchase Agreement (maturing on 07/02/2012 in the amount of $16,769, collateralized by U.S. Treasury Note 1.25% - 3.63%, 2014 - 2020, value of $17,105) | ||||||||||||
| 16,769 | 0.15%, 06/29/2012 | 16,769 | ||||||||||
| Deutsche Bank Securities TriParty Joint Repurchase Agreement (maturing on 07/02/2012 in the amount of $4,493, collateralized by U.S. Treasury Note 0.88%, 2016, value of $4,583) | ||||||||||||
| 4,493 | 0.20%, 06/29/2012 | 4,493 | ||||||||||
| TD Securities TriParty Joint Repurchase Agreement (maturing on 07/02/2012 in the amount of $13,131, collateralized by FHLMC 4.00% - 6.00%, 2027 - 2041, FNMA 4.00% - 4.50%, 2025 - 2042, U.S. Treasury Bond 6.38%, 2027, U.S. Treasury Note 0.38% - 8.75%, 2012 - 2017, value of $13,393) | ||||||||||||
| 13,130 | 0.15%, 06/29/2012 | 13,130 | ||||||||||
| UBS Securities, Inc. Joint Repurchase Agreement (maturing on 07/02/2012 in the amount of $5, collateralized by U.S. Treasury Note 1.00%, 2013, value of $5) | ||||||||||||
| 5 | 0.13%, 06/29/2012 | 5 | ||||||||||
| UBS Securities, Inc. TriParty Joint Repurchase Agreement (maturing on 07/02/2012 in the amount of $5,917, collateralized by GNMA 4.00%, 2042, value of $6,035) | ||||||||||||
| 5,917 | 0.20%, 06/29/2012 | 5,917 | ||||||||||
| 86,698 | ||||||||||||
| Total short-term investments | ||||||||||||
| (cost $86,698) | $ | 86,698 | ||||||||||
| Total investments | ||||||||||||
| (cost $2,918,782) ▲ | 99.8 | % | $ | 3,277,624 | ||||||||
| Other assets and liabilities | 0.2 | % | 5,185 | |||||||||
| Total net assets | 100.0 | % | $ | 3,282,809 | ||||||||
The accompanying notes are an integral part of these financial statements.
| 10 |
| Note: | Percentage of investments as shown is the ratio of the total market value to total net assets. |
| Prices of foreign equities that are principally traded on certain foreign markets may be adjusted daily pursuant to a fair value pricing service approved by the Board of Directors in order to reflect an adjustment for factors occurring after the close of certain foreign markets but before the close of the New York Stock Exchange. |
| ▲ | At June 30, 2012, the cost of securities for federal income tax purposes was $2,949,885 and the aggregate gross unrealized appreciation and depreciation based on that cost were: |
| Unrealized Appreciation | $ | 456,549 | ||
| Unrealized Depreciation | (128,810 | ) | ||
| Net Unrealized Appreciation | $ | 327,739 |
| † | These securities were valued in good faith at fair value as determined under policies and procedures established by and under the supervision of the Company's Board of Directors. At June 30, 2012, the aggregate value of these securities was $37,698, which represents 1.1% of total net assets. This amount excludes securities that are principally traded in certain foreign markets and whose prices are adjusted pursuant to a third party pricing service methodology approved by the Board of Directors. |
| ● | Non-income producing. |
| Δ | Variable rate securities; the rate reported is the coupon rate in effect at June 30, 2012. |
| ○ | The interest rate disclosed for these securities represents the effective yield on the date of the acquisition. |
| ■ | Securities issued within terms of a private placement memorandum, exempt from registration under Rule 144A under the Securities Act of 1933, as amended, and may be sold only to qualified institutional buyers. Unless otherwise indicated, these issues are determined to be liquid. At June 30, 2012, the aggregate value of these securities was $76,164, which represents 2.3% of total net assets. |
| ⌂ | The following securities are considered illiquid. Illiquid securities are often purchased in private placement transactions, are often not registered under the Securities Act of 1933 and may have contractual restrictions on resale. A security may also be considered illiquid if the security lacks a readily available market or if its valuation has not changed for a certain period of time. |
| Period Acquired | Shares/ Par | Security | Cost Basis | ||||||||
| 08/2011 | 11,702 | Allstar Co. | 11,913 | ||||||||
| 06/2007 | 11,241 | Buck Holdings L.P. | 4,115 | ||||||||
| At June 30, 2012, the aggregate value of these securities was $37,698, which represents 1.1% of total net assets. |
| ☼ | This security, or a portion of this security, was purchased on a when-issued, delayed delivery or delayed draw basis. The cost of these securities was $1,739 at June 30, 2012. |
| ‡ | This security, or a portion of this security, has been segregated to cover funding requirements on investment transactions settling in the future. |
Shorts Outstanding at June 30, 2012
| Description | Principal Amount | Maturity Date | Market Value ╪ | Unrealized Appreciation/ Depreciation | ||||||||||||
| FHLMC, 5.50% | $ | 1,300 | 07/15/2038 | $ | 1,412 | $ | (1 | ) | ||||||||
╪ See Significant Accounting Policies of accompanying Notes to Financial Statements regarding valuation of securities.
GLOSSARY: (abbreviations used in preceding Schedule of Investments)
| Municipal Bond Abbreviations: | ||
| GO | General Obligation | |
| PA | Port Authority | |
| USD | United School District | |
| Other Abbreviations: | ||
| ADR | American Depositary Receipt | |
| FHLMC | Federal Home Loan Mortgage Corp. | |
| FNMA | Federal National Mortgage Association | |
| GNMA | Government National Mortgage Association | |
The accompanying notes are an integral part of these financial statements.
| 11 |
Hartford Balanced HLS Fund (formerly Hartford Advisers HLS Fund)
Investment Valuation Hierarchy Level Summary
June 30, 2012 (Unaudited)
(000’s Omitted)
| Total | Level 1 ♦ | Level 2 ♦ | Level 3 | |||||||||||||
| Assets: | ||||||||||||||||
| Asset & Commercial Mortgage Backed Securities | $ | 1,477 | $ | – | $ | 1,470 | $ | 7 | ||||||||
| Common Stocks ‡ | 2,192,339 | 2,086,175 | 68,466 | 37,698 | ||||||||||||
| Corporate Bonds | 407,922 | – | 381,557 | 26,365 | ||||||||||||
| Municipal Bonds | 40,150 | – | 40,150 | – | ||||||||||||
| U.S. Government Agencies | 43,256 | – | 43,256 | – | ||||||||||||
| U.S. Government Securities | 505,782 | 13,211 | 492,571 | – | ||||||||||||
| Short-Term Investments | 86,698 | – | 86,698 | – | ||||||||||||
| Total | $ | 3,277,624 | $ | 2,099,386 | $ | 1,114,168 | $ | 64,070 | ||||||||
| Liabilities: | ||||||||||||||||
| Securities Sold Short | $ | 1,412 | $ | – | $ | 1,412 | $ | – | ||||||||
| Total | $ | 1,412 | $ | – | $ | 1,412 | $ | – | ||||||||
| ♦ | For the six-month period ended June 30, 2012, there were no transfers between Level 1 and Level 2. |
| ‡ | The Fund has all or primarily all of the equity securities categorized in a particular level. Refer to the Schedule of Investments for further industry breakout. |
Following is a reconciliation of Level 3 assets for which significant unobservable inputs were used to determine fair value:
| Balance as of December 31, 2011 | Realized Gain (Loss) | Change in Unrealized Appreciation (Depreciation) | Net Amortization | Purchases | Sales | Transfers Into Level 3 * | Transfers Out of Level 3 * | Balance as of June 30, 2012 | ||||||||||||||||||||||||||||
| Assets: | ||||||||||||||||||||||||||||||||||||
| Asset & Commercial Mortgage Backed Securities | $ | 7 | $ | — | $ | — | † | $ | — | $ | — | $ | — | $ | — | $ | — | $ | 7 | |||||||||||||||||
| Common Stocks | 37,276 | 8,997 | 2,942 | ‡ | — | — | (11,517 | ) | — | — | 37,698 | |||||||||||||||||||||||||
| Corporate Bonds | 7,254 | (48 | ) | 425 | § | (51 | ) | — | (559 | ) | 19,344 | — | 26,365 | |||||||||||||||||||||||
| Total | $ | 44,537 | $ | 8,949 | $ | 3,367 | $ | (51 | ) | $ | — | $ | (12,076 | ) | $ | 19,344 | $ | — | $ | 64,070 | ||||||||||||||||
| * | Investments are transferred into and out of Level 3 for a variety of reasons including, but not limited to: 1) Investments where trading has been halted (transfer into Level 3) or investments where trading has resumed (transfer out of Level 3). 2) Broker quoted investments (transfer into Level 3) or quoted prices in active markets (transfer out of Level 3). 3) Investments that have certain restrictions on trading (transfer into Level 3) or investments where trading restrictions have expired (transfer out of Level 3). |
| † | Change in unrealized appreciation (depreciation) in the current period relating to assets still held at June 30, 2012 rounds to zero. |
| ‡ | Change in unrealized appreciation (depreciation) in the current period relating to assets still held at June 30, 2012 was $2,942. |
| § | Change in unrealized appreciation (depreciation) in the current period relating to assets still held at June 30, 2012 was $425. |
The accompanying notes are an integral part of these financial statements.
| 12 |
Hartford Balanced HLS Fund (formerly Hartford Advisers HLS Fund)
Statement of Assets and Liabilities
June 30, 2012 (Unaudited)
(000’s Omitted)
| Assets: | ||||
| Investments in securities, at market value (cost $2,918,782) | $ | 3,277,624 | ||
| Cash | 523 | |||
| Receivables: | ||||
| Investment securities sold | 1,414 | |||
| Fund shares sold | 61 | |||
| Dividends and interest | 12,923 | |||
| Other assets | 6 | |||
| Total assets | 3,292,551 | |||
| Liabilities: | ||||
| Securities sold short, at market value (proceeds $1,411) | 1,412 | |||
| Payables: | ||||
| Investment securities purchased | 6,071 | |||
| Fund shares redeemed | 1,800 | |||
| Investment management fees | 272 | |||
| Distribution fees | 15 | |||
| Accrued expenses | 172 | |||
| Total liabilities | 9,742 | |||
| Net assets | $ | 3,282,809 | ||
| Summary of Net Assets: | ||||
| Capital stock and paid-in-capital | $ | 3,885,308 | ||
| Undistributed net investment income | 61,597 | |||
| Accumulated net realized loss | (1,022,945 | ) | ||
| Unrealized appreciation of investments and the translations of assets and liabilities denominated in foreign currency | 358,849 | |||
| Net assets | $ | 3,282,809 | ||
| Shares authorized | 9,500,000 | |||
| Par value | $ | 0.001 | ||
| Class IA: Net asset value per share | $ | 20.51 | ||
| Shares outstanding | 139,162 | |||
| Net assets | $ | 2,854,079 | ||
| Class IB: Net asset value per share | $ | 20.74 | ||
| Shares outstanding | 20,673 | |||
| Net assets | $ | 428,730 |
The accompanying notes are an integral part of these financial statements.
| 13 |
Hartford Balanced HLS Fund (formerly Hartford Advisers HLS Fund)
Statement of Operations
For the Six-Month Period Ended June 30, 2012 (Unaudited)
(000’s Omitted)
| Investment Income: | ||||
| Dividends | $ | 26,704 | ||
| Interest | 19,058 | |||
| Less: Foreign tax withheld | (693 | ) | ||
| Total investment income, net | 45,069 | |||
| Expenses: | ||||
| Investment management fees | 10,482 | |||
| Distribution fees - Class IB | 564 | |||
| Custodian fees | 6 | |||
| Accounting services fees | 274 | |||
| Board of Directors' fees | 42 | |||
| Audit fees | 15 | |||
| Other expenses | 226 | |||
| Total expenses (before fees paid indirectly) | 11,609 | |||
| Commission recapture | (32 | ) | ||
| Total fees paid indirectly | (32 | ) | ||
| Total expenses, net | 11,577 | |||
| Net investment income | 33,492 | |||
| Net Realized Gain on Investments, Other Financial Instruments and Foreign Currency Transactions: | ||||
| Net realized gain on investments | 87,060 | |||
| Net realized loss on futures | (158 | ) | ||
| Net realized gain on foreign currency contracts | 2,082 | |||
| Net realized gain on other foreign currency transactions | 96 | |||
| Net Realized Gain on Investments, Other Financial Instruments and Foreign Currency Transactions | 89,080 | |||
| Net Changes in Unrealized Appreciation of Investments and Foreign Currency Transactions: | ||||
| Net unrealized appreciation of investments | 82,689 | |||
| Net unrealized depreciation of securities sold short | (1 | ) | ||
| Net unrealized depreciation of foreign currency contracts | (147 | ) | ||
| Net unrealized depreciation on translation of other assets and liabilities in foreign currencies | (8 | ) | ||
| Net Changes in Unrealized Appreciation of Investments and Foreign Currency Transactions | 82,533 | |||
| Net Gain on Investments, Other Financial Instruments and Foreign Currency Transactions | 171,613 | |||
| Net Increase in Net Assets Resulting from Operations | $ | 205,105 |
The accompanying notes are an integral part of these financial statements.
| 14 |
Hartford Balanced HLS Fund (formerly Hartford Advisers HLS Fund)
Statement of Changes in Net Assets
(000’s Omitted)
| For the Six-Month Period Ended June 30, 2012 (Unaudited) | For the Year Ended December 31, 2011 | |||||||
| Operations: | ||||||||
| Net investment income | $ | 33,492 | $ | 68,092 | ||||
| Net realized gain on investments, other financial instruments and foreign currency transactions | 89,080 | 179,870 | ||||||
| Net unrealized appreciation (depreciation) of investments and foreign currency transactions | 82,533 | (177,718 | ) | |||||
| Net Increase In Net Assets Resulting From Operations | 205,105 | 70,244 | ||||||
| Distributions to Shareholders: | ||||||||
| From net investment income | ||||||||
| Class IA | — | (51,277 | ) | |||||
| Class IB | — | (6,578 | ) | |||||
| Total distributions | — | (57,855 | ) | |||||
| Capital Share Transactions: | ||||||||
| Class IA | ||||||||
| Sold | 22,432 | 50,601 | ||||||
| Issued on reinvestment of distributions | — | 51,277 | ||||||
| Redeemed | (305,770 | ) | (693,355 | ) | ||||
| Total capital share transactions | (283,338 | ) | (591,477 | ) | ||||
| Class IB | ||||||||
| Sold | 9,870 | 23,096 | ||||||
| Issued on reinvestment of distributions | — | 6,578 | ||||||
| Redeemed | (63,786 | ) | (131,780 | ) | ||||
| Total capital share transactions | (53,916 | ) | (102,106 | ) | ||||
| Net decrease from capital share transactions | (337,254 | ) | (693,583 | ) | ||||
| Net Decrease In Net Assets | (132,149 | ) | (681,194 | ) | ||||
| Net Assets: | ||||||||
| Beginning of period | 3,414,958 | 4,096,152 | ||||||
| End of period | $ | 3,282,809 | $ | 3,414,958 | ||||
| Undistributed (distribution in excess of) | ||||||||
| net investment income | $ | 61,597 | $ | 28,105 | ||||
| Shares: | ||||||||
| Class IA | ||||||||
| Sold | 1,096 | 2,583 | ||||||
| Issued on reinvestment of distributions | — | 2,706 | ||||||
| Redeemed | (14,938 | ) | (35,495 | ) | ||||
| Total share activity | (13,842 | ) | (30,206 | ) | ||||
| Class IB | ||||||||
| Sold | 475 | 1,160 | ||||||
| Issued on reinvestment of distributions | — | 344 | ||||||
| Redeemed | (3,088 | ) | (6,663 | ) | ||||
| Total share activity | (2,613 | ) | (5,159 | ) | ||||
The accompanying notes are an integral part of these financial statements.
| 15 |
Hartford Balanced HLS Fund (formerly Hartford Advisers HLS Fund)
Notes to Financial Statements
June 30, 2012 (Unaudited)
(000’s Omitted)
| 1. | Organization: |
Hartford Balanced HLS Fund (the “Fund”) serves as an underlying investment option for certain variable annuity and variable life insurance separate accounts of Hartford Life Insurance Company (“HLIC”) and its affiliates and certain qualified retirement plans. The Fund may also serve as an underlying investment option for certain variable annuity and variable life separate accounts of other insurance companies. Owners of variable annuity contracts and policyholders of variable life insurance contracts may choose the funds permitted in the variable insurance contract prospectus. In addition, participants in certain qualified retirement plans may choose the Fund if permitted by their plans.
Hartford Series Fund, Inc. (the “Company”) is an open-end registered management investment company comprised of thirty portfolios. Financial Statements for the Fund, a series of the Company, are included in this report.
The Company is organized under the laws of the State of Maryland and is registered with the Securities and Exchange Commission (“SEC”) under the Investment Company Act of 1940, as amended (“1940 Act”). The Fund is a diversified open-end management investment company.
The Fund is divided into Class IA and Class IB shares. Each class is offered at the per share net asset value (“NAV”) without a sales charge and is subject to the same expenses, except that the Class IB shares are subject to distribution and service fees charged pursuant to a Distribution Plan adopted in accordance with Rule 12b-1 under the 1940 Act.
| 2. | Significant Accounting Policies: |
The following is a summary of significant accounting policies of the Fund in the preparation of its financial statements, which are in accordance with the United States Generally Accepted Accounting Principles (“U.S. GAAP”). The preparation of financial statements in accordance with U.S. GAAP may require management to make estimates and assumptions that affect the reported amounts of assets and liabilities and disclosure of contingent assets and liabilities at the date of the financial statements and the reported amounts of increases and decreases in net assets from operations during the reporting period. Actual results could differ from those estimates.
| a) | Determination of Net Asset Value – The NAV of each class of the Fund’s shares is determined as of the close of regular trading (normally 4:00 p.m. Eastern Time) (the “NYSE Close”) on each day that the New York Stock Exchange (the “Exchange”) is open (“Valuation Date”). Information that becomes known to the Fund after the NAV has been calculated on a particular day will not generally be used to retroactively adjust the NAV determined earlier that day. |
| b) | Investment Valuation and Fair Value Measurements – For purposes of calculating the NAV, portfolio investments and other assets held by the Fund's portfolio for which market quotes are readily available are valued at market value. Market value is generally determined on the basis of last reported sales prices or official close price. If no sales are reported, market value is based on quotes obtained from a quotation reporting system, established market makers, or independent pricing services. If market prices are not readily available or are deemed unreliable, the Fund will use the fair value of the investment as determined in good faith under policies and procedures established by and under the supervision of the Company’s Board of Directors. Market quotes are considered not readily available where there is an absence of current or reliable market-based data (e.g., trade information or broker quotes), including where events occur after the close of the relevant market, but prior to the NYSE Close that materially affect the values of the Fund’s portfolio investments or assets. In addition, market quotes are considered not readily available when, due to extraordinary circumstances, the exchanges or markets on which the investments trade do not open for trading for the entire day and no other market prices are available. In addition, prices of foreign equities that are principally traded on certain foreign markets are adjusted daily pursuant to a fair value pricing service approved by the Board of Directors in order to reflect an adjustment for the factors occurring after the close of certain foreign markets but before the NYSE Close. Investments that are primarily traded on foreign markets may trade on days that are not business days of the Fund. The value of the |
| 16 |
foreign investments in which the Fund invests may change on days when a shareholder will not be able to purchase or redeem shares of the Fund. Fair value pricing is subjective in nature and the use of fair value pricing by the Fund may cause the NAV of its shares to differ significantly from the NAV that would have been calculated using market prices at the close of the exchange on which a portfolio investment is primarily traded. There can be no assurance that the Fund could obtain the fair market value assigned to an investment if the Fund were to sell the investment at approximately the time at which the Fund determines its NAV.
Fixed income investments (other than short term obligations) and non-exchange traded derivatives held by the Fund are normally valued on the basis of quotes obtained from brokers and dealers or independent pricing services in accordance with procedures established by the Company’s Board of Directors. Prices obtained from independent pricing services use information provided by market makers or estimates of market values obtained from yield data relating to investments with similar characteristics. Generally, the Fund may use fair valuation in regard to fixed income investments when the Fund holds defaulted or distressed investments or investments in a company in which a reorganization is pending. Short-term investments maturing in 60 days or less are generally valued at amortized cost, if their original term to maturity was 60 days or less, or by amortizing their value on the 61st day prior to maturity, if the original term to maturity exceeded 60 days.
Exchange traded options, futures and options on futures are valued at the settlement price determined by the relevant exchange as of the NYSE Close. If such instruments do not trade on an exchange, values may be supplied by an independent pricing service using a formula or other objective method that may take into consideration the style, direction, expiration, strike price, notional value and volatility or other adjustments.
Investments valued in currencies other than U.S. dollars are converted to U.S. dollars using exchange rates obtained from independent pricing services for calculation of the NAV. As a result, the NAV of the Fund’s shares may be affected by changes in the value of currencies in relation to the U.S. dollar. The value of investments traded in markets outside the United States or denominated in currencies other than the U.S. dollar may be affected significantly on a day that the NYSE is closed and the market value may change on days when an investor is not able to purchase, redeem or exchange shares of the Fund.
Foreign currency contracts represent agreements to exchange currencies on specific future dates at predetermined rates. Foreign currency contracts are valued using foreign currency exchange rates and forward rates as provided by an independent pricing service on the Valuation Date.
Financial instruments for which prices are not available from an independent pricing service may be valued using market quotations obtained from one or more dealers that make markets in the respective financial instrument in accordance with procedures established by the Company’s Board of Directors.
U.S. GAAP defines fair value as the price that the Fund would receive to sell an asset or pay to transfer a liability in an orderly transaction between market participants. The U.S. GAAP fair value measurement standards require disclosure of a fair value hierarchy for each major category of assets and liabilities. Various inputs are used in determining the fair value of the Fund’s investments. These inputs are summarized into three broad hierarchy levels. This hierarchy is based on whether the valuation inputs are observable or unobservable. These levels are:
| · | Level 1 – Quoted prices in active markets for identical investments. Level 1 may include exchange traded instruments, such as domestic equities, some foreign equities, options, futures, mutual funds, exchange traded funds, rights and warrants. |
| · | Level 2 – Observable inputs other than Level 1 prices, such as quoted prices for similar investments; quoted prices in markets that are not active; or other inputs that are observable or can be corroborated by observable market data. Level 2 may include debt investments that are traded less frequently than exchange traded instruments and which are valued using independent pricing services; foreign equities, which are principally |
| 17 |
| Hartford Balanced HLS Fund (formerly Hartford Advisers HLS Fund) |
| Notes to Financial Statements – (continued) |
| June 30, 2012 (Unaudited) |
| (000’s Omitted) |
traded on certain foreign markets and are adjusted daily pursuant to a fair value pricing service in order to reflect an adjustment for the factors occurring after the close of certain foreign markets but before the NYSE Close; and short-term investments, which are valued at amortized cost.
| · | Level 3 – Significant unobservable inputs that are supported by limited or no market activity. Level 3 may include financial instruments whose values are determined using indicative market quotes or require significant management judgment or estimation. These unobservable valuation inputs may include estimates for current yields, maturity/duration, prepayment speed, and indicative market quotes for comparable investments along with other assumptions relating to credit quality, collateral value, complexity of the investment structure, general market conditions and liquidity. This category may include investments where trading has been halted or there are certain restrictions on trading. While these investments are priced using unobservable inputs, the valuation of these investments reflects the best available data and management believes the prices are a reasonable representation of exit price. |
The Board of Directors of the Company generally reviews and approves the “Procedures for Valuation of Portfolio Securities” on an annual basis. These procedures define how investments are to be valued, including the formation of a Valuation Committee. The Valuation Committee is responsible for determining in good faith the fair value of investments when the value cannot be obtained from primary pricing services or alternative sources or if the valuation of an investment as provided by the primary pricing service or alternative source is believed not to reflect the investment’s fair value as of the Valuation Date. Members of the Valuation Committee include the Fund’s Treasurer or designee, a Vice President of the Funds with legal expertise or designee, and a Vice President of the investment manager or designee. In addition, the Fund’s chief compliance officer shall designate a member of the compliance group to attend Valuation Committee meetings as a non-voting resource, to monitor for and provide guidance with respect to compliance with these procedures. Two members of the Valuation Committee or their designees, representing different departments, shall constitute a quorum for purposes of permitting the Valuation Committee to take action. The Valuation Committee will consider all relevant factors in determining an investment’s fair value, and may seek the advice of the Fund’s sub-adviser, knowledgeable brokers and legal counsel in making such determination. The Valuation Committee reports to the Audit Committee of the Company’s Board of Directors. The Audit Committee receives quarterly written reports which include details of all fair-valued investments, including the reason for the fair valuation, and an indication, when possible, of the accuracy of the valuation by disclosing the next available reliable public price quotation or the disposition price of such investments (the “look-back” test). The Board of Directors then must consider for ratification all of the fair value determinations made during the previous quarter.
Valuation levels are not necessarily indicative of the risk associated with investing in such investments. Individual investments within any of the above mentioned asset classes may be assigned a different hierarchical level than those presented above, as individual circumstances dictate.
For additional information, refer to the Investment Valuation Hierarchy Level Summary and the Level 3 roll-forward reconciliation which follow the Schedule of Investments.
For purposes of reporting transfers between different hierarchy levels, both transfers in and out of each level, as applicable, are shown as if they occurred at the beginning of the period.
| c) | Investment Transactions and Investment Income – Investment transactions are recorded as of the trade date (the date the order to buy or sell is executed) for financial reporting purposes. Investments purchased or sold on a when-issued or delayed-delivery basis may be settled a month or more after the trade date. Realized gains and losses are determined on the basis of identified cost. |
Dividend income is recorded on the ex-dividend date, except certain dividends from foreign investments where the ex-dividend date may have passed are recorded as soon as the Fund is informed of the dividend. Interest income, including
| 18 |
amortization of premium and accretion of discounts, is accrued on a daily basis. Paydown gains and losses on mortgage-related and other asset-backed securities are included in interest income in the Statement of Operations.
| d) | Foreign Currency Transactions – Assets and liabilities denominated in currencies other than U.S. dollars are translated into U.S. dollars at the exchange rates in effect on the valuation date. Purchases and sales of investments, income, and expenses are translated into U.S. dollars at the exchange rates on the dates of such transactions. |
The Fund does not isolate that portion of portfolio investment valuation resulting from fluctuations in the foreign currency exchange rates from the fluctuations arising from changes in the market prices of investments held. Exchange rate fluctuations are included with the net realized and unrealized gain or loss on investments in the accompanying financial statements.
Net realized foreign exchange gains or losses arise from sales of foreign currencies and the difference between asset and liability amounts initially stated in foreign currencies and the U.S. dollar value of the amounts actually received or paid. Net unrealized foreign exchange gains or losses arise from changes in the value of other assets and liabilities at the end of the reporting period, resulting from changes in the exchange rates.
| e) | Joint Trading Account – The Fund may invest cash balances into a joint trading account that may be invested in one or more repurchase agreements. |
| f) | Fund Share Valuation and Dividend Distributions to Shareholders – Orders for the Fund’s shares are executed in accordance with the investment instructions of the contract holders and plan participants. The NAV of the Fund’s shares is determined as of the close of business on each business day of the Exchange. The NAV is determined separately for each class of shares of the Fund by dividing the Fund’s net assets attributable to that class by the number of shares of the class outstanding. Each class of shares offered by the Fund has equal rights as to assets and voting privileges (except that shareholders of a class have exclusive voting rights regarding any matter relating solely to that class of shares). Income and non-class specific expenses are allocated daily to each class on the basis of the relative net assets of the class. Realized and unrealized capital gains and losses are allocated daily based on the relative net assets of each class of shares of the Fund. |
Orders for the purchase of the Fund’s shares received prior to the close of the Exchange on any day the Exchange is open for business are priced at the NAV determined as of the close of the Exchange. Orders received after the close of the Exchange, or on a day on which the Exchange and/or the Fund is not open for business, are priced at the next determined NAV.
Dividends are declared pursuant to a policy adopted by the Company’s Board of Directors based upon the investment performance of the Fund. The policy of the Fund is to pay dividends from net investment income and realized capital gains, if any, at least once a year.
Distributions from net investment income, net realized capital gains and capital are determined in accordance with federal income tax regulations, which may differ from U.S. GAAP with respect to character and timing. These differences may include but are not limited to losses deferred due to wash sale adjustments, foreign currency gains and losses, adjustments related to Passive Foreign Investment Companies (“PFICs”), Real Estate Investment Trusts (“REITs”), Regulated Investment Companies (“RICs”), certain derivatives and partnerships. Permanent book and federal income tax basis differences relating to shareholder distributions will result in reclassifications to certain of the Fund’s capital accounts (see Federal Income Taxes: Reclassification of Capital Accounts note).
| 19 |
| Hartford Balanced HLS Fund (formerly Hartford Advisers HLS Fund) |
| Notes to Financial Statements – (continued) |
| June 30, 2012 (Unaudited) |
| (000’s Omitted) |
| 3. | Securities and Other Investments: |
| a) | Repurchase Agreements – A repurchase agreement is an agreement by which a counterparty agrees to sell an investment and agrees to repurchase the investment sold at a mutually agreed upon time and price. At the time the Fund enters into a repurchase agreement, the value of the underlying collateral, including accrued interest, will be equal to or exceed the value of the repurchase agreement. Repurchase agreements expose the Fund to counterparty risk. To minimize counterparty risk, the investments that serve to collateralize the repurchase agreement are held by the Fund’s custodian in book entry or physical form in the custodial account of the Fund or in a third party custodial account. Repurchase agreements are valued at cost plus accrued interest. The Fund, as shown on the Schedule of Investments, had outstanding repurchase agreements as of June 30, 2012. |
| b) | Illiquid and Restricted Investments – The Fund is permitted to invest up to 15% of its net assets in illiquid investments. Illiquid investments are those that may not be sold or disposed of in the ordinary course of business within seven days, at approximately the price used to determine the Fund’s NAV. The Fund may not be able to sell illiquid investments when its sub-adviser considers it desirable to do so or may have to sell such investments at a price that is lower than the price that could be obtained if the investments were more liquid. A sale of illiquid investments may require more time and may result in higher dealer discounts and other selling expenses than does the sale of those that are liquid. Illiquid investments also may be more difficult to value due to the unavailability of reliable market quotations for such investments, and an investment in them may have an adverse impact on the Fund’s NAV. The Fund may also purchase certain restricted investments that can only be resold to certain qualified investors and may be determined to be liquid pursuant to policies and guidelines established by the Company’s Board of Directors. The Fund, as shown on the Schedule of Investments, had illiquid and/or restricted investments as of June 30, 2012. |
| c) | Investments Purchased on a When-Issued or Delayed-Delivery Basis – Delivery and payment for investments that have been purchased by the Fund on a forward commitment, or when-issued or delayed-delivery basis, take place beyond the customary settlement period. A fund may dispose of or renegotiate a delayed-delivery transaction after it is entered into, and may sell delayed-delivery investments before they are delivered, which may result in a realized gain or loss. During this period, such investments are subject to market fluctuations, and the Fund identifies investments segregated in its records with a value at least equal to the amount of the commitment. The Fund, as shown on the Schedule of Investments, had when-issued or delayed delivery investments as of June 30, 2012. |
In connection with the Fund’s ability to purchase investments on a when-issued or forward commitment basis, the Fund may enter into to-be announced (“TBA”) commitments. TBA commitments are forward agreements for the purchase or sale of mortgage-backed securities for a fixed price, with payment and delivery on an agreed-upon future settlement date. The specific securities to be delivered are not identified at the trade date; however, delivered securities must meet specified terms, including issuer, rate and mortgage terms. The Fund generally enters into TBA commitments with intent to take possession of or deliver the underlying mortgage-backed securities but can extend the settlement or roll the transaction. In a TBA roll, the Fund generally purchases or sells the initial TBA commitment prior to the stipulated settlement date and enters into a new TBA commitment for future delivery or receipt of the mortgage-backed securities. TBA commitments involve a risk of loss if the value of the security to be purchased or sold declines or increases, respectively, prior to settlement date.
The Fund may enter into “dollar rolls” in which the Fund sells securities and contracts with the same counterparty to repurchase substantially similar securities (for example, same issuer, coupon and maturity) on a specified future date at an agreed upon price. The Fund gives up the right to receive interest paid on the investments sold. The Fund would benefit to the extent of any differences between the price received for the security and the lower forward price for the future purchase. Dollar rolls involve the risk that the market value of the securities that the Fund is required to purchase may decline below the agreed upon repurchase price of those securities. The Fund accounts for dollar roll transactions as purchases and sales and realizes gains and losses on these transactions. These transactions are excluded from the Fund’s portfolio turnover rate. The Fund had open dollar roll transactions as of June 30, 2012, as disclosed on the Schedule of Investments, the Statement of Assets and Liabilities and the Statement of Operations.
| 20 |
| d) | Mortgage Related and Other Asset Backed Securities – The Fund may invest in mortgage related and other asset backed securities. These securities include mortgage pass-through securities, collateralized mortgage obligations, commercial mortgage backed securities, stripped mortgage backed securities, asset backed securities, collateralized debt obligations and other securities that directly or indirectly represent a participation in, or are secured by and payable from, mortgage loans on real property. Mortgage related securities are created from pools of residential or commercial mortgage loans, including mortgage loans made by savings and loan institutions, mortgage bankers, commercial banks and others. Asset backed securities are created from many types of assets, including auto loans, credit card receivables, home equity loans, and student loans. These securities provide a monthly payment which consists of both interest and principal payments. Interest payments may be determined by fixed or adjustable rates. The rate of pre-payments on underlying mortgages will affect the price and volatility of a mortgage related security, and may have the effect of shortening or extending the effective duration of the security relative to what was anticipated at the time of purchase. The timely payment of principal and interest of certain mortgage related securities is guaranteed by the full faith and credit of the United States Government. Pools created and guaranteed by non-governmental issuers, including government-sponsored corporations, may be supported by various forms of insurance or guarantees, but there can be no assurance that the private insurers or guarantors can meet their obligations under the insurance policies or guarantee arrangements. The Fund, as shown on the Schedule of Investments, had mortgage related and other asset backed securities as of June 30, 2012. |
| 4. | Financial Derivative Instruments: |
The following disclosures contain information on how and why the Fund uses derivative instruments, the credit-risk-related contingent features in certain derivative instruments, and how derivative instruments affect the Fund’s financial position and results of operations. The location and fair value amounts of these instruments on the Statement of Assets and Liabilities and the realized gains and losses and changes in unrealized gains and losses on the Statement of Operations, each categorized by type of derivative contract, are included in the following Additional Derivative Instrument Information footnote. The derivative instruments outstanding as of period-end are disclosed in the notes to the Schedule of Investments and the amounts of realized gains and losses and changes in unrealized gains and losses on derivative instruments during the period are disclosed in the Statement of Operations.
| a) | Foreign Currency Contracts – The Fund may enter into foreign currency contracts that obligate the Fund to purchase or sell currencies at specified future dates. Foreign currency contracts are used to hedge the currency exposure associated with some or all of the Fund’s investments and/or as part of an investment strategy. Foreign currency contracts are marked to market daily and the change in value is recorded by the Fund as an unrealized gain or loss. The Fund will record a realized gain or loss when the foreign currency contract is settled. |
Foreign currency contracts involve elements of market risk in excess of the amounts reflected in the Statement of Assets and Liabilities. In addition, risks may arise upon entering into these contracts from the potential inability of the counterparties to meet the terms of the contracts and from unanticipated movements in the value of the foreign currencies relative to the U.S. dollar. The Fund had no outstanding foreign currency contracts as of June 30, 2012.
| b) | Futures Contracts – The Fund may enter into futures contracts. A futures contract is an agreement between two parties to buy or sell an asset at a set price on a future date. The Fund uses futures contracts to manage or obtain exposure to the investment markets, commodities, or movements in interest rates and currency values. The primary risks associated with the use of futures contracts are the imperfect correlation between the change in market value of the investments held by the Fund and the prices of futures contracts and the possibility of an illiquid market. Upon entering into a futures contract, the Fund is required to deposit with a futures commission merchant (“FCM”) an amount of cash or U.S. Government or Agency Obligations in accordance with the initial margin requirements of the broker or exchange. Futures contracts are marked to market daily at the most recent settlement price reported by an exchange on which, over time, they are traded most extensively, and an appropriate payable or receivable for the change in value (“variation margin”) is recorded by the Fund. Gains or losses are recognized but not considered realized until the contracts expire or are closed. Futures contracts involve, to varying degrees, risk of loss in excess of the variation margin disclosed on the |
| 21 |
| Hartford Balanced HLS Fund (formerly Hartford Advisers HLS Fund) |
| Notes to Financial Statements – (continued) |
| June 30, 2012 (Unaudited) |
| (000’s Omitted) |
Statement of Assets and Liabilities; however, this risk is reduced through the use of an FCM. As of June 30, 2012, the Fund had no outstanding futures contracts.
| c) | Additional Derivative Instrument Information: |
The volume of derivative activity was minimal during the six-month period ended June 30, 2012.
The effect of Derivative Instruments on the Statement of Operations for the six-month period ended June 30, 2012:
| Risk Exposure Category | ||||||||||||||||||||||||||||
Interest Rate Contracts | Foreign Exchange Contracts |
Credit Contracts |
Equity Contracts |
Commodity Contracts |
Other Contracts |
Total | ||||||||||||||||||||||
| Realized Gain (Loss) on Derivatives Recognized as a Result of Operations: | ||||||||||||||||||||||||||||
| Net realized loss on futures | $ | (158 | ) | $ | — | $ | — | $ | — | $ | — | $ | — | $ | (158 | ) | ||||||||||||
| Net realized gain on foreign currency contracts | — | 2,082 | — | — | — | — | 2,082 | |||||||||||||||||||||
| Total | $ | (158 | ) | $ | 2,082 | $ | — | $ | — | $ | — | $ | — | $ | 1,924 | |||||||||||||
| Net Change in Unrealized Appreciation (Depreciation) on Derivatives Recognized as a Result of Operations: | ||||||||||||||||||||||||||||
| Net change in unrealized depreciation of foreign currency contracts | $ | — | $ | (147 | ) | $ | — | $ | — | $ | — | $ | — | $ | (147 | ) | ||||||||||||
| Total | $ | — | $ | (147 | ) | $ | — | $ | — | $ | — | $ | — | $ | (147 | ) | ||||||||||||
| 5. | Principal Risks: |
| a) | Credit and Counterparty Risks – Credit risk depends largely on the perceived financial health of bond issuers. In general, the credit rating is inversely related to the credit risk of the issuer. Higher rated bonds generally are deemed to have less credit risk, while lower or unrated bonds are deemed to have higher risk of default. The share price, yield and total return of a fund that holds securities with higher credit risk may be more volatile than those of a fund that holds bonds with lower credit risk. Similar to credit risk, the Fund may be exposed to counterparty risk, or the risk that an institution or other entity with which the Fund has unsettled or open transactions will default. |
| b) | Market Risks – The Fund’s investments expose the Fund to various risks including, but not limited to, interest rate, prepayment, extension, foreign currency, and equity risks. Interest rate risk is the risk that fixed income securities will decline in value because of changes in interest rates. As nominal interest rates rise, the values of certain fixed income securities held by the Fund are likely to decrease. A nominal interest rate can be described as the sum of a real interest rate and an expected inflation rate. Fixed income securities with longer durations tend to be more sensitive to changes in interest rates, usually making them more volatile than securities with shorter durations. Duration is useful primarily as a measure of the sensitivity of a fixed income security’s market price to interest rate (i.e., yield) movements. In addition, securities are subject to extension risk. Rising interest rates may cause prepayments to occur at a slower than expected rate, thereby effectively lengthening the maturity of the security and making the security more sensitive to interest rate changes. Prepayment and extension risk are major risks of mortgage-backed securities and certain asset-backed securities. For certain asset-backed securities, the actual maturity may be less than the stated maturity shown in the Schedule of Investments, if applicable. As a result, the timing of income recognition relating to these securities may vary based upon the actual maturity. If the Fund invests directly in foreign currencies or in securities that trade in, and receive revenues in, foreign currencies, or in derivatives that provide exposure to foreign currencies, it will be subject to the risk that those currencies will decline in value relative to the base currency of the Fund, or, in the case of hedging positions, that the Fund’s base currency will decline in value relative to the currency being hedged. Currency rates in foreign countries may fluctuate significantly over short periods of time for a number of reasons, including changes in interest rates, intervention (or the failure to intervene) by U.S. or foreign governments, central banks or supranational entities, such as the International Monetary Fund, or by the imposition of currency controls or other political developments in the United States or abroad. As a result, the Fund’s investments in foreign currency denominated securities may reduce the returns of the Fund. The market values of equity securities, such as common stocks and preferred stocks, or equity |
| 22 |
related investments, such as futures and options, may decline due to general market conditions which are not specifically related to a particular company, such as real or perceived adverse economic conditions, changes in the general outlook for corporate earnings, changes in interest or currency rates or adverse investor sentiment generally. The market value of equity securities may also decline due to factors which affect a particular industry or industries, such as labor shortages or increased production costs and competitive conditions within an industry. Equity securities and equity related investments generally have greater market price volatility than fixed income securities.
| 6. | Federal Income Taxes: |
| a) | Federal Income Taxes – For federal income tax purposes, the Fund intends to continue to qualify as a RIC under Subchapter M of the Internal Revenue Code (“IRC”) by distributing substantially all of its taxable net investment income and net realized capital gains to its shareholders and otherwise complying with the requirements of RICs. The Fund has distributed substantially all of its income and capital gains in prior years, if applicable, and intends to distribute substantially all of its income and capital gains prior to the next fiscal year-end. Accordingly, no provision for federal income or excise taxes has been made in the accompanying financial statements. Distributions from short-term capital gains are treated as ordinary income distributions for federal income tax purposes. |
| b) | Net Investment Income (Loss), Net Realized Gains (Losses) – Net investment income (loss) and net realized gains (losses) may differ for financial statement and tax purposes primarily because of losses deferred due to wash sale adjustments, foreign currency gains and losses, adjustments related to PFICs, REITs, RICs, certain derivatives and partnerships. The character of distributions made during the year from net investment income or net realized gains may differ from their ultimate characterization for federal income tax purposes. Also, due to the timing of dividend distributions, the fiscal year in which amounts are distributed may differ from the year that the income or realized gains (losses) were recorded by the Fund. |
| c) | Distributions and Components of Distributable Earnings – The tax character of distributions paid by the Fund for the periods indicated is as follows (as adjusted for dividends payable): |
| For the Year Ended December 31, 2011 | For the Year Ended December 31, 2010 | |||||||
| Ordinary Income | $ | 57,855 | $ | 55,000 | ||||
As of December 31, 2011, the Fund’s components of distributable earnings (deficit) on a tax basis were as follows:
| Amount | ||||
| Undistributed Ordinary Income | $ | 28,105 | ||
| Accumulated Capital and Other Losses* | (1,080,774 | ) | ||
| Unrealized Appreciation† | 245,065 | |||
| Total Accumulated Deficit | $ | (807,604 | ) | |
| * | The Fund has capital loss carryforwards that are identified in the Capital Loss Carryforward note that follows. |
| † | The difference between book-basis and tax-basis unrealized appreciation (depreciation) may be attributable to the losses deferred due to wash sale adjustments, foreign currency gains and losses, adjustments related to PFICs, REITs, RICs, certain derivatives and partnerships. |
| d) | Reclassification of Capital Accounts – The Fund may record reclassifications in its capital accounts. These reclassifications have no impact on the total net assets of the Fund. The reclassifications are a result of permanent differences between U.S. GAAP and tax accounting for such items as foreign currency, PFICs, expiration or utilization of capital loss carryforwards or net operating losses. Adjustments are made to reflect the impact these items have on current and future distributions to shareholders. Therefore, the source of the Fund’s distributions may be shown in the |
| 23 |
| Hartford Balanced HLS Fund (formerly Hartford Advisers HLS Fund) |
| Notes to Financial Statements – (continued) |
| June 30, 2012 (Unaudited) |
| (000’s Omitted) |
accompanying Statement of Changes in Net Assets as from undistributed net investment income, from accumulated net realized gains on investments or from capital depending on the type of book and tax differences that exist. For the year ended December 31, 2011, the Fund recorded reclassifications to increase (decrease) the accounts listed below:
| Amount | ||||
| Undistributed Net Investment Income | $ | 363 | ||
| Accumulated Net Realized Gain (Loss) | (363 | ) | ||
| e) | Capital Loss Carryforward – On December 22, 2010, the Regulated Investment Company Modernization Act of 2010 (the “Act”) was enacted, which made changes to the capital loss carryforward rules. The changes are effective for taxable years beginning after the date of enactment. Under the Act, funds are permitted to carry forward capital losses for an unlimited period. However, any losses incurred during those future taxable years will be required to be utilized prior to the losses incurred in pre-enactment taxable years, which carry an expiration date. As a result of this ordering rule, pre-enactment capital loss carryforwards may be more likely to expire unused. Additionally, post-enactment capital loss carryforwards retain their character as either short-term or long-term capital losses rather than being considered all short-term as permitted under prior regulation. |
At December 31, 2011 (tax-year-end), the Fund had capital loss carryforwards for U.S. federal income tax purposes as follows:
| Year of Expiration | Amount | |||
| 2016 | $ | 123,119 | ||
| 2017 | 957,655 | |||
| Total | $ | 1,080,774 | ||
During the year ended December 31, 2011, the Fund utilized $161,012 of prior year capital loss carryforwards.
| f) | Accounting for Uncertainty in Income Taxes – The Fund has adopted financial reporting rules that require the Fund to analyze all open tax years, as defined by the statute of limitations, for all major jurisdictions. Generally, tax authorities can examine all tax returns filed for the last three years. The Fund does not have an examination in progress. |
The Fund has reviewed all open tax years and major jurisdictions and concluded that these financial reporting rules had no effect on the Fund’s financial position or results of operations. There is no tax liability resulting from unrecognized tax benefits relating to uncertain income tax positions taken or expected to be taken on the tax return for the fiscal year ended December 31, 2011. The Fund is also not aware of any tax positions for which it is reasonably possible that the total amounts of unrecognized tax benefits will significantly change in the next twelve months.
| 7. | Expenses: |
| a) | Investment Management Agreement – HL Investment Advisors, LLC (“HL Advisors”), an indirect wholly owned subsidiary of The Hartford Financial Services Group, Inc. (“The Hartford”), serves as investment manager to the Fund pursuant to an Investment Management Agreement with the Company. As investment manager, HL Advisors has overall investment supervisory responsibility for the Fund. In addition, HL Advisors provides administrative personnel, services, equipment, facilities and office space for proper operation of the Fund. HL Advisors has contracted with Wellington Management Company, LLP (“Wellington Management”) under a sub-advisory agreement for the provision of day-to-day investment management services to the Fund in accordance with the Fund’s investment objective and policies. The Fund pays a fee to HL Advisors, a portion of which may be used to compensate Wellington Management. |
| 24 |
The schedule below reflects the rates of compensation paid to HL Advisors for investment management services rendered as of June 30, 2012; the rates are accrued daily and paid monthly.
| Average Daily Net Assets | Annual Fee | |||
| On first $250 million | 0.6800 | % | ||
| On next $250 million | 0.6550 | % | ||
| On next $500 million | 0.6450 | % | ||
| On next $4 billion | 0.5950 | % | ||
| On next $5 billion | 0.5925 | % | ||
| Over $10 billion | 0.5900 | % | ||
| b) | Accounting Services Agreement – Pursuant to the Fund Accounting Agreement between HLIC and the Company, on behalf of the Fund, HLIC provides accounting services to the Fund and receives monthly compensation based on the Fund’s average daily net assets at the rates set forth below. The Fund’s accounting services fees are accrued daily and paid monthly. |
| Average Daily Net Assets | Annual Fee | |||
| On first $5 billion | 0.016 | % | ||
| On next $5 billion | 0.014 | % | ||
| Over $10 billion | 0.012 | % | ||
| c) | Operating Expenses – Allocable expenses incurred by the Company are allocated to each Fund and allocated to classes within a Fund in proportion to the average daily net assets of the Fund and each class, except where allocation of certain expenses is more fairly made directly to the Fund or to specific classes within a Fund. |
| d) | Fees Paid Indirectly – The Company, on behalf of the Fund, has entered into agreements with State Street Global Markets, LLC and Russell Implementation Services, Inc. to partially recapture non-discounted trade commissions. Such rebates are used to pay a portion of the Fund’s expenses. In addition, the Fund’s custodian bank has also agreed to reduce its fees when the Fund maintains cash on deposit in a non-interest-bearing custody account. For the six-month period ended June 30, 2012, these amounts, if any, are included in the Statement of Operations. |
The ratio of expenses to average net assets in the accompanying financial highlights excludes the reduction in expenses related to fees paid indirectly. The annualized expense ratio for the period listed below reflecting the reduction for fees paid indirectly is as follows:
| Annualized Six- Month Period Ended June 30, 2012 | ||||
| Class IA | 0.64 | % | ||
| Class IB | 0.89 | % | ||
| e) | Distribution Plan for Class IB shares – The Company, on behalf of the Fund, has adopted a Distribution Plan pursuant to Rule 12b-1 of the 1940 Act to compensate the Distributor, Hartford Securities Distribution Company, Inc. (a wholly owned, ultimate subsidiary of The Hartford), from assets attributable to the Class IB shares for services rendered and expenses borne in connection with activities primarily intended to result in the sale of the Class IB shares, subject to the review and approval of the Company’s Board of Directors. |
The Distribution Plan provides that the Fund may pay annually up to 0.25% of the average daily net assets of the Fund attributable to its Class IB shares for activities primarily intended to result in the sale of Class IB shares. The Board has the authority to suspend or reduce these payments at any point in time. Under the terms of the Distribution Plan and the
| 25 |
| Hartford Balanced HLS Fund (formerly Hartford Advisers HLS Fund) |
| Notes to Financial Statements – (continued) |
| June 30, 2012 (Unaudited) |
| (000’s Omitted) |
principal underwriting agreement, the Fund is authorized to make payments monthly to the Distributor that may be used to pay or compensate entities providing distribution and shareholder servicing with respect to the Class IB shares for such entities’ fees or expenses incurred or paid in that regard. These fees are accrued daily and paid monthly.
| f) | Other Related Party Transactions – Certain officers of the Fund are directors and/or officers of HL Advisors and/or The Hartford or its subsidiaries. For the six-month period ended June 30, 2012, a portion of the Fund’s chief compliance officer’s salary was paid by all the investment companies in the Hartford fund complex. The portion allocated to the Fund was in the amount of $3. These fees are accrued daily and paid monthly. |
| 8. | Investment Transactions: |
For the six-month period ended June 30, 2012, the Fund's aggregate purchases and sales of investment securities (excluding short-term investments) were as follows:
| Amount | ||||
| Cost of Purchases Excluding U.S. Government Obligations | $ | 557,912 | ||
| Sales Proceeds Excluding U.S. Government Obligations | 879,410 | |||
| Cost of Purchases for U.S. Government Obligations | 48,317 | |||
| Sales Proceeds for U.S. Government Obligations | 62,592 | |||
| 9. | Line of Credit: |
The Fund is one of several Hartford funds that participate in a $500 million committed revolving line of credit facility. The facility is to be used for temporary or emergency purposes. Under the arrangement, the funds are required to own securities having a market value in excess of 300% of the total bank borrowings. The interest rate on borrowings varies depending on the nature of the loan. The facility also requires a fee to be paid based on the amount of the commitment. This commitment fee is allocated to all of the funds participating in the line of credit based on the average net assets of the funds. During the six-month period ended June 30, 2012, the Fund did not have any borrowings under this facility.
| 10. | Industry Classifications: |
Other than the industry classifications “Other Investment Pools and Funds” and “Exchange Traded Funds,” equity industry classifications used in this report are the Global Industry Classification Standard, which was developed by and is the exclusive property and service mark of MSCI, Inc. and Standard & Poor’s.
| 11. | Indemnifications: |
Under the Company’s organizational documents, the Company shall indemnify its officers and directors to the full extent required or permitted under Maryland General Corporation Law and the federal securities laws. In addition, the Company, on behalf of the Fund, may enter into contracts that contain a variety of indemnifications. The Company’s maximum exposure under these arrangements is unknown. However, as of the date of these financial statements, the Company has not had prior claims or losses pursuant to these contracts and expects the risk of loss to be remote.
| 26 |
[This page is intentionally left blank.]
| 27 |
| Hartford Balanced HLS Fund (formerly Hartford Advisers HLS Fund) |
| Financial Highlights |
| - Selected Per-Share Data (A) - |
| Net Asset | Net Realized | Net Increase | ||||||||||||||||||||||||||||||||||||||||||
| Value at | and Unrealized | Total from | Dividends from | Distributions | (Decrease) in | Net Asset | ||||||||||||||||||||||||||||||||||||||
| Beginning of | Net Investment | Payments from | Gain (Loss) on | Investment | Net Investment | from Realized | Distributions | Total | Net Asset | Value at End of | ||||||||||||||||||||||||||||||||||
| Class | Period | Income (Loss) | (to) Affiliate | Investments | Operations | Income | Capital Gains | from Capital | Distributions | Value | Period | |||||||||||||||||||||||||||||||||
| For the Six-Month Period Ended June 30, 2012 (Unaudited) | ||||||||||||||||||||||||||||||||||||||||||||
| IA | $ | 19.34 | $ | 0.23 | $ | – | $ | 0.94 | $ | 1.17 | $ | – | $ | – | $ | – | $ | – | $ | 1.17 | $ | 20.51 | ||||||||||||||||||||||
| IB | 19.58 | 0.21 | – | 0.95 | 1.16 | – | – | – | – | 1.16 | 20.74 | |||||||||||||||||||||||||||||||||
| For the Year Ended December 31, 2011 | ||||||||||||||||||||||||||||||||||||||||||||
| IA | 19.32 | 0.41 | – | (0.06) | 0.35 | (0.33) | – | – | (0.33) | 0.02 | 19.34 | |||||||||||||||||||||||||||||||||
| IB | 19.55 | 0.36 | – | (0.05) | 0.31 | (0.28) | – | – | (0.28) | 0.03 | 19.58 | |||||||||||||||||||||||||||||||||
| For the Year Ended December 31, 2010 (G) | ||||||||||||||||||||||||||||||||||||||||||||
| IA | 17.47 | 0.30 | – | 1.82 | 2.12 | (0.27) | – | – | (0.27) | 1.85 | 19.32 | |||||||||||||||||||||||||||||||||
| IB | 17.68 | 0.26 | – | 1.83 | 2.09 | (0.22) | – | – | (0.22) | 1.87 | 19.55 | |||||||||||||||||||||||||||||||||
| For the Year Ended December 31, 2009 | ||||||||||||||||||||||||||||||||||||||||||||
| IA | 13.69 | 0.36 | – | 3.78 | 4.14 | (0.36) | – | – | (0.36) | 3.78 | 17.47 | |||||||||||||||||||||||||||||||||
| IB | 13.85 | 0.32 | – | 3.83 | 4.15 | (0.32) | – | – | (0.32) | 3.83 | 17.68 | |||||||||||||||||||||||||||||||||
| For the Year Ended December 31, 2008 | ||||||||||||||||||||||||||||||||||||||||||||
| IA | 20.97 | 0.50 | – | (7.09) | (6.59) | (0.58) | (0.11) | – | (0.69) | (7.28) | 13.69 | |||||||||||||||||||||||||||||||||
| IB | 21.18 | 0.47 | – | (7.17) | (6.70) | (0.52) | (0.11) | – | (0.63) | (7.33) | 13.85 | |||||||||||||||||||||||||||||||||
| For the Year Ended December 31, 2007 | ||||||||||||||||||||||||||||||||||||||||||||
| IA | 22.60 | 0.55 | – | 0.90 | 1.45 | (0.53) | (2.55) | – | (3.08) | (1.63) | 20.97 | |||||||||||||||||||||||||||||||||
| IB | 22.78 | 0.49 | – | 0.92 | 1.41 | (0.46) | (2.55) | – | (3.01) | (1.60) | 21.18 | |||||||||||||||||||||||||||||||||
| (A) | Information presented relates to a share outstanding throughout the indicated period. |
| (B) | The figures do not include sales charges or other fees which may be applied at the variable life insurance, variable annuity or qualified retirement plan product level. Any such additional sales charges or other fees would lower the Fund's performance. |
| (C) | Ratios do not reflect reductions for fees paid indirectly. Please see Fees Paid Indirectly in the Notes to Financial Statements. |
| (D) | Portfolio turnover rate is calculated on the basis of the Fund as a whole without distinguishing between the classes of shares issued. |
| (E) | Not annualized. |
| (F) | Annualized. |
| (G) | Per share amounts have been calculated using the average shares method. |
| (H) | During the year ended December 31, 2010, the Fund incurred $204.5 million in purchases associated with the transition of assets from Hartford Global Advisers HLS Fund, which merged into the Fund on March 19, 2010. These purchases were excluded from the portfolio turnover calculation. |
| 28 |
| - Ratios and Supplemental Data - |
| Total Return(B) | Net Assets at End of Period | Ratio of Expenses to Average Net Assets Before Waivers(C) | Ratio of Expenses to Average Net Assets After Waivers(C) | Ratio of Net Investment Income (Loss) to Average Net Assets | Portfolio Turnover Rate(D) | |||||||||||||||
| 6.05 | %(E) | $ | 2,854,079 | 0.65 | %(F) | 0.65 | %(F) | 1.99 | %(F) | 16 | % | |||||||||
| 5.92 | (E) | 428,730 | 0.90 | (F) | 0.90 | (F) | 1.74 | (F) | – | |||||||||||
| 1.86 | 2,959,019 | 0.64 | 0.64 | 1.84 | 34 | |||||||||||||||
| 1.61 | 455,939 | 0.89 | 0.89 | 1.59 | – | |||||||||||||||
| 12.14 | 3,539,983 | 0.65 | 0.65 | 1.68 | 65 | (H) | ||||||||||||||
| 11.86 | 556,169 | 0.90 | 0.90 | 1.43 | – | |||||||||||||||
| 30.29 | 3,607,929 | 0.65 | 0.65 | 2.15 | 73 | |||||||||||||||
| 29.96 | 578,338 | 0.90 | 0.90 | 1.90 | – | |||||||||||||||
| (31.64 | ) | 3,404,626 | 0.63 | 0.63 | 2.43 | 76 | ||||||||||||||
| (31.81 | ) | 548,899 | 0.88 | 0.88 | 2.18 | – | ||||||||||||||
| 6.64 | 6,291,220 | 0.63 | 0.63 | 2.13 | 47 | |||||||||||||||
| 6.37 | 1,080,254 | 0.88 | 0.88 | 1.88 | – | |||||||||||||||
| 29 |
| Hartford Balanced HLS Fund (formerly Hartford Advisers HLS Fund) |
| Directors and Officers (Unaudited) |
The Board of Directors of the Company appoints officers who are responsible for the day-to-day operations of the Fund and who execute policies formulated by the Directors. Each director serves until his or her death, resignation, or retirement or until the next annual meeting of shareholders is held or until his or her successor is elected and qualifies.
Directors and officers who are employed by or who have a financial interest in The Hartford are considered “interested” persons of the Fund pursuant to the 1940 Act. Each officer and two of the Company’s directors, as noted in the chart below, are “interested” persons of the Fund. Each director serves as a director for The Hartford Mutual Funds, Inc., The Hartford Mutual Funds II, Inc., Hartford Series Fund, Inc., Hartford HLS Series Fund II, Inc., and as a trustee for The Hartford Alternative Strategies Fund, which, as of June 30, 2012, collectively consist of 89 funds. Correspondence may be sent to directors and officers c/o Hartford Mutual Funds, P.O. Box 2999, Hartford, Connecticut 06104-2999, except that correspondence to Mr. Annoni, Mr. Dressen and Ms. Fagely may be sent to 500 Bielenberg Drive, Woodbury, Minnesota 55125.
The table below sets forth, for each director and officer, his or her name, year of birth, current position with the Company and date first elected or appointed to Hartford Series Fund, Inc. (“HSF”), and Hartford HLS Series Fund II, Inc. (“HSF2”), principal occupation, and, for directors, other directorships held. The Fund’s statement of additional information contains further information on the directors and is available free of charge by calling 1-800-862-6668 or writing to Hartford HLS Funds, c/o Individual Annuity Services, P.O. Box 5085, Hartford, CT 06102-5085.
Information on the aggregate remuneration paid to the directors of the Company can be found in the Statement of Operations herein. The Fund pays to The Hartford a portion of the Chief Compliance Officer’s compensation, but does not pay salaries or compensation to any of their other officers or directors who are employed by The Hartford.
Non-Interested Directors
Lynn S. Birdsong (1946) Director since 2003, Co-Chairman of the Investment Committee
Mr. Birdsong is a private investor. Mr. Birdsong currently serves as a Director of the Sovereign High Yield Investment Company (April 2010 to current). Mr. Birdsong currently serves as an Independent Director of Nomura Partners Funds, Inc. (formerly, The Japan Fund) (March 2003 to current). From 1979 to 2002, Mr. Birdsong was a managing director of Zurich Scudder Investments, an investment management firm. During his employment with Scudder, Mr. Birdsong was an Interested Director of The Japan Fund. Since 1981, Mr. Birdsong has been a partner in Birdsong Company, an advertising specialty firm.
Robert M. Gavin, Jr. (1940) Director since 2002 (HSF) and 1986 (HSF2), Chairman of the Board since 2004
Dr. Gavin is an educational consultant. Prior to September 1, 2001, he was President of Cranbrook Education Community and prior to July 1996, he was President of Macalester College, St. Paul, Minnesota.
Duane E. Hill (1945) Director since 2001 (HSF) and 2002 (HSF2), Chairman of the Nominating Committee
Mr. Hill is Partner of TSG Ventures L.P., a private equity investment company. Mr. Hill is a former partner of TSG Capital Group, a private equity investment firm that served as sponsor and lead investor in leveraged buyouts of middle market companies.
Sandra S. Jaffee (1941) Director since 2005
Ms. Jaffee is the founder and Chief Executive Officer of a private company, Homeworks Concierge, LLC, which provides residential property management services in Westchester County, New York (January 2012 to present). Ms. Jaffee served as Chairman (2008 to 2009) and Chief Executive Officer of Fortent (formerly Searchspace Group), a leading provider of compliance/regulatory technology to financial institutions from August 2005 to August 2009. Ms. Jaffe currently serves as a member of the Board of Directors of Broadridge Financial Solutions as well as a Trustee of Muhlenberg College.
William P. Johnston (1944) Director since 2005, Chairman of the Compliance Committee
In June 2006, Mr. Johnston was appointed as Senior Advisor to The Carlyle Group, a global private equity investment firm. In August 2007, Mr. Johnston was elected to the Board of Directors of LifeCare Holdings, Inc. In February 2008, Mr. Johnston was elected to the Board of Directors of HCR-ManorCare, Inc. In May 2006, Mr. Johnston was elected to the Supervisory Board of Fresenius Medical Care AG & Co. KGaA, after its acquisition of Renal Care Group, Inc. in March 2006.
Phillip O. Peterson (1944) Director since 2002 (HSF) and 2000 (HSF2), Chairman of the Audit Committee
Mr. Peterson is a mutual fund industry consultant. He was a partner of KPMG LLP (an accounting firm) until July 1999. Mr. Peterson joined William Blair Funds in February 2007 as a member of the Board of Trustees. Mr. Peterson also joined the Board of Trustees of Symetra Variable Mutual Funds Trust as a trustee in February 2012.
| 30 |
Lemma W. Senbet (1946) Director since 2005
Dr. Senbet is the William E. Mayer Chair Professor of Finance and Director, Center for Financial Policy, at the University of Maryland, Robert H. Smith School of Business. He was chair of the Finance Department from 1998 to 2006. Previously he was a chaired professor of finance at the University of Wisconsin-Madison. Also, he was director of the Fortis Funds from March 2000 to July 2002. Dr. Senbet served the finance profession in various capacities, including as director of the American Finance Association and President of the Western Finance Association. In 2006, Dr. Senbet was inducted Fellow of Financial Management Association International for his career-long distinguished scholarship and professional service.
Interested Directors and Officers
David N. Levenson (1966) Director since 2010(1)
Mr. Levenson currently serves as President of The Hartford’s Wealth Management business. He was appointed to this role in July 2010. Previously, Mr. Levenson served as Executive Vice President of Legacy Holdings for The Hartford from June 2009 to July 2010. From 2006 to 2009, Mr. Levenson was with Hartford Life Insurance K.K. where he served as President and Chief Executive Officer from 2007 to 2009. He served as Managing Director of Hartford Investment Management Company from 2005 to 2006. Additionally, Mr. Levenson serves as Executive Vice President of The Hartford and as President, Director and Chief Executive Officer of Hartford Life Insurance Company (“HLIC”) and Hartford Life, Inc. (“HL Inc.”).
(1) Mr. Levenson served as Interested Director until August 2, 2012.
Lowndes A. Smith (1939) Director since 1996 (HSF) and 2002 (HSF2), Co-Chairman of the Investment Committee
Mr. Smith served as Vice Chairman of The Hartford from February 1997 to January 2002, as President and Chief Executive Officer of HL Inc. from February 1997 to January 2002, and as President and Chief Operating Officer of The Hartford Life Insurance Companies from January 1989 to January 2002. Mr. Smith serves as a Director of White Mountains Insurance Group, Ltd., One Beacon Insurance and Symetra Financial and as Managing Director of Whittington Gray Associates.
Other Officers
James E. Davey (1964) President and Chief Executive Officer since 2010(2)
Mr. Davey serves as Executive Vice President of HLIC. Additionally, Mr. Davey serves as President, Chief Executive Officer and Manager of HIFSCO and President, Chief Executive Officer and Manager of HL Investment Advisors, LLC (“HL Advisors”). Mr. Davey joined The Hartford in 2002.
(2) Mr. Davey became an Interested Director effective August 2, 2012.
Mark A. Annoni (1964) Vice President, Controller and Treasurer since 2012(3)
Mr. Annoni serves as the Assistant Vice President and Director of Investment Finance (February 2004 to present). Mr. Annoni joined The Hartford in April 2001 as part of The Hartford’s acquisition of Fortis Financial Group. Prior to joining The Hartford, Mr. Annoni served as Manager of Mutual Fund Accounting at Fortis Financial Group (July 1997 to April 2001).
(3) Mr. Annoni was named Vice President, Controller and Treasurer on May 8, 2012.
Michael R. Dressen (1963) AML Compliance Officer since 2011
Mr. Dressen currently serves as Assistant Vice President of HLIC. He also serves as Chief Compliance Officer and AML Compliance Officer of Hartford Administrative Services Company (“HASCO”) and as Assistant Secretary and Compliance Officer of HIFSCO. Mr Dressen joined The Hartford in 2005 from State Farm Insurance Companies where he held various positions related to mutual funds, variable products, and property casualty insurance.
Tamara L. Fagely (1958) Vice President, since 2002 (HSF) and 1993 (HSF2)(4)
Ms. Fagely has been a Vice President of HASCO since 1998 and Chief Financial Officer since 2006. Currently Ms. Fagely is a Vice President of HLIC. She served as Assistant Vice President of HLIC from December 2001 through March 2005. In addition, Ms. Fagely is Controller and Chief Financial Officer of HIFSCO.
(4) Ms. Fagely served as Vice President, Controller and Treasurer until May 8, 2012.
Dr. Robert J. Froehlich (1953) Senior Managing Director since 2009(5)
Dr. Froehlich joined The Hartford as Senior Managing Director in September 2009. Prior to joining The Hartford, Dr. Froehlich served as Vice Chairman of Deutsche Asset Management from 1997-2009.
(5) Dr. Froehlich served as Senior Managing Director until March 26, 2012.
| 31 |
| Hartford Balanced HLS Fund (formerly Hartford Advisers HLS Fund) |
| Directors and Officers (Unaudited) – (continued) |
Edward P. Macdonald (1967) Vice President, Secretary and Chief Legal Officer since 2005
Mr. Macdonald serves as Vice President of HLIC and Chief Legal Officer of Mutual Funds and Vice President of HIFSCO. He also serves as Vice President and Secretary of HASCO, and Chief Legal Officer, Secretary and Vice President of HL Advisors. Mr. Macdonald joined The Hartford in 2005.
Vernon J. Meyer (1964) Vice President since 2006
Mr. Meyer serves as Senior Vice President of HLIC. He also serves as Senior Vice President of HIFSCO and HL Advisors. Mr. Meyer joined The Hartford in 2004.
Colleen B. Pernerewski (1969) Vice President and Chief Compliance Officer since 2010
Ms. Pernerewski serves as Vice President and Chief Investment Advisor Compliance Officer of HIFSCO and as Vice President and Chief Compliance Officer of HL Advisors. Ms. Pernerewski serves as Vice President and Chief Compliance Officer of Individual Annuity of HLIC. Ms. Pernerewski joined The Hartford in 2005 from Travelers Life and Annuity where she served as Counsel (2004-2005). Prior to Travelers Life and Annuity, Ms. Pernerewski held the position of Counsel at The Hartford (1998-2004).
Elizabeth L. Schroeder (1966) Vice President since 2010
Ms. Schroeder currently serves as Assistant Vice President of HLIC. Ms. Schroeder joined HLIC in 1991. She is also an Assistant Vice President of HASCO, HIFSCO and HL Advisors.
Martin Swanson (1962) Vice President since 2010
Mr. Swanson is a Vice President of HLIC. Mr. Swanson also serves as Vice President/Marketing for HIFSCO. Prior to joining HLIC in 1998, Mr. Swanson was a Vice President at PaineWebber, Inc.
Jane Wolak (1961) Vice President since 2009
Ms. Wolak currently serves as Senior Vice President of HLIC. Ms. Wolak joined HLIC as Vice President, Retail Product Services in May 2007. She is also Vice President of HASCO. Previously, Ms. Wolak was with Sun Life Financial where she held the position of Vice President, Service Center Operations from 2001-2007.
HOW TO OBTAIN A COPY OF THE FUND’S PROXY VOTING POLICIES AND VOTING RECORDS (UNAUDITED)
A description of the policies and procedures that the Fund uses to determine how to vote proxies relating to portfolio securities and a record of how the Fund voted any proxies for the twelve-month period ended June 30, 2012 are available (1) without charge, upon request, by calling 800-862-6668 and (2) on the SEC’s website at http://www.sec.gov.
QUARTERLY PORTFOLIO HOLDINGS INFORMATION (UNAUDITED)
The Fund files a complete schedule of portfolio holdings with the SEC for the first and third quarters of each fiscal year on Form N-Q. The Fund’s Forms are available (1) without charge, upon request, by calling 800-862-6668 and (2) on the SEC’s website at http://www.sec.gov. The Form N-Q may be reviewed and copied at the SEC’s Public Reference Room in Washington, DC. Information on the operation of the Public Reference Room may be obtained by calling 1-800-SEC-0330.
| 32 |
| Hartford Balanced HLS Fund (formerly Hartford Advisers HLS Fund) |
| Expense Example (Unaudited) |
Your Fund's Expenses
As a shareholder of the Fund, you incur two types of costs: (1) transaction costs and (2) ongoing costs including investment management fees, distribution fees, and other fund expenses. This example is intended to help you understand your ongoing costs (in dollars) of investing in the Fund and to compare these costs with the ongoing costs of investing in other mutual funds. The example is based on an investment of $1,000 invested at the beginning of the period and held for the period of December 31, 2011 through June 30, 2012.
Actual Expenses
The first set of columns of the table below provides information about actual account values and actual expenses. You may use the information in this column, together with the amount you invested, to estimate the expenses that you paid over the period. Simply divide your account value by $1,000 (for example, an $8,600 account value divided by $1,000 = 8.6), then multiply the result by the number in the line under the heading entitled “Expenses Paid During Period” to estimate the expenses you paid on your account during this period.
Hypothetical Example for Comparison Purposes
The second set of columns of the table below provides information about hypothetical account values and hypothetical expenses based on the Fund’s actual expense ratio and an assumed rate of return of 5% per year before expenses, which is not the Fund’s actual return. The hypothetical account values and expenses may not be used to estimate the actual ending account balance or expenses you paid for the period. You may use this information to compare the ongoing costs of investing in the Fund and other funds. To do so, compare this 5% hypothetical example with the 5% hypothetical examples that appear in the shareholder reports of the other funds.
Please note that the expenses shown in the table are meant to highlight your ongoing costs only and do not reflect any transactional costs, such as sales charges (loads) and CDSC. Therefore, the second set of columns of the table is useful in comparing ongoing costs only, and will not help you determine the relative total costs of owning different funds. In addition, if these transactional costs were included, your costs would be higher. Expenses are equal to the Fund's annualized expense ratios multiplied by average account value over the period, multiplied by 182/366 (to reflect the one-half year period).
| Actual return | Hypothetical (5% return before expenses) | |||||||||||||||||||||||||||||||||||
| Beginning Account Value December 31, 2011 | Ending Account Value June 30, 2012 | Expenses paid during the period December 31, 2011 through June 30, 2012 | Beginning Account Value December 31, 2011 | Ending Account Value June 30, 2012 | Expenses paid during the period December 31, 2011 through June 30, 2012 | Annualized expense ratio | Days in the current 1/2 year | Days in the full year | ||||||||||||||||||||||||||||
| Class IA | $ | 1,000.00 | $ | 1,060.48 | $ | 3.33 | $ | 1,000.00 | $ | 1,021.63 | $ | 3.27 | 0.65 | % | 182 | 366 | ||||||||||||||||||||
| Class IB | $ | 1,000.00 | $ | 1,059.16 | $ | 4.61 | $ | 1,000.00 | $ | 1,020.39 | $ | 4.52 | 0.90 | % | 182 | 366 | ||||||||||||||||||||
| 33 |
HARTFORD HLS FUNDS
c/o The Hartford Wealth Management - Global Annuities
P.O. Box 14293
Lexington, KY 40512-4293
Hartford Series Fund, Inc. is underwritten and distributed by Hartford Securities Distribution Company, Inc.
"The Hartford" is The Hartford Financial Services Group, Inc. and its subsidiaries.
Hartford Series Fund, Inc. inception dates range from 1977 to date. Hartford Series Fund, Inc. is not a subsidiary of The Hartford but is underwritten, distributed by and advised by subsidiaries of The Hartford. Investments in Hartford Series Fund, Inc. are not guaranteed by The Hartford or any other entity.
You should carefully consider investment objectives, risks, and charges and expenses of Hartford HLS Funds before investing. This and other information can be found in the Fund’s prospectus or summary prospectus, which can be obtained by calling 800-862-6668. Please read them carefully before you invest or send money.
| HLSSAR-B12 8-12 111647 Printed in U.S.A ©2012 The Hartford, Hartford, CT 06115 | |

A MESSAGE FROM THE PRESIDENT
Dear Fellow Shareholders:
I want to take this opportunity to say thank you for investing in the Hartford HLS Funds. We’ve seen continued market volatility throughout the first half of 2012, and there will likely be continued uncertainty until the Presidential election in November, but we are still optimistic about the markets in 2012.
Market Review
In the first quarter of 2012, the S&P 500 Index turned in its best quarterly performance since the third quarter of 2009. U.S. equities showed signs of improvement as investors focused on improving economic data and strong corporate earnings news and the Federal Reserve’s pledge to keep interest rates low buoyed investors’ appetites.
The second quarter ended on a high note for the stock market—the S&P 500 had its strongest June in more than a decade and the Dow Jones Industrial Average had its best month since October—but those gains weren’t enough to offset losses from April and May, and equities finished the quarter in the red. Although the S&P 500 was -2.75 for the second quarter, it was up 9.49% for the first half of 2012.
Concerns about domestic and European unemployment are having an effect on our economy. The unemployment rate in the euro zone's 17 nations rose to a record 11.1% in May, the highest level since the euro launched as a common currency more than 10 years ago. In the U.S., the labor market has been fickle this year, with job growth starting off strong in the first couple months of 2012 but slowing down in the spring, which has led many to wonder about the status of the economic recovery.
On a positive note, home prices are rising again after falling for more than five years, new and existing home sales are increasing, and home builders are ramping up construction.
The Hartford HLS Funds Expands Relationship with Wellington Management
We’re very pleased that we are expanding our relationship with Wellington Management, which will now serve as the primary sub-adviser for the Hartford HLS Funds including equity, fixed-income,* and asset-allocation funds. One of America’s oldest and largest investment management firms, Wellington Management has resources that span the entire globe, with multiple offices across the U.S. and numerous offices abroad. Wellington Management’s most distinctive strength is its proprietary research, which is shared across the entire organization.
We believe that aligning more closely with a well-respected money manager like Wellington Management puts us in a strong position to drive significant growth and to continue delivering innovative fund strategies to help our investors meet their financial goals.
Thank you again for investing with the Hartford HLS Funds.
James Davey
President
Hartford HLS Funds
*Several fixed-income funds will continue to be sub-advised by Hartford Investment Management Company.
Hartford Capital Appreciation HLS Fund
Table of Contents
This report is prepared for the general information of contract owners and qualified retirement plan participants. It is not an offer of contracts or of qualified retirement plans. It should not be used in connection with any offer, except in conjunction with the appropriate product prospectus which contains all pertinent information including the applicable sales, administrative and other charges.
The views expressed in the Fund’s Manager Discussion under ‘‘Why did the Fund perform this way?’’ and ‘‘What is the outlook?’’ are views of the Fund’s sub-adviser and portfolio management team through the end of the period and are subject to change based on market and other conditions.
Hartford Capital Appreciation HLS Fund inception 04/02/1984
| (sub-advised by Wellington Management Company, LLP) | |
| Investment objective – Seeks growth of capital. | |
Performance Overview 6/30/02 – 6/30/12
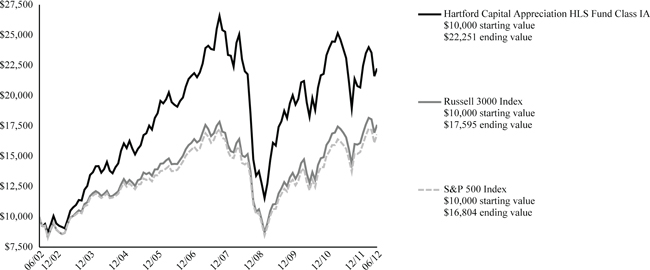
The chart shows the growth of a $10,000 investments in Class 1A. Growth results in classes other than Class 1A will vary from what is seen above due to differences in the expenses charged to those share classes.
| Average Annual Total Returns (as of 6/30/12) |
| 6 Month† | 1 Year | 5 year | 10 year | |
| Capital Appreciation IA | 7.60% | -6.76% | -1.60% | 8.33% |
| Capital Appreciation IB | 7.47% | -7.00% | -1.84% | 8.06% |
| Russell 3000 Index | 9.32% | 3.84% | 0.39% | 5.81% |
| S&P 500 Index | 9.48% | 5.43% | 0.21% | 5.33% |
| † | Not Annualized |
PAST PERFORMANCE IS NOT INDICATIVE OF FUTURE RESULTS.
Total returns presented above were calculated using the Fund's net asset value available to shareholders for sale or redemption of Fund shares on June 30, 2012, which may exclude investment transactions as of this date.
Russell 3000 Index is an unmanaged index that measures the performance of the 3,000 largest U.S. companies based on total market capitalization.
S&P 500 Index is a market capitalization-weighted price index composed of 500 widely held common stocks.
You cannot invest directly in an index.
The chart represents a hypothetical investment in the Fund. Performance data represents past performance and current performance could be higher or lower.
Performance information may reflect historical or current expense waivers/reimbursements from the investment adviser, without which performance would have been lower. For information on current expense waivers/reimbursements, please see the prospectus.
The value of the Fund will fluctuate so that when redeemed, it may be worth more or less than the original investment. The chart and table do not reflect the deductions of taxes, sales charges or other fees which may be applied at the variable life insurance, variable annuity or qualified retirement plan product level. Any such additional sales charges or other fees or expenses would lower the contract’s or plan’s performance.
| 2 |
| Hartford Capital Appreciation HLS Fund |
| Manager Discussion |
| June 30, 2012 (Unaudited) |
| Portfolio Managers | ||
| Saul J. Pannell, CFA | Kent M. Stahl, CFA | Peter I. Higgins, CFA |
| Senior Vice President and Equity Portfolio Manager | Senior Vice President and Director, Investments and Risk Managment | Senior Vice President and Equity Portfolio Manager |
| Paul E. Marrkand, CFA | Nicolas M. Choumenkovitch | Donald J. Kilbride |
| Senior Vice President and Equity Portfolio Manager | Senior Vice President and Equity Portfolio Manager | Senior Vice President and Equity Portfolio Manager |
| Stephen Mortimer | David W. Palmer, CFA | Francis J. Boggan, CFA |
| Senior Vice President and Equity Portfolio Manager | Senior Vice President and Equity Portfolio Manager | Senior Vice President and Equity Portfolio Manager |
How did the Fund perform?
The Class IA shares of the Hartford Capital Appreciation HLS Fund returned 7.60% for the six-month period ended June 30, 2012, underperforming its benchmark, the Russell 3000 Index, which returned 9.32% for the same period. The Fund underperformed the 7.71% return of the average fund in the Lipper Large-Cap Core VP-UF Funds peer group, a group of funds with investment strategies similar to those of the Fund.
Why did the Fund perform this way?
The six-month period ended June 30, 2012 was a volatile one. Equities performed well during the beginning of the period as investors shrugged off lingering uncertainty over eurozone sovereign debt and focused instead on improving economic data in the U.S. Strong corporate earnings news and the Federal Reserve’s pledge to keep interest rates low buoyed investors’ appetites for risk assets. However, following a strong first quarter, equities retreated in April, fell sharply in May, and recovered modestly in June. A lackluster U.S. jobs report, a heightened level of political uncertainty in France and Greece, and a host of Spanish and Italian bank downgrades by Moody’s dampened investor enthusiasm for equities. As the overall markets slowed, traditionally more defensive industries returned to favor while more cyclical industries experienced stronger sell-offs.
Equity markets as measured by the Russell 3000 rose (+9.3%) during the period, with nine of ten sectors within the index posting positive returns. Telecommunication Services (+16%), Financials (+13%), and Health Care (+13%) posted the strongest gains. Energy was the only sector to post a negative absolute return (-3%) during the period.
The fund underperformed its benchmark due primarily to weak stock selection in the Consumer Discretionary, Telecommunication Services, and Financials sectors. A modest cash position in a generally rising market also detracted from relative returns. Strong stock selection within the Industrials sector aided relative returns, as did an overweight (i.e. the Fund’s sector position was greater than the benchmark position) to the Consumer Discretionary sector, which outperformed the index.
The largest detractors from relative returns (i.e. performance of the Fund as measured against the benchmark) were Chesapeake Energy (Energy), Ford Motor (Consumer Discretionary), and NII Holdings (Telecommunication Services). Chesapeake Energy, a U.S.-based producer of natural gas, oil, and natural gas liquids, underperformed due to concerns regarding corporate governance and questions regarding the company’s ability to fund its capital expenditure plans. Ford Motor designs, manufactures, and services cars and trucks, and provides vehicle-related financing, leasing and insurance through its subsidiary, Ford Motor Credit Company. Concerns about the European economy, a key end-market for the firm, and larger fears of a global slowdown drove the share price lower. NII Holdings, a provider of mobile communications for business customers in Latin America, declined during the period due to weak reported revenue and concerns about near-term profitability. Google (Information Technology) was also a large detractor from absolute performance.
The largest contributors to relative performance included holdings in United Continental (Industrials) and eBay (Information Technology), and not owning Proctor & Gamble (Consumer Staples), a benchmark constituent whose shares underperformed. United Continental, a U.S.-based airline company, saw its shares rise as investors considered the positive impact of a 19% decline in the price of Brent crude oil. Shares of eBay, a U.S.-based provider of online marketplaces and payment solutions, rose after the firm posted better-than-expected quarterly revenue and earnings due to strength in its marketplace segment and Paypal. The company also raised its revenue and earnings guidance for the 2012 fiscal year. Proctor & Gamble, a provider of consumer packaged goods, saw its shares decline modestly as the company cut its earnings guidance, citing slowness in
| 3 |
| Hartford Capital Appreciation HLS Fund |
| Manager Discussion – (continued) |
| June 30, 2012 (Unaudited) |
developed markets and a negative impact from foreign exchange rates. Not owning the benchmark component stock aided relative performance. Apple (Information Technology) was also a top contributor to absolute returns.
What is the outlook?
Our approach in this environment is to actively manage the portfolio. We continue to add new ideas to the portfolio and remain disciplined about our sell decisions. We are evaluating companies and applying a higher burden of proof, which we believe is required in the current environment given concerns about decelerating global growth, economic and policy uncertainty and increased volatility in the market. While we are still focused on earnings growth and applying our long-standing valuation methodologies, we are increasingly focused on the execution milestones that could allow the market to appreciate the underlying value that we see.
At the end of the period, the fund was most overweight the Consumer Discretionary, Industrials, and Information Technology sectors relative to the benchmark. The fund was most underweight the Consumer Staples, Utilities, and Telecommunication Services sectors at the end of the period relative to the benchmark.
Diversification by Industry
as of June 30, 2012
| Industry (Sector) | Percentage of Net Assets | |||
| Equity Securities | ||||
| Automobiles & Components (Consumer Discretionary) | 4.4 | % | ||
| Banks (Financials) | 2.7 | |||
| Capital Goods (Industrials) | 7.2 | |||
| Commercial & Professional Services (Industrials) | 0.2 | |||
| Consumer Durables & Apparel (Consumer Discretionary) | 1.7 | |||
| Consumer Services (Consumer Discretionary) | 1.4 | |||
| Diversified Financials (Financials) | 6.7 | |||
| Energy (Energy) | 8.8 | |||
| Food & Staples Retailing (Consumer Staples) | 0.7 | |||
| Food, Beverage & Tobacco (Consumer Staples) | 2.8 | |||
| Health Care Equipment & Services (Health Care) | 4.8 | |||
| Household & Personal Products (Consumer Staples) | 0.2 | |||
| Insurance (Financials) | 2.9 | |||
| Materials (Materials) | 5.0 | |||
| Media (Consumer Discretionary) | 3.5 | |||
| Pharmaceuticals, Biotechnology & Life Sciences (Health Care) | 7.9 | |||
| Real Estate (Financials) | 1.2 | |||
| Retailing (Consumer Discretionary) | 6.8 | |||
| Semiconductors & Semiconductor Equipment (Information Technology) | 1.5 | |||
| Software & Services (Information Technology) | 11.1 | |||
| Technology Hardware & Equipment (Information Technology) | 7.3 | |||
| Telecommunication Services (Services) | 0.7 | |||
| Transportation (Industrials) | 7.4 | |||
| Utilities (Utilities) | 0.5 | |||
| Total | 97.4 | % | ||
| Fixed Income Securities | ||||
| Finance and Insurance (Finance) | 0.4 | % | ||
| Total | 0.4 | % | ||
| Put Options Purchased | 0.0 | |||
| Short-Term Investments | 1.8 | |||
| Other Assets and Liabilities | 0.4 | |||
| Total | 100.0 | % | ||
| 4 |
| Hartford Capital Appreciation HLS Fund |
| Schedule of Investments |
| June 30, 2012 (Unaudited) |
| (000’s Omitted) |
| Shares or Principal Amount | Market Value ╪ | |||||||
| COMMON STOCKS - 97.4% | ||||||||
| �� | Automobiles & Components - 4.4% | |||||||
| 138 | Allison Transmission Holdings, Inc. ● | $ | 2,423 | |||||
| 77 | Continental AG | 6,394 | ||||||
| 179 | Daimler AG | 8,059 | ||||||
| 788 | Dana Holding Corp. | 10,092 | ||||||
| 2,404 | Dongfeng Motor Group Co., Ltd. | 3,758 | ||||||
| 17,449 | Ford Motor Co. w/ Rights | 167,335 | ||||||
| 261 | General Motors Co. ● | 5,151 | ||||||
| 5,949 | Goodyear Tire & Rubber Co. ● | 70,257 | ||||||
| 1,751 | Modine Manufacturing Co. ● | 12,137 | ||||||
| 1,292 | Stoneridge, Inc. ● | 8,797 | ||||||
| 238 | Tenneco Automotive, Inc. ● | 6,395 | ||||||
| 2,133 | TRW Automotive Holdings Corp. ● | 78,423 | ||||||
| 57 | Wabco Holdings, Inc. ● | 3,009 | ||||||
| 508 | Yamaha Motor Co., Ltd. | 4,863 | ||||||
| 387,093 | ||||||||
| Banks - 2.7% | ||||||||
| 1,359 | Barclays Bank plc ADR | 3,472 | ||||||
| 26,324 | Mitsubishi UFJ Financial Group, Inc. | 126,115 | ||||||
| 413 | PNC Financial Services Group, Inc. | 25,219 | ||||||
| 1,301 | Sberbank of Russia ADR ● | 14,077 | ||||||
| 178 | Societe Generale Class A | 4,182 | ||||||
| 291 | Standard Chartered plc | 6,318 | ||||||
| 1,859 | Wells Fargo & Co. | 62,152 | ||||||
| 241,535 | ||||||||
| Capital Goods - 7.2% | ||||||||
| 82 | AGCO Corp. ● | 3,754 | ||||||
| 152 | AMETEK, Inc. | 7,596 | ||||||
| 461 | Assa Abloy Ab | 12,881 | ||||||
| 145 | BE Aerospace, Inc. ● | 6,344 | ||||||
| 243 | Belden, Inc. | 8,111 | ||||||
| 96 | Caterpillar, Inc. | 8,177 | ||||||
| 68 | Dover Corp. | 3,669 | ||||||
| 64 | Fanuc Corp. | 10,586 | ||||||
| 106 | Flowserve Corp. | 12,180 | ||||||
| 312 | General Dynamics Corp. | 20,552 | ||||||
| 4,333 | General Electric Co. | 90,291 | ||||||
| 520 | Honeywell International, Inc. | 29,012 | ||||||
| 185 | Ingersoll-Rand plc | 7,812 | ||||||
| 8,632 | Itochu Corp. | 90,726 | ||||||
| 148 | Joy Global, Inc. | 8,396 | ||||||
| 306 | Komatsu Ltd. | 7,295 | ||||||
| 151 | L-3 Communications Holdings, Inc. | 11,159 | ||||||
| 309 | Lockheed Martin Corp. | 26,897 | ||||||
| 886 | Meritor, Inc. ● | 4,624 | ||||||
| 422 | Northrop Grumman Corp. | 26,926 | ||||||
| 109 | PACCAR, Inc. | 4,259 | ||||||
| 139 | Pall Corp. | 7,611 | ||||||
| 74 | Parker-Hannifin Corp. | 5,667 | ||||||
| 751 | Pentair, Inc. | 28,760 | ||||||
| 243 | Polypore International, Inc. ● | 9,813 | ||||||
| 2,796 | Rolls-Royce Holdings plc | 37,680 | ||||||
| 1,890 | Safran S.A. | 70,177 | ||||||
| 143 | Schneider Electric S.A. | 7,953 | ||||||
| 143 | TransDigm Group, Inc. ● | 19,138 | ||||||
| 591 | Vinci S.A. | 27,613 | ||||||
| 206 | WESCO International, Inc. ● | 11,878 | ||||||
| 50 | Zodiac Aerospace | 5,081 | ||||||
| 632,618 | ||||||||
| Commercial & Professional Services - 0.2% | ||||||||
| 158 | Edenred | 4,479 | ||||||
| 260 | Manpower, Inc. | 9,521 | ||||||
| 14,000 | ||||||||
| Consumer Durables & Apparel - 1.7% | ||||||||
| 67 | Burberry Group plc | 1,394 | ||||||
| 98 | Cie Financiere Richemont S.A. | 5,368 | ||||||
| 85 | Coach, Inc. | 4,978 | ||||||
| 761 | D.R. Horton, Inc. | 13,990 | ||||||
| 217 | Deckers Outdoor Corp. ● | 9,568 | ||||||
| 265 | De'Longhi S.p.A. | 2,548 | ||||||
| 1,311 | Fifth & Pacific Cos., Inc. ● | 14,065 | ||||||
| 2,400 | Furniture Brands International, Inc. ● | 2,976 | ||||||
| 247 | Hanesbrands, Inc. ● | 6,838 | ||||||
| 166 | Jarden Corp. | 6,961 | ||||||
| 119 | Jones (The) Group, Inc. | 1,136 | ||||||
| 109 | Lennar Corp. | 3,369 | ||||||
| 32 | Lululemon Athletica, Inc. ● | 1,898 | ||||||
| 28 | LVMH Moet Hennessy Louis Vuitton S.A. | 4,287 | ||||||
| 605 | Mattel, Inc. | 19,624 | ||||||
| 941 | Pulte Group, Inc. ● | 10,067 | ||||||
| 102 | PVH Corp. | 7,952 | ||||||
| 705 | Sega Sammy Holdings, Inc. | 14,333 | ||||||
| 162 | Tempur-Pedic International, Inc. ● | 3,781 | ||||||
| 228 | True Religion Apparel, Inc. ● | 6,607 | ||||||
| 69 | V.F. Corp. | 9,168 | ||||||
| 150,908 | ||||||||
| Consumer Services - 1.4% | ||||||||
| 56 | Buffalo Wild Wings, Inc. ● | 4,820 | ||||||
| 50 | Burger King Worldwide, Inc. | 754 | ||||||
| 439 | Compass Group plc | 4,609 | ||||||
| 479 | Ctrip.com International Ltd. ADR ● | 8,020 | ||||||
| 282 | DeVry, Inc. | 8,721 | ||||||
| 847 | Dunkin' Brands Group, Inc. | 29,102 | ||||||
| 1,616 | Genting Berhad | 4,825 | ||||||
| 295 | ITT Educational Services, Inc. ● | 17,938 | ||||||
| 84 | Marriott International, Inc. Class A | 3,281 | ||||||
| 2,327 | Sands China Ltd. § | 7,487 | ||||||
| 130 | Starbucks Corp. | 6,911 | ||||||
| 276 | Tim Hortons, Inc. ☼ | 14,560 | ||||||
| 579 | Wynn Macau Ltd. | 1,365 | ||||||
| 160 | Yum! Brands, Inc. | 10,320 | ||||||
| 122,713 | ||||||||
| Diversified Financials - 6.7% | ||||||||
| 371 | Ameriprise Financial, Inc. | 19,370 | ||||||
| 3,637 | Bank of America Corp. | 29,754 | ||||||
| 168 | BlackRock, Inc. | 28,540 | ||||||
| 4,577 | Citigroup, Inc. | 125,445 | ||||||
| 304 | Credit Suisse Group AG | 5,569 | ||||||
| 245 | Discover Financial Services, Inc. | 8,483 | ||||||
| 2,560 | GAM Holding Ltd. | 28,583 | ||||||
| 448 | Goldman Sachs Group, Inc. | 42,917 | ||||||
| 7,311 | ING Groep N.V. ● | 49,015 | ||||||
| 5,922 | JP Morgan Chase & Co. | 211,601 | ||||||
| 330 | Justice Holdings Ltd. ⌂●† | 4,940 | ||||||
| 377 | Nasdaq OMX Group, Inc. ● | 8,542 | ||||||
| 274 | NYSE Euronext | 7,009 | ||||||
| 69 | Oaktree Capital ●† | 2,324 | ||||||
| 69 | Oaktree Capital ⌂■●† | 2,324 | ||||||
| 75 | Solar Cayman Ltd. ⌂■●† | 7 | ||||||
The accompanying notes are an integral part of these financial statements.
| 5 |
| Hartford Capital Appreciation HLS Fund |
| Schedule of Investments – (continued) |
| June 30, 2012 (Unaudited) |
| (000’s Omitted) |
| Shares or Principal Amount | Market Value ╪ | |||||||
| COMMON STOCKS - 97.4% - (continued) | ||||||||
| Diversified Financials - 6.7% - (continued) | ||||||||
| 401 | Waddell and Reed Financial, Inc. Class A w/ Rights | $ | 12,142 | |||||
| 586,565 | ||||||||
| Energy - 8.8% | ||||||||
| 859 | Anadarko Petroleum Corp. | 56,890 | ||||||
| 52 | Apache Corp. | 4,597 | ||||||
| 217 | Atwood Oceanics, Inc. ● | 8,211 | ||||||
| 599 | Baker Hughes, Inc. | 24,628 | ||||||
| 1,369 | BG Group plc | 28,022 | ||||||
| 241 | Cabot Oil & Gas Corp. | 9,515 | ||||||
| 101 | Cameco Corp. | 2,220 | ||||||
| 163 | Cameron International Corp. ● | 6,970 | ||||||
| 315 | Canadian Natural Resources Ltd. ADR | 8,468 | ||||||
| 1,668 | Cheniere Energy, Inc. ● | 24,583 | ||||||
| 3,408 | Chesapeake Energy Corp. | 63,393 | ||||||
| 2,094 | Cobalt International Energy ● | 49,208 | ||||||
| 218 | Consol Energy, Inc. | 6,581 | ||||||
| 84 | Diamond Offshore Drilling, Inc. | 4,945 | ||||||
| 256 | EnCana Corp. | 5,339 | ||||||
| 2,051 | Ensco plc | 96,357 | ||||||
| 53 | EOG Resources, Inc. | 4,805 | ||||||
| 1,032 | Halliburton Co. | 29,304 | ||||||
| 1,056 | Imperial Oil Ltd. | 44,069 | ||||||
| 1 | Inpex Corp. | 6,268 | ||||||
| 6,229 | JX Holdings, Inc. | 32,103 | ||||||
| 1,909 | Karoon Gas Australia Ltd. ● | 8,015 | ||||||
| 391 | Kior, Inc. ● | 3,495 | ||||||
| 618 | Lone Pine Resources, Inc. ● | 1,700 | ||||||
| 506 | McDermott International, Inc. ● | 5,636 | ||||||
| 387 | Newfield Exploration Co. ● | 11,353 | ||||||
| 100 | Noble Corp. | 3,253 | ||||||
| 443 | Occidental Petroleum Corp. | 37,960 | ||||||
| 383 | Patterson-UTI Energy, Inc. | 5,569 | ||||||
| 2,578 | Petroleo Brasileiro S.A. ADR | 48,382 | ||||||
| 2,473 | Petroleum Geo-Services ● | 30,225 | ||||||
| 100 | QEP Resources, Inc. | 2,995 | ||||||
| 527 | Repsol YPF S.A. | 8,471 | ||||||
| 224 | Repsol YPF S.A. Rights | 157 | ||||||
| 139 | Royal Dutch Shell plc ADR | 9,382 | ||||||
| 841 | Southwestern Energy Co. ● | 26,841 | ||||||
| 329 | Statoil ASA | 7,838 | ||||||
| 211 | Superior Energy Services, Inc. ● | 4,259 | ||||||
| 195 | Tesoro Corp. ● | 4,865 | ||||||
| 231 | TGS Nopec Geophysical Co. ASA | 6,227 | ||||||
| 58 | Transocean, Inc. | 2,608 | ||||||
| 158 | Tsakos Energy Navigation Ltd. | 770 | ||||||
| 66 | Tullow Oil plc | 1,521 | ||||||
| 1,553 | Uranium One, Inc. ● | 3,951 | ||||||
| 347 | Valero Energy Corp. | 8,384 | ||||||
| 213 | Whiting Petroleum Corp. ● | 8,769 | ||||||
| 769,102 | ||||||||
| Food & Staples Retailing - 0.7% | ||||||||
| 1,074 | CVS Caremark Corp. | 50,167 | ||||||
| 1,206 | Tesco plc | 5,859 | ||||||
| 132 | Wal-Mart Stores, Inc. | 9,212 | ||||||
| 65,238 | ||||||||
| Food, Beverage & Tobacco - 2.8% | ||||||||
| 346 | Archer Daniels Midland Co. | 10,200 | ||||||
| 144 | Coca-Cola Co. | 11,240 | ||||||
| 91 | Diageo plc ADR | 9,383 | ||||||
| 155 | Dr. Pepper Snapple Group | 6,781 | ||||||
| 393 | Green Mountain Coffee Roasters, Inc. ● | 8,559 | ||||||
| 462 | Groupe Danone | 28,702 | ||||||
| 966 | Grupo Modelo S.A.B. | 8,541 | ||||||
| 919 | Kraft Foods, Inc. | 35,506 | ||||||
| 64 | Lorillard, Inc. | 8,436 | ||||||
| 856 | Maple Leaf Foods, Inc. w/ Rights | 9,844 | ||||||
| 422 | Molson Coors Brewing Co. | 17,579 | ||||||
| 467 | PepsiCo, Inc. | 33,014 | ||||||
| 220 | Philip Morris International, Inc. | 19,202 | ||||||
| 1,677 | Smithfield Foods, Inc. ● | 36,273 | ||||||
| 243,260 | ||||||||
| Health Care Equipment & Services - 4.8% | ||||||||
| 74 | Aetna, Inc. | 2,855 | ||||||
| 124 | AmerisourceBergen Corp. | 4,890 | ||||||
| 587 | Cardinal Health, Inc. | 24,639 | ||||||
| 8,276 | CareView Communications, Inc. ● | 11,172 | ||||||
| 112 | Cie Generale d'Optique Essilor International S.A. | 10,440 | ||||||
| 1,542 | CIGNA Corp. | 67,826 | ||||||
| 929 | Covidien plc | 49,712 | ||||||
| 144 | Edwards Lifesciences Corp. ● | 14,881 | ||||||
| 37 | Heartware International, Inc. ● | 3,302 | ||||||
| 3,594 | Hologic, Inc. ● | 64,840 | ||||||
| 40 | Humana, Inc. | 3,059 | ||||||
| 17 | Intuitive Surgical, Inc. ● | 9,389 | ||||||
| 1,209 | Medtronic, Inc. | 46,833 | ||||||
| 627 | St. Jude Medical, Inc. | 25,040 | ||||||
| 118 | SXC Health Solutions Corp. ● | 11,660 | ||||||
| 793 | UnitedHealth Group, Inc. | 46,403 | ||||||
| 532 | Universal Health Services, Inc. Class B | 22,961 | ||||||
| 419,902 | ||||||||
| Household & Personal Products - 0.2% | ||||||||
| 110 | Energizer Holdings, Inc. ● | 8,308 | ||||||
| 122 | Herbalife Ltd. | 5,872 | ||||||
| 14,180 | ||||||||
| Insurance - 2.9% | ||||||||
| 125 | ACE Ltd. | 9,295 | ||||||
| 1,840 | Aflac, Inc. | 78,380 | ||||||
| 1,453 | AIA Group Ltd. | 5,017 | ||||||
| 2,262 | American International Group, Inc. ● | 72,594 | ||||||
| 686 | Assured Guaranty Ltd. | 9,675 | ||||||
| 1,930 | China Pacific Insurance | 6,298 | ||||||
| 297 | Principal Financial Group, Inc. | 7,777 | ||||||
| 332 | Progressive Corp. | 6,915 | ||||||
| 349 | Prudential plc | 4,041 | ||||||
| 227 | Reinsurance Group of America, Inc. | 12,087 | ||||||
| 98 | StanCorp Financial Group, Inc. | 3,656 | ||||||
| 212 | Swiss Re Ltd. | 13,392 | ||||||
| 784 | Unum Group | 15,000 | ||||||
| 33 | Zurich Financial Services AG | 7,471 | ||||||
| 251,598 | ||||||||
| Materials - 5.0% | ||||||||
| 54 | Agrium U.S., Inc. | 4,742 | ||||||
| 157 | Air Liquide | 17,999 | ||||||
| 137 | Akzo Nobel N.V. | 6,431 | ||||||
| 642 | AngloGold Ltd. ADR | 22,033 | ||||||
| 150 | Ball Corp. | 6,171 | ||||||
The accompanying notes are an integral part of these financial statements.
| 6 |
| Shares or Principal Amount | Market Value ╪ | |||||||
| COMMON STOCKS - 97.4% - (continued) | ||||||||
| Materials - 5.0% - (continued) | ||||||||
| 449 | Barrick Gold Corp. | $ | 16,858 | |||||
| 71 | BASF SE | 4,905 | ||||||
| 592 | Cabot Corp. | 24,095 | ||||||
| 256 | Celanese Corp. | 8,857 | ||||||
| 268 | CRH plc | 5,171 | ||||||
| 334 | Detour Gold Corp. ●☼ | 6,730 | ||||||
| 4,468 | Dow Chemical Co. | 140,734 | ||||||
| 181 | Fortescue Metals Group Ltd. | 927 | ||||||
| 11 | Givaudan | 10,394 | ||||||
| 7,121 | Glencore International plc | 33,024 | ||||||
| 199 | International Paper Co. | 5,750 | ||||||
| 218 | JSR Corp. | 3,783 | ||||||
| 409 | Louisiana-Pacific Corp. ● | 4,454 | ||||||
| 456 | Lundin Mining Corp. ● | 1,890 | ||||||
| 698 | Methanex Corp. ADR | 19,427 | ||||||
| 714 | Molycorp, Inc. ● | 15,390 | ||||||
| 394 | Mosaic Co. | 21,552 | ||||||
| 933 | Norbord, Inc. ● | 12,130 | ||||||
| 894 | Petronas Chemicals Group Bhd. | 1,833 | ||||||
| 11,937 | PTT Chemical Public Co., Ltd. ● | 21,038 | ||||||
| 83 | Rio Tinto plc ADR | 3,988 | ||||||
| 206 | Sealed Air Corp. | 3,176 | ||||||
| 1,970 | Sino Forest Corp. Class A ⌂●† | — | ||||||
| 1,600 | TSRC Corp. | 3,966 | ||||||
| 214 | Umicore | 9,887 | ||||||
| 437,335 | ||||||||
| Media - 3.5% | ||||||||
| 204 | CBS Corp. Class B | 6,674 | ||||||
| 844 | Comcast Corp. Class A | 26,988 | ||||||
| 180 | Comcast Corp. Special Class A | 5,664 | ||||||
| 479 | DirecTV Class A ● | 23,391 | ||||||
| 30 | Harvey Weinstein Co. Holdings Class A-1 ⌂●†∞ | — | ||||||
| 210 | Liberty Global, Inc. ● | 10,437 | ||||||
| 165 | Naspers Ltd. | 8,798 | ||||||
| 719 | Omnicom Group, Inc. | 34,956 | ||||||
| 76 | Publicis Groupe | 3,475 | ||||||
| 2,869 | Sirius XM Radio, Inc. w/ Rights ● | 5,307 | ||||||
| 291 | Time Warner, Inc. | 11,215 | ||||||
| 1,675 | Viacom, Inc. Class B | 78,769 | ||||||
| 1,989 | Walt Disney Co. | 96,486 | ||||||
| 312,160 | ||||||||
| Pharmaceuticals, Biotechnology & Life Sciences - 7.9% | ||||||||
| 100 | Abbott Laboratories | 6,441 | ||||||
| 1,248 | Agilent Technologies, Inc. | 48,964 | ||||||
| 183 | Alkermes plc ● | 3,100 | ||||||
| 753 | Almirall S.A. | 5,393 | ||||||
| 387 | Amgen, Inc. | 28,236 | ||||||
| 121 | Amylin Pharmaceuticals, Inc. ● | 3,427 | ||||||
| 533 | Arena Pharmaceuticals, Inc. ● | 5,320 | ||||||
| 165 | Auxilium Pharmaceuticals, Inc. ● | 4,430 | ||||||
| 1,570 | Avanir Pharmaceuticals ● | 6,156 | ||||||
| 156 | Biogen Idec, Inc. ● | 22,508 | ||||||
| 476 | Bristol-Myers Squibb Co. | 17,116 | ||||||
| 278 | Bruker Corp. ● | 3,702 | ||||||
| 96 | Celgene Corp. ● | 6,168 | ||||||
| 124 | Cubist Pharmaceuticals, Inc. ● | 4,716 | ||||||
| 976 | Daiichi Sankyo Co., Ltd. | 16,453 | ||||||
| 1,166 | Elan Corp. plc ADR ● | 17,015 | ||||||
| 2,001 | Gilead Sciences, Inc. ● | 102,605 | ||||||
| 1,080 | Johnson & Johnson | 72,995 | ||||||
| 323 | Life Technologies Corp. ● | 14,534 | ||||||
| 265 | Map Pharmaceuticals, Inc. ● | 3,968 | ||||||
| 1,038 | Merck & Co., Inc. | 43,353 | ||||||
| 178 | Mylan, Inc. ● | 3,806 | ||||||
| 22 | Onyx Pharmaceuticals, Inc. ● | 1,462 | ||||||
| 55 | Regeneron Pharmaceuticals, Inc. ● | 6,328 | ||||||
| 262 | Roche Holding AG | 45,192 | ||||||
| 70 | Salix Pharmaceuticals Ltd. ● | 3,784 | ||||||
| 172 | Seattle Genetics, Inc. ● | 4,362 | ||||||
| 943 | Shionogi & Co., Ltd. | 12,815 | ||||||
| 3,695 | Teva Pharmaceutical Industries Ltd. ADR | 145,732 | ||||||
| 2,170 | TherapeuticsMD, Inc. ● | 6,077 | ||||||
| 167 | Waters Corp. ● | 13,289 | ||||||
| 71 | Watson Pharmaceuticals, Inc. ● | 5,268 | ||||||
| 784 | WuXi PharmaTech Cayman, Inc. ● | 11,066 | ||||||
| 695,781 | ||||||||
| Real Estate - 1.2% | ||||||||
| 678 | BR Malls Participacoes S.A. | 7,674 | ||||||
| 659 | CBRE Group, Inc. ● | 10,788 | ||||||
| 146 | Daito Trust Construction Co., Ltd. | 13,858 | ||||||
| 431 | Host Hotels & Resorts, Inc. | 6,820 | ||||||
| 80 | Unibail-Rodamco SE | 14,676 | ||||||
| 3,888 | Westfield Group | 38,073 | ||||||
| 461 | Weyerhaeuser Co. | 10,297 | ||||||
| 102,186 | ||||||||
| Retailing - 6.8% | ||||||||
| 945 | Abercrombie & Fitch Co. Class A | 32,259 | ||||||
| 150 | Advance Automotive Parts, Inc. | 10,247 | ||||||
| 8,452 | Allstar Co. ⌂† | 12,438 | ||||||
| 157 | Amazon.com, Inc. ● | 35,909 | ||||||
| 170 | AutoZone, Inc. ● | 62,346 | ||||||
| 120 | Bed Bath & Beyond, Inc. ● | 7,391 | ||||||
| 29,055 | Buck Holdings L.P. ⌂●† | 52,927 | ||||||
| 292 | Buckle (The), Inc. | 11,568 | ||||||
| 403 | CarMax, Inc. ● | 10,456 | ||||||
| 407 | Chico's FAS, Inc. | 6,043 | ||||||
| 141 | Cia Hering | 2,685 | ||||||
| 67 | Dollar General Corp. ● | 3,655 | ||||||
| 84 | Dollarama, Inc. | 5,045 | ||||||
| 100 | DSW, Inc. | 5,428 | ||||||
| 662 | Express, Inc. ● | 12,034 | ||||||
| 592 | Family Dollar Stores, Inc. | 39,369 | ||||||
| 306 | GameStop Corp. Class A | 5,627 | ||||||
| 821 | Gap, Inc. | 22,463 | ||||||
| 216 | GNC Holdings, Inc. | 8,463 | ||||||
| 127 | HomeAway, Inc. ● | 2,754 | ||||||
| 509 | Kohl's Corp. | 23,142 | ||||||
| 1,638 | Liberty Media - Interactive A ● | 29,137 | ||||||
| 201 | LKQ Corp. ● | 6,707 | ||||||
| 2,383 | Lowe's Co., Inc. | 67,763 | ||||||
| 19 | Priceline.com, Inc. ● | 12,320 | ||||||
| 31 | Rent-A-Center, Inc. | 1,043 | ||||||
| 170 | Shutterfly, Inc. ● | 5,228 | ||||||
| 258 | Start Today Co., Ltd. | 3,603 | ||||||
| 531 | Target Corp. | 30,891 | ||||||
| 1,519 | TJX Cos., Inc. | 65,218 | ||||||
| 180 | Urban Outfitters, Inc. ● | 4,959 | ||||||
| 599,118 | ||||||||
The accompanying notes are an integral part of these financial statements.
| 7 |
| Hartford Capital Appreciation HLS Fund |
| Schedule of Investments – (continued) |
| June 30, 2012 (Unaudited) |
| (000’s Omitted) |
| Shares or Principal Amount | Market Value ╪ | |||||||
| COMMON STOCKS - 97.4% - (continued) | ||||||||
| Semiconductors & Semiconductor Equipment - 1.5% | ||||||||
| 263 | Altera Corp. | $ | 8,891 | |||||
| 30 | Broadcom Corp. Class A | 1,009 | ||||||
| 133 | Cree, Inc. ● | 3,418 | ||||||
| 412 | Cypress Semiconductor Corp. | 5,452 | ||||||
| 1,109 | Infineon Technologies AG | 7,505 | ||||||
| 180 | Maxim Integrated Products, Inc. | 4,608 | ||||||
| 1,398 | RF Micro Devices, Inc. ● | 5,943 | ||||||
| 45 | Samsung Electronics Co., Ltd. | 48,115 | ||||||
| 443 | Skyworks Solutions, Inc. ● | 12,113 | ||||||
| 3,475 | Taiwan Semiconductor Manufacturing Co., Ltd. | 9,513 | ||||||
| 1,167 | Teradyne, Inc. ● | 16,405 | ||||||
| 329 | Xilinx, Inc. | 11,038 | ||||||
| 134,010 | ||||||||
| Software & Services - 11.1% | ||||||||
| 140 | Accenture plc | 8,401 | ||||||
| 4,472 | Activision Blizzard, Inc. | 53,621 | ||||||
| 131 | ANSYS, Inc. ● | 8,274 | ||||||
| 239 | Automatic Data Processing, Inc. | 13,299 | ||||||
| 147 | BMC Software, Inc. ● | 6,281 | ||||||
| 697 | Booz Allen Hamilton Holding Corp. | 10,657 | ||||||
| 840 | Cadence Design Systems, Inc. ● | 9,226 | ||||||
| 119 | Check Point Software Technologies Ltd. ADR ● | 5,895 | ||||||
| 386 | Cognizant Technology Solutions Corp. ● | 23,150 | ||||||
| 143 | Concur Technologies, Inc. ● | 9,766 | ||||||
| 86 | DeNa Co., Ltd. | 2,256 | ||||||
| 218 | Dropbox, Inc. ⌂●† | 1,775 | ||||||
| 2,086 | eBay, Inc. ● | 87,643 | ||||||
| 16 | Electronic Arts, Inc. ● | 196 | ||||||
| 352 | Equinix, Inc. ● | 61,904 | ||||||
| 170 | Facebook, Inc. ● | 5,291 | ||||||
| 150 | Fiserv, Inc. ● | 10,847 | ||||||
| 2,099 | Genpact Ltd. ● | 34,910 | ||||||
| 234 | Global Payments, Inc. | 10,103 | ||||||
| 99 | Google, Inc. ● | 57,542 | ||||||
| 237 | IAC/InterActiveCorp. | 10,830 | ||||||
| 80 | IBM Corp. | 15,627 | ||||||
| 481 | iGate Corp. ● | 8,178 | ||||||
| 102 | Imperva, Inc. ● | 2,943 | ||||||
| 179 | Intuit, Inc. | 10,647 | ||||||
| 74 | Kakaku.com, Inc. | 2,504 | ||||||
| 166 | LinkedIn Corp. ● | 17,653 | ||||||
| 12 | Mastercard, Inc. | 5,290 | ||||||
| 5,905 | Microsoft Corp. | 180,644 | ||||||
| 16 | Netease.com, Inc. ● | 947 | ||||||
| 5,062 | Oracle Corp. | 150,336 | ||||||
| 226 | Paychex, Inc. | 7,109 | ||||||
| 237 | Rovi Corp. ● | 4,656 | ||||||
| 78 | Salesforce.com, Inc. ● | 10,780 | ||||||
| 89 | Splunk, Inc. ‡ | 2,513 | ||||||
| 65 | Teradata Corp. ● | 4,682 | ||||||
| 154 | Tibco Software, Inc. ● | 4,620 | ||||||
| 667 | TiVo, Inc. ● | 5,514 | ||||||
| 352 | VeriFone Systems, Inc. ● | 11,642 | ||||||
| 559 | VeriSign, Inc. | 24,364 | ||||||
| 3,425 | Western Union Co. | 57,670 | ||||||
| 86 | Wright Express Corp. ● | 5,308 | ||||||
| 535 | Yandex N.V. ● | 10,198 | ||||||
| 975,692 | ||||||||
| Technology Hardware & Equipment - 7.3% | ||||||||
| 481 | Acme Packet, Inc. ● | 8,965 | ||||||
| 414 | Apple, Inc. ● | 241,583 | ||||||
| 340 | Arrow Electronics, Inc. ● | 11,169 | ||||||
| 1,467 | Aruba Networks, Inc. ● | 22,071 | ||||||
| 155 | Canon, Inc. | 6,170 | ||||||
| 1,574 | Ciena Corp. ● | 25,768 | ||||||
| 4,713 | Cisco Systems, Inc. | 80,923 | ||||||
| 131 | Dell, Inc. ● | 1,639 | ||||||
| 2,221 | EMC Corp. ● | 56,934 | ||||||
| 301 | Emulex Corp. ● | 2,168 | ||||||
| 1,647 | Flextronics International Ltd. ● | 10,209 | ||||||
| 300 | Harris Corp. | 12,570 | ||||||
| 261 | Hewlett-Packard Co. | 5,255 | ||||||
| 22,497 | Hon Hai Precision Industry Co., Ltd. | 68,020 | ||||||
| 398 | Jabil Circuit, Inc. | 8,085 | ||||||
| 1,207 | JDS Uniphase Corp. ● | 13,280 | ||||||
| 891 | Juniper Networks, Inc. ● | 14,528 | ||||||
| 5,196 | Legend Holdings Ltd. | 4,434 | ||||||
| 270 | NetApp, Inc. ● | 8,578 | ||||||
| 487 | QLogic Corp. ● | 6,665 | ||||||
| 102 | Qualcomm, Inc. | 5,665 | ||||||
| 128 | SanDisk Corp. ● | 4,661 | ||||||
| 195 | Trimble Navigation Ltd. ● | 8,970 | ||||||
| 244 | Universal Display Corp. ● | 8,784 | ||||||
| 637,094 | ||||||||
| Telecommunication Services - 0.7% | ||||||||
| 1,722 | NII Holdings, Inc. Class B ● | 17,619 | ||||||
| 352 | SoftBank Corp. | 13,098 | ||||||
| 1,723 | Sprint Nextel Corp. ● | 5,617 | ||||||
| 511 | Tele2 Ab B Shares | 7,910 | ||||||
| 594 | Telenor ASA | 9,934 | ||||||
| 286 | Vodafone Group plc ADR | 8,052 | ||||||
| 62,230 | ||||||||
| Transportation - 7.4% | ||||||||
| 23,412 | AirAsia Berhad | 26,499 | ||||||
| 103 | C.H. Robinson Worldwide, Inc. | 6,018 | ||||||
| 192 | Canadian National Railway Co. | 16,212 | ||||||
| 507 | Canadian Pacific Railway Ltd. ADR | 37,150 | ||||||
| 1,162 | CSX Corp. | 25,982 | ||||||
| 9,334 | Delta Air Lines, Inc. ● | 102,208 | ||||||
| 145 | Expeditors International of Washington, Inc. | 5,615 | ||||||
| 1,057 | FedEx Corp. | 96,868 | ||||||
| 4,289 | Hertz Global Holdings, Inc. ● | 54,903 | ||||||
| 6,314 | JetBlue Airways Corp. ● | 33,467 | ||||||
| 663 | Knight Transportation, Inc. | 10,605 | ||||||
| 248 | Localiza Rent a Car S.A. | 3,735 | ||||||
| 189 | Norfolk Southern Corp. | 13,543 | ||||||
| 1,327 | Toll Holdings Ltd. | 5,457 | ||||||
| 7,191 | United Continental Holdings, Inc. ● | 174,966 | ||||||
| 484 | United Parcel Service, Inc. Class B | 38,089 | ||||||
| 651,317 | ||||||||
| Utilities - 0.5% | ||||||||
| 364 | Companhia Energetica de Minas Gerais ADR | 6,700 | ||||||
| 2,854 | ENN Energy Holdings Ltd. | 10,075 | ||||||
| 186 | Entergy Corp. | 12,656 | ||||||
The accompanying notes are an integral part of these financial statements.
| 8 |
| Shares or Principal Amount | Market Value ╪ | |||||||
| COMMON STOCKS - 97.4% - (continued) | ||||||||
| Utilities - 0.5% - (continued) | ||||||||
| 338 | UGI Corp. | $ | 9,933 | |||||
| 325 | Xcel Energy, Inc. | 9,228 | ||||||
| 48,592 | ||||||||
| Total common stocks | ||||||||
| (cost $8,472,187) | $ | 8,554,227 | ||||||
| WARRANTS - 0.0% | ||||||||
| Pharmaceuticals, Biotechnology & Life Sciences - 0.0% | ||||||||
| 510 | Novavax, Inc. ⌂● | $ | — | |||||
| Total warrants | ||||||||
| (cost $–) | $ | — | ||||||
| CORPORATE BONDS - 0.4% | ||||||||
| Finance and Insurance - 0.4% | ||||||||
| MBIA Insurance Co. | ||||||||
| $ | 53,500 | 14.00%, 01/15/2033 ■Δ | $ | 28,890 | ||||
| Total corporate bonds | ||||||||
| (cost $53,140) | $ | 28,890 | ||||||
| Contracts | Market Value ╪ | |||||||
| PUT OPTIONS PURCHASED - 0.0% | ||||||||
| Equity Contracts - 0.0% | ||||||||
| Apple, Inc. Option | ||||||||
| — | Expiration: 08/18/2012, Exercise Price: $560.00 | $ | 479 | |||||
| Total put options purchased | ||||||||
| (cost $619) | $ | 479 | ||||||
| Total long-term investments | ||||||||
| (cost $8,525,946) | $ | 8,583,596 | ||||||
| Shares or Principal Amount | Market Value ╪ | |||||||||
| SHORT-TERM INVESTMENTS - 1.8% | ||||||||||
| Repurchase Agreements - 1.8% | ||||||||||
| Bank of America Merrill Lynch TriParty Joint Repurchase Agreement (maturing on 07/02/2012 in the amount of $84,510, collateralized by FHLMC 5.50% - 6.50%, 2035 - 2036, FNMA 5.00% - 6.00%, 2033 - 2039, value of $86,199) | ||||||||||
| $ | 84,509 | 0.13%, 06/29/2012 | $ | 84,509 | ||||||
| Barclays Capital TriParty Joint Repurchase Agreement (maturing on 07/02/2012 in the amount of $30,553, collateralized by U.S. Treasury Note 1.25% - 3.63%, 2014 - 2020, value of $31,163) | ||||||||||
| 30,552 | 0.15%, 06/29/2012 | 30,552 | ||||||||
| Deutsche Bank Securities TriParty Joint Repurchase Agreement (maturing on 07/02/2012 in the amount of $8,186, collateralized by U.S. Treasury Note 0.88%, 2016, value of $8,349) | ||||||||||
| 8,186 | 0.20%, 06/29/2012 | 8,186 | ||||||||
| TD Securities TriParty Joint Repurchase Agreement (maturing on 07/02/2012 in the amount of $23,923, collateralized by FHLMC 4.00% - 6.00%, 2027 - 2041, FNMA 4.00% - 4.50%, 2025 - 2042, U.S. Treasury Bond 6.38%, 2027, U.S. Treasury Note 0.38% - 8.75%, 2012 - 2017, value of $24,401) | ||||||||||
| 23,923 | 0.15%, 06/29/2012 | 23,923 | ||||||||
| UBS Securities, Inc. Joint Repurchase Agreement (maturing on 07/02/2012 in the amount of $8, collateralized by U.S. Treasury Note 1.00%, 2013, value of $9) | ||||||||||
| 8 | 0.13%, 06/29/2012 | 8 | ||||||||
| UBS Securities, Inc. TriParty Joint Repurchase Agreement (maturing on 07/02/2012 in the amount of $10,780, collateralized by GNMA 4.00%, 2042, value of $10,995) | ||||||||||
| 10,780 | 0.20%, 06/29/2012 | 10,780 | ||||||||
| 157,958 | ||||||||||
| Total short-term investments | ||||||||||
| (cost $157,958) | $ | 157,958 | ||||||||
| Total investments | ||||||||||
| (cost $8,683,904) ▲ | 99.6 | % | $ | 8,741,554 | ||||||
| Other assets and liabilities | 0.4 | % | 39,170 | |||||||
| Total net assets | 100.0 | % | $ | 8,780,724 | ||||||
The accompanying notes are an integral part of these financial statements.
| 9 |
| Hartford Capital Appreciation HLS Fund |
| Schedule of Investments – (continued) |
| June 30, 2012 (Unaudited) |
| (000’s Omitted) |
| Note: | Percentage of investments as shown is the ratio of the total market value to total net assets. |
Prices of foreign equities that are principally traded on certain foreign markets may be adjusted daily pursuant to a fair value pricing service approved by the Board of Directors in order to reflect an adjustment for factors occurring after the close of certain foreign markets but before the close of the New York Stock Exchange.
| ▲ | At June 30, 2012, the cost of securities for federal income tax purposes was $8,955,715 and the aggregate gross unrealized appreciation and depreciation based on that cost were: |
| Unrealized Appreciation | $ | 704,302 | ||
| Unrealized Depreciation | (918,463 | ) | ||
| Net Unrealized Depreciation | $ | (214,161 | ) |
| † | These securities were valued in good faith at fair value as determined under policies and procedures established by and under the supervision of the Company's Board of Directors. At June 30, 2012, the aggregate value of these securities was $76,735, which represents 0.9% of total net assets. This amount excludes securities that are principally traded in certain foreign markets and whose prices are adjusted pursuant to a third party pricing service methodology approved by the Board of Directors. |
| ● | Non-income producing. |
| Δ | Variable rate securities; the rate reported is the coupon rate in effect at June 30, 2012. |
| ■ | Securities issued within terms of a private placement memorandum, exempt from registration under Rule 144A under the Securities Act of 1933, as amended, and may be sold only to qualified institutional buyers. Unless otherwise indicated, these issues are determined to be liquid. At June 30, 2012, the aggregate value of these securities was $31,221, which represents 0.4% of total net assets. |
| § | These securities were sold to the Fund under Regulation S, rules governing offers and sales made outside the United States without registration under the Securities Act of 1933. The Fund may only be able to resell these securities in the United States if an exemption from registration under the federal and state securities laws is available, or the Fund may only be able to sell these securities outside of the United States (such as on a foreign exchange) to a non-U.S. person. Unless otherwise indicated, these holdings are determined to be liquid. At June 30, 2012, the aggregate value of these securities was $7,487, which represents 0.1% of total net assets. |
| ∞ | Securities exempt from registration under Regulation D of the Securities Act of 1933. The Fund may only be able to resell these securities if they are subsequently registered or if an exemption from registration under the federal and state securities laws is available. Unless otherwise indicated, these holdings are determined to be liquid. At June 30, 2012, the aggregate value and percentage of net assets of these securities rounds to zero. |
| ⌂ | The following securities are considered illiquid. Illiquid securities are often purchased in private placement transactions, are often not registered under the Securities Act of 1933 and may have contractual restrictions on resale. A security may also be considered illiquid if the security lacks a readily available market or if its valuation has not changed for a certain period of time. |
| Period Acquired | Shares/ Par | Security | Cost Basis | ||||||||
| 08/2011 | 8,452 | Allstar Co. | 8,604 | ||||||||
| 06/2007 | 29,055 | Buck Holdings L.P. | 10,623 | ||||||||
| 05/2012 | 218 | Dropbox, Inc. | 1,972 | ||||||||
| 10/2005 | 30 | Harvey Weinstein Co. Holdings Class A-1 - Reg D | 27,951 | ||||||||
| 02/2011-09/2011 | 330 | Justice Holdings Ltd. | 5,282 | ||||||||
| 07/2008 | 510 | Novavax, Inc. Warrants | – | ||||||||
| 10/2008-06/2012 | 69 | Oaktree Capital - 144A | 1,302 | ||||||||
| 01/2010 - 07/2011 | 1,970 | Sino Forest Corp. Class A | 33,397 | ||||||||
| 03/2007 | 75 | Solar Cayman Ltd. - 144A | 22 | ||||||||
At June 30, 2012, the aggregate value of these securities was $74,411, which represents 0.8% of total net assets.
| ☼ | This security, or a portion of this security, was purchased on a when-issued, delayed delivery or delayed draw basis. The cost of these securities was $1,338 at June 30, 2012. |
| ‡ | This security, or a portion of this security, has been segregated to cover funding requirements on investment transactions settling in the future. |
The accompanying notes are an integral part of these financial statements.
| 10 |
Foreign Currency Contracts Outstanding at June 30, 2012 |
| Description | Counterparty | Buy / Sell | Market Value ╪ | Contract Amount | Delivery Date | Unrealized Appreciation/ (Depreciation) | ||||||||||||
| AUD | BNP | Buy | $ | 182 | $ | 181 | 07/03/2012 | $ | 1 | |||||||||
| AUD | CBK | Sell | 4,895 | 4,650 | 09/06/2012 | (245 | ) | |||||||||||
| AUD | CSFB | Buy | 879 | 864 | 07/03/2012 | 15 | ||||||||||||
| AUD | DEUT | Sell | 390 | 383 | 07/02/2012 | (7 | ) | |||||||||||
| CAD | BCLY | Buy | 1,338 | 1,321 | 07/03/2012 | 17 | ||||||||||||
| CAD | CSFB | Sell | 2,101 | 2,139 | 08/09/2012 | 38 | ||||||||||||
| CAD | GSC | Sell | 7,965 | 8,114 | 08/09/2012 | 149 | ||||||||||||
| CAD | UBS | Sell | 5,864 | 5,971 | 08/09/2012 | 107 | ||||||||||||
| CHF | SCB | Sell | 674 | 661 | 07/03/2012 | (13 | ) | |||||||||||
| CHF | SSG | Sell | 571 | 563 | 07/02/2012 | (8 | ) | |||||||||||
| DKK | JPM | Sell | 401 | 394 | 07/03/2012 | (7 | ) | |||||||||||
| DKK | SSG | Sell | 279 | 275 | 07/02/2012 | (4 | ) | |||||||||||
| EUR | BCLY | Sell | 43,955 | 44,834 | 12/14/2012 | 879 | ||||||||||||
| EUR | BNP | Buy | 4,716 | 4,718 | 07/03/2012 | (2 | ) | |||||||||||
| EUR | CBK | Sell | 55,459 | 56,641 | 12/14/2012 | 1,182 | ||||||||||||
| EUR | CSFB | Sell | 69,006 | 69,507 | 12/14/2012 | 501 | ||||||||||||
| EUR | DEUT | Sell | 56,806 | 57,918 | 12/14/2012 | 1,112 | ||||||||||||
| EUR | MSC | Buy | 19,443 | 19,308 | 12/14/2012 | 135 | ||||||||||||
| EUR | MSC | Sell | 47,752 | 48,256 | 12/14/2012 | 504 | ||||||||||||
| EUR | SSG | Buy | 506 | 499 | 07/02/2012 | 7 | ||||||||||||
| EUR | SSG | Sell | 854 | 842 | 07/02/2012 | (12 | ) | |||||||||||
| EUR | UBS | Sell | 51,616 | 52,219 | 12/14/2012 | 603 | ||||||||||||
| GBP | BCLY | Sell | 1,327 | 1,326 | 07/05/2012 | (1 | ) | |||||||||||
| GBP | DEUT | Buy | 10,754 | 10,693 | 07/02/2012 | 61 | ||||||||||||
| GBP | DEUT | Sell | 591 | 588 | 07/02/2012 | (3 | ) | |||||||||||
| GBP | JPM | Buy | 1,739 | 1,719 | 07/03/2012 | 20 | ||||||||||||
| HKD | CBK | Sell | 1,584 | 1,584 | 07/03/2012 | – | ||||||||||||
| HKD | CSFB | Sell | 160 | 160 | 07/05/2012 | – | ||||||||||||
| JPY | BCLY | Buy | 31,706 | 30,424 | 12/14/2012 | 1,282 | ||||||||||||
| JPY | BCLY | Sell | 47,110 | 47,495 | 12/14/2012 | 385 | ||||||||||||
| JPY | BNP | Sell | 270 | 271 | 07/02/2012 | 1 | ||||||||||||
| JPY | BNP | Buy | 230 | 232 | 07/03/2012 | (2 | ) | |||||||||||
| JPY | CBK | Buy | 31,706 | 30,431 | 12/14/2012 | 1,275 | ||||||||||||
| JPY | CSFB | Buy | 31,705 | 30,370 | 12/14/2012 | 1,335 | ||||||||||||
| JPY | DEUT | Buy | 27,975 | 26,744 | 12/14/2012 | 1,231 | ||||||||||||
| JPY | DEUT | Sell | 62,087 | 61,567 | 12/14/2012 | (520 | ) | |||||||||||
| JPY | GSC | Sell | 106,176 | 105,303 | 12/14/2012 | (873 | ) | |||||||||||
| JPY | MSC | Buy | 31,705 | 30,338 | 12/14/2012 | 1,367 | ||||||||||||
| JPY | MSC | Sell | 62,087 | 61,722 | 12/14/2012 | (365 | ) | |||||||||||
| JPY | UBS | Buy | 31,701 | 30,402 | 12/14/2012 | 1,299 | ||||||||||||
| JPY | UBS | Sell | 61,993 | 61,630 | 12/14/2012 | (363 | ) | |||||||||||
| NOK | DEUT | Sell | 280 | 276 | 07/02/2012 | (4 | ) | |||||||||||
| $ | 11,077 | |||||||||||||||||
| ╪ | See Significant Accounting Policies of accompanying Notes to Financial Statements regarding valuation of securities. |
The accompanying notes are an integral part of these financial statements.
| 11 |
| Hartford Capital Appreciation HLS Fund |
| Schedule of Investments – (continued) |
| June 30, 2012 (Unaudited) |
| (000’s Omitted) |
| GLOSSARY: (abbreviations used in preceding Schedule of Investments) | |
| Counterparty Abbreviations: | |
| BCLY | Barclays |
| BNP | BNP Paribas Securities |
| CBK | Citibank NA |
| CSFB | Credit Suisse First Boston Corp. |
| DEUT | Deutsche Bank Securities, Inc. |
| GSC | Goldman Sachs & Co. |
| JPM | JP Morgan Chase & Co. |
| MSC | Morgan Stanley |
| SCB | Standard Chartered Bank |
| SSG | State Street Global Markets LLC |
| UBS | UBS AG |
| Currency Abbreviations: | |
| AUD | Australian Dollar |
| CAD | Canadian Dollar |
| CHF | Swiss Franc |
| DKK | Danish Krone |
| EUR | EURO |
| GBP | British Pound |
| HKD | Hong Kong Dollar |
| JPY | Japanese Yen |
| NOK | Norwegian Krone |
| Other Abbreviations: | |
| ADR | American Depositary Receipt |
| FHLMC | Federal Home Loan Mortgage Corp. |
| FNMA | Federal National Mortgage Association |
| GNMA | Government National Mortgage Association |
The accompanying notes are an integral part of these financial statements.
| 12 |
| Hartford Capital Appreciation HLS Fund |
| Investment Valuation Hierarchy Level Summary |
| June 30, 2012 (Unaudited) |
| (000’s Omitted) |
| Total | Level 1 ♦ | Level 2 ♦ | Level 3 | |||||||||||||
| Assets: | ||||||||||||||||
| Common Stocks | ||||||||||||||||
| Automobiles & Components | $ | 387,093 | $ | 364,019 | $ | 23,074 | $ | – | ||||||||
| Banks | 241,535 | 87,371 | 154,164 | – | ||||||||||||
| Capital Goods | 632,618 | 362,626 | 269,992 | – | ||||||||||||
| Commercial & Professional Services | 14,000 | 9,521 | 4,479 | – | ||||||||||||
| Consumer Durables & Apparel | 150,908 | 122,978 | 27,930 | – | ||||||||||||
| Consumer Services | 122,713 | 104,427 | 18,286 | – | ||||||||||||
| Diversified Financials | 586,565 | 493,803 | 88,107 | 4,655 | ||||||||||||
| Energy | 769,102 | 640,412 | 128,690 | – | ||||||||||||
| Food & Staples Retailing | 65,238 | 59,379 | 5,859 | – | ||||||||||||
| Food, Beverage & Tobacco | 243,260 | 214,558 | 28,702 | – | ||||||||||||
| Health Care Equipment & Services | 419,902 | 409,462 | 10,440 | – | ||||||||||||
| Household & Personal Products | 14,180 | 14,180 | – | – | ||||||||||||
| Insurance | 251,598 | 215,379 | 36,219 | – | ||||||||||||
| Materials | 437,335 | 339,015 | 98,320 | – | ||||||||||||
| Media | 312,160 | 299,887 | 12,273 | – | ||||||||||||
| Pharmaceuticals, Biotechnology & Life Sciences | 695,781 | 615,928 | 79,853 | – | ||||||||||||
| Real Estate | 102,186 | 35,579 | 66,607 | – | ||||||||||||
| Retailing | 599,118 | 530,150 | 3,603 | 65,365 | ||||||||||||
| Semiconductors & Semiconductor Equipment | 134,010 | 68,877 | 65,133 | – | ||||||||||||
| Software & Services | 975,692 | 969,157 | 4,760 | 1,775 | ||||||||||||
| Technology Hardware & Equipment | 637,094 | 558,470 | 78,624 | – | ||||||||||||
| Telecommunication Services | 62,230 | 31,288 | 30,942 | – | ||||||||||||
| Transportation | 651,317 | 619,361 | 31,956 | – | ||||||||||||
| Utilities | 48,592 | 38,517 | 10,075 | – | ||||||||||||
| Total | 8,554,227 | 7,204,344 | 1,278,088 | 71,795 | ||||||||||||
| Corporate Bonds | 28,890 | – | 28,890 | – | ||||||||||||
| Warrants | – | – | – | – | ||||||||||||
| Short-Term Investments | 157,958 | – | 157,958 | – | ||||||||||||
| Put Options Purchased | 479 | 479 | – | – | ||||||||||||
| Total | $ | 8,741,554 | $ | 7,204,823 | $ | 1,464,936 | $ | 71,795 | ||||||||
| Foreign Currency Contracts* | 13,506 | – | 13,506 | – | ||||||||||||
| Total | $ | 13,506 | $ | – | $ | 13,506 | $ | – | ||||||||
| Liabilities: | ||||||||||||||||
| Foreign Currency Contracts* | 2,429 | – | 2,429 | – | ||||||||||||
| Total | $ | 2,429 | $ | – | $ | 2,429 | $ | – | ||||||||
| ♦ | For the six-month period ended June 30, 2012, investments valued at $7,743 were transferred from Level 1 to Level 2, and there were no transfers from Level 2 to Level 1. Investments are transferred between Level 1 and Level 2 for a variety of reasons including, but not limited to: |
| 1) | Foreign equities for which a fair value price is more representative of exit value than the local market close (transfer into Level 2). Foreign equities for which the local market close is more representative of exit value (transfer into Level 1). |
| 2) | U.S. Treasury securities that no longer represent the most recent issue (transfer into Level 2). |
| 3) | Equity investments with no observable trading but a bid or close price is used (transfer into Level 2). Equity investments using observable quoted prices in an active market (transfer into Level 1). |
| * | Derivative instruments not reflected in the Schedule of Investments are valued at the unrealized appreciation/depreciation on the investments. |
The accompanying notes are an integral part of these financial statements.
| 13 |
| The Hartford Capital Appreciation Fund |
| Investment Valuation Hierarchy Level Summary – (continued) |
| June 30, 2012 (Unaudited) |
| (000’s Omitted) |
Following is a reconciliation of Level 3 assets for which significant unobservable inputs were used to determine fair value:
| Balance as of December 31, 2011 | Realized Gain (Loss) | Change in Unrealized Appreciation (Depreciation) | Net Amortization | Purchases | Sales | Transfers Into Level 3 * | Transfers Out of Level 3 * | Balance as of June 30, 2012 | ||||||||||||||||||||||||||||
| Assets: | ||||||||||||||||||||||||||||||||||||
| Common Stocks | $ | 79,825 | $ | 23,256 | $ | (4,166 | )† | $ | — | $ | 2,647 | $ | (29,767 | ) | $ | — | $ | — | $ | 71,795 | ||||||||||||||||
| Total | $ | 79,825 | $ | 23,256 | $ | (4,166 | ) | $ | — | $ | 2,647 | $ | (29,767 | ) | $ | — | $ | — | $ | 71,795 | ||||||||||||||||
| * | Investments are transferred into and out of Level 3 for a variety of reasons including, but not limited to: |
| 1) | Investments where trading has been halted (transfer into Level 3) or investments where trading has resumed (transfer out of Level 3). |
| 2) | Broker quoted investments (transfer into Level 3) or quoted prices in active markets (transfer out of Level 3). |
| 3) | Investments that have certain restrictions on trading (transfer into Level 3) or investments where trading restrictions have expired (transfer out of Level 3). |
| † | Change in unrealized appreciation (depreciation) in the current period relating to assets still held at June 30, 2012 was $(4,166). |
The accompanying notes are an integral part of these financial statements.
| 14 |
| Hartford Capital Appreciation HLS Fund |
| Statement of Assets and Liabilities |
| June 30, 2012 (Unaudited) |
| (000’s Omitted) |
| Assets: | ||||
| Investments in securities, at market value (cost $8,683,904) | $ | 8,741,554 | ||
| Cash | 98 | |||
| Foreign currency on deposit with custodian (cost $4) | 4 | |||
| Unrealized appreciation on foreign currency contracts | 13,506 | |||
| Receivables: | ||||
| Investment securities sold | 116,670 | |||
| Fund shares sold | 1,147 | |||
| Dividends and interest | 11,780 | |||
| Other assets | 12 | |||
| Total assets | 8,884,771 | |||
| Liabilities: | ||||
| Unrealized depreciation on foreign currency contracts | 2,429 | |||
| Payables: | ||||
| Investment securities purchased | 95,138 | |||
| Fund shares redeemed | 5,388 | |||
| Investment management fees | 738 | |||
| Distribution fees | 34 | |||
| Accrued expenses | 320 | |||
| Total liabilities | 104,047 | |||
| Net assets | $ | 8,780,724 | ||
| Summary of Net Assets: | ||||
| Capital stock and paid-in-capital | $ | 9,586,191 | ||
| Undistributed net investment income | 60,549 | |||
| Accumulated net realized loss | (934,641 | ) | ||
| Unrealized appreciation of investments and the translations of assets and liabilities denominated in foreign currency | 68,625 | |||
| Net assets | $ | 8,780,724 | ||
| Shares authorized | 5,000,000 | |||
| Par value | $ | 0.001 | ||
| Class IA: Net asset value per share | $ | 40.03 | ||
| Shares outstanding | 194,359 | |||
| Net assets | $ | 7,779,237 | ||
| Class IB: Net asset value per share | $ | 39.66 | ||
| Shares outstanding | 25,253 | |||
| Net assets | $ | 1,001,487 |
The accompanying notes are an integral part of these financial statements.
| 15 |
| Hartford Capital Appreciation HLS Fund |
| Statement of Operations |
| For the Six-Month Period Ended June 30, 2012 (Unaudited) |
| (000’s Omitted) |
| Investment Income: | ||||
| Dividends | $ | 87,386 | ||
| Interest | 3,901 | |||
| Less: Foreign tax withheld | (3,752 | ) | ||
| Total investment income, net | 87,535 | |||
| Expenses: | ||||
| Investment management fees | 30,031 | |||
| Transfer agent fees | 3 | |||
| Distribution fees - Class IB | 1,420 | |||
| Custodian fees | 106 | |||
| Accounting services fees | 812 | |||
| Board of Directors' fees | 120 | |||
| Audit fees | 34 | |||
| Other expenses | 589 | |||
| Total expenses (before fees paid indirectly) | 33,115 | |||
| Commission recapture | (167 | ) | ||
| Total fees paid indirectly | (167 | ) | ||
| Total expenses, net | 32,948 | |||
| Net investment income | 54,587 | |||
| Net Realized Gain on Investments and Foreign Currency Transactions: | ||||
| Net realized gain on investments | 195,146 | |||
| Net realized gain on foreign currency contracts | 388 | |||
| Net realized gain on other foreign currency transactions | 1,301 | |||
| Net Realized Gain on Investments and Foreign Currency Transactions | 196,835 | |||
| Net Changes in Unrealized Appreciation of Investments and Foreign Currency Transactions: | ||||
| Net unrealized appreciation of investments | 458,623 | |||
| Net unrealized depreciation of purchased options | (140 | ) | ||
| Net unrealized appreciation of foreign currency contracts | 22,937 | |||
| Net unrealized depreciation on translation of other assets and liabilities in foreign currencies | (252 | ) | ||
| Net Changes in Unrealized Appreciation of Investments and Foreign Currency Transactions | 481,168 | |||
| Net Gain on Investments and Foreign Currency Transactions | 678,003 | |||
| Net Increase in Net Assets Resulting from Operations | $ | 732,590 |
The accompanying notes are an integral part of these financial statements.
| 16 |
| Hartford Capital Appreciation HLS Fund |
| Statement of Changes in Net Assets |
| (000’s Omitted) |
| For the Six-Month Period Ended June 30, 2012 (Unaudited) | For the Year Ended December 31, 2011 | |||||||
| Operations: | ||||||||
| Net investment income | $ | 54,587 | $ | 90,518 | ||||
| Net realized gain on investments and foreign currency transactions | 196,835 | 750,977 | ||||||
| Net unrealized appreciation (depreciation) of investments and foreign currency transactions | 481,168 | (1,939,769 | ) | |||||
| Net Increase (Decrease) In Net Assets Resulting From Operations | 732,590 | (1,098,274 | ) | |||||
| Distributions to Shareholders: | ||||||||
| From net investment income | ||||||||
| Class IA | — | (71,587 | ) | |||||
| Class IB | — | (6,414 | ) | |||||
| Total distributions | — | (78,001 | ) | |||||
| Capital Share Transactions: | ||||||||
| Class IA | ||||||||
| Sold | 150,957 | 1,967,235 | ||||||
| Issued on reinvestment of distributions | — | 71,587 | ||||||
| Redeemed | (1,190,899 | ) | (1,742,622 | ) | ||||
| Total capital share transactions | (1,039,942 | ) | 296,200 | |||||
| Class IB | ||||||||
| Sold | 39,180 | 100,885 | ||||||
| Issued on reinvestment of distributions | — | 6,414 | ||||||
| Redeemed | (222,336 | ) | (368,116 | ) | ||||
| Total capital share transactions | (183,156 | ) | (260,817 | ) | ||||
| Net increase (decrease) from capital share transactions | (1,223,098 | ) | 35,383 | |||||
| Net Decrease In Net Assets | (490,508 | ) | (1,140,892 | ) | ||||
| Net Assets: | ||||||||
| Beginning of period | 9,271,232 | 10,412,124 | ||||||
| End of period | $ | 8,780,724 | $ | 9,271,232 | ||||
| Undistributed (distribution in excess of) net investment income | $ | 60,549 | $ | 5,962 | ||||
| Shares: | ||||||||
| Class IA | ||||||||
| Sold | 3,689 | 50,481 | ||||||
| Issued on reinvestment of distributions | — | 1,944 | ||||||
| Redeemed | (28,950 | ) | (42,673 | ) | ||||
| Total share activity | (25,261 | ) | 9,752 | |||||
| Class IB | ||||||||
| Sold | 961 | 2,434 | ||||||
| Issued on reinvestment of distributions | — | 176 | ||||||
| Redeemed | (5,572 | ) | (8,988 | ) | ||||
| Total share activity | (4,611 | ) | (6,378 | ) | ||||
The accompanying notes are an integral part of these financial statements.
| 17 |
Hartford Capital Appreciation HLS Fund
Notes to Financial Statements
June 30, 2012 (Unaudited)
(000’s Omitted)
| 1. | Organization: |
Hartford Capital Appreciation HLS Fund (the “Fund”) serves as an underlying investment option for certain variable annuity and variable life insurance separate accounts of Hartford Life Insurance Company (“HLIC”) and its affiliates and certain qualified retirement plans. The Fund may also serve as an underlying investment option for certain variable annuity and variable life separate accounts of other insurance companies. Owners of variable annuity contracts and policyholders of variable life insurance contracts may choose the funds permitted in the variable insurance contract prospectus. In addition, participants in certain qualified retirement plans may choose the Fund if permitted by their plans.
Hartford Series Fund, Inc. (the “Company”) is an open-end registered management investment company comprised of thirty portfolios. Financial Statements for the Fund, a series of the Company, are included in this report.
The Company is organized under the laws of the State of Maryland and is registered with the Securities and Exchange Commission (“SEC”) under the Investment Company Act of 1940, as amended (���1940 Act”). The Fund is a diversified open-end management investment company.
The Fund is divided into Class IA and Class IB shares. Each class is offered at the per share net asset value (“NAV”) without a sales charge and is subject to the same expenses, except that the Class IB shares are subject to distribution and service fees charged pursuant to a Distribution Plan adopted in accordance with Rule 12b-1 under the 1940 Act.
| 2. | Significant Accounting Policies: |
The following is a summary of significant accounting policies of the Fund in the preparation of its financial statements, which are in accordance with the United States Generally Accepted Accounting Principles (“U.S. GAAP”). The preparation of financial statements in accordance with U.S. GAAP may require management to make estimates and assumptions that affect the reported amounts of assets and liabilities and disclosure of contingent assets and liabilities at the date of the financial statements and the reported amounts of increases and decreases in net assets from operations during the reporting period. Actual results could differ from those estimates.
| a) | Determination of Net Asset Value – The NAV of each class of the Fund’s shares is determined as of the close of regular trading (normally 4:00 p.m. Eastern Time) (the “NYSE Close”) on each day that the New York Stock Exchange (the “Exchange”) is open (“Valuation Date”). Information that becomes known to the Fund after the NAV has been calculated on a particular day will not generally be used to retroactively adjust the NAV determined earlier that day. |
| b) | Investment Valuation and Fair Value Measurements – For purposes of calculating the NAV, portfolio investments and other assets held by the Fund's portfolio for which market quotes are readily available are valued at market value. Market value is generally determined on the basis of last reported sales prices or official close price. If no sales are reported, market value is based on quotes obtained from a quotation reporting system, established market makers, or independent pricing services. If market prices are not readily available or are deemed unreliable, the Fund will use the fair value of the investment as determined in good faith under policies and procedures established by and under the supervision of the Company’s Board of Directors. Market quotes are considered not readily available where there is an absence of current or reliable market-based data (e.g., trade information or broker quotes), including where events occur after the close of the relevant market, but prior to the NYSE Close that materially affect the values of the Fund’s portfolio investments or assets. In addition, market quotes are considered not readily available when, due to extraordinary circumstances, the exchanges or markets on which the investments trade do not open for trading for the entire day and no other market prices are available. In addition, prices of foreign equities that are principally traded on certain foreign markets are adjusted daily pursuant to a fair value pricing service approved by the Board of Directors in order to reflect an adjustment for the factors occurring after the close of certain foreign markets but before the NYSE Close. Investments that are primarily traded on foreign markets may trade on days that are not business days of the Fund. The value of the foreign investments in which the Fund invests may change on days when a shareholder will not be able to purchase or redeem shares of the Fund. Fair value pricing is subjective in nature and the use of fair value |
| 18 |
pricing by the Fund may cause the NAV of its shares to differ significantly from the NAV that would have been calculated using market prices at the close of the exchange on which a portfolio investment is primarily traded. There can be no assurance that the Fund could obtain the fair market value assigned to an investment if the Fund were to sell the investment at approximately the time at which the Fund determines its NAV.
Fixed income investments (other than short term obligations) and non-exchange traded derivatives held by the Fund are normally valued on the basis of quotes obtained from brokers and dealers or independent pricing services in accordance with procedures established by the Company’s Board of Directors. Prices obtained from independent pricing services use information provided by market makers or estimates of market values obtained from yield data relating to investments with similar characteristics. Generally, the Fund may use fair valuation in regard to fixed income investments when the Fund holds defaulted or distressed investments or investments in a company in which a reorganization is pending. Short-term investments maturing in 60 days or less are generally valued at amortized cost, if their original term to maturity was 60 days or less, or by amortizing their value on the 61st day prior to maturity, if the original term to maturity exceeded 60 days.
Exchange traded options, futures and options on futures are valued at the settlement price determined by the relevant exchange as of the NYSE Close. If such instruments do not trade on an exchange, values may be supplied by an independent pricing service using a formula or other objective method that may take into consideration the style, direction, expiration, strike price, notional value and volatility or other adjustments.
Investments valued in currencies other than U.S. dollars are converted to U.S. dollars using exchange rates obtained from independent pricing services for calculation of the NAV. As a result, the NAV of the Fund’s shares may be affected by changes in the value of currencies in relation to the U.S. dollar. The value of investments traded in markets outside the United States or denominated in currencies other than the U.S. dollar may be affected significantly on a day that the NYSE is closed and the market value may change on days when an investor is not able to purchase, redeem or exchange shares of the Fund.
Foreign currency contracts represent agreements to exchange currencies on specific future dates at predetermined rates. Foreign currency contracts are valued using foreign currency exchange rates and forward rates as provided by an independent pricing service on the Valuation Date.
Investments in open-end mutual funds are valued at the respective NAV of each open-end mutual fund on the Valuation Date.
Financial instruments for which prices are not available from an independent pricing service may be valued using market quotations obtained from one or more dealers that make markets in the respective financial instrument in accordance with procedures established by the Company’s Board of Directors.
U.S. GAAP defines fair value as the price that the Fund would receive to sell an asset or pay to transfer a liability in an orderly transaction between market participants. The U.S. GAAP fair value measurement standards require disclosure of a fair value hierarchy for each major category of assets and liabilities. Various inputs are used in determining the fair value of the Fund’s investments. These inputs are summarized into three broad hierarchy levels. This hierarchy is based on whether the valuation inputs are observable or unobservable. These levels are:
| · | Level 1 – Quoted prices in active markets for identical investments. Level 1 may include exchange traded instruments, such as domestic equities, some foreign equities, options, futures, mutual funds, exchange traded funds, rights and warrants. |
| · | Level 2 – Observable inputs other than Level 1 prices, such as quoted prices for similar investments; quoted prices in markets that are not active; or other inputs that are observable or can be corroborated by observable market data. Level 2 may include debt investments that are traded less frequently than exchange traded instruments and which are valued using independent pricing services; foreign equities, which are principally traded on certain foreign markets and are adjusted daily pursuant to a fair value pricing service in order to |
| 19 |
Hartford Capital Appreciation HLS Fund
Notes to Financial Statements – (continued)
June 30, 2012 (Unaudited)
(000’s Omitted)
reflect an adjustment for the factors occurring after the close of certain foreign markets but before the NYSE Close; and short-term investments, which are valued at amortized cost.
| · | Level 3 – Significant unobservable inputs that are supported by limited or no market activity. Level 3 may include financial instruments whose values are determined using indicative market quotes or require significant management judgment or estimation. These unobservable valuation inputs may include estimates for current yields, maturity/duration, prepayment speed, and indicative market quotes for comparable investments along with other assumptions relating to credit quality, collateral value, complexity of the investment structure, general market conditions and liquidity. This category may include investments where trading has been halted or there are certain restrictions on trading. While these investments are priced using unobservable inputs, the valuation of these investments reflects the best available data and management believes the prices are a reasonable representation of exit price. |
The Board of Directors of the Company generally reviews and approves the “Procedures for Valuation of Portfolio Securities” on an annual basis. These procedures define how investments are to be valued, including the formation of a Valuation Committee. The Valuation Committee is responsible for determining in good faith the fair value of investments when the value cannot be obtained from primary pricing services or alternative sources or if the valuation of an investment as provided by the primary pricing service or alternative source is believed not to reflect the investment’s fair value as of the Valuation Date. Members of the Valuation Committee include the Fund’s Treasurer or designee, a Vice President of the Funds with legal expertise or designee, and a Vice President of the investment manager or designee. In addition, the Fund’s chief compliance officer shall designate a member of the compliance group to attend Valuation Committee meetings as a non-voting resource, to monitor for and provide guidance with respect to compliance with these procedures. Two members of the Valuation Committee or their designees, representing different departments, shall constitute a quorum for purposes of permitting the Valuation Committee to take action. The Valuation Committee will consider all relevant factors in determining an investment’s fair value, and may seek the advice of the Fund’s sub-adviser, knowledgeable brokers and legal counsel in making such determination. The Valuation Committee reports to the Audit Committee of the Company’s Board of Directors. The Audit Committee receives quarterly written reports which include details of all fair-valued investments, including the reason for the fair valuation, and an indication, when possible, of the accuracy of the valuation by disclosing the next available reliable public price quotation or the disposition price of such investments (the “look-back” test). The Board of Directors then must consider for ratification all of the fair value determinations made during the previous quarter.
Valuation levels are not necessarily indicative of the risk associated with investing in such investments. Individual investments within any of the above mentioned asset classes may be assigned a different hierarchical level than those presented above, as individual circumstances dictate.
For additional information, refer to the Investment Valuation Hierarchy Level Summary and the Level 3 roll-forward reconciliation which follow the Schedule of Investments.
For purposes of reporting transfers between different hierarchy levels, both transfers in and out of each level, as applicable, are shown as if they occurred at the beginning of the period.
| c) | Investment Transactions and Investment Income – Investment transactions are recorded as of the trade date (the date the order to buy or sell is executed) for financial reporting purposes. Investments purchased or sold on a when-issued or delayed-delivery basis may be settled a month or more after the trade date. Realized gains and losses are determined on the basis of identified cost. |
Dividend income is accrued as of the ex-dividend date, except certain dividends from foreign investments where the ex-dividend date may have passed are recorded as soon as the Fund is informed of the dividend. Interest income, including amortization of premium and accretion of discounts, is accrued on a daily basis.
| 20 |
| d) | Foreign Currency Transactions – Assets and liabilities denominated in currencies other than U.S. dollars are translated into U.S. dollars at the exchange rates in effect on the valuation date. Purchases and sales of investments, income, and expenses are translated into U.S. dollars at the exchange rates on the dates of such transactions. |
The Fund does not isolate that portion of portfolio investment valuation resulting from fluctuations in the foreign currency exchange rates from the fluctuations arising from changes in the market prices of investments held. Exchange rate fluctuations are included with the net realized and unrealized gain or loss on investments in the accompanying financial statements.
Net realized foreign exchange gains or losses arise from sales of foreign currencies and the difference between asset and liability amounts initially stated in foreign currencies and the U.S. dollar value of the amounts actually received or paid. Net unrealized foreign exchange gains or losses arise from changes in the value of other assets and liabilities at the end of the reporting period, resulting from changes in the exchange rates.
| e) | Joint Trading Account – The Fund may invest cash balances into a joint trading account that may be invested in one or more repurchase agreements. |
| f) | Fund Share Valuation and Dividend Distributions to Shareholders – Orders for the Fund’s shares are executed in accordance with the investment instructions of the contract holders and plan participants. The NAV of the Fund’s shares is determined as of the close of business on each business day of the Exchange. The NAV is determined separately for each class of shares of the Fund by dividing the Fund’s net assets attributable to that class by the number of shares of the class outstanding. Each class of shares offered by the Fund has equal rights as to assets and voting privileges (except that shareholders of a class have exclusive voting rights regarding any matter relating solely to that class of shares). Income and non-class specific expenses are allocated daily to each class on the basis of the relative net assets of the class. Realized and unrealized capital gains and losses are allocated daily based on the relative net assets of each class of shares of the Fund. |
Orders for the purchase of the Fund’s shares received prior to the close of the Exchange on any day the Exchange is open for business are priced at the NAV determined as of the close of the Exchange. Orders received after the close of the Exchange, or on a day on which the Exchange and/or the Fund is not open for business, are priced at the next determined NAV.
Dividends are declared pursuant to a policy adopted by the Company’s Board of Directors based upon the investment performance of the Fund. The policy of the Fund is to pay dividends from net investment income and realized capital gains, if any, at least once a year.
Distributions from net investment income, net realized capital gains and capital are determined in accordance with federal income tax regulations, which may differ from U.S. GAAP with respect to character and timing. These differences may include but are not limited to losses deferred due to wash sale adjustments, foreign currency gains and losses, adjustments related to Passive Foreign Investment Companies (“PFICs”), Real Estate Investment Trusts (“REITs”), Regulated Investment Companies (“RICs”), certain derivatives and partnerships. Permanent book and federal income tax basis differences relating to shareholder distributions will result in reclassifications to certain of the Fund’s capital accounts (see Federal Income Taxes: Reclassification of Capital Accounts note).
| 3. | Securities and Other Investments: |
| a) | Repurchase Agreements – A repurchase agreement is an agreement by which a counterparty agrees to sell an investment and agrees to repurchase the investment sold at a mutually agreed upon time and price. At the time the Fund enters into a repurchase agreement, the value of the underlying collateral, including accrued interest, will be equal to or exceed the value of the repurchase agreement. Repurchase agreements expose the Fund to counterparty risk. To minimize counterparty risk, the investments that serve to collateralize the repurchase agreement are held by the Fund’s custodian in book entry or physical form in the custodial account of the Fund or in a third party custodial account. |
| 21 |
Hartford Capital Appreciation HLS Fund
Notes to Financial Statements – (continued)
June 30, 2012 (Unaudited)
(000’s Omitted)
Repurchase agreements are valued at cost plus accrued interest. The Fund, as shown on the Schedule of Investments, had outstanding repurchase agreements as of June 30, 2012.
| b) | Illiquid and Restricted Investments – The Fund is permitted to invest up to 15% of its net assets in illiquid investments. Illiquid investments are those that may not be sold or disposed of in the ordinary course of business within seven days, at approximately the price used to determine the Fund’s NAV. The Fund may not be able to sell illiquid investments when its sub-adviser considers it desirable to do so or may have to sell such investments at a price that is lower than the price that could be obtained if the investments were more liquid. A sale of illiquid investments may require more time and may result in higher dealer discounts and other selling expenses than does the sale of those that are liquid. Illiquid investments also may be more difficult to value due to the unavailability of reliable market quotations for such investments, and an investment in them may have an adverse impact on the Fund’s NAV. The Fund may also purchase certain restricted investments that can only be resold to certain qualified investors and may be determined to be liquid pursuant to policies and guidelines established by the Company’s Board of Directors. The Fund, as shown on the Schedule of Investments, had illiquid and/or restricted investments as of June 30, 2012. |
| c) | Investments Purchased on a When-Issued or Delayed-Delivery Basis – Delivery and payment for investments that have been purchased by the Fund on a forward commitment, or when-issued or delayed-delivery basis, take place beyond the customary settlement period. A fund may dispose of or renegotiate a delayed-delivery transaction after it is entered into, and may sell delayed-delivery investments before they are delivered, which may result in a realized gain or loss. During this period, such investments are subject to market fluctuations, and the Fund identifies investments segregated in its records with a value at least equal to the amount of the commitment. The Fund, as shown on the Schedule of Investments, had when-issued or delayed delivery investments as of June 30, 2012. |
| 4. | Financial Derivative Instruments: |
The following disclosures contain information on how and why the Fund uses derivative instruments, the credit-risk-related contingent features in certain derivative instruments, and how derivative instruments affect the Fund’s financial position and results of operations. The location and fair value amounts of these instruments on the Statement of Assets and Liabilities and the realized gains and losses and changes in unrealized gains and losses on the Statement of Operations, each categorized by type of derivative contract, are included in the following Additional Derivative Instrument Information footnote. The derivative instruments outstanding as of period-end are disclosed in the notes to the Schedule of Investments and the amounts of realized gains and losses and changes in unrealized gains and losses on derivative instruments during the period are disclosed in the Statement of Operations.
| a) | Foreign Currency Contracts – The Fund may enter into foreign currency contracts that obligate the Fund to purchase or sell currencies at specified future dates. Foreign currency contracts are used to hedge the currency exposure associated with some or all of the Fund’s investments and/or as part of an investment strategy. Foreign currency contracts are marked to market daily and the change in value is recorded by the Fund as an unrealized gain or loss. The Fund will record a realized gain or loss when the foreign currency contract is settled. |
Foreign currency contracts involve elements of market risk in excess of the amounts reflected in the Statement of Assets and Liabilities. In addition, risks may arise upon entering into these contracts from the potential inability of the counterparties to meet the terms of the contracts and from unanticipated movements in the value of the foreign currencies relative to the U.S. dollar. The Fund had outstanding foreign currency contracts as shown on the Schedule of Investments as of June 30, 2012.
| b) | Options Contracts – An option contract is a contract sold by one party to another party that offers the buyer the right, but not the obligation, to buy (call) or sell (put) an investment or other financial asset at an agreed-upon price during a specific period of time or on a specific date. The Fund may write (sell) covered call and put options on futures, swaps (“swaptions”), securities, commodities or currencies. “Covered” means that so long as the Fund is obligated as the writer of an option, it will own either the underlying investments or currency or an option to purchase the same underlying investments or currency having an expiration date of the covered option and an exercise price equal to or |
| 22 |
less than the exercise price of the covered option, or will pledge cash or other liquid investments having a value equal to or greater than the fluctuating market value of the option investment or currency. Writing put options increases the Fund’s exposure to the underlying instrument. Writing call options decreases the Fund’s exposure to the underlying instrument. Premiums received from writing options that expire are treated as realized gains. Premiums received from writing options that are exercised or closed are added to the proceeds or offset amounts paid on the underlying futures, swap, investment or currency transaction to determine the realized gain or loss. The Fund as a writer of an option has no control over whether the underlying instrument may be sold (call) or purchased (put) and as a result bears the market risk of an unfavorable change in the price of the instrument underlying the written option. There is the risk the Fund may not be able to enter into a closing transaction because of an illiquid market. The Fund may also purchase put and call options. Purchasing call options increases the Fund’s exposure to the underlying instrument. Purchasing put options decreases the Fund’s exposure to the underlying instrument. The Fund pays a premium, which is included on the Fund’s Statement of Assets and Liabilities as an investment and is subsequently marked to market to reflect the current value of the option. Premiums paid for purchasing options that expire are treated as realized losses. Certain options may be purchased with premiums to be determined on a future date. The premiums for these options are based upon implied volatility parameters at specified terms. The risk associated with purchasing put and call options is generally limited to the premium paid. Premiums paid for purchasing options that are exercised or closed are added to the amounts paid or offset against the proceeds on the underlying investment transaction to determine the realized gain or loss. Entering into over-the-counter options also exposes the Fund to counterparty risk. Counterparty risk is the possibility that the counterparty to the agreements may default on its obligation to perform or disagree as to the meaning of the contractual terms in the agreements. The Fund, as shown on the Schedule of Investments, had outstanding purchased options contracts as of June 30, 2012. There were no transactions involving written options contracts during the six-month period ended June 30, 2012.
| c) | Additional Derivative Instrument Information: |
Fair Values of Derivative Instruments on the Statement of Assets and Liabilities as of June 30, 2012:
| Risk Exposure Category | ||||||||||||||||||||||||||||
| Interest Rate Contracts | Foreign Exchange Contracts | Credit Contracts | Equity Contracts | Commodity Contracts | Other Contracts | Total | ||||||||||||||||||||||
| Assets: | ||||||||||||||||||||||||||||
| Investments in securities, at value (purchased options), market value | $ | — | $ | — | $ | — | $ | 479 | $ | — | $ | — | $ | 479 | ||||||||||||||
| Unrealized appreciation on foreign currency contracts | — | 13,506 | — | — | — | — | 13,506 | |||||||||||||||||||||
| Total | $ | — | $ | 13,506 | $ | — | $ | 479 | $ | — | $ | — | $ | 13,985 | ||||||||||||||
| Liabilities: | ||||||||||||||||||||||||||||
| Unrealized depreciation on foreign currency contracts | $ | — | $ | 2,429 | $ | — | $ | — | $ | — | $ | — | $ | 2,429 | ||||||||||||||
| Total | $ | — | $ | 2,429 | $ | — | $ | — | $ | — | $ | — | $ | 2,429 | ||||||||||||||
The volume of derivatives that is presented in the Schedule of Investments is consistent with the derivative activity during the six-month period ended June 30, 2012.
| 23 |
Hartford Capital Appreciation HLS Fund
Notes to Financial Statements – (continued)
June 30, 2012 (Unaudited)
(000’s Omitted)
The effect of Derivative Instruments on the Statement of Operations for the six-month period ended June 30, 2012:
| Risk Exposure Category | ||||||||||||||||||||||||||||
| Interest Rate Contracts | Foreign Exchange Contracts | Credit Contracts | Equity Contracts | Commodity Contracts | Other Contracts | Total | ||||||||||||||||||||||
| Realized Gain (Loss) on Derivatives Recognized as a Result of Operations: | ||||||||||||||||||||||||||||
| Net realized gain on foreign currency contracts | $ | — | $ | 388 | $ | — | $ | — | $ | — | $ | — | $ | 388 | ||||||||||||||
| Total | $ | — | $ | 388 | $ | — | $ | — | $ | — | $ | — | $ | 388 | ||||||||||||||
| Net Change in Unrealized Appreciation (Depreciation) on Derivatives Recognized as a Result of Operations: | ||||||||||||||||||||||||||||
| Net change in unrealized depreciation of investments in purchased options | $ | — | $ | — | $ | — | $ | (140 | ) | $ | — | $ | — | $ | (140 | ) | ||||||||||||
| Net change in unrealized appreciation of foreign currency contracts | — | 22,937 | — | — | — | — | 22,937 | |||||||||||||||||||||
| Total | $ | — | $ | 22,937 | $ | — | $ | (140 | ) | $ | — | $ | — | $ | 22,797 | |||||||||||||
| 5. | Principal Risks: |
| a) | Credit and Counterparty Risks – Credit risk depends largely on the perceived financial health of bond issuers. In general, the credit rating is inversely related to the credit risk of the issuer. Higher rated bonds generally are deemed to have less credit risk, while lower or unrated bonds are deemed to have higher risk of default. The share price, yield and total return of a fund that holds securities with higher credit risk may be more volatile than those of a fund that holds bonds with lower credit risk. Similar to credit risk, the Fund may be exposed to counterparty risk, or the risk that an institution or other entity with which the Fund has unsettled or open transactions will default. |
| b) | Market Risks – The Fund’s investments expose the Fund to various risks including, but not limited to, interest rate, prepayment, extension, foreign currency, and equity risks. Interest rate risk is the risk that fixed income securities will decline in value because of changes in interest rates. As nominal interest rates rise, the values of certain fixed income securities held by the Fund are likely to decrease. A nominal interest rate can be described as the sum of a real interest rate and an expected inflation rate. Fixed income securities with longer durations tend to be more sensitive to changes in interest rates, usually making them more volatile than securities with shorter durations. Duration is useful primarily as a measure of the sensitivity of a fixed income security’s market price to interest rate (i.e., yield) movements. In addition, securities are subject to extension risk. Rising interest rates may cause prepayments to occur at a slower than expected rate, thereby effectively lengthening the maturity of the security and making the security more sensitive to interest rate changes. Prepayment and extension risk are major risks of mortgage-backed securities and certain asset-backed securities. For certain asset-backed securities, the actual maturity may be less than the stated maturity shown in the Schedule of Investments, if applicable. As a result, the timing of income recognition relating to these securities may vary based upon the actual maturity. If the Fund invests directly in foreign currencies or in securities that trade in, and receive revenues in, foreign currencies, or in derivatives that provide exposure to foreign currencies, it will be subject to the risk that those currencies will decline in value relative to the base currency of the Fund, or, in the case of hedging positions, that the Fund’s base currency will decline in value relative to the currency being hedged. Currency rates in foreign countries may fluctuate significantly over short periods of time for a number of reasons, including changes in interest rates, intervention (or the failure to intervene) by U.S. or foreign governments, central banks or supranational entities, such as the International Monetary Fund, or by the imposition of currency controls or other political developments in the United States or abroad. As a result, the Fund’s investments in foreign currency denominated securities may reduce the returns of the Fund. The market values of equity securities, such as common stocks and preferred stocks, or equity related investments, such as futures and options, may decline due to general market conditions which are not specifically related to a particular company, such as real or perceived adverse economic conditions, changes in the general outlook for corporate earnings, changes in interest or currency rates or adverse investor sentiment generally. The market value of equity securities may also decline due to factors which affect a particular industry or industries, such as labor shortages or increased production costs and competitive conditions within an industry. Equity securities and equity related investments generally have greater market price volatility than fixed income securities. |
| 24 |
| 6. | Federal Income Taxes: |
| a) | Federal Income Taxes – For federal income tax purposes, the Fund intends to continue to qualify as a RIC under Subchapter M of the Internal Revenue Code (“IRC”) by distributing substantially all of its taxable net investment income and net realized capital gains to its shareholders and otherwise complying with the requirements of RICs. The Fund has distributed substantially all of its income and capital gains in prior years, if applicable, and intends to distribute substantially all of its income and capital gains prior to the next fiscal year-end. Accordingly, no provision for federal income or excise taxes has been made in the accompanying financial statements. Distributions from short-term capital gains are treated as ordinary income distributions for federal income tax purposes. |
| b) | Net Investment Income (Loss), Net Realized Gains (Losses) – Net investment income (loss) and net realized gains (losses) may differ for financial statement and tax purposes primarily because of losses deferred due to wash sale adjustments, foreign currency gains and losses, adjustments related to PFICs, REITs, RICs, certain derivatives and partnerships. The character of distributions made during the year from net investment income or net realized gains may differ from their ultimate characterization for federal income tax purposes. Also, due to the timing of dividend distributions, the fiscal year in which amounts are distributed may differ from the year that the income or realized gains (losses) were recorded by the Fund. |
| c) | Distributions and Components of Distributable Earnings – The tax character of distributions paid by the Fund for the periods indicated is as follows (as adjusted for dividends payable): |
| For the Year Ended December 31, 2011 | For the Year Ended December 31, 2010 | |||||||
| Ordinary Income | $ | 78,001 | $ | 61,562 | ||||
| Tax Return of Capital | — | 7,438 | ||||||
As of December 31, 2011, the Fund’s components of distributable earnings (deficit) on a tax basis were as follows:
| Amount | ||||
| Undistributed Ordinary Income | $ | 6,056 | ||
| Accumulated Capital and Other Losses* | (871,619 | ) | ||
| Unrealized Depreciation† | (672,494 | ) | ||
| Total Accumulated Deficit | $ | (1,538,057 | ) | |
| * | The Fund has capital loss carryforwards that are identified in the Capital Loss Carryforward note that follows. |
| † | The difference between book-basis and tax-basis unrealized appreciation (depreciation) may be attributable to the losses deferred due to wash sale adjustments, foreign currency gains and losses, adjustments related to PFICs, REITs, RICs, certain derivatives and partnerships. |
| 25 |
Hartford Capital Appreciation HLS Fund
Notes to Financial Statements – (continued)
June 30, 2012 (Unaudited)
(000’s Omitted)
| d) | Reclassification of Capital Accounts – The Fund may record reclassifications in its capital accounts. These reclassifications have no impact on the total net assets of the Fund. The reclassifications are a result of permanent differences between U.S. GAAP and tax accounting for such items as foreign currency, PFICs, expiration or utilization of capital loss carryforwards or net operating losses. Adjustments are made to reflect the impact these items have on current and future distributions to shareholders. Therefore, the source of the Fund’s distributions may be shown in the accompanying Statement of Changes in Net Assets as from undistributed net investment income, from accumulated net realized gains on investments or from capital depending on the type of book and tax differences that exist. For the year ended December 31, 2011, the Fund recorded reclassifications to increase (decrease) the accounts listed below: |
| Amount | ||||
| Undistributed Net Investment Income | $ | (2,433 | ) | |
| Accumulated Net Realized Gain (Loss) | (3,314 | ) | ||
| Capital Stock and Paid-in-Capital | 5,747 | |||
| e) | Capital Loss Carryforward – On December 22, 2010, the Regulated Investment Company Modernization Act of 2010 (the “Act”) was enacted, which made changes to the capital loss carryforward rules. The changes are effective for taxable years beginning after the date of enactment. Under the Act, funds are permitted to carry forward capital losses for an unlimited period. However, any losses incurred during those future taxable years will be required to be utilized prior to the losses incurred in pre-enactment taxable years, which carry an expiration date. As a result of this ordering rule, pre-enactment capital loss carryforwards may be more likely to expire unused. Additionally, post-enactment capital loss carryforwards retain their character as either short-term or long-term capital losses rather than being considered all short-term as permitted under prior regulation. |
At December 31, 2011 (tax-year-end), the Fund had capital loss carryforwards for U.S. federal income tax purposes as follows:
| Year of Expiration | Amount | |||
| 2017 | $ | 871,619 | ||
| Total | $ | 871,619 | ||
During the year ended December 31, 2011, the Fund utilized $791,337 of prior year capital loss carryforwards.
| f) | Accounting for Uncertainty in Income Taxes – The Fund has adopted financial reporting rules that require the Fund to analyze all open tax years, as defined by the statute of limitations, for all major jurisdictions. Generally, tax authorities can examine all tax returns filed for the last three years. The Fund does not have an examination in progress. |
The Fund has reviewed all open tax years and major jurisdictions and concluded that these financial reporting rules had no effect on the Fund’s financial position or results of operations. There is no tax liability resulting from unrecognized tax benefits relating to uncertain income tax positions taken or expected to be taken on the tax return for the fiscal year ended December 31, 2011. The Fund is also not aware of any tax positions for which it is reasonably possible that the total amounts of unrecognized tax benefits will significantly change in the next twelve months.
| 7. | Expenses: |
| a) | Investment Management Agreement – HL Investment Advisors, LLC (“HL Advisors”), an indirect wholly owned subsidiary of The Hartford Financial Services Group, Inc. (“The Hartford”), serves as investment manager to the Fund pursuant to an Investment Management Agreement with the Company. As investment manager, HL Advisors has overall investment supervisory responsibility for the Fund. In addition, HL Advisors provides administrative personnel, services, equipment, facilities and office space for proper operation of the Fund. HL Advisors has contracted with Wellington Management Company, LLP (“Wellington Management”) under a sub-advisory agreement for the provision |
| 26 |
of day-to-day investment management services to the Fund in accordance with the Fund’s investment objective and policies. The Fund pays a fee to HL Advisors, a portion of which may be used to compensate Wellington Management.
The schedule below reflects the rates of compensation paid to HL Advisors for investment management services rendered as of June 30, 2012; the rates are accrued daily and paid monthly.
| Average Daily Net Assets | Annual Fee | |||
| On first $250 million | 0.7750 | % | ||
| On next $250 million | 0.7250 | % | ||
| On next $500 million | 0.6750 | % | ||
| On next $1.5 billion | 0.6250 | % | ||
| On next $2.5 billion | 0.6200 | % | ||
| On next $5 billion | 0.6150 | % | ||
| Over $10 billion | 0.6100 | % | ||
The schedule below reflects the rates of compensation paid to HL Advisors for investment management services rendered during the period December 31, 2011, through February 29, 2012.
| Average Daily Net Assets | Annual Fee | |||
| On first $250 million | 0.7750 | % | ||
| On next $250 million | 0.7250 | % | ||
| On next $500 million | 0.6750 | % | ||
| On next $4 billion | 0.6250 | % | ||
| On next $5 billion | 0.6225 | % | ||
| Over $10 billion | 0.6200 | % | ||
| b) | Accounting Services Agreement – Pursuant to the Fund Accounting Agreement between HLIC and the Company, on behalf of the Fund, HLIC provides accounting services to the Fund and receives monthly compensation based on the Fund’s average daily net assets at the rates set forth below. The Fund’s accounting services fees are accrued daily and paid monthly. |
| Average Daily Net Assets | Annual Fee | |||
| On first $5 billion | 0.018 | % | ||
| On next $5 billion | 0.016 | % | ||
| Over $10 billion | 0.014 | % | ||
| c) | Operating Expenses – Allocable expenses incurred by the Company are allocated to each Fund and allocated to classes within a Fund in proportion to the average daily net assets of the Fund and each class, except where allocation of certain expenses is more fairly made directly to the Fund or to specific classes within a Fund. |
| d) | Fees Paid Indirectly – The Company, on behalf of the Fund, has entered into agreements with State Street Global Markets, LLC and Russell Implementation Services, Inc. to partially recapture non-discounted trade commissions. Such rebates are used to pay a portion of the Fund’s expenses. In addition, the Fund’s custodian bank has also agreed to reduce its fees when the Fund maintains cash on deposit in a non-interest-bearing custody account. For the six-month period ended June 30, 2012, these amounts, if any, are included in the Statement of Operations. |
| 27 |
Hartford Capital Appreciation HLS Fund
Notes to Financial Statements – (continued)
June 30, 2012 (Unaudited)
(000’s Omitted)
The ratio of expenses to average net assets in the accompanying financial highlights excludes the reduction in expenses related to fees paid indirectly. The annualized expense ratio for the period listed below reflecting the reduction for fees paid indirectly is as follows:
| Annualized Six- Month Period Ended June 30, 2012 | ||||
| Class IA | 0.66 | % | ||
| Class IB | 0.91 | % | ||
| e) | Distribution Plan for Class IB shares – The Company, on behalf of the Fund, has adopted a Distribution Plan pursuant to Rule 12b-1 of the 1940 Act to compensate the Distributor, Hartford Securities Distribution Company, Inc. (a wholly owned, ultimate subsidiary of The Hartford), from assets attributable to the Class IB shares for services rendered and expenses borne in connection with activities primarily intended to result in the sale of the Class IB shares, subject to the review and approval of the Company’s Board of Directors. |
The Distribution Plan provides that the Fund may pay annually up to 0.25% of the average daily net assets of the Fund attributable to its Class IB shares for activities primarily intended to result in the sale of Class IB shares. The Board has the authority to suspend or reduce these payments at any point in time. Under the terms of the Distribution Plan and the principal underwriting agreement, the Fund is authorized to make payments monthly to the Distributor that may be used to pay or compensate entities providing distribution and shareholder servicing with respect to the Class IB shares for such entities’ fees or expenses incurred or paid in that regard. These fees are accrued daily and paid monthly.
| f) | Other Related Party Transactions – Certain officers of the Fund are directors and/or officers of HL Advisors and/or The Hartford or its subsidiaries. For the six-month period ended June 30, 2012, a portion of the Fund’s chief compliance officer’s salary was paid by all the investment companies in the Hartford fund complex. The portion allocated to the Fund was in the amount of $7. Hartford Administrative Services Company (“HASCO”), an indirect wholly owned subsidiary of The Hartford, provides transfer agent services to the Fund. HASCO was compensated on a per account basis for providing such services. The amount paid to HASCO can be found in the Statement of Operations. These fees are accrued daily and paid monthly. |
| g) | Payment from Affiliate – In July of 2007, The Hartford entered into a settlement with the Attorneys General of the states of New York, Connecticut and Illinois relating to market timing and the company's individual variable annuity contracts in which certain payments would be made directly to the variable annuity contract holders. The distribution plan provided that unclaimed money from the settlement would be distributed to certain HLS Funds that are investment options through a Hartford individual variable annuity contract. The unclaimed money was distributed to the Fund on September 18, 2009. |
The total return in the accompanying financial highlights includes a payment from an affiliate. Had the payment from the affiliate been excluded, the impact and total return for the period listed below would have been as follows:
| For the Year Ended December 31, 2009 | ||||||||
Class IA | Class IB | |||||||
| Impact from Payment from Affiliate for Attorneys General Settlement | — | % | — | % | ||||
| Total Return Excluding Payment from Affiliate | 45.66 | % | 45.30 | % | ||||
| 28 |
| 8. | Investment Transactions: |
For the six-month period ended June 30, 2012, the Fund's aggregate purchases and sales of investment securities (excluding short-term investments) were as follows:
| Amount | ||||
| Cost of Purchases Excluding U.S. Government Obligations | $ | 4,004,214 | ||
| Sales Proceeds Excluding U.S. Government Obligations | 5,069,914 | |||
| 9. | Line of Credit: |
The Fund is one of several Hartford funds that participate in a $500 million committed revolving line of credit facility. The facility is to be used for temporary or emergency purposes. Under the arrangement, the funds are required to own securities having a market value in excess of 300% of the total bank borrowings. The interest rate on borrowings varies depending on the nature of the loan. The facility also requires a fee to be paid based on the amount of the commitment. This commitment fee is allocated to all of the funds participating in the line of credit based on the average net assets of the funds. During the six-month period ended June 30, 2012, the Fund did not have any borrowings under this facility.
| 10. | Industry Classifications: |
Other than the industry classifications “Other Investment Pools and Funds” and “Exchange Traded Funds,” equity industry classifications used in this report are the Global Industry Classification Standard, which was developed by and is the exclusive property and service mark of MSCI, Inc. and Standard & Poor’s.
| 11. | Indemnifications: |
Under the Company’s organizational documents, the Company shall indemnify its officers and directors to the full extent required or permitted under Maryland General Corporation Law and the federal securities laws. In addition, the Company, on behalf of the Fund, may enter into contracts that contain a variety of indemnifications. The Company’s maximum exposure under these arrangements is unknown. However, as of the date of these financial statements, the Company has not had prior claims or losses pursuant to these contracts and expects the risk of loss to be remote.
| 29 |
Hartford Capital Appreciation HLS Fund
Financial Highlights
– Selected Per-Share Data (A) –
| Class | Net Asset Value at Beginning of Period | Net Investment Income (Loss) | Payments from (to) Affiliate | Net Realized and Unrealized Gain (Loss) on Investments | Total from Investment Operations | Dividends from Net Investment Income | Distributions from Realized Capital Gains | Distributions from Capital | Total Distributions | Net Increase (Decrease) in Net Asset Value | Net Asset Value at End of Period | |||||||||||||||||||||||||||||||||
| For the Six-Month Period Ended June 30, 2012 (Unaudited) | ||||||||||||||||||||||||||||||||||||||||||||
| IA | $ | 37.20 | $ | 0.26 | $ | – | $ | 2.57 | $ | 2.83 | $ | – | $ | – | $ | – | $ | – | $ | 2.83 | $ | 40.03 | ||||||||||||||||||||||
| IB | 36.90 | 0.21 | – | 2.55 | 2.76 | – | – | – | – | 2.76 | 39.66 | |||||||||||||||||||||||||||||||||
| For the Year Ended December 31, 2011 | ||||||||||||||||||||||||||||||||||||||||||||
| IA | 42.36 | 0.37 | – | (5.20 | ) | (4.83 | ) | (0.33 | ) | – | – | (0.33 | ) | (5.16 | ) | 37.20 | ||||||||||||||||||||||||||||
| IB | 42.00 | 0.32 | – | (5.20 | ) | (4.88 | ) | (0.22 | ) | – | – | (0.22 | ) | (5.10 | ) | 36.90 | ||||||||||||||||||||||||||||
| For the Year Ended December 31, 2010 | ||||||||||||||||||||||||||||||||||||||||||||
| IA | 36.63 | 0.30 | – | 5.72 | 6.02 | (0.26 | ) | – | (0.03 | ) | (0.29 | ) | 5.73 | 42.36 | ||||||||||||||||||||||||||||||
| IB | 36.32 | 0.21 | – | 5.66 | 5.87 | (0.16 | ) | – | (0.03 | ) | (0.19 | ) | 5.68 | 42.00 | ||||||||||||||||||||||||||||||
| For the Year Ended December 31, 2009 | ||||||||||||||||||||||||||||||||||||||||||||
| IA | 25.34 | 0.31 | – | 11.27 | 11.58 | (0.29 | ) | – | – | (0.29 | ) | 11.29 | 36.63 | |||||||||||||||||||||||||||||||
| IB | 25.14 | 0.25 | – | 11.14 | 11.39 | (0.21 | ) | – | – | (0.21 | ) | 11.18 | 36.32 | |||||||||||||||||||||||||||||||
| For the Year Ended December 31, 2008 | ||||||||||||||||||||||||||||||||||||||||||||
| IA | 52.46 | 0.46 | – | (22.58 | ) | (22.12 | ) | (0.50 | )(H) | (4.28 | ) | (0.22 | )(H) | (5.00 | ) | (27.12 | ) | 25.34 | ||||||||||||||||||||||||||
| IB | 52.01 | 0.39 | – | (22.37 | ) | (21.98 | ) | (0.39 | )(H) | (4.28 | ) | (0.22 | )(H) | (4.89 | ) | (26.87 | ) | 25.14 | ||||||||||||||||||||||||||
| For the Year Ended December 31, 2007 | ||||||||||||||||||||||||||||||||||||||||||||
| IA | 53.49 | 0.35 | – | 8.36 | 8.71 | (0.07 | ) | (9.67 | ) | – | (9.74 | ) | (1.03 | ) | 52.46 | |||||||||||||||||||||||||||||
| IB | 53.21 | 0.22 | – | 8.28 | 8.50 | (0.03 | ) | (9.67 | ) | – | (9.70 | ) | (1.20 | ) | 52.01 | |||||||||||||||||||||||||||||
| (A) | Information presented relates to a share outstanding throughout the indicated period. |
| (B) | The figures do not include sales charges or other fees which may be applied at the variable life insurance, variable annuity or qualified retirement plan product level. Any such additional sales charges or other fees would lower the Fund's performance. |
| (C) | Ratios do not reflect reductions for fees paid indirectly. Please see Fees Paid Indirectly in the Notes to Financial Statements. |
| (D) | Portfolio turnover rate is calculated on the basis of the Fund as a whole without distinguishing between the classes of shares issued. |
| (E) | Not annualized. |
| (F) | Annualized. |
| (G) | Total return without the inclusion of the Payment from (to) Affiliate can be found in Expenses in the accompanying Notes to Financial Statements. |
| (H) | In 2009, the Fund amended its 2008 federal tax return in order to change an election relating to the recognition and classification of certain net realized losses and ordinary income items. As a result, a portion of the distributions that were made by the Fund during 2008 were reclassified as return of capital. This reclassification had no impact on the total net assets or net asset value of the Fund. |
| 30 |
- Ratios and Supplemental Data -
| Total Return(B) | Net Assets at End of Period | Ratio of Expenses to Average Net Assets Before Waivers(C) | Ratio of Expenses to Average Net Assets After Waivers(C) | Ratio of Net Investment Income (Loss) to Average Net Assets | Portfolio Turnover Rate(D) | |||||||||||||||||
| 7.60 | %(E) | $ | 7,779,237 | 0.66 | %(F) | 0.66 | %(F) | 1.17 | %(F) | 43 | % | |||||||||||
| 7.47 | (E) | 1,001,487 | 0.91 | (F) | 0.91 | (F) | 0.93 | (F) | – | |||||||||||||
| (11.41 | ) | 8,169,178 | 0.67 | 0.67 | 0.95 | 113 | ||||||||||||||||
| (11.62 | ) | 1,102,054 | 0.92 | 0.92 | 0.71 | – | ||||||||||||||||
| 16.50 | 8,889,906 | 0.67 | 0.67 | 0.77 | 95 | |||||||||||||||||
| 16.21 | 1,522,218 | 0.92 | 0.92 | 0.52 | – | |||||||||||||||||
| 45.67 | (G) | 8,410,214 | 0.68 | 0.68 | 1.03 | 128 | ||||||||||||||||
| 45.30 | (G) | 1,595,912 | 0.93 | 0.93 | 0.79 | – | ||||||||||||||||
| (45.59 | ) | 6,017,984 | 0.67 | 0.67 | 1.12 | 131 | ||||||||||||||||
| (45.73 | ) | 1,295,065 | 0.92 | 0.92 | 0.87 | – | ||||||||||||||||
| 16.83 | 12,123,834 | 0.67 | 0.67 | 0.68 | 101 | |||||||||||||||||
| 16.53 | 2,933,905 | 0.92 | 0.92 | 0.42 | – | |||||||||||||||||
| 31 |
Hartford Capital Appreciation HLS Fund
Directors and Officers (Unaudited)
The Board of Directors of the Company appoints officers who are responsible for the day-to-day operations of the Fund and who execute policies formulated by the Directors. Each director serves until his or her death, resignation, or retirement or until the next annual meeting of shareholders is held or until his or her successor is elected and qualifies.
Directors and officers who are employed by or who have a financial interest in The Hartford are considered “interested” persons of the Fund pursuant to the 1940 Act. Each officer and two of the Company’s directors, as noted in the chart below, are “interested” persons of the Fund. Each director serves as a director for The Hartford Mutual Funds, Inc., The Hartford Mutual Funds II, Inc., Hartford Series Fund, Inc., Hartford HLS Series Fund II, Inc., and as a trustee for The Hartford Alternative Strategies Fund, which, as of June 30, 2012, collectively consist of 89 funds. Correspondence may be sent to directors and officers c/o Hartford Mutual Funds, P.O. Box 2999, Hartford, Connecticut 06104-2999, except that correspondence to Mr. Annoni, Mr. Dressen and Ms. Fagely may be sent to 500 Bielenberg Drive, Woodbury, Minnesota 55125.
The table below sets forth, for each director and officer, his or her name, year of birth, current position with the Company and date first elected or appointed to Hartford Series Fund, Inc. (“HSF”), and Hartford HLS Series Fund II, Inc. (“HSF2”), principal occupation, and, for directors, other directorships held. The Fund’s statement of additional information contains further information on the directors and is available free of charge by calling 1-800-862-6668 or writing to Hartford HLS Funds, c/o Individual Annuity Services, P.O. Box 5085, Hartford, CT 06102-5085.
Information on the aggregate remuneration paid to the directors of the Company can be found in the Statement of Operations herein. The Fund pays to The Hartford a portion of the Chief Compliance Officer’s compensation, but does not pay salaries or compensation to any of their other officers or directors who are employed by The Hartford.
Non-Interested Directors
Lynn S. Birdsong (1946) Director since 2003, Co-Chairman of the Investment Committee
Mr. Birdsong is a private investor. Mr. Birdsong currently serves as a Director of the Sovereign High Yield Investment Company (April 2010 to current). Mr. Birdsong currently serves as an Independent Director of Nomura Partners Funds, Inc. (formerly, The Japan Fund) (March 2003 to current). From 1979 to 2002, Mr. Birdsong was a managing director of Zurich Scudder Investments, an investment management firm. During his employment with Scudder, Mr. Birdsong was an Interested Director of The Japan Fund. Since 1981, Mr. Birdsong has been a partner in Birdsong Company, an advertising specialty firm.
Robert M. Gavin, Jr. (1940) Director since 2002 (HSF) and 1986 (HSF2), Chairman of the Board since 2004
Dr. Gavin is an educational consultant. Prior to September 1, 2001, he was President of Cranbrook Education Community and prior to July 1996, he was President of Macalester College, St. Paul, Minnesota.
Duane E. Hill (1945) Director since 2001 (HSF) and 2002 (HSF2), Chairman of the Nominating Committee
Mr. Hill is Partner of TSG Ventures L.P., a private equity investment company. Mr. Hill is a former partner of TSG Capital Group, a private equity investment firm that served as sponsor and lead investor in leveraged buyouts of middle market companies.
Sandra S. Jaffee (1941) Director since 2005
Ms. Jaffee is the founder and Chief Executive Officer of a private company, Homeworks Concierge, LLC, which provides residential property management services in Westchester County, New York (January 2012 to present). Ms. Jaffee served as Chairman (2008 to 2009) and Chief Executive Officer of Fortent (formerly Searchspace Group), a leading provider of compliance/regulatory technology to financial institutions from August 2005 to August 2009. Ms. Jaffe currently serves as a member of the Board of Directors of Broadridge Financial Solutions as well as a Trustee of Muhlenberg College.
William P. Johnston (1944) Director since 2005, Chairman of the Compliance Committee
In June 2006, Mr. Johnston was appointed as Senior Advisor to The Carlyle Group, a global private equity investment firm. In August 2007, Mr. Johnston was elected to the Board of Directors of LifeCare Holdings, Inc. In February 2008, Mr. Johnston was elected to the Board of Directors of HCR-ManorCare, Inc. In May 2006, Mr. Johnston was elected to the Supervisory Board of Fresenius Medical Care AG & Co. KGaA, after its acquisition of Renal Care Group, Inc. in March 2006.
Phillip O. Peterson (1944) Director since 2002 (HSF) and 2000 (HSF2), Chairman of the Audit Committee
Mr. Peterson is a mutual fund industry consultant. He was a partner of KPMG LLP (an accounting firm) until July 1999. Mr. Peterson joined William Blair Funds in February 2007 as a member of the Board of Trustees. Mr. Peterson also joined the Board of Trustees of Symetra Variable Mutual Funds Trust as a trustee in February 2012.
| 32 |
Lemma W. Senbet (1946) Director since 2005
Dr. Senbet is the William E. Mayer Chair Professor of Finance and Director, Center for Financial Policy, at the University of Maryland, Robert H. Smith School of Business. He was chair of the Finance Department from 1998 to 2006. Previously he was a chaired professor of finance at the University of Wisconsin-Madison. Also, he was director of the Fortis Funds from March 2000 to July 2002. Dr. Senbet served the finance profession in various capacities, including as director of the American Finance Association and President of the Western Finance Association. In 2006, Dr. Senbet was inducted Fellow of Financial Management Association International for his career-long distinguished scholarship and professional service.
Interested Directors and Officers
David N. Levenson (1966) Director since 2010(1)
Mr. Levenson currently serves as President of The Hartford’s Wealth Management business. He was appointed to this role in July 2010. Previously, Mr. Levenson served as Executive Vice President of Legacy Holdings for The Hartford from June 2009 to July 2010. From 2006 to 2009, Mr. Levenson was with Hartford Life Insurance K.K. where he served as President and Chief Executive Officer from 2007 to 2009. He served as Managing Director of Hartford Investment Management Company from 2005 to 2006. Additionally, Mr. Levenson serves as Executive Vice President of The Hartford and as President, Director and Chief Executive Officer of Hartford Life Insurance Company (“HLIC”) and Hartford Life, Inc. (“HL Inc.”).
(1) Mr. Levenson served as Interested Director until August 2, 2012.
Lowndes A. Smith (1939) Director since 1996 (HSF) and 2002 (HSF2), Co-Chairman of the Investment Committee
Mr. Smith served as Vice Chairman of The Hartford from February 1997 to January 2002, as President and Chief Executive Officer of HL Inc. from February 1997 to January 2002, and as President and Chief Operating Officer of The Hartford Life Insurance Companies from January 1989 to January 2002. Mr. Smith serves as a Director of White Mountains Insurance Group, Ltd., One Beacon Insurance and Symetra Financial and as Managing Director of Whittington Gray Associates.
Other Officers
James E. Davey (1964) President and Chief Executive Officer since 2010(2)
Mr. Davey serves as Executive Vice President of HLIC. Additionally, Mr. Davey serves as President, Chief Executive Officer and Manager of HIFSCO and President, Chief Executive Officer and Manager of HL Investment Advisors, LLC (“HL Advisors”). Mr. Davey joined The Hartford in 2002.
(2) Mr. Davey became an Interested Director effective August 2, 2012.
Mark A. Annoni (1964) Vice President, Controller and Treasurer since 2012(3)
Mr. Annoni serves as the Assistant Vice President and Director of Investment Finance (February 2004 to present). Mr. Annoni joined The Hartford in April 2001 as part of The Hartford’s acquisition of Fortis Financial Group. Prior to joining The Hartford, Mr. Annoni served as Manager of Mutual Fund Accounting at Fortis Financial Group (July 1997 to April 2001).
(3) Mr. Annoni was named Vice President, Controller and Treasurer on May 8, 2012.
Michael R. Dressen (1963) AML Compliance Officer since 2011
Mr. Dressen currently serves as Assistant Vice President of HLIC. He also serves as Chief Compliance Officer and AML Compliance Officer of Hartford Administrative Services Company (“HASCO”) and as Assistant Secretary and Compliance Officer of HIFSCO. Mr Dressen joined The Hartford in 2005 from State Farm Insurance Companies where he held various positions related to mutual funds, variable products, and property casualty insurance.
Tamara L. Fagely (1958) Vice President, since 2002 (HSF) and 1993 (HSF2)(4)
Ms. Fagely has been a Vice President of HASCO since 1998 and Chief Financial Officer since 2006. Currently Ms. Fagely is a Vice President of HLIC. She served as Assistant Vice President of HLIC from December 2001 through March 2005. In addition, Ms. Fagely is Controller and Chief Financial Officer of HIFSCO.
(4) Ms. Fagely served as Vice President, Controller and Treasurer until May 8, 2012.
Dr. Robert J. Froehlich (1953) Senior Managing Director since 2009(5)
Dr. Froehlich joined The Hartford as Senior Managing Director in September 2009. Prior to joining The Hartford, Dr. Froehlich served as Vice Chairman of Deutsche Asset Management from 1997-2009.
(5) Dr. Froehlich served as Senior Managing Director until March 26, 2012.
| 33 |
Hartford Capital Appreciation HLS Fund
Directors and Officers (Unaudited) – (continued)
Edward P. Macdonald (1967) Vice President, Secretary and Chief Legal Officer since 2005
Mr. Macdonald serves as Vice President of HLIC and Chief Legal Officer of Mutual Funds and Vice President of HIFSCO. He also serves as Vice President and Secretary of HASCO, and Chief Legal Officer, Secretary and Vice President of HL Advisors. Mr. Macdonald joined The Hartford in 2005.
Vernon J. Meyer (1964) Vice President since 2006
Mr. Meyer serves as Senior Vice President of HLIC. He also serves as Senior Vice President of HIFSCO and HL Advisors. Mr. Meyer joined The Hartford in 2004.
Colleen B. Pernerewski (1969) Vice President and Chief Compliance Officer since 2010
Ms. Pernerewski serves as Vice President and Chief Investment Advisor Compliance Officer of HIFSCO and as Vice President and Chief Compliance Officer of HL Advisors. Ms. Pernerewski serves as Vice President and Chief Compliance Officer of Individual Annuity of HLIC. Ms. Pernerewski joined The Hartford in 2005 from Travelers Life and Annuity where she served as Counsel (2004-2005). Prior to Travelers Life and Annuity, Ms. Pernerewski held the position of Counsel at The Hartford (1998-2004).
Elizabeth L. Schroeder (1966) Vice President since 2010
Ms. Schroeder currently serves as Assistant Vice President of HLIC. Ms. Schroeder joined HLIC in 1991. She is also an Assistant Vice President of HASCO, HIFSCO and HL Advisors.
Martin Swanson (1962) Vice President since 2010
Mr. Swanson is a Vice President of HLIC. Mr. Swanson also serves as Vice President/Marketing for HIFSCO. Prior to joining HLIC in 1998, Mr. Swanson was a Vice President at PaineWebber, Inc.
Jane Wolak (1961) Vice President since 2009
Ms. Wolak currently serves as Senior Vice President of HLIC. Ms. Wolak joined HLIC as Vice President, Retail Product Services in May 2007. She is also Vice President of HASCO. Previously, Ms. Wolak was with Sun Life Financial where she held the position of Vice President, Service Center Operations from 2001-2007.
HOW TO OBTAIN A COPY OF THE FUND’S PROXY VOTING POLICIES AND VOTING RECORDS (UNAUDITED)
A description of the policies and procedures that the Fund uses to determine how to vote proxies relating to portfolio securities and a record of how the Fund voted any proxies for the twelve-month period ended June 30, 2012 are available (1) without charge, upon request, by calling 800-862-6668 and (2) on the SEC’s website at http://www.sec.gov.
QUARTERLY PORTFOLIO HOLDINGS INFORMATION (UNAUDITED)
The Fund files a complete schedule of portfolio holdings with the SEC for the first and third quarters of each fiscal year on Form N-Q. The Fund’s Forms are available (1) without charge, upon request, by calling 800-862-6668 and (2) on the SEC’s website at http://www.sec.gov. The Form N-Q may be reviewed and copied at the SEC’s Public Reference Room in Washington, DC. Information on the operation of the Public Reference Room may be obtained by calling 1-800-SEC-0330.
| 34 |
Hartford Capital Appreciation HLS Fund
Expense Example (Unaudited)
Your Fund's Expenses
As a shareholder of the Fund, you incur two types of costs: (1) transaction costs and (2) ongoing costs including investment management fees, distribution fees, and other fund expenses. This example is intended to help you understand your ongoing costs (in dollars) of investing in the Fund and to compare these costs with the ongoing costs of investing in other mutual funds. The example is based on an investment of $1,000 invested at the beginning of the period and held for the period of December 31, 2011 through June 30, 2012.
Actual Expenses
The first set of columns of the table below provides information about actual account values and actual expenses. You may use the information in this column, together with the amount you invested, to estimate the expenses that you paid over the period. Simply divide your account value by $1,000 (for example, an $8,600 account value divided by $1,000 = 8.6), then multiply the result by the number in the line under the heading entitled “Expenses Paid During Period” to estimate the expenses you paid on your account during this period.
Hypothetical Example for Comparison Purposes
The second set of columns of the table below provides information about hypothetical account values and hypothetical expenses based on the Fund’s actual expense ratio and an assumed rate of return of 5% per year before expenses, which is not the Fund’s actual return. The hypothetical account values and expenses may not be used to estimate the actual ending account balance or expenses you paid for the period. You may use this information to compare the ongoing costs of investing in the Fund and other funds. To do so, compare this 5% hypothetical example with the 5% hypothetical examples that appear in the shareholder reports of the other funds.
Please note that the expenses shown in the table are meant to highlight your ongoing costs only and do not reflect any transactional costs, such as sales charges (loads) and CDSC. Therefore, the second set of columns of the table is useful in comparing ongoing costs only, and will not help you determine the relative total costs of owning different funds. In addition, if these transactional costs were included, your costs would be higher. Expenses are equal to the Fund's annualized expense ratios multiplied by average account value over the period, multiplied by 182/366 (to reflect the one-half year period).
| Actual return | Hypothetical (5% return before expenses) | |||||||||||||||||||||||||||||||||||
| Beginning Account Value December 31, 2011 | Ending Account Value June 30, 2012 | Expenses paid during the period December 31, 2011 through June 30, 2012 | Beginning Account Value December 31, 2011 | Ending Account Value June 30, 2012 | Expenses paid during the period December 31, 2011 through June 30, 2012 | Annualized expense ratio | Days in the current 1/2 year | Days in the full year | ||||||||||||||||||||||||||||
| Class IA | $ | 1,000.00 | $ | 1,076.04 | $ | 3.41 | $ | 1,000.00 | $ | 1,021.58 | $ | 3.32 | 0.66 | % | 182 | 366 | ||||||||||||||||||||
| Class IB | $ | 1,000.00 | $ | 1,074.69 | $ | 4.69 | $ | 1,000.00 | $ | 1,020.34 | $ | 4.57 | 0.91 | % | 182 | 366 | ||||||||||||||||||||
| 35 |
HARTFORD HLS FUNDS
c/o The Hartford Wealth Management - Global Annuities
P.O. Box 14293
Lexington, KY 40512-4293
Hartford Series Fund, Inc. is underwritten and distributed by Hartford Securities Distribution Company, Inc.
"The Hartford" is The Hartford Financial Services Group, Inc. and its subsidiaries.
Hartford Series Fund, Inc. inception dates range from 1977 to date. Hartford Series Fund, Inc. is not a subsidiary of The Hartford but is underwritten, distributed by and advised by subsidiaries of The Hartford. Investments in Hartford Series Fund, Inc. are not guaranteed by The Hartford or any other entity.
You should carefully consider investment objectives, risks, and charges and expenses of Hartford HLS Funds before investing. This and other information can be found in the Fund’s prospectus or summary prospectus, which can be obtained by calling 800-862-6668. Please read them carefully before you invest or send money.
| HLSSAR-CA12 8-12 111647 Printed in U.S.A ©2012 The Hartford, Hartford, CT 06115 | |

A MESSAGE FROM THE PRESIDENT
Dear Fellow Shareholders:
I want to take this opportunity to say thank you for investing in the Hartford HLS Funds. We’ve seen continued market volatility throughout the first half of 2012, and there will likely be continued uncertainty until the Presidential election in November, but we are still optimistic about the markets in 2012.
Market Review
In the first quarter of 2012, the S&P 500 Index turned in its best quarterly performance since the third quarter of 2009. U.S. equities showed signs of improvement as investors focused on improving economic data and strong corporate earnings news and the Federal Reserve’s pledge to keep interest rates low buoyed investors’ appetites.
The second quarter ended on a high note for the stock market—the S&P 500 had its strongest June in more than a decade and the Dow Jones Industrial Average had its best month since October—but those gains weren’t enough to offset losses from April and May, and equities finished the quarter in the red. Although the S&P 500 was -2.75 for the second quarter, it was up 9.49% for the first half of 2012.
Concerns about domestic and European unemployment are having an effect on our economy. The unemployment rate in the euro zone's 17 nations rose to a record 11.1% in May, the highest level since the euro launched as a common currency more than 10 years ago. In the U.S., the labor market has been fickle this year, with job growth starting off strong in the first couple months of 2012 but slowing down in the spring, which has led many to wonder about the status of the economic recovery.
On a positive note, home prices are rising again after falling for more than five years, new and existing home sales are increasing, and home builders are ramping up construction.
The Hartford HLS Funds Expands Relationship with Wellington Management
We’re very pleased that we are expanding our relationship with Wellington Management, which will now serve as the primary sub-adviser for the Hartford HLS Funds including equity, fixed-income,* and asset-allocation funds. One of America’s oldest and largest investment management firms, Wellington Management has resources that span the entire globe, with multiple offices across the U.S. and numerous offices abroad. Wellington Management’s most distinctive strength is its proprietary research, which is shared across the entire organization.
We believe that aligning more closely with a well-respected money manager like Wellington Management puts us in a strong position to drive significant growth and to continue delivering innovative fund strategies to help our investors meet their financial goals.
Thank you again for investing with the Hartford HLS Funds.
James Davey
President
Hartford HLS Funds
*Several fixed-income funds will continue to be sub-advised by Hartford Investment Management Company.
Hartford Disciplined Equity HLS Fund
This report is prepared for the general information of contract owners and qualified retirement plan participants. It is not an offer of contracts or of qualified retirement plans. It should not be used in connection with any offer, except in conjunction with the appropriate product prospectus which contains all pertinent information including the applicable sales, administrative and other charges.
The views expressed in the Fund’s Manager Discussion under ‘‘Why did the Fund perform this way?’’ and ‘‘What is the outlook?’’ are views of the Fund’s sub-adviser and portfolio management team through the end of the period and are subject to change based on market and other conditions.
Hartford Disciplined Equity HLS Fund inception 05/29/1998
(sub-advised by Wellington Management Company, LLP)
| Investment objective – Seeks growth of capital. |
Performance Overview 6/30/02 - 6/30/12

The chart above shows the growth of a $10,000 investment in Class 1A. Growth results in classes other than Class 1A will vary from what is seen above due to differences in the expenses charged to those share classes.
| Average Annual Total Returns (as of 6/30/12) |
| 6 Month† | 1 Year | 5 year | 10 year | |
| Disciplined Equity IA | 10.72% | 3.93% | 0.06% | 5.15% |
| Disciplined Equity IB | 10.59% | 3.67% | -0.19% | 4.88% |
| S&P 500 Index | 9.48% | 5.43% | 0.21% | 5.33% |
| † | Not Annualized |
PAST PERFORMANCE IS NOT INDICATIVE OF FUTURE RESULTS.
Total returns presented above were calculated using the Fund's net asset value available to shareholders for sale or redemption of Fund shares on June 30, 2012, which may exclude investment transactions as of this date.
S&P 500 Index is a market capitalization-weighted price index composed of 500 widely held common stocks.
You cannot invest directly in an index.
The chart represents a hypothetical investment in the Fund. Performance data represents past performance and current performance could be higher or lower.
Performance information may reflect historical or current expense waivers/reimbursements from the investment adviser, without which performance would have been lower. For information on current expense waivers/reimbursements, please see the prospectus.
The value of the Fund will fluctuate so that when redeemed, it may be worth more or less than the original investment. The chart and table do not reflect the deductions of taxes, sales charges or other fees which may be applied at the variable life insurance, variable annuity or qualified retirement plan product level. Any such additional sales charges or other fees or expenses would lower the contract’s or plan’s performance.
| 2 |
| Hartford Disciplined Equity HLS Fund |
| Manager Discussion |
| June 30, 2012 (Unaudited) |
| Portfolio Manager |
| Mammen Chally, CFA |
| Vice President and Equity Portfolio Manager |
How did the Fund perform?
The Class IA shares of the Hartford Disciplined Equity HLS Fund returned 10.72% for the six-month period ended June 30, 2012, outperforming its benchmark, the S&P 500, which returned 9.48% for the same period. The Fund also outperformed the 7.71% return of the average fund in the Lipper Large-Cap Core VP-UF Funds peer group, a group of funds with investment strategies similar to those of the Fund.
Why did the Fund perform this way?
The six-month period ended June 30, 2012 was a volatile period. U.S. equities surged during the beginning of the period as investors shrugged off lingering uncertainty over eurozone sovereign debt and focused instead on improving economic data. Strong corporate earnings news and the Federal Reserve’s pledge to keep interest rates low buoyed investors’ appetites for risk assets. However, following a strong first quarter, equities retreated in April, fell sharply in May, and recovered modestly in June. A lackluster U.S. jobs report, a heightened level of political uncertainty in France and Greece, and a host of Spanish and Italian bank downgrades by Moody’s dampened investor enthusiasm for equities. As the overall markets slowed, traditionally more defensive industries returned to favor while more cyclical industries experienced stronger sell-offs.
Overall equity market performance was positive for the period across all market capitalizations: large cap equities (+9.5%), mid caps (+7.9%), and small caps (+8.5%) all rose as represented by the S&P 500, S&P MidCap 400, and Russell 2000 Indices respectively. During the six-month period nine of ten sectors within the S&P 500 Index posted positive returns, led by Telecommunication Services (+17%) and Financials (+14%), while Energy (-2%) was the only sector to produce negative absolute returns.
The Fund outperformed its benchmark due to stock selection, which was strongest in Health Care, Information Technology, and Industrials. This was partially offset by weaker security selection in Consumer Discretionary, Energy, and Materials. Allocation among sectors had a negligible impact on relative performance (i.e. performance of the Fund as measured against the benchmark).
The largest contributors to benchmark relative performance were Regeneron Pharmaceuticals (Health Care), TJX Companies (Consumer Discretionary), and TransDigm Group (Industrials). Shares of biopharmaceutical company Regeneron Pharamaceuticals rose after the company reported better-than-expected sales and raised guidance during the second quarter. Shares of discount retailers TJX benefitted from increasing same-store sales growth in an environment of rising prices at some full-priced retailers. Shares of TransDigm Group, a global designer, producer and supplier of aircraft components for use on commercial and military aircraft in service, rose for the quarter after the company posted strong quarterly revenue and management raised its earnings guidance for the 2012 fiscal year. Top contributors to absolute performance (i.e. total return) included Apple (Information Technology).
The largest detractors from absolute performance and performance relative to the benchmark were Deckers Outdoor (Consumer Discretionary), Abercrombie & Fitch (Consumer Discretionary), and Chesapeake Energy (Energy). Deckers Outdoor is a designer and marketer of fashion-oriented footwear, including the UGG and Teva proprietary brands. Shares declined after disappointing guidance and margin pressures from higher product costs led to a reduction in consensus earnings expectations. Retailer Abercrombie & Fitch reported a disappointing quarter as same store sales turned modestly negative in the European flagships. Shares of Chesapeake Energy, a producer of natural gas, oil, and natural gas liquids, underperformed on concerns that increased spending on leaseholds and capital expenditures would not result in higher production guidance.
What is the outlook?
While the economic outlook has remained uncertain, our level of confidence in a continued modest global recovery has diminished more recently. Europe has been a concern for more than four quarters now; and, over the past couple of quarters we have seen dramatic reductions in growth in Brazil and India as well. China continues its gradual slowing. With slowing in more geographies recently, the risk has increased that China’s growth rate could deteriorate further given the importance of exports to their economy. While we have been optimistic about the U.S. economy and a continued recovery characterized by modest growth and manageable inflation, the data in the past few months has come in lower than we would have hoped and signals slowing conditions. The fact that many segments of the economy have not yet recovered to anywhere near peak conditions gives us some optimism that positive, albeit slower, growth will continue. In a global context, we
| 3 |
| Hartford Disciplined Equity HLS Fund |
| Manager Discussion – (continued) |
| June 30, 2012 (Unaudited) |
believe that the U.S. economy continues to be better positioned than other major economies. However, the U.S. may face a fiscal cliff headwind early in 2013 with the potential expiration of various tax cuts. Market volatility may remain elevated as we approach the U.S. presidential election.
The Fund focuses on stock selection as the key driver of returns and uses proprietary fundamental and quantitative research in a disciplined framework to build a portfolio of what we believe to be the most attractive stocks. Sector exposures are residuals from this bottom-up stock selection process (i.e. stock by stock fundamental research) and are not explicit management decisions. Based on individual stock decisions, the Fund ended the period most overweight the Health Care, Information Technology, and Industrials sectors and most underweight the Financials, Telecommunication Services, and Energy sectors relative to the S&P 500 Index, the Fund’s benchmark.
| Diversification by Industry |
| as of June 30, 2012 |
| Industry (Sector) | Percentage of Net Assets | |||
| Automobiles & Components (Consumer Discretionary) | 0.8 | % | ||
| Banks (Financials) | 4.8 | |||
| Capital Goods (Industrials) | 8.7 | |||
| Commercial & Professional Services (Industrials) | 1.8 | |||
| Consumer Durables & Apparel (Consumer Discretionary) | 1.1 | |||
| Consumer Services (Consumer Discretionary) | 1.3 | |||
| Diversified Financials (Financials) | 5.2 | |||
| Energy (Energy) | 9.2 | |||
| Food & Staples Retailing (Consumer Staples) | 3.6 | |||
| Food, Beverage & Tobacco (Consumer Staples) | 6.6 | |||
| Health Care Equipment & Services (Health Care) | 4.3 | |||
| Household & Personal Products (Consumer Staples) | 1.2 | |||
| Insurance (Financials) | 1.7 | |||
| Materials (Materials) | 2.3 | |||
| Media (Consumer Discretionary) | 1.1 | |||
| Pharmaceuticals, Biotechnology & Life Sciences (Health Care) | 11.8 | |||
| Retailing (Consumer Discretionary) | 6.6 | |||
| Semiconductors & Semiconductor Equipment (Information Technology) | 0.8 | |||
| Software & Services (Information Technology) | 14.7 | |||
| Technology Hardware & Equipment (Information Technology) | 7.5 | |||
| Telecommunication Services (Services) | 0.7 | |||
| Utilities (Utilities) | 3.1 | |||
| Short-Term Investments | 0.7 | |||
| Other Assets and Liabilities | 0.4 | |||
| Total | 100.0 | % | ||
| 4 |
| Hartford Disciplined Equity HLS Fund |
| Schedule of Investments |
| June 30, 2012 (Unaudited) |
| Shares or Principal Amount | Market Value ╪ | |||||||
| COMMON STOCKS - 98.9% | ||||||||
| Automobiles & Components - 0.8% | ||||||||
| 850 | Ford Motor Co. w/ Rights | $ | 8,148 | |||||
| Banks - 4.8% | ||||||||
| 258 | BB&T Corp. | 7,945 | ||||||
| 245 | PNC Financial Services Group, Inc. | 14,971 | ||||||
| 691 | Wells Fargo & Co. | 23,095 | ||||||
| 46,011 | ||||||||
| Capital Goods - 8.7% | ||||||||
| 153 | AMETEK, Inc. | 7,653 | ||||||
| 72 | Boeing Co. | 5,374 | ||||||
| 54 | Caterpillar, Inc. | 4,592 | ||||||
| 103 | Cooper Industries plc Class A | 7,008 | ||||||
| 119 | Dover Corp. | 6,370 | ||||||
| 595 | General Electric Co. | 12,397 | ||||||
| 126 | Illinois Tool Works, Inc. | 6,646 | ||||||
| 59 | Parker-Hannifin Corp. | 4,566 | ||||||
| 79 | TransDigm Group, Inc. ●Θ | 10,634 | ||||||
| 188 | United Technologies Corp. | 14,178 | ||||||
| 27 | W.W. Grainger, Inc. | 5,162 | ||||||
| 84,580 | ||||||||
| Commercial & Professional Services - 1.8% | ||||||||
| 183 | Equifax, Inc. ● | 8,508 | ||||||
| 143 | Towers Watson & Co. | 8,578 | ||||||
| 17,086 | ||||||||
| Consumer Durables & Apparel - 1.1% | ||||||||
| 136 | PVH Corp. | 10,606 | ||||||
| Consumer Services - 1.3% | ||||||||
| 142 | McDonald's Corp. | 12,590 | ||||||
| Diversified Financials - 5.2% | ||||||||
| 131 | Ameriprise Financial, Inc. | 6,845 | ||||||
| 1,110 | Bank of America Corp. Θ | 9,079 | ||||||
| 33 | BlackRock, Inc. | 5,538 | ||||||
| 317 | Citigroup, Inc. Θ | 8,696 | ||||||
| 384 | JP Morgan Chase & Co. | 13,730 | ||||||
| 407 | SLM Corp. | 6,397 | ||||||
| 50,285 | ||||||||
| Energy - 9.2% | ||||||||
| 111 | Anadarko Petroleum Corp. | 7,371 | ||||||
| 107 | Chevron Corp. | 11,251 | ||||||
| 273 | Cobalt International Energy ● | 6,424 | ||||||
| 191 | ConocoPhillips Holding Co. | 10,690 | ||||||
| 217 | Exxon Mobil Corp. | 18,539 | ||||||
| 110 | Marathon Petroleum Corp. | 4,948 | ||||||
| 106 | National Oilwell Varco, Inc. | 6,815 | ||||||
| 158 | Occidental Petroleum Corp. Θ | 13,510 | ||||||
| 131 | Phillips 66 ● | 4,362 | ||||||
| 318 | WPX Energy, Inc. ● | 5,137 | ||||||
| 89,047 | ||||||||
| Food & Staples Retailing - 3.6% | ||||||||
| 110 | Costco Wholesale Corp. | 10,484 | ||||||
| 297 | CVS Caremark Corp. | 13,896 | ||||||
| 339 | Walgreen Co. | 10,018 | ||||||
| 34,398 | ||||||||
| Food, Beverage & Tobacco - 6.6% | ||||||||
| 367 | Altria Group, Inc. | 12,690 | ||||||
| 84 | Lorillard, Inc. | 11,040 | ||||||
| 233 | PepsiCo, Inc. | 16,443 | ||||||
| 272 | Philip Morris International, Inc. | 23,702 | ||||||
| 63,875 | ||||||||
| Health Care Equipment & Services - 4.3% | ||||||||
| 147 | Covidien plc | 7,862 | ||||||
| 112 | McKesson Corp. | 10,460 | ||||||
| 140 | St. Jude Medical, Inc. | 5,593 | ||||||
| 298 | UnitedHealth Group, Inc. Θ | 17,410 | ||||||
| 41,325 | ||||||||
| Household & Personal Products - 1.2% | ||||||||
| 151 | Energizer Holdings, Inc. ● | 11,353 | ||||||
| Insurance - 1.7% | ||||||||
| 109 | ACE Ltd. | 8,099 | ||||||
| 265 | MetLife, Inc. | 8,167 | ||||||
| 16,266 | ||||||||
| Materials - 2.3% | ||||||||
| 337 | Dow Chemical Co. Θ | 10,617 | ||||||
| 121 | Newmont Mining Corp. Θ | 5,882 | ||||||
| 41 | Sherwin-Williams Co. | 5,397 | ||||||
| 21,896 | ||||||||
| Media - 1.1% | ||||||||
| 225 | Viacom, Inc. Class B | 10,602 | ||||||
| Pharmaceuticals, Biotechnology & Life Sciences - 11.8% | ||||||||
| 136 | Agilent Technologies, Inc. | 5,348 | ||||||
| 155 | Amgen, Inc. | 11,321 | ||||||
| 51 | Biogen Idec, Inc. ● | 7,320 | ||||||
| 301 | Eli Lilly & Co. | 12,915 | ||||||
| 344 | Forest Laboratories, Inc. ● | 12,019 | ||||||
| 219 | Gilead Sciences, Inc. ● | 11,218 | ||||||
| 669 | Merck & Co., Inc. | 27,919 | ||||||
| 34 | Regeneron Pharmaceuticals, Inc. ● | 3,937 | ||||||
| 124 | Salix Pharmaceuticals Ltd. ● | 6,727 | ||||||
| 108 | Thermo Fisher Scientific, Inc. | 5,583 | ||||||
| 137 | Watson Pharmaceuticals, Inc. ● | 10,163 | ||||||
| 114,470 | ||||||||
| Retailing - 6.6% | ||||||||
| 186 | Abercrombie & Fitch Co. Class A Θ | 6,360 | ||||||
| 79 | Amazon.com, Inc. ● | 18,031 | ||||||
| 391 | Lowe's Co., Inc. | 11,133 | ||||||
| 192 | Ross Stores, Inc. | 12,017 | ||||||
| 377 | TJX Cos., Inc. | 16,190 | ||||||
| 63,731 | ||||||||
| Semiconductors & Semiconductor Equipment - 0.8% | ||||||||
| 204 | Avago Technologies Ltd. | 7,338 | ||||||
| Software & Services - 14.7% | ||||||||
| 238 | Accenture plc | 14,315 | ||||||
| 768 | Activision Blizzard, Inc. | 9,204 | ||||||
| 275 | eBay, Inc. ● | 11,552 | ||||||
| 71 | Factset Research Systems, Inc. | 6,621 | ||||||
| 21 | Google, Inc. ● | 12,106 | ||||||
| 197 | Intuit, Inc. | 11,718 | ||||||
| 18 | Mastercard, Inc. | 7,708 | ||||||
| 862 | Microsoft Corp. | 26,354 | ||||||
| 619 | Oracle Corp. | 18,384 | ||||||
| 76 | Teradata Corp. ● | 5,485 | ||||||
| 312 | VeriSign, Inc. | 13,575 | ||||||
The accompanying notes are an integral part of these financial statements.
| 5 |
| Hartford Disciplined Equity HLS Fund |
| Schedule of Investments – (continued) |
| June 30, 2012 (Unaudited) |
| Shares or Principal Amount | Market Value ╪ | |||||||||||
| COMMON STOCKS - 98.9% - (continued) | ||||||||||||
| Software & Services - 14.7% - (continued) | ||||||||||||
| 298 | Western Union Co. | $ | 5,026 | |||||||||
| 142,048 | ||||||||||||
| Technology Hardware & Equipment - 7.5% | ||||||||||||
| 74 | Apple, Inc. ● | 43,032 | ||||||||||
| 584 | Cisco Systems, Inc. | 10,032 | ||||||||||
| 447 | EMC Corp. ● | 11,463 | ||||||||||
| 152 | Qualcomm, Inc. | 8,469 | ||||||||||
| 72,996 | ||||||||||||
| Telecommunication Services - 0.7% | ||||||||||||
| 180 | AT&T, Inc. | 6,431 | ||||||||||
| Utilities - 3.1% | ||||||||||||
| 238 | American Electric Power Co., Inc. | 9,484 | ||||||||||
| 103 | NextEra Energy, Inc. | 7,086 | ||||||||||
| 482 | Xcel Energy, Inc. | 13,690 | ||||||||||
| 30,260 | ||||||||||||
| Total common stocks | ||||||||||||
| (cost $762,533) | $ | 955,342 | ||||||||||
| Total long-term investments | ||||||||||||
| (cost $762,533) | $ | 955,342 | ||||||||||
| SHORT-TERM INVESTMENTS - 0.7% | ||||||||||||
| Repurchase Agreements - 0.7% | ||||||||||||
| Bank of America Merrill Lynch TriParty Joint Repurchase Agreement (maturing on 07/02/2012 in the amount of $3,426, collateralized by FHLMC 5.50% - 6.50%, 2035 - 2036, FNMA 5.00% - 6.00%, 2033 - 2039, value of $3,495) | ||||||||||||
| $ | 3,426 | 0.13%, 06/29/2012 | $ | 3,426 | ||||||||
| Barclays Capital TriParty Joint Repurchase Agreement (maturing on 07/02/2012 in the amount of $1,239, collateralized by U.S. Treasury Note 1.25% - 3.63%, 2014 - 2020, value of $1,263) | ||||||||||||
| 1,239 | 0.15%, 06/29/2012 | 1,239 | ||||||||||
| Deutsche Bank Securities TriParty Joint Repurchase Agreement (maturing on 07/02/2012 in the amount of $332, collateralized by U.S. Treasury Note 0.88%, 2016, value of $339) | ||||||||||||
| 332 | 0.20%, 06/29/2012 | 332 | ||||||||||
| TD Securities TriParty Joint Repurchase Agreement (maturing on 07/02/2012 in the amount of $970, collateralized by FHLMC 4.00% - 6.00%, 2027 - 2041, FNMA 4.00% - 4.50%, 2025 - 2042, U.S. Treasury Bond 6.38%, 2027, U.S. Treasury Note 0.38% - 8.75%, 2012 - 2017, value of $989) | ||||||||||||
| 970 | 0.15%, 06/29/2012 | 970 | ||||||||||
| UBS Securities, Inc. Joint Repurchase Agreement (maturing on 07/02/2012 in the amount of $-, collateralized by U.S. Treasury Note 1.00%, 2013, value of $-) | ||||||||||||
| — | 0.13%, 06/29/2012 | — | ||||||||||
| UBS Securities, Inc. TriParty Joint Repurchase Agreement (maturing on 07/02/2012 in the amount of $437, collateralized by GNMA 4.00%, 2042, value of $446) | ||||||||||||
| 437 | 0.20%, 06/29/2012 | 437 | ||||||||||
| 6,404 | ||||||||||||
| Total short-term investments | ||||||||||||
| (cost $6,404) | $ | 6,404 | ||||||||||
| Total investments | ||||||||||||
| (cost $768,937) ▲ | 99.6 | % | $ | 961,746 | ||||||||
| Other assets and liabilities | 0.4 | % | 3,888 | |||||||||
| Total net assets | 100.0 | % | $ | 965,634 | ||||||||
| Note: | Percentage of investments as shown is the ratio of the total market value to total net assets. |
| ▲ | At June 30, 2012, the cost of securities for federal income tax purposes was $769,559 and the aggregate gross unrealized appreciation and depreciation based on that cost were: |
| Unrealized Appreciation | $ | 212,978 | ||
| Unrealized Depreciation | (20,791 | ) | ||
| Net Unrealized Appreciation | $ | 192,187 |
| ● | Non-income producing. |
The accompanying notes are an integral part of these financial statements.
| 6 |
| Θ | At June 30, 2012, this security, or a portion of this security, is designated to cover written call options in the table below: |
| Description | Option Type | Exercise Price/Rate | Expiration Date | Number of Contracts* | Market Value ╪ | Premiums Received | Unrealized Appreciation (Depreciation) | |||||||||||||||||||
| Abercrombie & Fitch Co. Option | Equity | $ | 43.00 | 07/21/2012 | 260 | $ | – | $ | 16 | $ | 16 | |||||||||||||||
| Bank of America Corp. Option | Equity | $ | 8.00 | 07/21/2012 | 1,311 | 55 | 29 | (26 | ) | |||||||||||||||||
| Citigroup, Inc. Option | Equity | $ | 31.00 | 07/21/2012 | 343 | 3 | 11 | 8 | ||||||||||||||||||
| Dow Chemical Co. Option | Equity | $ | 33.00 | 07/21/2012 | 307 | 6 | 15 | 9 | ||||||||||||||||||
| Newmont Mining Corp. Option | Equity | $ | 55.00 | 07/21/2012 | 196 | 2 | 12 | 10 | ||||||||||||||||||
| Occidental Petroleum Corp. Option | Equity | $ | 87.50 | 07/21/2012 | 119 | 16 | 12 | (4 | ) | |||||||||||||||||
| TransDigm Group, Inc. Option | Equity | $ | 130.00 | 07/21/2012 | 75 | 39 | 16 | (23 | ) | |||||||||||||||||
| UnitedHealth Group, Inc. Option | Equity | $ | 62.50 | 07/21/2012 | 169 | 4 | 11 | 7 | ||||||||||||||||||
| $ | 125 | $ | 122 | $ | (3 | ) | ||||||||||||||||||||
* The number of contracts does not omit 000's.
| Written Put Option Contracts Outstanding at June 30, 2012 |
| Description | Option Type | Exercise Price/Rate | Expiration Date | Number of Contracts* | Market Value ╪ | Premiums Received | Unrealized Appreciation (Depreciation) | |||||||||||||||||||
| Agilent Technologies, Inc. Option | Equity | $ | 36.00 | 07/21/2012 | 239 | $ | 6 | $ | 10 | $ | 4 | |||||||||||||||
| Blackrock, Inc. Option | Equity | $ | 140.00 | 07/21/2012 | 56 | 1 | 14 | 13 | ||||||||||||||||||
| Caterpillar, Inc. Option | Equity | $ | 80.00 | 07/21/2012 | 102 | 8 | 13 | 5 | ||||||||||||||||||
| Ford Motor Co. Option | Equity | $ | 9.00 | 07/21/2012 | 918 | 8 | 10 | 2 | ||||||||||||||||||
| JP Morgan Chase & Co. Option | Equity | $ | 26.00 | 07/21/2012 | 276 | 1 | 10 | 9 | ||||||||||||||||||
| MetLife, Inc. Option | Equity | $ | 25.00 | 07/21/2012 | 300 | 2 | 11 | 9 | ||||||||||||||||||
| PVH Corp. Option | Equity | $ | 72.50 | 07/19/2012 | 119 | 9 | 12 | 3 | ||||||||||||||||||
| Regeneron Pharmaceuticals, Inc. Option | Equity | $ | 100.00 | 07/21/2012 | 81 | 6 | 10 | 4 | ||||||||||||||||||
| $ | 41 | $ | 90 | $ | 49 | |||||||||||||||||||||
* The number of contracts does not omit 000's.
Cash of $2,769 was pledged as collateral for open written put option contracts at June 30, 2012.
| Futures Contracts Outstanding at June 30, 2012 |
| Description | Number of Contracts* | Position | Expiration Date | Market Value ╪ | Notional Amount | Unrealized Appreciation/ (Depreciation) | ||||||||||||||||
| S&P 500 (E-Mini) Future | 76 | Long | 09/21/2012 | $ | 5,154 | $ | 5,024 | $ | 130 | |||||||||||||
| * The number of contracts does not omit 000's. |
| Cash of $266 was pledged as initial margin deposit and collateral for daily variation margin loss on open futures contracts at June 30, 2012. |
| ╪ | See Significant Accounting Policies of accompanying Notes to Financial Statements regarding valuation of securities. |
| GLOSSARY: (abbreviations used in preceding Schedule of Investments) | |
| Index Abbreviations: | |
| S&P | Standard & Poors |
| Other Abbreviations: | |
| FHLMC | Federal Home Loan Mortgage Corp. |
| FNMA | Federal National Mortgage Association |
| GNMA | Government National Mortgage Association |
The accompanying notes are an integral part of these financial statements.
| 7 |
| Hartford Disciplined Equity HLS Fund |
| Investment Valuation Hierarchy Level Summary |
| June 30, 2012 (Unaudited) |
| (000’s Omitted) |
| Total | Level 1 ♦ | Level 2 ♦ | Level 3 | |||||||||||||
| Assets: | ||||||||||||||||
| Common Stocks ‡ | $ | 955,342 | $ | 955,342 | $ | – | $ | – | ||||||||
| Short-Term Investments | 6,404 | – | 6,404 | – | ||||||||||||
| Total | $ | 961,746 | $ | 955,342 | $ | 6,404 | $ | – | ||||||||
| Futures * | 130 | 130 | – | – | ||||||||||||
| Written Options * | 99 | 99 | – | – | ||||||||||||
| Total | $ | 229 | $ | 229 | $ | – | $ | – | ||||||||
| Liabilities: | ||||||||||||||||
| Written Options * | 53 | 53 | – | – | ||||||||||||
| Total | $ | 53 | $ | 53 | $ | – | $ | – | ||||||||
| ♦ | For the six-month period ended June 30, 2012, there were no transfers between Level 1 and Level 2. |
| ‡ | The Fund has all or primarily all of the equity securities categorized in a particular level. Refer to the Schedule of Investments for further industry breakout. |
| * | Derivative instruments not reflected in the Schedule of Investments are valued at the unrealized appreciation/depreciation on the investments. |
The accompanying notes are an integral part of these financial statements.
| 8 |
| Hartford Disciplined Equity HLS Fund |
| Statement of Assets and Liabilities |
| June 30, 2012 (Unaudited) |
| (000’s Omitted) |
| Assets: | ||||
| Investments in securities, at market value (cost $768,937) | $ | 961,746 | ||
| Cash | 3,279 | *† | ||
| Receivables: | ||||
| Investment securities sold | 194 | |||
| Fund shares sold | 198 | |||
| Dividends and interest | 1,302 | |||
| Variation margin | 247 | |||
| Total assets | 966,966 | |||
| Liabilities: | ||||
| Payables: | ||||
| Investment securities purchased | 151 | |||
| Fund shares redeemed | 828 | |||
| Variation margin | 15 | |||
| Investment management fees | 93 | |||
| Distribution fees | 4 | |||
| Accrued expenses | 75 | |||
| Written options (proceeds $212) | 166 | |||
| Total liabilities | 1,332 | |||
| Net assets | $ | 965,634 | ||
| Summary of Net Assets: | ||||
| Capital stock and paid-in-capital | $ | 965,652 | ||
| Undistributed net investment income | 6,006 | |||
| Accumulated net realized loss | (199,009 | ) | ||
| Unrealized appreciation of investments | 192,985 | |||
| Net assets | $ | 965,634 | ||
| Shares authorized | 3,500,000 | |||
| Par value | $ | 0.001 | ||
| Class IA: Net asset value per share | $ | 13.05 | ||
| Shares outstanding | 64,382 | |||
| Net assets | $ | 840,022 | ||
| Class IB: Net asset value per share | $ | 12.97 | ||
| Shares outstanding | 9,687 | |||
| Net assets | $ | 125,612 |
* Cash of $2,769 was designated to cover open put options written at June 30, 2012.
† Cash of $266 was pledged as initial margin deposit and collateral for open futures contracts at June 30, 2012.
The accompanying notes are an integral part of these financial statements.
| 9 |
| Hartford Disciplined Equity HLS Fund |
| Statement of Operations |
| For the Six-Month Period Ended June 30, 2012 (Unaudited) |
| (000’s Omitted) |
| Investment Income: | ||||
| Dividends | $ | 9,210 | ||
| Interest | 11 | |||
| Total investment income, net | 9,221 | |||
| Expenses: | ||||
| Investment management fees | 3,562 | |||
| Distribution fees - Class IB | 164 | |||
| Custodian fees | 3 | |||
| Accounting services fees | 60 | |||
| Board of Directors' fees | 12 | |||
| Audit fees | 8 | |||
| Other expenses | 97 | |||
| Total expenses (before fees paid indirectly) | 3,906 | |||
| Commission recapture | (8 | ) | ||
| Total fees paid indirectly | (8 | ) | ||
| Total expenses, net | 3,898 | |||
| Net investment income | 5,323 | |||
| Net Realized Gain on Investments and Other Financial Instruments: | ||||
| Net realized gain on investments | 37,224 | |||
| Net realized gain on futures | 1,393 | |||
| Net realized gain on written options | 338 | |||
| Net Realized Gain on Investments and Other Financial Instruments | 38,955 | |||
| Net Changes in Unrealized Appreciation of Investments and Other Financial Instruments: | ||||
| Net unrealized appreciation of investments | 58,641 | |||
| Net unrealized appreciation of futures | 168 | |||
| Net unrealized appreciation of written options | 51 | |||
| Net Changes in Unrealized Appreciation of Investments and Other Financial Instruments | 58,860 | |||
| Net Gain on Investments and Other Financial Instruments | 97,815 | |||
| Net Increase in Net Assets Resulting from Operations | $ | 103,138 |
The accompanying notes are an integral part of these financial statements.
| 10 |
| Hartford Disciplined Equity HLS Fund |
| Statement of Changes in Net Assets |
| (000’s Omitted) |
| For the Six-Month Period Ended June 30, 2012 (Unaudited) | For the Year Ended December 31, 2011 | |||||||
| Operations: | ||||||||
| Net investment income | $ | 5,323 | $ | 11,096 | ||||
| Net realized gain on investments and other financial instruments | 38,955 | 76,546 | ||||||
| Net unrealized appreciation (depreciation) of investments and other financial instruments | 58,860 | (69,588 | ) | |||||
| Net Increase In Net Assets Resulting From Operations | 103,138 | 18,054 | ||||||
| Distributions to Shareholders: | ||||||||
| From net investment income | ||||||||
| Class IA | — | (10,406 | ) | |||||
| Class IB | — | (1,233 | ) | |||||
| Total distributions | — | (11,639 | ) | |||||
| Capital Share Transactions: | ||||||||
| Class IA | ||||||||
| Sold | 20,086 | 40,647 | ||||||
| Issued on reinvestment of distributions | — | 10,406 | ||||||
| Redeemed | (122,071 | ) | (226,529 | ) | ||||
| Total capital share transactions | (101,985 | ) | (175,476 | ) | ||||
| Class IB | ||||||||
| Sold | 6,074 | 12,903 | ||||||
| Issued on reinvestment of distributions | — | 1,233 | ||||||
| Redeemed | (23,321 | ) | (45,566 | ) | ||||
| Total capital share transactions | (17,247 | ) | (31,430 | ) | ||||
| Net decrease from capital share transactions | (119,232 | ) | (206,906 | ) | ||||
| Net Decrease In Net Assets | (16,094 | ) | (200,491 | ) | ||||
| Net Assets: | ||||||||
| Beginning of period | 981,728 | 1,182,219 | ||||||
| End of period | $ | 965,634 | $ | 981,728 | ||||
| Undistributed (distribution in excess of) net investment income | $ | 6,006 | $ | 683 | ||||
| Shares: | ||||||||
| Class IA | ||||||||
| Sold | 1,578 | 3,390 | ||||||
| Issued on reinvestment of distributions | — | 891 | ||||||
| Redeemed | (9,524 | ) | (18,634 | ) | ||||
| Total share activity | (7,946 | ) | (14,353 | ) | ||||
| Class IB | ||||||||
| Sold | 478 | 1,078 | ||||||
| Issued on reinvestment of distributions | — | 106 | ||||||
| Redeemed | (1,827 | ) | (3,775 | ) | ||||
| Total share activity | (1,349 | ) | (2,591 | ) | ||||
The accompanying notes are an integral part of these financial statements.
| 11 |
| Hartford Disciplined Equity HLS Fund |
| Notes to Financial Statements |
| June 30, 2012 (Unaudited) |
| (000’s Omitted) |
| 1. | Organization: |
Hartford Disciplined Equity HLS Fund (the “Fund”) serves as an underlying investment option for certain variable annuity and variable life insurance separate accounts of Hartford Life Insurance Company (“HLIC”) and its affiliates and certain qualified retirement plans. The Fund may also serve as an underlying investment option for certain variable annuity and variable life separate accounts of other insurance companies. Owners of variable annuity contracts and policyholders of variable life insurance contracts may choose the funds permitted in the variable insurance contract prospectus. In addition, participants in certain qualified retirement plans may choose the Fund if permitted by their plans.
Hartford Series Fund, Inc. (the “Company”) is an open-end registered management investment company comprised of thirty portfolios. Financial Statements for the Fund, a series of the Company, are included in this report.
The Company is organized under the laws of the State of Maryland and is registered with the Securities and Exchange Commission (“SEC”) under the Investment Company Act of 1940, as amended (“1940 Act”). The Fund is a diversified open-end management investment company.
The Fund is divided into Class IA and Class IB shares. Each class is offered at the per share net asset value (“NAV”) without a sales charge and is subject to the same expenses, except that the Class IB shares are subject to distribution and service fees charged pursuant to a Distribution Plan adopted in accordance with Rule 12b-1 under the 1940 Act.
| 2. | Significant Accounting Policies: |
The following is a summary of significant accounting policies of the Fund in the preparation of its financial statements, which are in accordance with the United States Generally Accepted Accounting Principles (“U.S. GAAP”). The preparation of financial statements in accordance with U.S. GAAP may require management to make estimates and assumptions that affect the reported amounts of assets and liabilities and disclosure of contingent assets and liabilities at the date of the financial statements and the reported amounts of increases and decreases in net assets from operations during the reporting period. Actual results could differ from those estimates.
| a) | Determination of Net Asset Value – The NAV of each class of the Fund’s shares is determined as of the close of regular trading (normally 4:00 p.m. Eastern Time) (the “NYSE Close”) on each day that the New York Stock Exchange (the “Exchange”) is open (“Valuation Date”). Information that becomes known to the Fund after the NAV has been calculated on a particular day will not generally be used to retroactively adjust the NAV determined earlier that day. |
| b) | Investment Valuation and Fair Value Measurements – For purposes of calculating the NAV, portfolio investments and other assets held by the Fund's portfolio for which market quotes are readily available are valued at market value. Market value is generally determined on the basis of last reported sales prices or official close price. If no sales are reported, market value is based on quotes obtained from a quotation reporting system, established market makers, or independent pricing services. If market prices are not readily available or are deemed unreliable, the Fund will use the fair value of the investment as determined in good faith under policies and procedures established by and under the supervision of the Company’s Board of Directors. Market quotes are considered not readily available where there is an absence of current or reliable market-based data (e.g., trade information or broker quotes), including where events occur after the close of the relevant market, but prior to the NYSE Close that materially affect the values of the Fund’s portfolio investments or assets. In addition, market quotes are considered not readily available when, due to extraordinary circumstances, the exchanges or markets on which the investments trade do not open for trading for the entire day and no other market prices are available. In addition, prices of foreign equities that are principally traded on certain foreign markets are adjusted daily pursuant to a fair value pricing service approved by the Board of Directors in order to reflect an adjustment for the factors occurring after the close of certain foreign markets but before the NYSE Close. Investments that are primarily traded on foreign markets may trade on days that are not business days of the Fund. The value of the foreign investments in which the Fund invests may change on days when a shareholder will not be able to purchase or |
| 12 |
redeem shares of the Fund. Fair value pricing is subjective in nature and the use of fair value pricing by the Fund may cause the NAV of its shares to differ significantly from the NAV that would have been calculated using market prices at the close of the exchange on which a portfolio investment is primarily traded. There can be no assurance that the Fund could obtain the fair market value assigned to an investment if the Fund were to sell the investment at approximately the time at which the Fund determines its NAV.
Exchange traded options, futures and options on futures are valued at the settlement price determined by the relevant exchange as of the NYSE Close. If such instruments do not trade on an exchange, values may be supplied by an independent pricing service using a formula or other objective method that may take into consideration the style, direction, expiration, strike price, notional value and volatility or other adjustments.
Financial instruments for which prices are not available from an independent pricing service may be valued using market quotations obtained from one or more dealers that make markets in the respective financial instrument in accordance with procedures established by the Company’s Board of Directors.
U.S. GAAP defines fair value as the price that the Fund would receive to sell an asset or pay to transfer a liability in an orderly transaction between market participants. The U.S. GAAP fair value measurement standards require disclosure of a fair value hierarchy for each major category of assets and liabilities. Various inputs are used in determining the fair value of the Fund’s investments. These inputs are summarized into three broad hierarchy levels. This hierarchy is based on whether the valuation inputs are observable or unobservable. These levels are:
| · | Level 1 – Quoted prices in active markets for identical investments. Level 1 may include exchange traded instruments, such as domestic equities, some foreign equities, options, futures, mutual funds, exchange traded funds, rights and warrants. |
| · | Level 2 – Observable inputs other than Level 1 prices, such as quoted prices for similar investments; quoted prices in markets that are not active; or other inputs that are observable or can be corroborated by observable market data. Level 2 may include debt investments that are traded less frequently than exchange traded instruments and which are valued using independent pricing services; foreign equities, which are principally traded on certain foreign markets and are adjusted daily pursuant to a fair value pricing service in order to reflect an adjustment for the factors occurring after the close of certain foreign markets but before the NYSE Close; and short-term investments, which are valued at amortized cost. |
| · | Level 3 – Significant unobservable inputs that are supported by limited or no market activity. Level 3 may include financial instruments whose values are determined using broker quotes or require significant management judgment or estimation. These unobservable valuation inputs may include estimates for current yields, maturity/duration, prepayment speed, and broker quotes for comparable investments along with other assumptions relating to credit quality, collateral value, complexity of the investment structure, general market conditions and liquidity. This category may include investments where trading has been halted or there are certain restrictions on trading. While these investments are priced using unobservable inputs, the valuation of these investments reflects the best available data and management believes the prices are a reasonable representation of exit price. |
The Board of Directors of the Company generally reviews and approves the “Procedures for Valuation of Portfolio Securities” on an annual basis. These procedures define how investments are to be valued, including the formation of a Valuation Committee. The Valuation Committee is responsible for determining in good faith the fair value of investments when the value cannot be obtained from primary pricing services or alternative sources or if the valuation of an investment as provided by the primary pricing service or alternative source is believed not to reflect the investment’s fair value as of the Valuation Date. Members of the Valuation Committee include the Fund’s Treasurer or designee, a Vice President of the Funds with legal expertise or designee, and a Vice President of the investment manager or designee. In addition, the Fund’s chief compliance officer shall designate a member of the compliance group to attend Valuation Committee meetings as a non-
| 13 |
| Hartford Disciplined Equity HLS Fund |
| Notes to Financial Statements – (continued) |
| June 30, 2012 (Unaudited) |
| (000’s Omitted) |
voting resource, to monitor for and provide guidance with respect to compliance with these procedures. Two members of the Valuation Committee or their designees, representing different departments, shall constitute a quorum for purposes of permitting the Valuation Committee to take action. The Valuation Committee will consider all relevant factors in determining an investment’s fair value, and may seek the advice of the Fund’s sub-adviser, knowledgeable brokers and legal counsel in making such determination. The Valuation Committee reports to the Audit Committee of the Company’s Board of Directors. The Audit Committee receives quarterly written reports which include details of all fair-valued investments, including the reason for the fair valuation, and an indication, when possible, of the accuracy of the valuation by disclosing the next available reliable public price quotation or the disposition price of such investments (the “look-back” test). The Board of Directors then must consider for ratification all of the fair value determinations made during the previous quarter.
Valuation levels are not necessarily indicative of the risk associated with investing in such investments. Individual investments within any of the above mentioned asset classes may be assigned a different hierarchical level than those presented above, as individual circumstances dictate.
For additional information, refer to the Investment Valuation Hierarchy Level Summary and the Level 3 roll-forward reconciliation which follow the Schedule of Investments.
For purposes of reporting transfers between different hierarchy levels, both transfers in and out of each level, as applicable, are shown as if they occurred at the beginning of the period.
| c) | Investment Transactions and Investment Income – Investment transactions are recorded as of the trade date (the date the order to buy or sell is executed) for financial reporting purposes. Investments purchased or sold on a when-issued or delayed-delivery basis may be settled a month or more after the trade date. Realized gains and losses are determined on the basis of identified cost. |
Dividend income is accrued as of the ex-dividend date, except certain dividends from foreign investments where the ex-dividend date may have passed are recorded as soon as the Fund is informed of the dividend. Interest income, including amortization of premium and accretion of discounts, is accrued on a daily basis.
| d) | Joint Trading Account – The Fund may invest cash balances into a joint trading account that may be invested in one or more repurchase agreements. |
| e) | Fund Share Valuation and Dividend Distributions to Shareholders – Orders for the Fund’s shares are executed in accordance with the investment instructions of the contract holders and plan participants. The NAV of the Fund’s shares is determined as of the close of business on each business day of the Exchange. The NAV is determined separately for each class of shares of the Fund by dividing the Fund’s net assets attributable to that class by the number of shares of the class outstanding. Each class of shares offered by the Fund has equal rights as to assets and voting privileges (except that shareholders of a class have exclusive voting rights regarding any matter relating solely to that class of shares). Income and non-class specific expenses are allocated daily to each class on the basis of the relative net assets of the class. Realized and unrealized capital gains and losses are allocated daily based on the relative net assets of each class of shares of the Fund. |
Orders for the purchase of the Fund’s shares received prior to the close of the Exchange on any day the Exchange is open for business are priced at the NAV determined as of the close of the Exchange. Orders received after the close of the Exchange, or on a day on which the Exchange and/or the Fund is not open for business, are priced at the next determined NAV.
| 14 |
Dividends are declared pursuant to a policy adopted by the Company’s Board of Directors based upon the investment performance of the Fund. The policy of the Fund is to pay dividends from net investment income and realized capital gains, if any, at least once a year.
Distributions from net investment income, net realized capital gains and capital are determined in accordance with federal income tax regulations, which may differ from U.S. GAAP with respect to character and timing. These differences may include but are not limited to losses deferred due to wash sale adjustments, foreign currency gains and losses, adjustments related to Passive Foreign Investment Companies (“PFICs”), Real Estate Investment Trusts (“REITs”), Regulated Investment Companies (“RICs”), certain derivatives and partnerships. Permanent book and federal income tax basis differences relating to shareholder distributions will result in reclassifications to certain of the Fund’s capital accounts (see Federal Income Taxes: Reclassification of Capital Accounts note).
| 3. | Securities and Other Investments: |
| a) | Repurchase Agreements – A repurchase agreement is an agreement by which a counterparty agrees to sell an investment and agrees to repurchase the investment sold at a mutually agreed upon time and price. At the time the Fund enters into a repurchase agreement, the value of the underlying collateral, including accrued interest, will be equal to or exceed the value of the repurchase agreement. Repurchase agreements expose the Fund to counterparty risk. To minimize counterparty risk, the investments that serve to collateralize the repurchase agreement are held by the Fund’s custodian in book entry or physical form in the custodial account of the Fund or in a third party custodial account. Repurchase agreements are valued at cost plus accrued interest. The Fund, as shown on the Schedule of Investments, had outstanding repurchase agreements as of June 30, 2012. |
| b) | Investments Purchased on a When-Issued or Delayed-Delivery Basis – Delivery and payment for investments that have been purchased by the Fund on a forward commitment, or when-issued or delayed-delivery basis, take place beyond the customary settlement period. A fund may dispose of or renegotiate a delayed-delivery transaction after it is entered into, and may sell delayed-delivery investments before they are delivered, which may result in a realized gain or loss. During this period, such investments are subject to market fluctuations, and the Fund identifies investments segregated in its records with a value at least equal to the amount of the commitment. As of June 30, 2012, the Fund had no outstanding when-issued or delayed delivery investments. |
| 4. | Financial Derivative Instruments: |
The following disclosures contain information on how and why the Fund uses derivative instruments, the credit-risk-related contingent features in certain derivative instruments, and how derivative instruments affect the Fund’s financial position and results of operations. The location and fair value amounts of these instruments on the Statement of Assets and Liabilities and the realized gains and losses and changes in unrealized gains and losses on the Statement of Operations, each categorized by type of derivative contract, are included in the following Additional Derivative Instrument Information footnote. The derivative instruments outstanding as of period-end are disclosed in the notes to the Schedule of Investments and the amounts of realized gains and losses and changes in unrealized gains and losses on derivative instruments during the period are disclosed in the Statement of Operations.
| a) | Futures Contracts – The Fund may enter into futures contracts. A futures contract is an agreement between two parties to buy or sell an asset at a set price on a future date. The Fund uses futures contracts to manage or obtain exposure to the investment markets, commodities, or movements in interest rates and currency values. The primary risks associated with the use of futures contracts are the imperfect correlation between the change in market value of the investments held by the Fund and the prices of futures contracts and the possibility of an illiquid market. Upon entering into a futures contract, the Fund is required to deposit with a futures commission merchant (“FCM”) an amount of cash or U.S. Government or Agency Obligations in accordance with the initial margin requirements of the broker or exchange. Futures contracts are marked to market daily at the most recent settlement price reported by an exchange on which, over |
| 15 |
| Hartford Disciplined Equity HLS Fund |
| Notes to Financial Statements – (continued) |
| June 30, 2012 (Unaudited) |
| (000’s Omitted) |
time, they are traded most extensively, and an appropriate payable or receivable for the change in value (“variation margin”) is recorded by the Fund. Gains or losses are recognized but not considered realized until the contracts expire or are closed. Futures contracts involve, to varying degrees, risk of loss in excess of the variation margin disclosed on the Statement of Assets and Liabilities; however, this risk is reduced through the use of an FCM. The Fund, as shown on the Schedule of Investments, had outstanding futures contracts as of June 30, 2012.
| b) | Options Contracts – An option contract is a contract sold by one party to another party that offers the buyer the right, but not the obligation, to buy (call) or sell (put) an investment or other financial asset at an agreed-upon price during a specific period of time or on a specific date. The Fund may write (sell) covered call and put options on futures, swaps (“swaptions”), securities, commodities or currencies. “Covered” means that so long as the Fund is obligated as the writer of an option, it will own either the underlying investments or currency or an option to purchase the same underlying investments or currency having an expiration date of the covered option and an exercise price equal to or less than the exercise price of the covered option, or will pledge cash or other liquid investments having a value equal to or greater than the fluctuating market value of the option investment or currency. Writing put options increases the Fund’s exposure to the underlying instrument. Writing call options decreases the Fund’s exposure to the underlying instrument. Premiums received from writing options that expire are treated as realized gains. Premiums received from writing options that are exercised or closed are added to the proceeds or offset amounts paid on the underlying futures, swap, investment or currency transaction to determine the realized gain or loss. The Fund as a writer of an option has no control over whether the underlying instrument may be sold (call) or purchased (put) and as a result bears the market risk of an unfavorable change in the price of the instrument underlying the written option. There is the risk the Fund may not be able to enter into a closing transaction because of an illiquid market. The Fund may also purchase put and call options. Purchasing call options increases the Fund’s exposure to the underlying instrument. Purchasing put options decreases the Fund’s exposure to the underlying instrument. The Fund pays a premium, which is included on the Fund’s Statement of Assets and Liabilities as an investment and is subsequently marked to market to reflect the current value of the option. Premiums paid for purchasing options that expire are treated as realized losses. Certain options may be purchased with premiums to be determined on a future date. The premiums for these options are based upon implied volatility parameters at specified terms. The risk associated with purchasing put and call options is generally limited to the premium paid. Premiums paid for purchasing options that are exercised or closed are added to the amounts paid or offset against the proceeds on the underlying investment transaction to determine the realized gain or loss. Entering into over-the-counter options also exposes the Fund to counterparty risk. Counterparty risk is the possibility that the counterparty to the agreements may default on its obligation to perform or disagree as to the meaning of the contractual terms in the agreements. The Fund had no outstanding purchased options contracts as of June 30, 2012. Transactions involving written options contracts for the Fund during the six-month period ended June 30, 2012, are summarized below: |
| Options Contract Activity During the Six-month Period Ended June 30, 2012 | ||||||||
| Call Options Written During the Period | Number of Contracts* | Premium Amounts | ||||||
| Beginning of the period | 1,268 | $ | 80 | |||||
| Written | 9,614 | 734 | ||||||
| Expired | (3,933 | ) | (308 | ) | ||||
| Closed | (2,970 | ) | (291 | ) | ||||
| Exercised | (1,199 | ) | (93 | ) | ||||
| End of period | 2,780 | $ | 122 | |||||
| Put Options Written During the Period | Number of Contracts* | Premium Amounts | ||||||
| Beginning of the period | 774 | $ | 36 | |||||
| Written | 8,594 | 411 | ||||||
| Expired | (5,956 | ) | (262 | ) | ||||
| Closed | (1,150 | ) | (81 | ) | ||||
| Exercised | (171 | ) | (14 | ) | ||||
| End of period | 2,091 | $ | 90 | |||||
* The number of contracts does not omit 000's.
| 16 |
| c) | Additional Derivative Instrument Information: |
Fair Values of Derivative Instruments on the Statement of Assets and Liabilities as of June 30, 2012:
| Risk Exposure Category | ||||||||||||||||||||||||||||
| Interest Rate Contracts | Foreign Exchange Contracts | Credit Contracts | Equity Contracts | Commodity Contracts | Other Contracts | Total | ||||||||||||||||||||||
| Assets: | ||||||||||||||||||||||||||||
| Variation margin receivable * | $ | — | $ | — | $ | — | $ | 247 | $ | — | $ | — | $ | 247 | ||||||||||||||
| Total | $ | — | $ | — | $ | — | $ | 247 | $ | — | $ | — | $ | 247 | ||||||||||||||
| Liabilities: | ||||||||||||||||||||||||||||
| Variation margin payable * | $ | — | $ | — | $ | — | $ | 15 | $ | — | $ | — | $ | 15 | ||||||||||||||
| Written options, market value | — | — | — | 166 | — | — | 166 | |||||||||||||||||||||
| Total | $ | — | $ | — | $ | — | $ | 181 | $ | — | $ | — | $ | 181 | ||||||||||||||
| * | Only current day's variation margin is reported within the Statement of Assets and Liabilities. The variation margin is included in the open futures cumulative appreciation (depreciation) of $130 as reported in the Schedule of Investments. |
The volume of derivatives that is presented in the Schedule of Investments is consistent with the derivative activity during the six-month period ended June 30, 2012.
The effect of Derivative Instruments on the Statement of Operations for the six-month period ended June 30, 2012:
| Risk Exposure Category | ||||||||||||||||||||||||||||
| Interest Rate Contracts | Foreign Exchange Contracts | Credit Contracts | Equity Contracts | Commodity Contracts | Other Contracts | Total | ||||||||||||||||||||||
| Realized Gain (Loss) on Derivatives Recognized as a Result of Operations: | ||||||||||||||||||||||||||||
| Net realized gain on futures | $ | — | $ | — | $ | — | $ | 1,393 | $ | — | $ | — | $ | 1,393 | ||||||||||||||
| Net realized gain on written options | — | — | — | 338 | — | — | 338 | |||||||||||||||||||||
| Total | $ | — | $ | — | $ | — | $ | 1,731 | $ | — | $ | — | $ | 1,731 | ||||||||||||||
| Net Change in Unrealized Appreciation (Depreciation) on Derivatives Recognized as a Result of Operations: | ||||||||||||||||||||||||||||
| Net change in unrealized appreciation of futures | $ | — | $ | — | $ | — | $ | 168 | $ | — | $ | — | $ | 168 | ||||||||||||||
| Net change in unrealized appreciation of written options | — | — | — | 51 | — | — | 51 | |||||||||||||||||||||
| Total | $ | — | $ | — | $ | — | $ | 219 | $ | — | $ | — | $ | 219 | ||||||||||||||
| 5. | Principal Risks: |
| a) | Counterparty Risk – The Fund may be exposed to counterparty risk, or the risk that an institution or other entity with which the Fund has unsettled or open transactions will default. |
| b) | Market Risks – The market values of equity securities, such as common stocks and preferred stocks, or equity related investments, such as futures and options, may decline due to general market conditions which are not specifically related to a particular company, such as real or perceived adverse economic conditions, changes in the general outlook for corporate earnings, changes in interest or currency rates or adverse investor sentiment generally. The market value of equity securities may also decline due to factors which affect a particular industry or industries, such as labor shortages or increased production costs and competitive conditions within an industry. Equity securities and equity related investments generally have greater market price volatility than fixed income securities. |
| 17 |
| Hartford Disciplined Equity HLS Fund |
| Notes to Financial Statements – (continued) |
| June 30, 2012 (Unaudited) |
| (000’s Omitted) |
| 6. | Federal Income Taxes: |
| a) | Federal Income Taxes – For federal income tax purposes, the Fund intends to continue to qualify as a RIC under Subchapter M of the Internal Revenue Code (“IRC”) by distributing substantially all of its taxable net investment income and net realized capital gains to its shareholders and otherwise complying with the requirements of RICs. The Fund has distributed substantially all of its income and capital gains in prior years, if applicable, and intends to distribute substantially all of its income and capital gains prior to the next fiscal year-end. Accordingly, no provision for federal income or excise taxes has been made in the accompanying financial statements. Distributions from short-term capital gains are treated as ordinary income distributions for federal income tax purposes. |
| b) | Net Investment Income (Loss), Net Realized Gains (Losses) – Net investment income (loss) and net realized gains (losses) may differ for financial statement and tax purposes primarily because of losses deferred due to wash sale adjustments, foreign currency gains and losses, adjustments related to PFICs, REITs, RICs, certain derivatives and partnerships. The character of distributions made during the year from net investment income or net realized gains may differ from their ultimate characterization for federal income tax purposes. Also, due to the timing of dividend distributions, the fiscal year in which amounts are distributed may differ from the year that the income or realized gains (losses) were recorded by the Fund. |
| c) | Distributions and Components of Distributable Earnings – The tax character of distributions paid by the Fund for the periods indicated is as follows (as adjusted for dividends payable): |
| For the Year Ended December 31, 2011 | For the Year Ended December 31, 2010 | |||||||
| Ordinary Income | $ | 11,639 | $ | 14,230 | ||||
As of December 31, 2011, the Fund’s components of distributable earnings (deficit) on a tax basis were as follows:
| Amount | ||||
| Undistributed Ordinary Income | $ | 682 | ||
| Accumulated Capital and Other Losses* | (237,381 | ) | ||
| Unrealized Appreciation† | 133,543 | |||
| Total Accumulated Deficit | $ | (103,156 | ) | |
| * | The Fund has capital loss carryforwards that are identified in the Capital Loss Carryforward note that follows. |
| † | The difference between book-basis and tax-basis unrealized appreciation (depreciation) may be attributable to the losses deferred due to wash sale adjustments, foreign currency gains and losses, adjustments related to PFICs, REITs, RICs, certain derivatives and partnerships. |
| d) | Reclassification of Capital Accounts – The Fund may record reclassifications in its capital accounts. These reclassifications have no impact on the total net assets of the Fund. The reclassifications are a result of permanent differences between U.S. GAAP and tax accounting for such items as foreign currency, PFICs, expiration or utilization of capital loss carryforwards or net operating losses. Adjustments are made to reflect the impact these items have on current and future distributions to shareholders. Therefore, the source of the Fund’s distributions may be shown in the accompanying Statement of Changes in Net Assets as from undistributed net investment income, from accumulated net realized gains on investments or from capital depending on the type of book and tax differences that exist. For the year ended December 31, 2011, the Fund recorded reclassifications to increase (decrease) the accounts listed below: |
| Amount | ||||
| Undistributed Net Investment Income | $ | (877 | ) | |
| Accumulated Net Realized Gain (Loss) | 877 | |||
| 18 |
| e) | Capital Loss Carryforward – On December 22, 2010, the Regulated Investment Company Modernization Act of 2010 (the “Act”) was enacted, which made changes to the capital loss carryforward rules. The changes are effective for taxable years beginning after the date of enactment. Under the Act, funds are permitted to carry forward capital losses for an unlimited period. However, any losses incurred during those future taxable years will be required to be utilized prior to the losses incurred in pre-enactment taxable years, which carry an expiration date. As a result of this ordering rule, pre-enactment capital loss carryforwards may be more likely to expire unused. Additionally, post-enactment capital loss carryforwards retain their character as either short-term or long-term capital losses rather than being considered all short-term as permitted under prior regulation. |
At December 31, 2011 (tax-year-end), the Fund had capital loss carryforwards for U.S. federal income tax purposes as follows:
| Year of Expiration | Amount | |||
| 2016 | $ | 50,480 | ||
| 2017 | 186,901 | |||
| Total | $ | 237,381 | ||
During the year ended December 31, 2011, the Fund utilized $77,777 of prior year capital loss carryforwards.
| f) | Accounting for Uncertainty in Income Taxes – The Fund has adopted financial reporting rules that require the Fund to analyze all open tax years, as defined by the statute of limitations, for all major jurisdictions. Generally, tax authorities can examine all tax returns filed for the last three years. The Fund does not have an examination in progress. |
The Fund has reviewed all open tax years and major jurisdictions and concluded that these financial reporting rules had no effect on the Fund’s financial position or results of operations. There is no tax liability resulting from unrecognized tax benefits relating to uncertain income tax positions taken or expected to be taken on the tax return for the fiscal year ended December 31, 2011. The Fund is also not aware of any tax positions for which it is reasonably possible that the total amounts of unrecognized tax benefits will significantly change in the next twelve months.
| 7. | Expenses: |
| a) | Investment Management Agreement – HL Investment Advisors, LLC (“HL Advisors”), an indirect wholly owned subsidiary of The Hartford Financial Services Group, Inc. (“The Hartford”), serves as investment manager to the Fund pursuant to an Investment Management Agreement with the Company. As investment manager, HL Advisors has overall investment supervisory responsibility for the Fund. In addition, HL Advisors provides administrative personnel, services, equipment, facilities and office space for proper operation of the Fund. HL Advisors has contracted with Wellington Management Company, LLP (“Wellington Management”) under a sub-advisory agreement for the provision of day-to-day investment management services to the Fund in accordance with the Fund’s investment objective and policies. The Fund pays a fee to HL Advisors, a portion of which may be used to compensate Wellington Management. |
The schedule below reflects the rates of compensation paid to HL Advisors for investment management services rendered as of June 30, 2012; the rates are accrued daily and paid monthly.
| Average Daily Net Assets | Annual Fee | |||
| On first $250 million | 0.7750 | % | ||
| On next $250 million | 0.7250 | % | ||
| On next $500 million | 0.6750 | % | ||
| On next $4 billion | 0.6250 | % | ||
| On next $5 billion | 0.6225 | % | ||
| Over $10 billion | 0.6200 | % | ||
| 19 |
| Hartford Disciplined Equity HLS Fund |
| Notes to Financial Statements – (continued) |
| June 30, 2012 (Unaudited) |
| (000’s Omitted) |
| b) | Accounting Services Agreement – Pursuant to the Fund Accounting Agreement between HLIC and the Company, on behalf of the Fund, HLIC provides accounting services to the Fund and receives monthly compensation based on the Fund’s average daily net assets at the rates set forth below. The Fund’s accounting services fees are accrued daily and paid monthly. |
| Average Daily Net Assets | Annual Fee | |||
| On first $5 billion | 0.012 | % | ||
| Over $5 billion | 0.010 | % | ||
| c) | Operating Expenses – Allocable expenses incurred by the Company are allocated to each Fund and allocated to classes within a Fund in proportion to the average daily net assets of the Fund and each class, except where allocation of certain expenses is more fairly made directly to the Fund or to specific classes within a Fund. |
| d) | Fees Paid Indirectly – The Company, on behalf of the Fund, has entered into agreements with State Street Global Markets, LLC and Russell Implementation Services, Inc. to partially recapture non-discounted trade commissions. Such rebates are used to pay a portion of the Fund’s expenses. In addition, the Fund’s custodian bank has also agreed to reduce its fees when the Fund maintains cash on deposit in a non-interest-bearing custody account. For the six-month period ended June 30, 2012, these amounts, if any, are included in the Statement of Operations. |
The ratio of expenses to average net assets in the accompanying financial highlights excludes the reduction in expenses related to fees paid indirectly. The annualized expense ratio for the period listed below reflecting the reduction for fees paid indirectly is as follows:
| Annualized Six- Month Period Ended June 30, 2012 | ||||
| Class IA | 0.75 | % | ||
| Class IB | 1.00 | % | ||
| e) | Distribution Plan for Class IB shares – The Company, on behalf of the Fund, has adopted a Distribution Plan pursuant to Rule 12b-1 of the 1940 Act to compensate the Distributor, Hartford Securities Distribution Company, Inc. (a wholly owned, ultimate subsidiary of The Hartford), from assets attributable to the Class IB shares for services rendered and expenses borne in connection with activities primarily intended to result in the sale of the Class IB shares, subject to the review and approval of the Company’s Board of Directors. |
The Distribution Plan provides that the Fund may pay annually up to 0.25% of the average daily net assets of the Fund attributable to its Class IB shares for activities primarily intended to result in the sale of Class IB shares. The Board has the authority to suspend or reduce these payments at any point in time. Under the terms of the Distribution Plan and the principal underwriting agreement, the Fund is authorized to make payments monthly to the Distributor that may be used to pay or compensate entities providing distribution and shareholder servicing with respect to the Class IB shares for such entities’ fees or expenses incurred or paid in that regard. These fees are accrued daily and paid monthly.
| f) | Other Related Party Transactions – Certain officers of the Fund are directors and/or officers of HL Advisors and/or The Hartford or its subsidiaries. For the six-month period ended June 30, 2012, a portion of the Fund’s chief compliance officer’s salary was paid by all the investment companies in the Hartford fund complex. The portion allocated to the Fund was in the amount of $1. These fees are accrued daily and paid monthly. |
| g) | Payment from Affiliate – In July of 2007, The Hartford entered into a settlement with the Attorneys General of the states of New York, Connecticut and Illinois relating to market timing and the company's individual variable annuity contracts in which certain payments would be made directly to the variable annuity contract holders. The distribution plan |
| 20 |
provided that unclaimed money from the settlement would be distributed to certain HLS Funds that are investment options through a Hartford individual variable annuity contract. The unclaimed money was distributed to the Fund on September 18, 2009.
The total return in the accompanying financial highlights includes a payment from an affiliate. Had the payment from the affiliate been excluded, the impact and total return for the period listed below would have been as follows:
| For the Year Ended December 31, 2009 | ||||||||
| Class IA | Class IB | |||||||
| Impact from Payment from Affiliate for Attorneys General Settlement | 0.01 | % | 0.01 | % | ||||
| Total Return Excluding Payment from Affiliate | 25.64 | % | 25.32 | % | ||||
| 8. | Investment Transactions: |
For the six-month period ended June 30, 2012, the Fund's aggregate purchases and sales of investment securities (excluding short-term investments) were as follows:
| Amount | ||||
| Cost of Purchases Excluding U.S. Government Obligations | $ | 160,839 | ||
| Sales Proceeds Excluding U.S. Government Obligations | 263,331 | |||
| 9. | Line of Credit: |
The Fund is one of several Hartford funds that participate in a $500 million committed revolving line of credit facility. The facility is to be used for temporary or emergency purposes. Under the arrangement, the funds are required to own securities having a market value in excess of 300% of the total bank borrowings. The interest rate on borrowings varies depending on the nature of the loan. The facility also requires a fee to be paid based on the amount of the commitment. This commitment fee is allocated to all of the funds participating in the line of credit based on the average net assets of the funds. During the six-month period ended June 30, 2012, the Fund did not have any borrowings under this facility.
| 10. | Industry Classifications: |
Other than the industry classifications “Other Investment Pools and Funds” and “Exchange Traded Funds,” equity industry classifications used in this report are the Global Industry Classification Standard, which was developed by and is the exclusive property and service mark of MSCI, Inc. and Standard & Poor’s.
| 11. | Indemnifications: |
Under the Company’s organizational documents, the Company shall indemnify its officers and directors to the full extent required or permitted under Maryland General Corporation Law and the federal securities laws. In addition, the Company, on behalf of the Fund, may enter into contracts that contain a variety of indemnifications. The Company’s maximum exposure under these arrangements is unknown. However, as of the date of these financial statements, the Company has not had prior claims or losses pursuant to these contracts and expects the risk of loss to be remote.
| 21 |
| Hartford Disciplined Equity HLS Fund |
| Financial Highlights |
| - Selected Per-Share Data (A) - |
| Class | Net Asset Value at Beginning of Period | Net Investment Income (Loss) | Payments from (to) Affiliate | Net Realized and Unrealized Gain (Loss) on Investments | Total from Investment Operations | Dividends from Net Investment Income | Distributions from Realized Capital Gains | Distributions from Capital | Total Distributions | Net Increase (Decrease) in Net Asset Value | Net Asset Value at End of Period | |||||||||||||||||||||||||||||||||
| For the Six-Month Period Ended June 30, 2012 (Unaudited) | ||||||||||||||||||||||||||||||||||||||||||||
| IA | $ | 11.78 | $ | 0.08 | $ | – | $ | 1.19 | $ | 1.27 | $ | – | $ | – | $ | – | $ | – | $ | 1.27 | $ | 13.05 | ||||||||||||||||||||||
| IB | 11.73 | 0.06 | – | 1.18 | 1.24 | – | – | – | – | 1.24 | 12.97 | |||||||||||||||||||||||||||||||||
| For the Year Ended December 31, 2011 | ||||||||||||||||||||||||||||||||||||||||||||
| IA | 11.79 | 0.14 | – | (0.01 | ) | 0.13 | (0.14 | ) | – | – | (0.14 | ) | (0.01 | ) | 11.78 | |||||||||||||||||||||||||||||
| IB | 11.73 | 0.11 | – | – | 0.11 | (0.11 | ) | – | – | (0.11 | ) | – | 11.73 | |||||||||||||||||||||||||||||||
| For the Year Ended December 31, 2010 | ||||||||||||||||||||||||||||||||||||||||||||
| IA | 10.47 | 0.15 | – | 1.32 | 1.47 | (0.15 | ) | – | – | (0.15 | ) | 1.32 | 11.79 | |||||||||||||||||||||||||||||||
| IB | 10.42 | 0.13 | – | 1.30 | 1.43 | (0.12 | ) | – | – | (0.12 | ) | 1.31 | 11.73 | |||||||||||||||||||||||||||||||
| For the Year Ended December 31, 2009 | ||||||||||||||||||||||||||||||||||||||||||||
| IA | 8.46 | 0.15 | – | 2.01 | 2.16 | (0.15 | ) | – | – | (0.15 | ) | 2.01 | 10.47 | |||||||||||||||||||||||||||||||
| IB | 8.41 | 0.13 | – | 2.00 | 2.13 | (0.12 | ) | – | – | (0.12 | ) | 2.01 | 10.42 | |||||||||||||||||||||||||||||||
| For the Year Ended December 31, 2008 | ||||||||||||||||||||||||||||||||||||||||||||
| IA | 15.05 | 0.14 | – | (5.37 | ) | (5.23 | ) | (0.14 | ) | (1.22 | ) | – | (1.36 | ) | (6.59 | ) | 8.46 | |||||||||||||||||||||||||||
| IB | 14.97 | 0.12 | – | (5.35 | ) | (5.23 | ) | (0.11 | ) | (1.22 | ) | – | (1.33 | ) | (6.56 | ) | 8.41 | |||||||||||||||||||||||||||
| For the Year Ended December 31, 2007 | ||||||||||||||||||||||||||||||||||||||||||||
| IA | 14.08 | 0.16 | – | 1.01 | 1.17 | (0.15 | ) | (0.05 | ) | – | (0.20 | ) | 0.97 | 15.05 | ||||||||||||||||||||||||||||||
| IB | 14.01 | 0.13 | – | 1.00 | 1.13 | (0.12 | ) | (0.05 | ) | – | (0.17 | ) | 0.96 | 14.97 | ||||||||||||||||||||||||||||||
| (A) | Information presented relates to a share outstanding throughout the indicated period. |
| (B) | The figures do not include sales charges or other fees which may be applied at the variable life insurance, variable annuity or qualified retirement plan product level. Any such additional sales charges or other fees would lower the Fund's performance. |
| (C) | Ratios do not reflect reductions for fees paid indirectly. Please see Fees Paid Indirectly in the Notes to Financial Statements. |
| (D) | Portfolio turnover rate is calculated on the basis of the Fund as a whole without distinguishing between the classes of shares issued. |
| (E) | Not annualized. |
| (F) | Annualized. |
| (G) | Total return without the inclusion of the Payment from (to) Affiliate can be found in Expenses in the accompanying Notes to Financial Statements. |
| 22 |
| - Ratios and Supplemental Data - |
| Total Return(B) | Net Assets at End of Period | Ratio of Expenses to Average Net Assets Before Waivers(C) | Ratio of Expenses to Average Net Assets After Waivers(C) | Ratio of Net Investment Income (Loss) to Average Net Assets | Portfolio Turnover Rate(D) | |||||||||||||||||
| 10.72 | %(E) | $ | 840,022 | 0.75 | %(F) | 0.75 | %(F) | 1.10 | %(F) | 16 | % | |||||||||||
| 10.59 | (E) | 125,612 | 1.00 | (F) | 1.00 | (F) | 0.84 | (F) | – | |||||||||||||
| 1.15 | 852,312 | 0.74 | 0.74 | 1.06 | 44 | |||||||||||||||||
| 0.90 | 129,416 | 0.99 | 0.99 | 0.81 | – | |||||||||||||||||
| 14.04 | 1,022,321 | 0.75 | 0.75 | 1.35 | 44 | |||||||||||||||||
| 13.76 | 159,898 | 1.00 | 1.00 | 1.10 | – | |||||||||||||||||
| 25.65 | (G) | 1,008,875 | 0.75 | 0.75 | 1.56 | 59 | ||||||||||||||||
| 25.33 | (G) | 173,063 | 1.00 | 1.00 | 1.31 | – | ||||||||||||||||
| (37.27 | ) | 868,799 | 0.71 | 0.71 | 1.14 | 73 | ||||||||||||||||
| (37.43 | ) | 165,848 | 0.96 | 0.96 | 0.89 | – | ||||||||||||||||
| 8.34 | 1,566,652 | 0.70 | 0.70 | 1.04 | 75 | |||||||||||||||||
| 8.07 | 339,877 | 0.95 | 0.95 | 0.79 | – | |||||||||||||||||
| 23 |
| Hartford Disciplined Equity HLS Fund |
| Directors and Officers (Unaudited) |
The Board of Directors of the Company appoints officers who are responsible for the day-to-day operations of the Fund and who execute policies formulated by the Directors. Each director serves until his or her death, resignation, or retirement or until the next annual meeting of shareholders is held or until his or her successor is elected and qualifies.
Directors and officers who are employed by or who have a financial interest in The Hartford are considered “interested” persons of the Fund pursuant to the 1940 Act. Each officer and two of the Company’s directors, as noted in the chart below, are “interested” persons of the Fund. Each director serves as a director for The Hartford Mutual Funds, Inc., The Hartford Mutual Funds II, Inc., Hartford Series Fund, Inc., Hartford HLS Series Fund II, Inc., and as a trustee for The Hartford Alternative Strategies Fund, which, as of June 30, 2012, collectively consist of 89 funds. Correspondence may be sent to directors and officers c/o Hartford Mutual Funds, P.O. Box 2999, Hartford, Connecticut 06104-2999, except that correspondence to Mr. Annoni, Mr. Dressen and Ms. Fagely may be sent to 500 Bielenberg Drive, Woodbury, Minnesota 55125.
The table below sets forth, for each director and officer, his or her name, year of birth, current position with the Company and date first elected or appointed to Hartford Series Fund, Inc. (“HSF”), and Hartford HLS Series Fund II, Inc. (“HSF2”), principal occupation, and, for directors, other directorships held. The Fund’s statement of additional information contains further information on the directors and is available free of charge by calling 1-800-862-6668 or writing to Hartford HLS Funds, c/o Individual Annuity Services, P.O. Box 5085, Hartford, CT 06102-5085.
Information on the aggregate remuneration paid to the directors of the Company can be found in the Statement of Operations herein. The Fund pays to The Hartford a portion of the Chief Compliance Officer’s compensation, but does not pay salaries or compensation to any of their other officers or directors who are employed by The Hartford.
Non-Interested Directors
Lynn S. Birdsong (1946) Director since 2003, Co-Chairman of the Investment Committee
Mr. Birdsong is a private investor. Mr. Birdsong currently serves as a Director of the Sovereign High Yield Investment Company (April 2010 to current). Mr. Birdsong currently serves as an Independent Director of Nomura Partners Funds, Inc. (formerly, The Japan Fund) (March 2003 to current). From 1979 to 2002, Mr. Birdsong was a managing director of Zurich Scudder Investments, an investment management firm. During his employment with Scudder, Mr. Birdsong was an Interested Director of The Japan Fund. Since 1981, Mr. Birdsong has been a partner in Birdsong Company, an advertising specialty firm.
Robert M. Gavin, Jr. (1940) Director since 2002 (HSF) and 1986 (HSF2), Chairman of the Board since 2004
Dr. Gavin is an educational consultant. Prior to September 1, 2001, he was President of Cranbrook Education Community and prior to July 1996, he was President of Macalester College, St. Paul, Minnesota.
Duane E. Hill (1945) Director since 2001 (HSF) and 2002 (HSF2), Chairman of the Nominating Committee
Mr. Hill is Partner of TSG Ventures L.P., a private equity investment company. Mr. Hill is a former partner of TSG Capital Group, a private equity investment firm that served as sponsor and lead investor in leveraged buyouts of middle market companies.
Sandra S. Jaffee (1941) Director since 2005
Ms. Jaffee is the founder and Chief Executive Officer of a private company, Homeworks Concierge, LLC, which provides residential property management services in Westchester County, New York (January 2012 to present). Ms. Jaffee served as Chairman (2008 to 2009) and Chief Executive Officer of Fortent (formerly Searchspace Group), a leading provider of compliance/regulatory technology to financial institutions from August 2005 to August 2009. Ms. Jaffe currently serves as a member of the Board of Directors of Broadridge Financial Solutions as well as a Trustee of Muhlenberg College.
William P. Johnston (1944) Director since 2005, Chairman of the Compliance Committee
In June 2006, Mr. Johnston was appointed as Senior Advisor to The Carlyle Group, a global private equity investment firm. In August 2007, Mr. Johnston was elected to the Board of Directors of LifeCare Holdings, Inc. In February 2008, Mr. Johnston was elected to the Board of Directors of HCR-ManorCare, Inc. In May 2006, Mr. Johnston was elected to the Supervisory Board of Fresenius Medical Care AG & Co. KGaA, after its acquisition of Renal Care Group, Inc. in March 2006.
Phillip O. Peterson (1944) Director since 2002 (HSF) and 2000 (HSF2), Chairman of the Audit Committee
Mr. Peterson is a mutual fund industry consultant. He was a partner of KPMG LLP (an accounting firm) until July 1999. Mr. Peterson joined William Blair Funds in February 2007 as a member of the Board of Trustees. Mr. Peterson also joined the Board of Trustees of Symetra Variable Mutual Funds Trust as a trustee in February 2012.
| 24 |
Lemma W. Senbet (1946) Director since 2005
Dr. Senbet is the William E. Mayer Chair Professor of Finance and Director, Center for Financial Policy, at the University of Maryland, Robert H. Smith School of Business. He was chair of the Finance Department from 1998 to 2006. Previously he was a chaired professor of finance at the University of Wisconsin-Madison. Also, he was director of the Fortis Funds from March 2000 to July 2002. Dr. Senbet served the finance profession in various capacities, including as director of the American Finance Association and President of the Western Finance Association. In 2006, Dr. Senbet was inducted Fellow of Financial Management Association International for his career-long distinguished scholarship and professional service.
Interested Directors and Officers
David N. Levenson (1966) Director since 2010(1)
Mr. Levenson currently serves as President of The Hartford’s Wealth Management business. He was appointed to this role in July 2010. Previously, Mr. Levenson served as Executive Vice President of Legacy Holdings for The Hartford from June 2009 to July 2010. From 2006 to 2009, Mr. Levenson was with Hartford Life Insurance K.K. where he served as President and Chief Executive Officer from 2007 to 2009. He served as Managing Director of Hartford Investment Management Company from 2005 to 2006. Additionally, Mr. Levenson serves as Executive Vice President of The Hartford and as President, Director and Chief Executive Officer of Hartford Life Insurance Company (“HLIC”) and Hartford Life, Inc. (“HL Inc.”).
(1) Mr. Levenson served as Interested Director until August 2, 2012.
Lowndes A. Smith (1939) Director since 1996 (HSF) and 2002 (HSF2), Co-Chairman of the Investment Committee
Mr. Smith served as Vice Chairman of The Hartford from February 1997 to January 2002, as President and Chief Executive Officer of HL Inc. from February 1997 to January 2002, and as President and Chief Operating Officer of The Hartford Life Insurance Companies from January 1989 to January 2002. Mr. Smith serves as a Director of White Mountains Insurance Group, Ltd., One Beacon Insurance and Symetra Financial and as Managing Director of Whittington Gray Associates.
Other Officers
James E. Davey (1964) President and Chief Executive Officer since 2010(2)
Mr. Davey serves as Executive Vice President of HLIC. Additionally, Mr. Davey serves as President, Chief Executive Officer and Manager of HIFSCO and President, Chief Executive Officer and Manager of HL Investment Advisors, LLC (“HL Advisors”). Mr. Davey joined The Hartford in 2002.
(2) Mr. Davey became an Interested Director effective August 2, 2012.
Mark A. Annoni (1964) Vice President, Controller and Treasurer since 2012(3)
Mr. Annoni serves as the Assistant Vice President and Director of Investment Finance (February 2004 to present). Mr. Annoni joined The Hartford in April 2001 as part of The Hartford’s acquisition of Fortis Financial Group. Prior to joining The Hartford, Mr. Annoni served as Manager of Mutual Fund Accounting at Fortis Financial Group (July 1997 to April 2001).
(3) Mr. Annoni was named Vice President, Controller and Treasurer on May 8, 2012.
Michael R. Dressen (1963) AML Compliance Officer since 2011
Mr. Dressen currently serves as Assistant Vice President of HLIC. He also serves as Chief Compliance Officer and AML Compliance Officer of Hartford Administrative Services Company (“HASCO”) and as Assistant Secretary and Compliance Officer of HIFSCO. Mr Dressen joined The Hartford in 2005 from State Farm Insurance Companies where he held various positions related to mutual funds, variable products, and property casualty insurance.
Tamara L. Fagely (1958) Vice President, since 2002 (HSF) and 1993 (HSF2)(4)
Ms. Fagely has been a Vice President of HASCO since 1998 and Chief Financial Officer since 2006. Currently Ms. Fagely is a Vice President of HLIC. She served as Assistant Vice President of HLIC from December 2001 through March 2005. In addition, Ms. Fagely is Controller and Chief Financial Officer of HIFSCO.
(4) Ms. Fagely served as Vice President, Controller and Treasurer until May 8, 2012.
Dr. Robert J. Froehlich (1953) Senior Managing Director since 2009(5)
Dr. Froehlich joined The Hartford as Senior Managing Director in September 2009. Prior to joining The Hartford, Dr. Froehlich served as Vice Chairman of Deutsche Asset Management from 1997-2009.
(5) Dr. Froehlich served as Senior Managing Director until March 26, 2012.
| 25 |
| Hartford Disciplined Equity HLS Fund |
| Directors and Officers (Unaudited) – (continued) |
Edward P. Macdonald (1967) Vice President, Secretary and Chief Legal Officer since 2005
Mr. Macdonald serves as Vice President of HLIC and Chief Legal Officer of Mutual Funds and Vice President of HIFSCO. He also serves as Vice President and Secretary of HASCO, and Chief Legal Officer, Secretary and Vice President of HL Advisors. Mr. Macdonald joined The Hartford in 2005.
Vernon J. Meyer (1964) Vice President since 2006
Mr. Meyer serves as Senior Vice President of HLIC. He also serves as Senior Vice President of HIFSCO and HL Advisors. Mr. Meyer joined The Hartford in 2004.
Colleen B. Pernerewski (1969) Vice President and Chief Compliance Officer since 2010
Ms. Pernerewski serves as Vice President and Chief Investment Advisor Compliance Officer of HIFSCO and as Vice President and Chief Compliance Officer of HL Advisors. Ms. Pernerewski serves as Vice President and Chief Compliance Officer of Individual Annuity of HLIC. Ms. Pernerewski joined The Hartford in 2005 from Travelers Life and Annuity where she served as Counsel (2004-2005). Prior to Travelers Life and Annuity, Ms. Pernerewski held the position of Counsel at The Hartford (1998-2004).
Elizabeth L. Schroeder (1966) Vice President since 2010
Ms. Schroeder currently serves as Assistant Vice President of HLIC. Ms. Schroeder joined HLIC in 1991. She is also an Assistant Vice President of HASCO, HIFSCO and HL Advisors.
Martin Swanson (1962) Vice President since 2010
Mr. Swanson is a Vice President of HLIC. Mr. Swanson also serves as Vice President/Marketing for HIFSCO. Prior to joining HLIC in 1998, Mr. Swanson was a Vice President at PaineWebber, Inc.
Jane Wolak (1961) Vice President since 2009
Ms. Wolak currently serves as Senior Vice President of HLIC. Ms. Wolak joined HLIC as Vice President, Retail Product Services in May 2007. She is also Vice President of HASCO. Previously, Ms. Wolak was with Sun Life Financial where she held the position of Vice President, Service Center Operations from 2001-2007.
HOW TO OBTAIN A COPY OF THE FUND’S PROXY VOTING POLICIES AND VOTING RECORDS (UNAUDITED)
A description of the policies and procedures that the Fund uses to determine how to vote proxies relating to portfolio securities and a record of how the Fund voted any proxies for the twelve-month period ended June 30, 2012 are available (1) without charge, upon request, by calling 800-862-6668 and (2) on the SEC’s website at http://www.sec.gov.
QUARTERLY PORTFOLIO HOLDINGS INFORMATION (UNAUDITED)
The Fund files a complete schedule of portfolio holdings with the SEC for the first and third quarters of each fiscal year on Form N-Q. The Fund’s Forms are available (1) without charge, upon request, by calling 800-862-6668 and (2) on the SEC’s website at http://www.sec.gov. The Form N-Q may be reviewed and copied at the SEC’s Public Reference Room in Washington, DC. Information on the operation of the Public Reference Room may be obtained by calling 1-800-SEC-0330.
| 26 |
| Hartford Disciplined Equity HLS Fund |
| Expense Example (Unaudited) |
Your Fund's Expenses
As a shareholder of the Fund, you incur two types of costs: (1) transaction costs and (2) ongoing costs including investment management fees, distribution fees, and other fund expenses. This example is intended to help you understand your ongoing costs (in dollars) of investing in the Fund and to compare these costs with the ongoing costs of investing in other mutual funds. The example is based on an investment of $1,000 invested at the beginning of the period and held for the period of December 31, 2011 through June 30, 2012.
Actual Expenses
The first set of columns of the table below provides information about actual account values and actual expenses. You may use the information in this column, together with the amount you invested, to estimate the expenses that you paid over the period. Simply divide your account value by $1,000 (for example, an $8,600 account value divided by $1,000 = 8.6), then multiply the result by the number in the line under the heading entitled “Expenses Paid During Period” to estimate the expenses you paid on your account during this period.
Hypothetical Example for Comparison Purposes
The second set of columns of the table below provides information about hypothetical account values and hypothetical expenses based on the Fund’s actual expense ratio and an assumed rate of return of 5% per year before expenses, which is not the Fund’s actual return. The hypothetical account values and expenses may not be used to estimate the actual ending account balance or expenses you paid for the period. You may use this information to compare the ongoing costs of investing in the Fund and other funds. To do so, compare this 5% hypothetical example with the 5% hypothetical examples that appear in the shareholder reports of the other funds.
Please note that the expenses shown in the table are meant to highlight your ongoing costs only and do not reflect any transactional costs, such as sales charges (loads) and CDSC. Therefore, the second set of columns of the table is useful in comparing ongoing costs only, and will not help you determine the relative total costs of owning different funds. In addition, if these transactional costs were included, your costs would be higher. Expenses are equal to the Fund's annualized expense ratios multiplied by average account value over the period, multiplied by 182/366 (to reflect the one-half year period).
| Actual return | Hypothetical (5% return before expenses) | |||||||||||||||||||||||||||||||||||
| Beginning Account Value December 31, 2011 | Ending Account Value June 30, 2012 | Expenses paid during the period December 31, 2011 through June 30, 2012 | Beginning Account Value December 31, 2011 | Ending Account Value June 30, 2012 | Expenses paid during the period December 31, 2011 through June 30, 2012 | Annualized expense ratio | Days in the current 1/2 year | Days in the full year | ||||||||||||||||||||||||||||
| Class IA | $ | 1,000.00 | $ | 1,107.23 | $ | 3.93 | $ | 1,000.00 | $ | 1,021.13 | $ | 3.77 | 0.75 | % | 182 | 366 | ||||||||||||||||||||
| Class IB | $ | 1,000.00 | $ | 1,105.85 | $ | 5.24 | $ | 1,000.00 | $ | 1,019.89 | $ | 5.02 | 1.00 | % | 182 | 366 | ||||||||||||||||||||
| 27 |
HARTFORD HLS FUNDS
c/o The Hartford Wealth Management - Global Annuities
P.O. Box 14293
Lexington, KY 40512-4293
Hartford Series Fund, Inc. is underwritten and distributed by Hartford Securities Distribution Company, Inc.
"The Hartford" is The Hartford Financial Services Group, Inc. and its subsidiaries.
Hartford Series Fund, Inc. inception dates range from 1977 to date. Hartford Series Fund, Inc. is not a subsidiary of The Hartford but is underwritten, distributed by and advised by subsidiaries of The Hartford. Investments in Hartford Series Fund, Inc. are not guaranteed by The Hartford or any other entity.
You should carefully consider investment objectives, risks, and charges and expenses of Hartford HLS Funds before investing. This and other information can be found in the Fund’s prospectus or summary prospectus, which can be obtained by calling 800-862-6668. Please read them carefully before you invest or send money.
| HLSSAR-DE12 8-12 111647 Printed in U.S.A ©2012 The Hartford, Hartford, CT 06115 | |
A MESSAGE FROM THE PRESIDENT
Dear Fellow Shareholders:
I want to take this opportunity to say thank you for investing in the Hartford HLS Funds. We’ve seen continued market volatility throughout the first half of 2012, and there will likely be continued uncertainty until the Presidential election in November, but we are still optimistic about the markets in 2012.
Market Review
In the first quarter of 2012, the S&P 500 Index turned in its best quarterly performance since the third quarter of 2009. U.S. equities showed signs of improvement as investors focused on improving economic data and strong corporate earnings news and the Federal Reserve’s pledge to keep interest rates low buoyed investors’ appetites.
The second quarter ended on a high note for the stock market—the S&P 500 had its strongest June in more than a decade and the Dow Jones Industrial Average had its best month since October—but those gains weren’t enough to offset losses from April and May, and equities finished the quarter in the red. Although the S&P 500 was -2.75 for the second quarter, it was up 9.49% for the first half of 2012.
Concerns about domestic and European unemployment are having an effect on our economy. The unemployment rate in the euro zone's 17 nations rose to a record 11.1% in May, the highest level since the euro launched as a common currency more than 10 years ago. In the U.S., the labor market has been fickle this year, with job growth starting off strong in the first couple months of 2012 but slowing down in the spring, which has led many to wonder about the status of the economic recovery.
On a positive note, home prices are rising again after falling for more than five years, new and existing home sales are increasing, and home builders are ramping up construction.
The Hartford HLS Funds Expands Relationship with Wellington Management
We’re very pleased that we are expanding our relationship with Wellington Management, which will now serve as the primary sub-adviser for the Hartford HLS Funds including equity, fixed-income,* and asset-allocation funds. One of America’s oldest and largest investment management firms, Wellington Management has resources that span the entire globe, with multiple offices across the U.S. and numerous offices abroad. Wellington Management’s most distinctive strength is its proprietary research, which is shared across the entire organization.
We believe that aligning more closely with a well-respected money manager like Wellington Management puts us in a strong position to drive significant growth and to continue delivering innovative fund strategies to help our investors meet their financial goals.
Thank you again for investing with the Hartford HLS Funds.
James Davey
President
Hartford HLS Funds
*Several fixed-income funds will continue to be sub-advised by Hartford Investment Management Company.
Hartford Dividend and Growth HLS Fund
Table of Contents
This report is prepared for the general information of contract owners and qualified retirement plan participants. It is not an offer of contracts or of qualified retirement plans. It should not be used in connection with any offer, except in conjunction with the appropriate product prospectus which contains all pertinent information including the applicable sales, administrative and other charges.
The views expressed in the Fund’s Manager Discussion under ‘‘Why did the Fund perform this way?’’ and ‘‘What is the outlook?’’ are views of the Fund’s sub-adviser and portfolio management team through the end of the period and are subject to change based on market and other conditions.
Hartford Dividend and Growth HLS Fund inception 03/09/1994
| (sub-advised by Wellington Management Company, LLP) |
| Investment objective – Seeks a high level of current income consistent with growth of capital. |
Performance Overview 6/30/02 - 6/30/12
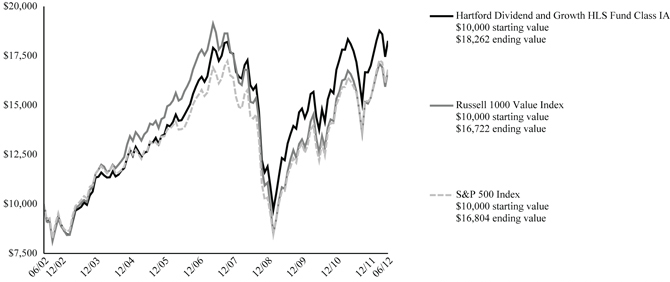
The chart above shows the growth of a $10,000 investment in Class IA. Growth results in classes other than Class IA will vary from what is seen above due to differences in the expenses charged to those classes.
| Average Annual Total Returns (as of 6/30/12) |
| 6 Month† | 1 Year | 5 year | 10 year | |||||||||||||
| Dividend and Growth IA | 7.35 | % | 2.94 | % | 0.58 | % | 6.21 | % | ||||||||
| Dividend and Growth IB | 7.21 | % | 2.69 | % | 0.33 | % | 5.94 | % | ||||||||
| Russell 1000 Value Index | 8.68 | % | 3.01 | % | -2.19 | % | 5.28 | % | ||||||||
| S&P 500 Index | 9.48 | % | 5.43 | % | 0.21 | % | 5.33 | % | ||||||||
| † | Not Annualized |
PAST PERFORMANCE IS NOT INDICATIVE OF FUTURE RESULTS.
Total returns presented above were calculated using the Fund's net asset value available to shareholders for sale or redemption of Fund shares on June 30, 2012, which may exclude investment transactions as of this date.
Russell 1000 Value Index is an unmanaged index measuring the performance of those Russell 1000 Index companies with lower price-to-book ratios and lower forecasted growth values. The Russell 1000 Index is an unmanaged index that measures the performance of the 1,000 largest companies in the Russell 3000 Index, which measures the performance of the 3,000 largest U.S. companies, based on total market capitalizations.
S&P 500 Index is a market capitalization-weighted price index composed of 500 widely held common stocks.
You cannot invest directly in an index.
The chart represents a hypothetical investment in the Fund. Performance data represents past performance and current performance could be higher or lower.
Performance information may reflect historical or current expense waivers/reimbursements from the investment adviser, without which performance would have been lower. For information on current expense waivers/reimbursements, please see the prospectus.
The value of the Fund will fluctuate so that when redeemed, it may be worth more or less than the original investment. The chart and table do not reflect the deductions of taxes, sales charges or other fees which may be applied at the variable life insurance, variable annuity or qualified retirement plan product level. Any such additional sales charges or other fees or expenses would lower the contract’s or plan’s performance.
| 2 |
| Hartford Dividend and Growth HLS Fund |
| Manager Discussion |
| June 30, 2012 (Unaudited) |
| Portfolio Managers | ||
| Edward P. Bousa, CFA | Donald J. Kilbride | Matthew G. Baker |
| Senior Vice President and Equity Portfolio Manager | Senior Vice President and Equity Portfolio Manager | Vice President and Equity Portfolio Manager |
How did the Fund perform?
The Class IA shares of the Hartford Dividend and Growth HLS Fund returned 7.35% for the six-month period ended June 30, 2012, underperforming its benchmark, the S&P 500 Index, which returned 9.48% for the same period. The Fund performed in line with the 7.33% return of the average fund in the Lipper Equity Income VP-UF Funds peer group, a group of funds with investment strategies similar to those of the Fund.
Why did the Fund perform this way?
The six- month period ending June 30, 2012 was another extremely volatile period for equity markets. Global equities started the year on a strong note and continued to march higher in the first quarter of 2012, driven by strong corporate earnings growth and generally improving economic data. However, global equities reversed course during the second half of the period. A lackluster U.S. jobs report, a heightened level of political uncertainty in France and Greece, and a host of Spanish and Italian bank downgrades by Moody’s dampened investor enthusiasm for equities. As the overall equity markets slowed in the latter half of the period, traditionally more defensive industries returned to favor while more cyclical industries and companies experienced stronger sell-offs.
Overall equity market performance was positive for the period across all market capitalizations: large cap equities (+9.5%), small caps (+8.5%), and mid caps (+7.9%) all rose as represented by the S&P 500, Russell 2000, and S&P MidCap 400 Indices respectively. During the six-month period nine of ten sectors within the S&P 500 Index posted positive returns, led by Telecommunication Services (+17%) and Financials (+14%), while Energy (-2%) was the only sector to produce negative absolute returns.
The Fund’s underperformance relative to the S&P 500 was largely due to negative stock selection within Health Care, Information Technology, and Financials. This was partially offset by stronger selection in Industrials. Overall sector allocation, a residual of bottom-up stock selection (i.e. stock by stock fundamental research), was negative driven in part by our underweight (i.e. the Fund’s sector position was less than the benchmark position) to Information Technology and overweight to Energy. A modest cash position detracted in an upward trending market.
The Fund’s top detractors from benchmark-relative returns were Apple (Information Technology), Anadarko Petroleum (Energy), and Barrick Gold (Materials). Shares of Apple, a designer, manufacturer, and retailer of a range of interconnected computing devices and personal electronic products, moved higher after the company reported better-than-expected quarterly revenue and earnings driven by strong iPhone demand, especially internationally, and another record new product launch with the third version of the iPad. Not owning the stock hurt performance during the period. Shares of leading U.S. oil and gas exploration company Anadarko Petroleum were hurt by sharp declines in oil prices. Gold mining company Barrick Gold’s shares declined during the period after their Chief Executive Officer was fired and a new co-chairman was hired. Ultra Petroleum (Energy) and JC Penny (Consumer Discretionary) also detracted from absolute returns.
The Fund’s top contributors to benchmark-relative performance during the period were Comcast (Consumer Discretionary), Wells Fargo (Financials), and Google (Information Technology). Shares of Comcast, the largest U.S. cable communications company, rose after the company posted strong quarterly earnings and announced a 44% increase in its dividend and a $3 billion stock buyback. Wells Fargo, a leading U.S. bank, benefited from strong earnings, an announced 83% increase in its quarterly dividend, and a plan to increase share repurchase activity. The bank also had a positive bank stress test result, highlighting its strong balance sheet and solid capital ratios. Not owning benchmark component Google, the Internet search engine giant, helped relative results as the stock experienced pressure due to disappointing quarterly results and investors’ uncertainty about mobile economics. AT&T (Telecommunication Services) was among the top contributors to absolute performance.
What is the outlook?
While we have been sensitive to the uncertain economic outlook for some time, our level of confidence in a continued modest global recovery has diminished more recently. Europe has been a concern for more than four quarters now; over the
| 3 |
| Hartford Dividend and Growth HLS Fund |
| Manager Discussion– (continued) |
| June 30, 2012 (Unaudited) |
past couple of quarters we have seen dramatic reductions in growth in Brazil and India as well. Southern Europe is most likely in a recession and the recent data out of Germany and other parts of Northern Europe suggests slowing there as well. China continues its gradual slowing with most pundits suggesting Gross Domestic Product growth will bottom in the 7% area. With slowing in more geographies recently, the risk has increased that China’s growth rate could deteriorate further given the importance of exports to their economy. We had been relatively optimistic about the U.S. economy and a continued recovery characterized by modest growth and manageable inflation; however, the data in the past few months has come in lower than we would have hoped and signals slowing conditions.
Recent U.S. economic reports have been on the softer side, especially in the labor market. Compared to previous cyclical upturns, this expansion has been disappointingly muted. Still, there appear to be bright spots in the U.S. economy. Housing activity shows clear signs of healing, and with the decline in long-term mortgage rates to below 4%, refinancing activity has been rekindled. We believe that the income freed up by refinancings, as well as the drop in energy prices, should help boost consumer expenditures enough to partly offset the deterioration in industrial activity. In a global context, we believe that the U.S. economy continues to be better positioned than other major economies. However, the U.S. may face a fiscal cliff headwind early in 2013 with the potential expiration of various tax cuts. While we continue to be positive over the long term, we remain cautious in the near term; market volatility may remain elevated as we approach the U.S. Presidential election.
Our investment discipline is focused on investing in areas of strong demand and avoiding areas of oversupply. At the end of the period, our largest overweights relative to the benchmark were to the Financials, Health Care, and Utilities sectors, while we remained underweight the Information Technology, Consumer Staples, and Materials sectors.
Diversification by Industry
as of June 30, 2012
| Industry (Sector) | Percentage of Net Assets | ||
| Automobiles & Components (Consumer Discretionary) | 1.4 | % | |
| Banks (Financials) | 6.8 | ||
| Capital Goods (Industrials) | 7.2 | ||
| Commercial & Professional Services (Industrials) | 0.9 | ||
| Diversified Financials (Financials) | 6.4 | ||
| Energy (Energy) | 11.5 | ||
| Food & Staples Retailing (Consumer Staples) | 1.1 | ||
| Food, Beverage & Tobacco (Consumer Staples) | 5.5 | ||
| Health Care Equipment & Services (Health Care) | 3.2 | ||
| Household & Personal Products (Consumer Staples) | 1.4 | ||
| Insurance (Financials) | 4.7 | ||
| Materials (Materials) | 2.0 | ||
| Media (Consumer Discretionary) | 5.8 | ||
| Pharmaceuticals, Biotechnology & Life Sciences (Health Care) | 12.0 | ||
| Retailing (Consumer Discretionary) | 3.0 | ||
| Semiconductors & Semiconductor Equipment (Information Technology) | 2.7 | ||
| Software & Services (Information Technology) | 8.8 | ||
| Technology Hardware & Equipment (Information Technology) | 2.5 | ||
| Telecommunication Services (Services) | 3.3 | ||
| Transportation (Industrials) | 2.4 | ||
| Utilities (Utilities) | 4.8 | ||
| Short-Term Investments | 2.5 | ||
| Other Assets and Liabilities | 0.1 | ||
| Total | 100.0 | % |
| 4 |
| Hartford Dividend and Growth HLS Fund |
| Schedule of Investments |
| June 30, 2012 (Unaudited) |
| (000’s Omitted) |
| Shares or Principal Amount | Market Value ╪ | |||||||
| COMMON STOCKS - 97.4% | ||||||||
| Automobiles & Components - 1.4% | ||||||||
| 3,010 | Ford Motor Co. w/ Rights | $ | 28,870 | |||||
| 1,163 | Johnson Controls, Inc. | 32,220 | ||||||
| 61,090 | ||||||||
| Banks - 6.8% | ||||||||
| 1,213 | PNC Financial Services Group, Inc. | 74,127 | ||||||
| 1,444 | US Bancorp | 46,424 | ||||||
| 5,412 | Wells Fargo & Co. | 180,981 | ||||||
| 301,532 | ||||||||
| Capital Goods - 7.2% | ||||||||
| 677 | Deere & Co. | 54,773 | ||||||
| 703 | Eaton Corp. | 27,861 | ||||||
| 507 | General Dynamics Corp. | 33,455 | ||||||
| 3,284 | General Electric Co. | 68,438 | ||||||
| 913 | Honeywell International, Inc. | 50,993 | ||||||
| 133 | Lockheed Martin Corp. | 11,617 | ||||||
| 859 | Raytheon Co. | 48,611 | ||||||
| 280 | Siemens AG ADR | 23,567 | ||||||
| 319,315 | ||||||||
| Commercial & Professional Services - 0.9% | ||||||||
| 1,232 | Waste Management, Inc. | 41,134 | ||||||
| Diversified Financials - 6.4% | ||||||||
| 862 | Ameriprise Financial, Inc. | 45,066 | ||||||
| 2,361 | Bank of America Corp. | 19,309 | ||||||
| 251 | BlackRock, Inc. | 42,608 | ||||||
| 138 | Goldman Sachs Group, Inc. | 13,200 | ||||||
| 2,912 | JP Morgan Chase & Co. | 104,036 | ||||||
| 1,431 | NYSE Euronext | 36,595 | ||||||
| 115 | State Street Corp. | 5,149 | ||||||
| 1,628 | UBS AG ADR | 19,066 | ||||||
| 285,029 | ||||||||
| Energy - 11.5% | ||||||||
| 960 | Anadarko Petroleum Corp. | 63,562 | ||||||
| 969 | Baker Hughes, Inc. | 39,839 | ||||||
| 975 | Chevron Corp. | 102,903 | ||||||
| 2,001 | EnCana Corp. ADR | 41,674 | ||||||
| 1,924 | Exxon Mobil Corp. | 164,606 | ||||||
| 520 | Occidental Petroleum Corp. | 44,576 | ||||||
| 712 | Total S.A. ADR | 32,024 | ||||||
| 869 | Ultra Petroleum Corp. ● | 20,055 | ||||||
| 509,239 | ||||||||
| Food & Staples Retailing - 1.1% | ||||||||
| 1,076 | CVS Caremark Corp. | 50,264 | ||||||
| Food, Beverage & Tobacco - 5.5% | ||||||||
| 296 | Anheuser-Busch InBev N.V. | 23,568 | ||||||
| 873 | General Mills, Inc. | 33,642 | ||||||
| 1,264 | PepsiCo, Inc. | 89,316 | ||||||
| 674 | Philip Morris International, Inc. | 58,808 | ||||||
| 1,171 | Unilever N.V. Class NY ADR | 39,040 | ||||||
| 244,374 | ||||||||
| Health Care Equipment & Services - 3.2% | ||||||||
| 1,230 | Cardinal Health, Inc. | 51,664 | ||||||
| 1,748 | Medtronic, Inc. | 67,700 | ||||||
| 383 | UnitedHealth Group, Inc. | 22,419 | ||||||
| 141,783 | ||||||||
| Household & Personal Products - 1.4% | ||||||||
| 1,004 | Procter & Gamble Co. | 61,495 | ||||||
| Insurance - 4.7% | ||||||||
| 942 | ACE Ltd. | 69,819 | ||||||
| 366 | Chubb Corp. | 26,642 | ||||||
| 188 | Marsh & McLennan Cos., Inc. | 6,071 | ||||||
| 1,123 | MetLife, Inc. | 34,648 | ||||||
| 1,180 | Principal Financial Group, Inc. | 30,940 | ||||||
| 810 | Prudential Financial, Inc. | 39,224 | ||||||
| 207,344 | ||||||||
| Materials - 2.0% | ||||||||
| 790 | Barrick Gold Corp. | 29,671 | ||||||
| 1,840 | Dow Chemical Co. | 57,951 | ||||||
| 87,622 | ||||||||
| Media - 5.8% | ||||||||
| 3,354 | Comcast Corp. Class A | 107,212 | ||||||
| 518 | Omnicom Group, Inc. | 25,179 | ||||||
| 1,220 | Time Warner, Inc. | 46,964 | ||||||
| 336 | Viacom, Inc. Class B | 15,789 | ||||||
| 1,283 | Walt Disney Co. | 62,225 | ||||||
| 257,369 | ||||||||
| Pharmaceuticals, Biotechnology & Life Sciences - 12.0% | ||||||||
| 812 | AstraZeneca plc ADR | 36,341 | ||||||
| 905 | Bristol-Myers Squibb Co. | 32,527 | ||||||
| 2,026 | Eli Lilly & Co. | 86,940 | ||||||
| 1,393 | Johnson & Johnson | 94,126 | ||||||
| 3,093 | Merck & Co., Inc. | 129,146 | ||||||
| 5,300 | Pfizer, Inc. | 121,890 | ||||||
| 834 | Teva Pharmaceutical Industries Ltd. ADR | 32,898 | ||||||
| 533,868 | ||||||||
| Retailing - 3.0% | ||||||||
| 629 | J.C. Penney Co., Inc. | 14,668 | ||||||
| 2,249 | Lowe's Co., Inc. | 63,958 | ||||||
| 975 | Target Corp. | 56,747 | ||||||
| 135,373 | ||||||||
| Semiconductors & Semiconductor Equipment - 2.7% | ||||||||
| 2,269 | Intel Corp. | 60,464 | ||||||
| 1,421 | Taiwan Semiconductor Manufacturing Co., Ltd. ADR | 19,842 | ||||||
| 1,379 | Texas Instruments, Inc. | 39,576 | ||||||
| 119,882 | ||||||||
| Software & Services - 8.8% | ||||||||
| 510 | Accenture plc | 30,659 | ||||||
| 756 | Automatic Data Processing, Inc. | 42,051 | ||||||
| 1,273 | eBay, Inc. ● | 53,470 | ||||||
| 555 | IBM Corp. | 108,567 | ||||||
| 4,135 | Microsoft Corp. | 126,503 | ||||||
| 1,039 | Oracle Corp. | 30,860 | ||||||
| 392,110 | ||||||||
| Technology Hardware & Equipment - 2.5% | ||||||||
| 940 | Avnet, Inc. ● | 29,014 | ||||||
| 2,466 | Cisco Systems, Inc. | 42,334 | ||||||
| 689 | Qualcomm, Inc. | 38,345 | ||||||
| 109,693 | ||||||||
| Telecommunication Services - 3.3% | ||||||||
| 4,178 | AT&T, Inc. | 148,995 | ||||||
| Transportation - 2.4% | ||||||||
| 548 | FedEx Corp. | 50,210 | ||||||
| 726 | United Parcel Service, Inc. Class B | 57,199 | ||||||
| 107,409 | ||||||||
The accompanying notes are an integral part of these financial statements.
| 5 |
| Hartford Dividend and Growth HLS Fund |
| Schedule of Investments – (continued) |
| June 30, 2012 (Unaudited) |
| (000’s Omitted) |
| Shares or Principal Amount | Market Value ╪ | |||||||||||
| COMMON STOCKS - 97.4% - (continued) | ||||||||||||
| Utilities - 4.8% | ||||||||||||
| 1,025 | Dominion Resources, Inc. | $ | 55,350 | |||||||||
| 506 | Edison International | 23,386 | ||||||||||
| 977 | Exelon Corp. | 36,748 | ||||||||||
| 793 | NextEra Energy, Inc. | 54,597 | ||||||||||
| 245 | PG&E Corp. | 11,092 | ||||||||||
| 1,201 | Xcel Energy, Inc. | 34,126 | ||||||||||
| 215,299 | ||||||||||||
| Total common stocks | ||||||||||||
| (cost $3,628,111) | $ | 4,330,219 | ||||||||||
| Total long-term investments | ||||||||||||
| (cost $3,628,111) | $ | 4,330,219 | ||||||||||
| SHORT-TERM INVESTMENTS - 2.5% | ||||||||||||
| Repurchase Agreements - 2.5% | ||||||||||||
| Bank of America Merrill Lynch TriParty | ||||||||||||
| Joint Repurchase Agreement (maturing on | ||||||||||||
| 07/02/2012 in the amount of $58,535, | ||||||||||||
| collateralized by FHLMC 5.50% - 6.50%, | ||||||||||||
| 2035 - 2036, FNMA 5.00% - 6.00%, 2033 | ||||||||||||
| - 2039, value of $59,706) | ||||||||||||
| $ | 58,535 | 0.13%, 06/29/2012 | $ | 58,535 | ||||||||
| Barclays Capital TriParty Joint Repurchase | ||||||||||||
| Agreement (maturing on 07/02/2012 in the | ||||||||||||
| amount of $21,162, collateralized by U.S. | ||||||||||||
| Treasury Note 1.25% - 3.63%, 2014 - | ||||||||||||
| 2020, value of $21,585) | ||||||||||||
| 21,162 | 0.15%, 06/29/2012 | 21,162 | ||||||||||
| Deutsche Bank Securities TriParty Joint | ||||||||||||
| Repurchase Agreement (maturing on | ||||||||||||
| 07/02/2012 in the amount of $5,670, | ||||||||||||
| collateralized by U.S. Treasury Note | ||||||||||||
| 0.88%, 2016, value of $5,783) | ||||||||||||
| 5,670 | 0.20%, 06/29/2012 | 5,670 | ||||||||||
| TD Securities TriParty Joint Repurchase | ||||||||||||
| Agreement (maturing on 07/02/2012 in the | ||||||||||||
| amount of $16,570, collateralized by | ||||||||||||
| FHLMC 4.00% - 6.00%, 2027 - 2041, | ||||||||||||
| FNMA 4.00% - 4.50%, 2025 - 2042, U.S. | ||||||||||||
| Treasury Bond 6.38%, 2027, U.S. Treasury | ||||||||||||
| Note 0.38% - 8.75%, 2012 - 2017, value of | ||||||||||||
| 16,570 | $16,902) 0.15%, 06/29/2012 | 16,570 | ||||||||||
| UBS Securities, Inc. Joint Repurchase | ||||||||||||
| Agreement (maturing on 07/02/2012 in the | ||||||||||||
| amount of $6, collateralized by U.S. | ||||||||||||
| Treasury Note 1.00%, 2013, value of $6) | ||||||||||||
| 6 | 0.13%, 06/29/2012 | 6 | ||||||||||
| UBS Securities, Inc. TriParty Joint | ||||||||||||
| Repurchase Agreement (maturing on | ||||||||||||
| 07/02/2012 in the amount of $7,467, | ||||||||||||
| collateralized by GNMA 4.00%, 2042, | ||||||||||||
| value of $7,616) | ||||||||||||
| 7,467 | 0.20%, 06/29/2012 | 7,467 | ||||||||||
| 109,410 | ||||||||||||
| Total short-term investments | ||||||||||||
| (cost $109,410) | $ | 109,410 | ||||||||||
| Total investments | ||||||||||||
| (cost $3,737,521) ▲ | 99.9 | % | $ | 4,439,629 | ||||||||
| Other assets and liabilities | 0 .1 | % | 2,571 | |||||||||
| Total net assets | 100.0 | % | $ | 4,442,200 | ||||||||
| Note: | Percentage of investments as shown is the ratio of the total market value to total net assets. |
| Prices of foreign equities that are principally traded on certain foreign markets may be adjusted daily pursuant to a fair value pricing service approved by the Board of Directors in order to reflect an adjustment for factors occurring after the close of certain foreign markets but before the close of the New York Stock Exchange. |
The accompanying notes are an integral part of these financial statements.
| 6 |
| ▲ | At June 30, 2012, the cost of securities for federal income tax purposes was $3,749,168 and the aggregate gross unrealized appreciation and depreciation based on that cost were: |
| Unrealized Appreciation | $ | 849,310 | ||
| Unrealized Depreciation | (158,849 | ) | ||
| Net Unrealized Appreciation | $ | 690,461 |
| ● | Non-income producing. |
| ╪ | See Significant Accounting Policies of accompanying Notes to Financial Statements regarding valuation of securities. |
| GLOSSARY: (abbreviations used in preceding Schedule of Investments) | |
| Other Abbreviations: | |
| ADR | American Depositary Receipt |
| FHLMC | Federal Home Loan Mortgage Corp. |
| FNMA | Federal National Mortgage Association |
| GNMA | Government National Mortgage Association |
The accompanying notes are an integral part of these financial statements.
| 7 |
| Hartford Dividend and Growth HLS Fund |
| Investment Valuation Hierarchy Level Summary |
| June 30, 2012 (Unaudited) |
| (000’s Omitted) |
| Total | Level 1 ♦ | Level 2 ♦ | Level 3 | |||||||||||||
| Assets: | ||||||||||||||||
| Common Stocks ‡ | $ | 4,330,219 | $ | 4,330,219 | $ | – | $ | – | ||||||||
| Short-Term Investments | 109,410 | – | 109,410 | – | ||||||||||||
| Total | $ | 4,439,629 | $ | 4,330,219 | $ | 109,410 | $ | – | ||||||||
| ♦ | For the six-month period ended June 30, 2012, there were no transfers between Level 1 and Level 2. |
| ‡ | The Fund has all or primarily all of the equity securities categorized in a particular level. Refer to the Schedule of Investments for further industry breakout. |
The accompanying notes are an integral part of these financial statements.
| 8 |
| Hartford Dividend and Growth HLS Fund |
| Statement of Assets and Liabilities |
| June 30, 2012 (Unaudited) |
| (000’s Omitted) |
| Assets: | ||||
| Investments in securities, at market value (cost $3,737,521) | $ | 4,439,629 | ||
| Cash | — | |||
| Receivables: | ||||
| Investment securities sold | 2,413 | |||
| Fund shares sold | 799 | |||
| Dividends and interest | 7,337 | |||
| Total assets | 4,450,178 | |||
| Liabilities: | ||||
| Payables: | ||||
| Investment securities purchased | 3,998 | |||
| Fund shares redeemed | 3,409 | |||
| Investment management fees | 381 | |||
| Distribution fees | 21 | |||
| Accrued expenses | 169 | |||
| Total liabilities | 7,978 | |||
| Net assets | $ | 4,442,200 | ||
| Summary of Net Assets: | ||||
| Capital stock and paid-in-capital | $ | 3,724,666 | ||
| Undistributed net investment income | 51,087 | |||
| Accumulated net realized loss | (35,661 | ) | ||
| Unrealized appreciation of investments | 702,108 | |||
| Net assets | $ | 4,442,200 | ||
| Shares authorized | 4,000,000 | |||
| Par value | $ | 0 .001 | ||
| Class IA: Net asset value per share | $ | 20 .76 | ||
| Shares outstanding | 183,281 | |||
| Net assets | $ | 3,804,325 | ||
| Class IB: Net asset value per share | $ | 20 .69 | ||
| Shares outstanding | 30,833 | |||
| Net assets | $ | 637,875 |
The accompanying notes are an integral part of these financial statements.
| 9 |
| Hartford Dividend and Growth HLS Fund |
| Statement of Operations |
| For the Six-Month Period Ended June 30, 2012 (Unaudited) |
| (000’s Omitted) |
| Investment Income: | ||||
| Dividends | $ | 63,995 | ||
| Interest | 52 | |||
| Less: Foreign tax withheld | (896 | ) | ||
| Total investment income, net | 63,151 | |||
| Expenses: | ||||
| Investment management fees | 14,669 | |||
| Transfer agent fees | 3 | |||
| Distribution fees - Class IB | 829 | |||
| Custodian fees | 3 | |||
| Accounting services fees | 274 | |||
| Board of Directors' fees | 54 | |||
| Audit fees | 19 | |||
| Other expenses | 279 | |||
| Total expenses (before fees paid indirectly) | 16,130 | |||
| Commission recapture | (16 | ) | ||
| Total fees paid indirectly | (16 | ) | ||
| Total expenses, net | 16,114 | |||
| Net investment income | 47,037 | |||
| Net Realized Gain on Investments and Foreign Currency Transactions: | ||||
| Net realized gain on investments | 116,540 | |||
| Net Realized Gain on Investments and Foreign Currency Transactions | 116,540 | |||
| Net Changes in Unrealized Appreciation of Investments: | ||||
| Net unrealized appreciation of investments | 161,788 | |||
| Net Changes in Unrealized Appreciation of Investments | 161,788 | |||
| Net Gain on Investments and Foreign Currency Transactions | 278,328 | |||
| Net Increase in Net Assets Resulting from Operations | $ | 325,365 |
The accompanying notes are an integral part of these financial statements.
| 10 |
| Hartford Dividend and Growth HLS Fund |
| Statement of Changes in Net Assets |
| (000’s Omitted) |
| For the Six-Month Period Ended June 30, 2012 (Unaudited) | For the Year Ended December 31, 2011 | |||||||
| Operations: | ||||||||
| Net investment income | $ | 47,037 | $ | 94,097 | ||||
| Net realized gain on investments | 116,540 | 294,702 | ||||||
| Net unrealized appreciation (depreciation) of investments | 161,788 | (319,890 | ) | |||||
| Net Increase In Net Assets Resulting From Operations | 325,365 | 68,909 | ||||||
| Distributions to Shareholders: | ||||||||
| From net investment income | ||||||||
| Class IA | — | (81,230 | ) | |||||
| Class IB | — | (12,208 | ) | |||||
| Total distributions | — | (93,438 | ) | |||||
| Capital Share Transactions: | ||||||||
| Class IA | ||||||||
| Sold | 65,943 | 192,919 | ||||||
| Issued on reinvestment of distributions | — | 81,230 | ||||||
| Redeemed | (392,105 | ) | (811,468 | ) | ||||
| Total capital share transactions | (326,162 | ) | (537,319 | ) | ||||
| Class IB | ||||||||
| Sold | 32,651 | 91,132 | ||||||
| Issued on reinvestment of distributions | — | 12,208 | ||||||
| Redeemed | (99,730 | ) | (197,204 | ) | ||||
| Total capital share transactions | (67,079 | ) | (93,864 | ) | ||||
| Net decrease from capital share transactions | (393,241 | ) | (631,183 | ) | ||||
| Net Decrease In Net Assets | (67,876 | ) | (655,712 | ) | ||||
| Net Assets: | ||||||||
| Beginning of period | 4,510,076 | 5,165,788 | ||||||
| End of period | $ | 4,442,200 | $ | 4,510,076 | ||||
| Undistributed (distribution in excess of) | ||||||||
| net investment income | $ | 51,087 | $ | 4,050 | ||||
| Shares: | ||||||||
| Class IA | ||||||||
| Sold | 3,227 | 9,736 | ||||||
| Issued on reinvestment of distributions | — | 4,240 | ||||||
| Redeemed | (19,139 | ) | (40,935 | ) | ||||
| Total share activity | (15,912 | ) | (26,959 | ) | ||||
| Class IB | ||||||||
| Sold | 1,594 | 4,600 | ||||||
| Issued on reinvestment of distributions | — | 639 | ||||||
| Redeemed | (4,883 | ) | (9,974 | ) | ||||
| Total share activity | (3,289 | ) | (4,735 | ) | ||||
The accompanying notes are an integral part of these financial statements.
| 11 |
| Hartford Dividend and Growth HLS Fund |
| Notes to Financial Statements |
| June 30, 2012 (Unaudited) |
| (000’s Omitted) |
| 1. | Organization: |
Hartford Dividend and Growth HLS Fund (the “Fund”) serves as an underlying investment option for certain variable annuity and variable life insurance separate accounts of Hartford Life Insurance Company (“HLIC”) and its affiliates and certain qualified retirement plans. The Fund may also serve as an underlying investment option for certain variable annuity and variable life separate accounts of other insurance companies. Owners of variable annuity contracts and policyholders of variable life insurance contracts may choose the funds permitted in the variable insurance contract prospectus. In addition, participants in certain qualified retirement plans may choose the Fund if permitted by their plans.
Hartford Series Fund, Inc. (the “Company”) is an open-end registered management investment company comprised of thirty portfolios. Financial Statements for the Fund, a series of the Company, are included in this report.
The Company is organized under the laws of the State of Maryland and is registered with the Securities and Exchange Commission (“SEC”) under the Investment Company Act of 1940, as amended (“1940 Act”). The Fund is a diversified open-end management investment company.
The Fund is divided into Class IA and Class IB shares. Each class is offered at the per share net asset value (“NAV”) without a sales charge and is subject to the same expenses, except that the Class IB shares are subject to distribution and service fees charged pursuant to a Distribution Plan adopted in accordance with Rule 12b-1 under the 1940 Act.
| 2. | Significant Accounting Policies: |
The following is a summary of significant accounting policies of the Fund in the preparation of its financial statements, which are in accordance with the United States Generally Accepted Accounting Principles (“U.S. GAAP”). The preparation of financial statements in accordance with U.S. GAAP may require management to make estimates and assumptions that affect the reported amounts of assets and liabilities and disclosure of contingent assets and liabilities at the date of the financial statements and the reported amounts of increases and decreases in net assets from operations during the reporting period. Actual results could differ from those estimates.
| a) | Determination of Net Asset Value – The NAV of each class of the Fund’s shares is determined as of the close of regular trading (normally 4:00 p.m. Eastern Time) (the “NYSE Close”) on each day that the New York Stock Exchange (the “Exchange”) is open (“Valuation Date”). Information that becomes known to the Fund after the NAV has been calculated on a particular day will not generally be used to retroactively adjust the NAV determined earlier that day. |
| b) | Investment Valuation and Fair Value Measurements – For purposes of calculating the NAV, portfolio investments and other assets held by the Fund's portfolio for which market quotes are readily available are valued at market value. Market value is generally determined on the basis of last reported sales prices or official close price. If no sales are reported, market value is based on quotes obtained from a quotation reporting system, established market makers, or independent pricing services. If market prices are not readily available or are deemed unreliable, the Fund will use the fair value of the investment as determined in good faith under policies and procedures established by and under the supervision of the Company’s Board of Directors. Market quotes are considered not readily available where there is an absence of current or reliable market-based data (e.g., trade information or broker quotes), including where events occur after the close of the relevant market, but prior to the NYSE Close that materially affect the values of the Fund’s portfolio investments or assets. In addition, market quotes are considered not readily available when, due to extraordinary circumstances, the exchanges or markets on which the investments trade do not open for trading for the entire day and no other market prices are available. In addition, prices of foreign equities that are principally traded on certain foreign markets are adjusted daily pursuant to a fair value pricing service approved by the Board of Directors in order to reflect an adjustment for the factors occurring after the close of certain foreign markets but before the NYSE Close. Investments that are primarily traded on foreign markets may trade on days that are not business days of the Fund. |
| 12 |
The value of the foreign investments in which the Fund invests may change on days when a shareholder will not be able to purchase or redeem shares of the Fund. Fair value pricing is subjective in nature and the use of fair value pricing by the Fund may cause the NAV of its shares to differ significantly from the NAV that would have been calculated using market prices at the close of the exchange on which a portfolio investment is primarily traded. There can be no assurance that the Fund could obtain the fair market value assigned to an investment if the Fund were to sell the investment at approximately the time at which the Fund determines its NAV.
Investments valued in currencies other than U.S. dollars are converted to U.S. dollars using exchange rates obtained from independent pricing services for calculation of the NAV. As a result, the NAV of the Fund’s shares may be affected by changes in the value of currencies in relation to the U.S. dollar. The value of investments traded in markets outside the United States or denominated in currencies other than the U.S. dollar may be affected significantly on a day that the NYSE is closed and the market value may change on days when an investor is not able to purchase, redeem or exchange shares of the Fund.
Financial instruments for which prices are not available from an independent pricing service may be valued using market quotations obtained from one or more dealers that make markets in the respective financial instrument in accordance with procedures established by the Company’s Board of Directors.
U.S. GAAP defines fair value as the price that the Fund would receive to sell an asset or pay to transfer a liability in an orderly transaction between market participants. The U.S. GAAP fair value measurement standards require disclosure of a fair value hierarchy for each major category of assets and liabilities. Various inputs are used in determining the fair value of the Fund’s investments. These inputs are summarized into three broad hierarchy levels. This hierarchy is based on whether the valuation inputs are observable or unobservable. These levels are:
| · | Level 1 – Quoted prices in active markets for identical investments. Level 1 may include exchange traded instruments, such as domestic equities, some foreign equities, options, futures, mutual funds, exchange traded funds, rights and warrants. |
| · | Level 2 – Observable inputs other than Level 1 prices, such as quoted prices for similar investments; quoted prices in markets that are not active; or other inputs that are observable or can be corroborated by observable market data. Level 2 may include debt investments that are traded less frequently than exchange traded instruments and which are valued using independent pricing services; foreign equities, which are principally traded on certain foreign markets and are adjusted daily pursuant to a fair value pricing service in order to reflect an adjustment for the factors occurring after the close of certain foreign markets but before the NYSE Close; and short-term investments, which are valued at amortized cost. |
| · | Level 3 – Significant unobservable inputs that are supported by limited or no market activity. Level 3 may include financial instruments whose values are determined using indicative market quotes or require significant management judgment or estimation. These unobservable valuation inputs may include estimates for current yields, maturity/duration, prepayment speed, and indicative market quotes for comparable investments along with other assumptions relating to credit quality, collateral value, complexity of the investment structure, general market conditions and liquidity. This category may include investments where trading has been halted or there are certain restrictions on trading. While these investments are priced using unobservable inputs, the valuation of these investments reflects the best available data and management believes the prices are a reasonable representation of exit price. | |
| The Board of Directors of the Company generally reviews and approves the “Procedures for Valuation of Portfolio Securities” on an annual basis. These procedures define how investments are to be valued, including the formation of a Valuation Committee. The Valuation Committee is responsible for determining in good faith the fair value of investments when the value cannot be obtained from primary pricing services or alternative sources or if the valuation of an investment as provided by the primary pricing service or alternative source is believed not to reflect the investment’s fair value as of the Valuation Date. Members of the Valuation Committee include the Fund’s Treasurer or designee, a Vice President of the Funds with legal expertise or |
| 13 |
| Hartford Dividend and Growth HLS Fund |
| Notes to Financial Statements – (continued) |
| June 30, 2012 (Unaudited) |
| (000’s Omitted |
designee, and a Vice President of the investment manager or designee. In addition, the Fund’s chief compliance officer shall designate a member of the compliance group to attend Valuation Committee meetings as a non-voting resource, to monitor for and provide guidance with respect to compliance with these procedures. Two members of the Valuation Committee or their designees, representing different departments, shall constitute a quorum for purposes of permitting the Valuation Committee to take action. The Valuation Committee will consider all relevant factors in determining an investment’s fair value, and may seek the advice of the Fund’s sub-adviser, knowledgeable brokers and legal counsel in making such determination. The Valuation Committee reports to the Audit Committee of the Company’s Board of Directors. The Audit Committee receives quarterly written reports which include details of all fair-valued investments, including the reason for the fair valuation, and an indication, when possible, of the accuracy of the valuation by disclosing the next available reliable public price quotation or the disposition price of such investments (the “look-back” test). The Board of Directors then must consider for ratification all of the fair value determinations made during the previous quarter.
Valuation levels are not necessarily indicative of the risk associated with investing in such investments. Individual investments within any of the above mentioned asset classes may be assigned a different hierarchical level than those presented above, as individual circumstances dictate.
For additional information, refer to the Investment Valuation Hierarchy Level Summary.
For purposes of reporting transfers between different hierarchy levels, both transfers in and out of each level, as applicable, are shown as if they occurred at the beginning of the period.
| c) | Investment Transactions and Investment Income – Investment transactions are recorded as of the trade date (the date the order to buy or sell is executed) for financial reporting purposes. Investments purchased or sold on a when-issued or delayed-delivery basis may be settled a month or more after the trade date. Realized gains and losses are determined on the basis of identified cost. |
Dividend income is accrued as of the ex-dividend date, except certain dividends from foreign investments where the ex-dividend date may have passed are recorded as soon as the Fund is informed of the dividend. Interest income, including amortization of premium and accretion of discounts, is accrued on a daily basis.
| d) | Joint Trading Account – The Fund may invest cash balances into a joint trading account that may be invested in one or more repurchase agreements. |
| e) | Fund Share Valuation and Dividend Distributions to Shareholders – Orders for the Fund’s shares are executed in accordance with the investment instructions of the contract holders and plan participants. The NAV of the Fund’s shares is determined as of the close of business on each business day of the Exchange. The NAV is determined separately for each class of shares of the Fund by dividing the Fund’s net assets attributable to that class by the number of shares of the class outstanding. Each class of shares offered by the Fund has equal rights as to assets and voting privileges (except that shareholders of a class have exclusive voting rights regarding any matter relating solely to that class of shares). Income and non-class specific expenses are allocated daily to each class on the basis of the relative net assets of the class. Realized and unrealized capital gains and losses are allocated daily based on the relative net assets of each class of shares of the Fund. |
Orders for the purchase of the Fund’s shares received prior to the close of the Exchange on any day the Exchange is open for business are priced at the NAV determined as of the close of the Exchange. Orders received after the close of the Exchange, or on a day on which the Exchange and/or the Fund is not open for business, are priced at the next determined NAV.
| 14 |
Dividends are declared pursuant to a policy adopted by the Company’s Board of Directors based upon the investment performance of the Fund. The policy of the Fund is to pay dividends from net investment income and realized capital gains, if any, at least once a year.
Distributions from net investment income, net realized capital gains and capital are determined in accordance with federal income tax regulations, which may differ from U.S. GAAP with respect to character and timing. These differences may include but are not limited to losses deferred due to wash sale adjustments, foreign currency gains and losses, adjustments related to Passive Foreign Investment Companies (“PFICs”), Real Estate Investment Trusts (“REITs”), Regulated Investment Companies (“RICs”), certain derivatives and partnerships. Permanent book and federal income tax basis differences relating to shareholder distributions will result in reclassifications to certain of the Fund’s capital accounts (see Federal Income Taxes: Reclassification of Capital Accounts note).
| 3. | Securities and Other Investments: |
| a) | Repurchase Agreements – A repurchase agreement is an agreement by which a counterparty agrees to sell an investment and agrees to repurchase the investment sold at a mutually agreed upon time and price. At the time the Fund enters into a repurchase agreement, the value of the underlying collateral, including accrued interest, will be equal to or exceed the value of the repurchase agreement. Repurchase agreements expose the Fund to counterparty risk. To minimize counterparty risk, the investments that serve to collateralize the repurchase agreement are held by the Fund’s custodian in book entry or physical form in the custodial account of the Fund or in a third party custodial account. Repurchase agreements are valued at cost plus accrued interest. The Fund, as shown on the Schedule of Investments, had outstanding repurchase agreements as of June 30, 2012. |
| 4. | Principal Risks: |
| a) | Counterparty Risk – The Fund may be exposed to counterparty risk, or the risk that an institution or other entity with which the Fund has unsettled or open transactions will default. |
| b) | Market Risks – If the Fund invests directly in foreign currencies or in securities that trade in, and receive revenues in, foreign currencies, or in derivatives that provide exposure to foreign currencies, it will be subject to the risk that those currencies will decline in value relative to the base currency of the Fund, or, in the case of hedging positions, that the Fund’s base currency will decline in value relative to the currency being hedged. Currency rates in foreign countries may fluctuate significantly over short periods of time for a number of reasons, including changes in interest rates, intervention (or the failure to intervene) by U.S. or foreign governments, central banks or supranational entities, such as the International Monetary Fund, or by the imposition of currency controls or other political developments in the United States or abroad. As a result, the Fund’s investments in foreign currency denominated securities may reduce the returns of the Fund. The market values of equity securities, such as common stocks and preferred stocks, or equity related investments, such as futures and options, may decline due to general market conditions which are not specifically related to a particular company, such as real or perceived adverse economic conditions, changes in the general outlook for corporate earnings, changes in interest or currency rates or adverse investor sentiment generally. The market value of equity securities may also decline due to factors which affect a particular industry or industries, such as labor shortages or increased production costs and competitive conditions within an industry. Equity securities and equity related investments generally have greater market price volatility than fixed income securities. |
| 5. | Federal Income Taxes: |
| a) | Federal Income Taxes – For federal income tax purposes, the Fund intends to continue to qualify as a RIC under Subchapter M of the Internal Revenue Code (“IRC”) by distributing substantially all of its taxable net investment income and net realized capital gains to its shareholders and otherwise complying with the requirements of RICs. The Fund has distributed substantially all of its income and capital gains in prior years, if applicable, and intends to distribute |
| 15 |
| Hartford Dividend and Growth HLS Fund |
| Notes to Financial Statements – (continued) |
| June 30, 2012 (Unaudited) |
| (000’s Omitted |
substantially all of its income and capital gains prior to the next fiscal year-end. Accordingly, no provision for federal income or excise taxes has been made in the accompanying financial statements. Distributions from short-term capital gains are treated as ordinary income distributions for federal income tax purposes.
| b) | Net Investment Income (Loss), Net Realized Gains (Losses) – Net investment income (loss) and net realized gains (losses) may differ for financial statement and tax purposes primarily because of losses deferred due to wash sale adjustments, foreign currency gains and losses, adjustments related to PFICs, REITs, RICs, certain derivatives and partnerships. The character of distributions made during the year from net investment income or net realized gains may differ from their ultimate characterization for federal income tax purposes. Also, due to the timing of dividend distributions, the fiscal year in which amounts are distributed may differ from the year that the income or realized gains (losses) were recorded by the Fund. |
| c) | Distributions and Components of Distributable Earnings – The tax character of distributions paid by the Fund for the periods indicated is as follows (as adjusted for dividends payable): |
| For the Year Ended December 31, 2011 | For the Year Ended December 31, 2010 | |||||||
| Ordinary Income | $ | 93,438 | $ | 92,350 | ||||
As of December 31, 2011, the Fund’s components of distributable earnings (deficit) on a tax basis were as follows:
| Amount | ||||
| Undistributed Ordinary Income | $ | 4,050 | ||
| Accumulated Capital and Other Losses* | (140,554 | ) | ||
| Unrealized Appreciation† | 528,673 | |||
| Total Accumulated Earnings | $ | 392,169 | ||
| * | The Fund has capital loss carryforwards that are identified in the Capital Loss Carryforward note that follows. | |
| † | The difference between book-basis and tax-basis unrealized appreciation (depreciation) may be attributable to the losses deferred due to wash sale adjustments, foreign currency gains and losses, adjustments related to PFICs, REITs, RICs, certain derivatives and partnerships. |
| d) | Reclassification of Capital Accounts – The Fund may record reclassifications in its capital accounts. These reclassifications have no impact on the total net assets of the Fund. The reclassifications are a result of permanent differences between U.S. GAAP and tax accounting for such items as foreign currency, PFICs, expiration or utilization of capital loss carryforwards or net operating losses. Adjustments are made to reflect the impact these items have on current and future distributions to shareholders. Therefore, the source of the Fund’s distributions may be shown in the accompanying Statement of Changes in Net Assets as from undistributed net investment income, from accumulated net realized gains on investments or from capital depending on the type of book and tax differences that exist. For the year ended December 31, 2011, the Fund recorded reclassifications to increase (decrease) the accounts listed below: |
| Amount | ||||
| Undistributed Net Investment Income | $ | (47 | ) | |
| Accumulated Net Realized Gain (Loss) | 47 | |||
| e) | Capital Loss Carryforward – On December 22, 2010, the Regulated Investment Company Modernization Act of 2010 (the “Act”) was enacted, which made changes to the capital loss carryforward rules. The changes are effective for taxable years beginning after the date of enactment. Under the Act, funds are permitted to carry forward capital losses for an unlimited period. However, any losses incurred during those future taxable years will be required to be utilized prior to the losses incurred in pre-enactment taxable years, which carry an expiration date. As a result of this ordering rule, pre-enactment capital loss carryforwards may be more likely to expire unused. Additionally, post-enactment capital |
| 16 |
loss carryforwards retain their character as either short-term or long-term capital losses rather than being considered all short-term as permitted under prior regulation.
At December 31, 2011 (tax-year-end), the Fund had capital loss carryforwards for U.S. federal income tax purposes as follows:
| Year of Expiration | Amount | |||
| 2017 | $ | 140,554 | ||
| Total | $ | 140,554 | ||
During the year ended December 31, 2011, the Fund utilized $294,671 of prior year capital loss carryforwards.
| f) | Accounting for Uncertainty in Income Taxes – The Fund has adopted financial reporting rules that require the Fund to analyze all open tax years, as defined by the statute of limitations, for all major jurisdictions. Generally, tax authorities can examine all tax returns filed for the last three years. The Fund does not have an examination in progress. |
The Fund has reviewed all open tax years and major jurisdictions and concluded that these financial reporting rules had no effect on the Fund’s financial position or results of operations. There is no tax liability resulting from unrecognized tax benefits relating to uncertain income tax positions taken or expected to be taken on the tax return for the fiscal year ended December 31, 2011. The Fund is also not aware of any tax positions for which it is reasonably possible that the total amounts of unrecognized tax benefits will significantly change in the next twelve months.
| 6. | Expenses: |
| a) | Investment Management Agreement – HL Investment Advisors, LLC (“HL Advisors”), an indirect wholly owned subsidiary of The Hartford Financial Services Group, Inc. (“The Hartford”), serves as investment manager to the Fund pursuant to an Investment Management Agreement with the Company. As investment manager, HL Advisors has overall investment supervisory responsibility for the Fund. In addition, HL Advisors provides administrative personnel, services, equipment, facilities and office space for proper operation of the Fund. HL Advisors has contracted with Wellington Management Company, LLP (“Wellington Management”) under a sub-advisory agreement for the provision of day-to-day investment management services to the Fund in accordance with the Fund’s investment objective and policies. The Fund pays a fee to HL Advisors, a portion of which may be used to compensate Wellington Management. |
The schedule below reflects the rates of compensation paid to HL Advisors for investment management services rendered as of June 30, 2012; the rates are accrued daily and paid monthly.
| Average Daily Net Assets | Annual Fee | |||
| On first $250 million | 0.7750 | % | ||
| On next $250 million | 0.7250 | % | ||
| On next $500 million | 0.6750 | % | ||
| On next $1.5 billion | 0.6250 | % | ||
| On next $2.5 billion | 0.6200 | % | ||
| On next $5 billion | 0.6150 | % | ||
| Over $10 billion | 0.6100 | % | ||
| 17 |
| Hartford Dividend and Growth HLS Fund |
| Notes to Financial Statements – (continued) |
| June 30, 2012 (Unaudited) |
| (000’s Omitted |
The schedule below reflects the rates of compensation paid to HL Advisors for investment management services rendered during the period December 31, 2011, through February 29, 2012.
| Average Daily Net Assets | Annual Fee | |||
| On first $250 million | 0.7750 | % | ||
| On next $250 million | 0.7250 | % | ||
| On next $500 million | 0.6750 | % | ||
| On next $4 billion | 0.6250 | % | ||
| On next $5 billion | 0.6225 | % | ||
| Over $10 billion | 0.6200 | % | ||
| b) | Accounting Services Agreement – Pursuant to the Fund Accounting Agreement between HLIC and the Company, on behalf of the Fund, HLIC provides accounting services to the Fund and receives monthly compensation based on the Fund’s average daily net assets at the rates set forth below. The Fund’s accounting services fees are accrued daily and paid monthly. |
| Average Daily Net Assets | Annual Fee | |||
| On first $5 billion | 0.012 | % | ||
| Over $5 billion | 0.010 | % | ||
| c) | Operating Expenses – Allocable expenses incurred by the Company are allocated to each Fund and allocated to classes within a Fund in proportion to the average daily net assets of the Fund and each class, except where allocation of certain expenses is more fairly made directly to the Fund or to specific classes within a Fund. |
| d) | Fees Paid Indirectly – The Company, on behalf of the Fund, has entered into agreements with State Street Global Markets, LLC and Russell Implementation Services, Inc. to partially recapture non-discounted trade commissions. Such rebates are used to pay a portion of the Fund’s expenses. In addition, the Fund’s custodian bank has also agreed to reduce its fees when the Fund maintains cash on deposit in a non-interest-bearing custody account. For the six-month period ended June 30, 2012, these amounts, if any, are included in the Statement of Operations. |
The ratio of expenses to average net assets in the accompanying financial highlights excludes the reduction in expenses related to fees paid indirectly. The annualized expense ratio for the period listed below reflecting the reduction for fees paid indirectly is as follows:
| Annualized Six- Month Period Ended June 30, 2012 | ||||
| Class IA | 0.67 | % | ||
| Class IB | 0.92 | % | ||
| e) | Distribution Plan for Class IB shares – The Company, on behalf of the Fund, has adopted a Distribution Plan pursuant to Rule 12b-1 of the 1940 Act to compensate the Distributor, Hartford Securities Distribution Company, Inc. (a wholly owned, ultimate subsidiary of The Hartford), from assets attributable to the Class IB shares for services rendered and expenses borne in connection with activities primarily intended to result in the sale of the Class IB shares, subject to the review and approval of the Company’s Board of Directors. |
The Distribution Plan provides that the Fund may pay annually up to 0.25% of the average daily net assets of the Fund attributable to its Class IB shares for activities primarily intended to result in the sale of Class IB shares. The Board has the authority to suspend or reduce these payments at any point in time. Under the terms of the Distribution Plan and the principal underwriting agreement, the Fund is authorized to make payments monthly to the Distributor that may be used
| 18 |
to pay or compensate entities providing distribution and shareholder servicing with respect to the Class IB shares for such entities’ fees or expenses incurred or paid in that regard. These fees are accrued daily and paid monthly.
| f) | Other Related Party Transactions – Certain officers of the Fund are directors and/or officers of HL Advisors and/or The Hartford or its subsidiaries. For the six-month period ended June 30, 2012, a portion of the Fund’s chief compliance officer’s salary was paid by all the investment companies in the Hartford fund complex. The portion allocated to the Fund was in the amount of $3. Hartford Administrative Services Company (“HASCO”), an indirect wholly owned subsidiary of The Hartford, provides transfer agent services to the Fund. HASCO was compensated on a per account basis for providing such services. The amount paid to HASCO can be found in the Statement of Operations. These fees are accrued daily and paid monthly. |
| g) | Payment from Affiliate – In July of 2007, The Hartford entered into a settlement with the Attorneys General of the states of New York, Connecticut and Illinois relating to market timing and the company's individual variable annuity contracts in which certain payments would be made directly to the variable annuity contract holders. The distribution plan provided that unclaimed money from the settlement would be distributed to certain HLS Funds that are investment options through a Hartford individual variable annuity contract. The unclaimed money was distributed to the Fund on September 18, 2009. |
The total return in the accompanying financial highlights includes a payment from an affiliate. Had the payment from the affiliate been excluded, the impact and total return for the period listed below would have been as follows:
| For the Year Ended December 31, 2009 | ||||||||
| Class IA | Class IB | |||||||
| Impact from Payment from Affiliate for Attorneys General Settlement | — | % | — | % | ||||
| Total Return Excluding Payment from Affiliate | 24.67 | % | 24.36 | % | ||||
| 7. | Investment Transactions: |
For the six-month period ended June 30, 2012, the Fund's aggregate purchases and sales of investment securities (excluding short-term investments) were as follows:
| Amount | ||||
| Cost of Purchases Excluding U.S. Government Obligations | $ | 421,298 | ||
| Sales Proceeds Excluding U.S. Government Obligations | 805,023 | |||
| 8. | Line of Credit: |
The Fund is one of several Hartford funds that participate in a $500 million committed revolving line of credit facility. The facility is to be used for temporary or emergency purposes. Under the arrangement, the funds are required to own securities having a market value in excess of 300% of the total bank borrowings. The interest rate on borrowings varies depending on the nature of the loan. The facility also requires a fee to be paid based on the amount of the commitment. This commitment fee is allocated to all of the funds participating in the line of credit based on the average net assets of the funds. During the six-month period ended June 30, 2012, the Fund did not have any borrowings under this facility.
| 9. | Industry Classifications: |
Other than the industry classifications “Other Investment Pools and Funds” and “Exchange Traded Funds,” equity industry classifications used in this report are the Global Industry Classification Standard, which was developed by and is the exclusive property and service mark of MSCI, Inc. and Standard & Poor’s.
| 19 |
| Hartford Dividend and Growth HLS Fund |
| Notes to Financial Statements – (continued) |
| June 30, 2012 (Unaudited) |
| (000’s Omitted |
| 10. | Indemnifications: |
Under the Company’s organizational documents, the Company shall indemnify its officers and directors to the full extent required or permitted under Maryland General Corporation Law and the federal securities laws. In addition, the Company, on behalf of the Fund, may enter into contracts that contain a variety of indemnifications. The Company’s maximum exposure under these arrangements is unknown. However, as of the date of these financial statements, the Company has not had prior claims or losses pursuant to these contracts and expects the risk of loss to be remote.
| 20 |
[This page is intentionally left blank]
| 21 |
| Hartford Dividend and Growth HLS Fund |
| Financial Highlights |
- Selected Per-Share Data (A) -
| Class | Net Asset Value at Beginning of Period | Net Investment Income (Loss) | Payments from (to) Affiliate | Net Realized and Unrealized Gain (Loss) on Investments | Total from Investment Operations | Dividends from Net Investment Income | Distributions from Realized Capital Gains | Distributions from Capital | Total Distributions | Net Increase (Decrease) in Net Asset Value | Net Asset Value at End of Period | |||||||||||||||||||||||||||||||||
| For the Six-Month Period Ended June 30, 2012 (Unaudited) | ||||||||||||||||||||||||||||||||||||||||||||
| IA | $ | 19.34 | $ | 0.22 | $ | – | $ | 1.20 | $ | 1.42 | $ | – | $ | – | $ | – | $ | – | $ | 1.42 | $ | 20.76 | ||||||||||||||||||||||
| IB | 19.30 | 0.20 | – | 1.19 | 1.39 | – | – | – | – | 1.39 | 20.69 | |||||||||||||||||||||||||||||||||
| FortheYearEndedDecember31,2011 | ||||||||||||||||||||||||||||||||||||||||||||
| IA | 19.50 | 0.42 | – | (0.16 | ) | 0.26 | (0.42 | ) | – | – | (0.42 | ) | (0.16 | ) | 19.34 | |||||||||||||||||||||||||||||
| IB | 19.46 | 0.36 | – | (0.16 | ) | 0.20 | (0.36 | ) | – | – | (0.36 | ) | (0.16 | ) | 19.30 | |||||||||||||||||||||||||||||
| FortheYearEndedDecember31,2010 | ||||||||||||||||||||||||||||||||||||||||||||
| IA | 17.55 | 0.35 | – | 1.96 | 2.31 | (0.36 | ) | – | – | (0.36 | ) | 1.95 | 19.50 | |||||||||||||||||||||||||||||||
| IB | 17.51 | 0.32 | – | 1.94 | 2.26 | (0.31 | ) | – | – | (0.31 | ) | 1.95 | 19.46 | |||||||||||||||||||||||||||||||
| FortheYearEndedDecember31,2009 | ||||||||||||||||||||||||||||||||||||||||||||
| IA | 14.37 | 0.35 | – | 3.19 | 3.54 | (0.36 | ) | – | – | (0.36 | ) | 3.18 | 17.55 | |||||||||||||||||||||||||||||||
| IB | 14.34 | 0.33 | – | 3.16 | 3.49 | (0.32 | ) | – | – | (0.32 | ) | 3.17 | 17.51 | |||||||||||||||||||||||||||||||
| FortheYearEndedDecember31,2008 | ||||||||||||||||||||||||||||||||||||||||||||
| IA | 22.35 | 0.44 | – | (7.57 | ) | (7.13 | ) | (0.44 | ) | (0.41 | ) | – | (0.85 | ) | (7.98 | ) | 14.37 | |||||||||||||||||||||||||||
| IB | 22.28 | 0.42 | – | (7.56 | ) | (7.14 | ) | (0.39 | ) | (0.41 | ) | – | (0.80 | ) | (7.94 | ) | 14.34 | |||||||||||||||||||||||||||
| FortheYearEndedDecember31,2007 | ||||||||||||||||||||||||||||||||||||||||||||
| IA | 22.79 | 0.42 | – | 1.44 | 1.86 | (0.41 | ) | (1.89 | ) | – | (2.30 | ) | (0.44 | ) | 22.35 | |||||||||||||||||||||||||||||
| IB | 22.72 | 0.37 | – | 1.42 | 1.79 | (0.34 | ) | (1.89 | ) | – | (2.23 | ) | (0.44 | ) | 22.28 | |||||||||||||||||||||||||||||
| (A) | Information presented relates to a share outstanding throughout the indicated period. |
| (B) | The figures do not include sales charges or other fees which may be applied at the variable life insurance, variable annuity or qualified retirement plan product level. Any such additional sales charges or other fees would lower the Fund's performance. |
| (C) | Ratios do not reflect reductions for fees paid indirectly. Please see Fees Paid Indirectly in the Notes to Financial Statements. |
| (D) | Portfolio turnover rate is calculated on the basis of the Fund as a whole without distinguishing between the classes of shares issued. |
| (E) | Not annualized. |
| (F) | Annualized. |
| (G) | Total return without the inclusion of the Payment from (to) Affiliate can be found in Expenses in the accompanying Notes to Financial Statements. |
| 22 |
| - Ratios and Supplemental Data - |
| Total Return(B) | Net Assets at End of Period | Ratio of Expenses to Average Net Assets Before Waivers(C) | Ratio of Expenses to Average Net Assets After Waivers(C) | Ratio of Net Investment Income (Loss) to Average Net Assets | Portfolio Turnover Rate(D) | |||||||||||||||||
| 7.35 | %(E) | $ | 3,804,325 | 0.67 | %(F) | 0.67 | %(F) | 2.10 | %(F) | 9 | % | |||||||||||
| 7.21 | (E) | 637,875 | 0.92 | (F) | 0.92 | (F) | 1.85 | (F) | – | |||||||||||||
| 1.32 | 3,851,657 | 0.67 | 0.67 | 1.98 | 24 | |||||||||||||||||
| 1.06 | 658,419 | 0.92 | 0.92 | 1.73 | – | |||||||||||||||||
| 13.21 | 4,409,787 | 0.68 | 0.68 | 1.87 | 32 | |||||||||||||||||
| 12.93 | 756,001 | 0.93 | 0.93 | 1.62 | – | |||||||||||||||||
| 24.68 | (G) | 4,247,031 | 0.69 | 0.69 | 2.24 | 34 | ||||||||||||||||
| 24.36 | (G) | 815,752 | 0.94 | 0.94 | 2.00 | – | ||||||||||||||||
| (32.43 | ) | 3,628,793 | 0.67 | 0.67 | 2.20 | 41 | ||||||||||||||||
| (32.60 | ) | 776,959 | 0.92 | 0.92 | 1.95 | – | ||||||||||||||||
| 8.26 | 5,842,788 | 0.67 | 0.67 | 1.70 | 27 | |||||||||||||||||
| 7.98 | 1,501,363 | 0.92 | 0.92 | 1.45 | – | |||||||||||||||||
| 23 |
| Hartford Dividend and Growth HLS Fund |
| Directors and Officers (Unaudited) |
The Board of Directors of the Company appoints officers who are responsible for the day-to-day operations of the Fund and who execute policies formulated by the Directors. Each director serves until his or her death, resignation, or retirement or until the next annual meeting of shareholders is held or until his or her successor is elected and qualifies.
Directors and officers who are employed by or who have a financial interest in The Hartford are considered “interested” persons of the Fund pursuant to the 1940 Act. Each officer and two of the Company’s directors, as noted in the chart below, are “interested” persons of the Fund. Each director serves as a director for The Hartford Mutual Funds, Inc., The Hartford Mutual Funds II, Inc., Hartford Series Fund, Inc., Hartford HLS Series Fund II, Inc., and as a trustee for The Hartford Alternative Strategies Fund, which, as of June 30, 2012, collectively consist of 89 funds. Correspondence may be sent to directors and officers c/o Hartford Mutual Funds, P.O. Box 2999, Hartford, Connecticut 06104-2999, except that correspondence to Mr. Annoni, Mr. Dressen and Ms. Fagely may be sent to 500 Bielenberg Drive, Woodbury, Minnesota 55125.
The table below sets forth, for each director and officer, his or her name, year of birth, current position with the Company and date first elected or appointed to Hartford Series Fund, Inc. (“HSF”), and Hartford HLS Series Fund II, Inc. (“HSF2”), principal occupation, and, for directors, other directorships held. The Fund’s statement of additional information contains further information on the directors and is available free of charge by calling 1-800-862-6668 or writing to Hartford HLS Funds, c/o Individual Annuity Services, P.O. Box 5085, Hartford, CT 06102-5085.
Information on the aggregate remuneration paid to the directors of the Company can be found in the Statement of Operations herein. The Fund pays to The Hartford a portion of the Chief Compliance Officer’s compensation, but does not pay salaries or compensation to any of their other officers or directors who are employed by The Hartford.
Non-Interested Directors
Lynn S. Birdsong (1946) Director since 2003, Co-Chairman of the Investment Committee
Mr. Birdsong is a private investor. Mr. Birdsong currently serves as a Director of the Sovereign High Yield Investment Company (April 2010 to current). Mr. Birdsong currently serves as an Independent Director of Nomura Partners Funds, Inc. (formerly, The Japan Fund) (March 2003 to current). From 1979 to 2002, Mr. Birdsong was a managing director of Zurich Scudder Investments, an investment management firm. During his employment with Scudder, Mr. Birdsong was an Interested Director of The Japan Fund. Since 1981, Mr. Birdsong has been a partner in Birdsong Company, an advertising specialty firm.
Robert M. Gavin, Jr. (1940) Director since 2002 (HSF) and 1986 (HSF2), Chairman of the Board since 2004
Dr. Gavin is an educational consultant. Prior to September 1, 2001, he was President of Cranbrook Education Community and prior to July 1996, he was President of Macalester College, St. Paul, Minnesota.
Duane E. Hill (1945) Director since 2001 (HSF) and 2002 (HSF2), Chairman of the Nominating Committee
Mr. Hill is Partner of TSG Ventures L.P., a private equity investment company. Mr. Hill is a former partner of TSG Capital Group, a private equity investment firm that served as sponsor and lead investor in leveraged buyouts of middle market companies.
Sandra S. Jaffee (1941) Director since 2005
Ms. Jaffee is the founder and Chief Executive Officer of a private company, Homeworks Concierge, LLC, which provides residential property management services in Westchester County, New York (January 2012 to present). Ms. Jaffee served as Chairman (2008 to 2009) and Chief Executive Officer of Fortent (formerly Searchspace Group), a leading provider of compliance/regulatory technology to financial institutions from August 2005 to August 2009. Ms. Jaffe currently serves as a member of the Board of Directors of Broadridge Financial Solutions as well as a Trustee of Muhlenberg College.
William P. Johnston (1944) Director since 2005, Chairman of the Compliance Committee
In June 2006, Mr. Johnston was appointed as Senior Advisor to The Carlyle Group, a global private equity investment firm. In August 2007, Mr. Johnston was elected to the Board of Directors of LifeCare Holdings, Inc. In February 2008, Mr. Johnston was elected to the Board of Directors of HCR-ManorCare, Inc. In May 2006, Mr. Johnston was elected to the Supervisory Board of Fresenius Medical Care AG & Co. KGaA, after its acquisition of Renal Care Group, Inc. in March 2006.
Phillip O. Peterson (1944) Director since 2002 (HSF) and 2000 (HSF2), Chairman of the Audit Committee
Mr. Peterson is a mutual fund industry consultant. He was a partner of KPMG LLP (an accounting firm) until July 1999. Mr. Peterson joined William Blair Funds in February 2007 as a member of the Board of Trustees. Mr. Peterson also joined the Board of Trustees of Symetra Variable Mutual Funds Trust as a trustee in February 2012.
| 24 |
Lemma W. Senbet (1946) Director since 2005
Dr. Senbet is the William E. Mayer Chair Professor of Finance and Director, Center for Financial Policy, at the University of Maryland, Robert H. Smith School of Business. He was chair of the Finance Department from 1998 to 2006. Previously he was a chaired professor of finance at the University of Wisconsin-Madison. Also, he was director of the Fortis Funds from March 2000 to July 2002. Dr. Senbet served the finance profession in various capacities, including as director of the American Finance Association and President of the Western Finance Association. In 2006, Dr. Senbet was inducted Fellow of Financial Management Association International for his career-long distinguished scholarship and professional service.
Interested Directors and Officers
David N. Levenson (1966) Director since 2010(1)
Mr. Levenson currently serves as President of The Hartford’s Wealth Management business. He was appointed to this role in July 2010. Previously, Mr. Levenson served as Executive Vice President of Legacy Holdings for The Hartford from June 2009 to July 2010. From 2006 to 2009, Mr. Levenson was with Hartford Life Insurance K.K. where he served as President and Chief Executive Officer from 2007 to 2009. He served as Managing Director of Hartford Investment Management Company from 2005 to 2006. Additionally, Mr. Levenson serves as Executive Vice President of The Hartford and as President, Director and Chief Executive Officer of Hartford Life Insurance Company (“HLIC”) and Hartford Life, Inc. (“HL Inc.”).
(1) Mr. Levenson served as Interested Director until August 2, 2012.
Lowndes A. Smith (1939) Director since 1996 (HSF) and 2002 (HSF2), Co-Chairman of the Investment Committee
Mr. Smith served as Vice Chairman of The Hartford from February 1997 to January 2002, as President and Chief Executive Officer of HL Inc. from February 1997 to January 2002, and as President and Chief Operating Officer of The Hartford Life Insurance Companies from January 1989 to January 2002. Mr. Smith serves as a Director of White Mountains Insurance Group, Ltd., One Beacon Insurance and Symetra Financial and as Managing Director of Whittington Gray Associates.
Other Officers
James E. Davey (1964) President and Chief Executive Officer since 2010(2)
Mr. Davey serves as Executive Vice President of HLIC. Additionally, Mr. Davey serves as President, Chief Executive Officer and Manager of HIFSCO and President, Chief Executive Officer and Manager of HL Investment Advisors, LLC (“HL Advisors”). Mr. Davey joined The Hartford in 2002.
(2) Mr. Davey became an Interested Director effective August 2, 2012.
Mark A. Annoni (1964) Vice President, Controller and Treasurer since 2012(3)
Mr. Annoni serves as the Assistant Vice President and Director of Investment Finance (February 2004 to present). Mr. Annoni joined The Hartford in April 2001 as part of The Hartford’s acquisition of Fortis Financial Group. Prior to joining The Hartford, Mr. Annoni served as Manager of Mutual Fund Accounting at Fortis Financial Group (July 1997 to April 2001).
(3) Mr. Annoni was named Vice President, Controller and Treasurer on May 8, 2012.
Michael R. Dressen (1963) AML Compliance Officer since 2011
Mr. Dressen currently serves as Assistant Vice President of HLIC. He also serves as Chief Compliance Officer and AML Compliance Officer of Hartford Administrative Services Company (“HASCO”) and as Assistant Secretary and Compliance Officer of HIFSCO. Mr Dressen joined The Hartford in 2005 from State Farm Insurance Companies where he held various positions related to mutual funds, variable products, and property casualty insurance.
Tamara L. Fagely (1958) Vice President, since 2002 (HSF) and 1993 (HSF2)(4)
Ms. Fagely has been a Vice President of HASCO since 1998 and Chief Financial Officer since 2006. Currently Ms. Fagely is a Vice President of HLIC. She served as Assistant Vice President of HLIC from December 2001 through March 2005. In addition, Ms. Fagely is Controller and Chief Financial Officer of HIFSCO.
(4) Ms. Fagely served as Vice President, Controller and Treasurer until May 8, 2012.
Dr. Robert J. Froehlich (1953) Senior Managing Director since 2009(5)
Dr. Froehlich joined The Hartford as Senior Managing Director in September 2009. Prior to joining The Hartford, Dr. Froehlich served as Vice Chairman of Deutsche Asset Management from 1997-2009.
(5) Dr. Froehlich served as Senior Managing Director until March 26, 2012.
| 25 |
| Hartford Dividend and Growth HLS Fund |
| Directors and Officers (Unaudited) – (continued) |
Edward P. Macdonald (1967) Vice President, Secretary and Chief Legal Officer since 2005
Mr. Macdonald serves as Vice President of HLIC and Chief Legal Officer of Mutual Funds and Vice President of HIFSCO. He also serves as Vice President and Secretary of HASCO, and Chief Legal Officer, Secretary and Vice President of HL Advisors. Mr. Macdonald joined The Hartford in 2005.
Vernon J. Meyer (1964) Vice President since 2006
Mr. Meyer serves as Senior Vice President of HLIC. He also serves as Senior Vice President of HIFSCO and HL Advisors. Mr. Meyer joined The Hartford in 2004.
Colleen B. Pernerewski (1969) Vice President and Chief Compliance Officer since 2010
Ms. Pernerewski serves as Vice President and Chief Investment Advisor Compliance Officer of HIFSCO and as Vice President and Chief Compliance Officer of HL Advisors. Ms. Pernerewski serves as Vice President and Chief Compliance Officer of Individual Annuity of HLIC. Ms. Pernerewski joined The Hartford in 2005 from Travelers Life and Annuity where she served as Counsel (2004-2005). Prior to Travelers Life and Annuity, Ms. Pernerewski held the position of Counsel at The Hartford (1998-2004).
Elizabeth L. Schroeder (1966) Vice President since 2010
Ms. Schroeder currently serves as Assistant Vice President of HLIC. Ms. Schroeder joined HLIC in 1991. She is also an Assistant Vice President of HASCO, HIFSCO and HL Advisors.
Martin Swanson (1962) Vice President since 2010
Mr. Swanson is a Vice President of HLIC. Mr. Swanson also serves as Vice President/Marketing for HIFSCO. Prior to joining HLIC in 1998, Mr. Swanson was a Vice President at PaineWebber, Inc.
Jane Wolak (1961) Vice President since 2009
Ms. Wolak currently serves as Senior Vice President of HLIC. Ms. Wolak joined HLIC as Vice President, Retail Product Services in May 2007. She is also Vice President of HASCO. Previously, Ms. Wolak was with Sun Life Financial where she held the position of Vice President, Service Center Operations from 2001-2007.
HOW TO OBTAIN A COPY OF THE FUND’S PROXY VOTING POLICIES AND VOTING RECORDS (UNAUDITED)
A description of the policies and procedures that the Fund uses to determine how to vote proxies relating to portfolio securities and a record of how the Fund voted any proxies for the twelve-month period ended June 30, 2012 are available (1) without charge, upon request, by calling 800-862-6668 and (2) on the SEC’s website at http://www.sec.gov.
QUARTERLY PORTFOLIO HOLDINGS INFORMATION (UNAUDITED)
The Fund files a complete schedule of portfolio holdings with the SEC for the first and third quarters of each fiscal year on Form N-Q. The Fund’s Forms are available (1) without charge, upon request, by calling 800-862-6668 and (2) on the SEC’s website at http://www.sec.gov. The Form N-Q may be reviewed and copied at the SEC’s Public Reference Room in Washington, DC. Information on the operation of the Public Reference Room may be obtained by calling 1-800-SEC-0330.
| 26 |
| Hartford Dividend and Growth HLS Fund |
| Expense Example (Unaudited) |
Your Fund's Expenses
As a shareholder of the Fund, you incur two types of costs: (1) transaction costs and (2) ongoing costs including investment management fees, distribution fees, and other fund expenses. This example is intended to help you understand your ongoing costs (in dollars) of investing in the Fund and to compare these costs with the ongoing costs of investing in other mutual funds. The example is based on an investment of $1,000 invested at the beginning of the period and held for the period of December 31, 2011 through June 30, 2012.
Actual Expenses
The first set of columns of the table below provides information about actual account values and actual expenses. You may use the information in this column, together with the amount you invested, to estimate the expenses that you paid over the period. Simply divide your account value by $1,000 (for example, an $8,600 account value divided by $1,000 = 8.6), then multiply the result by the number in the line under the heading entitled “Expenses Paid During Period” to estimate the expenses you paid on your account during this period.
Hypothetical Example for Comparison Purposes
The second set of columns of the table below provides information about hypothetical account values and hypothetical expenses based on the Fund’s actual expense ratio and an assumed rate of return of 5% per year before expenses, which is not the Fund’s actual return. The hypothetical account values and expenses may not be used to estimate the actual ending account balance or expenses you paid for the period. You may use this information to compare the ongoing costs of investing in the Fund and other funds. To do so, compare this 5% hypothetical example with the 5% hypothetical examples that appear in the shareholder reports of the other funds.
Please note that the expenses shown in the table are meant to highlight your ongoing costs only and do not reflect any transactional costs, such as sales charges (loads) and CDSC. Therefore, the second set of columns of the table is useful in comparing ongoing costs only, and will not help you determine the relative total costs of owning different funds. In addition, if these transactional costs were included, your costs would be higher. Expenses are equal to the Fund's annualized expense ratios multiplied by average account value over the period, multiplied by 182/366 (to reflect the one-half year period).
| Actual return | Hypothetical (5% return before expenses) | |||||||||||||||||||||||||||||||||||
| Beginning Account Value December 31, 2011 | Ending Account Value June 30, 2012 | Expenses paid during the period December 31, 2011 through June 30, 2012 | Beginning Account Value December 31, 2011 | Ending Account Value June 30, 2012 | Expenses paid during the period December 31, 2011 through June 30, 2012 | Annualized expense ratio | Days in the current 1/2 year | Days in the full year | ||||||||||||||||||||||||||||
| Class IA | $ | 1,000.00 | $ | 1,073.46 | $ | 3.45 | $ | 1,000.00 | $ | 1,021.53 | $ | 3.37 | 0.67 | % | 182 | 366 | ||||||||||||||||||||
| Class IB | $ | 1,000.00 | $ | 1,072.12 | $ | 4.74 | $ | 1,000.00 | $ | 1,020.29 | $ | 4.62 | 0.92 | % | 182 | 366 | ||||||||||||||||||||
| 27 |
HARTFORD HLS FUNDS
c/o The Hartford Wealth Management - Global Annuities
P.O. Box 14293
Lexington, KY 40512-4293
Hartford Series Fund, Inc. is underwritten and distributed by Hartford Securities Distribution Company, Inc.
"The Hartford" is The Hartford Financial Services Group, Inc. and its subsidiaries.
Hartford Series Fund, Inc. inception dates range from 1977 to date. Hartford Series Fund, Inc. is not a subsidiary of The Hartford but is underwritten, distributed by and advised by subsidiaries of The Hartford. Investments in Hartford Series Fund, Inc. are not guaranteed by The Hartford or any other entity.
You should carefully consider investment objectives, risks, and charges and expenses of Hartford HLS Funds before investing. This and other information can be found in the Fund’s prospectus or summary prospectus, which can be obtained by calling 800-862-6668. Please read them carefully before you invest or send money.
| HLSSAR-DG12 8-12 111647 Printed in U.S.A ©2012 The Hartford, Hartford, CT 06115 | |

A MESSAGE FROM THE PRESIDENT
Dear Fellow Shareholders:
I want to take this opportunity to say thank you for investing in the Hartford HLS Funds. We’ve seen continued market volatility throughout the first half of 2012, and there will likely be continued uncertainty until the Presidential election in November, but we are still optimistic about the markets in 2012.
Market Review
In the first quarter of 2012, the S&P 500 Index turned in its best quarterly performance since the third quarter of 2009. U.S. equities showed signs of improvement as investors focused on improving economic data and strong corporate earnings news and the Federal Reserve’s pledge to keep interest rates low buoyed investors’ appetites.
The second quarter ended on a high note for the stock market—the S&P 500 had its strongest June in more than a decade and the Dow Jones Industrial Average had its best month since October—but those gains weren’t enough to offset losses from April and May, and equities finished the quarter in the red. Although the S&P 500 was -2.75 for the second quarter, it was up 9.49% for the first half of 2012.
Concerns about domestic and European unemployment are having an effect on our economy. The unemployment rate in the euro zone's 17 nations rose to a record 11.1% in May, the highest level since the euro launched as a common currency more than 10 years ago. In the U.S., the labor market has been fickle this year, with job growth starting off strong in the first couple months of 2012 but slowing down in the spring, which has led many to wonder about the status of the economic recovery.
On a positive note, home prices are rising again after falling for more than five years, new and existing home sales are increasing, and home builders are ramping up construction.
The Hartford HLS Funds Expands Relationship with Wellington Management
We’re very pleased that we are expanding our relationship with Wellington Management, which will now serve as the primary sub-adviser for the Hartford HLS Funds including equity, fixed-income,* and asset-allocation funds. One of America’s oldest and largest investment management firms, Wellington Management has resources that span the entire globe, with multiple offices across the U.S. and numerous offices abroad. Wellington Management’s most distinctive strength is its proprietary research, which is shared across the entire organization.
We believe that aligning more closely with a well-respected money manager like Wellington Management puts us in a strong position to drive significant growth and to continue delivering innovative fund strategies to help our investors meet their financial goals.
Thank you again for investing with the Hartford HLS Funds.
James Davey
President
Hartford HLS Funds
*Several fixed-income funds will continue to be sub-advised by Hartford Investment Management Company.
Hartford Global Growth HLS Fund
This report is prepared for the general information of contract owners and qualified retirement plan participants. It is not an offer of contracts or of qualified retirement plans. It should not be used in connection with any offer, except in conjunction with the appropriate product prospectus which contains all pertinent information including the applicable sales, administrative and other charges.
The views expressed in the Fund’s Manager Discussion under ‘‘Why did the Fund perform this way?’’ and ‘‘What is the outlook?’’ are views of the Fund’s sub-adviser and portfolio management team through the end of the period and are subject to change based on market and other conditions.
| Hartford Global Growth HLS Fund inception 09/30/1998 |
| (sub-advised by Wellington Management Company, LLP) |
| Investment objective – Seeks growth of capital. |
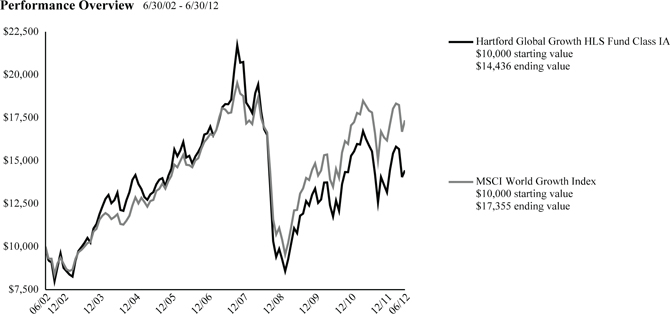
The chart above shows the growth of a $10,000 investment in Class IA. Growth results in classes other than Class IA will vary from what is seen above due to differences in the expenses charged to those share classes.
Average Annual Total Returns (as of 6/30/12)
| 6 Month† | 1 Year | 5 year | 10 year | |||||||||||||
| Global Growth IA | 9.66 | % | -9.16 | % | -4.63 | % | 3.74 | % | ||||||||
| Global Growth IB | 9.53 | % | -9.39 | % | -4.87 | % | 3.48 | % | ||||||||
| MSCI World Growth Index | 7.27 | % | -3.14 | % | -0.71 | % | 5.67 | % | ||||||||
| † | Not Annualized |
PAST PERFORMANCE IS NOT INDICATIVE OF FUTURE RESULTS.
Total returns presented above were calculated using the Fund's net asset value available to shareholders for sale or redemption of Fund shares on June 30, 2012, which may exclude investment transactions as of this date.
MSCI World Growth Index is a broad-based unmanaged market capitalization-weighted total return index which measures the performance of growth securities in 23 developed-country global equity markets including the United States, Canada, Europe, Australia, New Zealand and the Far East.
You cannot invest directly in an index.
The chart represents a hypothetical investment in the Fund. Performance data represents past performance and current performance could be higher or lower.
Performance information may reflect historical or current expense waivers/reimbursements from the investment adviser, without which performance would have been lower. For information on current expense waivers/reimbursements, please see the prospectus.
The value of the Fund will fluctuate so that when redeemed, it may be worth more or less than the original investment. The chart and table do not reflect the deductions of taxes, sales charges or other fees which may be applied at the variable life insurance, variable annuity or qualified retirement plan product level. Any such additional sales charges or other fees or expenses would lower the contract’s or plan’s performance.
| 2 |
| Hartford Global Growth HLS Fund |
| Manager Discussion |
| June 30, 2012 (Unaudited) |
| Portfolio Managers | |
| Matthew D. Hudson, CFA | John A. Boselli, CFA* |
| Vice President and Equity Portfolio Manager | Director and Equity Portfolio Manager |
| * Effective June 27, 2012, Mr. Boselli was added as a Portfolio Manager to the Fund. | |
How did the Fund perform?
The Class IA shares of the Hartford Global Growth HLS Fund returned 9.66% for the six-month period ended June 30, 2012, outperforming its benchmark, the MSCI World Growth Index, which returned 7.27% for the same period. The Fund also outperformed the 6.34% return of the average fund in the Lipper Global Growth VP-UF Funds peer group, a group of funds with investment strategies similar to those of the Fund.
Why did the Fund perform this way?
Global equities surged in the first half of the period as markets looked past lingering uncertainty regarding eurozone sovereign debt, focusing instead on improving economic data. Strong corporate earnings news added to investors’ optimism, helping to offset heightened geopolitical risks. In sharp contrast to the first half of the period, global equities reversed course during the second half of the period as fears surrounding European sovereign debt once again took center stage. Growing concerns that Greece may exit the euro zone and the possibility of a banking crisis in Spain underpinned a rise in risk aversion among investors. In the U.S., new economic data remained subdued and included a lackluster U.S. jobs report. Analysis of market drivers show that investors favored safety-oriented and lower volatility stocks in the second half of the period.
For the semi-annual period, Growth stocks (+7.3%) outperformed Value stocks (+5.3%) as measured by the MSCI World Growth Index and the MSCI World Value Indexes, respectively. Within the MSCI World Growth Index, seven of ten sectors posted positive returns. Information Technology (+13%), Health Care (+12%), and Consumer Discretionary (+11%) gained the most, while the Energy (-6%), Utilities (-6%), and Materials (-2%) sectors lagged with negative returns.
The Fund’s outperformance versus its benchmark was primarily due to broad-based strong security selection, particularly in the Consumer Discretionary, Information Technology, and Health Care sectors. Sector allocation, a residual of our bottom-up stock selection process (i.e. stock by stock fundamental research), was also additive to relative returns, primarily due to an overweight (i.e. the Fund’s sector position was more than the benchmark position) to the outperforming Information Technology sector. Overall strong performance was partially offset by unfavorable selection in Consumer Staples, Energy, and Financials.
Top contributors to relative performance included Regeneron Pharmaceuticals (Health Care), Edwards Lifesciences (Health Care), and eBay (Information Technology). Regeneron Pharmaceuticals is an integrated biopharmaceutical company which discovers, develops, manufactures, and commercializes medicines for the treatment of serious medical conditions. Shares rose after the company reported better-than-expected sales of the firm’s recently launched macular degeneration drug Eylea. In addition, Regeneron substantially raised sales guidance for Eylea during the period. Edwards Lifesciences, a biotechnology firm specializing in heart valve technology and treatments for cardiovascular disease, saw its shares rise after the company issued higher than expected earnings guidance in April and released favorable test phase results for the next generation of Sapien 3 valves. Shares of eBay, a U.S.-based provider of online marketplaces and payment solutions, rose after the firm posted better-than-expected quarterly revenue and earnings due to strength in its marketplace segment and Paypal. The company also raised its revenue and earnings guidance for the 2012 fiscal year. Top contributors to absolute performance (i.e. total return) also included Apple (Information Technology).
The top detractors from the Fund’s relative performance were Green Mountain Coffee (Consumer Staples), Chesapeake Energy (Energy), and Juniper Networks (Information Technology). Green Mountain Coffee, a U.S.-based maker of Keurig single-cup brewing systems and coffee, saw its shares decline due to disappointing quarterly results and lower guidance from management. Growth in the company’s K-cups business fell below consensus expectations and the shortfall led to lower-than-expected operating profits. Chesapeake Energy, a U.S.-based producer of natural gas, oil, and natural gas liquids, underperformed due to concerns regarding corporate governance and uncertainty regarding the company’s ability to fund its capital expenditure plans. Juniper Networks, a leading provider of routing and security solutions to both carriers and enterprises, saw its shares decline as it was pressured by capital expenditure tightening among customers,
| 3 |
| Hartford Global Growth HLS Fund |
| Manager Discussion – (continued) |
| June 30, 2012 (Unaudited) |
particularly in Europe. Top detractors from absolute performance also included Repsol (Energy).
What is the outlook?
Notwithstanding short-term volatility from quarter to quarter, we expect global economic growth to continue, but at a slow recovery rate and with varying degrees of recovery by region. While we believe that the U.S. economy appears more favorably positioned in a global context, we also recognize that the U.S. is not immune to growth setbacks and will have to address its fiscal imbalances in the coming years. Within emerging markets, we continue to see mixed stages of economic recovery and development.
In Europe, some relief was granted in late June after the European Union summit provided some clarity on support for Spanish banks and troubled banks elsewhere in the region, although significant challenges remain. In addition, Greek parliamentary elections put in place a coalition government that is more likely to support the existing bailout agreement, alleviating investors' fears of an imminent Euro breakup.
Portfolio construction is a bottom-up process based on intensive company research. Allocations among sectors are the result of individual stock decisions. At the end of the period, our stock-by-stock investment process resulted in greater-than-benchmark weights in Information Technology, Financials, Consumer Discretionary, Health Care, and Telecommunication Services. The Fund ended the period most underweight the Consumer Staples, Materials, and Energy sectors relative to the benchmark.
Diversification by Country
as of June 30, 2012
| Percentage of | ||||
| Country | Net Assets | |||
| Australia | 1.5 | % | ||
| Belgium | 0.7 | |||
| Brazil | 0.5 | |||
| Canada | 1.0 | |||
| China | 2.0 | |||
| France | 3.5 | |||
| Germany | 1.6 | |||
| Hong Kong | 3.6 | |||
| Ireland | 0.5 | |||
| Israel | 0.5 | |||
| Italy | 0.6 | |||
| Japan | 3.2 | |||
| Jersey | 0.4 | |||
| Mexico | 0.5 | |||
| Netherlands | 1.9 | |||
| South Korea | 1.2 | |||
| Sweden | 0.5 | |||
| Switzerland | 3.5 | |||
| Taiwan | 1.0 | |||
| United Kingdom | 5.6 | |||
| United States | 64.4 | |||
| Short-Term Investments | 5.3 | |||
| Other Assets and Liabilities | (3.5 | ) | ||
| Total | 100.0 | % | ||
| 4 |
| Hartford Global Growth HLS Fund |
| Schedule of Investments |
| June 30, 2012 (Unaudited) |
| (000’s Omitted) |
| Shares or Principal Amount | Market Value ╪ | |||||||
| COMMON STOCKS - 98.2% | ||||||||
| Automobiles & Components - 0.5% | ||||||||
| 247 | Nissan Motor Co., Ltd. | $ | 2,344 | |||||
| Banks - 2.3% | ||||||||
| 70 | BNP Paribas | 2,693 | ||||||
| 129 | Standard Chartered plc | 2,799 | ||||||
| 133 | Wells Fargo & Co. | 4,454 | ||||||
| 9,946 | ||||||||
| Capital Goods - 8.2% | ||||||||
| 78 | Assa Abloy Ab | 2,166 | ||||||
| 41 | Boeing Co. | 3,015 | ||||||
| 22 | Cummins, Inc. | 2,122 | ||||||
| 105 | Honeywell International, Inc. | 5,873 | ||||||
| 47 | Illinois Tool Works, Inc. | 2,491 | ||||||
| 93 | Monadelphous Group Ltd. | 2,110 | ||||||
| 28 | Nidec Corp. | 2,134 | ||||||
| 209 | Rolls-Royce Holdings plc | 2,812 | ||||||
| 106 | Safran S.A. | 3,952 | ||||||
| 50 | Schneider Electric S.A. | 2,771 | ||||||
| 15 | SMC Corp. | 2,640 | ||||||
| 63 | Tyco International Ltd. | 3,308 | ||||||
| 35,394 | ||||||||
| Commercial & Professional Services - 1.0% | ||||||||
| 41 | Campbell Brothers | 2,317 | ||||||
| 323 | Seek Ltd. | 2,117 | ||||||
| 4,434 | ||||||||
| Consumer Durables & Apparel - 3.9% | ||||||||
| 38 | Cie Financiere Richemont S.A. | 2,106 | ||||||
| 43 | Coach, Inc. | 2,515 | ||||||
| 1,270 | Daphne International Holdings Ltd. | 1,296 | ||||||
| 21 | Hugo Boss AG | 2,090 | ||||||
| 36 | Lululemon Athletica, Inc. ● | 2,145 | ||||||
| 3 | NVR, Inc. ● | 2,380 | ||||||
| 374 | Prada S.p.A. ● | 2,522 | ||||||
| 15 | V.F. Corp. | 2,015 | ||||||
| 17,069 | ||||||||
| Consumer Services - 2.9% | ||||||||
| 1,879 | Galaxy Entertainment Group Ltd. ● | 4,727 | ||||||
| 209 | MGM Resorts International ● | 2,336 | ||||||
| 1,001 | Sands China Ltd. § | 3,219 | ||||||
| 41 | Starbucks Corp. | 2,187 | ||||||
| 12,469 | ||||||||
| Diversified Financials - 6.6% | ||||||||
| 606 | Aberdeen Asset Management plc | 2,468 | ||||||
| 21 | Affiliated Managers Group, Inc. ● | 2,244 | ||||||
| 94 | American Express Co. | 5,490 | ||||||
| 17 | BlackRock, Inc. | 2,923 | ||||||
| 6 | CME Group, Inc. | 1,534 | ||||||
| 97 | Discover Financial Services, Inc. | 3,361 | ||||||
| 22 | Goldman Sachs Group, Inc. | 2,148 | ||||||
| 141 | Hong Kong Exchanges & Clearing Ltd. | 2,027 | ||||||
| 118 | JP Morgan Chase & Co. | 4,211 | ||||||
| 55 | Moody's Corp. | 2,025 | ||||||
| 28,431 | ||||||||
| Energy - 3.1% | ||||||||
| 36 | Anadarko Petroleum Corp. | 2,368 | ||||||
| 108 | BG Group plc | 2,205 | ||||||
| 48 | Ensco plc | 2,246 | ||||||
| 21 | EOG Resources, Inc. | 1,922 | ||||||
| 36 | National Oilwell Varco, Inc. | 2,293 | ||||||
| 34 | Schlumberger Ltd. | 2,218 | ||||||
| 13,252 | ||||||||
| Food & Staples Retailing - 0.9% | ||||||||
| 87 | CVS Caremark Corp. | 4,079 | ||||||
| Food, Beverage & Tobacco - 6.4% | ||||||||
| 39 | Anheuser-Busch InBev N.V. | 3,087 | ||||||
| 66 | British American Tobacco plc | 3,337 | ||||||
| 93 | Green Mountain Coffee Roasters, Inc. ● | 2,015 | ||||||
| 54 | Groupe Danone | 3,347 | ||||||
| 84 | Japan Tobacco, Inc. | 2,498 | ||||||
| 23 | Lorillard, Inc. | 3,008 | ||||||
| 23 | Pernod-Ricard | 2,482 | ||||||
| 52 | Philip Morris International, Inc. | 4,520 | ||||||
| 105 | Unilever N.V. CVA | 3,493 | ||||||
| 27,787 | ||||||||
| Health Care Equipment & Services - 4.8% | ||||||||
| 66 | Aetna, Inc. | 2,540 | ||||||
| 27 | Edwards Lifesciences Corp. ● | 2,744 | ||||||
| 3 | Galenica AG | 2,168 | ||||||
| 34 | Humana, Inc. | 2,641 | ||||||
| 27 | McKesson Corp. | 2,494 | ||||||
| 66 | Medtronic, Inc. | 2,572 | ||||||
| 52 | UnitedHealth Group, Inc. | 3,065 | ||||||
| 37 | Wellpoint, Inc. | 2,354 | ||||||
| 20,578 | ||||||||
| Insurance - 2.2% | ||||||||
| 40 | Hannover Rueckversicherung AG | 2,387 | ||||||
| 177 | Lancashire Holdings Ltd. | 2,206 | ||||||
| 246 | Ping An Insurance (Group) Co. | 1,988 | ||||||
| 44 | Swiss Re Ltd. | 2,767 | ||||||
| 9,348 | ||||||||
| Materials - 2.3% | ||||||||
| 47 | Anglo American plc | 1,552 | ||||||
| 54 | Barrick Gold Corp. | 2,047 | ||||||
| 327 | Cemex S.A. de C.V. ADR ● | 2,202 | ||||||
| 341 | Glencore International plc | 1,582 | ||||||
| 8 | Syngenta AG | 2,624 | ||||||
| 10,007 | ||||||||
| Media - 6.3% | ||||||||
| 70 | CBS Corp. Class B | 2,304 | ||||||
| 172 | Comcast Corp. Class A | 5,499 | ||||||
| 56 | DirecTV Class A ● | 2,751 | ||||||
| 306 | News Corp. Class A | 6,826 | ||||||
| 1,443 | Sirius XM Radio, Inc. w/ Rights ● | 2,669 | ||||||
| 64 | Viacom, Inc. Class B | 3,005 | ||||||
| 44 | Walt Disney Co. | 2,144 | ||||||
| 172 | WPP plc | 2,086 | ||||||
| 27,284 | ||||||||
| Pharmaceuticals, Biotechnology & Life Sciences - 5.6% | ||||||||
| 62 | Agilent Technologies, Inc. | 2,433 | ||||||
| 52 | Amgen, Inc. | 3,813 | ||||||
| 41 | Celgene Corp. ● | 2,653 | ||||||
| 108 | Gilead Sciences, Inc. ● | 5,520 | ||||||
| 49 | Life Technologies Corp. ● | 2,205 | ||||||
| 77 | Mylan, Inc. ● | 1,639 | ||||||
| 21 | Regeneron Pharmaceuticals, Inc. ● | 2,390 | ||||||
| 20 | Roche Holding AG | 3,467 | ||||||
| 24,120 | ||||||||
The accompanying notes are an integral part of these financial statements.
| 5 |
| Hartford Global Growth HLS Fund |
| Schedule of Investments – (continued) |
| June 30, 2012 (Unaudited) |
| (000’s Omitted) |
| Shares or Principal Amount | Market Value ╪ | |||||||
| COMMON STOCKS - 98.2% - (continued) | ||||||||
| Retailing - 5.6% | ||||||||
| 19 | Amazon.com, Inc. ● | $ | 4,269 | |||||
| 9 | AutoZone, Inc. ● | 3,121 | ||||||
| 38 | Bed Bath & Beyond, Inc. ● | 2,355 | ||||||
| 6 | Fast Retailing Co., Ltd. | 1,170 | ||||||
| 78 | Gap, Inc. | 2,139 | ||||||
| 124 | Lowe's Co., Inc. | 3,522 | ||||||
| 48 | Next plc | 2,407 | ||||||
| 8 | Priceline.com, Inc. ● | 5,448 | ||||||
| 24,431 | ||||||||
| Semiconductors & Semiconductor Equipment - 4.4% | ||||||||
| 86 | Altera Corp. | 2,910 | ||||||
| 92 | ASML Holding N.V. | 4,747 | ||||||
| 93 | Intel Corp. | 2,480 | ||||||
| 107 | NVIDIA Corp. ● | 1,485 | ||||||
| 5 | Samsung Electronics Co., Ltd. | 5,128 | ||||||
| 64 | Xilinx, Inc. | 2,145 | ||||||
| 18,895 | ||||||||
| Software & Services - 16.7% | ||||||||
| 40 | Accenture plc | 2,410 | ||||||
| 372 | Activision Blizzard, Inc. | 4,454 | ||||||
| 18 | Alliance Data Systems Corp. ● | 2,362 | ||||||
| 70 | Amdocs Ltd. ● | 2,089 | ||||||
| 36 | Baidu, Inc. ADR ● | 4,084 | ||||||
| 27 | Citrix Systems, Inc. ● | 2,246 | ||||||
| 170 | eBay, Inc. ● | 7,132 | ||||||
| 12 | Google, Inc. ● | 7,140 | ||||||
| 70 | IAC/InterActiveCorp. | 3,206 | ||||||
| 25 | LinkedIn Corp. ● | 2,609 | ||||||
| 7 | Mastercard, Inc. | 3,011 | ||||||
| 146 | Microsoft Corp. | 4,451 | ||||||
| 35 | Netease.com, Inc. ● | 2,054 | ||||||
| 62 | Nice Systems Ltd. ● | 2,262 | ||||||
| 290 | Oracle Corp. | 8,622 | ||||||
| 18 | Salesforce.com, Inc. ● | 2,448 | ||||||
| 43 | SAP AG | 2,549 | ||||||
| 37 | Splunk, Inc. | 1,042 | ||||||
| 88 | Tencent Holdings Ltd. | 2,608 | ||||||
| 26 | Visa, Inc. | 3,264 | ||||||
| 124 | Western Union Co. | 2,081 | ||||||
| 72,124 | ||||||||
| Technology Hardware & Equipment - 11.0% | ||||||||
| 768 | AAC Technologies Holdings, Inc. | 2,235 | ||||||
| 40 | Apple, Inc. ● | 23,459 | ||||||
| 298 | EMC Corp. ● | 7,636 | ||||||
| 461 | Hitachi Ltd. | 2,841 | ||||||
| 751 | Hon Hai Precision Industry Co., Ltd. | 2,271 | ||||||
| 147 | Juniper Networks, Inc. ● | 2,400 | ||||||
| 50 | Qualcomm, Inc. | 2,773 | ||||||
| 693 | Quanta Computer, Inc. | 1,861 | ||||||
| 91 | Spectris plc | 2,182 | ||||||
| 47,658 | ||||||||
| Telecommunication Services - 1.4% | ||||||||
| 203 | China Mobile Ltd. | 2,223 | ||||||
| 1,161 | Sprint Nextel Corp. ● | 3,786 | ||||||
| 6,009 | ||||||||
| Transportation - 1.6% | ||||||||
| 247 | Delta Air Lines, Inc. ● | 2,702 | ||||||
| 24 | FedEx Corp. | 2,200 | ||||||
| 20 | Kuehne & Nagel International AG | 2,108 | ||||||
| 7,010 | ||||||||
| Utilities - 0.5% | ||||||||
| 57 | Cia de Saneamento Basico do Estado de Sao Paulo | 2,156 | ||||||
| Total common stocks | ||||||||
| (cost $379,498) | $ | 424,825 | ||||||
| Total long-term investments | ||||||||
| (cost $379,498) | $ | 424,825 | ||||||
| SHORT-TERM INVESTMENTS - 5.3% | ||||||||
| Repurchase Agreements - 5.3% | ||||||||
| Bank of America Merrill Lynch TriParty Joint Repurchase Agreement (maturing on 07/02/2012 in the amount of $12,222, collateralized by FHLMC 5.50% - 6.50%, 2035 - 2036, FNMA 5.00% - 6.00%, 2033 - 2039, value of $12,467) | ||||||||
| $ | 12,222 | 0.13%, 06/29/2012 | $ | 12,222 | ||||
| Barclays Capital TriParty Joint Repurchase Agreement (maturing on 07/02/2012 in the amount of $4,419, collateralized by U.S. Treasury Note 1.25% - 3.63%, 2014 - 2020, value of $4,507) | ||||||||
| 4,419 | 0.15%, 06/29/2012 | 4,419 | ||||||
| Deutsche Bank Securities TriParty Joint Repurchase Agreement (maturing on 07/02/2012 in the amount of $1,184, collateralized by U.S. Treasury Note 0.88%, 2016, value of $1,208) | ||||||||
| 1,184 | 0.20%, 06/29/2012 | 1,184 | ||||||
| TD Securities TriParty Joint Repurchase Agreement (maturing on 07/02/2012 in the amount of $3,460, collateralized by FHLMC 4.00% - 6.00%, 2027 - 2041, FNMA 4.00% - 4.50%, 2025 - 2042, U.S. Treasury Bond 6.38%, 2027, U.S. Treasury Note 0.38% - 8.75%, 2012 - 2017, value of $3,529) | ||||||||
| 3,460 | 0.15%, 06/29/2012 | 3,460 | ||||||
| UBS Securities, Inc. Joint Repurchase Agreement (maturing on 07/02/2012 in the amount of $1, collateralized by U.S. Treasury Note 1.00%, 2013, value of $1) | ||||||||
| 1 | 0.13%, 06/29/2012 | 1 | ||||||
The accompanying notes are an integral part of these financial statements.
| 6 |
| Shares or Principal Amount | Market Value ╪ | |||||||||||
| SHORT-TERM INVESTMENTS - 5.3% - (continued) | ||||||||||||
| Repurchase Agreements - 5.3% - (continued) | ||||||||||||
| UBS Securities, Inc. TriParty Joint Repurchase Agreement (maturing on 07/02/2012 in the amount of $1,559, collateralized by GNMA 4.00%, 2042, value of $1,590) | ||||||||||||
| $ | 1,559 | 0.20%, 06/29/2012 | $ | 1,559 | ||||||||
| 22,845 | ||||||||||||
| Total short-term investments | ||||||||||||
| (cost $22,845) | $ | 22,845 | ||||||||||
| Total investments | ||||||||||||
| (cost $402,343) ▲ | 103.5 | % | $ | 447,670 | ||||||||
| Other assets and liabilities | (3.5 | )% | (15,055 | ) | ||||||||
| Total net assets | 100.0 | % | $ | 432,615 | ||||||||
| Note: | Percentage of investments as shown is the ratio of the total market value to total net assets. |
Prices of foreign equities that are principally traded on certain foreign markets may be adjusted daily pursuant to a fair value pricing service approved by the Board of Directors in order to reflect an adjustment for factors occurring after the close of certain foreign markets but before the close of the New York Stock Exchange.
| ▲ | At June 30, 2012, the cost of securities for federal income tax purposes was $403,212 and the aggregate gross unrealized appreciation and depreciation based on that cost were: |
| Unrealized Appreciation | $ | 53,177 | ||
| Unrealized Depreciation | (8,719 | ) | ||
| Net Unrealized Appreciation | $ | 44,458 |
| ● | Non-income producing. |
| § | These securities were sold to the Fund under Regulation S, rules governing offers and sales made outside the United States without registration under the Securities Act of 1933. The Fund may only be able to resell these securities in the United States if an exemption from registration under the federal and state securities laws is available, or the Fund may only be able to sell these securities outside of the United States (such as on a foreign exchange) to a non-U.S. person. Unless otherwise indicated, these holdings are determined to be liquid. At June 30, 2012, the aggregate value of these securities was $3,219, which represents 0.7% of total net assets. |
The accompanying notes are an integral part of these financial statements.
| 7 |
| Hartford Global Growth HLS Fund |
| Schedule of Investments – (continued) |
| June 30, 2012 (Unaudited) |
| (000’s Omitted) |
Foreign Currency Contracts Outstanding at June 30, 2012
| Description | Counterparty | Buy / Sell | Market Value ╪ | Contract Amount | Delivery Date | Unrealized Appreciation/ (Depreciation) | ||||||||||||||||
| AUD | CSFB | Buy | $ | 2,136 | $ | 2,099 | 07/03/2012 | $ | 37 | |||||||||||||
| AUD | DEUT | Buy | 4,192 | 4,121 | 07/02/2012 | 71 | ||||||||||||||||
| CHF | SCB | Buy | 617 | 605 | 07/03/2012 | 12 | ||||||||||||||||
| CHF | SSG | Sell | 1,912 | 1,884 | 07/02/2012 | (28 | ) | |||||||||||||||
| EUR | BNP | Sell | 618 | 618 | 07/05/2012 | – | ||||||||||||||||
| EUR | SSG | Buy | 410 | 404 | 07/02/2012 | 6 | ||||||||||||||||
| EUR | SSG | Sell | 12,861 | 12,675 | 07/02/2012 | (186 | ) | |||||||||||||||
| EUR | UBS | Buy | 1,200 | 1,178 | 07/03/2012 | 22 | ||||||||||||||||
| GBP | BCLY | Buy | 695 | 694 | 07/03/2012 | 1 | ||||||||||||||||
| GBP | BCLY | Sell | 385 | 385 | 07/05/2012 | – | ||||||||||||||||
| GBP | DEUT | Sell | 188 | 187 | 07/02/2012 | (1 | ) | |||||||||||||||
| GBP | DEUT | Buy | 2,883 | 2,866 | 07/02/2012 | 17 | ||||||||||||||||
| GBP | JPM | Buy | 1,156 | 1,143 | 07/03/2012 | 13 | ||||||||||||||||
| HKD | CBK | Buy | 2,109 | 2,109 | 07/03/2012 | – | ||||||||||||||||
| HKD | CSFB | Buy | 861 | 861 | 07/03/2012 | – | ||||||||||||||||
| JPY | BNP | Sell | 6,037 | 6,051 | 07/02/2012 | 14 | ||||||||||||||||
| SEK | DEUT | Buy | 998 | 980 | 07/02/2012 | 18 | ||||||||||||||||
| SEK | DEUT | Sell | 217 | 213 | 07/02/2012 | (4 | ) | |||||||||||||||
| SEK | SCB | Sell | 529 | 518 | 07/03/2012 | (11 | ) | |||||||||||||||
| $ | (19 | ) | ||||||||||||||||||||
| ╪ | See Significant Accounting Policies of accompanying Notes to Financial Statements regarding valuation of securities. |
| GLOSSARY: (abbreviations used in preceding Schedule of Investments) | |
| Counterparty Abbreviations: | |
| BCLY | Barclays |
| BNP | BNP Paribas Securities |
| CBK | Citibank NA |
| CSFB | Credit Suisse First Boston Corp. |
| DEUT | Deutsche Bank Securities, Inc. |
| JPM | JP Morgan Chase & Co. |
| SCB | Standard Chartered Bank |
| SSG | State Street Global Markets LLC |
| UBS | UBS AG |
| Currency Abbreviations: | |
| AUD | Australian Dollar |
| CHF | Swiss Franc |
| EUR | EURO |
| GBP | British Pound |
| HKD | Hong Kong Dollar |
| JPY | Japanese Yen |
| SEK | Swedish Krona |
| Other Abbreviations: | |
| ADR | American Depositary Receipt |
| FHLMC | Federal Home Loan Mortgage Corp. |
| FNMA | Federal National Mortgage Association |
| GNMA | Government National Mortgage Association |
The accompanying notes are an integral part of these financial statements.
| 8 |
| Hartford Global Growth HLS Fund |
| Investment Valuation Hierarchy Level Summary |
| June 30, 2012 (Unaudited) |
| (000’s Omitted) |
| Total | Level 1 ♦ | Level 2 ♦ | Level 3 | |||||||||||||
| Assets: | ||||||||||||||||
| Common Stocks | ||||||||||||||||
| Automobiles & Components | $ | 2,344 | $ | – | $ | 2,344 | $ | – | ||||||||
| Banks | 9,946 | 4,454 | 5,492 | – | ||||||||||||
| Capital Goods | 35,394 | 16,809 | 18,585 | – | ||||||||||||
| Commercial & Professional Services | 4,434 | – | 4,434 | – | ||||||||||||
| Consumer Durables & Apparel | 17,069 | 9,055 | 8,014 | – | ||||||||||||
| Consumer Services | 12,469 | 4,523 | 7,946 | – | ||||||||||||
| Diversified Financials | 28,431 | 23,936 | 4,495 | – | ||||||||||||
| Energy | 13,252 | 11,047 | 2,205 | – | ||||||||||||
| Food & Staples Retailing | 4,079 | 4,079 | – | – | ||||||||||||
| Food, Beverage & Tobacco | 27,787 | 9,543 | 18,244 | – | ||||||||||||
| Health Care Equipment & Services | 20,578 | 18,410 | 2,168 | – | ||||||||||||
| Insurance | 9,348 | – | 9,348 | – | ||||||||||||
| Materials | 10,007 | 4,249 | 5,758 | – | ||||||||||||
| Media | 27,284 | 25,198 | 2,086 | – | ||||||||||||
| Pharmaceuticals, Biotechnology & Life Sciences | 24,120 | 20,653 | 3,467 | – | ||||||||||||
| Retailing | 24,431 | 20,854 | 3,577 | – | ||||||||||||
| Semiconductors & Semiconductor Equipment | 18,895 | 9,020 | 9,875 | – | ||||||||||||
| Software & Services | 72,124 | 66,967 | 5,157 | – | ||||||||||||
| Technology Hardware & Equipment | 47,658 | 36,268 | 11,390 | – | ||||||||||||
| Telecommunication Services | 6,009 | 3,786 | 2,223 | – | ||||||||||||
| Transportation | 7,010 | 4,902 | 2,108 | – | ||||||||||||
| Utilities | 2,156 | 2,156 | – | – | ||||||||||||
| Total | 424,825 | 295,909 | 128,916 | – | ||||||||||||
| Short-Term Investments | 22,845 | – | 22,845 | – | ||||||||||||
| Total | $ | 447,670 | $ | 295,909 | $ | 151,761 | $ | – | ||||||||
| Foreign Currency Contracts* | 211 | – | 211 | – | ||||||||||||
| Total | $ | 211 | $ | – | $ | 211 | $ | – | ||||||||
| Liabilities: | ||||||||||||||||
| Foreign Currency Contracts* | 230 | – | 230 | – | ||||||||||||
| Total | $ | 230 | $ | – | $ | 230 | $ | – | ||||||||
| ♦ | For the six-month period ended June 30, 2012, there were no transfers between Level 1 and Level 2. |
| * | Derivative instruments not reflected in the Schedule of Investments are valued at the unrealized appreciation/depreciation on the investments. |
The accompanying notes are an integral part of these financial statements.
| 9 |
| Hartford Global Growth HLS Fund |
| Statement of Assets and Liabilities |
| June 30, 2012 (Unaudited) |
| (000’s Omitted) |
| Assets: | ||||
| Investments in securities, at market value (cost $402,343) | $ | 447,670 | ||
| Cash | — | |||
| Foreign currency on deposit with custodian (cost $—) | — | |||
| Unrealized appreciation on foreign currency contracts | 211 | |||
| Receivables: | ||||
| Investment securities sold | 153,047 | |||
| Fund shares sold | 120 | |||
| Dividends and interest | 499 | |||
| Total assets | 601,547 | |||
| Liabilities: | ||||
| Unrealized depreciation on foreign currency contracts | 230 | |||
| Payables: | ||||
| Investment securities purchased | 167,952 | |||
| Fund shares redeemed | 640 | |||
| Investment management fees | 44 | |||
| Distribution fees | 2 | |||
| Accrued expenses | 64 | |||
| Total liabilities | 168,932 | |||
| Net assets | $ | 432,615 | ||
| Summary of Net Assets: | ||||
| Capital stock and paid-in-capital | $ | 538,146 | ||
| Undistributed net investment income | 4,390 | |||
| Accumulated net realized loss | (155,155 | ) | ||
| Unrealized appreciation of investments and the translations of assets and liabilities denominated in foreign currency | 45,234 | |||
| Net assets | $ | 432,615 | ||
| Shares authorized | 3,400,000 | |||
| Par value | $ | 0.001 | ||
| Class IA: Net asset value per share | $ | 14.75 | ||
| Shares outstanding | 23,987 | |||
| Net assets | $ | 353,731 | ||
| Class IB: Net asset value per share | $ | 14.61 | ||
| Shares outstanding | 5,399 | |||
| Net assets | $ | 78,884 |
The accompanying notes are an integral part of these financial statements.
| 10 |
| Hartford Global Growth HLS Fund |
| Statement of Operations |
| For the Six-Month Period Ended June 30, 2012 (Unaudited) |
| (000’s Omitted) |
| Investment Income: | ||||
| Dividends | $ | 4,433 | ||
| Interest | 9 | |||
| Less: Foreign tax withheld | (322 | ) | ||
| Total investment income, net | 4,120 | |||
| Expenses: | ||||
| Investment management fees | 1,759 | |||
| Transfer agent fees | 1 | |||
| Distribution fees - Class IB | 109 | |||
| Custodian fees | 13 | |||
| Accounting services fees | 33 | |||
| Board of Directors' fees | 6 | |||
| Audit fees | 7 | |||
| Other expenses | 82 | |||
| Total expenses (before fees paid indirectly) | 2,010 | |||
| Commission recapture | (6 | ) | ||
| Total fees paid indirectly | (6 | ) | ||
| Total expenses, net | 2,004 | |||
| Net investment income | 2,116 | |||
| Net Realized Gain on Investments and Foreign Currency Transactions: | ||||
| Net realized gain on investments | 22,741 | |||
| Net realized loss on foreign currency contracts | (34 | ) | ||
| Net realized gain on other foreign currency transactions | 13 | |||
| Net Realized Gain on Investments and Foreign Currency Transactions | 22,720 | |||
| Net Changes in Unrealized Appreciation of Investments and Foreign Currency Transactions: | ||||
| Net unrealized appreciation of investments | 18,888 | |||
| Net unrealized depreciation of foreign currency contracts | (19 | ) | ||
| Net unrealized depreciation on translation of other assets and liabilities in foreign currencies | (83 | ) | ||
| Net Changes in Unrealized Appreciation of Investments and Foreign Currency Transactions | 18,786 | |||
| Net Gain on Investments and Foreign Currency Transactions | 41,506 | |||
| Net Increase in Net Assets Resulting from Operations | $ | 43,622 |
The accompanying notes are an integral part of these financial statements.
| 11 |
| Hartford Global Growth HLS Fund |
| Statement of Changes in Net Assets |
| (000’s Omitted) |
| For the Six-Month Period Ended June 30, 2012 (Unaudited) | For the Year Ended December 31, 2011 | |||||||
| Operations: | ||||||||
| Net investment income | $ | 2,116 | $ | 2,236 | ||||
| Net realized gain on investments and foreign currency transactions | 22,720 | 52,217 | ||||||
| Net unrealized appreciation (depreciation) of investments and foreign currency transactions | 18,786 | (126,300 | ) | |||||
| Net Increase (Decrease) In Net Assets Resulting From Operations | 43,622 | (71,847 | ) | |||||
| Distributions to Shareholders: | ||||||||
| From net investment income | ||||||||
| Class IA | — | (149 | ) | |||||
| Total distributions | — | (149 | ) | |||||
| Capital Share Transactions: | ||||||||
| Class IA | ||||||||
| Sold | 11,915 | 25,684 | ||||||
| Issued on reinvestment of distributions | — | 149 | ||||||
| Redeemed | (46,434 | ) | (99,236 | ) | ||||
| Total capital share transactions | (34,519 | ) | (73,403 | ) | ||||
| Class IB | ||||||||
| Sold | 4,883 | 12,370 | ||||||
| Redeemed | (16,522 | ) | (35,398 | ) | ||||
| Total capital share transactions | (11,639 | ) | (23,028 | ) | ||||
| Net decrease from capital share transactions | (46,158 | ) | (96,431 | ) | ||||
| Net Decrease In Net Assets | (2,536 | ) | (168,427 | ) | ||||
| Net Assets: | ||||||||
| Beginning of period | 435,151 | 603,578 | ||||||
| End of period | $ | 432,615 | $ | 435,151 | ||||
| Undistributed (distribution in excess of) net investment income | $ | 4,390 | $ | 2,274 | ||||
| Shares: | ||||||||
| Class IA | ||||||||
| Sold | 798 | 1,683 | ||||||
| Issued on reinvestment of distributions | — | 11 | ||||||
| Redeemed | (3,058 | ) | (6,477 | ) | ||||
| Total share activity | (2,260 | ) | (4,783 | ) | ||||
| Class IB | ||||||||
| Sold | 330 | 819 | ||||||
| Redeemed | (1,093 | ) | (2,308 | ) | ||||
| Total share activity | (763 | ) | (1,489 | ) | ||||
The accompanying notes are an integral part of these financial statements.
| 12 |
| Hartford Global Growth HLS Fund |
| Notes to Financial Statements |
| June 30, 2012 (Unaudited) |
| (000’s Omitted) |
| 1. | Organization: |
Hartford Global Growth HLS Fund (the “Fund”) serves as an underlying investment option for certain variable annuity and variable life insurance separate accounts of Hartford Life Insurance Company (“HLIC”) and its affiliates and certain qualified retirement plans. The Fund may also serve as an underlying investment option for certain variable annuity and variable life separate accounts of other insurance companies. Owners of variable annuity contracts and policyholders of variable life insurance contracts may choose the funds permitted in the variable insurance contract prospectus. In addition, participants in certain qualified retirement plans may choose the Fund if permitted by their plans.
Hartford Series Fund, Inc. (the “Company”) is an open-end registered management investment company comprised of thirty portfolios. Financial Statements for the Fund, a series of the Company, are included in this report.
The Company is organized under the laws of the State of Maryland and is registered with the Securities and Exchange Commission (“SEC”) under the Investment Company Act of 1940, as amended (“1940 Act”). The Fund is a diversified open-end management investment company.
The Fund is divided into Class IA and Class IB shares. Each class is offered at the per share net asset value (“NAV”) without a sales charge and is subject to the same expenses, except that the Class IB shares are subject to distribution and service fees charged pursuant to a Distribution Plan adopted in accordance with Rule 12b-1 under the 1940 Act.
| 2. | Significant Accounting Policies: |
The following is a summary of significant accounting policies of the Fund in the preparation of its financial statements, which are in accordance with the United States Generally Accepted Accounting Principles (“U.S. GAAP”). The preparation of financial statements in accordance with U.S. GAAP may require management to make estimates and assumptions that affect the reported amounts of assets and liabilities and disclosure of contingent assets and liabilities at the date of the financial statements and the reported amounts of increases and decreases in net assets from operations during the reporting period. Actual results could differ from those estimates.
| a) | Determination of Net Asset Value – The NAV of each class of the Fund’s shares is determined as of the close of regular trading (normally 4:00 p.m. Eastern Time) (the “NYSE Close”) on each day that the New York Stock Exchange (the “Exchange”) is open (“Valuation Date”). Information that becomes known to the Fund after the NAV has been calculated on a particular day will not generally be used to retroactively adjust the NAV determined earlier that day. |
| b) | Investment Valuation and Fair Value Measurements – For purposes of calculating the NAV, portfolio investments and other assets held by the Fund's portfolio for which market quotes are readily available are valued at market value. Market value is generally determined on the basis of last reported sales prices or official close price. If no sales are reported, market value is based on quotes obtained from a quotation reporting system, established market makers, or independent pricing services. If market prices are not readily available or are deemed unreliable, the Fund will use the fair value of the investment as determined in good faith under policies and procedures established by and under the supervision of the Company’s Board of Directors. Market quotes are considered not readily available where there is an absence of current or reliable market-based data (e.g., trade information or broker quotes), including where events occur after the close of the relevant market, but prior to the NYSE Close that materially affect the values of the Fund’s portfolio investments or assets. In addition, market quotes are considered not readily available when, due to extraordinary circumstances, the exchanges or markets on which the investments trade do not open for trading for the entire day and no other market prices are available. In addition, prices of foreign equities that are principally traded on certain foreign markets are adjusted daily pursuant to a fair value pricing service approved by the Board of Directors in order to reflect an adjustment for the factors occurring after the close of certain foreign markets but before the NYSE Close. Investments that are primarily traded on foreign markets may trade on days that are not business days of the Fund. The value of the foreign investments in which the Fund invests may change on days when a shareholder will not be able to purchase or |
| 13 |
| Hartford Global Growth HLS Fund |
| Notes to Financial Statements – (continued) |
| June 30, 2012 (Unaudited) |
| (000’s Omitted) |
redeem shares of the Fund. Fair value pricing is subjective in nature and the use of fair value pricing by the Fund may cause the NAV of its shares to differ significantly from the NAV that would have been calculated using market prices at the close of the exchange on which a portfolio investment is primarily traded. There can be no assurance that the Fund could obtain the fair market value assigned to an investment if the Fund were to sell the investment at approximately the time at which the Fund determines its NAV.
Investments valued in currencies other than U.S. dollars are converted to U.S. dollars using exchange rates obtained from independent pricing services for calculation of the NAV. As a result, the NAV of the Fund’s shares may be affected by changes in the value of currencies in relation to the U.S. dollar. The value of investments traded in markets outside the United States or denominated in currencies other than the U.S. dollar may be affected significantly on a day that the NYSE is closed and the market value may change on days when an investor is not able to purchase, redeem or exchange shares of the Fund.
Foreign currency contracts represent agreements to exchange currencies on specific future dates at predetermined rates. Foreign currency contracts are valued using foreign currency exchange rates and forward rates as provided by an independent pricing service on the Valuation Date.
Financial instruments for which prices are not available from an independent pricing service may be valued using market quotations obtained from one or more dealers that make markets in the respective financial instrument in accordance with procedures established by the Company’s Board of Directors.
U.S. GAAP defines fair value as the price that the Fund would receive to sell an asset or pay to transfer a liability in an orderly transaction between market participants. The U.S. GAAP fair value measurement standards require disclosure of a fair value hierarchy for each major category of assets and liabilities. Various inputs are used in determining the fair value of the Fund’s investments. These inputs are summarized into three broad hierarchy levels. This hierarchy is based on whether the valuation inputs are observable or unobservable. These levels are:
| · | Level 1 – Quoted prices in active markets for identical investments. Level 1 may include exchange traded instruments, such as domestic equities, some foreign equities, options, futures, mutual funds, exchange traded funds, rights and warrants. |
| · | Level 2 – Observable inputs other than Level 1 prices, such as quoted prices for similar investments; quoted prices in markets that are not active; or other inputs that are observable or can be corroborated by observable market data. Level 2 may include debt investments that are traded less frequently than exchange traded instruments and which are valued using independent pricing services; foreign equities, which are principally traded on certain foreign markets and are adjusted daily pursuant to a fair value pricing service in order to reflect an adjustment for the factors occurring after the close of certain foreign markets but before the NYSE Close; and short-term investments, which are valued at amortized cost. |
| · | Level 3 – Significant unobservable inputs that are supported by limited or no market activity. Level 3 may include financial instruments whose values are determined using indicative market quotes or require significant management judgment or estimation. These unobservable valuation inputs may include estimates for current yields, maturity/duration, prepayment speed, and indicative market quotes for comparable investments along with other assumptions relating to credit quality, collateral value, complexity of the investment structure, general market conditions and liquidity. This category may include investments where trading has been halted or there are certain restrictions on trading. While these investments are priced using unobservable inputs, the valuation of these investments reflects the best available data and management believes the prices are a reasonable representation of exit price. |
The Board of Directors of the Company generally reviews and approves the “Procedures for Valuation of Portfolio Securities” on an annual basis. These procedures define how investments are to be valued, including the formation of a Valuation Committee. The Valuation Committee is responsible for determining in good faith
| 14 |
the fair value of investments when the value cannot be obtained from primary pricing services or alternative sources or if the valuation of an investment as provided by the primary pricing service or alternative source is believed not to reflect the investment’s fair value as of the Valuation Date. Members of the Valuation Committee include the Fund’s Treasurer or designee, a Vice President of the Funds with legal expertise or designee, and a Vice President of the investment manager or designee. In addition, the Fund’s chief compliance officer shall designate a member of the compliance group to attend Valuation Committee meetings as a non-voting resource, to monitor for and provide guidance with respect to compliance with these procedures. Two members of the Valuation Committee or their designees, representing different departments, shall constitute a quorum for purposes of permitting the Valuation Committee to take action. The Valuation Committee will consider all relevant factors in determining an investment’s fair value, and may seek the advice of the Fund’s sub-adviser, knowledgeable brokers and legal counsel in making such determination. The Valuation Committee reports to the Audit Committee of the Company’s Board of Directors. The Audit Committee receives quarterly written reports which include details of all fair-valued investments, including the reason for the fair valuation, and an indication, when possible, of the accuracy of the valuation by disclosing the next available reliable public price quotation or the disposition price of such investments (the “look-back” test). The Board of Directors then must consider for ratification all of the fair value determinations made during the previous quarter.
Valuation levels are not necessarily indicative of the risk associated with investing in such investments. Individual investments within any of the above mentioned asset classes may be assigned a different hierarchical level than those presented above, as individual circumstances dictate.
For additional information, refer to the Investment Valuation Hierarchy Level Summary.
For purposes of reporting transfers between different hierarchy levels, both transfers in and out of each level, as applicable, are shown as if they occurred at the beginning of the period.
| c) | Investment Transactions and Investment Income – Investment transactions are recorded as of the trade date (the date the order to buy or sell is executed) for financial reporting purposes. Investments purchased or sold on a when-issued or delayed-delivery basis may be settled a month or more after the trade date. Realized gains and losses are determined on the basis of identified cost. |
Dividend income is accrued as of the ex-dividend date, except certain dividends from foreign investments where the ex-dividend date may have passed are recorded as soon as the Fund is informed of the dividend. Interest income, including amortization of premium and accretion of discounts, is accrued on a daily basis.
| d) | Foreign Currency Transactions – Assets and liabilities denominated in currencies other than U.S. dollars are translated into U.S. dollars at the exchange rates in effect on the valuation date. Purchases and sales of investments, income, and expenses are translated into U.S. dollars at the exchange rates on the dates of such transactions. |
The Fund does not isolate that portion of portfolio investment valuation resulting from fluctuations in the foreign currency exchange rates from the fluctuations arising from changes in the market prices of investments held. Exchange rate fluctuations are included with the net realized and unrealized gain or loss on investments in the accompanying financial statements.
Net realized foreign exchange gains or losses arise from sales of foreign currencies and the difference between asset and liability amounts initially stated in foreign currencies and the U.S. dollar value of the amounts actually received or paid. Net unrealized foreign exchange gains or losses arise from changes in the value of other assets and liabilities at the end of the reporting period, resulting from changes in the exchange rates.
| 15 |
| Hartford Global Growth HLS Fund |
| Notes to Financial Statements – (continued) |
| June 30, 2012 (Unaudited) |
| (000’s Omitted) |
| e) | Joint Trading Account – The Fund may invest cash balances into a joint trading account that may be invested in one or more repurchase agreements. |
| f) | Fund Share Valuation and Dividend Distributions to Shareholders – Orders for the Fund’s shares are executed in accordance with the investment instructions of the contract holders and plan participants. The NAV of the Fund’s shares is determined as of the close of business on each business day of the Exchange. The NAV is determined separately for each class of shares of the Fund by dividing the Fund’s net assets attributable to that class by the number of shares of the class outstanding. Each class of shares offered by the Fund has equal rights as to assets and voting privileges (except that shareholders of a class have exclusive voting rights regarding any matter relating solely to that class of shares). Income and non-class specific expenses are allocated daily to each class on the basis of the relative net assets of the class. Realized and unrealized capital gains and losses are allocated daily based on the relative net assets of each class of shares of the Fund. |
Orders for the purchase of the Fund’s shares received prior to the close of the Exchange on any day the Exchange is open for business are priced at the NAV determined as of the close of the Exchange. Orders received after the close of the Exchange, or on a day on which the Exchange and/or the Fund is not open for business, are priced at the next determined NAV.
Dividends are declared pursuant to a policy adopted by the Company’s Board of Directors based upon the investment performance of the Fund. The policy of the Fund is to pay dividends from net investment income and realized capital gains, if any, at least once a year.
Distributions from net investment income, net realized capital gains and capital are determined in accordance with federal income tax regulations, which may differ from U.S. GAAP with respect to character and timing. These differences may include but are not limited to losses deferred due to wash sale adjustments, foreign currency gains and losses, adjustments related to Passive Foreign Investment Companies (“PFICs”), Real Estate Investment Trusts (“REITs”), Regulated Investment Companies (“RICs”), certain derivatives and partnerships. Permanent book and federal income tax basis differences relating to shareholder distributions will result in reclassifications to certain of the Fund’s capital accounts (see Federal Income Taxes: Reclassification of Capital Accounts note).
| 3. | Securities and Other Investments: |
| a) | Repurchase Agreements – A repurchase agreement is an agreement by which a counterparty agrees to sell an investment and agrees to repurchase the investment sold at a mutually agreed upon time and price. At the time the Fund enters into a repurchase agreement, the value of the underlying collateral, including accrued interest, will be equal to or exceed the value of the repurchase agreement. Repurchase agreements expose the Fund to counterparty risk. To minimize counterparty risk, the investments that serve to collateralize the repurchase agreement are held by the Fund’s custodian in book entry or physical form in the custodial account of the Fund or in a third party custodial account. Repurchase agreements are valued at cost plus accrued interest. The Fund, as shown on the Schedule of Investments, had outstanding repurchase agreements as of June 30, 2012. |
| b) | Illiquid and Restricted Investments – The Fund is permitted to invest up to 15% of its net assets in illiquid investments. Illiquid investments are those that may not be sold or disposed of in the ordinary course of business within seven days, at approximately the price used to determine the Fund’s NAV. The Fund may not be able to sell illiquid investments when its sub-adviser considers it desirable to do so or may have to sell such investments at a price that is lower than the price that could be obtained if the investments were more liquid. A sale of illiquid investments may require more time and may result in higher dealer discounts and other selling expenses than does the sale of those that are liquid. Illiquid investments also may be more difficult to value due to the unavailability of reliable market quotations for such investments, and an investment in them may have an adverse impact on the Fund’s NAV. The Fund may also purchase certain restricted investments that can only be resold to certain qualified investors and may be determined to be liquid |
| 16 |
pursuant to policies and guidelines established by the Company’s Board of Directors. The Fund, as shown on the Schedule of Investments, had illiquid and/or restricted investments as of June 30, 2012.
| c) | Investments Purchased on a When-Issued or Delayed-Delivery Basis – Delivery and payment for investments that have been purchased by the Fund on a forward commitment, or when-issued or delayed-delivery basis, take place beyond the customary settlement period. A fund may dispose of or renegotiate a delayed-delivery transaction after it is entered into, and may sell delayed-delivery investments before they are delivered, which may result in a realized gain or loss. During this period, such investments are subject to market fluctuations, and the Fund identifies investments segregated in its records with a value at least equal to the amount of the commitment. As of June 30, 2012, the Fund had no outstanding when-issued or delayed delivery investments. |
| 4. | Financial Derivative Instruments: |
The following disclosures contain information on how and why the Fund uses derivative instruments, the credit-risk-related contingent features in certain derivative instruments, and how derivative instruments affect the Fund’s financial position and results of operations. The location and fair value amounts of these instruments on the Statement of Assets and Liabilities and the realized gains and losses and changes in unrealized gains and losses on the Statement of Operations, each categorized by type of derivative contract, are included in the following Additional Derivative Instrument Information footnote. The derivative instruments outstanding as of period-end are disclosed in the notes to the Schedule of Investments and the amounts of realized gains and losses and changes in unrealized gains and losses on derivative instruments during the period are disclosed in the Statement of Operations.
| a) | Foreign Currency Contracts – The Fund may enter into foreign currency contracts that obligate the Fund to purchase or sell currencies at specified future dates. Foreign currency contracts are used to hedge the currency exposure associated with some or all of the Fund’s investments and/or as part of an investment strategy. Foreign currency contracts are marked to market daily and the change in value is recorded by the Fund as an unrealized gain or loss. The Fund will record a realized gain or loss when the foreign currency contract is settled. |
Foreign currency contracts involve elements of market risk in excess of the amounts reflected in the Statement of Assets and Liabilities. In addition, risks may arise upon entering into these contracts from the potential inability of the counterparties to meet the terms of the contracts and from unanticipated movements in the value of the foreign currencies relative to the U.S. dollar. The Fund had outstanding foreign currency contracts as shown on the Schedule of Investments as of June 30, 2012.
| b) | Additional Derivative Instrument Information: |
Fair Values of Derivative Instruments on the Statement of Assets and Liabilities as of June 30, 2012:
| Risk Exposure Category | ||||||||||||||||||||||||||||
| Interest Rate Contracts | Foreign Exchange Contracts | Credit Contracts | Equity Contracts | Commodity Contracts | Other Contracts | Total | ||||||||||||||||||||||
| Assets: | ||||||||||||||||||||||||||||
| Unrealized appreciation on foreign currency contracts | $ | — | $ | 211 | $ | — | $ | — | $ | — | $ | — | $ | 211 | ||||||||||||||
| Total | $ | — | $ | 211 | $ | — | $ | — | $ | — | $ | — | $ | 211 | ||||||||||||||
| Liabilities: | ||||||||||||||||||||||||||||
| Unrealized depreciation on foreign currency contracts | $ | — | $ | 230 | $ | — | $ | — | $ | — | $ | — | $ | 230 | ||||||||||||||
| Total | $ | — | $ | 230 | $ | — | $ | — | $ | — | $ | — | $ | 230 | ||||||||||||||
| 17 |
| Hartford Global Growth HLS Fund |
| Notes to Financial Statements – (continued) |
| June 30, 2012 (Unaudited) |
| (000’s Omitted) |
The ratio of foreign currency contracts to nets assets at June 30, 2012, was 8.37% compared to the six-month period ended June 30, 2012, average to net assets of 1.57%.
The effect of Derivative Instruments on the Statement of Operations for the six-month period ended June 30, 2012:
| Risk Exposure Category | ||||||||||||||||||||||||||||
| Interest Rate Contracts | Foreign Exchange Contracts | Credit Contracts | Equity Contracts | Commodity Contracts | Other Contracts | Total | ||||||||||||||||||||||
| Realized Gain (Loss) on Derivatives Recognized as a Result of Operations: | ||||||||||||||||||||||||||||
| Net realized loss on foreign currency contracts | $ | — | $ | (34 | ) | $ | — | $ | — | $ | — | $ | — | $ | (34 | ) | ||||||||||||
| Total | $ | — | $ | (34 | ) | $ | — | $ | — | $ | — | $ | — | $ | (34 | ) | ||||||||||||
| Net Change in Unrealized Appreciation (Depreciation) on Derivatives Recognized as a Result of Operations: | ||||||||||||||||||||||||||||
| Net change in unrealized depreciation of foreign currency contracts | $ | — | $ | (19 | ) | $ | — | $ | — | $ | — | $ | — | $ | (19 | ) | ||||||||||||
| Total | $ | — | $ | (19 | ) | $ | — | $ | — | $ | — | $ | — | $ | (19 | ) | ||||||||||||
| 5. | Principal Risks: |
| a) | Counterparty Risk – The Fund may be exposed to counterparty risk, or the risk that an institution or other entity with which the Fund has unsettled or open transactions will default. |
| b) | Market Risks – If the Fund invests directly in foreign currencies or in securities that trade in, and receive revenues in, foreign currencies, or in derivatives that provide exposure to foreign currencies, it will be subject to the risk that those currencies will decline in value relative to the base currency of the Fund, or, in the case of hedging positions, that the Fund’s base currency will decline in value relative to the currency being hedged. Currency rates in foreign countries may fluctuate significantly over short periods of time for a number of reasons, including changes in interest rates, intervention (or the failure to intervene) by U.S. or foreign governments, central banks or supranational entities, such as the International Monetary Fund, or by the imposition of currency controls or other political developments in the United States or abroad. As a result, the Fund’s investments in foreign currency denominated securities may reduce the returns of the Fund. The market values of equity securities, such as common stocks and preferred stocks, or equity related investments, such as futures and options, may decline due to general market conditions which are not specifically related to a particular company, such as real or perceived adverse economic conditions, changes in the general outlook for corporate earnings, changes in interest or currency rates or adverse investor sentiment generally. The market value of equity securities may also decline due to factors which affect a particular industry or industries, such as labor shortages or increased production costs and competitive conditions within an industry. Equity securities and equity related investments generally have greater market price volatility than fixed income securities. |
| 6. | Federal Income Taxes: |
| a) | Federal Income Taxes – For federal income tax purposes, the Fund intends to continue to qualify as a RIC under Subchapter M of the Internal Revenue Code (“IRC”) by distributing substantially all of its taxable net investment income and net realized capital gains to its shareholders and otherwise complying with the requirements of RICs. The Fund has distributed substantially all of its income and capital gains in prior years, if applicable, and intends to distribute substantially all of its income and capital gains prior to the next fiscal year-end. Accordingly, no provision for federal income or excise taxes has been made in the accompanying financial statements. Distributions from short-term capital gains are treated as ordinary income distributions for federal income tax purposes. |
| b) | Net Investment Income (Loss), Net Realized Gains (Losses) – Net investment income (loss) and net realized gains (losses) may differ for financial statement and tax purposes primarily because of losses deferred due to wash sale |
| 18 |
adjustments, foreign currency gains and losses, adjustments related to PFICs, REITs, RICs, certain derivatives and partnerships. The character of distributions made during the year from net investment income or net realized gains may differ from their ultimate characterization for federal income tax purposes. Also, due to the timing of dividend distributions, the fiscal year in which amounts are distributed may differ from the year that the income or realized gains (losses) were recorded by the Fund.
| c) | Distributions and Components of Distributable Earnings – The tax character of distributions paid by the Fund for the periods indicated is as follows (as adjusted for dividends payable): |
| For the Year Ended December 31, 2011 | For the Year Ended December 31, 2010 | |||||||
| Ordinary Income | $ | 149 | $ | 1,250 | ||||
As of December 31, 2011, the Fund’s components of distributable earnings (deficit) on a tax basis were as follows:
| Amount | ||||
| Undistributed Ordinary Income | $ | 2,274 | ||
| Accumulated Capital and Other Losses* | (177,006 | ) | ||
| Unrealized Appreciation† | 25,579 | |||
| Total Accumulated Deficit | $ | (149,153 | ) | |
| * | The Fund has capital loss carryforwards that are identified in the Capital Loss Carryforward note that follows. |
| † | The difference between book-basis and tax-basis unrealized appreciation (depreciation) may be attributable to the losses deferred due to wash sale adjustments, foreign currency gains and losses, adjustments related to PFICs, REITs, RICs, certain derivatives and partnerships. |
| d) | Reclassification of Capital Accounts – The Fund may record reclassifications in its capital accounts. These reclassifications have no impact on the total net assets of the Fund. The reclassifications are a result of permanent differences between U.S. GAAP and tax accounting for such items as foreign currency, PFICs, expiration or utilization of capital loss carryforwards or net operating losses. Adjustments are made to reflect the impact these items have on current and future distributions to shareholders. Therefore, the source of the Fund’s distributions may be shown in the accompanying Statement of Changes in Net Assets as from undistributed net investment income, from accumulated net realized gains on investments or from capital depending on the type of book and tax differences that exist. For the year ended December 31, 2011, the Fund recorded reclassifications to increase (decrease) the accounts listed below: |
| Amount | ||||
| Undistributed Net Investment Income | $ | (60 | ) | |
| Accumulated Net Realized Gain (Loss) | 60 | |||
| e) | Capital Loss Carryforward – On December 22, 2010, the Regulated Investment Company Modernization Act of 2010 (the “Act”) was enacted, which made changes to the capital loss carryforward rules. The changes are effective for taxable years beginning after the date of enactment. Under the Act, funds are permitted to carry forward capital losses for an unlimited period. However, any losses incurred during those future taxable years will be required to be utilized prior to the losses incurred in pre-enactment taxable years, which carry an expiration date. As a result of this ordering rule, pre-enactment capital loss carryforwards may be more likely to expire unused. Additionally, post-enactment capital loss carryforwards retain their character as either short-term or long-term capital losses rather than being considered all short-term as permitted under prior regulation. |
| 19 |
| Hartford Global Growth HLS Fund |
| Notes to Financial Statements – (continued) |
| June 30, 2012 (Unaudited) |
| (000’s Omitted) |
At December 31, 2011 (tax-year-end), the Fund had capital loss carryforwards for U.S. federal income tax purposes as follows:
| Year of Expiration | Amount | |||
| 2016 | $ | 14,541 | ||
| 2017 | 162,465 | |||
| Total | $ | 177,006 | ||
During the year ended December 31, 2011, the Fund utilized $52,908 of prior year capital loss carryforwards.
| f) | Accounting for Uncertainty in Income Taxes – The Fund has adopted financial reporting rules that require the Fund to analyze all open tax years, as defined by the statute of limitations, for all major jurisdictions. Generally, tax authorities can examine all tax returns filed for the last three years. The Fund does not have an examination in progress. |
The Fund has reviewed all open tax years and major jurisdictions and concluded that these financial reporting rules had no effect on the Fund’s financial position or results of operations. There is no tax liability resulting from unrecognized tax benefits relating to uncertain income tax positions taken or expected to be taken on the tax return for the fiscal year ended December 31, 2011. The Fund is also not aware of any tax positions for which it is reasonably possible that the total amounts of unrecognized tax benefits will significantly change in the next twelve months.
| 7. | Expenses: |
| a) | Investment Management Agreement – HL Investment Advisors, LLC (“HL Advisors”), an indirect wholly owned subsidiary of The Hartford Financial Services Group, Inc. (“The Hartford”), serves as investment manager to the Fund pursuant to an Investment Management Agreement with the Company. As investment manager, HL Advisors has overall investment supervisory responsibility for the Fund. In addition, HL Advisors provides administrative personnel, services, equipment, facilities and office space for proper operation of the Fund. HL Advisors has contracted with Wellington Management Company, LLP (“Wellington Management”) under a sub-advisory agreement for the provision of day-to-day investment management services to the Fund in accordance with the Fund’s investment objective and policies. The Fund pays a fee to HL Advisors, a portion of which may be used to compensate Wellington Management. |
The schedule below reflects the rates of compensation paid to HL Advisors for investment management services rendered as of June 30, 2012; the rates are accrued daily and paid monthly.
| Average Daily Net Assets | Annual Fee | |||
| On first $250 million | 0.7750 | % | ||
| On next $250 million | 0.7250 | % | ||
| On next $500 million | 0.6750 | % | ||
| On next $4 billion | 0.6250 | % | ||
| On next $5 billion | 0.6225 | % | ||
| Over $10 billion | 0.6200 | % | ||
| 20 |
| b) | Accounting Services Agreement – Pursuant to the Fund Accounting Agreement between HLIC and the Company, on behalf of the Fund, HLIC provides accounting services to the Fund and receives monthly compensation based on the Fund’s average daily net assets at the rates set forth below. The Fund’s accounting services fees are accrued daily and paid monthly. |
| Average Daily Net Assets | Annual Fee | |||
| On first $5 billion | 0.014 | % | ||
| On next $5 billion | 0.012 | % | ||
| Over $10 billion | 0.010 | % | ||
| c) | Operating Expenses – Allocable expenses incurred by the Company are allocated to each Fund and allocated to classes within a Fund in proportion to the average daily net assets of the Fund and each class, except where allocation of certain expenses is more fairly made directly to the Fund or to specific classes within a Fund. |
| d) | Fees Paid Indirectly – The Company, on behalf of the Fund, has entered into agreements with State Street Global Markets, LLC and Russell Implementation Services, Inc. to partially recapture non-discounted trade commissions. Such rebates are used to pay a portion of the Fund’s expenses. In addition, the Fund’s custodian bank has also agreed to reduce its fees when the Fund maintains cash on deposit in a non-interest-bearing custody account. For the six-month period ended June 30, 2012, these amounts, if any, are included in the Statement of Operations. |
The ratio of expenses to average net assets in the accompanying financial highlights excludes the reduction in expenses related to fees paid indirectly. The annualized expense ratio for the period listed below reflecting the reduction for fees paid indirectly is as follows:
| Annualized Six- Month Period Ended June 30, 2012 | ||||
| Class IA | 0.81 | % | ||
| Class IB | 1.06 | % | ||
| e) | Distribution Plan for Class IB shares – The Company, on behalf of the Fund, has adopted a Distribution Plan pursuant to Rule 12b-1 of the 1940 Act to compensate the Distributor, Hartford Securities Distribution Company, Inc. (a wholly owned, ultimate subsidiary of The Hartford), from assets attributable to the Class IB shares for services rendered and expenses borne in connection with activities primarily intended to result in the sale of the Class IB shares, subject to the review and approval of the Company’s Board of Directors. |
The Distribution Plan provides that the Fund may pay annually up to 0.25% of the average daily net assets of the Fund attributable to its Class IB shares for activities primarily intended to result in the sale of Class IB shares. The Board has the authority to suspend or reduce these payments at any point in time. Under the terms of the Distribution Plan and the principal underwriting agreement, the Fund is authorized to make payments monthly to the Distributor that may be used to pay or compensate entities providing distribution and shareholder servicing with respect to the Class IB shares for such entities’ fees or expenses incurred or paid in that regard. These fees are accrued daily and paid monthly.
| f) | Other Related Party Transactions – Certain officers of the Fund are directors and/or officers of HL Advisors and/or The Hartford or its subsidiaries. For the six-month period ended June 30, 2012, a portion of the Fund’s chief compliance officer’s salary was paid by all the investment companies in the Hartford fund complex. The portion allocated to the Fund rounds to zero. Hartford Administrative Services Company (“HASCO”), an indirect wholly owned subsidiary of The Hartford, provides transfer agent services to the Fund. HASCO was compensated on a per account basis for providing such services. The amount paid to HASCO can be found in the Statement of Operations. These fees are accrued daily and paid monthly. |
| 21 |
| Hartford Global Growth HLS Fund |
| Notes to Financial Statements – (continued) |
| June 30, 2012 (Unaudited) |
| (000’s Omitted) |
| g) | Payment from Affiliate – In July of 2007, The Hartford entered into a settlement with the Attorneys General of the states of New York, Connecticut and Illinois relating to market timing and the company's individual variable annuity contracts in which certain payments would be made directly to the variable annuity contract holders. The distribution plan provided that unclaimed money from the settlement would be distributed to certain HLS Funds that are investment options through a Hartford individual variable annuity contract. The unclaimed money was distributed to the Fund on September 18, 2009. |
The total return in the accompanying financial highlights includes a payment from an affiliate. Had the payment from the affiliate been excluded, the impact and total return for the period listed below would have been as follows:
| For the Year Ended December 31, 2009 | ||||||||
| Class IA | Class IB | |||||||
| Impact from Payment from Affiliate for Attorneys General Settlement | 0.04 | % | 0.04 | % | ||||
| Total Return Excluding Payment from Affiliate | 35.59 | % | 35.26 | % | ||||
| 8. | Investment Transactions: |
For the six-month period ended June 30, 2012, the Fund's aggregate purchases and sales of investment securities (excluding short-term investments) were as follows:
| Amount | ||||
| Cost of Purchases Excluding U.S. Government Obligations | $ | 278,424 | ||
| Sales Proceeds Excluding U.S. Government Obligations | 319,537 | |||
| 9. | Line of Credit: |
The Fund is one of several Hartford funds that participate in a $500 million committed revolving line of credit facility. The facility is to be used for temporary or emergency purposes. Under the arrangement, the funds are required to own securities having a market value in excess of 300% of the total bank borrowings. The interest rate on borrowings varies depending on the nature of the loan. The facility also requires a fee to be paid based on the amount of the commitment. This commitment fee is allocated to all of the funds participating in the line of credit based on the average net assets of the funds. During the six-month period ended June 30, 2012, the Fund did not have any borrowings under this facility.
| 10. | Industry Classifications: |
Other than the industry classifications “Other Investment Pools and Funds” and “Exchange Traded Funds,” equity industry classifications used in this report are the Global Industry Classification Standard, which was developed by and is the exclusive property and service mark of MSCI, Inc. and Standard & Poor’s.
| 11. | Indemnifications: |
Under the Company’s organizational documents, the Company shall indemnify its officers and directors to the full extent required or permitted under Maryland General Corporation Law and the federal securities laws. In addition, the Company, on behalf of the Fund, may enter into contracts that contain a variety of indemnifications. The Company’s maximum exposure under these arrangements is unknown. However, as of the date of these financial statements, the Company has not had prior claims or losses pursuant to these contracts and expects the risk of loss to be remote.
| 22 |
[This page is intentionally left blank]
| 23 |
| Hartford Global Growth HLS Fund |
| Financial Highlights |
| - Selected Per-Share Data (A) - |
| Class | Net Asset Value at Beginning of Period | Net Investment Income (Loss) | Payments from (to) Affiliate | Net Realized and Unrealized Gain (Loss) on Investments | Total from Investment Operations | Dividends from Net Investment Income | Distributions from Realized Capital Gains | Distributions from Capital | Total Distributions | Net Increase (Decrease) in Net Asset Value | Net Asset Value at End of Period | |||||||||||||||||||||||||||||||||
| For the Six-Month Period Ended June 30, 2012 (Unaudited) | ||||||||||||||||||||||||||||||||||||||||||||
| IA | $ | 13.45 | $ | 0.08 | $ | – | $ | 1.22 | $ | 1.30 | $ | – | $ | – | $ | – | $ | – | $ | 1.30 | $ | 14.75 | ||||||||||||||||||||||
| IB | 13.34 | 0.06 | – | 1.21 | 1.27 | – | – | – | – | 1.27 | 14.61 | |||||||||||||||||||||||||||||||||
| For the Year Ended December 31, 2011 | ||||||||||||||||||||||||||||||||||||||||||||
| IA | 15.62 | 0.08 | – | (2.24 | ) | (2.16 | ) | (0.01 | ) | – | – | (0.01 | ) | (2.17 | ) | 13.45 | ||||||||||||||||||||||||||||
| IB | 15.53 | 0.04 | – | (2.23 | ) | (2.19 | ) | – | – | – | – | (2.19 | ) | 13.34 | ||||||||||||||||||||||||||||||
| For the Year Ended December 31, 2010 | ||||||||||||||||||||||||||||||||||||||||||||
| IA | 13.71 | 0.04 | – | 1.91 | 1.95 | (0.04 | ) | – | – | (0.04 | ) | 1.91 | 15.62 | |||||||||||||||||||||||||||||||
| IB | 13.64 | – | – | 1.90 | 1.90 | (0.01 | ) | – | – | (0.01 | ) | 1.89 | 15.53 | |||||||||||||||||||||||||||||||
| For the Year Ended December 31, 2009 | ||||||||||||||||||||||||||||||||||||||||||||
| IA | 10.17 | 0.08 | – | 3.55 | 3.63 | (0.09 | ) | – | – | (0.09 | ) | 3.54 | 13.71 | |||||||||||||||||||||||||||||||
| IB | 10.12 | 0.05 | – | 3.53 | 3.58 | (0.06 | ) | – | – | (0.06 | ) | 3.52 | 13.64 | |||||||||||||||||||||||||||||||
| For the Year Ended December 31, 2008 | ||||||||||||||||||||||||||||||||||||||||||||
| IA | 22.42 | 0.12 | – | (11.56 | ) | (11.44 | ) | (0.12 | ) | (0.69 | ) | – | (0.81 | ) | (12.25 | ) | 10.17 | |||||||||||||||||||||||||||
| IB | 22.27 | 0.08 | – | (11.47 | ) | (11.39 | ) | (0.07 | ) | (0.69 | ) | – | (0.76 | ) | (12.15 | ) | 10.12 | |||||||||||||||||||||||||||
| For the Year Ended December 31, 2007 | ||||||||||||||||||||||||||||||||||||||||||||
| IA | 20.09 | 0.03 | – | 4.84 | 4.87 | (0.01 | ) | (2.53 | ) | – | (2.54 | ) | 2.33 | 22.42 | ||||||||||||||||||||||||||||||
| IB | 20.02 | (0.02 | ) | – | 4.81 | 4.79 | (0.01 | ) | (2.53 | ) | – | (2.54 | ) | 2.25 | 22.27 | |||||||||||||||||||||||||||||
| (A) | Information presented relates to a share outstanding throughout the indicated period. |
| (B) | The figures do not include sales charges or other fees which may be applied at the variable life insurance, variable annuity or qualified retirement plan product level. Any such additional sales charges or other fees would lower the Fund's performance. |
| (C) | Ratios do not reflect reductions for fees paid indirectly. Please see Fees Paid Indirectly in the Notes to Financial Statements. |
| (D) | Portfolio turnover rate is calculated on the basis of the Fund as a whole without distinguishing between the classes of shares issued. |
| (E) | Not annualized. |
| (F) | Annualized. |
| (G) | Total return without the inclusion of the Payment from (to) Affiliate can be found in Expenses in the accompanying Notes to Financial Statements. |
| 24 |
| - Ratios and Supplemental Data - |
| Total Return(B) | Net Assets at End of Period | Ratio of Expenses to Average Net Assets Before Waivers(C) | Ratio of Expenses to Average Net Assets After Waivers(C) | Ratio of Net Investment Income (Loss) to Average Net Assets | Portfolio Turnover Rate(D) | |||||||||||||||||
| 9.66 | %(E) | $ | 353,731 | 0.81 | %(F) | 0.81 | %(F) | 0.95 | %(F) | 61 | % | |||||||||||
| 9.53 | (E) | 78,884 | 1.06 | (F) | 1.06 | (F) | 0.70 | (F) | – | |||||||||||||
| (13.89 | ) | 352,947 | 0.80 | 0.80 | 0.46 | 57 | ||||||||||||||||
| (14.10 | ) | 82,204 | 1.05 | 1.05 | 0.22 | – | ||||||||||||||||
| 14.25 | 484,754 | 0.81 | 0.81 | 0.28 | 62 | |||||||||||||||||
| 13.96 | 118,824 | 1.06 | 1.06 | 0.03 | – | |||||||||||||||||
| 35.64 | (G) | 488,720 | 0.81 | 0.81 | 0.67 | 70 | ||||||||||||||||
| 35.31 | (G) | 126,320 | 1.06 | 1.06 | 0.42 | – | ||||||||||||||||
| (52.46 | ) | 419,183 | 0.75 | 0.75 | 0.67 | 76 | ||||||||||||||||
| (52.58 | ) | 112,226 | 1.00 | 1.00 | 0.42 | – | ||||||||||||||||
| 25.05 | 1,028,843 | 0.73 | 0.73 | 0.13 | 75 | |||||||||||||||||
| 24.74 | 299,788 | 0.98 | 0.98 | (0.11 | ) | – | ||||||||||||||||
| 25 |
| Hartford Global Growth HLS Fund |
| Directors and Officers (Unaudited) |
The Board of Directors of the Company appoints officers who are responsible for the day-to-day operations of the Fund and who execute policies formulated by the Directors. Each director serves until his or her death, resignation, or retirement or until the next annual meeting of shareholders is held or until his or her successor is elected and qualifies.
Directors and officers who are employed by or who have a financial interest in The Hartford are considered “interested” persons of the Fund pursuant to the 1940 Act. Each officer and two of the Company’s directors, as noted in the chart below, are “interested” persons of the Fund. Each director serves as a director for The Hartford Mutual Funds, Inc., The Hartford Mutual Funds II, Inc., Hartford Series Fund, Inc., Hartford HLS Series Fund II, Inc., and as a trustee for The Hartford Alternative Strategies Fund, which, as of June 30, 2012, collectively consist of 89 funds. Correspondence may be sent to directors and officers c/o Hartford Mutual Funds, P.O. Box 2999, Hartford, Connecticut 06104-2999, except that correspondence to Mr. Annoni, Mr. Dressen and Ms. Fagely may be sent to 500 Bielenberg Drive, Woodbury, Minnesota 55125.
The table below sets forth, for each director and officer, his or her name, year of birth, current position with the Company and date first elected or appointed to Hartford Series Fund, Inc. (“HSF”), and Hartford HLS Series Fund II, Inc. (“HSF2”), principal occupation, and, for directors, other directorships held. The Fund’s statement of additional information contains further information on the directors and is available free of charge by calling 1-800-862-6668 or writing to Hartford HLS Funds, c/o Individual Annuity Services, P.O. Box 5085, Hartford, CT 06102-5085.
Information on the aggregate remuneration paid to the directors of the Company can be found in the Statement of Operations herein. The Fund pays to The Hartford a portion of the Chief Compliance Officer’s compensation, but does not pay salaries or compensation to any of their other officers or directors who are employed by The Hartford.
Non-Interested Directors
Lynn S. Birdsong (1946) Director since 2003, Co-Chairman of the Investment Committee
Mr. Birdsong is a private investor. Mr. Birdsong currently serves as a Director of the Sovereign High Yield Investment Company (April 2010 to current). Mr. Birdsong currently serves as an Independent Director of Nomura Partners Funds, Inc. (formerly, The Japan Fund) (March 2003 to current). From 1979 to 2002, Mr. Birdsong was a managing director of Zurich Scudder Investments, an investment management firm. During his employment with Scudder, Mr. Birdsong was an Interested Director of The Japan Fund. Since 1981, Mr. Birdsong has been a partner in Birdsong Company, an advertising specialty firm.
Robert M. Gavin, Jr. (1940) Director since 2002 (HSF) and 1986 (HSF2), Chairman of the Board since 2004
Dr. Gavin is an educational consultant. Prior to September 1, 2001, he was President of Cranbrook Education Community and prior to July 1996, he was President of Macalester College, St. Paul, Minnesota.
Duane E. Hill (1945) Director since 2001 (HSF) and 2002 (HSF2), Chairman of the Nominating Committee
Mr. Hill is Partner of TSG Ventures L.P., a private equity investment company. Mr. Hill is a former partner of TSG Capital Group, a private equity investment firm that served as sponsor and lead investor in leveraged buyouts of middle market companies.
Sandra S. Jaffee (1941) Director since 2005
Ms. Jaffee is the founder and Chief Executive Officer of a private company, Homeworks Concierge, LLC, which provides residential property management services in Westchester County, New York (January 2012 to present). Ms. Jaffee served as Chairman (2008 to 2009) and Chief Executive Officer of Fortent (formerly Searchspace Group), a leading provider of compliance/regulatory technology to financial institutions from August 2005 to August 2009. Ms. Jaffe currently serves as a member of the Board of Directors of Broadridge Financial Solutions as well as a Trustee of Muhlenberg College.
William P. Johnston (1944) Director since 2005, Chairman of the Compliance Committee
In June 2006, Mr. Johnston was appointed as Senior Advisor to The Carlyle Group, a global private equity investment firm. In August 2007, Mr. Johnston was elected to the Board of Directors of LifeCare Holdings, Inc. In February 2008, Mr. Johnston was elected to the Board of Directors of HCR-ManorCare, Inc. In May 2006, Mr. Johnston was elected to the Supervisory Board of Fresenius Medical Care AG & Co. KGaA, after its acquisition of Renal Care Group, Inc. in March 2006.
Phillip O. Peterson (1944) Director since 2002 (HSF) and 2000 (HSF2), Chairman of the Audit Committee
Mr. Peterson is a mutual fund industry consultant. He was a partner of KPMG LLP (an accounting firm) until July 1999. Mr. Peterson joined William Blair Funds in February 2007 as a member of the Board of Trustees. Mr. Peterson also joined the Board of Trustees of Symetra Variable Mutual Funds Trust as a trustee in February 2012.
| 26 |
Lemma W. Senbet (1946) Director since 2005
Dr. Senbet is the William E. Mayer Chair Professor of Finance and Director, Center for Financial Policy, at the University of Maryland, Robert H. Smith School of Business. He was chair of the Finance Department from 1998 to 2006. Previously he was a chaired professor of finance at the University of Wisconsin-Madison. Also, he was director of the Fortis Funds from March 2000 to July 2002. Dr. Senbet served the finance profession in various capacities, including as director of the American Finance Association and President of the Western Finance Association. In 2006, Dr. Senbet was inducted Fellow of Financial Management Association International for his career-long distinguished scholarship and professional service.
Interested Directors and Officers
David N. Levenson (1966) Director since 2010(1)
Mr. Levenson currently serves as President of The Hartford’s Wealth Management business. He was appointed to this role in July 2010. Previously, Mr. Levenson served as Executive Vice President of Legacy Holdings for The Hartford from June 2009 to July 2010. From 2006 to 2009, Mr. Levenson was with Hartford Life Insurance K.K. where he served as President and Chief Executive Officer from 2007 to 2009. He served as Managing Director of Hartford Investment Management Company from 2005 to 2006. Additionally, Mr. Levenson serves as Executive Vice President of The Hartford and as President, Director and Chief Executive Officer of Hartford Life Insurance Company (“HLIC”) and Hartford Life, Inc. (“HL Inc.”).
(1) Mr. Levenson served as Interested Director until August 2, 2012.
Lowndes A. Smith (1939) Director since 1996 (HSF) and 2002 (HSF2), Co-Chairman of the Investment Committee
Mr. Smith served as Vice Chairman of The Hartford from February 1997 to January 2002, as President and Chief Executive Officer of HL Inc. from February 1997 to January 2002, and as President and Chief Operating Officer of The Hartford Life Insurance Companies from January 1989 to January 2002. Mr. Smith serves as a Director of White Mountains Insurance Group, Ltd., One Beacon Insurance and Symetra Financial and as Managing Director of Whittington Gray Associates.
Other Officers
James E. Davey (1964) President and Chief Executive Officer since 2010(2)
Mr. Davey serves as Executive Vice President of HLIC. Additionally, Mr. Davey serves as President, Chief Executive Officer and Manager of HIFSCO and President, Chief Executive Officer and Manager of HL Investment Advisors, LLC (“HL Advisors”). Mr. Davey joined The Hartford in 2002.
(2) Mr. Davey became an Interested Director effective August 2, 2012.
Mark A. Annoni (1964) Vice President, Controller and Treasurer since 2012(3)
Mr. Annoni serves as the Assistant Vice President and Director of Investment Finance (February 2004 to present). Mr. Annoni joined The Hartford in April 2001 as part of The Hartford’s acquisition of Fortis Financial Group. Prior to joining The Hartford, Mr. Annoni served as Manager of Mutual Fund Accounting at Fortis Financial Group (July 1997 to April 2001).
(3) Mr. Annoni was named Vice President, Controller and Treasurer on May 8, 2012.
Michael R. Dressen (1963) AML Compliance Officer since 2011
Mr. Dressen currently serves as Assistant Vice President of HLIC. He also serves as Chief Compliance Officer and AML Compliance Officer of Hartford Administrative Services Company (“HASCO”) and as Assistant Secretary and Compliance Officer of HIFSCO. Mr Dressen joined The Hartford in 2005 from State Farm Insurance Companies where he held various positions related to mutual funds, variable products, and property casualty insurance.
Tamara L. Fagely (1958) Vice President, since 2002 (HSF) and 1993 (HSF2)(4)
Ms. Fagely has been a Vice President of HASCO since 1998 and Chief Financial Officer since 2006. Currently Ms. Fagely is a Vice President of HLIC. She served as Assistant Vice President of HLIC from December 2001 through March 2005. In addition, Ms. Fagely is Controller and Chief Financial Officer of HIFSCO.
(4) Ms. Fagely served as Vice President, Controller and Treasurer until May 8, 2012.
Dr. Robert J. Froehlich (1953) Senior Managing Director since 2009(5)
Dr. Froehlich joined The Hartford as Senior Managing Director in September 2009. Prior to joining The Hartford, Dr. Froehlich served as Vice Chairman of Deutsche Asset Management from 1997-2009.
(5) Dr. Froehlich served as Senior Managing Director until March 26, 2012.
| 27 |
| Hartford Global Growth HLS Fund |
| Directors and Officers (Unaudited) – (continued) |
Edward P. Macdonald (1967) Vice President, Secretary and Chief Legal Officer since 2005
Mr. Macdonald serves as Vice President of HLIC and Chief Legal Officer of Mutual Funds and Vice President of HIFSCO. He also serves as Vice President and Secretary of HASCO, and Chief Legal Officer, Secretary and Vice President of HL Advisors. Mr. Macdonald joined The Hartford in 2005.
Vernon J. Meyer (1964) Vice President since 2006
Mr. Meyer serves as Senior Vice President of HLIC. He also serves as Senior Vice President of HIFSCO and HL Advisors. Mr. Meyer joined The Hartford in 2004.
Colleen B. Pernerewski (1969) Vice President and Chief Compliance Officer since 2010
Ms. Pernerewski serves as Vice President and Chief Investment Advisor Compliance Officer of HIFSCO and as Vice President and Chief Compliance Officer of HL Advisors. Ms. Pernerewski serves as Vice President and Chief Compliance Officer of Individual Annuity of HLIC. Ms. Pernerewski joined The Hartford in 2005 from Travelers Life and Annuity where she served as Counsel (2004-2005). Prior to Travelers Life and Annuity, Ms. Pernerewski held the position of Counsel at The Hartford (1998-2004).
Elizabeth L. Schroeder (1966) Vice President since 2010
Ms. Schroeder currently serves as Assistant Vice President of HLIC. Ms. Schroeder joined HLIC in 1991. She is also an Assistant Vice President of HASCO, HIFSCO and HL Advisors.
Martin Swanson (1962) Vice President since 2010
Mr. Swanson is a Vice President of HLIC. Mr. Swanson also serves as Vice President/Marketing for HIFSCO. Prior to joining HLIC in 1998, Mr. Swanson was a Vice President at PaineWebber, Inc.
Jane Wolak (1961) Vice President since 2009
Ms. Wolak currently serves as Senior Vice President of HLIC. Ms. Wolak joined HLIC as Vice President, Retail Product Services in May 2007. She is also Vice President of HASCO. Previously, Ms. Wolak was with Sun Life Financial where she held the position of Vice President, Service Center Operations from 2001-2007.
HOW TO OBTAIN A COPY OF THE FUND’S PROXY VOTING POLICIES AND VOTING RECORDS (UNAUDITED)
A description of the policies and procedures that the Fund uses to determine how to vote proxies relating to portfolio securities and a record of how the Fund voted any proxies for the twelve-month period ended June 30, 2012 are available (1) without charge, upon request, by calling 800-862-6668 and (2) on the SEC’s website at http://www.sec.gov.
QUARTERLY PORTFOLIO HOLDINGS INFORMATION (UNAUDITED)
The Fund files a complete schedule of portfolio holdings with the SEC for the first and third quarters of each fiscal year on Form N-Q. The Fund’s Forms are available (1) without charge, upon request, by calling 800-862-6668 and (2) on the SEC’s website at http://www.sec.gov. The Form N-Q may be reviewed and copied at the SEC’s Public Reference Room in Washington, DC. Information on the operation of the Public Reference Room may be obtained by calling 1-800-SEC-0330.
| 28 |
| Hartford Global Growth HLS Fund |
| Expense Example (Unaudited) |
Your Fund's Expenses
As a shareholder of the Fund, you incur two types of costs: (1) transaction costs and (2) ongoing costs including investment management fees, distribution fees, and other fund expenses. This example is intended to help you understand your ongoing costs (in dollars) of investing in the Fund and to compare these costs with the ongoing costs of investing in other mutual funds. The example is based on an investment of $1,000 invested at the beginning of the period and held for the period of December 31, 2011 through June 30, 2012.
Actual Expenses
The first set of columns of the table below provides information about actual account values and actual expenses. You may use the information in this column, together with the amount you invested, to estimate the expenses that you paid over the period. Simply divide your account value by $1,000 (for example, an $8,600 account value divided by $1,000 = 8.6), then multiply the result by the number in the line under the heading entitled “Expenses Paid During Period” to estimate the expenses you paid on your account during this period.
Hypothetical Example for Comparison Purposes
The second set of columns of the table below provides information about hypothetical account values and hypothetical expenses based on the Fund’s actual expense ratio and an assumed rate of return of 5% per year before expenses, which is not the Fund’s actual return. The hypothetical account values and expenses may not be used to estimate the actual ending account balance or expenses you paid for the period. You may use this information to compare the ongoing costs of investing in the Fund and other funds. To do so, compare this 5% hypothetical example with the 5% hypothetical examples that appear in the shareholder reports of the other funds.
Please note that the expenses shown in the table are meant to highlight your ongoing costs only and do not reflect any transactional costs, such as sales charges (loads) and CDSC. Therefore, the second set of columns of the table is useful in comparing ongoing costs only, and will not help you determine the relative total costs of owning different funds. In addition, if these transactional costs were included, your costs would be higher. Expenses are equal to the Fund's annualized expense ratios multiplied by average account value over the period, multiplied by 182/366 (to reflect the one-half year period).
| Actual return | Hypothetical (5% return before expenses) | |||||||||||||||||||||||||||||||||||
| Beginning Account Value December 31, 2011 | Ending Account Value June 30, 2012 | Expenses paid during the period December 31, 2011 through June 30, 2012 | Beginning Account Value December 31, 2011 | Ending Account Value June 30, 2012 | Expenses paid during the period December 31, 2011 through June 30, 2012 | Annualized expense ratio | Days in the current 1/2 year | Days in the full year | ||||||||||||||||||||||||||||
| Class IA | $ | 1,000.00 | $ | 1,096.61 | $ | 4.22 | $ | 1,000.00 | $ | 1,020.84 | $ | 4.07 | 0.81 | % | 182 | 366 | ||||||||||||||||||||
| Class IB | $ | 1,000.00 | $ | 1,095.25 | $ | 5.52 | $ | 1,000.00 | $ | 1,019.59 | $ | 5.32 | 1.06 | % | 182 | 366 | ||||||||||||||||||||
| 29 |
HARTFORD HLS FUNDS
c/o The Hartford Wealth Management - Global Annuities
P.O. Box 14293
Lexington, KY 40512-4293
Hartford Series Fund, Inc. is underwritten and distributed by Hartford Securities Distribution Company, Inc.
"The Hartford" is The Hartford Financial Services Group, Inc. and its subsidiaries.
Hartford Series Fund, Inc. inception dates range from 1977 to date. Hartford Series Fund, Inc. is not a subsidiary of The Hartford but is underwritten, distributed by and advised by subsidiaries of The Hartford. Investments in Hartford Series Fund, Inc. are not guaranteed by The Hartford or any other entity.
You should carefully consider investment objectives, risks, and charges and expenses of Hartford HLS Funds before investing. This and other information can be found in the Fund’s prospectus or summary prospectus, which can be obtained by calling 800-862-6668. Please read them carefully before you invest or send money.
| HLSSAR-GG12 8-12 111647 Printed in U.S.A ©2012 The Hartford, Hartford, CT 06115 | |

A MESSAGE FROM THE PRESIDENT
Dear Fellow Shareholders:
I want to take this opportunity to say thank you for investing in the Hartford HLS Funds. We’ve seen continued market volatility throughout the first half of 2012, and there will likely be continued uncertainty until the Presidential election in November, but we are still optimistic about the markets in 2012.
Market Review
In the first quarter of 2012, the S&P 500 Index turned in its best quarterly performance since the third quarter of 2009. U.S. equities showed signs of improvement as investors focused on improving economic data and strong corporate earnings news and the Federal Reserve’s pledge to keep interest rates low buoyed investors’ appetites.
The second quarter ended on a high note for the stock market—the S&P 500 had its strongest June in more than a decade and the Dow Jones Industrial Average had its best month since October—but those gains weren’t enough to offset losses from April and May, and equities finished the quarter in the red. Although the S&P 500 was -2.75 for the second quarter, it was up 9.49% for the first half of 2012.
Concerns about domestic and European unemployment are having an effect on our economy. The unemployment rate in the euro zone's 17 nations rose to a record 11.1% in May, the highest level since the euro launched as a common currency more than 10 years ago. In the U.S., the labor market has been fickle this year, with job growth starting off strong in the first couple months of 2012 but slowing down in the spring, which has led many to wonder about the status of the economic recovery.
On a positive note, home prices are rising again after falling for more than five years, new and existing home sales are increasing, and home builders are ramping up construction.
The Hartford HLS Funds Expands Relationship with Wellington Management
We’re very pleased that we are expanding our relationship with Wellington Management, which will now serve as the primary sub-adviser for the Hartford HLS Funds including equity, fixed-income,* and asset-allocation funds. One of America’s oldest and largest investment management firms, Wellington Management has resources that span the entire globe, with multiple offices across the U.S. and numerous offices abroad. Wellington Management’s most distinctive strength is its proprietary research, which is shared across the entire organization.
We believe that aligning more closely with a well-respected money manager like Wellington Management puts us in a strong position to drive significant growth and to continue delivering innovative fund strategies to help our investors meet their financial goals.
Thank you again for investing with the Hartford HLS Funds.
James Davey
President
Hartford HLS Funds
*Several fixed-income funds will continue to be sub-advised by Hartford Investment Management Company.
Hartford Global Research HLS Fund
Table of Contents
This report is prepared for the general information of contract owners and qualified retirement plan participants. It is not an offer of contracts or of qualified retirement plans. It should not be used in connection with any offer, except in conjunction with the appropriate product prospectus which contains all pertinent information including the applicable sales, administrative and other charges.
The views expressed in the Fund’s Manager Discussion under ‘‘Why did the Fund perform this way?’’ and ‘‘What is the outlook?’’ are views of the Fund’s sub-adviser and portfolio management team through the end of the period and are subject to change based on market and other conditions.
Hartford Global Research HLS Fund inception 01/31/2008
(sub-advised by Wellington Management Company, LLP)
Investment objective – Seeks long-term capital appreciation.
Performance Overview 1/31/08 - 6/30/12
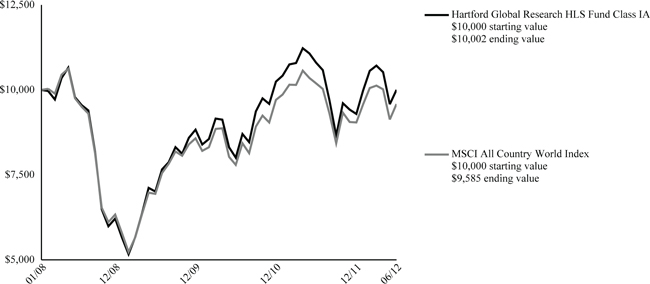
The chart above shows the growth of a $10,000 investment in Class IA. Growth results in classes other than Class IA will vary from what is seen above due to differences in the expenses charged to those share classes.
Average Annual Total Returns (as of 6/30/12)
| 6 Month† | 1 Year | Since Inception | ||||||||||
| Global Research IA | 7.63 | % | -7.38 | % | 0.00 | % | ||||||
| Global Research IB | 7.49 | % | -7.62 | % | -0.24 | % | ||||||
| MSCI All Country World Index | 6.01 | % | -5.96 | % | -0.96 | % | ||||||
| † | Not Annualized |
PAST PERFORMANCE IS NOT INDICATIVE OF FUTURE RESULTS.
Total returns presented above were calculated using the Fund's net asset value available to shareholders for sale or redemption of Fund shares on June 30, 2012, which may exclude investment transactions as of this date.
MSCI All Country World Index is a free float-adjusted market capitalization index that measures equity market performance in the global developed and emerging markets, consisting of 45 developed and emerging market country indices. This index is unmanaged, and its results include reinvested dividends and/or distributions, but do not reflect the effect of sales charges, commissions, expenses or taxes.
You cannot invest directly in an index.
The chart represents a hypothetical investment in the Fund. Performance data represents past performance and current performance could be higher or lower.
Performance information may reflect historical or current expense waivers/reimbursements from the investment adviser, without which performance would have been lower. For information on current expense waivers/reimbursements, please see the prospectus.
The value of the Fund will fluctuate so that when redeemed, it may be worth more or less than the original investment. The chart and table do not reflect the deductions of taxes, sales charges or other fees which may be applied at the variable life insurance, variable annuity or qualified retirement plan product level. Any such additional sales charges or other fees or expenses would lower the contract’s or plan’s performance.
| 2 |
| Hartford Global Research HLS Fund |
| Manager Discussion |
| June 30, 2012 (Unaudited) |
| Portfolio Managers | |
| Cheryl M. Duckworth, CFA | Mark D. Mandel, CFA* |
| Senior Vice President and Associate Director of Global Industry Research | Director of Global Industry Research |
| * Mr. Mandel supervises a team of global industry analysts that manage the Fund. Mr. Mandel is not involved in day-to-day management of the Fund. | |
How did the Fund perform?
The Class IA shares of the Hartford Global Research HLS Fund returned 7.63% for the six-month period ended June 30, 2012, outperforming its benchmark, the MSCI All Country World Index, which returned 6.01% for the same period. The Fund also outperformed the 6.23% return of the average fund in the Lipper Global Core VP-UF Funds peer group, a group of funds with investment strategies similar to those of the Fund.
Why did the Fund perform this way?
The six-month period ended June 30, 2012 was a volatile period. Equities performed well during the beginning of the period as investors shrugged off lingering uncertainty over eurozone sovereign debt and focused instead on improving economic data in the U.S. Strong corporate earnings news and the Federal Reserve’s pledge to keep interest rates low buoyed investors’ appetites for risk assets. However, following a strong first quarter, equities retreated in April, fell sharply in May, and recovered modestly in June. A lackluster U.S. jobs report, a heightened level of political uncertainty in France and Greece, and a host of Spanish and Italian bank downgrades by Moody’s dampened investor enthusiasm for equities. As the overall markets slowed, traditionally more defensive industries returned to favor while more cyclical industries experienced stronger sell-offs.
Eight of ten sectors in the MSCI All Country World Index rose during the period. Information Technology (+11%), Consumer Discretionary (+10%), and Financials (+9%) rose the most while returns in Energy (-4%) and Materials (-1%) lagged on a relative basis.
The Fund’s outperformance versus the benchmark was driven by positive security selection in eight of ten sectors. Stock selection was strongest in Information Technology, Health Care, and Financials while selection in Telecommunication Services and Consumer Staples detracted from relative performance (i.e. performance of the Fund as measured against the benchmark).
Top contributors to benchmark-relative performance during the period included Amylin Pharmaceuticals (Health Care), Regeneron Pharmaceuticals (Health Care), and Lorillard (Consumer Staples). Shares of Amylin Pharmaceuticals, a biopharmaceutical company focused on developing drugs for diabetes and other metabolic diseases, rose in response to speculation about a potential takeover. Shares of Regeneron Pharmaceuticals, an integrated biopharmaceutical company, rose after the company reported better-than-expected sales of the firm’s recently launched macular degeneration drug Eylea. In addition, Regeneron substantially raised sales guidance for Eylea during the period. Shares of Lorillard, a U.S.-based manufacturer of cigarettes, rose during the semi-annual period. During the first quarter, the company reported strong earnings growth for the fourth quarter of 2011 and announced a significant dividend increase, sending the shares higher. During the second quarter, Lorillard reported first quarter 2012 earnings that missed consensus expectations; despite the shortfall, the stock outperformed the broad market return during a period when investors generally favored safety-oriented stocks. Top contributors to absolute performance (i.e. total return) also included Apple (Information Technology).
The largest detractors from benchmark-relative returns were Green Mountain Coffee (Consumer Staples), Aquarius Platinum (Materials), and Leap Wireless (Telecommunication Services). Green Mountain Coffee, a U.S.-based maker of Keurig single-cup brewing systems and coffee, saw its shares decline due to disappointing quarterly results and lower guidance from management. Growth in the company’s K-cups business fell below consensus expectations and the shortfall led to lower-than-expected operating profits. Shares of Aquarius Platinum, an Australia-based platinum mining company with assets in South Africa and Zimbabwe, underperformed as the platinum price weakened during the period and Aquarius closed two of its unprofitable mines in South Africa in June. Leap Wireless, a U.S. wireless communications company that sells the Cricket brand wireless service, saw its shares fall after the company reported lower-than-expected margins due to high handset subsidies. In addition, Leap did not see the full seasonal benefit during the period due to delayed tax refunds and because of economic
| 3 |
| Hartford Global Research HLS Fund |
| Manager Discussion – (continued) |
| June 30, 2012 (Unaudited) |
and competitive pressures. Top detractors from absolute performance also included Repsol (Energy).
What is the outlook?
We expect global economic growth to continue, but at a slow recovery rate and with varying degrees of recovery by region. While we believe that the U.S. economy appears more favorably positioned in a global context, we also recognize that the U.S. is not immune to growth setbacks and will have to address its fiscal imbalances in the coming years. Within emerging markets, we continue to see mixed stages of economic recovery and development.
Within Information Technology, we favor Software & Services companies. We have been underweight Semiconductors in recent quarters but closed the relative weight after adding new positions in several companies. Within Technology Hardware, we believe that enterprise spending remains strong.
Relative to the index, our Health Care holdings favor managed care where we believe the recent decline in utilization is both cyclical and secular, and companies that should benefit from the wave of generic drug introductions and a stable competitive environment.
In the Consumer Staples sector, we continue to favor tobacco, where we believe that strong business strategy among the dominant market players continues to support strong pricing. We are underweight Household Products companies based on the view that increased competition is resulting in higher levels of promotional activity, which, coupled with rising input costs, could negatively affect earnings.
The Fund ended the period most overweight (i.e. the Fund’s sector position was greater than the benchmark position) the Health Care, Energy, and Information Technology sectors and most underweight the Telecommunication Services, Industrials, and Financials sectors relative to the MSCI All Country World Index. The Fund’s largest absolute weightings were in the Financials, Information Technology, and Energy sectors.
Diversification by Country
as of June 30, 2012
| Percentage of | ||||
| Country | Net Assets | |||
| Australia | 2.0 | % | ||
| Belgium | 1.3 | |||
| Brazil | 1.3 | |||
| Canada | 3.3 | |||
| Cayman Islands | 0.0 | |||
| Chile | 0.1 | |||
| China | 0.6 | |||
| Denmark | 0.2 | |||
| Egypt | 0.0 | |||
| Finland | 0.0 | |||
| France | 3.3 | |||
| Germany | 1.6 | |||
| Hong Kong | 2.2 | |||
| India | 0.6 | |||
| Indonesia | 0.1 | |||
| Ireland | 0.9 | |||
| Israel | 0.7 | |||
| Italy | 0.2 | |||
| Japan | 5.1 | |||
| Luxembourg | 0.2 | |||
| Malaysia | 0.5 | |||
| Marshall Islands | 0.1 | |||
| Mexico | 0.5 | |||
| Netherlands | 1.0 | |||
| Norway | 1.3 | |||
| Papua New Guinea | 0.1 | |||
| Philippines | 0.2 | |||
| Poland | 0.0 | |||
| Portugal | 0.3 | |||
| Russia | 0.2 | |||
| Singapore | 0.3 | |||
| South Africa | 0.6 | |||
| South Korea | 0.7 | |||
| Spain | 0.8 | |||
| Sweden | 0.3 | |||
| Switzerland | 2.1 | |||
| Taiwan | 0.7 | |||
| Thailand | 0.2 | |||
| Turkey | 0.3 | |||
| United Kingdom | 7.5 | |||
| United States | 57.2 | |||
| Short-Term Investments | 0.7 | |||
| Other Assets and Liabilities | 0.7 | |||
| Total | 100.0 | % | ||
| 4 |
| Hartford Global Research HLS Fund |
| Schedule of Investments |
| June 30, 2012 (Unaudited) |
| (000’s Omitted) |
| Shares or Principal Amount | Market Value ╪ | |||||||
COMMON STOCKS - 98.1% | ||||||||
| Automobiles & Components - 2.0% | ||||||||
| 4 | Daimler AG | $ | 187 | |||||
| 96 | Dongfeng Motor Group Co., Ltd. | 151 | ||||||
| 15 | Ford Motor Co. w/ Rights | 147 | ||||||
| 1 | Michelin (C.G.D.E.) Class B | 63 | ||||||
| 24 | Nissan Motor Co., Ltd. | 229 | ||||||
| 16 | Peugeot S.A. | 161 | ||||||
| 3 | Renault S.A. | 137 | ||||||
| 5 | Stanley Electric Co., Ltd. | 73 | ||||||
| 4 | Tokai Rika Co., Ltd. | 61 | ||||||
| 3 | Toyoda Gosei Co., Ltd. | 67 | ||||||
| 1 | Toyota Boshoku Corp. | 16 | ||||||
| 9 | Toyota Motor Corp. | 349 | ||||||
| 1,641 | ||||||||
| Banks - 7.6% | ||||||||
| 30 | Banco Santander Brasil S.A. | 232 | ||||||
| 8 | Bancorpsouth, Inc. | 118 | ||||||
| 27 | Bangkok Bank plc | 180 | ||||||
| 3 | BankNordik P/F | 34 | ||||||
| — | Banque Cantonale Vaudoise | 177 | ||||||
| 37 | Barclays Bank plc ADR | 94 | ||||||
| 11 | BB&T Corp. | 336 | ||||||
| 8 | BNP Paribas | 297 | ||||||
| 228 | China Construction Bank | 158 | ||||||
| 3 | Citizens & Northern Corp. | 48 | ||||||
| 4 | Citizens Republic Bancorp, Inc. ● | 75 | ||||||
| 30 | DNB ASA | 296 | ||||||
| 1 | Gronlandsbanken | 74 | ||||||
| 8 | Hana Financial Holdings | 242 | ||||||
| 5 | Home Capital Group, Inc. | 219 | ||||||
| 29 | HSBC Holdings plc | 257 | ||||||
| 43 | Karnataka Bank Ltd. | 72 | ||||||
| 129 | Mitsubishi UFJ Financial Group, Inc. | 620 | ||||||
| 6 | National Bank of Canada | 407 | ||||||
| 24 | Oversea-Chinese Banking Corp., Ltd. | 167 | ||||||
| 3 | PNC Financial Services Group, Inc. | 200 | ||||||
| 60 | Regions Financial Corp. | 407 | ||||||
| 31 | Standard Chartered plc | 676 | ||||||
| 3 | Toronto-Dominion Bank | 272 | ||||||
| 128 | Turkiye Sinai Kalkinma Bankasi A.S. | 131 | ||||||
| 12 | Wells Fargo & Co. | 387 | ||||||
| 6,176 | ||||||||
| Capital Goods - 6.1% | ||||||||
| 3 | AMETEK, Inc. | 146 | ||||||
| 15 | BAE Systems plc | 69 | ||||||
| 9 | Beijing Enterprises Holdings Ltd. | 53 | ||||||
| 4 | Boeing Co. | 287 | ||||||
| 1 | Brenntag AG | 148 | ||||||
| 1 | Carlisle Cos., Inc. | 33 | ||||||
| 3 | Colfax Corp. ● | 86 | ||||||
| 4 | Cooper Industries plc Class A | 251 | ||||||
| 5 | Danaher Corp. | 255 | ||||||
| 1 | Dover Corp. | 34 | ||||||
| 2 | Edwards Group Ltd. ADR | 16 | ||||||
| 2 | Emerson Electric Co. | 72 | ||||||
| — | Esterline Technologies Corp. ● | 27 | ||||||
| 3 | Exelis, Inc. | 27 | ||||||
| 25 | General Electric Co. | 530 | ||||||
| 6 | Hiwin Technologies Corp. | 59 | ||||||
| 5 | Honeywell International, Inc. | 252 | ||||||
| 3 | IDEX Corp. | 108 | ||||||
| 4 | Illinois Tool Works, Inc. | 215 | ||||||
| 5 | Ingersoll-Rand plc | 202 | ||||||
| 2 | Joy Global, Inc. | 106 | ||||||
| 2 | Komatsu Ltd. | 55 | ||||||
| 2 | Lockheed Martin Corp. | 178 | ||||||
| 6 | Mitsui & Co., Ltd. | 88 | ||||||
| 2 | Moog, Inc. Class A ● | 66 | ||||||
| 1 | Nidec Corp. | 81 | ||||||
| 5 | Pentair, Inc. | 189 | ||||||
| 3 | Raytheon Co. | 160 | ||||||
| 7 | Rexel S.A. | 112 | ||||||
| 12 | Rolls-Royce Holdings plc | 162 | ||||||
| 1 | Safran S.A. | 47 | ||||||
| 1 | Siemens AG | 79 | ||||||
| 1 | Stanley Black & Decker, Inc. | 41 | ||||||
| — | Triumph Group, Inc. | 28 | ||||||
| 4 | United Technologies Corp. | 322 | ||||||
| 2 | Vallourec | 87 | ||||||
| 4 | Vinci S.A. | 183 | ||||||
| 2 | WESCO International, Inc. ● | 97 | ||||||
| — | Zodiac Aerospace | 37 | ||||||
| 4,988 | ||||||||
| Commercial & Professional Services - 0.1% | ||||||||
| 2 | Huron Consulting Group, Inc. ● | 55 | ||||||
| 3 | Qualicorp S.A. | 26 | ||||||
| 15 | Transfield Services Ltd. | 27 | ||||||
| 108 | ||||||||
| Consumer Durables & Apparel - 1.3% | ||||||||
| 1 | Adidas AG | 71 | ||||||
| 3 | Coach, Inc. | 156 | ||||||
| 87 | Daphne International Holdings Ltd. | 89 | ||||||
| — | Lennar Corp. | 8 | ||||||
| 2 | LVMH Moet Hennessy Louis Vuitton S.A. | 304 | ||||||
| 2 | NIKE, Inc. Class B | 147 | ||||||
| 8 | Prada S.p.A. ● | 52 | ||||||
| 2 | Salvatore Ferragamo Italia S.p.A. ● | 49 | ||||||
| 74 | Samsonite International S.A. ● | 125 | ||||||
| 14 | Stella International | 35 | ||||||
| 1,036 | ||||||||
| Consumer Services - 0.3% | ||||||||
| 2 | Carnival Corp. | 83 | ||||||
| 5 | Compass Group plc | 48 | ||||||
| 12 | Galaxy Entertainment Group Ltd. ● | 30 | ||||||
| 1 | Las Vegas Sands Corp. | 22 | ||||||
| 1 | Marriott International, Inc. Class A | 21 | ||||||
| 12 | Sands China Ltd. § | 37 | ||||||
| 10 | Shangri-La Asia Ltd. | 19 | ||||||
| — | Wyndham Worldwide Corp. | 23 | ||||||
| 283 | ||||||||
| Diversified Financials - 4.8% | ||||||||
| 18 | Aberdeen Asset Management plc | 73 | ||||||
| 6 | Ameriprise Financial, Inc. | 307 | ||||||
| — | BlackRock, Inc. | 75 | ||||||
| 24 | Citigroup, Inc. | 645 | ||||||
| 15 | EFG International AG ● | 82 | ||||||
| 21 | GAM Holding Ltd. | 230 | ||||||
| 4 | IBJ Leasing Co., Ltd. | 97 | ||||||
| 9 | ICAP plc | 50 | ||||||
The accompanying notes are an integral part of these financial statements.
| 5 |
| Hartford Global Research HLS Fund |
| Schedule of Investments – (continued) |
| June 30, 2012 (Unaudited) |
| (000’s Omitted) |
| Shares or Principal Amount | Market Value ╪ | |||||||
COMMON STOCKS - 98.1% - (continued) | ||||||||
| Diversified Financials - 4.8% - (continued) | ||||||||
| 28 | ING Groep N.V. ● | $ | 189 | |||||
| 4 | Invesco Ltd. | 101 | ||||||
| 27 | Investec plc | 161 | ||||||
| 17 | JP Morgan Chase & Co. | 611 | ||||||
| 10 | Julius Baer Group Ltd. | 366 | ||||||
| 1 | LPL Financial Holdings, Inc. ● | 46 | ||||||
| 8 | Macquarie Group Ltd. | 224 | ||||||
| 3 | Matsui Securities Co., Ltd. | 17 | ||||||
| 1 | Nasdaq OMX Group, Inc. ● | 21 | ||||||
| 2 | NYSE Euronext | 38 | ||||||
| 10 | SEI Investments Co. | 201 | ||||||
| 33 | UBS AG | 389 | ||||||
| 1 | Warsaw Stock Exchange | 16 | ||||||
| 3,939 | ||||||||
| Energy - 11.5% | ||||||||
| 7 | Aban Offshore Ltd. | 46 | ||||||
| 5 | Alpha Natural Resources, Inc. ● | 42 | ||||||
| 6 | Anadarko Petroleum Corp. | 365 | ||||||
| 1 | Apache Corp. | 52 | ||||||
| 10 | Baker Hughes, Inc. | 431 | ||||||
| 37 | BG Group plc | 752 | ||||||
| 2 | BioFuel Energy Corp. ● | 6 | ||||||
| 37 | BP plc | 250 | ||||||
| 1 | BP plc ADR | 49 | ||||||
| 10 | Buru Energy Ltd. | 32 | ||||||
| 19 | Cairn Energy plc | 78 | ||||||
| 1 | Cameron International Corp. ● | 46 | ||||||
| 3 | Canadian Natural Resources Ltd. ADR | 90 | ||||||
| 2 | Celtic Exploration Ltd. | 22 | ||||||
| 15 | Chesapeake Energy Corp. | 282 | ||||||
| 2 | Chevron Corp. | 158 | ||||||
| 46 | CNOOC Ltd. | 93 | ||||||
| 8 | Cobalt International Energy ● | 196 | ||||||
| 3 | ConocoPhillips Holding Co. | 174 | ||||||
| 8 | Consol Energy, Inc. | 228 | ||||||
| 3 | Denbury Resources, Inc. ● | 48 | ||||||
| 1 | Dril-Quip, Inc. ● | 58 | ||||||
| 4 | EnCana Corp. ADR | 91 | ||||||
| 5 | Ensco plc | 222 | ||||||
| 1 | EOG Resources, Inc. | 120 | ||||||
| 1 | Exxon Mobil Corp. | 109 | ||||||
| 6 | GALP Energia S.A. | 82 | ||||||
| 16 | Green Plains Renewable Energy ● | 102 | ||||||
| 3 | Husky Energy, Inc. | 68 | ||||||
| 8 | Imperial Oil Ltd. | 321 | ||||||
| 6 | Indo Tambangraya Megah PT | 21 | ||||||
| — | Inpex Corp. | 11 | ||||||
| 19 | JX Holdings, Inc. | 100 | ||||||
| 41 | Karoon Gas Australia Ltd. ● | 170 | ||||||
| 3 | Kinder Morgan, Inc. | 104 | ||||||
| 62 | Kunlun Energy Co., Ltd. | 100 | ||||||
| 2 | Marathon Petroleum Corp. | 94 | ||||||
| 3 | National Oilwell Varco, Inc. | 218 | ||||||
| 43 | New Standard Energy Ltd. | 24 | ||||||
| — | Noble Energy, Inc. | 31 | ||||||
| 3 | Occidental Petroleum Corp. | 233 | ||||||
| 6 | Ocean Rig UDW, Inc. ● | 78 | ||||||
| 17 | Oil Search Ltd. | 114 | ||||||
| 3 | Painted Pony Petroleum Ltd. | 20 | ||||||
| 5 | Patterson-UTI Energy, Inc. | 72 | ||||||
| 5 | Peabody Energy Corp. | 122 | ||||||
| 12 | Petroleo Brasileiro S.A. ADR | 232 | ||||||
| 10 | Petroleum Geo-Services ● | 123 | ||||||
| 1 | Petrominerales Ltd. | 14 | ||||||
| 14 | Phillips 66 ● | 456 | ||||||
| 2 | Pioneer Natural Resources Co. | 142 | ||||||
| 1 | QEP Resources, Inc. | 36 | ||||||
| 8 | Reliance Industries Ltd. | 102 | ||||||
| 3 | Reliance Industries Ltd. GDR ■ | 73 | ||||||
| 27 | Repsol YPF S.A. | 428 | ||||||
| 27 | Repsol YPF S.A. Rights | 19 | ||||||
| — | Rosetta Resources, Inc. ● | 7 | ||||||
| 4 | Sasol Ltd. ADR | 176 | ||||||
| 1 | Schlumberger Ltd. | 83 | ||||||
| 5 | Southwestern Energy Co. ● | 171 | ||||||
| 7 | Statoil ASA | 172 | ||||||
| 5 | Suncor Energy, Inc. | 139 | ||||||
| 6 | Superior Energy Services, Inc. ● | 121 | ||||||
| 4 | Tesoro Corp. ● | 88 | ||||||
| 12 | Tonengeneral Sekiyu KK | 102 | ||||||
| 1 | Tourmaline Oil Corp. ● | 16 | ||||||
| 3 | Trican Well Service Ltd. | 30 | ||||||
| 4 | Tupras-Turkiye Petrol Rafinerileri A.S. | 86 | ||||||
| 35 | Vantage Drilling Co. ● | 53 | ||||||
| 62 | Whitehaven Coal Ltd. | 266 | ||||||
| 1 | Whiting Petroleum Corp. ● | 50 | ||||||
| 1 | WPX Energy, Inc. ● | 13 | ||||||
| 9,323 | ||||||||
| Food & Staples Retailing - 2.3% | ||||||||
| 2 | Costco Wholesale Corp. | 167 | ||||||
| 11 | CVS Caremark Corp. | 507 | ||||||
| 5 | Jeronimo Martins ● | 81 | ||||||
| 5 | Seven & I Holdings Co., Ltd. | 156 | ||||||
| 25 | Sheng Siong Group Ltd. ● | 8 | ||||||
| 60 | Tesco plc | 291 | ||||||
| 4 | Walgreen Co. | 129 | ||||||
| 5 | Wal-Mart Stores, Inc. | 341 | ||||||
| 6 | Woolworths Ltd. | 166 | ||||||
| 1,846 | ||||||||
| Food, Beverage & Tobacco - 8.3% | ||||||||
| 30 | Altria Group, Inc. | 1,023 | ||||||
| 8 | Anheuser-Busch InBev N.V. | 618 | ||||||
| 22 | Bajaj Hindusthan Ltd. | 12 | ||||||
| 16 | Balrampur Chini Mills Ltd. | 15 | ||||||
| 4 | British American Tobacco plc | 214 | ||||||
| 34 | Britvic plc | 177 | ||||||
| 23 | Cott Corp. ● | 187 | ||||||
| 6 | Diamond Foods, Inc. | 104 | ||||||
| 2 | GLG Life Technology Corp. ⌂●† | 1 | ||||||
| 16 | Green Mountain Coffee Roasters, Inc. ● | 342 | ||||||
| 12 | Groupe Danone | 746 | ||||||
| 30 | Grupo Modelo S.A.B. | 263 | ||||||
| 1 | Imperial Tobacco Group plc | 35 | ||||||
| 2 | Japan Tobacco, Inc. | 53 | ||||||
| 14 | Kraft Foods, Inc. | 557 | ||||||
| 10 | Lorillard, Inc. | 1,300 | ||||||
| 3 | Omega Protein Corp. ● | 25 | ||||||
| 6 | Philip Morris International, Inc. | 560 | ||||||
The accompanying notes are an integral part of these financial statements.
| 6 |
| Shares or Principal Amount | Market Value ╪ | |||||||
COMMON STOCKS - 98.1% - (continued) | ||||||||
| Food, Beverage & Tobacco - 8.3% - (continued) | ||||||||
| 9 | Pilgrim's Pride Corp. ● | $ | 63 | |||||
| 3 | Salmar ASA | 16 | ||||||
| 17 | Smithfield Foods, Inc. ● | 362 | ||||||
| 3 | Unilever N.V. CVA | 98 | ||||||
| 6,771 | ||||||||
| Health Care Equipment & Services - 3.0% | ||||||||
| 2 | Aetna, Inc. | 91 | ||||||
| 1 | Allscripts Healthcare Solutions, Inc. ● | 14 | ||||||
| 1 | AmerisourceBergen Corp. | 37 | ||||||
| 7 | Boston Scientific Corp. ● | 42 | ||||||
| 1 | Cardinal Health, Inc. | 62 | ||||||
| 3 | CIGNA Corp. | 132 | ||||||
| 6 | Covidien plc | 318 | ||||||
| 1 | HCA Holdings, Inc. | 35 | ||||||
| 1 | Hologic, Inc. ● | 25 | ||||||
| — | M3, Inc. | 129 | ||||||
| 3 | McKesson Corp. | 317 | ||||||
| 5 | Medtronic, Inc. | 195 | ||||||
| 3 | NMC Health plc | 9 | ||||||
| 10 | Smith & Nephew plc | 101 | ||||||
| 3 | St. Jude Medical, Inc. | 128 | ||||||
| 1 | Stryker Corp. | 57 | ||||||
| — | SXC Health Solutions Corp. ● | 24 | ||||||
| 10 | UnitedHealth Group, Inc. | 564 | ||||||
| 2 | Vanguard Health Systems, Inc. ● | 22 | ||||||
| 3 | Zimmer Holdings, Inc. | 167 | ||||||
| 2,469 | ||||||||
| Insurance - 3.1% | ||||||||
| 3 | Aflac, Inc. | 136 | ||||||
| 106 | Ageas | 210 | ||||||
| 2 | American International Group, Inc. ● | 77 | ||||||
| 3 | Aon plc | 136 | ||||||
| 10 | AXA S.A. | 138 | ||||||
| 2 | Berkshire Hathaway, Inc. Class B ● | 175 | ||||||
| 11 | Brasil Insurance Participacoes e Administracao S.A. | 101 | ||||||
| 31 | Discovery Holdings Ltd. | 194 | ||||||
| 11 | FBD Holdings | 108 | ||||||
| 4 | Marsh & McLennan Cos., Inc. | 123 | ||||||
| 5 | National Financial Partners Corp. ● | 70 | ||||||
| 3 | Principal Financial Group, Inc. | 79 | ||||||
| 8 | Progressive Corp. | 172 | ||||||
| 36 | Storebrand ASA | 139 | ||||||
| 5 | Swiss Re Ltd. | 298 | ||||||
| 4 | Unum Group | 82 | ||||||
| 15 | XL Group plc | 314 | ||||||
| 2,552 | ||||||||
| Materials - 7.6% | ||||||||
| 3 | Air Products & Chemicals, Inc. | 232 | ||||||
| 4 | Akzo Nobel N.V. | 177 | ||||||
| 1 | Allegheny Technologies, Inc. | 19 | ||||||
| 8 | Allied Nevada Gold Corp. ● | 215 | ||||||
| 15 | Anglo American plc | 506 | ||||||
| 3 | Antofagasta plc | 45 | ||||||
| 160 | Aquarius Platinum Ltd. | 115 | ||||||
| 7 | Asahi Kasei Corp. | 38 | ||||||
| 5 | Ball Corp. | 197 | ||||||
| 2 | Barrick Gold Corp. | 71 | ||||||
| 4 | BASF SE | 279 | ||||||
| 4 | BHP Billiton plc | 112 | ||||||
| 1 | Cabot Corp. | 45 | ||||||
| 1 | Celanese Corp. | 37 | ||||||
| — | CF Industries Holdings, Inc. | 82 | ||||||
| 53 | China Shanshui Cement Group | 37 | ||||||
| 1 | Crown Holdings, Inc. ● | 43 | ||||||
| 2 | Detour Gold Corp. ● | 30 | ||||||
| 6 | Dow Chemical Co. | 192 | ||||||
| 1 | Eastman Chemical Co. | 39 | ||||||
| 7 | EcoSynthetix, Inc. ● | 25 | ||||||
| 5 | Fertilizantes Heringer S.A. ● | 28 | ||||||
| 5 | First Quantum Minerals Ltd. | 97 | ||||||
| 1 | FMC Corp. | 48 | ||||||
| 16 | Fortescue Metals Group Ltd. | 83 | ||||||
| 1 | Freeport-McMoRan Copper & Gold, Inc. | 37 | ||||||
| 3 | Goldcorp, Inc. | 123 | ||||||
| 11 | Graphic Packaging Holding Co. ● | 63 | ||||||
| 2 | HeidelbergCement AG | 94 | ||||||
| 780 | Huabao International Holdings Ltd. | 388 | ||||||
| 2 | Ivanhoe Mines Ltd. ● | 19 | ||||||
| 2 | Ivanhoe Mines Ltd. Rights | 2 | ||||||
| 1 | JSR Corp. | 22 | ||||||
| 7 | Kinross Gold Corp. | 59 | ||||||
| 3 | LyondellBasell Industries Class A | 130 | ||||||
| — | Martin Marietta Materials, Inc. | 38 | ||||||
| 2 | MeadWestvaco Corp. | 48 | ||||||
| 8 | Methanex Corp. | 215 | ||||||
| 3 | Methanex Corp. ADR | 86 | ||||||
| 6 | Mitsubishi Chemical Holdings | 26 | ||||||
| 101 | Mongolian Mining Corp. ● | 57 | ||||||
| 12 | Mosaic Co. | 661 | ||||||
| 1 | New Gold, Inc. ● | 10 | ||||||
| 69 | Nine Dragons Paper Holdings | 39 | ||||||
| 5 | Owens-Illinois, Inc. ● | 102 | ||||||
| 42 | Perseus Mining Ltd. | 110 | ||||||
| 3 | Phosagro OAO § | 37 | ||||||
| 13 | PTT Chemical Public Co., Ltd. ● | 23 | ||||||
| 6 | Rexam plc | 37 | ||||||
| 4 | Rio Tinto plc | 191 | ||||||
| 2 | Rubicon Minerals Corp. ● | 5 | ||||||
| 3 | Shin-Etsu Chemical Co., Ltd. | 170 | ||||||
| 116 | Sino Forest Corp. Class A ⌂●† | — | ||||||
| 13 | Smurfit Kappa Group plc ● | 87 | ||||||
| 2 | Tikkurila Oy | 30 | ||||||
| 9 | Ube Industries Ltd. | 21 | ||||||
| 1 | Uralkali § | 33 | ||||||
| — | Walter Energy, Inc. | 14 | ||||||
| 2 | Westlake Chemical Corp. | 83 | ||||||
| 17 | Worthington Industries, Inc. | 339 | ||||||
| 6,191 | ||||||||
| Media - 2.7% | ||||||||
| 1 | AMC Networks, Inc. Class A ● | 20 | ||||||
| 2 | CBS Corp. Class B | 72 | ||||||
| 14 | Comcast Corp. Class A | 459 | ||||||
| 6 | Comcast Corp. Special Class A | 179 | ||||||
| 3 | DreamWorks Animation SKG, Inc. ● | 48 | ||||||
| — | Fuji Media Holdings, Inc. | 53 | ||||||
| 4 | Liberty Global, Inc. ● | 180 | ||||||
| 2 | Omnicom Group, Inc. | 106 | ||||||
| 1 | Publicis Groupe | 61 | ||||||
The accompanying notes are an integral part of these financial statements.
| 7 |
| Hartford Global Research HLS Fund |
| Schedule of Investments – (continued) |
| June 30, 2012 (Unaudited) |
| (000’s Omitted) |
| Shares or Principal Amount | Market Value ╪ | |||||||
COMMON STOCKS - 98.1% - (continued) | ||||||||
| Media - 2.7% - (continued) | ||||||||
| 7 | Reed Elsevier Capital, Inc. | $ | 56 | |||||
| 2 | SES Global S.A. | 37 | ||||||
| 16 | Sirius XM Radio, Inc. w/ Rights ● | 30 | ||||||
| 4 | Viacom, Inc. Class B | 178 | ||||||
| 5 | Virgin Media, Inc. | 121 | ||||||
| 12 | Walt Disney Co. | 563 | ||||||
| 2,163 | ||||||||
| Pharmaceuticals, Biotechnology & Life Sciences - 7.2% | ||||||||
| 1 | Acorda Therapeutics, Inc. ● | 21 | ||||||
| 1 | Actelion Ltd. | 23 | ||||||
| 1 | Agilent Technologies, Inc. | 47 | ||||||
| 1 | Algeta ASA ● | 41 | ||||||
| — | Alk-Abello A/S | 15 | ||||||
| 9 | Alkermes plc ● | 161 | ||||||
| 3 | Almirall S.A. | 18 | ||||||
| 15 | Amylin Pharmaceuticals, Inc. ● | 411 | ||||||
| 2 | Arena Pharmaceuticals, Inc. ● | 23 | ||||||
| 1 | Astellas Pharma, Inc. | 40 | ||||||
| 3 | AstraZeneca plc | 124 | ||||||
| 2 | AstraZeneca plc ADR | 110 | ||||||
| 1 | Auxilium Pharmaceuticals, Inc. ● | 35 | ||||||
| 1 | Biogen Idec, Inc. ● | 118 | ||||||
| 8 | Bristol-Myers Squibb Co. | 293 | ||||||
| 2 | Cadence Pharmaceuticals, Inc. ● | 6 | ||||||
| 1 | Cubist Pharmaceuticals, Inc. ● | 39 | ||||||
| 12 | Daiichi Sankyo Co., Ltd. | 198 | ||||||
| 6 | Eisai Co., Ltd. | 262 | ||||||
| 23 | Elan Corp. plc ADR ● | 337 | ||||||
| 7 | Eli Lilly & Co. | 307 | ||||||
| 6 | Exelixis, Inc. ● | 31 | ||||||
| 9 | Forest Laboratories, Inc. ● | 302 | ||||||
| 2 | Gilead Sciences, Inc. ● | 126 | ||||||
| 1 | H. Lundbeck A/S | 18 | ||||||
| 2 | Immunogen, Inc. ● | 25 | ||||||
| 2 | Incyte Corp. ● | 36 | ||||||
| 2 | Ironwood Pharmaceuticals, Inc. ● | 32 | ||||||
| 1 | Johnson & Johnson | 66 | ||||||
| 2 | Medicines Co. ● | 57 | ||||||
| 11 | Merck & Co., Inc. | 438 | ||||||
| 2 | Mylan, Inc. ● | 43 | ||||||
| 1 | NPS Pharmaceuticals, Inc. ● | 12 | ||||||
| 1 | Ono Pharmaceutical Co., Ltd. | 53 | ||||||
| 1 | Onyx Pharmaceuticals, Inc. ● | 38 | ||||||
| 1 | Pacira Pharmaceuticals, Inc. ● | 8 | ||||||
| 11 | Pfizer, Inc. | 261 | ||||||
| 3 | Regeneron Pharmaceuticals, Inc. ● | 321 | ||||||
| 2 | Rigel Pharmaceuticals, Inc. ● | 22 | ||||||
| 1 | Roche Holding AG | 106 | ||||||
| 2 | Salix Pharmaceuticals Ltd. ● | 82 | ||||||
| 2 | Seattle Genetics, Inc. ● | 42 | ||||||
| 12 | Shionogi & Co., Ltd. | 162 | ||||||
| — | Targacept, Inc. ● | 2 | ||||||
| 14 | Teva Pharmaceutical Industries Ltd. ADR | 552 | ||||||
| 1 | Thermo Fisher Scientific, Inc. | 38 | ||||||
| 4 | UCB S.A. | 212 | ||||||
| 1 | Vertex Pharmaceuticals, Inc. ● | 62 | ||||||
| — | Waters Corp. ● | 13 | ||||||
| 1 | Watson Pharmaceuticals, Inc. ● | 58 | ||||||
| 5,847 | ||||||||
| Real Estate - 3.1% | ||||||||
| — | Acadia Realty Trust | 10 | ||||||
| 1 | Aliansce Shopping Centers S.A. | 8 | ||||||
| 3 | American Assets Trust, Inc. | 81 | ||||||
| — | American Campus Communities, Inc. | 16 | ||||||
| 2 | American Tower Corp. REIT | 122 | ||||||
| 7 | Ascendas Real Estate Investment Trust | 12 | ||||||
| — | Avalonbay Communities, Inc. | 25 | ||||||
| 8 | Ayala Land, Inc. | 4 | ||||||
| — | Boardwalk REIT | 18 | ||||||
| — | Boston Properties, Inc. | 38 | ||||||
| 8 | BR Malls Participacoes S.A. | 92 | ||||||
| 4 | BR Properties S.A. | 50 | ||||||
| 2 | British Land Co. plc | 14 | ||||||
| — | Camden Property Trust | 26 | ||||||
| 10 | Capitacommercial Trust | 10 | ||||||
| 8 | Capitamall Trust | 12 | ||||||
| 1 | Castellum AB | 7 | ||||||
| 60 | China Overseas Grand Oceans Group Ltd. | 54 | ||||||
| 1 | Coresite Realty Corp. | 17 | ||||||
| 2 | Daito Trust Construction Co., Ltd. | 163 | ||||||
| 1 | DDR Corp. | 15 | ||||||
| 1 | Derwent London plc | 19 | ||||||
| 17 | Dexus Property Group | 16 | ||||||
| — | Digital Realty Trust, Inc. | 27 | ||||||
| 1 | Douglas Emmett, Inc. | 16 | ||||||
| — | EastGroup Properties, Inc. | 10 | ||||||
| 1 | Education Realty Trust, Inc. | 9 | ||||||
| — | Equity Lifestyle Properties, Inc. | 15 | ||||||
| 1 | Equity Residential Properties Trust | 32 | ||||||
| 9 | Forest City Enterprises, Inc. Class A ● | 126 | ||||||
| 36 | Fortune REIT | 21 | ||||||
| 1 | Glimcher Realty Trust | 12 | ||||||
| 1 | GSW Immobilien AG ● | 28 | ||||||
| 13 | Hammerson plc | 87 | ||||||
| 1 | HCP, Inc. | 28 | ||||||
| 1 | Health Care, Inc. | 37 | ||||||
| 1 | Host Hotels & Resorts, Inc. | 18 | ||||||
| 4 | Hysan Development Co., Ltd. | 17 | ||||||
| — | Icade | 7 | ||||||
| — | Industrial & Infrastructure Fund Investment Corp. | 6 | ||||||
| — | Kilroy Realty Corp. | 22 | ||||||
| 1 | LaSalle Hotel Properties | 17 | ||||||
| 34 | Link REIT | 138 | ||||||
| 2 | Mitsubishi Estate Co., Ltd. | 35 | ||||||
| 2 | Mitsui Fudosan Co., Ltd. | 29 | ||||||
| — | Post Properties, Inc. | 13 | ||||||
| — | PSP Swiss Property | 16 | ||||||
| — | Public Storage | 49 | ||||||
| 2 | Rayonier, Inc. | 104 | ||||||
| 1 | RioCan REIT | 22 | ||||||
| 187 | Robinsons Land Corp. | 78 | ||||||
| 2 | Shaftesbury plc | 19 | ||||||
| 2 | Simon Property Group, Inc. | 336 | ||||||
| — | Stag Industrial, Inc. | 3 | ||||||
| 2 | Sun Hung Kai Properties Ltd. | 19 | ||||||
| — | Swiss Prime Site AG | 15 | ||||||
| — | Taubman Centers, Inc. | 30 | ||||||
| — | Unibail-Rodamco SE | 44 | ||||||
The accompanying notes are an integral part of these financial statements.
| 8 |
| Shares or Principal Amount | Market Value ╪ | |||||||
COMMON STOCKS - 98.1% - (continued) | ||||||||
| Real Estate - 3.1% - (continued) | ||||||||
| 20 | Westfield Group | $ | 191 | |||||
| 14 | Westfield Retail Trust | 42 | ||||||
| 2,547 | ||||||||
| Retailing - 3.9% | ||||||||
| 2 | Advance Automotive Parts, Inc. | 135 | ||||||
| 3 | Amazon.com, Inc. ● | 723 | ||||||
| — | AutoZone, Inc. ● | 53 | ||||||
| 4 | Cia Hering | 68 | ||||||
| 1 | Dollar General Corp. ● | 77 | ||||||
| 2 | Family Dollar Stores, Inc. | 106 | ||||||
| 3 | Gap, Inc. | 72 | ||||||
| 4 | Hennes & Mauritz Ab | 128 | ||||||
| 4 | Home Depot, Inc. | 202 | ||||||
| 2 | Industria de Diseno Textil S.A. | 169 | ||||||
| 96 | Intime Department Store | 95 | ||||||
| 10 | Liberty Media - Interactive A ● | 185 | ||||||
| 16 | Lowe's Co., Inc. | 455 | ||||||
| 15 | Marks & Spencer Group plc | 77 | ||||||
| 11 | Myer Holdings Ltd. | 19 | ||||||
| — | Priceline.com, Inc. ● | 240 | ||||||
| 15 | Rakuten, Inc. | 152 | ||||||
| 11 | S.A.C.I. Falabella | 103 | ||||||
| 2 | Target Corp. | 88 | ||||||
| 3,147 | ||||||||
| Semiconductors & Semiconductor Equipment - 1.9% | ||||||||
| 9 | ASM Pacific Technology | 119 | ||||||
| 2 | ASML Holding N.V. | 82 | ||||||
| 1 | ASML Holding N.V. ADR | 62 | ||||||
| 1 | Broadcom Corp. Class A | 30 | ||||||
| 3 | Cirrus Logic, Inc. ● | 96 | ||||||
| 4 | Cypress Semiconductor Corp. | 50 | ||||||
| 5 | Fairchild Semiconductor International, Inc. ● | 69 | ||||||
| 1 | International Rectifier Corp. ● | 18 | ||||||
| 3 | Linear Technology Corp. | 104 | ||||||
| 2 | Maxim Integrated Products, Inc. | 47 | ||||||
| — | Samsung Electronics Co., Ltd. | 274 | ||||||
| 11 | Skyworks Solutions, Inc. ● | 314 | ||||||
| 90 | Taiwan Semiconductor Manufacturing Co., Ltd. | 245 | ||||||
| 1,510 | ||||||||
| Software & Services - 6.9% | ||||||||
| 8 | Accenture plc | 467 | ||||||
| 3 | Activision Blizzard, Inc. | 41 | ||||||
| 1 | Alliance Data Systems Corp. ● | 165 | ||||||
| 8 | Automatic Data Processing, Inc. | 455 | ||||||
| 11 | Cadence Design Systems, Inc. ● | 117 | ||||||
| 2 | Citrix Systems, Inc. ● | 168 | ||||||
| 4 | Dropbox, Inc. ⌂●† | 34 | ||||||
| 14 | eBay, Inc. ● | 577 | ||||||
| 2 | Equinix, Inc. ● | 386 | ||||||
| 1 | Exlservice Holdings, Inc. ● | 33 | ||||||
| 3 | Fortinet, Inc. ● | 75 | ||||||
| 4 | Genpact Ltd. ● | 74 | ||||||
| — | Google, Inc. ● | 56 | ||||||
| 4 | Hisoft Technology International Ltd. ● | 58 | ||||||
| 1 | IBM Corp. | 167 | ||||||
| 3 | Intuit, Inc. | 183 | ||||||
| 4 | Kakaku.com, Inc. | 131 | ||||||
| 12 | Microsoft Corp. | 380 | ||||||
| 1 | MicroStrategy, Inc. ● | 94 | ||||||
| 19 | Oracle Corp. | 567 | ||||||
| 1 | Rackspace Hosting, Inc. ● | 64 | ||||||
| 1 | Salesforce.com, Inc. ● | 167 | ||||||
| 8 | Sapient Corp. | 76 | ||||||
| 3 | Splunk, Inc. | 73 | ||||||
| 4 | Tencent Holdings Ltd. | 106 | ||||||
| 2 | Teradata Corp. ● | 111 | ||||||
| 2 | Tibco Software, Inc. ● | 60 | ||||||
| 2 | Vantiv, Inc. ● | 54 | ||||||
| 4 | VeriSign, Inc. | 171 | ||||||
| 2 | Visa, Inc. | 287 | ||||||
| — | VMware, Inc. ● | 16 | ||||||
| 14 | Western Union Co. | 244 | ||||||
| 5,657 | ||||||||
| Technology Hardware & Equipment - 4.2% | ||||||||
| 27 | AAC Technologies Holdings, Inc. | 79 | ||||||
| 17 | Advantech Co., Ltd. | 56 | ||||||
| 3 | Apple, Inc. ● | 1,807 | ||||||
| 1 | Audience, Inc. | 14 | ||||||
| 4 | Calix, Inc. ● | 30 | ||||||
| 3 | Ciena Corp. ● | 51 | ||||||
| 10 | EMC Corp. ● | 250 | ||||||
| 2 | Finisar Corp. ● | 31 | ||||||
| 4 | Hewlett-Packard Co. | 82 | ||||||
| 14 | Hitachi Ltd. | 84 | ||||||
| 38 | Hon Hai Precision Industry Co., Ltd. | 114 | ||||||
| 6 | Juniper Networks, Inc. ● | 95 | ||||||
| 1 | National Instruments Corp. | 16 | ||||||
| 8 | Qualcomm, Inc. | 458 | ||||||
| 3 | Riverbed Technology, Inc. ● | 42 | ||||||
| 1 | Rogers Corp. ● | 31 | ||||||
| 44 | Synnex Technology International Corp. | 107 | ||||||
| 2 | Trimble Navigation Ltd. ● | 78 | ||||||
| 3,425 | ||||||||
| Telecommunication Services - 3.0% | ||||||||
| 7 | America Movil SAB de C.V. ADR | 170 | ||||||
| 63 | Axiata Group Berhad | 110 | ||||||
| 27 | Bharti Televentures | 149 | ||||||
| 72 | China Unicom Ltd. | 90 | ||||||
| 11 | Cincinnati Bell, Inc. ● | 42 | ||||||
| 3 | Crown Castle International Corp. ● | 150 | ||||||
| 16 | Frontier Communications Corp. | 61 | ||||||
| 17 | Leap Wireless International, Inc. ● | 112 | ||||||
| 9 | MetroPCS Communications, Inc. ● | 52 | ||||||
| 1 | Millicom International Cellular SDR | 110 | ||||||
| 5 | Mobile Telesystems OJSC ADR | 87 | ||||||
| 6 | MTN Group Ltd. | 96 | ||||||
| 4 | NII Holdings, Inc. Class B ● | 37 | ||||||
| 22 | Orascom Telecom Media and Technology Holding SAE ●§ | 27 | ||||||
| 1 | P.T. Telekomunikasi Indonesia ADR | 46 | ||||||
| 1 | Philippine Long Distance Telephone Co. ADR | 59 | ||||||
| 12 | Portugal Telecom SGPS S.A. | 53 | ||||||
| 1 | SBA Communications Corp. ● | 56 | ||||||
| 4 | SK Telecom Co., Ltd. ADR | 53 | ||||||
| 40 | Sprint Nextel Corp. ● | 131 | ||||||
| 5 | Tele2 Ab B Shares | 78 | ||||||
| 16 | Telenor ASA | 274 | ||||||
The accompanying notes are an integral part of these financial statements.
| 9 |
| Hartford Global Research HLS Fund |
| Schedule of Investments – (continued) |
| June 30, 2012 (Unaudited) |
| (000’s Omitted) |
| Shares or Principal Amount | Market Value ╪ | |||||||
COMMON STOCKS - 98.1% - (continued) | ||||||||
| Telecommunication Services - 3.0% - (continued) | ||||||||
| 3 | Tim Participacoes S.A. ADR | $ | 73 | |||||
| 5 | TW Telecom, Inc. ● | 122 | ||||||
| 4 | VimpelCom Ltd. ADR | 29 | ||||||
| 66 | Vodafone Group plc | 184 | ||||||
| 1 | Ziggo N.V. ● | 31 | ||||||
| 2,482 | ||||||||
| Transportation - 3.2% | ||||||||
| 227 | AirAsia Berhad | 257 | ||||||
| 1 | C.H. Robinson Worldwide, Inc. | 69 | ||||||
| 7 | Celadon Group, Inc. | 117 | ||||||
| 10 | Delta Air Lines, Inc. ● | 114 | ||||||
| 1 | Expeditors International of Washington, Inc. | 23 | ||||||
| 3 | FedEx Corp. | 261 | ||||||
| 1 | Genesee & Wyoming, Inc. Class A ● | 49 | ||||||
| 71 | Hutchinson Port Holdings Trust | 51 | ||||||
| 4 | J.B. Hunt Transport Services, Inc. | 255 | ||||||
| 2 | Kansas City Southern ● | 128 | ||||||
| 3 | Landstar System, Inc. | 142 | ||||||
| 7 | Localiza Rent a Car S.A. | 110 | ||||||
| 3 | Norfolk Southern Corp. | 225 | ||||||
| 2 | Quality Distribution, Inc. ● | 25 | ||||||
| 1 | Spirit Airlines, Inc. ● | 21 | ||||||
| 16 | Swift Transportation Co. ● | 154 | ||||||
| 19 | Transurban Group | 113 | ||||||
| 26 | US Airways Group, Inc. ● | 345 | ||||||
| 4 | Vitran Corp., Inc. ● | 26 | ||||||
| 4 | XPO Logistics, Inc. ● | 63 | ||||||
| 51 | Zhejiang Expressway Co., Ltd. | 34 | ||||||
| 2,582 | ||||||||
| Utilities - 4.0% | ||||||||
| 6 | Calpine Corp. ● | 96 | ||||||
| 3 | Cheung Kong Infrastructure | 20 | ||||||
| 6 | Chubu Electric Power Co., Inc. | 100 | ||||||
| 14 | Duke Energy Corp. | 319 | ||||||
| 7 | E.On AG | 156 | ||||||
| 2 | Edison International | 76 | ||||||
| 1 | Electricite de France | 23 | ||||||
| 15 | Enel S.p.A. | 49 | ||||||
| 17 | ENN Energy Holdings Ltd. | 58 | ||||||
| 8 | Gaz de France | 194 | ||||||
| 124 | Guangdong Investment Ltd. | 90 | ||||||
| 4 | International Power plc † | 29 | ||||||
| 39 | National Grid plc | 418 | ||||||
| 9 | NextEra Energy, Inc. | 629 | ||||||
| 3 | Northeast Utilities | 112 | ||||||
| 1 | OGE Energy Corp. | 35 | ||||||
| 18 | Osaka Gas Co., Ltd. | 77 | ||||||
| 5 | PG&E Corp. | 221 | ||||||
| 1 | Pinnacle West Capital Corp. | 62 | ||||||
| 3 | RWE AG | 119 | ||||||
| 3 | Severn Trent plc | 70 | ||||||
| 8 | Snam S.p.A. | 37 | ||||||
| 3 | Suez Environment S.A. | 30 | ||||||
| 9 | Tokyo Gas Co., Ltd. | 47 | ||||||
| 3 | Tractebel Energia S.A. | 60 | ||||||
| 3 | Xcel Energy, Inc. | 90 | ||||||
| 3,217 | ||||||||
| Total common stocks | ||||||||
| (cost $77,703) | $ | 79,900 | ||||||
| PREFERRED STOCKS - 0.2% | ||||||||
| Automobiles & Components - 0.2% | ||||||||
| 1 | Volkswagen AG N.V. | $ | 156 | |||||
| Total preferred stocks | ||||||||
| (cost $185) | $ | 156 | ||||||
| EXCHANGE TRADED FUNDS - 0.3% | ||||||||
| Other Investment Pools and Funds - 0.3% | ||||||||
| 1 | Industrial Select Sector SPDR Fund | $ | 36 | |||||
| 3 | SPDR S&P Retail ETF | 186 | ||||||
| Total exchange traded funds | ||||||||
| (cost $218) | $ | 222 | ||||||
| CORPORATE BONDS - 0.0% | ||||||||
| Petroleum and Coal Products Manufacturing - 0.0% | ||||||||
| Green Plains Renewable Energy | ||||||||
| $ | 13 | 5.75%, 11/01/2015 ۞ | $ | 11 | ||||
| Total corporate bonds | ||||||||
| (cost $12) | $ | 11 | ||||||
| Total long-term investments | ||||||||
| (cost $78,118) | $ | 80,289 | ||||||
| SHORT-TERM INVESTMENTS - 0.7% | ||||||||
| Repurchase Agreements - 0.7% | ||||||||
| Bank of America Merrill Lynch TriParty Joint Repurchase Agreement (maturing on 07/02/2012 in the amount of $309, collateralized by FHLMC 5.50% - 6.50%, 2035 - 2036, FNMA 5.00% - 6.00%, 2033 - 2039, value of $315) | ||||||||
| $ | 309 | 0.13%, 06/29/2012 | $ | 309 | ||||
| Barclays Capital TriParty Joint Repurchase Agreement (maturing on 07/02/2012 in the amount of $112, collateralized by U.S. Treasury Note 1.25% - 3.63%, 2014 - 2020, value of $114) | ||||||||
| 112 | 0.15%, 06/29/2012 | 112 | ||||||
| Deutsche Bank Securities TriParty Joint Repurchase Agreement (maturing on 07/02/2012 in the amount of $30, collateralized by U.S. Treasury Note 0.88%, 2016, value of $30) | ||||||||
| 30 | 0.20%, 06/29/2012 | 30 | ||||||
The accompanying notes are an integral part of these financial statements.
| 10 |
| Shares or Principal Amount | Market Value ╪ | ||||||||
| SHORT-TERM INVESTMENTS - 0.7% - (continued) | |||||||||
| Repurchase Agreements - 0.7% - (continued) | |||||||||
| TD Securities TriParty Joint Repurchase Agreement (maturing on 07/02/2012 in the amount of $87, collateralized by FHLMC 4.00% - 6.00%, 2027 - 2041, FNMA 4.00% - 4.50%, 2025 - 2042, U.S. Treasury Bond 6.38%, 2027, U.S. Treasury Note 0.38% - 8.75%, 2012 - 2017, value of $89) | |||||||||
| $ | 87 | 0.15%, 06/29/2012 | $ | 87 | |||||
| UBS Securities, Inc. Joint Repurchase Agreement (maturing on 07/02/2012 in the amount of $-, collateralized by U.S. Treasury Note 1.00%, 2013, value of $-) | |||||||||
| — | 0.13%, 06/29/2012 | — | |||||||
| UBS Securities, Inc. TriParty Joint Repurchase Agreement (maturing on 07/02/2012 in the amount of $39, collateralized by GNMA 4.00%, 2042, value of $40) | |||||||||
| 39 | 0.20%, 06/29/2012 | 39 | |||||||
| 577 | |||||||||
| Total short-term investments | |||||||||
| (cost $577) | $ | 577 | |||||||
| Total investments | |||||||||
| (cost $78,695) ▲ | 99.3 | % | $ | 80,866 | |||||
| Other assets and liabilities | 0.7 | % | 536 | ||||||
| Total net assets | 100.0 | % | $ | 81,402 | |||||
| Note: | Percentage of investments as shown is the ratio of the total market value to total net assets. |
| Prices of foreign equities that are principally traded on certain foreign markets may be adjusted daily pursuant to a fair value pricing service approved by the Board of Directors in order to reflect an adjustment for factors occurring after the close of certain foreign markets but before the close of the New York Stock Exchange. |
| ▲ | At June 30, 2012, the cost of securities for federal income tax purposes was $80,227 and the aggregate gross unrealized appreciation and depreciation based on that cost were: |
| Unrealized Appreciation | $ | 8,847 | ||
| Unrealized Depreciation | (8,208 | ) | ||
| Net Unrealized Appreciation | $ | 639 |
| † | These securities were valued in good faith at fair value as determined under policies and procedures established by and under the supervision of the Company's Board of Directors. At June 30, 2012, the aggregate value of these securities was $64, which represents 0.1% of total net assets. This amount excludes securities that are principally traded in certain foreign markets and whose prices are adjusted pursuant to a third party pricing service methodology approved by the Board of Directors. |
| ● | Non-income producing. |
| ■ | Securities issued within terms of a private placement memorandum, exempt from registration under Rule 144A under the Securities Act of 1933, as amended, and may be sold only to qualified institutional buyers. Unless otherwise indicated, these issues are determined to be liquid. At June 30, 2012, the aggregate value of these securities was $73, which represents 0.1% of total net assets. |
The accompanying notes are an integral part of these financial statements.
| 11 |
| Hartford Global Research HLS Fund |
| Schedule of Investments – (continued) |
| June 30, 2012 (Unaudited) |
| (000’s Omitted) |
| § | These securities were sold to the Fund under Regulation S, rules governing offers and sales made outside the United States without registration under the Securities Act of 1933. The Fund may only be able to resell these securities in the United States if an exemption from registration under the federal and state securities laws is available, or the Fund may only be able to sell these securities outside of the United States (such as on a foreign exchange) to a non-U.S. person. Unless otherwise indicated, these holdings are determined to be liquid. At June 30, 2012, the aggregate value of these securities was $134, which represents 0.2% of total net assets. |
| ⌂ | The following securities are considered illiquid. Illiquid securities are often purchased in private placement transactions, are often not registered under the Securities Act of 1933 and may have contractual restrictions on resale. A security may also be considered illiquid if the security lacks a readily available market or if its valuation has not changed for a certain period of time. |
| Period Acquired | Shares/ Par | Security | Cost Basis | |||
| 05/2012 | 4 | Dropbox, Inc. | 38 | |||
| 02/2011 | 2 | GLG Life Technology Corp. | 23 | |||
| 06/2011 - 07/2011 | 116 | Sino Forest Corp. Class A | 485 |
At June 30, 2012, the aggregate value of these securities was $35, which rounds to zero percent of total net assets.
| ۞ | Convertible security. |
Foreign Currency Contracts Outstanding at June 30, 2012
| Description | Counterparty | Buy / Sell | Market Value ╪ | Contract Amount | Delivery Date | Unrealized Appreciation/ (Depreciation) | ||||||||||||
| AUD | CSFB | Buy | $ | 2 | $ | 2 | 07/03/2012 | $ | — | |||||||||
| CHF | CSFB | Buy | — | — | 07/03/2012 | — | ||||||||||||
| CHF | SSG | Sell | 6 | 6 | 07/02/2012 | — | ||||||||||||
| EUR | BNP | Buy | 35 | 35 | 07/03/2012 | — | ||||||||||||
| EUR | BNP | Sell | 30 | 30 | 07/05/2012 | — | ||||||||||||
| EUR | SSG | Sell | 3 | 3 | 07/02/2012 | — | ||||||||||||
| EUR | UBS | Buy | 49 | 48 | 07/02/2012 | 1 | ||||||||||||
| GBP | BCLY | Sell | 76 | 76 | 07/05/2012 | — | ||||||||||||
| GBP | DEUT | Sell | 2 | 2 | 07/02/2012 | — | ||||||||||||
| GBP | DEUT | Buy | 40 | 40 | 07/02/2012 | — | ||||||||||||
| GBP | JPM | Buy | 94 | 93 | 07/03/2012 | 1 | ||||||||||||
| HKD | CBK | Buy | 32 | 32 | 07/03/2012 | — | ||||||||||||
| JPY | BNP | Sell | 11 | 11 | 07/02/2012 | — | ||||||||||||
| JPY | BNP | Sell | 17 | 17 | 07/03/2012 | — | ||||||||||||
| JPY | BNP | Sell | 23 | 23 | 07/05/2012 | — | ||||||||||||
| JPY | DEUT | Sell | 6 | 6 | 08/01/2012 | — | ||||||||||||
| JPY | DEUT | Sell | 190 | 199 | 08/01/2012 | 9 | ||||||||||||
| JPY | JPM | Sell | 152 | 160 | 08/01/2012 | 8 | ||||||||||||
| NOK | DEUT | Sell | 2 | 2 | 07/02/2012 | — | ||||||||||||
| SGD | CBK | Buy | 1 | 1 | 07/03/2012 | — | ||||||||||||
| $ | 19 | |||||||||||||||||
| ╪ | See Significant Accounting Policies of accompanying Notes to Financial Statements regarding valuation of securities. |
The accompanying notes are an integral part of these financial statements.
| 12 |
| GLOSSARY: (abbreviations used in preceding Schedule of Investments) | ||
| Counterparty Abbreviations: | ||
| BCLY | Barclays | |
| BNP | BNP Paribas Securities | |
| CBK | Citibank NA | |
| CSFB | Credit Suisse First Boston Corp. | |
| DEUT | Deutsche Bank Securities, Inc. | |
| JPM | JP Morgan Chase & Co. | |
| SSG | State Street Global Markets LLC | |
| UBS | UBS AG | |
| Currency Abbreviations: | ||
| AUD | Australian Dollar | |
| CHF | Swiss Franc | |
| EUR | EURO | |
| GBP | British Pound | |
| HKD | Hong Kong Dollar | |
| JPY | Japanese Yen | |
| NOK | Norwegian Krone | |
| SGD | Singapore Dollar | |
| Index Abbreviations: | ||
| S&P | Standard & Poors | |
| Other Abbreviations: | ||
| ADR | American Depositary Receipt | |
| ETF | Exchange Traded Fund | |
| FHLMC | Federal Home Loan Mortgage Corp. | |
| FNMA | Federal National Mortgage Association | |
| GDR | Global Depositary Receipt | |
| GNMA | Government National Mortgage Association | |
| REIT | Real Estate Investment Trust | |
| SDR | Swedish Depositary Receipt | |
| SPDR | Standard & Poor's Depositary Receipt | |
The accompanying notes are an integral part of these financial statements.
| 13 |
| Hartford Global Research HLS Fund |
| Investment Valuation Hierarchy Level Summary |
| June 30, 2012 (Unaudited) |
| (000’s Omitted) |
| Total | Level 1 ♦ | Level 2 ♦ | Level 3 | |||||||||||||
| Assets: | ||||||||||||||||
| Common Stocks | ||||||||||||||||
| Automobiles & Components | $ | 1,641 | $ | 147 | $ | 1,494 | $ | — | ||||||||
| Banks | 6,176 | 2,955 | 3,221 | — | ||||||||||||
| Capital Goods | 4,988 | 3,728 | 1,260 | — | ||||||||||||
| Commercial & Professional Services | 108 | 81 | 27 | — | ||||||||||||
| Consumer Durables & Apparel | 1,036 | 311 | 725 | — | ||||||||||||
| Consumer Services | 283 | 149 | 134 | — | ||||||||||||
| Diversified Financials | 3,939 | 2,045 | 1,894 | — | ||||||||||||
| Energy | 9,323 | 6,171 | 3,152 | — | ||||||||||||
| Food & Staples Retailing | 1,846 | 1,144 | 702 | — | ||||||||||||
| Food, Beverage & Tobacco | 6,771 | 4,786 | 1,984 | 1 | ||||||||||||
| Health Care Equipment & Services | 2,469 | 2,239 | 230 | — | ||||||||||||
| Insurance | 2,552 | 1,465 | 1,087 | — | ||||||||||||
| Materials | 6,191 | 3,637 | 2,554 | — | ||||||||||||
| Media | 2,163 | 1,956 | 207 | — | ||||||||||||
| Pharmaceuticals, Biotechnology & Life Sciences | 5,847 | 4,575 | 1,272 | — | ||||||||||||
| Real Estate | 2,547 | 1,444 | 1,103 | — | ||||||||||||
| Retailing | 3,147 | 2,507 | 640 | — | ||||||||||||
| Semiconductors & Semiconductor Equipment | 1,510 | 790 | 720 | — | ||||||||||||
| Software & Services | 5,657 | 5,386 | 237 | 34 | ||||||||||||
| Technology Hardware & Equipment | 3,425 | 2,985 | 440 | — | ||||||||||||
| Telecommunication Services | 2,482 | 1,338 | 1,144 | — | ||||||||||||
| Transportation | 2,582 | 2,178 | 404 | — | ||||||||||||
| Utilities | 3,217 | 1,700 | 1,488 | 29 | ||||||||||||
| Total | 79,900 | 53,717 | 26,119 | 64 | ||||||||||||
| Corporate Bonds | 11 | — | 11 | — | ||||||||||||
| Exchange Traded Funds | 222 | 222 | — | — | ||||||||||||
| Preferred Stocks | 156 | — | 156 | — | ||||||||||||
| Short-Term Investments | 577 | — | 577 | — | ||||||||||||
| Total | $ | 80,866 | $ | 53,939 | $ | 26,863 | $ | 64 | ||||||||
| Foreign Currency Contracts* | 19 | — | 19 | — | ||||||||||||
| Total | $ | 19 | $ | — | $ | 19 | $ | — | ||||||||
| Liabilities: | ||||||||||||||||
| Foreign Currency Contracts* | — | — | — | — | ||||||||||||
| Total | $ | — | $ | — | $ | — | $ | — | ||||||||
| ♦ | For the six-month period ended June 30, 2012, investments valued at $245 were transferred from Level 1 to Level 2, and investments valued at $72 were transferred from Level 2 to Level 1. Investments are transferred between Level 1 and Level 2 for a variety of reasons including, but not limited to: |
| 1) | Foreign equities for which a fair value price is more representative of exit value than the local market close (transfer into Level 2). Foreign equities for which the local market close is more representative of exit value (transfer into Level 1). |
| 2) | U.S. Treasury securities that no longer represent the most recent issue (transfer into Level 2). |
| 3) | Equity investments with no observable trading but a bid or close price is used (transfer into Level 2). Equity investments using observable quoted prices in an active market (transfer into Level 1). |
| * | Derivative instruments not reflected in the Schedule of Investments are valued at the unrealized appreciation/depreciation on the investments. |
The accompanying notes are an integral part of these financial statements.
| 14 |
Following is a reconciliation of Level 3 assets for which significant unobservable inputs were used to determine fair value:
| Balance as of December 31, 2011 | Realized Gain (Loss) | Change in Unrealized Appreciation (Depreciation) | Net Amortization | Purchases | Sales | Transfers Into Level 3 * | Transfers Out of Level 3 * | Balance as of June 30, 2012 | ||||||||||||||||||||||||||||
| Assets: | ||||||||||||||||||||||||||||||||||||
| Common Stocks | $ | 40 | $ | 4 | $ | (43 | )† | $ | — | $ | 40 | $ | (9 | ) | $ | 32 | $ | — | $ | 64 | ||||||||||||||||
| Total | $ | 40 | $ | 4 | $ | (43 | ) | $ | — | $ | 40 | $ | (9 | ) | $ | 32 | $ | — | $ | 64 | ||||||||||||||||
| * | Investments are transferred into and out of Level 3 for a variety of reasons including, but not limited to: |
| 1) | Investments where trading has been halted (transfer into Level 3) or investments where trading has resumed (transfer out of Level 3). |
| 2) | Broker quoted investments (transfer into Level 3) or quoted prices in active markets (transfer out of Level 3). |
| 3) | Investments that have certain restrictions on trading (transfer into Level 3) or investments where trading restrictions have expired (transfer out of Level 3). |
| † | Change in unrealized appreciation (depreciation) in the current period relating to assets still held at June 30, 2012 was $(43). |
The accompanying notes are an integral part of these financial statements.
| 15 |
| Hartford Global Research HLS Fund |
| Statement of Assets and Liabilities |
| June 30, 2012 (Unaudited) |
| (000’s Omitted) |
| Assets: | ||||
| Investments in securities, at market value (cost $78,695) | $ | 80,866 | ||
| Cash | 3 | |||
| Unrealized appreciation on foreign currency contracts | 19 | |||
| Receivables: | ||||
| Investment securities sold | 1,168 | |||
| Fund shares sold | 22 | |||
| Dividends and interest | 171 | |||
| Other assets | 12 | |||
| Total assets | 82,261 | |||
| Liabilities: | ||||
| Unrealized depreciation on foreign currency contracts | — | |||
| Bank overdraft - foreign cash | 1 | |||
| Payables: | ||||
| Investment securities purchased | 707 | |||
| Fund shares redeemed | 111 | |||
| Investment management fees | 10 | |||
| Distribution fees | 1 | |||
| Accrued expenses | 29 | |||
| Total liabilities | 859 | |||
| Net assets | $ | 81,402 | ||
| Summary of Net Assets: | ||||
| Capital stock and paid-in-capital | $ | 94,802 | ||
| Undistributed net investment income | 1,479 | |||
| Accumulated net realized loss | (17,066 | ) | ||
| Unrealized appreciation of investments and the translations of assets and liabilities denominated in foreign currency | 2,187 | |||
| Net assets | $ | 81,402 | ||
| Shares authorized | 800,000 | |||
| Par value | $ | 0.001 | ||
| Class IA: Net asset value per share | $ | 9.71 | ||
| Shares outstanding | 5,618 | |||
| Net assets | $ | 54,529 | ||
| Class IB: Net asset value per share | $ | 9 .65 | ||
| Shares outstanding | 2,784 | |||
| Net assets | $ | 26,873 |
The accompanying notes are an integral part of these financial statements.
| 16 |
| Hartford Global Research HLS Fund |
| Statement of Operations |
| For the Six-Month Period Ended June 30, 2012 (Unaudited) |
| (000’s Omitted) |
| Investment Income: | ||||
| Dividends | $ | 1,197 | ||
| Interest | 2 | |||
| Less: Foreign tax withheld | (81 | ) | ||
| Total investment income, net | 1,118 | |||
| Expenses: | ||||
| Investment management fees | 375 | |||
| Distribution fees - Class IB | 34 | |||
| Custodian fees | 30 | |||
| Accounting services fees | 8 | |||
| Board of Directors' fees | 1 | |||
| Audit fees | 9 | |||
| Other expenses | 11 | |||
| Total expenses (before fees paid indirectly) | 468 | |||
| Commission recapture | (1 | ) | ||
| Total fees paid indirectly | (1 | ) | ||
| Total expenses, net | 467 | |||
| Net investment income | 651 | |||
| Net Realized Gain on Investments, Other Financial Instruments and Foreign Currency Transactions: | ||||
| Net realized gain on investments | 1,421 | |||
| Net realized gain on futures | 8 | |||
| Net realized loss on foreign currency contracts | (27 | ) | ||
| Net realized gain on other foreign currency transactions | 4 | |||
| Net Realized Gain on Investments, Other Financial Instruments and Foreign Currency Transactions | 1,406 | |||
| Net Changes in Unrealized Appreciation of Investments and Foreign Currency Transactions: | ||||
| Net unrealized appreciation of investments | 3,830 | |||
| Net unrealized appreciation of foreign currency contracts | 33 | |||
| Net unrealized depreciation on translation of other assets and liabilities in foreign currencies | (1 | ) | ||
| Net Changes in Unrealized Appreciation of Investments and Foreign Currency Transactions | 3,862 | |||
| Net Gain on Investments, Other Financial Instruments and Foreign Currency Transactions | 5,268 | |||
| Net Increase in Net Assets Resulting from Operations | $ | 5,919 |
The accompanying notes are an integral part of these financial statements.
| 17 |
| Hartford Global Research HLS Fund |
| Statement of Changes in Net Assets |
| (000’s Omitted) |
| For the Six-Month Period Ended June 30, 2012 (Unaudited) | For the Year Ended December 31, 2011 | |||||||
| Operations: | ||||||||
| Net investment income | $ | 651 | $ | 882 | ||||
| Net realized gain on investments, other financial instruments and foreign currency transactions | 1,406 | 8,126 | ||||||
| Net unrealized appreciation (depreciation) of investments and foreign currency transactions | 3,862 | (17,710 | ) | |||||
| Net Increase (Decrease) In Net Assets Resulting From Operations | 5,919 | (8,702 | ) | |||||
| Distributions to Shareholders: | ||||||||
| From net investment income | ||||||||
| Class IA | — | (9 | ) | |||||
| Class IB | — | (4 | ) | |||||
| Total distributions | — | (13 | ) | |||||
| Capital Share Transactions: | ||||||||
| Class IA | ||||||||
| Sold | 6,508 | 15,571 | ||||||
| Issued on reinvestment of distributions | — | 9 | ||||||
| Redeemed | (8,773 | ) | (26,693 | ) | ||||
| Total capital share transactions | (2,265 | ) | (11,113 | ) | ||||
| Class IB | ||||||||
| Sold | 4,409 | 6,048 | ||||||
| Issued on reinvestment of distributions | — | 4 | ||||||
| Redeemed | (5,176 | ) | (13,223 | ) | ||||
| Total capital share transactions | (767 | ) | (7,171 | ) | ||||
| Net decrease from capital share transactions | (3,032 | ) | (18,284 | ) | ||||
| Net Increase (Decrease) In Net Assets | 2,887 | (26,999 | ) | |||||
| Net Assets: | ||||||||
| Beginning of period | 78,515 | 105,514 | ||||||
| End of period | $ | 81,402 | $ | 78,515 | ||||
| Undistributed (distribution in excess of) | ||||||||
| net investment income | $ | 1,479 | $ | 828 | ||||
| Shares: | ||||||||
| Class IA | ||||||||
| Sold | 654 | 1,546 | ||||||
| Issued on reinvestment of distributions | — | 1 | ||||||
| Redeemed | (887 | ) | (2,710 | ) | ||||
| Total share activity | (233 | ) | (1,163 | ) | ||||
| Class IB | ||||||||
| Sold | 447 | 600 | ||||||
| Issued on reinvestment of distributions | — | 1 | ||||||
| Redeemed | (530 | ) | (1,338 | ) | ||||
| Total share activity | (83 | ) | (737 | ) | ||||
The accompanying notes are an integral part of these financial statements.
| 18 |
| Hartford Global Research HLS Fund |
| Notes to Financial Statements |
| June 30, 2012 (Unaudited) |
| (000’s Omitted) |
| 1. | Organization: |
Hartford Global Research HLS Fund (the “Fund”) serves as an underlying investment option for certain variable annuity and variable life insurance separate accounts of Hartford Life Insurance Company (“HLIC”) and its affiliates and certain qualified retirement plans. The Fund may also serve as an underlying investment option for certain variable annuity and variable life separate accounts of other insurance companies. Owners of variable annuity contracts and policyholders of variable life insurance contracts may choose the funds permitted in the variable insurance contract prospectus. In addition, participants in certain qualified retirement plans may choose the Fund if permitted by their plans.
Hartford Series Fund, Inc. (the “Company”) is an open-end registered management investment company comprised of thirty portfolios. Financial Statements for the Fund, a series of the Company, are included in this report.
The Company is organized under the laws of the State of Maryland and is registered with the Securities and Exchange Commission (“SEC”) under the Investment Company Act of 1940, as amended (“1940 Act”). The Fund is a diversified open-end management investment company.
The Fund is divided into Class IA and Class IB shares. Each class is offered at the per share net asset value (“NAV”) without a sales charge and is subject to the same expenses, except that the Class IB shares are subject to distribution and service fees charged pursuant to a Distribution Plan adopted in accordance with Rule 12b-1 under the 1940 Act.
| 2. | Significant Accounting Policies: |
The following is a summary of significant accounting policies of the Fund in the preparation of its financial statements, which are in accordance with the United States Generally Accepted Accounting Principles (“U.S. GAAP”). The preparation of financial statements in accordance with U.S. GAAP may require management to make estimates and assumptions that affect the reported amounts of assets and liabilities and disclosure of contingent assets and liabilities at the date of the financial statements and the reported amounts of increases and decreases in net assets from operations during the reporting period. Actual results could differ from those estimates.
| a) | Determination of Net Asset Value – The NAV of each class of the Fund’s shares is determined as of the close of regular trading (normally 4:00 p.m. Eastern Time) (the “NYSE Close”) on each day that the New York Stock Exchange (the “Exchange”) is open (“Valuation Date”). Information that becomes known to the Fund after the NAV has been calculated on a particular day will not generally be used to retroactively adjust the NAV determined earlier that day. |
| b) | Investment Valuation and Fair Value Measurements – For purposes of calculating the NAV, portfolio investments and other assets held by the Fund's portfolio for which market quotes are readily available are valued at market value. Market value is generally determined on the basis of last reported sales prices or official close price. If no sales are reported, market value is based on quotes obtained from a quotation reporting system, established market makers, or independent pricing services. If market prices are not readily available or are deemed unreliable, the Fund will use the fair value of the investment as determined in good faith under policies and procedures established by and under the supervision of the Company’s Board of Directors. Market quotes are considered not readily available where there is an absence of current or reliable market-based data (e.g., trade information or broker quotes), including where events occur after the close of the relevant market, but prior to the NYSE Close that materially affect the values of the Fund’s portfolio investments or assets. In addition, market quotes are considered not readily available when, due to extraordinary circumstances, the exchanges or markets on which the investments trade do not open for trading for the entire day and no other market prices are available. In addition, prices of foreign equities that are principally traded on certain foreign markets are adjusted daily pursuant to a fair value pricing service approved by the Board of Directors in order to reflect an adjustment for the factors occurring after the close of certain foreign markets but before the NYSE Close. Investments |
| 19 |
| Hartford Global Research HLS Fund |
| Notes to Financial Statements – (continued) |
| June 30, 2012 (Unaudited) |
| (000’s Omitted) |
that are primarily traded on foreign markets may trade on days that are not business days of the Fund. The value of the foreign investments in which the Fund invests may change on days when a shareholder will not be able to purchase or redeem shares of the Fund. Fair value pricing is subjective in nature and the use of fair value pricing by the Fund may cause the NAV of its shares to differ significantly from the NAV that would have been calculated using market prices at the close of the exchange on which a portfolio investment is primarily traded. There can be no assurance that the Fund could obtain the fair market value assigned to an investment if the Fund were to sell the investment at approximately the time at which the Fund determines its NAV.
Fixed income investments (other than short term obligations) and non-exchange traded derivatives held by the Fund are normally valued on the basis of quotes obtained from brokers and dealers or independent pricing services in accordance with procedures established by the Company’s Board of Directors. Prices obtained from independent pricing services use information provided by market makers or estimates of market values obtained from yield data relating to investments with similar characteristics. Generally, the Fund may use fair valuation in regard to fixed income investments when the Fund holds defaulted or distressed investments or investments in a company in which a reorganization is pending. Short-term investments maturing in 60 days or less are generally valued at amortized cost, if their original term to maturity was 60 days or less, or by amortizing their value on the 61st day prior to maturity, if the original term to maturity exceeded 60 days.
Exchange traded options, futures and options on futures are valued at the settlement price determined by the relevant exchange as of the NYSE Close. If such instruments do not trade on an exchange, values may be supplied by an independent pricing service using a formula or other objective method that may take into consideration the style, direction, expiration, strike price, notional value and volatility or other adjustments.
Investments valued in currencies other than U.S. dollars are converted to U.S. dollars using exchange rates obtained from independent pricing services for calculation of the NAV. As a result, the NAV of the Fund’s shares may be affected by changes in the value of currencies in relation to the U.S. dollar. The value of investments traded in markets outside the United States or denominated in currencies other than the U.S. dollar may be affected significantly on a day that the NYSE is closed and the market value may change on days when an investor is not able to purchase, redeem or exchange shares of the Fund.
Foreign currency contracts represent agreements to exchange currencies on specific future dates at predetermined rates. Foreign currency contracts are valued using foreign currency exchange rates and forward rates as provided by an independent pricing service on the Valuation Date.
Investments in open-end mutual funds are valued at the respective NAV of each open-end mutual fund on the Valuation Date.
Financial instruments for which prices are not available from an independent pricing service may be valued using market quotations obtained from one or more dealers that make markets in the respective financial instrument in accordance with procedures established by the Company’s Board of Directors.
U.S. GAAP defines fair value as the price that the Fund would receive to sell an asset or pay to transfer a liability in an orderly transaction between market participants. The U.S. GAAP fair value measurement standards require disclosure of a fair value hierarchy for each major category of assets and liabilities. Various inputs are used in determining the fair value of the Fund’s investments. These inputs are summarized into three broad hierarchy levels. This hierarchy is based on whether the valuation inputs are observable or unobservable. These levels are:
| · | Level 1 – Quoted prices in active markets for identical investments. Level 1 may include exchange traded instruments, such as domestic equities, some foreign equities, options, futures, mutual funds, exchange traded funds, rights and warrants. |
| 20 |
| · | Level 2 – Observable inputs other than Level 1 prices, such as quoted prices for similar investments; quoted prices in markets that are not active; or other inputs that are observable or can be corroborated by observable market data. Level 2 may include debt investments that are traded less frequently than exchange traded instruments and which are valued using independent pricing services; foreign equities, which are principally traded on certain foreign markets and are adjusted daily pursuant to a fair value pricing service in order to reflect an adjustment for the factors occurring after the close of certain foreign markets but before the NYSE Close; and short-term investments, which are valued at amortized cost. |
| · | Level 3 – Significant unobservable inputs that are supported by limited or no market activity. Level 3 may include financial instruments whose values are determined using indicative market quotes or require significant management judgment or estimation. These unobservable valuation inputs may include estimates for current yields, maturity/duration, prepayment speed, and indicative market quotes for comparable investments along with other assumptions relating to credit quality, collateral value, complexity of the investment structure, general market conditions and liquidity. This category may include investments where trading has been halted or there are certain restrictions on trading. While these investments are priced using unobservable inputs, the valuation of these investments reflects the best available data and management believes the prices are a reasonable representation of exit price. |
The Board of Directors of the Company generally reviews and approves the “Procedures for Valuation of Portfolio Securities” on an annual basis. These procedures define how investments are to be valued, including the formation of a Valuation Committee. The Valuation Committee is responsible for determining in good faith the fair value of investments when the value cannot be obtained from primary pricing services or alternative sources or if the valuation of an investment as provided by the primary pricing service or alternative source is believed not to reflect the investment’s fair value as of the Valuation Date. Members of the Valuation Committee include the Fund’s Treasurer or designee, a Vice President of the Funds with legal expertise or designee, and a Vice President of the investment manager or designee. In addition, the Fund’s chief compliance officer shall designate a member of the compliance group to attend Valuation Committee meetings as a non-voting resource, to monitor for and provide guidance with respect to compliance with these procedures. Two members of the Valuation Committee or their designees, representing different departments, shall constitute a quorum for purposes of permitting the Valuation Committee to take action. The Valuation Committee will consider all relevant factors in determining an investment’s fair value, and may seek the advice of the Fund’s sub-adviser, knowledgeable brokers and legal counsel in making such determination. The Valuation Committee reports to the Audit Committee of the Company’s Board of Directors. The Audit Committee receives quarterly written reports which include details of all fair-valued investments, including the reason for the fair valuation, and an indication, when possible, of the accuracy of the valuation by disclosing the next available reliable public price quotation or the disposition price of such investments (the “look-back” test). The Board of Directors then must consider for ratification all of the fair value determinations made during the previous quarter.
Valuation levels are not necessarily indicative of the risk associated with investing in such investments. Individual investments within any of the above mentioned asset classes may be assigned a different hierarchical level than those presented above, as individual circumstances dictate.
For additional information, refer to the Investment Valuation Hierarchy Level Summary and the Level 3 roll-forward reconciliation which follow the Schedule of Investments.
For purposes of reporting transfers between different hierarchy levels, both transfers in and out of each level, as applicable, are shown as if they occurred at the beginning of the period.
| c) | Investment Transactions and Investment Income – Investment transactions are recorded as of the trade date (the date the order to buy or sell is executed) for financial reporting purposes. Investments purchased or sold on a when-issued or |
| 21 |
| Hartford Global Research HLS Fund |
| Notes to Financial Statements – (continued) |
| June 30, 2012 (Unaudited) |
| (000’s Omitted) |
delayed-delivery basis may be settled a month or more after the trade date. Realized gains and losses are determined on the basis of identified cost.
Dividend income is accrued as of the ex-dividend date, except certain dividends from foreign investments where the ex-dividend date may have passed are recorded as soon as the Fund is informed of the dividend. Interest income, including amortization of premium and accretion of discounts, is accrued on a daily basis.
| d) | Foreign Currency Transactions – Assets and liabilities denominated in currencies other than U.S. dollars are translated into U.S. dollars at the exchange rates in effect on the valuation date. Purchases and sales of investments, income, and expenses are translated into U.S. dollars at the exchange rates on the dates of such transactions. |
The Fund does not isolate that portion of portfolio investment valuation resulting from fluctuations in the foreign currency exchange rates from the fluctuations arising from changes in the market prices of investments held. Exchange rate fluctuations are included with the net realized and unrealized gain or loss on investments in the accompanying financial statements.
Net realized foreign exchange gains or losses arise from sales of foreign currencies and the difference between asset and liability amounts initially stated in foreign currencies and the U.S. dollar value of the amounts actually received or paid.
Net unrealized foreign exchange gains or losses arise from changes in the value of other assets and liabilities at the end of the reporting period, resulting from changes in the exchange rates.
| e) | Joint Trading Account – The Fund may invest cash balances into a joint trading account that may be invested in one or more repurchase agreements. |
| f) | Fund Share Valuation and Dividend Distributions to Shareholders – Orders for the Fund’s shares are executed in accordance with the investment instructions of the contract holders and plan participants. The NAV of the Fund’s shares is determined as of the close of business on each business day of the Exchange. The NAV is determined separately for each class of shares of the Fund by dividing the Fund’s net assets attributable to that class by the number of shares of the class outstanding. Each class of shares offered by the Fund has equal rights as to assets and voting privileges (except that shareholders of a class have exclusive voting rights regarding any matter relating solely to that class of shares). Income and non-class specific expenses are allocated daily to each class on the basis of the relative net assets of the class. Realized and unrealized capital gains and losses are allocated daily based on the relative net assets of each class of shares of the Fund. |
Orders for the purchase of the Fund’s shares received prior to the close of the Exchange on any day the Exchange is open for business are priced at the NAV determined as of the close of the Exchange. Orders received after the close of the Exchange, or on a day on which the Exchange and/or the Fund is not open for business, are priced at the next determined NAV.
Dividends are declared pursuant to a policy adopted by the Company’s Board of Directors based upon the investment performance of the Fund. The policy of the Fund is to pay dividends from net investment income and realized capital gains, if any, at least once a year.
Distributions from net investment income, net realized capital gains and capital are determined in accordance with federal income tax regulations, which may differ from U.S. GAAP with respect to character and timing. These differences may include but are not limited to losses deferred due to wash sale adjustments, foreign currency gains and losses, adjustments related to Passive Foreign Investment Companies (“PFICs”), Real Estate Investment Trusts (“REITs”), Regulated Investment Companies (“RICs”), certain derivatives and partnerships. Permanent book and federal income tax basis differences relating to shareholder distributions will result in reclassifications to certain of the Fund’s capital accounts (see Federal Income Taxes: Reclassification of Capital Accounts note).
| 22 |
| 3. | Securities and Other Investments: |
| a) | Repurchase Agreements – A repurchase agreement is an agreement by which a counterparty agrees to sell an investment and agrees to repurchase the investment sold at a mutually agreed upon time and price. At the time the Fund enters into a repurchase agreement, the value of the underlying collateral, including accrued interest, will be equal to or exceed the value of the repurchase agreement. Repurchase agreements expose the Fund to counterparty risk. To minimize counterparty risk, the investments that serve to collateralize the repurchase agreement are held by the Fund’s custodian in book entry or physical form in the custodial account of the Fund or in a third party custodial account. Repurchase agreements are valued at cost plus accrued interest. The Fund, as shown on the Schedule of Investments, had outstanding repurchase agreements as of June 30, 2012. |
| b) | Illiquid and Restricted Investments – The Fund is permitted to invest up to 15% of its net assets in illiquid investments. Illiquid investments are those that may not be sold or disposed of in the ordinary course of business within seven days, at approximately the price used to determine the Fund’s NAV. The Fund may not be able to sell illiquid investments when its sub-adviser considers it desirable to do so or may have to sell such investments at a price that is lower than the price that could be obtained if the investments were more liquid. A sale of illiquid investments may require more time and may result in higher dealer discounts and other selling expenses than does the sale of those that are liquid. Illiquid investments also may be more difficult to value due to the unavailability of reliable market quotations for such investments, and an investment in them may have an adverse impact on the Fund’s NAV. The Fund may also purchase certain restricted investments that can only be resold to certain qualified investors and may be determined to be liquid pursuant to policies and guidelines established by the Company’s Board of Directors. The Fund, as shown on the Schedule of Investments, had illiquid and/or restricted investments as of June 30, 2012. |
| c) | Investments Purchased on a When-Issued or Delayed-Delivery Basis – Delivery and payment for investments that have been purchased by the Fund on a forward commitment, or when-issued or delayed-delivery basis, take place beyond the customary settlement period. A fund may dispose of or renegotiate a delayed-delivery transaction after it is entered into, and may sell delayed-delivery investments before they are delivered, which may result in a realized gain or loss. During this period, such investments are subject to market fluctuations, and the Fund identifies investments segregated in its records with a value at least equal to the amount of the commitment. As of June 30, 2012, the Fund had no outstanding when-issued or delayed delivery investments. |
| 4. | Financial Derivative Instruments: |
The following disclosures contain information on how and why the Fund uses derivative instruments, the credit-risk-related contingent features in certain derivative instruments, and how derivative instruments affect the Fund’s financial position and results of operations. The location and fair value amounts of these instruments on the Statement of Assets and Liabilities and the realized gains and losses and changes in unrealized gains and losses on the Statement of Operations, each categorized by type of derivative contract, are included in the following Additional Derivative Instrument Information footnote. The derivative instruments outstanding as of period-end are disclosed in the notes to the Schedule of Investments and the amounts of realized gains and losses and changes in unrealized gains and losses on derivative instruments during the period are disclosed in the Statement of Operations.
| a) | Foreign Currency Contracts – The Fund may enter into foreign currency contracts that obligate the Fund to purchase or sell currencies at specified future dates. Foreign currency contracts are used to hedge the currency exposure associated with some or all of the Fund’s investments and/or as part of an investment strategy. Foreign currency contracts are marked to market daily and the change in value is recorded by the Fund as an unrealized gain or loss. The Fund will record a realized gain or loss when the foreign currency contract is settled. |
Foreign currency contracts involve elements of market risk in excess of the amounts reflected in the Statement of Assets and Liabilities. In addition, risks may arise upon entering into these contracts from the potential inability of the
| 23 |
| Hartford Global Research HLS Fund |
| Notes to Financial Statements – (continued) |
| June 30, 2012 (Unaudited) |
| (000’s Omitted) |
counterparties to meet the terms of the contracts and from unanticipated movements in the value of the foreign currencies relative to the U.S. dollar. The Fund had outstanding foreign currency contracts as shown on the Schedule of Investments as of June 30, 2012.
| b) | Futures Contracts – The Fund may enter into futures contracts. A futures contract is an agreement between two parties to buy or sell an asset at a set price on a future date. The Fund uses futures contracts to manage or obtain exposure to the investment markets, commodities, or movements in interest rates and currency values. The primary risks associated with the use of futures contracts are the imperfect correlation between the change in market value of the investments held by the Fund and the prices of futures contracts and the possibility of an illiquid market. Upon entering into a futures contract, the Fund is required to deposit with a futures commission merchant (“FCM”) an amount of cash or U.S. Government or Agency Obligations in accordance with the initial margin requirements of the broker or exchange. Futures contracts are marked to market daily at the most recent settlement price reported by an exchange on which, over time, they are traded most extensively, and an appropriate payable or receivable for the change in value (“variation margin”) is recorded by the Fund. Gains or losses are recognized but not considered realized until the contracts expire or are closed. Futures contracts involve, to varying degrees, risk of loss in excess of the variation margin disclosed on the Statement of Assets and Liabilities; however, this risk is reduced through the use of an FCM. As of June 30, 2012, the Fund had no outstanding futures contracts. |
| c) | Additional Derivative Instrument Information: |
Fair Values of Derivative Instruments on the Statement of Assets and Liabilities as of June 30, 2012:
| Risk Exposure Category | ||||||||||||||||||||||||||||
| Interest Rate Contracts | Foreign Exchange Contracts | Credit Contracts | Equity Contracts | Commodity Contracts | Other Contracts | Total | ||||||||||||||||||||||
| Assets: | ||||||||||||||||||||||||||||
| Unrealized appreciation on foreign currency contracts | $ | — | $ | 19 | $ | — | $ | — | $ | — | $ | — | $ | 19 | ||||||||||||||
| Total | $ | — | $ | 19 | $ | — | $ | — | $ | — | $ | — | $ | 19 | ||||||||||||||
| Liabilities: | ||||||||||||||||||||||||||||
| Unrealized depreciation on foreign currency contracts | $ | — | $ | — | $ | — | $ | — | $ | — | $ | — | $ | — | ||||||||||||||
| Total | $ | — | $ | — | $ | — | $ | — | $ | — | $ | — | $ | — | ||||||||||||||
The volume of derivatives that is presented in the Schedule of Investments is consistent with the derivative activity during the six-month period ended June 30, 2012
The effect of Derivative Instruments on the Statement of Operations for the six-month period ended June 30, 2012:
| Risk Exposure Category | ||||||||||||||||||||||||||||
| Interest Rate Contracts | Foreign Exchange Contracts | Credit Contracts | Equity Contracts | Commodity Contracts | Other Contracts | Total | ||||||||||||||||||||||
| Realized Gain (Loss) on Derivatives Recognized as a Result of Operations: | ||||||||||||||||||||||||||||
| Net realized gain on futures | $ | — | $ | — | $ | — | $ | 8 | $ | — | $ | — | $ | 8 | ||||||||||||||
| Net realized loss on foreign currency contracts | — | (27 | ) | — | — | — | — | (27 | ) | |||||||||||||||||||
| Total | $ | — | $ | (27 | ) | $ | — | $ | 8 | $ | — | $ | — | $ | (19 | ) | ||||||||||||
| Net Change in Unrealized Appreciation (Depreciation) on Derivatives Recognized as a Result of Operations: | ||||||||||||||||||||||||||||
| Net change in unrealized appreciation of foreign currency contracts | $ | — | $ | 33 | $ | — | $ | — | $ | — | $ | — | $ | 33 | ||||||||||||||
| Total | $ | — | $ | 33 | $ | — | $ | — | $ | — | $ | — | $ | 33 | ||||||||||||||
| 24 |
| 5. | Principal Risks: |
| a) | Counterparty Risk – The Fund may be exposed to counterparty risk, or the risk that an institution or other entity with which the Fund has unsettled or open transactions will default. |
| b) | Market Risks – If the Fund invests directly in foreign currencies or in securities that trade in, and receive revenues in, foreign currencies, or in derivatives that provide exposure to foreign currencies, it will be subject to the risk that those currencies will decline in value relative to the base currency of the Fund, or, in the case of hedging positions, that the Fund’s base currency will decline in value relative to the currency being hedged. Currency rates in foreign countries may fluctuate significantly over short periods of time for a number of reasons, including changes in interest rates, intervention (or the failure to intervene) by U.S. or foreign governments, central banks or supranational entities, such as the International Monetary Fund, or by the imposition of currency controls or other political developments in the United States or abroad. As a result, the Fund’s investments in foreign currency denominated securities may reduce the returns of the Fund. The market values of equity securities, such as common stocks and preferred stocks, or equity related investments, such as futures and options, may decline due to general market conditions which are not specifically related to a particular company, such as real or perceived adverse economic conditions, changes in the general outlook for corporate earnings, changes in interest or currency rates or adverse investor sentiment generally. The market value of equity securities may also decline due to factors which affect a particular industry or industries, such as labor shortages or increased production costs and competitive conditions within an industry. Equity securities and equity related investments generally have greater market price volatility than fixed income securities. |
| 6. | Federal Income Taxes: |
| a) | Federal Income Taxes – For federal income tax purposes, the Fund intends to continue to qualify as a RIC under Subchapter M of the Internal Revenue Code (“IRC”) by distributing substantially all of its taxable net investment income and net realized capital gains to its shareholders and otherwise complying with the requirements of RICs. The Fund has distributed substantially all of its income and capital gains in prior years, if applicable, and intends to distribute substantially all of its income and capital gains prior to the next fiscal year-end. Accordingly, no provision for federal income or excise taxes has been made in the accompanying financial statements. Distributions from short-term capital gains are treated as ordinary income distributions for federal income tax purposes. |
| b) | Net Investment Income (Loss), Net Realized Gains (Losses) – Net investment income (loss) and net realized gains (losses) may differ for financial statement and tax purposes primarily because of losses deferred due to wash sale adjustments, foreign currency gains and losses, adjustments related to PFICs, REITs, RICs, certain derivatives and partnerships. The character of distributions made during the year from net investment income or net realized gains may differ from their ultimate characterization for federal income tax purposes. Also, due to the timing of dividend distributions, the fiscal year in which amounts are distributed may differ from the year that the income or realized gains (losses) were recorded by the Fund. |
| c) | Distributions and Components of Distributable Earnings – The tax character of distributions paid by the Fund for the periods indicated is as follows (as adjusted for dividends payable): |
| For the Year Ended December 31, 2011 | For the Year Ended December 31, 2010 | |||||||
| Ordinary Income | $ | 13 | $ | 1,100 | ||||
| 25 |
Hartford Global Research HLS Fund
Notes to Financial Statements – (continued)
June 30, 2012 (Unaudited)
(000’s Omitted)
As of December 31, 2011, the Fund’s components of distributable earnings (deficit) on a tax basis were as follows:
| Amount | ||||
| Undistributed Ordinary Income | $ | 831 | ||
| Accumulated Capital and Other Losses* | (16,957 | ) | ||
| Unrealized Depreciation† | (3,193 | ) | ||
| Total Accumulated Deficit | $ | (19,319 | ) | |
| * | The Fund has capital loss carryforwards that are identified in the Capital Loss Carryforward note that follows. |
| † | The difference between book-basis and tax-basis unrealized appreciation (depreciation) may be attributable to the losses deferred due to wash sale adjustments, foreign currency gains and losses, adjustments related to PFICs, REITs, RICs, certain derivatives and partnerships. |
| d) | Reclassification of Capital Accounts – The Fund may record reclassifications in its capital accounts. These reclassifications have no impact on the total net assets of the Fund. The reclassifications are a result of permanent differences between U.S. GAAP and tax accounting for such items as foreign currency, PFICs, expiration or utilization of capital loss carryforwards or net operating losses. Adjustments are made to reflect the impact these items have on current and future distributions to shareholders. Therefore, the source of the Fund’s distributions may be shown in the accompanying Statement of Changes in Net Assets as from undistributed net investment income, from accumulated net realized gains on investments or from capital depending on the type of book and tax differences that exist. For the year ended December 31, 2011, the Fund recorded reclassifications to increase (decrease) the accounts listed below: |
| Amount | ||||
| Undistributed Net Investment Income | $ | (88 | ) | |
| Accumulated Net Realized Gain (Loss) | 88 | |||
| e) | Capital Loss Carryforward – On December 22, 2010, the Regulated Investment Company Modernization Act of 2010 (the “Act”) was enacted, which made changes to the capital loss carryforward rules. The changes are effective for taxable years beginning after the date of enactment. Under the Act, funds are permitted to carry forward capital losses for an unlimited period. However, any losses incurred during those future taxable years will be required to be utilized prior to the losses incurred in pre-enactment taxable years, which carry an expiration date. As a result of this ordering rule, pre-enactment capital loss carryforwards may be more likely to expire unused. Additionally, post-enactment capital loss carryforwards retain their character as either short-term or long-term capital losses rather than being considered all short-term as permitted under prior regulation. |
At December 31, 2011 (tax-year-end), the Fund had capital loss carryforwards for U.S. federal income tax purposes as follows:
| Year of Expiration | Amount | |||
| 2017 | $ | 16,957 | ||
| Total | $ | 16,957 | ||
During the year ended December 31, 2011, the Fund utilized $7,201 of prior year capital loss carryforwards.
| f) | Accounting for Uncertainty in Income Taxes – The Fund has adopted financial reporting rules that require the Fund to analyze all open tax years, as defined by the statute of limitations, for all major jurisdictions. Generally, tax authorities can examine all tax returns filed for the last three years. The Fund does not have an examination in progress. |
| 26 |
The Fund has reviewed all open tax years and major jurisdictions and concluded that these financial reporting rules had no effect on the Fund’s financial position or results of operations. There is no tax liability resulting from unrecognized tax benefits relating to uncertain income tax positions taken or expected to be taken on the tax return for the fiscal year ended December 31, 2011. The Fund is also not aware of any tax positions for which it is reasonably possible that the total amounts of unrecognized tax benefits will significantly change in the next twelve months.
| 7. | Expenses: |
| a) | Investment Management Agreement – HL Investment Advisors, LLC (“HL Advisors”), an indirect wholly owned subsidiary of The Hartford Financial Services Group, Inc. (“The Hartford”), serves as investment manager to the Fund pursuant to an Investment Management Agreement with the Company. As investment manager, HL Advisors has overall investment supervisory responsibility for the Fund. In addition, HL Advisors provides administrative personnel, services, equipment, facilities and office space for proper operation of the Fund. HL Advisors has contracted with Wellington Management Company, LLP (“Wellington Management”) under a sub-advisory agreement for the provision of day-to-day investment management services to the Fund in accordance with the Fund’s investment objective and policies. The Fund pays a fee to HL Advisors, a portion of which may be used to compensate Wellington Management. |
The schedule below reflects the rates of compensation paid to HL Advisors for investment management services rendered as of June 30, 2012; the rates are accrued daily and paid monthly.
| Average Daily Net Assets | Annual Fee | |||
| On first $500 million | 0.9000 | % | ||
| On next $500 million | 0.8750 | % | ||
| On next $4 billion | 0.8500 | % | ||
| On next $5 billion | 0.8475 | % | ||
| Over $10 billion | 0.8450 | % | ||
| b) | Accounting Services Agreement – Pursuant to the Fund Accounting Agreement between HLIC and the Company, on behalf of the Fund, HLIC provides accounting services to the Fund and receives monthly compensation based on the Fund’s average daily net assets at the rates set forth below. The Fund’s accounting services fees are accrued daily and paid monthly. |
| Average Daily Net Assets | Annual Fee | |||
| On first $5 billion | 0.018 | % | ||
| On next $5 billion | 0.016 | % | ||
| Over $10 billion | 0.014 | % | ||
| c) | Operating Expenses – Allocable expenses incurred by the Company are allocated to each Fund and allocated to classes within a Fund in proportion to the average daily net assets of the Fund and each class, except where allocation of certain expenses is more fairly made directly to the Fund or to specific classes within a Fund. |
| d) | Fees Paid Indirectly – The Company, on behalf of the Fund, has entered into agreements with State Street Global Markets, LLC and Russell Implementation Services, Inc. to partially recapture non-discounted trade commissions. Such rebates are used to pay a portion of the Fund’s expenses. In addition, the Fund’s custodian bank has also agreed to reduce its fees when the Fund maintains cash on deposit in a non-interest-bearing custody account. For the six-month period ended June 30, 2012, these amounts, if any, are included in the Statement of Operations. |
| 27 |
Hartford Global Research HLS Fund
Notes to Financial Statements – (continued)
June 30, 2012 (Unaudited)
(000’s Omitted)
The ratio of expenses to average net assets in the accompanying financial highlights excludes the reduction in expenses related to fees paid indirectly. The annualized expense ratio for the period listed below reflecting the reduction for fees paid indirectly is as follows:
| Annualized Six- Month Period Ended June 30, 2012 | ||||
| Class IA | 1.04 | % | ||
| Class IB | 1.29 | % | ||
| e) | Distribution Plan for Class IB shares – The Company, on behalf of the Fund, has adopted a Distribution Plan pursuant to Rule 12b-1 of the 1940 Act to compensate the Distributor, Hartford Securities Distribution Company, Inc. (a wholly owned, ultimate subsidiary of The Hartford), from assets attributable to the Class IB shares for services rendered and expenses borne in connection with activities primarily intended to result in the sale of the Class IB shares, subject to the review and approval of the Company’s Board of Directors. |
The Distribution Plan provides that the Fund may pay annually up to 0.25% of the average daily net assets of the Fund attributable to its Class IB shares for activities primarily intended to result in the sale of Class IB shares. The Board has the authority to suspend or reduce these payments at any point in time. Under the terms of the Distribution Plan and the principal underwriting agreement, the Fund is authorized to make payments monthly to the Distributor that may be used to pay or compensate entities providing distribution and shareholder servicing with respect to the Class IB shares for such entities’ fees or expenses incurred or paid in that regard. These fees are accrued daily and paid monthly.
| f) | Other Related Party Transactions – Certain officers of the Fund are directors and/or officers of HL Advisors and/or The Hartford or its subsidiaries. For the six-month period ended June 30, 2012, a portion of the Fund’s chief compliance officer’s salary was paid by all the investment companies in the Hartford fund complex. The portion allocated to the Fund rounds to zero. These fees are accrued daily and paid monthly. |
| g) | Payment from Affiliate – In July of 2007, The Hartford entered into a settlement with the Attorneys General of the states of New York, Connecticut and Illinois relating to market timing and the company's individual variable annuity contracts in which certain payments would be made directly to the variable annuity contract holders. The distribution plan provided that unclaimed money from the settlement would be distributed to certain HLS Funds that are investment options through a Hartford individual variable annuity contract. The unclaimed money was distributed to the Fund on September 18, 2009. |
The total return in the accompanying financial highlights includes a payment from an affiliate. Had the payment from the affiliate been excluded, the impact and total return for the period listed below would have been as follows:
| For the Year Ended December 31, 2009 | ||||||||
| Class IA | Class IB | |||||||
| Impact from Payment from Affiliate for Attorneys General Settlement | 0.02% | 0.02% | ||||||
| Total Return Excluding Payment from Affiliate | 42.10% | 41.76% | ||||||
| 28 |
| 8. | Investment Transactions: |
For the six-month period ended June 30, 2012, the Fund's aggregate purchases and sales of investment securities (excluding short-term investments) were as follows:
| Amount | ||||
| Cost of Purchases Excluding U.S. Government Obligations | $ | 39,440 | ||
| Sales Proceeds Excluding U.S. Government Obligations | 42,228 | |||
| 9. | Line of Credit: |
The Fund is one of several Hartford funds that participate in a $500 million committed revolving line of credit facility. The facility is to be used for temporary or emergency purposes. Under the arrangement, the funds are required to own securities having a market value in excess of 300% of the total bank borrowings. The interest rate on borrowings varies depending on the nature of the loan. The facility also requires a fee to be paid based on the amount of the commitment. This commitment fee is allocated to all of the funds participating in the line of credit based on the average net assets of the funds. During the six-month period ended June 30, 2012, the Fund did not have any borrowings under this facility.
| 10. | Industry Classifications: |
Other than the industry classifications “Other Investment Pools and Funds” and “Exchange Traded Funds,” equity industry classifications used in this report are the Global Industry Classification Standard, which was developed by and is the exclusive property and service mark of MSCI, Inc. and Standard & Poor’s.
| 11. | Indemnifications: |
Under the Company’s organizational documents, the Company shall indemnify its officers and directors to the full extent required or permitted under Maryland General Corporation Law and the federal securities laws. In addition, the Company, on behalf of the Fund, may enter into contracts that contain a variety of indemnifications. The Company’s maximum exposure under these arrangements is unknown. However, as of the date of these financial statements, the Company has not had prior claims or losses pursuant to these contracts and expects the risk of loss to be remote.
| 29 |
Hartford Global Research HLS Fund
Financial Highlights
| - Selected Per-Share Data (A) - |
| Class | Net Asset Value at Beginning of Period | Net Investment Income (Loss) | Payments from (to) Affiliate | Net Realized and Unrealized Gain (Loss) on Investments | Total from Investment Operations | Dividends from Net Investment Income | Distributions from Realized Capital Gains | Distributions from Capital | Total Distributions | Net Increase |(Decrease) in Net Asset Value | Net Asset Value at End of Period | |||||||||||||||||||||||||||||||||
| For the Six-Month Period Ended June 30, 2012 (Unaudited) | ||||||||||||||||||||||||||||||||||||||||||||
| IA | $ | 9.02 | $ | 0.09 | $ | — | $ | 0.60 | $ | 0.69 | $ | — | $ | — | $ | — | $ | — | $ | 0.69 | $ | 9.71 | ||||||||||||||||||||||
| IB | 8.98 | 0.07 | — | 0.60 | 0.67 | — | — | — | — | 0 .67 | 9.65 | |||||||||||||||||||||||||||||||||
| For the Year Ended December 31, 2011 | ||||||||||||||||||||||||||||||||||||||||||||
| IA | 9.94 | 0.11 | — | (1.03) | (0.92) | — | — | — | — | (0.92) | 9.02 | |||||||||||||||||||||||||||||||||
| IB | 9.93 | 0.09 | — | (1.04) | (0.95) | — | — | — | — | (0.95) | 8.98 | |||||||||||||||||||||||||||||||||
| For the Year Ended December 31, 2010 | ||||||||||||||||||||||||||||||||||||||||||||
| IA | 8.67 | 0.10 | — | 1.28 | 1.38 | (0.11) | — | — | (0.11) | 1.27 | 9.94 | |||||||||||||||||||||||||||||||||
| IB | 8.66 | 0.08 | — | 1.28 | 1.36 | (0.09) | — | — | (0.09) | 1.27 | 9.93 | |||||||||||||||||||||||||||||||||
| For the Year Ended December 31, 2009 | ||||||||||||||||||||||||||||||||||||||||||||
| IA | 6.16 | 0.08 | — | 2.51 | 2.59 | (0.08) | — | — | (0.08) | 2.51 | 8.67 | |||||||||||||||||||||||||||||||||
| IB | 6.15 | 0.07 | — | 2.50 | 2.57 | (0.06) | — | — | (0.06) | 2.51 | 8.66 | |||||||||||||||||||||||||||||||||
| From January 31, 2008 (commencement of operations) through December 31, 2008 | ||||||||||||||||||||||||||||||||||||||||||||
| IA(H) | 10.00 | — | — | (3.78) | (3.78) | (0.05) | — | (0.01) | (0.06) | (3.84) | 6.16 | |||||||||||||||||||||||||||||||||
| IB(H) | 10.00 | (0.08) | — | (3.72) | (3.80) | (0.04) | — | (0.01) | (0.05) | (3.85) | 6.15 | |||||||||||||||||||||||||||||||||
| (A) | Information presented relates to a share outstanding throughout the indicated period. |
| (B) | The figures do not include sales charges or other fees which may be applied at the variable life insurance, variable annuity or qualified retirement plan product level. Any such additional sales charges or other fees would lower the Fund's performance. |
| (C) | Ratios do not reflect reductions for fees paid indirectly. Please see Fees Paid Indirectly in the Notes to Financial Statements. |
| (D) | Portfolio turnover rate is calculated on the basis of the Fund as a whole without distinguishing between the classes of shares issued. |
| (E) | Not annualized. |
| (F) | Annualized. |
| (G) | Total return without the inclusion of the Payment from (to) Affiliate can be found in Expenses in the accompanying Notes to Financial Statements. |
| (H) | Commenced operations on January 31, 2008. |
| (I) | During the year ended December 31, 2008, the Fund incurred $95.4 million in sales associated with the transition of assets from Hartford Global Communications HLS Fund, Hartford Global Financial Services HLS Fund and Hartford Global Technology HLS Fund, which merged into the Fund on August 22, 2008. These sales were excluded from the portfolio turnover rate calculation. |
| 30 |
| - Ratios and Supplemental Data - |
| Total Return(B) | Net Assets at End of Period | Ratio of Expenses to Average Net Assets Before Waivers(C) | Ratio of Expenses to Average Net Assets After Waivers(C) | Ratio of Net Investment Income (Loss) to Average Net Assets | Portfolio Turnover Rate(D) | |||||||||||||||
| 7.63 | %(E) | $ | 54,529 | 1.04 | %(F) | 1.04 | %(F) | 1.64 | %(F) | 48 | % | |||||||||
| 7.49 | (E) | 26,873 | 1.29 | (F) | 1.29 | (F) | 1.40 | (F) | — | |||||||||||
| (9.28) | 52,768 | 1.03 | 1.03 | 1.01 | 86 | |||||||||||||||
| (9.51) | 25,747 | 1.28 | 1.28 | 0.76 | — | |||||||||||||||
| 16.01 | 69,740 | 1.01 | 0.98 | 1.03 | 92 | |||||||||||||||
| 15.72 | 35,774 | 1.26 | 1.23 | 0.78 | — | |||||||||||||||
| 42.13 | (G) | 67,012 | 1.16 | 1.06 | 1.17 | 124 | ||||||||||||||
| 41.79 | (G) | 37,695 | 1.41 | 1.31 | 0.93 | — | ||||||||||||||
| (37.87) | (E) | 48,627 | 1.02 | (F) | 0.94 | (F) | 1.29 | (F) | 335 | (I) | ||||||||||
| (38.01) | (E) | 31,008 | 1.27 | (F) | 1.19 | (F) | 0.99 | (F) | — | |||||||||||
| 31 |
Hartford Global Research HLS Fund
Directors and Officers (Unaudited)
The Board of Directors of the Company appoints officers who are responsible for the day-to-day operations of the Fund and who execute policies formulated by the Directors. Each director serves until his or her death, resignation, or retirement or until the next annual meeting of shareholders is held or until his or her successor is elected and qualifies.
Directors and officers who are employed by or who have a financial interest in The Hartford are considered “interested” persons of the Fund pursuant to the 1940 Act. Each officer and two of the Company’s directors, as noted in the chart below, are “interested” persons of the Fund. Each director serves as a director for The Hartford Mutual Funds, Inc., The Hartford Mutual Funds II, Inc., Hartford Series Fund, Inc., Hartford HLS Series Fund II, Inc., and as a trustee for The Hartford Alternative Strategies Fund, which, as of June 30, 2012, collectively consist of 89 funds. Correspondence may be sent to directors and officers c/o Hartford Mutual Funds, P.O. Box 2999, Hartford, Connecticut 06104-2999, except that correspondence to Mr. Annoni, Mr. Dressen and Ms. Fagely may be sent to 500 Bielenberg Drive, Woodbury, Minnesota 55125.
The table below sets forth, for each director and officer, his or her name, year of birth, current position with the Company and date first elected or appointed to Hartford Series Fund, Inc. (“HSF”), and Hartford HLS Series Fund II, Inc. (“HSF2”), principal occupation, and, for directors, other directorships held. The Fund’s statement of additional information contains further information on the directors and is available free of charge by calling 1-800-862-6668 or writing to Hartford HLS Funds, c/o Individual Annuity Services, P.O. Box 5085, Hartford, CT 06102-5085.
Information on the aggregate remuneration paid to the directors of the Company can be found in the Statement of Operations herein. The Fund pays to The Hartford a portion of the Chief Compliance Officer’s compensation, but does not pay salaries or compensation to any of their other officers or directors who are employed by The Hartford.
Non-Interested Directors
Lynn S. Birdsong (1946) Director since 2003, Co-Chairman of the Investment Committee
Mr. Birdsong is a private investor. Mr. Birdsong currently serves as a Director of the Sovereign High Yield Investment Company (April 2010 to current). Mr. Birdsong currently serves as an Independent Director of Nomura Partners Funds, Inc. (formerly, The Japan Fund) (March 2003 to current). From 1979 to 2002, Mr. Birdsong was a managing director of Zurich Scudder Investments, an investment management firm. During his employment with Scudder, Mr. Birdsong was an Interested Director of The Japan Fund. Since 1981, Mr. Birdsong has been a partner in Birdsong Company, an advertising specialty firm.
Robert M. Gavin, Jr. (1940) Director since 2002 (HSF) and 1986 (HSF2), Chairman of the Board since 2004
Dr. Gavin is an educational consultant. Prior to September 1, 2001, he was President of Cranbrook Education Community and prior to July 1996, he was President of Macalester College, St. Paul, Minnesota.
Duane E. Hill (1945) Director since 2001 (HSF) and 2002 (HSF2), Chairman of the Nominating Committee
Mr. Hill is Partner of TSG Ventures L.P., a private equity investment company. Mr. Hill is a former partner of TSG Capital Group, a private equity investment firm that served as sponsor and lead investor in leveraged buyouts of middle market companies.
Sandra S. Jaffee (1941) Director since 2005
Ms. Jaffee is the founder and Chief Executive Officer of a private company, Homeworks Concierge, LLC, which provides residential property management services in Westchester County, New York (January 2012 to present). Ms. Jaffee served as Chairman (2008 to 2009) and Chief Executive Officer of Fortent (formerly Searchspace Group), a leading provider of compliance/regulatory technology to financial institutions from August 2005 to August 2009. Ms. Jaffe currently serves as a member of the Board of Directors of Broadridge Financial Solutions as well as a Trustee of Muhlenberg College.
William P. Johnston (1944) Director since 2005, Chairman of the Compliance Committee
In June 2006, Mr. Johnston was appointed as Senior Advisor to The Carlyle Group, a global private equity investment firm. In August 2007, Mr. Johnston was elected to the Board of Directors of LifeCare Holdings, Inc. In February 2008, Mr. Johnston was elected to the Board of Directors of HCR-ManorCare, Inc. In May 2006, Mr. Johnston was elected to the Supervisory Board of Fresenius Medical Care AG & Co. KGaA, after its acquisition of Renal Care Group, Inc. in March 2006.
Phillip O. Peterson (1944) Director since 2002 (HSF) and 2000 (HSF2), Chairman of the Audit Committee
Mr. Peterson is a mutual fund industry consultant. He was a partner of KPMG LLP (an accounting firm) until July 1999. Mr. Peterson joined William Blair Funds in February 2007 as a member of the Board of Trustees. Mr. Peterson also joined the Board of Trustees of Symetra Variable Mutual Funds Trust as a trustee in February 2012.
| 32 |
Lemma W. Senbet (1946) Director since 2005
Dr. Senbet is the William E. Mayer Chair Professor of Finance and Director, Center for Financial Policy, at the University of Maryland, Robert H. Smith School of Business. He was chair of the Finance Department from 1998 to 2006. Previously he was a chaired professor of finance at the University of Wisconsin-Madison. Also, he was director of the Fortis Funds from March 2000 to July 2002. Dr. Senbet served the finance profession in various capacities, including as director of the American Finance Association and President of the Western Finance Association. In 2006, Dr. Senbet was inducted Fellow of Financial Management Association International for his career-long distinguished scholarship and professional service.
Interested Directors and Officers
David N. Levenson (1966) Director since 2010(1)
Mr. Levenson currently serves as President of The Hartford’s Wealth Management business. He was appointed to this role in July 2010. Previously, Mr. Levenson served as Executive Vice President of Legacy Holdings for The Hartford from June 2009 to July 2010. From 2006 to 2009, Mr. Levenson was with Hartford Life Insurance K.K. where he served as President and Chief Executive Officer from 2007 to 2009. He served as Managing Director of Hartford Investment Management Company from 2005 to 2006. Additionally, Mr. Levenson serves as Executive Vice President of The Hartford and as President, Director and Chief Executive Officer of Hartford Life Insurance Company (“HLIC”) and Hartford Life, Inc. (“HL Inc.”).
(1) Mr. Levenson served as Interested Director until August 2, 2012.
Lowndes A. Smith (1939) Director since 1996 (HSF) and 2002 (HSF2), Co-Chairman of the Investment Committee
Mr. Smith served as Vice Chairman of The Hartford from February 1997 to January 2002, as President and Chief Executive Officer of HL Inc. from February 1997 to January 2002, and as President and Chief Operating Officer of The Hartford Life Insurance Companies from January 1989 to January 2002. Mr. Smith serves as a Director of White Mountains Insurance Group, Ltd., One Beacon Insurance and Symetra Financial and as Managing Director of Whittington Gray Associates.
Other Officers
James E. Davey (1964) President and Chief Executive Officer since 2010(2)
Mr. Davey serves as Executive Vice President of HLIC. Additionally, Mr. Davey serves as President, Chief Executive Officer and Manager of HIFSCO and President, Chief Executive Officer and Manager of HL Investment Advisors, LLC (“HL Advisors”). Mr. Davey joined The Hartford in 2002.
(2) Mr. Davey became an Interested Director effective August 2, 2012.
Mark A. Annoni (1964) Vice President, Controller and Treasurer since 2012(3)
Mr. Annoni serves as the Assistant Vice President and Director of Investment Finance (February 2004 to present). Mr. Annoni joined The Hartford in April 2001 as part of The Hartford’s acquisition of Fortis Financial Group. Prior to joining The Hartford, Mr. Annoni served as Manager of Mutual Fund Accounting at Fortis Financial Group (July 1997 to April 2001).
(3) Mr. Annoni was named Vice President, Controller and Treasurer on May 8, 2012.
Michael R. Dressen (1963) AML Compliance Officer since 2011
Mr. Dressen currently serves as Assistant Vice President of HLIC. He also serves as Chief Compliance Officer and AML Compliance Officer of Hartford Administrative Services Company (“HASCO”) and as Assistant Secretary and Compliance Officer of HIFSCO. Mr Dressen joined The Hartford in 2005 from State Farm Insurance Companies where he held various positions related to mutual funds, variable products, and property casualty insurance.
Tamara L. Fagely (1958) Vice President, since 2002 (HSF) and 1993 (HSF2)(4)
Ms. Fagely has been a Vice President of HASCO since 1998 and Chief Financial Officer since 2006. Currently Ms. Fagely is a Vice President of HLIC. She served as Assistant Vice President of HLIC from December 2001 through March 2005. In addition, Ms. Fagely is Controller and Chief Financial Officer of HIFSCO.
(4) Ms. Fagely served as Vice President, Controller and Treasurer until May 8, 2012.
Dr. Robert J. Froehlich (1953) Senior Managing Director since 2009(5)
Dr. Froehlich joined The Hartford as Senior Managing Director in September 2009. Prior to joining The Hartford, Dr. Froehlich served as Vice Chairman of Deutsche Asset Management from 1997-2009.
(5) Dr. Froehlich served as Senior Managing Director until March 26, 2012.
| 33 |
Hartford Global Research HLS Fund
Directors and Officers (Unaudited) – (continued)
Edward P. Macdonald (1967) Vice President, Secretary and Chief Legal Officer since 2005
Mr. Macdonald serves as Vice President of HLIC and Chief Legal Officer of Mutual Funds and Vice President of HIFSCO. He also serves as Vice President and Secretary of HASCO, and Chief Legal Officer, Secretary and Vice President of HL Advisors. Mr. Macdonald joined The Hartford in 2005.
Vernon J. Meyer (1964) Vice President since 2006
Mr. Meyer serves as Senior Vice President of HLIC. He also serves as Senior Vice President of HIFSCO and HL Advisors. Mr. Meyer joined The Hartford in 2004.
Colleen B. Pernerewski (1969) Vice President and Chief Compliance Officer since 2010
Ms. Pernerewski serves as Vice President and Chief Investment Advisor Compliance Officer of HIFSCO and as Vice President and Chief Compliance Officer of HL Advisors. Ms. Pernerewski serves as Vice President and Chief Compliance Officer of Individual Annuity of HLIC. Ms. Pernerewski joined The Hartford in 2005 from Travelers Life and Annuity where she served as Counsel (2004-2005). Prior to Travelers Life and Annuity, Ms. Pernerewski held the position of Counsel at The Hartford (1998-2004).
Elizabeth L. Schroeder (1966) Vice President since 2010
Ms. Schroeder currently serves as Assistant Vice President of HLIC. Ms. Schroeder joined HLIC in 1991. She is also an Assistant Vice President of HASCO, HIFSCO and HL Advisors.
Martin Swanson (1962) Vice President since 2010
Mr. Swanson is a Vice President of HLIC. Mr. Swanson also serves as Vice President/Marketing for HIFSCO. Prior to joining HLIC in 1998, Mr. Swanson was a Vice President at PaineWebber, Inc.
Jane Wolak (1961) Vice President since 2009
Ms. Wolak currently serves as Senior Vice President of HLIC. Ms. Wolak joined HLIC as Vice President, Retail Product Services in May 2007. She is also Vice President of HASCO. Previously, Ms. Wolak was with Sun Life Financial where she held the position of Vice President, Service Center Operations from 2001-2007.
HOW TO OBTAIN A COPY OF THE FUND’S PROXY VOTING POLICIES AND VOTING RECORDS (UNAUDITED)
A description of the policies and procedures that the Fund uses to determine how to vote proxies relating to portfolio securities and a record of how the Fund voted any proxies for the twelve-month period ended June 30, 2012 are available (1) without charge, upon request, by calling 800-862-6668 and (2) on the SEC’s website at http://www.sec.gov.
QUARTERLY PORTFOLIO HOLDINGS INFORMATION (UNAUDITED)
The Fund files a complete schedule of portfolio holdings with the SEC for the first and third quarters of each fiscal year on Form N-Q. The Fund’s Forms are available (1) without charge, upon request, by calling 800-862-6668 and (2) on the SEC’s website at http://www.sec.gov. The Form N-Q may be reviewed and copied at the SEC’s Public Reference Room in Washington, DC. Information on the operation of the Public Reference Room may be obtained by calling 1-800-SEC-0330.
| 34 |
Hartford Global Research HLS Fund
Expense Example (Unaudited)
As a shareholder of the Fund, you incur two types of costs: (1) transaction costs and (2) ongoing costs including investment management fees, distribution fees, and other fund expenses. This example is intended to help you understand your ongoing costs (in dollars) of investing in the Fund and to compare these costs with the ongoing costs of investing in other mutual funds. The example is based on an investment of $1,000 invested at the beginning of the period and held for the period of December 31, 2011 through June 30, 2012.
Actual Expenses
The first set of columns of the table below provides information about actual account values and actual expenses. You may use the information in this column, together with the amount you invested, to estimate the expenses that you paid over the period. Simply divide your account value by $1,000 (for example, an $8,600 account value divided by $1,000 = 8.6), then multiply the result by the number in the line under the heading entitled “Expenses Paid During Period” to estimate the expenses you paid on your account during this period.
Hypothetical Example for Comparison Purposes
The second set of columns of the table below provides information about hypothetical account values and hypothetical expenses based on the Fund’s actual expense ratio and an assumed rate of return of 5% per year before expenses, which is not the Fund’s actual return. The hypothetical account values and expenses may not be used to estimate the actual ending account balance or expenses you paid for the period. You may use this information to compare the ongoing costs of investing in the Fund and other funds. To do so, compare this 5% hypothetical example with the 5% hypothetical examples that appear in the shareholder reports of the other funds.
Please note that the expenses shown in the table are meant to highlight your ongoing costs only and do not reflect any transactional costs, such as sales charges (loads) and CDSC. Therefore, the second set of columns of the table is useful in comparing ongoing costs only, and will not help you determine the relative total costs of owning different funds. In addition, if these transactional costs were included, your costs would be higher. Expenses are equal to the Fund's annualized expense ratios multiplied by average account value over the period, multiplied by 182/366 (to reflect the one-half year period).
| Actual return | Hypothetical (5% return before expenses) | |||||||||||||||||||||||||||||||||||
| Expenses paid | Expenses paid | Days in | ||||||||||||||||||||||||||||||||||
| during the period | during the period | the | Days | |||||||||||||||||||||||||||||||||
| Beginning | Ending | December 31, 2011 | Beginning | Ending | December 31, 2011 | Annualized | current | in the | ||||||||||||||||||||||||||||
| Account Value | Account Value | through | Account Value | Account Value | through | expense | ½ | full | ||||||||||||||||||||||||||||
| December 31, 2011 | June 30, 2012 | June 30, 2012 | December 31, 2011 | June 30, 2012 | June 30, 2012 | ratio | year | year | ||||||||||||||||||||||||||||
| Class IA | $ | 1,000.00 | $ | 1,076.27 | $ | 5.37 | $ | 1,000.00 | $ | 1,019.69 | $ | 5.22 | 1.04 | % | 182 | 366 | ||||||||||||||||||||
| Class IB | $ | 1,000.00 | $ | 1,074.93 | $ | 6.66 | $ | 1,000.00 | $ | 1,018.45 | $ | 6.47 | 1.29 | % | 182 | 366 | ||||||||||||||||||||
| 35 |
HARTFORD HLS FUNDS
c/o The Hartford Wealth Management - Global Annuities
P.O. Box 14293
Lexington, KY 40512-4293
Hartford Series Fund, Inc. is underwritten and distributed by Hartford Securities Distribution Company, Inc.
"The Hartford" is The Hartford Financial Services Group, Inc. and its subsidiaries.
Hartford Series Fund, Inc. inception dates range from 1977 to date. Hartford Series Fund, Inc. is not a subsidiary of The Hartford but is underwritten, distributed by and advised by subsidiaries of The Hartford. Investments in Hartford Series Fund, Inc. are not guaranteed by The Hartford or any other entity.
You should carefully consider investment objectives, risks, and charges and expenses of Hartford HLS Funds before investing. This and other information can be found in the Fund’s prospectus or summary prospectus, which can be obtained by calling 800-862-6668. Please read them carefully before you invest or send money.
| HLSSAR-GR12 8-12 111647 Printed in U.S.A ©2012 The Hartford, Hartford, CT 06115 | |

A MESSAGE FROM THE PRESIDENT
Dear Fellow Shareholders:
I want to take this opportunity to say thank you for investing in the Hartford HLS Funds. We’ve seen continued market volatility throughout the first half of 2012, and there will likely be continued uncertainty until the Presidential election in November, but we are still optimistic about the markets in 2012.
Market Review
In the first quarter of 2012, the S&P 500 Index turned in its best quarterly performance since the third quarter of 2009. U.S. equities showed signs of improvement as investors focused on improving economic data and strong corporate earnings news and the Federal Reserve’s pledge to keep interest rates low buoyed investors’ appetites.
The second quarter ended on a high note for the stock market—the S&P 500 had its strongest June in more than a decade and the Dow Jones Industrial Average had its best month since October—but those gains weren’t enough to offset losses from April and May, and equities finished the quarter in the red. Although the S&P 500 was -2.75 for the second quarter, it was up 9.49% for the first half of 2012.
Concerns about domestic and European unemployment are having an effect on our economy. The unemployment rate in the euro zone's 17 nations rose to a record 11.1% in May, the highest level since the euro launched as a common currency more than 10 years ago. In the U.S., the labor market has been fickle this year, with job growth starting off strong in the first couple months of 2012 but slowing down in the spring, which has led many to wonder about the status of the economic recovery.
On a positive note, home prices are rising again after falling for more than five years, new and existing home sales are increasing, and home builders are ramping up construction.
The Hartford HLS Funds Expands Relationship with Wellington Management
We’re very pleased that we are expanding our relationship with Wellington Management, which will now serve as the primary sub-adviser for the Hartford HLS Funds including equity, fixed-income,* and asset-allocation funds. One of America’s oldest and largest investment management firms, Wellington Management has resources that span the entire globe, with multiple offices across the U.S. and numerous offices abroad. Wellington Management’s most distinctive strength is its proprietary research, which is shared across the entire organization.
We believe that aligning more closely with a well-respected money manager like Wellington Management puts us in a strong position to drive significant growth and to continue delivering innovative fund strategies to help our investors meet their financial goals.
Thank you again for investing with the Hartford HLS Funds.
James Davey
President
Hartford HLS Funds
*Several fixed-income funds will continue to be sub-advised by Hartford Investment Management Company.
Hartford Growth HLS Fund
This report is prepared for the general information of contract owners and qualified retirement plan participants. It is not an offer of contracts or of qualified retirement plans. It should not be used in connection with any offer, except in conjunction with the appropriate product prospectus which contains all pertinent information including the applicable sales, administrative and other charges.
The views expressed in the Fund’s Manager Discussion under ‘‘Why did the Fund perform this way?’’ and ‘‘What is the outlook?’’ are views of the Fund’s sub-adviser and portfolio management team through the end of the period and are subject to change based on market and other conditions.
Hartford Growth HLS Fund inception 04/30/2002
(sub-advised by Wellington Management Company, LLP)
Investment objective – Seeks long-term capital appreciation.
Performance Overview 6/30/02 - 6/30/12
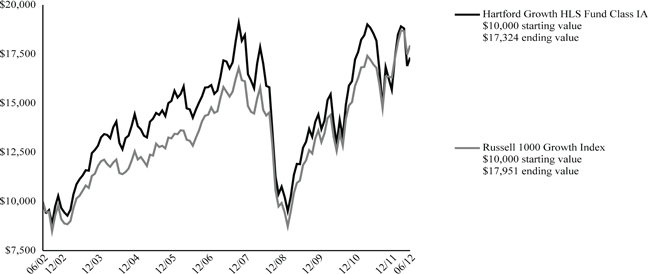
The chart above shows the growth of a $1,000 investment in Class IA. Growth results in classes other than Class IA will vary from what is seen above due to differences in the expenses charged to those share classes.
Average Annual Total Returns (as of 6/30/12)
| 6 Month† | 1 Year | 5 year | 10 year | |
| Growth IA | 10.43% | -6.63% | 0.23% | 5.65% |
| Growth IB | 10.29% | -6.86% | -0.02% | 5.39% |
| Russell 1000 Growth Index | 10.08% | 5.76% | 2.87% | 6.03% |
| † | Not Annualized |
PAST PERFORMANCE IS NOT INDICATIVE OF FUTURE RESULTS.
Total returns presented above were calculated using the Fund's net asset value available to shareholders for sale or redemption of Fund shares on June 30, 2012, which may exclude investment transactions as of this date.
Russell 1000 Growth Index is an unmanaged index which measures the performance of those Russell 1000 Index companies with higher price-to-book ratios and higher forecasted growth values. (The Russell 1000 Index is an unmanaged index that measures the performance of the 1,000 largest companies in the Russell 3000 Index, which measures the performance of the 3,000 largest U.S. companies based on total market capitalization.)
You cannot invest directly in an index.
The chart represents a hypothetical investment in the Fund. Performance data represents past performance and current performance could be higher or lower.
Performance information may reflect historical or current expense waivers/reimbursements from the investment adviser, without which performance would have been lower. For information on current expense waivers/reimbursements, please see the prospectus.
The value of the Fund will fluctuate so that when redeemed, it may be worth more or less than the original investment. The chart and table do not reflect the deductions of taxes, sales charges or other fees which may be applied at the variable life insurance, variable annuity or qualified retirement plan product level. Any such additional sales charges or other fees or expenses would lower the contract’s or plan’s performance.
| 2 |
| Hartford Growth HLS Fund |
| Manager Discussion |
| June 30, 2012 (Unaudited) |
| Portfolio Manager |
| Andrew J. Shilling, CFA |
| Senior Vice President and Equity Portfolio Manager |
How did the Fund perform?
The Class IA shares of the Hartford Growth HLS Fund returned 10.43% for the six-month period ended June 30, 2012, outperforming its benchmark, the Russell 1000 Growth Index, which returned 10.08% for the same period. The Fund outperformed the 10.17% return of the average fund in the Large-Cap Growth VP-UF Funds peer group, a group of funds with investment strategies similar to those of the Fund.
Why did the Fund perform this way?
The first and second quarters of 2012 were near mirror images of one another in terms of what worked and what did not. U.S. equities rallied at the start of the year based on improving macroeconomic data, including lower unemployment levels and improving consumer confidence. Following a strong first quarter, equities retreated in April, fell sharply in May, and recovered modestly in June. Fears surrounding European sovereign debt difficulties reclaimed center stage.
Eight out of ten sectors of the Russell 1000 Growth Index had positive returns for the period. Health Care (+16%), Information Technology (+15%), and Financials (+15%) performed the best, while Utilities (-9%) and Energy (-4%) lagged. Growth stocks (+10.1%) outperformed Value stocks (+8.7%), as measured by the Russell 1000 Growth and Russell 1000 Value Indices.
The Fund’s relative performance benefited from strong security selection in Consumer Discretionary, Health Care, and Information Technology. Security selection in Consumer Staples and Energy detracted from relative returns, as did holding a modest cash position in an upward-trending market. Sector allocation, which is a residual of bottom-up stock selection (i.e. stock by stock fundamental research), contributed positively to relative performance. Positive effects from an overweight (i.e. the Fund’s sector position was more than the benchmark position) to Information Technology and an underweight to Energy was enough to offset the negative effects of the Fund’s underweight exposure to Financials and Health Care.
eBay (Information Technology), Edwards Lifesciences (Health Care), and Apple (Information Technology) were the top contributors to relative and absolute (i.e. total return) performance during the period. Shares of eBay, a provider of online marketplaces and payment solutions, saw its share price steadily increase over the period. Continued improvements in its marketplace segment and increased adoption of PayPal by retailers helped drive earnings growth. Shares of Edwards Lifesciences, a provider of products and technologies to treat advanced cardiovascular disease, rose after the company reported strong first quarter revenue and earnings, in part due to a great start for the U.S. Sapien launch. Shares of Apple moved higher after the company reported better-than-expected quarterly revenue and earnings led by robust sales of the iPhone 4S.
Top detractors from relative performance (i.e. performance of the Fund as measured against the benchmark) during the period were Green Mountain Coffee Roasters (Consumer Staples), Acme Packet (Information Technology), and Altera (Information Technology). Shares of specialty coffee company Green Mountain were volatile during the period due to disappointing quarterly sales and a more muted growth outlook from management for the balance of the fiscal year. Acme Packet, a leading provider of session border control solutions, saw its shares fall following the company's pre-announcement of fourth-quarter results which fell short of analyst expectations. Shares of Altera, a semiconductor company specializing in programmable logic devices, lagged following slightly lower revenue guidance. The firm’s first quarter sales declined, in part due to weak orders in the telecom & wireless segment, causing the company to miss mid-quarter expectations and lower their numbers. Tempur-Pedic International (Consumer Discretionary) was also a top detractor from absolute performance.
What is the outlook?
While the economic outlook has remained uncertain over the past 12 months, our level of confidence in a continued modest global recovery has diminished more recently. While Europe has been a concern for four quarters or so, over the past couple of quarters we have seen dramatic reductions in growth in Brazil and India as well. Southern Europe is most likely in a recession and the recent data out of Germany and other parts of Northern Europe suggests slowing there as well. China continues its gradual slowing with most pundits suggesting Gross Domestic Product growth bottoming in the 7% area. With slowing in more geographies recently, the risk has increased that China’s growth rate could deteriorate further given the importance of exports to their economy. The Chinese leadership has signaled that it wants to move their economy toward more domestic consumption vs. exports, but this will take many years to play out. While we have been
| 3 |
| Hartford Growth HLS Fund |
| Manager Discussion – (continued) |
| June 30, 2012 (Unaudited) |
optimistic about the U.S. economy and a continued recovery characterized by modest growth and manageable inflation, the data in the past few months has come in lower than we would have hoped and signals slowing conditions. The fact that many segments of the economy have not yet recovered to anywhere near peak conditions gives us some optimism that positive, albeit slower, growth will continue. However, given the slowing conditions in other countries and the deteriorating U.S. data, we believe that a recession in the U.S. is now more than a distant possibility.
The recent strength in the dollar combined with slowing economic conditions lead us to believe that the imminent second quarter earnings season will be choppy. We would expect revenue and earnings misses from more companies as compared to recent quarters and we would expect company managements to be conservative with forward guidance. The political rhetoric is bound to heat up shortly with much discussion of weak recovery and high unemployment, which, at the margin, is not helpful for consumer sentiment. We also are closely following the potential impact from the automatic budget cuts that could kick in later this year if Congress does not act. The so called “sequestration” cuts may lead to layoff notices being distributed to defense industry employees in the early fall. Other government employees could receive layoff notices sometime before year end as well. These contractually mandated notices may have the potential to negatively impact consumer sentiment and consumer sales, further slowing the economy, even if Congress eventually acts in the lame duck session before year end.
Our investment discipline is focused on investing in areas of strong demand and avoiding areas of oversupply. At the end of the period, our largest overweights were to Information Technology and Consumer Discretionary while we remained underweight Consumer Staples and Financials, relative to the benchmark.
| Diversification by Industry | ||||
| as of June 30, 2012 | ||||
| Industry (Sector) | Percentage of Net Assets | |||
| Automobiles & Components (Consumer Discretionary) | 0.5 | % | ||
| Capital Goods (Industrials) | 4.6 | |||
| Commercial & Professional Services (Industrials) | 1.2 | |||
| Consumer Durables & Apparel (Consumer Discretionary) | 3.9 | |||
| Consumer Services (Consumer Discretionary) | 3.4 | |||
| Diversified Financials (Financials) | 1.1 | |||
| Energy (Energy) | 4.9 | |||
| Food & Staples Retailing (Consumer Staples) | 3.2 | |||
| Food, Beverage & Tobacco (Consumer Staples) | 3.9 | |||
| Health Care Equipment & Services (Health Care) | 6.1 | |||
| Materials (Materials) | 1.9 | |||
| Media (Consumer Discretionary) | 6.1 | |||
| Pharmaceuticals, Biotechnology & Life Sciences (Health Care) | 2.8 | |||
| Retailing (Consumer Discretionary) | 9.0 | |||
| Semiconductors & Semiconductor Equipment (Information Technology) | 3.1 | |||
| Software & Services (Information Technology) | 20.0 | |||
| Technology Hardware & Equipment (Information Technology) | 15.6 | |||
| Transportation (Industrials) | 4.1 | |||
| Short-Term Investments | 1.0 | |||
| Other Assets and Liabilities | 3.6 | |||
| Total | 100.0 | % | ||
| 4 |
| Hartford Growth HLS Fund |
| Schedule of Investments |
| June 30, 2012 (Unaudited) |
| (000’s Omitted) |
| Shares or Principal Amount | Market Value ╪ | |||||||
COMMON STOCKS - 95.4% | ||||||||
| Automobiles & Components - 0.5% | ||||||||
| 32 | Harley-Davidson, Inc. | $ | 1,476 | |||||
| Capital Goods - 4.6% | ||||||||
| 84 | AMETEK, Inc. | 4,183 | ||||||
| 64 | Boeing Co. | 4,779 | ||||||
| 12 | Cummins, Inc. | 1,192 | ||||||
| 67 | Eaton Corp. | 2,637 | ||||||
| 35 | Joy Global, Inc. | 1,983 | ||||||
| 14,774 | ||||||||
| Commercial & Professional Services - 1.2% | ||||||||
| 36 | IHS, Inc. ● | 3,874 | ||||||
| Consumer Durables & Apparel - 3.9% | ||||||||
| 40 | Coach, Inc. | 2,326 | ||||||
| 178 | D.R. Horton, Inc. | 3,275 | ||||||
| 37 | Fossil, Inc. ● | 2,830 | ||||||
| 58 | Lennar Corp. | 1,780 | ||||||
| 9 | Michael Kors Holdings Ltd. ● | 391 | ||||||
| 18 | PVH Corp. | 1,378 | ||||||
| 5 | Ralph Lauren Corp. | 745 | ||||||
| 12,725 | ||||||||
| Consumer Services - 3.4% | ||||||||
| 118 | Dunkin' Brands Group, Inc. | 4,044 | ||||||
| 71 | Starbucks Corp. | 3,778 | ||||||
| 50 | Yum! Brands, Inc. | 3,217 | ||||||
| 11,039 | ||||||||
| Diversified Financials - 1.1% | ||||||||
| 60 | American Express Co. | 3,500 | ||||||
| Energy - 4.9% | ||||||||
| 49 | Anadarko Petroleum Corp. | 3,257 | ||||||
| 55 | Cameron International Corp. ● | 2,358 | ||||||
| 52 | Cobalt International Energy ● | 1,218 | ||||||
| 59 | Ensco plc | 2,757 | ||||||
| 51 | National Oilwell Varco, Inc. | 3,286 | ||||||
| 45 | Schlumberger Ltd. | 2,908 | ||||||
| 15,784 | ||||||||
| Food & Staples Retailing - 3.2% | ||||||||
| 77 | CVS Caremark Corp. | 3,594 | ||||||
| 95 | Wal-Mart Stores, Inc. | 6,642 | ||||||
| 10,236 | ||||||||
| Food, Beverage & Tobacco - 3.9% | ||||||||
| 243 | Green Mountain Coffee Roasters, Inc. ● | 5,298 | ||||||
| 17 | Lorillard, Inc. | 2,272 | ||||||
| 73 | PepsiCo, Inc. | 5,182 | ||||||
| 12,752 | ||||||||
| Health Care Equipment & Services - 6.1% | ||||||||
| 57 | Covidien plc | 3,048 | ||||||
| 66 | Edwards Lifesciences Corp. ● | 6,827 | ||||||
| 263 | Hologic, Inc. ● | 4,752 | ||||||
| 90 | UnitedHealth Group, Inc. | 5,238 | ||||||
| 19,865 | ||||||||
| Materials - 1.9% | ||||||||
| 73 | Monsanto Co. | 6,051 | ||||||
| Media - 6.1% | ||||||||
| 148 | Comcast Corp. Class A | 4,745 | ||||||
| 251 | News Corp. Class A | 5,589 | ||||||
| 1,830 | Sirius XM Radio, Inc. w/ Rights ● | 3,386 | ||||||
| 121 | Walt Disney Co. | 5,866 | ||||||
| 19,586 | ||||||||
| Pharmaceuticals, Biotechnology & Life Sciences - 2.8% | ||||||||
| 24 | Agilent Technologies, Inc. | 942 | ||||||
| 23 | Biogen Idec, Inc. ● | 3,345 | ||||||
| 96 | Gilead Sciences, Inc. ● | 4,922 | ||||||
| 9,209 | ||||||||
| Retailing - 9.0% | ||||||||
| 78 | Abercrombie & Fitch Co. Class A | 2,649 | ||||||
| 32 | Amazon.com, Inc. ● | 7,224 | ||||||
| 11 | AutoZone, Inc. ● | 4,136 | ||||||
| 64 | Dollar General Corp. ● | 3,461 | ||||||
| 46 | Family Dollar Stores, Inc. | 3,079 | ||||||
| 200 | Lowe's Co., Inc. | 5,678 | ||||||
| 5 | Priceline.com, Inc. ● | 2,994 | ||||||
| 29,221 | ||||||||
| Semiconductors & Semiconductor Equipment - 3.1% | ||||||||
| 219 | Altera Corp. | 7,422 | ||||||
| 77 | Broadcom Corp. Class A | 2,608 | ||||||
| 10,030 | ||||||||
| Software & Services - 20.0% | ||||||||
| 33 | Alliance Data Systems Corp. ● | 4,510 | ||||||
| 80 | BMC Software, Inc. ● | 3,420 | ||||||
| 12 | Citrix Systems, Inc. ● | 971 | ||||||
| 48 | Cognizant Technology Solutions Corp. ● | 2,853 | ||||||
| 204 | eBay, Inc. ● | 8,589 | ||||||
| 57 | Facebook, Inc. ● | 1,767 | ||||||
| 10 | Google, Inc. ● | 5,711 | ||||||
| 31 | IBM Corp. | 6,048 | ||||||
| 13 | Mastercard, Inc. | 5,506 | ||||||
| 204 | Microsoft Corp. | 6,236 | ||||||
| 295 | Oracle Corp. | 8,769 | ||||||
| 55 | Rovi Corp. ● | 1,076 | ||||||
| 12 | Salesforce.com, Inc. ● | 1,679 | ||||||
| 42 | Splunk, Inc. | 1,183 | ||||||
| 56 | Tibco Software, Inc. ● | 1,666 | ||||||
| 92 | VeriSign, Inc. | 3,995 | ||||||
| 9 | VMware, Inc. ● | 858 | ||||||
| 64,837 | ||||||||
| Technology Hardware & Equipment - 15.6% | ||||||||
| 171 | Acme Packet, Inc. ● | 3,182 | ||||||
| 54 | Apple, Inc. ● | 31,656 | ||||||
| 178 | EMC Corp. ● | 4,557 | ||||||
| 221 | Juniper Networks, Inc. ● | 3,606 | ||||||
| 71 | NetApp, Inc. ● | 2,254 | ||||||
| 92 | Qualcomm, Inc. | 5,106 | ||||||
| 50,361 | ||||||||
| Transportation - 4.1% | ||||||||
| 39 | C.H. Robinson Worldwide, Inc. | 2,290 | ||||||
| 77 | Expeditors International of Washington, Inc. | 2,974 | ||||||
| 60 | J.B. Hunt Transport Services, Inc. | 3,546 | ||||||
The accompanying notes are an integral part of these financial statements.
| 5 |
| Hartford Growth HLS Fund |
| Schedule of Investments – (continued) |
| June 30, 2012 (Unaudited) |
| (000’s Omitted) |
| Shares or Principal Amount | Market Value ╪ | ||||||||||||||
| COMMON STOCKS - 95.4% - (continued) | |||||||||||||||
| Transportation - 4.1% - (continued) | |||||||||||||||
| 64 | Norfolk Southern Corp. | $ | 4,615 | ||||||||||||
| 13,425 | |||||||||||||||
| Total common stocks | |||||||||||||||
| (cost $274,611) | $ | 308,745 | |||||||||||||
| Total long-term investments | |||||||||||||||
| (cost $274,611) | $ | 308,745 | |||||||||||||
| SHORT-TERM INVESTMENTS - 1.0% | |||||||||||||||
| Repurchase Agreements - 1.0% | |||||||||||||||
| Bank of America Merrill Lynch TriParty Joint Repurchase Agreement (maturing on 07/02/2012 in the amount of $1,784, collateralized by FHLMC 5.50% - 6.50%, 2035 - 2036, FNMA 5.00% - 6.00%, 2033 - 2039, value of $1,820) | |||||||||||||||
| $ | 1,784 | 0.13%, 06/29/2012 | $ | 1,784 | |||||||||||
| Barclays Capital TriParty Joint Repurchase Agreement (maturing on 07/02/2012 in the amount of $645, collateralized by U.S. Treasury Note 1.25% - 3.63%, 2014 - 2020, value of $658) | |||||||||||||||
| 645 | 0.15%, 06/29/2012 | 645 | |||||||||||||
| Deutsche Bank Securities TriParty Joint Repurchase Agreement (maturing on 07/02/2012 in the amount of $173, collateralized by U.S. Treasury Note 0.88%, 2016, value of $176) | |||||||||||||||
| 173 | 0.20%, 06/29/2012 | 173 | |||||||||||||
| TD Securities TriParty Joint Repurchase Agreement (maturing on 07/02/2012 in the amount of $505, collateralized by FHLMC 4.00% - 6.00%, 2027 - 2041, FNMA 4.00% - 4.50%, 2025 - 2042, U.S. Treasury Bond 6.38%, 2027, U.S. Treasury Note 0.38% - 8.75%, 2012 - 2017, value of $515) | |||||||||||||||
| 505 | 0.15%, 06/29/2012 | 505 | |||||||||||||
| UBS Securities, Inc. Joint Repurchase Agreement (maturing on 07/02/2012 in the amount of $–, collateralized by U.S. Treasury Note 1.00%, 2013, value of $–) | |||||||||||||||
| — | 0.13%, 06/29/2012 | — | |||||||||||||
| UBS Securities, Inc. TriParty Joint Repurchase Agreement (maturing on 07/02/2012 in the amount of $228, collateralized by GNMA 4.00%, 2042, value of $232) | |||||||||||||||
| 228 | 0.20%, 06/29/2012 | 228 | |||||||||||||
| 3,335 | |||||||||||||||
| Total short-term investments | |||||||||||||||
| (cost $3,335) | $ | 3,335 | |||||||||||||
| Total investments | |||||||||||||||
| (cost $277,946) ▲ | 96.4 | % | $ | 312,080 | |||||||||||
| Other assets and liabilities | 3.6 | % | 11,796 | ||||||||||||
| Total net assets | 100.0 | % | $ | 323,876 | |||||||||||
The accompanying notes are an integral part of these financial statements.
| 6 |
| Note: | Percentage of investments as shown is the ratio of the total market value to total net assets. |
| Prices of foreign equities that are principally traded on certain foreign markets may be adjusted daily pursuant to a fair value pricing service approved by the Board of Directors in order to reflect an adjustment for factors occurring after the close of certain foreign markets but before the close of the New York Stock Exchange. |
| ▲ | At June 30, 2012, the cost of securities for federal income tax purposes was $279,039 and the aggregate gross unrealized appreciation and depreciation based on that cost were: |
| Unrealized Appreciation | $ | 55,695 | ||
| Unrealized Depreciation | (22,654 | ) | ||
| Net Unrealized Appreciation | $ | 33,041 |
| ● | Non-income producing. |
| ╪ | See Significant Accounting Policies of accompanying Notes to Financial Statements regarding valuation of securities. |
| GLOSSARY: (abbreviations used in preceding Schedule of Investments) | |
| Other Abbreviations: | |
| FHLMC | Federal Home Loan Mortgage Corp. |
| FNMA | Federal National Mortgage Association |
| GNMA | Government National Mortgage Association |
| 7 |
| Hartford Growth HLS Fund |
| Investment Valuation Hierarchy Level Summary |
| June 30, 2012 (Unaudited) |
| (000’s Omitted) |
| Total | Level 1 ♦ | Level 2 ♦ | Level 3 | |||||||||||||
| Assets: | ||||||||||||||||
| Common Stocks ‡ | $ | 308,745 | $ | 308,745 | $ | – | $ | – | ||||||||
| Short-Term Investments | 3,335 | – | 3,335 | – | ||||||||||||
| Total | $ | 312,080 | $ | 308,745 | $ | 3,335 | $ | – | ||||||||
| ♦ | For the six-month period ended June 30, 2012, there were no transfers between Level 1 and Level 2. |
| ‡ | The Fund has all or primarily all of the equity securities categorized in a particular level. Refer to the Schedule of Investments for further industry breakout. |
The accompanying notes are an integral part of these financial statements.
| 8 |
| Hartford Growth HLS Fund |
| Statement of Assets and Liabilities |
| June 30, 2012 (Unaudited) |
| (000’s Omitted) |
| Assets: | ||||
| Investments in securities, at market value (cost $277,946) | $ | 312,080 | ||
| Cash | — | |||
| Receivables: | ||||
| Investment securities sold | 16,762 | |||
| Fund shares sold | 131 | |||
| Dividends and interest | 96 | |||
| Total assets | 329,069 | |||
| Liabilities: | ||||
| Payables: | ||||
| Investment securities purchased | 4,026 | |||
| Fund shares redeemed | 1,100 | |||
| Investment management fees | 34 | |||
| Distribution fees | 2 | |||
| Accrued expenses | 31 | |||
| Total liabilities | 5,193 | |||
| Net assets | $ | 323,876 | ||
| Summary of Net Assets: | ||||
| Capital stock and paid-in-capital | $ | 319,230 | ||
| Distributions in excess of net investment loss | (378 | ) | ||
| Accumulated net realized loss | (29,110 | ) | ||
| Unrealized appreciation of investments | 34,134 | |||
| Net assets | $ | 323,876 | ||
| Shares authorized | 800,000 | |||
| Par value | $ | 0.001 | ||
| Class IA: Net asset value per share | $ | 12.06 | ||
| Shares outstanding | 20,547 | |||
| Net assets | $ | 247,807 | ||
| Class IB: Net asset value per share | $ | 11.83 | ||
| Shares outstanding | 6,431 | |||
| Net assets | $ | 76,069 |
The accompanying notes are an integral part of these financial statements.
| 9 |
| Hartford Growth HLS Fund |
| Statement of Operations |
| For the Six-Month Period Ended June 30, 2012 (Unaudited) |
| (000’s Omitted) |
| Investment Income: | ||||
| Dividends | $ | 1,147 | ||
| Interest | 6 | |||
| Total investment income, net | 1,153 | |||
| Expenses: | ||||
| Investment management fees | 1,358 | |||
| Transfer agent fees | 2 | |||
| Distribution fees - Class IB | 103 | |||
| Custodian fees | 4 | |||
| Accounting services fees | 17 | |||
| Board of Directors' fees | 5 | |||
| Audit fees | 6 | |||
| Other expenses | 41 | |||
| Total expenses (before fees paid indirectly) | 1,536 | |||
| Commission recapture | (5 | ) | ||
| Total fees paid indirectly | (5 | ) | ||
| Total expenses, net | 1,531 | |||
| Net investment loss | (378 | ) | ||
| Net Realized Gain on Investments: | ||||
| Net realized gain on investments | 24,854 | |||
| Net Realized Gain on Investments | 24,854 | |||
| Net Changes in Unrealized Appreciation of Investments: | ||||
| Net unrealized appreciation of investments | 8,898 | |||
| Net Changes in Unrealized Appreciation of Investments | 8,898 | |||
| Net Gain on Investments | 33,752 | |||
| Net Increase in Net Assets Resulting from Operations | $ | 33,374 |
The accompanying notes are an integral part of these financial statements.
| 10 |
| Hartford Growth HLS Fund |
| Statement of Changes in Net Assets |
| (000’s Omitted) |
| For the Six-Month Period Ended June 30, 2012 (Unaudited) | For the Year Ended December 31, 2011 | |||||||
| Operations: | ||||||||
| Net investment loss | $ | (378 | ) | $ | (10 | ) | ||
| Net realized gain on investments | 24,854 | 37,324 | ||||||
| Net unrealized appreciation (depreciation) of investments | 8,898 | (68,361 | ) | |||||
| Net Increase (Decrease) In Net Assets Resulting From Operations | 33,374 | (31,047 | ) | |||||
| Distributions to Shareholders: | ||||||||
| From net investment income | ||||||||
| Class IA | — | (460 | ) | |||||
| Total distributions | — | (460 | ) | |||||
| Capital Share Transactions: | ||||||||
| Class IA | ||||||||
| Sold | 23,488 | 50,505 | ||||||
| Issued on reinvestment of distributions | — | 460 | ||||||
| Redeemed | (44,562 | ) | (100,832 | ) | ||||
| Total capital share transactions | (21,074 | ) | (49,867 | ) | ||||
| Class IB | ||||||||
| Sold | 5,363 | 13,615 | ||||||
| Redeemed | (13,743 | ) | (38,523 | ) | ||||
| Total capital share transactions | (8,380 | ) | (24,908 | ) | ||||
| Net decrease from capital share transactions | (29,454 | ) | (74,775 | ) | ||||
| Net Increase (Decrease) In Net Assets | 3,920 | (106,282 | ) | |||||
| Net Assets: | ||||||||
| Beginning of period | 319,956 | 426,238 | ||||||
| End of period | $ | 323,876 | $ | 319,956 | ||||
| Undistributed (distribution in excess of) | ||||||||
| net investment income | $ | (378 | ) | $ | — | |||
| Shares: | ||||||||
| Class IA | ||||||||
| Sold | 1,874 | 4,162 | ||||||
| Issued on reinvestment of distributions | — | 41 | ||||||
| Redeemed | (3,623 | ) | (8,326 | ) | ||||
| Total share activity | (1,749 | ) | (4,123 | ) | ||||
| Class IB | ||||||||
| Sold | 437 | 1,144 | ||||||
| Redeemed | (1,134 | ) | (3,227 | ) | ||||
| Total share activity | (697 | ) | (2,083 | ) | ||||
The accompanying notes are an integral part of these financial statements.
| 11 |
| Hartford Growth HLS Fund |
| Notes to Financial Statements |
| June 30, 2012 (Unaudited) |
| (000’s Omitted) |
| 1. | Organization: |
Hartford Growth HLS Fund (the “Fund”) serves as an underlying investment option for certain variable annuity and variable life insurance separate accounts of Hartford Life Insurance Company (“HLIC”) and its affiliates and certain qualified retirement plans. The Fund may also serve as an underlying investment option for certain variable annuity and variable life separate accounts of other insurance companies. Owners of variable annuity contracts and policyholders of variable life insurance contracts may choose the funds permitted in the variable insurance contract prospectus. In addition, participants in certain qualified retirement plans may choose the Fund if permitted by their plans.
Hartford Series Fund, Inc. (the “Company”) is an open-end registered management investment company comprised of thirty portfolios. Financial Statements for the Fund, a series of the Company, are included in this report.
The Company is organized under the laws of the State of Maryland and is registered with the Securities and Exchange Commission (“SEC”) under the Investment Company Act of 1940, as amended (“1940 Act”). The Fund is a diversified open-end management investment company.
The Fund is divided into Class IA and Class IB shares. Each class is offered at the per share net asset value (“NAV”) without a sales charge and is subject to the same expenses, except that the Class IB shares are subject to distribution and service fees charged pursuant to a Distribution Plan adopted in accordance with Rule 12b-1 under the 1940 Act.
| 2. | Significant Accounting Policies: |
The following is a summary of significant accounting policies of the Fund in the preparation of its financial statements, which are in accordance with the United States Generally Accepted Accounting Principles (“U.S. GAAP”). The preparation of financial statements in accordance with U.S. GAAP may require management to make estimates and assumptions that affect the reported amounts of assets and liabilities and disclosure of contingent assets and liabilities at the date of the financial statements and the reported amounts of increases and decreases in net assets from operations during the reporting period. Actual results could differ from those estimates.
| a) | Determination of Net Asset Value – The NAV of each class of the Fund’s shares is determined as of the close of regular trading (normally 4:00 p.m. Eastern Time) (the “NYSE Close”) on each day that the New York Stock Exchange (the “Exchange”) is open (“Valuation Date”). Information that becomes known to the Fund after the NAV has been calculated on a particular day will not generally be used to retroactively adjust the NAV determined earlier that day. |
| b) | Investment Valuation and Fair Value Measurements – For purposes of calculating the NAV, portfolio investments and other assets held by the Fund's portfolio for which market quotes are readily available are valued at market value. Market value is generally determined on the basis of last reported sales prices or official close price. If no sales are reported, market value is based on quotes obtained from a quotation reporting system, established market makers, or independent pricing services. If market prices are not readily available or are deemed unreliable, the Fund will use the fair value of the investment as determined in good faith under policies and procedures established by and under the supervision of the Company’s Board of Directors. Market quotes are considered not readily available where there is an absence of current or reliable market-based data (e.g., trade information or broker quotes), including where events occur after the close of the relevant market, but prior to the NYSE Close that materially affect the values of the Fund’s portfolio investments or assets. In addition, market quotes are considered not readily available when, due to extraordinary circumstances, the exchanges or markets on which the investments trade do not open for trading for the entire day and no other market prices are available. In addition, prices of foreign equities that are principally traded on certain foreign markets are adjusted daily pursuant to a fair value pricing service approved by the Board of Directors in order to reflect an |
| 12 |
adjustment for the factors occurring after the close of certain foreign markets but before the NYSE Close. Investments that are primarily traded on foreign markets may trade on days that are not business days of the Fund. The value of the foreign investments in which the Fund invests may change on days when a shareholder will not be able to purchase or redeem shares of the Fund. Fair value pricing is subjective in nature and the use of fair value pricing by the Fund may cause the NAV of its shares to differ significantly from the NAV that would have been calculated using market prices at the close of the exchange on which a portfolio investment is primarily traded. There can be no assurance that the Fund could obtain the fair market value assigned to an investment if the Fund were to sell the investment at approximately the time at which the Fund determines its NAV.
Investments valued in currencies other than U.S. dollars are converted to U.S. dollars using exchange rates obtained from independent pricing services for calculation of the NAV. As a result, the NAV of the Fund’s shares may be affected by changes in the value of currencies in relation to the U.S. dollar. The value of investments traded in markets outside the United States or denominated in currencies other than the U.S. dollar may be affected significantly on a day that the NYSE is closed and the market value may change on days when an investor is not able to purchase, redeem or exchange shares of the Fund.
Financial instruments for which prices are not available from an independent pricing service may be valued using market quotations obtained from one or more dealers that make markets in the respective financial instrument in accordance with procedures established by the Company’s Board of Directors.
U.S. GAAP defines fair value as the price that the Fund would receive to sell an asset or pay to transfer a liability in an orderly transaction between market participants. The U.S. GAAP fair value measurement standards require disclosure of a fair value hierarchy for each major category of assets and liabilities. Various inputs are used in determining the fair value of the Fund’s investments. These inputs are summarized into three broad hierarchy levels. This hierarchy is based on whether the valuation inputs are observable or unobservable. These levels are:
| · | Level 1 – Quoted prices in active markets for identical investments. Level 1 may include exchange traded instruments, such as domestic equities, some foreign equities, options, futures, mutual funds, exchange traded funds, rights and warrants. |
| · | Level 2 – Observable inputs other than Level 1 prices, such as quoted prices for similar investments; quoted prices in markets that are not active; or other inputs that are observable or can be corroborated by observable market data. Level 2 may include debt investments that are traded less frequently than exchange traded instruments and which are valued using independent pricing services; foreign equities, which are principally traded on certain foreign markets and are adjusted daily pursuant to a fair value pricing service in order to reflect an adjustment for the factors occurring after the close of certain foreign markets but before the NYSE Close; and short-term investments, which are valued at amortized cost. |
| · | Level 3 – Significant unobservable inputs that are supported by limited or no market activity. Level 3 may include financial instruments whose values are determined using indicative market quotes or require significant management judgment or estimation. These unobservable valuation inputs may include estimates for current yields, maturity/duration, prepayment speed, and indicative market quotes for comparable investments along with other assumptions relating to credit quality, collateral value, complexity of the investment structure, general market conditions and liquidity. This category may include investments where trading has been halted or there are certain restrictions on trading. While these investments are priced using unobservable inputs, the valuation of these investments reflects the best available data and management believes the prices are a reasonable representation of exit price. |
The Board of Directors of the Company generally reviews and approves the “Procedures for Valuation of Portfolio Securities” on an annual basis. These procedures define how investments are to be valued, including the formation of a Valuation Committee. The Valuation Committee is responsible for determining in good faith the fair value of investments when the value cannot be obtained from primary pricing services or alternative
| 13 |
| Hartford Growth HLS Fund |
| Notes to Financial Statements – (continued) |
| June 30, 2012 (Unaudited) |
| (000’s Omitted) |
sources or if the valuation of an investment as provided by the primary pricing service or alternative source is believed not to reflect the investment’s fair value as of the Valuation Date. Members of the Valuation Committee include the Fund’s Treasurer or designee, a Vice President of the Funds with legal expertise or designee, and a Vice President of the investment manager or designee. In addition, the Fund’s chief compliance officer shall designate a member of the compliance group to attend Valuation Committee meetings as a non-voting resource, to monitor for and provide guidance with respect to compliance with these procedures. Two members of the Valuation Committee or their designees, representing different departments, shall constitute a quorum for purposes of permitting the Valuation Committee to take action. The Valuation Committee will consider all relevant factors in determining an investment’s fair value, and may seek the advice of the Fund’s sub-adviser, knowledgeable brokers and legal counsel in making such determination. The Valuation Committee reports to the Audit Committee of the Company’s Board of Directors. The Audit Committee receives quarterly written reports which include details of all fair-valued investments, including the reason for the fair valuation, and an indication, when possible, of the accuracy of the valuation by disclosing the next available reliable public price quotation or the disposition price of such investments (the “look-back” test). The Board of Directors then must consider for ratification all of the fair value determinations made during the previous quarter.
Valuation levels are not necessarily indicative of the risk associated with investing in such investments. Individual investments within any of the above mentioned asset classes may be assigned a different hierarchical level than those presented above, as individual circumstances dictate.
For additional information, refer to the Investment Valuation Hierarchy Level Summary.
For purposes of reporting transfers between different hierarchy levels, both transfers in and out of each level, as applicable, are shown as if they occurred at the beginning of the period.
| c) | Investment Transactions and Investment Income – Investment transactions are recorded as of the trade date (the date the order to buy or sell is executed) for financial reporting purposes. Investments purchased or sold on a when-issued or delayed-delivery basis may be settled a month or more after the trade date. Realized gains and losses are determined on the basis of identified cost. |
Dividend income is accrued as of the ex-dividend date, except certain dividends from foreign investments where the ex-dividend date may have passed are recorded as soon as the Fund is informed of the dividend. Interest income, including amortization of premium and accretion of discounts, is accrued on a daily basis.
| d) | Joint Trading Account – The Fund may invest cash balances into a joint trading account that may be invested in one or more repurchase agreements. |
| e) | Fund Share Valuation and Dividend Distributions to Shareholders – Orders for the Fund’s shares are executed in accordance with the investment instructions of the contract holders and plan participants. The NAV of the Fund’s shares is determined as of the close of business on each business day of the Exchange. The NAV is determined separately for each class of shares of the Fund by dividing the Fund’s net assets attributable to that class by the number of shares of the class outstanding. Each class of shares offered by the Fund has equal rights as to assets and voting privileges (except that shareholders of a class have exclusive voting rights regarding any matter relating solely to that class of shares). Income and non-class specific expenses are allocated daily to each class on the basis of the relative net assets of the class. Realized and unrealized capital gains and losses are allocated daily based on the relative net assets of each class of shares of the Fund. |
| 14 |
Orders for the purchase of the Fund’s shares received prior to the close of the Exchange on any day the Exchange is open for business are priced at the NAV determined as of the close of the Exchange. Orders received after the close of the Exchange, or on a day on which the Exchange and/or the Fund is not open for business, are priced at the next determined NAV.
Dividends are declared pursuant to a policy adopted by the Company’s Board of Directors based upon the investment performance of the Fund. The policy of the Fund is to pay dividends from net investment income and realized capital gains, if any, at least once a year.
Distributions from net investment income, net realized capital gains and capital are determined in accordance with federal income tax regulations, which may differ from U.S. GAAP with respect to character and timing. These differences may include but are not limited to losses deferred due to wash sale adjustments, foreign currency gains and losses, adjustments related to Passive Foreign Investment Companies (“PFICs”), Real Estate Investment Trusts (“REITs”), Regulated Investment Companies (“RICs”), certain derivatives and partnerships. Permanent book and federal income tax basis differences relating to shareholder distributions will result in reclassifications to certain of the Fund’s capital accounts (see Federal Income Taxes: Reclassification of Capital Accounts note).
| 3. | Securities and Other Investments: |
| a) | Repurchase Agreements – A repurchase agreement is an agreement by which a counterparty agrees to sell an investment and agrees to repurchase the investment sold at a mutually agreed upon time and price. At the time the Fund enters into a repurchase agreement, the value of the underlying collateral, including accrued interest, will be equal to or exceed the value of the repurchase agreement. Repurchase agreements expose the Fund to counterparty risk. To minimize counterparty risk, the investments that serve to collateralize the repurchase agreement are held by the Fund’s custodian in book entry or physical form in the custodial account of the Fund or in a third party custodial account. Repurchase agreements are valued at cost plus accrued interest. The Fund, as shown on the Schedule of Investments, had outstanding repurchase agreements as of June 30, 2012. |
| b) | Investments Purchased on a When-Issued or Delayed-Delivery Basis – Delivery and payment for investments that have been purchased by the Fund on a forward commitment, or when-issued or delayed-delivery basis, take place beyond the customary settlement period. A fund may dispose of or renegotiate a delayed-delivery transaction after it is entered into, and may sell delayed-delivery investments before they are delivered, which may result in a realized gain or loss. During this period, such investments are subject to market fluctuations, and the Fund identifies investments segregated in its records with a value at least equal to the amount of the commitment. As of June 30, 2012, the Fund had no outstanding when-issued or delayed delivery investments. |
| 4. | Principal Risks: |
| a) | Counterparty Risk – The Fund may be exposed to counterparty risk, or the risk that an institution or other entity with which the Fund has unsettled or open transactions will default. |
| b) | Market Risks – If the Fund invests directly in foreign currencies or in securities that trade in, and receive revenues in, foreign currencies, or in derivatives that provide exposure to foreign currencies, it will be subject to the risk that those currencies will decline in value relative to the base currency of the Fund, or, in the case of hedging positions, that the Fund’s base currency will decline in value relative to the currency being hedged. Currency rates in foreign countries may fluctuate significantly over short periods of time for a number of reasons, including changes in interest rates, intervention (or the failure to intervene) by U.S. or foreign governments, central banks or supranational entities, such as the International Monetary Fund, or by the imposition of currency controls or other political developments in the United States or abroad. As a result, the Fund’s investments in foreign currency denominated securities may reduce the returns |
| 15 |
| Hartford Growth HLS Fund |
| Notes to Financial Statements – (continued) |
| June 30, 2012 (Unaudited) |
| (000’s Omitted) |
of the Fund. The market values of equity securities, such as common stocks and preferred stocks, or equity related investments, such as futures and options, may decline due to general market conditions which are not specifically related to a particular company, such as real or perceived adverse economic conditions, changes in the general outlook for corporate earnings, changes in interest or currency rates or adverse investor sentiment generally. The market value of equity securities may also decline due to factors which affect a particular industry or industries, such as labor shortages or increased production costs and competitive conditions within an industry. Equity securities and equity related investments generally have greater market price volatility than fixed income securities.
| 5. | Federal Income Taxes: |
| a) | Federal Income Taxes – For federal income tax purposes, the Fund intends to continue to qualify as a RIC under Subchapter M of the Internal Revenue Code (“IRC”) by distributing substantially all of its taxable net investment income and net realized capital gains to its shareholders and otherwise complying with the requirements of RICs. The Fund has distributed substantially all of its income and capital gains in prior years, if applicable, and intends to distribute substantially all of its income and capital gains prior to the next fiscal year-end. Accordingly, no provision for federal income or excise taxes has been made in the accompanying financial statements. Distributions from short-term capital gains are treated as ordinary income distributions for federal income tax purposes. |
| b) | Net Investment Income (Loss), Net Realized Gains (Losses) – Net investment income (loss) and net realized gains (losses) may differ for financial statement and tax purposes primarily because of losses deferred due to wash sale adjustments, foreign currency gains and losses, adjustments related to PFICs, REITs, RICs, certain derivatives and partnerships. The character of distributions made during the year from net investment income or net realized gains may differ from their ultimate characterization for federal income tax purposes. Also, due to the timing of dividend distributions, the fiscal year in which amounts are distributed may differ from the year that the income or realized gains (losses) were recorded by the Fund. |
| c) | Distributions and Components of Distributable Earnings – The tax character of distributions paid by the Fund for the periods indicated is as follows (as adjusted for dividends payable): |
| For the Year Ended December 31, 2011 | For the Year Ended December 31, 2010 | |||||||
| Ordinary Income | $ | 460 | $ | 100 | ||||
As of December 31, 2011, the Fund’s components of distributable earnings (deficit) on a tax basis were as follows:
| Amount | ||||
| Accumulated Capital and Other Losses* | $ | (52,871 | ) | |
| Unrealized Appreciation† | 24,143 | |||
| Total Accumulated Deficit | $ | (28,728 | ) | |
| * | The Fund has capital loss carryforwards that are identified in the Capital Loss Carryforward note that follows. | |
| † | The difference between book-basis and tax-basis unrealized appreciation (depreciation) may be attributable to the losses deferred due to wash sale adjustments, foreign currency gains and losses, adjustments related to PFICs, REITs, RICs, certain derivatives and partnerships. |
| d) | Reclassification of Capital Accounts – The Fund may record reclassifications in its capital accounts. These reclassifications have no impact on the total net assets of the Fund. The reclassifications are a result of permanent |
| 16 |
differences between U.S. GAAP and tax accounting for such items as expiration or utilization of capital loss carryforwards or net operating losses. Adjustments are made to reflect the impact these items have on current and future distributions to shareholders. Therefore, the source of the Fund’s distributions may be shown in the accompanying Statement of Changes in Net Assets as from undistributed net investment income, from accumulated net realized gains on investments or from capital depending on the type of book and tax differences that exist. For the year ended December 31, 2011, the Fund recorded reclassifications to increase (decrease) the accounts listed below:
| Amount | ||||
| Undistributed Net Investment Income | $ | (50 | ) | |
| Accumulated Net Realized Gain (Loss) | 67 | |||
| Capital Stock and Paid-in-Capital | (17 | ) | ||
| e) | Capital Loss Carryforward – On December 22, 2010, the Regulated Investment Company Modernization Act of 2010 (the “Act”) was enacted, which made changes to the capital loss carryforward rules. The changes are effective for taxable years beginning after the date of enactment. Under the Act, funds are permitted to carry forward capital losses for an unlimited period. However, any losses incurred during those future taxable years will be required to be utilized prior to the losses incurred in pre-enactment taxable years, which carry an expiration date. As a result of this ordering rule, pre-enactment capital loss carryforwards may be more likely to expire unused. Additionally, post-enactment capital loss carryforwards retain their character as either short-term or long-term capital losses rather than being considered all short-term as permitted under prior regulation. |
At December 31, 2011 (tax-year-end), the Fund had capital loss carryforwards for U.S. federal income tax purposes as follows:
| Year of Expiration | Amount | |||
| 2017 | $ | 52,871 | ||
| Total | $ | 52,871 | ||
During the year ended December 31, 2011, the Fund utilized $35,277 of prior year capital loss carryforwards.
| f) | Accounting for Uncertainty in Income Taxes – The Fund has adopted financial reporting rules that require the Fund to analyze all open tax years, as defined by the statute of limitations, for all major jurisdictions. Generally, tax authorities can examine all tax returns filed for the last three years. The Fund does not have an examination in progress. |
The Fund has reviewed all open tax years and major jurisdictions and concluded that these financial reporting rules had no effect on the Fund’s financial position or results of operations. There is no tax liability resulting from unrecognized tax benefits relating to uncertain income tax positions taken or expected to be taken on the tax return for the fiscal year ended December 31, 2011. The Fund is also not aware of any tax positions for which it is reasonably possible that the total amounts of unrecognized tax benefits will significantly change in the next twelve months.
| 6. | Expenses: |
| a) | Investment Management Agreement – HL Investment Advisors, LLC (“HL Advisors”), an indirect wholly owned subsidiary of The Hartford Financial Services Group, Inc. (“The Hartford”), serves as investment manager to the Fund pursuant to an Investment Management Agreement with the Company. As investment manager, HL Advisors has overall investment supervisory responsibility for the Fund. In addition, HL Advisors provides administrative personnel, services, equipment, facilities and office space for proper operation of the Fund. HL Advisors has contracted with Wellington Management Company, LLP (“Wellington Management”) under a sub-advisory agreement for the provision of day-to-day investment management services to the Fund in accordance with the Fund’s investment objective and policies. The Fund pays a fee to HL Advisors, a portion of which may be used to compensate Wellington Management. |
| 17 |
| Hartford Growth HLS Fund |
| Notes to Financial Statements – (continued) |
| June 30, 2012 (Unaudited) |
| (000’s Omitted) |
The schedule below reflects the rates of compensation paid to HL Advisors for investment management services rendered as of June 30, 2012; the rates are accrued daily and paid monthly.
| Average Daily Net Assets | Annual Fee | |||
| On first $250 million | 0.8000 | % | ||
| On next $250 million | 0.7500 | % | ||
| On next $500 million | 0.7000 | % | ||
| On next $4 billion | 0.6750 | % | ||
| On next $5 billion | 0.6725 | % | ||
| Over $10 billion | 0.6700 | % | ||
| b) | Accounting Services Agreement – Pursuant to the Fund Accounting Agreement between HLIC and the Company, on behalf of the Fund, HLIC provides accounting services to the Fund and receives monthly compensation based on the Fund’s average daily net assets at the rates set forth below. The Fund’s accounting services fees are accrued daily and paid monthly. |
| Average Daily Net Assets | Annual Fee | |||
| All Assets | 0.010 | % | ||
| c) | Operating Expenses – Allocable expenses incurred by the Company are allocated to each Fund and allocated to classes within a Fund in proportion to the average daily net assets of the Fund and each class, except where allocation of certain expenses is more fairly made directly to the Fund or to specific classes within a Fund. |
| d) | Fees Paid Indirectly – The Company, on behalf of the Fund, has entered into agreements with State Street Global Markets, LLC and Russell Implementation Services, Inc. to partially recapture non-discounted trade commissions. Such rebates are used to pay a portion of the Fund’s expenses. In addition, the Fund’s custodian bank has also agreed to reduce its fees when the Fund maintains cash on deposit in a non-interest-bearing custody account. For the six-month period ended June 30, 2012, these amounts, if any, are included in the Statement of Operations. |
The ratio of expenses to average net assets in the accompanying financial highlights excludes the reduction in expenses related to fees paid indirectly. The annualized expense ratio for the period listed below reflecting the reduction for fees paid indirectly is as follows:
| Annualized Six- Month Period Ended June 30, 2012 | ||||
| Class IA | 0.83 | % | ||
| Class IB | 1.08 | % | ||
| e) | Distribution Plan for Class IB shares – The Company, on behalf of the Fund, has adopted a Distribution Plan pursuant to Rule 12b-1 of the 1940 Act to compensate the Distributor, Hartford Securities Distribution Company, Inc. (a wholly owned, ultimate subsidiary of The Hartford), from assets attributable to the Class IB shares for services rendered and expenses borne in connection with activities primarily intended to result in the sale of the Class IB shares, subject to the review and approval of the Company’s Board of Directors. |
The Distribution Plan provides that the Fund may pay annually up to 0.25% of the average daily net assets of the Fund attributable to its Class IB shares for activities primarily intended to result in the sale of Class IB shares. The Board has the authority to suspend or reduce these payments at any point in time. Under the terms of the Distribution Plan and the principal underwriting agreement, the Fund is authorized to make payments monthly to the Distributor that may be used
| 18 |
to pay or compensate entities providing distribution and shareholder servicing with respect to the Class IB shares for such entities’ fees or expenses incurred or paid in that regard. These fees are accrued daily and paid monthly.
| f) | Other Related Party Transactions – Certain officers of the Fund are directors and/or officers of HL Advisors and/or The Hartford or its subsidiaries. For the six-month period ended June 30, 2012, a portion of the Fund’s chief compliance officer’s salary was paid by all the investment companies in the Hartford fund complex. The portion allocated to the Fund rounds to zero. Hartford Administrative Services Company (“HASCO”), an indirect wholly owned subsidiary of The Hartford, provides transfer agent services to the Fund. HASCO was compensated on a per account basis for providing such services. The amount paid to HASCO can be found in the Statement of Operations. These fees are accrued daily and paid monthly. |
| 7. | Investment Transactions: |
For the six-month period ended June 30, 2012, the Fund's aggregate purchases and sales of investment securities (excluding short-term investments) were as follows:
| Amount | ||||
| Cost of Purchases Excluding U.S. Government Obligations | $ | 129,822 | ||
| Sales Proceeds Excluding U.S. Government Obligations | 171,005 | |||
| 8. | Line of Credit: |
The Fund is one of several Hartford funds that participate in a $500 million committed revolving line of credit facility. The facility is to be used for temporary or emergency purposes. Under the arrangement, the funds are required to own securities having a market value in excess of 300% of the total bank borrowings. The interest rate on borrowings varies depending on the nature of the loan. The facility also requires a fee to be paid based on the amount of the commitment. This commitment fee is allocated to all of the funds participating in the line of credit based on the average net assets of the funds. During the six-month period ended June 30, 2012, the Fund did not have any borrowings under this facility.
| 9. | Industry Classifications: |
Other than the industry classifications “Other Investment Pools and Funds” and “Exchange Traded Funds,” equity industry classifications used in this report are the Global Industry Classification Standard, which was developed by and is the exclusive property and service mark of MSCI, Inc. and Standard & Poor’s.
| 10. | Indemnifications: |
Under the Company’s organizational documents, the Company shall indemnify its officers and directors to the full extent required or permitted under Maryland General Corporation Law and the federal securities laws. In addition, the Company, on behalf of the Fund, may enter into contracts that contain a variety of indemnifications. The Company’s maximum exposure under these arrangements is unknown. However, as of the date of these financial statements, the Company has not had prior claims or losses pursuant to these contracts and expects the risk of loss to be remote.
| 19 |
| Hartford Growth HLS Fund |
| Financial Highlights |
| - Selected Per-Share Data (A) - |
| Class | Net Asset Value at Beginning of Period | Net Investment Income (Loss) | Payments from (to) Affiliate | Net Realized and Unrealized Gain (Loss) on Investments | Total from Investment Operations | Dividends from Net Investment Income | Distributions from Realized Capital Gains | Distributions from Capital | Total Distributions | Net Increase (Decrease) in Net Asset Value | Net Asset Value at End of Period | |||||||||||||||||||||||||||||||||
| For the Six-Month Period Ended June 30, 2012 (Unaudited) | ||||||||||||||||||||||||||||||||||||||||||||
| IA | $ | 10.92 | $ | (0.01 | ) | $ | – | $ | 1.15 | $ | 1.14 | $ | – | $ | – | $ | – | $ | – | $ | 1.14 | $ | 12.06 | |||||||||||||||||||||
| IB | 10.73 | (0.03 | ) | – | 1.13 | 1.10 | – | – | – | – | 1.10 | 11.83 | ||||||||||||||||||||||||||||||||
| For the Year Ended December 31, 2011 | ||||||||||||||||||||||||||||||||||||||||||||
| IA | 12.02 | 0.01 | – | (1.09 | ) | (1.08 | ) | (0.02 | ) | – | – | (0.02 | ) | (1.10 | ) | 10.92 | ||||||||||||||||||||||||||||
| IB | 11.81 | (0.03 | ) | – | (1.05 | ) | (1.08 | ) | – | – | – | – | (1.08 | ) | 10.73 | |||||||||||||||||||||||||||||
| For the Year Ended December 31, 2010 (G) | ||||||||||||||||||||||||||||||||||||||||||||
| IA | 10.07 | 0.02 | – | 1.93 | 1.95 | – | – | – | – | 1.95 | 12.02 | |||||||||||||||||||||||||||||||||
| IB | 9.92 | – | – | 1.89 | 1.89 | – | – | – | – | 1.89 | 11.81 | |||||||||||||||||||||||||||||||||
| For the Year Ended December 31, 2009 | ||||||||||||||||||||||||||||||||||||||||||||
| IA | 7.53 | 0.04 | – | 2.54 | 2.58 | (0.04 | ) | – | – | (0.04 | ) | 2.54 | 10.07 | |||||||||||||||||||||||||||||||
| IB | 7.42 | 0.02 | – | 2.49 | 2.51 | (0.01 | ) | – | – | (0.01 | ) | 2.50 | 9.92 | |||||||||||||||||||||||||||||||
| For the Year Ended December 31, 2008 | ||||||||||||||||||||||||||||||||||||||||||||
| IA | 13.39 | 0.03 | – | (5.47 | ) | (5.44 | ) | (0.03 | ) | (0.39 | ) | – | (0.42 | ) | (5.86 | ) | 7.53 | |||||||||||||||||||||||||||
| IB | 13.18 | – | – | (5.37 | ) | (5.37 | ) | – | (0.39 | ) | – | (0.39 | ) | (5.76 | ) | 7.42 | ||||||||||||||||||||||||||||
| For the Year Ended December 31, 2007 | ||||||||||||||||||||||||||||||||||||||||||||
| IA | 12.32 | 0.01 | – | 2.01 | 2.02 | – | (0.95 | ) | – | (0.95 | ) | 1.07 | 13.39 | |||||||||||||||||||||||||||||||
| IB | 12.17 | (0.02 | ) | – | 1.98 | 1.96 | – | (0.95 | ) | – | (0.95 | ) | 1.01 | 13.18 | ||||||||||||||||||||||||||||||
| (A) | Information presented relates to a share outstanding throughout the indicated period. |
| (B) | The figures do not include sales charges or other fees which may be applied at the variable life insurance, variable annuity or qualified retirement plan product level. Any such additional sales charges or other fees would lower the Fund's performance. |
| (C) | Ratios do not reflect reductions for fees paid indirectly. Please see Fees Paid Indirectly in the Notes to Financial Statements. |
| (D) | Portfolio turnover rate is calculated on the basis of the Fund as a whole without distinguishing between the classes of shares issued. |
| (E) | Not annualized. |
| (F) | Annualized. |
| (G) | Per share amounts have been calculated using the average shares method. |
| (H) | During the year ended December 31, 2010, the Fund incurred $49.9 million in sales associated with the transition of assets from Hartford Fundamental Growth HLS Fund, which merged into the Fund on April 16, 2010. These sales were excluded from the portfolio turnover calculation. |
| 20 |
| - Ratios and Supplemental Data - |
| Ratio of Expenses to Average | Ratio of Expenses to Average | Ratio of Net Investment Income | Portfolio Turnover | |||||||||||||||||||
| Total Return(B) | Net Assets at End of Period | Net Assets Before Waivers(C) | Net Assets After Waivers(C) | (Loss) to Average Net Assets | Rate(D) | |||||||||||||||||
| 10.43 | %(E) | $ | 247,807 | 0.83 | %(F) | 0.83 | %(F) | (0.16 | )%(F) | 39 | % | |||||||||||
| 10.29 | (E) | 76,069 | 1.08 | (F) | 1.08 | (F) | (0.41 | )(F) | – | |||||||||||||
| (8.95 | ) | 243,509 | 0.82 | 0.82 | 0.06 | 37 | ||||||||||||||||
| (9.18 | ) | 76,447 | 1.07 | 1.07 | (0.19 | ) | – | |||||||||||||||
| 19.37 | 317,464 | 0.84 | 0.84 | 0.21 | 74 | (H) | ||||||||||||||||
| 19.07 | 108,774 | 1.09 | 1.09 | (0.04 | ) | – | ||||||||||||||||
| 34.24 | 242,406 | 0.88 | 0.88 | 0.44 | 85 | |||||||||||||||||
| 33.90 | 86,556 | 1.13 | 1.13 | 0.20 | – | |||||||||||||||||
| (41.79 | ) | 203,993 | 0.84 | 0.84 | 0.27 | 93 | ||||||||||||||||
| (41.93 | ) | 81,720 | 1.09 | 1.09 | 0.02 | – | ||||||||||||||||
| 16.78 | 388,985 | 0.83 | 0.83 | 0.11 | 101 | |||||||||||||||||
| 16.49 | 189,987 | 1.08 | 1.08 | (0.14 | ) | – | ||||||||||||||||
| 21 |
| Hartford Growth HLS Fund |
| Directors and Officers (Unaudited) |
The Board of Directors of the Company appoints officers who are responsible for the day-to-day operations of the Fund and who execute policies formulated by the Directors. Each director serves until his or her death, resignation, or retirement or until the next annual meeting of shareholders is held or until his or her successor is elected and qualifies.
Directors and officers who are employed by or who have a financial interest in The Hartford are considered “interested” persons of the Fund pursuant to the 1940 Act. Each officer and two of the Company’s directors, as noted in the chart below, are “interested” persons of the Fund. Each director serves as a director for The Hartford Mutual Funds, Inc., The Hartford Mutual Funds II, Inc., Hartford Series Fund, Inc., Hartford HLS Series Fund II, Inc., and as a trustee for The Hartford Alternative Strategies Fund, which, as of June 30, 2012, collectively consist of 89 funds. Correspondence may be sent to directors and officers c/o Hartford Mutual Funds, P.O. Box 2999, Hartford, Connecticut 06104-2999, except that correspondence to Mr. Annoni, Mr. Dressen and Ms. Fagely may be sent to 500 Bielenberg Drive, Woodbury, Minnesota 55125.
The table below sets forth, for each director and officer, his or her name, year of birth, current position with the Company and date first elected or appointed to Hartford Series Fund, Inc. (“HSF”), and Hartford HLS Series Fund II, Inc. (“HSF2”), principal occupation, and, for directors, other directorships held. The Fund’s statement of additional information contains further information on the directors and is available free of charge by calling 1-800-862-6668 or writing to Hartford HLS Funds, c/o Individual Annuity Services, P.O. Box 5085, Hartford, CT 06102-5085.
Information on the aggregate remuneration paid to the directors of the Company can be found in the Statement of Operations herein. The Fund pays to The Hartford a portion of the Chief Compliance Officer’s compensation, but does not pay salaries or compensation to any of their other officers or directors who are employed by The Hartford.
Non-Interested Directors
Lynn S. Birdsong (1946) Director since 2003, Co-Chairman of the Investment Committee
Mr. Birdsong is a private investor. Mr. Birdsong currently serves as a Director of the Sovereign High Yield Investment Company (April 2010 to current). Mr. Birdsong currently serves as an Independent Director of Nomura Partners Funds, Inc. (formerly, The Japan Fund) (March 2003 to current). From 1979 to 2002, Mr. Birdsong was a managing director of Zurich Scudder Investments, an investment management firm. During his employment with Scudder, Mr. Birdsong was an Interested Director of The Japan Fund. Since 1981, Mr. Birdsong has been a partner in Birdsong Company, an advertising specialty firm.
Robert M. Gavin, Jr. (1940) Director since 2002 (HSF) and 1986 (HSF2), Chairman of the Board since 2004
Dr. Gavin is an educational consultant. Prior to September 1, 2001, he was President of Cranbrook Education Community and prior to July 1996, he was President of Macalester College, St. Paul, Minnesota.
Duane E. Hill (1945) Director since 2001 (HSF) and 2002 (HSF2), Chairman of the Nominating Committee
Mr. Hill is Partner of TSG Ventures L.P., a private equity investment company. Mr. Hill is a former partner of TSG Capital Group, a private equity investment firm that served as sponsor and lead investor in leveraged buyouts of middle market companies.
Sandra S. Jaffee (1941) Director since 2005
Ms. Jaffee is the founder and Chief Executive Officer of a private company, Homeworks Concierge, LLC, which provides residential property management services in Westchester County, New York (January 2012 to present). Ms. Jaffee served as Chairman (2008 to 2009) and Chief Executive Officer of Fortent (formerly Searchspace Group), a leading provider of compliance/regulatory technology to financial institutions from August 2005 to August 2009. Ms. Jaffe currently serves as a member of the Board of Directors of Broadridge Financial Solutions as well as a Trustee of Muhlenberg College.
William P. Johnston (1944) Director since 2005, Chairman of the Compliance Committee
In June 2006, Mr. Johnston was appointed as Senior Advisor to The Carlyle Group, a global private equity investment firm. In August 2007, Mr. Johnston was elected to the Board of Directors of LifeCare Holdings, Inc. In February 2008, Mr. Johnston was elected to the Board of Directors of HCR-ManorCare, Inc. In May 2006, Mr. Johnston was elected to the Supervisory Board of Fresenius Medical Care AG & Co. KGaA, after its acquisition of Renal Care Group, Inc. in March 2006.
Phillip O. Peterson (1944) Director since 2002 (HSF) and 2000 (HSF2), Chairman of the Audit Committee
Mr. Peterson is a mutual fund industry consultant. He was a partner of KPMG LLP (an accounting firm) until July 1999. Mr. Peterson joined William Blair Funds in February 2007 as a member of the Board of Trustees. Mr. Peterson also joined the Board of Trustees of Symetra Variable Mutual Funds Trust as a trustee in February 2012.
| 22 |
Lemma W. Senbet (1946) Director since 2005
Dr. Senbet is the William E. Mayer Chair Professor of Finance and Director, Center for Financial Policy, at the University of Maryland, Robert H. Smith School of Business. He was chair of the Finance Department from 1998 to 2006. Previously he was a chaired professor of finance at the University of Wisconsin-Madison. Also, he was director of the Fortis Funds from March 2000 to July 2002. Dr. Senbet served the finance profession in various capacities, including as director of the American Finance Association and President of the Western Finance Association. In 2006, Dr. Senbet was inducted Fellow of Financial Management Association International for his career-long distinguished scholarship and professional service.
Interested Directors and Officers
David N. Levenson (1966) Director since 2010(1)
Mr. Levenson currently serves as President of The Hartford’s Wealth Management business. He was appointed to this role in July 2010. Previously, Mr. Levenson served as Executive Vice President of Legacy Holdings for The Hartford from June 2009 to July 2010. From 2006 to 2009, Mr. Levenson was with Hartford Life Insurance K.K. where he served as President and Chief Executive Officer from 2007 to 2009. He served as Managing Director of Hartford Investment Management Company from 2005 to 2006. Additionally, Mr. Levenson serves as Executive Vice President of The Hartford and as President, Director and Chief Executive Officer of Hartford Life Insurance Company (“HLIC”) and Hartford Life, Inc. (“HL Inc.”).
(1) Mr. Levenson served as Interested Director until August 2, 2012.
Lowndes A. Smith (1939) Director since 1996 (HSF) and 2002 (HSF2), Co-Chairman of the Investment Committee
Mr. Smith served as Vice Chairman of The Hartford from February 1997 to January 2002, as President and Chief Executive Officer of HL Inc. from February 1997 to January 2002, and as President and Chief Operating Officer of The Hartford Life Insurance Companies from January 1989 to January 2002. Mr. Smith serves as a Director of White Mountains Insurance Group, Ltd., One Beacon Insurance and Symetra Financial and as Managing Director of Whittington Gray Associates.
Other Officers
James E. Davey (1964) President and Chief Executive Officer since 2010(2)
Mr. Davey serves as Executive Vice President of HLIC. Additionally, Mr. Davey serves as President, Chief Executive Officer and Manager of HIFSCO and President, Chief Executive Officer and Manager of HL Investment Advisors, LLC (“HL Advisors”). Mr. Davey joined The Hartford in 2002.
(2) Mr. Davey became an Interested Director effective August 2, 2012.
Mark A. Annoni (1964) Vice President, Controller and Treasurer since 2012(3)
Mr. Annoni serves as the Assistant Vice President and Director of Investment Finance (February 2004 to present). Mr. Annoni joined The Hartford in April 2001 as part of The Hartford’s acquisition of Fortis Financial Group. Prior to joining The Hartford, Mr. Annoni served as Manager of Mutual Fund Accounting at Fortis Financial Group (July 1997 to April 2001).
(3) Mr. Annoni was named Vice President, Controller and Treasurer on May 8, 2012.
Michael R. Dressen (1963) AML Compliance Officer since 2011
Mr. Dressen currently serves as Assistant Vice President of HLIC. He also serves as Chief Compliance Officer and AML Compliance Officer of Hartford Administrative Services Company (“HASCO”) and as Assistant Secretary and Compliance Officer of HIFSCO. Mr Dressen joined The Hartford in 2005 from State Farm Insurance Companies where he held various positions related to mutual funds, variable products, and property casualty insurance.
Tamara L. Fagely (1958) Vice President, since 2002 (HSF) and 1993 (HSF2)(4)
Ms. Fagely has been a Vice President of HASCO since 1998 and Chief Financial Officer since 2006. Currently Ms. Fagely is a Vice President of HLIC. She served as Assistant Vice President of HLIC from December 2001 through March 2005. In addition, Ms. Fagely is Controller and Chief Financial Officer of HIFSCO.
(4) Ms. Fagely served as Vice President, Controller and Treasurer until May 8, 2012.
Dr. Robert J. Froehlich (1953) Senior Managing Director since 2009(5)
Dr. Froehlich joined The Hartford as Senior Managing Director in September 2009. Prior to joining The Hartford, Dr. Froehlich served as Vice Chairman of Deutsche Asset Management from 1997-2009.
(5) Dr. Froehlich served as Senior Managing Director until March 26, 2012.
| 23 |
| Hartford Growth HLS Fund |
| Directors and Officers (Unaudited) – (continued) |
Edward P. Macdonald (1967) Vice President, Secretary and Chief Legal Officer since 2005
Mr. Macdonald serves as Vice President of HLIC and Chief Legal Officer of Mutual Funds and Vice President of HIFSCO. He also serves as Vice President and Secretary of HASCO, and Chief Legal Officer, Secretary and Vice President of HL Advisors. Mr. Macdonald joined The Hartford in 2005.
Vernon J. Meyer (1964) Vice President since 2006
Mr. Meyer serves as Senior Vice President of HLIC. He also serves as Senior Vice President of HIFSCO and HL Advisors. Mr. Meyer joined The Hartford in 2004.
Colleen B. Pernerewski (1969) Vice President and Chief Compliance Officer since 2010
Ms. Pernerewski serves as Vice President and Chief Investment Advisor Compliance Officer of HIFSCO and as Vice President and Chief Compliance Officer of HL Advisors. Ms. Pernerewski serves as Vice President and Chief Compliance Officer of Individual Annuity of HLIC. Ms. Pernerewski joined The Hartford in 2005 from Travelers Life and Annuity where she served as Counsel (2004-2005). Prior to Travelers Life and Annuity, Ms. Pernerewski held the position of Counsel at The Hartford (1998-2004).
Elizabeth L. Schroeder (1966) Vice President since 2010
Ms. Schroeder currently serves as Assistant Vice President of HLIC. Ms. Schroeder joined HLIC in 1991. She is also an Assistant Vice President of HASCO, HIFSCO and HL Advisors.
Martin Swanson (1962) Vice President since 2010
Mr. Swanson is a Vice President of HLIC. Mr. Swanson also serves as Vice President/Marketing for HIFSCO. Prior to joining HLIC in 1998, Mr. Swanson was a Vice President at PaineWebber, Inc.
Jane Wolak (1961) Vice President since 2009
Ms. Wolak currently serves as Senior Vice President of HLIC. Ms. Wolak joined HLIC as Vice President, Retail Product Services in May 2007. She is also Vice President of HASCO. Previously, Ms. Wolak was with Sun Life Financial where she held the position of Vice President, Service Center Operations from 2001-2007.
HOW TO OBTAIN A COPY OF THE FUND’S PROXY VOTING POLICIES AND VOTING RECORDS (UNAUDITED)
A description of the policies and procedures that the Fund uses to determine how to vote proxies relating to portfolio securities and a record of how the Fund voted any proxies for the twelve-month period ended June 30, 2012 are available (1) without charge, upon request, by calling 800-862-6668 and (2) on the SEC’s website at http://www.sec.gov.
QUARTERLY PORTFOLIO HOLDINGS INFORMATION (UNAUDITED)
The Fund files a complete schedule of portfolio holdings with the SEC for the first and third quarters of each fiscal year on Form N-Q. The Fund’s Forms are available (1) without charge, upon request, by calling 800-862-6668 and (2) on the SEC’s website at http://www.sec.gov. The Form N-Q may be reviewed and copied at the SEC’s Public Reference Room in Washington, DC. Information on the operation of the Public Reference Room may be obtained by calling 1-800-SEC-0330.
| 24 |
| Hartford Growth HLS Fund |
| Expense Example (Unaudited) |
Your Fund's Expenses
As a shareholder of the Fund, you incur two types of costs: (1) transaction costs and (2) ongoing costs including investment management fees, distribution fees, and other fund expenses. This example is intended to help you understand your ongoing costs (in dollars) of investing in the Fund and to compare these costs with the ongoing costs of investing in other mutual funds. The example is based on an investment of $1,000 invested at the beginning of the period and held for the period of December 31, 2011 through June 30, 2012.
Actual Expenses
The first set of columns of the table below provides information about actual account values and actual expenses. You may use the information in this column, together with the amount you invested, to estimate the expenses that you paid over the period. Simply divide your account value by $1,000 (for example, an $8,600 account value divided by $1,000 = 8.6), then multiply the result by the number in the line under the heading entitled “Expenses Paid During Period” to estimate the expenses you paid on your account during this period.
Hypothetical Example for Comparison Purposes
The second set of columns of the table below provides information about hypothetical account values and hypothetical expenses based on the Fund’s actual expense ratio and an assumed rate of return of 5% per year before expenses, which is not the Fund’s actual return. The hypothetical account values and expenses may not be used to estimate the actual ending account balance or expenses you paid for the period. You may use this information to compare the ongoing costs of investing in the Fund and other funds. To do so, compare this 5% hypothetical example with the 5% hypothetical examples that appear in the shareholder reports of the other funds.
Please note that the expenses shown in the table are meant to highlight your ongoing costs only and do not reflect any transactional costs, such as sales charges (loads) and CDSC. Therefore, the second set of columns of the table is useful in comparing ongoing costs only, and will not help you determine the relative total costs of owning different funds. In addition, if these transactional costs were included, your costs would be higher. Expenses are equal to the Fund's annualized expense ratios multiplied by average account value over the period, multiplied by 182/366 (to reflect the one-half year period).
| Actual return | Hypothetical (5% return before expenses) | ||||||||||||||||||||||||||||||||||||
| Beginning Account Value December 31, 2011 | Ending Account Value June 30, 2012 | Expenses paid during the period December 31, 2011 through June 30, 2012 | Beginning Account Value December 31, 2011 | Ending Account Value June 30, 2012 | Expenses paid during the period December 31, 2011 through June 30, 2012 | Annualized expense ratio | Days in the current 1/2 year | Days in the full year | |||||||||||||||||||||||||||||
| Class IA | $ | 1,000.00 | $ | 1,104.28 | $ | 4.34 | $ | 1,000.00 | $ | 1,020.74 | $ | 4.17 | 0.83 | % | 182 | 366 | |||||||||||||||||||||
| Class IB | $ | 1,000.00 | $ | 1,102.90 | $ | 5.65 | $ | 1,000.00 | $ | 1,019.49 | $ | 5.42 | 1.08 | % | 182 | 366 | |||||||||||||||||||||
| 25 |
HARTFORD HLS FUNDS
c/o The Hartford Wealth Management - Global Annuities
P.O. Box 14293
Lexington, KY 40512-4293
Hartford Series Fund, Inc. is underwritten and distributed by Hartford Securities Distribution Company, Inc.
"The Hartford" is The Hartford Financial Services Group, Inc. and its subsidiaries.
Hartford Series Fund, Inc. inception dates range from 1977 to date. Hartford Series Fund, Inc. is not a subsidiary of The Hartford but is underwritten, distributed by and advised by subsidiaries of The Hartford. Investments in Hartford Series Fund, Inc. are not guaranteed by The Hartford or any other entity.
You should carefully consider investment objectives, risks, and charges and expenses of Hartford HLS Funds before investing. This and other information can be found in the Fund’s prospectus or summary prospectus, which can be obtained by calling 800-862-6668. Please read them carefully before you invest or send money.
| HLSSAR-G12 8-12 111647 Printed in U.S.A ©2012 The Hartford, Hartford, CT 06115 | |

A MESSAGE FROM THE PRESIDENT
Dear Fellow Shareholders:
I want to take this opportunity to say thank you for investing in the Hartford HLS Funds. We’ve seen continued market volatility throughout the first half of 2012, and there will likely be continued uncertainty until the Presidential election in November, but we are still optimistic about the markets in 2012.
Market Review
In the first quarter of 2012, the S&P 500 Index turned in its best quarterly performance since the third quarter of 2009. U.S. equities showed signs of improvement as investors focused on improving economic data and strong corporate earnings news and the Federal Reserve’s pledge to keep interest rates low buoyed investors’ appetites.
The second quarter ended on a high note for the stock market—the S&P 500 had its strongest June in more than a decade and the Dow Jones Industrial Average had its best month since October—but those gains weren’t enough to offset losses from April and May, and equities finished the quarter in the red. Although the S&P 500 was -2.75 for the second quarter, it was up 9.49% for the first half of 2012.
Concerns about domestic and European unemployment are having an effect on our economy. The unemployment rate in the euro zone's 17 nations rose to a record 11.1% in May, the highest level since the euro launched as a common currency more than 10 years ago. In the U.S., the labor market has been fickle this year, with job growth starting off strong in the first couple months of 2012 but slowing down in the spring, which has led many to wonder about the status of the economic recovery.
On a positive note, home prices are rising again after falling for more than five years, new and existing home sales are increasing, and home builders are ramping up construction.
The Hartford HLS Funds Expands Relationship with Wellington Management
We’re very pleased that we are expanding our relationship with Wellington Management, which will now serve as the primary sub-adviser for the Hartford HLS Funds including equity, fixed-income,* and asset-allocation funds. One of America’s oldest and largest investment management firms, Wellington Management has resources that span the entire globe, with multiple offices across the U.S. and numerous offices abroad. Wellington Management’s most distinctive strength is its proprietary research, which is shared across the entire organization.
We believe that aligning more closely with a well-respected money manager like Wellington Management puts us in a strong position to drive significant growth and to continue delivering innovative fund strategies to help our investors meet their financial goals.
Thank you again for investing with the Hartford HLS Funds.
James Davey
President
Hartford HLS Funds
*Several fixed-income funds will continue to be sub-advised by Hartford Investment Management Company.
Table of Contents
This report is prepared for the general information of contract owners and qualified retirement plan participants. It is not an offer of contracts or of qualified retirement plans. It should not be used in connection with any offer, except in conjunction with the appropriate product prospectus which contains all pertinent information including the applicable sales, administrative and other charges.
The views expressed in the Fund’s Manager Discussion under ‘‘Why did the Fund perform this way?’’ and ‘‘What is the outlook?’’ are views of the Fund’s sub-adviser and portfolio management team through the end of the period and are subject to change based on market and other conditions.
| Hartford Healthcare HLS Fund inception 05/01/2000 | |
| (sub-advised by Wellington Management Company, LLP) | |
| Investment objective – Seeks long-term capital appreciation. | |
Performance Overview 6/30/02 - 6/30/12
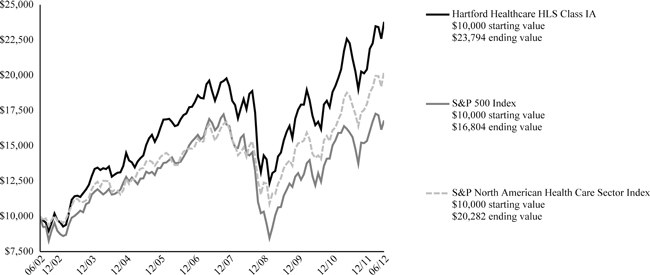
The chart above shows the growth of a $10,000 investment in Class IA. Growth results in classes other than Class IA will vary from what is seen above due to differences in the expenses charged to those share classes.
| Average Annual Total Returns (as of 6/30/12) |
| 6 Month† | 1 Year | 5 year | 10 year | |
| Healthcare IA | 16.50% | 6.81% | 4.74% | 9.06% |
| Healthcare IB | 16.36% | 6.54% | 4.48% | 8.78% |
| S&P 500 Index | 9.48% | 5.43% | 0.21% | 5.33% |
| S&P North American Health Care Sector Index | 12.83% | 9.49% | 4.91% | 7.33% |
| † | Not Annualized |
PAST PERFORMANCE IS NOT INDICATIVE OF FUTURE RESULTS.
Total returns presented above were calculated using the Fund's net asset value available to shareholders for sale or redemption of Fund shares on June 30, 2012, which may exclude investment transactions as of this date.
S&P 500 Index is a market capitalization-weighted price index composed of 500 widely held common stocks.
S&P North American Health Care Sector Index is a modified capitalization-weighted index based on United States headquartered health care companies. Stocks in the index are weighted such that each stock is no more than 7.5% of the market capitalization as of the most recent reconstitution date. The companies included in the index must be common stocks and be traded on the American Stock Exchange, Nasdaq or the New York Stock Exchange and meet certain established market capitalization levels.
You cannot invest directly in an index.
The chart represents a hypothetical investment in the Fund. Performance data represents past performance and current performance could be higher or lower.
Performance information may reflect historical or current expense waivers/reimbursements from the investment adviser, without which performance would have been lower. For information on current expense waivers/reimbursements, please see the prospectus.
The value of the Fund will fluctuate so that when redeemed, it may be worth more or less than the original investment. The chart and table do not reflect the deductions of taxes, sales charges or other fees which may be applied at the variable life insurance, variable annuity or qualified retirement plan product level. Any such additional sales charges or other fees or expenses would lower the contract’s or plan’s performance.
| 2 |
| Hartford Healthcare HLS Fund |
| Manager Discussion |
| June 30, 2012 (Unaudited) |
| Portfolio Managers | |||
| Ann C. Gallo | Jean M. Hynes, CFA | Robert L. Deresiewicz | Kirk J. Mayer, CFA |
Senior Vice President and Global Industry Analyst | Senior Vice President and Global Industry Analyst | Senior Vice President and Global Industry Analyst | Senior Vice President and Global Industry Analyst |
How did the Fund perform?
The Class IA shares of the Hartford Healthcare HLS Fund returned 16.50% for the six-month period ended June 30, 2012, outperforming its benchmark, the S&P North American Health Care Sector Index, which returned 12.83% for the same period. The Fund underperformed the 16.82% return of the average fund in the Lipper Health and Biotechnology VP-UF Funds peer group, a group of funds with investment strategies similar to those of the Fund.
Why did the Fund perform this way?
After a broad-based rally during the first quarter of 2012, U.S. equities reversed course during the second quarter and fell as fears surrounding European sovereign debt once again took center stage. Growing concerns that Greece may exit the eurozone and the possibility of a banking crisis in Spain underpinned a rise in risk aversion among investors. A lackluster U.S. jobs report, a heightened level of political uncertainty in France and Greece, and a host of Spanish and Italian bank downgrades by Moody’s dampened investor enthusiasm for equities.
Health Care stocks (+12.8%) outperformed both the broader U.S. market (+9.5%) and the global equity market (+6.3%) during the period, as measured by the S&P North American Health Care, S&P 500, and the MSCI World Indexes, respectively. Within the S&P North American Health Care Index, Health Care Technology (+26%), Biotechnology (+24%), and Life Sciences Tools & Services (+14%) led returns, while Health Care Equipment and Supplies (+12%), Health Care Providers & Services (+12%), and Pharmaceuticals (+9%) lagged the broader index returns.
The Fund’s outperformance versus its benchmark was primarily due to strong security selection within Biotechnology and Medical Technology sub-sector. This was partially offset by weaker selection within Health Services. Sector allocation, a residual of our bottom up stock selection process (i.e. stock by stock fundamental research), also contributed positively to relative returns, primarily due to an overweight (i.e. the Fund’s sector position was greater than the benchmark position) to the strong performing Biotechnology sub-sector.
Top contributors to relative performance included Amylin Pharmaceuticals (Specialty Pharmaceuticals/Biotechnology), Regeneron Pharmaceuticals (Specialty Pharmaceuticals/Biotechnology), and Ardea Biosciences (Specialty Pharmaceuticals/Biotechnology). Amylin Pharmaceuticals is a biopharmaceutical company focused on developing drugs for diabetes and other metabolic diseases. The stock soared on news that the firm will be acquired by Bristol-Myers. Shares of biopharmaceutical company Regeneron Pharmaceuticals rose after the company reported better than expected sales and raised guidance during the second quarter. Shares of Ardea Biosciences benefitted during the quarter after Astra Zeneca announced it would acquire the company at a significant premium to the market price. Top contributors to absolute performance (i.e. total return) also included United Health Care Group (Health Services).
Holdings of Daiichi Sankyo (Major Pharmaceuticals), Aetna (Health Services), and Walgreen (Health Services) detracted from both absolute and benchmark-relative performance. Shares of Daiichi Sankyo, a major Japanese pharmaceutical company, fell during the period due to losses at the company’s Indian subsidiary, Ranbaxy Laboratories, as well as concern around the company’s pipeline given upcoming patent expirations. Diversified health care benefits company Aetna’s shares declined during the quarter after the stock missed consensus earnings estimates for the first quarter. Shares of U.S. drug store chain Walgreen experienced a setback due to its severed business relationship with Express Scripts.
What is the outlook?
While we think Sequestration-driven cuts (i.e. automatic budget cuts that could kick in later this year if Congress does not act) are unlikely to be implemented, given the magnitude of the health care cost problem in the U.S., combined with our view that the Patient Protection and Affordable Care Act (PPACA) does very little to address the issue, we continue to believe that health care stocks will be subject to escalating reimbursement pressure in the years to come. More specifically, we think it is likely that, regardless of the outcome of the 2012 elections, the U.S. Congress will be forced to pass a comprehensive budget bill in either 2013 or 2014 that addresses the health care cost issue in a targeted, thoughtful manner. While it is impossible to predict the details, we believe the outcome is clear. We believe the bar has been raised for companies seeking reimbursement for
| 3 |
| Hartford Healthcare HLS Fund |
| Manager Discussion – (continued) |
| June 30, 2012 (Unaudited) |
health care products and services in the U.S. Going forward, success will likely accrue only to those companies able to offer a demonstrable improvement over current standards of care or an equivalent level of care, but at a lower price. This is one of the key tenets upon which we have structured our portfolio.
Against this backdrop, the Fund ended the period most overweight to the Specialty Pharmaceuticals/Biotechnology sub-sector and most underweight to the Major Pharmaceuticals sub-sector relative to the benchmark.
| Diversification by Industry |
| as of June 30, 2012 |
| Industry | Percentage of Net Assets | |||
| Biotechnology | 24.8 | % | ||
| Drug Retail | 3.5 | |||
| Health Care Distributors | 6.1 | |||
| Health Care Equipment | 15.1 | |||
| Health Care Facilities | 1.7 | |||
| Health Care Technology | 1.1 | |||
| Life Sciences Tools & Services | 4.5 | |||
| Managed Health Care | 12.5 | |||
| Pharmaceuticals | 29.5 | |||
| Research & Consulting Services | 0.9 | |||
| Short-Term Investments | 0.6 | |||
| Other Assets and Liabilities | (0.3 | ) | ||
| Total | 100.0 | % | ||
| 4 |
| Hartford Healthcare HLS Fund |
| Schedule of Investments |
| June 30, 2012 (Unaudited) |
| (000’s Omitted) |
| Shares or Principal Amount | Market Value ╪ | |||||||
COMMON STOCKS - 99.7% | ||||||||
| Biotechnology - 24.8% | ||||||||
| 87 | 3SBio, Inc. ADR ● | $ | 1,187 | |||||
| 198 | Achillion Pharmaceuticals, Inc. ● | 1,225 | ||||||
| 34 | Acorda Therapeutics, Inc. ● | 811 | ||||||
| 25 | Actelion Ltd. | 1,022 | ||||||
| 60 | Algeta ASA ● | 1,707 | ||||||
| 174 | Alkermes plc ● | 2,956 | ||||||
| 208 | Amylin Pharmaceuticals, Inc. ● | 5,883 | ||||||
| 82 | Anacor Pharmaceuticals, Inc. ● | 534 | ||||||
| 152 | Arena Pharmaceuticals, Inc. ● | 1,513 | ||||||
| 97 | Aveo Pharmaceuticals, Inc. ● | 1,177 | ||||||
| 32 | Biogen Idec, Inc. ● | 4,649 | ||||||
| 268 | Exelixis, Inc. ● | 1,482 | ||||||
| 114 | Gilead Sciences, Inc. ● | 5,866 | ||||||
| 122 | Immunogen, Inc. ● | 2,041 | ||||||
| 77 | Incyte Corp. ● | 1,744 | ||||||
| 78 | Ironwood Pharmaceuticals, Inc. ● | 1,079 | ||||||
| 55 | Momenta Pharmaceuticals, Inc. ● | 740 | ||||||
| 72 | NPS Pharmaceuticals, Inc. ● | 623 | ||||||
| 33 | Onyx Pharmaceuticals, Inc. ● | 2,160 | ||||||
| 90 | Progenics Pharmaceuticals, Inc. ● | 882 | ||||||
| 45 | Regeneron Pharmaceuticals, Inc. ● | 5,094 | ||||||
| 81 | Rigel Pharmaceuticals, Inc. ● | 751 | ||||||
| 98 | Seattle Genetics, Inc. ● | 2,498 | ||||||
| 15 | Targacept, Inc. ● | 64 | ||||||
| 132 | Trius Therapeutics, Inc. ● | 757 | ||||||
| 47 | Vertex Pharmaceuticals, Inc. ● | 2,634 | ||||||
| 51,079 | ||||||||
| Drug Retail - 3.5% | ||||||||
| 96 | CVS Caremark Corp. | 4,480 | ||||||
| 97 | Walgreen Co. | 2,854 | ||||||
| 7,334 | ||||||||
| Health Care Distributors - 6.1% | ||||||||
| 112 | Cardinal Health, Inc. | 4,717 | ||||||
| 83 | McKesson Corp. | 7,772 | ||||||
| 12,489 | ||||||||
| Health Care Equipment - 15.1% | ||||||||
| 143 | ABIOMED, Inc. ● | 3,259 | ||||||
| 99 | Covidien plc | 5,270 | ||||||
| 19 | DiaSorin S.p.A. | 568 | ||||||
| 37 | Heartware International, Inc. ● | 3,303 | ||||||
| 70 | Hologic, Inc. ● | 1,254 | ||||||
| 148 | Medtronic, Inc. | 5,713 | ||||||
| 83 | St. Jude Medical, Inc. | 3,328 | ||||||
| 128 | Stereotaxis, Inc. ● | 27 | ||||||
| 28 | Stryker Corp. | 1,526 | ||||||
| 56 | Tornier N.V. ● | 1,262 | ||||||
| 2,489 | Trauson Holdings Co., Ltd. | 995 | ||||||
| 77 | Volcano Corp. ● | 2,206 | ||||||
| 36 | Zimmer Holdings, Inc. | 2,311 | ||||||
| 31,022 | ||||||||
| Health Care Facilities - 1.7% | ||||||||
| 70 | HCA Holdings, Inc. | 2,139 | ||||||
| 137 | NMC Health plc | 409 | ||||||
| 103 | Vanguard Health Systems, Inc. ● | 918 | ||||||
| 3,466 | ||||||||
| Health Care Technology - 1.1% | ||||||||
| 103 | Allscripts Healthcare Solutions, Inc. ● | 1,121 | ||||||
| 11 | SXC Health Solutions Corp. ● | 1,101 | ||||||
| 2,222 | ||||||||
| Life Sciences Tools & Services - 4.5% | ||||||||
| 70 | Agilent Technologies, Inc. | 2,755 | ||||||
| 20 | Life Technologies Corp. ● | 918 | ||||||
| 73 | PAREXEL International Corp. ● | 2,069 | ||||||
| 57 | Thermo Fisher Scientific, Inc. | 2,954 | ||||||
| 7 | Waters Corp. ● | 572 | ||||||
| 9,268 | ||||||||
| Managed Health Care - 12.5% | ||||||||
| 148 | Aetna, Inc. | 5,750 | ||||||
| 153 | CIGNA Corp. | 6,746 | ||||||
| 182 | UnitedHealth Group, Inc. | 10,659 | ||||||
| 26 | Wellcare Health Plans, Inc. ● | 1,367 | ||||||
| 20 | Wellpoint, Inc. | 1,302 | ||||||
| 25,824 | ||||||||
| Pharmaceuticals - 29.5% | ||||||||
| 10 | Alk-Abello A/S | 592 | ||||||
| 61 | Almirall S.A. | 436 | ||||||
| 26 | AstraZeneca plc ADR | 1,172 | ||||||
| 39 | Auxilium Pharmaceuticals, Inc. ● | 1,051 | ||||||
| 104 | Bristol-Myers Squibb Co. | 3,728 | ||||||
| 81 | Cadence Pharmaceuticals, Inc. ● | 291 | ||||||
| 159 | Daiichi Sankyo Co., Ltd. | 2,676 | ||||||
| 46 | Dr. Reddy's Laboratories Ltd. ADR | 1,362 | ||||||
| 84 | Eisai Co., Ltd. | 3,657 | ||||||
| 414 | Elan Corp. plc ADR ● | 6,043 | ||||||
| 32 | Eli Lilly & Co. | 1,365 | ||||||
| 151 | Forest Laboratories, Inc. ● | 5,290 | ||||||
| 127 | Medicines Co. ● | 2,923 | ||||||
| 150 | Merck & Co., Inc. | 6,262 | ||||||
| 118 | Mylan, Inc. ● | 2,522 | ||||||
| 10 | Ono Pharmaceutical Co., Ltd. | 603 | ||||||
| 107 | Optimer Pharmaceuticals, Inc. ● | 1,653 | ||||||
| 27 | Pacira Pharmaceuticals, Inc. ● | 431 | ||||||
| 167 | Pfizer, Inc. | 3,841 | ||||||
| 6 | Salix Pharmaceuticals Ltd. ● | 326 | ||||||
| 238 | Shionogi & Co., Ltd. | 3,235 | ||||||
| 27 | Simcere Pharmaceutical Group ADR ● | 241 | ||||||
| 106 | Teva Pharmaceutical Industries Ltd. ADR | 4,192 | ||||||
| 54 | UCB S.A. | 2,713 | ||||||
| 50 | Watson Pharmaceuticals, Inc. ● | 3,707 | ||||||
| 73 | Xenoport, Inc. ● | 443 | ||||||
| 60,755 | ||||||||
| Research & Consulting Services - 0.9% | ||||||||
| 211 | Qualicorp S.A. | 1,830 | ||||||
| Total common stocks (cost $173,276) | $ | 205,289 | ||||||
| Total long-term investments (cost $173,276) | $ | 205,289 | ||||||
The accompanying notes are an integral part of these financial statements.
| 5 |
| Hartford Healthcare HLS Fund |
| Schedule of Investments – (continued) |
| June 30, 2012 (Unaudited) |
| (000’s Omitted) |
| Shares or Principal Amount | Market Value ╪ | |||||||
| SHORT-TERM INVESTMENTS - 0.6% | ||||||||
| Repurchase Agreements - 0.6% | ||||||||
| Bank of America Merrill Lynch TriParty Joint Repurchase Agreement (maturing on 07/02/2012 in the amount of $648, collateralized by FHLMC 5.50% - 6.50%, 2035 - 2036, FNMA 5.00% - 6.00%, 2033 - 2039, value of $661) | ||||||||
| $ | 648 | 0.13%, 06/29/2012 | $ | 648 | ||||
| Barclays Capital TriParty Joint Repurchase Agreement (maturing on 07/02/2012 in the amount of $234, collateralized by U.S. Treasury Note 1.25% - 3.63%, 2014 - 2020, value of $239) | ||||||||
| 234 | 0.15%, 06/29/2012 | 234 | ||||||
| Deutsche Bank Securities TriParty Joint Repurchase Agreement (maturing on 07/02/2012 in the amount of $63, collateralized by U.S. Treasury Note 0.88%, 2016, value of $64) | ||||||||
| 63 | 0.20%, 06/29/2012 | 63 | ||||||
| TD Securities TriParty Joint Repurchase Agreement (maturing on 07/02/2012 in the amount of $184, collateralized by FHLMC 4.00% - 6.00%, 2027 - 2041, FNMA 4.00% - 4.50%, 2025 - 2042, U.S. Treasury Bond 6.38%, 2027, U.S. Treasury Note 0.38% - 8.75%, 2012 - 2017, value of $187) | ||||||||
| 184 | 0.15%, 06/29/2012 | 184 | ||||||
| UBS Securities, Inc. Joint Repurchase Agreement (maturing on 07/02/2012 in the amount of $-, collateralized by U.S. Treasury Note 1.00%, 2013, value of $-) | ||||||||
| – | 0.13%, 06/29/2012 | – | ||||||
| UBS Securities, Inc. TriParty Joint Repurchase Agreement (maturing on 07/02/2012 in the amount of $83, collateralized by GNMA 4.00%, 2042, value of $84) | ||||||||
| 83 | 0.20%, 06/29/2012 | 83 | ||||||
| 1,212 | ||||||||
| Total short-term investments | ||||||||
| (cost $1,212) | $ | 1,212 | ||||||
| Total investments | |||||||||||
| (cost $174,488) ▲ | 100.3 | % | $ | 206,501 | |||||||
| Other assets and liabilities | (0.3 | )% | (562 | ) | |||||||
| Total net assets | 100.0 | % | $ | 205,939 |
| Note: | Percentage of investments as shown is the ratio of the total market value to total net assets. |
| Prices of foreign equities that are principally traded on certain foreign markets may be adjusted daily pursuant to a fair value pricing service approved by the Board of Directors in order to reflect an adjustment for factors occurring after the close of certain foreign markets but before the close of the New York Stock Exchange. |
The accompanying notes are an integral part of these financial statements.
| 6 |
| ▲ | At June 30, 2012, the cost of securities for federal income tax purposes was $175,878 and the aggregate gross unrealized appreciation and depreciation based on that cost were: |
| Unrealized Appreciation | $ | 40,708 | ||
| Unrealized Depreciation | (10,085 | ) | ||
| Net Unrealized Appreciation | $ | 30,623 |
| ● | Non-income producing. |
| Foreign Currency Contracts Outstanding at June 30, 2012 | |||||||||||||||||||||
| Description | Counterparty | Buy / Sell | Market Value ╪ | Contract | Delivery Date | Unrealized Appreciation/ (Depreciation) | |||||||||||||||
| JPY | JPM | Sell | $ | 5,284 | $ | 5,546 | 08/01/2012 | $ | 262 | ||||||||||||
╪ See Significant Accounting Policies of accompanying Notes to Financial Statements regarding valuation of securities.
| GLOSSARY: (abbreviations used in preceding Schedule of Investments) | |
| Counterparty Abbreviations: | |
| JPM | JP Morgan Chase & Co. |
| Currency Abbreviations: | |
| JPY | Japanese Yen |
| Other Abbreviations: | |
| ADR | American Depositary Receipt |
| FHLMC | Federal Home Loan Mortgage Corp. |
| FNMA | Federal National Mortgage Association |
| GNMA | Government National Mortgage Association |
The accompanying notes are an integral part of these financial statements.
| 7 |
| Hartford Healthcare HLS Fund |
| Investment Valuation Hierarchy Level Summary |
| June 30, 2012 (Unaudited) |
| (000’s Omitted) |
| Total | Level 1 ♦ | Level 2 ♦ | Level 3 | |||||||||||||
| Assets: | ||||||||||||||||
| Common Stocks ‡ | $ | 205,289 | $ | 187,085 | $ | 18,204 | $ | – | ||||||||
| Short-Term Investments | 1,212 | – | 1,212 | – | ||||||||||||
| Total | $ | 206,501 | $ | 187,085 | $ | 19,416 | $ | – | ||||||||
| Foreign Currency Contracts * | 262 | – | 262 | – | ||||||||||||
| Total | $ | 262 | $ | – | $ | 262 | $ | – | ||||||||
| ♦ | For the six-month period ended June 30, 2012, there were no transfers between Level 1 and Level 2. |
| ‡ | The Fund has all or primarily all of the equity securities categorized in a particular level. Refer to the Schedule of Investments for further industry breakout. |
| * | Derivative instruments not reflected in the Schedule of Investments are valued at the unrealized appreciation/depreciation on the investments. |
The accompanying notes are an integral part of these financial statements.
| 8 |
| Hartford Healthcare HLS Fund |
| Statement of Assets and Liabilities |
| June 30, 2012 (Unaudited) |
| (000’s Omitted) |
| Assets: | ||||
| Investments in securities, at market value (cost $174,488) | $ | 206,501 | ||
| Cash | 1 | |||
| Unrealized appreciation on foreign currency contracts | 262 | |||
| Receivables: | ||||
| Investment securities sold | 1,194 | |||
| Fund shares sold | 127 | |||
| Dividends and interest | 186 | |||
| Other assets | — | |||
| Total assets | 208,271 | |||
| Liabilities: | ||||
| Payables: | ||||
| Investment securities purchased | 1,381 | |||
| Fund shares redeemed | 909 | |||
| Investment management fees | 23 | |||
| Distribution fees | 2 | |||
| Accrued expenses | 17 | |||
| Total liabilities | 2,332 | |||
| Net assets | $ | 205,939 | ||
| Summary of Net Assets: | ||||
| Capital stock and paid-in-capital | $ | 172,300 | ||
| Undistributed net investment income | 1,171 | |||
| Accumulated net realized gain | 194 | |||
| Unrealized appreciation of investments and the translations of assets and liabilities denominated in foreign currency | 32,274 | |||
| Net assets | $ | 205,939 | ||
| Shares authorized | 800,000 | |||
| Par value | $ | 0.001 | ||
| Class IA: Net asset value per share | $ | 17.56 | ||
| Shares outstanding | 8,751 | |||
| Net assets | $ | 153,647 | ||
| Class IB: Net asset value per share | $ | 17.15 | ||
| Shares outstanding | 3,049 | |||
| Net assets | $ | 52,292 |
The accompanying notes are an integral part of these financial statements.
| 9 |
| Hartford Healthcare HLS Fund |
| Statement of Operations |
| For the Six-Month Period Ended June 30, 2012 (Unaudited) |
| (000’s Omitted) |
| Investment Income: | ||||
| Dividends | $ | 1,627 | ||
| Interest | 1 | |||
| Less: Foreign tax withheld | (62 | ) | ||
| Total investment income, net | 1,566 | |||
| Expenses: | ||||
| Investment management fees | 853 | |||
| Transfer agent fees | 2 | |||
| Distribution fees - Class IB | 64 | |||
| Custodian fees | 5 | |||
| Accounting services fees | 10 | |||
| Board of Directors' fees | 2 | |||
| Audit fees | 6 | |||
| Other expenses | 32 | |||
| Total expenses (before fees paid indirectly) | 974 | |||
| Commission recapture | (1 | ) | ||
| Total fees paid indirectly | (1 | ) | ||
| Total expenses, net | 973 | |||
| Net investment income | 593 | |||
| Net Realized Gain on Investments and Foreign Currency Transactions: | ||||
| Net realized gain on investments | 8,674 | |||
| Net realized loss on foreign currency contracts | (97 | ) | ||
| Net realized gain on other foreign currency transactions | 43 | |||
| Net Realized Gain on Investments and Foreign Currency Transactions | 8,620 | |||
| Net Changes in Unrealized Appreciation of Investments and Foreign Currency Transactions: | ||||
| Net unrealized appreciation of investments | 20,799 | |||
| Net unrealized appreciation of foreign currency contracts | 278 | |||
| Net unrealized depreciation on translation of other assets and liabilities in foreign currencies | (3 | ) | ||
| Net Changes in Unrealized Appreciation of Investments and Foreign Currency Transactions | 21,074 | |||
| Net Gain on Investments and Foreign Currency Transactions | 29,694 | |||
| Net Increase in Net Assets Resulting from Operations | $ | 30,287 |
The accompanying notes are an integral part of these financial statements.
| 10 |
| Hartford Healthcare HLS Fund |
| Statement of Changes in Net Assets |
| (000’s Omitted) |
| For the Six-Month Period Ended June 30, 2012 (Unaudited) | For the Year Ended December 31, 2011 | |||||||
| Operations: | ||||||||
| Net investment income | $ | 593 | $ | 516 | ||||
| Net realized gain on investments and foreign currency transactions | 8,620 | 20,256 | ||||||
| Net unrealized appreciation (depreciation) of investments and foreign currency transactions | 21,074 | (5,636 | ) | |||||
| Net Increase In Net Assets Resulting From Operations | 30,287 | 15,136 | ||||||
| Distributions to Shareholders: | ||||||||
| From net investment income | ||||||||
| Class IA | — | (68 | ) | |||||
| Total distributions | — | (68 | ) | |||||
| Capital Share Transactions: | ||||||||
| Class IA | ||||||||
| Sold | 12,793 | 30,285 | ||||||
| Issued on reinvestment of distributions | — | 68 | ||||||
| Redeemed | (18,718 | ) | (41,445 | ) | ||||
| Total capital share transactions | (5,925 | ) | (11,092 | ) | ||||
| Class IB | ||||||||
| Sold | 4,765 | 11,253 | ||||||
| Redeemed | (9,209 | ) | (21,415 | ) | ||||
| Total capital share transactions | (4,444 | ) | (10,162 | ) | ||||
| Net decrease from capital share transactions | (10,369 | ) | (21,254 | ) | ||||
| Net Increase (Decrease) In Net Assets | 19,918 | (6,186 | ) | |||||
| Net Assets: | ||||||||
| Beginning of period | 186,021 | 192,207 | ||||||
| End of period | $ | 205,939 | $ | 186,021 | ||||
| Undistributed (distribution in excess of) net investment income | $ | 1,171 | $ | 578 | ||||
| Shares: | ||||||||
| Class IA | ||||||||
| Sold | 773 | 1,950 | ||||||
| Issued on reinvestment of distributions | — | 5 | ||||||
| Redeemed | (1,119 | ) | (2,753 | ) | ||||
| Total share activity | (346 | ) | (798 | ) | ||||
| Class IB | ||||||||
| Sold | 294 | 747 | ||||||
| Redeemed | (565 | ) | (1,449 | ) | ||||
| Total share activity | (271 | ) | (702 | ) | ||||
The accompanying notes are an integral part of these financial statements.
| 11 |
| Hartford Healthcare HLS Fund |
| Notes to Financial Statements |
| June 30, 2012 (Unaudited) |
| (000’s Omitted) |
| 1. | Organization: |
Hartford Healthcare HLS Fund (the “Fund”) serves as an underlying investment option for certain variable annuity and variable life insurance separate accounts of Hartford Life Insurance Company (“HLIC”) and its affiliates and certain qualified retirement plans. The Fund may also serve as an underlying investment option for certain variable annuity and variable life separate accounts of other insurance companies. Owners of variable annuity contracts and policyholders of variable life insurance contracts may choose the funds permitted in the variable insurance contract prospectus. In addition, participants in certain qualified retirement plans may choose the Fund if permitted by their plans.
Hartford Series Fund, Inc. (the “Company”) is an open-end registered management investment company comprised of thirty portfolios. Financial Statements for the Fund, a series of the Company, are included in this report.
The Company is organized under the laws of the State of Maryland and is registered with the Securities and Exchange Commission (“SEC”) under the Investment Company Act of 1940, as amended (“1940 Act”). The Fund is a diversified open-end management investment company.
The Fund is divided into Class IA and Class IB shares. Each class is offered at the per share net asset value (“NAV”) without a sales charge and is subject to the same expenses, except that the Class IB shares are subject to distribution and service fees charged pursuant to a Distribution Plan adopted in accordance with Rule 12b-1 under the 1940 Act.
| 2. | Significant Accounting Policies: |
The following is a summary of significant accounting policies of the Fund in the preparation of its financial statements, which are in accordance with the United States Generally Accepted Accounting Principles (“U.S. GAAP”). The preparation of financial statements in accordance with U.S. GAAP may require management to make estimates and assumptions that affect the reported amounts of assets and liabilities and disclosure of contingent assets and liabilities at the date of the financial statements and the reported amounts of increases and decreases in net assets from operations during the reporting period. Actual results could differ from those estimates.
| a) | Determination of Net Asset Value – The NAV of each class of the Fund’s shares is determined as of the close of regular trading (normally 4:00 p.m. Eastern Time) (the “NYSE Close”) on each day that the New York Stock Exchange (the “Exchange”) is open (“Valuation Date”). Information that becomes known to the Fund after the NAV has been calculated on a particular day will not generally be used to retroactively adjust the NAV determined earlier that day. |
| b) | Investment Valuation and Fair Value Measurements – For purposes of calculating the NAV, portfolio investments and other assets held by the Fund's portfolio for which market quotes are readily available are valued at market value. Market value is generally determined on the basis of last reported sales prices or official close price. If no sales are reported, market value is based on quotes obtained from a quotation reporting system, established market makers, or independent pricing services. If market prices are not readily available or are deemed unreliable, the Fund will use the fair value of the investment as determined in good faith under policies and procedures established by and under the supervision of the Company’s Board of Directors. Market quotes are considered not readily available where there is an absence of current or reliable market-based data (e.g., trade information or broker quotes), including where events occur after the close of the relevant market, but prior to the NYSE Close that materially affect the values of the Fund’s portfolio investments or assets. In addition, market quotes are considered not readily available when, due to extraordinary circumstances, the exchanges or markets on which the investments trade do not open for trading for the entire day and no other market prices are available. In addition, prices of foreign equities that are principally traded on certain foreign markets are adjusted daily pursuant to a fair value pricing service approved by the Board of Directors in order to reflect an adjustment for the factors occurring after the close of certain foreign markets but before the NYSE Close. Investments that are primarily traded on foreign markets may trade on days that are not business days of the Fund. The value of the foreign investments in which the Fund invests may change on days when a shareholder will not be able to purchase or redeem shares of the Fund. Fair value pricing is subjective in nature and the use of fair value pricing by the Fund may |
| 12 |
| cause the NAV of its shares to differ significantly from the NAV that would have been calculated using market prices at the close of the exchange on which a portfolio investment is primarily traded. There can be no assurance that the Fund could obtain the fair market value assigned to an investment if the Fund were to sell the investment at approximately the time at which the Fund determines its NAV. |
Investments valued in currencies other than U.S. dollars are converted to U.S. dollars using exchange rates obtained from independent pricing services for calculation of the NAV. As a result, the NAV of the Fund’s shares may be affected by changes in the value of currencies in relation to the U.S. dollar. The value of investments traded in markets outside the United States or denominated in currencies other than the U.S. dollar may be affected significantly on a day that the NYSE is closed and the market value may change on days when an investor is not able to purchase, redeem or exchange shares of the Fund.
Foreign currency contracts represent agreements to exchange currencies on specific future dates at predetermined rates. Foreign currency contracts are valued using foreign currency exchange rates and forward rates as provided by an independent pricing service on the Valuation Date.
Financial instruments for which prices are not available from an independent pricing service may be valued using market quotations obtained from one or more dealers that make markets in the respective financial instrument in accordance with procedures established by the Company’s Board of Directors.
U.S. GAAP defines fair value as the price that the Fund would receive to sell an asset or pay to transfer a liability in an orderly transaction between market participants. The U.S. GAAP fair value measurement standards require disclosure of a fair value hierarchy for each major category of assets and liabilities. Various inputs are used in determining the fair value of the Fund’s investments. These inputs are summarized into three broad hierarchy levels. This hierarchy is based on whether the valuation inputs are observable or unobservable. These levels are:
| · | Level 1 – Quoted prices in active markets for identical investments. Level 1 may include exchange traded instruments, such as domestic equities, some foreign equities, options, futures, mutual funds, exchange traded funds, rights and warrants. | |
| · | Level 2 – Observable inputs other than Level 1 prices, such as quoted prices for similar investments; quoted prices in markets that are not active; or other inputs that are observable or can be corroborated by observable market data. Level 2 may include debt investments that are traded less frequently than exchange traded instruments and which are valued using independent pricing services; foreign equities, which are principally traded on certain foreign markets and are adjusted daily pursuant to a fair value pricing service in order to reflect an adjustment for the factors occurring after the close of certain foreign markets but before the NYSE Close; and short-term investments, which are valued at amortized cost. | |
| · | Level 3 – Significant unobservable inputs that are supported by limited or no market activity. Level 3 may include financial instruments whose values are determined using indicative market quotes or require significant management judgment or estimation. These unobservable valuation inputs may include estimates for current yields, maturity/duration, prepayment speed, and indicative market quotes for comparable investments along with other assumptions relating to credit quality, collateral value, complexity of the investment structure, general market conditions and liquidity. This category may include investments where trading has been halted or there are certain restrictions on trading. While these investments are priced using unobservable inputs, the valuation of these investments reflects the best available data and management believes the prices are a reasonable representation of exit price. |
The Board of Directors of the Company generally reviews and approves the “Procedures for Valuation of Portfolio Securities” on an annual basis. These procedures define how investments are to be valued, including the formation of a Valuation Committee. The Valuation Committee is responsible for determining in good faith the fair value of investments when the value cannot be obtained from primary pricing services or alternative sources or if the valuation of an investment as provided by the primary pricing service or alternative source is
| 13 |
Hartford Healthcare HLS Fund
Notes to Financial Statements – (continued)
June 30, 2012 (Unaudited)
(000’s Omitted)
believed not to reflect the investment’s fair value as of the Valuation Date. Members of the Valuation Committee include the Fund’s Treasurer or designee, a Vice President of the Funds with legal expertise or designee, and a Vice President of the investment manager or designee. In addition, the Fund’s chief compliance officer shall designate a member of the compliance group to attend Valuation Committee meetings as a non-voting resource, to monitor for and provide guidance with respect to compliance with these procedures. Two members of the Valuation Committee or their designees, representing different departments, shall constitute a quorum for purposes of permitting the Valuation Committee to take action. The Valuation Committee will consider all relevant factors in determining an investment’s fair value, and may seek the advice of the Fund’s sub-adviser, knowledgeable brokers and legal counsel in making such determination. The Valuation Committee reports to the Audit Committee of the Company’s Board of Directors. The Audit Committee receives quarterly written reports which include details of all fair-valued investments, including the reason for the fair valuation, and an indication, when possible, of the accuracy of the valuation by disclosing the next available reliable public price quotation or the disposition price of such investments (the “look-back” test). The Board of Directors then must consider for ratification all of the fair value determinations made during the previous quarter.
Valuation levels are not necessarily indicative of the risk associated with investing in such investments. Individual investments within any of the above mentioned asset classes may be assigned a different hierarchical level than those presented above, as individual circumstances dictate.
For additional information, refer to the Investment Valuation Hierarchy Level Summary.
For purposes of reporting transfers between different hierarchy levels, both transfers in and out of each level, as applicable, are shown as if they occurred at the beginning of the period.
| c) | Investment Transactions and Investment Income – Investment transactions are recorded as of the trade date (the date the order to buy or sell is executed) for financial reporting purposes. Investments purchased or sold on a when-issued or delayed-delivery basis may be settled a month or more after the trade date. Realized gains and losses are determined on the basis of identified cost. |
Dividend income is accrued as of the ex-dividend date, except certain dividends from foreign investments where the ex-dividend date may have passed are recorded as soon as the Fund is informed of the dividend. Interest income, including amortization of premium and accretion of discounts, is accrued on a daily basis.
| d) | Foreign Currency Transactions – Assets and liabilities denominated in currencies other than U.S. dollars are translated into U.S. dollars at the exchange rates in effect on the valuation date. Purchases and sales of investments, income, and expenses are translated into U.S. dollars at the exchange rates on the dates of such transactions. |
The Fund does not isolate that portion of portfolio investment valuation resulting from fluctuations in the foreign currency exchange rates from the fluctuations arising from changes in the market prices of investments held. Exchange rate fluctuations are included with the net realized and unrealized gain or loss on investments in the accompanying financial statements.
Net realized foreign exchange gains or losses arise from sales of foreign currencies and the difference between asset and liability amounts initially stated in foreign currencies and the U.S. dollar value of the amounts actually received or paid. Net unrealized foreign exchange gains or losses arise from changes in the value of other assets and liabilities at the end of the reporting period, resulting from changes in the exchange rates.
| e) | Joint Trading Account – The Fund may invest cash balances into a joint trading account that may be invested in one or more repurchase agreements. |
| 14 |
| f) | Fund Share Valuation and Dividend Distributions to Shareholders – Orders for the Fund’s shares are executed in accordance with the investment instructions of the contract holders and plan participants. The NAV of the Fund’s shares is determined as of the close of business on each business day of the Exchange. The NAV is determined separately for each class of shares of the Fund by dividing the Fund’s net assets attributable to that class by the number of shares of the class outstanding. Each class of shares offered by the Fund has equal rights as to assets and voting privileges (except that shareholders of a class have exclusive voting rights regarding any matter relating solely to that class of shares). Income and non-class specific expenses are allocated daily to each class on the basis of the relative net assets of the class. Realized and unrealized capital gains and losses are allocated daily based on the relative net assets of each class of shares of the Fund. |
Orders for the purchase of the Fund’s shares received prior to the close of the Exchange on any day the Exchange is open for business are priced at the NAV determined as of the close of the Exchange. Orders received after the close of the Exchange, or on a day on which the Exchange and/or the Fund is not open for business, are priced at the next determined NAV.
Dividends are declared pursuant to a policy adopted by the Company’s Board of Directors based upon the investment performance of the Fund. The policy of the Fund is to pay dividends from net investment income and realized capital gains, if any, at least once a year.
Distributions from net investment income, net realized capital gains and capital are determined in accordance with federal income tax regulations, which may differ from U.S. GAAP with respect to character and timing. These differences may include but are not limited to losses deferred due to wash sale adjustments, foreign currency gains and losses, adjustments related to Passive Foreign Investment Companies (“PFICs”), Real Estate Investment Trusts (“REITs”), Regulated Investment Companies (“RICs”), certain derivatives and partnerships. Permanent book and federal income tax basis differences relating to shareholder distributions will result in reclassifications to certain of the Fund’s capital accounts (see Federal Income Taxes: Reclassification of Capital Accounts note).
| 3. | Securities and Other Investments: |
| a) | Repurchase Agreements – A repurchase agreement is an agreement by which a counterparty agrees to sell an investment and agrees to repurchase the investment sold at a mutually agreed upon time and price. At the time the Fund enters into a repurchase agreement, the value of the underlying collateral, including accrued interest, will be equal to or exceed the value of the repurchase agreement. Repurchase agreements expose the Fund to counterparty risk. To minimize counterparty risk, the investments that serve to collateralize the repurchase agreement are held by the Fund’s custodian in book entry or physical form in the custodial account of the Fund or in a third party custodial account. Repurchase agreements are valued at cost plus accrued interest. The Fund, as shown on the Schedule of Investments, had outstanding repurchase agreements as of June 30, 2012. |
| b) | Investments Purchased on a When-Issued or Delayed-Delivery Basis – Delivery and payment for investments that have been purchased by the Fund on a forward commitment, or when-issued or delayed-delivery basis, take place beyond the customary settlement period. A fund may dispose of or renegotiate a delayed-delivery transaction after it is entered into, and may sell delayed-delivery investments before they are delivered, which may result in a realized gain or loss. During this period, such investments are subject to market fluctuations, and the Fund identifies investments segregated in its records with a value at least equal to the amount of the commitment. As of June 30, 2012, the Fund had no outstanding when-issued or delayed delivery investments. |
| 4. | Financial Derivative Instruments: |
The following disclosures contain information on how and why the Fund uses derivative instruments, the credit-risk-related contingent features in certain derivative instruments, and how derivative instruments affect the Fund’s financial position and results of operations. The location and fair value amounts of these instruments on the Statement of Assets
| 15 |
Hartford Healthcare HLS Fund
Notes to Financial Statements – (continued)
June 30, 2012 (Unaudited)
(000’s Omitted)
and Liabilities and the realized gains and losses and changes in unrealized gains and losses on the Statement of Operations, each categorized by type of derivative contract, are included in the following Additional Derivative Instrument Information footnote. The derivative instruments outstanding as of period-end are disclosed in the notes to the Schedule of Investments and the amounts of realized gains and losses and changes in unrealized gains and losses on derivative instruments during the period are disclosed in the Statement of Operations.
| a) | Foreign Currency Contracts – The Fund may enter into foreign currency contracts that obligate the Fund to purchase or sell currencies at specified future dates. Foreign currency contracts are used to hedge the currency exposure associated with some or all of the Fund’s investments and/or as part of an investment strategy. Foreign currency contracts are marked to market daily and the change in value is recorded by the Fund as an unrealized gain or loss. The Fund will record a realized gain or loss when the foreign currency contract is settled. |
Foreign currency contracts involve elements of market risk in excess of the amounts reflected in the Statement of Assets and Liabilities. In addition, risks may arise upon entering into these contracts from the potential inability of the counterparties to meet the terms of the contracts and from unanticipated movements in the value of the foreign currencies relative to the U.S. dollar. The Fund had outstanding foreign currency contracts as shown on the Schedule of Investments as of June 30, 2012.
| b) | Additional Derivative Instrument Information: |
Fair Values of Derivative Instruments on the Statement of Assets and Liabilities as of June 30, 2012:
| Risk Exposure Category | ||||||||||||||||||||||||||||
| Interest Rate Contracts | Foreign Exchange Contracts | Credit Contracts | Equity Contracts | Commodity Contracts | Other Contracts | Total | ||||||||||||||||||||||
| Assets: | ||||||||||||||||||||||||||||
| Unrealized appreciation on foreign currency contracts | $ | — | $ | 262 | $ | — | $ | — | $ | — | $ | — | $ | 262 | ||||||||||||||
| Total | $ | — | $ | 262 | $ | — | $ | — | $ | — | $ | — | $ | 262 | ||||||||||||||
The volume of derivatives that is presented in the Schedule of Investments is consistent with the derivative activity during the six-month period ended June 30, 2012.
The effect of Derivative Instruments on the Statement of Operations for the six-month period ended June 30, 2012:
| Risk Exposure Category | ||||||||||||||||||||||||||||
| Interest Rate Contracts | Foreign Exchange Contracts | Credit Contracts | Equity Contracts | Commodity Contracts | Other Contracts | Total | ||||||||||||||||||||||
| Realized Gain (Loss) on Derivatives Recognized as a Result of Operations: | ||||||||||||||||||||||||||||
| Net realized loss on foreign currency contracts | $ | — | $ | (97 | ) | $ | — | $ | — | $ | — | $ | — | $ | (97 | ) | ||||||||||||
| Total | $ | — | $ | (97 | ) | $ | — | $ | — | $ | — | $ | — | $ | (97 | ) | ||||||||||||
| Net Change in Unrealized Appreciation (Depreciation) on Derivatives Recognized as a Result of Operations: | ||||||||||||||||||||||||||||
| Net change in unrealized appreciation of foreign currency contracts | $ | — | $ | 278 | $ | — | $ | — | $ | — | $ | — | $ | 278 | ||||||||||||||
| Total | $ | — | $ | 278 | $ | — | $ | — | $ | — | $ | — | $ | 278 | ||||||||||||||
| 5. | Principal Risks: |
| a) | Counterparty Risk – The Fund may be exposed to counterparty risk, or the risk that an institution or other entity with which the Fund has unsettled or open transactions will default. |
| 16 |
| b) | Market Risks – If the Fund invests directly in foreign currencies or in securities that trade in, and receive revenues in, foreign currencies, or in derivatives that provide exposure to foreign currencies, it will be subject to the risk that those currencies will decline in value relative to the base currency of the Fund, or, in the case of hedging positions, that the Fund’s base currency will decline in value relative to the currency being hedged. Currency rates in foreign countries may fluctuate significantly over short periods of time for a number of reasons, including changes in interest rates, intervention (or the failure to intervene) by U.S. or foreign governments, central banks or supranational entities, such as the International Monetary Fund, or by the imposition of currency controls or other political developments in the United States or abroad. As a result, the Fund’s investments in foreign currency denominated securities may reduce the returns of the Fund. The market values of equity securities, such as common stocks and preferred stocks, or equity related investments, such as futures and options, may decline due to general market conditions which are not specifically related to a particular company, such as real or perceived adverse economic conditions, changes in the general outlook for corporate earnings, changes in interest or currency rates or adverse investor sentiment generally. The market value of equity securities may also decline due to factors which affect a particular industry or industries, such as labor shortages or increased production costs and competitive conditions within an industry. Equity securities and equity related investments generally have greater market price volatility than fixed income securities. |
| 6. | Federal Income Taxes: |
| a) | Federal Income Taxes – For federal income tax purposes, the Fund intends to continue to qualify as a RIC under Subchapter M of the Internal Revenue Code (“IRC”) by distributing substantially all of its taxable net investment income and net realized capital gains to its shareholders and otherwise complying with the requirements of RICs. The Fund has distributed substantially all of its income and capital gains in prior years, if applicable, and intends to distribute substantially all of its income and capital gains prior to the next fiscal year-end. Accordingly, no provision for federal income or excise taxes has been made in the accompanying financial statements. Distributions from short-term capital gains are treated as ordinary income distributions for federal income tax purposes. |
| b) | Net Investment Income (Loss), Net Realized Gains (Losses) – Net investment income (loss) and net realized gains (losses) may differ for financial statement and tax purposes primarily because of losses deferred due to wash sale adjustments, foreign currency gains and losses, adjustments related to PFICs, REITs, RICs, certain derivatives and partnerships. The character of distributions made during the year from net investment income or net realized gains may differ from their ultimate characterization for federal income tax purposes. Also, due to the timing of dividend distributions, the fiscal year in which amounts are distributed may differ from the year that the income or realized gains (losses) were recorded by the Fund. |
| c) | Distributions and Components of Distributable Earnings – The tax character of distributions paid by the Fund for the periods indicated is as follows (as adjusted for dividends payable): |
| For the Year Ended December 31, 2011 | For the Year Ended December 31, 2010 | |||||||
| Ordinary Income | $ | 68 | $ | 250 | ||||
As of December 31, 2011, the Fund’s components of distributable earnings (deficit) on a tax basis were as follows:
| Amount | ||||
| Undistributed Ordinary Income | $ | 650 | ||
| Accumulated Capital and Other Losses* | (7,124 | ) | ||
| Unrealized Appreciation† | 9,826 | |||
| Total Accumulated Earnings | $ | 3,352 | ||
| * | The Fund has capital loss carryforwards that are identified in the Capital Loss Carryforward note that follows. | |
| † | The difference between book-basis and tax-basis unrealized appreciation (depreciation) may be attributable to the losses deferred due to wash sale adjustments, foreign currency gains and losses, adjustments related to PFICs, REITs, RICs, certain derivatives and partnerships. |
| 17 |
Hartford Healthcare HLS Fund
Notes to Financial Statements – (continued)
June 30, 2012 (Unaudited)
(000’s Omitted)
| d) | Reclassification of Capital Accounts – The Fund may record reclassifications in its capital accounts. These reclassifications have no impact on the total net assets of the Fund. The reclassifications are a result of permanent differences between U.S. GAAP and tax accounting for such items as foreign currency, PFICs, expiration or utilization of capital loss carryforwards or net operating losses. Adjustments are made to reflect the impact these items have on current and future distributions to shareholders. Therefore, the source of the Fund’s distributions may be shown in the accompanying Statement of Changes in Net Assets as from undistributed net investment income, from accumulated net realized gains on investments or from capital depending on the type of book and tax differences that exist. For the year ended December 31, 2011, the Fund recorded reclassifications to increase (decrease) the accounts listed below: |
| Amount | ||||
| Undistributed Net Investment Income | $ | (607 | ) | |
| Accumulated Net Realized Gain (Loss) | 607 | |||
| e) | Capital Loss Carryforward – On December 22, 2010, the Regulated Investment Company Modernization Act of 2010 (the “Act”) was enacted, which made changes to the capital loss carryforward rules. The changes are effective for taxable years beginning after the date of enactment. Under the Act, funds are permitted to carry forward capital losses for an unlimited period. However, any losses incurred during those future taxable years will be required to be utilized prior to the losses incurred in pre-enactment taxable years, which carry an expiration date. As a result of this ordering rule, pre-enactment capital loss carryforwards may be more likely to expire unused. Additionally, post-enactment capital loss carryforwards retain their character as either short-term or long-term capital losses rather than being considered all short-term as permitted under prior regulation. |
At December 31, 2011 (tax-year-end), the Fund had capital loss carryforwards for U.S. federal income tax purposes as follows:
| Year of Expiration | Amount | |||
| 2017 | $ | 7,124 | ||
| Total | $ | 7,124 | ||
During the year ended December 31, 2011, the Fund utilized $17,252 of prior year capital loss carryforwards.
| f) | Accounting for Uncertainty in Income Taxes – The Fund has adopted financial reporting rules that require the Fund to analyze all open tax years, as defined by the statute of limitations, for all major jurisdictions. Generally, tax authorities can examine all tax returns filed for the last three years. The Fund does not have an examination in progress. |
The Fund has reviewed all open tax years and major jurisdictions and concluded that these financial reporting rules had no effect on the Fund’s financial position or results of operations. There is no tax liability resulting from unrecognized tax benefits relating to uncertain income tax positions taken or expected to be taken on the tax return for the fiscal year ended December 31, 2011. The Fund is also not aware of any tax positions for which it is reasonably possible that the total amounts of unrecognized tax benefits will significantly change in the next twelve months.
| 7. | Expenses: |
| a) | Investment Management Agreement – HL Investment Advisors, LLC (“HL Advisors”), an indirect wholly owned subsidiary of The Hartford Financial Services Group, Inc. (“The Hartford”), serves as investment manager to the Fund pursuant to an Investment Management Agreement with the Company. As investment manager, HL Advisors has overall investment supervisory responsibility for the Fund. In addition, HL Advisors provides administrative personnel, services, equipment, facilities and office space for proper operation of the Fund. HL Advisors has contracted with Wellington Management Company, LLP (“Wellington Management”) under a sub-advisory agreement for the provision of day-to- |
| 18 |
day investment management services to the Fund in accordance with the Fund’s investment objective and policies. The Fund pays a fee to HL Advisors, a portion of which may be used to compensate Wellington Management.
The schedule below reflects the rates of compensation paid to HL Advisors for investment management services rendered as of June 30, 2012; the rates are accrued daily and paid monthly.
| Average Daily Net Assets | Annual Fee | |||
| On first $250 million | 0.8500 | % | ||
| On next $250 million | 0.8000 | % | ||
| On next $4.5 billion | 0.7500 | % | ||
| On next $5 billion | 0.7475 | % | ||
| Over $10 billion | 0.7450 | % | ||
| b) | Accounting Services Agreement – Pursuant to the Fund Accounting Agreement between HLIC and the Company, on behalf of the Fund, HLIC provides accounting services to the Fund and receives monthly compensation based on the Fund’s average daily net assets at the rates set forth below. The Fund’s accounting services fees are accrued daily and paid monthly. |
| Average Daily Net Assets | Annual Fee | |||
| All Assets | 0.010 | % | ||
| c) | Operating Expenses – Allocable expenses incurred by the Company are allocated to each Fund and allocated to classes within a Fund in proportion to the average daily net assets of the Fund and each class, except where allocation of certain expenses is more fairly made directly to the Fund or to specific classes within a Fund. |
| d) | Fees Paid Indirectly – The Company, on behalf of the Fund, has entered into agreements with State Street Global Markets, LLC and Russell Implementation Services, Inc. to partially recapture non-discounted trade commissions. Such rebates are used to pay a portion of the Fund’s expenses. In addition, the Fund’s custodian bank has also agreed to reduce its fees when the Fund maintains cash on deposit in a non-interest-bearing custody account. For the six-month period ended June 30, 2012, these amounts, if any, are included in the Statement of Operations. |
The ratio of expenses to average net assets in the accompanying financial highlights excludes the reduction in expenses related to fees paid indirectly. The annualized expense ratio for the period listed below reflecting the reduction for fees paid indirectly is as follows:
| Annualized Six- Month Period Ended June 30, 2012 | ||||
| Class IA | 0.91 | % | ||
| Class IB | 1.16 | % | ||
| e) | Distribution Plan for Class IB shares – The Company, on behalf of the Fund, has adopted a Distribution Plan pursuant to Rule 12b-1 of the 1940 Act to compensate the Distributor, Hartford Securities Distribution Company, Inc. (a wholly owned, ultimate subsidiary of The Hartford), from assets attributable to the Class IB shares for services rendered and expenses borne in connection with activities primarily intended to result in the sale of the Class IB shares, subject to the review and approval of the Company’s Board of Directors. |
The Distribution Plan provides that the Fund may pay annually up to 0.25% of the average daily net assets of the Fund attributable to its Class IB shares for activities primarily intended to result in the sale of Class IB shares. The Board has
| 19 |
Hartford Healthcare HLS Fund
Notes to Financial Statements – (continued)
June 30, 2012 (Unaudited)
(000’s Omitted)
the authority to suspend or reduce these payments at any point in time. Under the terms of the Distribution Plan and the principal underwriting agreement, the Fund is authorized to make payments monthly to the Distributor that may be used to pay or compensate entities providing distribution and shareholder servicing with respect to the Class IB shares for such entities’ fees or expenses incurred or paid in that regard. These fees are accrued daily and paid monthly.
| f) | Other Related Party Transactions – Certain officers of the Fund are directors and/or officers of HL Advisors and/or The Hartford or its subsidiaries. For the six-month period ended June 30, 2012, a portion of the Fund’s chief compliance officer’s salary was paid by all the investment companies in the Hartford fund complex. The portion allocated to the Fund rounds to zero. Hartford Administrative Services Company (“HASCO”), an indirect wholly owned subsidiary of The Hartford, provides transfer agent services to the Fund. HASCO was compensated on a per account basis for providing such services. The amount paid to HASCO can be found in the Statement of Operations. These fees are accrued daily and paid monthly. |
| g) | Payment from Affiliate – In July of 2007, The Hartford entered into a settlement with the Attorneys General of the states of New York, Connecticut and Illinois relating to market timing and the company's individual variable annuity contracts in which certain payments would be made directly to the variable annuity contract holders. The distribution plan provided that unclaimed money from the settlement would be distributed to certain HLS Funds that are investment options through a Hartford individual variable annuity contract. The unclaimed money was distributed to the Fund on September 18, 2009. |
The total return in the accompanying financial highlights includes a payment from an affiliate. Had the payment from the affiliate been excluded, the impact and total return for the period listed below would have been as follows:
| For the Year Ended December 31, 2009 | ||||||||
| Class IA | Class IB | |||||||
| Impact from Payment from Affiliate for Attorneys General Settlement | 0.01 | % | 0.01 | % | ||||
| Total Return Excluding Payment from Affiliate | 22.70 | % | 22.39 | % | ||||
| 8. | Investment Transactions: |
For the six-month period ended June 30, 2012, the Fund's aggregate purchases and sales of investment securities (excluding short-term investments) were as follows:
| Amount | ||||
| Cost of Purchases Excluding U.S. Government Obligations | $ | 42,062 | ||
| Sales Proceeds Excluding U.S. Government Obligations | 52,112 | |||
| 9. | Line of Credit: |
The Fund is one of several Hartford funds that participate in a $500 million committed revolving line of credit facility. The facility is to be used for temporary or emergency purposes. Under the arrangement, the funds are required to own securities having a market value in excess of 300% of the total bank borrowings. The interest rate on borrowings varies depending on the nature of the loan. The facility also requires a fee to be paid based on the amount of the commitment. This commitment fee is allocated to all of the funds participating in the line of credit based on the average net assets of the funds. During the six-month period ended June 30, 2012, the Fund did not have any borrowings under this facility.
| 10. | Industry Classifications: |
Other than the industry classifications “Other Investment Pools and Funds” and “Exchange Traded Funds,” equity industry classifications used in this report are the Global Industry Classification Standard, which was developed by and is the exclusive property and service mark of MSCI, Inc. and Standard & Poor’s.
| 20 |
| 11. | Indemnifications: |
Under the Company’s organizational documents, the Company shall indemnify its officers and directors to the full extent required or permitted under Maryland General Corporation Law and the federal securities laws. In addition, the Company, on behalf of the Fund, may enter into contracts that contain a variety of indemnifications. The Company’s maximum exposure under these arrangements is unknown. However, as of the date of these financial statements, the Company has not had prior claims or losses pursuant to these contracts and expects the risk of loss to be remote.
| 21 |
Financial Highlights
– Selected Per-Share Data – (A)
| Class | Net Asset | Net Investment | Payments from | Net Realized | Total from | Dividends from | Distributions | Distributions | Total | Net Increase | Net Asset | |||||||||||||||||||||||||||||||||
| For the Six-Month Period Ended June 30, 2012 (Unaudited) | ||||||||||||||||||||||||||||||||||||||||||||
| IA | $ | 15.07 | $ | 0.06 | $ | – | $ | 2.43 | $ | 2.49 | $ | – | $ | – | $ | – | $ | – | $ 2.49 | $ 17.56 | ||||||||||||||||||||||||
| IB | 14.74 | 0.04 | – | 2.37 | 2.41 | – | – | – | – | 2.41 | 17.15 | |||||||||||||||||||||||||||||||||
| For the Year Ended December 31, 2011 | ||||||||||||||||||||||||||||||||||||||||||||
| IA | 13.89 | 0.06 | – | 1.13 | 1.19 | (0.01 | ) | – | – | (0.01 | ) | 1.18 | 15.07 | |||||||||||||||||||||||||||||||
| IB | 13.61 | 0.02 | – | 1.11 | 1.13 | – | – | – | – | 1.13 | 14.74 | |||||||||||||||||||||||||||||||||
| For the Year Ended December 31, 2010 | ||||||||||||||||||||||||||||||||||||||||||||
| IA | 12.99 | 0.08 | – | 0.84 | 0.92 | (0.02 | ) | – | – | (0.02 | ) | 0.90 | 13.89 | |||||||||||||||||||||||||||||||
| IB | 12.74 | 0.04 | – | 0.83 | 0.87 | – | – | – | – | 0.87 | 13.61 | |||||||||||||||||||||||||||||||||
| For the Year Ended December 31, 2009 | ||||||||||||||||||||||||||||||||||||||||||||
| IA | 10.66 | 0.07 | – | 2.35 | 2.42 | (0.07 | ) | (0.02 | ) | – | (0.09 | ) | 2.33 | 12.99 | ||||||||||||||||||||||||||||||
| IB | 10.46 | 0.03 | – | 2.31 | 2.34 | (0.04 | ) | (0.02 | ) | – | (0.06 | ) | 2.28 | 12.74 | ||||||||||||||||||||||||||||||
| For the Year Ended December 31, 2008 | ||||||||||||||||||||||||||||||||||||||||||||
| IA | 15.39 | 0.06 | – | (3.99 | ) | (3.93 | ) | (0.06 | ) | (0.74 | ) | – | (0.80 | ) | (4.73 | ) | 10.66 | |||||||||||||||||||||||||||
| IB | 15.11 | 0.02 | – | (3.91 | ) | (3.89 | ) | (0.02 | ) | (0.74 | ) | – | (0.76 | ) | (4.65 | ) | 10.46 | |||||||||||||||||||||||||||
| For the Year Ended December 31, 2007 | ||||||||||||||||||||||||||||||||||||||||||||
| IA | 16.84 | 0.03 | – | 0.99 | 1.02 | (0.02 | ) | (2.45 | ) | – | (2.47 | ) | (1.45 | ) | 15.39 | |||||||||||||||||||||||||||||
| IB | 16.59 | (0.02 | ) | – | 0.99 | 0.97 | – | (2.45 | ) | – | (2.45 | ) | (1.48 | ) | 15.11 | |||||||||||||||||||||||||||||
| (A) | Information presented relates to a share outstanding throughout the indicated period. |
| (B) | The figures do not include sales charges or other fees which may be applied at the variable life insurance, variable annuity or qualified retirement plan product level. Any such additional sales charges or other fees would lower the Fund's performance. |
| (C) | Ratios do not reflect reductions for fees paid indirectly. Please see Fees Paid Indirectly in the Notes to Financial Statements. |
| (D) | Portfolio turnover rate is calculated on the basis of the Fund as a whole without distinguishing between the classes of shares issued. |
| (E) | Not annualized. |
| (F) | Annualized. |
| (G) | Total return without the inclusion of the Payment from (to) Affiliate can be found in Expenses in the accompanying Notes to Financial Statements. |
| 22 |
– Ratios and Supplemental Data –
| Total Return(B) | Net Assets at End of Period | Ratio of Expenses to Average Net Assets Before Waivers(C) | Ratio of Expenses to Average Net Assets After Waivers(C) | Ratio of Net Investment Income (Loss) to Average Net Assets | Portfolio Turnover Rate(D) | |||||||||||||||||
| 16.50 | %(E) | $ | 153,647 | 0 91 | %(F) | 0.91 | %(F) | 0.66 | %(F) | 21 | % | |||||||||||
| 16.36 | (E) | 52,292 | 1.16 | (F) | 1.16 | (F) | 0.40 | (F) | – | |||||||||||||
| 8.54 | 137,088 | 0.91 | 0.91 | 0.33 | 45 | |||||||||||||||||
| 8.27 | 48,933 | 1.16 | 1.16 | 0.08 | – | |||||||||||||||||
| 7.10 | 137,454 | 0.90 | 0.90 | 0.55 | 32 | |||||||||||||||||
| 6.84 | 54,753 | 1.15 | 1.15 | 0.30 | – | |||||||||||||||||
| 22.72 | (G) | 154,216 | 0.91 | 0.91 | 0.51 | 73 | ||||||||||||||||
| 22.41 | (G) | 63,065 | 1.16 | 1.16 | 0.26 | – | ||||||||||||||||
| (25.56 | ) | 179,087 | 0.88 | 0.88 | 0.42 | 57 | ||||||||||||||||
| (25.75 | ) | 62,080 | 1.13 | 1.13 | 0.17 | – | ||||||||||||||||
| 6.12 | 289,561 | 0.87 | 0.87 | 0.16 | 39 | |||||||||||||||||
| 5.86 | 105,898 | 1.12 | 1.12 | (0.09 | ) | – | ||||||||||||||||
| 23 |
Directors and Officers (Unaudited)
The Board of Directors of the Company appoints officers who are responsible for the day-to-day operations of the Fund and who execute policies formulated by the Directors. Each director serves until his or her death, resignation, or retirement or until the next annual meeting of shareholders is held or until his or her successor is elected and qualifies.
Directors and officers who are employed by or who have a financial interest in The Hartford are considered “interested” persons of the Fund pursuant to the 1940 Act. Each officer and two of the Company’s directors, as noted in the chart below, are “interested” persons of the Fund. Each director serves as a director for The Hartford Mutual Funds, Inc., The Hartford Mutual Funds II, Inc., Hartford Series Fund, Inc., Hartford HLS Series Fund II, Inc., and as a trustee for The Hartford Alternative Strategies Fund, which, as of June 30, 2012, collectively consist of 89 funds. Correspondence may be sent to directors and officers c/o Hartford Mutual Funds, P.O. Box 2999, Hartford, Connecticut 06104-2999, except that correspondence to Mr. Annoni, Mr. Dressen and Ms. Fagely may be sent to 500 Bielenberg Drive, Woodbury, Minnesota 55125.
The table below sets forth, for each director and officer, his or her name, year of birth, current position with the Company and date first elected or appointed to Hartford Series Fund, Inc. (“HSF”), and Hartford HLS Series Fund II, Inc. (“HSF2”), principal occupation, and, for directors, other directorships held. The Fund’s statement of additional information contains further information on the directors and is available free of charge by calling 1-800-862-6668 or writing to Hartford HLS Funds, c/o Individual Annuity Services, P.O. Box 5085, Hartford, CT 06102-5085.
Information on the aggregate remuneration paid to the directors of the Company can be found in the Statement of Operations herein. The Fund pays to The Hartford a portion of the Chief Compliance Officer’s compensation, but does not pay salaries or compensation to any of their other officers or directors who are employed by The Hartford.
Non-Interested Directors
Lynn S. Birdsong (1946) Director since 2003, Co-Chairman of the Investment Committee
Mr. Birdsong is a private investor. Mr. Birdsong currently serves as a Director of the Sovereign High Yield Investment Company (April 2010 to current). Mr. Birdsong currently serves as an Independent Director of Nomura Partners Funds, Inc. (formerly, The Japan Fund) (March 2003 to current). From 1979 to 2002, Mr. Birdsong was a managing director of Zurich Scudder Investments, an investment management firm. During his employment with Scudder, Mr. Birdsong was an Interested Director of The Japan Fund. Since 1981, Mr. Birdsong has been a partner in Birdsong Company, an advertising specialty firm.
Robert M. Gavin, Jr. (1940) Director since 2002 (HSF) and 1986 (HSF2), Chairman of the Board since 2004
Dr. Gavin is an educational consultant. Prior to September 1, 2001, he was President of Cranbrook Education Community and prior to July 1996, he was President of Macalester College, St. Paul, Minnesota.
Duane E. Hill (1945) Director since 2001 (HSF) and 2002 (HSF2), Chairman of the Nominating Committee
Mr. Hill is Partner of TSG Ventures L.P., a private equity investment company. Mr. Hill is a former partner of TSG Capital Group, a private equity investment firm that served as sponsor and lead investor in leveraged buyouts of middle market companies.
Sandra S. Jaffee (1941) Director since 2005
Ms. Jaffee is the founder and Chief Executive Officer of a private company, Homeworks Concierge, LLC, which provides residential property management services in Westchester County, New York (January 2012 to present). Ms. Jaffee served as Chairman (2008 to 2009) and Chief Executive Officer of Fortent (formerly Searchspace Group), a leading provider of compliance/regulatory technology to financial institutions from August 2005 to August 2009. Ms. Jaffe currently serves as a member of the Board of Directors of Broadridge Financial Solutions as well as a Trustee of Muhlenberg College.
William P. Johnston (1944) Director since 2005, Chairman of the Compliance Committee
In June 2006, Mr. Johnston was appointed as Senior Advisor to The Carlyle Group, a global private equity investment firm. In August 2007, Mr. Johnston was elected to the Board of Directors of LifeCare Holdings, Inc. In February 2008, Mr. Johnston was elected to the Board of Directors of HCR-ManorCare, Inc. In May 2006, Mr. Johnston was elected to the Supervisory Board of Fresenius Medical Care AG & Co. KGaA, after its acquisition of Renal Care Group, Inc. in March 2006.
Phillip O. Peterson (1944) Director since 2002 (HSF) and 2000 (HSF2), Chairman of the Audit Committee
Mr. Peterson is a mutual fund industry consultant. He was a partner of KPMG LLP (an accounting firm) until July 1999. Mr. Peterson joined William Blair Funds in February 2007 as a member of the Board of Trustees. Mr. Peterson also joined the Board of Trustees of Symetra Variable Mutual Funds Trust as a trustee in February 2012.
| 24 |
Lemma W. Senbet (1946) Director since 2005
Dr. Senbet is the William E. Mayer Chair Professor of Finance and Director, Center for Financial Policy, at the University of Maryland, Robert H. Smith School of Business. He was chair of the Finance Department from 1998 to 2006. Previously he was a chaired professor of finance at the University of Wisconsin-Madison. Also, he was director of the Fortis Funds from March 2000 to July 2002. Dr. Senbet served the finance profession in various capacities, including as director of the American Finance Association and President of the Western Finance Association. In 2006, Dr. Senbet was inducted Fellow of Financial Management Association International for his career-long distinguished scholarship and professional service.
Interested Directors and Officers
David N. Levenson (1966) Director since 2010(1)
Mr. Levenson currently serves as President of The Hartford’s Wealth Management business. He was appointed to this role in July 2010. Previously, Mr. Levenson served as Executive Vice President of Legacy Holdings for The Hartford from June 2009 to July 2010. From 2006 to 2009, Mr. Levenson was with Hartford Life Insurance K.K. where he served as President and Chief Executive Officer from 2007 to 2009. He served as Managing Director of Hartford Investment Management Company from 2005 to 2006. Additionally, Mr. Levenson serves as Executive Vice President of The Hartford and as President, Director and Chief Executive Officer of Hartford Life Insurance Company (“HLIC”) and Hartford Life, Inc. (“HL Inc.”).
(1) Mr. Levenson served as Interested Director until August 2, 2012.
Lowndes A. Smith (1939) Director since 1996 (HSF) and 2002 (HSF2), Co-Chairman of the Investment Committee
Mr. Smith served as Vice Chairman of The Hartford from February 1997 to January 2002, as President and Chief Executive Officer of HL Inc. from February 1997 to January 2002, and as President and Chief Operating Officer of The Hartford Life Insurance Companies from January 1989 to January 2002. Mr. Smith serves as a Director of White Mountains Insurance Group, Ltd., One Beacon Insurance and Symetra Financial and as Managing Director of Whittington Gray Associates.
Other Officers
James E. Davey (1964) President and Chief Executive Officer since 2010(2)
Mr. Davey serves as Executive Vice President of HLIC. Additionally, Mr. Davey serves as President, Chief Executive Officer and Manager of HIFSCO and President, Chief Executive Officer and Manager of HL Investment Advisors, LLC (“HL Advisors”). Mr. Davey joined The Hartford in 2002.
(2) Mr. Davey became an Interested Director effective August 2, 2012.
Mark A. Annoni (1964) Vice President, Controller and Treasurer since 2012(3)
Mr. Annoni serves as the Assistant Vice President and Director of Investment Finance (February 2004 to present). Mr. Annoni joined The Hartford in April 2001 as part of The Hartford’s acquisition of Fortis Financial Group. Prior to joining The Hartford, Mr. Annoni served as Manager of Mutual Fund Accounting at Fortis Financial Group (July 1997 to April 2001).
(3) Mr. Annoni was named Vice President, Controller and Treasurer on May 8, 2012.
Michael R. Dressen (1963) AML Compliance Officer since 2011
Mr. Dressen currently serves as Assistant Vice President of HLIC. He also serves as Chief Compliance Officer and AML Compliance Officer of Hartford Administrative Services Company (“HASCO”) and as Assistant Secretary and Compliance Officer of HIFSCO. Mr Dressen joined The Hartford in 2005 from State Farm Insurance Companies where he held various positions related to mutual funds, variable products, and property casualty insurance.
Tamara L. Fagely (1958) Vice President, since 2002 (HSF) and 1993 (HSF2)(4)
Ms. Fagely has been a Vice President of HASCO since 1998 and Chief Financial Officer since 2006. Currently Ms. Fagely is a Vice President of HLIC. She served as Assistant Vice President of HLIC from December 2001 through March 2005. In addition, Ms. Fagely is Controller and Chief Financial Officer of HIFSCO.
(4) Ms. Fagely served as Vice President, Controller and Treasurer until May 8, 2012.
Dr. Robert J. Froehlich (1953) Senior Managing Director since 2009(5)
Dr. Froehlich joined The Hartford as Senior Managing Director in September 2009. Prior to joining The Hartford, Dr. Froehlich served as Vice Chairman of Deutsche Asset Management from 1997-2009.
(5) Dr. Froehlich served as Senior Managing Director until March 26, 2012.
| 25 |
Hartford Healthcare HLS Fund
Directors and Officers (Unaudited) – (continued)
Edward P. Macdonald (1967) Vice President, Secretary and Chief Legal Officer since 2005
Mr. Macdonald serves as Vice President of HLIC and Chief Legal Officer of Mutual Funds and Vice President of HIFSCO. He also serves as Vice President and Secretary of HASCO, and Chief Legal Officer, Secretary and Vice President of HL Advisors. Mr. Macdonald joined The Hartford in 2005.
Vernon J. Meyer (1964) Vice President since 2006
Mr. Meyer serves as Senior Vice President of HLIC. He also serves as Senior Vice President of HIFSCO and HL Advisors. Mr. Meyer joined The Hartford in 2004.
Colleen B. Pernerewski (1969) Vice President and Chief Compliance Officer since 2010
Ms. Pernerewski serves as Vice President and Chief Investment Advisor Compliance Officer of HIFSCO and as Vice President and Chief Compliance Officer of HL Advisors. Ms. Pernerewski serves as Vice President and Chief Compliance Officer of Individual Annuity of HLIC. Ms. Pernerewski joined The Hartford in 2005 from Travelers Life and Annuity where she served as Counsel (2004-2005). Prior to Travelers Life and Annuity, Ms. Pernerewski held the position of Counsel at The Hartford (1998-2004).
Elizabeth L. Schroeder (1966) Vice President since 2010
Ms. Schroeder currently serves as Assistant Vice President of HLIC. Ms. Schroeder joined HLIC in 1991. She is also an Assistant Vice President of HASCO, HIFSCO and HL Advisors.
Martin Swanson (1962) Vice President since 2010
Mr. Swanson is a Vice President of HLIC. Mr. Swanson also serves as Vice President/Marketing for HIFSCO. Prior to joining HLIC in 1998, Mr. Swanson was a Vice President at PaineWebber, Inc.
Jane Wolak (1961) Vice President since 2009
Ms. Wolak currently serves as Senior Vice President of HLIC. Ms. Wolak joined HLIC as Vice President, Retail Product Services in May 2007. She is also Vice President of HASCO. Previously, Ms. Wolak was with Sun Life Financial where she held the position of Vice President, Service Center Operations from 2001-2007.
HOW TO OBTAIN A COPY OF THE FUND’S PROXY VOTING POLICIES AND VOTING RECORDS (UNAUDITED)
A description of the policies and procedures that the Fund uses to determine how to vote proxies relating to portfolio securities and a record of how the Fund voted any proxies for the twelve-month period ended June 30, 2012 are available (1) without charge, upon request, by calling 800-862-6668 and (2) on the SEC’s website at http://www.sec.gov.
QUARTERLY PORTFOLIO HOLDINGS INFORMATION (UNAUDITED)
The Fund files a complete schedule of portfolio holdings with the SEC for the first and third quarters of each fiscal year on Form N-Q. The Fund’s Forms are available (1) without charge, upon request, by calling 800-862-6668 and (2) on the SEC’s website at http://www.sec.gov. The Form N-Q may be reviewed and copied at the SEC’s Public Reference Room in Washington, DC. Information on the operation of the Public Reference Room may be obtained by calling 1-800-SEC-0330.
| 26 |
Expense Example (Unaudited)
Your Fund's Expenses
As a shareholder of the Fund, you incur two types of costs: (1) transaction costs and (2) ongoing costs including investment management fees, distribution fees, and other fund expenses. This example is intended to help you understand your ongoing costs (in dollars) of investing in the Fund and to compare these costs with the ongoing costs of investing in other mutual funds. The example is based on an investment of $1,000 invested at the beginning of the period and held for the period of December 31, 2011 through June 30, 2012.
Actual Expenses
The first set of columns of the table below provides information about actual account values and actual expenses. You may use the information in this column, together with the amount you invested, to estimate the expenses that you paid over the period. Simply divide your account value by $1,000 (for example, an $8,600 account value divided by $1,000 = 8.6), then multiply the result by the number in the line under the heading entitled “Expenses Paid During Period” to estimate the expenses you paid on your account during this period.
Hypothetical Example for Comparison Purposes
The second set of columns of the table below provides information about hypothetical account values and hypothetical expenses based on the Fund’s actual expense ratio and an assumed rate of return of 5% per year before expenses, which is not the Fund’s actual return. The hypothetical account values and expenses may not be used to estimate the actual ending account balance or expenses you paid for the period. You may use this information to compare the ongoing costs of investing in the Fund and other funds. To do so, compare this 5% hypothetical example with the 5% hypothetical examples that appear in the shareholder reports of the other funds.
Please note that the expenses shown in the table are meant to highlight your ongoing costs only and do not reflect any transactional costs, such as sales charges (loads) and CDSC. Therefore, the second set of columns of the table is useful in comparing ongoing costs only, and will not help you determine the relative total costs of owning different funds. In addition, if these transactional costs were included, your costs would be higher. Expenses are equal to the Fund's annualized expense ratios multiplied by average account value over the period, multiplied by 182/366 (to reflect the one-half year period).
| Actual return | Hypothetical (5% return before expenses) | |||||||||||||||||||||||||||||||||||
| Beginning Account Value December 31, 2011 | Ending Account Value June 30, 2012 | Expenses paid during the period December 31, 2011 through June 30, 2012 | Beginning Account Value December 31, 2011 | Ending Account Value June 30, 2012 | Expenses paid during the period December 31, 2011 through June 30, 2012 | Annualized expense ratio | Days in the current ½ year | Days in the full year | ||||||||||||||||||||||||||||
| Class IA | $ | 1,000.00 | $ | 1,165.04 | $ | 4.90 | $ | 1,000.00 | $ | 1,020.34 | $ | 4.57 | 0.91 | % | 182 | 366 | ||||||||||||||||||||
| Class IB | $ | 1,000.00 | $ | 1,163.59 | $ | 6.24 | $ | 1,000.00 | $ | 1,019.10 | $ | 5.82 | 1.16 | % | 182 | 366 | ||||||||||||||||||||
| 27 |
HARTFORD HLS FUNDS
c/o The Hartford Wealth Management - Global Annuities
P.O. Box 14293
Lexington, KY 40512-4293
Hartford Series Fund, Inc. is underwritten and distributed by Hartford Securities Distribution Company, Inc.
"The Hartford" is The Hartford Financial Services Group, Inc. and its subsidiaries.
Hartford Series Fund, Inc. inception dates range from 1977 to date. Hartford Series Fund, Inc. is not a subsidiary of The Hartford but is underwritten, distributed by and advised by subsidiaries of The Hartford. Investments in Hartford Series Fund, Inc. are not guaranteed by The Hartford or any other entity.
You should carefully consider investment objectives, risks, and charges and expenses of Hartford HLS Funds before investing. This and other information can be found in the Fund’s prospectus or summary prospectus, which can be obtained by calling 800-862-6668. Please read them carefully before you invest or send money.
| HLSSAR-HC12 8-12 111647 Printed in U.S.A ©2012 The Hartford, Hartford, CT 06115 | |

A MESSAGE FROM THE PRESIDENT
Dear Fellow Shareholders:
I want to take this opportunity to say thank you for investing in the Hartford HLS Funds. We’ve seen continued market volatility throughout the first half of 2012, and there will likely be continued uncertainty until the Presidential election in November, but we are still optimistic about the markets in 2012.
Market Review
In the first quarter of 2012, the S&P 500 Index turned in its best quarterly performance since the third quarter of 2009. U.S. equities showed signs of improvement as investors focused on improving economic data and strong corporate earnings news and the Federal Reserve’s pledge to keep interest rates low buoyed investors’ appetites.
The second quarter ended on a high note for the stock market—the S&P 500 had its strongest June in more than a decade and the Dow Jones Industrial Average had its best month since October—but those gains weren’t enough to offset losses from April and May, and equities finished the quarter in the red. Although the S&P 500 was -2.75 for the second quarter, it was up 9.49% for the first half of 2012.
Concerns about domestic and European unemployment are having an effect on our economy. The unemployment rate in the euro zone's 17 nations rose to a record 11.1% in May, the highest level since the euro launched as a common currency more than 10 years ago. In the U.S., the labor market has been fickle this year, with job growth starting off strong in the first couple months of 2012 but slowing down in the spring, which has led many to wonder about the status of the economic recovery.
On a positive note, home prices are rising again after falling for more than five years, new and existing home sales are increasing, and home builders are ramping up construction.
The Hartford HLS Funds Expands Relationship with Wellington Management
We’re very pleased that we are expanding our relationship with Wellington Management, which will now serve as the primary sub-adviser for the Hartford HLS Funds including equity, fixed-income,* and asset-allocation funds. One of America’s oldest and largest investment management firms, Wellington Management has resources that span the entire globe, with multiple offices across the U.S. and numerous offices abroad. Wellington Management’s most distinctive strength is its proprietary research, which is shared across the entire organization.
We believe that aligning more closely with a well-respected money manager like Wellington Management puts us in a strong position to drive significant growth and to continue delivering innovative fund strategies to help our investors meet their financial goals.
Thank you again for investing with the Hartford HLS Funds.
James Davey
President
Hartford HLS Funds
*Several fixed-income funds will continue to be sub-advised by Hartford Investment Management Company.
Table of Contents
This report is prepared for the general information of contract owners and qualified retirement plan participants. It is not an offer of contracts or of qualified retirement plans. It should not be used in connection with any offer, except in conjunction with the appropriate product prospectus which contains all pertinent information including the applicable sales, administrative and other charges.
The views expressed in the Fund’s Manager Discussion under ‘‘Why did the Fund perform this way?’’ and ‘‘What is the outlook?’’ are views of the Fund’s sub-adviser and portfolio management team through the end of the period and are subject to change based on market and other conditions.
| Hartford High Yield HLS Fund inception 09/30/1998 |
| (sub-advised by Wellington Management Company, LLP) |
| Investment objective – Seeks to provide high current income, and long-term total return. |
Performance Overview 6/30/02 - 6/30/12

The chart above shows the growth of a $10,000 investment in Class IA. Growth results in classes other than Class IA will vary from what is seen above due to differences in the expenses charged to those share classes.
Average Annual Total Returns (as of 6/30/12)
| 6 Month† | 1 Year | 5 year | 10 year | |||||||||||||
| High Yield IA | 6.86 | % | 6.09 | % | 7.75 | % | 8.56 | % | ||||||||
| High Yield IB | 6.73 | % | 5.83 | % | 7.49 | % | 8.29 | % | ||||||||
| Barclays U.S. Corporate High-Yield Index | 7.27 | % | 7.27 | % | 8.45 | % | 10.16 | % | ||||||||
| † | Not Annualized |
PAST PERFORMANCE IS NOT INDICATIVE OF FUTURE RESULTS.
Total returns presented above were calculated using the Fund's net asset value available to shareholders for sale or redemption of Fund shares on June 30, 2012, which may exclude investment transactions as of this date.
Performance information includes performance of the Fund’s previous sub-adviser, Hartford Investment Management Company. As of March 5, 2012, Hartford Investment Management Company no longer serves as the sub-adviser to the Fund.
Barclays U.S. Corporate High-Yield Index (formerly known as Barclays Capital U.S. Corporate High-Yield Index) is an unmanaged broad-based market-value-weighted index that tracks the total return performance of non-investment grade, fixed-rate, publicly placed, dollar denominated and nonconvertible debt registered with the Securities and Exchange Commission.
You cannot invest directly in an index.
The chart represents a hypothetical investment in the Fund. Performance data represents past performance and current performance could be higher or lower.
Performance information may reflect historical or current expense waivers/reimbursements from the investment adviser, without which performance would have been lower. For information on current expense waivers/reimbursements, please see the prospectus.
The value of the Fund will fluctuate so that when redeemed, it may be worth more or less than the original investment. The chart and table do not reflect the deductions of taxes, sales charges or other fees which may be applied at the variable life insurance, variable annuity or qualified retirement plan product level. Any such additional sales charges or other fees or expenses would lower the contract’s or plan’s performance.
| 2 |
| Hartford High Yield HLS Fund |
| Manager Discussion |
| June 30, 2012 (Unaudited) |
Portfolio Managers
Christopher A. Jones, CFA
Senior Vice President and Fixed Income Portfolio Manager
As of March 5, 2012, Wellington Management Company, LLP became the sub-adviser for the Fund. As of the same date, Hartford Investment Management Company no longer serves as the sub-adviser to the Fund.
How did the Fund perform?
The Class IA shares of the Hartford High Yield HLS Fund returned 6.86%, before sales charge, for the six-month period to June 30, 2012, underperforming its benchmark, the Barclays U.S. Corporate High Yield Bond Index, which returned 7.27% for the same period. The Fund outperformed the return of the average fund in the Lipper High Current Yield VP-UF Funds category, a group of funds with investment strategies similar to those of the Fund, which returned 6.48%.
Why did the Fund perform this way?
Underweight allocations (i.e. the Fund’s sector position was less than the benchmark position) to the Building Materials and Utilities sectors detracted from relative performance. Underweight allocations to the Energy and Metals sectors were additive to relative performance.
Within the Automotive sector, our overweight position in General Motors and TRW Automotive detracted from relative returns. In the Chemicals sector, our overweight positions in Ferro and Momentive Performance detracted from performance. In the Utilities sector, our overweights to Edison Mission Energy and Kinder Morgan detracted from relative performance. Our positions in General Motors (Automotive), Edison Mission Energy (Utilities), and TRW Automotive (Automotive) were the largest detractors from absolute returns (i.e. total return) during the period.
In the Energy sector, our overweight positions in First Reserve Corporation, Everest Acquisition, and Endeavour International represented our largest contributors to relative returns. Our underweight position in Arch Coal and a lack of exposure to Patriot Coal added to relative returns in the Metals sector. Within the Media Cable sector, our overweight positions in Wide Open West and Charter Communications contributed to relative performance. Our positions in KCA Deutag Drilling (Energy), CIT Group (Financials), and Swift Transportation (Transportation) were the largest contributors to absolute returns during the period.
Lower quality bonds outperformed higher quality bonds during the period. Security selection in CCC and below rated bonds contributed positively to relative returns over the period.
On March 5, 2012, Wellington Management Company, LLP became sub-adviser of the Fund replacing Hartford Investment Management Company. There was no change to the investment objective or strategy of the Fund.
What is the outlook?
We believe high yield bonds are positioned well to benefit from several tailwinds. The trailing 12-month par-weighted default rate for U.S. High Yield ended June at 2.16%, well below the 25-year annual default rate average of 4.20%. It appears that issuers have meaningfully strengthened their balance sheets and liquidity positions since the 2008 credit crisis. In recent years, proceeds from new issuances have been used mainly to refinance existing debt, which should help mitigate default risk over the next few years. Finally, the current yield of 7.35% as of June 30, 2012 compares favorably to other fixed-income sectors.
Nevertheless, risks remain. Prolonged negative headlines out of Europe and fading U.S. growth prospects could pressure corporate earnings and liquidity positions for European and U.S. issuers.
In aggregate, we recognize the risks of a severe macro economic backdrop. However, with average spreads currently in the 68th percentile (in only 32% of months since 1994 have U.S. high yield valuations been cheaper), we believe that now is an opportune time to invest in high yield for investors with a longer-time horizon. Over the course of 2012, we expect to see continued demand for high yield assets from investors seeking yield and from crossover investors looking to high yield as an equity substitute.
| 3 |
| Hartford High Yield HLS Fund |
| Manager Discussion (continued) |
| June 30, 2012 (Unaudited) |
Distribution by Credit Quality
as of June 30, 2012
| Credit Rating * | Percentage of Net Assets | |||
| Baa / BBB | 0.7 | % | ||
| Ba / BB | 30.3 | |||
| B | 39.3 | |||
| Caa / CCC or Lower | 17.0 | |||
| Unrated | 4.2 | |||
| Non Debt Securities and Other Short-Term Instruments | 7.1 | |||
| Other Assets & Liabilities | 1.4 | |||
| Total | 100.0 | % | ||
| * | Does not apply to the Fund itself. Based upon Moody’s and S&P long-term credit ratings for the Fund’s holdings as of the date noted. If Moody's and S&P assign different ratings to a holding, the lower rating is used. "Unrated" includes fixed-income securities (other than cash-like short-term instruments and U.S. Government securities) for which Moody’s and S&P have not issued long-term credit ratings. |
Diversification by Industry
as of June 30, 2012
| Industry | Percentage of Net Assets | |||
| Fixed Income Securities | ||||
| Accommodation and Food Services | 2.7 | % | ||
| Administrative Waste Management and Remediation | 0.9 | |||
| Agriculture, Forestry, Fishing and Hunting | 0.1 | |||
| Air Transportation | 0.5 | |||
| Arts, Entertainment and Recreation | 6.2 | |||
| Beverage and Tobacco Product Manufacturing | 0.7 | |||
| Chemical Manufacturing | 2.6 | |||
| Computer and Electronic Product Manufacturing | 3.3 | |||
| Construction | 1.4 | |||
| Fabricated Metal Product Manufacturing | 0.6 | |||
| Finance and Insurance | 13.3 | |||
| Food Services | 0.6 | |||
| Health Care and Social Assistance | 8.2 | |||
| Information | 17.6 | |||
| Machinery Manufacturing | 1.2 | |||
| Mining | 2.8 | |||
| Miscellaneous Manufacturing | 1.9 | |||
| Motor Vehicle and Parts Manufacturing | 1.4 | |||
| Nonmetallic Mineral Product Manufacturing | 0.5 | |||
| Other Services | 1.4 | |||
| Petroleum and Coal Products Manufacturing | 5.2 | |||
| Pipeline Transportation | 2.1 | |||
| Primary Metal Manufacturing | 0.4 | |||
| Professional, Scientific and Technical Services | 1.7 | |||
| Real Estate, Rental and Leasing | 3.7 | |||
| Retail Trade | 5.1 | |||
| Soap, Cleaning Compound and Toilet Manufacturing | 0.6 | |||
| Transportation Equipment Manufacturing | 0.3 | |||
| Utilities | 2.9 | |||
| Water Transportation | 0.5 | |||
| Wholesale Trade | 1.1 | |||
| Total | 91.5 | % | ||
| Equity Securities | ||||
| Diversified Financials | 1.4 | |||
| Energy | 0.1 | |||
| Food, Beverage & Tobacco | 0.0 | |||
| Software & Services | 0.0 | |||
| Total | 1.5 | % | ||
| Short-Term Investments | 5.6 | |||
| Other Assets and Liabilities | 1.4 | |||
| Total | 100.0 | % | ||
| 4 |
| Hartford High Yield HLS Fund |
| Schedule of Investments |
| June 30, 2012 (Unaudited) |
| (000’s Omitted) |
| Shares or Principal Amount | Market Value ╪ | |||||||
ASSET & COMMERCIAL MORTGAGE BACKED SECURITIES - 0.0% | ||||||||
| Finance and Insurance - 0.0% | ||||||||
| Soundview NIM Trust | ||||||||
| $ | 2,490 | 0.00%, 12/25/2036 ■● | $ | — | ||||
| Total asset & commercial mortgage backed securities | ||||||||
| (cost $2,479) | $ | — | ||||||
CORPORATE BONDS - 86.8% | ||||||||
| Accommodation and Food Services - 2.7% | ||||||||
| Caesars Operating Escrow | ||||||||
| $ | 4,180 | 8.50%, 02/15/2020 ■ | $ | 4,211 | ||||
| Choice Hotels International, Inc. | ||||||||
| 1,370 | 5.75%, 07/01/2022 | 1,432 | ||||||
| MGM Mirage, Inc. | ||||||||
| 3,236 | 11.13%, 11/15/2017 | 3,632 | ||||||
| Starwood Hotels & Resorts, Inc. | ||||||||
| 3,905 | 7.15%, 12/01/2019 | 4,602 | ||||||
| Wynn Las Vegas LLC | ||||||||
| 825 | 5.38%, 03/15/2022 ■ | 829 | ||||||
| 2,424 | 7.75%, 08/15/2020 | 2,685 | ||||||
| 17,391 | ||||||||
| Administrative Waste Management and Remediation - 0.9% | ||||||||
| Carlson Wagonlit B.V. | ||||||||
| 1,675 | 6.88%, 06/15/2019 ■ | 1,717 | ||||||
| Iron Mountain, Inc. | ||||||||
| 3,816 | 7.75%, 10/01/2019 | 4,121 | ||||||
| 5,838 | ||||||||
| Agriculture, Forestry, Fishing and Hunting - 0.1% | ||||||||
| American Rock Salt Co. LLC | ||||||||
| 835 | 8.25%, 05/01/2018 ■ | 722 | ||||||
| ASG Consolidated LLC | ||||||||
| 163 | 15.00%, 05/15/2017 ■Þ | 126 | ||||||
| 848 | ||||||||
| Arts, Entertainment and Recreation - 6.2% | ||||||||
| AMC Entertainment, Inc. | ||||||||
| 718 | 8.75%, 06/01/2019 | 770 | ||||||
| CCO Holdings LLC | ||||||||
| 5,090 | 7.25%, 10/30/2017 | 5,548 | ||||||
| 4,972 | 7.38%, 06/01/2020 | 5,463 | ||||||
| Cenveo, Inc. | ||||||||
| 3,103 | 8.88%, 02/01/2018 | 2,777 | ||||||
| Chester Downs & Marina LLC | ||||||||
| 1,040 | 9.25%, 02/01/2020 ■ | 1,084 | ||||||
| Clear Channel Worldwide Holdings, Inc. | ||||||||
| 3,395 | 9.25%, 12/15/2017 | 3,701 | ||||||
| Equinix, Inc. | ||||||||
| 2,050 | 7.00%, 07/15/2021 | 2,255 | ||||||
| Fidelity National Information Services, Inc. | ||||||||
| 2,505 | 5.00%, 03/15/2022 ■ | 2,549 | ||||||
| Gray Television, Inc. | ||||||||
| 3,400 | 10.50%, 06/29/2015 | 3,536 | ||||||
| Greektown Superholdings, Inc. | ||||||||
| 1,650 | 13.00%, 07/01/2015 | 1,803 | ||||||
| NAI Entertainment Holdings LLC | ||||||||
| 1,494 | 8.25%, 12/15/2017 ■ | 1,651 | ||||||
| Regal Entertainment Group | ||||||||
| 3,455 | 9.13%, 08/15/2018 | 3,800 | ||||||
| UnityMedia Hessen GmbH & Co. | ||||||||
| 2,455 | 8.13%, 12/01/2017 ■ | 2,639 | ||||||
| Virgin Media Finance plc | ||||||||
| 2,330 | 9.50%, 08/15/2016 | 2,598 | ||||||
| 40,174 | ||||||||
| Beverage and Tobacco Product Manufacturing - 0.7% | ||||||||
| Constellation Brands, Inc. | ||||||||
| 3,965 | 6.00%, 05/01/2022 | 4,262 | ||||||
| Chemical Manufacturing - 2.6% | ||||||||
| Ferro Corp. | ||||||||
| 3,873 | 7.88%, 08/15/2018 | 3,776 | ||||||
| Hexion Specialty Chemicals | ||||||||
| 3,055 | 8.88%, 02/01/2018 | 3,116 | ||||||
| Hexion U.S. Finance Corp. | ||||||||
| 1,245 | 6.63%, 04/15/2020 | 1,276 | ||||||
| Ineos Group Holdings plc | ||||||||
| 5,630 | 8.50%, 02/15/2016 ■ | 5,166 | ||||||
| LyondellBasell Industries N.V. | ||||||||
| 1,715 | 6.00%, 11/15/2021 ■ | 1,882 | ||||||
| Momentive Performance | ||||||||
| 2,045 | 9.00%, 01/15/2021 | 1,549 | ||||||
| 16,765 | ||||||||
| Computer and Electronic Product Manufacturing - 3.3% | ||||||||
| CDW Escrow Corp. | ||||||||
| 3,455 | 8.50%, 04/01/2019 | 3,680 | ||||||
| CDW LLC/CDW Finance | ||||||||
| 2,775 | 8.00%, 12/15/2018 | 3,011 | ||||||
| Freescale Semiconductor, Inc. | ||||||||
| 3,791 | 8.05%, 02/01/2020 | 3,744 | ||||||
| 1,645 | 9.25%, 04/15/2018 ■ | 1,760 | ||||||
| Nextel Communications, Inc. | ||||||||
| 2,914 | 7.38%, 08/01/2015 | 2,918 | ||||||
| Seagate HDD Cayman | ||||||||
| 2,630 | 7.75%, 12/15/2018 | 2,909 | ||||||
| Sorenson Communications | ||||||||
| 4,750 | 10.50%, 02/01/2015 ■ | 3,681 | ||||||
| 21,703 | ||||||||
| Construction - 1.4% | ||||||||
| D.R. Horton, Inc. | ||||||||
| 2,520 | 6.50%, 04/15/2016 | 2,728 | ||||||
| KB Home | ||||||||
| 3,750 | 8.00%, 03/15/2020 | 3,825 | ||||||
| Pulte Homes, Inc. | ||||||||
| 2,446 | 7.88%, 06/15/2032 | 2,324 | ||||||
| 8,877 | ||||||||
| Fabricated Metal Product Manufacturing - 0.6% | ||||||||
| BWAY Holding Co. | ||||||||
| 2,162 | 10.00%, 06/15/2018 | 2,378 | ||||||
| Masco Corp. | ||||||||
| 1,135 | 5.95%, 03/15/2022 | 1,169 | ||||||
| 320 | 7.13%, 03/15/2020 | 353 | ||||||
| 3,900 | ||||||||
| Finance and Insurance - 12.9% | ||||||||
| Ally Financial, Inc. | ||||||||
| 7,341 | 5.50%, 02/15/2017 | 7,457 | ||||||
| 3,330 | 7.50%, 09/15/2020 | 3,742 | ||||||
The accompanying notes are an integral part of these financial statements.
| 5 |
| Hartford High Yield HLS Fund |
| Schedule of Investments – (continued) |
| June 30, 2012 (Unaudited) |
| (000’s Omitted) |
| Shares or Principal Amount | Market Value ╪ | |||||||
| CORPORATE BONDS - 86.8% - (continued) | ||||||||
| Finance and Insurance - 12.9% - (continued) | ||||||||
| CIT Group, Inc. | ||||||||
| $ | 9,381 | 5.25%, 03/15/2018 | $ | 9,686 | ||||
| 7,533 | 5.50%, 02/15/2019 ■ | 7,740 | ||||||
| 3,320 | 6.63%, 04/01/2018 ■ | 3,577 | ||||||
| Community Choice Financial | ||||||||
| 3,810 | 10.75%, 05/01/2019 ■ | 3,772 | ||||||
| Fibria Overseas Finance Ltd. | ||||||||
| 3,535 | 7.50%, 05/04/2020 ■ | 3,659 | ||||||
| Ford Motor Credit Co. | ||||||||
| 3,000 | 12.00%, 05/15/2015 | 3,727 | ||||||
| GMAC LLC | ||||||||
| 2,040 | 8.00%, 11/01/2031 | 2,392 | ||||||
| Ineos Finance plc | ||||||||
| 1,220 | 7.50%, 05/01/2020 ■ | 1,229 | ||||||
| 715 | 8.38%, 02/15/2019 ■ | 740 | ||||||
| 4,085 | 9.00%, 05/15/2015 ■ | 4,310 | ||||||
| Lloyds Banking Group plc | ||||||||
| 6,180 | 7.88%, 11/01/2020 ■ | 5,593 | ||||||
| NB Capital Trust IV | ||||||||
| 1,256 | 8.25%, 04/15/2027 | 1,284 | ||||||
| Offshore Group Investments Ltd. | ||||||||
| 2,408 | 11.50%, 08/01/2015 | 2,613 | ||||||
| 1,600 | 11.50%, 08/01/2015 ■ | 1,736 | ||||||
| Provident Funding Associates L.P. | ||||||||
| 5,422 | 10.25%, 04/15/2017 ■ | 5,652 | ||||||
| SLM Corp. | ||||||||
| 2,515 | 6.25%, 01/25/2016 | 2,641 | ||||||
| 1,960 | 7.25%, 01/25/2022 | 2,073 | ||||||
| 2,335 | 8.45%, 06/15/2018 | 2,615 | ||||||
| TitleMax, Inc. | ||||||||
| 5,155 | 13.25%, 07/15/2015 | 5,696 | ||||||
| Wind Acquisition Finance S.A. | ||||||||
| 1,915 | 7.25%, 02/15/2018 ■ | 1,666 | ||||||
| 83,600 | ||||||||
| Food Services - 0.6% | ||||||||
| ARAMARK Holdings Corp. | ||||||||
| 3,615 | 8.63%, 05/01/2016 ■Þ | 3,701 | ||||||
| Landry's Acquisition Co. | ||||||||
| 126 | 11.63%, 12/01/2015 ■ | 138 | ||||||
| 3,839 | ||||||||
| Health Care and Social Assistance - 8.2% | ||||||||
| Alere, Inc. | ||||||||
| 2,409 | 7.88%, 02/01/2016 | 2,469 | ||||||
| 2,850 | 9.00%, 05/15/2016 | 2,900 | ||||||
| American Renal Holdings, Inc. | ||||||||
| 3,490 | 8.38%, 05/15/2018 | 3,691 | ||||||
| Biomet, Inc. | ||||||||
| 3,079 | 10.38%, 10/15/2017 Þ | 3,291 | ||||||
| Fresenius Medical Care US Finance II, Inc. | ||||||||
| 2,875 | 5.88%, 01/31/2022 ■ | 2,993 | ||||||
| HCA, Inc. | ||||||||
| 4,260 | 7.25%, 09/15/2020 | 4,686 | ||||||
| 11,394 | 7.50%, 11/15/2095 | 9,115 | ||||||
| 2,531 | 8.50%, 04/15/2019 | 2,835 | ||||||
| Health Management Associates, Inc. | ||||||||
| 2,070 | 7.38%, 01/15/2020 ■ | 2,202 | ||||||
| HealthSouth Corp. | ||||||||
| 5,165 | 7.25%, 10/01/2018 | 5,501 | ||||||
| Radiation Therapy Services, Inc. | ||||||||
| 4,360 | 8.88%, 01/15/2017 ■ | 4,186 | ||||||
| 3,700 | 9.88%, 04/15/2017 | 2,895 | ||||||
| Savient Pharmaceuticals, Inc. | ||||||||
| 3,500 | 4.75%, 02/01/2018 ۞ | 1,137 | ||||||
| Valeant Pharmaceuticals International | ||||||||
| 1,535 | 6.75%, 08/15/2021 ■ | 1,504 | ||||||
| 3,630 | 7.25%, 07/15/2022 ■ | 3,639 | ||||||
| 53,044 | ||||||||
| Information - 16.7% | ||||||||
| Audatex North America, Inc. | ||||||||
| 3,150 | 6.75%, 06/15/2018 ■ | 3,315 | ||||||
| Beagle Acquisition Corp. | ||||||||
| 1,640 | 11.00%, 12/31/2019 ■ | 1,837 | ||||||
| CCO Holdings LLC | ||||||||
| 2,910 | 6.63%, 01/31/2022 | 3,114 | ||||||
| Ceridian Corp. | ||||||||
| 985 | 8.88%, 07/15/2019 ■☼ | 1,017 | ||||||
| Cricket Communications, Inc. | ||||||||
| 6,055 | 7.75%, 10/15/2020 | 5,782 | ||||||
| DISH DBS Corp. | ||||||||
| 3,725 | 5.88%, 07/15/2022 ■ | 3,762 | ||||||
| 4,886 | 7.88%, 09/01/2019 | 5,631 | ||||||
| First Data Corp. | ||||||||
| 5,425 | 7.38%, 06/15/2019 ■ | 5,533 | ||||||
| 2,265 | 8.25%, 01/15/2021 ■ | 2,265 | ||||||
| 4,914 | 10.55%, 09/24/2015 Þ | 5,025 | ||||||
| GCI, Inc. | ||||||||
| 1,465 | 6.75%, 06/01/2021 | 1,417 | ||||||
| Harron Communications | ||||||||
| 2,830 | 9.13%, 04/01/2020 ■ | 2,929 | ||||||
| Inmarsat Finance plc | ||||||||
| 860 | 7.38%, 12/01/2017 ■ | 918 | ||||||
| Intelsat Bermuda Ltd. | ||||||||
| 7,947 | 11.50%, 02/04/2017 Þ | 8,205 | ||||||
| Intelsat Jackson Holdings S.A. | ||||||||
| 7,610 | 8.50%, 11/01/2019 ‡ | 8,428 | ||||||
| Lawson Software | ||||||||
| 1,890 | 9.38%, 04/01/2019 ■ | 2,018 | ||||||
| Level 3 Financing, Inc. | ||||||||
| 6,401 | 10.00%, 02/01/2018 | 6,929 | ||||||
| Mediacom Broadband LLC | ||||||||
| 3,590 | 8.50%, 10/15/2015 | 3,689 | ||||||
| Mediacom LLC | ||||||||
| 3,470 | 9.13%, 08/15/2019 | 3,808 | ||||||
| MetroPCS Wireless, Inc. | ||||||||
| 2,225 | 6.63%, 11/15/2020 | 2,192 | ||||||
| 4,710 | 7.88%, 09/01/2018 | 4,887 | ||||||
| Paetec Holding Corp. | ||||||||
| 2,127 | 9.88%, 12/01/2018 | 2,377 | ||||||
| Sprint Nextel Corp. | ||||||||
| 507 | 7.00%, 03/01/2020 ■ | 527 | ||||||
| 3,092 | 9.00%, 11/15/2018 ■ | 3,455 | ||||||
| Syniverse Holdings, Inc. | ||||||||
| 3,470 | 9.13%, 01/15/2019 | 3,765 | ||||||
| Trilogy International Partners LLC | ||||||||
| 1,353 | 10.25%, 08/15/2016 ■ | 1,103 | ||||||
| UnityMedia GmbH | ||||||||
| 2,496 | 7.50%, 03/15/2019 ■ | 2,646 | ||||||
The accompanying notes are an integral part of these financial statements.
| 6 |
| Shares or Principal Amount | Market Value ╪ | |||||||
| CORPORATE BONDS - 86.8% - (continued) | ||||||||
| Information - 16.7% - (continued) | ||||||||
| UPCB Finance III Ltd. | ||||||||
| $ | 2,868 | 6.63%, 07/01/2020 ■ | $ | 2,911 | ||||
| UPCB Finance VI Ltd. | ||||||||
| 1,845 | 6.88%, 01/15/2022 ■ | 1,882 | ||||||
| Videotron Ltee | ||||||||
| 2,430 | 9.13%, 04/15/2018 | 2,661 | ||||||
| Windstream Corp. | ||||||||
| 3,400 | 7.50%, 04/01/2023 | 3,485 | ||||||
| Zayo Escrow Corp. | ||||||||
| 660 | 8.13%, 01/01/2020 ■ | 690 | ||||||
| 480 | 10.13%, 07/01/2020 ■ | 510 | ||||||
| 108,713 | ||||||||
| Machinery Manufacturing - 1.2% | ||||||||
| Case New Holland, Inc. | ||||||||
| 6,921 | 7.88%, 12/01/2017 | 7,994 | ||||||
| Mining - 2.2% | ||||||||
| FMG Resources Pty Ltd. | ||||||||
| 3,500 | 6.00%, 04/01/2017 ■ | 3,517 | ||||||
| 3,662 | 7.00%, 11/01/2015 ■ | 3,735 | ||||||
| 1,434 | 8.25%, 11/01/2019 ■ | 1,520 | ||||||
| Peabody Energy Corp. | ||||||||
| 4,020 | 6.00%, 11/15/2018 ■ | 4,000 | ||||||
| 1,572 | 6.50%, 09/15/2020 | 1,592 | ||||||
| 14,364 | ||||||||
| Miscellaneous Manufacturing - 1.9% | ||||||||
| BE Aerospace, Inc. | ||||||||
| 521 | 5.25%, 04/01/2022 | 537 | ||||||
| 2,293 | 6.88%, 10/01/2020 | 2,534 | ||||||
| Reynolds Group Issuer, Inc. | ||||||||
| 1,995 | 7.88%, 08/15/2019 ■ | 2,159 | ||||||
| 1,190 | 9.75%, 04/15/2019 ■ | 1,187 | ||||||
| TransDigm Group, Inc. | ||||||||
| 5,140 | 7.75%, 12/15/2018 | 5,641 | ||||||
| 12,058 | ||||||||
| Motor Vehicle and Parts Manufacturing - 1.4% | ||||||||
| Ford Motor Co. | ||||||||
| 2,405 | 7.50%, 08/01/2026 | 2,790 | ||||||
| Tenneco, Inc. | ||||||||
| 3,500 | 7.75%, 08/15/2018 | 3,798 | ||||||
| TRW Automotive, Inc. | ||||||||
| 1,721 | 7.25%, 03/15/2017 ■ | 1,966 | ||||||
| 550 | 8.88%, 12/01/2017 ■ | 606 | ||||||
| 9,160 | ||||||||
| Nonmetallic Mineral Product Manufacturing - 0.5% | ||||||||
| Ardagh Packaging Finance | ||||||||
| 480 | 7.38%, 10/15/2017 ■ | 510 | ||||||
| Silgan Holdings, Inc. | ||||||||
| 2,910 | 5.00%, 04/01/2020 ■ | 2,975 | ||||||
| 3,485 | ||||||||
| Other Services - 1.4% | ||||||||
| Service Corp. International | ||||||||
| 7,975 | 7.63%, 10/01/2018 | 9,052 | ||||||
| Petroleum and Coal Products Manufacturing - 5.2% | ||||||||
| Alpha Natural Resources, Inc. | ||||||||
| 2,355 | 6.00%, 06/01/2019 | 2,008 | ||||||
| Antero Resources Finance Corp. | ||||||||
| 3,605 | 7.25%, 08/01/2019 | 3,731 | ||||||
| Chesapeake Energy Corp. | ||||||||
| 2,805 | 6.88%, 08/15/2018 | 2,791 | ||||||
| Continental Resources, Inc. | ||||||||
| 1,775 | 5.00%, 09/15/2022 ■ | 1,802 | ||||||
| Endeavour International | ||||||||
| 3,048 | 12.00%, 03/01/2018 ■ | 3,170 | ||||||
| Everest Acquisition LLC | ||||||||
| 570 | 6.88%, 05/01/2019 ■ | 596 | ||||||
| 5,467 | 9.38%, 05/01/2020 ■ | 5,665 | ||||||
| Ferrellgas Partners L.P. | ||||||||
| 891 | 6.50%, 05/01/2021 | 813 | ||||||
| Harvest Operations Corp. | ||||||||
| 1,315 | 6.88%, 10/01/2017 ■ | 1,397 | ||||||
| Lone Pine Resources, Inc. | ||||||||
| 1,995 | 10.38%, 02/15/2017 ■ | 1,880 | ||||||
| Newfield Exploration Co. | ||||||||
| 2,176 | 5.75%, 01/30/2022 | 2,274 | ||||||
| Plains Exploration & Production Co. | ||||||||
| 675 | 6.75%, 02/01/2022 | 689 | ||||||
| Range Resources Corp. | ||||||||
| 1,325 | 5.00%, 08/15/2022 | 1,308 | ||||||
| 1,755 | 5.75%, 06/01/2021 | 1,834 | ||||||
| Rosetta Resources, Inc. | ||||||||
| 3,468 | 9.50%, 04/15/2018 | 3,780 | ||||||
| 33,738 | ||||||||
| Pipeline Transportation - 2.1% | ||||||||
| El Paso Corp. | ||||||||
| 955 | 7.75%, 01/15/2032 | 1,074 | ||||||
| 3,260 | 7.80%, 08/01/2031 | 3,659 | ||||||
| Energy Transfer Equity L.P. | ||||||||
| 2,588 | 7.50%, 10/15/2020 | 2,840 | ||||||
| Kinder Morgan Finance Co. | ||||||||
| 2,850 | 6.00%, 01/15/2018 ■ | 2,964 | ||||||
| Markwest Energy | ||||||||
| 1,024 | 6.25%, 06/15/2022 | 1,055 | ||||||
| NGPL Pipeco LLC | ||||||||
| 2,075 | 7.12%, 12/15/2017 ■ | 2,075 | ||||||
| 13,667 | ||||||||
| Primary Metal Manufacturing - 0.4% | ||||||||
| Novelis, Inc. | ||||||||
| 2,513 | 8.75%, 12/15/2020 | 2,708 | ||||||
| Professional, Scientific and Technical Services - 1.7% | ||||||||
| Lamar Media Corp. | ||||||||
| 1,465 | 7.88%, 04/15/2018 | 1,612 | ||||||
| SunGard Data Systems, Inc. | ||||||||
| 3,685 | 7.38%, 11/15/2018 | 3,952 | ||||||
| 1,520 | 7.63%, 11/15/2020 | 1,619 | ||||||
| 3,650 | 10.25%, 08/15/2015 | 3,750 | ||||||
| 10,933 | ||||||||
| Real Estate, Rental and Leasing - 3.7% | ||||||||
| Air Lease Corp. | ||||||||
| 4,215 | 5.63%, 04/01/2017 ■ | 4,152 | ||||||
| Ashtead Capital, Inc. | ||||||||
| 385 | 6.50%, 07/15/2022 ■☼ | 385 | ||||||
| International Lease Finance Corp. | ||||||||
| 9,461 | 5.88%, 04/01/2019 | 9,470 | ||||||
| 1,720 | 6.25%, 05/15/2019 | 1,752 | ||||||
| 3,335 | 8.88%, 09/01/2017 | 3,760 | ||||||
| 7 |
| Hartford High Yield HLS Fund |
| Schedule of Investments – (continued) |
| June 30, 2012 (Unaudited) |
| (000’s Omitted) |
| Shares or Principal Amount | Market Value ╪ | |||||||
| CORPORATE BONDS - 86.8% - (continued) | ||||||||
| Real Estate, Rental and Leasing - 3.7% - (continued) | ||||||||
| United Rental Financing Escrow Corp. | ||||||||
| $ | 292 | 5.75%, 07/15/2018 ■ | $ | 304 | ||||
| 531 | 7.38%, 05/15/2020 ■ | 555 | ||||||
| 529 | 7.63%, 04/15/2022 ■ | 554 | ||||||
| United Rentals North America, Inc. | ||||||||
| 2,823 | 8.38%, 09/15/2020 | 2,971 | ||||||
| 23,903 | ||||||||
| Retail Trade - 3.4% | ||||||||
| Amerigas Partners L.P. | ||||||||
| 3,336 | 6.25%, 08/20/2019 | 3,353 | ||||||
| Building Materials Corp. | ||||||||
| 2,948 | 7.50%, 03/15/2020 ■ | 3,199 | ||||||
| GRD Holding III Corp. | ||||||||
| 2,860 | 10.75%, 06/01/2019 ■ | 2,831 | ||||||
| Libby Glass, Inc. | ||||||||
| 660 | 6.88%, 05/15/2020 ■ | 678 | ||||||
| Michaels Stores, Inc. | ||||||||
| 5,245 | 7.75%, 11/01/2018 | 5,533 | ||||||
| Number Merger Sub, Inc. | ||||||||
| 3,545 | 11.00%, 12/15/2019 ■ | 3,829 | ||||||
| Sally Holdings LLC | ||||||||
| 1,425 | 5.75%, 06/01/2022 | 1,491 | ||||||
| 1,395 | 6.88%, 11/15/2019 | 1,517 | ||||||
| 22,431 | ||||||||
| Soap, Cleaning Compound and Toilet Manufacturing - 0.6% | ||||||||
| Revlon Consumer Products | ||||||||
| 3,430 | 9.75%, 11/15/2015 | 3,670 | ||||||
| Transportation Equipment Manufacturing - 0.3% | ||||||||
| Huntington Ingalls Industries, Inc. | ||||||||
| 1,785 | 7.13%, 03/15/2021 | 1,865 | ||||||
| Utilities - 2.3% | ||||||||
| AES (The) Corp. | ||||||||
| 3,230 | 8.00%, 10/15/2017 | 3,674 | ||||||
| 2,409 | 9.75%, 04/15/2016 | 2,855 | ||||||
| Calpine Corp. | ||||||||
| 3,420 | 7.88%, 01/15/2023 ■ | 3,728 | ||||||
| Dolphin Subsidiary II, Inc. | ||||||||
| 2,615 | 7.25%, 10/15/2021 ■ | 2,902 | ||||||
| Texas Competitive Electric Co. | ||||||||
| 2,765 | 11.50%, 10/01/2020 ■ | 1,887 | ||||||
| 15,046 | ||||||||
| Water Transportation - 0.5% | ||||||||
| ACL I Corp. | ||||||||
| 3,640 | 10.63%, 02/15/2016 Þ | 3,495 | ||||||
| Wholesale Trade - 1.1% | ||||||||
| HD Supply, Inc. | ||||||||
| 4,490 | 8.13%, 04/15/2019 ■ | 4,849 | ||||||
| J.M. Huber Corp. | ||||||||
| 1,985 | 9.88%, 11/01/2019 ■ | 2,134 | ||||||
| 6,983 | ||||||||
| Total corporate bonds | ||||||||
| (cost $551,494) | $ | 563,506 | ||||||
| SENIOR FLOATING RATE INTERESTS ♦ - 4.7% | ||||||||
| Air Transportation - 0.5% | ||||||||
| Macquarie Aircraft Leasing Finance S.A., Second Lien Term Loan | ||||||||
| $ | 3,492 | 4.25%, 11/29/2013 | $ | 3,422 | ||||
| Finance and Insurance - 0.4% | ||||||||
| Asurion Corp., Second Lien Term Loan | ||||||||
| 2,371 | 9.00%, 05/24/2019 | 2,413 | ||||||
| Information - 0.9% | ||||||||
| WideOpenWest Finance LLC, Second Lien Term Loan | ||||||||
| 6,117 | 6.50%, 06/29/2015 Þ | 6,065 | ||||||
| Mining - 0.6% | ||||||||
| Arch Coal, Inc. | ||||||||
| 3,835 | 5.75%, 05/16/2018 | 3,762 | ||||||
| Retail Trade - 1.7% | ||||||||
| EB Sports Corp. | ||||||||
| 10,983 | 11.50%, 12/31/2015 Þ | 10,763 | ||||||
| Utilities - 0.6% | ||||||||
| Texas Competitive Electric Holdings Co. LLC | ||||||||
| 7,000 | 4.74%, 10/10/2017 | 4,179 | ||||||
| Total senior floating rate interests | ||||||||
| (cost $29,984) | $ | 30,604 | ||||||
COMMON STOCKS - 0.1% | ||||||||
| Energy - 0.1% | ||||||||
| 207,275 | KCA Deutag ⌂●† | $ | 947 | |||||
| Software & Services - 0.0% | ||||||||
| 38 | Stratus Technologies, Inc. ⌂●† | — | ||||||
| Total common stocks | ||||||||
| (cost $2,795) | $ | 947 | ||||||
PREFERRED STOCKS - 1.4% | ||||||||
| Diversified Financials - 1.4% | ||||||||
| 117 | Citigroup Capital XIII | $ | 3,184 | |||||
| 245 | GMAC Capital Trust I ۞ | 5,892 | ||||||
| 9,076 | ||||||||
| Software & Services - 0.0% | ||||||||
| 9 | Stratus Technologies, Inc. ⌂† | 107 | ||||||
| Total preferred stocks | ||||||||
| (cost $8,765) | $ | 9,183 | ||||||
WARRANTS - 0.0% | ||||||||
| Food, Beverage & Tobacco - 0.0% | ||||||||
| 2 | ASG Consolidated LLC ■ | $ | 83 | |||||
| Total warrants | ||||||||
| (cost $–) | $ | 83 | ||||||
The accompanying notes are an integral part of these financial statements.
| 8 |
| Shares or Principal Amount | Market Value ╪ | |||||||||||
| WARRANTS - 0.0% - (continued) | ||||||||||||
| Total long-term investments | ||||||||||||
| (cost $595,517) | $ | 604,323 | ||||||||||
| SHORT-TERM INVESTMENTS - 5.6% | ||||||||||||
| Repurchase Agreements - 5.6% | ||||||||||||
| Bank of America Merrill Lynch TriParty Joint Repurchase Agreement (maturing on 07/02/2012 in the amount of $19,290, collateralized by FHLMC 5.50% - 6.50%, 2035 - 2036, FNMA 5.00% - 6.00%, 2033 - 2039, value of $19,676) | ||||||||||||
| $ | 19,290 | 0.13%, 06/29/2012 | $ | 19,290 | ||||||||
| Barclays Capital TriParty Joint Repurchase Agreement (maturing on 07/02/2012 in the amount of $6,974, collateralized by U.S. Treasury Note 1.25% - 3.63%, 2014 - 2020, value of $7,113) | ||||||||||||
| 6,974 | 0.15%, 06/29/2012 | 6,974 | ||||||||||
| Deutsche Bank Securities TriParty Joint Repurchase Agreement (maturing on 07/02/2012 in the amount of $1,868, collateralized by U.S. Treasury Note 0.88%, 2016, value of $1,906) | ||||||||||||
| 1,868 | 0.20%, 06/29/2012 | 1,868 | ||||||||||
| TD Securities TriParty Joint Repurchase Agreement (maturing on 07/02/2012 in the amount of $5,461, collateralized by FHLMC 4.00% - 6.00%, 2027 - 2041, FNMA 4.00% - 4.50%, 2025 - 2042, U.S. Treasury Bond 6.38%, 2027, U.S. Treasury Note 0.38% - 8.75%, 2012 - 2017, value of $5,570) | ||||||||||||
| 5,461 | 0.15%, 06/29/2012 | 5,461 | ||||||||||
| UBS Securities, Inc. Joint Repurchase Agreement (maturing on 07/02/2012 in the amount of $2, collateralized by U.S. Treasury Note 1.00%, 2013, value of $2) | ||||||||||||
| 2 | 0.13%, 06/29/2012 | 2 | ||||||||||
| UBS Securities, Inc. TriParty Joint Repurchase Agreement (maturing on 07/02/2012 in the amount of $2,461, collateralized by GNMA 4.00%, 2042, value of $2,510) | ||||||||||||
| 2,461 | 0.20%, 06/29/2012 | 2,461 | ||||||||||
| 36,056 | ||||||||||||
| Total short-term investments | ||||||||||||
| (cost $36,056) | $ | 36,056 | ||||||||||
| Total investments | ||||||||||||
| (cost $631,573) ▲ | 98.6 | % | $ | 640,379 | ||||||||
| Other assets and liabilities | 1.4 | % | 9,046 | |||||||||
| Total net assets | 100.0 | % | $ | 649,425 | ||||||||
| Note: | Percentage of investments as shown is the ratio of the total market value to total net assets. |
Prices of foreign equities that are principally traded on certain foreign markets may be adjusted daily pursuant to a fair value pricing service approved by the Board of Directors in order to reflect an adjustment for factors occurring after the close of certain foreign markets but before the close of the New York Stock Exchange.
| 9 |
| Hartford High Yield HLS Fund |
| Schedule of Investments – (continued) |
| June 30, 2012 (Unaudited) |
| (000’s Omitted) |
| ▲ | At June 30, 2012, the cost of securities for federal income tax purposes was $633,882 and the aggregate gross unrealized appreciation and depreciation based on that cost were: |
| Unrealized Appreciation | $ | 17,167 | ||
| Unrealized Depreciation | (10,670 | ) | ||
| Net Unrealized Appreciation | $ | 6,497 |
| † | These securities are valued in good faith at fair value as determined under policies and procedures established by and under the supervision of the Company's Board of Directors. At June 30, 2012, the aggregate value of these securities was $1,054, which represents 0.2% of total net assets. |
| ● | Non-income producing. For long-term debt securities, items identified are in default as to payment of interest and/or principal. |
| ♦ | Senior floating rate interests generally pay interest rates which are periodically adjusted by reference to a base short-term, floating lending rate plus a premium. These base lending rates are generally (i) the lending rate offered by one or more major European banks, such as the London Inter-Bank Offered Rate (LIBOR), (ii) the prime rate offered by one or more major United States Banks, or (iii) the bank's certificate of deposit rate. Senior floating rate interests often require prepayments from excess cash flows or permit the borrower to repay at its election. The rate at which the borrower repays cannot be predicted with accuracy. As a result, the actual remaining maturity may be substantially less than the stated maturities shown. Unless otherwise noted, the interest rate disclosed for these securities represents the average coupon as of June 30, 2012. |
| ■ | Securities issued within terms of a private placement memorandum, exempt from registration under Rule 144A under the Securities Act of 1933, as amended, and may be sold only to qualified institutional buyers. Unless otherwise indicated, these holdings are determined to be liquid. At June 30, 2012, the aggregate value of these securities was $197,166, which represents 30.4% of total net assets. |
| ⌂ | The following securities are considered illiquid. Illiquid securities are often purchased in private placement transactions, are often not registered under the Securities Act of 1933 and may have contractual restrictions on resale. A security may also be considered illiquid if the security lacks a readily available market or if its valuation has not changed for a certain period of time. |
| Period Acquired | Shares/ Par | Security | Cost Basis | |||||||||
| 03/2011 | 207,275 | KCA Deutag | $ | 2,795 | ||||||||
| 03/2010 - 04/2010 | 9 | Stratus Technologies, Inc. Preferred | $ | – | ||||||||
| 03/2010 - 04/2010 | 38 | Stratus Technologies, Inc. | $ | – | ||||||||
At June 30, 2012, the aggregate value of these securities was $1,054, which represents 0.2% of total net assets.
| ۞ | Convertible security. |
| ☼ | This security, or a portion of this security, was purchased on a when-issued, delayed delivery or delayed draw basis. The cost of these securities was $1,354 at June 30, 2012. |
| ‡ | This security, or a portion of this security, has been segregated to cover funding requirements on investment transactions settling in the future. |
| Þ | This security may pay interest in additional principal instead of cash. |
| ╪ | See Significant Accounting Policies of accompanying Notes to Financial Statements regarding valuation of securities. |
| GLOSSARY: (abbreviations used in preceding Schedule of Investments) |
| Other Abbreviations: | |
| FHLMC | Federal Home Loan Mortgage Corp. |
| FNMA | Federal National Mortgage Association |
| GNMA | Government National Mortgage Association |
The accompanying notes are an integral part of these financial statements.
| 10 |
| Hartford High Yield HLS Fund |
| Investment Valuation Hierarchy Level Summary |
| June 30, 2012 (Unaudited) |
| (000’s Omitted) |
| Total | Level 1 ♦ | Level 2 ♦ | Level 3 | |||||||||||||
| Assets: | ||||||||||||||||
| Asset & Commercial Mortgage Backed Securities | $ | – | $ | – | $ | – | $ | – | ||||||||
| Common Stocks ‡ | 947 | – | – | 947 | ||||||||||||
| Corporate Bonds | 563,506 | – | 563,506 | – | ||||||||||||
| Preferred Stocks | 9,183 | 9,076 | – | 107 | ||||||||||||
| Senior Floating Rate Interests | 30,604 | – | 30,604 | – | ||||||||||||
| Warrants | 83 | 83 | – | – | ||||||||||||
| Short-Term Investments | 36,056 | – | 36,056 | – | ||||||||||||
| Total | $ | 640,379 | $ | 9,159 | $ | 630,166 | $ | 1,054 | ||||||||
| ♦ | For the six-month period ended June 30, 2012, there were no transfers between Level 1 and Level 2. |
| ‡ | The Fund has all or primarily all of the equity securities categorized in a particular level. Refer to the Schedule of Investments for further industry breakout. |
Following is a reconciliation of Level 3 assets for which significant unobservable inputs were used to determine fair value:
| Balance as of December 31, 2011 | Realized Gain (Loss) | Change in Unrealized Appreciation (Depreciation) | Net Amortization | Purchases | Sales | Transfers Into Level 3 * | Transfers Out of Level 3 * | Balance as of June 30, 2012 | ||||||||||||||||||||||||||||
| Assets: | ||||||||||||||||||||||||||||||||||||
| Asset & Commercial Mortgage Backed Securities | $ | — | $ | — | $ | — | † | $ | — | $ | — | $ | — | $ | — | $ | — | $ | — | |||||||||||||||||
| Common Stocks | 1,720 | — | (773 | )‡ | — | — | — | — | — | 947 | ||||||||||||||||||||||||||
| Corporate Bonds | 5,167 | (25 | ) | 52 | † | (1 | ) | — | (1,946 | ) | — | (3,247 | ) | — | ||||||||||||||||||||||
| Preferred Stocks | — | — | 107 | § | — | — | — | — | — | 107 | ||||||||||||||||||||||||||
| Total | $ | 6,887 | $ | (25 | ) | $ | (614 | ) | $ | (1 | ) | $ | — | $ | (1,946 | ) | $ | — | $ | (3,247 | ) | $ | 1,054 | |||||||||||||
| * | Investments are transferred into and out of Level 3 for a variety of reasons including, but not limited to: |
1) Investments where trading has been halted (transfer into Level 3) or investments where trading has resumed (transfer out of Level 3).
2) Broker quoted investments (transfer into Level 3) or quoted prices in active markets (transfer out of Level 3).
3) Investments that have certain restrictions on trading (transfer into Level 3) or investments where trading restrictions have expired (transfer out of Level 3).
| † | Change in unrealized appreciation (depreciation) in the current period relating to assets still held at June 30, 2012 was zero. |
| ‡ | Change in unrealized appreciation (depreciation) in the current period relating to assets still held at June 30, 2012 was $(773). |
| § | Change in unrealized appreciation (depreciation) in the current period relating to assets still held at June 30, 2012 was $107. |
The accompanying notes are an integral part of these financial statements.
| 11 |
| Hartford High Yield HLS Fund |
| Statement of Assets and Liabilities |
| June 30, 2012 (Unaudited) |
| (000’s Omitted) |
| Assets: | ||||
| Investments in securities, at market value (cost $631,573) | $ | 640,379 | ||
| Cash | 179 | |||
| Receivables: | ||||
| Investment securities sold | 17,727 | |||
| Fund shares sold | 832 | |||
| Dividends and interest | 11,669 | |||
| Other assets | — | |||
| Total assets | 670,786 | |||
| Liabilities: | ||||
| Payables: | ||||
| Investment securities purchased | 20,336 | |||
| Fund shares redeemed | 920 | |||
| Investment management fees | 61 | |||
| Distribution fees | 5 | |||
| Accrued expenses | 39 | |||
| Total liabilities | 21,361 | |||
| Net assets | $ | 649,425 | ||
| Summary of Net Assets: | ||||
| Capital stock and paid-in-capital | $ | 600,112 | ||
| Undistributed net investment income | 80,874 | |||
| Accumulated net realized loss | (40,367 | ) | ||
| Unrealized appreciation of investments | 8,806 | |||
| Net assets | $ | 649,425 | ||
| Shares authorized | 2,800,000 | |||
| Par value | $ | 0.001 | ||
| Class IA: Net asset value per share | $ | 9.30 | ||
| Shares outstanding | 53,360 | |||
| Net assets | $ | 496,259 | ||
| Class IB: Net asset value per share | $ | 9.17 | ||
| Shares outstanding | 16,710 | |||
| Net assets | $ | 153,166 | ||
The accompanying notes are an integral part of these financial statements.
| 12 |
| Hartford High Yield HLS Fund |
| Statement of Operations |
| For the Six Month Period Ended June 30, 2012 (Unaudited) |
| (000’s Omitted) |
| Investment Income: | ||||
| Dividends | $ | 300 | ||
| Interest | 26,297 | |||
| Total investment income, net | 26,597 | |||
| Expenses: | ||||
| Investment management fees | 2,485 | |||
| Transfer agent fees | 1 | |||
| Distribution fees - Class IB | 199 | |||
| Custodian fees | 4 | |||
| Accounting services fees | 72 | |||
| Board of Directors' fees | 8 | |||
| Audit fees | 7 | |||
| Other expenses | 93 | |||
| Total expenses | 2,869 | |||
| Net investment income | 23,728 | |||
| Net Realized Gain on Investments, Other Financial Instruments and Foreign Currency Transactions: | ||||
| Net realized gain on investments | 6,483 | |||
| Net realized loss on swap contracts | (384 | ) | ||
| Net realized gain on foreign currency contracts | — | |||
| Net Realized Gain on Investments, Other Financial Instruments and Foreign Currency Transactions | 6,099 | |||
| Net Changes in Unrealized Appreciation of Investments: | ||||
| Net unrealized appreciation of investments | 16,284 | |||
| Net Changes in Unrealized Appreciation of Investments | 16,284 | |||
| Net Gain on Investments, Other Financial Instruments and Foreign Currency Transactions | 22,383 | |||
| Net Increase in Net Assets Resulting from Operations | $ | 46,111 |
The accompanying notes are an integral part of these financial statements.
| 13 |
| Hartford High Yield HLS Fund |
| Statement of Changes in Net Assets |
| (000’s Omitted) |
| For the Six-Month Period Ended June 30, 2012 (Unaudited) | For the Year Ended December 31, 2011 | |||||||
| Operations: | ||||||||
| Net investment income | $ | 23,728 | $ | 57,280 | ||||
| Net realized gain on investments and other financial instruments | 6,099 | 22,098 | ||||||
| Net unrealized appreciation (depreciation) of investments | 16,284 | (44,423 | ) | |||||
| Net Increase In Net Assets Resulting From Operations | 46,111 | 34,955 | ||||||
| Distributions to Shareholders: | ||||||||
| From net investment income | ||||||||
| Class IA | — | (49,277 | ) | |||||
| Class IB | — | (14,302 | ) | |||||
| Total distributions | — | (63,579 | ) | |||||
| Capital Share Transactions: | ||||||||
| Class IA | ||||||||
| Sold | 69,043 | 148,789 | ||||||
| Issued on reinvestment of distributions | — | 49,277 | ||||||
| Redeemed | (157,122 | ) | (229,731 | ) | ||||
| Total capital share transactions | (88,079 | ) | (31,665 | ) | ||||
| Class IB | ||||||||
| Sold | 13,714 | 42,743 | ||||||
| Issued on reinvestment of distributions | — | 14,302 | ||||||
| Redeemed | (30,989 | ) | (76,938 | ) | ||||
| Total capital share transactions | (17,275 | ) | (19,893 | ) | ||||
| Net decrease from capital share transactions | (105,354 | ) | (51,558 | ) | ||||
| Net Decrease In Net Assets | (59,243 | ) | (80,182 | ) | ||||
| Net Assets: | ||||||||
| Beginning of period | 708,668 | 788,850 | ||||||
| End of period | $ | 649,425 | $ | 708,668 | ||||
| Undistributed (distribution in excess of) net investment income | $ | 80,874 | $ | 57,146 | ||||
| Shares: | ||||||||
| Class IA | ||||||||
| Sold | 7,595 | 16,247 | ||||||
| Issued on reinvestment of distributions | — | 5,892 | ||||||
| Redeemed | (17,272 | ) | (24,914 | ) | ||||
| Total share activity | (9,677 | ) | (2,775 | ) | ||||
| Class IB | ||||||||
| Sold | 1,529 | 4,716 | ||||||
| Issued on reinvestment of distributions | — | 1,731 | ||||||
| Redeemed | (3,457 | ) | (8,423 | ) | ||||
| Total share activity | (1,928 | ) | (1,976 | ) | ||||
The accompanying notes are an integral part of these financial statements.
| 14 |
| Hartford High Yield HLS Fund |
| Notes to Financial Statements |
| June 30, 2012 (Unaudited) |
| (000’s Omitted) |
| 1. | Organization: |
Hartford High Yield HLS Fund (the “Fund”) serves as an underlying investment option for certain variable annuity and variable life insurance separate accounts of Hartford Life Insurance Company (“HLIC”) and its affiliates and certain qualified retirement plans. The Fund may also serve as an underlying investment option for certain variable annuity and variable life separate accounts of other insurance companies. Owners of variable annuity contracts and policyholders of variable life insurance contracts may choose the funds permitted in the variable insurance contract prospectus. In addition, participants in certain qualified retirement plans may choose the Fund if permitted by their plans.
Hartford Series Fund, Inc. (the “Company”) is an open-end registered management investment company comprised of thirty portfolios. Financial Statements for the Fund, a series of the Company, are included in this report.
The Company is organized under the laws of the State of Maryland and is registered with the Securities and Exchange Commission (“SEC”) under the Investment Company Act of 1940, as amended (“1940 Act”). The Fund is a diversified open-end management investment company.
The Fund is divided into Class IA and Class IB shares. Each class is offered at the per share net asset value (“NAV”) without a sales charge and is subject to the same expenses, except that the Class IB shares are subject to distribution and service fees charged pursuant to a Distribution Plan adopted in accordance with Rule 12b-1 under the 1940 Act.
| 2. | Significant Accounting Policies: |
The following is a summary of significant accounting policies of the Fund in the preparation of its financial statements, which are in accordance with the United States Generally Accepted Accounting Principles (“U.S. GAAP”). The preparation of financial statements in accordance with U.S. GAAP may require management to make estimates and assumptions that affect the reported amounts of assets and liabilities and disclosure of contingent assets and liabilities at the date of the financial statements and the reported amounts of increases and decreases in net assets from operations during the reporting period. Actual results could differ from those estimates.
| a) | Determination of Net Asset Value – The NAV of each class of the Fund’s shares is determined as of the close of regular trading (normally 4:00 p.m. Eastern Time) (the “NYSE Close”) on each day that the New York Stock Exchange (the “Exchange”) is open (“Valuation Date”). Information that becomes known to the Fund after the NAV has been calculated on a particular day will not generally be used to retroactively adjust the NAV determined earlier that day. |
| b) | Investment Valuation and Fair Value Measurements – For purposes of calculating the NAV, portfolio investments and other assets held by the Fund's portfolio for which market quotes are readily available are valued at market value. Market value is generally determined on the basis of last reported sales prices or official close price. If no sales are reported, market value is based on quotes obtained from a quotation reporting system, established market makers, or independent pricing services. If market prices are not readily available or are deemed unreliable, the Fund will use the fair value of the investment as determined in good faith under policies and procedures established by and under the supervision of the Company’s Board of Directors. Market quotes are considered not readily available where there is an absence of current or reliable market-based data (e.g., trade information or broker quotes), including where events occur after the close of the relevant market, but prior to the NYSE Close that materially affect the values of the Fund’s portfolio investments or assets. In addition, market quotes are considered not readily available when, due to extraordinary circumstances, the exchanges or markets on which the investments trade do not open for trading for the entire day and no other market prices are available. In addition, prices of foreign equities that are principally traded on certain foreign markets are adjusted daily pursuant to a fair value pricing service approved by the Board of Directors in order to reflect an adjustment for the factors occurring after the close of certain foreign markets but before the NYSE Close. Investments that are primarily traded on foreign markets may trade on days that are not business days of the Fund. The value of the |
| 15 |
| Hartford High Yield HLS Fund |
| Notes to Financial Statements – (continued) |
| June 30, 2012 (Unaudited) |
| (000’s Omitted) |
foreign investments in which the Fund invests may change on days when a shareholder will not be able to purchase or redeem shares of the Fund. Fair value pricing is subjective in nature and the use of fair value pricing by the Fund may cause the NAV of its shares to differ significantly from the NAV that would have been calculated using market prices at the close of the exchange on which a portfolio investment is primarily traded. There can be no assurance that the Fund could obtain the fair market value assigned to an investment if the Fund were to sell the investment at approximately the time at which the Fund determines its NAV.
Fixed income investments (other than short term obligations) and non-exchange traded derivatives held by the Fund are normally valued on the basis of quotes obtained from brokers and dealers or independent pricing services in accordance with procedures established by the Company’s Board of Directors. Prices obtained from independent pricing services use information provided by market makers or estimates of market values obtained from yield data relating to investments with similar characteristics. Generally, the Fund may use fair valuation in regard to fixed income investments when the Fund holds defaulted or distressed investments or investments in a company in which a reorganization is pending. Short-term investments maturing in 60 days or less are generally valued at amortized cost, if their original term to maturity was 60 days or less, or by amortizing their value on the 61st day prior to maturity, if the original term to maturity exceeded 60 days.
Exchange traded options, futures and options on futures are valued at the settlement price determined by the relevant exchange as of the NYSE Close. If such instruments do not trade on an exchange, values may be supplied by an independent pricing service using a formula or other objective method that may take into consideration the style, direction, expiration, strike price, notional value and volatility or other adjustments.
Investments valued in currencies other than U.S. dollars are converted to U.S. dollars using exchange rates obtained from independent pricing services for calculation of the NAV. As a result, the NAV of the Fund’s shares may be affected by changes in the value of currencies in relation to the U.S. dollar. The value of investments traded in markets outside the United States or denominated in currencies other than the U.S. dollar may be affected significantly on a day that the NYSE is closed and the market value may change on days when an investor is not able to purchase, redeem or exchange shares of the Fund.
Foreign currency contracts represent agreements to exchange currencies on specific future dates at predetermined rates. Foreign currency contracts are valued using foreign currency exchange rates and forward rates as provided by an independent pricing service on the Valuation Date.
Investments in open-end mutual funds are valued at the respective NAV of each open-end mutual fund on the Valuation Date.
Financial instruments for which prices are not available from an independent pricing service may be valued using market quotations obtained from one or more dealers that make markets in the respective financial instrument in accordance with procedures established by the Company’s Board of Directors.
U.S. GAAP defines fair value as the price that the Fund would receive to sell an asset or pay to transfer a liability in an orderly transaction between market participants. The U.S. GAAP fair value measurement standards require disclosure of a fair value hierarchy for each major category of assets and liabilities. Various inputs are used in determining the fair value of the Fund’s investments. These inputs are summarized into three broad hierarchy levels. This hierarchy is based on whether the valuation inputs are observable or unobservable. These levels are:
| · | Level 1 – Quoted prices in active markets for identical investments. Level 1 may include exchange traded instruments, such as domestic equities, some foreign equities, options, futures, mutual funds, exchange traded funds, rights and warrants. |
| 16 |
| · | Level 2 – Observable inputs other than Level 1 prices, such as quoted prices for similar investments; quoted prices in markets that are not active; or other inputs that are observable or can be corroborated by observable market data. Level 2 may include debt investments that are traded less frequently than exchange traded instruments and which are valued using independent pricing services; foreign equities, which are principally traded on certain foreign markets and are adjusted daily pursuant to a fair value pricing service in order to reflect an adjustment for the factors occurring after the close of certain foreign markets but before the NYSE Close; and short-term investments, which are valued at amortized cost. | |
| · | Level 3 – Significant unobservable inputs that are supported by limited or no market activity. Level 3 may include financial instruments whose values are determined using indicative market quotes or require significant management judgment or estimation. These unobservable valuation inputs may include estimates for current yields, maturity/duration, prepayment speed, and indicative market quotes for comparable investments along with other assumptions relating to credit quality, collateral value, complexity of the investment structure, general market conditions and liquidity. This category may include investments where trading has been halted or there are certain restrictions on trading. While these investments are priced using unobservable inputs, the valuation of these investments reflects the best available data and management believes the prices are a reasonable representation of exit price. |
The Board of Directors of the Company generally reviews and approves the “Procedures for Valuation of Portfolio Securities” on an annual basis. These procedures define how investments are to be valued, including the formation of a Valuation Committee. The Valuation Committee is responsible for determining in good faith the fair value of investments when the value cannot be obtained from primary pricing services or alternative sources or if the valuation of an investment as provided by the primary pricing service or alternative source is believed not to reflect the investment’s fair value as of the Valuation Date. Members of the Valuation Committee include the Fund’s Treasurer or designee, a Vice President of the Funds with legal expertise or designee, and a Vice President of the investment manager or designee. In addition, the Fund’s chief compliance officer shall designate a member of the compliance group to attend Valuation Committee meetings as a non-voting resource, to monitor for and provide guidance with respect to compliance with these procedures. Two members of the Valuation Committee or their designees, representing different departments, shall constitute a quorum for purposes of permitting the Valuation Committee to take action. The Valuation Committee will consider all relevant factors in determining an investment’s fair value, and may seek the advice of the Fund’s sub-adviser, knowledgeable brokers and legal counsel in making such determination. The Valuation Committee reports to the Audit Committee of the Company’s Board of Directors. The Audit Committee receives quarterly written reports which include details of all fair-valued investments, including the reason for the fair valuation, and an indication, when possible, of the accuracy of the valuation by disclosing the next available reliable public price quotation or the disposition price of such investments (the “look-back” test). The Board of Directors then must consider for ratification all of the fair value determinations made during the previous quarter.
Valuation levels are not necessarily indicative of the risk associated with investing in such investments. Individual investments within any of the above mentioned asset classes may be assigned a different hierarchical level than those presented above, as individual circumstances dictate.
For additional information, refer to the Investment Valuation Hierarchy Level Summary and the Level 3 roll-forward reconciliation which follow the Schedule of Investments.
For purposes of reporting transfers between different hierarchy levels, both transfers in and out of each level, as applicable, are shown as if they occurred at the beginning of the period.
| c) | Investment Transactions and Investment Income – Investment transactions are recorded as of the trade date (the date the order to buy or sell is executed) for financial reporting purposes. Investments purchased or sold on a when-issued or |
| 17 |
| Hartford High Yield HLS Fund |
| Notes to Financial Statements – (continued) |
| June 30, 2012 (Unaudited) |
| (000’s Omitted) |
delayed-delivery basis may be settled a month or more after the trade date. Realized gains and losses are determined on the basis of identified cost.
Trade date for senior floating rate interests purchased in the primary loan market is considered the date on which the loan allocations are determined. Trade date for senior floating rate interests purchased in the secondary loan market is the date on which the transaction is entered into.
Dividend income is recorded on the ex-dividend date, except certain dividends from foreign investments where the ex-dividend date may have passed are recorded as soon as the Fund is informed of the dividend. Interest income, including amortization of premium and accretion of discounts, is accrued on a daily basis. Paydown gains and losses on mortgage-related and other asset-backed securities are included in interest income in the Statement of Operations.
| d) | Foreign Currency Transactions – Assets and liabilities denominated in currencies other than U.S. dollars are translated into U.S. dollars at the exchange rates in effect on the valuation date. Purchases and sales of investments, income, and expenses are translated into U.S. dollars at the exchange rates on the dates of such transactions. |
The Fund does not isolate that portion of portfolio investment valuation resulting from fluctuations in the foreign currency exchange rates from the fluctuations arising from changes in the market prices of investments held. Exchange rate fluctuations are included with the net realized and unrealized gain or loss on investments in the accompanying financial statements.
Net realized foreign exchange gains or losses arise from sales of foreign currencies and the difference between asset and liability amounts initially stated in foreign currencies and the U.S. dollar value of the amounts actually received or paid. Net unrealized foreign exchange gains or losses arise from changes in the value of other assets and liabilities at the end of the reporting period, resulting from changes in the exchange rates.
| e) | Joint Trading Account – The Fund may invest cash balances into a joint trading account that may be invested in one or more repurchase agreements. |
| f) | Fund Share Valuation and Dividend Distributions to Shareholders – Orders for the Fund’s shares are executed in accordance with the investment instructions of the contract holders and plan participants. The NAV of the Fund’s shares is determined as of the close of business on each business day of the Exchange. The NAV is determined separately for each class of shares of the Fund by dividing the Fund’s net assets attributable to that class by the number of shares of the class outstanding. Each class of shares offered by the Fund has equal rights as to assets and voting privileges (except that shareholders of a class have exclusive voting rights regarding any matter relating solely to that class of shares). Income and non-class specific expenses are allocated daily to each class on the basis of the relative net assets of the class. Realized and unrealized capital gains and losses are allocated daily based on the relative net assets of each class of shares of the Fund. |
Orders for the purchase of the Fund’s shares received prior to the close of the Exchange on any day the Exchange is open for business are priced at the NAV determined as of the close of the Exchange. Orders received after the close of the Exchange, or on a day on which the Exchange and/or the Fund is not open for business, are priced at the next determined NAV.
Dividends are declared pursuant to a policy adopted by the Company’s Board of Directors based upon the investment performance of the Fund. The policy of the Fund is to pay dividends from net investment income and realized capital gains, if any, at least once a year.
Distributions from net investment income, net realized capital gains and capital are determined in accordance with federal income tax regulations, which may differ from U.S. GAAP with respect to character and timing. These
| 18 |
differences may include but are not limited to losses deferred due to wash sale adjustments, foreign currency gains and losses, adjustments related to Passive Foreign Investment Companies (“PFICs”), Real Estate Investment Trusts (“REITs”), Regulated Investment Companies (“RICs”), certain derivatives and partnerships. Permanent book and federal income tax basis differences relating to shareholder distributions will result in reclassifications to certain of the Fund’s capital accounts (see Federal Income Taxes: Reclassification of Capital Accounts note).
| 3. | Securities and Other Investments: |
| a) | Repurchase Agreements – A repurchase agreement is an agreement by which a counterparty agrees to sell an investment and agrees to repurchase the investment sold at a mutually agreed upon time and price. At the time the Fund enters into a repurchase agreement, the value of the underlying collateral, including accrued interest, will be equal to or exceed the value of the repurchase agreement. Repurchase agreements expose the Fund to counterparty risk. To minimize counterparty risk, the investments that serve to collateralize the repurchase agreement are held by the Fund’s custodian in book entry or physical form in the custodial account of the Fund or in a third party custodial account. Repurchase agreements are valued at cost plus accrued interest. The Fund, as shown on the Schedule of Investments, had outstanding repurchase agreements as of June 30, 2012. |
| b) | Illiquid and Restricted Investments – The Fund is permitted to invest up to 15% of its net assets in illiquid investments. Illiquid investments are those that may not be sold or disposed of in the ordinary course of business within seven days, at approximately the price used to determine the Fund’s NAV. The Fund may not be able to sell illiquid investments when its sub-adviser considers it desirable to do so or may have to sell such investments at a price that is lower than the price that could be obtained if the investments were more liquid. A sale of illiquid investments may require more time and may result in higher dealer discounts and other selling expenses than does the sale of those that are liquid. Illiquid investments also may be more difficult to value due to the unavailability of reliable market quotations for such investments, and an investment in them may have an adverse impact on the Fund’s NAV. The Fund may also purchase certain restricted investments that can only be resold to certain qualified investors and may be determined to be liquid pursuant to policies and guidelines established by the Company’s Board of Directors. The Fund, as shown on the Schedule of Investments, had illiquid and/or restricted investments as of June 30, 2012. |
| c) | Investments Purchased on a When-Issued or Delayed-Delivery Basis – Delivery and payment for investments that have been purchased by the Fund on a forward commitment, or when-issued or delayed-delivery basis, take place beyond the customary settlement period. A fund may dispose of or renegotiate a delayed-delivery transaction after it is entered into, and may sell delayed-delivery investments before they are delivered, which may result in a realized gain or loss. During this period, such investments are subject to market fluctuations, and the Fund identifies investments segregated in its records with a value at least equal to the amount of the commitment. The Fund, as shown on the Schedule of Investments, had when-issued or delayed delivery investments as of June 30, 2012. |
| d) | Senior Floating Rate Interests – The Fund, as shown on the Schedule of Investments, invests in senior floating rate interests. Senior floating rate interests hold the most senior position in the capital structure of a business entity (the “Borrower”), are typically secured by specific collateral and have a claim on the assets and/or stock of the Borrower that is senior to that held by subordinated debtholders and stockholders of the Borrower. Senior floating rate interests are typically structured and administered by a financial institution that acts as the agent of the lenders participating in the senior floating rate interest. The Fund may invest in multiple series or tranches of a senior floating rate interest, which may have varying terms and carry different associated risks. The Fund may also enter into unfunded loan commitments, which are contractual obligations for future funding. Unfunded loan commitments may include revolving credit facilities, which may obligate the Fund to supply additional cash to the borrower on demand. Unfunded loan commitments represent a future obligation in full. The Fund may receive a commitment fee based on the undrawn portion of the underlying line of credit portion of a senior floating rate interest. In certain circumstances, the Fund may receive various |
| 19 |
| Hartford High Yield HLS Fund |
| Notes to Financial Statements – (continued) |
| June 30, 2012 (Unaudited) |
| (000’s Omitted) |
fees upon the restructure of a senior floating rate interest by a borrower. Fees earned/paid may be recorded as a component of income or realized gain/loss in the Statement of Operations.
Senior floating rate interests are typically rated below-investment-grade, which suggests they are more likely to default and generally pay higher interest rates than investment-grade loans. A default could lead to non-payment of income, which would result in a reduction of income to the Fund, and there can be no assurance that the liquidation of any collateral would satisfy the Borrower’s obligation in the event of non-payment of scheduled interest or principal payments, or that such collateral could be readily liquidated. The Fund, as shown on the Schedule of Investments, had senior floating rate interests as of June 30, 2012.
| e) | Mortgage Related and Other Asset Backed Securities – The Fund may invest in mortgage related and other asset backed securities. These securities include mortgage pass-through securities, collateralized mortgage obligations, commercial mortgage backed securities, stripped mortgage backed securities, asset backed securities, collateralized debt obligations and other securities that directly or indirectly represent a participation in, or are secured by and payable from, mortgage loans on real property. Mortgage related securities are created from pools of residential or commercial mortgage loans, including mortgage loans made by savings and loan institutions, mortgage bankers, commercial banks and others. Asset backed securities are created from many types of assets, including auto loans, credit card receivables, home equity loans, and student loans. These securities provide a monthly payment which consists of both interest and principal payments. Interest payments may be determined by fixed or adjustable rates. The rate of pre-payments on underlying mortgages will affect the price and volatility of a mortgage related security, and may have the effect of shortening or extending the effective duration of the security relative to what was anticipated at the time of purchase. The timely payment of principal and interest of certain mortgage related securities is guaranteed by the full faith and credit of the United States Government. Pools created and guaranteed by non-governmental issuers, including government-sponsored corporations, may be supported by various forms of insurance or guarantees, but there can be no assurance that the private insurers or guarantors can meet their obligations under the insurance policies or guarantee arrangements. The Fund, as shown on the Schedule of Investments, had mortgage related and other asset backed securities as of June 30, 2012. |
| 4. | Financial Derivative Instruments: |
The following disclosures contain information on how and why the Fund uses derivative instruments, the credit-risk-related contingent features in certain derivative instruments, and how derivative instruments affect the Fund’s financial position and results of operations. The location and fair value amounts of these instruments on the Statement of Assets and Liabilities and the realized gains and losses and changes in unrealized gains and losses on the Statement of Operations, each categorized by type of derivative contract, are included in the following Additional Derivative Instrument Information footnote. The derivative instruments outstanding as of period-end are disclosed in the notes to the Schedule of Investments and the amounts of realized gains and losses and changes in unrealized gains and losses on derivative instruments during the period are disclosed in the Statement of Operations.
| a) | Foreign Currency Contracts – The Fund may enter into foreign currency contracts that obligate the Fund to purchase or sell currencies at specified future dates. Foreign currency contracts are used to hedge the currency exposure associated with some or all of the Fund’s investments and/or as part of an investment strategy. Foreign currency contracts are marked to market daily and the change in value is recorded by the Fund as an unrealized gain or loss. The Fund will record a realized gain or loss when the foreign currency contract is settled. |
Foreign currency contracts involve elements of market risk in excess of the amounts reflected in the Statement of Assets and Liabilities. In addition, risks may arise upon entering into these contracts from the potential inability of the counterparties to meet the terms of the contracts and from unanticipated movements in the value of the foreign currencies relative to the U.S. dollar. The Fund had no outstanding foreign currency contracts as of June 30, 2012.
| b) | Swap Agreements – The Fund may invest in swap agreements. Swap agreements are privately negotiated agreements between the Fund and a counterparty to exchange or swap investment cash flows, assets, foreign currencies or market- |
| 20 |
linked returns at specified future intervals. The Fund enters into credit default, total return, cross-currency, interest rate, inflation and other forms of swap agreements to manage its exposure to credit, currency, interest rate, commodity and inflation risk. Swap agreements are also used to gain exposure to certain markets. In connection with these agreements, investments or cash may be identified as collateral in accordance with the terms of the respective swap agreements to provide assets of value and recourse in the event of default or bankruptcy/insolvency. Swaps are valued based on custom valuations furnished by an independent pricing service. Swaps for which prices are not available from an independent pricing service are valued in accordance with procedures established by the Company’s Board of Directors, and the change in value, if any, is recorded as an unrealized gain or loss on the Statement of Assets and Liabilities. Payments received or made at the beginning of the measurement period are reflected as such on the Statement of Assets and Liabilities and represent payments made or received upon entering into the swap agreement to compensate for differences between the stated terms of the swap agreement and prevailing market conditions (credit spreads, currency exchange rates, interest rates, and other relevant factors). These upfront payments are recorded as realized gains or losses on the Statement of Operations upon termination or maturity of the swap. A liquidation payment received or made at the termination of the swap and some net periodic payments received or paid by the Fund are recorded as realized gains or losses on the Statement of Operations. Net periodic payments and some upfront payments received or paid by the Fund with regard to interest rate swaps are recorded as increases or decreases to income on the Statement of Operations. Entering into these agreements involves, to varying degrees, elements of credit, market and documentation risk in excess of the amounts recognized on the Statement of Assets and Liabilities. Such risks involve the possibility that there will be no liquid market for these agreements, that the counterparty to the agreements may default on its obligation to perform or disagree as to the meaning of contractual terms in the agreements, and that there may be unfavorable changes in interest rates. The Fund’s maximum risk of loss from counterparty credit risk is the discounted net value of the cash flows to be received from the counterparty over the contract’s remaining life, to the extent that amount is positive. The risk is mitigated by having a master netting arrangement between the Fund and the counterparty, which allows for the netting of payments made or received (although such amounts are presented on a gross basis within the Statement of Assets and Liabilities, as applicable) as well as the posting of collateral to the Fund to cover the Fund’s exposure to the counterparty.
Credit Default Swap Agreements – The credit default swap market allows the Fund to manage its exposure to the market or certain sectors of the market, to reduce its risk exposure to defaults of corporate and sovereign issuers, or to create exposure to corporate or sovereign issuers to which it is not otherwise exposed. Certain credit default swaps involve the exchange of a fixed rate premium for protection against the loss in value of an underlying investment or index in the event of a credit event, such as payment default or bankruptcy.
Under a credit default swap contract, one party acts as guarantor by receiving the fixed periodic payment in exchange for the commitment to purchase the underlying investment at par if the defined credit event occurs. Upon the occurrence of a defined credit event, the difference between the value of the reference obligation and the swap’s notional amount is recorded as realized gain or loss on swap transactions in the Statement of Operations. A “buyer” of credit protection agrees to pay a counterparty to assume the credit risk of an issuer upon the occurrence of certain events. The “seller” of the protection receives periodic payments and agrees to assume the credit risk of an issuer upon the occurrence of certain events. Although specified events are contract specific, credit events are generally defined as bankruptcy, failure to pay, restructuring, obligation acceleration, obligation default, or repudiation/moratorium. A “seller’s” exposure is limited to the total notional amount of the credit default swap contract. These potential amounts would be partially offset by any recovery values of the respective referenced obligations or upfront payments received upon entering into the contract.
Implied credit spreads, represented in absolute terms, utilized in determining the market value of credit default swap contracts on corporate issues, sovereign issues of an emerging country or U.S. municipal issues as of period end are disclosed in the notes to the Schedule of Investments, as applicable, and serve as an indicator of the current status of the payment/performance risk and represent the likelihood or risk of default for the credit derivative. The implied credit spread of a particular referenced entity reflects the cost of buying/selling protection and may include upfront payments required to be made to enter into the contract. Wider credit spreads represent a deterioration of the referenced entity’s soundness and a greater likelihood or risk of default or other credit event occurring as defined under the terms of the
| 21 |
| Hartford High Yield HLS Fund |
| Notes to Financial Statements – (continued) |
| June 30, 2012 (Unaudited) |
| (000’s Omitted) |
contract. For credit default swap contracts on asset-backed securities and credit indices, the quoted market prices and resulting values serve as the indicator of the current status of the payment/performance risk. Increasing market values, in absolute terms when compared to the notional amount of the swap, represent a deterioration of the referenced equity’s credit soundness and a greater likelihood or risk of default or other credit event occurring as defined under the terms of the contract. The Fund had no outstanding credit default swaps as of June 30, 2012.
| c) | Additional Derivative Instrument Information: |
The volume of derivative activity was minimal during the six-month period ended June 30, 2012.
The effect of Derivative Instruments on the Statement of Operations for the six-month period ended June 30, 2012:
| Risk Exposure Category | ||||||||||||||||||||||||||||
| Interest Rate Contracts | Foreign Exchange Contracts | Credit Contracts | Equity Contracts | Commodity Contracts | Other Contracts | Total | ||||||||||||||||||||||
| Realized Gain (Loss) on Derivatives Recognized as a Result of Operations: | ||||||||||||||||||||||||||||
| Net realized loss on swap contracts | $ | — | $ | — | $ | (384 | ) | $ | — | $ | — | $ | — | $ | (384 | ) | ||||||||||||
| Net realized gain on foreign currency contracts | — | — | — | — | — | — | — | |||||||||||||||||||||
| Total | $ | — | $ | — | $ | (384 | ) | $ | — | $ | — | $ | — | $ | (384 | ) | ||||||||||||
| 5. | Principal Risks: |
| a) | Credit and Counterparty Risks – Credit risk depends largely on the perceived financial health of bond issuers. In general, the credit rating is inversely related to the credit risk of the issuer. Higher rated bonds generally are deemed to have less credit risk, while lower or unrated bonds are deemed to have higher risk of default. The share price, yield and total return of a fund that holds securities with higher credit risk may be more volatile than those of a fund that holds bonds with lower credit risk. Similar to credit risk, the Fund may be exposed to counterparty risk, or the risk that an institution or other entity with which the Fund has unsettled or open transactions will default. |
| b) | Market Risks – The Fund’s investments expose the Fund to various risks including, but not limited to, interest rate, prepayment, extension, foreign currency, and equity risks. Interest rate risk is the risk that fixed income securities will decline in value because of changes in interest rates. As nominal interest rates rise, the values of certain fixed income securities held by the Fund are likely to decrease. A nominal interest rate can be described as the sum of a real interest rate and an expected inflation rate. Fixed income securities with longer durations tend to be more sensitive to changes in interest rates, usually making them more volatile than securities with shorter durations. Duration is useful primarily as a measure of the sensitivity of a fixed income security’s market price to interest rate (i.e., yield) movements. Senior floating rate interests and securities subject to prepayment and extension risk generally offer less potential for gains when interest rates decline. In addition, securities are subject to extension risk. Rising interest rates may cause prepayments to occur at a slower than expected rate, thereby effectively lengthening the maturity of the security and making the security more sensitive to interest rate changes. Prepayment and extension risk are major risks of mortgage-backed securities, senior floating rate interests, and certain asset-backed securities. For certain asset-backed securities, the actual maturity may be less than the stated maturity shown in the Schedule of Investments, if applicable. As a result, the timing of income recognition relating to these securities may vary based upon the actual maturity. If the Fund invests directly in foreign currencies or in securities that trade in, and receive revenues in, foreign currencies, or in derivatives that provide exposure to foreign currencies, it will be subject to the risk that those currencies will decline in value relative to the base currency of the Fund, or, in the case of hedging positions, that the Fund’s base currency will decline in value relative to the currency being hedged. Currency rates in foreign countries may fluctuate significantly over short periods of time for a number of reasons, including changes in interest rates, intervention (or the failure to intervene) by U.S. or foreign governments, central banks or supranational entities, such as the International Monetary Fund, or by the imposition of currency controls or other political developments in the United States or abroad. As a result, the Fund’s |
| 22 |
investments in foreign currency denominated securities may reduce the returns of the Fund. The market values of equity securities, such as common stocks and preferred stocks, or equity related investments, such as futures and options, may decline due to general market conditions which are not specifically related to a particular company, such as real or perceived adverse economic conditions, changes in the general outlook for corporate earnings, changes in interest or currency rates or adverse investor sentiment generally. The market value of equity securities may also decline due to factors which affect a particular industry or industries, such as labor shortages or increased production costs and competitive conditions within an industry. Equity securities and equity related investments generally have greater market price volatility than fixed income securities.
| 6. | Federal Income Taxes: |
| a) | Federal Income Taxes – For federal income tax purposes, the Fund intends to continue to qualify as a RIC under Subchapter M of the Internal Revenue Code (“IRC”) by distributing substantially all of its taxable net investment income and net realized capital gains to its shareholders and otherwise complying with the requirements of RICs. The Fund has distributed substantially all of its income and capital gains in prior years, if applicable, and intends to distribute substantially all of its income and capital gains prior to the next fiscal year-end. Accordingly, no provision for federal income or excise taxes has been made in the accompanying financial statements. Distributions from short-term capital gains are treated as ordinary income distributions for federal income tax purposes. |
| b) | Net Investment Income (Loss), Net Realized Gains (Losses) – Net investment income (loss) and net realized gains (losses) may differ for financial statement and tax purposes primarily because of losses deferred due to wash sale adjustments, foreign currency gains and losses, adjustments related to PFICs, REITs, RICs, certain derivatives and partnerships. The character of distributions made during the year from net investment income or net realized gains may differ from their ultimate characterization for federal income tax purposes. Also, due to the timing of dividend distributions, the fiscal year in which amounts are distributed may differ from the year that the income or realized gains (losses) were recorded by the Fund. |
| c) | Distributions and Components of Distributable Earnings – The tax character of distributions paid by the Fund for the periods indicated is as follows (as adjusted for dividends payable): |
| For the Year Ended December 31, 2011 | For the Year Ended December 31, 2010 | |||||||
| Ordinary Income | $ | 63,579 | $ | 5,000 | ||||
As of December 31, 2011, the Fund’s components of distributable earnings (deficit) on a tax basis were as follows:
| Amount | ||||
| Undistributed Ordinary Income | $ | 57,180 | ||
| Accumulated Capital and Other Losses* | (44,157 | ) | ||
| Unrealized Depreciation† | (9,787 | ) | ||
| Total Accumulated Earnings | $ | 3,236 | ||
| * | The Fund has capital loss carryforwards that are identified in the Capital Loss Carryforward note that follows. | |
| † | The difference between book-basis and tax-basis unrealized appreciation (depreciation) may be attributable to the losses deferred due to wash sale adjustments, foreign currency gains and losses, adjustments related to PFICs, REITs, RICs, certain derivatives and partnerships. |
| 23 |
| Hartford High Yield HLS Fund |
| Notes to Financial Statements – (continued) |
| June 30, 2012 (Unaudited) |
| (000’s Omitted) |
| d) | Reclassification of Capital Accounts – The Fund may record reclassifications in its capital accounts. These reclassifications have no impact on the total net assets of the Fund. The reclassifications are a result of permanent differences between U.S. GAAP and tax accounting for such items as foreign currency, PFICs, expiration or utilization of capital loss carryforwards or net operating losses. Adjustments are made to reflect the impact these items have on current and future distributions to shareholders. Therefore, the source of the Fund’s distributions may be shown in the accompanying Statement of Changes in Net Assets as from undistributed net investment income, from accumulated net realized gains on investments or from capital depending on the type of book and tax differences that exist. For the year ended December 31, 2011, the Fund recorded reclassifications to increase (decrease) the accounts listed below: |
| Amount | ||||
| Undistributed Net Investment Income | $ | (343 | ) | |
| Accumulated Net Realized Gain (Loss) | 343 | |||
| e) | Capital Loss Carryforward – On December 22, 2010, the Regulated Investment Company Modernization Act of 2010 (the “Act”) was enacted, which made changes to the capital loss carryforward rules. The changes are effective for taxable years beginning after the date of enactment. Under the Act, funds are permitted to carry forward capital losses for an unlimited period. However, any losses incurred during those future taxable years will be required to be utilized prior to the losses incurred in pre-enactment taxable years, which carry an expiration date. As a result of this ordering rule, pre-enactment capital loss carryforwards may be more likely to expire unused. Additionally, post-enactment capital loss carryforwards retain their character as either short-term or long-term capital losses rather than being considered all short-term as permitted under prior regulation. |
At December 31, 2011 (tax-year-end), the Fund had capital loss carryforwards for U.S. federal income tax purposes as follows:
| Year of Expiration | Amount | |||
| 2017 | $ | 44,157 | ||
| Total | $ | 44,157 | ||
During the year ended December 31, 2011, the Fund utilized $23,678 of prior year capital loss carryforwards.
| f) | Accounting for Uncertainty in Income Taxes – The Fund has adopted financial reporting rules that require the Fund to analyze all open tax years, as defined by the statute of limitations, for all major jurisdictions. Generally, tax authorities can examine all tax returns filed for the last three years. The Fund does not have an examination in progress. |
The Fund has reviewed all open tax years and major jurisdictions and concluded that these financial reporting rules had no effect on the Fund’s financial position or results of operations. There is no tax liability resulting from unrecognized tax benefits relating to uncertain income tax positions taken or expected to be taken on the tax return for the fiscal year ended December 31, 2011. The Fund is also not aware of any tax positions for which it is reasonably possible that the total amounts of unrecognized tax benefits will significantly change in the next twelve months.
| 7. | Expenses: |
| a) | Investment Management Agreement – HL Investment Advisors, LLC (“HL Advisors”), an indirect wholly owned subsidiary of The Hartford Financial Services Group, Inc. (“The Hartford”), serves as investment manager to the Fund pursuant to an Investment Management Agreement with the Company. As investment manager, HL Advisors has overall investment supervisory responsibility for the Fund. In addition, HL Advisors provides administrative personnel, services, equipment, facilities and office space for proper operation of the Fund. Effective March 5, 2012, HL Advisors has contracted with Wellington Management Company, LLP (“Wellington Management”) under a sub-advisory agreement for the provision of day-to-day investment management services to the Fund in accordance with the Fund’s investment |
| 24 |
objective and policies. Prior to March 5, 2012, Hartford Investment Management Company was the sub-adviser for the Fund. The Fund pays a fee to HL Advisors, a portion of which may be used to compensate sub-advisers.
The schedule below reflects the rates of compensation paid to HL Advisors for investment management services rendered as of June 30, 2012; the rates are accrued daily and paid monthly.
| Average Daily Net Assets | Annual Fee | |||
| On first $500 million | 0.7000 | % | ||
| On next $500 million | 0.6750 | % | ||
| On next $1.5 billion | 0.6250 | % | ||
| On next $2.5 billion | 0.6150 | % | ||
| On next $5 billion | 0.6050 | % | ||
| Over $10 billion | 0.5950 | % | ||
The schedule below reflects the rates of compensation paid to HL Advisors for investment management services rendered during the period December 31, 2011, through February 29, 2012.
| Average Daily Net Assets | Annual Fee | |||
| On first $500 million | 0.7000 | % | ||
| On next $500 million | 0.6750 | % | ||
| On next $4 billion | 0.6250 | % | ||
| On next $5 billion | 0.6050 | % | ||
| Over $10 billion | 0.5950 | % | ||
| b) | Accounting Services Agreement – Pursuant to the Fund Accounting Agreement between HLIC and the Company, on behalf of the Fund, HLIC provides accounting services to the Fund and receives monthly compensation based on the Fund’s average daily net assets at the rates set forth below. The Fund’s accounting services fees are accrued daily and paid monthly. |
| Average Daily Net Assets | Annual Fee | |||
| On first $5 billion | 0.020 | % | ||
| On next $5 billion | 0.018 | % | ||
| Over $10 billion | 0.016 | % | ||
| c) | Operating Expenses – Allocable expenses incurred by the Company are allocated to each Fund and allocated to classes within a Fund in proportion to the average daily net assets of the Fund and each class, except where allocation of certain expenses is more fairly made directly to the Fund or to specific classes within a Fund. |
| d) | Distribution Plan for Class IB shares – The Company, on behalf of the Fund, has adopted a Distribution Plan pursuant to Rule 12b-1 of the 1940 Act to compensate the Distributor, Hartford Securities Distribution Company, Inc. (a wholly owned, ultimate subsidiary of The Hartford), from assets attributable to the Class IB shares for services rendered and expenses borne in connection with activities primarily intended to result in the sale of the Class IB shares, subject to the review and approval of the Company’s Board of Directors. |
The Distribution Plan provides that the Fund may pay annually up to 0.25% of the average daily net assets of the Fund attributable to its Class IB shares for activities primarily intended to result in the sale of Class IB shares. The Board has the authority to suspend or reduce these payments at any point in time. Under the terms of the Distribution Plan and the principal underwriting agreement, the Fund is authorized to make payments monthly to the Distributor that may be used
| 25 |
| Hartford High Yield HLS Fund |
| Notes to Financial Statements – (continued) |
| June 30, 2012 (Unaudited) |
| (000’s Omitted) |
to pay or compensate entities providing distribution and shareholder servicing with respect to the Class IB shares for such entities’ fees or expenses incurred or paid in that regard. These fees are accrued daily and paid monthly.
| e) | Other Related Party Transactions – Certain officers of the Fund are directors and/or officers of HL Advisors and/or The Hartford or its subsidiaries. For the six-month period ended June 30, 2012, a portion of the Fund’s chief compliance officer’s salary was paid by all the investment companies in the Hartford fund complex. The portion allocated to the Fund was in the amount of $1. Hartford Administrative Services Company (“HASCO”), an indirect wholly owned subsidiary of The Hartford, provides transfer agent services to the Fund. HASCO was compensated on a per account basis for providing such services. The amount paid to HASCO can be found in the Statement of Operations. These fees are accrued daily and paid monthly. |
| f) | Payment from Affiliate – In July of 2007, The Hartford entered into a settlement with the Attorneys General of the states of New York, Connecticut and Illinois relating to market timing and the company's individual variable annuity contracts in which certain payments would be made directly to the variable annuity contract holders. The distribution plan provided that unclaimed money from the settlement would be distributed to certain HLS Funds that are investment options through a Hartford individual variable annuity contract. The unclaimed money was distributed to the Fund on September 18, 2009. |
The total return in the accompanying financial highlights includes a payment from an affiliate. Had the payment from the affiliate been excluded, the impact and total return for the period listed below would have been as follows:
| For the Year Ended December 31, 2009 | ||||||||
| Class IA | Class IB | |||||||
| Impact from Payment from Affiliate for Attorneys General Settlement | 0.03 | % | 0.03 | % | ||||
| Total Return Excluding Payment from Affiliate | 50.41 | % | 50.04 | % | ||||
| 8. | Investment Transactions: |
For the six-month period ended June 30, 2012, the Fund's aggregate purchases and sales of investment securities (excluding short-term investments) were as follows:
| Amount | ||||
| Cost of Purchases Excluding U.S. Government Obligations | $ | 455,479 | ||
| Sales Proceeds Excluding U.S. Government Obligations | 542,756 | |||
| Cost of Purchases for U.S. Government Obligations | 41,786 | |||
| Sales Proceeds for U.S. Government Obligations | 79,157 | |||
| 9. | Line of Credit: |
The Fund is one of several Hartford funds that participate in a $500 million committed revolving line of credit facility. The facility is to be used for temporary or emergency purposes. Under the arrangement, the funds are required to own securities having a market value in excess of 300% of the total bank borrowings. The interest rate on borrowings varies depending on the nature of the loan. The facility also requires a fee to be paid based on the amount of the commitment. This commitment fee is allocated to all of the funds participating in the line of credit based on the average net assets of the funds. During the six-month period ended June 30, 2012, the Fund did not have any borrowings under this facility.
| 26 |
| 10. | Industry Classifications: |
Other than the industry classifications “Other Investment Pools and Funds” and “Exchange Traded Funds,” equity industry classifications used in this report are the Global Industry Classification Standard, which was developed by and is the exclusive property and service mark of MSCI, Inc. and Standard & Poor’s.
| 11. | Indemnifications: |
Under the Company’s organizational documents, the Company shall indemnify its officers and directors to the full extent required or permitted under Maryland General Corporation Law and the federal securities laws. In addition, the Company, on behalf of the Fund, may enter into contracts that contain a variety of indemnifications. The Company’s maximum exposure under these arrangements is unknown. However, as of the date of these financial statements, the Company has not had prior claims or losses pursuant to these contracts and expects the risk of loss to be remote.
| 27 |
| Hartford High Yield HLS Fund |
| Financial Highlights |
| - Selected Per-Share Data (A) - |
Class | Net Asset Value at Beginning of Period | Net Investment Income (Loss) | Payments from (to) Affiliate | Net Realized and Unrealized Gain (Loss) on Investments | Total from Investment Operations | Dividends from Net Investment Income | Distributions from Realized Capital Gains | Distributions from Capital | Total Distributions | Net Increase (Decrease) in Net Asset Value | Net Asset Value at End of Period | |||||||||||||||||||||||||||||||||
| For the Six-Month Period Ended June 30, 2012 (Unaudited) (D) | ||||||||||||||||||||||||||||||||||||||||||||
| IA | $ | 8.70 | $ | 0.30 | $ | — | $ | 0.30 | $ | 0.60 | $ | — | $ | — | $ | — | $ | — | $ | 0.60 | $ | 9.30 | ||||||||||||||||||||||
| IB | 8.59 | 0.29 | — | 0.29 | 0.58 | — | — | — | — | 0.58 | 9.17 | |||||||||||||||||||||||||||||||||
| For the Year Ended December 31, 2011 (D) | ||||||||||||||||||||||||||||||||||||||||||||
| IA | 9.15 | 0.71 | — | (0.31 | ) | 0.40 | (0.85 | ) | — | — | (0.85 | ) | (0.45 | ) | 8.70 | |||||||||||||||||||||||||||||
| IB | 9.04 | 0.67 | — | (0.30 | ) | 0.37 | (0.82 | ) | — | — | (0.82 | ) | (0.45 | ) | 8.59 | |||||||||||||||||||||||||||||
| For the Year Ended December 31, 2010 (D) | ||||||||||||||||||||||||||||||||||||||||||||
| IA | 7.94 | 0.75 | — | 0.52 | 1.27 | (0.06 | ) | — | — | (0.06 | ) | 1.21 | 9.15 | |||||||||||||||||||||||||||||||
| IB | 7.86 | 0.72 | — | 0.52 | 1.24 | (0.06 | ) | — | — | (0.06 | ) | 1.18 | 9.04 | |||||||||||||||||||||||||||||||
| For the Year Ended December 31, 2009 (D) | ||||||||||||||||||||||||||||||||||||||||||||
| IA | 5.73 | 0.73 | — | 2.16 | 2.89 | (0.68 | ) | — | — | (0.68 | ) | 2.21 | 7.94 | |||||||||||||||||||||||||||||||
| IB | 5.68 | 0.70 | — | 2.14 | 2.84 | (0.66 | ) | — | — | (0.66 | ) | 2.18 | 7.86 | |||||||||||||||||||||||||||||||
| For the Year Ended December 31, 2008 | ||||||||||||||||||||||||||||||||||||||||||||
| IA | 8.87 | 0.83 | — | (3.12 | ) | (2.29 | ) | (0.85 | ) | — | — | (0.85 | ) | (3.14 | ) | 5.73 | ||||||||||||||||||||||||||||
| IB | 8.78 | 0.83 | — | (3.11 | ) | (2.28 | ) | (0.82 | ) | — | — | (0.82 | ) | (3.10 | ) | 5.68 | ||||||||||||||||||||||||||||
| For the Year Ended December 31, 2007 (D) | ||||||||||||||||||||||||||||||||||||||||||||
| IA | 9.35 | 0.71 | — | (0.45 | ) | 0.26 | (0.74 | ) | — | — | (0.74 | ) | (0.48 | ) | 8.87 | |||||||||||||||||||||||||||||
| IB | 9.27 | 0.68 | — | (0.45 | ) | 0.23 | (0.72 | ) | — | — | (0.72 | ) | (0.49 | ) | 8.78 | |||||||||||||||||||||||||||||
| (A) | Information presented relates to a share outstanding throughout the indicated period. |
| (B) | The figures do not include sales charges or other fees which may be applied at the variable life insurance, variable annuity or qualified retirement plan product level. Any such additional sales charges or other fees would lower the Fund's performance. |
| (C) | Portfolio turnover rate is calculated on the basis of the Fund as a whole without distinguishing between the classes of shares issued. |
| (D) | Per share amounts have been calculated using the average shares method. |
| (E) | Not annualized. |
| (F) | Annualized. |
| (G) | Total return without the inclusion of the Payment from (to) Affiliate can be found in Expenses in the accompanying Notes to Financial Statements. |
| 28 |
- Ratios and Supplemental Data -
| Total Return(B) | Net Assets at End of Period | Ratio of Expenses to Average Net Assets Before Waivers | Ratio of Expenses to Average Net Assets After Waivers | Ratio of Net Investment Income (Loss) to Average Net Assets | Portfolio Turnover Rate(C) | |||||||||||||||||
| 6.86 | %(E) | $ | 496,259 | 0.74 | %(F) | 0.74 | %(F) | 6.66 | %(F) | 69 | % | |||||||||||
| 6.73 | (E) | 153,166 | 0.99 | (F) | 0.99 | (F) | 6.43 | (F) | – | |||||||||||||
| 4.69 | 548,608 | 0.74 | 0.74 | 7.68 | 88 | |||||||||||||||||
| 4.44 | 160,060 | 0.99 | 0.99 | 7.43 | — | |||||||||||||||||
| 16.15 | 602,493 | 0.75 | 0.75 | 8.80 | 139 | |||||||||||||||||
| 15.86 | 186,357 | 1.00 | 1.00 | 8.57 | — | |||||||||||||||||
| 50.46 | (G) | 527,000 | 0.75 | 0.75 | 10.32 | 173 | ||||||||||||||||
| 50.08 | (G) | 188,832 | 1.00 | 1.00 | 10.08 | — | ||||||||||||||||
| (25.23 | ) | 293,839 | 0.74 | 0.74 | 9.05 | 101 | ||||||||||||||||
| (25.42 | ) | 124,701 | 0.99 | 0.99 | 8.76 | — | ||||||||||||||||
| 2.79 | 460,243 | 0.77 | 0.72 | 7.47 | 148 | |||||||||||||||||
| 2.53 | 222,712 | 1.02 | 0.97 | 7.20 | — | |||||||||||||||||
| 29 |
| Hartford High Yield HLS Fund |
| Directors and Officers (Unaudited) |
The Board of Directors of the Company appoints officers who are responsible for the day-to-day operations of the Fund and who execute policies formulated by the Directors. Each director serves until his or her death, resignation, or retirement or until the next annual meeting of shareholders is held or until his or her successor is elected and qualifies.
Directors and officers who are employed by or who have a financial interest in The Hartford are considered “interested” persons of the Fund pursuant to the 1940 Act. Each officer and two of the Company’s directors, as noted in the chart below, are “interested” persons of the Fund. Each director serves as a director for The Hartford Mutual Funds, Inc., The Hartford Mutual Funds II, Inc., Hartford Series Fund, Inc., Hartford HLS Series Fund II, Inc., and as a trustee for The Hartford Alternative Strategies Fund, which, as of June 30, 2012, collectively consist of 89 funds. Correspondence may be sent to directors and officers c/o Hartford Mutual Funds, P.O. Box 2999, Hartford, Connecticut 06104-2999, except that correspondence to Mr. Annoni, Mr. Dressen and Ms. Fagely may be sent to 500 Bielenberg Drive, Woodbury, Minnesota 55125.
The table below sets forth, for each director and officer, his or her name, year of birth, current position with the Company and date first elected or appointed to Hartford Series Fund, Inc. (“HSF”), and Hartford HLS Series Fund II, Inc. (“HSF2”), principal occupation, and, for directors, other directorships held. The Fund’s statement of additional information contains further information on the directors and is available free of charge by calling 1-800-862-6668 or writing to Hartford HLS Funds, c/o Individual Annuity Services, P.O. Box 5085, Hartford, CT 06102-5085.
Information on the aggregate remuneration paid to the directors of the Company can be found in the Statement of Operations herein. The Fund pays to The Hartford a portion of the Chief Compliance Officer’s compensation, but does not pay salaries or compensation to any of their other officers or directors who are employed by The Hartford.
Non-Interested Directors
Lynn S. Birdsong (1946) Director since 2003, Co-Chairman of the Investment Committee
Mr. Birdsong is a private investor. Mr. Birdsong currently serves as a Director of the Sovereign High Yield Investment Company (April 2010 to current). Mr. Birdsong currently serves as an Independent Director of Nomura Partners Funds, Inc. (formerly, The Japan Fund) (March 2003 to current). From 1979 to 2002, Mr. Birdsong was a managing director of Zurich Scudder Investments, an investment management firm. During his employment with Scudder, Mr. Birdsong was an Interested Director of The Japan Fund. Since 1981, Mr. Birdsong has been a partner in Birdsong Company, an advertising specialty firm.
Robert M. Gavin, Jr. (1940) Director since 2002 (HSF) and 1986 (HSF2), Chairman of the Board since 2004
Dr. Gavin is an educational consultant. Prior to September 1, 2001, he was President of Cranbrook Education Community and prior to July 1996, he was President of Macalester College, St. Paul, Minnesota.
Duane E. Hill (1945) Director since 2001 (HSF) and 2002 (HSF2), Chairman of the Nominating Committee
Mr. Hill is Partner of TSG Ventures L.P., a private equity investment company. Mr. Hill is a former partner of TSG Capital Group, a private equity investment firm that served as sponsor and lead investor in leveraged buyouts of middle market companies.
Sandra S. Jaffee (1941) Director since 2005
Ms. Jaffee is the founder and Chief Executive Officer of a private company, Homeworks Concierge, LLC, which provides residential property management services in Westchester County, New York (January 2012 to present). Ms. Jaffee served as Chairman (2008 to 2009) and Chief Executive Officer of Fortent (formerly Searchspace Group), a leading provider of compliance/regulatory technology to financial institutions from August 2005 to August 2009. Ms. Jaffe currently serves as a member of the Board of Directors of Broadridge Financial Solutions as well as a Trustee of Muhlenberg College.
William P. Johnston (1944) Director since 2005, Chairman of the Compliance Committee
In June 2006, Mr. Johnston was appointed as Senior Advisor to The Carlyle Group, a global private equity investment firm. In August 2007, Mr. Johnston was elected to the Board of Directors of LifeCare Holdings, Inc. In February 2008, Mr. Johnston was elected to the Board of Directors of HCR-ManorCare, Inc. In May 2006, Mr. Johnston was elected to the Supervisory Board of Fresenius Medical Care AG & Co. KGaA, after its acquisition of Renal Care Group, Inc. in March 2006.
Phillip O. Peterson (1944) Director since 2002 (HSF) and 2000 (HSF2), Chairman of the Audit Committee
Mr. Peterson is a mutual fund industry consultant. He was a partner of KPMG LLP (an accounting firm) until July 1999. Mr. Peterson joined William Blair Funds in February 2007 as a member of the Board of Trustees. Mr. Peterson also joined the Board of Trustees of Symetra Variable Mutual Funds Trust as a trustee in February 2012.
| 30 |
Lemma W. Senbet (1946) Director since 2005
Dr. Senbet is the William E. Mayer Chair Professor of Finance and Director, Center for Financial Policy, at the University of Maryland, Robert H. Smith School of Business. He was chair of the Finance Department from 1998 to 2006. Previously he was a chaired professor of finance at the University of Wisconsin-Madison. Also, he was director of the Fortis Funds from March 2000 to July 2002. Dr. Senbet served the finance profession in various capacities, including as director of the American Finance Association and President of the Western Finance Association. In 2006, Dr. Senbet was inducted Fellow of Financial Management Association International for his career-long distinguished scholarship and professional service.
Interested Directors and Officers
David N. Levenson (1966) Director since 2010(1)
Mr. Levenson currently serves as President of The Hartford’s Wealth Management business. He was appointed to this role in July 2010. Previously, Mr. Levenson served as Executive Vice President of Legacy Holdings for The Hartford from June 2009 to July 2010. From 2006 to 2009, Mr. Levenson was with Hartford Life Insurance K.K. where he served as President and Chief Executive Officer from 2007 to 2009. He served as Managing Director of Hartford Investment Management Company from 2005 to 2006. Additionally, Mr. Levenson serves as Executive Vice President of The Hartford and as President, Director and Chief Executive Officer of Hartford Life Insurance Company (“HLIC”) and Hartford Life, Inc. (“HL Inc.”).
(1) Mr. Levenson served as Interested Director until August 2, 2012.
Lowndes A. Smith (1939) Director since 1996 (HSF) and 2002 (HSF2), Co-Chairman of the Investment Committee
Mr. Smith served as Vice Chairman of The Hartford from February 1997 to January 2002, as President and Chief Executive Officer of HL Inc. from February 1997 to January 2002, and as President and Chief Operating Officer of The Hartford Life Insurance Companies from January 1989 to January 2002. Mr. Smith serves as a Director of White Mountains Insurance Group, Ltd., One Beacon Insurance and Symetra Financial and as Managing Director of Whittington Gray Associates.
Other Officers
James E. Davey (1964) President and Chief Executive Officer since 2010(2)
Mr. Davey serves as Executive Vice President of HLIC. Additionally, Mr. Davey serves as President, Chief Executive Officer and Manager of HIFSCO and President, Chief Executive Officer and Manager of HL Investment Advisors, LLC (“HL Advisors”). Mr. Davey joined The Hartford in 2002.
(2) Mr. Davey became an Interested Director effective August 2, 2012.
Mark A. Annoni (1964) Vice President, Controller and Treasurer since 2012(3)
Mr. Annoni serves as the Assistant Vice President and Director of Investment Finance (February 2004 to present). Mr. Annoni joined The Hartford in April 2001 as part of The Hartford’s acquisition of Fortis Financial Group. Prior to joining The Hartford, Mr. Annoni served as Manager of Mutual Fund Accounting at Fortis Financial Group (July 1997 to April 2001).
(3) Mr. Annoni was named Vice President, Controller and Treasurer on May 8, 2012.
Michael R. Dressen (1963) AML Compliance Officer since 2011
Mr. Dressen currently serves as Assistant Vice President of HLIC. He also serves as Chief Compliance Officer and AML Compliance Officer of Hartford Administrative Services Company (“HASCO”) and as Assistant Secretary and Compliance Officer of HIFSCO. Mr Dressen joined The Hartford in 2005 from State Farm Insurance Companies where he held various positions related to mutual funds, variable products, and property casualty insurance.
Tamara L. Fagely (1958) Vice President, since 2002 (HSF) and 1993 (HSF2)(4)
Ms. Fagely has been a Vice President of HASCO since 1998 and Chief Financial Officer since 2006. Currently Ms. Fagely is a Vice President of HLIC. She served as Assistant Vice President of HLIC from December 2001 through March 2005. In addition, Ms. Fagely is Controller and Chief Financial Officer of HIFSCO.
(4) Ms. Fagely served as Vice President, Controller and Treasurer until May 8, 2012.
Dr. Robert J. Froehlich (1953) Senior Managing Director since 2009(5)
Dr. Froehlich joined The Hartford as Senior Managing Director in September 2009. Prior to joining The Hartford, Dr. Froehlich served as Vice Chairman of Deutsche Asset Management from 1997-2009.
(5) Dr. Froehlich served as Senior Managing Director until March 26, 2012.
| 31 |
| Hartford High Yield HLS Fund |
| Directors and Officers (Unaudited) – (continued) |
Edward P. Macdonald (1967) Vice President, Secretary and Chief Legal Officer since 2005
Mr. Macdonald serves as Vice President of HLIC and Chief Legal Officer of Mutual Funds and Vice President of HIFSCO. He also serves as Vice President and Secretary of HASCO, and Chief Legal Officer, Secretary and Vice President of HL Advisors. Mr. Macdonald joined The Hartford in 2005.
Vernon J. Meyer (1964) Vice President since 2006
Mr. Meyer serves as Senior Vice President of HLIC. He also serves as Senior Vice President of HIFSCO and HL Advisors. Mr. Meyer joined The Hartford in 2004.
Colleen B. Pernerewski (1969) Vice President and Chief Compliance Officer since 2010
Ms. Pernerewski serves as Vice President and Chief Investment Advisor Compliance Officer of HIFSCO and as Vice President and Chief Compliance Officer of HL Advisors. Ms. Pernerewski serves as Vice President and Chief Compliance Officer of Individual Annuity of HLIC. Ms. Pernerewski joined The Hartford in 2005 from Travelers Life and Annuity where she served as Counsel (2004-2005). Prior to Travelers Life and Annuity, Ms. Pernerewski held the position of Counsel at The Hartford (1998-2004).
Elizabeth L. Schroeder (1966) Vice President since 2010
Ms. Schroeder currently serves as Assistant Vice President of HLIC. Ms. Schroeder joined HLIC in 1991. She is also an Assistant Vice President of HASCO, HIFSCO and HL Advisors.
Martin Swanson (1962) Vice President since 2010
Mr. Swanson is a Vice President of HLIC. Mr. Swanson also serves as Vice President/Marketing for HIFSCO. Prior to joining HLIC in 1998, Mr. Swanson was a Vice President at PaineWebber, Inc.
Jane Wolak (1961) Vice President since 2009
Ms. Wolak currently serves as Senior Vice President of HLIC. Ms. Wolak joined HLIC as Vice President, Retail Product Services in May 2007. She is also Vice President of HASCO. Previously, Ms. Wolak was with Sun Life Financial where she held the position of Vice President, Service Center Operations from 2001-2007.
HOW TO OBTAIN A COPY OF THE FUND’S PROXY VOTING POLICIES AND VOTING RECORDS (UNAUDITED)
A description of the policies and procedures that the Fund uses to determine how to vote proxies relating to portfolio securities and a record of how the Fund voted any proxies for the twelve-month period ended June 30, 2012 are available (1) without charge, upon request, by calling 800-862-6668 and (2) on the SEC’s website at http://www.sec.gov.
QUARTERLY PORTFOLIO HOLDINGS INFORMATION (UNAUDITED)
The Fund files a complete schedule of portfolio holdings with the SEC for the first and third quarters of each fiscal year on Form N-Q. The Fund’s Forms are available (1) without charge, upon request, by calling 800-862-6668 and (2) on the SEC’s website at http://www.sec.gov. The Form N-Q may be reviewed and copied at the SEC’s Public Reference Room in Washington, DC. Information on the operation of the Public Reference Room may be obtained by calling 1-800-SEC-0330.
| 32 |
| Hartford High Yield HLS Fund |
| Expense Example (Unaudited) |
Your Fund's Expenses
As a shareholder of the Fund, you incur two types of costs: (1) transaction costs and (2) ongoing costs including investment management fees, distribution fees, and other fund expenses. This example is intended to help you understand your ongoing costs (in dollars) of investing in the Fund and to compare these costs with the ongoing costs of investing in other mutual funds. The example is based on an investment of $1,000 invested at the beginning of the period and held for the period of December 31, 2011 through June 30, 2012.
Actual Expenses
The first set of columns of the table below provides information about actual account values and actual expenses. You may use the information in this column, together with the amount you invested, to estimate the expenses that you paid over the period. Simply divide your account value by $1,000 (for example, an $8,600 account value divided by $1,000 = 8.6), then multiply the result by the number in the line under the heading entitled “Expenses Paid During Period” to estimate the expenses you paid on your account during this period.
Hypothetical Example for Comparison Purposes
The second set of columns of the table below provides information about hypothetical account values and hypothetical expenses based on the Fund’s actual expense ratio and an assumed rate of return of 5% per year before expenses, which is not the Fund’s actual return. The hypothetical account values and expenses may not be used to estimate the actual ending account balance or expenses you paid for the period. You may use this information to compare the ongoing costs of investing in the Fund and other funds. To do so, compare this 5% hypothetical example with the 5% hypothetical examples that appear in the shareholder reports of the other funds.
Please note that the expenses shown in the table are meant to highlight your ongoing costs only and do not reflect any transactional costs, such as sales charges (loads) and CDSC. Therefore, the second set of columns of the table is useful in comparing ongoing costs only, and will not help you determine the relative total costs of owning different funds. In addition, if these transactional costs were included, your costs would be higher. Expenses are equal to the Fund's annualized expense ratios multiplied by average account value over the period, multiplied by 182/366 (to reflect the one-half year period).
| Actual return | Hypothetical (5% return before expenses) | ||||||||||||||||||||||||||||||||||||
| Beginning Account Value December 31, 2011 | Ending Account Value June 30, 2012 | Expenses paid during the period December 31, 2011 through June 30, 2012 | Beginning Account Value December 31, 2011 | Ending Account Value June 30, 2012 | Expenses paid during the period December 31, 2011 through June 30, 2012 | Annualized expense ratio | Days in the current 1/2 year | Days in the full year | |||||||||||||||||||||||||||||
| Class IA | $ | 1,000.00 | $ | 1,068.63 | $ | 3.81 | $ | 1,000.00 | $ | 1,021.18 | $ | 3.72 | 0.74 | % | 182 | 366 | |||||||||||||||||||||
| Class IB | $ | 1,000.00 | $ | 1,067.31 | $ | 5.09 | $ | 1,000.00 | $ | 1,019.94 | $ | 4.97 | 0.99 | % | 182 | 366 | |||||||||||||||||||||
| 33 |
| Hartford High Yield HLS Fund |
| Approval of Investment Sub-Advisory Agreement (Unaudited) |
Section 15(c) of the Investment Company Act of 1940, as amended (the “1940 Act”), requires that each mutual fund’s board of directors, including a majority of those directors who are not “interested persons” of the mutual fund, as defined in the 1940 Act (the “Independent Directors”), initially approve, and annually review and consider the continuation of, the mutual fund’s investment sub-advisory agreement(s). At its meeting held on February 1, 2012, the Board of Directors (the “Board”) of Hartford Series Fund, Inc., including each of the Independent Directors, unanimously voted to approve an investment sub-advisory agreement for Hartford High Yield HLS Fund (the “Fund”) between HL Investment Advisors, LLC (“HL Advisors”), the Fund’s investment manager, and Wellington Management Company, LLP (“Wellington Management”) (the “Agreement”). The Agreement went into effect on March 5, 2012.
Prior to approving the Agreement, the Board requested, received, and reviewed written responses from HL Advisors and Wellington Management to questions posed to them on behalf of the Independent Directors and supporting materials relating to those questions and responses (the “Adviser Materials”). In addition, the Board received an in-person presentation from Fund officers and representatives of HL Advisors about the proposal to replace Hartford Investment Management, the Fund’s current sub-adviser, with Wellington Management. The Board’s Contracts Committee also met in person with the proposed portfolio manager for the Fund regarding the capabilities of Wellington Management and the associated benefits to the Fund and its shareholders. In addition, the Board had previously received information with respect to Wellington Management in connection with Wellington Management’s re-approval on August 2-3, 2011 as the sub-adviser to certain other Hartford-sponsored funds.
In determining to approve the Agreement for the Fund, the members of the Board reviewed and evaluated information and factors they believed to be relevant and appropriate in light of the information that the Board deemed necessary and appropriate through the exercise of their reasonable business judgment. While individual members of the Board may have weighed certain factors differently, the Board’s determination to approve the Agreement was based on a comprehensive consideration of all information provided to the Board with respect to the approval of the Agreement. A more detailed discussion of the factors the Board considered with respect to its approval of the Agreement is provided below.
Nature, Extent, And Quality Of Services to be Provided by Wellington Management
The Board requested and considered information concerning the nature, extent, and quality of the services to be provided to the Fund by Wellington Management. The Board considered, among other things, the terms of the Agreement, the range of services to be provided, and Wellington Management’s organizational structure, systems and personnel. The Board also considered Wellington Management’s reputation and overall financial strength, and the Board’s past experience with Wellington Management as sub-adviser for other Hartford-sponsored funds. The Board considered the terms of the “preferred partnership” arrangement pursuant to which Wellington Management would serve as the preferred sub-adviser to the Hartford-sponsored funds, including the benefits of the arrangement for the Fund and other Hartford-sponsored funds.
With respect to Wellington Management’s fixed income capabilities, the Board considered that HL Advisors believes that Wellington Management is a high quality fixed income manager with greater depth and breadth relative to Hartford Investment Management and other peer advisory firms and that Wellington Management has strong investment capabilities with expertise across various investment disciplines. The Board also considered Wellington Management’s global fixed income capabilities, including the number and geographic locations of Wellington Management’s investment personnel. The Board noted that during the past ten years, Wellington Management had been committed to supporting the growth of its fixed income teams by allocating additional resources, personnel and technology to these teams, and also noted that Wellington Management is focused entirely on third-party asset management and has experience managing assets for a diverse set of clients, including fixed income mutual funds, with different objectives and guidelines. In addition, the Board considered Wellington Management’s risk management systems, noting that they are embedded within the firm’s fixed income process.
With respect to the day-to-day portfolio management services to be provided by Wellington Management, the Board considered the Contracts Committee’s meeting with the proposed portfolio manager, and Wellington Management’s investment philosophy and process, investment research capabilities and resources, performance record, trade execution capabilities and experience. The Board also considered the experience of the proposed portfolio manager and the investment professionals and sector specialists that would support the proposed portfolio manager.
The Board also considered information previously provided by HL Advisors and Wellington Management regarding Wellington Management’s compliance policies and procedures and compliance history, and received a representation from HL Advisors that
| 34 |
the written compliance policies and procedures of Wellington Management are reasonably designed to prevent violations of the federal securities laws.
In considering this information, the Board evaluated not only the information presented to the Board and the Contracts Committee in connection with its consideration of the Agreement, but also the Board’s experience through past interactions with Wellington Management. Based on these considerations, the Board concluded that it was satisfied with the nature, extent and quality of the services to be provided to the Fund by Wellington Management.
Performance of Wellington Management
The Board considered the investment performance of Wellington Management, including the performance of the Wellington Management composite for accounts with substantially similar investment objectives, policies and principal investment strategies to one or more components of the Fund’s principal investment strategy. The Board noted that the performance of the relevant Wellington Management composite was favorable in the long term and noted similarities between portfolio statistics of the Wellington Management composite and of the Fund. HL Advisors and Wellington Management also provided additional information about the broad range of the portfolio manager’s investment experience and the experience of the investment professionals and sector specialists that would support the proposed portfolio manager, and their investment philosophy and process.
Based on these considerations, the Board concluded that it was satisfied that Wellington Management has the capability of providing satisfactory investment performance for the Fund.
Costs of the Services and Profitability of HL Advisors and Wellington Management
The Board reviewed information regarding HL Advisors’ cost to provide investment management and related services to the Fund and the estimated profitability to HL Advisors and its affiliates from all services provided to the Fund and all aspects of their relationship with the Fund both under the sub-advisory arrangement with Hartford Investment Management and assuming implementation of the Agreement with Wellington Management. The Board also requested and received information relating to the operations and profitability of Wellington Management.
Based on these considerations, the Board concluded that the profits anticipated to be realized by HL Advisors, Wellington Management and their affiliates from their relationships with the Fund would not be excessive.
Comparison of Fees and Services
With respect to the sub-advisory fee schedule to be paid to Wellington Management by HL Advisors in respect of the Fund, the Board considered comparative information with respect to the sub-advisory fees to be paid by HL Advisors to Wellington Management. The Board also considered information provided by Wellington Management to the Contracts Committee of the Board about the quality of services to be performed for the Fund and Wellington Management’s investment philosophy. In addition, the Board considered HL Advisors’ representation that it had negotiated Wellington Management’s fees at arm’s length.
The Board considered that, in connection with the sub-adviser change, HL Advisors proposed to add an additional breakpoint to the Fund’s contractual management fee schedule with HL Advisors that would result in a management fee reduction at certain asset levels. The Board noted that HL Advisors, not the Fund, would pay the sub-advisory fees to Wellington Management.
Based on these considerations, the Board concluded that the Fund’s proposed sub-advisory fees, in conjunction with the information about quality of services, profitability, economies of scale, and other matters discussed, were reasonable in light of the services to be provided.
Economies of Scale
The Board considered the extent to which economies of scale would be realized as the Fund grows and whether the fee levels reflect these economies of scale for the benefit of the Fund’s shareholders. The Board reviewed the breakpoints in the
| 35 |
| Hartford High Yield HLS Fund |
| Approval of Investment Sub-Advisory Agreement (Unaudited) – (continued) |
management fee schedule for the Fund, which reduce fee rates as Fund assets grow over time. The Board noted HL Advisors’ proposal to add an additional breakpoint to the Fund’s management fee schedule in connection with the sub-adviser change, thereby reducing fee rates above certain asset levels.
The Board reviewed relevant information included in the Adviser Materials regarding comparative breakpoint information for other funds in the Fund’s Lipper peer group. Based on these considerations, the Board concluded that it was satisfied with the extent to which economies of scale would be shared for the benefit of the Fund’s shareholders based on currently available information and the effective advisory fees and expense ratios for the Fund at its current and reasonably anticipated asset levels. The Board noted, however, that it would review future growth in Fund assets and the appropriateness of the breakpoints as part of its future annual review of the Agreement and the investment management agreement between the Fund and HL Advisors.
Other Benefits
The Board considered other benefits to Wellington Management and its affiliates from their relationships with the Fund. The Board also considered the benefits, if any, to Wellington Management from any use of the Fund’s brokerage commissions to obtain soft dollar research, and representations from HL Advisors and Wellington Management that Wellington Management would not make any revenue-sharing payments or any other type of distribution payments to HL Advisors or its affiliates.
* * * *
Based upon its review of these various factors, among others, the Board concluded that it is in the best interests of the Fund and its shareholders for the Board to approve the Agreement. In reaching this decision, the Board did not assign relative weights to the factors discussed above or deem any one or group of them to be controlling in and of themselves. In connection with its deliberations, the Independent Directors met separately in executive session, with independent legal counsel, to review the relevant materials and consider their responsibilities under relevant laws and regulations.
| 36 |
HARTFORD HLS FUNDS
c/o The Hartford Wealth Management - Global Annuities
P.O. Box 14293
Lexington, KY 40512-4293
Hartford Series Fund, Inc. is underwritten and distributed by Hartford Securities Distribution Company, Inc.
"The Hartford" is The Hartford Financial Services Group, Inc. and its subsidiaries.
Hartford Series Fund, Inc. inception dates range from 1977 to date. Hartford Series Fund, Inc. is not a subsidiary of The Hartford but is underwritten, distributed by and advised by subsidiaries of The Hartford. Investments in Hartford Series Fund, Inc. are not guaranteed by The Hartford or any other entity.
You should carefully consider investment objectives, risks, and charges and expenses of Hartford HLS Funds before investing. This and other information can be found in the Fund’s prospectus or summary prospectus, which can be obtained by calling 800-862-6668. Please read them carefully before you invest or send money.
| HLSSAR-HY12 8-12 111647 Printed in U.S.A ©2012 The Hartford, Hartford, CT 06115 | |

A MESSAGE FROM THE PRESIDENT
Dear Fellow Shareholders:
I want to take this opportunity to say thank you for investing in the Hartford HLS Funds. We’ve seen continued market volatility throughout the first half of 2012, and there will likely be continued uncertainty until the Presidential election in November, but we are still optimistic about the markets in 2012.
Market Review
In the first quarter of 2012, the S&P 500 Index turned in its best quarterly performance since the third quarter of 2009. U.S. equities showed signs of improvement as investors focused on improving economic data and strong corporate earnings news and the Federal Reserve’s pledge to keep interest rates low buoyed investors’ appetites.
The second quarter ended on a high note for the stock market—the S&P 500 had its strongest June in more than a decade and the Dow Jones Industrial Average had its best month since October—but those gains weren’t enough to offset losses from April and May, and equities finished the quarter in the red. Although the S&P 500 was -2.75 for the second quarter, it was up 9.49% for the first half of 2012.
Concerns about domestic and European unemployment are having an effect on our economy. The unemployment rate in the euro zone's 17 nations rose to a record 11.1% in May, the highest level since the euro launched as a common currency more than 10 years ago. In the U.S., the labor market has been fickle this year, with job growth starting off strong in the first couple months of 2012 but slowing down in the spring, which has led many to wonder about the status of the economic recovery.
On a positive note, home prices are rising again after falling for more than five years, new and existing home sales are increasing, and home builders are ramping up construction.
The Hartford HLS Funds Expands Relationship with Wellington Management
We’re very pleased that we are expanding our relationship with Wellington Management, which will now serve as the primary sub-adviser for the Hartford HLS Funds including equity, fixed-income,* and asset-allocation funds. One of America’s oldest and largest investment management firms, Wellington Management has resources that span the entire globe, with multiple offices across the U.S. and numerous offices abroad. Wellington Management’s most distinctive strength is its proprietary research, which is shared across the entire organization.
We believe that aligning more closely with a well-respected money manager like Wellington Management puts us in a strong position to drive significant growth and to continue delivering innovative fund strategies to help our investors meet their financial goals.
Thank you again for investing with the Hartford HLS Funds.
James Davey
President
Hartford HLS Funds
*Several fixed-income funds will continue to be sub-advised by Hartford Investment Management Company.
Table of Contents
This report is prepared for the general information of contract owners and qualified retirement plan participants. It is not an offer of contracts or of qualified retirement plans. It should not be used in connection with any offer, except in conjunction with the appropriate product prospectus which contains all pertinent information including the applicable sales, administrative and other charges.
The views expressed in the Fund’s Manager Discussion under “Why did the Fund perform this way?” and “What is the outlook?” are views of the Fund’s sub-adviser and portfolio management team through the end of the period and are subject to change based on market and other conditions.
Hartford Index HLS Fund inception 05/01/1987
(sub-advised by Hartford Investment Management Company)
| Investment objective – Seeks to provide investment results which approximate the price and yield performance of publicly traded common stocks in the aggregate. |
Performance Overview 6/30/02 - 6/30/12
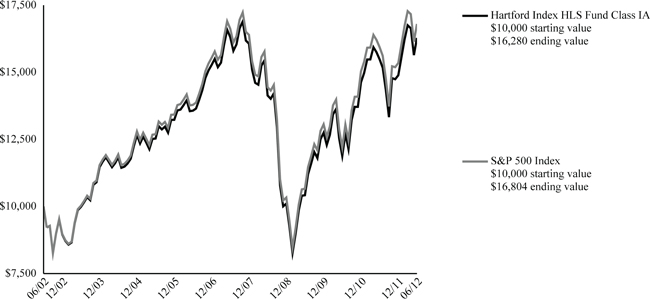
The chart above shows the growth of a $10,000 investment in Class IA. Growth results in classes other than Class IA will vary from what is seen above due to differences in the expenses charged to those share classes.
Average Annual Total Returns (as of 6/30/12) (1) (2)
| 6 Month† | 1 Year | 5 year | 10 year | |
| Index IA | 9.32% | 5.13% | -0.04% | 4.99% |
| Index IB | 9.18% | 4.91% | -0.28% | 4.74% |
| S&P 500 Index | 9.48% | 5.43% | 0.21% | 5.33% |
| † | Not Annualized |
PAST PERFORMANCE IS NOT INDICATIVE OF FUTURE RESULTS.
Total returns presented above were calculated using the Fund's net asset value available to shareholders for sale or redemption of Fund shares on June 30, 2012, which may exclude investment transactions as of this date.
S&P 500 Index is a market capitalization-weighted price index composed of 500 widely held common stocks.
You cannot invest directly in an index.
The chart represents a hypothetical investment in the Fund. Performance data represents past performance and current performance could be higher or lower.
Performance information may reflect historical or current expense waivers/reimbursements from the investment adviser, without which performance would have been lower. For information on current expense waivers/reimbursements, please see the prospectus.
The value of the Fund will fluctuate so that when redeemed, it may be worth more or less than the original investment. The chart and table do not reflect the deductions of taxes, sales charges or other fees which may be applied at the variable life insurance, variable annuity or qualified retirement plan product level. Any such additional sales charges or other fees or expenses would lower the contract’s or plan’s performance.
| 2 |
| Hartford Index HLS Fund |
| Manager Discussion |
| June 30, 2012 (Unaudited) |
| Portfolio Manager |
| Deane Gyllenhaal |
| Vice President |
How did the Fund perform?
The Class IA shares of the Hartford Index HLS Fund returned 9.32% for the six-month period ending June 30, 2012, underperforming its benchmark, the S&P 500 Index, which returned 9.48%, and outperforming the Lipper S&P 500 Index VP-UF Funds category, a group of funds with investment strategies similar to those of the Fund, which returned 9.25%.
Why did the Fund perform this way?
By design, the Fund is managed to mimic the performance of the S&P 500 Index. Due to this approach, the Fund is expected to perform in line with the Index. However, we do not purchase the stock of our parent, The Hartford Financial Services Group, Inc. (HIG). This exposure to HIG is reallocated across the Life/Health, Property/Casualty and Multi-line Insurance industries. The performance of the Fund marginally differed from the benchmark over the period, primarily due to trading in futures contracts, index events, minimal cash exposure, and lack of exposure to HIG.
All but one of the sectors within the S&P 500 Index had positive returns during the first half of 2012. Telecommunication Services led the way up 16.5% followed by Financials which gained 13.6%. Energy was the only sector with a negative return, dropping 2.4% for the six month period.
On a stock level, the best index performers for the quarter included Sears Holdings gaining 87.9% followed by TripAdvisor and Pulte Group which rose 77.3% and 69.6%, respectively. Two of the worst performers for the first half of the year were Alpha Natural Resources which fell 57.4% followed by First Solar with a decline of 55.4%.
What is the outlook?
Looking ahead, challenges include deleveraging, Eurozone member solvency, U.S. Presidential election year uncertainty - especially on fiscal policy, and higher energy costs. We believe corporate fundamentals are decent, but given the balance of challenges aforementioned, corporations are generally reluctant to hire or spend; thus keeping labor markets fragile. With the labor market tentative, we believe the consumer portion of the economy is at a cusp – ready to either drive through these challenges or add to them. These issues are well known. Investors have moved to the sideline, waiting to see which way the consumer falls, leading to tempting valuation levels. Analysts have in general significantly revised earnings downward. In this environment, we believe investors will place marginally higher demand for stable and expanding profit growth.
The Fund will continue to be invested in the S&P 500 Index, with a focus on risk control and efficient trading. Performance of the Fund is expected to be similar to that of the index.
Diversification by Industry
as of June 30, 2012
| Industry (Sector) | Percentage of Net Assets | |||
| Automobiles & Components (Consumer Discretionary) | 0.6 | % | ||
| Banks (Financials) | 3.0 | |||
| Capital Goods (Industrials) | 7.9 | |||
| Commercial & Professional Services (Industrials) | 0.5 | |||
| Consumer Durables & Apparel (Consumer Discretionary) | 0.9 | |||
| Consumer Services (Consumer Discretionary) | 2.0 | |||
| Diversified Financials (Financials) | 5.6 | |||
| Energy (Energy) | 10.7 | |||
| Food & Staples Retailing (Consumer Staples) | 2.4 | |||
| Food, Beverage & Tobacco (Consumer Staples) | 6.5 | |||
| Health Care Equipment & Services (Health Care) | 3.9 | |||
| Household & Personal Products (Consumer Staples) | 2.2 | |||
| Insurance (Financials) | 3.5 | |||
| Materials (Materials) | 3.4 | |||
| Media (Consumer Discretionary) | 3.3 | |||
| Pharmaceuticals, Biotechnology & Life Sciences (Health Care) | 8.0 | |||
| Real Estate (Financials) | 2.2 | |||
| Retailing (Consumer Discretionary) | 3.9 | |||
| Semiconductors & Semiconductor Equipment (Information Technology) | 2.3 | |||
| Software & Services (Information Technology) | 9.4 | |||
| Technology Hardware & Equipment (Information Technology) | 7.9 | |||
| Telecommunication Services (Services) | 3.2 | |||
| Transportation (Industrials) | 1.9 | |||
| Utilities (Utilities) | 3.7 | |||
| Short-Term Investments | 1.2 | |||
| Other Assets and Liabilities | (0.1 | ) | ||
| Total | 100.0 | % |
| 3 |
| Hartford Index HLS Fund |
| Schedule of Investments |
| June 30, 2012 (Unaudited) |
| (000’s Omitted) |
| Shares or Principal Amount | Market Value ╪ | |||||||
| COMMON STOCKS - 98.9% | ||||||||
| Automobiles & Components - 0.6% | ||||||||
| 9 | BorgWarner, Inc. ● | $ | 599 | |||||
| 303 | Ford Motor Co. w/ Rights | 2,902 | ||||||
| 19 | Goodyear Tire & Rubber Co. ● | 229 | ||||||
| 18 | Harley-Davidson, Inc. | 839 | ||||||
| 54 | Johnson Controls, Inc. | 1,495 | ||||||
| 6,064 | ||||||||
| Banks - 3.0% | ||||||||
| 55 | BB&T Corp. | 1,710 | ||||||
| 16 | Comerica, Inc. | 478 | ||||||
| 73 | Fifth Third Bancorp | 977 | ||||||
| 20 | First Horizon National Corp. | 173 | ||||||
| 42 | Hudson City Bancorp, Inc. | 266 | ||||||
| 68 | Huntington Bancshares, Inc. | 438 | ||||||
| 75 | Keycorp | 584 | ||||||
| 10 | M&T Bank Corp. | 833 | ||||||
| 28 | People's United Financial, Inc. | 327 | ||||||
| 42 | PNC Financial Services Group, Inc. | 2,562 | ||||||
| 112 | Regions Financial Corp. | 755 | ||||||
| 43 | SunTrust Banks, Inc. | 1,034 | ||||||
| 150 | US Bancorp | 4,833 | ||||||
| 421 | Wells Fargo & Co. | 14,094 | ||||||
| 15 | Zions Bancorporation | 284 | ||||||
| 29,348 | ||||||||
| Capital Goods - 7.9% | ||||||||
| 55 | 3M Co. | 4,928 | ||||||
| 59 | Boeing Co. | 4,418 | ||||||
| 52 | Caterpillar, Inc. | 4,397 | ||||||
| 13 | Cooper Industries plc Class A | 860 | ||||||
| 15 | Cummins, Inc. | 1,473 | ||||||
| 46 | Danaher Corp. | 2,374 | ||||||
| 32 | Deere & Co. | 2,551 | ||||||
| 15 | Dover Corp. | 779 | ||||||
| 27 | Eaton Corp. | 1,064 | ||||||
| 58 | Emerson Electric Co. | 2,709 | ||||||
| 23 | Fastenal Co. | 945 | ||||||
| 4 | Flowserve Corp. | 496 | ||||||
| 13 | Fluor Corp. | 663 | ||||||
| 29 | General Dynamics Corp. | 1,883 | ||||||
| 840 | General Electric Co. | 17,515 | ||||||
| 10 | Goodrich Corp. | 1,263 | ||||||
| 62 | Honeywell International, Inc. | 3,450 | ||||||
| 38 | Illinois Tool Works, Inc. | 2,001 | ||||||
| 24 | Ingersoll-Rand plc | 1,002 | ||||||
| 10 | Jacobs Engineering Group, Inc. ● | 389 | ||||||
| 8 | Joy Global, Inc. | 477 | ||||||
| 8 | L-3 Communications Holdings, Inc. | 571 | ||||||
| 21 | Lockheed Martin Corp. | 1,841 | ||||||
| 28 | Masco Corp. | 392 | ||||||
| 20 | Northrop Grumman Corp. | 1,273 | ||||||
| 28 | PACCAR, Inc. | 1,110 | ||||||
| 9 | Pall Corp. | 502 | ||||||
| 12 | Parker-Hannifin Corp. | 921 | ||||||
| 12 | Precision Castparts Corp. | 1,900 | ||||||
| 17 | Quanta Services, Inc. ● | 408 | ||||||
| 26 | Raytheon Co. | 1,498 | ||||||
| 11 | Rockwell Automation, Inc. | 751 | ||||||
| 11 | Rockwell Collins, Inc. | 567 | ||||||
| 8 | Roper Industries, Inc. | 762 | ||||||
| 5 | Snap-On, Inc. | 289 | ||||||
| 14 | Stanley Black & Decker, Inc. | 874 | ||||||
| 22 | Textron, Inc. | 554 | ||||||
| 37 | Tyco International Ltd. | 1,941 | ||||||
| 72 | United Technologies Corp. | 5,458 | ||||||
| 5 | W.W. Grainger, Inc. | 921 | ||||||
| 15 | Xylem, Inc. | 369 | ||||||
| 78,539 | ||||||||
| Commercial & Professional Services - 0.5% | ||||||||
| 8 | Avery Dennison Corp. | 226 | ||||||
| 9 | Cintas Corp. | 339 | ||||||
| 4 | Dun & Bradstreet Corp. | 274 | ||||||
| 10 | Equifax, Inc. ● | 444 | ||||||
| 14 | Iron Mountain, Inc. | 449 | ||||||
| 16 | Pitney Bowes, Inc. | 237 | ||||||
| 14 | R.R. Donnelley & Sons Co. | 168 | ||||||
| 25 | Republic Services, Inc. | 661 | ||||||
| 11 | Robert Half International, Inc. | 324 | ||||||
| 7 | Stericycle, Inc. ● | 618 | ||||||
| 37 | Waste Management, Inc. | 1,225 | ||||||
| 4,965 | ||||||||
| Consumer Durables & Apparel - 0.9% | ||||||||
| 23 | Coach, Inc. | 1,330 | ||||||
| 22 | D.R. Horton, Inc. | 409 | ||||||
| 4 | Fossil, Inc. ● | 314 | ||||||
| 6 | Harman International Industries, Inc. | 220 | ||||||
| 9 | Hasbro, Inc. | 313 | ||||||
| 11 | Leggett & Platt, Inc. | 236 | ||||||
| 13 | Lennar Corp. | 400 | ||||||
| 27 | Mattel, Inc. | 876 | ||||||
| 23 | Newell Rubbermaid, Inc. | 415 | ||||||
| 29 | NIKE, Inc. Class B | 2,557 | ||||||
| 27 | Pulte Group, Inc. ● | 285 | ||||||
| 5 | Ralph Lauren Corp. | 719 | ||||||
| 7 | V.F. Corp. | 923 | ||||||
| 6 | Whirlpool Corp. | 377 | ||||||
| 9,374 | ||||||||
| Consumer Services - 2.0% | ||||||||
| 9 | Apollo Group, Inc. Class A ● | 309 | ||||||
| 36 | Carnival Corp. | 1,233 | ||||||
| 2 | Chipotle Mexican Grill, Inc. ● | 935 | ||||||
| 10 | Darden Restaurants, Inc. | 519 | ||||||
| 5 | DeVry, Inc. | 143 | ||||||
| 23 | H & R Block, Inc. | 371 | ||||||
| 24 | International Game Technology | 370 | ||||||
| 21 | Marriott International, Inc. Class A | 823 | ||||||
| 81 | McDonald's Corp. | 7,133 | ||||||
| 60 | Starbucks Corp. | 3,206 | ||||||
| 16 | Starwood Hotels & Resorts, Inc. | 831 | ||||||
| 12 | Wyndham Worldwide Corp. | 612 | ||||||
| 6 | Wynn Resorts Ltd. | 651 | ||||||
| 37 | Yum! Brands, Inc. | 2,353 | ||||||
| 19,489 | ||||||||
| Diversified Financials - 5.6% | ||||||||
| 79 | American Express Co. | 4,620 | ||||||
| 17 | Ameriprise Financial, Inc. | 906 | ||||||
| 855 | Bank of America Corp. | 6,992 | ||||||
| 95 | Bank of New York Mellon Corp. | 2,076 | ||||||
| 10 | BlackRock, Inc. | 1,718 | ||||||
| 46 | Capital One Financial Corp. | 2,517 | ||||||
The accompanying notes are an integral part of these financial statements.
| 4 |
| Shares or Principal Amount | Market Value ╪ | |||||||
| COMMON STOCKS - 98.9% - (continued) | ||||||||
| Diversified Financials - 5.6% - (continued) | ||||||||
| 86 | Charles Schwab Corp. | $ | 1,110 | |||||
| 233 | Citigroup, Inc. | 6,375 | ||||||
| 5 | CME Group, Inc. | 1,415 | ||||||
| 42 | Discover Financial Services, Inc. | 1,453 | ||||||
| 20 | E*Trade Financial Corp. ● | 162 | ||||||
| 7 | Federated Investors, Inc. | 160 | ||||||
| 11 | Franklin Resources, Inc. | 1,249 | ||||||
| 39 | Goldman Sachs Group, Inc. | 3,744 | ||||||
| 6 | IntercontinentalExchange, Inc. ● | 786 | ||||||
| 36 | Invesco Ltd. | 804 | ||||||
| 302 | JP Morgan Chase & Co. | 10,787 | ||||||
| 10 | Legg Mason, Inc. | 263 | ||||||
| 16 | Leucadia National Corp. | 335 | ||||||
| 16 | Moody's Corp. | 574 | ||||||
| 121 | Morgan Stanley | 1,762 | ||||||
| 10 | Nasdaq OMX Group, Inc. ● | 221 | ||||||
| 19 | Northern Trust Corp. | 880 | ||||||
| 20 | NYSE Euronext | 517 | ||||||
| 39 | SLM Corp. | 607 | ||||||
| 39 | State Street Corp. | 1,728 | ||||||
| 20 | T. Rowe Price Group, Inc. | 1,272 | ||||||
| 55,033 | ||||||||
| Energy - 10.7% | ||||||||
| 17 | Alpha Natural Resources, Inc. ● | 152 | ||||||
| 40 | Anadarko Petroleum Corp. | 2,623 | ||||||
| 31 | Apache Corp. | 2,721 | ||||||
| 35 | Baker Hughes, Inc. | 1,432 | ||||||
| 17 | Cabot Oil & Gas Corp. | 657 | ||||||
| 20 | Cameron International Corp. ● | 834 | ||||||
| 52 | Chesapeake Energy Corp. | 976 | ||||||
| 157 | Chevron Corp. | 16,517 | ||||||
| 100 | ConocoPhillips Holding Co. | 5,606 | ||||||
| 18 | Consol Energy, Inc. | 547 | ||||||
| 31 | Denbury Resources, Inc. ● | 467 | ||||||
| 32 | Devon Energy Corp. | 1,859 | ||||||
| 6 | Diamond Offshore Drilling, Inc. | 327 | ||||||
| 21 | EOG Resources, Inc. | 1,922 | ||||||
| 12 | EQT Corp. | 635 | ||||||
| 371 | Exxon Mobil Corp. | 31,740 | ||||||
| 19 | FMC Technologies, Inc. ● | 745 | ||||||
| 73 | Halliburton Co. | 2,078 | ||||||
| 8 | Helmerich & Payne, Inc. | 369 | ||||||
| 24 | Hess Corp. | 1,049 | ||||||
| 40 | Kinder Morgan, Inc. | 1,289 | ||||||
| 56 | Marathon Oil Corp. | 1,430 | ||||||
| 27 | Marathon Petroleum Corp. | 1,212 | ||||||
| 15 | Murphy Oil Corp. | 773 | ||||||
| 23 | Nabors Industries Ltd. ● | 332 | ||||||
| 34 | National Oilwell Varco, Inc. | 2,180 | ||||||
| 11 | Newfield Exploration Co. ● | 314 | ||||||
| 20 | Noble Corp. | 651 | ||||||
| 14 | Noble Energy, Inc. | 1,197 | ||||||
| 64 | Occidental Petroleum Corp. | 5,522 | ||||||
| 22 | Peabody Energy Corp. | 530 | ||||||
| 50 | Phillips 66 ● | 1,649 | ||||||
| 10 | Pioneer Natural Resources Co. | 859 | ||||||
| 14 | QEP Resources, Inc. | 423 | ||||||
| 13 | Range Resources Corp. | 793 | ||||||
| 10 | Rowan Cos. plc Class A ● | 317 | ||||||
| 106 | Schlumberger Ltd. | 6,865 | ||||||
| 28 | Southwestern Energy Co. ● | 880 | ||||||
| 52 | Spectra Energy Corp. | 1,505 | ||||||
| 8 | Sunoco, Inc. | 397 | ||||||
| 11 | Tesoro Corp. ● | 279 | ||||||
| 44 | Valero Energy Corp. | 1,060 | ||||||
| 50 | Williams Cos., Inc. | 1,431 | ||||||
| 16 | WPX Energy, Inc. ● | 254 | ||||||
| 105,398 | ||||||||
| Food & Staples Retailing - 2.4% | ||||||||
| 34 | Costco Wholesale Corp. | 3,257 | ||||||
| 102 | CVS Caremark Corp. | 4,750 | ||||||
| 44 | Kroger (The) Co. | 1,031 | ||||||
| 19 | Safeway, Inc. | 346 | ||||||
| 46 | Sysco Corp. | 1,386 | ||||||
| 68 | Walgreen Co. | 2,025 | ||||||
| 137 | Wal-Mart Stores, Inc. | 9,542 | ||||||
| 13 | Whole Foods Market, Inc. | 1,235 | ||||||
| 23,572 | ||||||||
| Food, Beverage & Tobacco - 6.5% | ||||||||
| 161 | Altria Group, Inc. | 5,576 | ||||||
| 52 | Archer Daniels Midland Co. | 1,543 | ||||||
| 13 | Beam, Inc. | 784 | ||||||
| 8 | Brown-Forman Corp. | 764 | ||||||
| 14 | Campbell Soup Co. | 467 | ||||||
| 179 | Coca-Cola Co. | 13,992 | ||||||
| 24 | Coca-Cola Enterprises, Inc. | 669 | ||||||
| 33 | ConAgra Foods, Inc. | 855 | ||||||
| 13 | Constellation Brands, Inc. Class A ● | 349 | ||||||
| 15 | Dean Foods Co. ● | 248 | ||||||
| 17 | Dr. Pepper Snapple Group | 736 | ||||||
| 51 | General Mills, Inc. | 1,979 | ||||||
| 25 | H.J. Heinz Co. | 1,381 | ||||||
| 12 | Hershey Co. | 866 | ||||||
| 11 | Hormel Foods Corp. | 330 | ||||||
| 9 | J.M. Smucker Co. | 677 | ||||||
| 20 | Kellogg Co. | 964 | ||||||
| 141 | Kraft Foods, Inc. | 5,431 | ||||||
| 10 | Lorillard, Inc. | 1,359 | ||||||
| 11 | McCormick & Co., Inc. | 638 | ||||||
| 16 | Mead Johnson Nutrition Co. | 1,301 | ||||||
| 12 | Molson Coors Brewing Co. | 519 | ||||||
| 12 | Monster Beverage Corp. ● | 862 | ||||||
| 124 | PepsiCo, Inc. | 8,762 | ||||||
| 135 | Philip Morris International, Inc. | 11,804 | ||||||
| 26 | Reynolds American, Inc. | 1,181 | ||||||
| 23 | Tyson Foods, Inc. Class A | 431 | ||||||
| 64,468 | ||||||||
| Health Care Equipment & Services - 3.9% | ||||||||
| 28 | Aetna, Inc. | 1,068 | ||||||
| 20 | AmerisourceBergen Corp. | 783 | ||||||
| 7 | Bard (C.R.), Inc. | 721 | ||||||
| 44 | Baxter International, Inc. | 2,324 | ||||||
| 16 | Becton, Dickinson & Co. | 1,200 | ||||||
| 113 | Boston Scientific Corp. ● | 643 | ||||||
| 27 | Cardinal Health, Inc. | 1,152 | ||||||
| 18 | CareFusion Corp. ● | 452 | ||||||
| 12 | Cerner Corp. ● | 963 | ||||||
| 23 | CIGNA Corp. | 1,005 | ||||||
| 11 | Coventry Health Care, Inc. | 361 | ||||||
The accompanying notes are an integral part of these financial statements.
| 5 |
| Hartford Index HLS Fund |
| Schedule of Investments – (continued) |
| June 30, 2012 (Unaudited) |
| (000’s Omitted) |
| Shares or Principal Amount | Market Value ╪ | |||||||
| COMMON STOCKS - 98.9% - (continued) | ||||||||
| Health Care Equipment & Services - 3.9% - (continued) | ||||||||
| 38 | Covidien plc | $ | 2,047 | |||||
| 7 | DaVita, Inc. ● | 729 | ||||||
| 11 | Dentsply International, Inc. | 425 | ||||||
| 9 | Edwards Lifesciences Corp. ● | 936 | ||||||
| 64 | Express Scripts Holding Co. ● | 3,569 | ||||||
| 13 | Humana, Inc. | 1,003 | ||||||
| 3 | Intuitive Surgical, Inc. ● | 1,718 | ||||||
| 8 | Laboratory Corp. of America Holdings ● | 708 | ||||||
| 19 | McKesson Corp. | 1,751 | ||||||
| 83 | Medtronic, Inc. | 3,195 | ||||||
| 7 | Patterson Cos., Inc. | 240 | ||||||
| 13 | Quest Diagnostics, Inc. | 756 | ||||||
| 25 | St. Jude Medical, Inc. | 993 | ||||||
| 26 | Stryker Corp. | 1,415 | ||||||
| 32 | Tenet Healthcare Corp. ● | 170 | ||||||
| 82 | UnitedHealth Group, Inc. | 4,812 | ||||||
| 9 | Varian Medical Systems, Inc. ● | 538 | ||||||
| 26 | Wellpoint, Inc. | 1,672 | ||||||
| 14 | Zimmer Holdings, Inc. | 901 | ||||||
| 38,250 | ||||||||
| Household & Personal Products - 2.2% | ||||||||
| 34 | Avon Products, Inc. | 554 | ||||||
| 10 | Clorox Co. | 745 | ||||||
| 38 | Colgate-Palmolive Co. | 3,936 | ||||||
| 18 | Estee Lauder Co., Inc. | 965 | ||||||
| 31 | Kimberly-Clark Corp. | 2,609 | ||||||
| 217 | Procter & Gamble Co. | 13,312 | ||||||
| 22,121 | ||||||||
| Insurance - 3.5% | ||||||||
| 27 | ACE Ltd. | 2,017 | ||||||
| 39 | Aflac, Inc. | 1,648 | ||||||
| 39 | Allstate Corp. | 1,385 | ||||||
| 51 | American International Group, Inc. ● | 1,645 | ||||||
| 26 | Aon plc | 1,209 | ||||||
| 7 | Assurant, Inc. | 241 | ||||||
| 141 | Berkshire Hathaway, Inc. Class B ● | 11,754 | ||||||
| 22 | Chubb Corp. | 1,580 | ||||||
| 13 | Cincinnati Financial Corp. | 496 | ||||||
| 39 | Genworth Financial, Inc. ● | 222 | ||||||
| 24 | Lincoln National Corp. | 517 | ||||||
| 24 | Loews Corp. | 1,001 | ||||||
| 43 | Marsh & McLennan Cos., Inc. | 1,394 | ||||||
| 88 | MetLife, Inc. | 2,710 | ||||||
| 25 | Principal Financial Group, Inc. | 650 | ||||||
| 49 | Progressive Corp. | 1,019 | ||||||
| 39 | Prudential Financial, Inc. | 1,878 | ||||||
| 8 | Torchmark Corp. | 414 | ||||||
| 31 | Travelers Cos., Inc. | 1,992 | ||||||
| 24 | Unum Group | 452 | ||||||
| 25 | XL Group plc | 525 | ||||||
| 34,749 | ||||||||
| Materials - 3.4% | ||||||||
| 17 | Air Products & Chemicals, Inc. | 1,355 | ||||||
| 6 | Airgas, Inc. | 464 | ||||||
| 84 | Alcoa, Inc. | 739 | ||||||
| 9 | Allegheny Technologies, Inc. | 272 | ||||||
| 12 | Ball Corp. | 508 | ||||||
| 8 | Bemis Co., Inc. | 256 | ||||||
| 5 | CF Industries Holdings, Inc. | 1,009 | ||||||
| 11 | Cliff's Natural Resources, Inc. | 559 | ||||||
| 95 | Dow Chemical Co. | 2,987 | ||||||
| 74 | E.I. DuPont de Nemours & Co. | 3,757 | ||||||
| 11 | Eastman Chemical Co. | 550 | ||||||
| 23 | Ecolab, Inc. | 1,589 | ||||||
| 11 | FMC Corp. | 583 | ||||||
| 75 | Freeport-McMoRan Copper & Gold, Inc. | 2,565 | ||||||
| 6 | International Flavors & Fragrances, Inc. | 352 | ||||||
| 35 | International Paper Co. | 1,002 | ||||||
| 14 | MeadWestvaco Corp. | 391 | ||||||
| 42 | Monsanto Co. | 3,505 | ||||||
| 24 | Mosaic Co. | 1,293 | ||||||
| 39 | Newmont Mining Corp. | 1,905 | ||||||
| 25 | Nucor Corp. | 952 | ||||||
| 13 | Owens-Illinois, Inc. ● | 249 | ||||||
| 12 | PPG Industries, Inc. | 1,277 | ||||||
| 24 | Praxair, Inc. | 2,576 | ||||||
| 15 | Sealed Air Corp. | 238 | ||||||
| 7 | Sherwin-Williams Co. | 901 | ||||||
| 10 | Sigma-Aldrich Corp. | 707 | ||||||
| 7 | Titanium Metals Corp. | 74 | ||||||
| 11 | United States Steel Corp. | 235 | ||||||
| 10 | Vulcan Materials Co. | 408 | ||||||
| 33,258 | ||||||||
| Media - 3.3% | ||||||||
| 17 | Cablevision Systems Corp. | 227 | ||||||
| 51 | CBS Corp. Class B | 1,685 | ||||||
| 214 | Comcast Corp. Class A | 6,836 | ||||||
| 52 | DirecTV Class A ● | 2,534 | ||||||
| 20 | Discovery Communications, Inc. ● | 1,095 | ||||||
| 19 | Gannett Co., Inc. | 274 | ||||||
| 35 | Interpublic Group of Cos., Inc. | 381 | ||||||
| 22 | McGraw-Hill Cos., Inc. | 996 | ||||||
| 167 | News Corp. Class A | 3,726 | ||||||
| 22 | Omnicom Group, Inc. | 1,050 | ||||||
| 7 | Scripps Networks Interactive Class A | 415 | ||||||
| 25 | Time Warner Cable, Inc. | 2,035 | ||||||
| 76 | Time Warner, Inc. | 2,929 | ||||||
| 42 | Viacom, Inc. Class B | 1,967 | ||||||
| 142 | Walt Disney Co. | 6,873 | ||||||
| — | Washington Post Co. Class B | 147 | ||||||
| 33,170 | ||||||||
| Pharmaceuticals, Biotechnology & Life Sciences - 8.0% | ||||||||
| 125 | Abbott Laboratories | 8,049 | ||||||
| 28 | Agilent Technologies, Inc. | 1,080 | ||||||
| 15 | Alexion Pharmaceuticals, Inc. ● | 1,509 | ||||||
| 24 | Allergan, Inc. | 2,257 | ||||||
| 62 | Amgen, Inc. | 4,508 | ||||||
| 19 | Biogen Idec, Inc. ● | 2,752 | ||||||
| 134 | Bristol-Myers Squibb Co. | 4,817 | ||||||
| 35 | Celgene Corp. ● | 2,239 | ||||||
| 81 | Eli Lilly & Co. | 3,477 | ||||||
| 21 | Forest Laboratories, Inc. ● | 738 | ||||||
| 60 | Gilead Sciences, Inc. ● | 3,080 | ||||||
| 13 | Hospira, Inc. ● | 460 | ||||||
| 218 | Johnson & Johnson | 14,714 | ||||||
| 14 | Life Technologies Corp. ● | 635 | ||||||
| 241 | Merck & Co., Inc. | 10,073 | ||||||
| 34 | Mylan, Inc. ● | 725 | ||||||
| 9 | PerkinElmer, Inc. | 232 | ||||||
| 7 | Perrigo Co. | 871 | ||||||
The accompanying notes are an integral part of these financial statements.
| 6 |
| Shares or Principal Amount | Market Value ╪ | |||||||
| COMMON STOCKS - 98.9% - (continued) | ||||||||
| Pharmaceuticals, Biotechnology & Life Sciences - 8.0% - (continued) | ||||||||
| 594 | Pfizer, Inc. | $ | 13,661 | |||||
| 29 | Thermo Fisher Scientific, Inc. | 1,510 | ||||||
| 7 | Waters Corp. ● | 564 | ||||||
| 10 | Watson Pharmaceuticals, Inc. ● | 747 | ||||||
| 78,698 | ||||||||
| Real Estate - 2.2% | ||||||||
| 31 | American Tower Corp. REIT | 2,186 | ||||||
| 10 | Apartment Investment & Management Co. Class A | 284 | ||||||
| 8 | Avalonbay Communities, Inc. | 1,065 | ||||||
| 12 | Boston Properties, Inc. | 1,289 | ||||||
| 26 | CBRE Group, Inc. ● | 426 | ||||||
| 24 | Equity Residential Properties Trust | 1,487 | ||||||
| 33 | HCP, Inc. | 1,468 | ||||||
| 17 | Health Care, Inc. | 990 | ||||||
| 57 | Host Hotels & Resorts, Inc. | 902 | ||||||
| 32 | Kimco Realty Corp. | 612 | ||||||
| 13 | Plum Creek Timber Co., Inc. | 507 | ||||||
| 37 | ProLogis L.P. | 1,214 | ||||||
| 11 | Public Storage | 1,628 | ||||||
| 24 | Simon Property Group, Inc. | 3,734 | ||||||
| 23 | Ventas, Inc. | 1,447 | ||||||
| 15 | Vornado Realty Trust | 1,239 | ||||||
| 43 | Weyerhaeuser Co. | 954 | ||||||
| 21,432 | ||||||||
| Retailing - 3.9% | ||||||||
| 7 | Abercrombie & Fitch Co. Class A | 222 | ||||||
| 29 | Amazon.com, Inc. ● | 6,520 | ||||||
| 3 | AutoNation, Inc. ● | 115 | ||||||
| 2 | AutoZone, Inc. ● | 775 | ||||||
| 18 | Bed Bath & Beyond, Inc. ● | 1,140 | ||||||
| 22 | Best Buy Co., Inc. | 461 | ||||||
| 5 | Big Lots, Inc. ● | 204 | ||||||
| 18 | CarMax, Inc. ● | 471 | ||||||
| 19 | Dollar Tree, Inc. ● | 996 | ||||||
| 7 | Expedia, Inc. | 343 | ||||||
| 9 | Family Dollar Stores, Inc. | 612 | ||||||
| 10 | GameStop Corp. Class A | 191 | ||||||
| 26 | Gap, Inc. | 723 | ||||||
| 12 | Genuine Parts Co. | 744 | ||||||
| 121 | Home Depot, Inc. | 6,431 | ||||||
| 12 | J.C. Penney Co., Inc. | 271 | ||||||
| 19 | Kohl's Corp. | 863 | ||||||
| 19 | Limited Brands, Inc. | 817 | ||||||
| 93 | Lowe's Co., Inc. | 2,655 | ||||||
| 33 | Macy's, Inc. | 1,127 | ||||||
| 4 | Netflix, Inc. ● | 300 | ||||||
| 13 | Nordstrom, Inc. | 633 | ||||||
| 10 | O'Reilly Automotive, Inc. ● | 838 | ||||||
| 4 | Priceline.com, Inc. ● | 2,631 | ||||||
| 18 | Ross Stores, Inc. | 1,121 | ||||||
| 3 | Sears Holdings Corp. ● | 183 | ||||||
| 55 | Staples, Inc. | 714 | ||||||
| 52 | Target Corp. | 3,052 | ||||||
| 10 | Tiffany & Co. | 529 | ||||||
| 59 | TJX Cos., Inc. | 2,525 | ||||||
| 8 | TripAdvisor, Inc. ● | 336 | ||||||
| 9 | Urban Outfitters, Inc. ● | 243 | ||||||
| 38,786 | ||||||||
| Semiconductors & Semiconductor Equipment - 2.3% | ||||||||
| 46 | Advanced Micro Devices, Inc. ● | 266 | ||||||
| 26 | Altera Corp. | 864 | ||||||
| 24 | Analog Devices, Inc. | 891 | ||||||
| 102 | Applied Materials, Inc. | 1,165 | ||||||
| 39 | Broadcom Corp. Class A | 1,331 | ||||||
| 5 | First Solar, Inc. ● | 70 | ||||||
| 399 | Intel Corp. | 10,634 | ||||||
| 13 | KLA-Tencor Corp. | 655 | ||||||
| 16 | Lam Research Corp. ● | 603 | ||||||
| 18 | Linear Technology Corp. | 572 | ||||||
| 45 | LSI Corp. ● | 285 | ||||||
| 15 | Microchip Technology, Inc. | 508 | ||||||
| 78 | Micron Technology, Inc. ● | 494 | ||||||
| 49 | NVIDIA Corp. ● | 678 | ||||||
| 15 | Teradyne, Inc. ● | 207 | ||||||
| 91 | Texas Instruments, Inc. | 2,604 | ||||||
| 21 | Xilinx, Inc. | 702 | ||||||
| 22,529 | ||||||||
| Software & Services - 9.4% | ||||||||
| 51 | Accenture plc | 3,068 | ||||||
| 39 | Adobe Systems, Inc. ● | 1,274 | ||||||
| 14 | Akamai Technologies, Inc. ● | 452 | ||||||
| 18 | Autodesk, Inc. ● | 639 | ||||||
| 39 | Automatic Data Processing, Inc. | 2,158 | ||||||
| 13 | BMC Software, Inc. ● | 546 | ||||||
| 28 | CA, Inc. | 760 | ||||||
| 15 | Citrix Systems, Inc. ● | 1,242 | ||||||
| 24 | Cognizant Technology Solutions Corp. ● | 1,450 | ||||||
| 12 | Computer Sciences Corp. | 305 | ||||||
| 91 | eBay, Inc. ● | 3,830 | ||||||
| 25 | Electronic Arts, Inc. ● | 311 | ||||||
| 19 | Fidelity National Information Services, Inc. | 645 | ||||||
| 11 | Fiserv, Inc. ● | 785 | ||||||
| 20 | Google, Inc. ● | 11,722 | ||||||
| 91 | IBM Corp. | 17,891 | ||||||
| 23 | Intuit, Inc. | 1,381 | ||||||
| 8 | Mastercard, Inc. | 3,636 | ||||||
| 593 | Microsoft Corp. | 18,141 | ||||||
| 308 | Oracle Corp. | 9,142 | ||||||
| 26 | Paychex, Inc. | 803 | ||||||
| 15 | Red Hat, Inc. ● | 864 | ||||||
| 22 | SAIC, Inc. | 265 | ||||||
| 11 | Salesforce.com, Inc. ● | 1,508 | ||||||
| 57 | Symantec Corp. ● | 835 | ||||||
| 13 | Teradata Corp. ● | 963 | ||||||
| 13 | Total System Services, Inc. | 305 | ||||||
| 13 | VeriSign, Inc. | 546 | ||||||
| 40 | Visa, Inc. | 4,888 | ||||||
| 49 | Western Union Co. | 819 | ||||||
| 97 | Yahoo!, Inc. ● | 1,530 | ||||||
| 92,704 | ||||||||
| Technology Hardware & Equipment - 7.9% | ||||||||
| 13 | Amphenol Corp. Class A | 704 | ||||||
| 74 | Apple, Inc. ● | 43,345 | ||||||
| 425 | Cisco Systems, Inc. | 7,296 | ||||||
| 120 | Corning, Inc. | 1,558 | ||||||
The accompanying notes are an integral part of these financial statements.
| 7 |
| Hartford Index HLS Fund |
| Schedule of Investments – (continued) |
| June 30, 2012 (Unaudited) |
| (000’s Omitted) |
| Shares or Principal Amount | Market Value ╪ | |||||||
| COMMON STOCKS - 98.9% - (continued) | ||||||||
| Technology Hardware & Equipment - 7.9% - (continued) | ||||||||
| 118 | Dell, Inc. ● | $ | 1,476 | |||||
| 167 | EMC Corp. ● | 4,268 | ||||||
| 6 | F5 Networks, Inc. ● | 629 | ||||||
| 12 | FLIR Systems, Inc. | 237 | ||||||
| 9 | Harris Corp. | 377 | ||||||
| 157 | Hewlett-Packard Co. | 3,153 | ||||||
| 15 | Jabil Circuit, Inc. | 296 | ||||||
| 18 | JDS Uniphase Corp. ● | 200 | ||||||
| 42 | Juniper Networks, Inc. ● | 685 | ||||||
| 6 | Lexmark International, Inc. | 149 | ||||||
| 11 | Molex, Inc. | 260 | ||||||
| 23 | Motorola Solutions, Inc. | 1,117 | ||||||
| 29 | NetApp, Inc. ● | 915 | ||||||
| 136 | Qualcomm, Inc. | 7,568 | ||||||
| 19 | SanDisk Corp. ● | 706 | ||||||
| 30 | Seagate Technology plc | 742 | ||||||
| 34 | TE Connectivity Ltd. | 1,084 | ||||||
| 19 | Western Digital Corp. ● | 565 | ||||||
| 107 | Xerox Corp. | 842 | ||||||
| 78,172 | ||||||||
| Telecommunication Services - 3.2% | ||||||||
| 465 | AT&T, Inc. | 16,583 | ||||||
| 49 | CenturyLink, Inc. | 1,946 | ||||||
| 21 | Crown Castle International Corp. ● | 1,202 | ||||||
| 79 | Frontier Communications Corp. | 302 | ||||||
| 23 | MetroPCS Communications, Inc. ● | 141 | ||||||
| 237 | Sprint Nextel Corp. ● | 774 | ||||||
| 225 | Verizon Communications, Inc. | 10,016 | ||||||
| 46 | Windstream Corp. | 448 | ||||||
| 31,412 | ||||||||
| Transportation - 1.9% | ||||||||
| 13 | C.H. Robinson Worldwide, Inc. | 756 | ||||||
| 82 | CSX Corp. | 1,842 | ||||||
| 17 | Expeditors International of Washington, Inc. | 652 | ||||||
| 25 | FedEx Corp. | 2,294 | ||||||
| 26 | Norfolk Southern Corp. | 1,857 | ||||||
| 4 | Ryder System, Inc. | 147 | ||||||
| 61 | Southwest Airlines Co. | 561 | ||||||
| 38 | Union Pacific Corp. | 4,503 | ||||||
| 76 | United Parcel Service, Inc. Class B | 5,997 | ||||||
| 18,609 | ||||||||
| Utilities - 3.7% | ||||||||
| 51 | AES (The) Corp. ● | 656 | ||||||
| 9 | AGL Resources, Inc. | 359 | ||||||
| 19 | Ameren Corp. | 647 | ||||||
| 38 | American Electric Power Co., Inc. | 1,532 | ||||||
| 34 | CenterPoint Energy, Inc. | 700 | ||||||
| 21 | CMS Energy Corp. | 486 | ||||||
| 23 | Consolidated Edison, Inc. | 1,444 | ||||||
| 45 | Dominion Resources, Inc. | 2,446 | ||||||
| 14 | DTE Energy Co. | 802 | ||||||
| 106 | Duke Energy Corp. | 2,447 | ||||||
| 26 | Edison International | 1,193 | ||||||
| 14 | Entergy Corp. | 954 | ||||||
| 68 | Exelon Corp. | 2,542 | ||||||
| 33 | FirstEnergy Corp. | 1,632 | ||||||
| 6 | Integrys Energy Group, Inc. | 351 | ||||||
| 33 | NextEra Energy, Inc. | 2,279 | ||||||
| 22 | NiSource, Inc. | 557 | ||||||
| 25 | Northeast Utilities | 967 | ||||||
| 18 | NRG Energy, Inc. ● | 313 | ||||||
| 16 | Oneok, Inc. | 695 | ||||||
| 18 | Pepco Holdings, Inc. | 352 | ||||||
| 34 | PG&E Corp. | 1,517 | ||||||
| 9 | Pinnacle West Capital Corp. | 452 | ||||||
| 46 | PPL Corp. | 1,278 | ||||||
| 23 | Progress Energy, Inc. | 1,414 | ||||||
| 40 | Public Service Enterprise Group, Inc. | 1,304 | ||||||
| 9 | SCANA Corp. | 443 | ||||||
| 19 | Sempra Energy | 1,309 | ||||||
| 69 | Southern Co. | 3,189 | ||||||
| 17 | TECO Energy, Inc. | 309 | ||||||
| 18 | Wisconsin Energy Corp. | 721 | ||||||
| 39 | Xcel Energy, Inc. | 1,099 | ||||||
| 36,389 | ||||||||
| Total common stocks | ||||||||
| (cost $813,225) | $ | 976,529 | ||||||
| Total long-term investments | ||||||||
| (cost $813,225) | $ | 976,529 | ||||||
| SHORT-TERM INVESTMENTS - 1.2% | ||||||||
| Repurchase Agreements - 1.1% | ||||||||
| Deutsche Bank Securities TriParty Joint Repurchase Agreement (maturing on 07/02/2012 in the amount of $738, collateralized by U.S. Treasury Note 0.38%, 2015, value of $753) | ||||||||
| $ | 738 | 0.14%, 06/29/2012 | $ | 738 | ||||
| RBC Capital Markets TriParty Joint Repurchase Agreement (maturing on 07/02/2012 in the amount of $4,984, collateralized by U.S. Treasury Bill 0.19%, 2013, U.S. Treasury Bond 3.13%, 2/15/2042, U.S. Treasury Note 0.25% - 4.50%, 2014 - 2022, value of $5,084) | ||||||||
| 4,984 | 0.08%, 06/29/2012 | 4,984 | ||||||
| RBS Greenwich Capital Markets TriParty Joint Repurchase Agreement (maturing on 07/02/2012 in the amount of $3,151, collateralized by U.S. Treasury Note 1.25% - 1.38%, 2012 - 2014, value of $3,214) | ||||||||
| 3,151 | 0.14%, 06/29/2012 | 3,151 | ||||||
| UBS Securities, Inc. TriParty Joint Repurchase Agreement (maturing on 07/02/2012 in the amount of $1,754, collateralized by U.S. Treasury Note 2.00%, 2012, value of $1,789) | ||||||||
| 1,754 | 0.14%, 06/29/2012 | 1,754 | ||||||
| 10,627 | ||||||||
The accompanying notes are an integral part of these financial statements.
| 8 |
| Shares or Principal Amount | Market Value ╪ | |||||||||||
| SHORT-TERM INVESTMENTS - 1.2% - (continued) | ||||||||||||
| U.S. Treasury Bills - 0.1% | ||||||||||||
| 1,000 | 0.08%, 08/02/2012 □○ | $ | 1,000 | |||||||||
| Total short-term investments | ||||||||||||
| (cost $11,627) | $ | 11,627 | ||||||||||
| Total investments | ||||||||||||
| (cost $824,852) ▲ | 100.1 | % | $ | 988,156 | ||||||||
| Other assets and liabilities | (0.1 | )% | (1,207 | ) | ||||||||
| Total net assets | 100.0 | % | $ | 986,949 | ||||||||
Note: Percentage of investments as shown is the ratio of the total market value to total net assets.
| ▲ | At June 30, 2012, the cost of securities for federal income tax purposes was $858,539 and the aggregate gross unrealized appreciation and depreciation based on that cost were: |
| Unrealized Appreciation | $ | 299,436 | ||
| Unrealized Depreciation | (169,819 | ) | ||
| Net Unrealized Appreciation | $ | 129,617 |
| ● | Non-income producing. |
| ○ | The interest rate disclosed for these securities represents the effective yield on the date of the acquisition. |
| □ | This security, or a portion of this security, is pledged as initial margin deposit and collateral for daily variation margin loss on open futures contracts held at June 30, 2012 as listed in the table below: |
| Description | Number of Contracts* | Position | Expiration Date | Market Value ╪ | Notional Amount | Unrealized Appreciation/ (Depreciation) | ||||||||||||||
| S&P 500 Future | 36 | Long | 09/20/2012 | $ | 12,208 | $ | 11,797 | $ | 411 | |||||||||||
| * | The number of contracts does not omit 000's. |
| ╪ | See Significant Accounting Policies of accompanying Notes to Financial Statements regarding valuation of securities. |
| GLOSSARY: (abbreviations used in preceding Schedule of Investments) | |
| Index Abbreviations: | |
| S&P | Standard & Poors |
| Other Abbreviations: | |
| REIT | Real Estate Investment Trust |
The accompanying notes are an integral part of these financial statements.
| 9 |
| Hartford Index HLS Fund |
| Investment Valuation Hierarchy Level Summary |
| June 30, 2012 (Unaudited) |
| (000’s Omitted) |
| Total | Level 1 ♦ | Level 2 ♦ | Level 3 | |||||||||||||
| Assets: | ||||||||||||||||
| Common Stocks ‡ | $ | 976,529 | $ | 976,529 | $ | – | $ | – | ||||||||
| Short-Term Investments | 11,627 | – | 11,627 | – | ||||||||||||
| Total | $ | 988,156 | $ | 976,529 | $ | 11,627 | $ | – | ||||||||
| Futures * | 411 | 411 | – | – | ||||||||||||
| Total | $ | 411 | $ | 411 | $ | – | $ | – | ||||||||
| ♦ | For the six-month period ended June 30, 2012, there were no transfers between Level 1 and Level 2. |
| ‡ | The Fund has all or primarily all of the equity securities categorized in a particular level. Refer to the Schedule of Investments for further industry breakout. |
| * | Derivative instruments not reflected in the Schedule of Investments are valued at the unrealized appreciation/depreciation on the investments. |
The accompanying notes are an integral part of these financial statements.
| 10 |
| Hartford Index HLS Fund |
| Statement of Assets and Liabilities |
| June 30, 2012 (Unaudited) |
| (000’s Omitted) |
| Assets: | ||||
| Investments in securities, at market value (cost $824,852) | $ | 988,156 | ||
| Receivables: | ||||
| Investment securities sold | 871 | |||
| Dividends and interest | 1,407 | |||
| Variation margin | 332 | |||
| Other assets | 1 | |||
| Total assets | 990,767 | |||
| Liabilities: | ||||
| Bank overdraft | 141 | |||
| Payables: | ||||
| Investment securities purchased | 1,572 | |||
| Fund shares redeemed | 1,994 | |||
| Variation margin | 2 | |||
| Investment management fees | 40 | |||
| Distribution fees | 10 | |||
| Accrued expenses | 59 | |||
| Total liabilities | 3,818 | |||
| Net assets | $ | 986,949 | ||
| Summary of Net Assets: | ||||
| Capital stock and paid-in-capital | $ | 866,877 | ||
| Undistributed net investment income | 10,047 | |||
| Accumulated net realized loss | (53,690 | ) | ||
| Unrealized appreciation of investments | 163,715 | |||
| Net assets | $ | 986,949 | ||
| Shares authorized | 4,000,000 | |||
| Par value | $ | 0.001 | ||
| Class IA: Net asset value per share | $ | 28.64 | ||
| Shares outstanding | 24,226 | |||
| Net assets | $ | 693,871 | ||
| Class IB: Net asset value per share | $ | 28.49 | ||
| Shares outstanding | 10,288 | |||
| Net assets | $ | 293,078 |
The accompanying notes are an integral part of these financial statements.
| 11 |
| Hartford Index HLS Fund |
| Statement of Operations |
| For the Six-Month Period Ended June 30, 2012 (Unaudited) |
| (000’s Omitted) |
| Investment Income: | ||||
| Dividends | $ | 10,537 | ||
| Interest | 8 | |||
| Total investment income, net | 10,545 | |||
| Expenses: | ||||
| Investment management fees | 1,463 | |||
| Distribution fees - Class IB | 339 | |||
| Custodian fees | 10 | |||
| Accounting services fees | 49 | |||
| Board of Directors' fees | 11 | |||
| Audit fees | 8 | |||
| Other expenses | 69 | |||
| Total expenses | 1,949 | |||
| Net investment income | 8,596 | |||
| Net Realized Gain on Investments and Other Financial Instruments: | 2256000 | |||
| Net realized gain on investments | 1,626 | |||
| Net realized gain on futures | 630 | |||
| Net Realized Gain on Investments and Other Financial Instruments | 2,256 | |||
| Net Changes in Unrealized Appreciation of Investments and Other Financial Instruments: | 73,193 | |||
| Net unrealized appreciation of investments | 72,793 | |||
| Net unrealized appreciation of futures | 400 | |||
| Net Changes in Unrealized Appreciation of Investments and Other Financial Instruments | 73,193 | |||
| Net Gain on Investments and Other Financial Instruments | 75,449 | |||
| Net Increase in Net Assets Resulting from Operations | $ | 84,045 |
The accompanying notes are an integral part of these financial statements.
| 12 |
| Hartford Index HLS Fund |
| Statement of Changes in Net Assets |
| (000’s Omitted) |
| For the Six-Month Period Ended June 30, 2012 (Unaudited) | For the Year Ended December 31, 2011 | |||||||
| Operations: | ||||||||
| Net investment income | $ | 8,596 | $ | 16,452 | ||||
| Net realized gain (loss) on investments and other financial instruments | 2,256 | (789 | ) | |||||
| Net unrealized appreciation of investments and other financial instruments | 73,193 | 4,269 | ||||||
| Net Increase In Net Assets Resulting From Operations | 84,045 | 19,932 | ||||||
| Distributions to Shareholders: | ||||||||
| From net investment income | ||||||||
| Class IA | — | (11,907 | ) | |||||
| Class IB | — | (3,567 | ) | |||||
| Total distributions | — | (15,474 | ) | |||||
| Capital Share Transactions: | ||||||||
| Class IA | ||||||||
| Sold | 33,372 | 49,488 | ||||||
| Issued on reinvestment of distributions | — | 11,907 | ||||||
| Redeemed | (75,064 | ) | (202,307 | ) | ||||
| Total capital share transactions | (41,692 | ) | (140,912 | ) | ||||
| Class IB | ||||||||
| Sold | 75,826 | 103,660 | ||||||
| Issued on reinvestment of distributions | — | 3,567 | ||||||
| Redeemed | (36,964 | ) | (83,928 | ) | ||||
| Total capital share transactions | 38,862 | 23,299 | ||||||
| Net decrease from capital share transactions | (2,830 | ) | (117,613 | ) | ||||
| Net Increase (Decrease) In Net Assets | 81,215 | (113,155 | ) | |||||
| Net Assets: | ||||||||
| Beginning of period | 905,734 | 1,018,889 | ||||||
| End of period | $ | 986,949 | $ | 905,734 | ||||
| Undistributed (distribution in excess of) net investment income | $ | 10,047 | $ | 1,451 | ||||
| Shares: | ||||||||
| Class IA | ||||||||
| Sold | 1,189 | 1,855 | ||||||
| Issued on reinvestment of distributions | — | 458 | ||||||
| Redeemed | (2,660 | ) | (7,518 | ) | ||||
| Total share activity | (1,471 | ) | (5,205 | ) | ||||
| Class IB | ||||||||
| Sold | 2,698 | 3,893 | ||||||
| Issued on reinvestment of distributions | — | 138 | ||||||
| Redeemed | (1,319 | ) | (3,145 | ) | ||||
| Total share activity | 1,379 | 886 | ||||||
The accompanying notes are an integral part of these financial statements.
| 13 |
| Hartford Index HLS Fund |
| Notes to Financial Statements |
| June 30, 2012 (Unaudited) |
| (000’s Omitted) |
| 1. | Organization: |
Hartford Index HLS Fund (the “Fund”) serves as an underlying investment option for certain variable annuity and variable life insurance separate accounts of Hartford Life Insurance Company (“HLIC”) and its affiliates and certain qualified retirement plans. The Fund may also serve as an underlying investment option for certain variable annuity and variable life separate accounts of other insurance companies. Owners of variable annuity contracts and policyholders of variable life insurance contracts may choose the funds permitted in the variable insurance contract prospectus. In addition, participants in certain qualified retirement plans may choose the Fund if permitted by their plans.
Hartford Series Fund, Inc. (the “Company”) is an open-end registered management investment company comprised of thirty portfolios. Financial Statements for the Fund, a series of the Company, are included in this report.
The Company is organized under the laws of the State of Maryland and is registered with the Securities and Exchange Commission (“SEC”) under the Investment Company Act of 1940, as amended (“1940 Act”). The Fund is a diversified open-end management investment company.
The Fund is divided into Class IA and Class IB shares. Each class is offered at the per share net asset value (“NAV”) without a sales charge and is subject to the same expenses, except that the Class IB shares are subject to distribution and service fees charged pursuant to a Distribution Plan adopted in accordance with Rule 12b-1 under the 1940 Act.
| 2. | Significant Accounting Policies: |
The following is a summary of significant accounting policies of the Fund in the preparation of its financial statements, which are in accordance with the United States Generally Accepted Accounting Principles (“U.S. GAAP”). The preparation of financial statements in accordance with U.S. GAAP may require management to make estimates and assumptions that affect the reported amounts of assets and liabilities and disclosure of contingent assets and liabilities at the date of the financial statements and the reported amounts of increases and decreases in net assets from operations during the reporting period. Actual results could differ from those estimates.
| a) | Determination of Net Asset Value – The NAV of each class of the Fund’s shares is determined as of the close of regular trading (normally 4:00 p.m. Eastern Time) (the “NYSE Close”) on each day that the New York Stock Exchange (the “Exchange”) is open (“Valuation Date”). Information that becomes known to the Fund after the NAV has been calculated on a particular day will not generally be used to retroactively adjust the NAV determined earlier that day. |
| b) | Investment Valuation and Fair Value Measurements – For purposes of calculating the NAV, portfolio investments and other assets held by the Fund's portfolio for which market quotes are readily available are valued at market value. Market value is generally determined on the basis of last reported sales prices or official close price. If no sales are reported, market value is based on quotes obtained from a quotation reporting system, established market makers, or independent pricing services. If market prices are not readily available or are deemed unreliable, the Fund will use the fair value of the investment as determined in good faith under policies and procedures established by and under the supervision of the Company's Board of Directors. Market quotes are considered not readily available where there is an absence of current or reliable market-based data (e.g., trade information or broker quotes), including where events occur after the close of the relevant market, but prior to the NYSE Close that materially affect the values of the Fund's portfolio investments or assets. In addition, market quotes are considered not readily available when, due to extraordinary circumstances, the exchanges or markets on which the investments trade do not open for trading for the entire day and no other market prices are available. There can be no assurance that the Fund could obtain the fair market value assigned to an investment if the Fund were to sell the investment at approximately the time at which the Fund determines its NAV. |
| 14 |
Short-term investments maturing in 60 days or less are generally valued at amortized cost, if their original term to maturity was 60 days or less, or by amortizing their value on the 61st day prior to maturity, if the original term to maturity exceeded 60 days.
Exchange traded options, futures and options on futures are valued at the settlement price determined by the relevant exchange as of the NYSE Close. If such instruments do not trade on an exchange, values may be supplied by an independent pricing service using a formula or other objective method that may take into consideration the style, direction, expiration, strike price, notional value and volatility or other adjustments.
Financial instruments for which prices are not available from an independent pricing service may be valued using market quotations obtained from one or more dealers that make markets in the respective financial instrument in accordance with procedures established by the Company’s Board of Directors.
U.S. GAAP defines fair value as the price that the Fund would receive to sell an asset or pay to transfer a liability in an orderly transaction between market participants. The U.S. GAAP fair value measurement standards require disclosure of a fair value hierarchy for each major category of assets and liabilities. Various inputs are used in determining the fair value of the Fund’s investments. These inputs are summarized into three broad hierarchy levels. This hierarchy is based on whether the valuation inputs are observable or unobservable. These levels are:
| · | Level 1 – Quoted prices in active markets for identical investments. Level 1 may include exchange traded instruments, such as domestic equities, some foreign equities, options, futures, mutual funds, exchange traded funds, rights and warrants. |
| · | Level 2 – Observable inputs other than Level 1 prices, such as quoted prices for similar investments; quoted prices in markets that are not active; or other inputs that are observable or can be corroborated by observable market data. Level 2 may include debt investments that are traded less frequently than exchange traded instruments and which are valued using independent pricing services; foreign equities, which are principally traded on certain foreign markets and are adjusted daily pursuant to a fair value pricing service in order to reflect an adjustment for the factors occurring after the close of certain foreign markets but before the NYSE Close; and short-term investments, which are valued at amortized cost. |
| · | Level 3 – Significant unobservable inputs that are supported by limited or no market activity. Level 3 may include financial instruments whose values are determined using indicative market quotes or require significant management judgment or estimation. These unobservable valuation inputs may include estimates for current yields, maturity/duration, prepayment speed, and indicative market quotes for comparable investments along with other assumptions relating to credit quality, collateral value, complexity of the investment structure, general market conditions and liquidity. This category may include investments where trading has been halted or there are certain restrictions on trading. While these investments are priced using unobservable inputs, the valuation of these investments reflects the best available data and management believes the prices are a reasonable representation of exit price. |
The Board of Directors of the Company generally reviews and approves the “Procedures for Valuation of Portfolio Securities” on an annual basis. These procedures define how investments are to be valued, including the formation of a Valuation Committee. The Valuation Committee is responsible for determining in good faith the fair value of investments when the value cannot be obtained from primary pricing services or alternative sources or if the valuation of an investment as provided by the primary pricing service or alternative source is believed not to reflect the investment’s fair value as of the Valuation Date. Members of the Valuation Committee include the Fund’s Treasurer or designee, a Vice President of the Funds with legal expertise or designee, and a Vice President of the investment manager or designee. In addition, the Fund’s chief compliance officer shall designate a member of the compliance group to attend Valuation Committee meetings as a non-voting resource, to monitor for and provide guidance with respect to compliance with these procedures. Two members of the Valuation Committee or their designees, representing different departments, shall constitute a quorum for purposes of permitting the Valuation Committee to take action. The Valuation Committee will
| 15 |
| Hartford Index HLS Fund |
| Notes to Financial Statements – (continued) |
| June 30, 2012 (Unaudited) |
| (000’s Omitted) |
consider all relevant factors in determining an investment’s fair value, and may seek the advice of the Fund’s sub-adviser, knowledgeable brokers and legal counsel in making such determination. The Valuation Committee reports to the Audit Committee of the Company’s Board of Directors. The Audit Committee receives quarterly written reports which include details of all fair-valued investments, including the reason for the fair valuation, and an indication, when possible, of the accuracy of the valuation by disclosing the next available reliable public price quotation or the disposition price of such investments (the “look-back” test). The Board of Directors then must consider for ratification all of the fair value determinations made during the previous quarter.
Valuation levels are not necessarily indicative of the risk associated with investing in such investments. Individual investments within any of the above mentioned asset classes may be assigned a different hierarchical level than those presented above, as individual circumstances dictate.
For additional information, refer to the Investment Valuation Hierarchy Level Summary.
For purposes of reporting transfers between different hierarchy levels, both transfers in and out of each level, as applicable, are shown as if they occurred at the beginning of the period.
| c) | Investment Transactions and Investment Income – Investment transactions are recorded as of the trade date (the date the order to buy or sell is executed) for financial reporting purposes. Investments purchased or sold on a when-issued or delayed-delivery basis may be settled a month or more after the trade date. Realized gains and losses are determined on the basis of identified cost. |
Dividend income is accrued as of the ex-dividend date, except certain dividends from foreign investments where the ex-dividend date may have passed are recorded as soon as the Fund is informed of the dividend. Interest income, including amortization of premium and accretion of discounts, is accrued on a daily basis.
| d) | Joint Trading Account – The Fund may invest cash balances into a joint trading account that may be invested in one or more repurchase agreements. |
| e) | Fund Share Valuation and Dividend Distributions to Shareholders – Orders for the Fund’s shares are executed in accordance with the investment instructions of the contract holders and plan participants. The NAV of the Fund’s shares is determined as of the close of business on each business day of the Exchange. The NAV is determined separately for each class of shares of the Fund by dividing the Fund’s net assets attributable to that class by the number of shares of the class outstanding. Each class of shares offered by the Fund has equal rights as to assets and voting privileges (except that shareholders of a class have exclusive voting rights regarding any matter relating solely to that class of shares). Income and non-class specific expenses are allocated daily to each class on the basis of the relative net assets of the class. Realized and unrealized capital gains and losses are allocated daily based on the relative net assets of each class of shares of the Fund. |
Orders for the purchase of the Fund’s shares received prior to the close of the Exchange on any day the Exchange is open for business are priced at the NAV determined as of the close of the Exchange. Orders received after the close of the Exchange, or on a day on which the Exchange and/or the Fund is not open for business, are priced at the next determined NAV.
Dividends are declared pursuant to a policy adopted by the Company’s Board of Directors based upon the investment performance of the Fund. The policy of the Fund is to pay dividends from net investment income and realized capital gains, if any, at least once a year.
Distributions from net investment income, net realized capital gains and capital are determined in accordance with federal income tax regulations, which may differ from U.S. GAAP with respect to character and timing. These
| 16 |
differences may include but are not limited to losses deferred due to wash sale adjustments, foreign currency gains and losses, adjustments related to Passive Foreign Investment Companies (“PFICs”), Real Estate Investment Trusts (“REITs”), Regulated Investment Companies (“RICs”), certain derivatives and partnerships. Permanent book and federal income tax basis differences relating to shareholder distributions will result in reclassifications to certain of the Fund’s capital accounts (see Federal Income Taxes: Reclassification of Capital Accounts note).
| 3. | Securities and Other Investments: |
| a) | Repurchase Agreements – A repurchase agreement is an agreement by which a counterparty agrees to sell an investment and agrees to repurchase the investment sold at a mutually agreed upon time and price. At the time the Fund enters into a repurchase agreement, the value of the underlying collateral, including accrued interest, will be equal to or exceed the value of the repurchase agreement. Repurchase agreements expose the Fund to counterparty risk. To minimize counterparty risk, the investments that serve to collateralize the repurchase agreement are held by the Fund’s custodian in book entry or physical form in the custodial account of the Fund or in a third party custodial account. Repurchase agreements are valued at cost plus accrued interest. The Fund, as shown on the Schedule of Investments, had outstanding repurchase agreements as of June 30, 2012. |
| 4. | Financial Derivative Instruments: |
The following disclosures contain information on how and why the Fund uses derivative instruments, the credit-risk-related contingent features in certain derivative instruments, and how derivative instruments affect the Fund’s financial position and results of operations. The location and fair value amounts of these instruments on the Statement of Assets and Liabilities and the realized gains and losses and changes in unrealized gains and losses on the Statement of Operations, each categorized by type of derivative contract, are included in the following Additional Derivative Instrument Information footnote. The derivative instruments outstanding as of period-end are disclosed in the notes to the Schedule of Investments and the amounts of realized gains and losses and changes in unrealized gains and losses on derivative instruments during the period are disclosed in the Statement of Operations.
| a) | Futures Contracts – The Fund may enter into futures contracts. A futures contract is an agreement between two parties to buy or sell an asset at a set price on a future date. The Fund uses futures contracts to manage or obtain exposure to the investment markets, commodities, or movements in interest rates and currency values. The primary risks associated with the use of futures contracts are the imperfect correlation between the change in market value of the investments held by the Fund and the prices of futures contracts and the possibility of an illiquid market. Upon entering into a futures contract, the Fund is required to deposit with a futures commission merchant (“FCM”) an amount of cash or U.S. Government or Agency Obligations in accordance with the initial margin requirements of the broker or exchange. Futures contracts are marked to market daily at the most recent settlement price reported by an exchange on which, over time, they are traded most extensively, and an appropriate payable or receivable for the change in value (“variation margin”) is recorded by the Fund. Gains or losses are recognized but not considered realized until the contracts expire or are closed. Futures contracts involve, to varying degrees, risk of loss in excess of the variation margin disclosed on the Statement of Assets and Liabilities; however, this risk is reduced through the use of an FCM. The Fund, as shown on the Schedule of Investments, had outstanding futures contracts as of June 30, 2012. |
| 17 |
| Hartford Index HLS Fund |
| Notes to Financial Statements – (continued) |
| June 30, 2012 (Unaudited) |
| (000’s Omitted) |
| b) | Additional Derivative Instrument Information: |
Fair Values of Derivative Instruments on the Statement of Assets and Liabilities as of June 30, 2012:
| Risk Exposure Category | ||||||||||||||||||||||||||||
| Interest Rate Contracts | Foreign Exchange Contracts | Credit Contracts | Equity Contracts | Commodity Contracts | Other Contracts | Total | ||||||||||||||||||||||
| Assets: | ||||||||||||||||||||||||||||
| Variation margin receivable * | $ | — | $ | — | $ | — | $ | 332 | $ | — | $ | — | $ | 332 | ||||||||||||||
| Total | $ | — | $ | — | $ | — | $ | 332 | $ | — | $ | — | $ | 332 | ||||||||||||||
| Liabilities: | ||||||||||||||||||||||||||||
| Variation margin payable * | $ | — | $ | — | $ | — | $ | 2 | $ | — | $ | — | $ | 2 | ||||||||||||||
| Total | $ | — | $ | — | $ | — | $ | 2 | $ | — | $ | — | $ | 2 | ||||||||||||||
| * | Only current day's variation margin is reported within the Statement of Assets and Liabilities. The variation margin is included in the open futures cumulative appreciation (depreciation) of $411 as reported in the Schedule of Investments. |
The volume of derivatives that is presented in the Schedule of Investments is consistent with the derivative activity during the six-month period ended June 30, 2012.
The effect of Derivative Instruments on the Statement of Operations for the six-month period ended June 30, 2012:
| Risk Exposure Category | ||||||||||||||||||||||||||||
| Interest Rate Contracts | Foreign Exchange Contracts | Credit Contracts | Equity Contracts | Commodity Contracts | Other Contracts | Total | ||||||||||||||||||||||
| Realized Gain (Loss) on Derivatives Recognized as a Result of Operations: | ||||||||||||||||||||||||||||
| Net realized gain on futures | $ | — | $ | — | $ | — | $ | 630 | $ | — | $ | — | $ | 630 | ||||||||||||||
| Total | $ | — | $ | — | $ | — | $ | 630 | $ | — | $ | — | $ | 630 | ||||||||||||||
| Net Change in Unrealized Appreciation (Depreciation) on Derivatives Recognized as a Result of Operations: | ||||||||||||||||||||||||||||
| Net change in unrealized appreciation of futures | $ | — | $ | — | $ | — | $ | 400 | $ | — | $ | — | $ | 400 | ||||||||||||||
| Total | $ | — | $ | — | $ | — | $ | 400 | $ | — | $ | — | $ | 400 | ||||||||||||||
| 5. | Principal Risks: |
| a) | Counterparty Risk – The Fund may be exposed to counterparty risk, or the risk that an institution or other entity with which the Fund has unsettled or open transactions will default. |
| b) | Market Risks – The market values of equity securities, such as common stocks and preferred stocks, or equity related investments, such as futures and options, may decline due to general market conditions which are not specifically related to a particular company, such as real or perceived adverse economic conditions, changes in the general outlook for corporate earnings, changes in interest or currency rates or adverse investor sentiment generally. The market value of equity securities may also decline due to factors which affect a particular industry or industries, such as labor shortages or increased production costs and competitive conditions within an industry. Equity securities and equity related investments generally have greater market price volatility than fixed income securities. |
| 6. | Federal Income Taxes: |
| a) | Federal Income Taxes – For federal income tax purposes, the Fund intends to continue to qualify as a RIC under Subchapter M of the Internal Revenue Code (“IRC”) by distributing substantially all of its taxable net investment income and net realized capital gains to its shareholders and otherwise complying with the requirements of RICs. The Fund has distributed substantially all of its income and capital gains in prior years, if applicable, and intends to distribute |
| 18 |
| substantially all of its income and capital gains prior to the next fiscal year-end. Accordingly, no provision for federal income or excise taxes has been made in the accompanying financial statements. Distributions from short-term capital gains are treated as ordinary income distributions for federal income tax purposes. |
| b) | Net Investment Income (Loss), Net Realized Gains (Losses) – Net investment income (loss) and net realized gains (losses) may differ for financial statement and tax purposes primarily because of losses deferred due to wash sale adjustments, foreign currency gains and losses, adjustments related to PFICs, REITs, RICs, certain derivatives and partnerships. The character of distributions made during the year from net investment income or net realized gains may differ from their ultimate characterization for federal income tax purposes. Also, due to the timing of dividend distributions, the fiscal year in which amounts are distributed may differ from the year that the income or realized gains (losses) were recorded by the Fund. |
| c) | Distributions and Components of Distributable Earnings – The tax character of distributions paid by the Fund for the periods indicated is as follows (as adjusted for dividends payable): |
| For the Year Ended December 31, 2011 | For the Year Ended December 31, 2010 | |||||||
| Ordinary Income | $ | 15,474 | $ | 16,000 | ||||
As of December 31, 2011, the Fund’s components of distributable earnings (deficit) on a tax basis were as follows:
| Amount | ||||
| Undistributed Ordinary Income | $ | 1,451 | ||
| Accumulated Capital and Other Losses* | (22,247 | ) | ||
| Unrealized Appreciation† | 56,823 | |||
| Total Accumulated Earnings | $ | 36,027 | ||
| * | The Fund has capital loss carryforwards that are identified in the Capital Loss Carryforward note that follows. |
| † | The difference between book-basis and tax-basis unrealized appreciation (depreciation) may be attributable to the losses deferred due to wash sale adjustments, foreign currency gains and losses, adjustments related to PFICs, REITs, RICs, certain derivatives and partnerships. |
| d) | Reclassification of Capital Accounts – The Fund may record reclassifications in its capital accounts. These reclassifications have no impact on the total net assets of the Fund. The reclassifications are a result of permanent differences between U.S. GAAP and tax accounting for such items as foreign currency, PFICs, expiration or utilization of capital loss carryforwards or net operating losses. Adjustments are made to reflect the impact these items have on current and future distributions to shareholders. Therefore, the source of the Fund’s distributions may be shown in the accompanying Statement of Changes in Net Assets as from undistributed net investment income, from accumulated net realized gains on investments or from capital depending on the type of book and tax differences that exist. For the year ended December 31, 2011, the Fund recorded reclassifications to increase (decrease) the accounts listed below: |
| Amount | ||||
| Undistributed Net Investment Income | $ | (311 | ) | |
| Accumulated Net Realized Gain (Loss) | 311 | |||
| e) | Capital Loss Carryforward – On December 22, 2010, the Regulated Investment Company Modernization Act of 2010 (the “Act”) was enacted, which made changes to the capital loss carryforward rules. The changes are effective for taxable years beginning after the date of enactment. Under the Act, funds are permitted to carry forward capital losses for an unlimited period. However, any losses incurred during those future taxable years will be required to be utilized prior to the losses incurred in pre-enactment taxable years, which carry an expiration date. As a result of this ordering rule, pre-enactment capital loss carryforwards may be more likely to expire unused. Additionally, post-enactment capital loss |
| 19 |
| Hartford Index HLS Fund |
| Notes to Financial Statements – (continued) |
| June 30, 2012 (Unaudited) |
| (000’s Omitted) |
| carryforwards retain their character as either short-term or long-term capital losses rather than being considered all short-term as permitted under prior regulation. |
At December 31, 2011 (tax-year-end), the Fund had capital loss carryforwards for U.S. federal income tax purposes as follows:
| Year of Expiration | Amount | |||
| 2017 | $ | 22,247 | ||
| Total | $ | 22,247 | ||
During the year ended December 31, 2011, the Fund utilized $1,269 of prior year capital loss carryforwards.
| f) | Accounting for Uncertainty in Income Taxes – The Fund has adopted financial reporting rules that require the Fund to analyze all open tax years, as defined by the statute of limitations, for all major jurisdictions. Generally, tax authorities can examine all tax returns filed for the last three years. The Fund does not have an examination in progress. |
The Fund has reviewed all open tax years and major jurisdictions and concluded that these financial reporting rules had no effect on the Fund’s financial position or results of operations. There is no tax liability resulting from unrecognized tax benefits relating to uncertain income tax positions taken or expected to be taken on the tax return for the fiscal year ended December 31, 2011. The Fund is also not aware of any tax positions for which it is reasonably possible that the total amounts of unrecognized tax benefits will significantly change in the next twelve months.
| 7. | Expenses: |
| a) | Investment Management Agreement – HL Investment Advisors, LLC (“HL Advisors”), an indirect wholly owned subsidiary of The Hartford Financial Services Group, Inc. (“The Hartford”), serves as investment manager to the Fund pursuant to an Investment Management Agreement with the Company. As investment manager, HL Advisors has overall investment supervisory responsibility for the Fund. In addition, HL Advisors provides administrative personnel, services, equipment, facilities and office space for proper operation of the Fund. HL Advisors has contracted with Hartford Investment Management Company (“Hartford Investment Management”) under a sub-advisory agreement for the provision of day-to-day investment management services to the Fund in accordance with the Fund’s investment objective and policies. The Fund pays a fee to HL Advisors, a portion of which may be used to compensate Hartford Investment Management. |
The schedule below reflects the rates of compensation paid to HL Advisors for investment management services rendered as of June 30, 2012; the rates are accrued daily and paid monthly.
| Average Daily Net Assets | Annual Fee | |||
| On first $2 billion | 0.3000 | % | ||
| On next $3 billion | 0.2000 | % | ||
| On next $5 billion | 0.1800 | % | ||
| Over $10 billion | 0.1700 | % | ||
| 20 |
| b) | Accounting Services Agreement – Pursuant to the Fund Accounting Agreement between HLIC and the Company, on behalf of the Fund, HLIC provides accounting services to the Fund and receives monthly compensation based on the Fund’s average daily net assets at the rates set forth below. The Fund’s accounting services fees are accrued daily and paid monthly. |
| Average Daily Net Assets | Annual Fee | |||
| All Assets | 0.010 | % | ||
| c) | Operating Expenses – Allocable expenses incurred by the Company are allocated to each Fund and allocated to classes within a Fund in proportion to the average daily net assets of the Fund and each class, except where allocation of certain expenses is more fairly made directly to the Fund or to specific classes within a Fund. |
| d) | Distribution Plan for Class IB shares – The Company, on behalf of the Fund, has adopted a Distribution Plan pursuant to Rule 12b-1 of the 1940 Act to compensate the Distributor, Hartford Securities Distribution Company, Inc. (a wholly owned, ultimate subsidiary of The Hartford), from assets attributable to the Class IB shares for services rendered and expenses borne in connection with activities primarily intended to result in the sale of the Class IB shares, subject to the review and approval of the Company’s Board of Directors. |
The Distribution Plan provides that the Fund may pay annually up to 0.25% of the average daily net assets of the Fund attributable to its Class IB shares for activities primarily intended to result in the sale of Class IB shares. The Board has the authority to suspend or reduce these payments at any point in time. Under the terms of the Distribution Plan and the principal underwriting agreement, the Fund is authorized to make payments monthly to the Distributor that may be used to pay or compensate entities providing distribution and shareholder servicing with respect to the Class IB shares for such entities’ fees or expenses incurred or paid in that regard. These fees are accrued daily and paid monthly.
| e) | Other Related Party Transactions – Certain officers of the Fund are directors and/or officers of HL Advisors and/or The Hartford or its subsidiaries. For the six-month period ended June 30, 2012, a portion of the Fund’s chief compliance officer’s salary was paid by all the investment companies in the Hartford fund complex. The portion allocated to the Funds was in the amount of $1. These fees are accrued daily and paid monthly. |
| 8. | Investment Transactions: |
For the six-month period ended June 30, 2012, the Fund's aggregate purchases and sales of investment securities (excluding short-term investments) were as follows:
| Amount | ||||
| Cost of Purchases Excluding U.S. Government Obligations | $ | 24,377 | ||
| Sales Proceeds Excluding U.S. Government Obligations | 16,031 | |||
| 9. | Line of Credit: |
The Fund is one of several Hartford funds that participate in a $500 million committed revolving line of credit facility. The facility is to be used for temporary or emergency purposes. Under the arrangement, the funds are required to own securities having a market value in excess of 300% of the total bank borrowings. The interest rate on borrowings varies depending on the nature of the loan. The facility also requires a fee to be paid based on the amount of the commitment. This commitment fee is allocated to all of the funds participating in the line of credit based on the average net assets of the funds. During the six-month period ended June 30, 2012, the Fund did not have any borrowings under this facility.
| 21 |
| Hartford Index HLS Fund |
| Notes to Financial Statements – (continued) |
| June 30, 2012 (Unaudited) |
| (000’s Omitted) |
| 10. | Industry Classifications: |
Other than the industry classifications “Other Investment Pools and Funds” and “Exchange Traded Funds,” equity industry classifications used in this report are the Global Industry Classification Standard, which was developed by and is the exclusive property and service mark of MSCI, Inc. and Standard & Poor’s.
| 11. | Indemnifications: |
Under the Company’s organizational documents, the Company shall indemnify its officers and directors to the full extent required or permitted under Maryland General Corporation Law and the federal securities laws. In addition, the Company, on behalf of the Fund, may enter into contracts that contain a variety of indemnifications. The Company’s maximum exposure under these arrangements is unknown. However, as of the date of these financial statements, the Company has not had prior claims or losses pursuant to these contracts and expects the risk of loss to be remote.
| 22 |
[This page intentionally left blank]
| 23 |
| Hartford Index HLS Fund |
| Financial Highlights |
| - Selected Per-Share Data (A) - |
| Class(A) | Net Asset Value at Beginning of Period | Net Investment Income (Loss) | Payments from (to) Affiliate | Net Realized and Unrealized Gain (Loss) on Investments | Total from Investment Operations | Dividends from Net Investment Income | Distributions from Realized Capital Gains | Distributions from Capital | Total Distributions | Net Increase (Decrease) in Net Asset Value | Net Asset Value at End of Period | |||||||||||||||||||||||||||||||||
| For the Six-Month Period Ended June 30, 2012 (Unaudited) | ||||||||||||||||||||||||||||||||||||||||||||
| IA | $ | 26.20 | $ | 0.27 | $ | – | $ | 2.17 | $ | 2.44 | $ | – | $ | – | $ | – | $ | – | $ | 2.44 | $ | 28.64 | ||||||||||||||||||||||
| IB | 26.09 | 0.20 | – | 2.20 | 2.40 | – | – | – | – | 2.40 | 28.49 | |||||||||||||||||||||||||||||||||
| For the Year Ended December 31, 2011 | ||||||||||||||||||||||||||||||||||||||||||||
| IA | 26.20 | 0.52 | – | (0.05 | ) | 0.47 | (0.47 | ) | – | – | (0.47 | ) | – | 26.20 | ||||||||||||||||||||||||||||||
| IB | 26.08 | 0.39 | – | 0.03 | 0.42 | (0.41 | ) | – | – | (0.41 | ) | 0.01 | 26.09 | |||||||||||||||||||||||||||||||
| For the Year Ended December 31, 2010 | ||||||||||||||||||||||||||||||||||||||||||||
| IA | 23.22 | 0.44 | – | 2.97 | 3.41 | (0.43 | ) | – | – | (0.43 | ) | 2.98 | 26.20 | |||||||||||||||||||||||||||||||
| IB | 23.12 | 0.34 | – | 2.99 | 3.33 | (0.37 | ) | – | – | (0.37 | ) | 2.96 | 26.08 | |||||||||||||||||||||||||||||||
| For the Year Ended December 31, 2009 | ||||||||||||||||||||||||||||||||||||||||||||
| IA | 18.75 | 0.42 | – | 4.48 | 4.90 | (0.42 | ) | (0.01 | ) | – | (0.43 | ) | 4.47 | 23.22 | ||||||||||||||||||||||||||||||
| IB | 18.69 | 0.35 | – | 4.46 | 4.81 | (0.37 | ) | (0.01 | ) | – | (0.38 | ) | 4.43 | 23.12 | ||||||||||||||||||||||||||||||
| For the Year Ended December 31, 2008 | ||||||||||||||||||||||||||||||||||||||||||||
| IA | 31.54 | 0.59 | – | (12.16 | ) | (11.57 | ) | (0.58 | ) | (0.64 | ) | – | (1.22 | ) | (12.79 | ) | 18.75 | |||||||||||||||||||||||||||
| IB | 31.40 | 0.51 | – | (12.07 | ) | (11.56 | ) | (0.51 | ) | (0.64 | ) | – | (1.15 | ) | (12.71 | ) | 18.69 | |||||||||||||||||||||||||||
| For the Year Ended December 31, 2007 | ||||||||||||||||||||||||||||||||||||||||||||
| IA | 32.36 | 0.59 | – | 1.07 | 1.66 | (0.57 | ) | (1.91 | ) | – | (2.48 | ) | (0.82 | ) | 31.54 | |||||||||||||||||||||||||||||
| IB | 32.22 | 0.48 | – | 1.09 | 1.57 | (0.48 | ) | (1.91 | ) | – | (2.39 | ) | (0.82 | ) | 31.40 | |||||||||||||||||||||||||||||
| (A) | Information presented relates to a share outstanding throughout the indicated period. |
| (B) | The figures do not include sales charges or other fees which may be applied at the variable life insurance, variable annuity or qualified retirement plan product level. Any such additional sales charges or other fees would lower the Fund's performance. |
| (C) | Portfolio turnover rate is calculated on the basis of the Fund as a whole without distinguishing between the classes of shares issued. |
| (D) | Not annualized. |
| (E) | Annualized. |
| 24 |
| - Ratios and Supplemental Data - |
| Total Return(B) | Net Assets at End of Period | Ratio of Expenses to Average Net Assets Before Waivers | Ratio of Expenses to Average Net Assets After Waivers | Ratio of Net Investment Income (Loss) to Average Net Assets | Portfolio Turnover Rate(C) | |||||||||||||||||
| 9.32 | %(D) | $ | 693,871 | 0.33 | %(E) | 0.33 | %(E) | 1.83 | %(E) | 2 | % | |||||||||||
| 9.18 | (D) | 293,078 | 0.58 | (E) | 0.58 | (E) | 1.59 | (E) | – | |||||||||||||
| 1.81 | 673,275 | 0.33 | 0.33 | 1.74 | 3 | |||||||||||||||||
| 1.60 | 232,459 | 0.58 | 0.58 | 1.51 | – | |||||||||||||||||
| 14.73 | 809,629 | 0.34 | 0.34 | 1.73 | 4 | |||||||||||||||||
| 14.45 | 209,260 | 0.59 | 0.59 | 1.48 | – | |||||||||||||||||
| 26.15 | 811,634 | 0.35 | 0.35 | 2.00 | 6 | |||||||||||||||||
| 25.81 | 166,162 | 0.60 | 0.60 | 1.75 | – | |||||||||||||||||
| (37.11 | ) | 718,081 | 0.32 | 0.32 | 2.02 | 4 | ||||||||||||||||
| (37.27 | ) | 138,014 | 0.57 | 0.57 | 1.77 | – | ||||||||||||||||
| 5.20 | 1,390,827 | 0.33 | 0.33 | 1.61 | 4 | |||||||||||||||||
| 4.94 | 271,967 | 0.58 | 0.58 | 1.36 | – | |||||||||||||||||
| 25 |
| Hartford Index HLS Fund |
| Directors and Officers (Unaudited) |
The Board of Directors of the Company appoints officers who are responsible for the day-to-day operations of the Fund and who execute policies formulated by the Directors. Each director serves until his or her death, resignation, or retirement or until the next annual meeting of shareholders is held or until his or her successor is elected and qualifies.
Directors and officers who are employed by or who have a financial interest in The Hartford are considered “interested” persons of the Fund pursuant to the 1940 Act. Each officer and two of the Company’s directors, as noted in the chart below, are “interested” persons of the Fund. Each director serves as a director for The Hartford Mutual Funds, Inc., The Hartford Mutual Funds II, Inc., Hartford Series Fund, Inc., Hartford HLS Series Fund II, Inc., and as a trustee for The Hartford Alternative Strategies Fund, which, as of June 30, 2012, collectively consist of 89 funds. Correspondence may be sent to directors and officers c/o Hartford Mutual Funds, P.O. Box 2999, Hartford, Connecticut 06104-2999, except that correspondence to Mr. Annoni, Mr. Dressen and Ms. Fagely may be sent to 500 Bielenberg Drive, Woodbury, Minnesota 55125.
The table below sets forth, for each director and officer, his or her name, year of birth, current position with the Company and date first elected or appointed to Hartford Series Fund, Inc. (“HSF”), and Hartford HLS Series Fund II, Inc. (“HSF2”), principal occupation, and, for directors, other directorships held. The Fund’s statement of additional information contains further information on the directors and is available free of charge by calling 1-800-862-6668 or writing to Hartford HLS Funds, c/o Individual Annuity Services, P.O. Box 5085, Hartford, CT 06102-5085.
Information on the aggregate remuneration paid to the directors of the Company can be found in the Statement of Operations herein. The Fund pays to The Hartford a portion of the Chief Compliance Officer’s compensation, but does not pay salaries or compensation to any of their other officers or directors who are employed by The Hartford.
Non-Interested Directors
Lynn S. Birdsong (1946) Director since 2003, Co-Chairman of the Investment Committee
Mr. Birdsong is a private investor. Mr. Birdsong currently serves as a Director of the Sovereign High Yield Investment Company (April 2010 to current). Mr. Birdsong currently serves as an Independent Director of Nomura Partners Funds, Inc. (formerly, The Japan Fund) (March 2003 to current). From 1979 to 2002, Mr. Birdsong was a managing director of Zurich Scudder Investments, an investment management firm. During his employment with Scudder, Mr. Birdsong was an Interested Director of The Japan Fund. Since 1981, Mr. Birdsong has been a partner in Birdsong Company, an advertising specialty firm.
Robert M. Gavin, Jr. (1940) Director since 2002 (HSF) and 1986 (HSF2), Chairman of the Board since 2004
Dr. Gavin is an educational consultant. Prior to September 1, 2001, he was President of Cranbrook Education Community and prior to July 1996, he was President of Macalester College, St. Paul, Minnesota.
Duane E. Hill (1945) Director since 2001 (HSF) and 2002 (HSF2), Chairman of the Nominating Committee
Mr. Hill is Partner of TSG Ventures L.P., a private equity investment company. Mr. Hill is a former partner of TSG Capital Group, a private equity investment firm that served as sponsor and lead investor in leveraged buyouts of middle market companies.
Sandra S. Jaffee (1941) Director since 2005
Ms. Jaffee is the founder and Chief Executive Officer of a private company, Homeworks Concierge, LLC, which provides residential property management services in Westchester County, New York (January 2012 to present). Ms. Jaffee served as Chairman (2008 to 2009) and Chief Executive Officer of Fortent (formerly Searchspace Group), a leading provider of compliance/regulatory technology to financial institutions from August 2005 to August 2009. Ms. Jaffe currently serves as a member of the Board of Directors of Broadridge Financial Solutions as well as a Trustee of Muhlenberg College.
William P. Johnston (1944) Director since 2005, Chairman of the Compliance Committee
In June 2006, Mr. Johnston was appointed as Senior Advisor to The Carlyle Group, a global private equity investment firm. In August 2007, Mr. Johnston was elected to the Board of Directors of LifeCare Holdings, Inc. In February 2008, Mr. Johnston was elected to the Board of Directors of HCR-ManorCare, Inc. In May 2006, Mr. Johnston was elected to the Supervisory Board of Fresenius Medical Care AG & Co. KGaA, after its acquisition of Renal Care Group, Inc. in March 2006.
Phillip O. Peterson (1944) Director since 2002 (HSF) and 2000 (HSF2), Chairman of the Audit Committee
Mr. Peterson is a mutual fund industry consultant. He was a partner of KPMG LLP (an accounting firm) until July 1999. Mr. Peterson joined William Blair Funds in February 2007 as a member of the Board of Trustees. Mr. Peterson also joined the Board of Trustees of Symetra Variable Mutual Funds Trust as a trustee in February 2012.
| 26 |
Lemma W. Senbet (1946) Director since 2005
Dr. Senbet is the William E. Mayer Chair Professor of Finance and Director, Center for Financial Policy, at the University of Maryland, Robert H. Smith School of Business. He was chair of the Finance Department from 1998 to 2006. Previously he was a chaired professor of finance at the University of Wisconsin-Madison. Also, he was director of the Fortis Funds from March 2000 to July 2002. Dr. Senbet served the finance profession in various capacities, including as director of the American Finance Association and President of the Western Finance Association. In 2006, Dr. Senbet was inducted Fellow of Financial Management Association International for his career-long distinguished scholarship and professional service.
Interested Directors and Officers
David N. Levenson (1966) Director since 2010(1)
Mr. Levenson currently serves as President of The Hartford’s Wealth Management business. He was appointed to this role in July 2010. Previously, Mr. Levenson served as Executive Vice President of Legacy Holdings for The Hartford from June 2009 to July 2010. From 2006 to 2009, Mr. Levenson was with Hartford Life Insurance K.K. where he served as President and Chief Executive Officer from 2007 to 2009. He served as Managing Director of Hartford Investment Management Company from 2005 to 2006. Additionally, Mr. Levenson serves as Executive Vice President of The Hartford and as President, Director and Chief Executive Officer of Hartford Life Insurance Company (“HLIC”) and Hartford Life, Inc. (“HL Inc.”).
(1) Mr. Levenson served as Interested Director until August 2, 2012.
Lowndes A. Smith (1939) Director since 1996 (HSF) and 2002 (HSF2), Co-Chairman of the Investment Committee
Mr. Smith served as Vice Chairman of The Hartford from February 1997 to January 2002, as President and Chief Executive Officer of HL Inc. from February 1997 to January 2002, and as President and Chief Operating Officer of The Hartford Life Insurance Companies from January 1989 to January 2002. Mr. Smith serves as a Director of White Mountains Insurance Group, Ltd., One Beacon Insurance and Symetra Financial and as Managing Director of Whittington Gray Associates.
Other Officers
James E. Davey (1964) President and Chief Executive Officer since 2010(2)
Mr. Davey serves as Executive Vice President of HLIC. Additionally, Mr. Davey serves as President, Chief Executive Officer and Manager of HIFSCO and President, Chief Executive Officer and Manager of HL Investment Advisors, LLC (“HL Advisors”). Mr. Davey joined The Hartford in 2002.
(2) Mr. Davey became an Interested Director effective August 2, 2012.
Mark A. Annoni (1964) Vice President, Controller and Treasurer since 2012(3)
Mr. Annoni serves as the Assistant Vice President and Director of Investment Finance (February 2004 to present). Mr. Annoni joined The Hartford in April 2001 as part of The Hartford’s acquisition of Fortis Financial Group. Prior to joining The Hartford, Mr. Annoni served as Manager of Mutual Fund Accounting at Fortis Financial Group (July 1997 to April 2001).
(3) Mr. Annoni was named Vice President, Controller and Treasurer on May 8, 2012.
Michael R. Dressen (1963) AML Compliance Officer since 2011
Mr. Dressen currently serves as Assistant Vice President of HLIC. He also serves as Chief Compliance Officer and AML Compliance Officer of Hartford Administrative Services Company (“HASCO”) and as Assistant Secretary and Compliance Officer of HIFSCO. Mr Dressen joined The Hartford in 2005 from State Farm Insurance Companies where he held various positions related to mutual funds, variable products, and property casualty insurance.
Tamara L. Fagely (1958) Vice President, since 2002 (HSF) and 1993 (HSF2)(4)
Ms. Fagely has been a Vice President of HASCO since 1998 and Chief Financial Officer since 2006. Currently Ms. Fagely is a Vice President of HLIC. She served as Assistant Vice President of HLIC from December 2001 through March 2005. In addition, Ms. Fagely is Controller and Chief Financial Officer of HIFSCO.
(4) Ms. Fagely served as Vice President, Controller and Treasurer until May 8, 2012.
Dr. Robert J. Froehlich (1953) Senior Managing Director since 2009(5)
Dr. Froehlich joined The Hartford as Senior Managing Director in September 2009. Prior to joining The Hartford, Dr. Froehlich served as Vice Chairman of Deutsche Asset Management from 1997-2009.
(5) Dr. Froehlich served as Senior Managing Director until March 26, 2012.
| 27 |
| Hartford Index HLS Fund |
| Directors and Officers (Unaudited) – (continued) |
Edward P. Macdonald (1967) Vice President, Secretary and Chief Legal Officer since 2005
Mr. Macdonald serves as Vice President of HLIC and Chief Legal Officer of Mutual Funds and Vice President of HIFSCO. He also serves as Vice President and Secretary of HASCO, and Chief Legal Officer, Secretary and Vice President of HL Advisors. Mr. Macdonald joined The Hartford in 2005.
Vernon J. Meyer (1964) Vice President since 2006
Mr. Meyer serves as Senior Vice President of HLIC. He also serves as Senior Vice President of HIFSCO and HL Advisors. Mr. Meyer joined The Hartford in 2004.
Colleen B. Pernerewski (1969) Vice President and Chief Compliance Officer since 2010
Ms. Pernerewski serves as Vice President and Chief Investment Advisor Compliance Officer of HIFSCO and as Vice President and Chief Compliance Officer of HL Advisors. Ms. Pernerewski serves as Vice President and Chief Compliance Officer of Individual Annuity of HLIC. Ms. Pernerewski joined The Hartford in 2005 from Travelers Life and Annuity where she served as Counsel (2004-2005). Prior to Travelers Life and Annuity, Ms. Pernerewski held the position of Counsel at The Hartford (1998-2004).
Elizabeth L. Schroeder (1966) Vice President since 2010
Ms. Schroeder currently serves as Assistant Vice President of HLIC. Ms. Schroeder joined HLIC in 1991. She is also an Assistant Vice President of HASCO, HIFSCO and HL Advisors.
Martin Swanson (1962) Vice President since 2010
Mr. Swanson is a Vice President of HLIC. Mr. Swanson also serves as Vice President/Marketing for HIFSCO. Prior to joining HLIC in 1998, Mr. Swanson was a Vice President at PaineWebber, Inc.
Jane Wolak (1961) Vice President since 2009
Ms. Wolak currently serves as Senior Vice President of HLIC. Ms. Wolak joined HLIC as Vice President, Retail Product Services in May 2007. She is also Vice President of HASCO. Previously, Ms. Wolak was with Sun Life Financial where she held the position of Vice President, Service Center Operations from 2001-2007.
HOW TO OBTAIN A COPY OF THE FUND’S PROXY VOTING POLICIES AND VOTING RECORDS (UNAUDITED)
A description of the policies and procedures that the Fund uses to determine how to vote proxies relating to portfolio securities and a record of how the Fund voted any proxies for the twelve-month period ended June 30, 2012 are available (1) without charge, upon request, by calling 800-862-6668 and (2) on the SEC’s website at http://www.sec.gov.
QUARTERLY PORTFOLIO HOLDINGS INFORMATION (UNAUDITED)
The Fund files a complete schedule of portfolio holdings with the SEC for the first and third quarters of each fiscal year on Form N-Q. The Fund’s Forms are available (1) without charge, upon request, by calling 800-862-6668 and (2) on the SEC’s website at http://www.sec.gov. The Form N-Q may be reviewed and copied at the SEC’s Public Reference Room in Washington, DC. Information on the operation of the Public Reference Room may be obtained by calling 1-800-SEC-0330.
| 28 |
| Hartford Index HLS Fund |
| Expense Example (Unaudited) |
Your Fund's Expenses
As a shareholder of the Fund, you incur two types of costs: (1) transaction costs and (2) ongoing costs including investment management fees, distribution fees, and other fund expenses. This example is intended to help you understand your ongoing costs (in dollars) of investing in the Fund and to compare these costs with the ongoing costs of investing in other mutual funds. The example is based on an investment of $1,000 invested at the beginning of the period and held for the period of December 31, 2011 through June 30, 2012.
Actual Expenses
The first set of columns of the table below provides information about actual account values and actual expenses. You may use the information in this column, together with the amount you invested, to estimate the expenses that you paid over the period. Simply divide your account value by $1,000 (for example, an $8,600 account value divided by $1,000 = 8.6), then multiply the result by the number in the line under the heading entitled “Expenses Paid During Period” to estimate the expenses you paid on your account during this period.
Hypothetical Example for Comparison Purposes
The second set of columns of the table below provides information about hypothetical account values and hypothetical expenses based on the Fund’s actual expense ratio and an assumed rate of return of 5% per year before expenses, which is not the Fund’s actual return. The hypothetical account values and expenses may not be used to estimate the actual ending account balance or expenses you paid for the period. You may use this information to compare the ongoing costs of investing in the Fund and other funds. To do so, compare this 5% hypothetical example with the 5% hypothetical examples that appear in the shareholder reports of the other funds.
Please note that the expenses shown in the table are meant to highlight your ongoing costs only and do not reflect any transactional costs, such as sales charges (loads) and CDSC. Therefore, the second set of columns of the table is useful in comparing ongoing costs only, and will not help you determine the relative total costs of owning different funds. In addition, if these transactional costs were included, your costs would be higher. Expenses are equal to the Fund's annualized expense ratios multiplied by average account value over the period, multiplied by 182/366 (to reflect the one-half year period).
| Actual return | Hypothetical (5% return before expenses) | |||||||||||||||||||||||||||||||||||
| Beginning Account Value December 31, 2011 | Ending Account Value June 30, 2012 | Expenses paid during the period December 31, 2011 through June 30, 2012 | Beginning Account Value December 31, 2011 | Ending Account Value June 30, 2012 | Expenses paid during the period December 31, 2011 through June 30, 2012 | Annualized expense ratio | Days in the current 1/2 year | Days in the full year | ||||||||||||||||||||||||||||
| Class IA | $ | 1,000.00 | $ | 1,093.16 | $ | 1.72 | $ | 1,000.00 | $ | 1,023.22 | $ | 1.66 | 0.33 | % | 182 | 366 | ||||||||||||||||||||
| Class IB | $ | 1,000.00 | $ | 1,091.80 | $ | 3.02 | $ | 1,000.00 | $ | 1,021.98 | $ | 2.92 | 0.58 | % | 182 | 366 | ||||||||||||||||||||
| 29 |
HARTFORD HLS FUNDS
c/o The Hartford Wealth Management - Global Annuities
P.O. Box 14293
Lexington, KY 40512-4293
Hartford Series Fund, Inc. is underwritten and distributed by Hartford Securities Distribution Company, Inc.
"The Hartford" is The Hartford Financial Services Group, Inc. and its subsidiaries.
Hartford Series Fund, Inc. inception dates range from 1977 to date. Hartford Series Fund, Inc. is not a subsidiary of The Hartford but is underwritten, distributed by and advised by subsidiaries of The Hartford. Investments in Hartford Series Fund, Inc. are not guaranteed by The Hartford or any other entity.
You should carefully consider investment objectives, risks, and charges and expenses of Hartford HLS Funds before investing. This and other information can be found in the Fund’s prospectus or summary prospectus, which can be obtained by calling 800-862-6668. Please read them carefully before you invest or send money.
| HLSSAR-IX12 8-12 111647 Printed in U.S.A ©2012 The Hartford, Hartford, CT 06115 | |

A MESSAGE FROM THE PRESIDENT
Dear Fellow Shareholders:
I want to take this opportunity to say thank you for investing in the Hartford HLS Funds. We’ve seen continued market volatility throughout the first half of 2012, and there will likely be continued uncertainty until the Presidential election in November, but we are still optimistic about the markets in 2012.
Market Review
In the first quarter of 2012, the S&P 500 Index turned in its best quarterly performance since the third quarter of 2009. U.S. equities showed signs of improvement as investors focused on improving economic data and strong corporate earnings news and the Federal Reserve’s pledge to keep interest rates low buoyed investors’ appetites.
The second quarter ended on a high note for the stock market—the S&P 500 had its strongest June in more than a decade and the Dow Jones Industrial Average had its best month since October—but those gains weren’t enough to offset losses from April and May, and equities finished the quarter in the red. Although the S&P 500 was -2.75 for the second quarter, it was up 9.49% for the first half of 2012.
Concerns about domestic and European unemployment are having an effect on our economy. The unemployment rate in the euro zone's 17 nations rose to a record 11.1% in May, the highest level since the euro launched as a common currency more than 10 years ago. In the U.S., the labor market has been fickle this year, with job growth starting off strong in the first couple months of 2012 but slowing down in the spring, which has led many to wonder about the status of the economic recovery.
On a positive note, home prices are rising again after falling for more than five years, new and existing home sales are increasing, and home builders are ramping up construction.
The Hartford HLS Funds Expands Relationship with Wellington Management
We’re very pleased that we are expanding our relationship with Wellington Management, which will now serve as the primary sub-adviser for the Hartford HLS Funds including equity, fixed-income,* and asset-allocation funds. One of America’s oldest and largest investment management firms, Wellington Management has resources that span the entire globe, with multiple offices across the U.S. and numerous offices abroad. Wellington Management’s most distinctive strength is its proprietary research, which is shared across the entire organization.
We believe that aligning more closely with a well-respected money manager like Wellington Management puts us in a strong position to drive significant growth and to continue delivering innovative fund strategies to help our investors meet their financial goals.
Thank you again for investing with the Hartford HLS Funds.
James Davey
President
Hartford HLS Funds
*Several fixed-income funds will continue to be sub-advised by Hartford Investment Management Company.
Hartford International Opportunities HLS Fund
Table of Contents
This report is prepared for the general information of contract owners and qualified retirement plan participants. It is not an offer of contracts or of qualified retirement plans. It should not be used in connection with any offer, except in conjunction with the appropriate product prospectus which contains all pertinent information including the applicable sales, administrative and other charges.
The views expressed in the Fund’s Manager Discussion under ‘‘Why did the Fund perform this way?’’ and ‘‘What is the outlook?’’ are views of the Fund’s sub-adviser and portfolio management team through the end of the period and are subject to change based on market and other conditions.
Hartford International Opportunities HLS Fund inception 07/02/1990
| (sub-advised by Wellington Management Company, LLP) |
| Investment objective – Seeks long-term growth of capital. |
Performance Overview 6/30/02 - 6/30/12
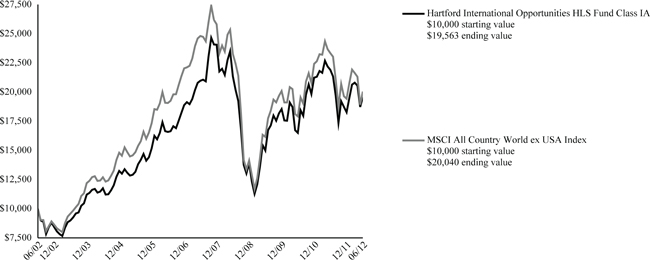
The chart above shows the growth of a $10,000 investment in Class IA. Growth results in classes other than Class IA will vary from what is seen above due to differences in the expenses charged to those share classes.
| Average Annual Total Returns (as of 6/30/12) |
| 6 Month† | 1 Year | 5 year | 10 year | |||||||||||||
| International Opportunities IA | 7.10 | % | -10.70 | % | -1.38 | % | 6.94 | % | ||||||||
| International Opportunities IB | 6.96 | % | -10.93 | % | -1.63 | % | 6.67 | % | ||||||||
| MSCI All Country World ex USA Index | 3.13 | % | -14.15 | % | -4.18 | % | 7.20 | % | ||||||||
| † | Not Annualized |
PAST PERFORMANCE IS NOT INDICATIVE OF FUTURE RESULTS.
Total returns presented above were calculated using the Fund's net asset value available to shareholders for sale or redemption of Fund shares on June 30, 2012, which may exclude investment transactions as of this date.
MSCI All Country World ex USA Index is a broad-based, unmanaged, market capitalization weighted, total return index that measures the performance of both developed and emerging stock markets, excluding the U.S. The index is calculated to exclude companies and share classes which cannot be freely purchased by foreigners.
You cannot invest directly in an index.
The chart represents a hypothetical investment in the Fund. Performance data represents past performance and current performance could be higher or lower.
Performance information may reflect historical or current expense waivers/reimbursements from the investment adviser, without which performance would have been lower. For information on current expense waivers/reimbursements, please see the prospectus.
The value of the Fund will fluctuate so that when redeemed, it may be worth more or less than the original investment. The chart and table do not reflect the deductions of taxes, sales charges or other fees which may be applied at the variable life insurance, variable annuity or qualified retirement plan product level. Any such additional sales charges or other fees or expenses would lower the contract’s or plan’s performance.
| 2 |
| Hartford International Opportunities HLS Fund |
| Manager Discussion |
| June 30, 2012 (Unaudited) |
| Portfolio Managers | ||
| Nicolas M. Choumenkovitch | Tara Connolly Stilwell, CFA | |
| Senior Vice President and Equity Portfolio Manager | Vice President and Equity Portfolio Manager | |
How did the Fund perform?
The Class IA shares of the Hartford International Opportunities HLS Fund returned 7.10% for the six-month period ended June 30, 2012, outperforming its benchmark, the MSCI All Country World ex USA Index, which returned 3.13% for the same period. The Fund also outperformed the 5.36% return of the average fund in the Lipper International Growth VP-UF Funds peer group, a group of funds with investment strategies similar to those of the Fund.
Why did the Fund perform this way?
Global equities surged in the first half of the period as markets looked past lingering uncertainty regarding eurozone sovereign debt, focusing instead on improving economic data. Strong corporate earnings news added to investors’ optimism, helping to offset heightened geopolitical risks. However, global equities reversed course during the second half of the period and fell as fears surrounding European sovereign debt once again took center stage. Growing concerns that Greece may exit the euro zone and the possibility of a banking crisis in Spain underpinned a rise in risk aversion among investors. In the U.S., economic data released during the second quarter remained subdued and included a lackluster U.S. jobs report.
During the six-month period eight out of the ten sectors in the benchmark posted positive returns, led by Consumer Discretionary (+7%), Financials (+7%), and Consumer Staples (+7%). The Energy (-6%) and Materials (-3%) sectors posted negative absolute returns during the period.
The Fund’s outperformance versus its benchmark was primarily due to strong stock selection, particularly within Industrials, Financials, and Materials. This was offset modestly by weaker selection in Consumer Staples and Telecommunication Services. Allocation among sectors, a result of the bottom-up stock selection process (i.e. stock by stock fundamental research), also contributed to positive relative returns, largely due to underweight (i.e. the Fund’s sector position was less than the benchmark position) positions in Energy and Materials.
Top contributors to relative and absolute (i.e. total return) performance during the period included Essilor International (Health Care), Continental AG (Consumer Discretionary), and Swiss Re (Financials). Essilor International is a France-based company and a global leader in making ophthalmic lenses and optical equipment. Shares rose as the company beat quarterly earnings estimates. Continental AG is a leading provider of various products and services primarily for the automotive industry worldwide. The stock rose as Continental reported another strong set of results for the first quarter led by fast topline growth, margin expansion, and good cash flow. Shares of Swiss Re, which offers reinsurance, insurance and insurance linked to financial market products, rose as the company’s quarterly results exceeded consensus estimates handily driven by strong pricing in the reinsurance industry. In addition, Swiss Re sold its U.S. business, improving the return on equity of its business and returning capital to shareholders to pay a special dividend in 2012.
The largest detractors from relative returns (i.e. performance of the Fund as measured against the benchmark) were Vodafone Group (telecommunication services), Tesco (consumer staples), and Volvo (industrials). Shares of U.K.-based global mobile communications company Vodafone Group declined modestly with overall weakness in Europe. We eliminated our position during the period. Shares of Tesco, a U.K.-based multinational food and general merchandise retailer, dropped as the market in the U.K. deteriorated and investors feared a weak profit outlook. We eliminated our holding during the period. Shares of Volvo, a Sweden-based maker of cars and trucks with exposure to the construction cycle, underperformed due to cyclical weakness and strains in Europe. Check Point Software (information technology) also detracted from absolute performance.
What is the outlook?
At a macro level, we continue to see signs of economic improvement in the developed world, which we expect to remain in a low growth environment and with low interest rates. While we believe the risk of a sharp economic decline is reduced, we strive to maintain a well-balanced portfolio with investments that represent diverse economic drivers.
As is consistent with the investment approach, we continue to look for opportunities at a company-by-company level, focusing on those companies which we believe can deliver improvements in Return on Invested Capital (ROIC) or sustain ROIC for longer than the market anticipates. At the end of the period, we were most overweight to Industrials and Health Care, and most underweight to Telecommunication Services and Financials, relative to the benchmark. On a regional basis, we ended the period with an overweight to select European countries, including France, Switzerland, and Ireland. We
| 3 |
| Hartford International Opportunities HLS Fund |
| Manager Discussion – (continued) |
| June 30, 2012 (Unaudited) |
maintained underweight positions in select Asian countries, including Australia, Japan, and South Korea.
Diversification by Industry
as of June 30, 2012
| Industry (Sector) | Percentage of Net Assets | |||
| Automobiles & Components (Consumer Discretionary) | 2.6 | % | ||
| Banks (Financials) | 3.7 | |||
| Capital Goods (Industrials) | 10.9 | |||
| Commercial & Professional Services (Industrials) | 1.1 | |||
| Consumer Durables & Apparel (Consumer Discretionary) | 0.5 | |||
| Consumer Services (Consumer Discretionary) | 6.4 | |||
| Diversified Financials (Financials) | 1.0 | |||
| Energy (Energy) | 9.6 | |||
| Food & Staples Retailing (Consumer Staples) | 1.0 | |||
| Food, Beverage & Tobacco (Consumer Staples) | 9.4 | |||
| Health Care Equipment & Services (Health Care) | 2.1 | |||
| Household & Personal Products (Consumer Staples) | 0.4 | |||
| Insurance (Financials) | 5.4 | |||
| Materials (Materials) | 8.5 | |||
| Pharmaceuticals, Biotechnology & Life Sciences (Health Care) | 7.4 | |||
| Real Estate (Financials) | 9.1 | |||
| Retailing (Consumer Discretionary) | 1.3 | |||
| Semiconductors & Semiconductor Equipment (Information Technology) | 5.5 | |||
| Software & Services (Information Technology) | 1.2 | |||
| Technology Hardware & Equipment (Information Technology) | 1.1 | |||
| Telecommunication Services (Services) | 1.2 | |||
| Transportation (Industrials) | 4.0 | |||
| Utilities (Utilities) | 5.1 | |||
| Short-Term Investments | 1.3 | |||
| Other Assets and Liabilities | 0.2 | |||
| Total | 100.0 | % | ||
| 4 |
| Hartford International Opportunities HLS Fund |
| Schedule of Investments |
| June 30, 2012 (Unaudited) |
| (000’s Omitted) |
| Shares or Principal Amount | Market Value ╪ | |||||||
| COMMON STOCKS - 98.5% | ||||||||
| Australia - 1.6% | ||||||||
| 2,361 | Westfield Group | $ | 23,115 | |||||
| Belgium - 1.7% | ||||||||
| 527 | Umicore | 24,365 | ||||||
| Brazil - 3.2% | ||||||||
| 1,553 | BR Malls Participacoes S.A. | 17,593 | ||||||
| 715 | CCR S.A. | 5,802 | ||||||
| 1,292 | JSL S.A. | 5,919 | ||||||
| 282 | Localiza Rent a Car S.A. | 4,245 | ||||||
| 587 | Petroleo Brasileiro S.A. ADR | 11,022 | ||||||
| 286 | Raia Drogasil S.A. | 2,864 | ||||||
| 47,445 | ||||||||
| Canada - 6.8% | ||||||||
| 438 | Canadian National Railway Co. | 37,008 | ||||||
| 328 | Canadian Natural Resources Ltd. ☼ | 8,798 | ||||||
| 885 | EnCana Corp. | 18,426 | ||||||
| 167 | MEG Energy Corp. ● | 5,996 | ||||||
| 561 | Tim Hortons, Inc. | 29,584 | ||||||
| 99,812 | ||||||||
| Chile - 0.6% | ||||||||
| 488 | Enersis S.A. ADR ‡ | 9,120 | ||||||
| China - 2.0% | ||||||||
| 7,238 | China Pacific Insurance | 23,620 | ||||||
| 4,092 | Dongfeng Motor Group Co., Ltd. | 6,396 | ||||||
| 30,016 | ||||||||
| Finland - 0.9% | ||||||||
| 129 | Kone Oyj Class B | 7,762 | ||||||
| 157 | Nokian Rendaat Oyj | 5,948 | ||||||
| 13,710 | ||||||||
| France - 14.9% | ||||||||
| 180 | Accor S.A. | 5,640 | ||||||
| 321 | Air Liquide | 36,699 | ||||||
| 329 | BNP Paribas | 12,672 | ||||||
| 90 | Bureau Veritas S.A. | 7,987 | ||||||
| 299 | Cie Generale d'Optique Essilor International S.A. | 27,738 | ||||||
| 629 | Groupe Danone | 39,070 | ||||||
| 336 | Pernod-Ricard | 35,932 | ||||||
| 530 | Safran S.A. | 19,665 | ||||||
| 176 | Unibail-Rodamco SE | 32,417 | ||||||
| 217,820 | ||||||||
| Germany - 3.3% | ||||||||
| 211 | Continental AG | 17,628 | ||||||
| 285 | GSW Immobilien AG ● | 9,743 | ||||||
| 3,093 | Infineon Technologies AG | 20,934 | ||||||
| 48,305 | ||||||||
| Hong Kong - 4.5% | ||||||||
| 6,867 | AIA Group Ltd. | 23,720 | ||||||
| 1,868 | ENN Energy Holdings Ltd. | 6,594 | ||||||
| 579 | Hengan International Group Co., Ltd. | 5,640 | ||||||
| 4,496 | Sands China Ltd. § | 14,463 | ||||||
| 6,297 | Shangri-La Asia Ltd. | 12,096 | ||||||
| 2,516 | Zhongsheng Group Holdings Ltd. | 3,075 | ||||||
| 65,588 | ||||||||
| India - 1.3% | ||||||||
| 767 | Bharti Televentures | 4,222 | ||||||
| 3,222 | ITC Ltd. | 15,002 | ||||||
| 19,224 | ||||||||
| Ireland - 2.4% | ||||||||
| 871 | CRH plc | 16,798 | ||||||
| 1,208 | Elan Corp. plc ADR ● | 17,623 | ||||||
| 34,421 | ||||||||
| Israel - 0.9% | ||||||||
| 217 | Check Point Software Technologies Ltd. ADR ● | 10,761 | ||||||
| 75 | Teva Pharmaceutical Industries Ltd. ADR | 2,942 | ||||||
| 13,703 | ||||||||
| Italy - 1.5% | ||||||||
| 5,064 | Snam S.p.A. | 22,689 | ||||||
| Japan - 11.9% | ||||||||
| 206 | Acom Co., Ltd. | 4,084 | ||||||
| 352 | Daiichi Sankyo Co., Ltd. | 5,939 | ||||||
| 337 | Daito Trust Construction Co., Ltd. | 31,907 | ||||||
| 320 | Eisai Co., Ltd. | 14,009 | ||||||
| 256 | FamilyMart Co., Ltd. | 11,721 | ||||||
| 198 | Fanuc Corp. | 32,580 | ||||||
| 18 | Fast Retailing Co., Ltd. | 3,502 | ||||||
| 1 | Inpex Corp. | 8,352 | ||||||
| 216 | LIXIL Group Corp. | 4,567 | ||||||
| 5,446 | Mitsubishi UFJ Financial Group, Inc. | 26,091 | ||||||
| 933 | Mitsui Fudosan Co., Ltd. | 18,103 | ||||||
| 1,241 | Rakuten, Inc. | 12,825 | ||||||
| 173,680 | ||||||||
| Malaysia - 0.4% | ||||||||
| 4,584 | AirAsia Berhad | 5,189 | ||||||
| Netherlands - 1.9% | ||||||||
| 253 | ASML Holding N.V. ADR | 13,014 | ||||||
| 1,095 | ING Groep N.V. ● | 7,339 | ||||||
| 386 | Yandex N.V. ● | 7,359 | ||||||
| 27,712 | ||||||||
| Norway - 1.3% | ||||||||
| 230 | Algeta ASA ● | 6,581 | ||||||
| 766 | Telenor ASA | 12,805 | ||||||
| 19,386 | ||||||||
| Russia - 0.5% | ||||||||
| 721 | Sberbank ADR ● | 7,804 | ||||||
| South Korea - 1.9% | ||||||||
| 38 | Hyundai Motor Co., Ltd. | 7,766 | ||||||
| 18 | Samsung Electronics Co., Ltd. | 19,511 | ||||||
| 27,277 | ||||||||
| Spain - 0.4% | ||||||||
| 385 | Repsol YPF S.A. | 6,184 | ||||||
| Sweden - 3.8% | ||||||||
| 1,103 | Assa Abloy Ab | 30,798 | ||||||
| 246 | Skf Ab B Shares | 4,845 | ||||||
| 1,783 | Volvo Ab Class B | 20,385 | ||||||
| 56,028 | ||||||||
| Switzerland - 8.9% | ||||||||
| 142 | Actelion Ltd. | 5,843 | ||||||
| 133 | Cie Financiere Richemont S.A. | 7,293 | ||||||
The accompanying notes are an integral part of these financial statements.
| 5 |
| Hartford International Opportunities HLS Fund |
| Schedule of Investments – (continued) |
| June 30, 2012 (Unaudited) |
| (000’s Omitted) |
| Shares or Principal Amount | Market Value ╪ | |||||||||||
| COMMON STOCKS - 98.5% - (continued) | ||||||||||||
| Switzerland - 8.9% - (continued) | ||||||||||||
| 28 | Givaudan | $ | 27,563 | |||||||||
| 259 | Roche Holding AG | 44,824 | ||||||||||
| 5 | SGS S.A. | 8,946 | ||||||||||
| 517 | Swiss Re Ltd. | 32,619 | ||||||||||
| 307 | UBS AG | 3,592 | ||||||||||
| 130,680 | ||||||||||||
| Taiwan - 3.4% | ||||||||||||
| 605 | Hiwin Technologies Corp. | 6,213 | ||||||||||
| 2,761 | Quanta Computer, Inc. | 7,414 | ||||||||||
| 3,873 | Synnex Technology International Corp. | 9,478 | ||||||||||
| 9,714 | Taiwan Semiconductor Manufacturing Co., Ltd. | 26,592 | ||||||||||
| 49,697 | ||||||||||||
| United Kingdom - 17.1% | ||||||||||||
| 235 | AstraZeneca plc | 10,480 | ||||||||||
| 1,877 | BG Group plc | 38,415 | ||||||||||
| 3,290 | BP plc | 21,969 | ||||||||||
| 524 | British American Tobacco plc | 26,628 | ||||||||||
| 462 | Ensco plc | 21,681 | ||||||||||
| 548 | Imperial Tobacco Group plc | 21,120 | ||||||||||
| 478 | Intercontinental Hotels Group | 11,501 | ||||||||||
| 3,451 | National Grid plc | 36,572 | ||||||||||
| 1,018 | NMC Health plc | 3,038 | ||||||||||
| 401 | Rio Tinto plc | 19,055 | ||||||||||
| 2,455 | Rolls-Royce Holdings plc | 33,092 | ||||||||||
| 332 | Standard Chartered plc | 7,214 | ||||||||||
| 250,765 | ||||||||||||
| United States - 1.4% | ||||||||||||
| 590 | Carnival Corp. | 20,216 | ||||||||||
| Total common stocks | ||||||||||||
| (cost $1,415,616) | $ | 1,443,951 | ||||||||||
| Total long-term investments | ||||||||||||
| (cost $1,415,616) | $ | 1,443,951 | ||||||||||
| SHORT-TERM INVESTMENTS - 1.3% | ||||||||||||
| Repurchase Agreements - 1.3% | ||||||||||||
| Bank of America Merrill Lynch TriParty Joint Repurchase Agreement (maturing on 07/02/2012 in the amount of $9,933, collateralized by FHLMC 5.50% - 6.50%, 2035 - 2036, FNMA 5.00% - 6.00%, 2033 - 2039, value of $10,132) | ||||||||||||
| $ | 9,933 | 0.13%, 06/29/2012 | $ | 9,933 | ||||||||
| Barclays Capital TriParty Joint Repurchase Agreement (maturing on 07/02/2012 in the amount of $3,591, collateralized by U.S. Treasury Note 1.25% - 3.63%, 2014 - 2020, value of $3,663) | ||||||||||||
| 3,591 | 0.15%, 06/29/2012 | 3,591 | ||||||||||
| Deutsche Bank Securities TriParty Joint Repurchase Agreement (maturing on 07/02/2012 in the amount of $962, collateralized by U.S. Treasury Note 0.88%, 2016, value of $981) | ||||||||||||
| 962 | 0.20%, 06/29/2012 | 962 | ||||||||||
| TD Securities TriParty Joint Repurchase Agreement (maturing on 07/02/2012 in the amount of $2,812, collateralized by FHLMC 4.00% - 6.00%, 2027 - 2041, FNMA 4.00% - 4.50%, 2025 - 2042, U.S. Treasury Bond 6.38%, 2027, U.S. Treasury Note 0.38% - 8.75%, 2012 - 2017, value of $2,868) | ||||||||||||
| 2,812 | 0.15%, 06/29/2012 | 2,812 | ||||||||||
| UBS Securities, Inc. Joint Repurchase Agreement (maturing on 07/02/2012 in the amount of $1, collateralized by U.S. Treasury Note 1.00%, 2013, value of $1) | ||||||||||||
| 1 | 0.13%, 06/29/2012 | 1 | ||||||||||
| UBS Securities, Inc. TriParty Joint Repurchase Agreement (maturing on 07/02/2012 in the amount of $1,267, collateralized by GNMA 4.00%, 2042, value of $1,292) | ||||||||||||
| 1,267 | 0.20%, 06/29/2012 | 1,267 | ||||||||||
| 18,566 | ||||||||||||
| Total short-term investments | ||||||||||||
| (cost $18,566) | $ | 18,566 | ||||||||||
| Total investments | ||||||||||||
| (cost $1,434,182) ▲ | 99.8% | $ | 1,462,517 | |||||||||
| Other assets and liabilities | 0.2% | 2,761 | ||||||||||
| Total net assets | 100.0% | $ | 1,465,278 | |||||||||
The accompanying notes are an integral part of these financial statements.
| 6 |
| Note: | Percentage of investments as shown is the ratio of the total market value to total net assets. |
Prices of foreign equities that are principally traded on certain foreign markets may be adjusted daily pursuant to a fair value pricing service approved by the Board of Directors in order to reflect an adjustment for factors occurring after the close of certain foreign markets but before the close of the New York Stock Exchange.
| ▲ | At June 30, 2012, the cost of securities for federal income tax purposes was $1,452,641 and the aggregate gross unrealized appreciation and depreciation based on that cost were: |
| Unrealized Appreciation | $ | 80,365 | ||
| Unrealized Depreciation | (70,489 | ) | ||
| Net Unrealized Appreciation | $ | 9,876 |
| ● | Non-income producing. |
| § | These securities were sold to the Fund under Regulation S, rules governing offers and sales made outside the United States without registration under the Securities Act of 1933. The Fund may only be able to resell these securities in the United States if an exemption from registration under the federal and state securities laws is available, or the Fund may only be able to sell these securities outside of the United States (such as on a foreign exchange) to a non-U.S. person. Unless otherwise indicated, these holdings are determined to be liquid. At June 30, 2012, the aggregate value of these securities was $14,463, which represents 1.0% of total net assets. |
| ☼ | This security, or a portion of this security, was purchased on a when-issued, delayed delivery or delayed draw basis. The cost of these securities was $2,829 at June 30, 2012. |
| ‡ | This security, or a portion of this security, has been segregated to cover funding requirements on investment transactions settling in the future. |
Foreign Currency Contracts Outstanding at June 30, 2012
| Description | Counterparty | Buy / Sell | Market Value ╪ | Contract Amount | Delivery Date | Unrealized Appreciation/ (Depreciation) | ||||||||||||
| AUD | CBK | Sell | $ | 7,283 | $ | 6,918 | 09/06/2012 | $ | (365 | ) | ||||||||
| CAD | BCLY | Buy | 2,829 | 2,808 | 07/03/2012 | 21 | ||||||||||||
| CAD | CSFB | Sell | 4,003 | 4,075 | 08/09/2012 | 72 | ||||||||||||
| CAD | GSC | Sell | 15,174 | 15,457 | 08/09/2012 | 283 | ||||||||||||
| CAD | UBS | Sell | 11,171 | 11,376 | 08/09/2012 | 205 | ||||||||||||
| CHF | CSFB | Buy | 1,464 | 1,464 | 07/03/2012 | – | ||||||||||||
| EUR | BNP | Buy | 3,483 | 3,485 | 07/03/2012 | (2 | ) | |||||||||||
| GBP | BCLY | Sell | 2,716 | 2,714 | 07/05/2012 | (2 | ) | |||||||||||
| GBP | JPM | Buy | 1,268 | 1,254 | 07/03/2012 | 14 | ||||||||||||
| HKD | CBK | Buy | 152 | 152 | 07/03/2012 | – | ||||||||||||
| HKD | CSFB | Sell | 4,184 | 4,184 | 07/05/2012 | – | ||||||||||||
| JPY | BNP | Sell | 1,381 | 1,387 | 07/05/2012 | 6 | ||||||||||||
| $ | 232 | |||||||||||||||||
| ╪ | See Significant Accounting Policies of accompanying Notes to Financial Statements regarding valuation of securities. |
The accompanying notes are an integral part of these financial statements.
| 7 |
Hartford International Opportunities HLS Fund
Schedule of Investments – (continued)
June 30, 2012 (Unaudited)
(000’s Omitted)
| GLOSSARY: (abbreviations used in preceding Schedule of Investments) | |
| Counterparty Abbreviations: | |
| BCLY | Barclays |
| BNP | BNP Paribas Securities |
| CBK | Citibank NA |
| CSFB | Credit Suisse First Boston Corp. |
| GSC | Goldman Sachs & Co. |
| JPM | JP Morgan Chase & Co. |
| UBS | UBS AG |
| Currency Abbreviations: | |
| AUD | Australian Dollar |
| CAD | Canadian Dollar |
| CHF | Swiss Franc |
| EUR | EURO |
| GBP | British Pound |
| HKD | Hong Kong Dollar |
| JPY | Japanese Yen |
| Other Abbreviations: | |
| ADR | American Depositary Receipt |
| FHLMC | Federal Home Loan Mortgage Corp. |
| FNMA | Federal National Mortgage Association |
| GNMA | Government National Mortgage Association |
The accompanying notes are an integral part of these financial statements.
| 8 |
Hartford International Opportunities HLS Fund
Investment Valuation Hierarchy Level Summary
June 30, 2012 (Unaudited)
(000’s Omitted)
| Total | Level 1 ♦ | Level 2 ♦ | Level 3 | |||||||||||||
| Assets: | ||||||||||||||||
| Common Stocks | ||||||||||||||||
| Australia | $ | 23,115 | $ | – | $ | 23,115 | $ | – | ||||||||
| Belgium | 24,365 | – | 24,365 | – | ||||||||||||
| Brazil | 47,445 | 47,445 | – | – | ||||||||||||
| Canada | 99,812 | 99,812 | – | – | ||||||||||||
| Chile | 9,120 | 9,120 | – | – | ||||||||||||
| China | 30,016 | – | 30,016 | – | ||||||||||||
| Finland | 13,710 | – | 13,710 | – | ||||||||||||
| France | 217,820 | – | 217,820 | – | ||||||||||||
| Germany | 48,305 | – | 48,305 | – | ||||||||||||
| Hong Kong | 65,588 | – | 65,588 | – | ||||||||||||
| India | 19,224 | – | 19,224 | – | ||||||||||||
| Ireland | 34,421 | 17,623 | 16,798 | – | ||||||||||||
| Israel | 13,703 | 13,703 | – | – | ||||||||||||
| Italy | 22,689 | – | 22,689 | – | ||||||||||||
| Japan | 173,680 | – | 173,680 | – | ||||||||||||
| Malaysia | 5,189 | – | 5,189 | – | ||||||||||||
| Netherlands | 27,712 | 20,373 | 7,339 | – | ||||||||||||
| Norway | 19,386 | – | 19,386 | – | ||||||||||||
| Russia | 7,804 | 7,804 | – | – | ||||||||||||
| South Korea | 27,277 | – | 27,277 | – | ||||||||||||
| Spain | 6,184 | – | 6,184 | – | ||||||||||||
| Sweden | 56,028 | – | 56,028 | – | ||||||||||||
| Switzerland | 130,680 | – | 130,680 | – | ||||||||||||
| Taiwan | 49,697 | – | 49,697 | – | ||||||||||||
| United Kingdom | 250,765 | 24,719 | 226,046 | – | ||||||||||||
| United States | 20,216 | 20,216 | – | – | ||||||||||||
| Total | 1,443,951 | 260,815 | 1,183,136 | – | ||||||||||||
| Short-Term Investments | 18,566 | – | 18,566 | – | ||||||||||||
| Total | $ | 1,462,517 | $ | 260,815 | $ | 1,201,702 | $ | – | ||||||||
| Foreign Currency Contracts* | 601 | – | 601 | – | ||||||||||||
| Total | $ | 601 | $ | – | $ | 601 | $ | – | ||||||||
| Liabilities: | ||||||||||||||||
| Foreign Currency Contracts* | 369 | – | 369 | – | ||||||||||||
| Total | $ | 369 | $ | – | $ | 369 | $ | – | ||||||||
| ♦ | For the six-month period ended June 30, 2012, there were no transfers between Level 1 and Level 2. |
| * | Derivative instruments not reflected in the Schedule of Investments are valued at the unrealized appreciation/depreciation on the investments. |
The accompanying notes are an integral part of these financial statements.
| 9 |
Hartford International Opportunities HLS Fund
Statement of Assets and Liabilities
June 30, 2012 (Unaudited)
(000’s Omitted)
| Assets: | ||||
| Investments in securities, at market value (cost $1,434,182) | $ | 1,462,517 | ||
| Cash | 1 | |||
| Unrealized appreciation on foreign currency contracts | 601 | |||
| Receivables: | ||||
| Investment securities sold | 13,478 | |||
| Fund shares sold | 545 | |||
| Dividends and interest | 4,085 | |||
| Total assets | 1,481,227 | |||
| Liabilities: | ||||
| Unrealized depreciation on foreign currency contracts | 369 | |||
| Bank overdraft - foreign cash | 1 | |||
| Payables: | ||||
| Investment securities purchased | 14,219 | |||
| Fund shares redeemed | 1,084 | |||
| Investment management fees | 133 | |||
| Distribution fees | 7 | |||
| Accrued expenses | 136 | |||
| Total liabilities | 15,949 | |||
| Net assets | $ | 1,465,278 | ||
| Summary of Net Assets: | ||||
| Capital stock and paid-in-capital | $ | 2,138,886 | ||
| Undistributed net investment income | 49,043 | |||
| Accumulated net realized loss | (751,197 | ) | ||
| Unrealized appreciation of investments and the translations of assets and liabilities denominated in foreign currency | 28,546 | |||
| Net assets | $ | 1,465,278 | ||
| Shares authorized | 2,625,000 | |||
| Par value | $ | 0.001 | ||
| Class IA: Net asset value per share | $ | 11.48 | ||
| Shares outstanding | 108,627 | |||
| Net assets | $ | 1,246,592 | ||
| Class IB: Net asset value per share | $ | 11.57 | ||
| Shares outstanding | 18,896 | |||
| Net assets | $ | 218,686 |
The accompanying notes are an integral part of these financial statements.
| 10 |
Hartford International Opportunities HLS Fund
Statement of Operations
For the Six-Month Period Ended June 30, 2012 (Unaudited)
(000’s Omitted)
| Investment Income: | ||||
| Dividends | $ | 30,170 | ||
| Interest | 30 | |||
| Less: Foreign tax withheld | (3,272 | ) | ||
| Total investment income, net | 26,928 | |||
| Expenses: | ||||
| Investment management fees | 5,309 | |||
| Transfer agent fees | 2 | |||
| Distribution fees - Class IB | 296 | |||
| Custodian fees | 69 | |||
| Accounting services fees | 125 | |||
| Board of Directors' fees | 20 | |||
| Audit fees | 11 | |||
| Other expenses | 210 | |||
| Total expenses (before fees paid indirectly) | 6,042 | |||
| Commission recapture | (23 | ) | ||
| Total fees paid indirectly | (23 | ) | ||
| Total expenses, net | 6,019 | |||
| Net investment income | 20,909 | |||
| Net Realized Loss on Investments and Foreign Currency Transactions: | ||||
| Net realized loss on investments | (10,268 | ) | ||
| Net realized loss on foreign currency contracts | (1,442 | ) | ||
| Net realized gain on other foreign currency transactions | 783 | |||
| Net Realized Loss on Investments and Foreign Currency Transactions | (10,927 | ) | ||
| Net Changes in Unrealized Appreciation of Investments and Foreign Currency Transactions: | ||||
| Net unrealized appreciation of investments | 100,130 | |||
| Net unrealized appreciation of foreign currency contracts | 240 | |||
| Net unrealized appreciation on translation of other assets and liabilities in foreign currencies | 29 | |||
| Net Changes in Unrealized Appreciation of Investments and Foreign Currency Transactions | 100,399 | |||
| Net Gain on Investments and Foreign Currency Transactions | 89,472 | |||
| Net Increase in Net Assets Resulting from Operations | $ | 110,381 |
The accompanying notes are an integral part of these financial statements.
| 11 |
Hartford International Opportunities HLS Fund
Statement of Changes in Net Assets
(000’s Omitted)
| For the Six-Month Period Ended June 30, 2012 (Unaudited) | For the Year Ended December 31, 2011 | |||||||
| Operations: | ||||||||
| Net investment income | $ | 20,909 | $ | 29,682 | ||||
| Net realized gain (loss) on investments and foreign currency transactions | (10,927 | ) | 5,344 | |||||
| Net unrealized appreciation (depreciation) of investments and foreign currency transactions | 100,399 | (293,187 | ) | |||||
| Net Increase (Decrease) In Net Assets Resulting From Operations | 110,381 | (258,161 | ) | |||||
| Distributions to Shareholders: | ||||||||
| From net investment income | ||||||||
| Class IA | — | (686 | ) | |||||
| Class IB | — | (122 | ) | |||||
| Total distributions | — | (808 | ) | |||||
| Capital Share Transactions: | ||||||||
| Class IA | ||||||||
| Sold | 35,259 | 151,842 | ||||||
| Issued on reinvestment of distributions | — | 686 | ||||||
| Redeemed | (170,182 | ) | (351,186 | ) | ||||
| Total capital share transactions | (134,923 | ) | (198,658 | ) | ||||
| Class IB | ||||||||
| Sold | 11,806 | 34,174 | ||||||
| Issued on reinvestment of distributions | — | 122 | ||||||
| Redeemed | (42,610 | ) | (90,473 | ) | ||||
| Total capital share transactions | (30,804 | ) | (56,177 | ) | ||||
| Net decrease from capital share transactions | (165,727 | ) | (254,835 | ) | ||||
| Net Decrease In Net Assets | (55,346 | ) | (513,804 | ) | ||||
| Net Assets: | ||||||||
| Beginning of period | 1,520,624 | 2,034,428 | ||||||
| End of period | $ | 1,465,278 | $ | 1,520,624 | ||||
| Undistributed (distribution in excess of) net investment income | $ | 49,043 | $ | 28,134 | ||||
| Shares: | ||||||||
| Class IA | ||||||||
| Sold | 3,066 | 12,594 | ||||||
| Issued on reinvestment of distributions | — | 62 | ||||||
| Redeemed | (14,633 | ) | (29,342 | ) | ||||
| Total share activity | (11,567 | ) | (16,686 | ) | ||||
| Class IB | ||||||||
| Sold | 1,016 | 2,865 | ||||||
| Issued on reinvestment of distributions | — | 11 | ||||||
| Redeemed | (3,628 | ) | (7,424 | ) | ||||
| Total share activity | (2,612 | ) | (4,548 | ) | ||||
The accompanying notes are an integral part of these financial statements.
| 12 |
| Hartford International Opportunities HLS Fund |
| Notes to Financial Statements |
| June 30, 2012 (Unaudited) |
| (000’s Omitted) |
| 1. | Organization: |
Hartford International Opportunities HLS Fund (the “Fund”) serves as an underlying investment option for certain variable annuity and variable life insurance separate accounts of Hartford Life Insurance Company (“HLIC”) and its affiliates and certain qualified retirement plans. The Fund may also serve as an underlying investment option for certain variable annuity and variable life separate accounts of other insurance companies. Owners of variable annuity contracts and policyholders of variable life insurance contracts may choose the funds permitted in the variable insurance contract prospectus. In addition, participants in certain qualified retirement plans may choose the Fund if permitted by their plans.
Hartford Series Fund, Inc. (the “Company”) is an open-end registered management investment company comprised of thirty portfolios. Financial Statements for the Fund, a series of the Company, are included in this report.
The Company is organized under the laws of the State of Maryland and is registered with the Securities and Exchange Commission (“SEC”) under the Investment Company Act of 1940, as amended (“1940 Act”). The Fund is a diversified open-end management investment company.
The Fund is divided into Class IA and Class IB shares. Each class is offered at the per share net asset value (“NAV”) without a sales charge and is subject to the same expenses, except that the Class IB shares are subject to distribution and service fees charged pursuant to a Distribution Plan adopted in accordance with Rule 12b-1 under the 1940 Act.
| 2. | Significant Accounting Policies: |
The following is a summary of significant accounting policies of the Fund in the preparation of its financial statements, which are in accordance with the United States Generally Accepted Accounting Principles (“U.S. GAAP”). The preparation of financial statements in accordance with U.S. GAAP may require management to make estimates and assumptions that affect the reported amounts of assets and liabilities and disclosure of contingent assets and liabilities at the date of the financial statements and the reported amounts of increases and decreases in net assets from operations during the reporting period. Actual results could differ from those estimates.
| a) | Determination of Net Asset Value – The NAV of each class of the Fund’s shares is determined as of the close of regular trading (normally 4:00 p.m. Eastern Time) (the “NYSE Close”) on each day that the New York Stock Exchange (the “Exchange”) is open (“Valuation Date”). Information that becomes known to the Fund after the NAV has been calculated on a particular day will not generally be used to retroactively adjust the NAV determined earlier that day. |
| b) | Investment Valuation and Fair Value Measurements – For purposes of calculating the NAV, portfolio investments and other assets held by the Fund's portfolio for which market quotes are readily available are valued at market value. Market value is generally determined on the basis of last reported sales prices or official close price. If no sales are reported, market value is based on quotes obtained from a quotation reporting system, established market makers, or independent pricing services. If market prices are not readily available or are deemed unreliable, the Fund will use the fair value of the investment as determined in good faith under policies and procedures established by and under the supervision of the Company’s Board of Directors. Market quotes are considered not readily available where there is an absence of current or reliable market-based data (e.g., trade information or broker quotes), including where events occur after the close of the relevant market, but prior to the NYSE Close that materially affect the values of the Fund’s portfolio investments or assets. In addition, market quotes are considered not readily available when, due to extraordinary circumstances, the exchanges or markets on which the investments trade do not open for trading for the entire day and no other market prices are available. In addition, prices of foreign equities that are principally traded on certain foreign markets are adjusted daily pursuant to a fair value pricing service approved by the Board of Directors in order to reflect an adjustment for the factors occurring after the close of certain foreign markets but before the NYSE Close. Investments that are primarily traded on foreign markets may trade on days that are not business days of the Fund. The value of the foreign investments in which the Fund invests may change on days when a shareholder will not be able to purchase or |
| 13 |
| Hartford International Opportunities HLS Fund |
| Notes to Financial Statements – (continued) |
| June 30, 2012 (Unaudited) |
| (000’s Omitted) |
redeem shares of the Fund. Fair value pricing is subjective in nature and the use of fair value pricing by the Fund may cause the NAV of its shares to differ significantly from the NAV that would have been calculated using market prices at the close of the exchange on which a portfolio investment is primarily traded. There can be no assurance that the Fund could obtain the fair market value assigned to an investment if the Fund were to sell the investment at approximately the time at which the Fund determines its NAV.
Investments valued in currencies other than U.S. dollars are converted to U.S. dollars using exchange rates obtained from independent pricing services for calculation of the NAV. As a result, the NAV of the Fund’s shares may be affected by changes in the value of currencies in relation to the U.S. dollar. The value of investments traded in markets outside the United States or denominated in currencies other than the U.S. dollar may be affected significantly on a day that the NYSE is closed and the market value may change on days when an investor is not able to purchase, redeem or exchange shares of the Fund.
Foreign currency contracts represent agreements to exchange currencies on specific future dates at predetermined rates. Foreign currency contracts are valued using foreign currency exchange rates and forward rates as provided by an independent pricing service on the Valuation Date.
Financial instruments for which prices are not available from an independent pricing service may be valued using market quotations obtained from one or more dealers that make markets in the respective financial instrument in accordance with procedures established by the Company’s Board of Directors.
U.S. GAAP defines fair value as the price that the Fund would receive to sell an asset or pay to transfer a liability in an orderly transaction between market participants. The U.S. GAAP fair value measurement standards require disclosure of a fair value hierarchy for each major category of assets and liabilities. Various inputs are used in determining the fair value of the Fund’s investments. These inputs are summarized into three broad hierarchy levels. This hierarchy is based on whether the valuation inputs are observable or unobservable. These levels are:
| · | Level 1 – Quoted prices in active markets for identical investments. Level 1 may include exchange traded instruments, such as domestic equities, some foreign equities, options, futures, mutual funds, exchange traded funds, rights and warrants. |
| · | Level 2 – Observable inputs other than Level 1 prices, such as quoted prices for similar investments; quoted prices in markets that are not active; or other inputs that are observable or can be corroborated by observable market data. Level 2 may include debt investments that are traded less frequently than exchange traded instruments and which are valued using independent pricing services; foreign equities, which are principally traded on certain foreign markets and are adjusted daily pursuant to a fair value pricing service in order to reflect an adjustment for the factors occurring after the close of certain foreign markets but before the NYSE Close; and short-term investments, which are valued at amortized cost. |
| · | Level 3 – Significant unobservable inputs that are supported by limited or no market activity. Level 3 may include financial instruments whose values are determined using indicative market quotes or require significant management judgment or estimation. These unobservable valuation inputs may include estimates for current yields, maturity/duration, prepayment speed, and indicative market quotes for comparable investments along with other assumptions relating to credit quality, collateral value, complexity of the investment structure, general market conditions and liquidity. This category may include investments where trading has been halted or there are certain restrictions on trading. While these investments are priced using unobservable inputs, the valuation of these investments reflects the best available data and management believes the prices are a reasonable representation of exit price. |
The Board of Directors of the Company generally reviews and approves the “Procedures for Valuation of Portfolio Securities” on an annual basis. These procedures define how investments are to be valued, including the formation of a Valuation Committee. The Valuation Committee is responsible for determining in good faith
| 14 |
the fair value of investments when the value cannot be obtained from primary pricing services or alternative sources or if the valuation of an investment as provided by the primary pricing service or alternative source is believed not to reflect the investment’s fair value as of the Valuation Date. Members of the Valuation Committee include the Fund’s Treasurer or designee, a Vice President of the Funds with legal expertise or designee, and a Vice President of the investment manager or designee. In addition, the Fund’s chief compliance officer shall designate a member of the compliance group to attend Valuation Committee meetings as a non-voting resource, to monitor for and provide guidance with respect to compliance with these procedures. Two members of the Valuation Committee or their designees, representing different departments, shall constitute a quorum for purposes of permitting the Valuation Committee to take action. The Valuation Committee will consider all relevant factors in determining an investment’s fair value, and may seek the advice of the Fund’s sub-adviser, knowledgeable brokers and legal counsel in making such determination. The Valuation Committee reports to the Audit Committee of the Company’s Board of Directors. The Audit Committee receives quarterly written reports which include details of all fair-valued investments, including the reason for the fair valuation, and an indication, when possible, of the accuracy of the valuation by disclosing the next available reliable public price quotation or the disposition price of such investments (the “look-back” test). The Board of Directors then must consider for ratification all of the fair value determinations made during the previous quarter.
Valuation levels are not necessarily indicative of the risk associated with investing in such investments. Individual investments within any of the above mentioned asset classes may be assigned a different hierarchical level than those presented above, as individual circumstances dictate.
For additional information, refer to the Investment Valuation Hierarchy Level Summary.
For purposes of reporting transfers between different hierarchy levels, both transfers in and out of each level, as applicable, are shown as if they occurred at the beginning of the period.
| c) | Investment Transactions and Investment Income – Investment transactions are recorded as of the trade date (the date the order to buy or sell is executed) for financial reporting purposes. Investments purchased or sold on a when-issued or delayed-delivery basis may be settled a month or more after the trade date. Realized gains and losses are determined on the basis of identified cost. |
Dividend income is accrued as of the ex-dividend date, except certain dividends from foreign investments where the ex-dividend date may have passed are recorded as soon as the Fund is informed of the dividend. Interest income, including amortization of premium and accretion of discounts, is accrued on a daily basis.
| d) | Foreign Currency Transactions – Assets and liabilities denominated in currencies other than U.S. dollars are translated into U.S. dollars at the exchange rates in effect on the valuation date. Purchases and sales of investments, income, and expenses are translated into U.S. dollars at the exchange rates on the dates of such transactions. |
The Fund does not isolate that portion of portfolio investment valuation resulting from fluctuations in the foreign currency exchange rates from the fluctuations arising from changes in the market prices of investments held. Exchange rate fluctuations are included with the net realized and unrealized gain or loss on investments in the accompanying financial statements.
Net realized foreign exchange gains or losses arise from sales of foreign currencies and the difference between asset and liability amounts initially stated in foreign currencies and the U.S. dollar value of the amounts actually received or paid. Net unrealized foreign exchange gains or losses arise from changes in the value of other assets and liabilities at the end of the reporting period, resulting from changes in the exchange rates.
| 15 |
| Hartford International Opportunities HLS Fund |
| Notes to Financial Statements – (continued) |
| June 30, 2012 (Unaudited) |
| (000’s Omitted) |
| e) | Joint Trading Account – The Fund may invest cash balances into a joint trading account that may be invested in one or more repurchase agreements. |
| f) | Fund Share Valuation and Dividend Distributions to Shareholders – Orders for the Fund’s shares are executed in accordance with the investment instructions of the contract holders and plan participants. The NAV of the Fund’s shares is determined as of the close of business on each business day of the Exchange. The NAV is determined separately for each class of shares of the Fund by dividing the Fund’s net assets attributable to that class by the number of shares of the class outstanding. Each class of shares offered by the Fund has equal rights as to assets and voting privileges (except that shareholders of a class have exclusive voting rights regarding any matter relating solely to that class of shares). Income and non-class specific expenses are allocated daily to each class on the basis of the relative net assets of the class. Realized and unrealized capital gains and losses are allocated daily based on the relative net assets of each class of shares of the Fund. |
Orders for the purchase of the Fund’s shares received prior to the close of the Exchange on any day the Exchange is open for business are priced at the NAV determined as of the close of the Exchange. Orders received after the close of the Exchange, or on a day on which the Exchange and/or the Fund is not open for business, are priced at the next determined NAV.
Dividends are declared pursuant to a policy adopted by the Company’s Board of Directors based upon the investment performance of the Fund. The policy of the Fund is to pay dividends from net investment income and realized capital gains, if any, at least once a year.
Distributions from net investment income, net realized capital gains and capital are determined in accordance with federal income tax regulations, which may differ from U.S. GAAP with respect to character and timing. These differences may include but are not limited to losses deferred due to wash sale adjustments, foreign currency gains and losses, adjustments related to Passive Foreign Investment Companies (“PFICs”), Real Estate Investment Trusts (“REITs”), Regulated Investment Companies (“RICs”), certain derivatives and partnerships. Permanent book and federal income tax basis differences relating to shareholder distributions will result in reclassifications to certain of the Fund’s capital accounts (see Federal Income Taxes: Reclassification of Capital Accounts note).
| 3. | Securities and Other Investments: |
| a) | Repurchase Agreements – A repurchase agreement is an agreement by which a counterparty agrees to sell an investment and agrees to repurchase the investment sold at a mutually agreed upon time and price. At the time the Fund enters into a repurchase agreement, the value of the underlying collateral, including accrued interest, will be equal to or exceed the value of the repurchase agreement. Repurchase agreements expose the Fund to counterparty risk. To minimize counterparty risk, the investments that serve to collateralize the repurchase agreement are held by the Fund’s custodian in book entry or physical form in the custodial account of the Fund or in a third party custodial account. Repurchase agreements are valued at cost plus accrued interest. The Fund, as shown on the Schedule of Investments, had outstanding repurchase agreements as of June 30, 2012. |
| b) | Illiquid and Restricted Investments – The Fund is permitted to invest up to 15% of its net assets in illiquid investments. Illiquid investments are those that may not be sold or disposed of in the ordinary course of business within seven days, at approximately the price used to determine the Fund’s NAV. The Fund may not be able to sell illiquid investments when its sub-adviser considers it desirable to do so or may have to sell such investments at a price that is lower than the price that could be obtained if the investments were more liquid. A sale of illiquid investments may require more time and may result in higher dealer discounts and other selling expenses than does the sale of those that are liquid. Illiquid investments also may be more difficult to value due to the unavailability of reliable market quotations for such investments, and an investment in them may have an adverse impact on the Fund’s NAV. The Fund may also purchase certain restricted investments that can only be resold to certain qualified investors and may be determined to be liquid |
| 16 |
pursuant to policies and guidelines established by the Company’s Board of Directors. The Fund, as shown on the Schedule of Investments, had illiquid and/or restricted investments as of June 30, 2012.
| c) | Investments Purchased on a When-Issued or Delayed-Delivery Basis – Delivery and payment for investments that have been purchased by the Fund on a forward commitment, or when-issued or delayed-delivery basis, take place beyond the customary settlement period. A fund may dispose of or renegotiate a delayed-delivery transaction after it is entered into, and may sell delayed-delivery investments before they are delivered, which may result in a realized gain or loss. During this period, such investments are subject to market fluctuations, and the Fund identifies investments segregated in its records with a value at least equal to the amount of the commitment. The Fund, as shown on the Schedule of Investments, had when-issued or delayed delivery investments as of June 30, 2012. |
| 4. | Financial Derivative Instruments: |
The following disclosures contain information on how and why the Fund uses derivative instruments, the credit-risk-related contingent features in certain derivative instruments, and how derivative instruments affect the Fund’s financial position and results of operations. The location and fair value amounts of these instruments on the Statement of Assets and Liabilities and the realized gains and losses and changes in unrealized gains and losses on the Statement of Operations, each categorized by type of derivative contract, are included in the following Additional Derivative Instrument Information footnote. The derivative instruments outstanding as of period-end are disclosed in the notes to the Schedule of Investments and the amounts of realized gains and losses and changes in unrealized gains and losses on derivative instruments during the period are disclosed in the Statement of Operations.
| a) | Foreign Currency Contracts – The Fund may enter into foreign currency contracts that obligate the Fund to purchase or sell currencies at specified future dates. Foreign currency contracts are used to hedge the currency exposure associated with some or all of the Fund’s investments and/or as part of an investment strategy. Foreign currency contracts are marked to market daily and the change in value is recorded by the Fund as an unrealized gain or loss. The Fund will record a realized gain or loss when the foreign currency contract is settled. |
Foreign currency contracts involve elements of market risk in excess of the amounts reflected in the Statement of Assets and Liabilities. In addition, risks may arise upon entering into these contracts from the potential inability of the counterparties to meet the terms of the contracts and from unanticipated movements in the value of the foreign currencies relative to the U.S. dollar. The Fund had outstanding foreign currency contracts as shown on the Schedule of Investments as of June 30, 2012.
| b) | Additional Derivative Instrument Information: |
Fair Values of Derivative Instruments on the Statement of Assets and Liabilities as of June 30, 2012:
| Risk Exposure Category | ||||||||||||||||||||||||||||
| Interest Rate Contracts | Foreign Exchange Contracts | Credit Contracts | Equity Contracts | Commodity Contracts | Other Contracts | Total | ||||||||||||||||||||||
| Assets: | ||||||||||||||||||||||||||||
| Unrealized appreciation on foreign currency contracts | $ | — | $ | 601 | $ | — | $ | — | $ | — | $ | — | $ | 601 | ||||||||||||||
| Total | $ | — | $ | 601 | $ | — | $ | — | $ | — | $ | — | $ | 601 | ||||||||||||||
| Liabilities: | ||||||||||||||||||||||||||||
| Unrealized depreciation on foreign currency contracts | $ | — | $ | 369 | $ | — | $ | — | $ | — | $ | — | $ | 369 | ||||||||||||||
| Total | $ | — | $ | 369 | $ | — | $ | — | $ | — | $ | — | $ | 369 | ||||||||||||||
| 17 |
| Hartford International Opportunities HLS Fund |
| Notes to Financial Statements – (continued) |
| June 30, 2012 (Unaudited) |
| (000’s Omitted) |
The volume of derivatives that is presented in the Schedule of Investments is consistent with the derivative activity during the six-month period ended June 30, 2012.
The effect of Derivative Instruments on the Statement of Operations for the six-month period ended June 30, 2012:
| Risk Exposure Category | ||||||||||||||||||||||||||||
| Interest Rate Contracts | Foreign Exchange Contracts | Credit Contracts | Equity Contracts | Commodity Contracts | Other Contracts | Total | ||||||||||||||||||||||
| Realized Gain (Loss) on Derivatives Recognized as a Result of Operations: | ||||||||||||||||||||||||||||
| Net realized loss on foreign currency contracts | $ | — | $ | (1,442 | ) | $ | — | $ | — | $ | — | $ | — | $ | (1,442 | ) | ||||||||||||
| Total | $ | — | $ | (1,442 | ) | $ | — | $ | — | $ | — | $ | — | $ | (1,442 | ) | ||||||||||||
| Net Change in Unrealized Appreciation (Depreciation) on Derivatives Recognized as a Result of Operations: | ||||||||||||||||||||||||||||
| Net change in unrealized appreciation of foreign currency contracts | $ | — | $ | 240 | $ | — | $ | — | $ | — | $ | — | $ | 240 | ||||||||||||||
| Total | $ | — | $ | 240 | $ | — | $ | — | $ | — | $ | — | $ | 240 | ||||||||||||||
| 5. | Principal Risks: |
| a) | Counterparty Risk – The Fund may be exposed to counterparty risk, or the risk that an institution or other entity with which the Fund has unsettled or open transactions will default. |
| b) | Market Risks – If the Fund invests directly in foreign currencies or in securities that trade in, and receive revenues in, foreign currencies, or in derivatives that provide exposure to foreign currencies, it will be subject to the risk that those currencies will decline in value relative to the base currency of the Fund, or, in the case of hedging positions, that the Fund’s base currency will decline in value relative to the currency being hedged. Currency rates in foreign countries may fluctuate significantly over short periods of time for a number of reasons, including changes in interest rates, intervention (or the failure to intervene) by U.S. or foreign governments, central banks or supranational entities, such as the International Monetary Fund, or by the imposition of currency controls or other political developments in the United States or abroad. As a result, the Fund’s investments in foreign currency denominated securities may reduce the returns of the Fund. The market values of equity securities, such as common stocks and preferred stocks, or equity related investments, such as futures and options, may decline due to general market conditions which are not specifically related to a particular company, such as real or perceived adverse economic conditions, changes in the general outlook for corporate earnings, changes in interest or currency rates or adverse investor sentiment generally. The market value of equity securities may also decline due to factors which affect a particular industry or industries, such as labor shortages or increased production costs and competitive conditions within an industry. Equity securities and equity related investments generally have greater market price volatility than fixed income securities. |
| 6. | Federal Income Taxes: |
| a) | Federal Income Taxes – For federal income tax purposes, the Fund intends to continue to qualify as a RIC under Subchapter M of the Internal Revenue Code (“IRC”) by distributing substantially all of its taxable net investment income and net realized capital gains to its shareholders and otherwise complying with the requirements of RICs. The Fund has distributed substantially all of its income and capital gains in prior years, if applicable, and intends to distribute substantially all of its income and capital gains prior to the next fiscal year-end. Accordingly, no provision for federal income or excise taxes has been made in the accompanying financial statements. Distributions from short-term capital gains are treated as ordinary income distributions for federal income tax purposes. |
| b) | Net Investment Income (Loss), Net Realized Gains (Losses) – Net investment income (loss) and net realized gains (losses) may differ for financial statement and tax purposes primarily because of losses deferred due to wash sale adjustments, foreign currency gains and losses, adjustments related to PFICs, REITs, RICs, certain derivatives and |
| 18 |
partnerships. The character of distributions made during the year from net investment income or net realized gains may differ from their ultimate characterization for federal income tax purposes. Also, due to the timing of dividend distributions, the fiscal year in which amounts are distributed may differ from the year that the income or realized gains (losses) were recorded by the Fund.
| c) | Distributions and Components of Distributable Earnings – The tax character of distributions paid by the Fund for the periods indicated is as follows (as adjusted for dividends payable): |
| For the Year Ended December 31, 2011 | For the Year Ended December 31, 2010 | |||||||
| Ordinary Income | $ | 808 | $ | 22,300 | ||||
As of December 31, 2011, the Fund’s components of distributable earnings (deficit) on a tax basis were as follows:
| Amount | ||||
| Undistributed Ordinary Income | $ | 28,134 | ||
| Accumulated Capital and Other Losses* | (721,811 | ) | ||
| Unrealized Depreciation† | (90,312 | ) | ||
| Total Accumulated Deficit | $ | (783,989 | ) | |
| * | The Fund has capital loss carryforwards that are identified in the Capital Loss Carryforward note that follows. |
| † | The difference between book-basis and tax-basis unrealized appreciation (depreciation) may be attributable to the losses deferred due to wash sale adjustments, foreign currency gains and losses, adjustments related to PFICs, REITs, RICs, certain derivatives and partnerships. |
| d) | Reclassification of Capital Accounts – The Fund may record reclassifications in its capital accounts. These reclassifications have no impact on the total net assets of the Fund. The reclassifications are a result of permanent differences between U.S. GAAP and tax accounting for such items as foreign currency, PFICs, expiration or utilization of capital loss carryforwards or net operating losses. Adjustments are made to reflect the impact these items have on current and future distributions to shareholders. Therefore, the source of the Fund’s distributions may be shown in the accompanying Statement of Changes in Net Assets as from undistributed net investment income, from accumulated net realized gains on investments or from capital depending on the type of book and tax differences that exist. For the year ended December 31, 2011, the Fund recorded reclassifications to increase (decrease) the accounts listed below: |
| Amount | ||||
| Undistributed Net Investment Income | $ | (1,170 | ) | |
| Accumulated Net Realized Gain (Loss) | 1,170 | |||
| e) | Capital Loss Carryforward – On December 22, 2010, the Regulated Investment Company Modernization Act of 2010 (the “Act”) was enacted, which made changes to the capital loss carryforward rules. The changes are effective for taxable years beginning after the date of enactment. Under the Act, funds are permitted to carry forward capital losses for an unlimited period. However, any losses incurred during those future taxable years will be required to be utilized prior to the losses incurred in pre-enactment taxable years, which carry an expiration date. As a result of this ordering rule, pre-enactment capital loss carryforwards may be more likely to expire unused. Additionally, post-enactment capital loss carryforwards retain their character as either short-term or long-term capital losses rather than being considered all short-term as permitted under prior regulation. |
| 19 |
| Hartford International Opportunities HLS Fund |
| Notes to Financial Statements – (continued) |
| June 30, 2012 (Unaudited) |
| (000’s Omitted) |
At December 31, 2011 (tax-year-end), the Fund had capital loss carryforwards for U.S. federal income tax purposes as follows:
| Year of Expiration | Amount | |||
| 2015 | $ | 37,085 | ||
| 2016 | 397,126 | |||
| 2017 | 287,600 | |||
| Total | $ | 721,811 | ||
During the year ended December 31, 2011, the Fund utilized $9,925 of prior year capital loss carryforwards.
| f) | Accounting for Uncertainty in Income Taxes – The Fund has adopted financial reporting rules that require the Fund to analyze all open tax years, as defined by the statute of limitations, for all major jurisdictions. Generally, tax authorities can examine all tax returns filed for the last three years. The Fund does not have an examination in progress. |
The Fund has reviewed all open tax years and major jurisdictions and concluded that these financial reporting rules had no effect on the Fund’s financial position or results of operations. There is no tax liability resulting from unrecognized tax benefits relating to uncertain income tax positions taken or expected to be taken on the tax return for the fiscal year ended December 31, 2011. The Fund is also not aware of any tax positions for which it is reasonably possible that the total amounts of unrecognized tax benefits will significantly change in the next twelve months.
| 7. | Expenses: |
| a) | Investment Management Agreement – HL Investment Advisors, LLC (“HL Advisors”), an indirect wholly owned subsidiary of The Hartford Financial Services Group, Inc. (“The Hartford”), serves as investment manager to the Fund pursuant to an Investment Management Agreement with the Company. As investment manager, HL Advisors has overall investment supervisory responsibility for the Fund. In addition, HL Advisors provides administrative personnel, services, equipment, facilities and office space for proper operation of the Fund. HL Advisors has contracted with Wellington Management Company, LLP (“Wellington Management”) under a sub-advisory agreement for the provision of day-to-day investment management services to the Fund in accordance with the Fund’s investment objective and policies. The Fund pays a fee to HL Advisors, a portion of which may be used to compensate Wellington Management. |
The schedule below reflects the rates of compensation paid to HL Advisors for investment management services rendered as of June 30, 2012; the rates are accrued daily and paid monthly.
| Average Daily Net Assets | Annual Fee | |||
| On first $250 million | 0.7750 | % | ||
| On next $250 million | 0.7250 | % | ||
| On next $500 million | 0.6750 | % | ||
| On next $1.5 billion | 0.6250 | % | ||
| On next $2.5 billion | 0.6200 | % | ||
| On next $5 billion | 0.6150 | % | ||
| Over $10 billion | 0.6100 | % | ||
| 20 |
The schedule below reflects the rates of compensation paid to HL Advisors for investment management services rendered during the period December 31, 2011, through February 29, 2012.
| Average Daily Net Assets | Annual Fee | |||
| On first $250 million | 0.7750 | % | ||
| On next $250 million | 0.7250 | % | ||
| On next $500 million | 0.6750 | % | ||
| On next $4 billion | 0.6250 | % | ||
| On next $5 billion | 0.6225 | % | ||
| Over $10 billion | 0.6200 | % | ||
| b) | Accounting Services Agreement – Pursuant to the Fund Accounting Agreement between HLIC and the Company, on behalf of the Fund, HLIC provides accounting services to the Fund and receives monthly compensation based on the Fund’s average daily net assets at the rates set forth below. The Fund’s accounting services fees are accrued daily and paid monthly. |
| Average Daily Net Assets | Annual Fee | |||
| On first $5 billion | 0.016 | % | ||
| On next $5 billion | 0.014 | % | ||
| Over $10 billion | 0.012 | % | ||
| c) | Operating Expenses – Allocable expenses incurred by the Company are allocated to each Fund and allocated to classes within a Fund in proportion to the average daily net assets of the Fund and each class, except where allocation of certain expenses is more fairly made directly to the Fund or to specific classes within a Fund. |
| d) | Fees Paid Indirectly – The Company, on behalf of the Fund, has entered into agreements with State Street Global Markets, LLC and Russell Implementation Services, Inc. to partially recapture non-discounted trade commissions. Such rebates are used to pay a portion of the Fund’s expenses. In addition, the Fund’s custodian bank has also agreed to reduce its fees when the Fund maintains cash on deposit in a non-interest-bearing custody account. For the six-month period ended June 30, 2012, these amounts, if any, are included in the Statement of Operations. |
The ratio of expenses to average net assets in the accompanying financial highlights excludes the reduction in expenses related to fees paid indirectly. The annualized expense ratio for the period listed below reflecting the reduction for fees paid indirectly is as follows:
| Annualized Six- Month Period Ended June 30, 2012 | ||||
| Class IA | 0.73 | % | ||
| Class IB | 0.98 | % | ||
| e) | Distribution Plan for Class IB shares – The Company, on behalf of the Fund, has adopted a Distribution Plan pursuant to Rule 12b-1 of the 1940 Act to compensate the Distributor, Hartford Securities Distribution Company, Inc. (a wholly owned, ultimate subsidiary of The Hartford), from assets attributable to the Class IB shares for services rendered and expenses borne in connection with activities primarily intended to result in the sale of the Class IB shares, subject to the review and approval of the Company’s Board of Directors. |
| 21 |
| Hartford International Opportunities HLS Fund |
| Notes to Financial Statements – (continued) |
| June 30, 2012 (Unaudited) |
| (000’s Omitted) |
The Distribution Plan provides that the Fund may pay annually up to 0.25% of the average daily net assets of the Fund attributable to its Class IB shares for activities primarily intended to result in the sale of Class IB shares. The Board has the authority to suspend or reduce these payments at any point in time. Under the terms of the Distribution Plan and the principal underwriting agreement, the Fund is authorized to make payments monthly to the Distributor that may be used to pay or compensate entities providing distribution and shareholder servicing with respect to the Class IB shares for such entities’ fees or expenses incurred or paid in that regard. These fees are accrued daily and paid monthly.
| f) | Other Related Party Transactions – Certain officers of the Fund are directors and/or officers of HL Advisors and/or The Hartford or its subsidiaries. For the six-month period ended June 30, 2012, a portion of the Fund’s chief compliance officer’s salary was paid by all the investment companies in the Hartford fund complex. The portion allocated to the Fund was in the amount of $1. Hartford Administrative Services Company (“HASCO”), an indirect wholly owned subsidiary of The Hartford, provides transfer agent services to the Fund. HASCO was compensated on a per account basis for providing such services. The amount paid to HASCO can be found in the Statement of Operations. These fees are accrued daily and paid monthly. |
| g) | Payment from Affiliate – In July of 2007, The Hartford entered into a settlement with the Attorneys General of the states of New York, Connecticut and Illinois relating to market timing and the company's individual variable annuity contracts in which certain payments would be made directly to the variable annuity contract holders. The distribution plan provided that unclaimed money from the settlement would be distributed to certain HLS Funds that are investment options through a Hartford individual variable annuity contract. The unclaimed money was distributed to the Fund on September 18, 2009. |
The total return in the accompanying financial highlights includes a payment from an affiliate. Had the payment from the affiliate been excluded, the impact and total return for the period listed below would have been as follows:
| For the Year Ended December 31, 2009 | ||||||||
| Class IA | Class IB | |||||||
| Impact from Payment from Affiliate for Attorneys General Settlement | 0.23 | % | 0.23 | % | ||||
| Total Return Excluding Payment from Affiliate | 33.15 | % | 32.83 | % | ||||
| 8. | Investment Transactions: |
For the six-month period ended June 30, 2012, the Fund's aggregate purchases and sales of investment securities (excluding short-term investments) were as follows:
| Amount | ||||
| Cost of Purchases Excluding U.S. Government Obligations | $ | 784,956 | ||
| Sales Proceeds Excluding U.S. Government Obligations | 889,341 | |||
| 9. | Line of Credit: |
The Fund is one of several Hartford funds that participate in a $500 million committed revolving line of credit facility. The facility is to be used for temporary or emergency purposes. Under the arrangement, the funds are required to own securities having a market value in excess of 300% of the total bank borrowings. The interest rate on borrowings varies depending on the nature of the loan. The facility also requires a fee to be paid based on the amount of the commitment. This commitment fee is allocated to all of the funds participating in the line of credit based on the average net assets of the funds. During the six-month period ended June 30, 2012, the Fund did not have any borrowings under this facility.
| 22 |
| 10. | Industry Classifications: |
Other than the industry classifications “Other Investment Pools and Funds” and “Exchange Traded Funds,” equity industry classifications used in this report are the Global Industry Classification Standard, which was developed by and is the exclusive property and service mark of MSCI, Inc. and Standard & Poor’s.
| 11. | Indemnifications: |
Under the Company’s organizational documents, the Company shall indemnify its officers and directors to the full extent required or permitted under Maryland General Corporation Law and the federal securities laws. In addition, the Company, on behalf of the Fund, may enter into contracts that contain a variety of indemnifications. The Company’s maximum exposure under these arrangements is unknown. However, as of the date of these financial statements, the Company has not had prior claims or losses pursuant to these contracts and expects the risk of loss to be remote.
| 23 |
| Hartford International Opportunities HLS Fund |
| Financial Highlights |
| - Selected Per-Share Data (A) - |
| Class | Net Asset Value at Beginning of Period | Net Investment Income (Loss) | Payments from (to) Affiliate | Net Realized and Unrealized Gain (Loss) on Investments | Total from Investment Operations | Dividends from Net Investment Income | Distributions from Realized Capital Gains | Distributions from Capital | Total Distributions | Net Increase (Decrease) in Net Asset Value | Net Asset Value at End of Period | |||||||||||||||||||||||||||||||||
| For the Six-Month Period Ended June 30, 2012 (Unaudited) | ||||||||||||||||||||||||||||||||||||||||||||
| IA | $ | 10.72 | $ | 0.19 | $ | — | $ | 0.57 | $ | 0.76 | $ | — | $ | — | $ | — | $ | — | $ | 0.76 | $ | 11.48 | ||||||||||||||||||||||
| IB | 10.82 | 0.18 | — | 0.57 | 0.75 | — | — | — | — | 0.75 | 11.57 | |||||||||||||||||||||||||||||||||
| For the Year Ended December 31, 2011 | ||||||||||||||||||||||||||||||||||||||||||||
| IA | 12.46 | 0.21 | — | (1.94) | (1.73) | (0.01) | — | — | (0.01) | (1.74) | 10.72 | |||||||||||||||||||||||||||||||||
| IB | 12.61 | 0.19 | — | (1.97) | (1.78) | (0.01) | — | — | (0.01) | (1.79) | 10.82 | |||||||||||||||||||||||||||||||||
| For the Year Ended December 31, 2010 (G) | ||||||||||||||||||||||||||||||||||||||||||||
| IA | 11.01 | 0.13 | — | 1.46 | 1.59 | (0.14) | — | — | (0.14) | 1.45 | 12.46 | |||||||||||||||||||||||||||||||||
| IB | 11.15 | 0.11 | — | 1.46 | 1.57 | (0.11) | — | — | (0.11) | 1.46 | 12.61 | |||||||||||||||||||||||||||||||||
| For the Year Ended December 31, 2009 | ||||||||||||||||||||||||||||||||||||||||||||
| IA | 8.40 | 0.16 | 0.03 | 2.61 | 2.80 | (0.19) | — | — | (0.19) | 2.61 | 11.01 | |||||||||||||||||||||||||||||||||
| IB | 8.51 | 0.14 | 0.03 | 2.64 | 2.81 | (0.17) | — | — | (0.17) | 2.64 | 11.15 | |||||||||||||||||||||||||||||||||
| For the Year Ended December 31, 2008 | ||||||||||||||||||||||||||||||||||||||||||||
| IA | 15.62 | 0.28 | — | (6.68) | (6.40) | (0.28) | (0.54) | — | (0.82) | (7.22) | 8.40 | |||||||||||||||||||||||||||||||||
| IB | 15.78 | 0.27 | — | (6.76) | (6.49) | (0.24) | (0.54) | — | (0.78) | (7.27) | 8.51 | |||||||||||||||||||||||||||||||||
| For the Year Ended December 31, 2007 | ||||||||||||||||||||||||||||||||||||||||||||
| IA | 15.23 | 0.18 | — | 3.77 | 3.95 | (0.19) | (3.37) | — | (3.56) | 0.39 | 15.62 | |||||||||||||||||||||||||||||||||
| IB | 15.36 | 0.16 | — | 3.78 | 3.94 | (0.15) | (3.37) | — | (3.52) | 0.42 | 15.78 | |||||||||||||||||||||||||||||||||
| (A) | Information presented relates to a share outstanding throughout the indicated period. |
| (B) | The figures do not include sales charges or other fees which may be applied at the variable life insurance, variable annuity or qualified retirement plan product level. Any such additional sales charges or other fees would lower the Fund's performance. |
| (C) | Ratios do not reflect reductions for fees paid indirectly. Please see Fees Paid Indirectly in the Notes to Financial Statements. |
| (D) | Portfolio turnover rate is calculated on the basis of the Fund as a whole without distinguishing between the classes of shares issued. |
| (E) | Not annualized. |
| (F) | Annualized. |
| (G) | Per share amounts have been calculated using the average shares method. |
| (H) | During the year ended December 31, 2010, the Fund incurred $456.2 million in sales associated with the transition of assets from Hartford International Growth HLS Fund and Hartford International Small Company HLS Fund, which merged into the Fund on April 16, 2010. These sales were excluded from the portfolio turnover calculation. |
| (I) | Total return without the inclusion of the Payment from (to) Affiliate can be found in Expenses in the accompanying Notes to Financial Statements. |
| 24 |
| - Ratios and Supplemental Data - |
| Total Return(B) | Net Assets at End of Period | Ratio of Expenses to Average Net Assets Before Waivers(C) | Ratio of Expenses to Average Net Assets After Waivers(C) | Ratio of Net Investment Income (Loss) to Average Net Assets | Portfolio Turnover Rate(D) | |||||||||||||||||
| 7.10 | %(E) | $ | 1,246,592 | 0.74 | %(F) | 0.74 | %(F) | 2.72 | %(F) | 52 | % | |||||||||||
| 6.96 | (E) | 218,686 | 0.99 | (F) | 0.99 | (F) | 2.46 | (F) | — | |||||||||||||
| (13.97 | ) | 1,287,917 | 0.73 | 0.73 | 1.66 | 111 | ||||||||||||||||
| (14.19 | ) | 232,707 | 0.98 | 0.98 | 1.41 | — | ||||||||||||||||
| 14.49 | 1,705,757 | 0.74 | 0.74 | 1.19 | 128 | (H) | ||||||||||||||||
| 14.20 | 328,671 | 0.99 | 0.99 | 0.94 | — | |||||||||||||||||
| 33.46 | (I) | 1,247,179 | 0.76 | 0.76 | 1.68 | 152 | ||||||||||||||||
| 33.13 | (I) | 216,882 | 1.01 | 1.01 | 1.43 | — | ||||||||||||||||
| (42.25 | ) | 1,046,234 | 0.71 | 0.71 | 2.21 | 158 | ||||||||||||||||
| (42.39 | ) | 189,221 | 0.96 | 0.96 | 1.96 | — | ||||||||||||||||
| 27.43 | 2,027,078 | 0.71 | 0.71 | 1.13 | 135 | |||||||||||||||||
| 27.11 | 417,144 | 0.96 | 0.96 | 0.89 | — | |||||||||||||||||
| 25 |
| Hartford International Opportunities HLS Fund |
| Directors and Officers (Unaudited) |
The Board of Directors of the Company appoints officers who are responsible for the day-to-day operations of the Fund and who execute policies formulated by the Directors. Each director serves until his or her death, resignation, or retirement or until the next annual meeting of shareholders is held or until his or her successor is elected and qualifies.
Directors and officers who are employed by or who have a financial interest in The Hartford are considered “interested” persons of the Fund pursuant to the 1940 Act. Each officer and two of the Company’s directors, as noted in the chart below, are “interested” persons of the Fund. Each director serves as a director for The Hartford Mutual Funds, Inc., The Hartford Mutual Funds II, Inc., Hartford Series Fund, Inc., Hartford HLS Series Fund II, Inc., and as a trustee for The Hartford Alternative Strategies Fund, which, as of June 30, 2012, collectively consist of 89 funds. Correspondence may be sent to directors and officers c/o Hartford Mutual Funds, P.O. Box 2999, Hartford, Connecticut 06104-2999, except that correspondence to Mr. Annoni, Mr. Dressen and Ms. Fagely may be sent to 500 Bielenberg Drive, Woodbury, Minnesota 55125.
The table below sets forth, for each director and officer, his or her name, year of birth, current position with the Company and date first elected or appointed to Hartford Series Fund, Inc. (“HSF”), and Hartford HLS Series Fund II, Inc. (“HSF2”), principal occupation, and, for directors, other directorships held. The Fund’s statement of additional information contains further information on the directors and is available free of charge by calling 1-800-862-6668 or writing to Hartford HLS Funds, c/o Individual Annuity Services, P.O. Box 5085, Hartford, CT 06102-5085.
Information on the aggregate remuneration paid to the directors of the Company can be found in the Statement of Operations herein. The Fund pays to The Hartford a portion of the Chief Compliance Officer’s compensation, but does not pay salaries or compensation to any of their other officers or directors who are employed by The Hartford.
Non-Interested Directors
Lynn S. Birdsong (1946) Director since 2003, Co-Chairman of the Investment Committee
Mr. Birdsong is a private investor. Mr. Birdsong currently serves as a Director of the Sovereign High Yield Investment Company (April 2010 to current). Mr. Birdsong currently serves as an Independent Director of Nomura Partners Funds, Inc. (formerly, The Japan Fund) (March 2003 to current). From 1979 to 2002, Mr. Birdsong was a managing director of Zurich Scudder Investments, an investment management firm. During his employment with Scudder, Mr. Birdsong was an Interested Director of The Japan Fund. Since 1981, Mr. Birdsong has been a partner in Birdsong Company, an advertising specialty firm.
Robert M. Gavin, Jr. (1940) Director since 2002 (HSF) and 1986 (HSF2), Chairman of the Board since 2004
Dr. Gavin is an educational consultant. Prior to September 1, 2001, he was President of Cranbrook Education Community and prior to July 1996, he was President of Macalester College, St. Paul, Minnesota.
Duane E. Hill (1945) Director since 2001 (HSF) and 2002 (HSF2), Chairman of the Nominating Committee
Mr. Hill is Partner of TSG Ventures L.P., a private equity investment company. Mr. Hill is a former partner of TSG Capital Group, a private equity investment firm that served as sponsor and lead investor in leveraged buyouts of middle market companies.
Sandra S. Jaffee (1941) Director since 2005
Ms. Jaffee is the founder and Chief Executive Officer of a private company, Homeworks Concierge, LLC, which provides residential property management services in Westchester County, New York (January 2012 to present). Ms. Jaffee served as Chairman (2008 to 2009) and Chief Executive Officer of Fortent (formerly Searchspace Group), a leading provider of compliance/regulatory technology to financial institutions from August 2005 to August 2009. Ms. Jaffe currently serves as a member of the Board of Directors of Broadridge Financial Solutions as well as a Trustee of Muhlenberg College.
William P. Johnston (1944) Director since 2005, Chairman of the Compliance Committee
In June 2006, Mr. Johnston was appointed as Senior Advisor to The Carlyle Group, a global private equity investment firm. In August 2007, Mr. Johnston was elected to the Board of Directors of LifeCare Holdings, Inc. In February 2008, Mr. Johnston was elected to the Board of Directors of HCR-ManorCare, Inc. In May 2006, Mr. Johnston was elected to the Supervisory Board of Fresenius Medical Care AG & Co. KGaA, after its acquisition of Renal Care Group, Inc. in March 2006.
Phillip O. Peterson (1944) Director since 2002 (HSF) and 2000 (HSF2), Chairman of the Audit Committee
Mr. Peterson is a mutual fund industry consultant. He was a partner of KPMG LLP (an accounting firm) until July 1999. Mr. Peterson joined William Blair Funds in February 2007 as a member of the Board of Trustees. Mr. Peterson also joined the Board of Trustees of Symetra Variable Mutual Funds Trust as a trustee in February 2012.
| 26 |
Lemma W. Senbet (1946) Director since 2005
Dr. Senbet is the William E. Mayer Chair Professor of Finance and Director, Center for Financial Policy, at the University of Maryland, Robert H. Smith School of Business. He was chair of the Finance Department from 1998 to 2006. Previously he was a chaired professor of finance at the University of Wisconsin-Madison. Also, he was director of the Fortis Funds from March 2000 to July 2002. Dr. Senbet served the finance profession in various capacities, including as director of the American Finance Association and President of the Western Finance Association. In 2006, Dr. Senbet was inducted Fellow of Financial Management Association International for his career-long distinguished scholarship and professional service.
Interested Directors and Officers
David N. Levenson (1966) Director since 2010(1)
Mr. Levenson currently serves as President of The Hartford’s Wealth Management business. He was appointed to this role in July 2010. Previously, Mr. Levenson served as Executive Vice President of Legacy Holdings for The Hartford from June 2009 to July 2010. From 2006 to 2009, Mr. Levenson was with Hartford Life Insurance K.K. where he served as President and Chief Executive Officer from 2007 to 2009. He served as Managing Director of Hartford Investment Management Company from 2005 to 2006. Additionally, Mr. Levenson serves as Executive Vice President of The Hartford and as President, Director and Chief Executive Officer of Hartford Life Insurance Company (“HLIC”) and Hartford Life, Inc. (“HL Inc.”).
(1) Mr. Levenson served as Interested Director until August 2, 2012.
Lowndes A. Smith (1939) Director since 1996 (HSF) and 2002 (HSF2), Co-Chairman of the Investment Committee
Mr. Smith served as Vice Chairman of The Hartford from February 1997 to January 2002, as President and Chief Executive Officer of HL Inc. from February 1997 to January 2002, and as President and Chief Operating Officer of The Hartford Life Insurance Companies from January 1989 to January 2002. Mr. Smith serves as a Director of White Mountains Insurance Group, Ltd., One Beacon Insurance and Symetra Financial and as Managing Director of Whittington Gray Associates.
Other Officers
James E. Davey (1964) President and Chief Executive Officer since 2010(2)
Mr. Davey serves as Executive Vice President of HLIC. Additionally, Mr. Davey serves as President, Chief Executive Officer and Manager of HIFSCO and President, Chief Executive Officer and Manager of HL Investment Advisors, LLC (“HL Advisors”). Mr. Davey joined The Hartford in 2002.
(2) Mr. Davey became an Interested Director effective August 2, 2012.
Mark A. Annoni (1964) Vice President, Controller and Treasurer since 2012(3)
Mr. Annoni serves as the Assistant Vice President and Director of Investment Finance (February 2004 to present). Mr. Annoni joined The Hartford in April 2001 as part of The Hartford’s acquisition of Fortis Financial Group. Prior to joining The Hartford, Mr. Annoni served as Manager of Mutual Fund Accounting at Fortis Financial Group (July 1997 to April 2001).
(3) Mr. Annoni was named Vice President, Controller and Treasurer on May 8, 2012.
Michael R. Dressen (1963) AML Compliance Officer since 2011
Mr. Dressen currently serves as Assistant Vice President of HLIC. He also serves as Chief Compliance Officer and AML Compliance Officer of Hartford Administrative Services Company (“HASCO”) and as Assistant Secretary and Compliance Officer of HIFSCO. Mr Dressen joined The Hartford in 2005 from State Farm Insurance Companies where he held various positions related to mutual funds, variable products, and property casualty insurance.
Tamara L. Fagely (1958) Vice President, since 2002 (HSF) and 1993 (HSF2)(4)
Ms. Fagely has been a Vice President of HASCO since 1998 and Chief Financial Officer since 2006. Currently Ms. Fagely is a Vice President of HLIC. She served as Assistant Vice President of HLIC from December 2001 through March 2005. In addition, Ms. Fagely is Controller and Chief Financial Officer of HIFSCO.
(4) Ms. Fagely served as Vice President, Controller and Treasurer until May 8, 2012.
Dr. Robert J. Froehlich (1953) Senior Managing Director since 2009(5)
Dr. Froehlich joined The Hartford as Senior Managing Director in September 2009. Prior to joining The Hartford, Dr. Froehlich served as Vice Chairman of Deutsche Asset Management from 1997-2009.
(5) Dr. Froehlich served as Senior Managing Director until March 26, 2012.
| 27 |
| Hartford International Opportunities HLS Fund |
| Directors and Officers (Unaudited) – (continued) |
Edward P. Macdonald (1967) Vice President, Secretary and Chief Legal Officer since 2005
Mr. Macdonald serves as Vice President of HLIC and Chief Legal Officer of Mutual Funds and Vice President of HIFSCO. He also serves as Vice President and Secretary of HASCO, and Chief Legal Officer, Secretary and Vice President of HL Advisors. Mr. Macdonald joined The Hartford in 2005.
Vernon J. Meyer (1964) Vice President since 2006
Mr. Meyer serves as Senior Vice President of HLIC. He also serves as Senior Vice President of HIFSCO and HL Advisors. Mr. Meyer joined The Hartford in 2004.
Colleen B. Pernerewski (1969) Vice President and Chief Compliance Officer since 2010
Ms. Pernerewski serves as Vice President and Chief Investment Advisor Compliance Officer of HIFSCO and as Vice President and Chief Compliance Officer of HL Advisors. Ms. Pernerewski serves as Vice President and Chief Compliance Officer of Individual Annuity of HLIC. Ms. Pernerewski joined The Hartford in 2005 from Travelers Life and Annuity where she served as Counsel (2004-2005). Prior to Travelers Life and Annuity, Ms. Pernerewski held the position of Counsel at The Hartford (1998-2004).
Elizabeth L. Schroeder (1966) Vice President since 2010
Ms. Schroeder currently serves as Assistant Vice President of HLIC. Ms. Schroeder joined HLIC in 1991. She is also an Assistant Vice President of HASCO, HIFSCO and HL Advisors.
Martin Swanson (1962) Vice President since 2010
Mr. Swanson is a Vice President of HLIC. Mr. Swanson also serves as Vice President/Marketing for HIFSCO. Prior to joining HLIC in 1998, Mr. Swanson was a Vice President at PaineWebber, Inc.
Jane Wolak (1961) Vice President since 2009
Ms. Wolak currently serves as Senior Vice President of HLIC. Ms. Wolak joined HLIC as Vice President, Retail Product Services in May 2007. She is also Vice President of HASCO. Previously, Ms. Wolak was with Sun Life Financial where she held the position of Vice President, Service Center Operations from 2001-2007.
HOW TO OBTAIN A COPY OF THE FUND’S PROXY VOTING POLICIES AND VOTING RECORDS (UNAUDITED)
A description of the policies and procedures that the Fund uses to determine how to vote proxies relating to portfolio securities and a record of how the Fund voted any proxies for the twelve-month period ended June 30, 2012 are available (1) without charge, upon request, by calling 800-862-6668 and (2) on the SEC’s website at http://www.sec.gov.
QUARTERLY PORTFOLIO HOLDINGS INFORMATION (UNAUDITED)
The Fund files a complete schedule of portfolio holdings with the SEC for the first and third quarters of each fiscal year on Form N-Q. The Fund’s Forms are available (1) without charge, upon request, by calling 800-862-6668 and (2) on the SEC’s website at http://www.sec.gov. The Form N-Q may be reviewed and copied at the SEC’s Public Reference Room in Washington, DC. Information on the operation of the Public Reference Room may be obtained by calling 1-800-SEC-0330.
| 28 |
| Hartford International Opportunities HLS Fund |
| Expense Example (Unaudited) |
Your Fund's Expenses
As a shareholder of the Fund, you incur two types of costs: (1) transaction costs and (2) ongoing costs including investment management fees, distribution fees, and other fund expenses. This example is intended to help you understand your ongoing costs (in dollars) of investing in the Fund and to compare these costs with the ongoing costs of investing in other mutual funds. The example is based on an investment of $1,000 invested at the beginning of the period and held for the period of December 31, 2011 through June 30, 2012.
Actual Expenses
The first set of columns of the table below provides information about actual account values and actual expenses. You may use the information in this column, together with the amount you invested, to estimate the expenses that you paid over the period. Simply divide your account value by $1,000 (for example, an $8,600 account value divided by $1,000 = 8.6), then multiply the result by the number in the line under the heading entitled “Expenses Paid During Period” to estimate the expenses you paid on your account during this period.
Hypothetical Example for Comparison Purposes
The second set of columns of the table below provides information about hypothetical account values and hypothetical expenses based on the Fund’s actual expense ratio and an assumed rate of return of 5% per year before expenses, which is not the Fund’s actual return. The hypothetical account values and expenses may not be used to estimate the actual ending account balance or expenses you paid for the period. You may use this information to compare the ongoing costs of investing in the Fund and other funds. To do so, compare this 5% hypothetical example with the 5% hypothetical examples that appear in the shareholder reports of the other funds.
Please note that the expenses shown in the table are meant to highlight your ongoing costs only and do not reflect any transactional costs, such as sales charges (loads) and CDSC. Therefore, the second set of columns of the table is useful in comparing ongoing costs only, and will not help you determine the relative total costs of owning different funds. In addition, if these transactional costs were included, your costs would be higher. Expenses are equal to the Fund's annualized expense ratios multiplied by average account value over the period, multiplied by 182/366 (to reflect the one-half year period).
| Actual return | Hypothetical (5% return before expenses) | |||||||||||||||||||||||||||||||||||
| Beginning Account Value December 31, 2011 | Ending Account Value June 30, 2012 | Expenses paid during the period December 31, 2011 through June 30, 2012 | Beginning Account Value December 31, 2011 | Ending Account Value June 30, 2012 | Expenses paid during the period December 31, 2011 through June 30, 2012 | Annualized expense ratio | Days in the current 1/2 year | Days in the full year | ||||||||||||||||||||||||||||
| Class IA | $ | 1,000.00 | $ | 1,070.98 | $ | 3.81 | $ | 1,000.00 | $ | 1,021.18 | $ | 3.72 | 0.74 | % | 182 | 366 | ||||||||||||||||||||
| Class IB | $ | 1,000.00 | $ | 1,069.65 | $ | 5.09 | $ | 1,000.00 | $ | 1,019.94 | $ | 4.97 | 0.99 | % | 182 | 366 | ||||||||||||||||||||
| 29 |
HARTFORD HLS FUNDS
c/o The Hartford Wealth Management - Global Annuities
P.O. Box 14293
Lexington, KY 40512-4293
Hartford Series Fund, Inc. is underwritten and distributed by Hartford Securities Distribution Company, Inc.
"The Hartford" is The Hartford Financial Services Group, Inc. and its subsidiaries.
Hartford Series Fund, Inc. inception dates range from 1977 to date. Hartford Series Fund, Inc. is not a subsidiary of The Hartford but is underwritten, distributed by and advised by subsidiaries of The Hartford. Investments in Hartford Series Fund, Inc. are not guaranteed by The Hartford or any other entity.
You should carefully consider investment objectives, risks, and charges and expenses of Hartford HLS Funds before investing. This and other information can be found in the Fund’s prospectus or summary prospectus, which can be obtained by calling 800-862-6668. Please read them carefully before you invest or send money.
| HLSSAR-IO12 8-12 111647 Printed in U.S.A ©2012 The Hartford, Hartford, CT 06115 | |

A MESSAGE FROM THE PRESIDENT
Dear Fellow Shareholders:
I want to take this opportunity to say thank you for investing in the Hartford HLS Funds. We’ve seen continued market volatility throughout the first half of 2012, and there will likely be continued uncertainty until the Presidential election in November, but we are still optimistic about the markets in 2012.
Market Review
In the first quarter of 2012, the S&P 500 Index turned in its best quarterly performance since the third quarter of 2009. U.S. equities showed signs of improvement as investors focused on improving economic data and strong corporate earnings news and the Federal Reserve’s pledge to keep interest rates low buoyed investors’ appetites.
The second quarter ended on a high note for the stock market—the S&P 500 had its strongest June in more than a decade and the Dow Jones Industrial Average had its best month since October—but those gains weren’t enough to offset losses from April and May, and equities finished the quarter in the red. Although the S&P 500 was -2.75 for the second quarter, it was up 9.49% for the first half of 2012.
Concerns about domestic and European unemployment are having an effect on our economy. The unemployment rate in the euro zone's 17 nations rose to a record 11.1% in May, the highest level since the euro launched as a common currency more than 10 years ago. In the U.S., the labor market has been fickle this year, with job growth starting off strong in the first couple months of 2012 but slowing down in the spring, which has led many to wonder about the status of the economic recovery.
On a positive note, home prices are rising again after falling for more than five years, new and existing home sales are increasing, and home builders are ramping up construction.
The Hartford HLS Funds Expands Relationship with Wellington Management
We’re very pleased that we are expanding our relationship with Wellington Management, which will now serve as the primary sub-adviser for the Hartford HLS Funds including equity, fixed-income,* and asset-allocation funds. One of America’s oldest and largest investment management firms, Wellington Management has resources that span the entire globe, with multiple offices across the U.S. and numerous offices abroad. Wellington Management’s most distinctive strength is its proprietary research, which is shared across the entire organization.
We believe that aligning more closely with a well-respected money manager like Wellington Management puts us in a strong position to drive significant growth and to continue delivering innovative fund strategies to help our investors meet their financial goals.
Thank you again for investing with the Hartford HLS Funds.
James Davey
President
Hartford HLS Funds
*Several fixed-income funds will continue to be sub-advised by Hartford Investment Management Company.
Hartford MidCap HLS Fund
This report is prepared for the general information of contract owners and qualified retirement plan participants. It is not an offer of contracts or of qualified retirement plans. It should not be used in connection with any offer, except in conjunction with the appropriate product prospectus which contains all pertinent information including the applicable sales, administrative and other charges.
The views expressed in the Fund’s Manager Discussion under ‘‘Why did the Fund perform this way?’’ and ‘‘What is the outlook?’’ are views of the Fund’s sub-adviser and portfolio management team through the end of the period and are subject to change based on market and other conditions.
Hartford MidCap HLS Fund* inception 07/14/1997
(sub-advised by Wellington Management Company, LLP)
| Investment objective – Seeks long-term growth of capital. |
Performance Overview 6/30/02 - 6/30/12
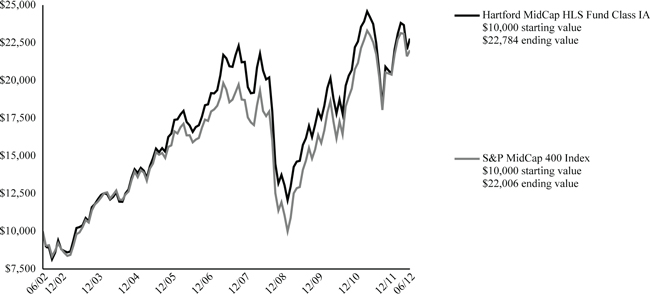
The chart above shows the growth of a $10,000 investment in Class IA. Growth results in classes other than Class IA will vary from what is seen above due to differences in the expenses charged to those share classes.
Average Annual Total Returns (as of 6/30/12)
| 6 Month† | 1 Year | 5 year | 10 year | |||||||||||||
| MidCap IA | 11.40 | % | -4.08 | % | 1.19 | % | 8.58 | % | ||||||||
| MidCap IB | 11.26 | % | -4.32 | % | 0.93 | % | 8.31 | % | ||||||||
| S&P MidCap 400 Index | 7.90 | % | -2.33 | % | 2.55 | % | 8.21 | % | ||||||||
| † | Not Annualized |
PAST PERFORMANCE IS NOT INDICATIVE OF FUTURE RESULTS.
Total returns presented above were calculated using the Fund's net asset value available to shareholders for sale or redemption of Fund shares on June 30, 2012, which may exclude investment transactions as of this date.
S&P MidCap 400 Index is an unmanaged index of common stocks of companies chosen by S&P designed to represent price movements in the mid-cap U.S. equity market.
You cannot invest directly in an index.
The chart represents a hypothetical investment in the Fund. Performance data represents past performance and current performance could be higher or lower.
Performance information may reflect historical or current expense waivers/reimbursements from the investment adviser, without which performance would have been lower. For information on current expense waivers/reimbursements, please see the prospectus.
The value of the Fund will fluctuate so that when redeemed, it may be worth more or less than the original investment. The chart and table do not reflect the deductions of taxes, sales charges or other fees which may be applied at the variable life insurance, variable annuity or qualified retirement plan product level. Any such additional sales charges or other fees or expenses would lower the contract’s or plan’s performance.
| * | The Fund has restrictions on the purchase of shares. A description of the restrictions can be found in the prospectus. |
| 2 |
| Hartford MidCap HLS Fund |
| Manager Discussion |
| June 30, 2012 (Unaudited) |
| Portfolio Managers | |
| Philip W. Ruedi, CFA | Mark A. Whitaker, CFA |
| Senior Vice President and Equity Portfolio Manager | Vice President and Equity Portfolio Manager |
How did the Fund perform?
The Class IA shares of the Hartford MidCap HLS Fund returned 11.40% for the six-month period ended June 30, 2012, outperforming its benchmark, the S&P MidCap 400 Index, which returned 7.90% for the same period. The Fund also outperformed the 7.40% return of the average fund in the Lipper Mid-Cap Core VP-UF Funds peer group, a group of funds with investment strategies similar to those of the Fund.
Why did the Fund perform this way?
The six-month period ending June 30, 2012 was yet another extremely volatile period for equity markets. Global equities started the year on a strong note and continued to march higher in the first quarter of 2012, driven by strong corporate earnings growth and generally improving economic data. However, global equities reversed course during the second half of the period. A lackluster U.S. jobs report, a heightened level of political uncertainty in France and Greece, and a host of Spanish and Italian bank downgrades by Moody’s dampened investor enthusiasm for equities. As the overall markets slowed in the latter half of the period, traditionally more defensive industries returned to favor while more cyclical industries and companies experienced stronger sell-offs.
Mid-cap stocks (+7.9%) and small-cap stocks (+8.5%) underperformed large-cap stocks (+9.5%) during the period, as measured by the S&P MidCap 400, Russell 2000, and S&P 500 Indices, respectively. Growth stocks (+8.4%) slightly outpaced Value stocks (+8.1%) during the period, as measured by the Russell 2500 Growth and Russell 2500 Value Indices. Within the S&P MidCap 400 Index, nine out of ten sectors posted positive returns during the six-month period. The Health Care (+17%), Telecommunication Services (+14%), and Consumer Discretionary (+11%) sectors performed best while the Energy (-13%), Utilities (+3%), Consumer Staples (+4%), Industrials (+5%), and Materials (+7%) sectors lagged the benchmark.
Outperformance versus the benchmark was driven by strong security selection in the Health Care, Energy, and Industrials sectors, which more than offset weak stock selection in the Consumer Discretionary and Financials sectors. Sector allocation, which is driven by our bottom-up stock selection process (i.e. stock by stock fundamental research), detracted from relative performance during the period as a result of our overweight position (i.e. the Fund’s sector position was greater than the benchmark position) in Energy and an underweight position in Financials.
Top contributors to relative and absolute performance were Amylin Pharmaceuticals (Health Care) and Skyworks Solutions (Information Technology). Additionally, Lincare Holdings (Health Care) was a top relative contributor. Shares of health care company Amylin climbed as a result of ongoing speculation that the company would be acquired. A takeover offer from Bristol-Myers Squibb was rejected in March. Amylin Pharmaceuticals also has a compelling antibody platform that we believe positions it well in drug discovery. Shares of Skyworks Solutions, a semiconductor manufacturer, climbed based on strong earning results. Shares of Lincare, a home respiratory treatment device company, rose sharply based on speculation that the company would be acquired. Regeneron Pharmaceuticals (Health Care) was another top contributor to absolute performance (i.e. total return).
Top detractors from relative and absolute performance were Newfield Exploration (Energy) and Rovi Corporation (Information Technology). Additionally, Vertex Pharmaceuticals (Health Care) was a top relative detractor. Shares of Newfield Exploration, a U.S.-based oil & gas exploration and production company, stumbled after the company missed earnings expectations based on lower production volumes and provided mixed guidance for liquids-rich growth and lower natural gas volumes year-over-year. Shares of digital media technology company Rovi Corporation declined due to a slow ramp up and additional capital requirements for the successful launch of the Rovi Entertainment Store (RES) platform. Not owning benchmark constituent Vertex Pharmaceuticals hurt relative performance after the company reported compelling data from a phase II Cystic Fibrosis combination study. CH Robinson Worldwide (Industrials) also detracted from absolute performance.
What is the outlook?
Economic indicators in the U.S. have been mixed in recent months. We believe strength in housing and consumer spending are helping to offset weak employment gains in the U.S. We expect that uncertainty will dominate markets until U.S. Presidential election results are known later in the fall. While the macroeconomic outlook remains uncertain, we are optimistic about certain opportunities in the mid cap space. We consider our strength to be in bottom-up stock selection
| 3 |
| Hartford MidCap HLS Fund |
| Manager Discussion – (continued) |
| June 30, 2012 (Unaudited) |
and do not manage the portfolio based on an opinion of the direction of the broader economy.
We have focused on including both defensive, acyclical (generic drugs, drug distribution, non-asset-based transportation) and offensive, procyclical (oil exploration and production, temporary staffing) positions in the portfolio. As we analyze individual stocks, we are looking for companies that we believe can exceed expectations irrespective of the rate of growth in the overall economy. We believe that this mix will allow us to benefit in a variety of economic environments.
We feel the outperformance in the first half of the year is illustrative of our conviction in the team, process, and the current portfolio. We strive to maintain a balanced portfolio and continue to find new ideas and investable themes based on our bottom-up analysis. For example, investing in natural gas-related companies is an emerging theme in the portfolio. Low natural gas prices and economic uncertainty have compressed valuations for natural gas companies. We expect that companies with unique assets and with flexibility in production of higher priced oil versus lower priced natural gas will benefit as those characteristics are recognized by the market. These companies should benefit disproportionately from a potential recovery in natural gas prices, and we have identified and established positions in several companies with compelling features. In the event of a protracted economic downturn, we would expect for cash costs to come down for natural gas companies as a result of lower demand for oil. Because much of the natural gas demand is driven by electricity generation needs, we believe the companies have an effective hedge against the business cycle. New positions this year among natural gas companies in the portfolio include Cabot Oil & Gas and Range Resources.
At the end of the period, our largest overweights relative to the benchmark were in the Health Care and Energy sectors. Our largest underweights were in Financials and Materials.
Diversification by Industry
as of June 30, 2012
| Industry (Sector) | Percentage of Net Assets | |||
| Automobiles & Components (Consumer Discretionary) | 2.3 | % | ||
| Banks (Financials) | 4.6 | |||
| Capital Goods (Industrials) | 8.6 | |||
| Commercial & Professional Services (Industrials) | 6.2 | |||
| Consumer Durables & Apparel (Consumer Discretionary) | 3.4 | |||
| Consumer Services (Consumer Discretionary) | 0.7 | |||
| Diversified Financials (Financials) | 5.1 | |||
| Energy (Energy) | 10.1 | |||
| Food & Staples Retailing (Consumer Staples) | 0.5 | |||
| Food, Beverage & Tobacco (Consumer Staples) | 1.1 | |||
| Health Care Equipment & Services (Health Care) | 7.1 | |||
| Insurance (Financials) | 2.4 | |||
| Materials (Materials) | 3.3 | |||
| Media (Consumer Discretionary) | 2.7 | |||
| Pharmaceuticals, Biotechnology & Life Sciences (Health Care) | 11.9 | |||
| Real Estate (Financials) | 1.6 | |||
| Retailing (Consumer Discretionary) | 4.0 | |||
| Semiconductors & Semiconductor Equipment (Information Technology) | 2.9 | |||
| Software & Services (Information Technology) | 11.5 | |||
| Technology Hardware & Equipment (Information Technology) | 3.3 | |||
| Transportation (Industrials) | 3.3 | |||
| Utilities (Utilities) | 2.7 | |||
| Short-Term Investments | 0.8 | |||
| Other Assets and Liabilities | (0.1 | ) | ||
| Total | 100.0 | % | ||
| 4 |
| Hartford MidCap HLS Fund |
| Schedule of Investments |
| June 30, 2012 (Unaudited) |
| (000’s Omitted) |
| Shares or Principal Amount | Market Value ╪ | |||||||
| COMMON STOCKS - 99.3% | ||||||||
| Automobiles & Components - 2.3% | ||||||||
| 627 | Allison Transmission Holdings, Inc. ● | $ | 11,015 | |||||
| 438 | Harley-Davidson, Inc. | 20,039 | ||||||
| 31,054 | ||||||||
| Banks - 4.6% | ||||||||
| 133 | Cullen/Frost Bankers, Inc. | 7,666 | ||||||
| 255 | East West Bancorp, Inc. | 5,984 | ||||||
| 1,177 | First Niagara Financial Group, Inc. | 9,004 | ||||||
| 382 | First Republic Bank ● | 12,825 | ||||||
| 301 | M&T Bank Corp. | 24,878 | ||||||
| 49 | Signature Bank ● | 2,965 | ||||||
| 63,322 | ||||||||
| Capital Goods - 8.6% | ||||||||
| 257 | AMETEK, Inc. | 12,844 | ||||||
| 230 | Carlisle Cos., Inc. | 12,194 | ||||||
| 270 | IDEX Corp. | 10,528 | ||||||
| 339 | Jacobs Engineering Group, Inc. ● | 12,833 | ||||||
| 551 | Lennox International, Inc. | 25,707 | ||||||
| 218 | MSC Industrial Direct Co., Inc. | 14,294 | ||||||
| 454 | PACCAR, Inc. | 17,788 | ||||||
| 204 | Pall Corp. | 11,195 | ||||||
| 117,383 | ||||||||
| Commercial & Professional Services - 6.2% | ||||||||
| 241 | Corrections Corp. of America ● | 7,083 | ||||||
| 515 | Equifax, Inc. ● | 23,988 | ||||||
| 458 | Manpower, Inc. | 16,794 | ||||||
| 832 | Robert Half International, Inc. | 23,763 | ||||||
| 438 | Waste Connections, Inc. | 13,115 | ||||||
| 84,743 | ||||||||
| Consumer Durables & Apparel - 3.4% | ||||||||
| 479 | Hasbro, Inc. | 16,225 | ||||||
| 28 | NVR, Inc. ● | 23,447 | ||||||
| 294 | Ryland Group, Inc. | 7,510 | ||||||
| 47,182 | ||||||||
| Consumer Services - 0.7% | ||||||||
| 200 | Weight Watchers International, Inc. | 10,298 | ||||||
| Diversified Financials - 5.1% | ||||||||
| 212 | Greenhill & Co., Inc. | 7,567 | ||||||
| 896 | Invesco Ltd. | 20,243 | ||||||
| 229 | LPL Financial Holdings, Inc. ● | 7,721 | ||||||
| 1,047 | SEI Investments Co. | 20,827 | ||||||
| 214 | T. Rowe Price Group, Inc. | 13,470 | ||||||
| 69,828 | ||||||||
| Energy - 10.1% | ||||||||
| 422 | Atwood Oceanics, Inc. ● | 15,968 | ||||||
| 284 | Cabot Oil & Gas Corp. | 11,189 | ||||||
| 564 | Cobalt International Energy ● | 13,250 | ||||||
| 469 | Consol Energy, Inc. | 14,176 | ||||||
| 356 | Denbury Resources, Inc. ● | 5,381 | ||||||
| 362 | Ensco plc | 16,988 | ||||||
| 879 | McDermott International, Inc. ● | 9,788 | ||||||
| 556 | Newfield Exploration Co. ● | 16,298 | ||||||
| 109 | Pioneer Natural Resources Co. | 9,577 | ||||||
| 152 | Range Resources Corp. | 9,431 | ||||||
| 304 | Superior Energy Services, Inc. ● | 6,154 | ||||||
| 636 | WPX Energy, Inc. ● | 10,295 | ||||||
| 138,495 | ||||||||
| Food & Staples Retailing - 0.5% | ||||||||
| 110 | PriceSmart, Inc. | 7,455 | ||||||
| Food, Beverage & Tobacco - 1.1% | ||||||||
| 365 | Molson Coors Brewing Co. | 15,169 | ||||||
| Health Care Equipment & Services - 7.1% | ||||||||
| 529 | Allscripts Healthcare Solutions, Inc. ● | 5,779 | ||||||
| 418 | AmerisourceBergen Corp. | 16,438 | ||||||
| 345 | Cardinal Health, Inc. | 14,488 | ||||||
| 864 | Lincare Holdings, Inc. | 29,399 | ||||||
| 398 | Patterson Cos., Inc. | 13,718 | ||||||
| 184 | SXC Health Solutions Corp. ● | 18,296 | ||||||
| 98,118 | ||||||||
| Insurance - 2.4% | ||||||||
| 48 | Alleghany Corp. ● | 16,189 | ||||||
| 343 | Unum Group | 6,555 | ||||||
| 279 | W.R. Berkley Corp. | 10,859 | ||||||
| 33,603 | ||||||||
| Materials - 3.3% | ||||||||
| 216 | Carpenter Technology Corp. | 10,317 | ||||||
| 203 | FMC Corp. | 10,851 | ||||||
| 111 | Sherwin-Williams Co. | 14,655 | ||||||
| 210 | Silgan Holdings, Inc. | 8,947 | ||||||
| 44,770 | ||||||||
| Media - 2.7% | ||||||||
| 374 | AMC Networks, Inc. Class A ● | 13,300 | ||||||
| 740 | DreamWorks Animation SKG, Inc. ● | 14,103 | ||||||
| 203 | Liberty Global, Inc. ● | 10,071 | ||||||
| 37,474 | ||||||||
| Pharmaceuticals, Biotechnology & Life Sciences - 11.9% | ||||||||
| 542 | Alkermes plc ● | 9,193 | ||||||
| 861 | Amylin Pharmaceuticals, Inc. ● | 24,317 | ||||||
| 333 | Elan Corp. plc ADR ● | 4,854 | ||||||
| 399 | Incyte Corp. ● | 9,051 | ||||||
| 446 | Ironwood Pharmaceuticals, Inc. ● | 6,139 | ||||||
| 253 | Life Technologies Corp. ● | 11,397 | ||||||
| 1,080 | Mylan, Inc. ● | 23,090 | ||||||
| 115 | Regeneron Pharmaceuticals, Inc. ● | 13,097 | ||||||
| 367 | Seattle Genetics, Inc. ● | 9,306 | ||||||
| 239 | Waters Corp. ● | 19,010 | ||||||
| 448 | Watson Pharmaceuticals, Inc. ● | 33,167 | ||||||
| 162,621 | ||||||||
| Real Estate - 1.6% | ||||||||
| 307 | American Tower Corp. REIT | 21,495 | ||||||
| Retailing - 4.0% | ||||||||
| 320 | Advance Automotive Parts, Inc. | 21,851 | ||||||
| 491 | CarMax, Inc. ● | 12,745 | ||||||
| 161 | Joseph A. Bank Clothiers, Inc. ● | 6,853 | ||||||
| 298 | TripAdvisor, Inc. ● | 13,298 | ||||||
| 54,747 | ||||||||
| Semiconductors & Semiconductor Equipment - 2.9% | ||||||||
| 642 | Maxim Integrated Products, Inc. | 16,466 | ||||||
| 829 | Skyworks Solutions, Inc. ● | 22,686 | ||||||
| 39,152 | ||||||||
| Software & Services - 11.5% | ||||||||
| 158 | ANSYS, Inc. ● | 9,997 | ||||||
| 165 | Citrix Systems, Inc. ● | 13,866 | ||||||
| 132 | Factset Research Systems, Inc. | 12,234 | ||||||
The accompanying notes are an integral part of these financial statements.
| 5 |
| Hartford MidCap HLS Fund |
| Schedule of Investments – (continued) |
| June 30, 2012 (Unaudited) |
| (000’s Omitted) |
| Shares or Principal Amount | Market Value ╪ | |||||||||||
| COMMON STOCKS - 99.3% - (continued) | ||||||||||||
| Software & Services - 11.5% - (continued) | ||||||||||||
| 85 | FleetCor Technologies, Inc. ● | $ | 2,993 | |||||||||
| 226 | Gartner, Inc. Class A ● | 9,720 | ||||||||||
| 1,947 | Genpact Ltd. ● | 32,384 | ||||||||||
| 195 | Micros Systems ● | 9,964 | ||||||||||
| 771 | Rovi Corp. ● | 15,122 | ||||||||||
| 614 | VeriSign, Inc. | 26,753 | ||||||||||
| 1,220 | Western Union Co. | 20,543 | ||||||||||
| 70 | Wright Express Corp. ● | 4,299 | ||||||||||
| 157,875 | ||||||||||||
| Technology Hardware & Equipment - 3.3% | ||||||||||||
| 494 | ADTRAN, Inc. | 14,919 | ||||||||||
| 289 | Amphenol Corp. Class A | 15,867 | ||||||||||
| 521 | National Instruments Corp. | 13,994 | ||||||||||
| 44,780 | ||||||||||||
| Transportation - 3.3% | ||||||||||||
| 298 | C.H. Robinson Worldwide, Inc. | 17,437 | ||||||||||
| 392 | Expeditors International of Washington, Inc. | 15,209 | ||||||||||
| 224 | J.B. Hunt Transport Services, Inc. | 13,353 | ||||||||||
| 45,999 | ||||||||||||
| Utilities - 2.7% | ||||||||||||
| 181 | Northeast Utilities | 7,006 | ||||||||||
| 618 | UGI Corp. | 18,181 | ||||||||||
| 315 | Wisconsin Energy Corp. | 12,471 | ||||||||||
| 37,658 | ||||||||||||
| Total common stocks | ||||||||||||
| (cost $1,223,599) | $ | 1,363,221 | ||||||||||
| Total long-term investments | ||||||||||||
| (cost $1,223,599) | $ | 1,363,221 | ||||||||||
| SHORT-TERM INVESTMENTS - 0.8% | ||||||||||||
| Repurchase Agreements - 0.8% | ||||||||||||
| Bank of America Merrill Lynch TriParty Joint Repurchase Agreement (maturing on 07/02/2012 in the amount of $5,559, collateralized by FHLMC 5.50% - 6.50%, 2035 - 2036, FNMA 5.00% - 6.00%, 2033 - 2039, value of $5,670) | ||||||||||||
| $ | 5,559 | 0.13%, 06/29/2012 | $ | 5,559 | ||||||||
| Barclays Capital TriParty Joint Repurchase Agreement (maturing on 07/02/2012 in the amount of $2,010, collateralized by U.S. Treasury Note 1.25% - 3.63%, 2014 - 2020, value of $2,050) | ||||||||||||
| 2,010 | 0.15%, 06/29/2012 | 2,010 | ||||||||||
| Deutsche Bank Securities TriParty Joint Repurchase Agreement (maturing on 07/02/2012 in the amount of $538, collateralized by U.S. Treasury Note 0.88%, 2016, value of $549) | ||||||||||||
| 538 | 0.20%, 06/29/2012 | 538 | ||||||||||
| TD Securities TriParty Joint Repurchase Agreement (maturing on 07/02/2012 in the amount of $1,574, collateralized by FHLMC 4.00% - 6.00%, 2027 - 2041, FNMA 4.00% - 4.50%, 2025 - 2042, U.S. Treasury Bond 6.38%, 2027, U.S. Treasury Note 0.38% - 8.75%, 2012 - 2017, value of $1,605) | ||||||||||||
| 1,574 | 0.15%, 06/29/2012 | 1,574 | ||||||||||
| UBS Securities, Inc. Joint Repurchase Agreement (maturing on 07/02/2012 in the amount of $1, collateralized by U.S. Treasury Note 1.00%, 2013, value of $1) | ||||||||||||
| — | 0.13%, 06/29/2012 | — | ||||||||||
| UBS Securities, Inc. TriParty Joint Repurchase Agreement (maturing on 07/02/2012 in the amount of $709, collateralized by GNMA 4.00%, 2042, value of $723) | ||||||||||||
| 709 | 0.20%, 06/29/2012 | 709 | ||||||||||
| 10,390 | ||||||||||||
| Total short-term investments | ||||||||||||
| (cost $10,390) | $ | 10,390 | ||||||||||
| Total investments | ||||||||||||
| (cost $1,233,989) ▲ | 100.1 | % | $ | 1,373,611 | ||||||||
| Other assets and liabilities | (0.1 | )% | (2,019 | ) | ||||||||
| Total net assets | 100.0 | % | $ | 1,371,592 |
The accompanying notes are an integral part of these financial statements.
| 6 |
| Note: | Percentage of investments as shown is the ratio of the total market value to total net assets. |
Prices of foreign equities that are principally traded on certain foreign markets may be adjusted daily pursuant to a fair value pricing service approved by the Board of Directors in order to reflect an adjustment for factors occurring after the close of certain foreign markets but before the close of the New York Stock Exchange.
| ▲ | At June 30, 2012, the cost of securities for federal income tax purposes was $1,256,476 and the aggregate gross unrealized appreciation and depreciation based on that cost were: |
| Unrealized Appreciation | $ | 213,085 | ||
| Unrealized Depreciation | (95,950 | ) | ||
| Net Unrealized Appreciation | $ | 117,135 |
| ● | Non-income producing. |
| ╪ | See Significant Accounting Policies of accompanying Notes to Financial Statements regarding valuation of securities. |
| GLOSSARY: (abbreviations used in preceding Schedule of Investments) | ||
| Other Abbreviations: | ||
| ADR | American Depositary Receipt | |
| FHLMC | Federal Home Loan Mortgage Corp. | |
| FNMA | Federal National Mortgage Association | |
| GNMA | Government National Mortgage Association | |
| REIT | Real Estate Investment Trust | |
The accompanying notes are an integral part of these financial statements.
| 7 |
| Hartford MidCap HLS Fund |
| Investment Valuation Hierarchy Level Summary |
| June 30, 2012 (Unaudited) |
| (000’s Omitted) |
| Total | Level 1 ♦ | Level 2 ♦ | Level 3 | |||||||||||||
| Assets: | ||||||||||||||||
| Common Stocks ‡ | $ | 1,363,221 | $ | 1,363,221 | $ | – | $ | – | ||||||||
| Short-Term Investments | 10,390 | – | 10,390 | – | ||||||||||||
| Total | $ | 1,373,611 | $ | 1,363,221 | $ | 10,390 | $ | – | ||||||||
| ♦ | For the six-month period ended June 30, 2012, there were no transfers between Level 1 and Level 2. |
| ‡ | The Fund has all or primarily all of the equity securities categorized in a particular level. Refer to the Schedule of Investments for further industry breakout. |
The accompanying notes are an integral part of these financial statements.
| 8 |
| Hartford MidCap HLS Fund |
| Statement of Assets and Liabilities |
| June 30, 2012 (Unaudited) |
| (000’s Omitted) |
| Assets: | ||||
| Investments in securities, at market value (cost $1,233,989) | $ | 1,373,611 | ||
| Cash | 1 | |||
| Receivables: | ||||
| Fund shares sold | 247 | |||
| Dividends and interest | 645 | |||
| Total assets | 1,374,504 | |||
| Liabilities: | ||||
| Payables: | ||||
| Investment securities purchased | 1,418 | |||
| Fund shares redeemed | 1,287 | |||
| Investment management fees | 126 | |||
| Distribution fees | 2 | |||
| Accrued expenses | 79 | |||
| Total liabilities | 2,912 | |||
| Net assets | $ | 1,371,592 | ||
| Summary of Net Assets: | ||||
| Capital stock and paid-in-capital | $ | 1,261,566 | ||
| Undistributed net investment income | 3,963 | |||
| Accumulated net realized loss | (33,559 | ) | ||
| Unrealized appreciation of investments | 139,622 | |||
| Net assets | $ | 1,371,592 | ||
| Shares authorized | 2,400,000 | |||
| Par value | $ | 0.001 | ||
| Class IA: Net asset value per share | $ | 26.48 | ||
| Shares outstanding | 48,860 | |||
| Net assets | $ | 1,293,600 | ||
| Class IB: Net asset value per share | $ | 26.25 | ||
| Shares outstanding | 2,971 | |||
| Net assets | $ | 77,992 |
The accompanying notes are an integral part of these financial statements.
| 9 |
| Hartford MidCap HLS Fund |
| Statement of Operations |
| For the Six-Month Period Ended June 30, 2012 (Unaudited) |
| (000’s Omitted) |
| Investment Income: | ||||
| Dividends | $ | 8,066 | ||
| Interest | 6 | |||
| Less: Foreign tax withheld | (4 | ) | ||
| Total investment income, net | 8,068 | |||
| Expenses: | ||||
| Investment management fees | 4,749 | |||
| Transfer agent fees | 3 | |||
| Distribution fees - Class IB | 90 | |||
| Custodian fees | 9 | |||
| Accounting services fees | 69 | |||
| Board of Directors' fees | 20 | |||
| Audit fees | 10 | |||
| Other expenses | 84 | |||
| Total expenses (before fees paid indirectly) | 5,034 | |||
| Commission recapture | (33 | ) | ||
| Total fees paid indirectly | (33 | ) | ||
| Total expenses, net | 5,001 | |||
| Net investment income | 3,067 | |||
| Net Realized Gain on Investments and Foreign Currency Transactions: | ||||
| Net realized gain on investments | 49,260 | |||
| Net realized loss on foreign currency contracts | (14 | ) | ||
| Net realized gain on other foreign currency transactions | 44 | |||
| Net Realized Gain on Investments and Foreign Currency Transactions | 49,290 | |||
| Net Changes in Unrealized Appreciation of Investments and Foreign Currency Transactions: | ||||
| Net unrealized appreciation of investments | 91,944 | |||
| Net unrealized appreciation on translation of other assets and liabilities in foreign currencies | — | |||
| Net Changes in Unrealized Appreciation of Investments and Foreign Currency Transactions | 91,944 | |||
| Net Gain on Investments and Foreign Currency Transactions | 141,234 | |||
| Net Increase in Net Assets Resulting from Operations | $ | 144,301 |
The accompanying notes are an integral part of these financial statements.
| 10 |
| Hartford MidCap HLS Fund |
| Statement of Changes in Net Assets |
| (000’s Omitted) |
| For the Six-Month Period Ended June 30, 2012 (Unaudited) | For the Year Ended December 31, 2011 | |||||||
| Operations: | ||||||||
| Net investment income | $ | 3,067 | $ | 7,763 | ||||
| Net realized gain on investments and foreign currency transactions | 49,290 | 236,884 | ||||||
| Net unrealized appreciation (depreciation) of investments | 91,944 | (382,149 | ) | |||||
| Net Increase (Decrease) In Net Assets Resulting From Operations | 144,301 | (137,502 | ) | |||||
| Distributions to Shareholders: | ||||||||
| From net investment income | ||||||||
| Class IA | — | (10,115 | ) | |||||
| Class IB | — | (147 | ) | |||||
| Total distributions | — | (10,262 | ) | |||||
| Capital Share Transactions: | ||||||||
| Class IA | ||||||||
| Sold | 61,829 | 178,223 | ||||||
| Issued on reinvestment of distributions | — | 10,115 | ||||||
| Redeemed | (116,968 | ) | (554,640 | ) | ||||
| Total capital share transactions | (55,139 | ) | (366,302 | ) | ||||
| Class IB | ||||||||
| Sold | 12,498 | 16,499 | ||||||
| Issued on reinvestment of distributions | — | 147 | ||||||
| Redeemed | (12,513 | ) | (66,782 | ) | ||||
| Total capital share transactions | (15 | ) | (50,136 | ) | ||||
| Net decrease from capital share transactions | (55,154 | ) | (416,438 | ) | ||||
| Net Increase (Decrease) In Net Assets | 89,147 | (564,202 | ) | |||||
| Net Assets: | ||||||||
| Beginning of period | 1,282,445 | 1,846,647 | ||||||
| End of period | $ | 1,371,592 | $ | 1,282,445 | ||||
| Undistributed (distribution in excess of) net investment income | $ | 3,963 | $ | 896 | ||||
| Shares: | ||||||||
| Class IA | ||||||||
| Sold | 2,293 | 6,643 | ||||||
| Issued on reinvestment of distributions | — | 433 | ||||||
| Redeemed | (4,442 | ) | (22,270 | ) | ||||
| Total share activity | (2,149 | ) | (15,194 | ) | ||||
| Class IB | ||||||||
| Sold | 478 | 621 | ||||||
| Issued on reinvestment of distributions | — | 6 | ||||||
| Redeemed | (482 | ) | (2,487 | ) | ||||
| Total share activity | (4 | ) | (1,860 | ) | ||||
The accompanying notes are an integral part of these financial statements.
| 11 |
| Hartford MidCap HLS Fund |
| Notes to Financial Statements |
| June 30, 2012 (Unaudited) |
| (000’s Omitted) |
| 1. | Organization: |
Hartford MidCap HLS Fund (the “Fund”) serves as an underlying investment option for certain variable annuity and variable life insurance separate accounts of Hartford Life Insurance Company (“HLIC”) and its affiliates and certain qualified retirement plans. The Fund may also serve as an underlying investment option for certain variable annuity and variable life separate accounts of other insurance companies. Owners of variable annuity contracts and policyholders of variable life insurance contracts may choose the funds permitted in the variable insurance contract prospectus. In addition, participants in certain qualified retirement plans may choose the Fund if permitted by their plans.
Hartford Series Fund, Inc. (the “Company”) is an open-end registered management investment company comprised of thirty portfolios. Financial Statements for the Fund, a series of the Company, are included in this report.
The Company is organized under the laws of the State of Maryland and is registered with the Securities and Exchange Commission (“SEC”) under the Investment Company Act of 1940, as amended (“1940 Act”). The Fund is a diversified open-end management investment company.
The Fund is divided into Class IA and Class IB shares. Each class is offered at the per share net asset value (“NAV”) without a sales charge and is subject to the same expenses, except that the Class IB shares are subject to distribution and service fees charged pursuant to a Distribution Plan adopted in accordance with Rule 12b-1 under the 1940 Act.
| 2. | Significant Accounting Policies: |
The following is a summary of significant accounting policies of the Fund in the preparation of its financial statements, which are in accordance with the United States Generally Accepted Accounting Principles (“U.S. GAAP”). The preparation of financial statements in accordance with U.S. GAAP may require management to make estimates and assumptions that affect the reported amounts of assets and liabilities and disclosure of contingent assets and liabilities at the date of the financial statements and the reported amounts of increases and decreases in net assets from operations during the reporting period. Actual results could differ from those estimates.
| a) | Determination of Net Asset Value – The NAV of each class of the Fund’s shares is determined as of the close of regular trading (normally 4:00 p.m. Eastern Time) (the “NYSE Close”) on each day that the New York Stock Exchange (the “Exchange”) is open (“Valuation Date”). Information that becomes known to the Fund after the NAV has been calculated on a particular day will not generally be used to retroactively adjust the NAV determined earlier that day. |
| b) | Investment Valuation and Fair Value Measurements – For purposes of calculating the NAV, portfolio investments and other assets held by the Fund's portfolio for which market quotes are readily available are valued at market value. Market value is generally determined on the basis of last reported sales prices or official close price. If no sales are reported, market value is based on quotes obtained from a quotation reporting system, established market makers, or independent pricing services. If market prices are not readily available or are deemed unreliable, the Fund will use the fair value of the investment as determined in good faith under policies and procedures established by and under the supervision of the Company’s Board of Directors. Market quotes are considered not readily available where there is an absence of current or reliable market-based data (e.g., trade information or broker quotes), including where events occur after the close of the relevant market, but prior to the NYSE Close that materially affect the values of the Fund’s portfolio investments or assets. In addition, market quotes are considered not readily available when, due to extraordinary circumstances, the exchanges or markets on which the investments trade do not open for trading for the entire day and no other market prices are available. In addition, prices of foreign equities that are principally traded on certain foreign markets are adjusted daily pursuant to a fair value pricing service approved by the Board of Directors in order to reflect an adjustment for the factors occurring after the close of certain foreign markets but before the NYSE Close. Investments that are primarily traded on foreign markets may trade on days that are not business days of the Fund. The value of the |
| 12 |
foreign investments in which the Fund invests may change on days when a shareholder will not be able to purchase or redeem shares of the Fund. Fair value pricing is subjective in nature and the use of fair value pricing by the Fund may cause the NAV of its shares to differ significantly from the NAV that would have been calculated using market prices at the close of the exchange on which a portfolio investment is primarily traded. There can be no assurance that the Fund could obtain the fair market value assigned to an investment if the Fund were to sell the investment at approximately the time at which the Fund determines its NAV.
Investments valued in currencies other than U.S. dollars are converted to U.S. dollars using exchange rates obtained from independent pricing services for calculation of the NAV. As a result, the NAV of the Fund’s shares may be affected by changes in the value of currencies in relation to the U.S. dollar. The value of investments traded in markets outside the United States or denominated in currencies other than the U.S. dollar may be affected significantly on a day that the NYSE is closed and the market value may change on days when an investor is not able to purchase, redeem or exchange shares of the Fund.
Foreign currency contracts represent agreements to exchange currencies on specific future dates at predetermined rates. Foreign currency contracts are valued using foreign currency exchange rates and forward rates as provided by an independent pricing service on the Valuation Date.
Financial instruments for which prices are not available from an independent pricing service may be valued using market quotations obtained from one or more dealers that make markets in the respective financial instrument in accordance with procedures established by the Company’s Board of Directors.
U.S. GAAP defines fair value as the price that the Fund would receive to sell an asset or pay to transfer a liability in an orderly transaction between market participants. The U.S. GAAP fair value measurement standards require disclosure of a fair value hierarchy for each major category of assets and liabilities. Various inputs are used in determining the fair value of the Fund’s investments. These inputs are summarized into three broad hierarchy levels. This hierarchy is based on whether the valuation inputs are observable or unobservable. These levels are:
| · | Level 1 – Quoted prices in active markets for identical investments. Level 1 may include exchange traded instruments, such as domestic equities, some foreign equities, options, futures, mutual funds, exchange traded funds, rights and warrants. |
| · | Level 2 – Observable inputs other than Level 1 prices, such as quoted prices for similar investments; quoted prices in markets that are not active; or other inputs that are observable or can be corroborated by observable market data. Level 2 may include debt investments that are traded less frequently than exchange traded instruments and which are valued using independent pricing services; foreign equities, which are principally traded on certain foreign markets and are adjusted daily pursuant to a fair value pricing service in order to reflect an adjustment for the factors occurring after the close of certain foreign markets but before the NYSE Close; and short-term investments, which are valued at amortized cost. |
| · | Level 3 – Significant unobservable inputs that are supported by limited or no market activity. Level 3 may include financial instruments whose values are determined using indicative market quotes or require significant management judgment or estimation. These unobservable valuation inputs may include estimates for current yields, maturity/duration, prepayment speed, and indicative market quotes for comparable investments along with other assumptions relating to credit quality, collateral value, complexity of the investment structure, general market conditions and liquidity. This category may include investments where trading has been halted or there are certain restrictions on trading. While these investments are priced using unobservable inputs, the valuation of these investments reflects the best available data and management believes the prices are a reasonable representation of exit price. |
The Board of Directors of the Company generally reviews and approves the “Procedures for Valuation of Portfolio Securities” on an annual basis. These procedures define how investments are to be valued, including
| 13 |
| Hartford MidCap HLS Fund |
| Notes to Financial Statements – (continued) |
| June 30, 2012 (Unaudited) |
| (000’s Omitted) |
the formation of a Valuation Committee. The Valuation Committee is responsible for determining in good faith the fair value of investments when the value cannot be obtained from primary pricing services or alternative sources or if the valuation of an investment as provided by the primary pricing service or alternative source is believed not to reflect the investment’s fair value as of the Valuation Date. Members of the Valuation Committee include the Fund’s Treasurer or designee, a Vice President of the Funds with legal expertise or designee, and a Vice President of the investment manager or designee. In addition, the Fund’s chief compliance officer shall designate a member of the compliance group to attend Valuation Committee meetings as a non-voting resource, to monitor for and provide guidance with respect to compliance with these procedures. Two members of the Valuation Committee or their designees, representing different departments, shall constitute a quorum for purposes of permitting the Valuation Committee to take action. The Valuation Committee will consider all relevant factors in determining an investment’s fair value, and may seek the advice of the Fund’s sub-adviser, knowledgeable brokers and legal counsel in making such determination. The Valuation Committee reports to the Audit Committee of the Company’s Board of Directors. The Audit Committee receives quarterly written reports which include details of all fair-valued investments, including the reason for the fair valuation, and an indication, when possible, of the accuracy of the valuation by disclosing the next available reliable public price quotation or the disposition price of such investments (the “look-back” test). The Board of Directors then must consider for ratification all of the fair value determinations made during the previous quarter.
Valuation levels are not necessarily indicative of the risk associated with investing in such investments. Individual investments within any of the above mentioned asset classes may be assigned a different hierarchical level than those presented above, as individual circumstances dictate.
For additional information, refer to the Investment Valuation Hierarchy Level Summary.
For purposes of reporting transfers between different hierarchy levels, both transfers in and out of each level, as applicable, are shown as if they occurred at the beginning of the period.
| c) | Investment Transactions and Investment Income – Investment transactions are recorded as of the trade date (the date the order to buy or sell is executed) for financial reporting purposes. Investments purchased or sold on a when-issued or delayed-delivery basis may be settled a month or more after the trade date. Realized gains and losses are determined on the basis of identified cost. |
Dividend income is accrued as of the ex-dividend date, except certain dividends from foreign investments where the ex-dividend date may have passed are recorded as soon as the Fund is informed of the dividend. Interest income, including amortization of premium and accretion of discounts, is accrued on a daily basis.
| d) | Foreign Currency Transactions – Assets and liabilities denominated in currencies other than U.S. dollars are translated into U.S. dollars at the exchange rates in effect on the valuation date. Purchases and sales of investments, income, and expenses are translated into U.S. dollars at the exchange rates on the dates of such transactions. |
The Fund does not isolate that portion of portfolio investment valuation resulting from fluctuations in the foreign currency exchange rates from the fluctuations arising from changes in the market prices of investments held. Exchange rate fluctuations are included with the net realized and unrealized gain or loss on investments in the accompanying financial statements.
Net realized foreign exchange gains or losses arise from sales of foreign currencies and the difference between asset and liability amounts initially stated in foreign currencies and the U.S. dollar value of the amounts actually received or paid. Net unrealized foreign exchange gains or losses arise from changes in the value of other assets and liabilities at the end of the reporting period, resulting from changes in the exchange rates.
| 14 |
| e) | Joint Trading Account – The Fund may invest cash balances into a joint trading account that may be invested in one or more repurchase agreements. |
| f) | Fund Share Valuation and Dividend Distributions to Shareholders – Orders for the Fund’s shares are executed in accordance with the investment instructions of the contract holders and plan participants. The NAV of the Fund’s shares is determined as of the close of business on each business day of the Exchange. The NAV is determined separately for each class of shares of the Fund by dividing the Fund’s net assets attributable to that class by the number of shares of the class outstanding. Each class of shares offered by the Fund has equal rights as to assets and voting privileges (except that shareholders of a class have exclusive voting rights regarding any matter relating solely to that class of shares). Income and non-class specific expenses are allocated daily to each class on the basis of the relative net assets of the class. Realized and unrealized capital gains and losses are allocated daily based on the relative net assets of each class of shares of the Fund. |
Orders for the purchase of the Fund’s shares received prior to the close of the Exchange on any day the Exchange is open for business are priced at the NAV determined as of the close of the Exchange. Orders received after the close of the Exchange, or on a day on which the Exchange and/or the Fund is not open for business, are priced at the next determined NAV.
Dividends are declared pursuant to a policy adopted by the Company’s Board of Directors based upon the investment performance of the Fund. The policy of the Fund is to pay dividends from net investment income and realized capital gains, if any, at least once a year.
Distributions from net investment income, net realized capital gains and capital are determined in accordance with federal income tax regulations, which may differ from U.S. GAAP with respect to character and timing. These differences may include but are not limited to losses deferred due to wash sale adjustments, foreign currency gains and losses, adjustments related to Passive Foreign Investment Companies (“PFICs”), Real Estate Investment Trusts (“REITs”), Regulated Investment Companies (“RICs”), certain derivatives and partnerships. Permanent book and federal income tax basis differences relating to shareholder distributions will result in reclassifications to certain of the Fund’s capital accounts (see Federal Income Taxes: Reclassification of Capital Accounts note).
| 3. | Securities and Other Investments: |
| a) | Repurchase Agreements – A repurchase agreement is an agreement by which a counterparty agrees to sell an investment and agrees to repurchase the investment sold at a mutually agreed upon time and price. At the time the Fund enters into a repurchase agreement, the value of the underlying collateral, including accrued interest, will be equal to or exceed the value of the repurchase agreement. Repurchase agreements expose the Fund to counterparty risk. To minimize counterparty risk, the investments that serve to collateralize the repurchase agreement are held by the Fund’s custodian in book entry or physical form in the custodial account of the Fund or in a third party custodial account. Repurchase agreements are valued at cost plus accrued interest. The Fund, as shown on the Schedule of Investments, had outstanding repurchase agreements as of June 30, 2012. |
| 4. | Financial Derivative Instruments: |
The following disclosures contain information on how and why the Fund uses derivative instruments, the credit-risk-related contingent features in certain derivative instruments, and how derivative instruments affect the Fund’s financial position and results of operations. The location and fair value amounts of these instruments on the Statement of Assets and Liabilities and the realized gains and losses and changes in unrealized gains and losses on the Statement of Operations, each categorized by type of derivative contract, are included in the following Additional Derivative Instrument Information footnote. The derivative instruments outstanding as of period-end are disclosed in the notes to
| 15 |
| Hartford MidCap HLS Fund |
| Notes to Financial Statements – (continued) |
| June 30, 2012 (Unaudited) |
| (000’s Omitted) |
the Schedule of Investments and the amounts of realized gains and losses and changes in unrealized gains and losses on derivative instruments during the period are disclosed in the Statement of Operations.
| a) | Foreign Currency Contracts – The Fund may enter into foreign currency contracts that obligate the Fund to purchase or sell currencies at specified future dates. Foreign currency contracts are used to hedge the currency exposure associated with some or all of the Fund’s investments and/or as part of an investment strategy. Foreign currency contracts are marked to market daily and the change in value is recorded by the Fund as an unrealized gain or loss. The Fund will record a realized gain or loss when the foreign currency contract is settled. |
Foreign currency contracts involve elements of market risk in excess of the amounts reflected in the Statement of Assets and Liabilities. In addition, risks may arise upon entering into these contracts from the potential inability of the counterparties to meet the terms of the contracts and from unanticipated movements in the value of the foreign currencies relative to the U.S. dollar. The Fund had no outstanding foreign currency contracts as of June 30, 2012.
| b) | Additional Derivative Instrument Information: |
The volume of derivative activity was minimal during the six-month period ended June 30, 2012.
The effect of Derivative Instruments on the Statement of Operations for the six-month period ended June 30, 2012:
| Risk Exposure Category | ||||||||||||||||||||||||||||
| Interest Rate Contracts | Foreign Exchange Contracts | Credit Contracts | Equity Contracts | Commodity Contracts | Other Contracts | Total | ||||||||||||||||||||||
| Realized Gain (Loss) on Derivatives Recognized as a Result of Operations: | ||||||||||||||||||||||||||||
| Net realized loss on foreign currency contracts | $ | — | $ | (14 | ) | $ | — | $ | — | $ | — | $ | — | $ | (14 | ) | ||||||||||||
| Total | $ | — | $ | (14 | ) | $ | — | $ | — | $ | — | $ | — | $ | (14 | ) | ||||||||||||
| 5. | Principal Risks: |
| a) | Counterparty Risk – The Fund may be exposed to counterparty risk, or the risk that an institution or other entity with which the Fund has unsettled or open transactions will default. |
| b) | Market Risks – If the Fund invests directly in foreign currencies or in securities that trade in, and receive revenues in, foreign currencies, or in derivatives that provide exposure to foreign currencies, it will be subject to the risk that those currencies will decline in value relative to the base currency of the Fund, or, in the case of hedging positions, that the Fund’s base currency will decline in value relative to the currency being hedged. Currency rates in foreign countries may fluctuate significantly over short periods of time for a number of reasons, including changes in interest rates, intervention (or the failure to intervene) by U.S. or foreign governments, central banks or supranational entities, such as the International Monetary Fund, or by the imposition of currency controls or other political developments in the United States or abroad. As a result, the Fund’s investments in foreign currency denominated securities may reduce the returns of the Fund. The market values of equity securities, such as common stocks and preferred stocks, or equity related investments, such as futures and options, may decline due to general market conditions which are not specifically related to a particular company, such as real or perceived adverse economic conditions, changes in the general outlook for corporate earnings, changes in interest or currency rates or adverse investor sentiment generally. The market value of equity securities may also decline due to factors which affect a particular industry or industries, such as labor shortages or increased production costs and competitive conditions within an industry. Equity securities and equity related investments generally have greater market price volatility than fixed income securities. |
| 16 |
6. Federal Income Taxes:
| a) | Federal Income Taxes – For federal income tax purposes, the Fund intends to continue to qualify as a RIC under Subchapter M of the Internal Revenue Code (“IRC”) by distributing substantially all of its taxable net investment income and net realized capital gains to its shareholders and otherwise complying with the requirements of RICs. The Fund has distributed substantially all of its income and capital gains in prior years, if applicable, and intends to distribute substantially all of its income and capital gains prior to the next fiscal year-end. Accordingly, no provision for federal income or excise taxes has been made in the accompanying financial statements. Distributions from short-term capital gains are treated as ordinary income distributions for federal income tax purposes. |
| b) | Net Investment Income (Loss), Net Realized Gains (Losses) – Net investment income (loss) and net realized gains (losses) may differ for financial statement and tax purposes primarily because of losses deferred due to wash sale adjustments, foreign currency gains and losses, adjustments related to PFICs, REITs, RICs, certain derivatives and partnerships. The character of distributions made during the year from net investment income or net realized gains may differ from their ultimate characterization for federal income tax purposes. Also, due to the timing of dividend distributions, the fiscal year in which amounts are distributed may differ from the year that the income or realized gains (losses) were recorded by the Fund. |
| c) | Distributions and Components of Distributable Earnings – The tax character of distributions paid by the Fund for the periods indicated is as follows (as adjusted for dividends payable): |
| For the Year Ended December 31, 2011 | For the Year Ended December 31, 2010 | |||||||
| Ordinary Income | $ | 10,262 | $ | 4,020 | ||||
As of December 31, 2011, the Fund’s components of distributable earnings (deficit) on a tax basis were as follows:
| Amount | ||||
| Undistributed Ordinary Income | $ | 896 | ||
| Accumulated Capital and Other Losses* | (60,362 | ) | ||
| Unrealized Appreciation† | 25,191 | |||
| Total Accumulated Deficit | $ | (34,275 | ) | |
| * | The Fund has capital loss carryforwards that are identified in the Capital Loss Carryforward note that follows. |
| † | The difference between book-basis and tax-basis unrealized appreciation (depreciation) may be attributable to the losses deferred due to wash sale adjustments, foreign currency gains and losses, adjustments related to PFICs, REITs, RICs, certain derivatives and partnerships. |
| d) | Reclassification of Capital Accounts – The Fund may record reclassifications in its capital accounts. These reclassifications have no impact on the total net assets of the Fund. The reclassifications are a result of permanent differences between U.S. GAAP and tax accounting for such items as foreign currency, PFICs, expiration or utilization of capital loss carryforwards or net operating losses. Adjustments are made to reflect the impact these items have on current and future distributions to shareholders. Therefore, the source of the Fund’s distributions may be shown in the accompanying Statement of Changes in Net Assets as from undistributed net investment income, from accumulated net realized gains on investments or from capital depending on the type of book and tax differences that exist. For the year ended December 31, 2011, the Fund recorded reclassifications to increase (decrease) the accounts listed below: |
| Amount | ||||
| Undistributed Net Investment Income | $ | (347 | ) | |
| Accumulated Net Realized Gain (Loss) | 347 | |||
| 17 |
| Hartford MidCap HLS Fund |
| Notes to Financial Statements – (continued) |
| June 30, 2012 (Unaudited) |
| (000’s Omitted) |
| e) | Capital Loss Carryforward – On December 22, 2010, the Regulated Investment Company Modernization Act of 2010 (the “Act”) was enacted, which made changes to the capital loss carryforward rules. The changes are effective for taxable years beginning after the date of enactment. Under the Act, funds are permitted to carry forward capital losses for an unlimited period. However, any losses incurred during those future taxable years will be required to be utilized prior to the losses incurred in pre-enactment taxable years, which carry an expiration date. As a result of this ordering rule, pre-enactment capital loss carryforwards may be more likely to expire unused. Additionally, post-enactment capital loss carryforwards retain their character as either short-term or long-term capital losses rather than being considered all short-term as permitted under prior regulation. |
At December 31, 2011 (tax-year-end), the Fund had capital loss carryforwards for U.S. federal income tax purposes as follows:
| Year of Expiration | Amount | |||
| 2017 | $ | 60,362 | ||
| Total | $ | 60,362 | ||
During the year ended December 31, 2011, the Fund utilized $250,501 of prior year capital loss carryforwards.
| f) | Accounting for Uncertainty in Income Taxes – The Fund has adopted financial reporting rules that require the Fund to analyze all open tax years, as defined by the statute of limitations, for all major jurisdictions. Generally, tax authorities can examine all tax returns filed for the last three years. The Fund does not have an examination in progress. |
The Fund has reviewed all open tax years and major jurisdictions and concluded that these financial reporting rules had no effect on the Fund’s financial position or results of operations. There is no tax liability resulting from unrecognized tax benefits relating to uncertain income tax positions taken or expected to be taken on the tax return for the fiscal year ended December 31, 2011. The Fund is also not aware of any tax positions for which it is reasonably possible that the total amounts of unrecognized tax benefits will significantly change in the next twelve months.
| 7. | Expenses: |
| a) | Investment Management Agreement – HL Investment Advisors, LLC (“HL Advisors”), an indirect wholly owned subsidiary of The Hartford Financial Services Group, Inc. (“The Hartford”), serves as investment manager to the Fund pursuant to an Investment Management Agreement with the Company. As investment manager, HL Advisors has overall investment supervisory responsibility for the Fund. In addition, HL Advisors provides administrative personnel, services, equipment, facilities and office space for proper operation of the Fund. HL Advisors has contracted with Wellington Management Company, LLP (“Wellington Management”) under a sub-advisory agreement for the provision of day-to-day investment management services to the Fund in accordance with the Fund’s investment objective and policies. The Fund pays a fee to HL Advisors, a portion of which may be used to compensate Wellington Management. |
The schedule below reflects the rates of compensation paid to HL Advisors for investment management services rendered as of June 30, 2012; the rates are accrued daily and paid monthly.
| Average Daily Net Assets | Annual Fee | |||
| On first $250 million | 0.7750 | % | ||
| On next $250 million | 0.7250 | % | ||
| On next $500 million | 0.6750 | % | ||
| On next $4 billion | 0.6250 | % | ||
| On next $5 billion | 0.6225 | % | ||
| Over $10 billion | 0.6200 | % | ||
| 18 |
| b) | Accounting Services Agreement – Pursuant to the Fund Accounting Agreement between HLIC and the Company, on behalf of the Fund, HLIC provides accounting services to the Fund and receives monthly compensation based on the Fund’s average daily net assets at the rates set forth below. The Fund’s accounting services fees are accrued daily and paid monthly. |
| Average Daily Net Assets | Annual Fee | |||
| All assets | 0.010 | % | ||
| c) | Operating Expenses – Allocable expenses incurred by the Company are allocated to each Fund and allocated to classes within a Fund in proportion to the average daily net assets of the Fund and each class, except where allocation of certain expenses is more fairly made directly to the Fund or to specific classes within a Fund. |
| d) | Fees Paid Indirectly – The Company, on behalf of the Fund, has entered into agreements with State Street Global Markets, LLC and Russell Implementation Services, Inc. to partially recapture non-discounted trade commissions. Such rebates are used to pay a portion of the Fund’s expenses. In addition, the Fund’s custodian bank has also agreed to reduce its fees when the Fund maintains cash on deposit in a non-interest-bearing custody account. For the six-month period ended June 30, 2012, these amounts, if any, are included in the Statement of Operations. |
The ratio of expenses to average net assets in the accompanying financial highlights excludes the reduction in expenses related to fees paid indirectly. The annualized expense ratio for the period listed below reflecting the reduction for fees paid indirectly is as follows:
| Annualized Six- Month Period Ended June 30, 2012 | ||||
| Class IA | 0.71 | % | ||
| Class IB | 0.96 | % | ||
| e) | Distribution Plan for Class IB shares – The Company, on behalf of the Fund, has adopted a Distribution Plan pursuant to Rule 12b-1 of the 1940 Act to compensate the Distributor, Hartford Securities Distribution Company, Inc. (a wholly owned, ultimate subsidiary of The Hartford), from assets attributable to the Class IB shares for services rendered and expenses borne in connection with activities primarily intended to result in the sale of the Class IB shares, subject to the review and approval of the Company’s Board of Directors. |
The Distribution Plan provides that the Fund may pay annually up to 0.25% of the average daily net assets of the Fund attributable to its Class IB shares for activities primarily intended to result in the sale of Class IB shares. The Board has the authority to suspend or reduce these payments at any point in time. Under the terms of the Distribution Plan and the principal underwriting agreement, the Fund is authorized to make payments monthly to the Distributor that may be used to pay or compensate entities providing distribution and shareholder servicing with respect to the Class IB shares for such entities’ fees or expenses incurred or paid in that regard. These fees are accrued daily and paid monthly.
| f) | Other Related Party Transactions – Certain officers of the Fund are directors and/or officers of HL Advisors and/or The Hartford or its subsidiaries. For the six-month period ended June 30, 2012, a portion of the Fund’s chief compliance officer’s salary was paid by all the investment companies in the Hartford fund complex. The portion allocated to the Fund was in the amount of $1. Hartford Administrative Services Company (“HASCO”), an indirect wholly owned subsidiary of The Hartford, provides transfer agent services to the Fund. HASCO was compensated on a per account basis for providing such services. The amount paid to HASCO can be found in the Statement of Operations. These fees are accrued daily and paid monthly. |
| 19 |
| Hartford MidCap HLS Fund |
| Notes to Financial Statements – (continued) |
| June 30, 2012 (Unaudited) |
| (000’s Omitted) |
| g) | Payment from Affiliate – In July of 2007, The Hartford entered into a settlement with the Attorneys General of the states of New York, Connecticut and Illinois relating to market timing and the company's individual variable annuity contracts in which certain payments would be made directly to the variable annuity contract holders. The distribution plan provided that unclaimed money from the settlement would be distributed to certain HLS Funds that are investment options through a Hartford individual variable annuity contract. The unclaimed money was distributed to the Fund on September 18, 2009. |
The total return in the accompanying financial highlights includes a payment from an affiliate. Had the payment from the affiliate been excluded, the impact and total return for the period listed below would have been as follows:
| For the Year Ended December 31, 2009 | ||||||||
| Class IA | Class IB | |||||||
| Impact from Payment from Affiliate for Attorneys General Settlement | 0.03 | % | 0.03 | % | ||||
| Total Return Excluding Payment from Affiliate | 30.92 | % | 30.59 | % | ||||
| 8. | Investment Transactions: |
For the six-month period ended June 30, 2012, the Fund's aggregate purchases and sales of investment securities (excluding short-term investments) were as follows:
| Amount | ||||
| Cost of Purchases Excluding U.S. Government Obligations | $ | 355,846 | ||
| Sales Proceeds Excluding U.S. Government Obligations | 404,853 | |||
| 9. | Line of Credit: |
The Fund is one of several Hartford funds that participate in a $500 million committed revolving line of credit facility. The facility is to be used for temporary or emergency purposes. Under the arrangement, the funds are required to own securities having a market value in excess of 300% of the total bank borrowings. The interest rate on borrowings varies depending on the nature of the loan. The facility also requires a fee to be paid based on the amount of the commitment. This commitment fee is allocated to all of the funds participating in the line of credit based on the average net assets of the funds. During the six-month period ended June 30, 2012, the Fund did not have any borrowings under this facility.
| 10. | Industry Classifications: |
Other than the industry classifications “Other Investment Pools and Funds��� and “Exchange Traded Funds,” equity industry classifications used in this report are the Global Industry Classification Standard, which was developed by and is the exclusive property and service mark of MSCI, Inc. and Standard & Poor’s.
| 11. | Indemnifications: |
Under the Company’s organizational documents, the Company shall indemnify its officers and directors to the full extent required or permitted under Maryland General Corporation Law and the federal securities laws. In addition, the Company, on behalf of the Fund, may enter into contracts that contain a variety of indemnifications. The Company’s maximum exposure under these arrangements is unknown. However, as of the date of these financial statements, the Company has not had prior claims or losses pursuant to these contracts and expects the risk of loss to be remote.
| 20 |
[This page is intentionally left blank]
| 21 |
| Hartford MidCap HLS Fund |
| Financial Highlights |
| - Selected Per-Share Data (A) - |
| Class | Net Asset Value at Beginning of Period | Net Investment Income (Loss) | Payments from (to) Affiliate | Net Realized and Unrealized Gain (Loss) on Investments | Total from Investment Operations | Dividends from Net Investment Income | Distributions from Realized Capital Gains | Distributions from Capital | Total Distributions | Net Increase (Decrease) in Net Asset Value | Net Asset Value at End of Period | |||||||||||||||||||||||||||||||||
| For the Six-Month Period Ended June 30, 2012 (Unaudited) | ||||||||||||||||||||||||||||||||||||||||||||
| IA | $ | 23.77 | $ | 0.06 | $ | – | $ | 2.65 | $ | 2.71 | $ | – | $ | – | $ | – | $ | – | $ | 2.71 | $ | 26.48 | ||||||||||||||||||||||
| IB | 23.59 | 0.02 | – | 2.64 | 2.66 | – | – | – | – | 2.66 | 26.25 | |||||||||||||||||||||||||||||||||
| For the Year Ended December 31, 2011 | ||||||||||||||||||||||||||||||||||||||||||||
| IA | 26.01 | 0.15 | – | (2.20 | ) | (2.05 | ) | (0.19 | ) | – | – | (0.19 | ) | (2.24 | ) | 23.77 | ||||||||||||||||||||||||||||
| IB | 25.74 | 0.07 | – | (2.17 | ) | (2.10 | ) | (0.05 | ) | – | – | (0.05 | ) | (2.15 | ) | 23.59 | ||||||||||||||||||||||||||||
| For the Year Ended December 31, 2010 | ||||||||||||||||||||||||||||||||||||||||||||
| IA | 21.12 | 0.10 | – | 4.85 | 4.95 | (0.06 | ) | – | – | (0.06 | ) | 4.89 | 26.01 | |||||||||||||||||||||||||||||||
| IB | 20.92 | 0.04 | – | 4.79 | 4.83 | (0.01 | ) | – | – | (0.01 | ) | 4.82 | 25.74 | |||||||||||||||||||||||||||||||
| For the Year Ended December 31, 2009 | ||||||||||||||||||||||||||||||||||||||||||||
| IA | 16.21 | 0.11 | 0.01 | 4.89 | 5.01 | (0.10 | ) | – | – | (0.10 | ) | 4.91 | 21.12 | |||||||||||||||||||||||||||||||
| IB | 16.06 | 0.04 | 0.01 | 4.86 | 4.91 | (0.05 | ) | – | – | (0.05 | ) | 4.86 | 20.92 | |||||||||||||||||||||||||||||||
| For the Year Ended December 31, 2008 | ||||||||||||||||||||||||||||||||||||||||||||
| IA | 26.34 | 0.12 | – | (9.03 | ) | (8.91 | ) | (0.12 | ) | (1.10 | ) | – | (1.22 | ) | (10.13 | ) | 16.21 | |||||||||||||||||||||||||||
| IB | 26.08 | 0.06 | – | (8.92 | ) | (8.86 | ) | (0.06 | ) | (1.10 | ) | – | (1.16 | ) | (10.02 | ) | 16.06 | |||||||||||||||||||||||||||
| For the Year Ended December 31, 2007 (H) | ||||||||||||||||||||||||||||||||||||||||||||
| IA | 26.99 | 0.06 | – | 3.99 | 4.05 | (0.15 | ) | (4.55 | ) | – | (4.70 | ) | (0.65 | ) | 26.34 | |||||||||||||||||||||||||||||
| IB | 26.76 | (0.01 | ) | – | 3.95 | 3.94 | (0.07 | ) | (4.55 | ) | – | (4.62 | ) | (0.68 | ) | 26.08 | ||||||||||||||||||||||||||||
| (A) | Information presented relates to a share outstanding throughout the indicated period. |
| (B) | The figures do not include sales charges or other fees which may be applied at the variable life insurance, variable annuity or qualified retirement plan product level. Any such additional sales charges or other fees would lower the Fund's performance. |
| (C) | Ratios do not reflect reductions for fees paid indirectly. Please see Fees Paid Indirectly in the Notes to Financial Statements. |
| (D) | Portfolio turnover rate is calculated on the basis of the Fund as a whole without distinguishing between the classes of shares issued. |
| (E) | Not annualized. |
| (F) | Annualized. |
| (G) | Total return without the inclusion of the Payment from (to) Affiliate can be found in Expenses in the accompanying Notes to Financial Statements. |
| (H) | Per share amounts have been calculated using the average shares method. |
| 22 |
| - Ratios and Supplemental Data - |
| Total Return(B) | Net Assets at End of Period | Ratio of Expenses to Average Net Assets Before Waivers(C) | Ratio of Expenses to Average Net Assets After Waivers(C) | Ratio of Net Investment Income (Loss) to Average Net Assets | Portfolio Turnover Rate(D) | |||||||||||||||||
| 11.40 | %(E) | $ | 1,293,600 | 0.72 | %(F) | 0.72 | %(F) | 0.46 | %(F) | 26 | % | |||||||||||
| 11.26 | (E) | 77,992 | 0.97 | (F) | 0.97 | (F) | 0.20 | (F) | – | |||||||||||||
| (7.92 | ) | 1,212,257 | 0.71 | 0.71 | 0.48 | 69 | ||||||||||||||||
| (8.16 | ) | 70,188 | 0.96 | 0.96 | 0.18 | – | ||||||||||||||||
| 23.45 | 1,722,182 | 0.70 | 0.70 | 0.44 | 52 | |||||||||||||||||
| 23.15 | 124,465 | 0.95 | 0.95 | 0.12 | – | |||||||||||||||||
| �� | ||||||||||||||||||||||
| 30.96 | (G) | 1,490,852 | 0.72 | 0.72 | 0.48 | 82 | ||||||||||||||||
| 30.62 | (G) | 173,205 | 0.97 | 0.97 | 0.23 | – | ||||||||||||||||
| (35.32 | ) | 1,552,741 | 0.69 | 0.69 | 0.51 | 92 | ||||||||||||||||
| (35.49 | ) | 169,328 | 0.94 | 0.94 | 0.26 | – | ||||||||||||||||
| 15.30 | 2,716,285 | 0.69 | 0.69 | 0.22 | 79 | |||||||||||||||||
| 15.01 | 302,151 | 0.94 | 0.94 | (0.03 | ) | – | ||||||||||||||||
| 23 |
| Hartford MidCap HLS Fund |
| Directors and Officers (Unaudited) |
The Board of Directors of the Company appoints officers who are responsible for the day-to-day operations of the Fund and who execute policies formulated by the Directors. Each director serves until his or her death, resignation, or retirement or until the next annual meeting of shareholders is held or until his or her successor is elected and qualifies.
Directors and officers who are employed by or who have a financial interest in The Hartford are considered “interested” persons of the Fund pursuant to the 1940 Act. Each officer and two of the Company’s directors, as noted in the chart below, are “interested” persons of the Fund. Each director serves as a director for The Hartford Mutual Funds, Inc., The Hartford Mutual Funds II, Inc., Hartford Series Fund, Inc., Hartford HLS Series Fund II, Inc., and as a trustee for The Hartford Alternative Strategies Fund, which, as of June 30, 2012, collectively consist of 89 funds. Correspondence may be sent to directors and officers c/o Hartford Mutual Funds, P.O. Box 2999, Hartford, Connecticut 06104-2999, except that correspondence to Mr. Annoni, Mr. Dressen and Ms. Fagely may be sent to 500 Bielenberg Drive, Woodbury, Minnesota 55125.
The table below sets forth, for each director and officer, his or her name, year of birth, current position with the Company and date first elected or appointed to Hartford Series Fund, Inc. (“HSF”), and Hartford HLS Series Fund II, Inc. (“HSF2”), principal occupation, and, for directors, other directorships held. The Fund’s statement of additional information contains further information on the directors and is available free of charge by calling 1-800-862-6668 or writing to Hartford HLS Funds, c/o Individual Annuity Services, P.O. Box 5085, Hartford, CT 06102-5085.
Information on the aggregate remuneration paid to the directors of the Company can be found in the Statement of Operations herein. The Fund pays to The Hartford a portion of the Chief Compliance Officer’s compensation, but does not pay salaries or compensation to any of their other officers or directors who are employed by The Hartford.
Non-Interested Directors
Lynn S. Birdsong (1946) Director since 2003, Co-Chairman of the Investment Committee
Mr. Birdsong is a private investor. Mr. Birdsong currently serves as a Director of the Sovereign High Yield Investment Company (April 2010 to current). Mr. Birdsong currently serves as an Independent Director of Nomura Partners Funds, Inc. (formerly, The Japan Fund) (March 2003 to current). From 1979 to 2002, Mr. Birdsong was a managing director of Zurich Scudder Investments, an investment management firm. During his employment with Scudder, Mr. Birdsong was an Interested Director of The Japan Fund. Since 1981, Mr. Birdsong has been a partner in Birdsong Company, an advertising specialty firm.
Robert M. Gavin, Jr. (1940) Director since 2002 (HSF) and 1986 (HSF2), Chairman of the Board since 2004
Dr. Gavin is an educational consultant. Prior to September 1, 2001, he was President of Cranbrook Education Community and prior to July 1996, he was President of Macalester College, St. Paul, Minnesota.
Duane E. Hill (1945) Director since 2001 (HSF) and 2002 (HSF2), Chairman of the Nominating Committee
Mr. Hill is Partner of TSG Ventures L.P., a private equity investment company. Mr. Hill is a former partner of TSG Capital Group, a private equity investment firm that served as sponsor and lead investor in leveraged buyouts of middle market companies.
Sandra S. Jaffee (1941) Director since 2005
Ms. Jaffee is the founder and Chief Executive Officer of a private company, Homeworks Concierge, LLC, which provides residential property management services in Westchester County, New York (January 2012 to present). Ms. Jaffee served as Chairman (2008 to 2009) and Chief Executive Officer of Fortent (formerly Searchspace Group), a leading provider of compliance/regulatory technology to financial institutions from August 2005 to August 2009. Ms. Jaffe currently serves as a member of the Board of Directors of Broadridge Financial Solutions as well as a Trustee of Muhlenberg College.
William P. Johnston (1944) Director since 2005, Chairman of the Compliance Committee
In June 2006, Mr. Johnston was appointed as Senior Advisor to The Carlyle Group, a global private equity investment firm. In August 2007, Mr. Johnston was elected to the Board of Directors of LifeCare Holdings, Inc. In February 2008, Mr. Johnston was elected to the Board of Directors of HCR-ManorCare, Inc. In May 2006, Mr. Johnston was elected to the Supervisory Board of Fresenius Medical Care AG & Co. KGaA, after its acquisition of Renal Care Group, Inc. in March 2006.
Phillip O. Peterson (1944) Director since 2002 (HSF) and 2000 (HSF2), Chairman of the Audit Committee
Mr. Peterson is a mutual fund industry consultant. He was a partner of KPMG LLP (an accounting firm) until July 1999. Mr. Peterson joined William Blair Funds in February 2007 as a member of the Board of Trustees. Mr. Peterson also joined the Board of Trustees of Symetra Variable Mutual Funds Trust as a trustee in February 2012.
| 24 |
Lemma W. Senbet (1946) Director since 2005
Dr. Senbet is the William E. Mayer Chair Professor of Finance and Director, Center for Financial Policy, at the University of Maryland, Robert H. Smith School of Business. He was chair of the Finance Department from 1998 to 2006. Previously he was a chaired professor of finance at the University of Wisconsin-Madison. Also, he was director of the Fortis Funds from March 2000 to July 2002. Dr. Senbet served the finance profession in various capacities, including as director of the American Finance Association and President of the Western Finance Association. In 2006, Dr. Senbet was inducted Fellow of Financial Management Association International for his career-long distinguished scholarship and professional service.
Interested Directors and Officers
David N. Levenson (1966) Director since 2010(1)
Mr. Levenson currently serves as President of The Hartford’s Wealth Management business. He was appointed to this role in July 2010. Previously, Mr. Levenson served as Executive Vice President of Legacy Holdings for The Hartford from June 2009 to July 2010. From 2006 to 2009, Mr. Levenson was with Hartford Life Insurance K.K. where he served as President and Chief Executive Officer from 2007 to 2009. He served as Managing Director of Hartford Investment Management Company from 2005 to 2006. Additionally, Mr. Levenson serves as Executive Vice President of The Hartford and as President, Director and Chief Executive Officer of Hartford Life Insurance Company (“HLIC”) and Hartford Life, Inc. (“HL Inc.”).
(1) Mr. Levenson served as Interested Director until August 2, 2012.
Lowndes A. Smith (1939) Director since 1996 (HSF) and 2002 (HSF2), Co-Chairman of the Investment Committee
Mr. Smith served as Vice Chairman of The Hartford from February 1997 to January 2002, as President and Chief Executive Officer of HL Inc. from February 1997 to January 2002, and as President and Chief Operating Officer of The Hartford Life Insurance Companies from January 1989 to January 2002. Mr. Smith serves as a Director of White Mountains Insurance Group, Ltd., One Beacon Insurance and Symetra Financial and as Managing Director of Whittington Gray Associates.
Other Officers
James E. Davey (1964) President and Chief Executive Officer since 2010(2)
Mr. Davey serves as Executive Vice President of HLIC. Additionally, Mr. Davey serves as President, Chief Executive Officer and Manager of HIFSCO and President, Chief Executive Officer and Manager of HL Investment Advisors, LLC (“HL Advisors”). Mr. Davey joined The Hartford in 2002.
(2) Mr. Davey became an Interested Director effective August 2, 2012.
Mark A. Annoni (1964) Vice President, Controller and Treasurer since 2012(3)
Mr. Annoni serves as the Assistant Vice President and Director of Investment Finance (February 2004 to present). Mr. Annoni joined The Hartford in April 2001 as part of The Hartford’s acquisition of Fortis Financial Group. Prior to joining The Hartford, Mr. Annoni served as Manager of Mutual Fund Accounting at Fortis Financial Group (July 1997 to April 2001).
(3) Mr. Annoni was named Vice President, Controller and Treasurer on May 8, 2012.
Michael R. Dressen (1963) AML Compliance Officer since 2011
Mr. Dressen currently serves as Assistant Vice President of HLIC. He also serves as Chief Compliance Officer and AML Compliance Officer of Hartford Administrative Services Company (“HASCO”) and as Assistant Secretary and Compliance Officer of HIFSCO. Mr Dressen joined The Hartford in 2005 from State Farm Insurance Companies where he held various positions related to mutual funds, variable products, and property casualty insurance.
Tamara L. Fagely (1958) Vice President, since 2002 (HSF) and 1993 (HSF2)(4)
Ms. Fagely has been a Vice President of HASCO since 1998 and Chief Financial Officer since 2006. Currently Ms. Fagely is a Vice President of HLIC. She served as Assistant Vice President of HLIC from December 2001 through March 2005. In addition, Ms. Fagely is Controller and Chief Financial Officer of HIFSCO.
(4) Ms. Fagely served as Vice President, Controller and Treasurer until May 8, 2012.
Dr. Robert J. Froehlich (1953) Senior Managing Director since 2009(5)
Dr. Froehlich joined The Hartford as Senior Managing Director in September 2009. Prior to joining The Hartford, Dr. Froehlich served as Vice Chairman of Deutsche Asset Management from 1997-2009.
(5) Dr. Froehlich served as Senior Managing Director until March 26, 2012.
| 25 |
| Hartford MidCap HLS Fund |
| Directors and Officers (Unaudited) – (continued) |
Edward P. Macdonald (1967) Vice President, Secretary and Chief Legal Officer since 2005
Mr. Macdonald serves as Vice President of HLIC and Chief Legal Officer of Mutual Funds and Vice President of HIFSCO. He also serves as Vice President and Secretary of HASCO, and Chief Legal Officer, Secretary and Vice President of HL Advisors. Mr. Macdonald joined The Hartford in 2005.
Vernon J. Meyer (1964) Vice President since 2006
Mr. Meyer serves as Senior Vice President of HLIC. He also serves as Senior Vice President of HIFSCO and HL Advisors. Mr. Meyer joined The Hartford in 2004.
Colleen B. Pernerewski (1969) Vice President and Chief Compliance Officer since 2010
Ms. Pernerewski serves as Vice President and Chief Investment Advisor Compliance Officer of HIFSCO and as Vice President and Chief Compliance Officer of HL Advisors. Ms. Pernerewski serves as Vice President and Chief Compliance Officer of Individual Annuity of HLIC. Ms. Pernerewski joined The Hartford in 2005 from Travelers Life and Annuity where she served as Counsel (2004-2005). Prior to Travelers Life and Annuity, Ms. Pernerewski held the position of Counsel at The Hartford (1998-2004).
Elizabeth L. Schroeder (1966) Vice President since 2010
Ms. Schroeder currently serves as Assistant Vice President of HLIC. Ms. Schroeder joined HLIC in 1991. She is also an Assistant Vice President of HASCO, HIFSCO and HL Advisors.
Martin Swanson (1962) Vice President since 2010
Mr. Swanson is a Vice President of HLIC. Mr. Swanson also serves as Vice President/Marketing for HIFSCO. Prior to joining HLIC in 1998, Mr. Swanson was a Vice President at PaineWebber, Inc.
Jane Wolak (1961) Vice President since 2009
Ms. Wolak currently serves as Senior Vice President of HLIC. Ms. Wolak joined HLIC as Vice President, Retail Product Services in May 2007. She is also Vice President of HASCO. Previously, Ms. Wolak was with Sun Life Financial where she held the position of Vice President, Service Center Operations from 2001-2007.
HOW TO OBTAIN A COPY OF THE FUND’S PROXY VOTING POLICIES AND VOTING RECORDS (UNAUDITED)
A description of the policies and procedures that the Fund uses to determine how to vote proxies relating to portfolio securities and a record of how the Fund voted any proxies for the twelve-month period ended June 30, 2012 are available (1) without charge, upon request, by calling 800-862-6668 and (2) on the SEC’s website at http://www.sec.gov.
QUARTERLY PORTFOLIO HOLDINGS INFORMATION (UNAUDITED)
The Fund files a complete schedule of portfolio holdings with the SEC for the first and third quarters of each fiscal year on Form N-Q. The Fund’s Forms are available (1) without charge, upon request, by calling 800-862-6668 and (2) on the SEC’s website at http://www.sec.gov. The Form N-Q may be reviewed and copied at the SEC’s Public Reference Room in Washington, DC. Information on the operation of the Public Reference Room may be obtained by calling 1-800-SEC-0330.
| 26 |
| Hartford MidCap HLS Fund |
| Expense Example (Unaudited) |
Your Fund's Expenses
As a shareholder of the Fund, you incur two types of costs: (1) transaction costs and (2) ongoing costs including investment management fees, distribution fees, and other fund expenses. This example is intended to help you understand your ongoing costs (in dollars) of investing in the Fund and to compare these costs with the ongoing costs of investing in other mutual funds. The example is based on an investment of $1,000 invested at the beginning of the period and held for the period of December 31, 2011 through June 30, 2012.
Actual Expenses
The first set of columns of the table below provides information about actual account values and actual expenses. You may use the information in this column, together with the amount you invested, to estimate the expenses that you paid over the period. Simply divide your account value by $1,000 (for example, an $8,600 account value divided by $1,000 = 8.6), then multiply the result by the number in the line under the heading entitled “Expenses Paid During Period” to estimate the expenses you paid on your account during this period.
Hypothetical Example for Comparison Purposes
The second set of columns of the table below provides information about hypothetical account values and hypothetical expenses based on the Fund’s actual expense ratio and an assumed rate of return of 5% per year before expenses, which is not the Fund’s actual return. The hypothetical account values and expenses may not be used to estimate the actual ending account balance or expenses you paid for the period. You may use this information to compare the ongoing costs of investing in the Fund and other funds. To do so, compare this 5% hypothetical example with the 5% hypothetical examples that appear in the shareholder reports of the other funds.
Please note that the expenses shown in the table are meant to highlight your ongoing costs only and do not reflect any transactional costs, such as sales charges (loads) and CDSC. Therefore, the second set of columns of the table is useful in comparing ongoing costs only, and will not help you determine the relative total costs of owning different funds. In addition, if these transactional costs were included, your costs would be higher. Expenses are equal to the Fund's annualized expense ratios multiplied by average account value over the period, multiplied by 182/366 (to reflect the one-half year period).
| Actual return | Hypothetical (5% return before expenses) | |||||||||||||||||||||||||||||||||||
| Beginning Account Value December 31, 2011 | Ending Account Value June 30, 2012 | Expenses paid during the period December 31, 2011 through June 30, 2012 | Beginning Account Value December 31, 2011 | Ending Account Value June 30, 2012 | Expenses paid during the period December 31, 2011 through June 30, 2012 | Annualized expense ratio | Days in the current 1/2 year | Days in the full year | ||||||||||||||||||||||||||||
| Class IA | $ | 1,000.00 | $ | 1,114.04 | $ | 3.78 | $ | 1,000.00 | $ | 1,021.28 | $ | 3.62 | 0.72 | % | 182 | 366 | ||||||||||||||||||||
| Class IB | $ | 1,000.00 | $ | 1,112.65 | $ | 5.10 | $ | 1,000.00 | $ | 1,020.04 | $ | 4.87 | 0.97 | % | 182 | 366 | ||||||||||||||||||||
| 27 |
HARTFORD HLS FUNDS
c/o The Hartford Wealth Management - Global Annuities
P.O. Box 14293
Lexington, KY 40512-4293
Hartford Series Fund, Inc. is underwritten and distributed by Hartford Securities Distribution Company, Inc.
"The Hartford" is The Hartford Financial Services Group, Inc. and its subsidiaries.
Hartford Series Fund, Inc. inception dates range from 1977 to date. Hartford Series Fund, Inc. is not a subsidiary of The Hartford but is underwritten, distributed by and advised by subsidiaries of The Hartford. Investments in Hartford Series Fund, Inc. are not guaranteed by The Hartford or any other entity.
You should carefully consider investment objectives, risks, and charges and expenses of Hartford HLS Funds before investing. This and other information can be found in the Fund’s prospectus or summary prospectus, which can be obtained by calling 800-862-6668. Please read them carefully before you invest or send money.
| HLSSAR-MC12 8-12 111647 Printed in U.S.A ©2012 The Hartford, Hartford, CT 06115 | |

A MESSAGE FROM THE PRESIDENT
Dear Fellow Shareholders:
I want to take this opportunity to say thank you for investing in the Hartford HLS Funds. We’ve seen continued market volatility throughout the first half of 2012, and there will likely be continued uncertainty until the Presidential election in November, but we are still optimistic about the markets in 2012.
Market Review
In the first quarter of 2012, the S&P 500 Index turned in its best quarterly performance since the third quarter of 2009. U.S. equities showed signs of improvement as investors focused on improving economic data and strong corporate earnings news and the Federal Reserve’s pledge to keep interest rates low buoyed investors’ appetites.
The second quarter ended on a high note for the stock market—the S&P 500 had its strongest June in more than a decade and the Dow Jones Industrial Average had its best month since October—but those gains weren’t enough to offset losses from April and May, and equities finished the quarter in the red. Although the S&P 500 was -2.75 for the second quarter, it was up 9.49% for the first half of 2012.
Concerns about domestic and European unemployment are having an effect on our economy. The unemployment rate in the euro zone's 17 nations rose to a record 11.1% in May, the highest level since the euro launched as a common currency more than 10 years ago. In the U.S., the labor market has been fickle this year, with job growth starting off strong in the first couple months of 2012 but slowing down in the spring, which has led many to wonder about the status of the economic recovery.
On a positive note, home prices are rising again after falling for more than five years, new and existing home sales are increasing, and home builders are ramping up construction.
The Hartford HLS Funds Expands Relationship with Wellington Management
We’re very pleased that we are expanding our relationship with Wellington Management, which will now serve as the primary sub-adviser for the Hartford HLS Funds including equity, fixed-income,* and asset-allocation funds. One of America’s oldest and largest investment management firms, Wellington Management has resources that span the entire globe, with multiple offices across the U.S. and numerous offices abroad. Wellington Management’s most distinctive strength is its proprietary research, which is shared across the entire organization.
We believe that aligning more closely with a well-respected money manager like Wellington Management puts us in a strong position to drive significant growth and to continue delivering innovative fund strategies to help our investors meet their financial goals.
Thank you again for investing with the Hartford HLS Funds.
James Davey
President
Hartford HLS Funds
*Several fixed-income funds will continue to be sub-advised by Hartford Investment Management Company.
Hartford MidCap Value HLS Fund
Table of Contents
This report is prepared for the general information of contract owners and qualified retirement plan participants. It is not an offer of contracts or of qualified retirement plans. It should not be used in connection with any offer, except in conjunction with the appropriate product prospectus which contains all pertinent information including the applicable sales, administrative and other charges.
The views expressed in the Fund’s Manager Discussion under ‘‘Why did the Fund perform this way?’’ and ‘‘What is the outlook?’’ are views of the Fund’s sub-adviser and portfolio management team through the end of the period and are subject to change based on market and other conditions.
| Hartford MidCap Value HLS Fund* inception 04/30/2001 |
| (sub-advised by Wellington Management Company, LLP) Investment objective – Seeks long-term capital appreciation. |
Performance Overview 6/30/02 - 6/30/12
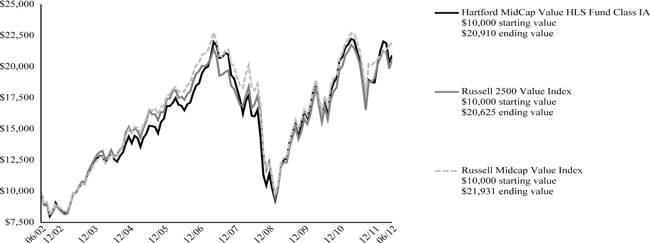
The chart above shows the growth of a $10,000 investment in Class IA. Growth results in classes other than Class IA will vary from what is seen above due to differences in the expenses charged to those share classes.
Average Annual Total Returns (as of 6/30/12)
| 6 Month† | 1 Year | 5 year | 10 year | |||||||||||||
| MidCap Value IA | 11.67 | % | -1.84 | % | -0.73 | % | 7.66 | % | ||||||||
| MidCap Value IB | 11.53 | % | -2.09 | % | -0.98 | % | 7.39 | % | ||||||||
| Russell 2500 Value Index | 8.15 | % | -1.49 | % | -0.20 | % | 7.51 | % | ||||||||
| Russell Midcap Value Index | 7.74 | % | -0.41 | % | -0.14 | % | 8.17 | % |
| † | Not Annualized |
PAST PERFORMANCE IS NOT INDICATIVE OF FUTURE RESULTS.
Total returns presented above were calculated using the Fund's net asset value available to shareholders for sale or redemption of Fund shares on June 30, 2012, which may exclude investment transactions as of this date.
Russell 2500 Value Index is an unmanaged index measuring the performance of those Russell 2500 Index companies with lower price-to-book ratios and lower forecasted growth values. (The Russell 2500 Index is an unmanaged index that measures the performance of the 2,500 smallest U.S. companies based on total market capitalization.)
Russell Midcap Value Index measures the performance of the mid-cap value segment of the U.S. equity universe. It includes those Russell Midcap Index companies with lower price-to-book ratios and lower forecasted growth values.
You cannot invest directly in an index.
The chart represents a hypothetical investment in the Fund. Performance data represents past performance and current performance could be higher or lower.
Performance information may reflect historical or current expense waivers/reimbursements from the investment adviser, without which performance would have been lower. For information on current expense waivers/reimbursements, please see the prospectus.
The value of the Fund will fluctuate so that when redeemed, it may be worth more or less than the original investment. The chart and table do not reflect the deductions of taxes, sales charges or other fees which may be applied at the variable life insurance, variable annuity or qualified retirement plan product level. Any such additional sales charges or other fees or expenses would lower the contract’s or plan’s performance.
| * | The Fund has restrictions on the purchase of shares. A description of the restrictions can be found in the prospectus. |
| 2 |
| Hartford MidCap Value HLS Fund |
| Manager Discussion |
| June 30, 2012 (Unaudited) |
| Portfolio Manager |
| James N. Mordy |
| Senior Vice President and Equity Portfolio Manager |
How did the Fund perform?
The Class IA shares of the Hartford MidCap Value HLS Fund returned 11.67% for the six-month period ended June 30, 2012, outperforming its benchmark, the Russell 2500 Value Index, which returned 8.15% for the same period. The Fund also outperformed the 6.83% return of the average fund in the Lipper Mid-Cap Value VP-UF Fund peer group, a group of funds with investment strategies similar to those of the Fund.
Why did the Fund perform this way?
U.S. equities moved higher during the first quarter along with a favorable investment climate as economic growth continued at a measured pace in the U.S., and the European Central Bank provided sufficient liquidity to reduce European credit market risks. However, equities backtracked in the second quarter as global economic momentum faded and concerns intensified about the stability of Europe. In contrast to the first quarter, safety was again back in favor as investors focused on the cloudy macro picture. Defensive sectors outperformed, as did stocks with higher yield, lower beta, and minimal international exposure.
During the period, large cap equities (+9.5%) outperformed small caps (+8.5%) which outperformed mid caps (+7.9%) as represented by the S&P 500, Russell 2000, and S&P MidCap 400 Indices, respectively. All but one sector in the Russell 2500 Value Index gained during the period, with Consumer Discretionary (+14%), Financials (+12%), Health Care (+10%), and Consumer Staples (+9%) performing the best. Energy (-7%) was the only sector to post a negative return during the period.
The Fund’s relative outperformance versus the index was primarily driven by strong stock selection within Consumer Discretionary, Industrials, and Materials, which outweighed weak stock selection within Consumer Staples and Health Care. Overall sector allocation, a result of bottom-up security selection (i.e. stock by stock fundamental research), detracted from relative returns, in part due to the Fund’s overweight positions (i.e. the Fund’s sector position was greater than the benchmark position) in Energy and Materials and underweight to Financials. A modest cash position was a mild detractor in an upward trending market.
The largest contributors to benchmark-relative performance included PHH Corp (Financials), Buck Holdings L.P., which allows for an indirect investment in the private Dollar General Corp. (Consumer Discretionary), and Toll Brothers (Consumer Discretionary). Shares of PHH, a mortgage originator, gained during the period after closing on a $250 million convertible senior note offering and announcing new appointments to its board of directors. Dollar General, a discount retailer, continued to execute well and take share from other retailers as its value message resonated with consumers. Shares of Toll Brothers, a homebuilder, rallied as increasing evidence of the housing recovery was apparent in the company's results. With new home prices now increasing, the company’s land position has become a valued asset. In addition, Lennar (Consumer Discretionary) was among the top contributors to absolute performance (i.e. total return).
The largest detractors from benchmark-relative returns included Lone Pine Resources (Energy), Arrow Electronics (Information Technology), and Unum Group (Financials). Shares of Lone Pine Resources, a Canada-based company engaged in the exploration, development, and production of oil and gas properties, declined during the period along with lower natural gas prices. Arrow Electronics is a provider of products, services and solutions to industrial and commercial users of electronic components and enterprise computing solutions. Weak component demand in Europe and Asia led to disappointing quarterly results and a cautious outlook. This, combined with negative macroeconomic data, weighed on Arrow's shares. Unum Group, a U.S.-based provider of disability insurance products in the U.S. and U.K., lagged during the period after reporting weaker than expected quarterly earnings and on worries of continued low interest rates. In addition, Sealed Air Corp (Materials) was among the top detractors from absolute returns.
What is the outlook?
Our macro outlook has not changed significantly. Global economic momentum has faded. In the U.S., jobs growth remains disappointing, consumer spending has cooled a bit, and the Institute for Supply Management (ISM) indices have moved lower. We believe the U.S. will remain in a highly uncertain environment given an election cycle and the approaching debt ceiling/fiscal cliff issues over the potential expiration of various tax cuts. In our view, Europe has taken some important first steps toward fiscal union, but this process remains uncertain and will take more time. China continues to slow and faces its own leadership transition later this year. We believe an easing of inflationary pressures allows room for further stimulus.
| 3 |
| Hartford MidCap Value HLS Fund |
| Manager Discussion – (continued) |
| June 30, 2012 (Unaudited) |
We expect to hear a cautious tone during the upcoming earnings reporting season, and believe consensus forward earnings estimates will be marked lower. We have tried to be mindful of these risks in our positioning and look for companies with drivers besides just Gross Domestic Product growth where it appears that we don’t have to pay an excessive valuation premium.
The annual rebalancing of our benchmark index near the end of the quarter did impact our relative sector weightings. At June 30 we were underweight to Financials, Utilities, Telecom & Media, and Energy. We ended the period most overweight to the Consumer Staples, Health Care, and Materials sectors with modest overweights in Information Technology and Consumer Discretionary.
Diversification by Industry
as of June 30, 2012
| Percentage of | ||||
| Industry (Sector) | Net Assets | |||
| Banks (Financials) | 7.0 | % | ||
| Capital Goods (Industrials) | 11.7 | |||
| Consumer Durables & Apparel (Consumer Discretionary) | 6.4 | |||
| Consumer Services (Consumer Discretionary) | 0.3 | |||
| Diversified Financials (Financials) | 4.5 | |||
| Energy (Energy) | 6.1 | |||
| Food, Beverage & Tobacco (Consumer Staples) | 4.1 | |||
| Health Care Equipment & Services (Health Care) | 4.6 | |||
| Household & Personal Products (Consumer Staples) | 1.2 | |||
| Insurance (Financials) | 8.3 | |||
| Materials (Materials) | 9.0 | |||
| Media (Consumer Discretionary) | 0.7 | |||
| Pharmaceuticals, Biotechnology & Life Sciences (Health Care) | 3.7 | |||
| Real Estate (Financials) | 7.1 | |||
| Retailing (Consumer Discretionary) | 3.7 | |||
| Semiconductors & Semiconductor Equipment (Information Technology) | 4.9 | |||
| Software & Services (Information Technology) | 0.9 | |||
| Technology Hardware & Equipment (Information Technology) | 4.1 | |||
| Transportation (Industrials) | 1.9 | |||
| Utilities (Utilities) | 7.2 | |||
| Short-Term Investments | 2.1 | |||
| Other Assets and Liabilities | 0.5 | |||
| Total | 100.0 | % |
| 4 |
| Hartford MidCap Value HLS Fund |
| Schedule of Investments |
| June 30, 2012 (Unaudited) |
| (000’s Omitted) |
| Shares or Principal Amount | Market Value ╪ | |||||||
COMMON STOCKS - 97.4% | ||||||||
| Banks - 7.0% | ||||||||
| 122 | Bankunited, Inc. | $ | 2,867 | |||||
| 284 | Beneficial Mutual Bancorp, Inc. ● | 2,454 | ||||||
| 130 | Comerica, Inc. | 3,986 | ||||||
| 58 | EverBank Financial Corp. | 633 | ||||||
| 199 | First Midwest Bancorp, Inc. | 2,188 | ||||||
| 43 | M&T Bank Corp. | 3,518 | ||||||
| 212 | Popular, Inc. | 3,517 | ||||||
| 982 | Regions Financial Corp. | 6,628 | ||||||
| 241 | Zions Bancorporation | 4,673 | ||||||
| 30,464 | ||||||||
| Capital Goods - 11.7% | ||||||||
| 101 | AGCO Corp. ● | 4,628 | ||||||
| 259 | Barnes Group, Inc. | 6,292 | ||||||
| 55 | Dover Corp. | 2,970 | ||||||
| 93 | Esterline Technologies Corp. ● | 5,804 | ||||||
| 104 | Hubbell, Inc. Class B | 8,106 | ||||||
| 171 | Pentair, Inc. | 6,553 | ||||||
| 100 | Teledyne Technologies, Inc. ● | 6,159 | ||||||
| 133 | URS Corp. | 4,642 | ||||||
| 100 | WESCO International, Inc. ● | 5,726 | ||||||
| 50,880 | ||||||||
| Consumer Durables & Apparel - 6.4% | ||||||||
| 247 | Lennar Corp. | 7,626 | ||||||
| 200 | Mattel, Inc. | 6,488 | ||||||
| 2,615 | Samsonite International S.A. ● | 4,420 | ||||||
| 314 | Toll Brothers, Inc. ● | �� | 9,323 | |||||
| 27,857 | ||||||||
| Consumer Services - 0.3% | ||||||||
| 45 | DeVry, Inc. | 1,406 | ||||||
| Diversified Financials - 4.5% | ||||||||
| 225 | E*Trade Financial Corp. ●‡ | 1,810 | ||||||
| 184 | Invesco Ltd. | 4,152 | ||||||
| 120 | NYSE Euronext | 3,077 | ||||||
| 387 | PHH Corp. ● | 6,759 | ||||||
| 160 | Solar Capital Ltd. | 3,569 | ||||||
| 452 | Solar Cayman Ltd. ⌂■●† | 41 | ||||||
| 19,408 | ||||||||
| Energy - 6.1% | ||||||||
| 353 | Cobalt International Energy ● | 8,288 | ||||||
| 73 | Consol Energy, Inc. | 2,220 | ||||||
| 59 | Japan Petroleum Exploration Co., Ltd. | 2,239 | ||||||
| 89 | Newfield Exploration Co. ● | 2,606 | ||||||
| 298 | Ocean Rig UDW, Inc. ● | 4,023 | ||||||
| 68 | QEP Resources, Inc. | 2,038 | ||||||
| 73 | Tidewater, Inc. | 3,370 | ||||||
| 149 | Trican Well Service Ltd. ☼ | 1,717 | ||||||
| 26,501 | ||||||||
| Food, Beverage & Tobacco - 4.1% | ||||||||
| 63 | Bunge Ltd. Finance Corp. | 3,940 | ||||||
| 138 | Dr. Pepper Snapple Group | 6,046 | ||||||
| 94 | Ingredion, Inc. | 4,660 | ||||||
| 270 | Maple Leaf Foods, Inc. w/ Rights | 3,100 | ||||||
| 17,746 | ||||||||
| Health Care Equipment & Services - 4.6% | ||||||||
| 99 | AmerisourceBergen Corp. | 3,892 | ||||||
| 548 | Boston Scientific Corp. ● | 3,106 | ||||||
| 285 | Brookdale Senior Living, Inc. ● | 5,058 | ||||||
| 139 | CIGNA Corp. | 6,111 | ||||||
| 223 | Vanguard Health Systems, Inc. ● | 1,980 | ||||||
| 20,147 | ||||||||
| Household & Personal Products - 1.2% | ||||||||
| 70 | Energizer Holdings, Inc. ● | 5,290 | ||||||
| Insurance - 8.3% | ||||||||
| 85 | Everest Re Group Ltd. | 8,766 | ||||||
| 146 | Platinum Underwriters Holdings Ltd. | 5,550 | ||||||
| 186 | Principal Financial Group, Inc. | 4,873 | ||||||
| 171 | Reinsurance Group of America, Inc. | 9,089 | ||||||
| 406 | Unum Group | 7,774 | ||||||
| 36,052 | ||||||||
| Materials - 9.0% | ||||||||
| 102 | FMC Corp. | 5,444 | ||||||
| 1,029 | Incitec Pivot Ltd. | 3,041 | ||||||
| 650 | Louisiana-Pacific Corp. ● | 7,075 | ||||||
| 238 | Methanex Corp. ADR | 6,620 | ||||||
| 197 | Owens-Illinois, Inc. ● | 3,777 | ||||||
| 159 | Packaging Corp. of America | 4,493 | ||||||
| 226 | Rexam plc | 1,491 | ||||||
| 264 | Sealed Air Corp. | 4,070 | ||||||
| 132 | Sino Forest Corp. ⌂■●† | — | ||||||
| 220 | Sino Forest Corp. Class A ⌂●† | — | ||||||
| 3,443 | Yingde Gases | 3,151 | ||||||
| 39,162 | ||||||||
| Media - 0.7% | ||||||||
| 129 | Virgin Media, Inc. | 3,141 | ||||||
| Pharmaceuticals, Biotechnology & Life Sciences - 3.7% | ||||||||
| 722 | Almirall S.A. | 5,175 | ||||||
| 282 | Impax Laboratories, Inc. ● | 5,710 | ||||||
| 101 | UCB S.A. | 5,116 | ||||||
| 16,001 | ||||||||
| Real Estate - 7.1% | ||||||||
| 157 | American Assets Trust, Inc. | 3,798 | ||||||
| 778 | BR Properties S.A. | 9,102 | ||||||
| 234 | Forest City Enterprises, Inc. Class A ● | 3,414 | ||||||
| 180 | Hatteras Financial Corp. | 5,142 | ||||||
| 92 | Iguatemi Emp de Shopping | 1,896 | ||||||
| 337 | Weyerhaeuser Co. | 7,542 | ||||||
| 30,894 | ||||||||
| Retailing - 3.7% | ||||||||
| 61 | ANN, Inc. ● | 1,560 | ||||||
| 5,788 | Buck Holdings L.P. ⌂●† | 10,544 | ||||||
| 66 | Ross Stores, Inc. | 4,148 | ||||||
| 16,252 | ||||||||
| Semiconductors & Semiconductor Equipment - 4.9% | ||||||||
| 215 | Avago Technologies Ltd. | 7,730 | ||||||
| 77 | Linear Technology Corp. | 2,403 | ||||||
| 336 | Microsemi Corp. ● | 6,205 | ||||||
| 337 | Teradyne, Inc. ● | 4,741 | ||||||
| 21,079 | ||||||||
| Software & Services - 0.9% | ||||||||
| 255 | Booz Allen Hamilton Holding Corp. | 3,901 | ||||||
| Technology Hardware & Equipment - 4.1% | ||||||||
| 296 | Arrow Electronics, Inc. ● | 9,722 | ||||||
| 95 | Harris Corp. | 3,959 | ||||||
The accompanying notes are an integral part of these financial statements.
| 5 |
| Hartford MidCap Value HLS Fund |
| Schedule of Investments – (continued) |
| June 30, 2012 (Unaudited) |
| (000’s Omitted) |
| Shares or Principal Amount | Market Value ╪ | |||||||||
| COMMON STOCKS - 97.4% - (continued) | ||||||||||
| Technology Hardware & Equipment - 4.1% - (continued) | ||||||||||
| 117 | SanDisk Corp. ● | $ | 4,268 | |||||||
| 17,949 | ||||||||||
| Transportation - 1.9% | ||||||||||
| 389 | Delta Air Lines, Inc. ● | 4,257 | ||||||||
| 434 | Swift Transportation Co. ● | 4,100 | ||||||||
| 8,357 | ||||||||||
| Utilities - 7.2% | ||||||||||
| 107 | Alliant Energy Corp. | 4,894 | ||||||||
| 528 | N.V. Energy, Inc. | 9,286 | ||||||||
| 189 | Northeast Utilities | 7,339 | ||||||||
| 187 | UGI Corp. | 5,509 | ||||||||
| 107 | Wisconsin Energy Corp. | 4,234 | ||||||||
| 31,262 | ||||||||||
| Total common stocks | ||||||||||
| (cost $386,739) | $ | 423,749 | ||||||||
| Total long-term investments | ||||||||||
| (cost $386,739) | $ | 423,749 | ||||||||
| SHORT-TERM INVESTMENTS - 2.1% | ||||||||||
| Repurchase Agreements - 2.1% | ||||||||||
| Bank of America Merrill Lynch TriParty Joint Repurchase Agreement (maturing on 07/02/2012 in the amount of $4,869, collateralized by FHLMC 5.50% - 6.50%, 2035 - 2036, FNMA 5.00% - 6.00%, 2033 - 2039, value of $4,966) | ||||||||||
| $ | 4,869 | 0.13%, 06/29/2012 | $ | 4,869 | ||||||
| Barclays Capital TriParty Joint Repurchase Agreement (maturing on 07/02/2012 in the amount of $1,760, collateralized by U.S. Treasury Note 1.25% - 3.63%, 2014 - 2020, value of $1,795) | ||||||||||
| 1,760 | 0.15%, 06/29/2012 | 1,760 | ||||||||
| Deutsche Bank Securities TriParty Joint Repurchase Agreement (maturing on 07/02/2012 in the amount of $472, collateralized by U.S. Treasury Note 0.88%, 2016, value of $481) | ||||||||||
| 472 | 0.20%, 06/29/2012 | 472 | ||||||||
| TD Securities TriParty Joint Repurchase Agreement (maturing on 07/02/2012 in the amount of $1,378, collateralized by FHLMC 4.00% - 6.00%, 2027 - 2041, FNMA 4.00% - 4.50%, 2025 - 2042, U.S. Treasury Bond 6.38%, 2027, U.S. Treasury Note 0.38% - 8.75%, 2012 - 2017, value of $1,406) | ||||||||||
| 1,378 | 0.15%, 06/29/2012 | 1,378 | ||||||||
| UBS Securities, Inc. Joint Repurchase Agreement (maturing on 07/02/2012 in the amount of $-, collateralized by U.S. Treasury Note 1.00%, 2013, value of $-) | ||||||||||
| – | 0.13%, 06/29/2012 | – | ||||||||
| UBS Securities, Inc. TriParty Joint Repurchase Agreement (maturing on 07/02/2012 in the amount of $621, collateralized by GNMA 4.00%, 2042, value of $633) | ||||||||||
| 621 | 0.20%, 06/29/2012 | 621 | ||||||||
| 9,100 | ||||||||||
| Total short-term investments | ||||||||||
| (cost $9,100) | $ | 9,100 | ||||||||
| Total investments | ||||||||||
| (cost $395,839) ▲ | 99.5 | % | $ | 432,849 | ||||||
| Other assets and liabilities | 0.5 | % | 1,980 | |||||||
| Total net assets | 100.0 | % | $ | 434,829 | ||||||
| Note: | Percentage of investments as shown is the ratio of the total market value to total net assets. |
Prices of foreign equities that are principally traded on certain foreign markets may be adjusted daily pursuant to a fair value pricing service approved by the Board of Directors in order to reflect an adjustment for factors occurring after the close of certain foreign markets but before the close of the New York Stock Exchange.
| ▲ | At June 30, 2012, the cost of securities for federal income tax purposes was $404,146 and the aggregate gross unrealized appreciation and depreciation based on that cost were: |
| Unrealized Appreciation | $ | 68,155 | ||
| Unrealized Depreciation | (39,452 | ) | ||
| Net Unrealized Appreciation | $ | 28,703 |
| † | These securities were valued in good faith at fair value as determined under policies and procedures established by and under the supervision of the Company's Board of Directors. At June 30, 2012, the aggregate value of these securities was $10,585, which represents 2.4% of total net assets. This amount excludes securities that are principally traded in certain foreign markets and whose prices are adjusted pursuant to a third party pricing service methodology approved by the Board of Directors. |
| ● | Non-income producing. |
The accompanying notes are an integral part of these financial statements.
| 6 |
| ■ | Securities issued within terms of a private placement memorandum, exempt from registration under Rule 144A under the Securities Act of 1933, as amended, and may be sold only to qualified institutional buyers. Unless otherwise indicated, these issues are determined to be liquid. At June 30, 2012, the aggregate value of these securities was $41, which rounds to zero percent of total net assets. |
| ⌂ | The following securities are considered illiquid. Illiquid securities are often purchased in private placement transactions, are often not registered under the Securities Act of 1933 and may have contractual restrictions on resale. A security may also be considered illiquid if the security lacks a readily available market or if its valuation has not changed for a certain period of time. |
| Period Acquired | Shares/ Par | Security | Cost Basis | |||||||||
| 06/2007 | 5,788 | Buck Holdings L.P. | $ | 2,123 | ||||||||
| 12/2009 | 132 | Sino Forest Corp. - 144A | 2,093 | |||||||||
| 12/2009 - 06/2011 | 220 | Sino Forest Corp. Class A | 3,807 | |||||||||
| 03/2007 | 452 | Solar Cayman Ltd. - 144A | 132 | |||||||||
At June 30, 2012, the aggregate value of these securities was $10,585, which represents 2.4% of total net assets.
| ☼ | This security, or a portion of this security, was purchased on a when-issued, delayed delivery or delayed draw basis. The cost of these securities was $213 at June 30, 2012. |
| ‡ | This security, or a portion of this security, has been segregated to cover funding requirements on investment transactions settling in the future. |
| Foreign Currency Contracts Outstanding at June 30, 2012 | ||||||||||||||||||||||||
| Description | Counterparty | Buy / Sell | Market Value ╪ | Contract | Delivery Date | Unrealized | ||||||||||||||||||
| AUD | BNP | Sell | $ | 9 | $ | 9 | 07/03/2012 | $ | – | |||||||||||||||
| CAD | BCLY | Buy | 213 | 210 | 07/03/2012 | 3 | ||||||||||||||||||
| CAD | BCLY | Sell | 9 | 9 | 07/05/2012 | – | ||||||||||||||||||
| EUR | BNP | Sell | 30 | 30 | 07/05/2012 | – | ||||||||||||||||||
| GBP | BCLY | Sell | 4 | 4 | 07/05/2012 | – | ||||||||||||||||||
| HKD | CSFB | Sell | 10 | 10 | 07/05/2012 | – | ||||||||||||||||||
| JPY | BNP | Sell | 11 | 11 | 07/05/2012 | – | ||||||||||||||||||
| $ | 3 | |||||||||||||||||||||||
| ╪ | See Significant Accounting Policies of accompanying Notes to Financial Statements regarding valuation of securities. |
| GLOSSARY: (abbreviations used in preceding Schedule of Investments) | ||
| Counterparty Abbreviations: | ||
| BCLY | Barclays | |
| BNP | BNP Paribas Securities | |
| CSFB | Credit Suisse First Boston Corp. | |
| Currency Abbreviations: | ||
| AUD | Australian Dollar | |
| CAD | Canadian Dollar | |
| EUR | EURO | |
| GBP | British Pound | |
| HKD | Hong Kong Dollar | |
| JPY | Japanese Yen | |
| Other Abbreviations: | ||
| ADR | American Depositary Receipt | |
| FHLMC | Federal Home Loan Mortgage Corp. | |
| FNMA | Federal National Mortgage Association | |
| GNMA | Government National Mortgage Association | |
The accompanying notes are an integral part of these financial statements.
| 7 |
| Hartford MidCap Value HLS Fund |
| Investment Valuation Hierarchy Level Summary |
| June 30, 2012 (Unaudited) |
| (000’s Omitted) |
| Total | Level 1 ♦ | Level 2 ♦ | Level 3 | |||||||||||||
| Assets: | ||||||||||||||||
| Common Stocks ‡ | $ | 423,749 | $ | 388,531 | $ | 24,633 | $ | 10,585 | ||||||||
| Short-Term Investments | 9,100 | – | 9,100 | – | ||||||||||||
| Total | $ | 432,849 | $ | 388,531 | $ | 33,733 | $ | 10,585 | ||||||||
| Foreign Currency Contracts * | 3 | – | 3 | – | ||||||||||||
| Total | $ | 3 | $ | – | $ | 3 | $ | – | ||||||||
| Liabilities: | ||||||||||||||||
| Foreign Currency Contracts * | – | – | – | – | ||||||||||||
| Total | $ | – | $ | – | $ | – | $ | – | ||||||||
| ♦ | For the six-month period ended June 30, 2012, there were no transfers between Level 1 and Level 2. |
| ‡ | The Fund has all or primarily all of the equity securities categorized in a particular level. Refer to the Schedule of Investments for further industry breakout. |
| * | Derivative instruments not reflected in the Schedule of Investments are valued at the unrealized appreciation/depreciation on the investments. |
Following is a reconciliation of Level 3 assets for which significant unobservable inputs were used to determine fair value:
| Balance as of December 31, 2011 | Realized Gain (Loss) | Change in Unrealized Appreciation (Depreciation) | Net Amortization | Purchases | Sales | Transfers Into Level 3 | Transfers Out of Level 3 | Balance as of June 30, 2012 | ||||||||||||||||||||||||||||
| Assets: | ||||||||||||||||||||||||||||||||||||
| Common Stocks | $ | 13,116 | $ | 4,633 | $ | (1,234 | )* | $ | — | $ | — | $ | (5,930 | ) | $ | — | $ | — | $ | 10,585 | ||||||||||||||||
| Total | $ | 13,116 | $ | 4,633 | $ | (1,234 | ) | $ | — | $ | — | $ | (5,930 | ) | $ | — | $ | — | $ | 10,585 | ||||||||||||||||
| * | Change in unrealized appreciation (depreciation) in the current period relating to assets still held at June 30, 2012 was $(1,234). |
The accompanying notes are an integral part of these financial statements.
| 8 |
| Hartford MidCap Value HLS Fund |
| Statement of Assets and Liabilities |
| June 30, 2012 (Unaudited) |
| (000’s Omitted) |
| Assets: | ||||
| Investments in securities, at market value (cost $395,839) | $ | 432,849 | ||
| Cash | 47 | |||
| Unrealized appreciation on foreign currency contracts | 3 | |||
| Receivables: | ||||
| Investment securities sold | 4,084 | |||
| Fund shares sold | 38 | |||
| Dividends and interest | 716 | |||
| Total assets | 437,737 | |||
| Liabilities: | ||||
| Unrealized depreciation on foreign currency contracts | — | |||
| Bank overdraft - foreign cash | 9 | |||
| Payables: | ||||
| Investment securities purchased | 2,523 | |||
| Fund shares redeemed | 284 | |||
| Investment management fees | 46 | |||
| Distribution fees | 4 | |||
| Accrued expenses | 42 | |||
| Total liabilities | 2,908 | |||
| Net assets | $ | 434,829 | ||
| Summary of Net Assets: | ||||
| Capital stock and paid-in-capital | $ | 427,748 | ||
| Undistributed net investment income | 5,234 | |||
| Accumulated net realized loss | (35,166 | ) | ||
| Unrealized appreciation of investments and the translations of assets and liabilities denominated in foreign currency | 37,013 | |||
| Net assets | $ | 434,829 | ||
| Shares authorized | 1,200,000 | |||
| Par value | $ | 0.001 | ||
| Class IA: Net asset value per share | $ | 10.54 | ||
| Shares outstanding | 30,468 | |||
| Net assets | $ | 321,101 | ||
| Class IB: Net asset value per share | $ | 10.46 | ||
| Shares outstanding | 10,871 | |||
| Net assets | $ | 113,728 |
The accompanying notes are an integral part of these financial statements.
| 9 |
| Hartford MidCap Value HLS Fund |
| Statement of Operations |
| For the Six-Month Period Ended June 30, 2012 (Unaudited) |
| (000’s Omitted) |
| Investment Income: | ||||
| Dividends | $ | 4,012 | ||
| Interest | 6 | |||
| Less: Foreign tax withheld | (67 | ) | ||
| Total investment income, net | 3,951 | |||
| Expenses: | ||||
| Investment management fees | 1,883 | |||
| Transfer agent fees | 1 | |||
| Distribution fees - Class IB | 151 | |||
| Custodian fees | 11 | |||
| Accounting services fees | 24 | |||
| Board of Directors' fees | 7 | |||
| Audit fees | 7 | |||
| Other expenses | 57 | |||
| Total expenses (before fees paid indirectly) | 2,141 | |||
| Commission recapture | (10 | ) | ||
| Total fees paid indirectly | (10 | ) | ||
| Total expenses, net | 2,131 | |||
| Net investment income | 1,820 | |||
| Net Realized Gain on Investments and Foreign Currency Transactions: | ||||
| Net realized gain on investments | 32,937 | |||
| Net realized gain on foreign currency contracts | 7 | |||
| Net realized loss on other foreign currency transactions | (28 | ) | ||
| Net Realized Gain on Investments and Foreign Currency Transactions | 32,916 | |||
| Net Changes in Unrealized Appreciation of Investments and Foreign Currency Transactions: | ||||
| Net unrealized appreciation of investments | 19,853 | |||
| Net unrealized appreciation of foreign currency contracts | 3 | |||
| Net unrealized appreciation on translation of other assets and liabilities in foreign currencies | 1 | |||
| Net Changes in Unrealized Appreciation of Investments and Foreign Currency Transactions | 19,857 | |||
| Net Gain on Investments and Foreign Currency Transactions | 52,773 | |||
| Net Increase in Net Assets Resulting from Operations | $ | 54,593 |
The accompanying notes are an integral part of these financial statements.
| 10 |
| Hartford MidCap Value HLS Fund |
| Statement of Changes in Net Assets |
| (000’s Omitted) |
| For the Six-Month Period Ended June 30, 2012 (Unaudited) | For the Year Ended December 31, 2011 | |||||||
| Operations: | ||||||||
| Net investment income | $ | 1,820 | $ | 2,772 | ||||
| Net realized gain on investments and foreign currency transactions | 32,916 | 74,878 | ||||||
| Net unrealized appreciation (depreciation) of investments and foreign currency transactions | 19,857 | (123,016 | ) | |||||
| Net Increase (Decrease) In Net Assets Resulting From Operations | 54,593 | (45,366 | ) | |||||
| Distributions to Shareholders: | ||||||||
| From net investment income | ||||||||
| Class IA | — | (40 | ) | |||||
| Class IB | — | (14 | ) | |||||
| Total distributions | — | (54 | ) | |||||
| Capital Share Transactions: | ||||||||
| Class IA | ||||||||
| Sold | 12,161 | 30,432 | ||||||
| Issued on reinvestment of distributions | — | 40 | ||||||
| Redeemed | (73,830 | ) | (117,488 | ) | ||||
| Total capital share transactions | (61,669 | ) | (87,016 | ) | ||||
| Class IB | ||||||||
| Sold | 3,455 | 11,942 | ||||||
| Issued on reinvestment of distributions | — | 14 | ||||||
| Redeemed | (19,696 | ) | (47,153 | ) | ||||
| Total capital share transactions | (16,241 | ) | (35,197 | ) | ||||
| Net decrease from capital share transactions | (77,910 | ) | (122,213 | ) | ||||
| Net Decrease In Net Assets | (23,317 | ) | (167,633 | ) | ||||
| Net Assets: | ||||||||
| Beginning of period | 458,146 | 625,779 | ||||||
| End of period | $ | 434,829 | $ | 458,146 | ||||
| Undistributed (distribution in excess of) net investment income | $ | 5,234 | $ | 3,414 | ||||
| Shares: | ||||||||
| Class IA | ||||||||
| Sold | 1,152 | 2,960 | ||||||
| Issued on reinvestment of distributions | — | 4 | ||||||
| Redeemed | (6,876 | ) | (11,556 | ) | ||||
| Total share activity | (5,724 | ) | (8,592 | ) | ||||
| Class IB | ||||||||
| Sold | 330 | 1,173 | ||||||
| Issued on reinvestment of distributions | — | 1 | ||||||
| Redeemed | (1,885 | ) | (4,645 | ) | ||||
| Total share activity | (1,555 | ) | (3,471 | ) | ||||
The accompanying notes are an integral part of these financial statements.
| 11 |
| Hartford MidCap Value HLS Fund |
| Notes to Financial Statements |
| June 30, 2012 (Unaudited) |
| (000’s Omitted) |
| 1. | Organization: |
Hartford MidCap Value HLS Fund (the “Fund”) serves as an underlying investment option for certain variable annuity and variable life insurance separate accounts of Hartford Life Insurance Company (“HLIC”) and its affiliates and certain qualified retirement plans. The Fund may also serve as an underlying investment option for certain variable annuity and variable life separate accounts of other insurance companies. Owners of variable annuity contracts and policyholders of variable life insurance contracts may choose the funds permitted in the variable insurance contract prospectus. In addition, participants in certain qualified retirement plans may choose the Fund if permitted by their plans.
Hartford Series Fund, Inc. (the “Company”) is an open-end registered management investment company comprised of thirty portfolios. Financial Statements for the Fund, a series of the Company, are included in this report.
The Company is organized under the laws of the State of Maryland and is registered with the Securities and Exchange Commission (“SEC”) under the Investment Company Act of 1940, as amended (“1940 Act”). The Fund is a diversified open-end management investment company.
The Fund is divided into Class IA and Class IB shares. Each class is offered at the per share net asset value (“NAV”) without a sales charge and is subject to the same expenses, except that the Class IB shares are subject to distribution and service fees charged pursuant to a Distribution Plan adopted in accordance with Rule 12b-1 under the 1940 Act.
| 2. | Significant Accounting Policies: |
The following is a summary of significant accounting policies of the Fund in the preparation of its financial statements, which are in accordance with the United States Generally Accepted Accounting Principles (“U.S. GAAP”). The preparation of financial statements in accordance with U.S. GAAP may require management to make estimates and assumptions that affect the reported amounts of assets and liabilities and disclosure of contingent assets and liabilities at the date of the financial statements and the reported amounts of increases and decreases in net assets from operations during the reporting period. Actual results could differ from those estimates.
| a) | Determination of Net Asset Value – The NAV of each class of the Fund’s shares is determined as of the close of regular trading (normally 4:00 p.m. Eastern Time) (the “NYSE Close”) on each day that the New York Stock Exchange (the “Exchange”) is open (“Valuation Date”). Information that becomes known to the Fund after the NAV has been calculated on a particular day will not generally be used to retroactively adjust the NAV determined earlier that day. |
| b) | Investment Valuation and Fair Value Measurements – For purposes of calculating the NAV, portfolio investments and other assets held by the Fund's portfolio for which market quotes are readily available are valued at market value. Market value is generally determined on the basis of last reported sales prices or official close price. If no sales are reported, market value is based on quotes obtained from a quotation reporting system, established market makers, or independent pricing services. If market prices are not readily available or are deemed unreliable, the Fund will use the fair value of the investment as determined in good faith under policies and procedures established by and under the supervision of the Company’s Board of Directors. Market quotes are considered not readily available where there is an absence of current or reliable market-based data (e.g., trade information or broker quotes), including where events occur after the close of the relevant market, but prior to the NYSE Close that materially affect the values of the Fund’s portfolio investments or assets. In addition, market quotes are considered not readily available when, due to extraordinary circumstances, the exchanges or markets on which the investments trade do not open for trading for the entire day and no other market prices are available. In addition, prices of foreign equities that are principally traded on certain foreign markets are adjusted daily pursuant to a fair value pricing service approved by the Board of Directors in order to reflect an adjustment for the factors occurring after the close of certain foreign markets but before the NYSE Close. Investments that are primarily traded on foreign markets may trade on days that are not business days of the Fund. The value of the foreign investments in which the Fund invests may change on days when a shareholder will not be able to purchase or |
| 12 |
redeem shares of the Fund. Fair value pricing is subjective in nature and the use of fair value pricing by the Fund may cause the NAV of its shares to differ significantly from the NAV that would have been calculated using market prices at the close of the exchange on which a portfolio investment is primarily traded. There can be no assurance that the Fund could obtain the fair market value assigned to an investment if the Fund were to sell the investment at approximately the time at which the Fund determines its NAV.
Investments valued in currencies other than U.S. dollars are converted to U.S. dollars using exchange rates obtained from independent pricing services for calculation of the NAV. As a result, the NAV of the Fund’s shares may be affected by changes in the value of currencies in relation to the U.S. dollar. The value of investments traded in markets outside the United States or denominated in currencies other than the U.S. dollar may be affected significantly on a day that the NYSE is closed and the market value may change on days when an investor is not able to purchase, redeem or exchange shares of the Fund.
Foreign currency contracts represent agreements to exchange currencies on specific future dates at predetermined rates. Foreign currency contracts are valued using foreign currency exchange rates and forward rates as provided by an independent pricing service on the Valuation Date.
Financial instruments for which prices are not available from an independent pricing service may be valued using market quotations obtained from one or more dealers that make markets in the respective financial instrument in accordance with procedures established by the Company’s Board of Directors.
U.S. GAAP defines fair value as the price that the Fund would receive to sell an asset or pay to transfer a liability in an orderly transaction between market participants. The U.S. GAAP fair value measurement standards require disclosure of a fair value hierarchy for each major category of assets and liabilities. Various inputs are used in determining the fair value of the Fund’s investments. These inputs are summarized into three broad hierarchy levels. This hierarchy is based on whether the valuation inputs are observable or unobservable. These levels are:
| · | Level 1 – Quoted prices in active markets for identical investments. Level 1 may include exchange traded instruments, such as domestic equities, some foreign equities, options, futures, mutual funds, exchange traded funds, rights and warrants. |
| · | Level 2 – Observable inputs other than Level 1 prices, such as quoted prices for similar investments; quoted prices in markets that are not active; or other inputs that are observable or can be corroborated by observable market data. Level 2 may include debt investments that are traded less frequently than exchange traded instruments and which are valued using independent pricing services; foreign equities, which are principally traded on certain foreign markets and are adjusted daily pursuant to a fair value pricing service in order to reflect an adjustment for the factors occurring after the close of certain foreign markets but before the NYSE Close; and short-term investments, which are valued at amortized cost. |
| · | Level 3 – Significant unobservable inputs that are supported by limited or no market activity. Level 3 may include financial instruments whose values are determined using indicative market quotes or require significant management judgment or estimation. These unobservable valuation inputs may include estimates for current yields, maturity/duration, prepayment speed, and indicative market quotes for comparable investments along with other assumptions relating to credit quality, collateral value, complexity of the investment structure, general market conditions and liquidity. This category may include investments where trading has been halted or there are certain restrictions on trading. While these investments are priced using unobservable inputs, the valuation of these investments reflects the best available data and management believes the prices are a reasonable representation of exit price. For more information on specific valuation techniques and unobservable inputs, please see table below titled "Quantitative Information about Level 3 Fair Value Measurements". |
The Board of Directors of the Company generally reviews and approves the “Procedures for Valuation of Portfolio Securities” on an annual basis. These procedures define how investments are to be valued, including
| 13 |
| Hartford MidCap Value HLS Fund |
| Notes to Financial Statements – (continued) |
| June 30, 2012 (Unaudited) |
| (000’s Omitted) |
the formation of a Valuation Committee. The Valuation Committee is responsible for determining in good faith the fair value of investments when the value cannot be obtained from primary pricing services or alternative sources or if the valuation of an investment as provided by the primary pricing service or alternative source is believed not to reflect the investment’s fair value as of the Valuation Date. Members of the Valuation Committee include the Fund’s Treasurer or designee, a Vice President of the Funds with legal expertise or designee, and a Vice President of the investment manager or designee. In addition, the Fund’s chief compliance officer shall designate a member of the compliance group to attend Valuation Committee meetings as a non-voting resource, to monitor for and provide guidance with respect to compliance with these procedures. Two members of the Valuation Committee or their designees, representing different departments, shall constitute a quorum for purposes of permitting the Valuation Committee to take action. The Valuation Committee will consider all relevant factors in determining an investment’s fair value, and may seek the advice of the Fund’s sub-adviser, knowledgeable brokers and legal counsel in making such determination. The Valuation Committee reports to the Audit Committee of the Company’s Board of Directors. The Audit Committee receives quarterly written reports which include details of all fair-valued investments, including the reason for the fair valuation, and an indication, when possible, of the accuracy of the valuation by disclosing the next available reliable public price quotation or the disposition price of such investments (the “look-back” test). The Board of Directors then must consider for ratification all of the fair value determinations made during the previous quarter.
Valuation levels are not necessarily indicative of the risk associated with investing in such investments. Individual investments within any of the above mentioned asset classes may be assigned a different hierarchical level than those presented above, as individual circumstances dictate.
For additional information, refer to the Investment Valuation Hierarchy Level Summary and the Level 3 roll-forward reconciliation which follow the Schedule of Investments.
For purposes of reporting transfers between different hierarchy levels, both transfers in and out of each level, as applicable, are shown as if they occurred at the beginning of the period.
Quantitative Information about Level 3 Fair Value Measurements:
| Fair Value at June 30, 2012 | Valuation Technique | Unobservable Input(1) | ||||||||
| Common Stocks | $ | 10,544 | Intrinsically priced to a related security | 10% discount due to marketability(2) | ||||||
| - | Bankruptcy proceedings data and prices on related debt issues | Limited value as determined in reference to bankruptcy proceedings | ||||||||
| 41 | Estimated recoverability from liquidation | 10% discount due to marketability(2) | ||||||||
| Total | $ | 10,585 |
| (1) | Significant changes to any unobservable inputs may result in a significant change to the fair value. |
| (2) | For fair-valued investments that cannot be readily traded in the market, the Valuation Committee may apply an illiquidity discount as an estimate on the impact to fair value. The Valuation Committee considers a range of premiums or discounts consistent with available information. |
| c) | Investment Transactions and Investment Income – Investment transactions are recorded as of the trade date (the date the order to buy or sell is executed) for financial reporting purposes. Investments purchased or sold on a when-issued or delayed-delivery basis may be settled a month or more after the trade date. Realized gains and losses are determined on the basis of identified cost. |
Dividend income is accrued as of the ex-dividend date, except certain dividends from foreign investments where the ex-dividend date may have passed are recorded as soon as the Fund is informed of the dividend. Interest income, including amortization of premium and accretion of discounts, is accrued on a daily basis.
| 14 |
| d) | Foreign Currency Transactions – Assets and liabilities denominated in currencies other than U.S. dollars are translated into U.S. dollars at the exchange rates in effect on the valuation date. Purchases and sales of investments, income, and expenses are translated into U.S. dollars at the exchange rates on the dates of such transactions. |
The Fund does not isolate that portion of portfolio investment valuation resulting from fluctuations in the foreign currency exchange rates from the fluctuations arising from changes in the market prices of investments held. Exchange rate fluctuations are included with the net realized and unrealized gain or loss on investments in the accompanying financial statements.
Net realized foreign exchange gains or losses arise from sales of foreign currencies and the difference between asset and liability amounts initially stated in foreign currencies and the U.S. dollar value of the amounts actually received or paid. Net unrealized foreign exchange gains or losses arise from changes in the value of other assets and liabilities at the end of the reporting period, resulting from changes in the exchange rates.
| e) | Joint Trading Account – The Fund may invest cash balances into a joint trading account that may be invested in one or more repurchase agreements. |
| f) | Fund Share Valuation and Dividend Distributions to Shareholders – Orders for the Fund’s shares are executed in accordance with the investment instructions of the contract holders and plan participants. The NAV of the Fund’s shares is determined as of the close of business on each business day of the Exchange. The NAV is determined separately for each class of shares of the Fund by dividing the Fund’s net assets attributable to that class by the number of shares of the class outstanding. Each class of shares offered by the Fund has equal rights as to assets and voting privileges (except that shareholders of a class have exclusive voting rights regarding any matter relating solely to that class of shares). Income and non-class specific expenses are allocated daily to each class on the basis of the relative net assets of the class. Realized and unrealized capital gains and losses are allocated daily based on the relative net assets of each class of shares of the Fund. |
Orders for the purchase of the Fund’s shares received prior to the close of the Exchange on any day the Exchange is open for business are priced at the NAV determined as of the close of the Exchange. Orders received after the close of the Exchange, or on a day on which the Exchange and/or the Fund is not open for business, are priced at the next determined NAV.
Dividends are declared pursuant to a policy adopted by the Company’s Board of Directors based upon the investment performance of the Fund. The policy of the Fund is to pay dividends from net investment income and realized capital gains, if any, at least once a year.
Distributions from net investment income, net realized capital gains and capital are determined in accordance with federal income tax regulations, which may differ from U.S. GAAP with respect to character and timing. These differences may include but are not limited to losses deferred due to wash sale adjustments, foreign currency gains and losses, adjustments related to Passive Foreign Investment Companies (“PFICs”), Real Estate Investment Trusts (“REITs”), Regulated Investment Companies (“RICs”), certain derivatives and partnerships. Permanent book and federal income tax basis differences relating to shareholder distributions will result in reclassifications to certain of the Fund’s capital accounts (see Federal Income Taxes: Reclassification of Capital Accounts note).
| 3. | Securities and Other Investments: |
| a) | Repurchase Agreements – A repurchase agreement is an agreement by which a counterparty agrees to sell an investment and agrees to repurchase the investment sold at a mutually agreed upon time and price. At the time the Fund enters into a repurchase agreement, the value of the underlying collateral, including accrued interest, will be equal to or exceed the value of the repurchase agreement. Repurchase agreements expose the Fund to counterparty risk. To minimize |
| 15 |
Hartford MidCap Value HLS Fund
Notes to Financial Statements – (continued)
June 30, 2012 (Unaudited)
(000’s Omitted)
counterparty risk, the investments that serve to collateralize the repurchase agreement are held by the Fund’s custodian in book entry or physical form in the custodial account of the Fund or in a third party custodial account. Repurchase agreements are valued at cost plus accrued interest. The Fund, as shown on the Schedule of Investments, had outstanding repurchase agreements as of June 30, 2012.
| b) | Illiquid and Restricted Investments – The Fund is permitted to invest up to 15% of its net assets in illiquid investments. Illiquid investments are those that may not be sold or disposed of in the ordinary course of business within seven days, at approximately the price used to determine the Fund’s NAV. The Fund may not be able to sell illiquid investments when its sub-adviser considers it desirable to do so or may have to sell such investments at a price that is lower than the price that could be obtained if the investments were more liquid. A sale of illiquid investments may require more time and may result in higher dealer discounts and other selling expenses than does the sale of those that are liquid. Illiquid investments also may be more difficult to value due to the unavailability of reliable market quotations for such investments, and an investment in them may have an adverse impact on the Fund’s NAV. The Fund may also purchase certain restricted investments that can only be resold to certain qualified investors and may be determined to be liquid pursuant to policies and guidelines established by the Company’s Board of Directors. The Fund, as shown on the Schedule of Investments, had illiquid and/or restricted investments as of June 30, 2012. |
| c) | Investments Purchased on a When-Issued or Delayed-Delivery Basis – Delivery and payment for investments that have been purchased by the Fund on a forward commitment, or when-issued or delayed-delivery basis, take place beyond the customary settlement period. A fund may dispose of or renegotiate a delayed-delivery transaction after it is entered into, and may sell delayed-delivery investments before they are delivered, which may result in a realized gain or loss. During this period, such investments are subject to market fluctuations, and the Fund identifies investments segregated in its records with a value at least equal to the amount of the commitment. The Fund, as shown on the Schedule of Investments, had when-issued or delayed delivery investments as of June 30, 2012. |
| 4. | Financial Derivative Instruments: |
The following disclosures contain information on how and why the Fund uses derivative instruments, the credit-risk-related contingent features in certain derivative instruments, and how derivative instruments affect the Fund’s financial position and results of operations. The location and fair value amounts of these instruments on the Statement of Assets and Liabilities and the realized gains and losses and changes in unrealized gains and losses on the Statement of Operations, each categorized by type of derivative contract, are included in the following Additional Derivative Instrument Information footnote. The derivative instruments outstanding as of period-end are disclosed in the notes to the Schedule of Investments and the amounts of realized gains and losses and changes in unrealized gains and losses on derivative instruments during the period are disclosed in the Statement of Operations.
| a) | Foreign Currency Contracts – The Fund may enter into foreign currency contracts that obligate the Fund to purchase or sell currencies at specified future dates. Foreign currency contracts are used to hedge the currency exposure associated with some or all of the Fund’s investments and/or as part of an investment strategy. Foreign currency contracts are marked to market daily and the change in value is recorded by the Fund as an unrealized gain or loss. The Fund will record a realized gain or loss when the foreign currency contract is settled. |
Foreign currency contracts involve elements of market risk in excess of the amounts reflected in the Statement of Assets and Liabilities. In addition, risks may arise upon entering into these contracts from the potential inability of the counterparties to meet the terms of the contracts and from unanticipated movements in the value of the foreign currencies relative to the U.S. dollar. The Fund had outstanding foreign currency contracts as shown on the Schedule of Investments as of June 30, 2012.
| 16 |
| b) | Additional Derivative Instrument Information: |
Fair Values of Derivative Instruments on the Statement of Assets and Liabilities as of June 30, 2012:
| Risk Exposure Category | ||||||||||||||||||||||||||||
| Interest Rate Contracts | Foreign Exchange Contracts | Credit Contracts | Equity Contracts | Commodity Contracts | Other Contracts | Total | ||||||||||||||||||||||
| Assets: | ||||||||||||||||||||||||||||
| Unrealized appreciation on foreign currency contracts | $ | — | $ | 3 | $ | — | $ | — | $ | — | $ | — | $ | 3 | ||||||||||||||
| Total | $ | — | $ | 3 | $ | — | $ | — | $ | — | $ | — | $ | 3 | ||||||||||||||
| Liabilities: | ||||||||||||||||||||||||||||
| Unrealized depreciation on foreign currency contracts | $ | — | $ | — | $ | — | $ | — | $ | — | $ | — | $ | — | ||||||||||||||
| Total | $ | — | $ | — | $ | — | $ | — | $ | — | $ | — | $ | — | ||||||||||||||
The volume of derivatives that is presented in the Schedule of Investments is consistent with the derivative activity during the six-month period ended June 30, 2012.
The effect of Derivative Instruments on the Statement of Operations for the six-month period ended June 30, 2012:
| Risk Exposure Category | ||||||||||||||||||||||||||||
| Interest Rate Contracts | Foreign Exchange Contracts | Credit Contracts | Equity Contracts | Commodity Contracts | Other Contracts | Total | ||||||||||||||||||||||
| Realized Gain (Loss) on Derivatives Recognized as a Result of Operations: | ||||||||||||||||||||||||||||
| Net realized gain on foreign currency contracts | $ | — | $ | 7 | $ | — | $ | — | $ | — | $ | — | $ | 7 | ||||||||||||||
| Total | $ | — | $ | 7 | $ | — | $ | — | $ | — | $ | — | $ | 7 | ||||||||||||||
| Net Change in Unrealized Appreciation (Depreciation) on Derivatives Recognized as a Result of Operations: | ||||||||||||||||||||||||||||
| Net change in unrealized appreciation of foreign currency contracts | $ | — | $ | 3 | $ | — | $ | — | $ | — | $ | — | $ | 3 | ||||||||||||||
| Total | $ | — | $ | 3 | $ | — | $ | — | $ | — | $ | — | $ | 3 | ||||||||||||||
| 5. | Principal Risks: |
| a) | Counterparty Risk – The Fund may be exposed to counterparty risk, or the risk that an institution or other entity with which the Fund has unsettled or open transactions will default. |
| b) | Market Risks – If the Fund invests directly in foreign currencies or in securities that trade in, and receive revenues in, foreign currencies, or in derivatives that provide exposure to foreign currencies, it will be subject to the risk that those currencies will decline in value relative to the base currency of the Fund, or, in the case of hedging positions, that the Fund’s base currency will decline in value relative to the currency being hedged. Currency rates in foreign countries may fluctuate significantly over short periods of time for a number of reasons, including changes in interest rates, intervention (or the failure to intervene) by U.S. or foreign governments, central banks or supranational entities, such as the International Monetary Fund, or by the imposition of currency controls or other political developments in the United States or abroad. As a result, the Fund’s investments in foreign currency denominated securities may reduce the returns of the Fund. The market values of equity securities, such as common stocks and preferred stocks, or equity related investments, such as futures and options, may decline due to general market conditions which are not specifically related to a particular company, such as real or perceived adverse economic conditions, changes in the general outlook for corporate earnings, changes in interest or currency rates or adverse investor sentiment generally. The market value of equity securities may also decline due to factors which affect a particular industry or industries, such as labor shortages |
| 17 |
Hartford MidCap Value HLS Fund
Notes to Financial Statements – (continued)
June 30, 2012 (Unaudited)
(000’s Omitted)
or increased production costs and competitive conditions within an industry. Equity securities and equity related investments generally have greater market price volatility than fixed income securities.
| 6. | Federal Income Taxes: |
| a) | Federal Income Taxes – For federal income tax purposes, the Fund intends to continue to qualify as a RIC under Subchapter M of the Internal Revenue Code (“IRC”) by distributing substantially all of its taxable net investment income and net realized capital gains to its shareholders and otherwise complying with the requirements of RICs. The Fund has distributed substantially all of its income and capital gains in prior years, if applicable, and intends to distribute substantially all of its income and capital gains prior to the next fiscal year-end. Accordingly, no provision for federal income or excise taxes has been made in the accompanying financial statements. Distributions from short-term capital gains are treated as ordinary income distributions for federal income tax purposes. |
| b) | Net Investment Income (Loss), Net Realized Gains (Losses) – Net investment income (loss) and net realized gains (losses) may differ for financial statement and tax purposes primarily because of losses deferred due to wash sale adjustments, foreign currency gains and losses, adjustments related to PFICs, REITs, RICs, certain derivatives and partnerships. The character of distributions made during the year from net investment income or net realized gains may differ from their ultimate characterization for federal income tax purposes. Also, due to the timing of dividend distributions, the fiscal year in which amounts are distributed may differ from the year that the income or realized gains (losses) were recorded by the Fund. |
| c) | Distributions and Components of Distributable Earnings – The tax character of distributions paid by the Fund for the periods indicated is as follows (as adjusted for dividends payable): |
| For the Year Ended December 31, 2011 | For the Year Ended December 31, 2010 | |||||||
| Ordinary Income | $ | 54 | $ | 3,020 | ||||
As of December 31, 2011, the Fund’s components of distributable earnings (deficit) on a tax basis were as follows:
| Amount | ||||
| Undistributed Ordinary Income | $ | 5,097 | ||
| Accumulated Capital and Other Losses* | (61,458 | ) | ||
| Unrealized Appreciation† | 8,849 | |||
| Total Accumulated Deficit | $ | (47,512 | ) | |
| * | The Fund has capital loss carryforwards that are identified in the Capital Loss Carryforward note that follows. | |
| † | The difference between book-basis and tax-basis unrealized appreciation (depreciation) may be attributable to the losses deferred due to wash sale adjustments, foreign currency gains and losses, adjustments related to PFICs, REITs, RICs, certain derivatives and partnerships. |
| 18 |
| d) | Reclassification of Capital Accounts – The Fund may record reclassifications in its capital accounts. These reclassifications have no impact on the total net assets of the Fund. The reclassifications are a result of permanent differences between U.S. GAAP and tax accounting for such items as foreign currency, PFICs, expiration or utilization of capital loss carryforwards or net operating losses. Adjustments are made to reflect the impact these items have on current and future distributions to shareholders. Therefore, the source of the Fund’s distributions may be shown in the accompanying Statement of Changes in Net Assets as from undistributed net investment income, from accumulated net realized gains on investments or from capital depending on the type of book and tax differences that exist. For the year ended December 31, 2011, the Fund recorded reclassifications to increase (decrease) the accounts listed below: |
| Amount | ||||
| Undistributed Net Investment Income | $ | 365 | ||
| Accumulated Net Realized Gain (Loss) | (365 | ) | ||
| e) | Capital Loss Carryforward – On December 22, 2010, the Regulated Investment Company Modernization Act of 2010 (the “Act”) was enacted, which made changes to the capital loss carryforward rules. The changes are effective for taxable years beginning after the date of enactment. Under the Act, funds are permitted to carry forward capital losses for an unlimited period. However, any losses incurred during those future taxable years will be required to be utilized prior to the losses incurred in pre-enactment taxable years, which carry an expiration date. As a result of this ordering rule, pre-enactment capital loss carryforwards may be more likely to expire unused. Additionally, post-enactment capital loss carryforwards retain their character as either short-term or long-term capital losses rather than being considered all short-term as permitted under prior regulation. |
At December 31, 2011 (tax-year-end), the Fund had capital loss carryforwards for U.S. federal income tax purposes as follows:
| Year of Expiration | Amount | |||
| 2016 | $ | 8,562 | ||
| 2017 | 52,896 | |||
| Total | $ | 61,458 | ||
As a result of current or past mergers in the Fund, certain provisions in the Internal Revenue Code may limit the future utilization of capital losses. During the year ended December 31, 2011, the Fund utilized $68,839 of prior year capital loss carryforwards.
| f) | Accounting for Uncertainty in Income Taxes – The Fund has adopted financial reporting rules that require the Fund to analyze all open tax years, as defined by the statute of limitations, for all major jurisdictions. Generally, tax authorities can examine all tax returns filed for the last three years. The Fund does not have an examination in progress. |
The Fund has reviewed all open tax years and major jurisdictions and concluded that these financial reporting rules had no effect on the Fund’s financial position or results of operations. There is no tax liability resulting from unrecognized tax benefits relating to uncertain income tax positions taken or expected to be taken on the tax return for the fiscal year ended December 31, 2011. The Fund is also not aware of any tax positions for which it is reasonably possible that the total amounts of unrecognized tax benefits will significantly change in the next twelve months.
| 7. | Expenses: |
| a) | Investment Management Agreement – HL Investment Advisors, LLC (“HL Advisors”), an indirect wholly owned subsidiary of The Hartford Financial Services Group, Inc. (“The Hartford”), serves as investment manager to the Fund pursuant to an Investment Management Agreement with the Company. As investment manager, HL Advisors has overall investment supervisory responsibility for the Fund. In addition, HL Advisors provides administrative personnel, services, equipment, facilities and office space for proper operation of the Fund. HL Advisors has contracted with Wellington Management Company, LLP (“Wellington Management”) under a sub-advisory agreement for the provision of day-to- |
| 19 |
Hartford MidCap Value HLS Fund
Notes to Financial Statements – (continued)
June 30, 2012 (Unaudited)
(000’s Omitted)
day investment management services to the Fund in accordance with the Fund’s investment objective and policies. The Fund pays a fee to HL Advisors, a portion of which may be used to compensate Wellington Management.
The schedule below reflects the rates of compensation paid to HL Advisors for investment management services rendered as of June 30, 2012; the rates are accrued daily and paid monthly.
| Average Daily Net Assets | Annual Fee | |||
| On first $500 million | 0.8000 | % | ||
| On next $500 million | 0.7250 | % | ||
| On next $1.5 billion | 0.6750 | % | ||
| On next $2.5 billion | 0.6700 | % | ||
| On next $5 billion | 0.6650 | % | ||
| Over $10 billion | 0.6600 | % | ||
The schedule below reflects the rates of compensation paid to HL Advisors for investment management services rendered during the period December 31, 2011, through February 29, 2012.
| Average Daily Net Assets | Annual Fee | |||
| On first $250 million | 0.8250 | % | ||
| On next $250 million | 0.7750 | % | ||
| On next $500 million | 0.7250 | % | ||
| On next $4 billion | 0.6750 | % | ||
| On next $5 billion | 0.6725 | % | ||
| Over $10 billion | 0.6700 | % | ||
| b) | Accounting Services Agreement – Pursuant to the Fund Accounting Agreement between HLIC and the Company, on behalf of the Fund, HLIC provides accounting services to the Fund and receives monthly compensation based on the Fund’s average daily net assets at the rates set forth below. The Fund’s accounting services fees are accrued daily and paid monthly. |
| Average Daily Net Assets | Annual Fee | |||
| All Assets | 0.010 | % | ||
| c) | Operating Expenses – Allocable expenses incurred by the Company are allocated to each Fund and allocated to classes within a Fund in proportion to the average daily net assets of the Fund and each class, except where allocation of certain expenses is more fairly made directly to the Fund or to specific classes within a Fund. |
| d) | Fees Paid Indirectly – The Company, on behalf of the Fund, has entered into agreements with State Street Global Markets, LLC and Russell Implementation Services, Inc. to partially recapture non-discounted trade commissions. Such rebates are used to pay a portion of the Fund’s expenses. In addition, the Fund’s custodian bank has also agreed to reduce its fees when the Fund maintains cash on deposit in a non-interest-bearing custody account. For the six-month period ended June 30, 2012, these amounts, if any, are included in the Statement of Operations. |
| 20 |
The ratio of expenses to average net assets in the accompanying financial highlights excludes the reduction in expenses related to fees paid indirectly. The annualized expense ratio for the period listed below reflecting the reduction for fees paid indirectly is as follows:
| Annualized Six- Month Period Ended June 30, 2012 | ||||
| Class IA | 0.84 | % | ||
| Class IB | 1.09 | % | ||
| e) | Distribution Plan for Class IB shares – The Company, on behalf of the Fund, has adopted a Distribution Plan pursuant to Rule 12b-1 of the 1940 Act to compensate the Distributor, Hartford Securities Distribution Company, Inc. (a wholly owned, ultimate subsidiary of The Hartford), from assets attributable to the Class IB shares for services rendered and expenses borne in connection with activities primarily intended to result in the sale of the Class IB shares, subject to the review and approval of the Company’s Board of Directors. |
The Distribution Plan provides that the Fund may pay annually up to 0.25% of the average daily net assets of the Fund attributable to its Class IB shares for activities primarily intended to result in the sale of Class IB shares. The Board has the authority to suspend or reduce these payments at any point in time. Under the terms of the Distribution Plan and the principal underwriting agreement, the Fund is authorized to make payments monthly to the Distributor that may be used to pay or compensate entities providing distribution and shareholder servicing with respect to the Class IB shares for such entities’ fees or expenses incurred or paid in that regard. These fees are accrued daily and paid monthly.
| f) | Other Related Party Transactions – Certain officers of the Fund are directors and/or officers of HL Advisors and/or The Hartford or its subsidiaries. For the six-month period ended June 30, 2012, a portion of the Fund’s chief compliance officer’s salary was paid by all the investment companies in the Hartford fund complex. The portion allocated to the Fund rounds to zero. Hartford Administrative Services Company (“HASCO”), an indirect wholly owned subsidiary of The Hartford, provides transfer agent services to the Fund. HASCO was compensated on a per account basis for providing such services. The amount paid to HASCO can be found in the Statement of Operations. These fees are accrued daily and paid monthly. |
| g) | Payment from Affiliate – In July of 2007, The Hartford entered into a settlement with the Attorneys General of the states of New York, Connecticut and Illinois relating to market timing and the company's individual variable annuity contracts in which certain payments would be made directly to the variable annuity contract holders. The distribution plan provided that unclaimed money from the settlement would be distributed to certain HLS Funds that are investment options through a Hartford individual variable annuity contract. The unclaimed money was distributed to the Fund on September 18, 2009. |
The total return in the accompanying financial highlights includes a payment from an affiliate. Had the payment from the affiliate been excluded, the impact and total return for the period listed below would have been as follows:
| For the Year Ended December 31, 2009 | ||||||||
Class IA | Class IB | |||||||
| Impact from Payment from Affiliate for Attorneys General Settlement | 0.01 | % | 0.01 | % | ||||
| Total Return Excluding Payment from Affiliate | 44.18 | % | 43.82 | % | ||||
| 21 |
Hartford MidCap Value HLS Fund
Notes to Financial Statements – (continued)
June 30, 2012 (Unaudited)
(000’s Omitted)
8. Investment Transactions:
For the six-month period ended June 30, 2012, the Fund's aggregate purchases and sales of investment securities (excluding short-term investments) were as follows:
| Amount | ||||
| Cost of Purchases Excluding U.S. Government Obligations | $ | 118,686 | ||
| Sales Proceeds Excluding U.S. Government Obligations | 200,035 | |||
9. Line of Credit:
The Fund is one of several Hartford funds that participate in a $500 million committed revolving line of credit facility. The facility is to be used for temporary or emergency purposes. Under the arrangement, the funds are required to own securities having a market value in excess of 300% of the total bank borrowings. The interest rate on borrowings varies depending on the nature of the loan. The facility also requires a fee to be paid based on the amount of the commitment. This commitment fee is allocated to all of the funds participating in the line of credit based on the average net assets of the funds. During the six-month period ended June 30, 2012, the Fund did not have any borrowings under this facility.
| 10. | Industry Classifications: |
Other than the industry classifications “Other Investment Pools and Funds” and “Exchange Traded Funds,” equity industry classifications used in this report are the Global Industry Classification Standard, which was developed by and is the exclusive property and service mark of MSCI, Inc. and Standard & Poor’s.
| 11. | Indemnifications: |
Under the Company’s organizational documents, the Company shall indemnify its officers and directors to the full extent required or permitted under Maryland General Corporation Law and the federal securities laws. In addition, the Company, on behalf of the Fund, may enter into contracts that contain a variety of indemnifications. The Company’s maximum exposure under these arrangements is unknown. However, as of the date of these financial statements, the Company has not had prior claims or losses pursuant to these contracts and expects the risk of loss to be remote.
| 22 |
[This page is intentionally left blank]
| 23 |
Hartford MidCap Value HLS Fund
Financial Highlights
- Selected Per-Share Data (A) -
| Class | Net Asset | Net Investment | Payments from | Net Realized | Total from | Dividends from | Distributions | Distributions | Total | Net Increase | Net Asset Value | |||||||||||||||||||||||||||||||||
| For the Six-Month Period Ended June 30, 2012 (Unaudited) | ||||||||||||||||||||||||||||||||||||||||||||
| IA | $ | 9.44 | $ | 0.06 | $ | – | $ | 1.04 | $ | 1.10 | $ | – | $ | – | $ | – | $ | – | $ | 1.10 | $ | 10.54 | ||||||||||||||||||||||
| IB | 9.38 | 0.04 | – | 1.04 | 1.08 | – | – | – | – | 1.08 | 10.46 | |||||||||||||||||||||||||||||||||
| For the Year Ended December 31, 2011 | ||||||||||||||||||||||||||||||||||||||||||||
| IA | 10.32 | 0.07 | – | (0.95 | ) | (0.88 | ) | – | – | – | – | (0.88 | ) | 9.44 | ||||||||||||||||||||||||||||||
| IB | 10.29 | 0.04 | – | (0.95 | ) | (0.91 | ) | – | – | – | – | (0.91 | ) | 9.38 | ||||||||||||||||||||||||||||||
| For the Year Ended December 31, 2010 (G) | ||||||||||||||||||||||||||||||||||||||||||||
| IA | 8.33 | 0.05 | – | 2.00 | 2.05 | (0.06 | ) | – | – | (0.06 | ) | 1.99 | 10.32 | |||||||||||||||||||||||||||||||
| IB | 8.30 | 0.03 | – | 1.99 | 2.02 | (0.03 | ) | – | – | (0.03 | ) | 1.99 | 10.29 | |||||||||||||||||||||||||||||||
| For the Year Ended December 31, 2009 | ||||||||||||||||||||||||||||||||||||||||||||
| IA | 5.82 | 0.07 | – | 2.50 | 2.57 | (0.06 | ) | – | – | (0.06 | ) | 2.51 | 8.33 | |||||||||||||||||||||||||||||||
| IB | 5.80 | 0.05 | – | 2.49 | 2.54 | (0.04 | ) | – | – | (0.04 | ) | 2.50 | 8.30 | |||||||||||||||||||||||||||||||
| For the Year Ended December 31, 2008 | ||||||||||||||||||||||||||||||||||||||||||||
| IA | 12.34 | 0.07 | – | (4.35 | ) | (4.28 | ) | (0.06 | ) | (2.18 | ) | – | (2.24 | ) | (6.52 | ) | 5.82 | |||||||||||||||||||||||||||
| IB | 12.30 | 0.05 | – | (4.33 | ) | (4.28 | ) | (0.04 | ) | (2.18 | ) | – | (2.22 | ) | (6.50 | ) | 5.80 | |||||||||||||||||||||||||||
| For the Year Ended December 31, 2007 | ||||||||||||||||||||||||||||||||||||||||||||
| IA | 14.18 | 0.08 | – | 0.51 | 0.59 | (0.07 | ) | (2.36 | ) | – | (2.43 | ) | (1.84 | ) | 12.34 | |||||||||||||||||||||||||||||
| IB | 14.13 | 0.04 | – | 0.53 | 0.57 | (0.04 | ) | (2.36 | ) | – | (2.40 | ) | (1.83 | ) | 12.30 | |||||||||||||||||||||||||||||
| (A) | Information presented relates to a share outstanding throughout the indicated period. |
| (B) | The figures do not include sales charges or other fees which may be applied at the variable life insurance, variable annuity or qualified retirement plan product level. Any such additional sales charges or other fees would lower the Fund's performance. |
| (C) | Ratios do not reflect reductions for fees paid indirectly. Please see Fees Paid Indirectly in the Notes to Financial Statements. |
| (D) | Portfolio turnover rate is calculated on the basis of the Fund as a whole without distinguishing between the classes of shares issued. |
| (E) | Not annualized. |
| (F) | Annualized. |
| (G) | Per share amounts have been calculated using the average shares method. |
| (H) | During the year ended December 31, 2010, the Fund incurred $89.7 million in purchases associated with the transition of assets from Hartford SmallCap Value HLS Fund, which merged into the Fund on July 30, 2010. These purchases were excluded from the portfolio turnover calculation. |
| (I) | Total return without the inclusion of the Payment from (to) Affiliate can be found in Expenses in the accompanying Notes to Financial Statements. |
| 24 |
- Ratios and Supplemental Data -
| Total Return(B) | Net Assets at End of Period | Ratio of Expenses to Average Net Assets Before Waivers(C) | Ratio of Expenses to Average Net Assets After Waivers(C) | Ratio of Net Investment Income (Loss) to Average Net Assets | Portfolio Turnover Rate(D) | |||||||||||||||
| 11.67 | %(E) | $ | 321,101 | 0.85 | %(F) | 0.85 | %(F) | 0.84 | %(F) | 26 | % | |||||||||
| 11.53 | (E) | 113,728 | 1.10 | (F) | 1.10 | (F) | 0.59 | (F) | – | |||||||||||
| (8.56 | ) | 341,583 | 0.83 | 0.83 | 0.57 | 43 | ||||||||||||||
| (8.79 | ) | 116,563 | 1.08 | 1.08 | 0.32 | – | ||||||||||||||
| 24.67 | 462,281 | 0.85 | 0.85 | 0.57 | 57 | (H) | ||||||||||||||
| 24.36 | 163,498 | 1.10 | 1.10 | 0.30 | – | |||||||||||||||
| 44.19 | (I) | 348,742 | 0.86 | 0.86 | 0.87 | 50 | ||||||||||||||
| 43.83 | (I) | 145,920 | 1.11 | 1.11 | 0.62 | – | ||||||||||||||
| (40.21 | ) | 301,896 | 0.81 | 0.81 | 0.82 | 51 | ||||||||||||||
| (40.36 | ) | 128,483 | 1.06 | 1.06 | 0.57 | – | ||||||||||||||
| 2.13 | 615,430 | 0.79 | 0.79 | 0.53 | 50 | |||||||||||||||
| 1.87 | 300,502 | 1.04 | 1.04 | 0.28 | – | |||||||||||||||
| 25 |
Hartford MidCap Value HLS Fund
Directors and Officers (Unaudited)
The Board of Directors of the Company appoints officers who are responsible for the day-to-day operations of the Fund and who execute policies formulated by the Directors. Each director serves until his or her death, resignation, or retirement or until the next annual meeting of shareholders is held or until his or her successor is elected and qualifies.
Directors and officers who are employed by or who have a financial interest in The Hartford are considered “interested” persons of the Fund pursuant to the 1940 Act. Each officer and two of the Company’s directors, as noted in the chart below, are “interested” persons of the Fund. Each director serves as a director for The Hartford Mutual Funds, Inc., The Hartford Mutual Funds II, Inc., Hartford Series Fund, Inc., Hartford HLS Series Fund II, Inc., and as a trustee for The Hartford Alternative Strategies Fund, which, as of June 30, 2012, collectively consist of 89 funds. Correspondence may be sent to directors and officers c/o Hartford Mutual Funds, P.O. Box 2999, Hartford, Connecticut 06104-2999, except that correspondence to Mr. Annoni, Mr. Dressen and Ms. Fagely may be sent to 500 Bielenberg Drive, Woodbury, Minnesota 55125.
The table below sets forth, for each director and officer, his or her name, year of birth, current position with the Company and date first elected or appointed to Hartford Series Fund, Inc. (“HSF”), and Hartford HLS Series Fund II, Inc. (“HSF2”), principal occupation, and, for directors, other directorships held. The Fund’s statement of additional information contains further information on the directors and is available free of charge by calling 1-800-862-6668 or writing to Hartford HLS Funds, c/o Individual Annuity Services, P.O. Box 5085, Hartford, CT 06102-5085.
Information on the aggregate remuneration paid to the directors of the Company can be found in the Statement of Operations herein. The Fund pays to The Hartford a portion of the Chief Compliance Officer’s compensation, but does not pay salaries or compensation to any of their other officers or directors who are employed by The Hartford.
Non-Interested Directors
Lynn S. Birdsong (1946) Director since 2003, Co-Chairman of the Investment Committee
Mr. Birdsong is a private investor. Mr. Birdsong currently serves as a Director of the Sovereign High Yield Investment Company (April 2010 to current). Mr. Birdsong currently serves as an Independent Director of Nomura Partners Funds, Inc. (formerly, The Japan Fund) (March 2003 to current). From 1979 to 2002, Mr. Birdsong was a managing director of Zurich Scudder Investments, an investment management firm. During his employment with Scudder, Mr. Birdsong was an Interested Director of The Japan Fund. Since 1981, Mr. Birdsong has been a partner in Birdsong Company, an advertising specialty firm.
Robert M. Gavin, Jr. (1940) Director since 2002 (HSF) and 1986 (HSF2), Chairman of the Board since 2004
Dr. Gavin is an educational consultant. Prior to September 1, 2001, he was President of Cranbrook Education Community and prior to July 1996, he was President of Macalester College, St. Paul, Minnesota.
Duane E. Hill (1945) Director since 2001 (HSF) and 2002 (HSF2), Chairman of the Nominating Committee
Mr. Hill is Partner of TSG Ventures L.P., a private equity investment company. Mr. Hill is a former partner of TSG Capital Group, a private equity investment firm that served as sponsor and lead investor in leveraged buyouts of middle market companies.
Sandra S. Jaffee (1941) Director since 2005
Ms. Jaffee is the founder and Chief Executive Officer of a private company, Homeworks Concierge, LLC, which provides residential property management services in Westchester County, New York (January 2012 to present). Ms. Jaffee served as Chairman (2008 to 2009) and Chief Executive Officer of Fortent (formerly Searchspace Group), a leading provider of compliance/regulatory technology to financial institutions from August 2005 to August 2009. Ms. Jaffe currently serves as a member of the Board of Directors of Broadridge Financial Solutions as well as a Trustee of Muhlenberg College.
William P. Johnston (1944) Director since 2005, Chairman of the Compliance Committee
In June 2006, Mr. Johnston was appointed as Senior Advisor to The Carlyle Group, a global private equity investment firm. In August 2007, Mr. Johnston was elected to the Board of Directors of LifeCare Holdings, Inc. In February 2008, Mr. Johnston was elected to the Board of Directors of HCR-ManorCare, Inc. In May 2006, Mr. Johnston was elected to the Supervisory Board of Fresenius Medical Care AG & Co. KGaA, after its acquisition of Renal Care Group, Inc. in March 2006.
Phillip O. Peterson (1944) Director since 2002 (HSF) and 2000 (HSF2), Chairman of the Audit Committee
Mr. Peterson is a mutual fund industry consultant. He was a partner of KPMG LLP (an accounting firm) until July 1999. Mr. Peterson joined William Blair Funds in February 2007 as a member of the Board of Trustees. Mr. Peterson also joined the Board of Trustees of Symetra Variable Mutual Funds Trust as a trustee in February 2012.
| 26 |
Lemma W. Senbet (1946) Director since 2005
Dr. Senbet is the William E. Mayer Chair Professor of Finance and Director, Center for Financial Policy, at the University of Maryland, Robert H. Smith School of Business. He was chair of the Finance Department from 1998 to 2006. Previously he was a chaired professor of finance at the University of Wisconsin-Madison. Also, he was director of the Fortis Funds from March 2000 to July 2002. Dr. Senbet served the finance profession in various capacities, including as director of the American Finance Association and President of the Western Finance Association. In 2006, Dr. Senbet was inducted Fellow of Financial Management Association International for his career-long distinguished scholarship and professional service.
Interested Directors and Officers
David N. Levenson (1966) Director since 2010(1)
Mr. Levenson currently serves as President of The Hartford’s Wealth Management business. He was appointed to this role in July 2010. Previously, Mr. Levenson served as Executive Vice President of Legacy Holdings for The Hartford from June 2009 to July 2010. From 2006 to 2009, Mr. Levenson was with Hartford Life Insurance K.K. where he served as President and Chief Executive Officer from 2007 to 2009. He served as Managing Director of Hartford Investment Management Company from 2005 to 2006. Additionally, Mr. Levenson serves as Executive Vice President of The Hartford and as President, Director and Chief Executive Officer of Hartford Life Insurance Company (“HLIC”) and Hartford Life, Inc. (“HL Inc.”).
(1) Mr. Levenson served as Interested Director until August 2, 2012.
Lowndes A. Smith (1939) Director since 1996 (HSF) and 2002 (HSF2), Co-Chairman of the Investment Committee
Mr. Smith served as Vice Chairman of The Hartford from February 1997 to January 2002, as President and Chief Executive Officer of HL Inc. from February 1997 to January 2002, and as President and Chief Operating Officer of The Hartford Life Insurance Companies from January 1989 to January 2002. Mr. Smith serves as a Director of White Mountains Insurance Group, Ltd., One Beacon Insurance and Symetra Financial and as Managing Director of Whittington Gray Associates.
Other Officers
James E. Davey (1964) President and Chief Executive Officer since 2010(2)
Mr. Davey serves as Executive Vice President of HLIC. Additionally, Mr. Davey serves as President, Chief Executive Officer and Manager of HIFSCO and President, Chief Executive Officer and Manager of HL Investment Advisors, LLC (“HL Advisors”). Mr. Davey joined The Hartford in 2002.
(2) Mr. Davey became an Interested Director effective August 2, 2012.
Mark A. Annoni (1964) Vice President, Controller and Treasurer since 2012(3)
Mr. Annoni serves as the Assistant Vice President and Director of Investment Finance (February 2004 to present). Mr. Annoni joined The Hartford in April 2001 as part of The Hartford’s acquisition of Fortis Financial Group. Prior to joining The Hartford, Mr. Annoni served as Manager of Mutual Fund Accounting at Fortis Financial Group (July 1997 to April 2001).
(3) Mr. Annoni was named Vice President, Controller and Treasurer on May 8, 2012.
Michael R. Dressen (1963) AML Compliance Officer since 2011
Mr. Dressen currently serves as Assistant Vice President of HLIC. He also serves as Chief Compliance Officer and AML Compliance Officer of Hartford Administrative Services Company (“HASCO”) and as Assistant Secretary and Compliance Officer of HIFSCO. Mr Dressen joined The Hartford in 2005 from State Farm Insurance Companies where he held various positions related to mutual funds, variable products, and property casualty insurance.
Tamara L. Fagely (1958) Vice President, since 2002 (HSF) and 1993 (HSF2)(4)
Ms. Fagely has been a Vice President of HASCO since 1998 and Chief Financial Officer since 2006. Currently Ms. Fagely is a Vice President of HLIC. She served as Assistant Vice President of HLIC from December 2001 through March 2005. In addition, Ms. Fagely is Controller and Chief Financial Officer of HIFSCO.
(4) Ms. Fagely served as Vice President, Controller and Treasurer until May 8, 2012.
Dr. Robert J. Froehlich (1953) Senior Managing Director since 2009(5)
Dr. Froehlich joined The Hartford as Senior Managing Director in September 2009. Prior to joining The Hartford, Dr. Froehlich served as Vice Chairman of Deutsche Asset Management from 1997-2009.
(5) Dr. Froehlich served as Senior Managing Director until March 26, 2012.
| 27 |
Hartford MidCap Value HLS Fund
Directors and Officers (Unaudited) – (continued)
Edward P. Macdonald (1967) Vice President, Secretary and Chief Legal Officer since 2005
Mr. Macdonald serves as Vice President of HLIC and Chief Legal Officer of Mutual Funds and Vice President of HIFSCO. He also serves as Vice President and Secretary of HASCO, and Chief Legal Officer, Secretary and Vice President of HL Advisors. Mr. Macdonald joined The Hartford in 2005.
Vernon J. Meyer (1964) Vice President since 2006
Mr. Meyer serves as Senior Vice President of HLIC. He also serves as Senior Vice President of HIFSCO and HL Advisors. Mr. Meyer joined The Hartford in 2004.
Colleen B. Pernerewski (1969) Vice President and Chief Compliance Officer since 2010
Ms. Pernerewski serves as Vice President and Chief Investment Advisor Compliance Officer of HIFSCO and as Vice President and Chief Compliance Officer of HL Advisors. Ms. Pernerewski serves as Vice President and Chief Compliance Officer of Individual Annuity of HLIC. Ms. Pernerewski joined The Hartford in 2005 from Travelers Life and Annuity where she served as Counsel (2004-2005). Prior to Travelers Life and Annuity, Ms. Pernerewski held the position of Counsel at The Hartford (1998-2004).
Elizabeth L. Schroeder (1966) Vice President since 2010
Ms. Schroeder currently serves as Assistant Vice President of HLIC. Ms. Schroeder joined HLIC in 1991. She is also an Assistant Vice President of HASCO, HIFSCO and HL Advisors.
Martin Swanson (1962) Vice President since 2010
Mr. Swanson is a Vice President of HLIC. Mr. Swanson also serves as Vice President/Marketing for HIFSCO. Prior to joining HLIC in 1998, Mr. Swanson was a Vice President at PaineWebber, Inc.
Jane Wolak (1961) Vice President since 2009
Ms. Wolak currently serves as Senior Vice President of HLIC. Ms. Wolak joined HLIC as Vice President, Retail Product Services in May 2007. She is also Vice President of HASCO. Previously, Ms. Wolak was with Sun Life Financial where she held the position of Vice President, Service Center Operations from 2001-2007.
HOW TO OBTAIN A COPY OF THE FUND’S PROXY VOTING POLICIES AND VOTING RECORDS (UNAUDITED)
A description of the policies and procedures that the Fund uses to determine how to vote proxies relating to portfolio securities and a record of how the Fund voted any proxies for the twelve-month period ended June 30, 2012 are available (1) without charge, upon request, by calling 800-862-6668 and (2) on the SEC’s website at http://www.sec.gov.
QUARTERLY PORTFOLIO HOLDINGS INFORMATION (UNAUDITED)
The Fund files a complete schedule of portfolio holdings with the SEC for the first and third quarters of each fiscal year on Form N-Q. The Fund’s Forms are available (1) without charge, upon request, by calling 800-862-6668 and (2) on the SEC’s website at http://www.sec.gov. The Form N-Q may be reviewed and copied at the SEC’s Public Reference Room in Washington, DC. Information on the operation of the Public Reference Room may be obtained by calling 1-800-SEC-0330.
| 28 |
Hartford MidCap Value HLS Fund
Expense Example (Unaudited)
Your Fund's Expenses
As a shareholder of the Fund, you incur two types of costs: (1) transaction costs and (2) ongoing costs including investment management fees, distribution fees, and other fund expenses. This example is intended to help you understand your ongoing costs (in dollars) of investing in the Fund and to compare these costs with the ongoing costs of investing in other mutual funds. The example is based on an investment of $1,000 invested at the beginning of the period and held for the period of December 31, 2011 through June 30, 2012.
Actual Expenses
The first set of columns of the table below provides information about actual account values and actual expenses. You may use the information in this column, together with the amount you invested, to estimate the expenses that you paid over the period. Simply divide your account value by $1,000 (for example, an $8,600 account value divided by $1,000 = 8.6), then multiply the result by the number in the line under the heading entitled “Expenses Paid During Period” to estimate the expenses you paid on your account during this period.
Hypothetical Example for Comparison Purposes
The second set of columns of the table below provides information about hypothetical account values and hypothetical expenses based on the Fund’s actual expense ratio and an assumed rate of return of 5% per year before expenses, which is not the Fund’s actual return. The hypothetical account values and expenses may not be used to estimate the actual ending account balance or expenses you paid for the period. You may use this information to compare the ongoing costs of investing in the Fund and other funds. To do so, compare this 5% hypothetical example with the 5% hypothetical examples that appear in the shareholder reports of the other funds.
Please note that the expenses shown in the table are meant to highlight your ongoing costs only and do not reflect any transactional costs, such as sales charges (loads) and CDSC. Therefore, the second set of columns of the table is useful in comparing ongoing costs only, and will not help you determine the relative total costs of owning different funds. In addition, if these transactional costs were included, your costs would be higher. Expenses are equal to the Fund's annualized expense ratios multiplied by average account value over the period, multiplied by 182/366 (to reflect the one-half year period).
| Actual return | Hypothetical (5% return before expenses) | |||||||||||||||||||||||||||||||||||
| Beginning Account Value December 31, 2011 | Ending Account Value June 30, 2012 | Expenses paid during the period December 31, 2011 through June 30, 2012 | Beginning Account Value December 31, 2011 | Ending Account Value June 30, 2012 | Expenses paid during the period December 31, 2011 through June 30, 2012 | Annualized expense ratio | Days in the current 1/2 year | Days in the full year | ||||||||||||||||||||||||||||
| Class IA | $ | 1,000.00 | $ | 1,116.66 | $ | 4.47 | $ | 1,000.00 | $ | 1,020.64 | $ | 4.27 | 0.85 | % | 182 | 366 | ||||||||||||||||||||
| Class IB | $ | 1,000.00 | $ | 1,115.26 | $ | 5.79 | $ | 1,000.00 | $ | 1,019.39 | $ | 5.52 | 1.10 | % | 182 | 366 | ||||||||||||||||||||
| 29 |
HARTFORD HLS FUNDS
c/o The Hartford Wealth Management - Global Annuities
P.O. Box 14293
Lexington, KY 40512-4293
Hartford Series Fund, Inc. is underwritten and distributed by Hartford Securities Distribution Company, Inc.
"The Hartford" is The Hartford Financial Services Group, Inc. and its subsidiaries.
Hartford Series Fund, Inc. inception dates range from 1977 to date. Hartford Series Fund, Inc. is not a subsidiary of The Hartford but is underwritten, distributed by and advised by subsidiaries of The Hartford. Investments in Hartford Series Fund, Inc. are not guaranteed by The Hartford or any other entity.
You should carefully consider investment objectives, risks, and charges and expenses of Hartford HLS Funds before investing. This and other information can be found in the Fund’s prospectus or summary prospectus, which can be obtained by calling 800-862-6668. Please read them carefully before you invest or send money.
| HLSSAR-MCV12 8-12 111647 Printed in U.S.A ©2012 The Hartford, Hartford, CT 06115 | |
A MESSAGE FROM THE PRESIDENT
Dear Fellow Shareholders:
I want to take this opportunity to say thank you for investing in the Hartford HLS Funds. We’ve seen continued market volatility throughout the first half of 2012, and there will likely be continued uncertainty until the Presidential election in November, but we are still optimistic about the markets in 2012.
Market Review
In the first quarter of 2012, the S&P 500 Index turned in its best quarterly performance since the third quarter of 2009. U.S. equities showed signs of improvement as investors focused on improving economic data and strong corporate earnings news and the Federal Reserve’s pledge to keep interest rates low buoyed investors’ appetites.
The second quarter ended on a high note for the stock market—the S&P 500 had its strongest June in more than a decade and the Dow Jones Industrial Average had its best month since October—but those gains weren’t enough to offset losses from April and May, and equities finished the quarter in the red. Although the S&P 500 was -2.75 for the second quarter, it was up 9.49% for the first half of 2012.
Concerns about domestic and European unemployment are having an effect on our economy. The unemployment rate in the euro zone's 17 nations rose to a record 11.1% in May, the highest level since the euro launched as a common currency more than 10 years ago. In the U.S., the labor market has been fickle this year, with job growth starting off strong in the first couple months of 2012 but slowing down in the spring, which has led many to wonder about the status of the economic recovery.
On a positive note, home prices are rising again after falling for more than five years, new and existing home sales are increasing, and home builders are ramping up construction.
The Hartford HLS Funds Expands Relationship with Wellington Management
We’re very pleased that we are expanding our relationship with Wellington Management, which will now serve as the primary sub-adviser for the Hartford HLS Funds including equity, fixed-income,* and asset-allocation funds. One of America’s oldest and largest investment management firms, Wellington Management has resources that span the entire globe, with multiple offices across the U.S. and numerous offices abroad. Wellington Management’s most distinctive strength is its proprietary research, which is shared across the entire organization.
We believe that aligning more closely with a well-respected money manager like Wellington Management puts us in a strong position to drive significant growth and to continue delivering innovative fund strategies to help our investors meet their financial goals.
Thank you again for investing with the Hartford HLS Funds.
James Davey
President
Hartford HLS Funds
*Several fixed-income funds will continue to be sub-advised by Hartford Investment Management Company.
Hartford Money Market HLS Fund
Table of Contents
This report is prepared for the general information of contract owners and qualified retirement plan participants. It is not an offer of contracts or of qualified retirement plans. It should not be used in connection with any offer, except in conjunction with the appropriate product prospectus which contains all pertinent information including the applicable sales, administrative and other charges.
| Hartford Money Market HLS Fund |
| Schedule of Investments |
| June 30, 2012 (Unaudited) |
| (000’s Omitted) |
| Shares or Principal Amount | Market Value ╪ | |||||||
| CERTIFICATES OF DEPOSIT - 1.8% | ||||||||
| Finance and Insurance - 1.8% | ||||||||
| Bank of Nova Scotia | ||||||||
| $ | 11,750 | 0.47%, 07/02/2012 | $ | 11,750 | ||||
| Toronto-Dominion Bank New York | ||||||||
| 10,600 | 0.21%, 08/13/2012 | 10,603 | ||||||
| 15,600 | 0.47%, 02/04/2013 Δ | 15,600 | ||||||
| 37,953 | ||||||||
| Total certificates of deposit | ||||||||
| (cost $37,953) | $ | 37,953 | ||||||
| COMMERCIAL PAPER - 36.8% | ||||||||
| Arts, Entertainment and Recreation - 1.8% | ||||||||
| Walt Disney Co. | ||||||||
| $ | 14,000 | 0.12%, 07/10/2012 ■ | $ | 13,999 | ||||
| 23,550 | 0.16%, 08/20/2012 ■ | 23,545 | ||||||
| 37,544 | ||||||||
| Beverage and Tobacco Product Manufacturing - 3.6% | ||||||||
| Coca Cola Co. | ||||||||
| 11,000 | 0.16%, 07/09/2012 | 10,999 | ||||||
| 31,500 | 0.22%, 08/14/2012 - 10/16/2012 | 31,484 | ||||||
| 10,250 | 0.23%, 11/05/2012 | 10,242 | ||||||
| Pepsico, Inc. | ||||||||
| 21,000 | 0.09%, 07/03/2012 ■ | 21,000 | ||||||
| 73,725 | ||||||||
| Chemical Manufacturing - 3.7% | ||||||||
| E.I. DuPont De Nemours & Co. | ||||||||
| 20,750 | 0.16%, 08/01/2012 ■ | 20,747 | ||||||
| 15,500 | 0.17%, 07/13/2012 ■ | 15,499 | ||||||
| 15,500 | 0.20%, 08/07/2012 ■ | 15,497 | ||||||
| Praxair, Inc. | ||||||||
| 24,150 | 0.11%, 07/11/2012 | 24,149 | ||||||
| 75,892 | ||||||||
| Computer and Electrical Products Manufacturing - 1.5% | ||||||||
| Merck & Co. | ||||||||
| 31,250 | 0.11%, 07/11/2012 | 31,249 | ||||||
| Finance and Insurance - 18.5% | ||||||||
| Bank of Nova Scotia | ||||||||
| 10,500 | 0.19%, 09/06/2012 | 10,496 | ||||||
| 10,500 | 0.21%, 08/03/2012 | 10,498 | ||||||
| 10,500 | 0.29%, 11/02/2012 | 10,490 | ||||||
| Caterpillar Financial Services Corp. | ||||||||
| 21,000 | 0.18%, 08/02/2012 | 20,997 | ||||||
| Deere (John) Capital Corp. | ||||||||
| 26,750 | 0.13%, 07/17/2012 ■ | 26,748 | ||||||
| 20,750 | 0.14%, 07/16/2012 ■ | 20,749 | ||||||
| General Electric Capital Corp. | ||||||||
| 16,500 | 0.12%, 07/02/2012 | 16,500 | ||||||
| 10,250 | 0.22%, 09/14/2012 | 10,245 | ||||||
| 10,500 | 0.25%, 10/17/2012 | 10,492 | ||||||
| 10,750 | 0.30%, 08/13/2012 | 10,746 | ||||||
| JP Morgan Chase & Co. | ||||||||
| 17,000 | 0.24%, 07/23/2012 | 16,997 | ||||||
| Old Line Funding LLC | ||||||||
| 15,500 | 0.19%, 08/27/2012 | 15,496 | ||||||
| 10,250 | 0.20%, 09/26/2012 | 10,245 | ||||||
| 15,500 | 0.22%, 09/20/2012 ■ | 15,492 | ||||||
| State Street Corp. | ||||||||
| 21,750 | 0.18%, 07/10/2012 | 21,749 | ||||||
| 16,000 | 0.22%, 07/25/2012 | 15,998 | ||||||
| Toronto-Dominion Holdings USA | ||||||||
| 25,750 | 0.20%, 09/25/2012 | 25,738 | ||||||
| Toyota Motor Credit Corp. | ||||||||
| 5,250 | 0.20%, 08/08/2012 | 5,249 | ||||||
| 10,500 | 0.23%, 09/06/2012 | 10,495 | ||||||
| 10,500 | 0.24%, 10/16/2012 | 10,493 | ||||||
| 5,250 | 0.25%, 09/20/2012 | 5,247 | ||||||
| 15,750 | 0.28%, 10/22/2012 ■ | 15,736 | ||||||
| U.S. Bank N.A. | ||||||||
| 36,750 | 0.14%, 07/09/2012 - 07/20/2012 | 36,748 | ||||||
| 15,750 | 0.17%, 07/19/2012 | 15,748 | ||||||
| Wells Fargo & Co. | ||||||||
| 10,250 | 0.18%, 09/21/2012 | 10,246 | ||||||
| 379,638 | ||||||||
| Health Care and Social Assistance - 2.5% | ||||||||
| Abbott Laboratories | ||||||||
| 35,000 | 0.15%, 07/24/2012 - 08/28/2012 ■ | 34,994 | ||||||
| 15,500 | 0.18%, 09/10/2012 ■ | 15,495 | ||||||
| 50,489 | ||||||||
| Machinery Manufacturing - 1.0% | ||||||||
| Caterpillar, Inc. | ||||||||
| 20,750 | 0.20%, 09/13/2012 | 20,741 | ||||||
| Mining - 1.0% | ||||||||
| Merck & Co. | ||||||||
| 20,750 | 0.12%, 08/01/2012 | 20,748 | ||||||
| Retail Trade - 2.5% | ||||||||
| Wal-Mart Stores, Inc. | ||||||||
| 26,000 | 0.13%, 08/16/2012 | 25,996 | ||||||
| 26,000 | 0.14%, 08/06/2012 | 25,996 | ||||||
| 51,992 | ||||||||
| Soap, Cleaning Compound and Toilet Manufacturing - 0.7% | ||||||||
| Colgate-Palmolive Co. | ||||||||
| 14,400 | 0.11%, 07/09/2012 | 14,400 | ||||||
| Total commercial paper | ||||||||
| (cost $756,418) | $ | 756,418 | ||||||
| CORPORATE NOTES - 5.6% | ||||||||
| Chemical Manufacturing - 0.9% | ||||||||
| Export Development Canada | ||||||||
| $ | 17,900 | 0.22%, 09/24/2012 | $ | 17,964 | ||||
| Finance and Insurance - 4.7% | ||||||||
| International Bank for Reconstruction & Development | ||||||||
| 17,250 | 0.21%, 07/13/2012 | 17,254 | ||||||
| JP Morgan Chase Bank | ||||||||
| 15,750 | 0.54%, 06/18/2013 Δ | 15,750 | ||||||
| Met Life Global Funding I | ||||||||
| 19,500 | 0.42%, 10/10/2012 ■ Δ | 19,500 | ||||||
| 12,000 | 0.59%, 07/06/2012 ■ Δ | 12,000 | ||||||
| Wells Fargo & Co. | ||||||||
| 21,000 | 0.46%, 10/23/2012 | 21,315 | ||||||
The accompanying notes are an integral part of these financial statements.
| 2 |
| Shares or Principal Amount | Market Value ╪ | |||||||||||
| CORPORATE NOTES - 5.6% - (continued) | ||||||||||||
| Finance and Insurance - 4.7% - (continued) | ||||||||||||
| Wells Fargo & Co. - (continued) | ||||||||||||
| $ | 10,250 | 0.54%, 07/19/2013 Δ | $ | 10,250 | ||||||||
| 96,069 | ||||||||||||
| Total corporate notes | ||||||||||||
| (cost $114,033) | $ | 114,033 | ||||||||||
| FOREIGN GOVERNMENT OBLIGATIONS - 7.8% | ||||||||||||
| Canada - 7.8% | ||||||||||||
| British Columbia (Province of) | ||||||||||||
| $ | 15,500 | 0.10%, 07/05/2012 | $ | 15,500 | ||||||||
| 18,460 | 0.21%, 10/03/2012 | 18,450 | ||||||||||
| Ontario (Province of) | ||||||||||||
| 10,250 | 0.15%, 10/04/2012 | 10,246 | ||||||||||
| 21,000 | 0.16%, 07/25/2012 | 20,998 | ||||||||||
| 10,500 | 0.22%, 11/30/2012 | 10,490 | ||||||||||
| 20,700 | 0.49%, 07/17/2012 | 20,745 | ||||||||||
| Quebec (Province of) | ||||||||||||
| 15,750 | 0.17%, 10/02/2012 ■ | 15,743 | ||||||||||
| 21,000 | 0.18%, 08/17/2012 ■ | 20,995 | ||||||||||
| 15,500 | 0.20%, 09/20/2012 | 15,493 | ||||||||||
| 10,750 | 0.20%, 10/03/2012 ■ | 10,744 | ||||||||||
| 159,404 | ||||||||||||
| Total foreign government obligations | ||||||||||||
| (cost $159,404) | $ | 159,404 | ||||||||||
| OTHER POOLS AND FUNDS - 0.0% | ||||||||||||
| 1 | JP Morgan U.S. Government Money Market Fund | $ | 1 | |||||||||
| — | Wells Fargo Advantage Government Money Market Fund | — | ||||||||||
| Total other pools and funds | ||||||||||||
| (cost $1) | $ | 1 | ||||||||||
| REPURCHASE AGREEMENTS - 24.4% | ||||||||||||
| Deutsche Bank Securities TriParty Joint Repurchase Agreement (maturing on 07/02/2012 in the amount of $34,820, collateralized by U.S. Treasury Note 0.38%, 2015, value of $35,516) | ||||||||||||
| $ | 34,820 | 0.14% dated 06/29/2012 | $ | 34,820 | ||||||||
| RBC Capital Markets TriParty Joint Repurchase Agreement (maturing on 07/02/2012 in the amount of $235,201, collateralized by U.S. Treasury Bill 0.19%, 2013, U.S. Treasury Bond 3.13%, 2/15/2042, U.S. Treasury Note 0.25% - 4.50%, 2014 - 2022, value of $239,903) | ||||||||||||
| 235,199 | 0.08% dated 06/29/2012 | 235,199 | ||||||||||
| RBS Greenwich Capital Markets TriParty Joint Repurchase Agreement (maturing on 07/02/2012 in the amount of $148,665, collateralized by U.S. Treasury Note 1.25% - 1.38%, 2012 - 2014, value of $151,637) | ||||||||||||
| 148,663 | 0.14% dated 06/29/2012 | 148,663 | ||||||||||
| UBS Securities, Inc. TriParty Joint Repurchase Agreement (maturing on 07/02/2012 in the amount of $82,781, collateralized by U.S. Treasury Note 2.00%, 2012, value of $84,435) | ||||||||||||
| 82,780 | 0.14% dated 06/29/2012 | 82,780 | ||||||||||
| Total repurchase agreements | ||||||||||||
| (cost $501,462) | $ | 501,462 | ||||||||||
| U.S. GOVERNMENT AGENCIES - 1.8% | ||||||||||||
| Federal Home Loan Mortgage Corp. - 1.1% | ||||||||||||
| $ | 21,600 | 0.12%, 09/10/2012 | $ | 21,595 | ||||||||
| Federal National Mortgage Association - 0.7% | ||||||||||||
| 15,250 | 0.06%, 07/09/2012 | 15,250 | ||||||||||
| Total U.S. government agencies | ||||||||||||
| (cost $36,845) | $ | 36,845 | ||||||||||
| U.S. GOVERNMENT SECURITIES - 21.8% | ||||||||||||
| Other Direct Federal Obligations - 6.0% | ||||||||||||
| Federal Home Loan Bank | ||||||||||||
| $ | 41,000 | 0.06%, 08/01/2012 | $ | 40,998 | ||||||||
| 41,000 | 0.08%, 07/20/2012 | 40,998 | ||||||||||
| 41,000 | 0.11%, 08/24/2012 | 40,993 | ||||||||||
| 122,989 | ||||||||||||
| U.S. Treasury Bills - 4.8% | ||||||||||||
| 33,000 | 0.10%, 07/12/2012 | 32,999 | ||||||||||
| 66,000 | 0.11%, 07/19/2012 - 07/26/2012 | 65,995 | ||||||||||
| 98,994 | ||||||||||||
| U.S. Treasury Notes - 11.0% | ||||||||||||
| 50,050 | 0.13%, 07/31/2012 | 50,071 | ||||||||||
| 54,750 | 0.16%, 08/31/2012 | 54,770 | ||||||||||
| 64,250 | 0.18%, 10/15/2012 - 10/31/2012 | 64,383 | ||||||||||
| 55,000 | 0.24%, 08/15/2012 | 55,288 | ||||||||||
| 224,512 | ||||||||||||
| Total U.S. government securities | ||||||||||||
| (cost $446,495) | $ | 446,495 | ||||||||||
| Total investments | ||||||||||||
| (cost $2,052,611) ▲ | 100.0 | % | $ | 2,052,611 | ||||||||
| Other assets and liabilities | — | % | 131 | |||||||||
| Total net assets | 100.0 | % | $ | 2,052,742 | ||||||||
The accompanying notes are an integral part of these financial statements.
| 3 |
| Hartford Money Market HLS Fund |
| Schedule of Investments – (continued) |
| June 30, 2012 (Unaudited) |
| (000’s Omitted) |
| Note: | Percentage of investments as shown is the ratio of the total market value to total net assets. The rates presented in this Schedule of Investments are yields, unless otherwise noted. |
| ▲ | Also represents cost for tax purposes. |
| Δ | Variable rate securities; the rate reported is the coupon rate in effect at June 30, 2012. |
| ■ | Securities issued within terms of a private placement memorandum, exempt from registration under Rule 144A under the Securities Act of 1933, as amended, and may be sold only to qualified institutional buyers. Unless otherwise indicated, these holdings are determined to be liquid. At June 30, 2012, the aggregate value of these securities was $318,483, which represents 15.5% of total net assets. |
| ╪ | See Significant Accounting Policies of accompanying Notes to Financial Statements regarding valuation of securities. |
The accompanying notes are an integral part of these financial statements.
| 4 |
| Hartford Money Market HLS Fund |
| Investment Valuation Hierarchy Level Summary |
| June 30, 2012 (Unaudited) |
| (000’s Omitted) |
| Total | Level 1 ♦ | Level 2 ♦ | Level 3 | |||||||||||||
| Assets: | ||||||||||||||||
| Certificates of Deposit | $ | 37,953 | $ | – | $ | 37,953 | $ | – | ||||||||
| Commercial Paper | 756,418 | – | 756,418 | – | ||||||||||||
| Corporate Notes | 114,033 | – | 114,033 | – | ||||||||||||
| Foreign Government Obligations | 159,404 | – | 159,404 | – | ||||||||||||
| Other Pools and Funds | 1 | 1 | – | – | ||||||||||||
| Repurchase Agreements | 501,462 | – | 501,462 | – | ||||||||||||
| U.S. Government Agencies | 36,845 | – | 36,845 | – | ||||||||||||
| U.S. Government Securities | 446,495 | – | 446,495 | – | ||||||||||||
| Total | $ | 2,052,611 | $ | 1 | $ | 2,052,610 | $ | – | ||||||||
| ♦ | For the six-month period ended June 30, 2012, there were no transfers between Level 1 and Level 2. |
The accompanying notes are an integral part of these financial statements.
| 5 |
| Hartford Money Market HLS Fund |
| Statement of Assets and Liabilities |
| June 30, 2012 (Unaudited) |
| (000’s Omitted) |
| Assets: | ||||
| Investments in securities, at market value (cost $2,052,611) | $ | 2,052,611 | ||
| Cash | — | |||
| Receivables: | ||||
| Fund shares sold | 5,309 | |||
| Dividends and interest | 2,198 | |||
| Other assets | 73 | |||
| Total assets | 2,060,191 | |||
| Liabilities: | ||||
| Payables: | ||||
| Fund shares redeemed | 7,255 | |||
| Investment management fees | 112 | |||
| Accrued expenses | 82 | |||
| Total liabilities | 7,449 | |||
| Net assets | $ | 2,052,742 | ||
| Summary of Net Assets: | ||||
| Capital stock and paid-in-capital | $ | 2,052,742 | ||
| Net assets | $ | 2,052,742 | ||
| Shares authorized | 14,000,000 | |||
| Par value | $ | 0.001 | ||
| Class IA: Net asset value per share | $ | 1.00 | ||
| Shares outstanding | 1,741,229 | |||
| Net assets | $ | 1,741,229 | ||
| Class IB: Net asset value per share | $ | 1.00 | ||
| Shares outstanding | 311,513 | |||
| Net assets | $ | 311,513 |
The accompanying notes are an integral part of these financial statements.
| 6 |
| Hartford Money Market HLS Fund |
| Statement of Operations |
| For the Six-Month Period Ended June 30, 2012 (Unaudited) |
| (000’s Omitted) |
| Investment Income: | ||||
| Dividends | $ | — | ||
| Interest | 1,731 | |||
| Total investment income, net | 1,731 | |||
| Expenses: | ||||
| Investment management fees | 4,321 | |||
| Transfer agent fees | 1 | |||
| Custodian fees | 3 | |||
| Accounting services fees | 108 | |||
| Board of Directors' fees | 26 | |||
| Audit fees | 5 | |||
| Other expenses | 103 | |||
| Total expenses (before waivers and fees paid indirectly) | 4,567 | |||
| Expense waivers | (2,836 | ) | ||
| Custodian fee offset | — | |||
| Total waivers and fees paid indirectly | (2,836 | ) | ||
| Total expenses, net | 1,731 | |||
| Net investment income | — | |||
| Net Realized Gain on Investments: | ||||
| Net realized gain on investments | — | |||
| Net Realized Gain on Investments | — | |||
| Net Gain on Investments | — | |||
| Net Increase in Net Assets Resulting from Operations | $ | — |
The accompanying notes are an integral part of these financial statements.
| 7 |
| Hartford Money Market HLS Fund |
| Statement of Changes in Net Assets |
| (000’s Omitted) |
| For the Six-Month Period Ended June 30, 2012 (Unaudited) | For the Year Ended December 31, 2011 | |||||||
| Operations: | ||||||||
| Net investment income | $ | — | $ | — | ||||
| Net realized gain on investments | — | — | ||||||
| Net Increase In Net Assets Resulting From Operations | — | — | ||||||
| Capital Share Transactions: | ||||||||
| Class IA | ||||||||
| Sold | 629,365 | 1,775,191 | ||||||
| Redeemed | (858,448 | ) | (1,890,893 | ) | ||||
| Total capital share transactions | (229,083 | ) | (115,702 | ) | ||||
| Class IB | ||||||||
| Sold | 82,174 | 267,452 | ||||||
| Redeemed | (147,309 | ) | (310,323 | ) | ||||
| Total capital share transactions | (65,135 | ) | (42,871 | ) | ||||
| Net decrease from capital share transactions | (294,218 | ) | (158,573 | ) | ||||
| Net Decrease In Net Assets | (294,218 | ) | (158,573 | ) | ||||
| Net Assets: | ||||||||
| Beginning of period | 2,346,960 | 2,505,533 | ||||||
| End of period | $ | 2,052,742 | $ | 2,346,960 | ||||
| Undistributed (distribution in excess of) net investment income | $ | — | $ | — | ||||
| Shares: | ||||||||
| Class IA | �� | |||||||
| Sold | 629,365 | 1,775,191 | ||||||
| Redeemed | (858,448 | ) | (1,890,893 | ) | ||||
| Total share activity | (229,083 | ) | (115,702 | ) | ||||
| Class IB | ||||||||
| Sold | 82,174 | 267,452 | ||||||
| Redeemed | (147,309 | ) | (310,323 | ) | ||||
| Total share activity | (65,135 | ) | (42,871 | ) | ||||
The accompanying notes are an integral part of these financial statements.
| 8 |
| Hartford Money Market HLS Fund |
| Notes to Financial Statements |
| June 30, 2012 (Unaudited) |
| (000’s Omitted) |
| 1. | Organization: |
Hartford Money Market HLS Fund (the “Fund”) serves as an underlying investment option for certain variable annuity and variable life insurance separate accounts of Hartford Life Insurance Company (“HLIC”) and its affiliates and certain qualified retirement plans. The Fund may also serve as an underlying investment option for certain variable annuity and variable life separate accounts of other insurance companies. Owners of variable annuity contracts and policyholders of variable life insurance contracts may choose the funds permitted in the variable insurance contract prospectus. In addition, participants in certain qualified retirement plans may choose the Fund if permitted by their plans.
Hartford Series Fund, Inc. (the “Company”) is an open-end registered management investment company comprised of thirty portfolios. Financial Statements for the Fund, a series of the Company, are included in this report.
The Company is organized under the laws of the State of Maryland and is registered with the Securities and Exchange Commission (“SEC”) under the Investment Company Act of 1940, as amended (“1940 Act”). The Fund is a diversified open-end management investment company.
The Fund is divided into Class IA and Class IB shares. Each class is offered at the per share net asset value (“NAV”) without a sales charge and is subject to the same expenses, except that the Class IB shares are subject to distribution and service fees charged pursuant to a Distribution Plan adopted in accordance with Rule 12b-1 under the 1940 Act.
| 2. | Significant Accounting Policies: |
The following is a summary of significant accounting policies of the Fund in the preparation of its financial statements, which are in accordance with the United States Generally Accepted Accounting Principles (“U.S. GAAP”). The preparation of financial statements in accordance with U.S. GAAP may require management to make estimates and assumptions that affect the reported amounts of assets and liabilities and disclosure of contingent assets and liabilities at the date of the financial statements and the reported amounts of increases and decreases in net assets from operations during the reporting period. Actual results could differ from those estimates.
| a) | Determination of Net Asset Value – The NAV of each class of the Fund’s shares is determined as of the close of regular trading (normally 4:00 p.m. Eastern Time) (the “NYSE Close”) on each day that the New York Stock Exchange (the “Exchange”) is open (“Valuation Date”). Information that becomes known to the Fund after the NAV has been calculated on a particular day will not generally be used to retroactively adjust the NAV determined earlier that day. |
| b) | Investment Valuation – The Fund’s investments are valued at amortized cost, which approximates market value. Investments in open-end mutual funds are valued at the respective NAV of each open-end mutual fund as determined on the Valuation Date. |
U.S. GAAP defines fair value as the price that the Fund would receive to sell an asset or pay to transfer a liability in an orderly transaction between market participants. The U.S. GAAP fair value measurement standards require disclosure of a fair value hierarchy for each major category of assets and liabilities. Various inputs are used in determining the fair value of the Fund’s investments. These inputs are summarized into three broad hierarchy levels. This hierarchy is based on whether the valuation inputs are observable or unobservable. These levels are:
| · | Level 1 – Quoted prices in active markets for identical investments. Level 1 may include exchange traded instruments, such as domestic equities, some foreign equities, options, futures, mutual funds, exchange traded funds, rights and warrants. |
| · | Level 2 – Observable inputs other than Level 1 prices, such as quoted prices for similar investments; quoted prices in markets that are not active; or other inputs that are observable or can be corroborated by observable |
| 9 |
| Hartford Money Market HLS Fund |
| Notes to Financial Statements – (continued) |
| June 30, 2012 (Unaudited) |
| (000’s Omitted) |
market data. Level 2 may include debt investments that are traded less frequently than exchange traded instruments and which are valued using independent pricing services; foreign equities, which are principally traded on certain foreign markets and are adjusted daily pursuant to a fair value pricing service in order to reflect an adjustment for the factors occurring after the close of certain foreign markets but before the NYSE Close; and short-term investments, which are valued at amortized cost.
| · | Level 3 – Significant unobservable inputs that are supported by limited or no market activity. Level 3 may include financial instruments whose values are determined using indicative market quotes or require significant management judgment or estimation. These unobservable valuation inputs may include estimates for current yields, maturity/duration, prepayment speed, and indicative market quotes for comparable investments along with other assumptions relating to credit quality, collateral value, complexity of the investment structure, general market conditions and liquidity. This category may include investments where trading has been halted or there are certain restrictions on trading. While these investments are priced using unobservable inputs, the valuation of these investments reflects the best available data and management believes the prices are a reasonable representation of exit price. |
The Board of Directors of the Company generally reviews and approves the “Procedures for Valuation of Portfolio Securities” on an annual basis. These procedures define how investments are to be valued, including the formation of a Valuation Committee. The Valuation Committee is responsible for determining in good faith the fair value of investments when the value cannot be obtained from primary pricing services or alternative sources or if the valuation of an investment as provided by the primary pricing service or alternative source is believed not to reflect the investment’s fair value as of the Valuation Date. Members of the Valuation Committee include the Fund’s Treasurer or designee, a Vice President of the Funds with legal expertise or designee, and a Vice President of the investment manager or designee. In addition, the Fund’s chief compliance officer shall designate a member of the compliance group to attend Valuation Committee meetings as a non-voting resource, to monitor for and provide guidance with respect to compliance with these procedures. Two members of the Valuation Committee or their designees, representing different departments, shall constitute a quorum for purposes of permitting the Valuation Committee to take action. The Valuation Committee will consider all relevant factors in determining an investment’s fair value, and may seek the advice of the Fund’s sub-adviser, knowledgeable brokers and legal counsel in making such determination. The Valuation Committee reports to the Audit Committee of the Company’s Board of Directors. The Audit Committee receives quarterly written reports which include details of all fair-valued investments, including the reason for the fair valuation, and an indication, when possible, of the accuracy of the valuation by disclosing the next available reliable public price quotation or the disposition price of such investments (the “look-back” test). The Board of Directors then must consider for ratification all of the fair value determinations made during the previous quarter.
Valuation levels are not necessarily indicative of the risk associated with investing in such investments. Individual investments within any of the above mentioned asset classes may be assigned a different hierarchical level than those presented above, as individual circumstances dictate.
For additional information, refer to the Investment Valuation Hierarchy Level Summary.
For purposes of reporting transfers between different hierarchy levels, both transfers in and out of each level, as applicable, are shown as if they occurred at the beginning of the period.
| c) | Investment Transactions and Investment Income – Investment transactions are recorded as of the trade date (the date the order to buy or sell is executed) for financial reporting purposes. Realized gains and losses are determined on the basis of identified cost. |
Interest income, including amortization of premium and accretion of discounts, is accrued on a daily basis.
| 10 |
| d) | Joint Trading Account – The Fund may invest cash balances into a joint trading account that may be invested in one or more repurchase agreements. |
| e) | Fund Share Valuation and Dividend Distributions to Shareholders – Orders for the Fund’s shares are executed in accordance with the investment instructions of the contract holders and plan participants. The NAV of the Fund’s shares is determined as of the close of business on each business day of the Exchange. The NAV is determined separately for each class of shares of the Fund by dividing the Fund’s net assets attributable to that class by the number of shares of the class outstanding. Each class of shares offered by the Fund has equal rights as to assets and voting privileges (except that shareholders of a class have exclusive voting rights regarding any matter relating solely to that class of shares). Income and non-class specific expenses are allocated daily to each class on the basis of the relative net assets of the class. Realized and unrealized capital gains and losses are allocated daily based on the relative net assets of each class of shares of the Fund. |
Orders for the purchase of the Fund’s shares received prior to the close of the Exchange on any day the Exchange is open for business are priced at the NAV determined as of the close of the Exchange. Orders received after the close of the Exchange, or on a day on which the Exchange and/or the Fund is not open for business, are priced at the next determined NAV.
Dividends are declared pursuant to a policy adopted by the Company’s Board of Directors based upon the investment performance of the Fund. Normally, dividends from net investment income are declared daily and paid monthly. Dividends from realized capital gains, if any, are paid at least once a year.
Distributions from net investment income, net realized capital gains and capital are determined in accordance with federal income tax regulations, which may differ from U.S. GAAP with respect to character and timing. These differences may include but are not limited to losses deferred due to wash sale adjustments and short-term capital gain adjustments. Permanent book and federal income tax basis differences relating to shareholder distributions will result in reclassifications to certain of the Fund’s capital accounts (see Federal Income Taxes: Reclassification of Capital Accounts note).
| 3. | Securities and Other Investments: |
| a) | Repurchase Agreements – A repurchase agreement is an agreement by which a counterparty agrees to sell an investment and agrees to repurchase the investment sold at a mutually agreed upon time and price. At the time the Fund enters into a repurchase agreement, the value of the underlying collateral, including accrued interest, will be equal to or exceed the value of the repurchase agreement. Repurchase agreements expose the Fund to counterparty risk. To minimize counterparty risk, the investments that serve to collateralize the repurchase agreement are held by the Fund’s custodian in book entry or physical form in the custodial account of the Fund or in a third party custodial account. Repurchase agreements are valued at cost plus accrued interest. The Fund, as shown on the Schedule of Investments, had outstanding repurchase agreements as of June 30, 2012. |
| b) | Illiquid and Restricted Investments – The Fund is permitted to invest up to 15% of its net assets in illiquid investments. Illiquid investments are those that may not be sold or disposed of in the ordinary course of business within seven days, at approximately the price used to determine the Fund’s NAV. The Fund may not be able to sell illiquid investments when its sub-adviser considers it desirable to do so or may have to sell such investments at a price that is lower than the price that could be obtained if the investments were more liquid. A sale of illiquid investments may require more time and may result in higher dealer discounts and other selling expenses than does the sale of those that are liquid. Illiquid investments also may be more difficult to value due to the unavailability of reliable market quotations for such investments, and an investment in them may have an adverse impact on the Fund’s NAV. The Fund may also purchase certain restricted investments that can only be resold to certain qualified investors and may be determined to be liquid |
| 11 |
| Hartford Money Market HLS Fund |
| Notes to Financial Statements – (continued) |
| June 30, 2012 (Unaudited) |
| (000’s Omitted) |
pursuant to policies and guidelines established by the Company’s Board of Directors. The Fund, as shown on the Schedule of Investments, had illiquid and/or restricted investments as of June 30, 2012.
| c) | Investments Purchased on a When-Issued or Delayed-Delivery Basis – Delivery and payment for investments that have been purchased by the Fund on a forward commitment, or when-issued or delayed-delivery basis, take place beyond the customary settlement period. A fund may dispose of or renegotiate a delayed-delivery transaction after it is entered into, and may sell delayed-delivery investments before they are delivered, which may result in a realized gain or loss. During this period, such investments are subject to market fluctuations, and the Fund identifies investments segregated in its records with a value at least equal to the amount of the commitment. As of June 30, 2012, the Fund had no outstanding when-issued or delayed delivery investments. |
| 4. | Principal Risks: |
| a) | Credit and Counterparty Risks – Credit risk depends largely on the perceived financial health of bond issuers. In general, the credit rating is inversely related to the credit risk of the issuer. Higher rated bonds generally are deemed to have less credit risk, while lower or unrated bonds are deemed to have higher risk of default. The share price, yield and total return of a fund that holds securities with higher credit risk may be more volatile than those of a fund that holds bonds with lower credit risk. Similar to credit risk, the Fund may be exposed to counterparty risk, or the risk that an institution or other entity with which the Fund has unsettled or open transactions will default. |
| b) | Market Risks – The Fund’s investments expose the Fund to various risks including, but not limited to, interest rate, prepayment and extension risks. Interest rate risk is the risk that fixed income securities will decline in value because of changes in interest rates. As nominal interest rates rise, the value of certain fixed income securities held by the Fund is likely to decrease. A nominal interest rate can be described as the sum of a real interest rate and an expected inflation rate. |
| 5. | Federal Income Taxes: |
| a) | Federal Income Taxes – For federal income tax purposes, the Fund intends to continue to qualify as a RIC under Subchapter M of the Internal Revenue Code (“IRC”) by distributing substantially all of its taxable net investment income and net realized capital gains to its shareholders and otherwise complying with the requirements of RICs. The Fund has distributed substantially all of its income and capital gains in prior years, if applicable, and intends to distribute substantially all of its income and capital gains prior to the next fiscal year-end. Accordingly, no provision for federal income or excise taxes has been made in the accompanying financial statements. Distributions from short-term capital gains are treated as ordinary income distributions for federal income tax purposes. |
| b) | Net Investment Income (Loss), Net Realized Gains (Losses) – Net investment income (loss) and net realized gains (losses) may differ for financial statement and tax purposes primarily because of losses deferred due to wash sale adjustments, foreign currency gains and losses, adjustments related to PFICs, REITs, RICs, certain derivatives and partnerships. The character of distributions made during the year from net investment income or net realized gains may differ from their ultimate characterization for federal income tax purposes. Also, due to the timing of dividend distributions, the fiscal year in which amounts are distributed may differ from the year that the income or realized gains (losses) were recorded by the Fund. |
| c) | Reclassification of Capital Accounts – The Fund may record reclassifications in its capital accounts. These reclassifications have no impact on the total net assets of the Fund. The reclassifications are a result of permanent differences between U.S. GAAP and tax accounting for such items as foreign currency, PFICs, expiration or utilization of capital loss carryforwards or net operating losses. Adjustments are made to reflect the impact these items have on current and future distributions to shareholders. Therefore, the source of the Fund’s distributions may be shown in the accompanying Statement of Changes in Net Assets as from undistributed net investment income, from accumulated net |
| 12 |
realized gains on investments or from capital depending on the type of book and tax differences that exist. For the year ended December 31, 2011, the Fund had no reclassifications.
| d) | Capital Loss Carryforward – On December 22, 2010, the Regulated Investment Company Modernization Act of 2010 (the “Act”) was enacted, which made changes to the capital loss carryforward rules. The changes are effective for taxable years beginning after the date of enactment. Under the Act, funds are permitted to carry forward capital losses for an unlimited period. However, any losses incurred during those future taxable years will be required to be utilized prior to the losses incurred in pre-enactment taxable years, which carry an expiration date. As a result of this ordering rule, pre-enactment capital loss carryforwards may be more likely to expire unused. Additionally, post-enactment capital loss carryforwards retain their character as either short-term or long-term capital losses rather than being considered all short-term as permitted under prior regulation. |
The Fund had no capital loss carryforward for U.S. federal income tax purposes as of December 31, 2011.
| e) | Accounting for Uncertainty in Income Taxes – The Fund has adopted financial reporting rules that require the Fund to analyze all open tax years, as defined by the statute of limitations, for all major jurisdictions. Generally, tax authorities can examine all tax returns filed for the last three years. The Fund does not have an examination in progress. |
The Fund has reviewed all open tax years and major jurisdictions and concluded that these financial reporting rules had no effect on the Fund’s financial position or results of operations. There is no tax liability resulting from unrecognized tax benefits relating to uncertain income tax positions taken or expected to be taken on the tax return for the fiscal year ended December 31, 2011. The Fund is also not aware of any tax positions for which it is reasonably possible that the total amounts of unrecognized tax benefits will significantly change in the next twelve months.
| 6. | Expenses: |
| a) | Investment Management Agreement – HL Investment Advisors, LLC (“HL Advisors”), an indirect wholly owned subsidiary of The Hartford Financial Services Group, Inc. (“The Hartford”), serves as investment manager to the Fund pursuant to an Investment Management Agreement with the Company. As investment manager, HL Advisors has overall investment supervisory responsibility for the Fund. In addition, HL Advisors provides administrative personnel, services, equipment, facilities and office space for proper operation of the Fund. HL Advisors has contracted with Hartford Investment Management Company (“Hartford Investment Management”) under a sub-advisory agreement for the provision of day-to-day investment management services to the Fund in accordance with the Fund’s investment objective and policies. The Fund pays a fee to HL Advisors, a portion of which may be used to compensate Hartford Investment Management. |
The schedule below reflects the rates of compensation paid to HL Advisors for investment management services rendered as of June 30, 2012; the rates are accrued daily and paid monthly.
| Average Daily Net Assets | Annual Fee | |||
| On first $5 billion | 0.4000 | % | ||
| On next $5 billion | 0.3800 | % | ||
| Over $10 billion | 0.3700 | % | ||
| b) | Accounting Services Agreement – Pursuant to the Fund Accounting Agreement between HLIC and the Company, on behalf of the Fund, HLIC provides accounting services to the Fund and receives monthly compensation based on the Fund’s average daily net assets at the rates set forth below. The Fund’s accounting services fees are accrued daily and paid monthly. |
| Average Daily Net Assets | Annual Fee | |||
| All Assets | 0.010 | % | ||
| 13 |
| Hartford Money Market HLS Fund |
| Notes to Financial Statements – (continued) |
| June 30, 2012 (Unaudited) |
| (000’s Omitted) |
| c) | Operating Expenses – Allocable expenses incurred by the Company are allocated to each Fund and allocated to classes within a Fund in proportion to the average daily net assets of the Fund and each class, except where allocation of certain expenses is more fairly made directly to the Fund or to specific classes within a Fund. |
| d) | Fees Paid Indirectly – The Fund’s custodian bank has agreed to reduce its fees when the Fund maintains cash on deposit in a non-interest-bearing custody account. For the six-month period ended June 30, 2012, these amounts, if any, are included in the Statement of Operations. |
The ratio of expenses to average net assets in the accompanying financial highlights excludes the reduction in expenses related to fees paid indirectly. The annualized expense ratio for the period listed below reflecting the reduction for fees paid indirectly is as follows:
| Annualized Six- Month Period Ended June 30, 2012 | ||||
| Class IA | 0.16 | % | ||
| Class IB | 0.16 | % | ||
| e) | Distribution Plan for Class IB shares – The Company, on behalf of the Fund, has adopted a Distribution Plan pursuant to Rule 12b-1 of the 1940 Act to compensate the Distributor, Hartford Securities Distribution Company, Inc. (a wholly owned, ultimate subsidiary of The Hartford), from assets attributable to the Class IB shares for services rendered and expenses borne in connection with activities primarily intended to result in the sale of the Class IB shares, subject to the review and approval of the Company’s Board of Directors. |
The Distribution Plan provides that the Fund may pay annually up to 0.25% of the average daily net assets of the Fund attributable to its Class IB shares for activities primarily intended to result in the sale of Class IB shares. The Board has the authority to suspend or reduce these payments at any point in time. Under the terms of the Distribution Plan and the principal underwriting agreement, the Fund is authorized to make payments monthly to the Distributor that may be used to pay or compensate entities providing distribution and shareholder servicing with respect to the Class IB shares for such entities’ fees or expenses incurred or paid in that regard. These fees are accrued daily and paid monthly.
At a meeting held on February 4, 2009, the Board of Directors approved the temporary reduction of distribution and service fees under the Fund’s 12b-1 Plan of Distribution to zero for Class IB for a period of six months, effective March 1, 2009. The Board of Directors has extended the reduction of payment of distribution and service fees through August 31, 2012. The Fund’s action results in a corresponding temporary reduction of 12b-1 payments of amounts paid to financial intermediaries by the Fund’s distributor to zero for Class IB during this time period. The Board of Directors’ action can be changed at any time.
| f) | Other Related Party Transactions – Certain officers of the Fund are directors and/or officers of HL Advisors and/or The Hartford or its subsidiaries. For the six-month period ended June 30, 2012, a portion of the Fund’s chief compliance officer’s salary was paid by all the investment companies in the Hartford fund complex. The portion allocated to the Fund was in the amount of $2. Hartford Administrative Services Company (“HASCO”), an indirect wholly owned subsidiary of The Hartford, provides transfer agent services to the Fund. HASCO was compensated on a per account basis for providing such services. The amount paid to HASCO can be found in the Statement of Operations. These fees are accrued daily and paid monthly. |
7. Investment Transactions:
For the six-month period ended June 30, 2012, the costs of purchases and sales of securities (including U.S. Government Obligations) for the Fund were $83,447,058 and $83,741,009, respectively.
| 14 |
| 8. | Indemnifications: |
Under the Company’s organizational documents, the Company shall indemnify its officers and directors to the full extent required or permitted under Maryland General Corporation Law and the federal securities laws. In addition, the Company, on behalf of the Fund, may enter into contracts that contain a variety of indemnifications. The Company’s maximum exposure under these arrangements is unknown. However, as of the date of these financial statements, the Company has not had prior claims or losses pursuant to these contracts and expects the risk of loss to be remote.
| 15 |
| Hartford Money Market HLS Fund |
| Financial Highlights |
| - Selected Per-Share Data (A) - |
| Class | Net Asset Value at Beginning of Period | Net Investment Income (Loss) | Payments from (to) Affiliate | Net Realized and Unrealized Gain (Loss) on Investments | Total from Investment Operations | Dividends from Net Investment Income | Distributions from Realized Capital Gains | Distributions from Capital | Total Distributions | Net Increase (Decrease) in Net Asset Value | Net Asset Value at End of Period | |||||||||||||||||||||||||||||||||
| For the Six-Month Period Ended June 30, 2012 (Unaudited) | ||||||||||||||||||||||||||||||||||||||||||||
| IA | $ | 1.00 | $ | – | $ | – | $ | – | $ | – | $ | – | $ | – | $ | – | $ | – | $ | – | $ | 1.00 | ||||||||||||||||||||||
| IB | 1.00 | – | – | – | – | – | – | – | – | – | 1.00 | |||||||||||||||||||||||||||||||||
| For the Year Ended December 31, 2011 | ||||||||||||||||||||||||||||||||||||||||||||
| IA | 1.00 | – | – | – | – | – | – | – | – | – | 1.00 | |||||||||||||||||||||||||||||||||
| IB | 1.00 | – | – | – | – | – | – | – | – | – | 1.00 | |||||||||||||||||||||||||||||||||
| For the Year Ended December 31, 2010 | ||||||||||||||||||||||||||||||||||||||||||||
| IA | 1.00 | – | – | – | – | – | – | – | – | – | 1.00 | |||||||||||||||||||||||||||||||||
| IB | 1.00 | – | – | – | – | – | – | – | – | – | 1.00 | |||||||||||||||||||||||||||||||||
| For the Year Ended December 31, 2009 | ||||||||||||||||||||||||||||||||||||||||||||
| IA | 1.00 | – | – | – | – | – | – | – | – | – | 1.00 | |||||||||||||||||||||||||||||||||
| IB | 1.00 | – | – | – | – | – | – | – | – | – | 1.00 | |||||||||||||||||||||||||||||||||
| For the Year Ended December 31, 2008 | ||||||||||||||||||||||||||||||||||||||||||||
| IA | 1.00 | 0.02 | – | – | 0.02 | (0.02) | – | – | (0.02) | – | 1.00 | |||||||||||||||||||||||||||||||||
| IB | 1.00 | 0.02 | – | – | 0.02 | (0.02) | – | – | (0.02) | – | 1.00 | |||||||||||||||||||||||||||||||||
| For the Year Ended December 31, 2007 | ||||||||||||||||||||||||||||||||||||||||||||
| IA | 1.00 | 0.05 | – | – | 0.05 | (0.05) | – | – | (0.05) | – | 1.00 | |||||||||||||||||||||||||||||||||
| IB | 1.00 | 0.05 | – | – | 0.05 | (0.05) | – | – | (0.05) | – | 1.00 | |||||||||||||||||||||||||||||||||
| (A) | Information presented relates to a share outstanding throughout the indicated period. |
| (B) | The figures do not include sales charges or other fees which may be applied at the variable life insurance, variable annuity or qualified retirement plan product level. Any such additional sales charges or other fees would lower the Fund's performance. |
| (C) | Ratios do not reflect reductions for fees paid indirectly. Please see Fees Paid Indirectly in the Notes to Financial Statements. |
| (D) | Not annualized. |
| (E) | Annualized. |
| 16 |
| - Ratios and Supplemental Data - |
| Total Return(B) | Net Assets at End of Period | Ratio of Expenses to Average Net Assets Before Waivers(C) | Ratio of Expenses to Average Net Assets After Waivers(C) | Ratio of Net Investment Income (Loss) to Average Net Assets | Portfolio Turnover Rate | ||||||||||||||||||
| – | %(D) | $ | 1,741,229 | 0.42 | %(E) | 0.16 | %(E) | – | %(E) | N/A | |||||||||||||
| – | (D) | 311,513 | 0.42 | (E) | 0.16 | (E) | – | (E) | – | ||||||||||||||
| – | 1,970,312 | 0.42 | 0.16 | – | N/A | ||||||||||||||||||
| – | 376,648 | 0.42 | 0.16 | – | – | ||||||||||||||||||
| – | 2,086,014 | 0.43 | 0.22 | – | N/A | ||||||||||||||||||
| – | 419,519 | 0.43 | 0.22 | – | – | ||||||||||||||||||
| 0.06 | 2,820,121 | 0.48 | 0.32 | 0.02 | N/A | ||||||||||||||||||
| 0.05 | 548,134 | 0.53 | 0.34 | 0.00 | – | ||||||||||||||||||
| 2.15 | 4,427,230 | 0.47 | 0.42 | 2.01 | N/A | ||||||||||||||||||
| 1.89 | 774,432 | 0.72 | 0.67 | 1.80 | – | ||||||||||||||||||
| 4.95 | 2,224,124 | 0.47 | 0.42 | 4.83 | N/A | ||||||||||||||||||
| 4.69 | 452,976 | 0.72 | 0.67 | 4.58 | – | ||||||||||||||||||
| 17 |
| Hartford Money Market HLS Fund |
| Directors and Officers (Unaudited) |
The Board of Directors of the Company appoints officers who are responsible for the day-to-day operations of the Fund and who execute policies formulated by the Directors. Each director serves until his or her death, resignation, or retirement or until the next annual meeting of shareholders is held or until his or her successor is elected and qualifies.
Directors and officers who are employed by or who have a financial interest in The Hartford are considered “interested” persons of the Fund pursuant to the 1940 Act. Each officer and two of the Company’s directors, as noted in the chart below, are “interested” persons of the Fund. Each director serves as a director for The Hartford Mutual Funds, Inc., The Hartford Mutual Funds II, Inc., Hartford Series Fund, Inc., Hartford HLS Series Fund II, Inc., and as a trustee for The Hartford Alternative Strategies Fund, which, as of June 30, 2012, collectively consist of 89 funds. Correspondence may be sent to directors and officers c/o Hartford Mutual Funds, P.O. Box 2999, Hartford, Connecticut 06104-2999, except that correspondence to Mr. Annoni, Mr. Dressen and Ms. Fagely may be sent to 500 Bielenberg Drive, Woodbury, Minnesota 55125.
The table below sets forth, for each director and officer, his or her name, year of birth, current position with the Company and date first elected or appointed to Hartford Series Fund, Inc. (“HSF”), and Hartford HLS Series Fund II, Inc. (“HSF2”), principal occupation, and, for directors, other directorships held. The Fund’s statement of additional information contains further information on the directors and is available free of charge by calling 1-800-862-6668 or writing to Hartford HLS Funds, c/o Individual Annuity Services, P.O. Box 5085, Hartford, CT 06102-5085.
Information on the aggregate remuneration paid to the directors of the Company can be found in the Statement of Operations herein. The Fund pays to The Hartford a portion of the Chief Compliance Officer’s compensation, but does not pay salaries or compensation to any of their other officers or directors who are employed by The Hartford.
Non-Interested Directors
Lynn S. Birdsong (1946) Director since 2003, Co-Chairman of the Investment Committee
Mr. Birdsong is a private investor. Mr. Birdsong currently serves as a Director of the Sovereign High Yield Investment Company (April 2010 to current). Mr. Birdsong currently serves as an Independent Director of Nomura Partners Funds, Inc. (formerly, The Japan Fund) (March 2003 to current). From 1979 to 2002, Mr. Birdsong was a managing director of Zurich Scudder Investments, an investment management firm. During his employment with Scudder, Mr. Birdsong was an Interested Director of The Japan Fund. Since 1981, Mr. Birdsong has been a partner in Birdsong Company, an advertising specialty firm.
Robert M. Gavin, Jr. (1940) Director since 2002 (HSF) and 1986 (HSF2), Chairman of the Board since 2004
Dr. Gavin is an educational consultant. Prior to September 1, 2001, he was President of Cranbrook Education Community and prior to July 1996, he was President of Macalester College, St. Paul, Minnesota.
Duane E. Hill (1945) Director since 2001 (HSF) and 2002 (HSF2), Chairman of the Nominating Committee
Mr. Hill is Partner of TSG Ventures L.P., a private equity investment company. Mr. Hill is a former partner of TSG Capital Group, a private equity investment firm that served as sponsor and lead investor in leveraged buyouts of middle market companies.
Sandra S. Jaffee (1941) Director since 2005
Ms. Jaffee is the founder and Chief Executive Officer of a private company, Homeworks Concierge, LLC, which provides residential property management services in Westchester County, New York (January 2012 to present). Ms. Jaffee served as Chairman (2008 to 2009) and Chief Executive Officer of Fortent (formerly Searchspace Group), a leading provider of compliance/regulatory technology to financial institutions from August 2005 to August 2009. Ms. Jaffe currently serves as a member of the Board of Directors of Broadridge Financial Solutions as well as a Trustee of Muhlenberg College.
William P. Johnston (1944) Director since 2005, Chairman of the Compliance Committee
In June 2006, Mr. Johnston was appointed as Senior Advisor to The Carlyle Group, a global private equity investment firm. In August 2007, Mr. Johnston was elected to the Board of Directors of LifeCare Holdings, Inc. In February 2008, Mr. Johnston was elected to the Board of Directors of HCR-ManorCare, Inc. In May 2006, Mr. Johnston was elected to the Supervisory Board of Fresenius Medical Care AG & Co. KGaA, after its acquisition of Renal Care Group, Inc. in March 2006.
Phillip O. Peterson (1944) Director since 2002 (HSF) and 2000 (HSF2), Chairman of the Audit Committee
Mr. Peterson is a mutual fund industry consultant. He was a partner of KPMG LLP (an accounting firm) until July 1999. Mr. Peterson joined William Blair Funds in February 2007 as a member of the Board of Trustees. Mr. Peterson also joined the Board of Trustees of Symetra Variable Mutual Funds Trust as a trustee in February 2012.
| 18 |
Lemma W. Senbet (1946) Director since 2005
Dr. Senbet is the William E. Mayer Chair Professor of Finance and Director, Center for Financial Policy, at the University of Maryland, Robert H. Smith School of Business. He was chair of the Finance Department from 1998 to 2006. Previously he was a chaired professor of finance at the University of Wisconsin-Madison. Also, he was director of the Fortis Funds from March 2000 to July 2002. Dr. Senbet served the finance profession in various capacities, including as director of the American Finance Association and President of the Western Finance Association. In 2006, Dr. Senbet was inducted Fellow of Financial Management Association International for his career-long distinguished scholarship and professional service.
Interested Directors and Officers
David N. Levenson (1966) Director since 2010(1)
Mr. Levenson currently serves as President of The Hartford’s Wealth Management business. He was appointed to this role in July 2010. Previously, Mr. Levenson served as Executive Vice President of Legacy Holdings for The Hartford from June 2009 to July 2010. From 2006 to 2009, Mr. Levenson was with Hartford Life Insurance K.K. where he served as President and Chief Executive Officer from 2007 to 2009. He served as Managing Director of Hartford Investment Management Company from 2005 to 2006. Additionally, Mr. Levenson serves as Executive Vice President of The Hartford and as President, Director and Chief Executive Officer of Hartford Life Insurance Company (“HLIC”) and Hartford Life, Inc. (“HL Inc.”).
(1) Mr. Levenson served as Interested Director until August 2, 2012.
Lowndes A. Smith (1939) Director since 1996 (HSF) and 2002 (HSF2), Co-Chairman of the Investment Committee
Mr. Smith served as Vice Chairman of The Hartford from February 1997 to January 2002, as President and Chief Executive Officer of HL Inc. from February 1997 to January 2002, and as President and Chief Operating Officer of The Hartford Life Insurance Companies from January 1989 to January 2002. Mr. Smith serves as a Director of White Mountains Insurance Group, Ltd., One Beacon Insurance and Symetra Financial and as Managing Director of Whittington Gray Associates.
Other Officers
James E. Davey (1964) President and Chief Executive Officer since 2010(2)
Mr. Davey serves as Executive Vice President of HLIC. Additionally, Mr. Davey serves as President, Chief Executive Officer and Manager of HIFSCO and President, Chief Executive Officer and Manager of HL Investment Advisors, LLC (“HL Advisors”). Mr. Davey joined The Hartford in 2002.
(2) Mr. Davey became an Interested Director effective August 2, 2012.
Mark A. Annoni (1964) Vice President, Controller and Treasurer since 2012(3)
Mr. Annoni serves as the Assistant Vice President and Director of Investment Finance (February 2004 to present). Mr. Annoni joined The Hartford in April 2001 as part of The Hartford’s acquisition of Fortis Financial Group. Prior to joining The Hartford, Mr. Annoni served as Manager of Mutual Fund Accounting at Fortis Financial Group (July 1997 to April 2001).
(3) Mr. Annoni was named Vice President, Controller and Treasurer on May 8, 2012.
Michael R. Dressen (1963) AML Compliance Officer since 2011
Mr. Dressen currently serves as Assistant Vice President of HLIC. He also serves as Chief Compliance Officer and AML Compliance Officer of Hartford Administrative Services Company (“HASCO”) and as Assistant Secretary and Compliance Officer of HIFSCO. Mr Dressen joined The Hartford in 2005 from State Farm Insurance Companies where he held various positions related to mutual funds, variable products, and property casualty insurance.
Tamara L. Fagely (1958) Vice President, since 2002 (HSF) and 1993 (HSF2)(4)
Ms. Fagely has been a Vice President of HASCO since 1998 and Chief Financial Officer since 2006. Currently Ms. Fagely is a Vice President of HLIC. She served as Assistant Vice President of HLIC from December 2001 through March 2005. In addition, Ms. Fagely is Controller and Chief Financial Officer of HIFSCO.
(4) Ms. Fagely served as Vice President, Controller and Treasurer until May 8, 2012.
Dr. Robert J. Froehlich (1953) Senior Managing Director since 2009(5)
Dr. Froehlich joined The Hartford as Senior Managing Director in September 2009. Prior to joining The Hartford, Dr. Froehlich served as Vice Chairman of Deutsche Asset Management from 1997-2009.
(5) Dr. Froehlich served as Senior Managing Director until March 26, 2012.
| 19 |
| Hartford Money Market HLS Fund |
| Directors and Officers (Unaudited) – (continued) |
Edward P. Macdonald (1967) Vice President, Secretary and Chief Legal Officer since 2005
Mr. Macdonald serves as Vice President of HLIC and Chief Legal Officer of Mutual Funds and Vice President of HIFSCO. He also serves as Vice President and Secretary of HASCO, and Chief Legal Officer, Secretary and Vice President of HL Advisors. Mr. Macdonald joined The Hartford in 2005.
Vernon J. Meyer (1964) Vice President since 2006
Mr. Meyer serves as Senior Vice President of HLIC. He also serves as Senior Vice President of HIFSCO and HL Advisors. Mr. Meyer joined The Hartford in 2004.
Colleen B. Pernerewski (1969) Vice President and Chief Compliance Officer since 2010
Ms. Pernerewski serves as Vice President and Chief Investment Advisor Compliance Officer of HIFSCO and as Vice President and Chief Compliance Officer of HL Advisors. Ms. Pernerewski serves as Vice President and Chief Compliance Officer of Individual Annuity of HLIC. Ms. Pernerewski joined The Hartford in 2005 from Travelers Life and Annuity where she served as Counsel (2004-2005). Prior to Travelers Life and Annuity, Ms. Pernerewski held the position of Counsel at The Hartford (1998-2004).
Elizabeth L. Schroeder (1966) Vice President since 2010
Ms. Schroeder currently serves as Assistant Vice President of HLIC. Ms. Schroeder joined HLIC in 1991. She is also an Assistant Vice President of HASCO, HIFSCO and HL Advisors.
Martin Swanson (1962) Vice President since 2010
Mr. Swanson is a Vice President of HLIC. Mr. Swanson also serves as Vice President/Marketing for HIFSCO. Prior to joining HLIC in 1998, Mr. Swanson was a Vice President at PaineWebber, Inc.
Jane Wolak (1961) Vice President since 2009
Ms. Wolak currently serves as Senior Vice President of HLIC. Ms. Wolak joined HLIC as Vice President, Retail Product Services in May 2007. She is also Vice President of HASCO. Previously, Ms. Wolak was with Sun Life Financial where she held the position of Vice President, Service Center Operations from 2001-2007.
HOW TO OBTAIN A COPY OF THE FUND’S PROXY VOTING POLICIES AND VOTING RECORDS (UNAUDITED)
A description of the policies and procedures that the Fund uses to determine how to vote proxies relating to portfolio securities and a record of how the Fund voted any proxies for the twelve-month period ended June 30, 2012 are available (1) without charge, upon request, by calling 800-862-6668 and (2) on the SEC’s website at http://www.sec.gov.
QUARTERLY PORTFOLIO HOLDINGS INFORMATION (UNAUDITED)
The Fund files a complete schedule of portfolio holdings with the SEC for the first and third quarters of each fiscal year on Form N-Q. The Fund’s Forms are available (1) without charge, upon request, by calling 800-862-6668 and (2) on the SEC’s website at http://www.sec.gov. The Form N-Q may be reviewed and copied at the SEC’s Public Reference Room in Washington, DC. Information on the operation of the Public Reference Room may be obtained by calling 1-800-SEC-0330.
| 20 |
| Hartford Money Market HLS Fund |
| Expense Example (Unaudited) |
Your Fund's Expenses
As a shareholder of the Fund, you incur two types of costs: (1) transaction costs and (2) ongoing costs including investment management fees, distribution fees, and other fund expenses. This example is intended to help you understand your ongoing costs (in dollars) of investing in the Fund and to compare these costs with the ongoing costs of investing in other mutual funds. The example is based on an investment of $1,000 invested at the beginning of the period and held for the period of December 31, 2011 through June 30, 2012.
Actual Expenses
The first set of columns of the table below provides information about actual account values and actual expenses. You may use the information in this column, together with the amount you invested, to estimate the expenses that you paid over the period. Simply divide your account value by $1,000 (for example, an $8,600 account value divided by $1,000 = 8.6), then multiply the result by the number in the line under the heading entitled “Expenses Paid During Period” to estimate the expenses you paid on your account during this period.
Hypothetical Example for Comparison Purposes
The second set of columns of the table below provides information about hypothetical account values and hypothetical expenses based on the Fund’s actual expense ratio and an assumed rate of return of 5% per year before expenses, which is not the Fund’s actual return. The hypothetical account values and expenses may not be used to estimate the actual ending account balance or expenses you paid for the period. You may use this information to compare the ongoing costs of investing in the Fund and other funds. To do so, compare this 5% hypothetical example with the 5% hypothetical examples that appear in the shareholder reports of the other funds.
Please note that the expenses shown in the table are meant to highlight your ongoing costs only and do not reflect any transactional costs, such as sales charges (loads) and CDSC. Therefore, the second set of columns of the table is useful in comparing ongoing costs only, and will not help you determine the relative total costs of owning different funds. In addition, if these transactional costs were included, your costs would be higher. Expenses are equal to the Fund's annualized expense ratios multiplied by average account value over the period, multiplied by 182/366 (to reflect the one-half year period).
| Actual return | Hypothetical (5% return before expenses) | |||||||||||||||||||||||||||||||||||
| Beginning Account Value December 31, 2011 | Ending Account Value June 30, 2012 | Expenses paid during the period December 31, 2011 through June 30, 2012 | Beginning Account Value December 31, 2011 | Ending Account Value June 30, 2012 | Expenses paid during the period December 31, 2011 through June 30, 2012 | Annualized expense ratio | Days in the current 1/2 year | Days in the full year | ||||||||||||||||||||||||||||
| Class IA | $ | 1,000.00 | $ | 1,000.00 | $ | 0.80 | $ | 1,000.00 | $ | 1,024.07 | $ | 0.81 | 0.16 | % | 182 | 366 | ||||||||||||||||||||
| Class IB | $ | 1,000.00 | $ | 1,000.00 | $ | 0.80 | $ | 1,000.00 | $ | 1,024.07 | $ | 0.81 | 0.16 | % | 182 | 366 | ||||||||||||||||||||
| 21 |
HARTFORD HLS FUNDS
c/o The Hartford Wealth Management - Global Annuities
P.O. Box 14293
Lexington, KY 40512-4293
Hartford Series Fund, Inc. is underwritten and distributed by Hartford Securities Distribution Company, Inc.
"The Hartford" is The Hartford Financial Services Group, Inc. and its subsidiaries.
Hartford Series Fund, Inc. inception dates range from 1977 to date. Hartford Series Fund, Inc. is not a subsidiary of The Hartford but is underwritten, distributed by and advised by subsidiaries of The Hartford. Investments in Hartford Series Fund, Inc. are not guaranteed by The Hartford or any other entity.
You should carefully consider investment objectives, risks, and charges and expenses of Hartford HLS Funds before investing. This and other information can be found in the Fund’s prospectus or summary prospectus, which can be obtained by calling 800-862-6668. Please read them carefully before you invest or send money.
| HLSSAR-MM12 8-12 111647 Printed in U.S.A ©2012 The Hartford, Hartford, CT 06115 | |

A MESSAGE FROM THE PRESIDENT
Dear Fellow Shareholders:
I want to take this opportunity to say thank you for investing in the Hartford HLS Funds. We’ve seen continued market volatility throughout the first half of 2012, and there will likely be continued uncertainty until the Presidential election in November, but we are still optimistic about the markets in 2012.
Market Review
In the first quarter of 2012, the S&P 500 Index turned in its best quarterly performance since the third quarter of 2009. U.S. equities showed signs of improvement as investors focused on improving economic data and strong corporate earnings news and the Federal Reserve’s pledge to keep interest rates low buoyed investors’ appetites.
The second quarter ended on a high note for the stock market—the S&P 500 had its strongest June in more than a decade and the Dow Jones Industrial Average had its best month since October—but those gains weren’t enough to offset losses from April and May, and equities finished the quarter in the red. Although the S&P 500 was -2.75 for the second quarter, it was up 9.49% for the first half of 2012.
Concerns about domestic and European unemployment are having an effect on our economy. The unemployment rate in the euro zone's 17 nations rose to a record 11.1% in May, the highest level since the euro launched as a common currency more than 10 years ago. In the U.S., the labor market has been fickle this year, with job growth starting off strong in the first couple months of 2012 but slowing down in the spring, which has led many to wonder about the status of the economic recovery.
On a positive note, home prices are rising again after falling for more than five years, new and existing home sales are increasing, and home builders are ramping up construction.
The Hartford HLS Funds Expands Relationship with Wellington Management
We’re very pleased that we are expanding our relationship with Wellington Management, which will now serve as the primary sub-adviser for the Hartford HLS Funds including equity, fixed-income,* and asset-allocation funds. One of America’s oldest and largest investment management firms, Wellington Management has resources that span the entire globe, with multiple offices across the U.S. and numerous offices abroad. Wellington Management’s most distinctive strength is its proprietary research, which is shared across the entire organization.
We believe that aligning more closely with a well-respected money manager like Wellington Management puts us in a strong position to drive significant growth and to continue delivering innovative fund strategies to help our investors meet their financial goals.
Thank you again for investing with the Hartford HLS Funds.
James Davey
President
Hartford HLS Funds
*Several fixed-income funds will continue to be sub-advised by Hartford Investment Management Company.
Hartford Portfolio Diversifier HLS Fund
Table of Contents
This report is prepared for the general information of contract owners and qualified retirement plan participants. It is not an offer of contracts or of qualified retirement plans. It should not be used in connection with any offer, except in conjunction with the appropriate product prospectus which contains all pertinent information including the applicable sales, administrative and other charges.
The views expressed in the Fund’s Manager Discussion under ‘‘Why did the Fund perform this way?’’ and ‘‘What is the outlook?’’ are views of the Fund’s sub-adviser and portfolio management team through the end of the period and are subject to change based on market and other conditions.
| Hartford Portfolio Diversifier HLS Fund inception 06/06/2011 |
| (sub-advised by Hartford Investment Management Company) |
| Investment objective – Seeks to produce investment performance that mitigates against significant declines in the aggregate value of investment allocations to equity mutual funds under certain variable annuity contracts issued by Hartford Life Insurance Company and its affiliates, while also preserving the potential for modest appreciation in the Fund’s net asset value when markets are appreciating. |
Performance Overview 6/06/11 – 6/30/12
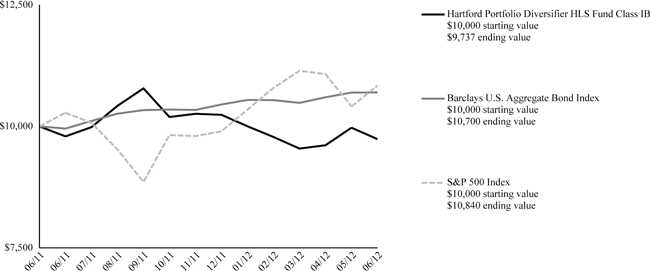
The chart above shows the growth of a $10,000 investment in Class IB.
Average Annual Total Returns (as of 6/30/12)
| 6 Month† | 1 Year | Since Inception | |
| Portfolio Diversifier IB | -4.89% | -0.58% | -2.46% |
| Barclays U.S. Aggregate Bond Index | 2.37% | 7.47% | 6.54% |
| S&P 500 Index | 9.48% | 5.43% | 7.84% |
| † | Not Annualized |
PAST PERFORMANCE IS NOT INDICATIVE OF FUTURE RESULTS.
Total returns presented above were calculated using the Fund's net asset value available to shareholders for sale or redemption of Fund shares on June 30, 2012, which may exclude investment transactions as of this date.
Barclays U.S. Aggregate Bond Index (formerly known as Barclays Capital U.S. Aggregate Bond Index) is an unmanaged index and is composed of securities from the Barclays Government/Credit Bond Index, Mortgage-Backed Securities Index, Asset-Backed Securities Index and Commercial Mortgage-Backed Securities Index.
S&P 500 Index is a market capitalization-weighted price index composed of 500 widely held common stocks.
You cannot invest directly in an index.
The chart represents a hypothetical investment in the Fund. Performance data represents past performance and current performance could be higher or lower.
Performance information may reflect historical or current expense waivers/reimbursements from the investment adviser, without which performance would have been lower. For information on current expense waivers/reimbursements, please see the prospectus.
The value of the Fund will fluctuate so that when redeemed, it may be worth more or less than the original investment. The chart and table do not reflect the deductions of taxes, sales charges or other fees which may be applied at the variable annuity level. Any such additional sales charges or other fees or expenses would lower the contract’s performance.
| 2 |
| Hartford Portfolio Diversifier HLS Fund |
| Manager Discussion |
| June 30, 2012 (Unaudited) |
| Portfolio Managers | |
| Paul Bukowski, CFA | James Ong, CFA |
| Executive Vice President and Head of Quantitative Equities | Vice President |
How did the Fund perform?
The Class IB Shares of the Hartford Portfolio Diversifier HLS Fund returned -4.89% for the six-month period ending June 30, 2012, compared to the returns of the Barclays U.S. Aggregate Bond Index which returned 2.37% and the S&P 500 Index which returned 9.48% for the same period.
Why did the Fund perform this way?
The Fund performed in line with expectations, which is performance generally “contra” to that of the equity markets, as measured by the S&P 500 Index. The Fund generally invests in securities which increase in value as the S&P 500 declines (protection), and securities which are expected to approximate the performance of the Barclays U.S. Aggregate Bond and S&P 500 Indices.
Overall the Fund declined in value as it is designed to achieve performance generally “contra” to that of the S&P 500 which posted strong performance appreciating nearly 10% during the first half of the year. The Fund’s protection securities, short S&P futures and a modest short and long term S&P put position, declined in value, providing a head wind (i.e. negative impact) to performance during the first half of the year. The fixed income sleeve offset some of this decline as it contributed modest positive performance.
What is your outlook?
Looking ahead, challenges include deleveraging, Eurozone member solvency, U.S. Presidential election year uncertainty - especially on fiscal policy, and higher energy costs. We believe corporate fundamentals are decent, but given the balance of challenges aforementioned, corporations are generally reluctant to hire or spend; thus keeping labor markets fragile. With the labor market tentative, the consumer portion of the economy is at a cusp – ready to either drive through these challenges or add to them. These issues are well known. Investors have moved to the sideline, waiting to see which way the consumer falls, leading to tempting valuation levels. Analysts in general have significantly revised earnings downward. In this environment, we believe investors will place marginally higher demand for stable and expanding profit growth.
Our approach uses quality as defense and growth as offense. It assumes that the market will neither fall nor rise dramatically. The risk to this strategy then is a policy or macro event that overwhelms investors’ desire to discriminate among stocks. For example, investors might turn the “risk on” trade back ‘on’ because of a major liquidity event such as quantitative easing or tax cuts. Another risk is that there is a major geopolitical event, such as spillover conflict from Syria that causes investors to turn “risk off” regardless of stock fundamentals.
| Distribution by Credit Quality |
| as of June 30, 2012 |
| Credit Rating * | Percentage of Net Assets | |||
| Aaa / AAA | 1.1 | % | ||
| Aa / AA | 0.8 | |||
| A | 3.9 | |||
| Baa / BBB | 3.8 | |||
| Ba / BB | 0.1 | |||
| Unrated | 0.0 | |||
| U.S. Government Agencies and Securities | 24.9 | |||
| Non Debt Securities and Other Short-Term Instruments | 68.7 | |||
| Other Assets & Liabilities | (3.3 | ) | ||
| Total | 100.0 | % | ||
| * | Does not apply to the Fund itself. Based upon Moody’s and S&P long-term credit ratings for the Fund’s holdings as of the date noted. If Moody's and S&P assign different ratings to a holding, the lower rating is used. "Unrated" includes fixed-income securities (other than cash-like short-term instruments and U.S. Government securities) for which Moody’s and S&P have not issued long-term credit ratings. |
| 3 |
| Hartford Portfolio Diversifier HLS Fund |
| Manager Discussion– (continued) |
| June 30, 2012 (Unaudited) |
Diversification by Industry
as of June 30, 2012
| Industry (Sector) | Percentage of Net Assets | |||
| Equity Securities | ||||
| Automobiles & Components (Consumer Discretionary) | 0.1 | % | ||
| Banks (Financials) | 0.5 | |||
| Capital Goods (Industrials) | 1.5 | |||
| Commercial & Professional Services (Industrials) | 0.1 | |||
| Consumer Durables & Apparel (Consumer Discretionary) | 0.2 | |||
| Consumer Services (Consumer Discretionary) | 0.4 | |||
| Diversified Financials (Financials) | 1.0 | |||
| Energy (Energy) | 2.0 | |||
| Food & Staples Retailing (Consumer Staples) | 0.4 | |||
| Food, Beverage & Tobacco (Consumer Staples) | 1.2 | |||
| Health Care Equipment & Services (Health Care) | 0.7 | |||
| Household & Personal Products (Consumer Staples) | 0.4 | |||
| Insurance (Financials) | 0.6 | |||
| Materials (Materials) | 0.6 | |||
| Media (Consumer Discretionary) | 0.6 | |||
| Other Investment Pools and Funds (Financials) | 0.5 | |||
| Pharmaceuticals, Biotechnology & Life Sciences (Health Care) | 1.5 | |||
| Real Estate (Financials) | 0.4 | |||
| Retailing (Consumer Discretionary) | 0.7 | |||
| Semiconductors & Semiconductor Equipment (Information Technology) | 0.4 | |||
| Software & Services (Information Technology) | 1.7 | |||
| Technology Hardware & Equipment (Information Technology) | 1.4 | |||
| Telecommunication Services (Services) | 0.6 | |||
| Transportation (Industrials) | 0.3 | |||
| Utilities (Utilities) | 0.7 | |||
| Total | 18.5 | % | ||
| Fixed Income Securities | ||||
| Administrative Waste Management and Remediation (Services) | 0.0 | % | ||
| Airport Revenues (Airport Revenues) | 0.0 | |||
| Arts, Entertainment and Recreation (Services) | 0.4 | |||
| Beverage and Tobacco Product Manufacturing (Consumer Staples) | 0.3 | |||
| Chemical Manufacturing (Basic Materials) | 0.1 | |||
| Computer and Electronic Product Manufacturing (Technology) | 0.3 | |||
| Couriers and Messengers (Services) | 0.0 | |||
| Electrical Equipment and Appliance Manufacturing (Technology) | 0.1 | |||
| Finance and Insurance (Finance) | 3.9 | |||
| Food Manufacturing (Consumer Staples) | 0.2 | |||
| Food Services (Consumer Cyclical) | 0.1 | |||
| General Obligations (General Obligations) | 0.1 | |||
| Health Care and Social Assistance (Health Care) | 0.5 | |||
| Higher Education (Univ., Dorms, etc.) (Higher Education (Univ., Dorms, etc.)) | 0.1 | |||
| Information (Technology) | 0.6 | |||
| Machinery Manufacturing (Capital Goods) | 0.1 | |||
| Mining (Basic Materials) | 0.2 | |||
| Miscellaneous (Miscellaneous) | 0.0 | |||
| Miscellaneous Manufacturing (Capital Goods) | 0.2 | |||
| Motor Vehicle and Parts Manufacturing (Consumer Cyclical) | 0.0 | |||
| Paper Manufacturing (Basic Materials) | 0.1 | |||
| Petroleum and Coal Products Manufacturing (Energy) | 0.7 | |||
| Pipeline Transportation (Utilities) | 0.1 | |||
| Primary Metal Manufacturing (Basic Materials) | 0.1 | |||
| Professional, Scientific and Technical Services (Services) | 0.0 | |||
| Public Administration (Services) | 0.0 | |||
| Rail Transportation (Transportation) | 0.1 | |||
| Real Estate, Rental and Leasing (Finance) | 0.0 | |||
| Retail Trade (Consumer Cyclical) | 0.3 | |||
| Soap, Cleaning Compound and Toilet Manufacturing (Consumer Staples) | 0.0 | |||
| Transportation (Transportation) | 0.0 | |||
| Transportation Equipment Manufacturing (Transportation) | 0.0 | |||
| Utilities (Utilities) | 0.5 | |||
| Utilities - Water and Sewer (Utilities - Water and Sewer) | 0.0 | |||
| Total | 9.1 | % | ||
| Foreign Government Obligations | 0.6 | % | ||
| Put Options Purchased | 9.3 | |||
| U.S. Government Agencies | 11.8 | |||
| U.S. Government Securities | 13.1 | |||
| Short-Term Investments | 40.9 | |||
| Other Assets and Liabilities | (3.3 | ) | ||
| Total | 100.0 | % | ||
| 4 |
| Hartford Portfolio Diversifier HLS Fund |
| Schedule of Investments – (continued) |
| June 30, 2012 (Unaudited) |
| (000’s Omitted) |
| Shares or Principal Amount | Market Value ╪ | |||||||
| COMMON STOCKS - 18.0% | ||||||||
| Automobiles & Components - 0.1% | ||||||||
| — | BorgWarner, Inc. ● | $ | 23 | |||||
| 12 | Ford Motor Co. w/ Rights | 115 | ||||||
| 1 | Goodyear Tire & Rubber Co. ● | 9 | ||||||
| 1 | Harley-Davidson, Inc. | 33 | ||||||
| 2 | Johnson Controls, Inc. | 59 | ||||||
| 239 | ||||||||
| Banks - 0.5% | ||||||||
| 2 | BB&T Corp. | 67 | ||||||
| 1 | Comerica, Inc. | 19 | ||||||
| 3 | Fifth Third Bancorp | 39 | ||||||
| 1 | First Horizon National Corp. | 7 | ||||||
| 2 | Hudson City Bancorp, Inc. | 10 | ||||||
| 3 | Huntington Bancshares, Inc. | 17 | ||||||
| 3 | Keycorp | 23 | ||||||
| — | M&T Bank Corp. | 33 | ||||||
| 1 | People's United Financial, Inc. | 13 | ||||||
| 2 | PNC Financial Services Group, Inc. | 101 | ||||||
| 4 | Regions Financial Corp. | 30 | ||||||
| 2 | SunTrust Banks, Inc. | 41 | ||||||
| 6 | US Bancorp | 191 | ||||||
| 17 | Wells Fargo & Co. | 556 | ||||||
| 1 | Zions Bancorporation | 11 | ||||||
| 1,158 | ||||||||
| Capital Goods - 1.5% | ||||||||
| 2 | 3M Co. | 194 | ||||||
| 2 | Boeing Co. | 174 | ||||||
| 2 | Caterpillar, Inc. | 173 | ||||||
| — | Cooper Industries plc Class A | 34 | ||||||
| 1 | Cummins, Inc. | 58 | ||||||
| 2 | Danaher Corp. | 94 | ||||||
| 1 | Deere & Co. | 101 | ||||||
| 1 | Dover Corp. | 31 | ||||||
| 1 | Eaton Corp. | 42 | ||||||
| 2 | Emerson Electric Co. | 107 | ||||||
| 1 | Fastenal Co. | 37 | ||||||
| — | Flowserve Corp. | 20 | ||||||
| 1 | Fluor Corp. | 26 | ||||||
| 1 | General Dynamics Corp. | 74 | ||||||
| 33 | General Electric Co. | 691 | ||||||
| — | Goodrich Corp. | 50 | ||||||
| 2 | Honeywell International, Inc. | 136 | ||||||
| 1 | Illinois Tool Works, Inc. | 79 | ||||||
| 1 | Ingersoll-Rand plc | 39 | ||||||
| — | Jacobs Engineering Group, Inc. ● | 15 | ||||||
| — | Joy Global, Inc. | 19 | ||||||
| — | L-3 Communications Holdings, Inc. | 23 | ||||||
| 1 | Lockheed Martin Corp. | 72 | ||||||
| 1 | Masco Corp. | 16 | ||||||
| 1 | Northrop Grumman Corp. | 50 | ||||||
| 1 | PACCAR, Inc. | 44 | ||||||
| — | Pall Corp. | 20 | ||||||
| — | Parker-Hannifin Corp. | 36 | ||||||
| — | Precision Castparts Corp. | 75 | ||||||
| 1 | Quanta Services, Inc. ● | 16 | ||||||
| 1 | Raytheon Co. | 59 | ||||||
| — | Rockwell Automation, Inc. | 29 | ||||||
| — | Rockwell Collins, Inc. | 22 | ||||||
| — | Roper Industries, Inc. | 30 | ||||||
| — | Snap-On, Inc. | 11 | ||||||
| 1 | Stanley Black & Decker, Inc. | 34 | ||||||
| 1 | Textron, Inc. | 22 | ||||||
| 1 | Tyco International Ltd. | 77 | ||||||
| 3 | United Technologies Corp. | 215 | ||||||
| — | W.W. Grainger, Inc. | 36 | ||||||
| 1 | Xylem, Inc. | 15 | ||||||
| 3,096 | ||||||||
| Commercial & Professional Services - 0.1% | ||||||||
| — | Avery Dennison Corp. | 9 | ||||||
| — | Cintas Corp. | 13 | ||||||
| — | Dun & Bradstreet Corp. | 11 | ||||||
| — | Equifax, Inc. ● | 17 | ||||||
| 1 | Iron Mountain, Inc. | 18 | ||||||
| 1 | Pitney Bowes, Inc. | 9 | ||||||
| 1 | R.R. Donnelley & Sons Co. | �� | 7 | |||||
| 1 | Republic Services, Inc. | 26 | ||||||
| — | Robert Half International, Inc. | 13 | ||||||
| — | Stericycle, Inc. ● | 24 | ||||||
| 1 | Waste Management, Inc. | 48 | ||||||
| 195 | ||||||||
| Consumer Durables & Apparel - 0.2% | ||||||||
| 1 | Coach, Inc. | 53 | ||||||
| 1 | D.R. Horton, Inc. | 16 | ||||||
| — | Fossil, Inc. ● | 12 | ||||||
| — | Harman International Industries, Inc. | 9 | ||||||
| — | Hasbro, Inc. | 12 | ||||||
| — | Leggett & Platt, Inc. | 9 | ||||||
| 1 | Lennar Corp. | 16 | ||||||
| 1 | Mattel, Inc. | 35 | ||||||
| 1 | Newell Rubbermaid, Inc. | 16 | ||||||
| 1 | NIKE, Inc. Class B | 101 | ||||||
| 1 | Pulte Group, Inc. ● | 11 | ||||||
| — | Ralph Lauren Corp. | 28 | ||||||
| — | V.F. Corp. | 36 | ||||||
| — | Whirlpool Corp. | 15 | ||||||
| 369 | ||||||||
| Consumer Services - 0.4% | ||||||||
| — | Apollo Group, Inc. Class A ● | 12 | ||||||
| 1 | Carnival Corp. | 48 | ||||||
| — | Chipotle Mexican Grill, Inc. ● | 38 | ||||||
| — | Darden Restaurants, Inc. | 20 | ||||||
| — | DeVry, Inc. | 6 | ||||||
| 1 | H & R Block, Inc. | 15 | ||||||
| 1 | International Game Technology | 15 | ||||||
| 1 | Marriott International, Inc. Class A | 32 | ||||||
| 3 | McDonald's Corp. | 281 | ||||||
| 2 | Starbucks Corp. | 126 | ||||||
| 1 | Starwood Hotels & Resorts, Inc. | 33 | ||||||
| — | Wyndham Worldwide Corp. | 24 | ||||||
| — | Wynn Resorts Ltd. | 26 | ||||||
| 1 | Yum! Brands, Inc. | 93 | ||||||
| 769 | ||||||||
| Diversified Financials - 1.0% | ||||||||
| 3 | American Express Co. | 182 | ||||||
| 1 | Ameriprise Financial, Inc. | 36 | ||||||
| 34 | Bank of America Corp. | 276 | ||||||
| 4 | Bank of New York Mellon Corp. | 82 | ||||||
| — | BlackRock, Inc. | 68 | ||||||
| 2 | Capital One Financial Corp. | 99 | ||||||
The accompanying notes are an integral part of these financial statements.
| 5 |
| Hartford Portfolio Diversifier HLS Fund |
| Schedule of Investments – (continued) |
| June 30, 2012 (Unaudited) |
| (000’s Omitted) |
| Shares or Principal Amount | Market Value ╪ | |||||||
| COMMON STOCKS - 18.0% - (continued) | ||||||||
| Diversified Financials - 1.0% - (continued) | ||||||||
| 3 | Charles Schwab Corp. | $ | 44 | |||||
| 9 | Citigroup, Inc. | 251 | ||||||
| — | CME Group, Inc. | 56 | ||||||
| 2 | Discover Financial Services, Inc. | 57 | ||||||
| 1 | E*Trade Financial Corp. ● | 6 | ||||||
| — | Federated Investors, Inc. | 6 | ||||||
| — | Franklin Resources, Inc. | 49 | ||||||
| 2 | Goldman Sachs Group, Inc. | 148 | ||||||
| — | IntercontinentalExchange, Inc. ● | 31 | ||||||
| 1 | Invesco Ltd. | 32 | ||||||
| 12 | JP Morgan Chase & Co. | 426 | ||||||
| — | Legg Mason, Inc. | 10 | ||||||
| 1 | Leucadia National Corp. | 13 | ||||||
| 1 | Moody's Corp. | 23 | ||||||
| 5 | Morgan Stanley | 69 | ||||||
| — | Nasdaq OMX Group, Inc. ● | 9 | ||||||
| 1 | Northern Trust Corp. | 35 | ||||||
| 1 | NYSE Euronext | 20 | ||||||
| 2 | SLM Corp. | 24 | ||||||
| 2 | State Street Corp. | 68 | ||||||
| 1 | T. Rowe Price Group, Inc. | 50 | ||||||
| 2,170 | ||||||||
| Energy - 2.0% | ||||||||
| 1 | Alpha Natural Resources, Inc. ● | 6 | ||||||
| 2 | Anadarko Petroleum Corp. | 103 | ||||||
| 1 | Apache Corp. | 108 | ||||||
| 1 | Baker Hughes, Inc. | 56 | ||||||
| 1 | Cabot Oil & Gas Corp. | 26 | ||||||
| 1 | Cameron International Corp. ● | 33 | ||||||
| 2 | Chesapeake Energy Corp. | 39 | ||||||
| 6 | Chevron Corp. | 651 | ||||||
| 4 | ConocoPhillips Holding Co. | 221 | ||||||
| 1 | Consol Energy, Inc. | 21 | ||||||
| 1 | Denbury Resources, Inc. ● | 18 | ||||||
| 1 | Devon Energy Corp. | 73 | ||||||
| — | Diamond Offshore Drilling, Inc. | 13 | ||||||
| 1 | EOG Resources, Inc. | 76 | ||||||
| — | EQT Corp. | 25 | ||||||
| 15 | Exxon Mobil Corp. | 1,252 | ||||||
| 1 | FMC Technologies, Inc. ● | 29 | ||||||
| 3 | Halliburton Co. | 82 | ||||||
| — | Helmerich & Payne, Inc. | 15 | ||||||
| 1 | Hess Corp. | 41 | ||||||
| 2 | Kinder Morgan, Inc. | 51 | ||||||
| 2 | Marathon Oil Corp. | 56 | ||||||
| 1 | Marathon Petroleum Corp. | 48 | ||||||
| 1 | Murphy Oil Corp. | 30 | ||||||
| 1 | Nabors Industries Ltd. ● | 13 | ||||||
| 1 | National Oilwell Varco, Inc. | 86 | ||||||
| — | Newfield Exploration Co. ● | 12 | ||||||
| 1 | Noble Corp. | 26 | ||||||
| 1 | Noble Energy, Inc. | 47 | ||||||
| 3 | Occidental Petroleum Corp. | 218 | ||||||
| 1 | Peabody Energy Corp. | 21 | ||||||
| 2 | Phillips 66 ● | 65 | ||||||
| — | Pioneer Natural Resources Co. | 34 | ||||||
| 1 | QEP Resources, Inc. | 17 | ||||||
| 1 | Range Resources Corp. | 31 | ||||||
| — | Rowan Cos. plc Class A ● | 13 | ||||||
| 4 | Schlumberger Ltd. | 271 | ||||||
| 1 | Southwestern Energy Co. ● | 35 | ||||||
| 2 | Spectra Energy Corp. | 59 | ||||||
| — | Sunoco, Inc. | 16 | ||||||
| — | Tesoro Corp. ● | 11 | ||||||
| 2 | Valero Energy Corp. | 42 | ||||||
| 2 | Williams Cos., Inc. | 56 | ||||||
| 1 | WPX Energy, Inc. ● | 10 | ||||||
| 4,156 | ||||||||
| Food & Staples Retailing - 0.4% | ||||||||
| 1 | Costco Wholesale Corp. | 128 | ||||||
| 4 | CVS Caremark Corp. | 187 | ||||||
| 2 | Kroger (The) Co. | 41 | ||||||
| 1 | Safeway, Inc. | 14 | ||||||
| 2 | Sysco Corp. | 55 | ||||||
| 3 | Walgreen Co. | 80 | ||||||
| 5 | Wal-Mart Stores, Inc. | 376 | ||||||
| 1 | Whole Foods Market, Inc. | 49 | ||||||
| 930 | ||||||||
| Food, Beverage & Tobacco - 1.2% | ||||||||
| 6 | Altria Group, Inc. | 220 | ||||||
| 2 | Archer Daniels Midland Co. | 61 | ||||||
| — | Beam, Inc. | 31 | ||||||
| — | Brown-Forman Corp. | 30 | ||||||
| 1 | Campbell Soup Co. | 19 | ||||||
| 7 | Coca-Cola Co. | 552 | ||||||
| 1 | Coca-Cola Enterprises, Inc. | 26 | ||||||
| 1 | ConAgra Foods, Inc. | 34 | ||||||
| 1 | Constellation Brands, Inc. Class A ● | 14 | ||||||
| 1 | Dean Foods Co. ● | 10 | ||||||
| 1 | Dr. Pepper Snapple Group | 29 | ||||||
| 2 | General Mills, Inc. | 78 | ||||||
| 1 | H.J. Heinz Co. | 54 | ||||||
| — | Hershey Co. | 34 | ||||||
| — | Hormel Foods Corp. | 13 | ||||||
| — | J.M. Smucker Co. | 27 | ||||||
| 1 | Kellogg Co. | 38 | ||||||
| 6 | Kraft Foods, Inc. | 214 | ||||||
| — | Lorillard, Inc. | 54 | ||||||
| — | McCormick & Co., Inc. | 25 | ||||||
| 1 | Mead Johnson Nutrition Co. | 51 | ||||||
| — | Molson Coors Brewing Co. | 20 | ||||||
| — | Monster Beverage Corp. ● | 35 | ||||||
| 5 | PepsiCo, Inc. | 346 | ||||||
| 5 | Philip Morris International, Inc. | 466 | ||||||
| 1 | Reynolds American, Inc. | 46 | ||||||
| 1 | Tyson Foods, Inc. Class A | 17 | ||||||
| 2,544 | ||||||||
| Health Care Equipment & Services - 0.7% | ||||||||
| 1 | Aetna, Inc. | 42 | ||||||
| 1 | AmerisourceBergen Corp. | 31 | ||||||
| — | Bard (C.R.), Inc. | 28 | ||||||
| 2 | Baxter International, Inc. | 91 | ||||||
| 1 | Becton, Dickinson & Co. | 47 | ||||||
| 4 | Boston Scientific Corp. ● | 25 | ||||||
| 1 | Cardinal Health, Inc. | 45 | ||||||
| 1 | CareFusion Corp. ● | 18 | ||||||
| — | Cerner Corp. ● | 38 | ||||||
| 1 | CIGNA Corp. | 40 | ||||||
The accompanying notes are an integral part of these financial statements.
| 6 |
| Shares or Principal Amount | Market Value ╪ | |||||||
| COMMON STOCKS - 18.0% - (continued) | ||||||||
| Health Care Equipment & Services - 0.7% - (continued) | ||||||||
| — | Coventry Health Care, Inc. | $ | 14 | |||||
| 2 | Covidien plc | 81 | ||||||
| — | DaVita, Inc. ● | 29 | ||||||
| — | Dentsply International, Inc. | 17 | ||||||
| — | Edwards Lifesciences Corp. ● | 37 | ||||||
| 3 | Express Scripts Holding Co. ● | 141 | ||||||
| 1 | Humana, Inc. | 40 | ||||||
| — | Intuitive Surgical, Inc. ● | 69 | ||||||
| — | Laboratory Corp. of America Holdings ● | 28 | ||||||
| 1 | McKesson Corp. | 69 | ||||||
| 3 | Medtronic, Inc. | 126 | ||||||
| — | Patterson Cos., Inc. | 9 | ||||||
| — | Quest Diagnostics, Inc. | 30 | ||||||
| 1 | St. Jude Medical, Inc. | 39 | ||||||
| 1 | Stryker Corp. | 56 | ||||||
| 1 | Tenet Healthcare Corp. ● | 7 | ||||||
| 3 | UnitedHealth Group, Inc. | 190 | ||||||
| — | Varian Medical Systems, Inc. ● | 21 | ||||||
| 1 | Wellpoint, Inc. | 66 | ||||||
| 1 | Zimmer Holdings, Inc. | 35 | ||||||
| 1,509 | ||||||||
| Household & Personal Products - 0.4% | ||||||||
| 1 | Avon Products, Inc. | 22 | ||||||
| — | Clorox Co. | 29 | ||||||
| 1 | Colgate-Palmolive Co. | 156 | ||||||
| 1 | Estee Lauder Co., Inc. | 38 | ||||||
| 1 | Kimberly-Clark Corp. | 103 | ||||||
| 9 | Procter & Gamble Co. | 525 | ||||||
| 873 | ||||||||
| Insurance - 0.6% | ||||||||
| 1 | ACE Ltd. | 79 | ||||||
| 2 | Aflac, Inc. | 65 | ||||||
| 2 | Allstate Corp. | 55 | ||||||
| 2 | American International Group, Inc. ● | 65 | ||||||
| 1 | Aon plc | 48 | ||||||
| — | Assurant, Inc. | 10 | ||||||
| 6 | Berkshire Hathaway, Inc. Class B ● | 464 | ||||||
| 1 | Chubb Corp. | 62 | ||||||
| 1 | Cincinnati Financial Corp. | 19 | ||||||
| 2 | Genworth Financial, Inc. ● | 9 | ||||||
| 1 | Lincoln National Corp. | 20 | ||||||
| 1 | Loews Corp. | 39 | ||||||
| 2 | Marsh & McLennan Cos., Inc. | 55 | ||||||
| 3 | MetLife, Inc. | 107 | ||||||
| 1 | Principal Financial Group, Inc. | 26 | ||||||
| 2 | Progressive Corp. | 40 | ||||||
| 2 | Prudential Financial, Inc. | 74 | ||||||
| — | Torchmark Corp. | 16 | ||||||
| 1 | Travelers Cos., Inc. | 79 | ||||||
| 1 | Unum Group | 18 | ||||||
| 1 | XL Group plc | 21 | ||||||
| 1,371 | ||||||||
| Materials - 0.6% | ||||||||
| 1 | Air Products & Chemicals, Inc. | 53 | ||||||
| — | Airgas, Inc. | 18 | ||||||
| 3 | Alcoa, Inc. | 29 | ||||||
| — | Allegheny Technologies, Inc. | 11 | ||||||
| — | Ball Corp. | 20 | ||||||
| — | Bemis Co., Inc. | 10 | ||||||
| — | CF Industries Holdings, Inc. | 40 | ||||||
| — | Cliff's Natural Resources, Inc. | 22 | ||||||
| 4 | Dow Chemical Co. | 118 | ||||||
| 3 | E.I. DuPont de Nemours & Co. | 148 | ||||||
| — | Eastman Chemical Co. | 22 | ||||||
| 1 | Ecolab, Inc. | 63 | ||||||
| — | FMC Corp. | 23 | ||||||
| 3 | Freeport-McMoRan Copper & Gold, Inc. | 101 | ||||||
| — | International Flavors & Fragrances, Inc. | 14 | ||||||
| 1 | International Paper Co. | 39 | ||||||
| 1 | MeadWestvaco Corp. | 15 | ||||||
| 2 | Monsanto Co. | 138 | ||||||
| 1 | Mosaic Co. | 51 | ||||||
| 2 | Newmont Mining Corp. | 75 | ||||||
| 1 | Nucor Corp. | 38 | ||||||
| 1 | Owens-Illinois, Inc. ● | 10 | ||||||
| — | PPG Industries, Inc. | 50 | ||||||
| 1 | Praxair, Inc. | 102 | ||||||
| 1 | Sealed Air Corp. | 9 | ||||||
| — | Sherwin-Williams Co. | 35 | ||||||
| — | Sigma-Aldrich Corp. | 28 | ||||||
| — | Titanium Metals Corp. | 3 | ||||||
| — | United States Steel Corp. | 9 | ||||||
| — | Vulcan Materials Co. | 16 | ||||||
| 1,310 | ||||||||
| Media - 0.6% | ||||||||
| 1 | Cablevision Systems Corp. | 9 | ||||||
| 2 | CBS Corp. Class B | 66 | ||||||
| 8 | Comcast Corp. Class A | 270 | ||||||
| 2 | DirecTV Class A ● | 100 | ||||||
| 1 | Discovery Communications, Inc. ● | 43 | ||||||
| 1 | Gannett Co., Inc. | 11 | ||||||
| 1 | Interpublic Group of Cos., Inc. | 15 | ||||||
| 1 | McGraw-Hill Cos., Inc. | 39 | ||||||
| 7 | News Corp. Class A | 147 | ||||||
| 1 | Omnicom Group, Inc. | 41 | ||||||
| — | Scripps Networks Interactive Class A | 17 | ||||||
| 1 | Time Warner Cable, Inc. | 80 | ||||||
| 3 | Time Warner, Inc. | 116 | ||||||
| 2 | Viacom, Inc. Class B | 78 | ||||||
| 6 | Walt Disney Co. | 271 | ||||||
| — | Washington Post Co. Class B | 6 | ||||||
| 1,309 | ||||||||
| Pharmaceuticals, Biotechnology & Life Sciences - 1.5% | ||||||||
| 5 | Abbott Laboratories | 317 | ||||||
| 1 | Agilent Technologies, Inc. | 43 | ||||||
| 1 | Alexion Pharmaceuticals, Inc. ● | 60 | ||||||
| 1 | Allergan, Inc. | 89 | ||||||
| 2 | Amgen, Inc. | 178 | ||||||
| 1 | Biogen Idec, Inc. ● | 108 | ||||||
| 5 | Bristol-Myers Squibb Co. | 190 | ||||||
| 1 | Celgene Corp. ● | 88 | ||||||
| 3 | Eli Lilly & Co. | 137 | ||||||
| 1 | Forest Laboratories, Inc. ● | 29 | ||||||
| 2 | Gilead Sciences, Inc. ● | 121 | ||||||
| 1 | Hospira, Inc. ● | 18 | ||||||
| 9 | Johnson & Johnson | 581 | ||||||
The accompanying notes are an integral part of these financial statements.
| 7 |
| Hartford Portfolio Diversifier HLS Fund |
| Schedule of Investments – (continued) |
| June 30, 2012 (Unaudited) |
| (000’s Omitted) |
| Shares or Principal Amount | Market Value ╪ | |||||||
| COMMON STOCKS - 18.0% - (continued) | ||||||||
| Pharmaceuticals, Biotechnology & Life Sciences - 1.5% - (continued) | ||||||||
| 1 | Life Technologies Corp. ● | $ | 25 | |||||
| 10 | Merck & Co., Inc. | 397 | ||||||
| 1 | Mylan, Inc. ● | 29 | ||||||
| — | PerkinElmer, Inc. | 9 | ||||||
| — | Perrigo Co. | 34 | ||||||
| 23 | Pfizer, Inc. | 539 | ||||||
| 1 | Thermo Fisher Scientific, Inc. | 60 | ||||||
| — | Waters Corp. ● | 22 | ||||||
| — | Watson Pharmaceuticals, Inc. ● | 29 | ||||||
| 3,103 | ||||||||
| Real Estate - 0.4% | ||||||||
| 1 | American Tower Corp. REIT | 86 | ||||||
| — | Apartment Investment & Management Co. Class A | 11 | ||||||
| — | Avalonbay Communities, Inc. | 42 | ||||||
| — | Boston Properties, Inc. | 51 | ||||||
| 1 | CBRE Group, Inc. ● | 17 | ||||||
| 1 | Equity Residential Properties Trust | 58 | ||||||
| 1 | HCP, Inc. | 58 | ||||||
| 1 | Health Care, Inc. | 39 | ||||||
| 2 | Host Hotels & Resorts, Inc. | 36 | ||||||
| 1 | Kimco Realty Corp. | 24 | ||||||
| 1 | Plum Creek Timber Co., Inc. | 20 | ||||||
| 1 | ProLogis L.P. | 48 | ||||||
| — | Public Storage | 64 | ||||||
| 1 | Simon Property Group, Inc. | 148 | ||||||
| 1 | Ventas, Inc. | 57 | ||||||
| 1 | Vornado Realty Trust | 49 | ||||||
| 2 | Weyerhaeuser Co. | 37 | ||||||
| 845 | ||||||||
| Retailing - 0.7% | ||||||||
| — | Abercrombie & Fitch Co. Class A | 9 | ||||||
| 1 | Amazon.com, Inc. ● | 258 | ||||||
| — | AutoNation, Inc. ● | 5 | ||||||
| — | AutoZone, Inc. ● | 30 | ||||||
| 1 | Bed Bath & Beyond, Inc. ● | 45 | ||||||
| 1 | Best Buy Co., Inc. | 18 | ||||||
| — | Big Lots, Inc. ● | 8 | ||||||
| 1 | CarMax, Inc. ● | 18 | ||||||
| 1 | Dollar Tree, Inc. ● | 39 | ||||||
| — | Expedia, Inc. | 14 | ||||||
| — | Family Dollar Stores, Inc. | 24 | ||||||
| — | GameStop Corp. Class A | 7 | ||||||
| 1 | Gap, Inc. | 28 | ||||||
| — | Genuine Parts Co. | 29 | ||||||
| 5 | Home Depot, Inc. | 254 | ||||||
| — | J.C. Penney Co., Inc. | 11 | ||||||
| 1 | Kohl's Corp. | 34 | ||||||
| 1 | Limited Brands, Inc. | 32 | ||||||
| 4 | Lowe's Co., Inc. | 105 | ||||||
| 1 | Macy's, Inc. | 44 | ||||||
| — | Netflix, Inc. ● | 12 | ||||||
| �� | — | Nordstrom, Inc. | 25 | |||||
| — | O'Reilly Automotive, Inc. ● | 33 | ||||||
| — | Priceline.com, Inc. ● | 104 | ||||||
| 1 | Ross Stores, Inc. | 44 | ||||||
| — | Sears Holdings Corp. ● | 7 | ||||||
| 2 | Staples, Inc. | 28 | ||||||
| 2 | Target Corp. | 120 | ||||||
| — | Tiffany & Co. | 21 | ||||||
| 2 | TJX Cos., Inc. | 100 | ||||||
| — | TripAdvisor, Inc. ● | 13 | ||||||
| — | Urban Outfitters, Inc. ● | 10 | ||||||
| 1,529 | ||||||||
| Semiconductors & Semiconductor Equipment - 0.4% | ||||||||
| 2 | Advanced Micro Devices, Inc. ● | 10 | ||||||
| 1 | Altera Corp. | 34 | ||||||
| 1 | Analog Devices, Inc. | 35 | ||||||
| 4 | Applied Materials, Inc. | 46 | ||||||
| 2 | Broadcom Corp. Class A | 52 | ||||||
| — | First Solar, Inc. ● | 3 | ||||||
| 16 | Intel Corp. | 420 | ||||||
| 1 | KLA-Tencor Corp. | 26 | ||||||
| 1 | Lam Research Corp. ● | 24 | ||||||
| 1 | Linear Technology Corp. | 22 | ||||||
| 2 | LSI Corp. ● | 11 | ||||||
| 1 | Microchip Technology, Inc. | 20 | ||||||
| 3 | Micron Technology, Inc. ● | 19 | ||||||
| 2 | NVIDIA Corp. ● | 27 | ||||||
| 1 | Teradyne, Inc. ● | 8 | ||||||
| 4 | Texas Instruments, Inc. | 103 | ||||||
| 1 | Xilinx, Inc. | 28 | ||||||
| 888 | ||||||||
| Software & Services - 1.7% | ||||||||
| 2 | Accenture plc | 121 | ||||||
| 2 | Adobe Systems, Inc. ● | 50 | ||||||
| 1 | Akamai Technologies, Inc. ● | 18 | ||||||
| 1 | Autodesk, Inc. ● | 25 | ||||||
| 2 | Automatic Data Processing, Inc. | 85 | ||||||
| 1 | BMC Software, Inc. ● | 21 | ||||||
| 1 | CA, Inc. | 30 | ||||||
| 1 | Citrix Systems, Inc. ● | 49 | ||||||
| 1 | Cognizant Technology Solutions Corp. ● | 57 | ||||||
| — | Computer Sciences Corp. | 12 | ||||||
| 4 | eBay, Inc. ● | 151 | ||||||
| 1 | Electronic Arts, Inc. ● | 12 | ||||||
| 1 | Fidelity National Information Services, Inc. | 25 | ||||||
| — | Fiserv, Inc. ● | 31 | ||||||
| 1 | Google, Inc. ● | 462 | ||||||
| 4 | IBM Corp. | 706 | ||||||
| 1 | Intuit, Inc. | 55 | ||||||
| — | Mastercard, Inc. | 143 | ||||||
| 23 | Microsoft Corp. | 716 | ||||||
| 12 | Oracle Corp. | 361 | ||||||
| 1 | Paychex, Inc. | 32 | ||||||
| 1 | Red Hat, Inc. ● | 34 | ||||||
| 1 | SAIC, Inc. | 10 | ||||||
| — | Salesforce.com, Inc. ● | 60 | ||||||
| 2 | Symantec Corp. ● | 33 | ||||||
| 1 | Teradata Corp. ● | 38 | ||||||
| 1 | Total System Services, Inc. | 12 | ||||||
| — | VeriSign, Inc. | 22 | ||||||
| 2 | Visa, Inc. | 193 | ||||||
| 2 | Western Union Co. | 32 | ||||||
| 4 | Yahoo!, Inc. ● | 60 | ||||||
| 3,656 | ||||||||
The accompanying notes are an integral part of these financial statements.
| 8 |
| Shares or Principal Amount | Market Value ╪ | |||||||
| COMMON STOCKS - 18.0% - (continued) | ||||||||
| Technology Hardware & Equipment - 1.4% | ||||||||
| 1 | Amphenol Corp. Class A | $ | 28 | |||||
| 3 | Apple, Inc. ● | 1,709 | ||||||
| 17 | Cisco Systems, Inc. | 288 | ||||||
| 5 | Corning, Inc. | 61 | ||||||
| 5 | Dell, Inc. ● | 58 | ||||||
| 7 | EMC Corp. ● | 168 | ||||||
| — | F5 Networks, Inc. ● | 25 | ||||||
| — | FLIR Systems, Inc. | 9 | ||||||
| — | Harris Corp. | 15 | ||||||
| 6 | Hewlett-Packard Co. | 124 | ||||||
| 1 | Jabil Circuit, Inc. | 12 | ||||||
| 1 | JDS Uniphase Corp. ● | 8 | ||||||
| 2 | Juniper Networks, Inc. ● | 27 | ||||||
| — | Lexmark International, Inc. | 6 | ||||||
| — | Molex, Inc. | 10 | ||||||
| 1 | Motorola Solutions, Inc. | 44 | ||||||
| 1 | NetApp, Inc. ● | 36 | ||||||
| 5 | Qualcomm, Inc. | 299 | ||||||
| 1 | SanDisk Corp. ● | 28 | ||||||
| 1 | Seagate Technology plc | 30 | ||||||
| 1 | TE Connectivity Ltd. | 43 | ||||||
| 1 | Western Digital Corp. ● | 22 | ||||||
| 4 | Xerox Corp. | 33 | ||||||
| 3,083 | ||||||||
| Telecommunication Services - 0.6% | ||||||||
| 18 | AT&T, Inc. | 654 | ||||||
| 2 | CenturyLink, Inc. | 77 | ||||||
| 1 | Crown Castle International Corp. ● | 47 | ||||||
| 3 | Frontier Communications Corp. | 12 | ||||||
| 1 | MetroPCS Communications, Inc. ● | 6 | ||||||
| 9 | Sprint Nextel Corp. ● | 30 | ||||||
| 9 | Verizon Communications, Inc. | 395 | ||||||
| 2 | Windstream Corp. | 18 | ||||||
| 1,239 | ||||||||
| Transportation - 0.3% | ||||||||
| 1 | C.H. Robinson Worldwide, Inc. | 30 | ||||||
| 3 | CSX Corp. | 73 | ||||||
| 1 | Expeditors International of Washington, Inc. | 26 | ||||||
| 1 | FedEx Corp. | 90 | ||||||
| 1 | Norfolk Southern Corp. | 73 | ||||||
| — | Ryder System, Inc. | 6 | ||||||
| 2 | Southwest Airlines Co. | 22 | ||||||
| 1 | Union Pacific Corp. | 178 | ||||||
| 3 | United Parcel Service, Inc. Class B | 236 | ||||||
| 734 | ||||||||
| Utilities - 0.7% | ||||||||
| 2 | AES (The) Corp. ● | 26 | ||||||
| — | AGL Resources, Inc. | 14 | ||||||
| 1 | Ameren Corp. | 25 | ||||||
| 2 | American Electric Power Co., Inc. | 60 | ||||||
| 1 | CenterPoint Energy, Inc. | 28 | ||||||
| 1 | CMS Energy Corp. | 19 | ||||||
| 1 | Consolidated Edison, Inc. | 57 | ||||||
| 2 | Dominion Resources, Inc. | 97 | ||||||
| 1 | DTE Energy Co. | 31 | ||||||
| 4 | Duke Energy Corp. | 97 | ||||||
| 1 | Edison International | 47 | ||||||
| 1 | Entergy Corp. | 38 | ||||||
| 3 | Exelon Corp. | 100 | ||||||
| 1 | FirstEnergy Corp. | 64 | ||||||
| — | Integrys Energy Group, Inc. | 14 | ||||||
| 1 | NextEra Energy, Inc. | 90 | ||||||
| 1 | NiSource, Inc. | 22 | ||||||
| 1 | Northeast Utilities | 38 | ||||||
| 1 | NRG Energy, Inc. ● | 12 | ||||||
| 1 | Oneok, Inc. | 27 | ||||||
| 1 | Pepco Holdings, Inc. | 14 | ||||||
| 1 | PG&E Corp. | 60 | ||||||
| — | Pinnacle West Capital Corp. | 18 | ||||||
| 2 | PPL Corp. | 50 | ||||||
| 1 | Progress Energy, Inc. | 56 | ||||||
| 2 | Public Service Enterprise Group, Inc. | 51 | ||||||
| — | SCANA Corp. | 17 | ||||||
| 1 | Sempra Energy | 52 | ||||||
| 3 | Southern Co. | 126 | ||||||
| 1 | TECO Energy, Inc. | 12 | ||||||
| 1 | Wisconsin Energy Corp. | 29 | ||||||
| 2 | Xcel Energy, Inc. | 43 | ||||||
| 1,434 | ||||||||
| Total common stocks | ||||||||
| (cost $36,555) | $ | 38,509 | ||||||
| EXCHANGE TRADED FUNDS - 0.5% | ||||||||
| Other Investment Pools and Funds - 0.5% | ||||||||
| 16 | Vanguard S&P 500 ETF | $ | 973 | |||||
| Total exchange traded funds | ||||||||
| (cost $954) | $ | 973 | ||||||
| ASSET & COMMERCIAL MORTGAGE BACKED SECURITIES - 0.6% | ||||||||
| Finance and Insurance - 0.6% | ||||||||
| Ally Automotive Receivables Trust | ||||||||
| $ | 20 | 0.93%, 02/16/2016 | $ | 20 | ||||
| Banc of America Commercial Mortgage, Inc. | ||||||||
| 25 | 5.41%, 09/10/2047 | 28 | ||||||
| 15 | 5.73%, 05/10/2045 Δ | 17 | ||||||
| 25 | 5.89%, 07/10/2044 Δ | 28 | ||||||
| Citibank Credit Card Issuance Trust | ||||||||
| 110 | 4.85%, 03/10/2017 | 122 | ||||||
| Citigroup Commercial Mortgage Trust | ||||||||
| 35 | 5.70%, 12/10/2049 Δ | 40 | ||||||
| Citigroup/Deutsche Bank Commercial Mortgage Trust | ||||||||
| 25 | 5.32%, 12/11/2049 | 28 | ||||||
| 35 | 5.39%, 07/15/2044 Δ | 39 | ||||||
| 25 | 5.62%, 10/15/2048 | 28 | ||||||
| Commercial Mortgage Pass-Through Certificates | ||||||||
| 20 | 5.31%, 12/10/2046 | 22 | ||||||
| 15 | 5.81%, 12/10/2049 Δ | 18 | ||||||
| Credit Suisse Mortgage Capital Certificates | ||||||||
| 25 | 5.31%, 12/15/2039 | 28 | ||||||
| 30 | 5.47%, 09/15/2039 | 33 | ||||||
| Goldman Sachs Mortgage Securities Corp. | ||||||||
| 45 | 5.79%, 08/10/2045 Δ | 50 | ||||||
The accompanying notes are an integral part of these financial statements.
| 9 |
| Hartford Portfolio Diversifier HLS Fund |
| Schedule of Investments – (continued) |
| June 30, 2012 (Unaudited) |
| (000’s Omitted) |
| Shares or Principal Amount | Market Value ╪ | |||||||
| ASSET & COMMERCIAL MORTGAGE BACKED SECURITIES - 0.6% - (continued) | ||||||||
| Finance and Insurance - 0.6% - (continued) | ||||||||
| Goldman Sachs Mortgage Securities Corp. II | ||||||||
| $ | 35 | 4.75%, 07/10/2039 | $ | 38 | ||||
| 15 | 5.40%, 08/10/2038 | 16 | ||||||
| 25 | 5.56%, 11/10/2039 | 28 | ||||||
| Greenwich Capital Commercial Funding Corp. | ||||||||
| 40 | 5.22%, 04/10/2037 Δ | 44 | ||||||
| 35 | 5.44%, 03/10/2039 Δ | 39 | ||||||
| JP Morgan Chase Commercial Mortgage Securities Corp. | ||||||||
| 25 | 5.34%, 05/15/2047 | 28 | ||||||
| 20 | 5.42%, 01/15/2049 | 22 | ||||||
| 35 | 5.44%, 06/12/2047 Δ | 40 | ||||||
| 20 | 5.48%, 12/12/2044 Δ | 22 | ||||||
| 20 | 5.74%, 02/12/2049 Δ | 23 | ||||||
| 38 | 5.79%, 02/12/2051 Δ | 44 | ||||||
| 25 | 5.82%, 06/15/2049 Δ | 27 | ||||||
| LB-UBS Commercial Mortgage Trust | ||||||||
| 20 | 5.43%, 02/15/2040 | 22 | ||||||
| 25 | 5.86%, 07/15/2040 Δ | 29 | ||||||
| 20 | 5.87%, 09/15/2045 | 23 | ||||||
| LB-UBS Commerical Mortgage Trust | ||||||||
| 25 | 5.37%, 09/15/2039 Δ | 28 | ||||||
| Merrill Lynch/Countrywide Commercial Mortgage Trust | ||||||||
| 25 | 5.17%, 12/12/2049 Δ | 28 | ||||||
| 25 | 5.38%, 08/12/2048 | 27 | ||||||
| Morgan Stanley Capital I | ||||||||
| 25 | 5.69%, 04/15/2049 Δ | 28 | ||||||
| Morgan Stanley Capital Investments | ||||||||
| 25 | 5.81%, 12/12/2049 | 29 | ||||||
| Wachovia Bank Commercial Mortgage Trust | ||||||||
| 25 | 5.27%, 12/15/2044 Δ | 28 | ||||||
| 25 | 5.31%, 11/15/2048 | 28 | ||||||
| 25 | 5.34%, 12/15/2043 | 27 | ||||||
| 25 | 5.42%, 01/15/2045 Δ | 28 | ||||||
| 25 | 5.51%, 04/15/2047 | 27 | ||||||
| 25 | 5.74%, 06/15/2049 Δ | 27 | ||||||
| 1,251 | ||||||||
| Total asset & commercial mortgage backed securities | ||||||||
| (cost $1,219) | $ | 1,251 | ||||||
| CORPORATE BONDS - 8.3% | ||||||||
| Administrative Waste Management and Remediation - 0.0% | ||||||||
| Republic Services, Inc. | ||||||||
| $ | 45 | 5.00%, 03/01/2020 | $ | 51 | ||||
| Arts, Entertainment and Recreation - 0.4% | ||||||||
| CBS Corp. | ||||||||
| 25 | 7.88%, 07/30/2030 | 32 | ||||||
| Comcast Corp. | ||||||||
| 165 | 5.15%, 03/01/2020 | 192 | ||||||
| DirecTV Holdings LLC | ||||||||
| 30 | 3.50%, 03/01/2016 | 32 | ||||||
| 65 | 5.00%, 03/01/2021 | 71 | ||||||
| Discovery Communications, Inc. | ||||||||
| 15 | 5.05%, 06/01/2020 | 17 | ||||||
| NBC Universal Media LLC | ||||||||
| 70 | 4.38%, 04/01/2021 | 77 | ||||||
| News America, Inc. | ||||||||
| 71 | 6.40%, 12/15/2035 | 82 | ||||||
| Time Warner Cable, Inc. | ||||||||
| 75 | 4.00%, 09/01/2021 | 79 | ||||||
| Time Warner, Inc. | ||||||||
| 130 | 4.88%, 03/15/2020 | 146 | ||||||
| 65 | 6.75%, 07/01/2018 | 79 | ||||||
| Viacom, Inc. | ||||||||
| 20 | 6.88%, 04/30/2036 | 26 | ||||||
| Walt Disney Co. | ||||||||
| 20 | 4.13%, 12/01/2041 | 21 | ||||||
| 50 | 5.63%, 09/15/2016 | 59 | ||||||
| 913 | ||||||||
| Beverage and Tobacco Product Manufacturing - 0.3% | ||||||||
| Altria Group, Inc. | ||||||||
| 55 | 4.75%, 05/05/2021 | 62 | ||||||
| 25 | 9.70%, 11/10/2018 | 35 | ||||||
| Anheuser-Busch InBev Worldwide, Inc. | ||||||||
| 125 | 5.38%, 01/15/2020 | 149 | ||||||
| Coca-Cola Co. | ||||||||
| 40 | 1.65%, 03/14/2018 | 41 | ||||||
| 30 | 3.15%, 11/15/2020 | 32 | ||||||
| Diageo Capital plc | ||||||||
| 75 | 5.50%, 09/30/2016 | 88 | ||||||
| Dr. Pepper Snapple Group | ||||||||
| 40 | 2.90%, 01/15/2016 | 42 | ||||||
| PepsiCo, Inc. | ||||||||
| 100 | 3.13%, 11/01/2020 | 105 | ||||||
| Philip Morris International, Inc. | ||||||||
| 65 | 4.50%, 03/26/2020 | 75 | ||||||
| 629 | ||||||||
| Chemical Manufacturing - 0.1% | ||||||||
| Dow Chemical Co. | ||||||||
| 90 | 8.55%, 05/15/2019 | 120 | ||||||
| E.I. DuPont de Nemours & Co. | ||||||||
| 55 | 3.63%, 01/15/2021 | 60 | ||||||
| Ecolab, Inc. | ||||||||
| 15 | 4.35%, 12/08/2021 | 17 | ||||||
| Potash Corp. of Saskatchewan, Inc. | ||||||||
| 35 | 6.50%, 05/15/2019 | 44 | ||||||
| PPG Industries, Inc. | ||||||||
| 20 | 3.60%, 11/15/2020 | 21 | ||||||
| Praxair, Inc. | ||||||||
| 25 | 5.38%, 11/01/2016 | 29 | ||||||
| 291 | ||||||||
| Computer and Electronic Product Manufacturing - 0.3% | ||||||||
| Cingular Wireless LLC | ||||||||
| 25 | 7.13%, 12/15/2031 | 33 | ||||||
| Cisco Systems, Inc. | ||||||||
| 75 | 4.45%, 01/15/2020 | 87 | ||||||
| 40 | 5.50%, 02/22/2016 | 46 | ||||||
| Dell, Inc. | ||||||||
| 20 | 5.88%, 06/15/2019 | 24 | ||||||
The accompanying notes are an integral part of these financial statements.
| 10 |
| Shares or Principal Amount | Market Value ╪ | |||||||
| CORPORATE BONDS - 8.3% - (continued) | ||||||||
| Computer and Electronic Product Manufacturing - 0.3% - (continued) | ||||||||
| Hewlett-Packard Co. | ||||||||
| $ | 45 | 4.30%, 06/01/2021 | $ | 46 | ||||
| 50 | 5.50%, 03/01/2018 | 57 | ||||||
| Intel Corp. | ||||||||
| 50 | 3.30%, 10/01/2021 | 53 | ||||||
| Lockheed Martin Corp. | ||||||||
| 45 | 4.25%, 11/15/2019 | 50 | ||||||
| 15 | 4.85%, 09/15/2041 | 17 | ||||||
| Raytheon Co. | ||||||||
| 25 | 3.13%, 10/15/2020 | 26 | ||||||
| Texas Instruments, Inc. | ||||||||
| 25 | 2.38%, 05/16/2016 | 26 | ||||||
| Thermo Fisher Scientific, Inc. | ||||||||
| 65 | 2.25%, 08/15/2016 | 67 | ||||||
| 532 | ||||||||
| Couriers and Messengers - 0.0% | ||||||||
| United Parcel Service, Inc. | ||||||||
| 35 | 3.13%, 01/15/2021 | 37 | ||||||
| 45 | 3.88%, 04/01/2014 | 48 | ||||||
| 85 | ||||||||
| Electrical Equipment and Appliance Manufacturing - 0.1% | ||||||||
| Emerson Electric Co. | ||||||||
| 30 | 4.88%, 10/15/2019 | 35 | ||||||
| General Electric Co. | ||||||||
| 55 | 5.25%, 12/06/2017 | 64 | ||||||
| Koninklijke Philips Electronics N.V. | ||||||||
| 18 | 6.88%, 03/11/2038 | 24 | ||||||
| 123 | ||||||||
| Finance and Insurance - 3.3% | ||||||||
| Aetna, Inc. | ||||||||
| 20 | 3.95%, 09/01/2020 | 22 | ||||||
| Allstate Corp. | ||||||||
| 35 | 5.00%, 08/15/2014 | 38 | ||||||
| 29 | 5.95%, 04/01/2036 | 35 | ||||||
| American Express Co. | ||||||||
| 50 | 8.13%, 05/20/2019 | 67 | ||||||
| American Express Credit Corp. | ||||||||
| 75 | 2.75%, 09/15/2015 | 78 | ||||||
| American International Group, Inc. | ||||||||
| 120 | 6.40%, 12/15/2020 | 136 | ||||||
| Aon Corp. | ||||||||
| 20 | 5.00%, 09/30/2020 | 22 | ||||||
| Asian Development Bank | ||||||||
| 135 | 2.50%, 03/15/2016 | 144 | ||||||
| Bank of America Corp. | ||||||||
| 90 | 5.00%, 05/13/2021 | 93 | ||||||
| 280 | 5.65%, 05/01/2018 | 299 | ||||||
| Bank of New York Mellon Corp. | ||||||||
| 25 | 2.30%, 07/28/2016 | 26 | ||||||
| 20 | 3.55%, 09/23/2021 | 21 | ||||||
| Bank of Nova Scotia | ||||||||
| 35 | 4.38%, 01/13/2021 | 40 | ||||||
| Barclays Bank plc | ||||||||
| 100 | 5.20%, 07/10/2014 | 105 | ||||||
| BB&T Corp. | ||||||||
| 80 | 3.20%, 03/15/2016 | 85 | ||||||
| Berkshire Hathaway Finance Corp. | ||||||||
| 100 | 5.40%, 05/15/2018 | 118 | ||||||
| Blackrock, Inc. | ||||||||
| 25 | 5.00%, 12/10/2019 | 29 | ||||||
| Boston Properties L.P. | ||||||||
| 40 | 5.88%, 10/15/2019 | 46 | ||||||
| BP Capital Markets plc | ||||||||
| 70 | 2.25%, 11/01/2016 | 72 | ||||||
| 40 | 3.25%, 05/06/2022 | 42 | ||||||
| Capital One Financial Corp. | ||||||||
| 50 | 6.15%, 09/01/2016 | 56 | ||||||
| Caterpillar Financial Services Corp. | ||||||||
| 45 | 6.13%, 02/17/2014 | 49 | ||||||
| Chubb Corp. | ||||||||
| 45 | 5.75%, 05/15/2018 | 55 | ||||||
| Cigna Corp. | ||||||||
| 10 | 5.38%, 02/15/2042 | 11 | ||||||
| Citigroup, Inc. | ||||||||
| 75 | 5.00%, 09/15/2014 | 77 | ||||||
| 215 | 5.38%, 08/09/2020 | 232 | ||||||
| 25 | 6.63%, 06/15/2032 | 26 | ||||||
| Credit Suisse First Boston USA, Inc. | ||||||||
| 150 | 5.38%, 03/02/2016 | 166 | ||||||
| Deutsche Bank AG | ||||||||
| 40 | 3.25%, 01/11/2016 | 41 | ||||||
| European Bank for Reconstruction & Development | ||||||||
| 65 | 2.50%, 03/15/2016 | 69 | ||||||
| European Investment Bank | ||||||||
| 105 | 1.25%, 10/14/2016 | 105 | ||||||
| 95 | 2.88%, 09/15/2020 | 99 | ||||||
| 200 | 3.13%, 06/04/2014 | 209 | ||||||
| Fifth Third Bancorp | ||||||||
| 35 | 3.63%, 01/25/2016 | 37 | ||||||
| Ford Motor Credit Co. | ||||||||
| 170 | 6.63%, 08/15/2017 | 193 | ||||||
| General Electric Capital Corp. | ||||||||
| 215 | 4.38%, 09/16/2020 | 232 | ||||||
| 120 | 5.30%, 02/11/2021 | 135 | ||||||
| Goldman Sachs Group, Inc. | ||||||||
| 200 | 5.38%, 03/15/2020 | 206 | ||||||
| 59 | 6.25%, 02/01/2041 | 61 | ||||||
| HCP, Inc. | ||||||||
| 60 | 6.70%, 01/30/2018 | 70 | ||||||
| Health Care REIT, Inc. | ||||||||
| 20 | 5.25%, 01/15/2022 | 21 | ||||||
| HSBC Finance Corp. | ||||||||
| 50 | 4.75%, 07/15/2013 | 52 | ||||||
| 40 | 5.00%, 06/30/2015 | 42 | ||||||
| HSBC Holdings plc | ||||||||
| 120 | 5.10%, 04/05/2021 | 134 | ||||||
| Inter-American Development Bank | ||||||||
| 75 | 2.25%, 07/15/2015 | 78 | ||||||
| 40 | 3.88%, 02/14/2020 | 47 | ||||||
| International Bank for Reconstruction & Development | ||||||||
| 150 | 1.13%, 08/25/2014 | 152 | ||||||
| 47 | 7.63%, 01/19/2023 | 70 | ||||||
The accompanying notes are an integral part of these financial statements.
| 11 |
| Hartford Portfolio Diversifier HLS Fund |
| Schedule of Investments – (continued) |
| June 30, 2012 (Unaudited) |
| (000’s Omitted) |
| Shares or Principal Amount | Market Value ╪ | |||||||
| CORPORATE BONDS - 8.3% - (continued) | ||||||||
| Finance and Insurance - 3.3% - (continued) | ||||||||
| John Deere Capital Corp. | ||||||||
| $ | 35 | 1.85%, 09/15/2016 | $ | 36 | ||||
| 35 | 2.80%, 09/18/2017 | 37 | ||||||
| JP Morgan Chase & Co. | ||||||||
| 200 | 4.95%, 03/25/2020 | 221 | ||||||
| 75 | 5.13%, 09/15/2014 | 80 | ||||||
| 30 | 6.00%, 01/15/2018 | 34 | ||||||
| 130 | 6.30%, 04/23/2019 | 152 | ||||||
| Keycorp | ||||||||
| 70 | 3.75%, 08/13/2015 | 74 | ||||||
| Kreditanstalt fuer Wiederaufbau | ||||||||
| 350 | 1.25%, 10/26/2015 - 02/15/2017 | 355 | ||||||
| 45 | 2.63%, 01/25/2022 | 47 | ||||||
| 71 | 4.00%, 01/27/2020 | 81 | ||||||
| Landwirtschaftliche Rentenbank | ||||||||
| 100 | 3.13%, 07/15/2015 | 107 | ||||||
| Lincoln National Corp. | ||||||||
| 25 | 8.75%, 07/01/2019 | 31 | ||||||
| Lloyds Banking Group plc | ||||||||
| 40 | 6.38%, 01/21/2021 | 45 | ||||||
| MetLife, Inc. | ||||||||
| 20 | 5.70%, 06/15/2035 | 24 | ||||||
| 50 | 7.72%, 02/15/2019 | 63 | ||||||
| Morgan Stanley | ||||||||
| 50 | 4.75%, 04/01/2014 | 51 | ||||||
| 100 | 5.45%, 01/09/2017 | 101 | ||||||
| 40 | 5.50%, 07/28/2021 | 39 | ||||||
| National Rural Utilities Cooperative Finance Corp. | ||||||||
| 30 | 5.45%, 04/10/2017 | 35 | ||||||
| Nomura Holdings, Inc. | ||||||||
| 50 | 4.13%, 01/19/2016 | 51 | ||||||
| Oesterreichische Kontrollbank AG | ||||||||
| 35 | 4.88%, 02/16/2016 | 39 | ||||||
| PNC Funding Corp. | ||||||||
| 60 | 5.13%, 02/08/2020 | 69 | ||||||
| Prudential Financial, Inc. | ||||||||
| 85 | 5.38%, 06/21/2020 | 94 | ||||||
| Rabobank Nederland | ||||||||
| 25 | 4.50%, 01/11/2021 | 27 | ||||||
| Royal Bank of Canada | ||||||||
| 35 | 2.30%, 07/20/2016 | 36 | ||||||
| Royal Bank of Scotland plc | ||||||||
| 75 | 3.95%, 09/21/2015 | 76 | ||||||
| Simon Property Group L.P. | ||||||||
| 75 | 5.65%, 02/01/2020 | 87 | ||||||
| SLM Corp. | ||||||||
| 60 | 6.25%, 01/25/2016 | 63 | ||||||
| Toyota Motor Credit Corp. | ||||||||
| 40 | 3.20%, 06/17/2015 | 43 | ||||||
| 20 | 3.40%, 09/15/2021 | 21 | ||||||
| Travelers Cos., Inc. | ||||||||
| 60 | 3.90%, 11/01/2020 | 67 | ||||||
| U.S. Bancorp | ||||||||
| 110 | 2.45%, 07/27/2015 | 114 | ||||||
| UBS AG Stamford CT | ||||||||
| 100 | 5.88%, 07/15/2016 | 105 | ||||||
| UnitedHealth Group, Inc. | ||||||||
| 35 | 6.88%, 02/15/2038 | 49 | ||||||
| Wellpoint, Inc. | ||||||||
| 25 | 5.25%, 01/15/2016 | 28 | ||||||
| 20 | 5.80%, 08/15/2040 | 24 | ||||||
| Wells Fargo & Co. | ||||||||
| 50 | 2.10%, 05/08/2017 | 50 | ||||||
| 165 | 4.60%, 04/01/2021 | 184 | ||||||
| Westpac Banking Corp. | ||||||||
| 40 | 3.00%, 12/09/2015 | 41 | ||||||
| 7,124 | ||||||||
| Food Manufacturing - 0.2% | ||||||||
| Archer Daniels Midland Co. | ||||||||
| 18 | 5.94%, 10/01/2032 | 22 | ||||||
| General Mills, Inc. | ||||||||
| 20 | 5.65%, 02/15/2019 | 24 | ||||||
| Kellogg Co. | ||||||||
| 40 | 4.00%, 12/15/2020 | 44 | ||||||
| Kraft Foods, Inc. | ||||||||
| 160 | 5.38%, 02/10/2020 | 189 | ||||||
| 12 | 6.88%, 02/01/2038 | 16 | ||||||
| Unilever Capital Corp. | ||||||||
| 20 | 5.90%, 11/15/2032 | 28 | ||||||
| 323 | ||||||||
| Food Services - 0.1% | ||||||||
| McDonald's Corp. | ||||||||
| 80 | 5.35%, 03/01/2018 | 96 | ||||||
| Yum! Brands, Inc. | ||||||||
| 7 | 6.88%, 11/15/2037 | 9 | ||||||
| 105 | ||||||||
| Health Care and Social Assistance - 0.5% | ||||||||
| Abbott Laboratories | ||||||||
| 75 | 5.13%, 04/01/2019 | 89 | ||||||
| Amgen, Inc. | ||||||||
| 55 | 3.88%, 11/15/2021 | 58 | ||||||
| 37 | 5.75%, 03/15/2040 | 41 | ||||||
| Aristotle Holding, Inc. | ||||||||
| 45 | 4.75%, 11/15/2021 ■ | 50 | ||||||
| AstraZeneca plc | ||||||||
| 30 | 5.90%, 09/15/2017 | 36 | ||||||
| Baxter International, Inc. | ||||||||
| 30 | 4.50%, 08/15/2019 | 34 | ||||||
| Boston Scientific Corp. | ||||||||
| 40 | 6.00%, 01/15/2020 | 48 | ||||||
| Bristol-Myers Squibb Co. | ||||||||
| 20 | 5.45%, 05/01/2018 | 24 | ||||||
| Covidien International | ||||||||
| 25 | 6.00%, 10/15/2017 | 30 | ||||||
| CVS Caremark Corp. | ||||||||
| 30 | 6.13%, 09/15/2039 | 37 | ||||||
| Eli Lilly & Co. | ||||||||
| 20 | 5.20%, 03/15/2017 | 23 | ||||||
| Gilead Sciences, Inc. | ||||||||
| 20 | 4.40%, 12/01/2021 | 22 | ||||||
| Glaxosmithkline Capital, Inc. | ||||||||
| 75 | 5.65%, 05/15/2018 | 91 | ||||||
| Johnson & Johnson | ||||||||
| 75 | 2.15%, 05/15/2016 | 78 | ||||||
| 10 | 5.95%, 08/15/2037 | 14 | ||||||
| McKesson Corp. | ||||||||
| 10 | 4.75%, 03/01/2021 | 12 | ||||||
The accompanying notes are an integral part of these financial statements.
| 12 |
| Shares or Principal Amount | Market Value ╪ | |||||||
| CORPORATE BONDS - 8.3% - (continued) | ||||||||
| Health Care and Social Assistance - 0.5% - (continued) | ||||||||
| Medtronic, Inc. | ||||||||
| $ | 50 | 4.45%, 03/15/2020 | $ | 57 | ||||
| Merck & Co., Inc. | ||||||||
| 85 | 3.88%, 01/15/2021 | 96 | ||||||
| Novartis Securities Investment Ltd. | ||||||||
| 25 | 5.13%, 02/10/2019 | 30 | ||||||
| Pfizer, Inc. | ||||||||
| 140 | 6.20%, 03/15/2019 | 176 | ||||||
| Quest Diagnostics, Inc. | ||||||||
| 40 | 4.70%, 04/01/2021 | 45 | ||||||
| Sanofi-Aventis S.A. | ||||||||
| 20 | 4.00%, 03/29/2021 | 22 | ||||||
| Teva Pharmaceutical Finance B.V. | ||||||||
| 20 | 3.65%, 11/10/2021 | 21 | ||||||
| 1,134 | ||||||||
| Information - 0.6% | ||||||||
| America Movil SAB de C.V. | ||||||||
| 70 | 5.63%, 11/15/2017 | 82 | ||||||
| AT&T, Inc. | ||||||||
| 43 | 5.35%, 09/01/2040 | 49 | ||||||
| 160 | 5.80%, 02/15/2019 | 195 | ||||||
| 42 | 6.40%, 05/15/2038 | 53 | ||||||
| British Telecommunications plc | ||||||||
| 18 | 9.62%, 12/15/2030 Δ | 27 | ||||||
| Cellco Partnership - Verizon Wireless Capital LLC | ||||||||
| 50 | 8.50%, 11/15/2018 | 68 | ||||||
| CenturyLink, Inc. | ||||||||
| 51 | 7.60%, 09/15/2039 | 49 | ||||||
| Deutsche Telekom International Finance B.V. | ||||||||
| 27 | 8.75%, 06/15/2030 | 38 | ||||||
| France Telecom S.A. | ||||||||
| 40 | 5.38%, 07/08/2019 | 45 | ||||||
| Google, Inc. | ||||||||
| 65 | 2.13%, 05/19/2016 | 68 | ||||||
| Microsoft Corp. | ||||||||
| 60 | 1.63%, 09/25/2015 | 62 | ||||||
| 15 | 5.20%, 06/01/2039 | 19 | ||||||
| Oracle Corp. | ||||||||
| 20 | 5.38%, 07/15/2040 | 24 | ||||||
| 60 | 5.75%, 04/15/2018 | 73 | ||||||
| Telecom Italia Capital | ||||||||
| 30 | 7.00%, 06/04/2018 | 30 | ||||||
| Telefonica Emisiones SAU | ||||||||
| 60 | 5.46%, 02/16/2021 | 52 | ||||||
| Verizon Communications, Inc. | ||||||||
| 43 | 6.00%, 04/01/2041 | 55 | ||||||
| 130 | 6.35%, 04/01/2019 | 162 | ||||||
| Vodafone Group plc | ||||||||
| 60 | 5.45%, 06/10/2019 | 72 | ||||||
| 1,223 | ||||||||
| Machinery Manufacturing - 0.1% | ||||||||
| Baker Hughes, Inc. | ||||||||
| 16 | 5.13%, 09/15/2040 | 19 | ||||||
| Caterpillar, Inc. | ||||||||
| 85 | 3.90%, 05/27/2021 | 95 | ||||||
| Deere & Co. | ||||||||
| 15 | 3.90%, 06/09/2042 | 15 | ||||||
| Joy Global, Inc. | ||||||||
| 10 | 5.13%, 10/15/2021 | 11 | ||||||
| Xerox Corp. | ||||||||
| 20 | 6.35%, 05/15/2018 | 23 | ||||||
| 163 | ||||||||
| Mining - 0.2% | ||||||||
| Barrick Gold Corp. | ||||||||
| 70 | 6.95%, 04/01/2019 | 87 | ||||||
| BHP Billiton Finance USA Ltd. | ||||||||
| 15 | 4.13%, 02/24/2042 | 16 | ||||||
| 30 | 6.50%, 04/01/2019 | 38 | ||||||
| Newmont Mining Corp. | ||||||||
| 18 | 6.25%, 10/01/2039 | 20 | ||||||
| Rio Tinto Finance USA Ltd. | ||||||||
| 60 | 3.75%, 09/20/2021 | 65 | ||||||
| 40 | 6.50%, 07/15/2018 | 49 | ||||||
| Teck Resources Ltd. | ||||||||
| 40 | 4.50%, 01/15/2021 | 42 | ||||||
| Vale Overseas Ltd. | ||||||||
| 35 | 6.88%, 11/10/2039 | 41 | ||||||
| 358 | ||||||||
| Miscellaneous Manufacturing - 0.2% | ||||||||
| 3M Co. | ||||||||
| 75 | 1.38%, 09/29/2016 | 77 | ||||||
| Boeing Co. | ||||||||
| 65 | 4.88%, 02/15/2020 | 78 | ||||||
| Honeywell International, Inc. | ||||||||
| 45 | 4.25%, 03/01/2021 | 52 | ||||||
| Northrop Grumman Corp. | ||||||||
| 20 | 5.05%, 08/01/2019 | 23 | ||||||
| Tyco International Finance S.A. | ||||||||
| 20 | 8.50%, 01/15/2019 | 27 | ||||||
| United Technologies Corp. | ||||||||
| 95 | 4.50%, 04/15/2020 - 06/01/2042 | 108 | ||||||
| 25 | 6.13%, 02/01/2019 | 31 | ||||||
| 396 | ||||||||
| Motor Vehicle and Parts Manufacturing - 0.0% | ||||||||
| DaimlerChrysler NA Holdings Corp. | ||||||||
| 18 | 8.50%, 01/18/2031 | 28 | ||||||
| Johnson Controls, Inc. | ||||||||
| 40 | 5.00%, 03/30/2020 | 45 | ||||||
| 73 | ||||||||
| Paper Manufacturing - 0.1% | ||||||||
| International Paper Co. | ||||||||
| 60 | 7.50%, 08/15/2021 | 76 | ||||||
| Kimberly-Clark Corp. | ||||||||
| 40 | 6.13%, 08/01/2017 | 49 | ||||||
| 125 | ||||||||
| Petroleum and Coal Products Manufacturing - 0.7% | ||||||||
| Anadarko Petroleum Corp. | ||||||||
| 40 | 5.95%, 09/15/2016 | 45 | ||||||
| Apache Corp. | ||||||||
| 25 | 5.10%, 09/01/2040 | 29 | ||||||
| Atmos Energy Corp. | ||||||||
| 8 | 5.50%, 06/15/2041 | 10 | ||||||
| Canadian Natural Resources Ltd. | ||||||||
| 60 | 5.70%, 05/15/2017 | 70 | ||||||
The accompanying notes are an integral part of these financial statements.
| 13 |
| Hartford Portfolio Diversifier HLS Fund |
| Schedule of Investments – (continued) |
| June 30, 2012 (Unaudited) |
| (000’s Omitted) |
| Shares or Principal Amount | Market Value ╪ | |||||||
| CORPORATE BONDS - 8.3% - (continued) | ||||||||
| Petroleum and Coal Products Manufacturing - 0.7% - (continued) | ||||||||
| Cenovus Energy, Inc. | ||||||||
| $ | 25 | 5.70%, 10/15/2019 | $ | 29 | ||||
| ConocoPhillips | ||||||||
| 63 | 6.50%, 02/01/2039 | 87 | ||||||
| Devon Financing Corp. | ||||||||
| 20 | 7.88%, 09/30/2031 | 29 | ||||||
| EnCana Corp. | ||||||||
| 25 | 6.50%, 02/01/2038 | 27 | ||||||
| Ensco plc | ||||||||
| 50 | 4.70%, 03/15/2021 | 54 | ||||||
| Hess Corp. | ||||||||
| 23 | 5.60%, 02/15/2041 | 24 | ||||||
| Kerr-McGee Corp. | ||||||||
| 30 | 6.95%, 07/01/2024 | 37 | ||||||
| Marathon Petroleum Corp. | ||||||||
| 15 | 5.13%, 03/01/2021 | 17 | ||||||
| Nabors Industries, Inc. | ||||||||
| 20 | 5.00%, 09/15/2020 | 21 | ||||||
| Nexen, Inc. | ||||||||
| 10 | 7.50%, 07/30/2039 | 12 | ||||||
| Noble Energy, Inc. | ||||||||
| 20 | 6.00%, 03/01/2041 | 23 | ||||||
| Occidental Petroleum Corp. | ||||||||
| 40 | 4.10%, 02/01/2021 | 45 | ||||||
| Pemex Project Funding Master Trust | ||||||||
| 50 | 5.75%, 03/01/2018 | 57 | ||||||
| Petrobras International Finance Co. | ||||||||
| 135 | 5.38%, 01/27/2021 | 146 | ||||||
| Petroleos Mexicanos | ||||||||
| 45 | 6.50%, 06/02/2041 ■ | 53 | ||||||
| Phillips 66 | ||||||||
| 45 | 4.30%, 04/01/2022 ■ | 47 | ||||||
| Sempra Energy | ||||||||
| 10 | 6.00%, 10/15/2039 | 13 | ||||||
| 35 | 6.50%, 06/01/2016 | 41 | ||||||
| Shell International Finance B.V. | ||||||||
| 100 | 4.30%, 09/22/2019 | 116 | ||||||
| Statoilhydro ASA | ||||||||
| 60 | 5.25%, 04/15/2019 | 72 | ||||||
| Suncor Energy, Inc. | ||||||||
| 25 | 6.50%, 06/15/2038 | 30 | ||||||
| Talisman Energy, Inc. | ||||||||
| 25 | 7.75%, 06/01/2019 | 31 | ||||||
| Total Capital International S.A. | ||||||||
| 45 | 1.50%, 02/17/2017 | 45 | ||||||
| Transocean, Inc. | ||||||||
| 45 | 6.50%, 11/15/2020 | 51 | ||||||
| TXU Electric Delivery Co. | ||||||||
| 30 | 7.00%, 09/01/2022 | 36 | ||||||
| Valero Energy Corp. | ||||||||
| 60 | 6.13%, 02/01/2020 | 69 | ||||||
| Weatherford International Ltd. | ||||||||
| 30 | 5.13%, 09/15/2020 | 32 | ||||||
| Williams Partners L.P. | ||||||||
| 45 | 5.25%, 03/15/2020 | 51 | ||||||
| 1,449 | ||||||||
| Pipeline Transportation - 0.1% | ||||||||
| Enterprise Products Operating LLC | ||||||||
| 90 | 5.20%, 09/01/2020 | 103 | ||||||
| Kinder Morgan Energy Partners L.P. | ||||||||
| 47 | 6.38%, 03/01/2041 | 53 | ||||||
| Oneok Partners L.P. | ||||||||
| 10 | 6.65%, 10/01/2036 | 12 | ||||||
| Plains All American Pipeline L.P. | ||||||||
| 20 | 6.65%, 01/15/2037 | 25 | ||||||
| TransCanada Pipelines Ltd. | ||||||||
| 50 | 3.80%, 10/01/2020 | 55 | ||||||
| 50 | 7.13%, 01/15/2019 | 64 | ||||||
| 312 | ||||||||
| Primary Metal Manufacturing - 0.1% | ||||||||
| Alcoa, Inc. | ||||||||
| 50 | 6.15%, 08/15/2020 | 53 | ||||||
| ArcelorMittal | ||||||||
| 85 | 5.50%, 03/01/2021 | 80 | ||||||
| 133 | ||||||||
| Professional, Scientific and Technical Services - 0.0% | ||||||||
| IBM Corp. | ||||||||
| 43 | 5.60%, 11/30/2039 | 56 | ||||||
| Public Administration - 0.0% | ||||||||
| Waste Management, Inc. | ||||||||
| 25 | 4.75%, 06/30/2020 | 28 | ||||||
| Rail Transportation - 0.1% | ||||||||
| Burlington Northern Santa Fe Corp. | ||||||||
| 80 | 4.70%, 10/01/2019 | 90 | ||||||
| Canadian National Railway Co. | ||||||||
| 40 | 2.85%, 12/15/2021 | 41 | ||||||
| Canadian Pacific Railway Co. | ||||||||
| 8 | 7.13%, 10/15/2031 | 10 | ||||||
| CSX Corp. | ||||||||
| 25 | 3.70%, 10/30/2020 | 26 | ||||||
| 20 | 4.25%, 06/01/2021 | 22 | ||||||
| Norfolk Southern Corp. | ||||||||
| 25 | 4.84%, 10/01/2041 | 28 | ||||||
| Union Pacific Corp. | ||||||||
| 14 | 6.63%, 02/01/2029 | 19 | ||||||
| 236 | ||||||||
| Real Estate, Rental and Leasing - 0.0% | ||||||||
| COX Communications, Inc. | ||||||||
| 60 | 5.45%, 12/15/2014 | 66 | ||||||
| ERP Operating L.P. | ||||||||
| 25 | 5.75%, 06/15/2017 | 29 | ||||||
| 95 | ||||||||
| Retail Trade - 0.3% | ||||||||
| Energy Transfer Partners | ||||||||
| 64 | 9.00%, 04/15/2019 | 80 | ||||||
| Federated Retail Holdings, Inc. | ||||||||
| 65 | 5.90%, 12/01/2016 | 75 | ||||||
| Home Depot, Inc. | ||||||||
| 70 | 4.40%, 04/01/2021 | 81 | ||||||
| Kroger (The) Co. | ||||||||
| 40 | 3.90%, 10/01/2015 | 43 | ||||||
| 20 | 6.80%, 12/15/2018 | 24 | ||||||
| Lowe's Co., Inc. | ||||||||
| 18 | 6.65%, 09/15/2037 | 24 | ||||||
The accompanying notes are an integral part of these financial statements.
| 14 |
| Shares or Principal Amount | Market Value ╪ | |||||||
| CORPORATE BONDS - 8.3% - (continued) | ||||||||
| Retail Trade - 0.3% - (continued) | ||||||||
| Target Corp. | ||||||||
| $ | 105 | 3.88%, 07/15/2020 | $ | 116 | ||||
| Wal-Mart Stores, Inc. | ||||||||
| 115 | 3.25%, 10/25/2020 | 123 | ||||||
| 30 | 4.25%, 04/15/2021 | 35 | ||||||
| 28 | 5.63%, 04/15/2041 | 36 | ||||||
| 637 | ||||||||
| Soap, Cleaning Compound and Toilet Manufacturing - 0.0% | ||||||||
| Procter & Gamble Co. | ||||||||
| 75 | 4.70%, 02/15/2019 | 89 | ||||||
| Transportation Equipment Manufacturing - 0.0% | ||||||||
| General Dynamics Corp. | ||||||||
| 15 | 3.88%, 07/15/2021 | 17 | ||||||
| Utilities - 0.5% | ||||||||
| Consolidated Edison Co. of NY | ||||||||
| 10 | 5.50%, 12/01/2039 | 12 | ||||||
| 40 | 6.65%, 04/01/2019 | 51 | ||||||
| Dominion Resources, Inc. | ||||||||
| 95 | 4.45%, 03/15/2021 | 108 | ||||||
| Duke Energy Corp. | ||||||||
| 45 | 5.30%, 02/15/2040 | 56 | ||||||
| Entergy Corp. | ||||||||
| 40 | 3.63%, 09/15/2015 | 41 | ||||||
| Exelon Generation Co. LLC | ||||||||
| 100 | 4.00%, 10/01/2020 | 101 | ||||||
| FirstEnergy Solutions Co. | ||||||||
| 80 | 6.05%, 08/15/2021 | 88 | ||||||
| Florida Power & Light Co. | ||||||||
| 35 | 5.69%, 03/01/2040 | 46 | ||||||
| Georgia Power Co. | ||||||||
| 25 | 2.85%, 05/15/2022 | 25 | ||||||
| 35 | 4.75%, 09/01/2040 | 38 | ||||||
| Hydro Quebec | ||||||||
| 30 | 8.40%, 01/15/2022 | 43 | ||||||
| Kentucky Utilities | ||||||||
| 20 | 5.13%, 11/01/2040 | 24 | ||||||
| MidAmerican Energy Holdings Co. | ||||||||
| 65 | 6.13%, 04/01/2036 | 81 | ||||||
| Nevada Power Co. | ||||||||
| 10 | 6.75%, 07/01/2037 | 14 | ||||||
| Ohio Power Co. | ||||||||
| 35 | 5.38%, 10/01/2021 | 41 | ||||||
| Pacific Gas & Electric Co. | ||||||||
| 55 | 6.05%, 03/01/2034 | 69 | ||||||
| Progress Energy, Inc. | ||||||||
| 100 | 4.40%, 01/15/2021 | 111 | ||||||
| PSEG Power LLC | ||||||||
| 25 | 5.13%, 04/15/2020 | 28 | ||||||
| Public Service Electric & Gas Co. | ||||||||
| 10 | 3.95%, 05/01/2042 | 10 | ||||||
| San Diego Gas & Electric Co. | ||||||||
| 12 | 4.50%, 08/15/2040 | 14 | ||||||
| South Carolina Electric & Gas | ||||||||
| 10 | 6.05%, 01/15/2038 | 13 | ||||||
| Southern California Edison Co. | ||||||||
| 35 | 4.50%, 09/01/2040 | 39 | ||||||
| Xcel Energy, Inc. | ||||||||
| 65 | 4.70%, 05/15/2020 | 75 | ||||||
| 1,128 | ||||||||
| Total corporate bonds | ||||||||
| (cost $17,356) | $ | 17,828 | ||||||
| FOREIGN GOVERNMENT OBLIGATIONS - 0.6% | ||||||||
| Brazil - 0.1% | ||||||||
| Brazil (Republic of) | ||||||||
| $ | 125 | 5.88%, 01/15/2019 | $ | 151 | ||||
| 58 | 7.13%, 01/20/2037 | 83 | ||||||
| $ | 234 | |||||||
| Canada - 0.3% | ||||||||
| British Columbia (Province of) | ||||||||
| 60 | 2.10%, 05/18/2016 | 63 | ||||||
| Canada (Government of) | ||||||||
| 35 | 0.88%, 02/14/2017 | 35 | ||||||
| 40 | 2.38%, 09/10/2014 | 42 | ||||||
| Manitoba (Province of) | ||||||||
| 75 | 2.63%, 07/15/2015 | 79 | ||||||
| Nova Scotia (Province of) | ||||||||
| 35 | 5.13%, 01/26/2017 | 41 | ||||||
| Ontario (Province of) | ||||||||
| 115 | 4.40%, 04/14/2020 | 134 | ||||||
| Quebec (Province of) | ||||||||
| 90 | 3.50%, 07/29/2020 | 99 | ||||||
| 493 | ||||||||
| Colombia - 0.1% | ||||||||
| Colombia (Republic of) | ||||||||
| 61 | 8.13%, 05/21/2024 | 89 | ||||||
| Italy - 0.0% | ||||||||
| Italy (Republic of) | ||||||||
| 25 | 5.38%, 06/15/2033 | 22 | ||||||
| Mexico - 0.1% | ||||||||
| United Mexican States | ||||||||
| 140 | 5.13%, 01/15/2020 | 164 | ||||||
| 50 | 6.05%, 01/11/2040 | 65 | ||||||
| 229 | ||||||||
| Panama - 0.0% | ||||||||
| Panama (Republic of) | ||||||||
| 30 | 6.70%, 01/26/2036 | 40 | ||||||
| Peru - 0.0% | ||||||||
| Peru (Republic of) | ||||||||
| 20 | 5.63%, 11/18/2050 | 24 | ||||||
| 30 | 7.13%, 03/30/2019 | 39 | ||||||
| 63 | ||||||||
| Poland - 0.0% | ||||||||
| Poland (Republic of) | ||||||||
| 40 | 5.00%, 03/23/2022 | 44 | ||||||
| Total foreign government obligations | ||||||||
| (cost $1,155) | $ | 1,214 | ||||||
The accompanying notes are an integral part of these financial statements.
| 15 |
| Hartford Portfolio Diversifier HLS Fund |
| Schedule of Investments – (continued) |
| June 30, 2012 (Unaudited) |
| (000’s Omitted) |
| Shares or Principal Amount | Market Value ╪ | |||||||
| MUNICIPAL BONDS - 0.2% | ||||||||
| Airport Revenues - 0.0% | ||||||||
| Clark County, NV, Airport Rev, | ||||||||
| $ | 5 | 6.82%, 07/01/2045 | $ | 7 | ||||
| New York & New Jersey PA, | ||||||||
| 15 | 4.93%, 10/01/2051 | 17 | ||||||
| 24 | ||||||||
| General Obligations - 0.1% | ||||||||
| California State GO, | ||||||||
| 55 | 7.60%, 11/01/2040 | 71 | ||||||
| California State GO, Taxable, | ||||||||
| 10 | 7.55%, 04/01/2039 | 13 | ||||||
| Connecticut State GO, | ||||||||
| 15 | 5.85%, 03/15/2032 | 19 | ||||||
| Illionis State, GO, | ||||||||
| 55 | 5.10%, 06/01/2033 | 52 | ||||||
| Massachusetts State GO, | ||||||||
| 15 | 5.46%, 12/01/2039 | 19 | ||||||
| Mississippi State GO, | ||||||||
| 25 | 5.25%, 11/01/2034 | 29 | ||||||
| New York, NY, GO, | ||||||||
| 15 | 5.85%, 06/01/2040 | 19 | ||||||
| Texas State GO, | ||||||||
| 10 | 5.52%, 04/01/2039 | 13 | ||||||
| 235 | ||||||||
| Higher Education (Univ., Dorms, etc.) - 0.1% | ||||||||
| New York, NY, Dormitory Auth Rev, | ||||||||
| 20 | 5.60%, 03/15/2040 | 25 | ||||||
| University of California, Build America Bonds Rev, | ||||||||
| 25 | 5.77%, 05/15/2043 | 31 | ||||||
| University of Texas, | ||||||||
| 25 | 4.79%, 08/15/2046 | 30 | ||||||
| 86 | ||||||||
| Miscellaneous - 0.0% | ||||||||
| New Jersey State Econ DA Lease Rev, | ||||||||
| 15 | 7.43%, 02/15/2029 | 18 | ||||||
| Transportation - 0.0% | ||||||||
| Bay Area, CA, Toll Auth Bridge Rev, | ||||||||
| 15 | 6.26%, 04/01/2049 | 20 | ||||||
| Metropolitan Transportation Auth, NY, Rev, | ||||||||
| 20 | 5.87%, 11/15/2039 | 23 | ||||||
| New Jersey State Turnpike Auth, Taxable, | ||||||||
| 15 | 7.41%, 01/01/2040 | 22 | ||||||
| 65 | ||||||||
| Utilities - Water and Sewer – 0.0% | ||||||||
| New York City, NY, Municipal Water FA, | ||||||||
| 25 | 5.88%, 06/15/2044 | 33 | ||||||
| Total municipal bonds | ||||||||
| (cost $436) | $ | 461 | ||||||
| U.S. GOVERNMENT AGENCIES - 11.8% | ||||||||
| Federal Home Loan Mortgage Corporation - 3.8% | ||||||||
| $ | 200 | 1.63%, 04/15/2013 | $ | 202 | ||||
| 320 | 2.50%, 01/07/2014 | 331 | ||||||
| 130 | 2.88%, 02/09/2015 | 138 | ||||||
| 296 | 3.00%, 12/01/2025 - 04/01/2027 | 310 | ||||||
| 800 | 3.50%, 04/01/2026 - 04/01/2042 | 842 | ||||||
| 220 | 3.75%, 03/27/2019 | 254 | ||||||
| 1,153 | 4.00%, 06/01/2024 - 02/01/2042 | 1,225 | ||||||
| 1,729 | 4.50%, 03/01/2015 - 06/01/2041 | 1,854 | ||||||
| 1,239 | 5.00%, 05/01/2023 - 08/01/2041 | 1,341 | ||||||
| 230 | 5.13%, 10/18/2016 | 271 | ||||||
| 120 | 5.25%, 04/18/2016 | 140 | ||||||
| 675 | 5.50%, 01/01/2038 - 05/01/2038 | 735 | ||||||
| 400 | 6.00%, 06/01/2036 - 10/01/2037 | 439 | ||||||
| 10 | 6.25%, 07/15/2032 | 15 | ||||||
| 8,097 | ||||||||
| Federal National Mortgage Association - 5.4% | ||||||||
| 70 | 1.00%, 09/23/2013 | 71 | ||||||
| 110 | 1.63%, 10/26/2015 | 114 | ||||||
| 330 | 2.63%, 11/20/2014 | 347 | ||||||
| 630 | 2.75%, 03/13/2014 | 656 | ||||||
| 385 | 3.00%, 12/01/2025 - 04/01/2042 | 402 | ||||||
| 1,146 | 3.50%, 09/01/2025 - 05/01/2042 ☼ | 1,209 | ||||||
| 1,854 | 4.00%, 04/01/2025 - 02/01/2042 | 1,976 | ||||||
| 1,860 | 4.50%, 05/01/2025 - 05/01/2041 | 1,998 | ||||||
| 110 | 4.63%, 10/15/2013 | 116 | ||||||
| 2,135 | 5.00%, 02/01/2022 - 01/01/2040 | 2,315 | ||||||
| 1,116 | 5.50%, 05/01/2037 - 05/01/2040 | 1,219 | ||||||
| 70 | 5.63%, 07/15/2037 | 100 | ||||||
| 719 | 6.00%, 04/01/2036 - 07/01/2037 | 793 | ||||||
| 203 | 6.50%, 06/01/2039 | 230 | ||||||
| 53 | 6.63%, 11/15/2030 | 80 | ||||||
| 11,626 | ||||||||
| Government National Mortgage Association - 2.6% | ||||||||
| 119 | 3.00%, 04/15/2027 | 126 | ||||||
| 536 | 3.50%, 09/15/2025 - 06/15/2042 | 573 | ||||||
| 1,036 | 4.00%, 08/15/2026 - 06/15/2042 | 1,133 | ||||||
| 1,698 | 4.50%, 09/15/2039 - 07/20/2041 | 1,874 | ||||||
| 1,032 | 5.00%, 09/15/2039 - 12/20/2041 | 1,143 | ||||||
| 456 | 5.50%, 05/20/2038 - 07/15/2039 | 506 | ||||||
| 212 | 6.00%, 02/15/2036 - 08/20/2041 | 239 | ||||||
| 5,594 | ||||||||
| Total U.S. government agencies | ||||||||
| (cost $25,001) | $ | 25,317 | ||||||
| U.S. GOVERNMENT SECURITIES - 13.1% | ||||||||
| Other Direct Federal Obligations - 0.5% | ||||||||
| Federal Farm Credit Bank - 0.0% | ||||||||
| $ | 20 | 3.88%, 10/07/2013 | $ | 21 | ||||
| 40 | 4.88%, 01/17/2017 | 47 | ||||||
| 68 | ||||||||
| Federal Home Loan Bank - 0.4% | ||||||||
| 200 | 1.88%, 06/21/2013 | 203 | ||||||
| 100 | 4.50%, 09/16/2013 | 105 | ||||||
| 220 | 4.75%, 12/16/2016 | 257 | ||||||
| 90 | 5.00%, 11/17/2017 | 109 | ||||||
| 100 | 5.25%, 06/18/2014 | 110 | ||||||
| 784 | ||||||||
| Tennessee Valley Authority - 0.1% | ||||||||
| 95 | 6.75%, 11/01/2025 | 138 | ||||||
| 990 | ||||||||
The accompanying notes are an integral part of these financial statements.
| 16 |
| Shares or Principal Amount | Market Value ╪ | |||||||
| U.S. GOVERNMENT SECURITIES - 13.1% - (continued) | ||||||||
| U.S. Treasury Securities - 12.6% | ||||||||
| U.S. Treasury Bonds - 2.4% | ||||||||
| $ | 1,333 | 3.13%, 11/15/2041 | $ | 1,433 | ||||
| 305 | 3.75%, 08/15/2041 | 368 | ||||||
| 728 | 4.25%, 11/15/2040 | 952 | ||||||
| 1,570 | 5.38%, 02/15/2031 | 2,288 | ||||||
| 5,041 | ||||||||
| U.S. Treasury Notes - 10.2% | ||||||||
| 520 | 0.63%, 05/31/2017 | 518 | ||||||
| 485 | 0.88%, 11/30/2016 | 490 | ||||||
| 5,080 | 1.00%, 07/15/2013 - 08/31/2016 ௠| 5,134 | ||||||
| 930 | 1.25%, 08/31/2015 | 953 | ||||||
| 1,356 | 1.75%, 05/31/2016 - 05/15/2022 | 1,394 | ||||||
| 2,958 | 1.88%, 09/30/2017 | 3,120 | ||||||
| 345 | 2.13%, 08/15/2021 | 363 | ||||||
| 9,385 | 2.38%, 08/31/2014 Ø | 9,794 | ||||||
| 215 | 3.13%, 05/15/2021 Ø | 245 | ||||||
| 22,011 | ||||||||
| 27,052 | ||||||||
| Total U.S. government securities | ||||||||
| (cost $27,444) | $ | 28,042 | ||||||
| Contracts | Market Value ╪ | |||||||
| PUT OPTIONS PURCHASED - 9.3% | ||||||||
| Equity Contracts - 9.3% | ||||||||
| S&P 500 Option | ||||||||
| 97 | Expiration: 06/06/2016, Exercise Price: $1,170.00 | $ | 19,464 | |||||
| 33 | Expiration: 09/26/2012, Exercise Price: $1,175.00 | 296 | ||||||
| 19,760 | ||||||||
| Total put options purchased | ||||||||
| (cost $26,784) | $ | 19,760 | ||||||
| Total long-term investments | ||||||||
| (cost $136,904) | $ | 133,355 | ||||||
| Shares or Principal Amount | Market Value ╪ | |||||||||||
| SHORT-TERM INVESTMENTS - 40.9% | ||||||||||||
| Investment Pools and Funds - 0.0% | ||||||||||||
| 16 | JP Morgan U.S. Government Money Market Fund | $ | 16 | |||||||||
| Repurchase Agreements - 40.9% | ||||||||||||
| Deutsche Bank Securities TriParty Joint Repurchase Agreement (maturing on 07/02/2012 in the amount of $6,074, collateralized by U.S. Treasury Note 0.38%, 2015, value of $6,196) | ||||||||||||
| $ | 6,074 | 0.14%, 06/29/2012 | 6,074 | |||||||||
| RBC Capital Markets TriParty Joint Repurchase Agreement (maturing on 07/02/2012 in the amount of $41,030, collateralized by U.S. Treasury Bill 0.19%, 2013, U.S. Treasury Bond 3.13%, 2/15/2042, U.S. Treasury Note 0.25% - 4.50%, 2014 - 2022, value of $41,851) | ||||||||||||
| 41,030 | 0.08%, 06/29/2012 | 41,030 | ||||||||||
| RBS Greenwich Capital Markets TriParty Joint Repurchase Agreement (maturing on 07/02/2012 in the amount of $25,934, collateralized by U.S. Treasury Note 1.25% - 1.38%, 2012 - 2014, value of $26,453) | ||||||||||||
| 25,934 | 0.14%, 06/29/2012 | 25,934 | ||||||||||
| UBS Securities, Inc. TriParty Joint Repurchase Agreement (maturing on 07/02/2012 in the amount of $14,441, collateralized by U.S. Treasury Note 2.00%, 2012, value of $14,730) | ||||||||||||
| 14,441 | 0.14%, 06/29/2012 | 14,441 | ||||||||||
| 87,479 | ||||||||||||
| Total short-term investments | ||||||||||||
| (cost $87,495) | $ | 87,495 | ||||||||||
| Total investments | ||||||||||||
| (cost $224,399) ▲ | 103.3 | % | $ | 220,850 | ||||||||
| Other assets and liabilities | (3.3 | )% | (7,086 | ) | ||||||||
| Total net assets | 100.0 | % | $ | 213,764 | ||||||||
The accompanying notes are an integral part of these financial statements.
| 17 |
| Hartford Portfolio Diversifier HLS Fund |
| Schedule of Investments – (continued) |
| June 30, 2012 (Unaudited) |
| (000’s Omitted) |
| Note: | Percentage of investments as shown is the ratio of the total market value to total net assets. |
| ▲ | At June 30, 2012, the cost of securities for federal income tax purposes was $225,988 and the aggregate gross unrealized appreciation and depreciation based on that cost were: |
| Unrealized Appreciation | $ | 4,528 | ||
| Unrealized Depreciation | (9,666 | ) | ||
| Net Unrealized Depreciation | $ | (5,138 | ) |
| ● | Non-income producing. |
| Δ | Variable rate securities; the rate reported is the coupon rate in effect at June 30, 2012. |
| ■ | Securities issued within terms of a private placement memorandum, exempt from registration under Rule 144A under the Securities Act of 1933, as amended, and may be sold only to qualified institutional buyers. Unless otherwise indicated, these issues are determined to be liquid. At June 30, 2012, the aggregate value of these securities was $150, which represents 0.1% of total net assets. |
| ☼ | This security, or a portion of this security, was purchased on a when-issued, delayed delivery or delayed draw basis. The cost of these securities was $168 at June 30, 2012. |
| ‡ | This security, or a portion of this security, has been segregated to cover funding requirements on investment transactions settling in the future. |
| Ø | This security, or a portion of this security, collateralized the written put options in the table below: |
| Description | Option Type | Exercise Price/ Rate | Expiration Date | Number of Contracts* | Market Value ╪ | Premiums Received | Unrealized Appreciation (Depreciation) | |||||||||||||||||
| S&P 500 Option | Equity | $ | 910.00 | 06/06/2016 | 97,255 | $ | 11,018 | $ | 13,218 | $ | 2,200 | |||||||||||||
| * | The number of contracts does not omit 000's. |
In addition, securities valued at $9,563, held on behalf of the Fund at the custoday bank, were received from the broker as collateral in connection with option contracts.
Futures Contracts Outstanding at June 30, 2012
| Description | Number of Contracts* | Position | Expiration Date | Market Value ╪ | Notional Amount | Unrealized Appreciation/ (Depreciation) | ||||||||||||||||
| S&P 500 E-Mini Future | 1,924 | Short | 09/21/2012 | $ | 130,486 | $ | 126,001 | $ | (4,485 | ) | ||||||||||||
| * | The number of contracts does not omit 000's. |
Cash of $7,005 was pledged as initial margin deposit and collateral for daily variation margin loss on open futures contracts at June 30, 2012.
| ╪ | See Significant Accounting Policies of accompanying Notes to Financial Statements regarding valuation of securities. |
| GLOSSARY: (abbreviations used in preceding Schedule of Investments) | ||
| Index Abbreviations: | ||
| S&P | Standard & Poors | |
| Municipal Bond Abbreviations: | ||
| DA | Development Authority | |
| FA | Finance Authority | |
| GO | General Obligation | |
| PA | Port Authority | |
| Other Abbreviations: | ||
| ETF | Exchange Traded Fund | |
| REIT | Real Estate Investment Trust | |
The accompanying notes are an integral part of these financial statements.
| 18 |
| Hartford Portfolio Diversifier HLS Fund |
| Investment Valuation Hierarchy Level Summary |
| June 30, 2012 (Unaudited) |
| (000’s Omitted) |
| Total | Level 1 ♦ | Level 2 ♦ | Level 3 | |||||||||||||
| Assets: | ||||||||||||||||
| Asset & Commercial Mortgage Backed Securities | $ | 1,251 | $ | – | $ | 1,251 | $ | – | ||||||||
| Common Stocks ‡ | 38,509 | 38,509 | – | – | ||||||||||||
| Corporate Bonds | 17,828 | – | 17,828 | – | ||||||||||||
| Exchange Traded Funds | 973 | 973 | – | – | ||||||||||||
| Foreign Government Obligations | 1,214 | – | 1,214 | – | ||||||||||||
| Municipal Bonds | 461 | – | 461 | – | ||||||||||||
| Put Options Purchased | 19,760 | – | 19,760 | – | ||||||||||||
| U.S. Government Agencies | 25,317 | – | 25,317 | – | ||||||||||||
| U.S. Government Securities | 28,042 | 1,153 | 26,889 | – | ||||||||||||
| Short-Term Investments | 87,495 | 16 | 87,479 | – | ||||||||||||
| Total | $ | 220,850 | $ | 40,651 | $ | 180,199 | $ | – | ||||||||
| Written Options * | 2,200 | – | 2,200 | – | ||||||||||||
| Total | $ | 2,200 | $ | – | $ | 2,200 | $ | – | ||||||||
| Liabilities: | ||||||||||||||||
| Futures * | 4,485 | 4,485 | – | – | ||||||||||||
| Total | $ | 4,485 | $ | 4,485 | $ | – | $ | – | ||||||||
| ♦ | For the six-month period ended June 30, 2012, investments valued at $180 were transferred from Level 1 to Level 2, and there were no transfers from Level 2 to Level 1. Investments are transferred between Level 1 and Level 2 for a variety of reasons including, but not limited to: |
| 1) | Foreign equities for which a fair value price is more representative of exit value than the local market close (transfer into Level 2). Foreign equities for which the local market close is more representative of exit value (transfer into Level 1). |
| 2) | U.S. Treasury securities that no longer represent the most recent issue (transfer into Level 2). |
| 3) | Equity investments with no observable trading but a bid or close price is used (transfer into Level 2). Equity investments using observable quoted prices in an active market (transfer into Level 1). |
| ‡ | The Fund has all or primarily all of the equity securities categorized in a particular level. Refer to the Schedule of Investments for further industry breakout. |
| * | Derivative instruments not reflected in the Schedule of Investments are valued at the unrealized appreciation/depreciation on the investments. |
Following is a reconciliation of Level 3 assets for which significant unobservable inputs were used to determine fair value:
| Balance as of December 31, 2011 | Realized Gain (Loss) | Change in Unrealized Appreciation (Depreciation) | Net Amortization | Purchases | Sales | Transfers Into Level 3 * | Transfers Out of Level 3 * | Balance as of June 30, 2012 | ||||||||||||||||||||||||||||
| Assets: | ||||||||||||||||||||||||||||||||||||
| U.S. Government Agencies | $ | 54 | $ | — | $ | — | $ | — | $ | — | $ | — | $ | — | $ | (54 | ) | $ | — | |||||||||||||||||
| Total | $ | 54 | $ | — | $ | — | $ | — | $ | — | $ | — | $ | — | $ | (54 | ) | $ | — | |||||||||||||||||
| * | Investments are transferred into and out of Level 3 for a variety of reasons including, but not limited to: |
| 1) | Investments where trading has been halted (transfer into Level 3) or investments where trading has resumed (transfer out of Level 3). |
| 2) | Broker quoted investments (transfer into Level 3) or quoted prices in active markets (transfer out of Level 3). |
| 3) | Investments that have certain restrictions on trading (transfer into Level 3) or investments where trading restrictions have expired (transfer out of Level 3). |
The accompanying notes are an integral part of these financial statements.
| 19 |
| Hartford Portfolio Diversifier HLS Fund |
| Statement of Assets and Liabilities |
| June 30, 2012 (Unaudited) |
| (000’s Omitted) |
| Assets: | ||||
| Investments in securities, at market value (cost $224,399) | $ | 220,850 | ||
| Cash | 7,005 | * | ||
| Receivables: | ||||
| Investment securities sold | 439 | |||
| Fund shares sold | 524 | |||
| Dividends and interest | 573 | |||
| Other assets | 15 | |||
| Total assets | 229,406 | |||
| Liabilities: | ||||
| Bank overdraft | 4 | |||
| Payables: | ||||
| Investment securities purchased | 1,312 | |||
| Fund shares redeemed | — | |||
| Variation margin | 3,268 | |||
| Investment management fees | 18 | |||
| Distribution fees | 7 | |||
| Other liabilities | 4 | |||
| Accrued expenses | 11 | |||
| Written options (proceeds $13,218) | 11,018 | |||
| Total liabilities | 15,642 | |||
| Net assets | $ | 213,764 | ||
| Summary of Net Assets: | ||||
| Capital stock and paid-in-capital | $ | 218,723 | ||
| Undistributed net investment income | 262 | |||
| Accumulated net realized gain | 613 | |||
| Unrealized depreciation of investments | (5,834 | ) | ||
| Net assets | $ | 213,764 | ||
| Shares authorized | 1,000,000 | |||
| Par value | $ | 0.001 | ||
| Class IB: Net asset value per share | $ | 9.69 | ||
| Shares outstanding | 22,068 | |||
| Net assets | $ | 213,764 |
* Cash of $7,005 was pledged as initial margin deposit and collateral for open futures contracts at June 30, 2012.
The accompanying notes are an integral part of these financial statements.
| 20 |
| Hartford Portfolio Diversifier HLS Fund |
| Statement of Operations |
| For the Six-Month Period Ended June 30, 2012 (Unaudited) |
| (000’s Omitted) |
| Investment Income: | ||||
| Dividends | $ | 340 | ||
| Interest | 634 | |||
| Total investment income, net | 974 | |||
| Expenses: | ||||
| Investment management fees | 502 | |||
| Distribution fees - Class IB | 209 | |||
| Custodian fees | 23 | |||
| Accounting services fees | 15 | |||
| Board of Directors' fees | 1 | |||
| Audit fees | 6 | |||
| Other expenses | 9 | |||
| Total expenses (before waivers) | 765 | |||
| Expense waivers | (53 | ) | ||
| Total waivers | (53 | ) | ||
| Total expenses, net | 712 | |||
| Net investment income | 262 | |||
| Net Realized Gain on Investments and Other Financial Instruments: | ||||
| Net realized gain on investments | 497 | |||
| Net realized gain on futures | 106 | |||
| Net Realized Gain on Investments and Other Financial Instruments | 603 | |||
| Net Changes in Unrealized Depreciation of Investments and Other Financial Instruments: | ||||
| Net unrealized appreciation of investments | 2,300 | |||
| Net unrealized depreciation of futures | (4,533 | ) | ||
| Net unrealized depreciation of purchased options | (8,314 | ) | ||
| Net unrealized appreciation of written options | 4,221 | |||
| Net Changes in Unrealized Depreciation of Investments and Other Financial Instruments | (6,326 | ) | ||
| Net Loss on Investments and Other Financial Instruments | (5,723 | ) | ||
| Net Decrease in Net Assets Resulting from Operations | $ | (5,461 | ) |
The accompanying notes are an integral part of these financial statements.
| 21 |
| Hartford Portfolio Diversifier HLS Fund |
| Statement of Changes in Net Assets |
| (000’s Omitted) |
| For the Six-Month Period Ended June 30, 2012 (Unaudited) | For the Period June 6, 2011* through December 31, 2011 | |||||||
| Operations: | ||||||||
| Net investment income | $ | 262 | $ | 245 | ||||
| Net realized gain on investments and other financial instruments | 603 | 272 | ||||||
| Net unrealized appreciation (depreciation) of investments and other financial instruments | (6,326 | ) | 492 | |||||
| Net Increase (Decrease) In Net Assets Resulting From Operations | (5,461 | ) | 1,009 | |||||
| Distributions to Shareholders: | ||||||||
| From net investment income | ||||||||
| Class IB | — | (352 | ) | |||||
| Total from net investment income | — | (352 | ) | |||||
| From net realized gain on investments | ||||||||
| Class IB | — | (191 | ) | |||||
| Total from net realized gain on investments | — | (191 | ) | |||||
| Total distributions | — | (543 | ) | |||||
| Capital Share Transactions: | ||||||||
| Class IB | ||||||||
| Sold | 120,134 | 106,671 | ||||||
| Issued on reinvestment of distributions | — | 543 | ||||||
| Redeemed | (7,490 | ) | (1,099 | ) | ||||
| Total capital share transactions | 112,644 | 106,115 | ||||||
| Net increase from capital share transactions | 112,644 | 106,115 | ||||||
| Net Increase In Net Assets | 107,183 | 106,581 | ||||||
| Net Assets: | ||||||||
| Beginning of period | 106,581 | — | ||||||
| End of period | $ | 213,764 | $ | 106,581 | ||||
| Undistributed (distribution in excess of) net investment income | $ | 262 | $ | — | ||||
| Shares: | ||||||||
| Class IB | ||||||||
| Sold | 12,369 | 10,517 | ||||||
| Issued on reinvestment of distributions | — | 53 | ||||||
| Redeemed | (766 | ) | (105 | ) | ||||
| Total share activity | 11,603 | 10,465 | ||||||
* Commencement of operations.
The accompanying notes are an integral part of these financial statements.
| 22 |
| Hartford Portfolio Diversifier HLS Fund |
| Notes to Financial Statements |
| June 30, 2012 (Unaudited) |
| (000’s Omitted) |
| 1. | Organization: |
Hartford Portfolio Diversifier HLS Fund (the “Fund”) serves as an underlying investment option for certain variable annuity separate accounts of Hartford Life Insurance Company (“HLIC”) and its affiliates. The Fund’s shares are available only to separate accounts of HLIC and its affiliates as a required investment option for variable annuity contracts whose holders have elected a guaranteed benefit rider subject to an allocation requiring investment in the Fund.
Hartford Series Fund, Inc. (the “Company”) is an open-end registered management investment company comprised of thirty portfolios. Financial Statements for the Fund, a series of the Company, are included in this report.
The Company is organized under the laws of the State of Maryland and is registered with the Securities and Exchange Commission (“SEC”) under the Investment Company Act of 1940, as amended (“1940 Act”). The Fund is a diversified open-end management investment company.
Class IB shares of the Fund are offered at the per share net asset value (“NAV”) without a sales charge and are subject to distribution and service fees charged pursuant to a Distribution Plan adopted in accordance with Rule 12b-1 under the 1940 Act.
| 2. | Significant Accounting Policies: |
The following is a summary of significant accounting policies of the Fund in the preparation of its financial statements, which are in accordance with the United States Generally Accepted Accounting Principles (“U.S. GAAP”). The preparation of financial statements in accordance with U.S. GAAP may require management to make estimates and assumptions that affect the reported amounts of assets and liabilities and disclosure of contingent assets and liabilities at the date of the financial statements and the reported amounts of increases and decreases in net assets from operations during the reporting period. Actual results could differ from those estimates.
| a) | Determination of Net Asset Value – The NAV of the Fund’s shares is determined as of the close of regular trading (normally 4:00 p.m. Eastern Time) (the “NYSE Close”) on each day that the New York Stock Exchange (the “Exchange”) is open (“Valuation Date”). Information that becomes known to the Fund after the NAV has been calculated on a particular day will not generally be used to retroactively adjust the NAV determined earlier that day. |
| b) | Investment Valuation and Fair Value Measurements – For purposes of calculating the NAV, portfolio investments and other assets held by the Fund's portfolio for which market quotes are readily available are valued at market value. Market value is generally determined on the basis of last reported sales prices or official close price. If no sales are reported, market value is based on quotes obtained from a quotation reporting system, established market makers, or independent pricing services. If market prices are not readily available or are deemed unreliable, the Fund will use the fair value of the investment as determined in good faith under policies and procedures established by and under the supervision of the Company’s Board of Directors. Market quotes are considered not readily available where there is an absence of current or reliable market-based data (e.g., trade information or broker quotes), including where events occur after the close of the relevant market, but prior to the NYSE Close that materially affect the values of the Fund’s portfolio investments or assets. In addition, market quotes are considered not readily available when, due to extraordinary circumstances, the exchanges or markets on which the investments trade do not open for trading for the entire day and no other market prices are available. In addition, prices of foreign equities that are principally traded on certain foreign markets are adjusted daily pursuant to a fair value pricing service approved by the Board of Directors in order to reflect an adjustment for the factors occurring after the close of certain foreign markets but before the NYSE Close. Investments that are primarily traded on foreign markets may trade on days that are not business days of the Fund. The value of the foreign investments in which the Fund invests may change on days when a shareholder will not be able to purchase or redeem shares of the Fund. Fair value pricing is subjective in nature and the use of fair value pricing by the Fund may |
| 23 |
| Hartford Portfolio Diversifier HLS Fund |
| Notes to Financial Statements – (continued) |
| June 30, 2012 (Unaudited) |
| (000’s Omitted) |
cause the NAV of its shares to differ significantly from the NAV that would have been calculated using market prices at the close of the exchange on which a portfolio investment is primarily traded. There can be no assurance that the Fund could obtain the fair market value assigned to an investment if the Fund were to sell the investment at approximately the time at which the Fund determines its NAV.
Fixed income investments (other than short term obligations) and non-exchange traded derivatives held by the Fund are normally valued on the basis of quotes obtained from brokers and dealers or independent pricing services in accordance with procedures established by the Company’s Board of Directors. Prices obtained from independent pricing services use information provided by market makers or estimates of market values obtained from yield data relating to investments with similar characteristics. Generally, the Fund may use fair valuation in regard to fixed income investments when the Fund holds defaulted or distressed investments or investments in a company in which a reorganization is pending. Short-term investments maturing in 60 days or less are generally valued at amortized cost, if their original term to maturity was 60 days or less, or by amortizing their value on the 61st day prior to maturity, if the original term to maturity exceeded 60 days.
Exchange traded options, futures and options on futures are valued at the settlement price determined by the relevant exchange as of the NYSE Close. If such instruments do not trade on an exchange, values may be supplied by an independent pricing service using a formula or other objective method that may take into consideration the style, direction, expiration, strike price, notional value and volatility or other adjustments.
Investments in open-end mutual funds are valued at the respective NAV of each open-end mutual fund on the Valuation Date.
Financial instruments for which prices are not available from an independent pricing service may be valued using market quotations obtained from one or more dealers that make markets in the respective financial instrument in accordance with procedures established by the Company’s Board of Directors.
U.S. GAAP defines fair value as the price that the Fund would receive to sell an asset or pay to transfer a liability in an orderly transaction between market participants. The U.S. GAAP fair value measurement standards require disclosure of a fair value hierarchy for each major category of assets and liabilities. Various inputs are used in determining the fair value of the Fund’s investments. These inputs are summarized into three broad hierarchy levels. This hierarchy is based on whether the valuation inputs are observable or unobservable. These levels are:
| · | Level 1 – Quoted prices in active markets for identical investments. Level 1 may include exchange traded instruments, such as domestic equities, some foreign equities, options, futures, mutual funds, exchange traded funds, rights and warrants. |
| · | Level 2 – Observable inputs other than Level 1 prices, such as quoted prices for similar investments; quoted prices in markets that are not active; or other inputs that are observable or can be corroborated by observable market data. Level 2 may include debt investments that are traded less frequently than exchange traded instruments and which are valued using independent pricing services; foreign equities, which are principally traded on certain foreign markets and are adjusted daily pursuant to a fair value pricing service in order to reflect an adjustment for the factors occurring after the close of certain foreign markets but before the NYSE Close; and short-term investments, which are valued at amortized cost. |
| · | Level 3 – Significant unobservable inputs that are supported by limited or no market activity. Level 3 may include financial instruments whose values are determined using indicative market quotes or require significant management judgment or estimation. These unobservable valuation inputs may include estimates for current yields, maturity/duration, prepayment speed, and indicative market quotes for comparable investments along with other assumptions relating to credit quality, collateral value, complexity of the investment structure, general market conditions and liquidity. This category may include investments where trading has been halted or there are certain restrictions on trading. While these investments are priced using unobservable inputs, the |
| 24 |
valuation of these investments reflects the best available data and management believes the prices are a reasonable representation of exit price.
The Board of Directors of the Company generally reviews and approves the “Procedures for Valuation of Portfolio Securities” on an annual basis. These procedures define how investments are to be valued, including the formation of a Valuation Committee. The Valuation Committee is responsible for determining in good faith the fair value of investments when the value cannot be obtained from primary pricing services or alternative sources or if the valuation of an investment as provided by the primary pricing service or alternative source is believed not to reflect the investment’s fair value as of the Valuation Date. Members of the Valuation Committee include the Fund’s Treasurer or designee, a Vice President of the Funds with legal expertise or designee, and a Vice President of the investment manager or designee. In addition, the Fund’s chief compliance officer shall designate a member of the compliance group to attend Valuation Committee meetings as a non-voting resource, to monitor for and provide guidance with respect to compliance with these procedures. Two members of the Valuation Committee or their designees, representing different departments, shall constitute a quorum for purposes of permitting the Valuation Committee to take action. The Valuation Committee will consider all relevant factors in determining an investment’s fair value, and may seek the advice of the Fund’s sub-adviser, knowledgeable brokers and legal counsel in making such determination. The Valuation Committee reports to the Audit Committee of the Company’s Board of Directors. The Audit Committee receives quarterly written reports which include details of all fair-valued investments, including the reason for the fair valuation, and an indication, when possible, of the accuracy of the valuation by disclosing the next available reliable public price quotation or the disposition price of such investments (the “look-back” test). The Board of Directors then must consider for ratification all of the fair value determinations made during the previous quarter.
Valuation levels are not necessarily indicative of the risk associated with investing in such investments. Individual investments within any of the above mentioned asset classes may be assigned a different hierarchical level than those presented above, as individual circumstances dictate.
For additional information, refer to the Investment Valuation Hierarchy Level Summary and the Level 3 roll-forward reconciliation which follow the Schedule of Investments.
For purposes of reporting transfers between different hierarchy levels, both transfers in and out of each level, as applicable, are shown as if they occurred at the beginning of the period.
| c) | Investment Transactions and Investment Income – Investment transactions are recorded as of the trade date (the date the order to buy or sell is executed) for financial reporting purposes. Investments purchased or sold on a when-issued or delayed-delivery basis may be settled a month or more after the trade date. Realized gains and losses are determined on the basis of identified cost. |
Dividend income is recorded on the ex-dividend date, except certain dividends from foreign investments where the ex-dividend date may have passed are recorded as soon as the Fund is informed of the dividend. Interest income, including amortization of premium and accretion of discounts, is accrued on a daily basis. Paydown gains and losses on mortgage-related and other asset-backed securities are included in interest income in the Statement of Operations.
| d) | Joint Trading Account – The Fund may invest cash balances into a joint trading account that may be invested in one or more repurchase agreements. |
| e) | Fund Share Valuation and Dividend Distributions to Shareholders – Orders for the Fund’s shares are executed in accordance with the investment instructions of the contract holders. The NAV of the Fund’s shares is determined as of the close of business on each business day of the Exchange. The NAV is determined by dividing the Fund’s net assets by the number of shares outstanding. |
| 25 |
| Hartford Portfolio Diversifier HLS Fund |
| Notes to Financial Statements – (continued) |
| June 30, 2012 (Unaudited) |
| (000’s Omitted) |
Orders for the purchase of the Fund’s shares received prior to the close of the Exchange on any day the Exchange is open for business are priced at the NAV determined as of the close of the Exchange. Orders received after the close of the Exchange, or on a day on which the Exchange and/or the Fund is not open for business, are priced at the next determined NAV.
Dividends are declared pursuant to a policy adopted by the Company’s Board of Directors based upon the investment performance of the Fund. The policy of the Fund is to pay dividends from net investment income and realized capital gains, if any, at least once a year.
Distributions from net investment income, net realized capital gains and capital are determined in accordance with federal income tax regulations, which may differ from U.S. GAAP with respect to character and timing. These differences may include but are not limited to losses deferred due to wash sale adjustments, foreign currency gains and losses, adjustments related to Passive Foreign Investment Companies (“PFICs”), Real Estate Investment Trusts (“REITs”), Regulated Investment Companies (“RICs”), certain derivatives and partnerships. Permanent book and federal income tax basis differences relating to shareholder distributions will result in reclassifications to certain of the Fund’s capital accounts (see Federal Income Taxes: Reclassification of Capital Accounts note).
| 3. | Securities and Other Investments: |
| a) | Repurchase Agreements – A repurchase agreement is an agreement by which a counterparty agrees to sell an investment and agrees to repurchase the investment sold at a mutually agreed upon time and price. At the time the Fund enters into a repurchase agreement, the value of the underlying collateral, including accrued interest, will be equal to or exceed the value of the repurchase agreement. Repurchase agreements expose the Fund to counterparty risk. To minimize counterparty risk, the investments that serve to collateralize the repurchase agreement are held by the Fund’s custodian in book entry or physical form in the custodial account of the Fund or in a third party custodial account. Repurchase agreements are valued at cost plus accrued interest. The Fund, as shown on the Schedule of Investments, had outstanding repurchase agreements as of June 30, 2012. |
| b) | Illiquid and Restricted Investments – The Fund is permitted to invest up to 15% of its net assets in illiquid investments. Illiquid investments are those that may not be sold or disposed of in the ordinary course of business within seven days, at approximately the price used to determine the Fund’s NAV. The Fund may not be able to sell illiquid investments when its sub-adviser considers it desirable to do so or may have to sell such investments at a price that is lower than the price that could be obtained if the investments were more liquid. A sale of illiquid investments may require more time and may result in higher dealer discounts and other selling expenses than does the sale of those that are liquid. Illiquid investments also may be more difficult to value due to the unavailability of reliable market quotations for such investments, and an investment in them may have an adverse impact on the Fund’s NAV. The Fund may also purchase certain restricted investments that can only be resold to certain qualified investors and may be determined to be liquid pursuant to policies and guidelines established by the Company’s Board of Directors. The Fund, as shown on the Schedule of Investments, had illiquid and/or restricted investments as of June 30, 2012. |
| c) | Investments Purchased on a When-Issued or Delayed-Delivery Basis – Delivery and payment for investments that have been purchased by the Fund on a forward commitment, or when-issued or delayed-delivery basis, take place beyond the customary settlement period. A fund may dispose of or renegotiate a delayed-delivery transaction after it is entered into, and may sell delayed-delivery investments before they are delivered, which may result in a realized gain or loss. During this period, such investments are subject to market fluctuations, and the Fund identifies investments segregated in its records with a value at least equal to the amount of the commitment. The Fund, as shown on the Schedule of Investments, had when-issued or delayed delivery investments as of June 30, 2012. |
| d) | Mortgage Related and Other Asset Backed Securities – The Fund may invest in mortgage related and other asset backed securities. These securities include mortgage pass-through securities, collateralized mortgage obligations, commercial |
| 26 |
mortgage backed securities, stripped mortgage backed securities, asset backed securities, collateralized debt obligations and other securities that directly or indirectly represent a participation in, or are secured by and payable from, mortgage loans on real property. Mortgage related securities are created from pools of residential or commercial mortgage loans, including mortgage loans made by savings and loan institutions, mortgage bankers, commercial banks and others. Asset backed securities are created from many types of assets, including auto loans, credit card receivables, home equity loans, and student loans. These securities provide a monthly payment which consists of both interest and principal payments. Interest payments may be determined by fixed or adjustable rates. The rate of pre-payments on underlying mortgages will affect the price and volatility of a mortgage related security, and may have the effect of shortening or extending the effective duration of the security relative to what was anticipated at the time of purchase. The timely payment of principal and interest of certain mortgage related securities is guaranteed by the full faith and credit of the United States Government. Pools created and guaranteed by non-governmental issuers, including government-sponsored corporations, may be supported by various forms of insurance or guarantees, but there can be no assurance that the private insurers or guarantors can meet their obligations under the insurance policies or guarantee arrangements. The Fund, as shown on the Schedule of Investments, had mortgage related and other asset backed securities as of June 30, 2012.
| 4. | Financial Derivative Instruments: |
The following disclosures contain information on how and why the Fund uses derivative instruments, the credit-risk-related contingent features in certain derivative instruments, and how derivative instruments affect the Fund’s financial position and results of operations. The location and fair value amounts of these instruments on the Statement of Assets and Liabilities and the realized gains and losses and changes in unrealized gains and losses on the Statement of Operations, each categorized by type of derivative contract, are included in the following Additional Derivative Instrument Information footnote. The derivative instruments outstanding as of period-end are disclosed in the notes to the Schedule of Investments and the amounts of realized gains and losses and changes in unrealized gains and losses on derivative instruments during the period are disclosed in the Statement of Operations.
| a) | Futures Contracts – The Fund may enter into futures contracts. A futures contract is an agreement between two parties to buy or sell an asset at a set price on a future date. The Fund uses futures contracts to manage or obtain exposure to the investment markets, commodities, or movements in interest rates. The primary risks associated with the use of futures contracts are the imperfect correlation between the change in market value of the investments held by the Fund and the prices of futures contracts and the possibility of an illiquid market. Upon entering into a futures contract, the Fund is required to deposit with a futures commission merchant (“FCM”) an amount of cash or U.S. Government or Agency Obligations in accordance with the initial margin requirements of the broker or exchange. Futures contracts are marked to market daily at the most recent settlement price reported by an exchange on which, over time, they are traded most extensively, and an appropriate payable or receivable for the change in value (“variation margin”) is recorded by the Fund. Gains or losses are recognized but not considered realized until the contracts expire or are closed. Futures contracts involve, to varying degrees, risk of loss in excess of the variation margin disclosed on the Statement of Assets and Liabilities; however, this risk is reduced through the use of an FCM. The Fund, as shown on the Schedule of Investments, had outstanding futures contracts as of June 30, 2012. |
| b) | Options Contracts – An option contract is a contract sold by one party to another party that offers the buyer the right, but not the obligation, to buy (call) or sell (put) an investment or other financial asset at an agreed-upon price during a specific period of time or on a specific date. The Fund may write (sell) covered call and put options on futures, swaps (“swaptions”), securities or commodities. “Covered” means that so long as the Fund is obligated as the writer of an option, it will own either the underlying investments or currency or an option to purchase the same underlying investments or currency having an expiration date of the covered option and an exercise price equal to or less than the exercise price of the covered option, or will pledge cash or other liquid investments having a value equal to or greater than the fluctuating market value of the option investment or currency. Writing put options increases the Fund’s exposure to the underlying instrument. Writing call options decreases the Fund’s exposure to the underlying instrument. Premiums received from writing options that expire are treated as realized gains. Premiums received from writing options that are exercised or closed are added to the proceeds or offset amounts paid on the underlying futures, swap, |
| 27 |
| Hartford Portfolio Diversifier HLS Fund |
| Notes to Financial Statements – (continued) |
| June 30, 2012 (Unaudited) |
| (000’s Omitted) |
investment or currency transaction to determine the realized gain or loss. The Fund as a writer of an option has no control over whether the underlying instrument may be sold (call) or purchased (put) and as a result bears the market risk of an unfavorable change in the price of the instrument underlying the written option. There is the risk the Fund may not be able to enter into a closing transaction because of an illiquid market. The Fund may also purchase put and call options. Purchasing call options increases the Fund’s exposure to the underlying instrument. Purchasing put options decreases the Fund’s exposure to the underlying instrument. The Fund pays a premium, which is included on the Fund’s Statement of Assets and Liabilities as an investment and is subsequently marked to market to reflect the current value of the option. Premiums paid for purchasing options that expire are treated as realized losses. Certain options may be purchased with premiums to be determined on a future date. The premiums for these options are based upon implied volatility parameters at specified terms. The risk associated with purchasing put and call options is generally limited to the premium paid. Premiums paid for purchasing options that are exercised or closed are added to the amounts paid or offset against the proceeds on the underlying investment transaction to determine the realized gain or loss. Entering into over-the-counter options also exposes the Fund to counterparty risk. Counterparty risk is the possibility that the counterparty to the agreements may default on its obligation to perform or disagree as to the meaning of the contractual terms in the agreements. The Fund, as shown on the Schedule of Investments, had outstanding purchased options contracts as of June 30, 2012. There were no transactions involving written options contracts during the six-month period ended June 30, 2012.
| Options Contract Activity During the Six-month Period Ended June 30, 2012 | ||||||||
| Put Options Written During the Period | Number of Contracts* | Premium Amounts | ||||||
| Beginning of the period | 97,255 | $ | 13,218 | |||||
| Written | — | — | ||||||
| Expired | — | — | ||||||
| Closed | — | — | ||||||
| Exercised | — | — | ||||||
| End of period | 97,255 | $ | 13,218 | |||||
| * The number of contracts does not omit 000's. | ||||||||
| c) | Additional Derivative Instrument Information: |
Fair Values of Derivative Instruments on the Statement of Assets and Liabilities as of June 30, 2012:
| Risk Exposure Category | ||||||||||||||||||||||||||||
| Interest Rate Contracts | Foreign Exchange Contracts | Credit Contracts | Equity Contracts | Commodity Contracts | Other Contracts | Total | ||||||||||||||||||||||
| Liabilities: | ||||||||||||||||||||||||||||
| Variation margin payable * | $ | — | $ | — | $ | — | $ | 3,268 | $ | — | $ | — | $ | 3,268 | ||||||||||||||
| Written options, market value | — | — | — | 11,018 | — | — | 11,018 | |||||||||||||||||||||
| Total | $ | — | $ | — | $ | — | $ | 14,286 | $ | — | $ | — | $ | 14,286 | ||||||||||||||
| * | Only current day's variation margin is reported within the Statement of Assets and Liabilities. The variation margin is included in the open futures cumulative appreciation (depreciation) of $(4,485) as reported in the Schedule of Investments. |
The volume of derivatives that is presented in the Schedule of Investments is consistent with the derivative activity during the six-month period ended June 30, 2012.
| 28 |
The effect of Derivative Instruments on the Statement of Operations for the six-month period ended June 30, 2012:
| Risk Exposure Category | ||||||||||||||||||||||||||||
| Interest Rate Contracts | Foreign Exchange Contracts | Credit Contracts | Equity Contracts | Commodity Contracts | Other Contracts | Total | ||||||||||||||||||||||
| Realized Gain (Loss) on Derivatives Recognized as a Result of Operations: | ||||||||||||||||||||||||||||
| Net realized gain on futures | $ | — | $ | — | $ | — | $ | 106 | $ | — | $ | — | $ | 106 | ||||||||||||||
| Total | $ | — | $ | — | $ | — | $ | 106 | $ | — | $ | — | $ | 106 | ||||||||||||||
| Net Change in Unrealized Appreciation (Depreciation) on Derivatives Recognized as a Result of Operations: | ||||||||||||||||||||||||||||
| Net change in unrealized depreciation of investments in purchased options | $ | — | $ | — | $ | — | $ | (8,314 | ) | $ | — | $ | — | $ | (8,314 | ) | ||||||||||||
| Net change in unrealized depreciation of futures | — | — | — | (4,533 | ) | — | — | (4,533 | ) | |||||||||||||||||||
| Net change in unrealized appreciation of written options | — | — | — | 4,221 | — | — | 4,221 | |||||||||||||||||||||
| Total | $ | — | $ | — | $ | — | $ | (8,626 | ) | $ | — | $ | — | $ | (8,626 | ) | ||||||||||||
| 5. | Principal Risks: |
| a) | Credit and Counterparty Risks – Credit risk depends largely on the perceived financial health of bond issuers. In general, the credit rating is inversely related to the credit risk of the issuer. Higher rated bonds generally are deemed to have less credit risk, while lower or unrated bonds are deemed to have higher risk of default. The share price, yield and total return of a fund that holds securities with higher credit risk may be more volatile than those of a fund that holds bonds with lower credit risk. Similar to credit risk, the Fund may be exposed to counterparty risk, or the risk that an institution or other entity with which the Fund has unsettled or open transactions will default. |
| b) | Market Risks – The Fund’s investments expose the Fund to various risks including, but not limited to, interest rate, prepayment, extension, and equity risks. Interest rate risk is the risk that fixed income securities will decline in value because of changes in interest rates. As nominal interest rates rise, the values of certain fixed income securities held by the Fund are likely to decrease. A nominal interest rate can be described as the sum of a real interest rate and an expected inflation rate. Fixed income securities with longer durations tend to be more sensitive to changes in interest rates, usually making them more volatile than securities with shorter durations. Duration is useful primarily as a measure of the sensitivity of a fixed income security’s market price to interest rate (i.e., yield) movements. In addition, securities are subject to extension risk. Rising interest rates may cause prepayments to occur at a slower than expected rate, thereby effectively lengthening the maturity of the security and making the security more sensitive to interest rate changes. Prepayment and extension risk are major risks of mortgage-backed securities and certain asset-backed securities. For certain asset-backed securities, the actual maturity may be less than the stated maturity shown in the Schedule of Investments, if applicable. As a result, the timing of income recognition relating to these securities may vary based upon the actual maturity. The market values of equity securities, such as common stocks and preferred stocks, or equity related investments, such as futures and options, may decline due to general market conditions which are not specifically related to a particular company, such as real or perceived adverse economic conditions, changes in the general outlook for corporate earnings, changes in interest or currency rates or adverse investor sentiment generally. The market value of equity securities may also decline due to factors which affect a particular industry or industries, such as labor shortages or increased production costs and competitive conditions within an industry. Equity securities and equity related investments generally have greater market price volatility than fixed income securities. |
| 6. | Federal Income Taxes: |
| a) | Federal Income Taxes – For federal income tax purposes, the Fund intends to continue to qualify as a RIC under Subchapter M of the Internal Revenue Code (“IRC”) by distributing substantially all of its taxable net investment income and net realized capital gains to its shareholders and otherwise complying with the requirements of RICs. The Fund has distributed substantially all of its income and capital gains in prior years, if applicable, and intends to distribute |
| 29 |
| Hartford Portfolio Diversifier HLS Fund |
| Notes to Financial Statements – (continued) |
| June 30, 2012 (Unaudited) |
| (000’s Omitted) |
substantially all of its income and capital gains prior to the next fiscal year-end. Accordingly, no provision for federal income or excise taxes has been made in the accompanying financial statements. Distributions from short-term capital gains are treated as ordinary income distributions for federal income tax purposes.
| b) | Net Investment Income (Loss), Net Realized Gains (Losses) – Net investment income (loss) and net realized gains (losses) may differ for financial statement and tax purposes primarily because of losses deferred due to wash sale adjustments, foreign currency gains and losses, adjustments related to PFICs, REITs, RICs, certain derivatives and partnerships. The character of distributions made during the year from net investment income or net realized gains may differ from their ultimate characterization for federal income tax purposes. Also, due to the timing of dividend distributions, the fiscal year in which amounts are distributed may differ from the year that the income or realized gains (losses) were recorded by the Fund. |
| c) | Distributions and Components of Distributable Earnings – The tax character of distributions paid by the Fund for the periods indicated is as follows (as adjusted for dividends payable): |
| For the Period June 6, 2011 (Commencement of Operations) through December 31, 2011 | ||||
| Ordinary Income | $ | 486 | ||
| Long-Term Capital Gains* | 57 | |||
| * | The Fund designates these distributions as long-term capital dividends pursuant to IRC Sec. 852(b)(3)(C). |
As of December 31, 2011, the Fund’s components of distributable earnings (deficit) on a tax basis were as follows:
| Amount | ||||
| Accumulated Capital and Other Losses | $ | (374 | ) | |
| Unrealized Appreciation* | 876 | |||
| Total Accumulated Earnings | $ | 502 | ||
| * | The difference between book-basis and tax-basis unrealized appreciation (depreciation) may be attributable to the losses deferred due to wash sale adjustments, foreign currency gains and losses, adjustments related to PFICs, REITs, RICs, certain derivatives and partnerships. |
| d) | Reclassification of Capital Accounts – The Fund may record reclassifications in its capital accounts. These reclassifications have no impact on the total net assets of the Fund. The reclassifications are a result of permanent differences between U.S. GAAP and tax accounting for such items as foreign currency, PFICs, expiration or utilization of capital loss carryforwards or net operating losses. Adjustments are made to reflect the impact these items have on current and future distributions to shareholders. Therefore, the source of the Fund’s distributions may be shown in the accompanying Statement of Changes in Net Assets as from undistributed net investment income, from accumulated net realized gains on investments or from capital depending on the type of book and tax differences that exist. For the year ended December 31, 2011, the Fund recorded reclassifications to increase (decrease) the accounts listed below: |
| Amount | ||||
| Undistributed Net Investment Income | $ | 107 | ||
| Accumulated Net Realized Gain (Loss) | (71 | ) | ||
| Capital Stock and Paid-in-Capital | (36 | ) | ||
| 30 |
| e) | Capital Loss Carryforward – On December 22, 2010, the Regulated Investment Company Modernization Act of 2010 (the “Act”) was enacted, which made changes to the capital loss carryforward rules. The changes are effective for taxable years beginning after the date of enactment. Under the Act, funds are permitted to carry forward capital losses for an unlimited period. Additionally, capital loss carryforwards retain their character as either short-term or long-term capital losses rather than being considered all short-term as permitted under prior regulation. |
The Fund had no capital loss carryforward for U.S. federal income tax purposes as of December 31, 2011.
As of December 31, 2011, the Fund elected to defer the following post-October losses:
| Amount | ||||
| Ordinary Income | $ | 374 | ||
| f) | Accounting for Uncertainty in Income Taxes – The Fund has adopted financial reporting rules that require the Fund to analyze all open tax years, as defined by the statute of limitations, for all major jurisdictions. Generally, tax authorities can examine all tax returns filed for the last three years. The Fund does not have an examination in progress. |
The Fund has reviewed all open tax years and major jurisdictions and concluded that these financial reporting rules had no effect on the Fund’s financial position or results of operations. There is no tax liability resulting from unrecognized tax benefits relating to uncertain income tax positions taken or expected to be taken on the tax return for the fiscal year ended December 31, 2011. The Fund is also not aware of any tax positions for which it is reasonably possible that the total amounts of unrecognized tax benefits will significantly change in the next twelve months.
| 7. | Expenses: |
| a) | Investment Management Agreement – HL Investment Advisors, LLC (“HL Advisors”), an indirect wholly owned subsidiary of The Hartford Financial Services Group, Inc. (“The Hartford”), serves as investment manager to the Fund pursuant to an Investment Management Agreement with the Company. As investment manager, HL Advisors has overall investment supervisory responsibility for the Fund. In addition, HL Advisors provides administrative personnel, services, equipment, facilities and office space for proper operation of the Fund. HL Advisors has contracted with Hartford Investment Management Company (“Hartford Investment Management”) under a sub-advisory agreement for the provision of day-to-day investment management services to the Fund in accordance with the Fund’s investment objective and policies. The Fund pays a fee to HL Advisors, a portion of which may be used to compensate Hartford Investment Management. |
The schedule below reflects the rates of compensation paid to HL Advisors for investment management services rendered as of June 30, 2012; the rates are accrued daily and paid monthly.
| Average Daily Net Assets | Annual Fee | |||
| On first $500 million | 0.60 | % | ||
| On next $500 million | 0.55 | % | ||
| On next $4 billion | 0.50 | % | ||
| On next $5 billion | 0.48 | % | ||
| Over $10 billion | 0.47 | % | ||
| 31 |
| Hartford Portfolio Diversifier HLS Fund |
| Notes to Financial Statements – (continued) |
| June 30, 2012 (Unaudited) |
| (000’s Omitted) |
| b) | Accounting Services Agreement – Pursuant to the Fund Accounting Agreement between HLIC and the Company, on behalf of the Fund, HLIC provides accounting services to the Fund and receives monthly compensation based on the Fund’s average daily net assets at the rates set forth below. The Fund’s accounting services fees are accrued daily and paid monthly. |
| Average Daily Net Assets | Annual Fee | |||
| On first $5 billion | 0.018 | % | ||
| On next $5 billion | 0.016 | % | ||
| Over $10 billion | 0.014 | % | ||
| c) | Operating Expenses – Allocable expenses incurred by the Company are allocated to each Fund in proportion to the average daily net assets of the Fund, except where allocation of certain expenses is more fairly made directly to the Fund. HL Advisors has contractually agreed to reimburse expenses (exclusive of taxes, interest expense, brokerage commissions, acquired fund fees and expenses and extraordinary expenses) to the extent necessary to maintain total annual operating expenses for the Class IB shares of the Fund at the annual rate of 0.85% of the Fund’s average daily net assets. This contractual arrangement will remain in effect until April 30, 2013, and shall renew automatically for one-year terms unless HL Advisors provides written notice of termination prior to the start date of the next term or upon approval of the Board of Directors of the Company. |
| d) | Distribution Plan for Class IB shares – The Company, on behalf of the Fund, has adopted a Distribution Plan pursuant to Rule 12b-1 of the 1940 Act to compensate the Distributor, Hartford Securities Distribution Company, Inc. (a wholly owned, ultimate subsidiary of The Hartford), from assets attributable to the Class IB shares for services rendered and expenses borne in connection with activities primarily intended to result in the sale of the Class IB shares, subject to the review and approval of the Company’s Board of Directors. |
The Distribution Plan provides that the Fund may pay annually up to 0.25% of the average daily net assets of the Fund attributable to its Class IB shares for activities primarily intended to result in the sale of Class IB shares. The Board has the authority to suspend or reduce these payments at any point in time. Under the terms of the Distribution Plan and the principal underwriting agreement, the Fund is authorized to make payments monthly to the Distributor that may be used to pay or compensate entities providing distribution and shareholder servicing with respect to the Class IB shares for such entities’ fees or expenses incurred or paid in that regard. These fees are accrued daily and paid monthly.
| e) | Other Related Party Transactions – Certain officers of the Fund are directors and/or officers of HL Advisors and/or The Hartford or its subsidiaries. For the six-month period ended June 30, 2012, a portion of the Fund’s chief compliance officer’s salary was paid by all the investment companies in the Hartford fund complex. The portion allocated to the Fund rounds to zero. These fees are accrued daily and paid monthly. |
| 8. | Affiliate Holdings: |
As of June 30, 2012, affiliates of The Hartford had ownership of shares in the Fund as follows:
| Shares | Percentage of Class | |||||||
| Class IB | 6,031 | 27 | % | |||||
| 32 |
| 9. | Investment Transactions: |
For the six-month period ended June 30, 2012, the cost of purchases and proceeds from sales of investment securities (excluding short-term investments) were as follows:
| Amount | ||||
| Cost of Purchases Excluding U.S. Government Obligations | $ | 76,183 | ||
| Sales Proceeds Excluding U.S. Government Obligations | 40,005 | |||
| Cost of Purchases for U.S. Government Obligations | 21,051 | |||
| Sales Proceeds for U.S. Government Obligations | 9,284 | |||
| 10. | Industry Classifications: |
Other than the industry classifications “Other Investment Pools and Funds” and “Exchange Traded Funds,” equity industry classifications used in this report are the Global Industry Classification Standard, which was developed by and is the exclusive property and service mark of MSCI, Inc. and Standard & Poor’s.
| 11. | Indemnifications: |
Under the Company’s organizational documents, the Company shall indemnify its officers and directors to the full extent required or permitted under Maryland General Corporation Law and the federal securities laws. In addition, the Company, on behalf of the Fund, may enter into contracts that contain a variety of indemnifications. The Company’s maximum exposure under these arrangements is unknown. However, as of the date of these financial statements, the Company has not had prior claims or losses pursuant to these contracts and expects the risk of loss to be remote.
| 33 |
| Hartford Portfolio Diversifier HLS Fund |
| Financial Highlights |
| - Selected Per-Share Data (A) - |
| Class | Net Asset Value at Beginning of Period | Net Investment Income (Loss) | Payments from (to) Affiliate | Net Realized and Unrealized Gain (Loss) on Investments | Total from Investment Operations | Dividends from Net Investment Income | Distributions from Realized Capital Gains | Distributions from Capital | Total Distributions | Net Increase (Decrease) in Net Asset Value | Net Asset Value at End of Period | |||||||||||||||||||||||||||||||||||
| For the Six-Month Period Ended June 30, 2012 (Unaudited) | ||||||||||||||||||||||||||||||||||||||||||||||
| IB | $ | 10.18 | $ | 0.01 | $ | – | $ | (0.50 | ) | $ | (0.49 | ) | $ | – | $ | – | $ | – | $ | – | $ | (0.49 | ) | $ | 9.69 | |||||||||||||||||||||
| From June 6, 2011 (commencement of operations) through December 31, 2011 (E) | ||||||||||||||||||||||||||||||||||||||||||||||
| IB(F) | 10.00 | 0.04 | – | 0.19 | 0.23 | (0.03 | ) | (0.02 | ) | – | (0.05 | ) | 0.18 | 10.18 | ||||||||||||||||||||||||||||||||
| (A) | Information presented relates to a share outstanding throughout the indicated period. |
| (B) | The figures do not include sales charges or other fees which may be applied at the variable annuity product level. Any such additional sales charges or other fees would lower the Fund's performance. |
| (C) | Not annualized. |
| (D) | Annualized. |
| (E) | Per share amounts have been calculated using the average shares method. |
| (F) | Commenced operations on June 6, 2011. |
| 34 |
| - Ratios and Supplemental Data - |
| Total Return(B) | Net Assets at End of Period | Ratio of Expenses to Average Net Assets Before Waivers | Ratio of Expenses to Average Net Assets After Waivers | Ratio of Net Investment Income (Loss) to Average Net Assets | Portfolio Turnover Rate | |||||||||||||||||
| (4.89 | )%(C) | $ | 213,764 | 0.91 | %(D) | 0.85 | %(D) | 0.31 | %(D) | 44 | % | |||||||||||
| 2.38 | (C) | 106,581 | 0.93 | (D) | 0.85 | (D) | 0.58 | (D) | 43 | |||||||||||||
| 35 |
| Hartford Portfolio Diversifier HLS Fund |
| Directors and Officers (Unaudited) |
The Board of Directors of the Company appoints officers who are responsible for the day-to-day operations of the Fund and who execute policies formulated by the Directors. Each director serves until his or her death, resignation, or retirement or until the next annual meeting of shareholders is held or until his or her successor is elected and qualifies.
Directors and officers who are employed by or who have a financial interest in The Hartford are considered “interested” persons of the Fund pursuant to the 1940 Act. Each officer and two of the Company’s directors, as noted in the chart below, are “interested” persons of the Fund. Each director serves as a director for The Hartford Mutual Funds, Inc., The Hartford Mutual Funds II, Inc., Hartford Series Fund, Inc., Hartford HLS Series Fund II, Inc., and as a trustee for The Hartford Alternative Strategies Fund, which, as of June 30, 2012, collectively consist of 89 funds. Correspondence may be sent to directors and officers c/o Hartford Mutual Funds, P.O. Box 2999, Hartford, Connecticut 06104-2999, except that correspondence to Mr. Annoni, Mr. Dressen and Ms. Fagely may be sent to 500 Bielenberg Drive, Woodbury, Minnesota 55125.
The table below sets forth, for each director and officer, his or her name, year of birth, current position with the Company and date first elected or appointed to Hartford Series Fund, Inc. (“HSF”), and Hartford HLS Series Fund II, Inc. (“HSF2”), principal occupation, and, for directors, other directorships held. The Fund’s statement of additional information contains further information on the directors and is available free of charge by calling 1-800-862-6668 or writing to Hartford HLS Funds, c/o Individual Annuity Services, P.O. Box 5085, Hartford, CT 06102-5085.
Information on the aggregate remuneration paid to the directors of the Company can be found in the Statement of Operations herein. The Fund pays to The Hartford a portion of the Chief Compliance Officer’s compensation, but does not pay salaries or compensation to any of their other officers or directors who are employed by The Hartford.
Non-Interested Directors
Lynn S. Birdsong (1946) Director since 2003, Co-Chairman of the Investment Committee
Mr. Birdsong is a private investor. Mr. Birdsong currently serves as a Director of the Sovereign High Yield Investment Company (April 2010 to current). Mr. Birdsong currently serves as an Independent Director of Nomura Partners Funds, Inc. (formerly, The Japan Fund) (March 2003 to current). From 1979 to 2002, Mr. Birdsong was a managing director of Zurich Scudder Investments, an investment management firm. During his employment with Scudder, Mr. Birdsong was an Interested Director of The Japan Fund. Since 1981, Mr. Birdsong has been a partner in Birdsong Company, an advertising specialty firm.
Robert M. Gavin, Jr. (1940) Director since 2002 (HSF) and 1986 (HSF2), Chairman of the Board since 2004
Dr. Gavin is an educational consultant. Prior to September 1, 2001, he was President of Cranbrook Education Community and prior to July 1996, he was President of Macalester College, St. Paul, Minnesota.
Duane E. Hill (1945) Director since 2001 (HSF) and 2002 (HSF2), Chairman of the Nominating Committee
Mr. Hill is Partner of TSG Ventures L.P., a private equity investment company. Mr. Hill is a former partner of TSG Capital Group, a private equity investment firm that served as sponsor and lead investor in leveraged buyouts of middle market companies.
Sandra S. Jaffee (1941) Director since 2005
Ms. Jaffee is the founder and Chief Executive Officer of a private company, Homeworks Concierge, LLC, which provides residential property management services in Westchester County, New York (January 2012 to present). Ms. Jaffee served as Chairman (2008 to 2009) and Chief Executive Officer of Fortent (formerly Searchspace Group), a leading provider of compliance/regulatory technology to financial institutions from August 2005 to August 2009. Ms. Jaffe currently serves as a member of the Board of Directors of Broadridge Financial Solutions as well as a Trustee of Muhlenberg College.
William P. Johnston (1944) Director since 2005, Chairman of the Compliance Committee
In June 2006, Mr. Johnston was appointed as Senior Advisor to The Carlyle Group, a global private equity investment firm. In August 2007, Mr. Johnston was elected to the Board of Directors of LifeCare Holdings, Inc. In February 2008, Mr. Johnston was elected to the Board of Directors of HCR-ManorCare, Inc. In May 2006, Mr. Johnston was elected to the Supervisory Board of Fresenius Medical Care AG & Co. KGaA, after its acquisition of Renal Care Group, Inc. in March 2006.
Phillip O. Peterson (1944) Director since 2002 (HSF) and 2000 (HSF2), Chairman of the Audit Committee
Mr. Peterson is a mutual fund industry consultant. He was a partner of KPMG LLP (an accounting firm) until July 1999. Mr. Peterson joined William Blair Funds in February 2007 as a member of the Board of Trustees. Mr. Peterson also joined the Board of Trustees of Symetra Variable Mutual Funds Trust as a trustee in February 2012.
| 36 |
Lemma W. Senbet (1946) Director since 2005
Dr. Senbet is the William E. Mayer Chair Professor of Finance and Director, Center for Financial Policy, at the University of Maryland, Robert H. Smith School of Business. He was chair of the Finance Department from 1998 to 2006. Previously he was a chaired professor of finance at the University of Wisconsin-Madison. Also, he was director of the Fortis Funds from March 2000 to July 2002. Dr. Senbet served the finance profession in various capacities, including as director of the American Finance Association and President of the Western Finance Association. In 2006, Dr. Senbet was inducted Fellow of Financial Management Association International for his career-long distinguished scholarship and professional service.
Interested Directors and Officers
David N. Levenson (1966) Director since 2010(1)
Mr. Levenson currently serves as President of The Hartford’s Wealth Management business. He was appointed to this role in July 2010. Previously, Mr. Levenson served as Executive Vice President of Legacy Holdings for The Hartford from June 2009 to July 2010. From 2006 to 2009, Mr. Levenson was with Hartford Life Insurance K.K. where he served as President and Chief Executive Officer from 2007 to 2009. He served as Managing Director of Hartford Investment Management Company from 2005 to 2006. Additionally, Mr. Levenson serves as Executive Vice President of The Hartford and as President, Director and Chief Executive Officer of Hartford Life Insurance Company (“HLIC”) and Hartford Life, Inc. (“HL Inc.”).
(1) Mr. Levenson served as Interested Director until August 2, 2012.
Lowndes A. Smith (1939) Director since 1996 (HSF) and 2002 (HSF2), Co-Chairman of the Investment Committee
Mr. Smith served as Vice Chairman of The Hartford from February 1997 to January 2002, as President and Chief Executive Officer of HL Inc. from February 1997 to January 2002, and as President and Chief Operating Officer of The Hartford Life Insurance Companies from January 1989 to January 2002. Mr. Smith serves as a Director of White Mountains Insurance Group, Ltd., One Beacon Insurance and Symetra Financial and as Managing Director of Whittington Gray Associates.
Other Officers
James E. Davey (1964) President and Chief Executive Officer since 2010(2)
Mr. Davey serves as Executive Vice President of HLIC. Additionally, Mr. Davey serves as President, Chief Executive Officer and Manager of HIFSCO and President, Chief Executive Officer and Manager of HL Investment Advisors, LLC (“HL Advisors”). Mr. Davey joined The Hartford in 2002.
(2) Mr. Davey became an Interested Director effective August 2, 2012.
Mark A. Annoni (1964) Vice President, Controller and Treasurer since 2012(3)
Mr. Annoni serves as the Assistant Vice President and Director of Investment Finance (February 2004 to present). Mr. Annoni joined The Hartford in April 2001 as part of The Hartford’s acquisition of Fortis Financial Group. Prior to joining The Hartford, Mr. Annoni served as Manager of Mutual Fund Accounting at Fortis Financial Group (July 1997 to April 2001).
(3) Mr. Annoni was named Vice President, Controller and Treasurer on May 8, 2012.
Michael R. Dressen (1963) AML Compliance Officer since 2011
Mr. Dressen currently serves as Assistant Vice President of HLIC. He also serves as Chief Compliance Officer and AML Compliance Officer of Hartford Administrative Services Company (“HASCO”) and as Assistant Secretary and Compliance Officer of HIFSCO. Mr Dressen joined The Hartford in 2005 from State Farm Insurance Companies where he held various positions related to mutual funds, variable products, and property casualty insurance.
Tamara L. Fagely (1958) Vice President, since 2002 (HSF) and 1993 (HSF2)(4)
Ms. Fagely has been a Vice President of HASCO since 1998 and Chief Financial Officer since 2006. Currently Ms. Fagely is a Vice President of HLIC. She served as Assistant Vice President of HLIC from December 2001 through March 2005. In addition, Ms. Fagely is Controller and Chief Financial Officer of HIFSCO.
(4) Ms. Fagely served as Vice President, Controller and Treasurer until May 8, 2012.
Dr. Robert J. Froehlich (1953) Senior Managing Director since 2009(5)
Dr. Froehlich joined The Hartford as Senior Managing Director in September 2009. Prior to joining The Hartford, Dr. Froehlich served as Vice Chairman of Deutsche Asset Management from 1997-2009.
(5) Dr. Froehlich served as Senior Managing Director until March 26, 2012.
| 37 |
| Hartford Portfolio Diversifier HLS Fund |
| Directors and Officers (Unaudited) – (continued) |
Edward P. Macdonald (1967) Vice President, Secretary and Chief Legal Officer since 2005
Mr. Macdonald serves as Vice President of HLIC and Chief Legal Officer of Mutual Funds and Vice President of HIFSCO. He also serves as Vice President and Secretary of HASCO, and Chief Legal Officer, Secretary and Vice President of HL Advisors. Mr. Macdonald joined The Hartford in 2005.
Vernon J. Meyer (1964) Vice President since 2006
Mr. Meyer serves as Senior Vice President of HLIC. He also serves as Senior Vice President of HIFSCO and HL Advisors. Mr. Meyer joined The Hartford in 2004.
Colleen B. Pernerewski (1969) Vice President and Chief Compliance Officer since 2010
Ms. Pernerewski serves as Vice President and Chief Investment Advisor Compliance Officer of HIFSCO and as Vice President and Chief Compliance Officer of HL Advisors. Ms. Pernerewski serves as Vice President and Chief Compliance Officer of Individual Annuity of HLIC. Ms. Pernerewski joined The Hartford in 2005 from Travelers Life and Annuity where she served as Counsel (2004-2005). Prior to Travelers Life and Annuity, Ms. Pernerewski held the position of Counsel at The Hartford (1998-2004).
Elizabeth L. Schroeder (1966) Vice President since 2010
Ms. Schroeder currently serves as Assistant Vice President of HLIC. Ms. Schroeder joined HLIC in 1991. She is also an Assistant Vice President of HASCO, HIFSCO and HL Advisors.
Martin Swanson (1962) Vice President since 2010
Mr. Swanson is a Vice President of HLIC. Mr. Swanson also serves as Vice President/Marketing for HIFSCO. Prior to joining HLIC in 1998, Mr. Swanson was a Vice President at PaineWebber, Inc.
Jane Wolak (1961) Vice President since 2009
Ms. Wolak currently serves as Senior Vice President of HLIC. Ms. Wolak joined HLIC as Vice President, Retail Product Services in May 2007. She is also Vice President of HASCO. Previously, Ms. Wolak was with Sun Life Financial where she held the position of Vice President, Service Center Operations from 2001-2007.
HOW TO OBTAIN A COPY OF THE FUND’S PROXY VOTING POLICIES AND VOTING RECORDS (UNAUDITED)
A description of the policies and procedures that the Fund uses to determine how to vote proxies relating to portfolio securities and a record of how the Fund voted any proxies for the twelve-month period ended June 30, 2012 are available (1) without charge, upon request, by calling 800-862-6668 and (2) on the SEC’s website at http://www.sec.gov.
QUARTERLY PORTFOLIO HOLDINGS INFORMATION (UNAUDITED)
The Fund files a complete schedule of portfolio holdings with the SEC for the first and third quarters of each fiscal year on Form N-Q. The Fund’s Forms are available (1) without charge, upon request, by calling 800-862-6668 and (2) on the SEC’s website at http://www.sec.gov. The Form N-Q may be reviewed and copied at the SEC’s Public Reference Room in Washington, DC. Information on the operation of the Public Reference Room may be obtained by calling 1-800-SEC-0330.
| 38 |
| Hartford Portfolio Diversifier HLS Fund |
| Expense Example (Unaudited) |
Your Fund's Expenses
As a shareholder of the Fund, you incur two types of costs: (1) transaction costs and (2) ongoing costs including investment management fees, distribution fees, and other fund expenses. This example is intended to help you understand your ongoing costs (in dollars) of investing in the Fund and to compare these costs with the ongoing costs of investing in other mutual funds. The example is based on an investment of $1,000 invested at the beginning of the period and held for the period of December 31, 2011 through June 30, 2012.
Actual Expenses
The first set of columns of the table below provides information about actual account values and actual expenses. You may use the information in this column, together with the amount you invested, to estimate the expenses that you paid over the period. Simply divide your account value by $1,000 (for example, an $8,600 account value divided by $1,000 = 8.6), then multiply the result by the number in the line under the heading entitled “Expenses Paid During Period” to estimate the expenses you paid on your account during this period.
Hypothetical Example for Comparison Purposes
The second set of columns of the table below provides information about hypothetical account values and hypothetical expenses based on the Fund’s actual expense ratio and an assumed rate of return of 5% per year before expenses, which is not the Fund’s actual return. The hypothetical account values and expenses may not be used to estimate the actual ending account balance or expenses you paid for the period. You may use this information to compare the ongoing costs of investing in the Fund and other funds. To do so, compare this 5% hypothetical example with the 5% hypothetical examples that appear in the shareholder reports of the other funds.
Please note that the expenses shown in the table are meant to highlight your ongoing costs only and do not reflect any transactional costs, such as sales charges (loads) and CDSC. Therefore, the second set of columns of the table is useful in comparing ongoing costs only, and will not help you determine the relative total costs of owning different funds. In addition, if these transactional costs were included, your costs would be higher. Expenses are equal to the Fund's annualized expense ratios multiplied by average account value over the period, multiplied by 182/366 (to reflect the one-half year period).
| Actual return | Hypothetical (5% return before expenses) | |||||||||||||||||||||||||||||||||||
| Beginning Account Value December 31, 2011 | Ending Account Value June 30, 2012 | Expenses paid during the period December 31, 2011 through June 30, 2012 | Beginning Account Value December 31, 2011 | Ending Account Value June 30, 2012 | Expenses paid during the period December 31, 2011 through June 30, 2012 | Annualized expense ratio | Days in the current 1/2 year | Days in the full year | ||||||||||||||||||||||||||||
| Class IB | $ | 1,000.00 | $ | 951.12 | $ | 4.12 | $ | 1,000.00 | $ | 1,020.64 | $ | 4.27 | 0.85 | % | 182 | 366 | ||||||||||||||||||||
| 39 |
HARTFORD HLS FUNDS
c/o The Hartford Wealth Management - Global Annuities
P.O. Box 14293
Lexington, KY 40512-4293
Hartford Series Fund, Inc. is underwritten and distributed by Hartford Securities Distribution Company, Inc.
"The Hartford" is The Hartford Financial Services Group, Inc. and its subsidiaries.
Hartford Series Fund, Inc. inception dates range from 1977 to date. Hartford Series Fund, Inc. is not a subsidiary of The Hartford but is underwritten, distributed by and advised by subsidiaries of The Hartford. Investments in Hartford Series Fund, Inc. are not guaranteed by The Hartford or any other entity.
You should carefully consider investment objectives, risks, and charges and expenses of Hartford HLS Funds before investing. This and other information can be found in the Fund’s prospectus or summary prospectus, which can be obtained by calling 800-862-6668. Please read them carefully before you invest or send money.
| HLSSAR-PD12 8-12 111647 Printed in U.S.A ©2012 The Hartford, Hartford, CT 06115 | |

A MESSAGE FROM THE PRESIDENT
Dear Fellow Shareholders:
I want to take this opportunity to say thank you for investing in the Hartford HLS Funds. We’ve seen continued market volatility throughout the first half of 2012, and there will likely be continued uncertainty until the Presidential election in November, but we are still optimistic about the markets in 2012.
Market Review
In the first quarter of 2012, the S&P 500 Index turned in its best quarterly performance since the third quarter of 2009. U.S. equities showed signs of improvement as investors focused on improving economic data and strong corporate earnings news and the Federal Reserve’s pledge to keep interest rates low buoyed investors’ appetites.
The second quarter ended on a high note for the stock market—the S&P 500 had its strongest June in more than a decade and the Dow Jones Industrial Average had its best month since October—but those gains weren’t enough to offset losses from April and May, and equities finished the quarter in the red. Although the S&P 500 was -2.75 for the second quarter, it was up 9.49% for the first half of 2012.
Concerns about domestic and European unemployment are having an effect on our economy. The unemployment rate in the euro zone's 17 nations rose to a record 11.1% in May, the highest level since the euro launched as a common currency more than 10 years ago. In the U.S., the labor market has been fickle this year, with job growth starting off strong in the first couple months of 2012 but slowing down in the spring, which has led many to wonder about the status of the economic recovery.
On a positive note, home prices are rising again after falling for more than five years, new and existing home sales are increasing, and home builders are ramping up construction.
The Hartford HLS Funds Expands Relationship with Wellington Management
We’re very pleased that we are expanding our relationship with Wellington Management, which will now serve as the primary sub-adviser for the Hartford HLS Funds including equity, fixed-income,* and asset-allocation funds. One of America’s oldest and largest investment management firms, Wellington Management has resources that span the entire globe, with multiple offices across the U.S. and numerous offices abroad. Wellington Management’s most distinctive strength is its proprietary research, which is shared across the entire organization.
We believe that aligning more closely with a well-respected money manager like Wellington Management puts us in a strong position to drive significant growth and to continue delivering innovative fund strategies to help our investors meet their financial goals.
Thank you again for investing with the Hartford HLS Funds.
James Davey
President
Hartford HLS Funds
*Several fixed-income funds will continue to be sub-advised by Hartford Investment Management Company.
Hartford Small Company HLS Fund
Table of Contents
This report is prepared for the general information of contract owners and qualified retirement plan participants. It is not an offer of contracts or of qualified retirement plans. It should not be used in connection with any offer, except in conjunction with the appropriate product prospectus which contains all pertinent information including the applicable sales, administrative and other charges.
The views expressed in the Fund’s Manager Discussion under ‘‘Why did the Fund perform this way?’’ and ‘‘What is the outlook?’’ are views of the Fund’s sub-adviser and portfolio management team through the end of the period and are subject to change based on market and other conditions.
| Hartford Small Company HLS Fund inception 08/09/1996 |
| (sub-advised by Wellington Management Company, LLP) |
| Investment objective – Seeks growth of capital. |
Performance Overview 6/30/02 - 6/30/12
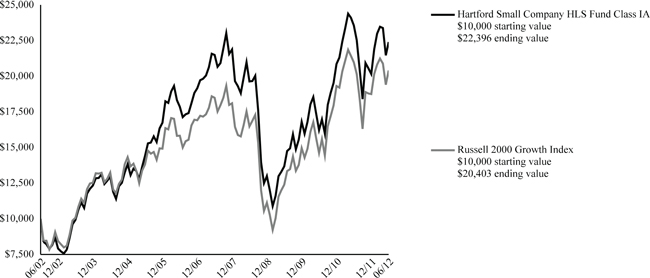
The chart above shows the growth of a $10,000 investment in Class IA. Growth results in classes other than Class IA will vary from what is seen above due to differences in the expenses charged to those share classes.
| Average Annual Total Returns (as of 6/30/12) |
| 6 Month† | 1 Year | 5 year | 10 year | |
| Small Company IA | 11.10% | -4.95% | 0.83% | 8.40% |
| Small Company IB | 10.96% | -5.19% | 0.59% | 8.13% |
| Russell 2000 Growth Index | 8.81% | -2.71% | 1.99% | 7.39% |
| † | Not Annualized |
PAST PERFORMANCE IS NOT INDICATIVE OF FUTURE RESULTS.
Total returns presented above were calculated using the Fund's net asset value available to shareholders for sale or redemption of Fund shares on June 30, 2012, which may exclude investment transactions as of this date.
Russell 2000 Growth Index is an unmanaged index of those Russell 2000 Index growth companies with higher price-to-book ratios and higher forecasted growth values. (The Russell 2000 Index is a broad-based unmanaged index comprised of 2,000 of the smallest U.S.-domiciled company common stocks (on the basis of capitalization) that are traded in the United States on the New York Stock Exchange, American Stock Exchange and Nasdaq.)
You cannot invest directly in an index.
The chart represents a hypothetical investment in the Fund. Performance data represents past performance and current performance could be higher or lower.
Performance information may reflect historical or current expense waivers/reimbursements from the investment adviser, without which performance would have been lower. For information on current expense waivers/reimbursements, please see the prospectus.
The value of the Fund will fluctuate so that when redeemed, it may be worth more or less than the original investment. The chart and table do not reflect the deductions of taxes, sales charges or other fees which may be applied at the variable life insurance, variable annuity or qualified retirement plan product level. Any such additional sales charges or other fees or expenses would lower the contract’s or plan’s performance.
| 2 |
| Hartford Small Company HLS Fund |
| Manager Discussion |
| June 30, 2012 (Unaudited) |
| Portfolio Managers | ||
| Steven C. Angeli, CFA | Stephen C. Mortimer | Jamie A. Rome, CFA |
| Senior Vice President and Equity Portfolio Manager | Senior Vice President and Equity Portfolio Manager | Senior Vice President and Equity Portfolio Manager |
| Mario E. Abularach, CFA | Mammen Chally, CFA | |
| Senior Vice President and Equity Research Analyst | Vice President and Equity Portfolio Manager | |
How did the Fund perform?
The Class IA shares of the Hartford Small Company HLS Fund returned 11.10% for the six-month period ended June 30, 2012, outperforming its benchmark, the Russell 2000 Growth Index which returned 8.81% for the same period. The Fund also outperformed the 8.54% return of the average fund in the Lipper Small Cap Growth Funds peer group, a group of funds with investment strategies similar to those of the Fund.
Why did the Fund perform this way?
U.S. equities rallied at the start of the year based on improving macroeconomic data including lower unemployment levels and improving consumer confidence. Following a strong first quarter, equities retreated in April, fell sharply in May, and recovered modestly in June. Fears surrounding European sovereign debt took center stage.
In this environment, small cap, mid cap and large cap stocks all registered positive returns over the six-month period, as measured by the Russell 2000 (+8.5), S&P MidCap 400 (+7.9%) and S&P 500 (+9.5%) indices, respectively. Eight of ten sectors within the Russell 2000 Growth index increased during the period. The Health Care (+22%), Consumer Discretionary (+12%), and Consumer Staples (+9%) sectors gained the most while Energy (-13%) and Utilities (-7%) posted a negative returns.
The Fund outperformed its benchmark during the period due to strong stock selection primarily in the Industrials, Health Care, and Energy sectors. This more than offset weak stock selection in the Information Technology sector. Sector allocation, which is a residual result of bottom-up stock selection (i.e. stock by stock fundamental research), hurt relative performance during the period. In particular, an underweight allocation (i.e. the Fund’s sector position was less than the benchmark position) to the strong performing Health Care sector detracted from relative returns.
Top contributors to relative performance (i.e. performance of the Fund as measured against the benchmark) during the period included SXC Health Solutions (Health Care), Skyworks Solutions (Information Technology), and Arena Pharmaceuticals (Health Care). Pharmacy benefit manager SXC Health Solutions shares rose in response to solid earnings results and favorable guidance. Additionally, in April 2012, the company announced plans to merge with competitor Catalyst Health Solutions (also a Fund holding), and shares moved higher following the announcement. Shares of Skyworks Solutions, a mixed signal semiconductor manufacturer, rose based on strong earnings results and guidance above-consensus expectations. Shares of Arena Pharmaceuticals, a U.S.-based pharmaceutical company focusing on weight loss products, rose sharply after the release of a favorable June 27th U.S. Food and Drug Administration decision to approve the Lorcaserin weight loss drug. Additionally, LivePerson (Information Technology) was among the top contributors to absolute performance.
Top detractors from relative returns during the period were Pharmacyclics (Health Care), Deckers Outdoor (Consumer Discretionary), and Sapient (Information Technology). Shares of Pharmacyclics, a biopharmaceutical company, rose as better-than-expected results with the drug Ibrutinib were released. Not owning shares of this benchmark component hurt relative results. Shares of fashion footwear designer and marketer Deckers Outdoor declined as unseasonably warm winter weather hurt sales and the company issued conservative guidance for 2012 earnings. Shares of Sapient, a business marketing and information technology services provider, traded lower after the company issued disappointing growth and earnings guidance for 2012. Additionally Lattice Semiconductor (Information Technology) was among the top detractors from absolute (i.e. total return) performance.
What is the outlook?
We continue to challenge ourselves to discover emerging growth companies and to be opportunistic to uncover re-emerging growth companies. We believe that market volatility over the past year has validated our long-standing price target discipline, which we continue to apply with rigor. The Fund continues to focus on stocks of companies that we see as having unique business models or special market opportunities that should allow them to deliver superior growth regardless of the pace of economic recovery.
| 3 |
| Hartford Small Company HLS Fund |
| Manager Discussion – (continued) |
| June 30, 2012 (Unaudited) |
The annual Russell 2000 Growth Index re-balance in June impacted our relative weightings in certain sectors. Our fundamental research-driven stock-by-stock investment decisions combined with the Index rebalance led to overweights in Consumer Discretionary, Information Technology, Financials, and Energy relative to the Russell 2000 Growth Index at the end of the period. The Fund ended the period most underweight to Health Care, Consumer Staples, and Materials.
| Diversification by Industry |
| as of June 30, 2012 |
| Industry (Sector) | Percentage of Net Assets | |||
| Automobiles & Components (Consumer Discretionary) | 1.1 | % | ||
| Banks (Financials) | 2.6 | |||
| Capital Goods (Industrials) | 9.9 | |||
| Commercial & Professional Services (Industrials) | 2.1 | |||
| Consumer Durables & Apparel (Consumer Discretionary) | 4.1 | |||
| Consumer Services (Consumer Discretionary) | 2.3 | |||
| Diversified Financials (Financials) | 1.7 | |||
| Energy (Energy) | 6.0 | |||
| Food & Staples Retailing (Consumer Staples) | 0.8 | |||
| Food, Beverage & Tobacco (Consumer Staples) | 0.5 | |||
| Health Care Equipment & Services (Health Care) | 6.6 | |||
| Household & Personal Products (Consumer Staples) | 1.2 | |||
| Insurance (Financials) | 0.3 | |||
| Materials (Materials) | 2.7 | |||
| Other Investment Pools and Funds (Financials) | 3.0 | |||
| Pharmaceuticals, Biotechnology & Life Sciences (Health Care) | 12.2 | |||
| Real Estate (Financials) | 3.2 | |||
| Retailing (Consumer Discretionary) | 10.5 | |||
| Semiconductors & Semiconductor Equipment (Information Technology) | 3.3 | |||
| Software & Services (Information Technology) | 15.5 | |||
| Technology Hardware & Equipment (Information Technology) | 4.4 | |||
| Telecommunication Services (Services) | 0.3 | |||
| Transportation (Industrials) | 3.3 | |||
| Utilities (Utilities) | 0.4 | |||
| Short-Term Investments | 2.3 | |||
| Other Assets and Liabilities | (0.3 | ) | ||
| Total | 100.0 | % | ||
| 4 |
| Hartford Small Company HLS Fund |
| Schedule of Investments |
| June 30, 2012 (Unaudited) |
| (000’s Omitted) |
| Shares or Principal Amount | Market Value ╪ | |||||||
| COMMON STOCKS - 94.9% | ||||||||
| Automobiles & Components - 1.1% | ||||||||
| 278 | Dana Holding Corp. | $ | 3,558 | |||||
| 317 | Tenneco Automotive, Inc. ● | 8,500 | ||||||
| 50 | Tesla Motors, Inc. ● | 1,565 | ||||||
| 13,623 | ||||||||
| Banks - 2.6% | ||||||||
| 250 | Boston Private Financial Holdings, Inc. | 2,236 | ||||||
| 49 | East West Bancorp, Inc. | 1,152 | ||||||
| 121 | EverBank Financial Corp. | 1,320 | ||||||
| 185 | Flushing Financial Corp. | 2,521 | ||||||
| 76 | Hudson Valley Holding Corp. | 1,373 | ||||||
| 61 | MB Financial, Inc. | 1,314 | ||||||
| 95 | Nationstar Mortgage Holdings, Inc. ● | 2,036 | ||||||
| 157 | Ocwen Financial Corp. ● | 2,943 | ||||||
| 209 | Pinnacle Financial Partners, Inc. ● | 4,075 | ||||||
| 270 | Privatebancorp, Inc. | 3,979 | ||||||
| 42 | Signature Bank ● | 2,579 | ||||||
| 167 | Umpqua Holdings Corp. | 2,196 | ||||||
| 590 | Western Alliance Bancorp ● | 5,525 | ||||||
| 35 | Wintrust Financial Corp. | 1,228 | ||||||
| 34,477 | ||||||||
| Capital Goods - 9.9% | ||||||||
| 48 | A.O. Smith Corp. | 2,338 | ||||||
| 47 | AAON, Inc. | 881 | ||||||
| 142 | Acuity Brands, Inc. | 7,230 | ||||||
| 28 | AGCO Corp. ● | 1,262 | ||||||
| 198 | Altra Holdings, Inc. ● | 3,117 | ||||||
| 60 | Applied Industrial Technologies, Inc. | 2,221 | ||||||
| 41 | AZZ, Inc. | 2,522 | ||||||
| 65 | Belden, Inc. | 2,156 | ||||||
| 21 | Carlisle Cos., Inc. | 1,130 | ||||||
| 55 | Ceradyne, Inc. | 1,412 | ||||||
| 71 | Chart Industries, Inc. ● | 4,876 | ||||||
| 110 | Colfax Corp. ● | 3,028 | ||||||
| 99 | Commercial Vehicles Group, Inc. ● | 855 | ||||||
| 30 | Crane Co. | 1,075 | ||||||
| 508 | DigitalGlobe, Inc. ● | 7,707 | ||||||
| 96 | DXP Enterprises, Inc. ● | 3,982 | ||||||
| 48 | EMCOR Group, Inc. | 1,342 | ||||||
| 128 | Esterline Technologies Corp. ● | 7,959 | ||||||
| 44 | Franklin Electric Co., Inc. | 2,240 | ||||||
| 22 | Gardner Denver Machinery, Inc. | 1,175 | ||||||
| 119 | GrafTech International Ltd. ● | 1,146 | ||||||
| 70 | H & E Equipment Services, Inc. ● | 1,045 | ||||||
| 79 | John Bean Technologies Corp. | 1,072 | ||||||
| 41 | Lennox International, Inc. | 1,890 | ||||||
| 18 | Lindsay Corp. | 1,150 | ||||||
| 153 | Meritor, Inc. ● | 797 | ||||||
| 58 | Michael Baker Corp. ● | 1,516 | ||||||
| 24 | Middleby Corp. ● | 2,414 | ||||||
| 290 | Moog, Inc. Class A ● | 12,011 | ||||||
| 85 | Nordson Corp. | 4,350 | ||||||
| 321 | Polypore International, Inc. ● | 12,956 | ||||||
| 107 | Sauer-Danfoss, Inc. | 3,755 | ||||||
| 58 | Sun Hydraulics Corp. | 1,405 | ||||||
| 38 | TAL International Group, Inc. | 1,259 | ||||||
| 180 | Teledyne Technologies, Inc. ● | 11,125 | ||||||
| 34 | Textainer Group Holdings Ltd. ‡ | 1,251 | ||||||
| 199 | Trex Co., Inc. ● | 5,983 | ||||||
| 115 | Trimas Corp. ● | 2,306 | ||||||
| 46 | WESCO International, Inc. ● | 2,647 | ||||||
| 128,586 | ||||||||
| Commercial & Professional Services - 2.1% | ||||||||
| 130 | Advisory (The) Board Co. ● | 6,469 | ||||||
| 82 | Deluxe Corp. | 2,042 | ||||||
| 67 | Exponent, Inc. ● | 3,522 | ||||||
| 123 | On Assignment, Inc. ● | 1,957 | ||||||
| 34 | Portfolio Recovery Associate ● | 3,076 | ||||||
| 601 | Sykes Enterprises, Inc. ● | 9,599 | ||||||
| 43 | United Stationers, Inc. | 1,155 | ||||||
| 27,820 | ||||||||
| Consumer Durables & Apparel - 4.0% | ||||||||
| 63 | Arctic Cat, Inc. ● | 2,306 | ||||||
| 110 | Brunswick Corp. | 2,442 | ||||||
| 46 | Deckers Outdoor Corp. ● | 2,036 | ||||||
| 153 | Fifth & Pacific Cos., Inc. ● | 1,641 | ||||||
| 68 | G-III Apparel Group Ltd. ● | 1,622 | ||||||
| 420 | Hanesbrands, Inc. ● | 11,648 | ||||||
| 164 | Leapfrog Enterprises, Inc. ● | 1,678 | ||||||
| 143 | Meritage Homes Corp. ● | 4,854 | ||||||
| 744 | Pulte Group, Inc. ● | 7,961 | ||||||
| 63 | Skechers USA, Inc. Class A ● | 1,277 | ||||||
| 278 | Steven Madden Ltd. ● | 8,821 | ||||||
| 120 | True Religion Apparel, Inc. ● | 3,489 | ||||||
| 39 | Warnaco Group, Inc. ● | 1,674 | ||||||
| 51,449 | ||||||||
| Consumer Services - 2.3% | ||||||||
| 33 | American Public Education, Inc. ● | 1,061 | ||||||
| 94 | Brinker International, Inc. | 3,011 | ||||||
| 79 | Buffalo Wild Wings, Inc. ● | 6,853 | ||||||
| 368 | Cheesecake Factory, Inc. ● | 11,770 | ||||||
| 120 | Ignite Restaurant Group, Inc. | 2,182 | ||||||
| 13 | Red Robin Gourmet Burgers, Inc. ● | 398 | ||||||
| 68 | Sotheby's Holdings | 2,281 | ||||||
| 26 | Steiner Leisure Ltd. ● | 1,197 | ||||||
| 101 | Whistler Blackcomb Holdings, Inc. | 1,094 | ||||||
| 29,847 | ||||||||
| Diversified Financials - 1.7% | ||||||||
| 218 | BGC Partners, Inc. | 1,278 | ||||||
| 103 | Compass Diversified Holdings | 1,436 | ||||||
| 215 | DFC Global Corp. ● | 3,969 | ||||||
| 126 | Fifth Street Finance Corp. | 1,254 | ||||||
| 206 | Gain Capital Holdings, Inc. | 1,028 | ||||||
| 647 | Knight Capital Group, Inc. ● | 7,721 | ||||||
| 41 | Manning & Napier, Inc. | 586 | ||||||
| 420 | Netspend Holdings, Inc. ● | 3,862 | ||||||
| 240 | Uranium Participation Corp. ● | 1,299 | ||||||
| 22,433 | ||||||||
| Energy - 6.0% | ||||||||
| 2,328 | Alberta Oilsands, Inc. ● | 332 | ||||||
| 255 | Atwood Oceanics, Inc. ● | 9,651 | ||||||
| 101 | Berry Petroleum Co. | 3,988 | ||||||
| 469 | BPZ Resources, Inc. ● | 1,188 | ||||||
| 149 | C&J Energy Services, Inc. ● | 2,747 | ||||||
| 113 | CVR Energy, Inc. ● | 2,994 | ||||||
| 76 | Energy XXI (Bermuda) Ltd. ● | 2,366 | ||||||
| 277 | Gulfmark Offshore, Inc. ● | 9,414 | ||||||
| 59 | Hornbeck Offshore Services, Inc. ● | 2,289 | ||||||
| 407 | ION Geophysical Corp. ● | 2,684 | ||||||
The accompanying notes are an integral part of these financial statements.
| 5 |
| Hartford Small Company HLS Fund |
| Schedule of Investments – (continued) |
| June 30, 2012 (Unaudited) |
| (000’s Omitted) |
| Shares or Principal Amount | Market Value ╪ | |||||||
COMMON STOCKS - 94.9% - (continued) | ||||||||
| Energy - 6.0% - (continued) | ||||||||
| 288 | Karoon Gas Australia Ltd. ● | $ | 1,208 | |||||
| 102 | Midstates Petroleum Co., Inc. | 988 | ||||||
| 3,035 | Oilsands Quest, Inc. ● | 129 | ||||||
| 73 | PDC Energy, Inc. ● | 1,802 | ||||||
| 893 | Rex Energy Corp. ● | 10,013 | ||||||
| 323 | Rosetta Resources, Inc. ● | 11,843 | ||||||
| 160 | SemGroup Corp. ● | 5,117 | ||||||
| 83 | Stone Energy Corp. ● | 2,098 | ||||||
| 54 | Swift Energy Co. ● | 1,010 | ||||||
| 5 | Tidewater, Inc. | 232 | ||||||
| 165 | Tourmaline Oil Corp. ● | 4,369 | ||||||
| 207 | Vaalco Energy, Inc. ● | 1,784 | ||||||
| 78,246 | ||||||||
| Food & Staples Retailing - 0.8% | ||||||||
| 169 | Casey's General Stores, Inc. | 9,955 | ||||||
| 9,955 | ||||||||
| Food, Beverage & Tobacco - 0.5% | ||||||||
| 19 | Boston Beer Co., Inc. Class A ● | 2,288 | ||||||
| 75 | Cosan S.A. Industria E Comercio | 1,144 | ||||||
| 168 | Darling International, Inc. ● | 2,765 | ||||||
| 6,197 | ||||||||
| Health Care Equipment & Services - 6.6% | ||||||||
| 257 | ABIOMED, Inc. ● | 5,876 | ||||||
| 40 | AmSurg Corp. ● | 1,202 | ||||||
| 135 | AngioDynamics, Inc. ● | 1,623 | ||||||
| 8 | Atrion Corp. | 1,607 | ||||||
| 52 | Corvel Corp. ● | 2,543 | ||||||
| 72 | Cyberonics, Inc. ● | 3,244 | ||||||
| 190 | Dexcom, Inc. ● | 2,467 | ||||||
| 47 | Ensign Group, Inc. | 1,320 | ||||||
| 57 | Greatbatch, Inc. ● | 1,285 | ||||||
| 106 | HealthSouth Corp. ● | 2,454 | ||||||
| 146 | Heartware International, Inc. ● | 12,996 | ||||||
| 22 | ICU Medical, Inc. ● | 1,180 | ||||||
| 399 | Insulet Corp. ● | 8,537 | ||||||
| 74 | LHC Group, Inc. ● | 1,257 | ||||||
| 83 | Masimo Corp. ● | 1,861 | ||||||
| 18 | MEDNAX, Inc. ● | 1,227 | ||||||
| 348 | Merge Healthcare, Inc. ● | 995 | ||||||
| 84 | Merit Medical Systems, Inc. ● | 1,160 | ||||||
| 107 | Owens & Minor, Inc. | 3,286 | ||||||
| 157 | SXC Health Solutions Corp. ● | 15,575 | ||||||
| 77 | U.S. Physical Therapy, Inc. | 1,950 | ||||||
| 311 | Volcano Corp. ● | 8,917 | ||||||
| 67 | Wellcare Health Plans, Inc. ● | 3,542 | ||||||
| 86,104 | ||||||||
| Household & Personal Products - 1.2% | ||||||||
| 334 | Elizabeth Arden, Inc. ● | 12,972 | ||||||
| 61 | Nu Skin Enterprises, Inc. Class A | 2,860 | ||||||
| 15,832 | ||||||||
| Insurance - 0.3% | ||||||||
| 73 | Amerisafe, Inc. ● | 1,888 | ||||||
| 62 | Protective Life Corp. | 1,818 | ||||||
| 3,706 | ||||||||
| Materials - 2.7% | ||||||||
| 39 | Allied Nevada Gold Corp. ● | 1,112 | ||||||
| 22 | AptarGroup, Inc. | 1,113 | ||||||
| 1,562 | Aurcana Corp. ● | 1,411 | ||||||
| 57 | Flotek Industries, Inc. ● | 535 | ||||||
| 71 | Kraton Performance Polymers ● | 1,551 | ||||||
| 275 | Methanex Corp. ADR | 7,657 | ||||||
| 149 | New Gold, Inc. ● | 1,418 | ||||||
| 106 | Olin Corp. | 2,215 | ||||||
| 1,517 | Romarco Minerals, Inc. ● | 790 | ||||||
| 312 | Silgan Holdings, Inc. | 13,331 | ||||||
| 38 | TPC Group, Inc. ● | 1,420 | ||||||
| 28 | Universal Stainless & Alloy Products ● | 1,143 | ||||||
| 79 | Winpak Ltd. | 1,223 | ||||||
| 34,919 | ||||||||
| Pharmaceuticals, Biotechnology & Life Sciences - 12.2% | ||||||||
| 81 | 3SBio, Inc. ADR ● | 1,106 | ||||||
| 119 | Algeta ASA ● | 3,411 | ||||||
| 191 | Alkermes plc ● | 3,244 | ||||||
| 9 | Almirall S.A. | 68 | ||||||
| 207 | Amylin Pharmaceuticals, Inc. ● | 5,843 | ||||||
| 392 | Arena Pharmaceuticals, Inc. ● | 3,907 | ||||||
| 166 | Auxilium Pharmaceuticals, Inc. ● | 4,452 | ||||||
| 281 | Aveo Pharmaceuticals, Inc. ● | 3,417 | ||||||
| 168 | Bruker Corp. ● | 2,238 | ||||||
| 267 | Cadence Pharmaceuticals, Inc. ● | 952 | ||||||
| 164 | Cubist Pharmaceuticals, Inc. ● | 6,211 | ||||||
| 433 | Exelixis, Inc. ● | 2,393 | ||||||
| 542 | Immunogen, Inc. ● | 9,098 | ||||||
| 462 | Incyte Corp. ● | 10,484 | ||||||
| 684 | Ironwood Pharmaceuticals, Inc. ● | 9,424 | ||||||
| 496 | Medicines Co. ● | 11,369 | ||||||
| 68 | Momenta Pharmaceuticals, Inc. ● | 919 | ||||||
| 155 | Neurocrine Biosciences, Inc. ● | 1,229 | ||||||
| 918 | NPS Pharmaceuticals, Inc. ● | 7,905 | ||||||
| 172 | Onyx Pharmaceuticals, Inc. ● | 11,422 | ||||||
| 479 | Optimer Pharmaceuticals, Inc. ● | 7,434 | ||||||
| 502 | PAREXEL International Corp. ● | �� | 14,160 | |||||
| 155 | Progenics Pharmaceuticals, Inc. ● | 1,514 | ||||||
| 590 | Rigel Pharmaceuticals, Inc. ● | 5,484 | ||||||
| 291 | Salix Pharmaceuticals Ltd. ● | 15,845 | ||||||
| 522 | Seattle Genetics, Inc. ● | 13,249 | ||||||
| 81 | Tesaro, Inc. ●☼ | 1,129 | ||||||
| 182 | Trius Therapeutics, Inc. ●‡ | 1,050 | ||||||
| 158,957 | ||||||||
| Real Estate - 3.2% | ||||||||
| 161 | Anworth Mortgage Asset Corp. | 1,135 | ||||||
| 77 | Capstead Mortgage Corp. | 1,070 | ||||||
| 86 | Colonial Properties Trust | 1,901 | ||||||
| 475 | Coresite Realty Corp. | 12,256 | ||||||
| 87 | Glimcher Realty Trust | 891 | ||||||
| 36 | Hatteras Financial Corp. | 1,024 | ||||||
| 109 | LaSalle Hotel Properties | 3,168 | ||||||
| 127 | Medical Properties Trust, Inc. | 1,225 | ||||||
| 352 | MFA Mortgage Investments, Inc. | 2,775 | ||||||
| 355 | Pebblebrook Hotel Trust | 8,265 | ||||||
| 9 | PS Business Parks, Inc. | 632 | ||||||
| 168 | Summit Hotel Properties, Inc. | 1,409 | ||||||
| 467 | Sunstone Hotel Investors, Inc. ● | 5,136 | ||||||
| 77 | Whitestone REIT | 1,059 | ||||||
| 41,946 | ||||||||
| Retailing - 10.5% | ||||||||
| 5,016 | Allstar Co. ⌂† | 7,383 | ||||||
| 185 | Ascena Retail Group, Inc. ● | 3,451 | ||||||
The accompanying notes are an integral part of these financial statements.
| 6 |
| Shares or Principal Amount | Market Value ╪ | |||||||
| COMMON STOCKS - 94.9% - (continued) | ||||||||
| Retailing - 10.5% - (continued) | ||||||||
| 45 | Cato Corp. | $ | 1,356 | |||||
| 230 | Children's Place Retail Stores, Inc. ● | 11,471 | ||||||
| 59 | Core-Mark Holding Co., Inc. | 2,836 | ||||||
| 1,003 | Debenhams plc | 1,362 | ||||||
| 197 | DSW, Inc. | 10,737 | ||||||
| 575 | Express, Inc. ● | 10,452 | ||||||
| 317 | GNC Holdings, Inc. | 12,423 | ||||||
| 39 | Group 1 Automotive, Inc. | 1,788 | ||||||
| 44 | Guess?, Inc. | 1,348 | ||||||
| 158 | Hibbett Sports, Inc. ● | 9,116 | ||||||
| 228 | HomeAway, Inc. ● | 4,949 | ||||||
| 112 | Hot Topic, Inc. | 1,084 | ||||||
| 174 | Lumber Liquidators Holdings, Inc. ● | 5,869 | ||||||
| 195 | Mattress Firm Holding Corp. ● | 5,897 | ||||||
| 86 | PetMed Express, Inc. | 1,043 | ||||||
| 184 | Rent-A-Center, Inc. | 6,197 | ||||||
| 317 | rue21, Inc. ● | 8,005 | ||||||
| 431 | Shutterfly, Inc. ● | 13,228 | ||||||
| 65 | Teavana Holdings, Inc. ● | 877 | ||||||
| 66 | The Finish Line, Inc. | 1,380 | ||||||
| 179 | TripAdvisor, Inc. ● | 7,979 | ||||||
| 175 | Urban Outfitters, Inc. ● | 4,821 | ||||||
| 38 | Vitamin Shoppe, Inc. ● | 2,111 | ||||||
| 137,163 | ||||||||
| Semiconductors & Semiconductor Equipment - 3.3% | ||||||||
| 62 | Cymer, Inc. ● | 3,682 | ||||||
| 554 | Cypress Semiconductor Corp. | 7,318 | ||||||
| 323 | GT Advanced Technologies, Inc. ● | 1,705 | ||||||
| 1,377 | Lattice Semiconductor Corp. ● | 5,193 | ||||||
| 63 | Microsemi Corp. ● | 1,156 | ||||||
| 408 | Mindspeed Technologies, Inc. ● | 1,003 | ||||||
| 141 | Nanometrics, Inc. ● | 2,159 | ||||||
| 181 | PMC - Sierra, Inc. ● | 1,111 | ||||||
| 392 | Skyworks Solutions, Inc. ● | 10,729 | ||||||
| 291 | Ultratech Stepper, Inc. ● | 9,157 | ||||||
| 43,213 | ||||||||
| Software & Services - 15.5% | ||||||||
| 89 | Ancestry.com, Inc. ● | 2,464 | ||||||
| 88 | Bazaarvoice, Inc. ● | 1,601 | ||||||
| 80 | Broadsoft, Inc. ● | 2,306 | ||||||
| 1,009 | Cadence Design Systems, Inc. ● | 11,085 | ||||||
| 22 | Commvault Systems, Inc. ● | 1,101 | ||||||
| 119 | Concur Technologies, Inc. ● | 8,100 | ||||||
| 127 | Constant Contact, Inc. ● | 2,262 | ||||||
| 49 | CoStar Group, Inc. ● | 3,986 | ||||||
| 238 | DealerTrack Holdings, Inc. ● | 7,171 | ||||||
| 69 | Dice Holdings, Inc. ● | 648 | ||||||
| 164 | Earthlink, Inc. | 1,216 | ||||||
| 43 | Ebix, Inc. | 854 | ||||||
| 3 | ExactTarget, Inc. ● | 72 | ||||||
| 55 | Fortinet, Inc. ● | 1,282 | ||||||
| 77 | Guidewire Software, Inc. ● | 2,161 | ||||||
| 172 | Higher One Holdings, Inc. ● | 2,097 | ||||||
| 250 | IAC/InterActiveCorp. | 11,385 | ||||||
| 256 | Imperva, Inc. ● | 7,384 | ||||||
| 152 | j2 Global, Inc. | 4,029 | ||||||
| 134 | JDA Software Group, Inc. ● | 3,975 | ||||||
| 360 | Jive Software, Inc. ● | 7,552 | ||||||
| 96 | Keynote Systems, Inc. | 1,430 | ||||||
| 798 | LivePerson, Inc. ● | 15,209 | ||||||
| 15 | Mercadolibre, Inc. | 1,164 | ||||||
| 78 | MicroStrategy, Inc. ● | 10,132 | ||||||
| 93 | Mitek Systems, Inc. ● | 360 | ||||||
| 48 | Nuance Communications, Inc. ● | 1,151 | ||||||
| 70 | Opnet Technologies, Inc. | 1,862 | ||||||
| 249 | Parametric Technology Corp. ● | 5,229 | ||||||
| 206 | Pegasystems, Inc. | 6,805 | ||||||
| 43 | Proofpoint, Inc. ● | 724 | ||||||
| 99 | QLIK Technologies, Inc. ● | 2,187 | ||||||
| 1,206 | Sapient Corp. | 12,142 | ||||||
| 77 | Solarwinds, Inc. ● | 3,333 | ||||||
| 265 | Solera Holdings, Inc. | 11,083 | ||||||
| 43 | Sourcefire, Inc. ● | 2,192 | ||||||
| 82 | Splunk, Inc. | 2,315 | ||||||
| 155 | Syntel, Inc. | 9,385 | ||||||
| 195 | Tangoe, Inc. ● | 4,158 | ||||||
| 83 | Tyler Corp. ● | 3,367 | ||||||
| 57 | VeriFone Systems, Inc. ● | 1,884 | ||||||
| 407 | Web.com Group, Inc. ● | 7,447 | ||||||
| 243 | Wright Express Corp. ● | 15,001 | ||||||
| 127 | XO Group, Inc. ● | 1,127 | ||||||
| 202,418 | ||||||||
| Technology Hardware & Equipment - 4.4% | ||||||||
| 37 | ADTRAN, Inc. | 1,123 | ||||||
| 91 | Arris Group, Inc. ● | 1,264 | ||||||
| 125 | Aruba Networks, Inc. ● | 1,882 | ||||||
| 44 | Audience, Inc. | 856 | ||||||
| 224 | Coherent, Inc. ● | 9,688 | ||||||
| 156 | Emulex Corp. ● | 1,120 | ||||||
| 349 | Extreme Networks, Inc. ● | 1,199 | ||||||
| 569 | Fabrinet ● | 7,138 | ||||||
| 436 | Finisar Corp. ● | 6,518 | ||||||
| 30 | Ixia ● | 357 | ||||||
| 429 | Jabil Circuit, Inc. | 8,724 | ||||||
| 257 | Mitel Networks Corp. ● | 1,136 | ||||||
| 43 | Netgear, Inc. ● | 1,481 | ||||||
| 134 | Oplink Communications, Inc. ● | 1,808 | ||||||
| 50 | Park Electrochemical Corp. | 1,281 | ||||||
| 77 | Plantronics, Inc. | 2,571 | ||||||
| 136 | TTM Technologies, Inc. ● | 1,275 | ||||||
| 207 | Universal Display Corp. ● | 7,423 | ||||||
| 56,844 | ||||||||
| Telecommunication Services - 0.3% | ||||||||
| 25 | AboveNet, Inc. ● | 2,108 | ||||||
| 208 | Leap Wireless International, Inc. ● | 1,337 | ||||||
| 3,445 | ||||||||
| Transportation - 3.3% | ||||||||
| 250 | Avis Budget Group, Inc. ● | 3,796 | ||||||
| 260 | Landstar System, Inc. | 13,428 | ||||||
| 55 | Marten Transport Ltd. | 1,165 | ||||||
| 238 | Old Dominion Freight Line, Inc. ● | 10,294 | ||||||
| 592 | Spirit Airlines, Inc. ● | 11,513 | ||||||
| 133 | Werner Enterprises, Inc. | 3,172 | ||||||
| 43,368 | ||||||||
| Utilities - 0.4% | ||||||||
| 42 | Portland General Electric Co. | 1,123 | ||||||
| 89 | UNS Energy Corp. | 3,404 | ||||||
The accompanying notes are an integral part of these financial statements.
| 7 |
| Hartford Small Company HLS Fund |
| Schedule of Investments – (continued) |
| June 30, 2012 (Unaudited) |
| (000’s Omitted) |
| Shares or Principal Amount | Market Value ╪ | |||||||||||
| COMMON STOCKS - 94.9% - (continued) | ||||||||||||
| Utilities - 0.4% - (continued) | ||||||||||||
| 37 | Westar Energy, Inc. | $ | 1,111 | |||||||||
| 5,638 | ||||||||||||
| Total common stocks | ||||||||||||
| (cost $1,145,164) | $ | 1,236,186 | ||||||||||
| PREFERRED STOCKS - 0.1% | ||||||||||||
| Consumer Durables & Apparel - 0.1% | ||||||||||||
| 18 | Callaway Golf Co., 7.50% ۞ | $ | 1,723 | |||||||||
| Total preferred stocks | ||||||||||||
| (cost $2,017) | $ | 1,723 | ||||||||||
| EXCHANGE TRADED FUNDS - 3.0% | ||||||||||||
| Other Investment Pools and Funds - 3.0% | ||||||||||||
| 428 | iShares Russell 2000 Growth Index Fund | $ | 39,135 | |||||||||
| Total exchange traded funds | ||||||||||||
| (cost $39,545) | $ | 39,135 | ||||||||||
| Total long-term investments | $ | 1,277,044 | ||||||||||
| (cost $1,186,726) | ||||||||||||
| SHORT-TERM INVESTMENTS - 2.3% | ||||||||||||
| Repurchase Agreements - 2.3% | ||||||||||||
| Bank of America Merrill Lynch TriParty Joint Repurchase Agreement (maturing on 07/02/2012 in the amount of $16,211, collateralized by FHLMC 5.50% - 6.50%, 2035 - 2036, FNMA 5.00% - 6.00%, 2033 - 2039, value of $16,535) | ||||||||||||
| $ | 16,211 | 0.13%, 06/29/2012 | $ | 16,211 | ||||||||
| Barclays Capital TriParty Joint Repurchase Agreement (maturing on 07/02/2012 in the amount of $5,861, collateralized by U.S. Treasury Note 1.25% - 3.63%, 2014 - 2020, value of $5,978) | ||||||||||||
| 5,861 | 0.15%, 06/29/2012 | 5,861 | ||||||||||
| Deutsche Bank Securities TriParty Joint Repurchase Agreement (maturing on 07/02/2012 in the amount of $1,570, collateralized by U.S. Treasury Note 0.88%, 2016, value of $1,602) | ||||||||||||
| 1,570 | 0.20%, 06/29/2012 | 1,570 | ||||||||||
| TD Securities TriParty Joint Repurchase Agreement (maturing on 07/02/2012 in the amount of $4,589, collateralized by FHLMC 4.00% - 6.00%, 2027 - 2041, FNMA 4.00% - 4.50%, 2025 - 2042, U.S. Treasury Bond 6.38%, 2027, U.S. Treasury Note 0.38% - 8.75%, 2012 - 2017, value of $4,681) | ||||||||||||
| 4,589 | 0.15%, 06/29/2012 | 4,589 | ||||||||||
| UBS Securities, Inc. Joint Repurchase Agreement (maturing on 07/02/2012 in the amount of $2, collateralized by U.S. Treasury Note 1.00%, 2013, value of $2) | ||||||||||||
| 1 | 0.13%, 06/29/2012 | 1 | ||||||||||
| UBS Securities, Inc. TriParty Joint Repurchase Agreement (maturing on 07/02/2012 in the amount of $2,068, collateralized by GNMA 4.00%, 2042, value of $2,109) | ||||||||||||
| 2,068 | 0.20%, 06/29/2012 | $ | 2,068 | |||||||||
| 30,300 | ||||||||||||
| Total short-term investments | ||||||||||||
| (cost $30,300) | $ | 30,300 | ||||||||||
| Total investments | ||||||||||||
| (cost $1,217,026) ▲ | 100.3 | % | $ | 1,307,344 | ||||||||
| Other assets and liabilities | (0.3 | )% | (3,844 | ) | ||||||||
| Total net assets | 100.0 | % | $ | 1,303,500 | ||||||||
The accompanying notes are an integral part of these financial statements.
| 8 |
| Note: | Percentage of investments as shown is the ratio of the total market value to total net assets. |
| Prices of foreign equities that are principally traded on certain foreign markets may be adjusted daily pursuant to a fair value pricing service approved by the Board of Directors in order to reflect an adjustment for factors occurring after the close of certain foreign markets but before the close of the New York Stock Exchange. |
| ▲ | At June 30, 2012, the cost of securities for federal income tax purposes was $1,230,249 and the aggregate gross unrealized appreciation and depreciation based on that cost were: |
| Unrealized Appreciation | $ | 162,153 | ||
| Unrealized Depreciation | (85,058 | ) | ||
| Net Unrealized Appreciation | $ | 77,095 |
| † | These securities were valued in good faith at fair value as determined under policies and procedures established by and under the supervision of the Company's Board of Directors. At June 30, 2012, the aggregate value of these securities was $7,383, which represents 0.6% of total net assets. This amount excludes securities that are principally traded in certain foreign markets and whose prices are adjusted pursuant to a third party pricing service methodology approved by the Board of Directors. |
| ● | Non-income producing. |
| ⌂ | The following securities are considered illiquid. Illiquid securities are often purchased in private placement transactions, are often not registered under the Securities Act of 1933 and may have contractual restrictions on resale. A security may also be considered illiquid if the security lacks a readily available market or if its valuation has not changed for a certain period of time. |
| Period Acquired | Shares/ Par | Security | Cost Basis | |||||||
| 08/2011 | 5,016 | Allstar Co. | 5,107 | |||||||
At June 30, 2012, the aggregate value of these securities was $7,383, which represents 0.6% of total net assets.
| ۞ | Convertible security. |
| ☼ | This security, or a portion of this security, was purchased on a when-issued, delayed delivery or delayed draw basis. The cost of these securities was $1,089 at June 30, 2012. |
| ‡ | This security, or a portion of this security, has been segregated to cover funding requirements on investment transactions settling in the future. |
| Foreign Currency Contracts Outstanding at June 30, 2012 | ||||||||||||||||||||||
| Description | Counterparty | Buy / Sell | Market Value ╪ | Contract Amount | Delivery Date | Unrealized Appreciation/ (Depreciation) | ||||||||||||||||
| EUR | BNP | Buy | $ | 68 | $ | 68 | 07/03/2012 | $ | – | |||||||||||||
| ╪ | See Significant Accounting Policies of accompanying Notes to Financial Statements regarding valuation of securities. |
| GLOSSARY: (abbreviations used in preceding Schedule of Investments) | ||
| Counterparty Abbreviations: | ||
| BNP | BNP Paribas Securities | |
| Currency Abbreviations: | ||
| EUR | EURO | |
| Other Abbreviations: | ||
| ADR | American Depositary Receipt | |
| FHLMC | Federal Home Loan Mortgage Corp. | |
| FNMA | Federal National Mortgage Association | |
| GNMA | Government National Mortgage Association | |
| REIT | Real Estate Investment Trust | |
The accompanying notes are an integral part of these financial statements.
| 9 |
| Hartford Small Company HLS Fund |
| Investment Valuation Hierarchy Level Summary |
| June 30, 2012 (Unaudited) |
| (000’s Omitted) |
| Total | Level 1 ♦ | Level 2 ♦ | Level 3 | |||||||||||||
| Assets: | ||||||||||||||||
| Common Stocks ‡ | $ | 1,236,186 | $ | 1,222,754 | $ | 6,049 | $ | 7,383 | ||||||||
| Exchange Traded Funds | 39,135 | 39,135 | – | – | ||||||||||||
| Preferred Stocks | 1,723 | 1,723 | – | – | ||||||||||||
| Short-Term Investments | 30,300 | – | 30,300 | – | ||||||||||||
| Total | $ | 1,307,344 | $ | 1,263,612 | $ | 36,349 | $ | 7,383 | ||||||||
| Liabilities: | ||||||||||||||||
| Foreign Currency Contracts * | – | – | – | – | ||||||||||||
| Total | $ | – | $ | – | $ | – | $ | – | ||||||||
| ♦ | For the six-month period ended June 30, 2012, investments valued at $5,529 were transferred from Level 1 to Level 2, and there were no transfers from Level 2 to Level 1. Investments are transferred between Level 1 and Level 2 for a variety of reasons including, but not limited to: |
| 1) | Foreign equities for which a fair value price is more representative of exit value than the local market close (transfer into Level 2). Foreign equities for which the local market close is more representative of exit value (transfer into Level 1). | |
| 2) | U.S. Treasury securities that no longer represent the most recent issue (transfer into Level 2). | |
| 3) | Equity investments with no observable trading but a bid or close price is used (transfer into Level 2). Equity investments using observable quoted prices in an active market (transfer into Level 1). |
| ‡ | The Fund has all or primarily all of the equity securities categorized in a particular level. Refer to the Schedule of Investments for further industry breakout. |
| * | Derivative instruments not reflected in the Schedule of Investments are valued at the unrealized appreciation/depreciation on the investments. |
| Following is a reconciliation of Level 3 assets for which significant unobservable inputs were used to determine fair value: |
| Balance as of December 31, 2011 | Realized Gain (Loss) | Change in Unrealized Appreciation (Depreciation) | Net Amortization | Purchases | Sales | Transfers Into Level 3 * | Transfers Out of Level 3 * | Balance as of June 30, 2012 | ||||||||||||||||||||||||||||
| Assets: | ||||||||||||||||||||||||||||||||||||
| Common Stocks | $ | 5,630 | $ | — | $ | 2,188 | † | $ | — | $ | — | $ | — | $ | — | $ | (435 | ) | $ | 7,383 | ||||||||||||||||
| Total | $ | 5,630 | $ | — | $ | 2,188 | $ | — | $ | — | $ | — | $ | — | $ | (435 | ) | $ | 7,383 | |||||||||||||||||
| * | Investments are transferred into and out of Level 3 for a variety of reasons including, but not limited to: |
| 1) | Investments where trading has been halted (transfer into Level 3) or investments where trading has resumed (transfer out of Level 3). | |
| 2) | Broker quoted investments (transfer into Level 3) or quoted prices in active markets (transfer out of Level 3). | |
| 3) | Investments that have certain restrictions on trading (transfer into Level 3) or investments where trading restrictions have expired (transfer out of Level 3). |
| † | Change in unrealized appreciation (depreciation) in the current period relating to assets still held at June 30, 2012 was $2,188. |
The accompanying notes are an integral part of these financial statements.
| 10 |
| Hartford Small Company HLS Fund |
| Statement of Assets and Liabilities |
| June 30, 2012 (Unaudited) |
| (000’s Omitted) |
| Assets: | ||||
| Investments in securities, at market value (cost $1,217,026) | $ | 1,307,344 | ||
| Cash | 46 | |||
| Receivables: | ||||
| Investment securities sold | 14,069 | |||
| Fund shares sold | 187 | |||
| Dividends and interest | 604 | |||
| Total assets | 1,322,250 | |||
| Liabilities: | ||||
| Unrealized depreciation on foreign currency contracts | — | |||
| Payables: | ||||
| Investment securities purchased | 16,959 | |||
| Fund shares redeemed | 1,589 | |||
| Investment management fees | 119 | |||
| Distribution fees | 5 | |||
| Accrued expenses | 78 | |||
| Total liabilities | 18,750 | |||
| Net assets | $ | 1,303,500 | ||
| Summary of Net Assets: | ||||
| Capital stock and paid-in-capital | $ | 1,152,592 | ||
| Distributions in excess of net investment loss | (1,536 | ) | ||
| Accumulated net realized gain | 62,126 | |||
| Unrealized appreciation of investments and the translations of assets and liabilities denominated in foreign currency | 90,318 | |||
| Net assets | $ | 1,303,500 | ||
| Shares authorized | 1,500,000 | |||
| Par value | $ | 0.001 | ||
| Class IA: Net asset value per share | $ | 18.96 | ||
| Shares outstanding | 60,644 | |||
| Net assets | $ | 1,150,021 | ||
| Class IB: Net asset value per share | $ | 18.38 | ||
| Shares outstanding | 8,352 | |||
| Net assets | $ | 153,479 |
The accompanying notes are an integral part of these financial statements.
| 11 |
| Hartford Small Company HLS Fund |
| Statement of Operations |
| For the Six-Month Period Ended June 30, 2012 (Unaudited) |
| (000’s Omitted) |
| Investment Income: | ||||
| Dividends | $ | 3,504 | ||
| Interest | 18 | |||
| Less: Foreign tax withheld | (33 | ) | ||
| Total investment income, net | 3,489 | |||
| Expenses: | ||||
| Investment management fees | 4,581 | |||
| Transfer agent fees | 3 | |||
| Distribution fees - Class IB | 203 | |||
| Custodian fees | 17 | |||
| Accounting services fees | 80 | |||
| Board of Directors' fees | 16 | |||
| Audit fees | 9 | |||
| Other expenses | 104 | |||
| Total expenses (before fees paid indirectly) | 5,013 | |||
| Commission recapture | (55 | ) | ||
| Total fees paid indirectly | (55 | ) | ||
| Total expenses, net | 4,958 | |||
| Net investment loss | (1,469 | ) | ||
| Net Realized Gain on Investments and Foreign Currency Transactions: | ||||
| Net realized gain on investments | 76,539 | |||
| Net realized gain on foreign currency contracts | 42 | |||
| Net realized loss on other foreign currency transactions | (85 | ) | ||
| Net Realized Gain on Investments and Foreign Currency Transactions | 76,496 | |||
| Net Changes in Unrealized Appreciation of Investments and Foreign Currency Transactions: | ||||
| Net unrealized appreciation of investments | 62,597 | |||
| Net unrealized appreciation of foreign currency contracts | — | |||
| Net unrealized depreciation on translation of other assets and liabilities in foreign currencies | (2 | ) | ||
| Net Changes in Unrealized Appreciation of Investments and Foreign Currency Transactions | 62,595 | |||
| Net Gain on Investments and Foreign Currency Transactions | 139,091 | |||
| Net Increase in Net Assets Resulting from Operations | $ | 137,622 |
The accompanying notes are an integral part of these financial statements.
| 12 |
| Hartford Small Company HLS Fund |
| Statement of Changes in Net Assets |
| (000’s Omitted) |
| For the Six-Month Period Ended June 30, 2012 (Unaudited) | For the Year Ended December 31, 2011 | |||||||
| Operations: | ||||||||
| Net investment loss | $ | (1,469 | ) | $ | (2,311 | ) | ||
| Net realized gain on investments and foreign currency transactions | 76,496 | 196,454 | ||||||
| Net unrealized appreciation (depreciation) of investments and foreign currency transactions | 62,595 | (237,202 | ) | |||||
| Net Increase (Decrease) In Net Assets Resulting From Operations | 137,622 | (43,059 | ) | |||||
| Capital Share Transactions: | ||||||||
| Class IA | ||||||||
| Sold | 49,612 | 242,954 | ||||||
| Redeemed | (111,276 | ) | (294,153 | ) | ||||
| Total capital share transactions | (61,664 | ) | (51,199 | ) | ||||
| Class IB | ||||||||
| Sold | 11,045 | 44,274 | ||||||
| Redeemed | (30,356 | ) | (95,489 | ) | ||||
| Total capital share transactions | (19,311 | ) | (51,215 | ) | ||||
| Net decrease from capital share transactions | (80,975 | ) | (102,414 | ) | ||||
| Net Increase (Decrease) In Net Assets | 56,647 | (145,473 | ) | |||||
| Net Assets: | ||||||||
| Beginning of period | 1,246,853 | 1,392,326 | ||||||
| End of period | $ | 1,303,500 | $ | 1,246,853 | ||||
| Undistributed (distribution in excess of) net investment income | $ | (1,536 | ) | $ | (67 | ) | ||
| Shares: | ||||||||
| Class IA | ||||||||
| Sold | 2,597 | 13,058 | ||||||
| Redeemed | (5,863 | ) | (15,958 | ) | ||||
| Total share activity | (3,266 | ) | (2,900 | ) | ||||
| Class IB | ||||||||
| Sold | 597 | 2,422 | ||||||
| Redeemed | (1,663 | ) | (5,358 | ) | ||||
| Total share activity | (1,066 | ) | (2,936 | ) | ||||
The accompanying notes are an integral part of these financial statements.
| 13 |
Hartford Small Company HLS Fund
Notes to Financial Statements
June 30, 2012 (Unaudited)
| (000’s Omitted) |
| 1. | Organization: |
Hartford Small Company HLS Fund (the “Fund”) serves as an underlying investment option for certain variable annuity and variable life insurance separate accounts of Hartford Life Insurance Company (“HLIC”) and its affiliates and certain qualified retirement plans. The Fund may also serve as an underlying investment option for certain variable annuity and variable life separate accounts of other insurance companies. Owners of variable annuity contracts and policyholders of variable life insurance contracts may choose the funds permitted in the variable insurance contract prospectus. In addition, participants in certain qualified retirement plans may choose the Fund if permitted by their plans.
Hartford Series Fund, Inc. (the “Company”) is an open-end registered management investment company comprised of thirty portfolios. Financial Statements for the Fund, a series of the Company, are included in this report.
The Company is organized under the laws of the State of Maryland and is registered with the Securities and Exchange Commission (“SEC”) under the Investment Company Act of 1940, as amended (“1940 Act”). The Fund is a diversified open-end management investment company.
The Fund is divided into Class IA and Class IB shares. Each class is offered at the per share net asset value (“NAV”) without a sales charge and is subject to the same expenses, except that the Class IB shares are subject to distribution and service fees charged pursuant to a Distribution Plan adopted in accordance with Rule 12b-1 under the 1940 Act.
| 2. | Significant Accounting Policies: |
The following is a summary of significant accounting policies of the Fund in the preparation of its financial statements, which are in accordance with the United States Generally Accepted Accounting Principles (“U.S. GAAP”). The preparation of financial statements in accordance with U.S. GAAP may require management to make estimates and assumptions that affect the reported amounts of assets and liabilities and disclosure of contingent assets and liabilities at the date of the financial statements and the reported amounts of increases and decreases in net assets from operations during the reporting period. Actual results could differ from those estimates.
| a) | Determination of Net Asset Value – The NAV of each class of the Fund’s shares is determined as of the close of regular trading (normally 4:00 p.m. Eastern Time) (the “NYSE Close”) on each day that the New York Stock Exchange (the “Exchange”) is open (“Valuation Date”). Information that becomes known to the Fund after the NAV has been calculated on a particular day will not generally be used to retroactively adjust the NAV determined earlier that day. |
| b) | Investment Valuation and Fair Value Measurements – For purposes of calculating the NAV, portfolio investments and other assets held by the Fund's portfolio for which market quotes are readily available are valued at market value. Market value is generally determined on the basis of last reported sales prices or official close price. If no sales are reported, market value is based on quotes obtained from a quotation reporting system, established market makers, or independent pricing services. If market prices are not readily available or are deemed unreliable, the Fund will use the fair value of the investment as determined in good faith under policies and procedures established by and under the supervision of the Company’s Board of Directors. Market quotes are considered not readily available where there is an absence of current or reliable market-based data (e.g., trade information or broker quotes), including where events occur after the close of the relevant market, but prior to the NYSE Close that materially affect the values of the Fund’s portfolio investments or assets. In addition, market quotes are considered not readily available when, due to extraordinary circumstances, the exchanges or markets on which the investments trade do not open for trading for the entire day and no other market prices are available. In addition, prices of foreign equities that are principally traded on certain foreign markets are adjusted daily pursuant to a fair value pricing service approved by the Board of Directors in order to reflect an adjustment for the factors occurring after the close of certain foreign markets but before the NYSE Close. Investments that are primarily traded on foreign markets may trade on days that are not business days of the Fund. The value of the |
| 14 |
foreign investments in which the Fund invests may change on days when a shareholder will not be able to purchase or redeem shares of the Fund. Fair value pricing is subjective in nature and the use of fair value pricing by the Fund may cause the NAV of its shares to differ significantly from the NAV that would have been calculated using market prices at the close of the exchange on which a portfolio investment is primarily traded. There can be no assurance that the Fund could obtain the fair market value assigned to an investment if the Fund were to sell the investment at approximately the time at which the Fund determines its NAV.
Investments valued in currencies other than U.S. dollars are converted to U.S. dollars using exchange rates obtained from independent pricing services for calculation of the NAV. As a result, the NAV of the Fund’s shares may be affected by changes in the value of currencies in relation to the U.S. dollar. The value of investments traded in markets outside the United States or denominated in currencies other than the U.S. dollar may be affected significantly on a day that the NYSE is closed and the market value may change on days when an investor is not able to purchase, redeem or exchange shares of the Fund.
Foreign currency contracts represent agreements to exchange currencies on specific future dates at predetermined rates. Foreign currency contracts are valued using foreign currency exchange rates and forward rates as provided by an independent pricing service on the Valuation Date.
Investments in open-end mutual funds are valued at the respective NAV of each open-end mutual fund on the Valuation Date.
Financial instruments for which prices are not available from an independent pricing service may be valued using market quotations obtained from one or more dealers that make markets in the respective financial instrument in accordance with procedures established by the Company’s Board of Directors.
U.S. GAAP defines fair value as the price that the Fund would receive to sell an asset or pay to transfer a liability in an orderly transaction between market participants. The U.S. GAAP fair value measurement standards require disclosure of a fair value hierarchy for each major category of assets and liabilities. Various inputs are used in determining the fair value of the Fund’s investments. These inputs are summarized into three broad hierarchy levels. This hierarchy is based on whether the valuation inputs are observable or unobservable. These levels are:
| · | Level 1 – Quoted prices in active markets for identical investments. Level 1 may include exchange traded instruments, such as domestic equities, some foreign equities, options, futures, mutual funds, exchange traded funds, rights and warrants. |
| · | Level 2 – Observable inputs other than Level 1 prices, such as quoted prices for similar investments; quoted prices in markets that are not active; or other inputs that are observable or can be corroborated by observable market data. Level 2 may include debt investments that are traded less frequently than exchange traded instruments and which are valued using independent pricing services; foreign equities, which are principally traded on certain foreign markets and are adjusted daily pursuant to a fair value pricing service in order to reflect an adjustment for the factors occurring after the close of certain foreign markets but before the NYSE Close; and short-term investments, which are valued at amortized cost. |
| · | Level 3 – Significant unobservable inputs that are supported by limited or no market activity. Level 3 may include financial instruments whose values are determined using indicative market quotes or require significant management judgment or estimation. These unobservable valuation inputs may include estimates for current yields, maturity/duration, prepayment speed, and indicative market quotes for comparable investments along with other assumptions relating to credit quality, collateral value, complexity of the investment structure, general market conditions and liquidity. This category may include investments where trading has been halted or there are certain restrictions on trading. While these investments are priced using unobservable inputs, the valuation of these investments reflects the best available data and management believes the prices are a reasonable representation of exit price. |
| 15 |
Hartford Small Company HLS Fund
Notes to Financial Statements – (continued)
June 30, 2012 (Unaudited)
| (000’s Omitted) |
The Board of Directors of the Company generally reviews and approves the “Procedures for Valuation of Portfolio Securities” on an annual basis. These procedures define how investments are to be valued, including the formation of a Valuation Committee. The Valuation Committee is responsible for determining in good faith the fair value of investments when the value cannot be obtained from primary pricing services or alternative sources or if the valuation of an investment as provided by the primary pricing service or alternative source is believed not to reflect the investment’s fair value as of the Valuation Date. Members of the Valuation Committee include the Fund’s Treasurer or designee, a Vice President of the Funds with legal expertise or designee, and a Vice President of the investment manager or designee. In addition, the Fund’s chief compliance officer shall designate a member of the compliance group to attend Valuation Committee meetings as a non-voting resource, to monitor for and provide guidance with respect to compliance with these procedures. Two members of the Valuation Committee or their designees, representing different departments, shall constitute a quorum for purposes of permitting the Valuation Committee to take action. The Valuation Committee will consider all relevant factors in determining an investment’s fair value, and may seek the advice of the Fund’s sub-adviser, knowledgeable brokers and legal counsel in making such determination. The Valuation Committee reports to the Audit Committee of the Company’s Board of Directors. The Audit Committee receives quarterly written reports which include details of all fair-valued investments, including the reason for the fair valuation, and an indication, when possible, of the accuracy of the valuation by disclosing the next available reliable public price quotation or the disposition price of such investments (the “look-back” test). The Board of Directors then must consider for ratification all of the fair value determinations made during the previous quarter.
Valuation levels are not necessarily indicative of the risk associated with investing in such investments. Individual investments within any of the above mentioned asset classes may be assigned a different hierarchical level than those presented above, as individual circumstances dictate.
For additional information, refer to the Investment Valuation Hierarchy Level Summary and the Level 3 roll-forward reconciliation which follow the Schedule of Investments.
For purposes of reporting transfers between different hierarchy levels, both transfers in and out of each level, as applicable, are shown as if they occurred at the beginning of the period.
| c) | Investment Transactions and Investment Income – Investment transactions are recorded as of the trade date (the date the order to buy or sell is executed) for financial reporting purposes. Investments purchased or sold on a when-issued or delayed-delivery basis may be settled a month or more after the trade date. Realized gains and losses are determined on the basis of identified cost. |
Dividend income is accrued as of the ex-dividend date, except certain dividends from foreign investments where the ex-dividend date may have passed are recorded as soon as the Fund is informed of the dividend. Interest income, including amortization of premium and accretion of discounts, is accrued on a daily basis.
| d) | Foreign Currency Transactions – Assets and liabilities denominated in currencies other than U.S. dollars are translated into U.S. dollars at the exchange rates in effect on the valuation date. Purchases and sales of investments, income, and expenses are translated into U.S. dollars at the exchange rates on the dates of such transactions. |
The Fund does not isolate that portion of portfolio investment valuation resulting from fluctuations in the foreign currency exchange rates from the fluctuations arising from changes in the market prices of investments held. Exchange rate fluctuations are included with the net realized and unrealized gain or loss on investments in the accompanying financial statements.
| 16 |
Net realized foreign exchange gains or losses arise from sales of foreign currencies and the difference between asset and liability amounts initially stated in foreign currencies and the U.S. dollar value of the amounts actually received or paid. Net unrealized foreign exchange gains or losses arise from changes in the value of other assets and liabilities at the end of the reporting period, resulting from changes in the exchange rates.
| e) | Joint Trading Account – The Fund may invest cash balances into a joint trading account that may be invested in one or more repurchase agreements. |
| f) | Fund Share Valuation and Dividend Distributions to Shareholders – Orders for the Fund’s shares are executed in accordance with the investment instructions of the contract holders and plan participants. The NAV of the Fund’s shares is determined as of the close of business on each business day of the Exchange. The NAV is determined separately for each class of shares of the Fund by dividing the Fund’s net assets attributable to that class by the number of shares of the class outstanding. Each class of shares offered by the Fund has equal rights as to assets and voting privileges (except that shareholders of a class have exclusive voting rights regarding any matter relating solely to that class of shares). Income and non-class specific expenses are allocated daily to each class on the basis of the relative net assets of the class. Realized and unrealized capital gains and losses are allocated daily based on the relative net assets of each class of shares of the Fund. |
Orders for the purchase of the Fund’s shares received prior to the close of the Exchange on any day the Exchange is open for business are priced at the NAV determined as of the close of the Exchange. Orders received after the close of the Exchange, or on a day on which the Exchange and/or the Fund is not open for business, are priced at the next determined NAV.
Dividends are declared pursuant to a policy adopted by the Company’s Board of Directors based upon the investment performance of the Fund. The policy of the Fund is to pay dividends from net investment income and realized capital gains, if any, at least once a year.
Distributions from net investment income, net realized capital gains and capital are determined in accordance with federal income tax regulations, which may differ from U.S. GAAP with respect to character and timing. These differences may include but are not limited to losses deferred due to wash sale adjustments, foreign currency gains and losses, adjustments related to Passive Foreign Investment Companies (“PFICs”), Real Estate Investment Trusts (“REITs”), Regulated Investment Companies (“RICs”), certain derivatives and partnerships. Permanent book and federal income tax basis differences relating to shareholder distributions will result in reclassifications to certain of the Fund’s capital accounts (see Federal Income Taxes: Reclassification of Capital Accounts note).
| 3. | Securities and Other Investments: |
| a) | Repurchase Agreements – A repurchase agreement is an agreement by which a counterparty agrees to sell an investment and agrees to repurchase the investment sold at a mutually agreed upon time and price. At the time the Fund enters into a repurchase agreement, the value of the underlying collateral, including accrued interest, will be equal to or exceed the value of the repurchase agreement. Repurchase agreements expose the Fund to counterparty risk. To minimize counterparty risk, the investments that serve to collateralize the repurchase agreement are held by the Fund’s custodian in book entry or physical form in the custodial account of the Fund or in a third party custodial account. Repurchase agreements are valued at cost plus accrued interest. The Fund, as shown on the Schedule of Investments, had outstanding repurchase agreements as of June 30, 2012. |
| b) | Illiquid and Restricted Investments – The Fund is permitted to invest up to 15% of its net assets in illiquid investments. Illiquid investments are those that may not be sold or disposed of in the ordinary course of business within seven days, at approximately the price used to determine the Fund’s NAV. The Fund may not be able to sell illiquid investments when its sub-adviser considers it desirable to do so or may have to sell such investments at a price that is lower than the price |
| 17 |
Hartford Small Company HLS Fund
Notes to Financial Statements – (continued)
June 30, 2012 (Unaudited)
| (000’s Omitted) |
that could be obtained if the investments were more liquid. A sale of illiquid investments may require more time and may result in higher dealer discounts and other selling expenses than does the sale of those that are liquid. Illiquid investments also may be more difficult to value due to the unavailability of reliable market quotations for such investments, and an investment in them may have an adverse impact on the Fund’s NAV. The Fund may also purchase certain restricted investments that can only be resold to certain qualified investors and may be determined to be liquid pursuant to policies and guidelines established by the Company’s Board of Directors. The Fund, as shown on the Schedule of Investments, had illiquid and/or restricted investments as of June 30, 2012.
| c) | Investments Purchased on a When-Issued or Delayed-Delivery Basis – Delivery and payment for investments that have been purchased by the Fund on a forward commitment, or when-issued or delayed-delivery basis, take place beyond the customary settlement period. A fund may dispose of or renegotiate a delayed-delivery transaction after it is entered into, and may sell delayed-delivery investments before they are delivered, which may result in a realized gain or loss. During this period, such investments are subject to market fluctuations, and the Fund identifies investments segregated in its records with a value at least equal to the amount of the commitment. The Fund, as shown on the Schedule of Investments, had when-issued or delayed delivery investments as of June 30, 2012. |
| 4. | Financial Derivative Instruments: |
The following disclosures contain information on how and why the Fund uses derivative instruments, the credit-risk-related contingent features in certain derivative instruments, and how derivative instruments affect the Fund’s financial position and results of operations. The location and fair value amounts of these instruments on the Statement of Assets and Liabilities and the realized gains and losses and changes in unrealized gains and losses on the Statement of Operations, each categorized by type of derivative contract, are included in the following Additional Derivative Instrument Information footnote. The derivative instruments outstanding as of period-end are disclosed in the notes to the Schedule of Investments and the amounts of realized gains and losses and changes in unrealized gains and losses on derivative instruments during the period are disclosed in the Statement of Operations.
| a) | Foreign Currency Contracts – The Fund may enter into foreign currency contracts that obligate the Fund to purchase or sell currencies at specified future dates. Foreign currency contracts are used to hedge the currency exposure associated with some or all of the Fund’s investments and/or as part of an investment strategy. Foreign currency contracts are marked to market daily and the change in value is recorded by the Fund as an unrealized gain or loss. The Fund will record a realized gain or loss when the foreign currency contract is settled. |
Foreign currency contracts involve elements of market risk in excess of the amounts reflected in the Statement of Assets and Liabilities. In addition, risks may arise upon entering into these contracts from the potential inability of the counterparties to meet the terms of the contracts and from unanticipated movements in the value of the foreign currencies relative to the U.S. dollar. The Fund had outstanding foreign currency contracts as shown on the Schedule of Investments as of June 30, 2012.
| b) | Additional Derivative Instrument Information: |
Fair Values of Derivative Instruments on the Statement of Assets and Liabilities as of June 30, 2012:
| Risk Exposure Category | ||||||||||||||||||||||||||||
| Interest Rate Contracts | Foreign Exchange Contracts | Credit Contracts | Equity Contracts | Commodity Contracts | Other Contracts | Total | ||||||||||||||||||||||
| Liabilities: | ||||||||||||||||||||||||||||
| Unrealized depreciation on foreign currency contracts | $ | — | $ | — | $ | — | $ | — | $ | — | $ | — | $ | — | ||||||||||||||
| Total | $ | — | $ | — | $ | — | $ | — | $ | — | $ | — | $ | — | ||||||||||||||
The volume of derivative activity was minimal during the six-month period ended June 30, 2012.
| 18 |
The effect of Derivative Instruments on the Statement of Operations for the six-month period ended June 30, 2012:
| Risk Exposure Category | ||||||||||||||||||||||||||||
| Interest Rate Contracts | Foreign Exchange Contracts | Credit Contracts | Equity Contracts | Commodity Contracts | Other Contracts | Total | ||||||||||||||||||||||
| Realized Gain (Loss) on Derivatives Recognized as a Result of Operations: | ||||||||||||||||||||||||||||
| Net realized gain on foreign currency contracts | $ | — | $ | 42 | $ | — | $ | — | $ | — | $ | — | $ | 42 | ||||||||||||||
| Total | $ | — | $ | 42 | $ | — | $ | — | $ | — | $ | — | $ | 42 | ||||||||||||||
| 5. | Principal Risks: |
| a) | Counterparty Risk – The Fund may be exposed to counterparty risk, or the risk that an institution or other entity with which the Fund has unsettled or open transactions will default. |
| b) | Market Risks – If the Fund invests directly in foreign currencies or in securities that trade in, and receive revenues in, foreign currencies, or in derivatives that provide exposure to foreign currencies, it will be subject to the risk that those currencies will decline in value relative to the base currency of the Fund, or, in the case of hedging positions, that the Fund’s base currency will decline in value relative to the currency being hedged. Currency rates in foreign countries may fluctuate significantly over short periods of time for a number of reasons, including changes in interest rates, intervention (or the failure to intervene) by U.S. or foreign governments, central banks or supranational entities, such as the International Monetary Fund, or by the imposition of currency controls or other political developments in the United States or abroad. As a result, the Fund’s investments in foreign currency denominated securities may reduce the returns of the Fund. The market values of equity securities, such as common stocks and preferred stocks, or equity related investments, such as futures and options, may decline due to general market conditions which are not specifically related to a particular company, such as real or perceived adverse economic conditions, changes in the general outlook for corporate earnings, changes in interest or currency rates or adverse investor sentiment generally. The market value of equity securities may also decline due to factors which affect a particular industry or industries, such as labor shortages or increased production costs and competitive conditions within an industry. Equity securities and equity related investments generally have greater market price volatility than fixed income securities. |
| 6. | Federal Income Taxes: |
| a) | Federal Income Taxes – For federal income tax purposes, the Fund intends to continue to qualify as a RIC under Subchapter M of the Internal Revenue Code (“IRC”) by distributing substantially all of its taxable net investment income and net realized capital gains to its shareholders and otherwise complying with the requirements of RICs. The Fund has distributed substantially all of its income and capital gains in prior years, if applicable, and intends to distribute substantially all of its income and capital gains prior to the next fiscal year-end. Accordingly, no provision for federal income or excise taxes has been made in the accompanying financial statements. Distributions from short-term capital gains are treated as ordinary income distributions for federal income tax purposes. |
| b) | Net Investment Income (Loss), Net Realized Gains (Losses) – Net investment income (loss) and net realized gains (losses) may differ for financial statement and tax purposes primarily because of losses deferred due to wash sale adjustments, foreign currency gains and losses, adjustments related to PFICs, REITs, RICs, certain derivatives and partnerships. The character of distributions made during the year from net investment income or net realized gains may differ from their ultimate characterization for federal income tax purposes. Also, due to the timing of dividend distributions, the fiscal year in which amounts are distributed may differ from the year that the income or realized gains (losses) were recorded by the Fund. |
| 19 |
Hartford Small Company HLS Fund
Notes to Financial Statements – (continued)
June 30, 2012 (Unaudited)
| (000’s Omitted) |
| c) | Components of Distributable Earnings – The Fund’s components of distributable earnings (deficit) on a tax basis at December 31, 2011, are as follows: |
| Amount | ||||
| Accumulated Capital and Other Losses* | $ | (1,214 | ) | |
| Unrealized Appreciation† | 14,500 | |||
| Total Accumulated Earnings | $ | 13,286 | ||
| * | The Fund has capital loss carryforwards that are identified in the Capital Loss Carryforward note that follows. | |
| † | The difference between book-basis and tax-basis unrealized appreciation (depreciation) may be attributable to the losses deferred due to wash sale adjustments, foreign currency gains and losses, adjustments related to PFICs, REITs, RICs, certain derivatives and partnerships. |
| d) | Reclassification of Capital Accounts – The Fund may record reclassifications in its capital accounts. These reclassifications have no impact on the total net assets of the Fund. The reclassifications are a result of permanent differences between U.S. GAAP and tax accounting for such items as foreign currency, PFICs, expiration or utilization of capital loss carryforwards or net operating losses. Adjustments are made to reflect the impact these items have on current and future distributions to shareholders. Therefore, the source of the Fund’s distributions may be shown in the accompanying Statement of Changes in Net Assets as from undistributed net investment income, from accumulated net realized gains on investments or from capital depending on the type of book and tax differences that exist. For the year ended December 31, 2011, the Fund recorded reclassifications to increase (decrease) the accounts listed below: |
| Amount | ||||
| Undistributed Net Investment Income | $ | 2,796 | ||
| Accumulated Net Realized Gain (Loss) | 272 | |||
| Capital Stock and Paid-in-Capital | (3,068 | ) | ||
| e) | Capital Loss Carryforward – On December 22, 2010, the Regulated Investment Company Modernization Act of 2010 (the “Act”) was enacted, which made changes to the capital loss carryforward rules. The changes are effective for taxable years beginning after the date of enactment. Under the Act, funds are permitted to carry forward capital losses for an unlimited period. However, any losses incurred during those future taxable years will be required to be utilized prior to the losses incurred in pre-enactment taxable years, which carry an expiration date. As a result of this ordering rule, pre-enactment capital loss carryforwards may be more likely to expire unused. Additionally, post-enactment capital loss carryforwards retain their character as either short-term or long-term capital losses rather than being considered all short-term as permitted under prior regulation. |
At December 31, 2011 (tax-year-end), the Fund had capital loss carryforwards for U.S. federal income tax purposes as follows:
| Year of Expiration | Amount | |||
| 2017 | $ | 1,214 | ||
| Total | $ | 1,214 | ||
During the year ended December 31, 2011, the Fund utilized $203,709 of prior year capital loss carryforwards
| f) | Accounting for Uncertainty in Income Taxes – The Fund has adopted financial reporting rules that require the Fund to analyze all open tax years, as defined by the statute of limitations, for all major jurisdictions. Generally, tax authorities can examine all tax returns filed for the last three years. The Fund does not have an examination in progress. |
| 20 |
The Fund has reviewed all open tax years and major jurisdictions and concluded that these financial reporting rules had no effect on the Fund’s financial position or results of operations. There is no tax liability resulting from unrecognized tax benefits relating to uncertain income tax positions taken or expected to be taken on the tax return for the fiscal year ended December 31, 2011. The Fund is also not aware of any tax positions for which it is reasonably possible that the total amounts of unrecognized tax benefits will significantly change in the next twelve months.
| 7. | Expenses: |
| a) | Investment Management Agreement – HL Investment Advisors, LLC (“HL Advisors”), an indirect wholly owned subsidiary of The Hartford Financial Services Group, Inc. (“The Hartford”), serves as investment manager to the Fund pursuant to an Investment Management Agreement with the Company. As investment manager, HL Advisors has overall investment supervisory responsibility for the Fund. In addition, HL Advisors provides administrative personnel, services, equipment, facilities and office space for proper operation of the Fund. HL Advisors has contracted with Wellington Management Company, LLP (“Wellington Management”) under a sub-advisory agreement for the provision of day-to-day investment management services to the Fund in accordance with the Fund’s investment objective and policies. The Fund pays a fee to HL Advisors, a portion of which may be used to compensate Wellington Management. |
The schedule below reflects the rates of compensation paid to HL Advisors for investment management services rendered as of June 30, 2012; the rates are accrued daily and paid monthly.
| Average Daily Net Assets | Annual Fee | |||
| On first $250 million | 0.7750 | % | ||
| On next $250 million | 0.7250 | % | ||
| On next $500 million | 0.6750 | % | ||
| On next $500 million | 0.6000 | % | ||
| On next $3.5 billion | 0.5500 | % | ||
| On next $5 billion | 0.5300 | % | ||
| Over $10 billion | 0.5200 | % | ||
| b) | Accounting Services Agreement – Pursuant to the Fund Accounting Agreement between HLIC and the Company, on behalf of the Fund, HLIC provides accounting services to the Fund and receives monthly compensation based on the Fund’s average daily net assets at the rates set forth below. The Fund’s accounting services fees are accrued daily and paid monthly. |
| Average Daily Net Assets | Annual Fee | |||
| On first $5 billion | 0.012 | % | ||
| Over $5 billion | 0.010 | % | ||
| c) | Operating Expenses – Allocable expenses incurred by the Company are allocated to each Fund and allocated to classes within a Fund in proportion to the average daily net assets of the Fund and each class, except where allocation of certain expenses is more fairly made directly to the Fund or to specific classes within a Fund. |
| d) | Fees Paid Indirectly – The Company, on behalf of the Fund, has entered into agreements with State Street Global Markets, LLC and Russell Implementation Services, Inc. to partially recapture non-discounted trade commissions. Such rebates are used to pay a portion of the Fund’s expenses. In addition, the Fund’s custodian bank has also agreed to reduce its fees when the Fund maintains cash on deposit in a non-interest-bearing custody account. For the six-month period ended June 30, 2012, these amounts, if any, are included in the Statement of Operations. |
| 21 |
Hartford Small Company HLS Fund
Notes to Financial Statements – (continued)
June 30, 2012 (Unaudited)
| (000’s Omitted) |
The ratio of expenses to average net assets in the accompanying financial highlights excludes the reduction in expenses related to fees paid indirectly. The annualized expense ratio for the period listed below reflecting the reduction for fees paid indirectly is as follows:
| Annualized Six- Month Period Ended June 30, 2012 | ||||
| Class IA | 0.71 | % | ||
| Class IB | 0.96 | % | ||
| e) | Distribution Plan for Class IB shares – The Company, on behalf of the Fund, has adopted a Distribution Plan pursuant to Rule 12b-1 of the 1940 Act to compensate the Distributor, Hartford Securities Distribution Company, Inc. (a wholly owned, ultimate subsidiary of The Hartford), from assets attributable to the Class IB shares for services rendered and expenses borne in connection with activities primarily intended to result in the sale of the Class IB shares, subject to the review and approval of the Company’s Board of Directors. |
The Distribution Plan provides that the Fund may pay annually up to 0.25% of the average daily net assets of the Fund attributable to its Class IB shares for activities primarily intended to result in the sale of Class IB shares. The Board has the authority to suspend or reduce these payments at any point in time. Under the terms of the Distribution Plan and the principal underwriting agreement, the Fund is authorized to make payments monthly to the Distributor that may be used to pay or compensate entities providing distribution and shareholder servicing with respect to the Class IB shares for such entities’ fees or expenses incurred or paid in that regard. These fees are accrued daily and paid monthly.
| f) | Other Related Party Transactions – Certain officers of the Fund are directors and/or officers of HL Advisors and/or The Hartford or its subsidiaries. For the six-month period ended June 30, 2012, a portion of the Fund’s chief compliance officer’s salary was paid by all the investment companies in the Hartford fund complex. The portion allocated to the Fund was in the amount of $1. Hartford Administrative Services Company (“HASCO”), an indirect wholly owned subsidiary of The Hartford, provides transfer agent services to the Fund. HASCO was compensated on a per account basis for providing such services. The amount paid to HASCO can be found in the Statement of Operations. These fees are accrued daily and paid monthly. |
| g) | Payments from Affiliates – In July of 2007, The Hartford entered into a settlement with the Attorneys General of the states of New York, Connecticut and Illinois relating to market timing and the company's individual variable annuity contracts in which certain payments would be made directly to the variable annuity contract holders. The distribution plan provided that unclaimed money from the settlement would be distributed to certain HLS Funds that are investment options through a Hartford individual variable annuity contract. The unclaimed money was distributed to the Fund on September 18, 2009. |
On June 8, 2007, the Fund was reimbursed for incorrect IPO allocations to the Fund.
On May 2, 2007, the Fund had trading reimbursements relating to the change in portfolio managers of the Fund.
| 22 |
The total return in the accompanying financial highlights includes payments from affiliates. Had the payments from the affiliates been excluded, the impact and total return for the periods listed below would have been as follows:
| For the Year Ended December 31, 2009 | ||||||||
| Class IA | Class IB | |||||||
| Impact from Payment from Affiliate for Attorneys General Settlement | 0.08 | % | 0.09 | % | ||||
| Total Return Excluding Payment from Affiliate | 29.18 | % | 28.90 | % | ||||
| For the Year Ended December 31, 2007 | ||||||||
| Class IA | Class IB | |||||||
| Impact from Payment from Affiliate for Trading Reimbursements | 0.16 | % | 0.16 | % | ||||
| Impact from Payment from Affiliate for Incorrect IPO Allocations | 0.03 | % | 0.03 | % | ||||
| Total Return Excluding Payments from Affiliates | 14.01 | % | 13.73 | % | ||||
| 8. | Investment Transactions: |
For the six-month period ended June 30, 2012, the Fund's aggregate purchases and sales of investment securities (excluding short-term investments) were as follows:
| Amount | ||||
| Cost of Purchases Excluding U.S. Government Obligations | $ | 744,329 | ||
| Sales Proceeds Excluding U.S. Government Obligations | 830,939 | |||
| 9. | Line of Credit: |
The Fund is one of several Hartford funds that participate in a $500 million committed revolving line of credit facility. The facility is to be used for temporary or emergency purposes. Under the arrangement, the funds are required to own securities having a market value in excess of 300% of the total bank borrowings. The interest rate on borrowings varies depending on the nature of the loan. The facility also requires a fee to be paid based on the amount of the commitment. This commitment fee is allocated to all of the funds participating in the line of credit based on the average net assets of the funds. During the six-month period ended June 30, 2012, the Fund did not have any borrowings under this facility.
| 10. | Industry Classifications: |
Other than the industry classifications “Other Investment Pools and Funds” and “Exchange Traded Funds,” equity industry classifications used in this report are the Global Industry Classification Standard, which was developed by and is the exclusive property and service mark of MSCI, Inc. and Standard & Poor’s.
| 11. | Indemnifications: |
Under the Company’s organizational documents, the Company shall indemnify its officers and directors to the full extent required or permitted under Maryland General Corporation Law and the federal securities laws. In addition, the Company, on behalf of the Fund, may enter into contracts that contain a variety of indemnifications. The Company’s maximum exposure under these arrangements is unknown. However, as of the date of these financial statements, the Company has not had prior claims or losses pursuant to these contracts and expects the risk of loss to be remote.
| 23 |
Hartford Small Company HLS Fund
| Financial Highlights |
| - Selected Per-Share Data (A) - |
| Class | Net Asset Value at Beginning of Period | Net Investment Income (Loss) | Payments from (to) Affiliate | Net Realized and Unrealized Gain (Loss) on Investments | Total from Investment Operations | Dividends from Net Investment Income | Distributions from Realized Capital Gains | Distributions from Capital | Total Distributions | Net Increase (Decrease) in Net Asset Value | Net Asset Value at End of Period | |||||||||||||||||||||||||||||||||
| For the Six-Month Period Ended June 30, 2012 (Unaudited) | ||||||||||||||||||||||||||||||||||||||||||||
| IA | $ | 17.07 | $ | (0.02 | ) | $ | – | $ | 1.91 | $ | 1.89 | $ | – | $ | – | $ | – | $ | – | $ | 1.89 | $ | 18.96 | |||||||||||||||||||||
| IB | 16.56 | (0.04 | ) | – | 1.86 | 1.82 | – | – | – | – | 1.82 | 18.38 | ||||||||||||||||||||||||||||||||
| For the Year Ended December 31, 2011 | ||||||||||||||||||||||||||||||||||||||||||||
| IA | 17.66 | (0.02 | ) | – | (0.57 | ) | (0.59 | ) | – | – | – | �� | (0.59 | ) | 17.07 | |||||||||||||||||||||||||||||
| IB | 17.18 | (0.09 | ) | – | (0.53 | ) | (0.62 | ) | – | – | – | – | (0.62 | ) | 16.56 | |||||||||||||||||||||||||||||
| For the Year Ended December 31, 2010 | ||||||||||||||||||||||||||||||||||||||||||||
| IA | 14.23 | (0.01 | ) | – | 3.44 | 3.43 | – | – | – | – | 3.43 | 17.66 | ||||||||||||||||||||||||||||||||
| IB | 13.88 | (0.06 | ) | – | 3.36 | 3.30 | – | – | – | – | 3.30 | 17.18 | ||||||||||||||||||||||||||||||||
| For the Year Ended December 31, 2009 | ||||||||||||||||||||||||||||||||||||||||||||
| IA | 11.01 | (0.01 | ) | 0.01 | 3.22 | 3.22 | – | – | – | – | 3.22 | 14.23 | ||||||||||||||||||||||||||||||||
| IB | 10.76 | (0.04 | ) | 0.01 | 3.15 | 3.12 | – | – | – | – | 3.12 | 13.88 | ||||||||||||||||||||||||||||||||
| For the Year Ended December 31, 2008 | ||||||||||||||||||||||||||||||||||||||||||||
| IA | 18.62 | 0.02 | – | (7.56 | ) | (7.54 | ) | (0.02 | ) | (0.05 | ) | – | (0.07 | ) | (7.61 | ) | 11.01 | |||||||||||||||||||||||||||
| IB | 18.20 | (0.01 | ) | – | (7.38 | ) | (7.39 | ) | – | (0.05 | ) | – | (0.05 | ) | (7.44 | ) | 10.76 | |||||||||||||||||||||||||||
| For the Year Ended December 31, 2007 (H) | ||||||||||||||||||||||||||||||||||||||||||||
| IA | 19.07 | – | 0.04 | 2.57 | 2.61 | (0.05 | ) | (3.01 | ) | – | (3.06 | ) | (0.45 | ) | 18.62 | |||||||||||||||||||||||||||||
| IB | 18.71 | (0.05 | ) | 0.04 | 2.51 | 2.50 | – | (3.01 | ) | – | (3.01 | ) | (0.51 | ) | 18.20 | |||||||||||||||||||||||||||||
| (A) | Information presented relates to a share outstanding throughout the indicated period. |
| (B) | The figures do not include sales charges or other fees which may be applied at the variable life insurance, variable annuity or qualified retirement plan product level. Any such additional sales charges or other fees would lower the Fund's performance. |
| (C) | Ratios do not reflect reductions for fees paid indirectly. Please see Fees Paid Indirectly in the Notes to Financial Statements. |
| (D) | Portfolio turnover rate is calculated on the basis of the Fund as a whole without distinguishing between the classes of shares issued. |
| (E) | Not annualized. |
| (F) | Annualized. |
| (G) | Total return without the inclusion of the Payment from (to) Affiliate can be found in Expenses in the accompanying Notes to Financial Statements. |
| (H) | Per share amounts have been calculated using the average shares method. |
| (I) | During the year ended December 31, 2007, Hartford Small Company HLS Fund received a $12.6 million in-kind subscription of securities from a shareholder in exchange for shares of this fund. This payment-in-kind was excluded from the portfolio turnover rate calculation. |
| 24 |
| Total Return(B) | Net Assets at End of Period | Ratio of Expenses to Average Net Assets Before Waivers(C) | Ratio of Expenses to Average Net Assets After Waivers(C) | Ratio of Net Investment Income (Loss) to Average Net Assets | Portfolio Turnover Rate(D) | |||||||||||||||||
| 11.10 | %(E) | $ | 1,150,021 | 0.72 | %(F) | 0.72 | %(F) | (0.19 | )%(F) | 57 | % | |||||||||||
| 10.96 | (E) | 153,479 | 0.97 | (F) | 0.97 | (F) | (0.44 | )(F) | – | |||||||||||||
| (3.36 | ) | 1,090,883 | 0.71 | 0.71 | (0.13 | ) | 99 | |||||||||||||||
| (3.62 | ) | 155,970 | 0.96 | 0.96 | (0.38 | ) | – | |||||||||||||||
| 24.13 | 1,180,045 | 0.73 | 0.73 | (0.08 | ) | 171 | ||||||||||||||||
| 23.83 | 212,281 | 0.98 | 0.98 | (0.33 | ) | – | ||||||||||||||||
| 29.29 | (G) | 1,026,150 | 0.75 | 0.75 | (0.07 | ) | 184 | |||||||||||||||
| 29.01 | (G) | 208,358 | 1.00 | 1.00 | (0.32 | ) | – | |||||||||||||||
| (40.60 | ) | 793,078 | 0.71 | 0.71 | 0.16 | 194 | ||||||||||||||||
| (40.73 | ) | 179,411 | 0.96 | 0.96 | (0.09 | ) | – | |||||||||||||||
| 14.23 | (G) | 1,292,444 | 0.70 | 0.70 | (0.02 | ) | 167 | (I) | ||||||||||||||
| 13.94 | (G) | 312,775 | 0.95 | 0.95 | (0.27 | ) | – | |||||||||||||||
| 25 |
Hartford Small Company HLS Fund
| Directors and Officers (Unaudited) |
The Board of Directors of the Company appoints officers who are responsible for the day-to-day operations of the Fund and who execute policies formulated by the Directors. Each director serves until his or her death, resignation, or retirement or until the next annual meeting of shareholders is held or until his or her successor is elected and qualifies.
Directors and officers who are employed by or who have a financial interest in The Hartford are considered “interested” persons of the Fund pursuant to the 1940 Act. Each officer and two of the Company’s directors, as noted in the chart below, are “interested” persons of the Fund. Each director serves as a director for The Hartford Mutual Funds, Inc., The Hartford Mutual Funds II, Inc., Hartford Series Fund, Inc., Hartford HLS Series Fund II, Inc., and as a trustee for The Hartford Alternative Strategies Fund, which, as of June 30, 2012, collectively consist of 89 funds. Correspondence may be sent to directors and officers c/o Hartford Mutual Funds, P.O. Box 2999, Hartford, Connecticut 06104-2999, except that correspondence to Mr. Annoni, Mr. Dressen and Ms. Fagely may be sent to 500 Bielenberg Drive, Woodbury, Minnesota 55125.
The table below sets forth, for each director and officer, his or her name, year of birth, current position with the Company and date first elected or appointed to Hartford Series Fund, Inc. (“HSF”), and Hartford HLS Series Fund II, Inc. (“HSF2”), principal occupation, and, for directors, other directorships held. The Fund’s statement of additional information contains further information on the directors and is available free of charge by calling 1-800-862-6668 or writing to Hartford HLS Funds, c/o Individual Annuity Services, P.O. Box 5085, Hartford, CT 06102-5085.
Information on the aggregate remuneration paid to the directors of the Company can be found in the Statement of Operations herein. The Fund pays to The Hartford a portion of the Chief Compliance Officer’s compensation, but does not pay salaries or compensation to any of their other officers or directors who are employed by The Hartford.
Non-Interested Directors
Lynn S. Birdsong (1946) Director since 2003, Co-Chairman of the Investment Committee
Mr. Birdsong is a private investor. Mr. Birdsong currently serves as a Director of the Sovereign High Yield Investment Company (April 2010 to current). Mr. Birdsong currently serves as an Independent Director of Nomura Partners Funds, Inc. (formerly, The Japan Fund) (March 2003 to current). From 1979 to 2002, Mr. Birdsong was a managing director of Zurich Scudder Investments, an investment management firm. During his employment with Scudder, Mr. Birdsong was an Interested Director of The Japan Fund. Since 1981, Mr. Birdsong has been a partner in Birdsong Company, an advertising specialty firm.
Robert M. Gavin, Jr. (1940) Director since 2002 (HSF) and 1986 (HSF2), Chairman of the Board since 2004
Dr. Gavin is an educational consultant. Prior to September 1, 2001, he was President of Cranbrook Education Community and prior to July 1996, he was President of Macalester College, St. Paul, Minnesota.
Duane E. Hill (1945) Director since 2001 (HSF) and 2002 (HSF2), Chairman of the Nominating Committee
Mr. Hill is Partner of TSG Ventures L.P., a private equity investment company. Mr. Hill is a former partner of TSG Capital Group, a private equity investment firm that served as sponsor and lead investor in leveraged buyouts of middle market companies.
Sandra S. Jaffee (1941) Director since 2005
Ms. Jaffee is the founder and Chief Executive Officer of a private company, Homeworks Concierge, LLC, which provides residential property management services in Westchester County, New York (January 2012 to present). Ms. Jaffee served as Chairman (2008 to 2009) and Chief Executive Officer of Fortent (formerly Searchspace Group), a leading provider of compliance/regulatory technology to financial institutions from August 2005 to August 2009. Ms. Jaffe currently serves as a member of the Board of Directors of Broadridge Financial Solutions as well as a Trustee of Muhlenberg College.
William P. Johnston (1944) Director since 2005, Chairman of the Compliance Committee
In June 2006, Mr. Johnston was appointed as Senior Advisor to The Carlyle Group, a global private equity investment firm. In August 2007, Mr. Johnston was elected to the Board of Directors of LifeCare Holdings, Inc. In February 2008, Mr. Johnston was elected to the Board of Directors of HCR-ManorCare, Inc. In May 2006, Mr. Johnston was elected to the Supervisory Board of Fresenius Medical Care AG & Co. KGaA, after its acquisition of Renal Care Group, Inc. in March 2006.
Phillip O. Peterson (1944) Director since 2002 (HSF) and 2000 (HSF2), Chairman of the Audit Committee
Mr. Peterson is a mutual fund industry consultant. He was a partner of KPMG LLP (an accounting firm) until July 1999. Mr. Peterson joined William Blair Funds in February 2007 as a member of the Board of Trustees. Mr. Peterson also joined the Board of Trustees of Symetra Variable Mutual Funds Trust as a trustee in February 2012.
| 26 |
Lemma W. Senbet (1946) Director since 2005
Dr. Senbet is the William E. Mayer Chair Professor of Finance and Director, Center for Financial Policy, at the University of Maryland, Robert H. Smith School of Business. He was chair of the Finance Department from 1998 to 2006. Previously he was a chaired professor of finance at the University of Wisconsin-Madison. Also, he was director of the Fortis Funds from March 2000 to July 2002. Dr. Senbet served the finance profession in various capacities, including as director of the American Finance Association and President of the Western Finance Association. In 2006, Dr. Senbet was inducted Fellow of Financial Management Association International for his career-long distinguished scholarship and professional service.
Interested Directors and Officers
David N. Levenson (1966) Director since 2010(1)
Mr. Levenson currently serves as President of The Hartford’s Wealth Management business. He was appointed to this role in July 2010. Previously, Mr. Levenson served as Executive Vice President of Legacy Holdings for The Hartford from June 2009 to July 2010. From 2006 to 2009, Mr. Levenson was with Hartford Life Insurance K.K. where he served as President and Chief Executive Officer from 2007 to 2009. He served as Managing Director of Hartford Investment Management Company from 2005 to 2006. Additionally, Mr. Levenson serves as Executive Vice President of The Hartford and as President, Director and Chief Executive Officer of Hartford Life Insurance Company (“HLIC”) and Hartford Life, Inc. (“HL Inc.”).
(1) Mr. Levenson served as Interested Director until August 2, 2012.
Lowndes A. Smith (1939) Director since 1996 (HSF) and 2002 (HSF2), Co-Chairman of the Investment Committee
Mr. Smith served as Vice Chairman of The Hartford from February 1997 to January 2002, as President and Chief Executive Officer of HL Inc. from February 1997 to January 2002, and as President and Chief Operating Officer of The Hartford Life Insurance Companies from January 1989 to January 2002. Mr. Smith serves as a Director of White Mountains Insurance Group, Ltd., One Beacon Insurance and Symetra Financial and as Managing Director of Whittington Gray Associates.
Other Officers
James E. Davey (1964) President and Chief Executive Officer since 2010(2)
Mr. Davey serves as Executive Vice President of HLIC. Additionally, Mr. Davey serves as President, Chief Executive Officer and Manager of HIFSCO and President, Chief Executive Officer and Manager of HL Investment Advisors, LLC (“HL Advisors”). Mr. Davey joined The Hartford in 2002.
(2) Mr. Davey became an Interested Director effective August 2, 2012.
Mark A. Annoni (1964) Vice President, Controller and Treasurer since 2012(3)
Mr. Annoni serves as the Assistant Vice President and Director of Investment Finance (February 2004 to present). Mr. Annoni joined The Hartford in April 2001 as part of The Hartford’s acquisition of Fortis Financial Group. Prior to joining The Hartford, Mr. Annoni served as Manager of Mutual Fund Accounting at Fortis Financial Group (July 1997 to April 2001).
(3) Mr. Annoni was named Vice President, Controller and Treasurer on May 8, 2012.
Michael R. Dressen (1963) AML Compliance Officer since 2011
Mr. Dressen currently serves as Assistant Vice President of HLIC. He also serves as Chief Compliance Officer and AML Compliance Officer of Hartford Administrative Services Company (“HASCO”) and as Assistant Secretary and Compliance Officer of HIFSCO. Mr Dressen joined The Hartford in 2005 from State Farm Insurance Companies where he held various positions related to mutual funds, variable products, and property casualty insurance.
Tamara L. Fagely (1958) Vice President, since 2002 (HSF) and 1993 (HSF2)(4)
Ms. Fagely has been a Vice President of HASCO since 1998 and Chief Financial Officer since 2006. Currently Ms. Fagely is a Vice President of HLIC. She served as Assistant Vice President of HLIC from December 2001 through March 2005. In addition, Ms. Fagely is Controller and Chief Financial Officer of HIFSCO.
(4) Ms. Fagely served as Vice President, Controller and Treasurer until May 8, 2012.
Dr. Robert J. Froehlich (1953) Senior Managing Director since 2009(5)
Dr. Froehlich joined The Hartford as Senior Managing Director in September 2009. Prior to joining The Hartford, Dr. Froehlich served as Vice Chairman of Deutsche Asset Management from 1997-2009.
(5) Dr. Froehlich served as Senior Managing Director until March 26, 2012.
| 27 |
Hartford Small Company HLS Fund
| Directors and Officers (Unaudited) – (continued) |
Edward P. Macdonald (1967) Vice President, Secretary and Chief Legal Officer since 2005
Mr. Macdonald serves as Vice President of HLIC and Chief Legal Officer of Mutual Funds and Vice President of HIFSCO. He also serves as Vice President and Secretary of HASCO, and Chief Legal Officer, Secretary and Vice President of HL Advisors. Mr. Macdonald joined The Hartford in 2005.
Vernon J. Meyer (1964) Vice President since 2006
Mr. Meyer serves as Senior Vice President of HLIC. He also serves as Senior Vice President of HIFSCO and HL Advisors. Mr. Meyer joined The Hartford in 2004.
Colleen B. Pernerewski (1969) Vice President and Chief Compliance Officer since 2010
Ms. Pernerewski serves as Vice President and Chief Investment Advisor Compliance Officer of HIFSCO and as Vice President and Chief Compliance Officer of HL Advisors. Ms. Pernerewski serves as Vice President and Chief Compliance Officer of Individual Annuity of HLIC. Ms. Pernerewski joined The Hartford in 2005 from Travelers Life and Annuity where she served as Counsel (2004-2005). Prior to Travelers Life and Annuity, Ms. Pernerewski held the position of Counsel at The Hartford (1998-2004).
Elizabeth L. Schroeder (1966) Vice President since 2010
Ms. Schroeder currently serves as Assistant Vice President of HLIC. Ms. Schroeder joined HLIC in 1991. She is also an Assistant Vice President of HASCO, HIFSCO and HL Advisors.
Martin Swanson (1962) Vice President since 2010
Mr. Swanson is a Vice President of HLIC. Mr. Swanson also serves as Vice President/Marketing for HIFSCO. Prior to joining HLIC in 1998, Mr. Swanson was a Vice President at PaineWebber, Inc.
Jane Wolak (1961) Vice President since 2009
Ms. Wolak currently serves as Senior Vice President of HLIC. Ms. Wolak joined HLIC as Vice President, Retail Product Services in May 2007. She is also Vice President of HASCO. Previously, Ms. Wolak was with Sun Life Financial where she held the position of Vice President, Service Center Operations from 2001-2007.
HOW TO OBTAIN A COPY OF THE FUND’S PROXY VOTING POLICIES AND VOTING RECORDS (UNAUDITED)
A description of the policies and procedures that the Fund uses to determine how to vote proxies relating to portfolio securities and a record of how the Fund voted any proxies for the twelve-month period ended June 30, 2012 are available (1) without charge, upon request, by calling 800-862-6668 and (2) on the SEC’s website at http://www.sec.gov.
QUARTERLY PORTFOLIO HOLDINGS INFORMATION (UNAUDITED)
The Fund files a complete schedule of portfolio holdings with the SEC for the first and third quarters of each fiscal year on Form N-Q. The Fund’s Forms are available (1) without charge, upon request, by calling 800-862-6668 and (2) on the SEC’s website at http://www.sec.gov. The Form N-Q may be reviewed and copied at the SEC’s Public Reference Room in Washington, DC. Information on the operation of the Public Reference Room may be obtained by calling 1-800-SEC-0330.
| 28 |
Hartford Small Company HLS Fund
| Expense Example (Unaudited) |
Your Fund's Expenses
As a shareholder of the Fund, you incur two types of costs: (1) transaction costs and (2) ongoing costs including investment management fees, distribution fees, and other fund expenses. This example is intended to help you understand your ongoing costs (in dollars) of investing in the Fund and to compare these costs with the ongoing costs of investing in other mutual funds. The example is based on an investment of $1,000 invested at the beginning of the period and held for the period of December 31, 2011 through June 30, 2012.
Actual Expenses
The first set of columns of the table below provides information about actual account values and actual expenses. You may use the information in this column, together with the amount you invested, to estimate the expenses that you paid over the period. Simply divide your account value by $1,000 (for example, an $8,600 account value divided by $1,000 = 8.6), then multiply the result by the number in the line under the heading entitled “Expenses Paid During Period” to estimate the expenses you paid on your account during this period.
Hypothetical Example for Comparison Purposes
The second set of columns of the table below provides information about hypothetical account values and hypothetical expenses based on the Fund’s actual expense ratio and an assumed rate of return of 5% per year before expenses, which is not the Fund’s actual return. The hypothetical account values and expenses may not be used to estimate the actual ending account balance or expenses you paid for the period. You may use this information to compare the ongoing costs of investing in the Fund and other funds. To do so, compare this 5% hypothetical example with the 5% hypothetical examples that appear in the shareholder reports of the other funds.
Please note that the expenses shown in the table are meant to highlight your ongoing costs only and do not reflect any transactional costs, such as sales charges (loads) and CDSC. Therefore, the second set of columns of the table is useful in comparing ongoing costs only, and will not help you determine the relative total costs of owning different funds. In addition, if these transactional costs were included, your costs would be higher. Expenses are equal to the Fund's annualized expense ratios multiplied by average account value over the period, multiplied by 182/366 (to reflect the one-half year period).
| Actual return | Hypothetical (5% return before expenses) | |||||||||||||||||||||||||||||||||||
| Beginning Account Value December 31, 2011 | Ending Account Value June 30, 2012 | Expenses paid during the period December 31, 2011 through June 30, 2012 | Beginning Account Value December 31, 2011 | Ending Account Value June 30, 2012 | Expenses paid during the period December 31, 2011 through June 30, 2012 | Annualized expense ratio | Days in the current 1/2 year | Days in the full year | ||||||||||||||||||||||||||||
| Class IA | $ | 1,000.00 | $ | 1,110.99 | $ | 3.78 | $ | 1,000.00 | $ | 1,021.28 | $ | 3.62 | 0.72 | % | 182 | 366 | ||||||||||||||||||||
| Class IB | $ | 1,000.00 | $ | 1,109.60 | $ | 5.09 | $ | 1,000.00 | $ | 1,020.04 | $ | 4.87 | 0.97 | % | 182 | 366 | ||||||||||||||||||||
| 29 |
HARTFORD HLS FUNDS
c/o The Hartford Wealth Management - Global Annuities
P.O. Box 14293
Lexington, KY 40512-4293
Hartford Series Fund, Inc. is underwritten and distributed by Hartford Securities Distribution Company, Inc.
"The Hartford" is The Hartford Financial Services Group, Inc. and its subsidiaries.
Hartford Series Fund, Inc. inception dates range from 1977 to date. Hartford Series Fund, Inc. is not a subsidiary of The Hartford but is underwritten, distributed by and advised by subsidiaries of The Hartford. Investments in Hartford Series Fund, Inc. are not guaranteed by The Hartford or any other entity.
You should carefully consider investment objectives, risks, and charges and expenses of Hartford HLS Funds before investing. This and other information can be found in the Fund’s prospectus or summary prospectus, which can be obtained by calling 800-862-6668. Please read them carefully before you invest or send money.
| HLSSAR-SC12 8-12 111647 Printed in U.S.A ©2012 The Hartford, Hartford, CT 06115 | |

A MESSAGE FROM THE PRESIDENT
Dear Fellow Shareholders:
I want to take this opportunity to say thank you for investing in the Hartford HLS Funds. We’ve seen continued market volatility throughout the first half of 2012, and there will likely be continued uncertainty until the Presidential election in November, but we are still optimistic about the markets in 2012.
Market Review
In the first quarter of 2012, the S&P 500 Index turned in its best quarterly performance since the third quarter of 2009. U.S. equities showed signs of improvement as investors focused on improving economic data and strong corporate earnings news and the Federal Reserve’s pledge to keep interest rates low buoyed investors’ appetites.
The second quarter ended on a high note for the stock market—the S&P 500 had its strongest June in more than a decade and the Dow Jones Industrial Average had its best month since October—but those gains weren’t enough to offset losses from April and May, and equities finished the quarter in the red. Although the S&P 500 was -2.75 for the second quarter, it was up 9.49% for the first half of 2012.
Concerns about domestic and European unemployment are having an effect on our economy. The unemployment rate in the euro zone's 17 nations rose to a record 11.1% in May, the highest level since the euro launched as a common currency more than 10 years ago. In the U.S., the labor market has been fickle this year, with job growth starting off strong in the first couple months of 2012 but slowing down in the spring, which has led many to wonder about the status of the economic recovery.
On a positive note, home prices are rising again after falling for more than five years, new and existing home sales are increasing, and home builders are ramping up construction.
The Hartford HLS Funds Expands Relationship with Wellington Management
We’re very pleased that we are expanding our relationship with Wellington Management, which will now serve as the primary sub-adviser for the Hartford HLS Funds including equity, fixed-income,* and asset-allocation funds. One of America’s oldest and largest investment management firms, Wellington Management has resources that span the entire globe, with multiple offices across the U.S. and numerous offices abroad. Wellington Management’s most distinctive strength is its proprietary research, which is shared across the entire organization.
We believe that aligning more closely with a well-respected money manager like Wellington Management puts us in a strong position to drive significant growth and to continue delivering innovative fund strategies to help our investors meet their financial goals.
Thank you again for investing with the Hartford HLS Funds.
James Davey
President
Hartford HLS Funds
*Several fixed-income funds will continue to be sub-advised by Hartford Investment Management Company.
Table of Contents
This report is prepared for the general information of contract owners and qualified retirement plan participants. It is not an offer of contracts or of qualified retirement plans. It should not be used in connection with any offer, except in conjunction with the appropriate product prospectus which contains all pertinent information including the applicable sales, administrative and other charges.
The views expressed in the Fund’s Manager Discussion under ‘‘Why did the Fund perform this way?’’ and ‘‘What is the outlook?’’ are views of the Fund’s sub-adviser and portfolio management team through the end of the period and are subject to change based on market and other conditions.
| Hartford Stock HLS Fund inception 08/31/1977 |
| (sub-advised by Wellington Management Company, LLP) |
| Investment objective – Seeks long-term growth of capital. |
Performance Overview 6/30/02 - 6/30/12

The chart above shows the growth of a $10,000 investment in Class IA. Growth results in classes other than Class IA will vary from what is seen above due to differences in the expenses charged to those share classes.
Average Annual Total Returns (as of 6/30/12)
| 6 Month† | 1 Year | 5 year | 10 year | |||||||||||||
| Stock IA | 10.22 | % | 4.55 | % | -0.66 | % | 4.84 | % | ||||||||
| Stock IB | 10.08 | % | 4.29 | % | -0.91 | % | 4.57 | % | ||||||||
| Russell 1000 Index | 9.38 | % | 4.37 | % | 0.39 | % | 5.72 | % | ||||||||
| S&P 500 Index | 9.48 | % | 5.43 | % | 0.21 | % | 5.33 | % | ||||||||
| † | Not Annualized |
PAST PERFORMANCE IS NOT INDICATIVE OF FUTURE RESULTS.
Total returns presented above were calculated using the Fund's net asset value available to shareholders for sale or redemption of Fund shares on June 30, 2012, which may exclude investment transactions as of this date.
Russell 1000 Index is an unmanaged index which measures the performance of the 1,000 largest companies in the Russell 3000 Index, which measures the performance of the 3,000 largest U.S. companies, based on total market capitalization.
S&P 500 Index is a market capitalization-weighted price index composed of 500 widely held common stocks.
You cannot invest directly in an index.
The chart represents a hypothetical investment in the Fund. Performance data represents past performance and current performance could be higher or lower.
Performance information may reflect historical or current expense waivers/reimbursements from the investment adviser, without which performance would have been lower. For information on current expense waivers/reimbursements, please see the prospectus.
The value of the Fund will fluctuate so that when redeemed, it may be worth more or less than the original investment. The chart and table do not reflect the deductions of taxes, sales charges or other fees which may be applied at the variable life insurance, variable annuity or qualified retirement plan product level. Any such additional sales charges or other fees or expenses would lower the contract’s or plan’s performance.
| 2 |
| Hartford Stock HLS Fund |
| Manager Discussion |
| June 30, 2012 (Unaudited) |
Portfolio Managers
Donald J. Kilbride*
Senior Vice President and Equity Portfolio Manager
* Appointed as a Portfolio Manager for the Fund as of April 30, 2012. As of the same date, Steven T. Irons and Peter I. Higgins no longer serve as portfolio managers for the Fund.
How did the Fund perform?
The Class IA shares of the Hartford Stock HLS Fund returned 10.22% for the six-month period ended June 30, 2012, outperforming both the S&P 500 Index which returned 9.48% and the Russell 1000 Index which returned 9.38% for the same period. The Fund also outperformed the 7.71% return of the average fund in the Lipper Large Cap Core VP-UF Funds peer group, a group of funds with investment strategies similar to those of the Fund.
Why did the Fund perform this way?
The first and second quarters of 2012 were near mirror images of one another in terms of what worked and what did not. U.S. equities rallied at the start of the year based on improving macroeconomic data, including lower unemployment levels and improving consumer confidence. Following a strong first quarter, equities retreated in April, fell sharply in May, and recovered modestly in June. Fears surrounding European sovereign debt difficulties reclaimed center stage.
Overall equity market performance was positive for the period across all market capitalizations: large cap equities (+9.4%) outperformed mid caps (+7.9%), and small caps (+8.5%) equities as represented by the Russell 1000, S&P MidCap 400, and Russell 2000 indices, respectively. During the six-month period nine of ten sectors rose within the Russell 1000 Index, led by Telecommunication Services (+17%), Financials (+13%), and Information Technology (+13%). Energy (-3%) lagged on both an absolute and a relative basis.
The Fund’s outperformance versus the benchmark was driven by strong security selection in Consumer Discretionary and Financials, as well as an overweight exposure (i.e. the Fund’s sector position was greater than the benchmark position) to the Information Technology sector and an underweight exposure to the Financials sector. This was modestly offset by weak selection in Information Technology and Health Care, as well as an underweight exposure to Telecommunication Services. Note that sector positioning is a result of bottom-up security selection (i.e. stock by stock fundamental research).
Top contributors to relative performance (i.e. performance of the Fund as measured against the benchmark) during the period were JPMorgan Chase (Financials), Johnson & Johnson (Health Care), and Harley-Davidson (Industrials). Shares of financial services firm JPMorgan Chase fell sharply after the company announced an unexpected trading loss stemming from a long standing economic hedging program designed to manage risk against overall credit exposures. Not owning shares of benchmark component JPMorgan Chase at the time of the trading loss announcement contributed positively to relative performance. Shares of Johnson & Johnson, a leading pharmaceutical company, reacted favorably to the completion of their acquisition of Swiss medical device company Synthes Inc. Motorcycle manufacturer Harley-Davidson saw its shares rise in the first four months of the year as it announced strong earnings which exceeded expectations. Apple (Information Technology) and Wells Fargo (Financials) also contributed positively to the Fund’s returns on an absolute (i.e. total return) basis.
Stocks that detracted the most from relative returns during the period were Google (Information Technology), Nike (Consumer Discretionary), and Western Union (Information Technology). Google, a leading provider of online search, internet content services, and web-based software applications, saw its shares decline in the face of a potential slow down in advertising expenditure in a lower global growth environment. Shares of Nike, a footwear, apparel and sports equipment retailer, fell due to weaker than expected demand and margin trends. Money movement and payment services company Western Union reported muted transaction and revenue growth as macroeconomic uncertainty in Southern Europe and new regulations in Italy weighed on results. Our holdings in BG Group (Energy) also detracted from returns on an absolute basis.
What is the outlook?
Threats to a U.S. economic slowdown seem increasingly worrisome today. That is largely true based on a more cautious outlook in the U.S. We believe continued uncertainty in Washington, DC has placed a cloud over the market. The
| 3 |
| Hartford Stock HLS Fund |
| Manager Discussion – (continued) |
| June 30, 2012 (Unaudited) |
growing prospect of a U.S. slowdown could be verified by second quarter results and add to the markets’ volatility.
Our efforts are focused on companies with above-average growth in dividends which we believe is an effective and often overlooked indicator of high quality, shareholder-oriented companies. We believe these companies tend to produce consistent, above-average returns over time and in order to grow dividends, they must produce not only growth in reported earnings but also growth in free cash flow. In our view, they also need to allocate free cash flow effectively by reinvesting capital selectively, and returning excess capital to shareholders. We believe that a portfolio of high-quality stocks with superior prospects for dividend growth, selling at reasonable valuation levels, can produce superior total returns over time. At the end of the period, our bottom-up investment approach resulted in overweight exposures in Consumer Discretionary, Industrials, and Health Care, as we found a number of attractive investment opportunities in these sectors. The Fund’s largest underweight exposures relative to the Russell 1000 Index were in Financials, Information Technology, and Telecommunication Services.
Diversification by Industry
as of June 30, 2012
| Industry (Sector) | Percentage of Net Assets | |||
| Banks (Financials) | 4.2 | % | ||
| Capital Goods (Industrials) | 9.3 | |||
| Commercial & Professional Services (Industrials) | 1.3 | |||
| Consumer Durables & Apparel (Consumer Discretionary) | 3.4 | |||
| Consumer Services (Consumer Discretionary) | 1.6 | |||
| Energy (Energy) | 11.9 | |||
| Food & Staples Retailing (Consumer Staples) | 3.6 | |||
| Food, Beverage & Tobacco (Consumer Staples) | 4.8 | |||
| Health Care Equipment & Services (Health Care) | 5.7 | |||
| Household & Personal Products (Consumer Staples) | 4.0 | |||
| Insurance (Financials) | 4.1 | |||
| Materials (Materials) | 3.7 | |||
| Media (Consumer Discretionary) | 4.4 | |||
| Pharmaceuticals, Biotechnology & Life Sciences (Health Care) | 9.5 | |||
| Retailing (Consumer Discretionary) | 6.8 | |||
| Software & Services (Information Technology) | 13.8 | |||
| Transportation (Industrials) | 4.3 | |||
| Utilities (Utilities) | 1.6 | |||
| Short-Term Investments | 1.1 | |||
| Other Assets and Liabilities | 0.9 | |||
| Total | 100.0 | % | ||
| 4 |
| Hartford Stock HLS Fund |
| Schedule of Investments |
| June 30, 2012 (Unaudited) |
| (000’s Omitted) |
| Shares or Principal Amount | Market Value ╪ | |||||||
| COMMON STOCKS - 98.0% | ||||||||
| Banks - 4.2% | ||||||||
| 630 | PNC Financial Services Group, Inc. | $ | 38,530 | |||||
| 1,149 | Wells Fargo & Co. | 38,419 | ||||||
| 76,949 | ||||||||
| Capital Goods - 9.3% | ||||||||
| 453 | Emerson Electric Co. | 21,102 | ||||||
| 539 | General Dynamics Corp. | 35,572 | ||||||
| 501 | Honeywell International, Inc. | 27,996 | ||||||
| 418 | Lockheed Martin Corp. | 36,411 | ||||||
| 415 | Northrop Grumman Corp. | 26,502 | ||||||
| 302 | United Technologies Corp. | 22,813 | ||||||
| 170,396 | ||||||||
| Commercial & Professional Services - 1.3% | ||||||||
| 730 | Waste Management, Inc. | 24,375 | ||||||
| Consumer Durables & Apparel - 3.4% | ||||||||
| 954 | Mattel, Inc. | 30,961 | ||||||
| 354 | NIKE, Inc. Class B | 31,073 | ||||||
| 62,034 | ||||||||
| Consumer Services - 1.6% | ||||||||
| 326 | McDonald's Corp. | 28,852 | ||||||
| Energy - 11.9% | ||||||||
| 1,746 | BG Group plc | 35,748 | ||||||
| 300 | Chevron Corp. | 31,639 | ||||||
| 906 | Enbridge, Inc. | 36,167 | ||||||
| 634 | Exxon Mobil Corp. | 54,245 | ||||||
| 693 | Occidental Petroleum Corp. | 59,420 | ||||||
| 217,219 | ||||||||
| Food & Staples Retailing - 3.6% | ||||||||
| 770 | CVS Caremark Corp. | 35,997 | ||||||
| 436 | Wal-Mart Stores, Inc. | 30,418 | ||||||
| 66,415 | ||||||||
| Food, Beverage & Tobacco - 4.8% | ||||||||
| 320 | Coca-Cola Co. | 25,036 | ||||||
| 882 | PepsiCo, Inc. | 62,342 | ||||||
| 87,378 | ||||||||
| Health Care Equipment & Services - 5.7% | ||||||||
| 966 | Cardinal Health, Inc. | 40,590 | ||||||
| 1,142 | Medtronic, Inc. | 44,230 | ||||||
| 321 | UnitedHealth Group, Inc. | 18,764 | ||||||
| 103,584 | ||||||||
| Household & Personal Products - 4.0% | ||||||||
| 327 | Colgate-Palmolive Co. | 34,075 | ||||||
| 643 | Procter & Gamble Co. | 39,382 | ||||||
| 73,457 | ||||||||
| Insurance - 4.1% | ||||||||
| 480 | ACE Ltd. | 35,605 | ||||||
| 279 | Chubb Corp. | 20,305 | ||||||
| 615 | Marsh & McLennan Cos., Inc. | 19,806 | ||||||
| 75,716 | ||||||||
| Materials - 3.7% | ||||||||
| 570 | Ecolab, Inc. | 39,096 | ||||||
| 267 | Praxair, Inc. | 28,995 | ||||||
| 68,091 | ||||||||
| Media - 4.4% | ||||||||
| 700 | Comcast Corp. Class A | 22,378 | ||||||
| 552 | Omnicom Group, Inc. | 26,851 | ||||||
| 652 | Walt Disney Co. | 31,627 | ||||||
| 80,856 | ||||||||
| Pharmaceuticals, Biotechnology & Life Sciences - 9.5% | ||||||||
| 433 | Amgen, Inc. | 31,635 | ||||||
| 888 | Johnson & Johnson | 60,000 | ||||||
| 1,739 | Pfizer, Inc. | 39,986 | ||||||
| 243 | Roche Holding AG | 41,917 | ||||||
| 173,538 | ||||||||
| Retailing - 6.8% | ||||||||
| 9,440 | Allstar Co. ⌂† | 13,893 | ||||||
| 10,986 | Buck Holdings L.P. ⌂●† | 20,012 | ||||||
| 1,225 | Lowe's Co., Inc. | 34,831 | ||||||
| 964 | Target Corp. | 56,087 | ||||||
| 124,823 | ||||||||
| Software & Services - 13.8% | ||||||||
| 460 | Accenture plc | 27,632 | ||||||
| 965 | Automatic Data Processing, Inc. | 53,715 | ||||||
| 221 | IBM Corp. | 43,126 | ||||||
| 1,637 | Microsoft Corp. | 50,073 | ||||||
| 1,355 | Oracle Corp. | 40,253 | ||||||
| 2,222 | Western Union Co. | 37,412 | ||||||
| 252,211 | ||||||||
| Transportation - 4.3% | ||||||||
| 520 | C.H. Robinson Worldwide, Inc. | 30,464 | ||||||
| 620 | United Parcel Service, Inc. Class B | 48,865 | ||||||
| 79,329 | ||||||||
| Utilities - 1.6% | ||||||||
| 540 | Dominion Resources, Inc. | 29,154 | ||||||
| Total common stocks | ||||||||
| (cost $1,703,391) | $ | 1,794,377 | ||||||
| Total long-term investments | ||||||||
| (cost $1,703,391) | $ | 1,794,377 | ||||||
| SHORT-TERM INVESTMENTS - 1.1% | ||||||||
| Repurchase Agreements - 1.1% | ||||||||
| Bank of America Merrill Lynch TriParty Joint Repurchase Agreement (maturing on 07/02/2012 in the amount of $11,162, collateralized by FHLMC 5.50% - 6.50%, 2035 - 2036, FNMA 5.00% - 6.00%, 2033 - 2039, value of $11,385) | ||||||||
| $ | 11,162 | 0.13%, 06/29/2012 | $ | 11,162 | ||||
| Barclays Capital TriParty Joint Repurchase Agreement (maturing on 07/02/2012 in the amount of $4,035, collateralized by U.S. Treasury Note 1.25% - 3.63%, 2014 - 2020, value of $4,116) | ||||||||
| 4,035 | 0.15%, 06/29/2012 | 4,035 | ||||||
| Deutsche Bank Securities TriParty Joint Repurchase Agreement (maturing on 07/02/2012 in the amount of $1,081, collateralized by U.S. Treasury Note 0.88%, 2016, value of $1,103) | ||||||||
| 1,081 | 0.20%, 06/29/2012 | 1,081 | ||||||
The accompanying notes are an integral part of these financial statements.
| 5 |
| Hartford Stock HLS Fund |
| Schedule of Investments – (continued) |
| June 30, 2012 (Unaudited) |
| (000’s Omitted) |
| Shares or Principal Amount | Market Value ╪ | |||||||||||
| SHORT-TERM INVESTMENTS - 1.1% - (continued) | ||||||||||||
| Repurchase Agreements - 1.1% - (continued) | ||||||||||||
| TD Securities TriParty Joint Repurchase Agreement (maturing on 07/02/2012 in the amount of $3,160, collateralized by FHLMC 4.00% - 6.00%, 2027 - 2041, FNMA 4.00% - 4.50%, 2025 - 2042, U.S. Treasury Bond 6.38%, 2027, U.S. Treasury Note 0.38% - 8.75%, 2012 - 2017, value of $3,223) | ||||||||||||
| $ | 3,160 | 0.15%, 06/29/2012 | $ | 3,160 | ||||||||
| UBS Securities, Inc. Joint Repurchase Agreement (maturing on 07/02/2012 in the amount of $1, collateralized by U.S. Treasury Note 1.00%, 2013, value of $1) | ||||||||||||
| 1 | 0.13%, 06/29/2012 | 1 | ||||||||||
| UBS Securities, Inc. TriParty Joint Repurchase Agreement (maturing on 07/02/2012 in the amount of $1,424, collateralized by GNMA 4.00%, 2042, value of $1,452) | ||||||||||||
| 1,424 | 0.20%, 06/29/2012 | 1,424 | ||||||||||
| 20,863 | ||||||||||||
| Total short-term investments | ||||||||||||
| (cost $20,863) | $ | 20,863 | ||||||||||
| Total investments | ||||||||||||
| (cost $1,724,254) ▲ | 99.1 | % | $ | 1,815,240 | ||||||||
| Other assets and liabilities | 0.9 | % | 16,799 | |||||||||
| Total net assets | 100.0 | % | $ | 1,832,039 | ||||||||
| Note: | Percentage of investments as shown is the ratio of the total market value to total net assets. |
Prices of foreign equities that are principally traded on certain foreign markets may be adjusted daily pursuant to a fair value pricing service approved by the Board of Directors in order to reflect an adjustment for factors occurring after the close of certain foreign markets but before the close of the New York Stock Exchange.
| ▲ | At June 30, 2012, the cost of securities for federal income tax purposes was $1,741,808 and the aggregate gross unrealized appreciation and depreciation based on that cost were: |
| Unrealized Appreciation | $ | 132,242 | ||
| Unrealized Depreciation | (58,810 | ) | ||
| Net Unrealized Appreciation | $ | 73,432 |
| † | These securities were valued in good faith at fair value as determined under policies and procedures established by and under the supervision of the Company's Board of Directors. At June 30, 2012, the aggregate value of these securities was $33,905, which represents 1.9% of total net assets. This amount excludes securities that are principally traded in certain foreign markets and whose prices are adjusted pursuant to a third party pricing service methodology approved by the Board of Directors. |
| ● | Non-income producing. |
The accompanying notes are an integral part of these financial statements.
| 6 |
| ⌂ | The following securities are considered illiquid. Illiquid securities are often purchased in private placement transactions, are often not registered under the Securities Act of 1933 and may have contractual restrictions on resale. A security may also be considered illiquid if the security lacks a readily available market or if its valuation has not changed for a certain period of time. |
| Period Acquired | Shares/ Par | Security | Cost Basis | |||||||
| 08/2011 | 9,440 | Allstar Co. | $ | 9,610 | ||||||
| 06/2007 | 10,986 | Buck Holdings L.P. | $ | 4,022 | ||||||
At June 30, 2012, the aggregate value of these securities was $33,905, which represents 1.9% of total net assets.
Foreign Currency Contracts Outstanding at June 30, 2012
| Description | Counterparty | Buy / Sell | Market Value ╪ | Contract Amount | Delivery Date | Unrealized Appreciation/ (Depreciation) | ||||||||||||
| CHF | CSFB | Sell | $ | 588 | $ | 588 | 07/05/2012 | $ | – | |||||||||
| GBP | BCLY | Buy | 1,279 | 1,278 | 07/03/2012 | 1 | ||||||||||||
| $ | 1 | |||||||||||||||||
| ╪ | See Significant Accounting Policies of accompanying Notes to Financial Statements regarding valuation of securities. |
| GLOSSARY: (abbreviations used in preceding Schedule of Investments) | ||
| Counterparty Abbreviations: | ||
| BCLY | Barclays | |
| CSFB | Credit Suisse First Boston Corp. | |
| Currency Abbreviations: | ||
| CHF | Swiss Franc | |
| GBP | British Pound | |
| Other Abbreviations: | ||
| FHLMC | Federal Home Loan Mortgage Corp. | |
| FNMA | Federal National Mortgage Association | |
| GNMA | Government National Mortgage Association | |
The accompanying notes are an integral part of these financial statements.
| 7 |
| Hartford Stock HLS Fund |
| Investment Valuation Hierarchy Level Summary |
| June 30, 2012 (Unaudited) |
| (000’s Omitted) |
| Total | Level 1 ♦ | Level 2 ♦ | Level 3 | |||||||||||||
| Assets: | ||||||||||||||||
| Common Stocks ‡ | $ | 1,794,377 | $ | 1,682,807 | $ | 77,665 | $ | 33,905 | ||||||||
| Short-Term Investments | 20,863 | – | 20,863 | – | ||||||||||||
| Total | $ | 1,815,240 | $ | 1,682,807 | $ | 98,528 | $ | 33,905 | ||||||||
| Foreign Currency Contracts * | 1 | – | 1 | – | ||||||||||||
| Total | $ | 1 | $ | – | $ | 1 | $ | – | ||||||||
| ♦ | For the six-month period ended June 30, 2012, there were no transfers between Level 1 and Level 2. |
| ‡ | The Fund has all or primarily all of the equity securities categorized in a particular level. Refer to the Schedule of Investments for further industry breakout. |
| * | Derivative instruments not reflected in the Schedule of Investments are valued at the unrealized appreciation/depreciation on the investments. |
Following is a reconciliation of Level 3 assets for which significant unobservable inputs were used to determine fair value:
| Balance as of December 31, 2011 | Realized Gain (Loss) | Change in Unrealized Appreciation (Depreciation) | Net Amortization | Purchases | Sales | Transfers | Transfers Out of Level 3 | Balance as of June 30, 2012 | ||||||||||||||||||||||||||||
| Assets: | ||||||||||||||||||||||||||||||||||||
| Common Stocks | $ | 34,362 | $ | 8,793 | $ | 2,005 | * | $ | — | $ | — | $ | (11,255 | ) | $ | — | $ | — | $ | 33,905 | ||||||||||||||||
| Total | $ | 34,362 | $ | 8,793 | $ | 2,005 | $ | — | $ | — | $ | (11,255 | ) | $ | — | $ | — | $ | 33,905 | |||||||||||||||||
| * | Change in unrealized appreciation (depreciation) in the current period relating to assets still held at June 30, 2012 was $2,005. |
The accompanying notes are an integral part of these financial statements.
| 8 |
| Hartford Stock HLS Fund |
| Statement of Assets and Liabilities |
| June 30, 2012 (Unaudited) |
| (000’s Omitted) |
| Assets: | ||||
| Investments in securities, at market value (cost $1,724,254) | $ | 1,815,240 | ||
| Cash | — | |||
| Foreign currency on deposit with custodian (cost $—) | — | |||
| Unrealized appreciation on foreign currency contracts | 1 | |||
| Receivables: | ||||
| Investment securities sold | 25,363 | |||
| Fund shares sold | 247 | |||
| Dividends and interest | 2,227 | |||
| Other assets | 6 | |||
| Total assets | 1,843,084 | |||
| Liabilities: | ||||
| Payables: | ||||
| Investment securities purchased | 8,999 | |||
| Fund shares redeemed | 1,821 | |||
| Investment management fees | 116 | |||
| Distribution fees | 7 | |||
| Accrued expenses | 102 | |||
| Total liabilities | 11,045 | |||
| Net assets | $ | 1,832,039 | ||
| Summary of Net Assets: | ||||
| Capital stock and paid-in-capital | $ | 2,476,436 | ||
| Undistributed net investment income | 18,174 | |||
| Accumulated net realized loss | (753,549 | ) | ||
| Unrealized appreciation of investments and the translations of assets and liabilities denominated in foreign currency | 90,978 | |||
| Net assets | $ | 1,832,039 | ||
| Shares authorized | 4,000,000 | |||
| Par value | $ | 0.001 | ||
| Class IA: Net asset value per share | $ | 44.03 | ||
| Shares outstanding | 36,613 | |||
| Net assets | $ | 1,612,046 | ||
| Class IB: Net asset value per share | $ | 43.94 | ||
| Shares outstanding | 5,007 | |||
| Net assets | $ | 219,993 |
The accompanying notes are an integral part of these financial statements.
| 9 |
| Hartford Stock HLS Fund |
| Statement of Operations |
| For the Six-Month Period Ended June 30, 2012 (Unaudited) |
| (000’s Omitted) |
| Investment Income: | ||||
| Dividends | $ | 20,913 | ||
| Interest | 20 | |||
| Less: Foreign tax withheld | (283 | ) | ||
| Total investment income, net | 20,650 | |||
| Expenses: | ||||
| Investment management fees | 4,459 | |||
| Distribution fees - Class IB | 290 | |||
| Custodian fees | 5 | |||
| Accounting services fees | 94 | |||
| Board of Directors' fees | 24 | |||
| Audit fees | 11 | |||
| Other expenses | 152 | |||
| Total expenses (before fees paid indirectly) | 5,035 | |||
| Commission recapture | (23 | ) | ||
| Total fees paid indirectly | (23 | ) | ||
| Total expenses, net | 5,012 | |||
| Net investment income | 15,638 | |||
| Net Realized Gain on Investments and Foreign Currency Transactions: | ||||
| Net realized gain on investments | 206,244 | |||
| Net realized gain on foreign currency contracts | 1,504 | |||
| Net realized gain on other foreign currency transactions | 264 | |||
| Net Realized Gain on Investments and Foreign Currency Transactions | 208,012 | |||
| Net Changes in Unrealized Depreciation of Investments and Foreign Currency Transactions: | ||||
| Net unrealized depreciation of investments | (39,113 | ) | ||
| Net unrealized depreciation of foreign currency contracts | (118 | ) | ||
| Net unrealized depreciation on translation of other assets and liabilities in foreign currencies | (5 | ) | ||
| Net Changes in Unrealized Depreciation of Investments and Foreign Currency Transactions | (39,236 | ) | ||
| Net Gain on Investments and Foreign Currency Transactions | 168,776 | |||
| Net Increase in Net Assets Resulting from Operations | $ | 184,414 |
The accompanying notes are an integral part of these financial statements.
| 10 |
| Hartford Stock HLS Fund |
| Statement of Changes in Net Assets |
| (000’s Omitted) |
| For the Six-Month Period Ended June 30, 2012 (Unaudited) | For the Year Ended December 31, 2011 | |||||||
| Operations: | ||||||||
| Net investment income | $ | 15,638 | $ | 27,545 | ||||
| Net realized gain on investments and foreign currency transactions | 208,012 | 135,742 | ||||||
| Net unrealized depreciation of investments and foreign currency transactions | (39,236 | ) | (182,032 | ) | ||||
| Net Increase (Decrease) In Net Assets Resulting From Operations | 184,414 | (18,745 | ) | |||||
| Distributions to Shareholders: | ||||||||
| From net investment income | ||||||||
| Class IA | — | (23,255 | ) | |||||
| Class IB | — | (2,687 | ) | |||||
| Total distributions | — | (25,942 | ) | |||||
| Capital Share Transactions: | ||||||||
| Class IA | ||||||||
| Sold | 12,708 | 35,432 | ||||||
| Issued on reinvestment of distributions | — | 23,255 | ||||||
| Redeemed | (177,178 | ) | (385,103 | ) | ||||
| Total capital share transactions | (164,470 | ) | (326,416 | ) | ||||
| Class IB | ||||||||
| Sold | 5,462 | 16,524 | ||||||
| Issued on reinvestment of distributions | — | 2,687 | ||||||
| Redeemed | (39,532 | ) | (82,724 | ) | ||||
| Total capital share transactions | (34,070 | ) | (63,513 | ) | ||||
| Net decrease from capital share transactions | (198,540 | ) | (389,929 | ) | ||||
| Net Decrease In Net Assets | (14,126 | ) | (434,616 | ) | ||||
| Net Assets: | ||||||||
| Beginning of period | 1,846,165 | 2,280,781 | ||||||
| End of period | $ | 1,832,039 | $ | 1,846,165 | ||||
| Undistributed (distribution in excess of) net investment income | $ | 18,174 | $ | 2,536 | ||||
| Shares: | ||||||||
| Class IA | ||||||||
| Sold | 291 | 862 | ||||||
| Issued on reinvestment of distributions | — | 588 | ||||||
| Redeemed | (4,100 | ) | (9,352 | ) | ||||
| Total share activity | (3,809 | ) | (7,902 | ) | ||||
| Class IB | ||||||||
| Sold | 127 | 398 | ||||||
| Issued on reinvestment of distributions | — | 68 | ||||||
| Redeemed | (916 | ) | (2,005 | ) | ||||
| Total share activity | (789 | ) | (1,539 | ) | ||||
The accompanying notes are an integral part of these financial statements.
| 11 |
| Hartford Stock HLS Fund |
| Notes to Financial Statements |
| June 30, 2012 (Unaudited) |
| (000’s Omitted) |
| 1. | Organization: |
Hartford Stock HLS Fund (the “Fund”) serves as an underlying investment option for certain variable annuity and variable life insurance separate accounts of Hartford Life Insurance Company (“HLIC”) and its affiliates and certain qualified retirement plans. The Fund may also serve as an underlying investment option for certain variable annuity and variable life separate accounts of other insurance companies. Owners of variable annuity contracts and policyholders of variable life insurance contracts may choose the funds permitted in the variable insurance contract prospectus. In addition, participants in certain qualified retirement plans may choose the Fund if permitted by their plans.
Hartford Series Fund, Inc. (the “Company”) is an open-end registered management investment company comprised of thirty portfolios. Financial Statements for the Fund, a series of the Company, are included in this report.
The Company is organized under the laws of the State of Maryland and is registered with the Securities and Exchange Commission (“SEC”) under the Investment Company Act of 1940, as amended (“1940 Act”). The Fund is a diversified open-end management investment company.
The Fund is divided into Class IA and Class IB shares. Each class is offered at the per share net asset value (“NAV”) without a sales charge and is subject to the same expenses, except that the Class IB shares are subject to distribution and service fees charged pursuant to a Distribution Plan adopted in accordance with Rule 12b-1 under the 1940 Act.
| 2. | Significant Accounting Policies: |
The following is a summary of significant accounting policies of the Fund in the preparation of its financial statements, which are in accordance with the United States Generally Accepted Accounting Principles (“U.S. GAAP”). The preparation of financial statements in accordance with U.S. GAAP may require management to make estimates and assumptions that affect the reported amounts of assets and liabilities and disclosure of contingent assets and liabilities at the date of the financial statements and the reported amounts of increases and decreases in net assets from operations during the reporting period. Actual results could differ from those estimates.
| a) | Determination of Net Asset Value – The NAV of each class of the Fund’s shares is determined as of the close of regular trading (normally 4:00 p.m. Eastern Time) (the “NYSE Close”) on each day that the New York Stock Exchange (the “Exchange”) is open (“Valuation Date”). Information that becomes known to the Fund after the NAV has been calculated on a particular day will not generally be used to retroactively adjust the NAV determined earlier that day. |
| b) | Investment Valuation and Fair Value Measurements – For purposes of calculating the NAV, portfolio investments and other assets held by the Fund's portfolio for which market quotes are readily available are valued at market value. Market value is generally determined on the basis of last reported sales prices or official close price. If no sales are reported, market value is based on quotes obtained from a quotation reporting system, established market makers, or independent pricing services. If market prices are not readily available or are deemed unreliable, the Fund will use the fair value of the investment as determined in good faith under policies and procedures established by and under the supervision of the Company’s Board of Directors. Market quotes are considered not readily available where there is an absence of current or reliable market-based data (e.g., trade information or broker quotes), including where events occur after the close of the relevant market, but prior to the NYSE Close that materially affect the values of the Fund’s portfolio investments or assets. In addition, market quotes are considered not readily available when, due to extraordinary circumstances, the exchanges or markets on which the investments trade do not open for trading for the entire day and no other market prices are available. In addition, prices of foreign equities that are principally traded on certain foreign markets are adjusted daily pursuant to a fair value pricing service approved by the Board of Directors in order to reflect an adjustment for the factors occurring after the close of certain foreign markets but before the NYSE Close. Investments that are primarily traded on foreign markets may trade on days that are not business days of the Fund. The value of the |
| 12 |
foreign investments in which the Fund invests may change on days when a shareholder will not be able to purchase or redeem shares of the Fund. Fair value pricing is subjective in nature and the use of fair value pricing by the Fund may cause the NAV of its shares to differ significantly from the NAV that would have been calculated using market prices at the close of the exchange on which a portfolio investment is primarily traded. There can be no assurance that the Fund could obtain the fair market value assigned to an investment if the Fund were to sell the investment at approximately the time at which the Fund determines its NAV.
Investments valued in currencies other than U.S. dollars are converted to U.S. dollars using exchange rates obtained from independent pricing services for calculation of the NAV. As a result, the NAV of the Fund’s shares may be affected by changes in the value of currencies in relation to the U.S. dollar. The value of investments traded in markets outside the United States or denominated in currencies other than the U.S. dollar may be affected significantly on a day that the NYSE is closed and the market value may change on days when an investor is not able to purchase, redeem or exchange shares of the Fund.
Foreign currency contracts represent agreements to exchange currencies on specific future dates at predetermined rates. Foreign currency contracts are valued using foreign currency exchange rates and forward rates as provided by an independent pricing service on the Valuation Date.
Financial instruments for which prices are not available from an independent pricing service may be valued using market quotations obtained from one or more dealers that make markets in the respective financial instrument in accordance with procedures established by the Company’s Board of Directors.
U.S. GAAP defines fair value as the price that the Fund would receive to sell an asset or pay to transfer a liability in an orderly transaction between market participants. The U.S. GAAP fair value measurement standards require disclosure of a fair value hierarchy for each major category of assets and liabilities. Various inputs are used in determining the fair value of the Fund’s investments. These inputs are summarized into three broad hierarchy levels. This hierarchy is based on whether the valuation inputs are observable or unobservable. These levels are:
| · | Level 1 – Quoted prices in active markets for identical investments. Level 1 may include exchange traded instruments, such as domestic equities, some foreign equities, options, futures, mutual funds, exchange traded funds, rights and warrants. |
| · | Level 2 – Observable inputs other than Level 1 prices, such as quoted prices for similar investments; quoted prices in markets that are not active; or other inputs that are observable or can be corroborated by observable market data. Level 2 may include debt investments that are traded less frequently than exchange traded instruments and which are valued using independent pricing services; foreign equities, which are principally traded on certain foreign markets and are adjusted daily pursuant to a fair value pricing service in order to reflect an adjustment for the factors occurring after the close of certain foreign markets but before the NYSE Close; and short-term investments, which are valued at amortized cost. |
| · | Level 3 – Significant unobservable inputs that are supported by limited or no market activity. Level 3 may include financial instruments whose values are determined using indicative market quotes or require significant management judgment or estimation. These unobservable valuation inputs may include estimates for current yields, maturity/duration, prepayment speed, and indicative market quotes for comparable investments along with other assumptions relating to credit quality, collateral value, complexity of the investment structure, general market conditions and liquidity. This category may include investments where trading has been halted or there are certain restrictions on trading. While these investments are priced using unobservable inputs, the valuation of these investments reflects the best available data and management believes the prices are a reasonable representation of exit price. |
The Board of Directors of the Company generally reviews and approves the “Procedures for Valuation of Portfolio Securities” on an annual basis. These procedures define how investments are to be valued, including the formation of a Valuation Committee. The Valuation Committee is responsible for determining in good faith
| 13 |
| Hartford Stock HLS Fund |
| Notes to Financial Statements – (continued) |
| June 30, 2012 (Unaudited) |
| (000’s Omitted) |
the fair value of investments when the value cannot be obtained from primary pricing services or alternative sources or if the valuation of an investment as provided by the primary pricing service or alternative source is believed not to reflect the investment’s fair value as of the Valuation Date. Members of the Valuation Committee include the Fund’s Treasurer or designee, a Vice President of the Funds with legal expertise or designee, and a Vice President of the investment manager or designee. In addition, the Fund’s chief compliance officer shall designate a member of the compliance group to attend Valuation Committee meetings as a non-voting resource, to monitor for and provide guidance with respect to compliance with these procedures. Two members of the Valuation Committee or their designees, representing different departments, shall constitute a quorum for purposes of permitting the Valuation Committee to take action. The Valuation Committee will consider all relevant factors in determining an investment’s fair value, and may seek the advice of the Fund’s sub-adviser, knowledgeable brokers and legal counsel in making such determination. The Valuation Committee reports to the Audit Committee of the Company’s Board of Directors. The Audit Committee receives quarterly written reports which include details of all fair-valued investments, including the reason for the fair valuation, and an indication, when possible, of the accuracy of the valuation by disclosing the next available reliable public price quotation or the disposition price of such investments (the “look-back” test). The Board of Directors then must consider for ratification all of the fair value determinations made during the previous quarter.
Valuation levels are not necessarily indicative of the risk associated with investing in such investments. Individual investments within any of the above mentioned asset classes may be assigned a different hierarchical level than those presented above, as individual circumstances dictate.
For additional information, refer to the Investment Valuation Hierarchy Level Summary and the Level 3 roll-forward reconciliation which follow the Schedule of Investments.
For purposes of reporting transfers between different hierarchy levels, both transfers in and out of each level, as applicable, are shown as if they occurred at the beginning of the period.
| c) | Investment Transactions and Investment Income – Investment transactions are recorded as of the trade date (the date the order to buy or sell is executed) for financial reporting purposes. Investments purchased or sold on a when-issued or delayed-delivery basis may be settled a month or more after the trade date. Realized gains and losses are determined on the basis of identified cost. |
Dividend income is accrued as of the ex-dividend date, except certain dividends from foreign investments where the ex-dividend date may have passed are recorded as soon as the Fund is informed of the dividend. Interest income, including amortization of premium and accretion of discounts, is accrued on a daily basis.
| d) | Foreign Currency Transactions – Assets and liabilities denominated in currencies other than U.S. dollars are translated into U.S. dollars at the exchange rates in effect on the valuation date. Purchases and sales of investments, income, and expenses are translated into U.S. dollars at the exchange rates on the dates of such transactions. |
The Fund does not isolate that portion of portfolio investment valuation resulting from fluctuations in the foreign currency exchange rates from the fluctuations arising from changes in the market prices of investments held. Exchange rate fluctuations are included with the net realized and unrealized gain or loss on investments in the accompanying financial statements.
Net realized foreign exchange gains or losses arise from sales of foreign currencies and the difference between asset and liability amounts initially stated in foreign currencies and the U.S. dollar value of the amounts actually received or paid. Net unrealized foreign exchange gains or losses arise from changes in the value of other assets and liabilities at the end of the reporting period, resulting from changes in the exchange rates.
| 14 |
| e) | Joint Trading Account – The Fund may invest cash balances into a joint trading account that may be invested in one or more repurchase agreements. |
| f) | Fund Share Valuation and Dividend Distributions to Shareholders – Orders for the Fund’s shares are executed in accordance with the investment instructions of the contract holders and plan participants. The NAV of the Fund’s shares is determined as of the close of business on each business day of the Exchange. The NAV is determined separately for each class of shares of the Fund by dividing the Fund’s net assets attributable to that class by the number of shares of the class outstanding. Each class of shares offered by the Fund has equal rights as to assets and voting privileges (except that shareholders of a class have exclusive voting rights regarding any matter relating solely to that class of shares). Income and non-class specific expenses are allocated daily to each class on the basis of the relative net assets of the class. Realized and unrealized capital gains and losses are allocated daily based on the relative net assets of each class of shares of the Fund. |
Orders for the purchase of the Fund’s shares received prior to the close of the Exchange on any day the Exchange is open for business are priced at the NAV determined as of the close of the Exchange. Orders received after the close of the Exchange, or on a day on which the Exchange and/or the Fund is not open for business, are priced at the next determined NAV.
Dividends are declared pursuant to a policy adopted by the Company’s Board of Directors based upon the investment performance of the Fund. The policy of the Fund is to pay dividends from net investment income and realized capital gains, if any, at least once a year.
Distributions from net investment income, net realized capital gains and capital are determined in accordance with federal income tax regulations, which may differ from U.S. GAAP with respect to character and timing. These differences may include but are not limited to losses deferred due to wash sale adjustments, foreign currency gains and losses, adjustments related to Passive Foreign Investment Companies (“PFICs”), Real Estate Investment Trusts (“REITs”), Regulated Investment Companies (“RICs”), certain derivatives and partnerships. Permanent book and federal income tax basis differences relating to shareholder distributions will result in reclassifications to certain of the Fund’s capital accounts (see Federal Income Taxes: Reclassification of Capital Accounts note).
| 3. | Securities and Other Investments: |
| a) | Repurchase Agreements – A repurchase agreement is an agreement by which a counterparty agrees to sell an investment and agrees to repurchase the investment sold at a mutually agreed upon time and price. At the time the Fund enters into a repurchase agreement, the value of the underlying collateral, including accrued interest, will be equal to or exceed the value of the repurchase agreement. Repurchase agreements expose the Fund to counterparty risk. To minimize counterparty risk, the investments that serve to collateralize the repurchase agreement are held by the Fund’s custodian in book entry or physical form in the custodial account of the Fund or in a third party custodial account. Repurchase agreements are valued at cost plus accrued interest. The Fund, as shown on the Schedule of Investments, had outstanding repurchase agreements as of June 30, 2012. |
| b) | Illiquid and Restricted Investments – The Fund is permitted to invest up to 15% of its net assets in illiquid investments. Illiquid investments are those that may not be sold or disposed of in the ordinary course of business within seven days, at approximately the price used to determine the Fund’s NAV. The Fund may not be able to sell illiquid investments when its sub-adviser considers it desirable to do so or may have to sell such investments at a price that is lower than the price that could be obtained if the investments were more liquid. A sale of illiquid investments may require more time and may result in higher dealer discounts and other selling expenses than does the sale of those that are liquid. Illiquid investments also may be more difficult to value due to the unavailability of reliable market quotations for such investments, and an investment in them may have an adverse impact on the Fund’s NAV. The Fund may also purchase certain restricted investments that can only be resold to certain qualified investors and may be determined to be liquid |
| 15 |
| Hartford Stock HLS Fund |
| Notes to Financial Statements – (continued) |
| June 30, 2012 (Unaudited) |
| (000’s Omitted) |
| pursuant to policies and guidelines established by the Company’s Board of Directors. The Fund, as shown on the Schedule of Investments, had illiquid and/or restricted investments as of June 30, 2012. |
| c) | Investments Purchased on a When-Issued or Delayed-Delivery Basis – Delivery and payment for investments that have been purchased by the Fund on a forward commitment, or when-issued or delayed-delivery basis, take place beyond the customary settlement period. A fund may dispose of or renegotiate a delayed-delivery transaction after it is entered into, and may sell delayed-delivery investments before they are delivered, which may result in a realized gain or loss. During this period, such investments are subject to market fluctuations, and the Fund identifies investments segregated in its records with a value at least equal to the amount of the commitment. As of June 30, 2012, the Fund had no outstanding when-issued or delayed delivery investments. |
| 4. | Financial Derivative Instruments: |
The following disclosures contain information on how and why the Fund uses derivative instruments, the credit-risk-related contingent features in certain derivative instruments, and how derivative instruments affect the Fund’s financial position and results of operations. The location and fair value amounts of these instruments on the Statement of Assets and Liabilities and the realized gains and losses and changes in unrealized gains and losses on the Statement of Operations, each categorized by type of derivative contract, are included in the following Additional Derivative Instrument Information footnote. The derivative instruments outstanding as of period-end are disclosed in the notes to the Schedule of Investments and the amounts of realized gains and losses and changes in unrealized gains and losses on derivative instruments during the period are disclosed in the Statement of Operations.
| a) | Foreign Currency Contracts – The Fund may enter into foreign currency contracts that obligate the Fund to purchase or sell currencies at specified future dates. Foreign currency contracts are used to hedge the currency exposure associated with some or all of the Fund’s investments and/or as part of an investment strategy. Foreign currency contracts are marked to market daily and the change in value is recorded by the Fund as an unrealized gain or loss. The Fund will record a realized gain or loss when the foreign currency contract is settled. |
Foreign currency contracts involve elements of market risk in excess of the amounts reflected in the Statement of Assets and Liabilities. In addition, risks may arise upon entering into these contracts from the potential inability of the counterparties to meet the terms of the contracts and from unanticipated movements in the value of the foreign currencies relative to the U.S. dollar. The Fund had outstanding foreign currency contracts as shown on the Schedule of Investments as of June 30, 2012.
| b) | Additional Derivative Instrument Information: |
Fair Values of Derivative Instruments on the Statement of Assets and Liabilities as of June 30, 2012:
| Risk Exposure Category | ||||||||||||||||||||||||||||
| Interest Rate Contracts | Foreign Exchange Contracts | Credit Contracts | Equity Contracts | Commodity Contracts | Other Contracts | Total | ||||||||||||||||||||||
| Assets: | ||||||||||||||||||||||||||||
| Unrealized appreciation on foreign currency contracts | $ | — | $ | 1 | $ | — | $ | — | $ | — | $ | — | $ | 1 | ||||||||||||||
| Total | $ | — | $ | 1 | $ | — | $ | — | $ | — | $ | — | $ | 1 | ||||||||||||||
The volume of derivatives that is presented in the Schedule of Investments is consistent with the derivative activity during the six-month period ended June 30, 2012.
| 16 |
The effect of Derivative Instruments on the Statement of Operations for the six-month period ended June 30, 2012:
| Risk Exposure Category | ||||||||||||||||||||||||||||
| Interest Rate Contracts | Foreign Exchange Contracts | Credit Contracts | Equity Contracts | Commodity Contracts | Other Contracts | Total | ||||||||||||||||||||||
| Realized Gain (Loss) on Derivatives Recognized as a Result of Operations: | ||||||||||||||||||||||||||||
| Net realized gain on foreign currency contracts | $ | — | $ | 1,504 | $ | — | $ | — | $ | — | $ | — | $ | 1,504 | ||||||||||||||
| Total | $ | — | $ | 1,504 | $ | — | $ | — | $ | — | $ | — | $ | 1,504 | ||||||||||||||
| Net Change in Unrealized Appreciation (Depreciation) on Derivatives Recognized as a Result of Operations: | ||||||||||||||||||||||||||||
| Net change in unrealized depreciation of foreign currency contracts | $ | — | $ | (118 | ) | $ | — | $ | — | $ | — | $ | — | $ | (118 | ) | ||||||||||||
| Total | $ | — | $ | (118 | ) | $ | — | $ | — | $ | — | $ | — | $ | (118 | ) | ||||||||||||
| 5. | Principal Risks: |
| a) | Counterparty Risk – The Fund may be exposed to counterparty risk, or the risk that an institution or other entity with which the Fund has unsettled or open transactions will default. |
| b) | Market Risks – If the Fund invests directly in foreign currencies or in securities that trade in, and receive revenues in, foreign currencies, or in derivatives that provide exposure to foreign currencies, it will be subject to the risk that those currencies will decline in value relative to the base currency of the Fund, or, in the case of hedging positions, that the Fund’s base currency will decline in value relative to the currency being hedged. Currency rates in foreign countries may fluctuate significantly over short periods of time for a number of reasons, including changes in interest rates, intervention (or the failure to intervene) by U.S. or foreign governments, central banks or supranational entities, such as the International Monetary Fund, or by the imposition of currency controls or other political developments in the United States or abroad. As a result, the Fund’s investments in foreign currency denominated securities may reduce the returns of the Fund. The market values of equity securities, such as common stocks and preferred stocks, or equity related investments, such as futures and options, may decline due to general market conditions which are not specifically related to a particular company, such as real or perceived adverse economic conditions, changes in the general outlook for corporate earnings, changes in interest or currency rates or adverse investor sentiment generally. The market value of equity securities may also decline due to factors which affect a particular industry or industries, such as labor shortages or increased production costs and competitive conditions within an industry. Equity securities and equity related investments generally have greater market price volatility than fixed income securities. |
| 6. | Federal Income Taxes: |
| a) | Federal Income Taxes – For federal income tax purposes, the Fund intends to continue to qualify as a RIC under Subchapter M of the Internal Revenue Code (“IRC”) by distributing substantially all of its taxable net investment income and net realized capital gains to its shareholders and otherwise complying with the requirements of RICs. The Fund has distributed substantially all of its income and capital gains in prior years, if applicable, and intends to distribute substantially all of its income and capital gains prior to the next fiscal year-end. Accordingly, no provision for federal income or excise taxes has been made in the accompanying financial statements. Distributions from short-term capital gains are treated as ordinary income distributions for federal income tax purposes. |
| b) | Net Investment Income (Loss), Net Realized Gains (Losses) – Net investment income (loss) and net realized gains (losses) may differ for financial statement and tax purposes primarily because of losses deferred due to wash sale adjustments, foreign currency gains and losses, adjustments related to PFICs, REITs, RICs, certain derivatives and partnerships. The character of distributions made during the year from net investment income or net realized gains may differ from their ultimate characterization for federal income tax purposes. Also, due to the timing of dividend |
| 17 |
| Hartford Stock HLS Fund |
| Notes to Financial Statements – (continued) |
| June 30, 2012 (Unaudited) |
| (000’s Omitted) |
distributions, the fiscal year in which amounts are distributed may differ from the year that the income or realized gains (losses) were recorded by the Fund.
| c) | Distributions and Components of Distributable Earnings – The tax character of distributions paid by the Fund for the periods indicated is as follows (as adjusted for dividends payable): |
| For the Year Ended December 31, 2011 | For the Year Ended December 31, 2010 | |||||||
| Ordinary Income | $ | 25,942 | $ | 24,299 | ||||
As of December 31, 2011, the Fund’s components of distributable earnings (deficit) on a tax basis were as follows:
| Amount | ||||
| Undistributed Ordinary Income | $ | 2,536 | ||
| Accumulated Capital and Other Losses* | (943,888 | ) | ||
| Unrealized Appreciation† | 112,541 | |||
| Total Accumulated Deficit | $ | (828,811 | ) | |
| * | The Fund has capital loss carryforwards that are identified in the Capital Loss Carryforward note that follows. |
| † | The difference between book-basis and tax-basis unrealized appreciation (depreciation) may be attributable to the losses deferred due to wash sale adjustments, foreign currency gains and losses, adjustments related to PFICs, REITs, RICs, certain derivatives and partnerships. |
| d) | Reclassification of Capital Accounts – The Fund may record reclassifications in its capital accounts. These reclassifications have no impact on the total net assets of the Fund. The reclassifications are a result of permanent differences between U.S. GAAP and tax accounting for such items as foreign currency, PFICs, expiration or utilization of capital loss carryforwards or net operating losses. Adjustments are made to reflect the impact these items have on current and future distributions to shareholders. Therefore, the source of the Fund’s distributions may be shown in the accompanying Statement of Changes in Net Assets as from undistributed net investment income, from accumulated net realized gains on investments or from capital depending on the type of book and tax differences that exist. For the year ended December 31, 2011, the Fund recorded reclassifications to increase (decrease) the accounts listed below: |
| Amount | ||||
| Undistributed Net Investment Income | $ | 278 | ||
| Accumulated Net Realized Gain (Loss) | (278 | ) | ||
| e) | Capital Loss Carryforward – On December 22, 2010, the Regulated Investment Company Modernization Act of 2010 (the “Act”) was enacted, which made changes to the capital loss carryforward rules. The changes are effective for taxable years beginning after the date of enactment. Under the Act, funds are permitted to carry forward capital losses for an unlimited period. However, any losses incurred during those future taxable years will be required to be utilized prior to the losses incurred in pre-enactment taxable years, which carry an expiration date. As a result of this ordering rule, pre-enactment capital loss carryforwards may be more likely to expire unused. Additionally, post-enactment capital loss carryforwards retain their character as either short-term or long-term capital losses rather than being considered all short-term as permitted under prior regulation. |
| 18 |
At December 31, 2011 (tax-year-end), the Fund had capital loss carryforwards for U.S. federal income tax purposes as follows:
| Year of Expiration | Amount | |||
| 2016 | $ | 205,611 | ||
| 2017 | 738,277 | |||
| Total | $ | 943,888 | ||
During the year ended December 31, 2011, the Fund utilized $106,064 of prior year capital loss carryforwards.
| f) | Accounting for Uncertainty in Income Taxes – The Fund has adopted financial reporting rules that require the Fund to analyze all open tax years, as defined by the statute of limitations, for all major jurisdictions. Generally, tax authorities can examine all tax returns filed for the last three years. The Fund does not have an examination in progress. |
The Fund has reviewed all open tax years and major jurisdictions and concluded that these financial reporting rules had no effect on the Fund’s financial position or results of operations. There is no tax liability resulting from unrecognized tax benefits relating to uncertain income tax positions taken or expected to be taken on the tax return for the fiscal year ended December 31, 2011. The Fund is also not aware of any tax positions for which it is reasonably possible that the total amounts of unrecognized tax benefits will significantly change in the next twelve months.
7. Expenses:
| a) | Investment Management Agreement – HL Investment Advisors, LLC (“HL Advisors”), an indirect wholly owned subsidiary of The Hartford Financial Services Group, Inc. (“The Hartford”), serves as investment manager to the Fund pursuant to an Investment Management Agreement with the Company. As investment manager, HL Advisors has overall investment supervisory responsibility for the Fund. In addition, HL Advisors provides administrative personnel, services, equipment, facilities and office space for proper operation of the Fund. HL Advisors has contracted with Wellington Management Company, LLP (“Wellington Management”) under a sub-advisory agreement for the provision of day-to-day investment management services to the Fund in accordance with the Fund’s investment objective and policies. The Fund pays a fee to HL Advisors, a portion of which may be used to compensate Wellington Management. |
The schedule below reflects the rates of compensation paid to HL Advisors for investment management services rendered as of June 30, 2012; the rates are accrued daily and paid monthly.
| Average Daily Net Assets | Annual Fee | |||
| On first $250 million | 0.5250 | % | ||
| On next $250 million | 0.5000 | % | ||
| On next $500 million | 0.4750 | % | ||
| On next $4 billion | 0.4500 | % | ||
| On next $5 billion | 0.4475 | % | ||
| Over $10 billion | 0.4450 | % | ||
| b) | Accounting Services Agreement – Pursuant to the Fund Accounting Agreement between HLIC and the Company, on behalf of the Fund, HLIC provides accounting services to the Fund and receives monthly compensation based on the Fund’s average daily net assets at the rates set forth below. The Fund’s accounting services fees are accrued daily and paid monthly. |
| Average Daily Net Assets | Annual Fee | |||
| All assets | 0.010 | % | ||
| 19 |
| Hartford Stock HLS Fund |
| Notes to Financial Statements – (continued) |
| June 30, 2012 (Unaudited) |
| (000’s Omitted) |
| c) | Operating Expenses – Allocable expenses incurred by the Company are allocated to each Fund and allocated to classes within a Fund in proportion to the average daily net assets of the Fund and each class, except where allocation of certain expenses is more fairly made directly to the Fund or to specific classes within a Fund. |
| d) | Fees Paid Indirectly – The Company, on behalf of the Fund, has entered into agreements with State Street Global Markets, LLC and Russell Implementation Services, Inc. to partially recapture non-discounted trade commissions. Such rebates are used to pay a portion of the Fund’s expenses. In addition, the Fund’s custodian bank has also agreed to reduce its fees when the Fund maintains cash on deposit in a non-interest-bearing custody account. For the six-month period ended June 30, 2012, these amounts, if any, are included in the Statement of Operations. |
The ratio of expenses to average net assets in the accompanying financial highlights excludes the reduction in expenses related to fees paid indirectly. The annualized expense ratio for the period listed below reflecting the reduction for fees paid indirectly is as follows:
| Annualized Six- Month Period Ended June 30, 2012 | ||||
| Class IA | 0.50 | % | ||
| Class IB | 0.75 | % | ||
| e) | Distribution Plan for Class IB shares – The Company, on behalf of the Fund, has adopted a Distribution Plan pursuant to Rule 12b-1 of the 1940 Act to compensate the Distributor, Hartford Securities Distribution Company, Inc. (a wholly owned, ultimate subsidiary of The Hartford), from assets attributable to the Class IB shares for services rendered and expenses borne in connection with activities primarily intended to result in the sale of the Class IB shares, subject to the review and approval of the Company’s Board of Directors. |
The Distribution Plan provides that the Fund may pay annually up to 0.25% of the average daily net assets of the Fund attributable to its Class IB shares for activities primarily intended to result in the sale of Class IB shares. The Board has the authority to suspend or reduce these payments at any point in time. Under the terms of the Distribution Plan and the principal underwriting agreement, the Fund is authorized to make payments monthly to the Distributor that may be used to pay or compensate entities providing distribution and shareholder servicing with respect to the Class IB shares for such entities’ fees or expenses incurred or paid in that regard. These fees are accrued daily and paid monthly.
| f) | Other Related Party Transactions – Certain officers of the Fund are directors and/or officers of HL Advisors and/or The Hartford or its subsidiaries. For the six-month period ended June 30, 2012, a portion of the Fund’s chief compliance officer’s salary was paid by all the investment companies in the Hartford fund complex. The portion allocated to the Fund was in the amount of $1. These fees are accrued daily and paid monthly. |
| g) | Payment from Affiliate – In July of 2007, The Hartford entered into a settlement with the Attorneys General of the states of New York, Connecticut and Illinois relating to market timing and the company's individual variable annuity contracts in which certain payments would be made directly to the variable annuity contract holders. The distribution plan provided that unclaimed money from the settlement would be distributed to certain HLS Funds that are investment options through a Hartford individual variable annuity contract. The unclaimed money was distributed to the Fund on September 18, 2009. |
| 20 |
The total return in the accompanying financial highlights includes a payment from an affiliate. Had the payment from the affiliate been excluded, the impact and total return for the period listed below would have been as follows:
| For the Year Ended December 31, 2009 | ||||||||
| Class IA | Class IB | |||||||
| Impact from Payment from Affiliate for Attorneys General Settlement | — | % | — | % | ||||
| Total Return Excluding Payment from Affiliate | 41.53 | % | 41.18% | % | ||||
| 8. | Investment Transactions: |
For the six-month period ended June 30, 2012, the Fund's aggregate purchases and sales of investment securities (excluding short-term investments) were as follows:
| Amount | ||||
| Cost of Purchases Excluding U.S. Government Obligations | $ | 1,368,170 | ||
| Sales Proceeds Excluding U.S. Government Obligations | 1,573,695 | |||
| 9. | Line of Credit: |
The Fund is one of several Hartford funds that participate in a $500 million committed revolving line of credit facility. The facility is to be used for temporary or emergency purposes. Under the arrangement, the funds are required to own securities having a market value in excess of 300% of the total bank borrowings. The interest rate on borrowings varies depending on the nature of the loan. The facility also requires a fee to be paid based on the amount of the commitment. This commitment fee is allocated to all of the funds participating in the line of credit based on the average net assets of the funds. During the six-month period ended June 30, 2012, the Fund did not have any borrowings under this facility.
| 10. | Industry Classifications: |
Other than the industry classifications “Other Investment Pools and Funds” and “Exchange Traded Funds,” equity industry classifications used in this report are the Global Industry Classification Standard, which was developed by and is the exclusive property and service mark of MSCI, Inc. and Standard & Poor’s.
| 11. | Indemnifications: |
Under the Company’s organizational documents, the Company shall indemnify its officers and directors to the full extent required or permitted under Maryland General Corporation Law and the federal securities laws. In addition, the Company, on behalf of the Fund, may enter into contracts that contain a variety of indemnifications. The Company’s maximum exposure under these arrangements is unknown. However, as of the date of these financial statements, the Company has not had prior claims or losses pursuant to these contracts and expects the risk of loss to be remote.
| 21 |
| Hartford Stock HLS Fund |
| Financial Highlights |
| - Selected Per-Share Data (A) - |
| Class | Net Asset Value at Beginning of Period | Net Investment Income (Loss) | Payments from (to) Affiliate | Net Realized and Unrealized Gain (Loss) on Investments | Total from Investment Operations | Dividends from Net Investment Income | Distributions from Realized Capital Gains | Distributions from Capital | Total Distributions | Net Increase (Decrease) in Net Asset Value | Net Asset Value at End of Period | |||||||||||||||||||||||||||||||||
| For the Six-Month Period Ended June 30, 2012 (Unaudited) | ||||||||||||||||||||||||||||||||||||||||||||
| IA | $ | 39.95 | $ | 0.39 | $ | – | $ | 3.69 | $ | 4.08 | $ | – | $ | – | $ | – | $ | – | $ | 4.08 | $ | 44.03 | ||||||||||||||||||||||
| IB | 39.92 | 0.34 | – | 3.68 | 4.02 | – | – | – | – | 4.02 | 43.94 | |||||||||||||||||||||||||||||||||
| For the Year Ended December 31, 2011 | ||||||||||||||||||||||||||||||||||||||||||||
| IA | 40.98 | 0.62 | – | (1.07 | ) | (0.45 | ) | (0.58 | ) | – | – | (0.58 | ) | (1.03 | ) | 39.95 | ||||||||||||||||||||||||||||
| IB | 40.94 | 0.51 | – | (1.06 | ) | (0.55 | ) | (0.47 | ) | – | – | (0.47 | ) | (1.02 | ) | 39.92 | ||||||||||||||||||||||||||||
| For the Year Ended December 31, 2010 | ||||||||||||||||||||||||||||||||||||||||||||
| IA | 36.10 | 0.44 | – | 4.89 | 5.33 | (0.45 | ) | – | – | (0.45 | ) | 4.88 | 40.98 | |||||||||||||||||||||||||||||||
| IB | 36.06 | 0.35 | – | 4.88 | 5.23 | (0.35 | ) | – | – | (0.35 | ) | 4.88 | 40.94 | |||||||||||||||||||||||||||||||
| For the Year Ended December 31, 2009 | ||||||||||||||||||||||||||||||||||||||||||||
| IA | 25.86 | 0.48 | – | 10.25 | 10.73 | (0.49 | ) | – | – | (0.49 | ) | 10.24 | 36.10 | |||||||||||||||||||||||||||||||
| IB | 25.84 | 0.39 | – | 10.24 | 10.63 | (0.41 | ) | – | – | (0.41 | ) | 10.22 | 36.06 | |||||||||||||||||||||||||||||||
| For the Year Ended December 31, 2008 | ||||||||||||||||||||||||||||||||||||||||||||
| IA | 47.11 | 0.59 | – | (20.79 | ) | (20.20 | ) | (0.81 | ) | (0.24 | ) | – | (1.05 | ) | (21.25 | ) | 25.86 | |||||||||||||||||||||||||||
| IB | 47.00 | 0.50 | – | (20.72 | ) | (20.22 | ) | (0.70 | ) | (0.24 | ) | – | (0.94 | ) | (21.16 | ) | 25.84 | |||||||||||||||||||||||||||
| For the Year Ended December 31, 2007 | ||||||||||||||||||||||||||||||||||||||||||||
| IA | 52.57 | 0.60 | – | 2.43 | 3.03 | (0.57 | ) | (7.92 | ) | – | (8.49 | ) | (5.46 | ) | 47.11 | |||||||||||||||||||||||||||||
| IB | 52.45 | 0.45 | – | 2.44 | 2.89 | (0.42 | ) | (7.92 | ) | – | (8.34 | ) | (5.45 | ) | 47.00 | |||||||||||||||||||||||||||||
| (A) | Information presented relates to a share outstanding throughout the indicated period. |
| (B) | The figures do not include sales charges or other fees which may be applied at the variable life insurance, variable annuity or qualified retirement plan product level. Any such additional sales charges or other fees would lower the Fund's performance. |
| (C) | Ratios do not reflect reductions for fees paid indirectly. Please see Fees Paid Indirectly in the Notes to Financial Statements. |
| (D) | Portfolio turnover rate is calculated on the basis of the Fund as a whole without distinguishing between the classes of shares issued. |
| (E) | Not annualized. |
| (F) | Annualized. |
| (G) | Total return without the inclusion of the Payment from (to) Affiliate can be found in Expenses in the accompanying Notes to Financial Statements. |
| 22 |
- Ratios and Supplemental Data -
| Total Return(B) | Net Assets at End of Period | Ratio of Expenses to Average Net Assets Before Waivers(C) | Ratio of Expenses to Average Net Assets After Waivers(C) | Ratio of Net Investment Income (Loss) to Average Net Assets | Portfolio Turnover Rate(D) | |||||||||||||||||
| 10.22 | %(E) | $ | 1,612,046 | 0.50 | %(F) | 0.50 | %(F) | 1.69 | %(F) | 74 | % | |||||||||||
| 10.08 | (E) | 219,993 | 0.75 | (F) | 0.75 | (F) | 1.44 | (F) | – | |||||||||||||
| (1.09 | ) | 1,614,788 | 0.50 | 0.50 | 1.37 | 43 | ||||||||||||||||
| (1.34 | ) | 231,377 | 0.75 | 0.75 | 1.11 | – | ||||||||||||||||
| 14.80 | 1,980,502 | 0.50 | 0.50 | 1.09 | 77 | |||||||||||||||||
| 14.51 | 300,279 | 0.75 | 0.75 | 0.84 | – | |||||||||||||||||
| 41.54 | (G) | 2,055,227 | 0.51 | 0.51 | 1.43 | 84 | ||||||||||||||||
| 41.18 | (G) | 328,275 | 0.76 | 0.76 | 1.19 | – | ||||||||||||||||
| (43.13 | ) | 1,810,864 | 0.49 | 0.49 | 1.38 | 89 | ||||||||||||||||
| (43.27 | ) | 287,794 | 0.74 | 0.74 | 1.13 | – | ||||||||||||||||
| 5.90 | 3,909,045 | 0.49 | 0.49 | 1.01 | 96 | |||||||||||||||||
| 5.64 | 652,838 | 0.74 | 0.74 | 0.76 | – | |||||||||||||||||
| 23 |
| Hartford Stock HLS Fund |
| Directors and Officers (Unaudited) |
The Board of Directors of the Company appoints officers who are responsible for the day-to-day operations of the Fund and who execute policies formulated by the Directors. Each director serves until his or her death, resignation, or retirement or until the next annual meeting of shareholders is held or until his or her successor is elected and qualifies.
Directors and officers who are employed by or who have a financial interest in The Hartford are considered “interested” persons of the Fund pursuant to the 1940 Act. Each officer and two of the Company’s directors, as noted in the chart below, are “interested” persons of the Fund. Each director serves as a director for The Hartford Mutual Funds, Inc., The Hartford Mutual Funds II, Inc., Hartford Series Fund, Inc., Hartford HLS Series Fund II, Inc., and as a trustee for The Hartford Alternative Strategies Fund, which, as of June 30, 2012, collectively consist of 89 funds. Correspondence may be sent to directors and officers c/o Hartford Mutual Funds, P.O. Box 2999, Hartford, Connecticut 06104-2999, except that correspondence to Mr. Annoni, Mr. Dressen and Ms. Fagely may be sent to 500 Bielenberg Drive, Woodbury, Minnesota 55125.
The table below sets forth, for each director and officer, his or her name, year of birth, current position with the Company and date first elected or appointed to Hartford Series Fund, Inc. (“HSF”), and Hartford HLS Series Fund II, Inc. (“HSF2”), principal occupation, and, for directors, other directorships held. The Fund’s statement of additional information contains further information on the directors and is available free of charge by calling 1-800-862-6668 or writing to Hartford HLS Funds, c/o Individual Annuity Services, P.O. Box 5085, Hartford, CT 06102-5085.
Information on the aggregate remuneration paid to the directors of the Company can be found in the Statement of Operations herein. The Fund pays to The Hartford a portion of the Chief Compliance Officer’s compensation, but does not pay salaries or compensation to any of their other officers or directors who are employed by The Hartford.
Non-Interested Directors
Lynn S. Birdsong (1946) Director since 2003, Co-Chairman of the Investment Committee
Mr. Birdsong is a private investor. Mr. Birdsong currently serves as a Director of the Sovereign High Yield Investment Company (April 2010 to current). Mr. Birdsong currently serves as an Independent Director of Nomura Partners Funds, Inc. (formerly, The Japan Fund) (March 2003 to current). From 1979 to 2002, Mr. Birdsong was a managing director of Zurich Scudder Investments, an investment management firm. During his employment with Scudder, Mr. Birdsong was an Interested Director of The Japan Fund. Since 1981, Mr. Birdsong has been a partner in Birdsong Company, an advertising specialty firm.
Robert M. Gavin, Jr. (1940) Director since 2002 (HSF) and 1986 (HSF2), Chairman of the Board since 2004
Dr. Gavin is an educational consultant. Prior to September 1, 2001, he was President of Cranbrook Education Community and prior to July 1996, he was President of Macalester College, St. Paul, Minnesota.
Duane E. Hill (1945) Director since 2001 (HSF) and 2002 (HSF2), Chairman of the Nominating Committee
Mr. Hill is Partner of TSG Ventures L.P., a private equity investment company. Mr. Hill is a former partner of TSG Capital Group, a private equity investment firm that served as sponsor and lead investor in leveraged buyouts of middle market companies.
Sandra S. Jaffee (1941) Director since 2005
Ms. Jaffee is the founder and Chief Executive Officer of a private company, Homeworks Concierge, LLC, which provides residential property management services in Westchester County, New York (January 2012 to present). Ms. Jaffee served as Chairman (2008 to 2009) and Chief Executive Officer of Fortent (formerly Searchspace Group), a leading provider of compliance/regulatory technology to financial institutions from August 2005 to August 2009. Ms. Jaffe currently serves as a member of the Board of Directors of Broadridge Financial Solutions as well as a Trustee of Muhlenberg College.
William P. Johnston (1944) Director since 2005, Chairman of the Compliance Committee
In June 2006, Mr. Johnston was appointed as Senior Advisor to The Carlyle Group, a global private equity investment firm. In August 2007, Mr. Johnston was elected to the Board of Directors of LifeCare Holdings, Inc. In February 2008, Mr. Johnston was elected to the Board of Directors of HCR-ManorCare, Inc. In May 2006, Mr. Johnston was elected to the Supervisory Board of Fresenius Medical Care AG & Co. KGaA, after its acquisition of Renal Care Group, Inc. in March 2006.
Phillip O. Peterson (1944) Director since 2002 (HSF) and 2000 (HSF2), Chairman of the Audit Committee
Mr. Peterson is a mutual fund industry consultant. He was a partner of KPMG LLP (an accounting firm) until July 1999. Mr. Peterson joined William Blair Funds in February 2007 as a member of the Board of Trustees. Mr. Peterson also joined the Board of Trustees of Symetra Variable Mutual Funds Trust as a trustee in February 2012.
| 24 |
Lemma W. Senbet (1946) Director since 2005
Dr. Senbet is the William E. Mayer Chair Professor of Finance and Director, Center for Financial Policy, at the University of Maryland, Robert H. Smith School of Business. He was chair of the Finance Department from 1998 to 2006. Previously he was a chaired professor of finance at the University of Wisconsin-Madison. Also, he was director of the Fortis Funds from March 2000 to July 2002. Dr. Senbet served the finance profession in various capacities, including as director of the American Finance Association and President of the Western Finance Association. In 2006, Dr. Senbet was inducted Fellow of Financial Management Association International for his career-long distinguished scholarship and professional service.
Interested Directors and Officers
David N. Levenson (1966) Director since 2010(1)
Mr. Levenson currently serves as President of The Hartford’s Wealth Management business. He was appointed to this role in July 2010. Previously, Mr. Levenson served as Executive Vice President of Legacy Holdings for The Hartford from June 2009 to July 2010. From 2006 to 2009, Mr. Levenson was with Hartford Life Insurance K.K. where he served as President and Chief Executive Officer from 2007 to 2009. He served as Managing Director of Hartford Investment Management Company from 2005 to 2006. Additionally, Mr. Levenson serves as Executive Vice President of The Hartford and as President, Director and Chief Executive Officer of Hartford Life Insurance Company (“HLIC”) and Hartford Life, Inc. (“HL Inc.”).
(1) Mr. Levenson served as Interested Director until August 2, 2012.
Lowndes A. Smith (1939) Director since 1996 (HSF) and 2002 (HSF2), Co-Chairman of the Investment Committee
Mr. Smith served as Vice Chairman of The Hartford from February 1997 to January 2002, as President and Chief Executive Officer of HL Inc. from February 1997 to January 2002, and as President and Chief Operating Officer of The Hartford Life Insurance Companies from January 1989 to January 2002. Mr. Smith serves as a Director of White Mountains Insurance Group, Ltd., One Beacon Insurance and Symetra Financial and as Managing Director of Whittington Gray Associates.
Other Officers
James E. Davey (1964) President and Chief Executive Officer since 2010(2)
Mr. Davey serves as Executive Vice President of HLIC. Additionally, Mr. Davey serves as President, Chief Executive Officer and Manager of HIFSCO and President, Chief Executive Officer and Manager of HL Investment Advisors, LLC (“HL Advisors”). Mr. Davey joined The Hartford in 2002.
(2) Mr. Davey became an Interested Director effective August 2, 2012.
Mark A. Annoni (1964) Vice President, Controller and Treasurer since 2012(3)
Mr. Annoni serves as the Assistant Vice President and Director of Investment Finance (February 2004 to present). Mr. Annoni joined The Hartford in April 2001 as part of The Hartford’s acquisition of Fortis Financial Group. Prior to joining The Hartford, Mr. Annoni served as Manager of Mutual Fund Accounting at Fortis Financial Group (July 1997 to April 2001).
(3) Mr. Annoni was named Vice President, Controller and Treasurer on May 8, 2012.
Michael R. Dressen (1963) AML Compliance Officer since 2011
Mr. Dressen currently serves as Assistant Vice President of HLIC. He also serves as Chief Compliance Officer and AML Compliance Officer of Hartford Administrative Services Company (“HASCO”) and as Assistant Secretary and Compliance Officer of HIFSCO. Mr Dressen joined The Hartford in 2005 from State Farm Insurance Companies where he held various positions related to mutual funds, variable products, and property casualty insurance.
Tamara L. Fagely (1958) Vice President, since 2002 (HSF) and 1993 (HSF2)(4)
Ms. Fagely has been a Vice President of HASCO since 1998 and Chief Financial Officer since 2006. Currently Ms. Fagely is a Vice President of HLIC. She served as Assistant Vice President of HLIC from December 2001 through March 2005. In addition, Ms. Fagely is Controller and Chief Financial Officer of HIFSCO.
(4) Ms. Fagely served as Vice President, Controller and Treasurer until May 8, 2012.
Dr. Robert J. Froehlich (1953) Senior Managing Director since 2009(5)
Dr. Froehlich joined The Hartford as Senior Managing Director in September 2009. Prior to joining The Hartford, Dr. Froehlich served as Vice Chairman of Deutsche Asset Management from 1997-2009.
(5) Dr. Froehlich served as Senior Managing Director until March 26, 2012.
| 25 |
| Hartford Stock HLS Fund |
| Directors and Officers (Unaudited) – (continued) |
Edward P. Macdonald (1967) Vice President, Secretary and Chief Legal Officer since 2005
Mr. Macdonald serves as Vice President of HLIC and Chief Legal Officer of Mutual Funds and Vice President of HIFSCO. He also serves as Vice President and Secretary of HASCO, and Chief Legal Officer, Secretary and Vice President of HL Advisors. Mr. Macdonald joined The Hartford in 2005.
Vernon J. Meyer (1964) Vice President since 2006
Mr. Meyer serves as Senior Vice President of HLIC. He also serves as Senior Vice President of HIFSCO and HL Advisors. Mr. Meyer joined The Hartford in 2004.
Colleen B. Pernerewski (1969) Vice President and Chief Compliance Officer since 2010
Ms. Pernerewski serves as Vice President and Chief Investment Advisor Compliance Officer of HIFSCO and as Vice President and Chief Compliance Officer of HL Advisors. Ms. Pernerewski serves as Vice President and Chief Compliance Officer of Individual Annuity of HLIC. Ms. Pernerewski joined The Hartford in 2005 from Travelers Life and Annuity where she served as Counsel (2004-2005). Prior to Travelers Life and Annuity, Ms. Pernerewski held the position of Counsel at The Hartford (1998-2004).
Elizabeth L. Schroeder (1966) Vice President since 2010
Ms. Schroeder currently serves as Assistant Vice President of HLIC. Ms. Schroeder joined HLIC in 1991. She is also an Assistant Vice President of HASCO, HIFSCO and HL Advisors.
Martin Swanson (1962) Vice President since 2010
Mr. Swanson is a Vice President of HLIC. Mr. Swanson also serves as Vice President/Marketing for HIFSCO. Prior to joining HLIC in 1998, Mr. Swanson was a Vice President at PaineWebber, Inc.
Jane Wolak (1961) Vice President since 2009
Ms. Wolak currently serves as Senior Vice President of HLIC. Ms. Wolak joined HLIC as Vice President, Retail Product Services in May 2007. She is also Vice President of HASCO. Previously, Ms. Wolak was with Sun Life Financial where she held the position of Vice President, Service Center Operations from 2001-2007.
HOW TO OBTAIN A COPY OF THE FUND’S PROXY VOTING POLICIES AND VOTING RECORDS (UNAUDITED)
A description of the policies and procedures that the Fund uses to determine how to vote proxies relating to portfolio securities and a record of how the Fund voted any proxies for the twelve-month period ended June 30, 2012 are available (1) without charge, upon request, by calling 800-862-6668 and (2) on the SEC’s website at http://www.sec.gov.
QUARTERLY PORTFOLIO HOLDINGS INFORMATION (UNAUDITED)
The Fund files a complete schedule of portfolio holdings with the SEC for the first and third quarters of each fiscal year on Form N-Q. The Fund’s Forms are available (1) without charge, upon request, by calling 800-862-6668 and (2) on the SEC’s website at http://www.sec.gov. The Form N-Q may be reviewed and copied at the SEC’s Public Reference Room in Washington, DC. Information on the operation of the Public Reference Room may be obtained by calling 1-800-SEC-0330.
| 26 |
| Hartford Stock HLS Fund |
| Expense Example (Unaudited) |
Your Fund's Expenses
As a shareholder of the Fund, you incur two types of costs: (1) transaction costs and (2) ongoing costs including investment management fees, distribution fees, and other fund expenses. This example is intended to help you understand your ongoing costs (in dollars) of investing in the Fund and to compare these costs with the ongoing costs of investing in other mutual funds. The example is based on an investment of $1,000 invested at the beginning of the period and held for the period of December 31, 2011 through June 30, 2012.
Actual Expenses
The first set of columns of the table below provides information about actual account values and actual expenses. You may use the information in this column, together with the amount you invested, to estimate the expenses that you paid over the period. Simply divide your account value by $1,000 (for example, an $8,600 account value divided by $1,000 = 8.6), then multiply the result by the number in the line under the heading entitled “Expenses Paid During Period” to estimate the expenses you paid on your account during this period.
Hypothetical Example for Comparison Purposes
The second set of columns of the table below provides information about hypothetical account values and hypothetical expenses based on the Fund’s actual expense ratio and an assumed rate of return of 5% per year before expenses, which is not the Fund’s actual return. The hypothetical account values and expenses may not be used to estimate the actual ending account balance or expenses you paid for the period. You may use this information to compare the ongoing costs of investing in the Fund and other funds. To do so, compare this 5% hypothetical example with the 5% hypothetical examples that appear in the shareholder reports of the other funds.
Please note that the expenses shown in the table are meant to highlight your ongoing costs only and do not reflect any transactional costs, such as sales charges (loads) and CDSC. Therefore, the second set of columns of the table is useful in comparing ongoing costs only, and will not help you determine the relative total costs of owning different funds. In addition, if these transactional costs were included, your costs would be higher. Expenses are equal to the Fund's annualized expense ratios multiplied by average account value over the period, multiplied by 182/366 (to reflect the one-half year period).
| Actual return | Hypothetical (5% return before expenses) | |||||||||||||||||||||||||||||||||||
| Beginning Account Value December 31, 2011 | Ending Account Value June 30, 2012 | Expenses paid during the period December 31, 2011 through June 30, 2012 | Beginning Account Value December 31, 2011 | Ending Account Value June 30, 2012 | Expenses paid during the period December 31, 2011 through June 30, 2012 | Annualized expense ratio | Days in the current 1/2 year | Days in the full year | ||||||||||||||||||||||||||||
| Class IA | $ | 1,000.00 | $ | 1,102.15 | $ | 2.61 | $ | 1,000.00 | $ | 1,022.38 | $ | 2.51 | 0.50 | % | 182 | 366 | ||||||||||||||||||||
| Class IB | $ | 1,000.00 | $ | 1,100.78 | $ | 3.92 | $ | 1,000.00 | $ | 1,021.13 | $ | 3.77 | 0.75 | % | 182 | 366 | ||||||||||||||||||||
| 27 |
HARTFORD HLS FUNDS
c/o The Hartford Wealth Management - Global Annuities
P.O. Box 14293
Lexington, KY 40512-4293
Hartford Series Fund, Inc. is underwritten and distributed by Hartford Securities Distribution Company, Inc.
"The Hartford" is The Hartford Financial Services Group, Inc. and its subsidiaries.
Hartford Series Fund, Inc. inception dates range from 1977 to date. Hartford Series Fund, Inc. is not a subsidiary of The Hartford but is underwritten, distributed by and advised by subsidiaries of The Hartford. Investments in Hartford Series Fund, Inc. are not guaranteed by The Hartford or any other entity.
You should carefully consider investment objectives, risks, and charges and expenses of Hartford HLS Funds before investing. This and other information can be found in the Fund’s prospectus or summary prospectus, which can be obtained by calling 800-862-6668. Please read them carefully before you invest or send money.
| HLSSAR-S12 8-12 111647 Printed in U.S.A ©2012 The Hartford, Hartford, CT 06115 | |

A MESSAGE FROM THE PRESIDENT
Dear Fellow Shareholders:
I want to take this opportunity to say thank you for investing in the Hartford HLS Funds. We’ve seen continued market volatility throughout the first half of 2012, and there will likely be continued uncertainty until the Presidential election in November, but we are still optimistic about the markets in 2012.
Market Review
In the first quarter of 2012, the S&P 500 Index turned in its best quarterly performance since the third quarter of 2009. U.S. equities showed signs of improvement as investors focused on improving economic data and strong corporate earnings news and the Federal Reserve’s pledge to keep interest rates low buoyed investors’ appetites.
The second quarter ended on a high note for the stock market—the S&P 500 had its strongest June in more than a decade and the Dow Jones Industrial Average had its best month since October—but those gains weren’t enough to offset losses from April and May, and equities finished the quarter in the red. Although the S&P 500 was -2.75 for the second quarter, it was up 9.49% for the first half of 2012.
Concerns about domestic and European unemployment are having an effect on our economy. The unemployment rate in the euro zone's 17 nations rose to a record 11.1% in May, the highest level since the euro launched as a common currency more than 10 years ago. In the U.S., the labor market has been fickle this year, with job growth starting off strong in the first couple months of 2012 but slowing down in the spring, which has led many to wonder about the status of the economic recovery.
On a positive note, home prices are rising again after falling for more than five years, new and existing home sales are increasing, and home builders are ramping up construction.
The Hartford HLS Funds Expands Relationship with Wellington Management
We’re very pleased that we are expanding our relationship with Wellington Management, which will now serve as the primary sub-adviser for the Hartford HLS Funds including equity, fixed-income,* and asset-allocation funds. One of America’s oldest and largest investment management firms, Wellington Management has resources that span the entire globe, with multiple offices across the U.S. and numerous offices abroad. Wellington Management’s most distinctive strength is its proprietary research, which is shared across the entire organization.
We believe that aligning more closely with a well-respected money manager like Wellington Management puts us in a strong position to drive significant growth and to continue delivering innovative fund strategies to help our investors meet their financial goals.
Thank you again for investing with the Hartford HLS Funds.
James Davey
President
Hartford HLS Funds
*Several fixed-income funds will continue to be sub-advised by Hartford Investment Management Company.
Hartford Total Return Bond HLS Fund
Table of Contents
This report is prepared for the general information of contract owners and qualified retirement plan participants. It is not an offer of contracts or of qualified retirement plans. It should not be used in connection with any offer, except in conjunction with the appropriate product prospectus which contains all pertinent information including the applicable sales, administrative and other charges.
The views expressed in the Fund’s Manager Discussion under “Why did the Fund perform this way?” and “What is the outlook?” are views of the Fund’s sub-adviser and portfolio management team through the end of the period and are subject to change based on market and other conditions.
Hartford Total Return Bond HLS Fund inception 08/31/1977
(sub-advised by Wellington Management Company, LLP)
| Investment objective – Seeks a competitive total return, with income as a secondary objective. |
Performance Overview 6/30/02 - 6/30/12
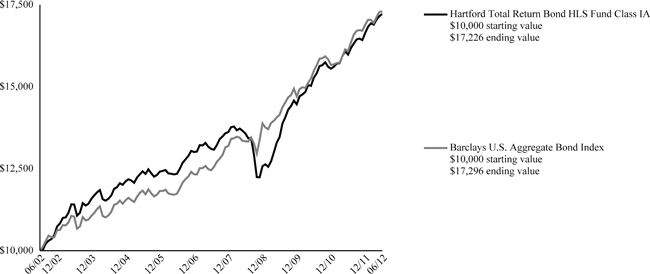
The chart above shows the growth of a $10,000 investment in Class IA. Growth results in classes other than Class IA will vary from what is seen above due to differences in the expenses charged to those share classes.
Average Annual Total Returns (as of 6/30/12)
| 6 Month† | 1 Year | 5 year | 10 year | |
| Total Return Bond IA | 3.52% | 7.78% | 5.62% | 5.59% |
| Total Return Bond IB | 3.39% | 7.52% | 5.36% | 5.33% |
| Barclays U.S. Aggregate Bond Index | 2.37% | 7.47% | 6.79% | 5.63% |
| † | Not Annualized |
PAST PERFORMANCE IS NOT INDICATIVE OF FUTURE RESULTS.
Total returns presented above were calculated using the Fund's net asset value available to shareholders for sale or redemption of Fund shares on June 30, 2012, which may exclude investment transactions as of this date.
Performance information includes performance of the Fund’s previous sub-adviser, Hartford Investment Management Company. As of March 5, 2012, Hartford Investment Management Company no longer serves as the sub-adviser to the Fund.
Barclays U.S. Aggregate Bond Index (formerly known as Barclays Capital U.S. Aggregate Bond Index) is an unmanaged index and is composed of securities from the Barclays Government/Credit Bond Index, Mortgage-Backed Securities Index, Asset-Backed Securities Index and Commercial Mortgage-Backed Securities Index.
You cannot invest directly in an index.
The chart represents a hypothetical investment in the Fund. Performance data represents past performance and current performance could be higher or lower.
Performance information may reflect historical or current expense waivers/reimbursements from the investment adviser, without which performance would have been lower. For information on current expense waivers/reimbursements, please see the prospectus.
The value of the Fund will fluctuate so that when redeemed, it may be worth more or less than the original investment. The chart and table do not reflect the deductions of taxes, sales charges or other fees which may be applied at the variable life insurance, variable annuity or qualified retirement plan product level. Any such additional sales charges or other fees or expenses would lower the contract’s or plan’s performance.
| 2 |
| Hartford Total Return Bond HLS Fund |
| Manager Discussion |
| June 30, 2012 (Unaudited) |
| Portfolio Managers | ||||
| Joseph F. Marvan, CFA | Lucius T. (L.T.) Hill, III | Campe Goodman, CFA | ||
| Senior Vice President and Fixed Income Portfolio Manager | Senior Vice President and Fixed Income Portfolio Manager | Vice President and Fixed Income Portfolio Manager | ||
| As of March 5, 2012, Wellington Management Company, LLP became the sub-adviser for the Fund. As of the same date, Hartford Investment Management Company no longer serves as the sub-adviser to the Fund. | ||||
How did the Fund perform?
The Class IA shares of the Hartford Total Return Bond HLS Fund returned 3.52%, before sales charge, for the six-month period ended June 30, 2012, outperforming its benchmark, the Barclays U.S. Aggregate Bond Index, which returned 2.37% for the same period. The Fund underperformed the 3.60% return of the average fund in the Lipper Intermediate Investment Grade Debt VP-UF Funds peer group, a group of funds that invest primarily in investment-grade debt issues with dollar-weighted average maturities of five to ten years.
Why did the Fund perform this way?
Anxiety over Europe’s worsening debt crisis and deteriorating global growth kept markets on edge during the period. Early on, some improvement in the European debt crisis supported demand for risky assets. However, growing uncertainty about the outlook for the euro area, a rescue of Spanish banks, and a host of sovereign and corporate debt downgrades all weighed on investor sentiment primarily during the second quarter. Signs of softening in the U.S. economy further added to market tension. The U.S. Federal Open Market Committee (FOMC) reduced its economic growth outlook, noting the recent deterioration in the labor market and slowdown in consumer spending. Federal Reserve Board (Fed) policy remained extremely accommodative throughout the period. The Fed extended its Operation Twist program in an effort to lower long-term interest rates and help prop up the economy. Meanwhile, the FOMC kept its late 2014 rate guidance intact and signaled its readiness to take further action if warranted.
U.S. Treasury yields declined over the period as slowing global growth triggered demand for safe-haven government debt. The U.S. Treasury curve flattened as longer term yields declined more than short-term rates. All of the major fixed income spread sectors posted positive absolute returns with the overall decline in interest rates, but results were mixed relative to Treasuries during the period on an excess return basis amid the volatile and uncertain environment.
During the first two months of 2012, the Fund earned positive returns from tactical long-duration positioning compared against the benchmark. In anticipation of further stress in Europe, the Fund benefitted by underweighting (i.e. the Fund’s position was less than the benchmark position) European financial securities.
On March 5, 2012, Wellington Management Company, LLP (Wellington) became sub-adviser of the Fund replacing Hartford Investment Management Company. The Fund’s principal investment strategy did not change in connection with this transition.
From March 5, 2012, we focused on transitioning the portfolio to our desired positioning, in particular moving out of lower quality high yield corporate bonds and into BB-rated bonds, as well as adding exposure to non-agency Mortgage Backed Securities (MBS) and Commercial MBS. The Fund’s benchmark-relative outperformance during the period was primarily due to our exposure in lower coupon agency MBS pass-throughs, achieved through both specified mortgage pools and To-Be-Announced securities (TBAs). Security selection within investment-grade corporates and an allocation to non-agency MBS also contributed to relative performance. Our Treasury Inflation Protected Securities (TIPS) positioning, achieved through cash bonds and Consumer Price Index swaps, was modestly additive. However, an allocation to high yield cash bonds and high yield Credit Default Swaps detracted from relative results. Our tactical duration and yield curve positioning was neutral for performance.
What is the outlook?
We have a slightly pro-cyclical bias, as manifested by our allocation to risky assets such as BB-rated high yield, non-agency Residential MBS, and an overweight (i.e. the Fund’s sector position was greater than the benchmark position) to Financials within investment-grade corporates. Nevertheless, we are cautious given macro uncertainties. On the one hand, long-term valuations look very attractive and fundamentals appear to be on solid footing, suggesting a positive stance toward risky assets. On the other hand, macro risks such as the European debt crisis, a slowdown in China, and the U.S. fiscal cliff due to the potential expiration of tax cuts, which we believe could subtract as much as 4% from U.S. Gross Domestic Product growth, have held us back from adding risk at a meaningful level.
| 3 |
| Hartford Total Return Bond HLS Fund |
| Manager Discussion – (continued) |
| June 30, 2012 (Unaudited) |
As of the end of the period, we continued to be positioned with an underweight to the government sector, as we believe that there are more compelling opportunities in other sectors. We had a significant overweight to agency MBS which we view as an excellent high quality alternative to low yielding government securities. We were also modestly overweight to the credit sector due to strong credit fundamentals, primarily in financial and communications issuers. We believe that financial companies have de-levered significantly and communications issuers have solid balance sheets. Within high yield credit we have an up-in-quality bias and favored BB issuers where fundamentals are strong and defaults are expected to stay low. In the CMBS market, we continued to believe that there is strong collateralization in senior CMBS tranches and were positioned with a modest overweight relative to the benchmark. Within Asset Backed Securities, we favored the consumer sectors on improving fundamentals.
We have been tactical in our duration positioning based on our view that rates will stay in a range with relatively low volatility. As of the end of the period we had a modestly long duration position believing the market was priced for higher rates than we anticipated in the future. Even though rates are at extremely low levels, we believe there is some room for yields to fall should any of the major near-term risks materialize. Several derivative option positions transitioned from HIMCO to Wellington on March 5, 2012. These positions expired in late March 2012 and had a slight negative impact on the Fund’s performance. Going forward, options are not principal instruments utilized by Wellington. The options might be used at times, particularly in the currency and interest rate space.
Distribution by Credit Quality
as of June 30, 2012
| Credit Rating * | Percentage of Net Assets | |||
| Aaa / AAA | 2.4 | % | ||
| Aa / AA | 3.0 | |||
| A | 9.7 | |||
| Baa / BBB | 16.8 | |||
| Ba / BB | 6.9 | |||
| B | 2.3 | |||
| Caa / CCC or Lower | 4.6 | |||
| Unrated | 0.2 | |||
| U.S. Government Agencies and Securities | 74.9 | |||
| Non Debt Securities and Other Short-Term Instruments | 9.8 | |||
| Other Assets & Liabilities | (30.6 | ) | ||
| Total | 100.0 | % | ||
| * | Does not apply to the Fund itself. Based upon Moody’s and S&P long-term credit ratings for the Fund’s holdings as of the date noted. If Moody's and S&P assign different ratings to a holding, the lower rating is used. "Unrated" includes fixed-income securities (other than cash-like short-term instruments and U.S. Government securities) for which Moody’s and S&P have not issued long-term credit ratings. |
Diversification by Industry
as of June 30, 2012
| Industry | Percentage of Net Assets | |||
| Fixed Income Securities | ||||
| Accommodation and Food Services | 0.2 | % | ||
| Administrative Waste Management and Remediation | 0.0 | |||
| Air Transportation | 0.1 | |||
| Apparel Manufacturing | 0.1 | |||
| Arts, Entertainment and Recreation | 2.3 | |||
| Beverage and Tobacco Product Manufacturing | 1.0 | |||
| Chemical Manufacturing | 0.8 | |||
| Computer and Electronic Product Manufacturing | 0.5 | |||
| Construction | 0.1 | |||
| Fabricated Metal Product Manufacturing | 0.2 | |||
| Finance and Insurance | 24.4 | |||
| Food Manufacturing | 0.4 | |||
| General Obligations | 0.7 | |||
| Health Care and Social Assistance | 1.8 | |||
| Higher Education (Univ., Dorms, etc.) | 0.1 | |||
| Information | 3.2 | |||
| Machinery Manufacturing | 0.3 | |||
| Mining | 0.6 | |||
| Miscellaneous | 0.1 | |||
| Miscellaneous Manufacturing | 0.6 | |||
| Motor Vehicle and Parts Manufacturing | 0.1 | |||
| Nonmetallic Mineral Product Manufacturing | 0.2 | |||
| Petroleum and Coal Products Manufacturing | 2.1 | |||
| Pipeline Transportation | 0.5 | |||
| Primary Metal Manufacturing | 0.3 | |||
| Professional, Scientific and Technical Services | 0.1 | |||
| Real Estate, Rental and Leasing | 0.5 | |||
| Retail Trade | 1.2 | |||
| Tax Allocation | 0.0 | |||
| Transportation Equipment Manufacturing | 0.1 | |||
| Utilities | 1.7 | |||
| Utilities - Electric | 0.3 | |||
| Utilities - Water and Sewer | 0.2 | |||
| Wholesale Trade | 0.6 | |||
| Total | 45.4 | % | ||
| Equity Securities | ||||
| Diversified Banks | 0.1 | |||
| Other Diversified Financial Services | 0.0 | |||
| Thrifts & Mortgage Finance | 0.0 | |||
| Total | 0.1 | % | ||
| Foreign Government Obligations | 0.5 | |||
| Put Options Purchased | 0.0 | |||
| U.S. Government Agencies | 61.3 | |||
| U.S. Government Securities | 13.6 | |||
| Short-Term Investments | 9.7 | |||
| Other Assets and Liabilities | (30.6 | ) | ||
| Total | 100.0 | % | ||
The above table represents sub-industry investments by industry, which combines multiple sub-industries into one industry category. Detailed information on sub-industry breakdowns is available in the Schedule of Investments.
| 4 |
| Hartford Total Return Bond HLS Fund |
| Schedule of Investments |
| June 30, 2012 (Unaudited) |
| (000’s Omitted) |
| Shares or Principal Amount | Market Value ╪ | |||||||
ASSET & COMMERCIAL MORTGAGE BACKED SECURITIES - 11.4% | ||||||||
| Finance and Insurance - 11.4% | ||||||||
| Captive Auto Finance - 1.3% | ||||||||
| Ally Automotive Receivables Trust | ||||||||
| $ | 1,900 | 3.00%, 10/15/2015 ■ | $ | 1,920 | ||||
| 5,675 | 3.38%, 09/15/2017 ■ | 5,854 | ||||||
| 5,650 | 3.61%, 08/15/2016 ■ | 5,883 | ||||||
| Bank of America Automotive Trust | ||||||||
| 5,443 | 3.03%, 10/15/2016 ■ | 5,494 | ||||||
| Carnow Automotive Receivables Trust | ||||||||
| 2,386 | 2.09%, 01/15/2015 ■ | 2,386 | ||||||
| Credit Acceptance Automotive Loan Trust | ||||||||
| 5,115 | 3.12%, 03/16/2020 ■ | 5,137 | ||||||
| Ford Credit Automotive Owner Trust | ||||||||
| 4,600 | 2.54%, 02/15/2016 | 4,768 | ||||||
| 3,680 | 3.21%, 07/15/2017 | 3,829 | ||||||
| 1,730 | 5.53%, 05/15/2016 ■ | 1,842 | ||||||
| Harley-Davidson Motorcycle Trust | ||||||||
| 4,180 | 2.12%, 08/15/2017 | 4,215 | ||||||
| Hyundai Automotive Receivables Trust | ||||||||
| 6,710 | 2.27%, 02/15/2017 | 6,884 | ||||||
| Prestige Automotive Receivables Trust | ||||||||
| 3,855 | 2.49%, 04/16/2018 ■ | 3,894 | ||||||
| SNAAC Automotive Receivables Trust | ||||||||
| 3,241 | 1.78%, 09/15/2014 ■ | 3,247 | ||||||
| 55,353 | ||||||||
| Captive Retail Finance - 0.1% | ||||||||
| CNH Equipment Trust | ||||||||
| 3,075 | 2.97%, 05/15/2017 | 3,178 | ||||||
| Fieldstone Mortgage Investment Corp. | ||||||||
| 3,465 | 0.59%, 04/25/2047 Δ | 1,453 | ||||||
| 4,631 | ||||||||
| Credit Card Issuing - 0.2% | ||||||||
| Chase Issuance Trust | ||||||||
| 6,920 | 5.12%, 10/15/2014 | 7,017 | ||||||
| GE Capital Credit Card Master Note Trust | ||||||||
| 3,230 | 2.21%, 06/15/2016 | 3,280 | ||||||
| 10,297 | ||||||||
| Real Estate Credit (Mortgage Banking) - 9.8% | ||||||||
| Argent Securities, Inc. | ||||||||
| 21,170 | 0.40%, 06/25/2036 Δ | 5,880 | ||||||
| Banc of America Funding Corp. | ||||||||
| 8,010 | 0.54%, 05/20/2047 Δ | 5,150 | ||||||
| 11,150 | 5.77%, 05/25/2037 | 8,725 | ||||||
| BCAP LLC Trust | ||||||||
| 4,789 | 0.43%, 03/25/2037 Δ | 2,878 | ||||||
| Bear Stearns Adjustable Rate Mortgage Trust | ||||||||
| 11,043 | 2.25%, 08/25/2035 Δ | 10,240 | ||||||
| 13,973 | 2.40%, 10/25/2035 Δ | 12,181 | ||||||
| Bear Stearns Commercial Mortgage Securities, Inc. | ||||||||
| 32,323 | 0.66%, 11/11/2041 ► | 101 | ||||||
| 37,752 | 0.86%, 07/11/2042 ► | 94 | ||||||
| 3,600 | 5.54%, 10/12/2041 | 4,114 | ||||||
| Citigroup/Deutsche Bank Commercial Mortgage Trust | ||||||||
| 7,950 | 5.32%, 12/11/2049 | 8,830 | ||||||
| 10,047 | 5.39%, 07/15/2044 Δ | 11,180 | ||||||
| Commercial Mortgage Loan Trust | ||||||||
| 7,740 | 6.20%, 12/10/2049 ‡Δ | 8,839 | ||||||
| Commercial Mortgage Pass-Through Certificates | ||||||||
| 28,762 | 2.46%, 07/10/2046 ■► | 2,581 | ||||||
| Consumer Portfolio Services, Inc. | ||||||||
| 620 | 5.01%, 06/17/2019 ■ | 621 | ||||||
| Countrywide Asset-Backed Certificates | ||||||||
| 15,720 | 0.48%, 07/25/2037 Δ | 2,919 | ||||||
| 15,820 | 0.49%, 04/27/2017 Δ | 4,330 | ||||||
| Countrywide Home Loans, Inc. | ||||||||
| 3,071 | 2.97%, 04/20/2036 Δ | 1,498 | ||||||
| 21,558 | 6.00%, 10/25/2037 | 20,055 | ||||||
| CS First Boston Mortgage Securities Corp. | ||||||||
| 5,767 | 5.50%, 06/25/2035 | 5,119 | ||||||
| CW Capital Cobalt Series 2006-C1, Class A4 | ||||||||
| 12,236 | 5.22%, 08/15/2048 | 13,515 | ||||||
| DBUBS Mortgage Trust | ||||||||
| 27,051 | 1.40%, 01/01/2021 ■► | 1,463 | ||||||
| 5,155 | 4.54%, 05/12/2021 ■ | 5,420 | ||||||
| First Franklin Mortgage Loan Asset Backed | ||||||||
| 14,867 | 0.49%, 04/25/2036 Δ | 5,855 | ||||||
| First Horizon Alternative Mortgage Securities | ||||||||
| 16,367 | 2.55%, 04/25/2036 Δ | 9,578 | ||||||
| 22,798 | 2.58%, 09/25/2035 Δ | 16,510 | ||||||
| Ford Credit Floorplan Master Owner Trust | ||||||||
| 6,225 | 1.50%, 09/15/2015 | 6,283 | ||||||
| GE Business Loan Trust | ||||||||
| 6,661 | 1.24%, 05/15/2034 ■Δ | 2,510 | ||||||
| GMAC Mortgage Corp. Loan Trust | ||||||||
| 3,291 | 4.89%, 09/19/2035 Δ | 2,790 | ||||||
| Goldman Sachs Mortgage Securities Trust | ||||||||
| 8,200 | 3.55%, 04/12/2034 ■ | 8,477 | ||||||
| GSAMP Trust | ||||||||
| 2,835 | 0.37%, 12/25/2036 Δ | 1,035 | ||||||
| 2,900 | 0.42%, 12/25/2036 Δ | 1,068 | ||||||
| 2,855 | 0.50%, 12/25/2036 Δ | 1,052 | ||||||
| GSR Mortgage Loan Trust | ||||||||
| 14,145 | 2.70%, 01/25/2036 Δ | 9,641 | ||||||
| Indymac Index Mortgage Loan Trust | ||||||||
| 3,319 | 0.37%, 07/25/2036 Δ | 1,748 | ||||||
| 3,645 | 2.52%, 01/25/2036 Δ | 2,790 | ||||||
| 2,132 | 2.63%, 08/25/2035 Δ | 1,181 | ||||||
| 13,106 | 2.82%, 03/25/2036 Δ | 7,220 | ||||||
| JP Morgan Automotive Receivable Trust | ||||||||
| 82 | 12.85%, 04/15/2012 ■ | 81 | ||||||
| JP Morgan Chase Commercial Mortgage Securities Corp. | ||||||||
| 8,400 | 3.91%, 05/05/2022 ■Δ | 8,613 | ||||||
| 12,745 | 5.34%, 05/15/2047 ‡ | 14,100 | ||||||
| 6,876 | 5.46%, 01/12/2043 Δ | 7,504 | ||||||
| 5,880 | 5.59%, 06/12/2041 Δ | 6,291 | ||||||
| 8,047 | 6.07%, 02/12/2051 | 8,514 | ||||||
| JP Morgan Mortgage Trust | ||||||||
| 3,975 | 5.01%, 09/25/2035 Δ | 3,353 | ||||||
The accompanying notes are an integral part of these financial statements.
| 5 |
| Hartford Total Return Bond HLS Fund |
| Schedule of Investments – (continued) |
| June 30, 2012 (Unaudited) |
| (000’s Omitted) |
| Shares or Principal Amount | Market Value ╪ | |||||||
ASSET & COMMERCIAL MORTGAGE BACKED SECURITIES - 11.4% - (continued) | ||||||||
| Finance and Insurance - 11.4% - (continued) | ||||||||
| Real Estate Credit (Mortgage Banking) - 9.8% - (continued) | ||||||||
| LB-UBS Commercial Mortgage Trust | ||||||||
| $ | 13,905 | 5.43%, 02/15/2040 | $ | 15,522 | ||||
| Lehman Brothers Small Balance Commercial | ||||||||
| 2,206 | 5.52%, 09/25/2030 ■ | 1,852 | ||||||
| 209 | 5.62%, 09/25/2036 ■ | 211 | ||||||
| Merrill Lynch Mortgage Investors Trust | ||||||||
| 12,695 | 0.51%, 03/25/2037 Δ | 4,512 | ||||||
| 1,890 | 2.78%, 07/25/2035 Δ | 1,295 | ||||||
| 2,839 | 5.59%, 03/25/2036 Δ | 1,644 | ||||||
| Merrill Lynch Mortgage Trust | ||||||||
| 5,135 | 5.20%, 09/12/2042 | 5,593 | ||||||
| Merrill Lynch/Countrywide Commercial Mortgage Trust | ||||||||
| 6,925 | 5.38%, 08/12/2048 | 7,496 | ||||||
| 17,210 | 5.75%, 06/12/2050 ‡Δ | 18,526 | ||||||
| Morgan Stanley ABS Capital I | ||||||||
| 1,556 | 0.31%, 12/25/2036 Δ | 844 | ||||||
| Morgan Stanley Capital I | ||||||||
| 102,584 | 1.14%, 09/15/2047 ■► | 3,796 | ||||||
| 17,025 | 5.69%, 04/15/2049 Δ | 18,738 | ||||||
| National Credit Union Administration | ||||||||
| 4,586 | 1.84%, 10/07/2020 Δ | 4,643 | ||||||
| Nationstar Home Equity Loan Trust | ||||||||
| 13,475 | 0.43%, 06/25/2037 Δ | 5,858 | ||||||
| Option One Mortgage Loan Trust | ||||||||
| 2,455 | 0.50%, 03/25/2037 Δ | 879 | ||||||
| Residential Asset Securities Corp. | ||||||||
| 15,170 | 0.49%, 08/25/2036 Δ | 3,235 | ||||||
| Residential Funding Mortgage Securities, Inc. | ||||||||
| 1,935 | 6.00%, 07/25/2037 | 1,684 | ||||||
| Securitized Asset Backed Receivables LLC | ||||||||
| 1,930 | 0.34%, 07/25/2036 Δ | 651 | ||||||
| 9,725 | 0.40%, 12/25/2036 Δ | 3,766 | ||||||
| 1,951 | 0.49%, 07/25/2036 Δ | 679 | ||||||
| Soundview Home Equity Loan Trust, Inc. | ||||||||
| 3,900 | 0.43%, 07/25/2037 Δ | 1,419 | ||||||
| 7,820 | 0.50%, 06/25/2036 Δ | 3,295 | ||||||
| 15,460 | 0.53%, 05/25/2036 Δ | 6,317 | ||||||
| Structured Adjustable Rate Mortgage Loan Trust | ||||||||
| 1,921 | 0.55%, 09/25/2034 Δ | 1,376 | ||||||
| 18,127 | 2.57%, 02/25/2036 Δ | 10,708 | ||||||
| UBS-Barclays Commercial Mortgage Trust | ||||||||
| 6,360 | 3.53%, 05/10/2063 ☼ | 6,487 | ||||||
| Wachovia Bank Commercial Mortgage Trust | ||||||||
| 11,450 | 5.77%, 07/15/2045 ╦Δ | 12,903 | ||||||
| Wells Fargo Alternative Loan Trust | ||||||||
| 8,368 | 6.25%, 11/25/2037 | 7,551 | ||||||
| Wells Fargo Mortgage Backed Securities Trust | ||||||||
| 2,759 | 2.62%, 07/25/2036 Δ | 2,069 | ||||||
| 3,237 | 5.18%, 10/25/2035 Δ | 3,108 | ||||||
| 418,584 | ||||||||
| 488,865 | ||||||||
| Total asset & commercial mortgage backed securities | ||||||||
| (cost $490,267) | $ | 488,865 | ||||||
CORPORATE BONDS - 32.0% | ||||||||
| Accommodation and Food Services - 0.2% | ||||||||
| Traveler Accommodation - 0.2% | ||||||||
| Choice Hotels International, Inc. | ||||||||
| $ | 680 | 5.75%, 07/01/2022 | $ | 711 | ||||
| Wynn Las Vegas LLC | ||||||||
| 1,185 | 5.38%, 03/15/2022 ■ | 1,191 | ||||||
| 4,910 | 7.75%, 08/15/2020 | 5,438 | ||||||
| 7,340 | ||||||||
| Administrative Waste Management and Remediation - 0.0% | ||||||||
| Other Support Services - 0.0% | ||||||||
| Iron Mountain, Inc. | ||||||||
| 1,215 | 7.75%, 10/01/2019 | 1,312 | ||||||
| Air Transportation - 0.0% | ||||||||
| Scheduled Air Transportation - 0.0% | ||||||||
| US Airways Group, Inc. | ||||||||
| 978 | 6.25%, 04/22/2023 | 1,026 | ||||||
| Apparel Manufacturing - 0.1% | ||||||||
| Cut and Sew Apparel Manufacturing - 0.1% | ||||||||
| Hanesbrands, Inc. | ||||||||
| 690 | 6.38%, 12/15/2020 | 726 | ||||||
| Phillips Van-Heusen Corp. | ||||||||
| 1,950 | 7.38%, 05/15/2020 | 2,160 | ||||||
| 2,886 | ||||||||
| Arts, Entertainment and Recreation - 2.2% | ||||||||
| Cable and Other Subscription Programming - 1.2% | ||||||||
| CCO Holdings LLC | ||||||||
| 275 | 7.38%, 06/01/2020 | 302 | ||||||
| Comcast Corp. | ||||||||
| 6,880 | 3.13%, 07/15/2022 ☼ | 6,912 | ||||||
| 100 | 10.63%, 07/15/2012 | 101 | ||||||
| DirecTV Holdings LLC | ||||||||
| 9,880 | 3.80%, 03/15/2022 | 9,992 | ||||||
| 4,200 | 5.00%, 03/01/2021 | 4,614 | ||||||
| Time Warner Entertainment Co., L.P. | ||||||||
| 8,175 | 8.38%, 07/15/2033 ‡ | 11,074 | ||||||
| Time Warner, Inc. | ||||||||
| 2,540 | 3.40%, 06/15/2022 | 2,561 | ||||||
| 3,800 | 6.10%, 07/15/2040 | 4,372 | ||||||
| 3,965 | 6.25%, 03/29/2041 | 4,610 | ||||||
| UnityMedia Hessen GmbH & Co. | ||||||||
| 696 | 8.13%, 12/01/2017 ■ | 748 | ||||||
| Viacom, Inc. | ||||||||
| 3,440 | 3.13%, 06/15/2022 | 3,444 | ||||||
The accompanying notes are an integral part of these financial statements.
| 6 |
| Shares or Principal Amount | Market Value ╪ | |||||||
CORPORATE BONDS - 32.0% - (continued) | ||||||||
| Arts, Entertainment and Recreation - 2.2% - (continued) | ||||||||
| Cable and Other Subscription Programming - 1.2% - (continued) | ||||||||
| Virgin Media Finance plc | ||||||||
| $ | 2,370 | 5.25%, 02/15/2022 | $ | 2,424 | ||||
| 1,080 | 9.50%, 08/15/2016 | 1,204 | ||||||
| 52,358 | ||||||||
| Data Processing, Hosting, and Related Services - 0.1% | ||||||||
| Fidelity National Information Services, Inc. | ||||||||
| 1,575 | 5.00%, 03/15/2022 ■ | 1,603 | ||||||
| Motion Picture and Video Industries - 0.0% | ||||||||
| NAI Entertainment Holdings LLC | ||||||||
| 813 | 8.25%, 12/15/2017 ■ | 898 | ||||||
| National CineMedia LLC | ||||||||
| 160 | 6.00%, 04/15/2022 ■ | 163 | ||||||
| 1,061 | ||||||||
| Newspaper, Periodical, Book and Database Publisher - 0.2% | ||||||||
| Cenveo, Inc. | ||||||||
| 1,600 | 8.88%, 02/01/2018 | 1,432 | ||||||
| News America, Inc. | ||||||||
| 5,500 | 6.15%, 03/01/2037 | 6,232 | ||||||
| 7,664 | ||||||||
| Radio and Television Broadcasting - 0.7% | ||||||||
| CBS Corp. | ||||||||
| 8,500 | 3.38%, 03/01/2022 | 8,468 | ||||||
| 5,000 | 8.20%, 05/15/2014 | 5,661 | ||||||
| Liberty Media Corp. | ||||||||
| 4,047 | 8.25%, 02/01/2030 | 4,158 | ||||||
| NBC Universal Media LLC | ||||||||
| 4,665 | 5.15%, 04/30/2020 ‡ | 5,356 | ||||||
| 3,390 | 5.95%, 04/01/2041 ‡ | 4,002 | ||||||
| Videotron Ltee | ||||||||
| 3,761 | 5.00%, 07/15/2022 ■ | 3,817 | ||||||
| 31,462 | ||||||||
| 94,148 | ||||||||
| Beverage and Tobacco Product Manufacturing - 1.0% | ||||||||
| Beverage Manufacturing - 0.8% | ||||||||
| Anheuser-Busch InBev Worldwide, Inc. | ||||||||
| 8,890 | 7.75%, 01/15/2019 ‡ | 11,742 | ||||||
| Constellation Brands, Inc. | ||||||||
| 3,955 | 6.00%, 05/01/2022 ‡ | 4,251 | ||||||
| 5,535 | 7.25%, 05/15/2017 ‡ | 6,331 | ||||||
| Molson Coors Brewing Co. | ||||||||
| 1,920 | 3.50%, 05/01/2022 | 1,971 | ||||||
| Pernod-Ricard S.A. | ||||||||
| 8,665 | 2.95%, 01/15/2017 ■‡ | 8,771 | ||||||
| 33,066 | ||||||||
| Tobacco Manufacturing - 0.2% | ||||||||
| Altria Group, Inc. | ||||||||
| 4,440 | 10.20%, 02/06/2039 ‡ | 7,223 | ||||||
| 40,289 | ||||||||
| Chemical Manufacturing - 0.8% | ||||||||
| Agricultural Chemical Manufacturing - 0.1% | ||||||||
| Yara International ASA | ||||||||
| 3,445 | 7.88%, 06/11/2019 ■ | 4,315 | ||||||
| Basic Chemical Manufacturing - 0.6% | ||||||||
| Dow Chemical Co. | ||||||||
| 4,000 | 4.25%, 11/15/2020 | 4,339 | ||||||
| 13,145 | 8.55%, 05/15/2019 | 17,484 | ||||||
| LyondellBasell Industries N.V. | ||||||||
| 4,670 | 6.00%, 11/15/2021 ■ | 5,126 | ||||||
| 26,949 | ||||||||
| Other Chemical and Preparation Manufacturing - 0.1% | ||||||||
| Ecolab, Inc. | ||||||||
| 3,980 | 4.35%, 12/08/2021 | 4,411 | ||||||
| 35,675 | ||||||||
| Computer and Electronic Product Manufacturing - 0.5% | ||||||||
| Communications Equipment Manufacturing - 0.1% | ||||||||
| Nextel Communications, Inc. | ||||||||
| 1,060 | 7.38%, 08/01/2015 | 1,061 | ||||||
| Computer and Peripheral Equipment Manufacturing - 0.4% | ||||||||
| Hewlett-Packard Co. | ||||||||
| 7,860 | 2.35%, 03/15/2015 | 7,983 | ||||||
| Seagate HDD Cayman | ||||||||
| 6,495 | 6.88%, 05/01/2020 ‡ | 6,982 | ||||||
| 2,460 | 7.75%, 12/15/2018 | 2,721 | ||||||
| 17,686 | ||||||||
| Navigational, Measuring and Control Instruments - 0.0% | ||||||||
| Esterline Technologies Corp. | ||||||||
| 200 | 7.00%, 08/01/2020 | 220 | ||||||
| 18,967 | ||||||||
| Construction - 0.1% | ||||||||
| Residential Building Construction - 0.1% | ||||||||
| Centex Corp. | ||||||||
| 3,140 | 6.50%, 05/01/2016 | 3,391 | ||||||
| D.R. Horton, Inc. | ||||||||
| 1,245 | 6.50%, 04/15/2016 | 1,348 | ||||||
| Pulte Homes, Inc. | ||||||||
| 800 | 7.88%, 06/15/2032 | 760 | ||||||
| 5,499 | ||||||||
| Fabricated Metal Product Manufacturing - 0.2% | ||||||||
| Boiler, Tank and Shipping Container Manufacturing - 0.2% | ||||||||
| Ball Corp. | ||||||||
| 4,200 | 5.00%, 03/15/2022 ‡ | 4,368 | ||||||
| 2,330 | 6.75%, 09/15/2020 | 2,563 | ||||||
| 6,931 | ||||||||
| Other Fabricated Metal Product Manufacturing - 0.0% | ||||||||
| Crown Americas, Inc. | ||||||||
| 300 | 6.25%, 02/01/2021 | 328 | ||||||
| Masco Corp. | ||||||||
| 575 | 5.95%, 03/15/2022 | 592 | ||||||
| 920 | ||||||||
| Spring and Wire Product Manufacturing - 0.0% | ||||||||
| Anixter International, Inc. | ||||||||
| 805 | 5.63%, 05/01/2019 | 831 | ||||||
| 8,682 | ||||||||
The accompanying notes are an integral part of these financial statements.
| 7 |
| Hartford Total Return Bond HLS Fund |
| Schedule of Investments – (continued) |
| June 30, 2012 (Unaudited) |
| (000’s Omitted) |
| Shares or Principal Amount | Market Value ╪ | |||||||
CORPORATE BONDS - 32.0% - (continued) | ||||||||
| Finance and Insurance - 12.8% | ||||||||
| Captive Auto Finance - 0.4% | ||||||||
| Ford Motor Credit Co. | ||||||||
| $ | 12,925 | 2.75%, 05/15/2015 | $ | 13,030 | ||||
| 2,975 | 6.63%, 08/15/2017 | 3,384 | ||||||
| 850 | 12.00%, 05/15/2015 | 1,056 | ||||||
| 17,470 | ||||||||
| Commercial Banking - 0.8% | ||||||||
| American Express Centurion Bank | ||||||||
| 5,337 | 5.95%, 06/12/2017 ‡ | 6,208 | ||||||
| Barclays Bank plc | ||||||||
| 10,500 | 6.05%, 12/04/2017 ■‡ | 10,610 | ||||||
| HSBC Bank USA | ||||||||
| 4,011 | 2.38%, 02/13/2015 | 4,057 | ||||||
| Nordea Bank AB | ||||||||
| 9,345 | 2.25%, 03/20/2015 ■‡ | 9,379 | ||||||
| Rabobank Netherlands | ||||||||
| 2,297 | 11.00%, 06/30/2019 ■♠ | 2,889 | ||||||
| Santander Holdings USA | ||||||||
| 3,006 | 4.63%, 04/19/2016 | 2,905 | ||||||
| 36,048 | ||||||||
| Depository Credit Banking - 3.1% | ||||||||
| Bank of America Capital II | ||||||||
| 2,610 | 8.00%, 12/15/2026 ‡ | 2,670 | ||||||
| Bank of America Corp. | ||||||||
| 8,840 | 5.65%, 05/01/2018 ‡ | 9,452 | ||||||
| 8,165 | 5.75%, 12/01/2017 ‡ | 8,714 | ||||||
| 4,000 | 5.88%, 01/05/2021 | 4,367 | ||||||
| 11,395 | 6.50%, 08/01/2016 ‡ | 12,513 | ||||||
| 3,700 | 7.63%, 06/01/2019 ‡ | 4,351 | ||||||
| Citigroup, Inc. | ||||||||
| 5,700 | 4.45%, 01/10/2017 ‡ | 5,975 | ||||||
| 1,550 | 4.50%, 01/14/2022 ☼ | 1,601 | ||||||
| 15,351 | 4.59%, 12/15/2015 ‡ | 16,058 | ||||||
| 4,102 | 6.13%, 08/25/2036 | 4,035 | ||||||
| 8,900 | 6.63%, 06/15/2032 ‡ | 9,280 | ||||||
| 900 | 6.88%, 03/05/2038 | 1,101 | ||||||
| 4,839 | 8.50%, 05/22/2019 ‡ | 5,976 | ||||||
| HSBC Holdings plc | ||||||||
| 7,000 | 4.00%, 03/30/2022 | 7,269 | ||||||
| 5,500 | 6.80%, 06/01/2038 | 6,299 | ||||||
| PNC Bank NA | ||||||||
| 2,235 | 6.00%, 12/07/2017 | 2,602 | ||||||
| 2,924 | 6.88%, 04/01/2018 | 3,488 | ||||||
| Wells Fargo & Co. | ||||||||
| 10,000 | 2.10%, 05/08/2017 | 10,022 | ||||||
| 9,000 | 4.60%, 04/01/2021 ╦ | 10,041 | ||||||
| Wells Fargo Bank NA | ||||||||
| 8,015 | 0.68%, 05/16/2016 Δ | 7,643 | ||||||
| 133,457 | ||||||||
| Insurance Carriers - 1.5% | ||||||||
| American International Group, Inc. | ||||||||
| 2,593 | 3.65%, 01/15/2014 ‡ | 2,649 | ||||||
| 8,880 | 3.80%, 03/22/2017 ‡ | 9,052 | ||||||
| 3,295 | 4.88%, 06/01/2022 | 3,371 | ||||||
| Cigna Corp. | ||||||||
| 12,903 | 2.75%, 11/15/2016 ‡ | 13,294 | ||||||
| Massachusetts Mutual Life Insurance Co. | ||||||||
| 2,993 | 8.88%, 06/01/2039 ■ | 4,289 | ||||||
| Nationwide Financial Services, Inc. | ||||||||
| 4,280 | 5.38%, 03/25/2021 ■‡ | 4,420 | ||||||
| Nationwide Mutual Insurance Co. | ||||||||
| 5,925 | 9.38%, 08/15/2039 ■‡ | 7,795 | ||||||
| Teachers Insurance & Annuity Association | ||||||||
| 6,248 | 6.85%, 12/16/2039 ■ | 8,068 | ||||||
| UnitedHealth Group, Inc. | ||||||||
| 9,225 | 2.88%, 03/15/2022 ╦ | 9,320 | ||||||
| 62,258 | ||||||||
| International Trade Financing (Foreign Banks) - 0.2% | ||||||||
| Royal Bank of Scotland plc | ||||||||
| 5,000 | 3.95%, 09/21/2015 ‡ | 5,093 | ||||||
| Standard Chartered plc | ||||||||
| 3,752 | 3.20%, 05/12/2016 ■ | 3,835 | ||||||
| 8,928 | ||||||||
| Monetary Authorities - Central Bank - 0.6% | ||||||||
| ABN Amro Bank N.V. | ||||||||
| 5,615 | 4.25%, 02/02/2017 ■╦ | 5,717 | ||||||
| Lloyds Banking Group plc | ||||||||
| 8,335 | 4.38%, 01/12/2015 ■ | 8,608 | ||||||
| Santander U.S. Debt S.A. | ||||||||
| 10,100 | 3.72%, 01/20/2015 ■‡ | 9,394 | ||||||
| 23,719 | ||||||||
| Nondepository Credit Banking - 1.6% | ||||||||
| Ally Financial, Inc. | ||||||||
| 2,085 | 5.50%, 02/15/2017 ‡ | 2,118 | ||||||
| 1,255 | 7.50%, 09/15/2020 ‡ | 1,410 | ||||||
| Capital One Financial Corp. | ||||||||
| 3,000 | 3.15%, 07/15/2016 | 3,107 | ||||||
| 2,000 | 4.75%, 07/15/2021 | 2,182 | ||||||
| 4,000 | 6.15%, 09/01/2016 ‡ | 4,472 | ||||||
| CIT Group, Inc. | ||||||||
| 45 | 5.00%, 05/15/2017 | 46 | ||||||
| 75 | 5.38%, 05/15/2020 | 77 | ||||||
| 2,593 | 5.50%, 02/15/2019 ■ | 2,664 | ||||||
| 1,175 | 6.63%, 04/01/2018 ■ | 1,266 | ||||||
| Discover Financial Services, Inc. | ||||||||
| 5,970 | 5.20%, 04/27/2022 ■ | 6,245 | ||||||
| General Electric Capital Corp. | ||||||||
| 10,029 | 4.38%, 09/16/2020 ‡ | 10,850 | ||||||
| 4,500 | 5.30%, 02/11/2021 | 5,051 | ||||||
| 10,990 | 5.63%, 05/01/2018 | 12,633 | ||||||
| Provident Funding Associates L.P. | ||||||||
| 1,901 | 10.25%, 04/15/2017 ■ | 1,982 | ||||||
| SLM Corp. | ||||||||
| 10,995 | 7.25%, 01/25/2022 | 11,627 | ||||||
| 3,755 | 8.45%, 06/15/2018 | 4,206 | ||||||
| 69,936 | ||||||||
| Other Financial Investment Activities - 0.8% | ||||||||
| BAE Systems Holdings, Inc. | ||||||||
| 4,154 | 5.20%, 08/15/2015 ■‡ | 4,519 | ||||||
| BP Capital Markets plc | ||||||||
| 2,165 | 1.85%, 05/05/2017 ‡ | 2,187 | ||||||
| 8,420 | 2.25%, 11/01/2016 ‡ | 8,671 | ||||||
| Fresenius U.S. Finance II | ||||||||
| 596 | 9.00%, 07/15/2015 ■ | 685 | ||||||
| State Street Corp. | ||||||||
| 7,610 | 4.96%, 03/15/2018 | 8,150 | ||||||
The accompanying notes are an integral part of these financial statements.
| 8 |
| Shares or Principal Amount | Market Value ╪ | |||||||
CORPORATE BONDS - 32.0% - (continued) | ||||||||
| Finance and Insurance - 12.8% - (continued) | ||||||||
| Other Financial Investment Activities - 0.8% - (continued) | ||||||||
| Xstrata Finance Canada Corp. | ||||||||
| $ | 6,375 | 3.60%, 01/15/2017 ■ | $ | 6,566 | ||||
| 3,825 | 4.95%, 11/15/2021 ■ | 3,952 | ||||||
| 34,730 | ||||||||
| Other Investment Pools and Funds - 0.2% | ||||||||
| Fibria Overseas Finance Ltd. | ||||||||
| 3,875 | 7.50%, 05/04/2020 ■ | 4,011 | ||||||
| Ineos Finance plc | ||||||||
| 649 | 8.38%, 02/15/2019 ■ | 671 | ||||||
| 1,780 | 9.00%, 05/15/2015 ■ | 1,878 | ||||||
| 6,560 | ||||||||
| Real Estate Investment Trust (REIT) - 0.4% | ||||||||
| DuPont Fabros Technology L.P. | ||||||||
| 1,900 | 8.50%, 12/15/2017 | 2,090 | ||||||
| HCP, Inc. | ||||||||
| 5,284 | 3.75%, 02/01/2016 | 5,495 | ||||||
| Health Care REIT, Inc. | ||||||||
| 4,802 | 3.63%, 03/15/2016 | 4,936 | ||||||
| Host Hotels & Resorts L.P. | ||||||||
| 5,900 | 6.00%, 11/01/2020 | 6,402 | ||||||
| 18,923 | ||||||||
| Securities and Commodity Contracts and Brokerage - 3.2% | ||||||||
| Goldman Sachs Group, Inc. | ||||||||
| 10,955 | 5.75%, 01/24/2022 | 11,564 | ||||||
| 6,637 | 6.00%, 06/15/2020 | 7,086 | ||||||
| 4,400 | 6.45%, 05/01/2036 | 4,291 | ||||||
| 6,700 | 6.75%, 10/01/2037 | 6,566 | ||||||
| JP Morgan Chase & Co. | ||||||||
| 19,095 | 3.15%, 07/05/2016 ‡ | 19,637 | ||||||
| 12,145 | 4.35%, 08/15/2021 ‡ | 12,818 | ||||||
| 4,000 | 4.50%, 01/24/2022 | 4,309 | ||||||
| 13,196 | 4.75%, 03/01/2015 ‡ | 14,128 | ||||||
| 6,375 | 6.00%, 01/15/2018 | 7,318 | ||||||
| Merrill Lynch & Co., Inc. | ||||||||
| 12,775 | 6.05%, 05/16/2016 ‡ | 13,208 | ||||||
| Morgan Stanley | ||||||||
| 13,455 | 3.80%, 04/29/2016 ‡ | 13,035 | ||||||
| 18,500 | 6.25%, 08/28/2017 ‡ | 19,096 | ||||||
| UBS AG Stamford CT | ||||||||
| 4,535 | 2.25%, 01/28/2014 | 4,558 | ||||||
| 137,614 | ||||||||
| 549,643 | ||||||||
| Food Manufacturing - 0.4% | ||||||||
| Other Food Manufacturing - 0.2% | ||||||||
| Kraft Foods, Inc. | ||||||||
| 6,595 | 3.50%, 06/06/2022 ■ | 6,768 | ||||||
| Sugar and Confectionery Product Manufacturing - 0.2% | ||||||||
| William Wrigley Jr. Co. | ||||||||
| 10,070 | 3.70%, 06/30/2014 ■ | 10,404 | ||||||
| 17,172 | ||||||||
| Health Care and Social Assistance - 1.8% | ||||||||
| General Medical and Surgical Hospitals - 0.5% | ||||||||
| HCA, Inc. | ||||||||
| 2,135 | 7.25%, 09/15/2020 | 2,348 | ||||||
| 4,997 | 7.50%, 11/15/2095 | 3,998 | ||||||
| 1,140 | 8.50%, 04/15/2019 | 1,277 | ||||||
| Memorial Sloan-Kettering Cancer Center | ||||||||
| 4,710 | 5.00%, 07/01/2042 | 5,429 | ||||||
| Tenet Healthcare Corp. | ||||||||
| 5,969 | 6.25%, 11/01/2018 | 6,312 | ||||||
| 2,955 | 8.88%, 07/01/2019 | 3,317 | ||||||
| 22,681 | ||||||||
| Health and Personal Care Stores - 0.2% | ||||||||
| CVS Caremark Corp. | ||||||||
| 8,183 | 8.35%, 07/10/2031 ■‡ | 10,705 | ||||||
| Offices and Physicians - 0.1% | ||||||||
| Partners Healthcare Systems | ||||||||
| 2,815 | 3.44%, 07/01/2021 | 2,913 | ||||||
| Pharmaceutical and Medicine Manufacturing - 1.0% | ||||||||
| Amgen, Inc. | ||||||||
| 6,500 | 2.13%, 05/15/2017 | 6,576 | ||||||
| Aristotle Holding, Inc. | ||||||||
| 7,610 | 2.10%, 02/12/2015 ■‡ | 7,684 | ||||||
| 8,840 | 3.50%, 11/15/2016 ■‡ | 9,307 | ||||||
| 5,962 | 3.90%, 02/15/2022 ■‡ | 6,180 | ||||||
| Gilead Sciences, Inc. | ||||||||
| 9,439 | 4.40%, 12/01/2021 | 10,419 | ||||||
| Valeant Pharmaceuticals International | ||||||||
| 920 | 6.75%, 08/15/2021 ■ | 902 | ||||||
| 1,280 | 7.25%, 07/15/2022 ■ | 1,283 | ||||||
| 42,351 | ||||||||
| 78,650 | ||||||||
| Information - 3.1% | ||||||||
| Cable and Other Program Distribution - 0.8% | ||||||||
| CCO Holdings LLC | ||||||||
| 10,860 | 6.63%, 01/31/2022 ‡ | 11,620 | ||||||
| CSC Holdings LLC | ||||||||
| 768 | 6.75%, 11/15/2021 ■ | 818 | ||||||
| CSC Holdings, Inc. | ||||||||
| 2,260 | 7.63%, 07/15/2018 | 2,526 | ||||||
| DISH DBS Corp. | ||||||||
| 6,030 | 5.88%, 07/15/2022 ■ | 6,090 | ||||||
| 4,730 | 7.88%, 09/01/2019 | 5,452 | ||||||
| Rogers Cable, Inc. | ||||||||
| 1,745 | 8.75%, 05/01/2032 | 2,503 | ||||||
| TCI Communications, Inc. | ||||||||
| 4,025 | 8.75%, 08/01/2015 | 4,911 | ||||||
| 33,920 | ||||||||
| Data Processing Services - 0.0% | ||||||||
| Audatex North America, Inc. | ||||||||
| 651 | 6.75%, 06/15/2018 ■ | 685 | ||||||
| Satellite Telecommunications - 0.1% | ||||||||
| Hughes Satelite Systems | ||||||||
| 2,050 | 6.50%, 06/15/2019 | 2,178 | ||||||
| Intelsat Jackson Holdings S.A. | ||||||||
| 2,665 | 8.50%, 11/01/2019 | 2,951 | ||||||
| 5,129 | ||||||||
The accompanying notes are an integral part of these financial statements.
| 9 |
| Hartford Total Return Bond HLS Fund |
| Schedule of Investments – (continued) |
| June 30, 2012 (Unaudited) |
| (000’s Omitted) |
| Shares or Principal Amount | Market Value ╪ | |||||||
CORPORATE BONDS - 32.0% - (continued) | ||||||||
| Information - 3.1% - (continued) | ||||||||
| Telecommunications - Other - 0.7% | ||||||||
| Sprint Nextel Corp. | ||||||||
| $ | 3,745 | 7.00%, 03/01/2020 ■ | $ | 3,895 | ||||
| 1,306 | 9.00%, 11/15/2018 ■ | 1,459 | ||||||
| Telecom Italia Capital | ||||||||
| 2,850 | 7.18%, 06/18/2019 | 2,836 | ||||||
| 214 | 7.72%, 06/04/2038 | 187 | ||||||
| Telefonica Emisiones SAU | ||||||||
| 11,220 | 3.99%, 02/16/2016 ‡ | 10,031 | ||||||
| UPCB Finance III Ltd. | ||||||||
| 1,084 | 6.63%, 07/01/2020 ■ | 1,100 | ||||||
| UPCB Finance VI Ltd. | ||||||||
| 3,070 | 6.88%, 01/15/2022 ■ | 3,131 | ||||||
| Vivendi S.A. | ||||||||
| 8,080 | 2.40%, 04/10/2015 ■ | 8,000 | ||||||
| 30,639 | ||||||||
| Telecommunications - Wired Carriers - 1.0% | ||||||||
| AT&T, Inc. | ||||||||
| 6,550 | 5.35%, 09/01/2040 ╦ | 7,517 | ||||||
| 5,500 | 5.50%, 02/01/2018 ‡ | 6,536 | ||||||
| Deutsche Telekom International Finance B.V. | ||||||||
| 13,315 | 3.13%, 04/11/2016 ■ | 13,772 | ||||||
| Paetec Holding Corp. | ||||||||
| 698 | 9.88%, 12/01/2018 | 780 | ||||||
| SBA Telecommunications | ||||||||
| 1,940 | 8.25%, 08/15/2019 | 2,124 | ||||||
| UnityMedia GmbH | ||||||||
| 1,269 | 7.50%, 03/15/2019 ■ | 1,345 | ||||||
| Videotron Ltee | ||||||||
| 915 | 9.13%, 04/15/2018 | 1,002 | ||||||
| Windstream Corp. | ||||||||
| 1,625 | 7.50%, 04/01/2023 | 1,666 | ||||||
| 1,475 | 7.75%, 10/15/2020 | 1,563 | ||||||
| 4,356 | 7.88%, 11/01/2017 | 4,748 | ||||||
| 41,053 | ||||||||
| Telecommunications - Wireless Carriers - 0.3% | ||||||||
| Cricket Communications, Inc. | ||||||||
| 3,725 | 7.75%, 05/15/2016 | 3,953 | ||||||
| Qwest Corp. | ||||||||
| 4,835 | 7.20%, 11/10/2026 | 4,883 | ||||||
| 3,656 | 7.25%, 10/15/2035 | 3,684 | ||||||
| Trilogy International Partners LLC | ||||||||
| 774 | 10.25%, 08/15/2016 ■ | 631 | ||||||
| 13,151 | ||||||||
| Wireless Communications Services - 0.2% | ||||||||
| Verizon Communications, Inc. | ||||||||
| 2,480 | 3.50%, 11/01/2021 ╦ | 2,641 | ||||||
| 3,400 | 6.40%, 02/15/2038 | 4,415 | ||||||
| Verizon Maryland, Inc. | ||||||||
| 1,500 | 8.30%, 08/01/2031 | 1,971 | ||||||
| 9,027 | ||||||||
| 133,604 | ||||||||
| Machinery Manufacturing - 0.3% | ||||||||
| Agriculture, Construction, Mining and Machinery - 0.3% | ||||||||
| Case New Holland, Inc. | ||||||||
| 9,901 | 7.88%, 12/01/2017 | 11,436 | ||||||
| Mining - 0.6% | ||||||||
| Coal Mining - 0.2% | ||||||||
| Consol Energy, Inc. | ||||||||
| 925 | 8.00%, 04/01/2017 | 960 | ||||||
| Peabody Energy Corp. | ||||||||
| 1,370 | 6.00%, 11/15/2018 ■ | 1,363 | ||||||
| 3,150 | 6.50%, 09/15/2020 | 3,189 | ||||||
| 3,850 | 7.38%, 11/01/2016 | 4,235 | ||||||
| 9,747 | ||||||||
| Metal Ore Mining - 0.2% | ||||||||
| Rio Tinto Finance USA Ltd. | ||||||||
| 2,965 | 9.00%, 05/01/2019 ‡ | 4,054 | ||||||
| Teck Resources Ltd. | ||||||||
| 3,758 | 10.75%, 05/15/2019 | 4,519 | ||||||
| 8,573 | ||||||||
| Nonmetallic Mineral Mining and Quarrying - 0.2% | ||||||||
| FMG Resources Pty Ltd. | ||||||||
| 6,340 | 6.00%, 04/01/2017 ■ | 6,372 | ||||||
| 1,299 | 7.00%, 11/01/2015 ■ | 1,325 | ||||||
| 691 | 8.25%, 11/01/2019 ■ | 732 | ||||||
| 8,429 | ||||||||
| 26,749 | ||||||||
| Miscellaneous Manufacturing - 0.6% | ||||||||
| Aerospace Product and Parts Manufacturing - 0.4% | ||||||||
| BE Aerospace, Inc. | ||||||||
| 201 | 5.25%, 04/01/2022 | 207 | ||||||
| 1,884 | 6.88%, 10/01/2020 | 2,082 | ||||||
| Bombardier, Inc. | ||||||||
| 4,540 | 7.75%, 03/15/2020 ■ | 5,051 | ||||||
| Textron, Inc. | ||||||||
| 5,175 | 4.63%, 09/21/2016 | 5,586 | ||||||
| United Technologies Corp. | ||||||||
| 4,485 | 3.10%, 06/01/2022 | 4,699 | ||||||
| 17,625 | ||||||||
| Other Miscellaneous Manufacturing - 0.2% | ||||||||
| Owens-Brockway Glass Container, Inc. | ||||||||
| 2,690 | 7.38%, 05/15/2016 | 2,999 | ||||||
| Reynolds Group Issuer, Inc. | ||||||||
| 4,875 | 7.88%, 08/15/2019 ■ | 5,278 | ||||||
| 1,525 | 9.75%, 04/15/2019 ■ | 1,521 | ||||||
| 9,798 | ||||||||
| 27,423 | ||||||||
| Motor Vehicle and Parts Manufacturing - 0.1% | ||||||||
| Motor Vehicle and Parts Manufacturing - 0.1% | ||||||||
| TRW Automotive, Inc. | ||||||||
| 3,800 | 7.25%, 03/15/2017 ■ | 4,341 | ||||||
| Motor Vehicle Manufacturing - 0.0% | ||||||||
| Ford Motor Co. | ||||||||
| 1,380 | 7.50%, 08/01/2026 | 1,601 | ||||||
| 5,942 | ||||||||
| Nonmetallic Mineral Product Manufacturing - 0.2% | ||||||||
| Glass and Glass Product Manufacturing - 0.2% | ||||||||
| Ardagh Packaging Finance | ||||||||
| 1,985 | 7.38%, 10/15/2017 ■ | 2,109 | ||||||
| Silgan Holdings, Inc. | ||||||||
| 5,315 | 5.00%, 04/01/2020 ■‡ | 5,435 | ||||||
| 7,544 | ||||||||
The accompanying notes are an integral part of these financial statements.
| 10 |
| Shares or Principal Amount | Market Value ╪ | |||||||
CORPORATE BONDS - 32.0% - (continued) | ||||||||
| Petroleum and Coal Products Manufacturing - 2.1% | ||||||||
| Natural Gas Distribution - 0.1% | ||||||||
| Sempra Energy | ||||||||
| $ | 5,218 | 6.50%, 06/01/2016 ‡ | $ | 6,139 | ||||
| Oil and Gas Extraction - 1.4% | ||||||||
| Anadarko Petroleum Corp. | ||||||||
| 3,565 | 6.38%, 09/15/2017 ‡ | 4,141 | ||||||
| Chesapeake Energy Corp. | ||||||||
| 2,178 | 6.88%, 08/15/2018 | 2,167 | ||||||
| CNOOC Finance 2012 Ltd. | ||||||||
| 5,215 | 3.88%, 05/02/2022 ■‡ | 5,394 | ||||||
| Continental Resources, Inc. | ||||||||
| 2,100 | 5.00%, 09/15/2022 ■ | 2,131 | ||||||
| Everest Acquisition LLC | ||||||||
| 3,023 | 9.38%, 05/01/2020 ■ | 3,132 | ||||||
| Harvest Operations Corp. | ||||||||
| 1,695 | 6.88%, 10/01/2017 ■ | 1,801 | ||||||
| Hornbeck Offshore Services, Inc. | ||||||||
| 3,595 | 5.88%, 04/01/2020 ■ | 3,568 | ||||||
| Newfield Exploration Co. | ||||||||
| 5,880 | 5.75%, 01/30/2022 ‡ | 6,145 | ||||||
| Pemex Project Funding Master Trust | ||||||||
| 6,205 | 6.63%, 06/15/2035 ‡ | 7,384 | ||||||
| Petrobras International Finance Co. | ||||||||
| 2,500 | 2.88%, 02/06/2015 | 2,537 | ||||||
| 4,120 | 3.88%, 01/27/2016 | 4,254 | ||||||
| 2,815 | 5.38%, 01/27/2021 | 3,034 | ||||||
| 10,275 | 5.75%, 01/20/2020 ‡ | 11,240 | ||||||
| Range Resources Corp. | ||||||||
| 1,950 | 6.75%, 08/01/2020 | 2,116 | ||||||
| 59,044 | ||||||||
| Petroleum and Coal Products Manufacturing - 0.2% | ||||||||
| Alpha Natural Resources, Inc. | ||||||||
| 1,161 | 6.00%, 06/01/2019 | 990 | ||||||
| Valero Energy Corp. | ||||||||
| 4,791 | 9.38%, 03/15/2019 | 6,296 | ||||||
| 7,286 | ||||||||
| Support Activities For Mining - 0.4% | ||||||||
| Transocean, Inc. | ||||||||
| 11,630 | 1.50%, 12/15/2037۞╦ | 11,572 | ||||||
| 4,375 | 6.38%, 12/15/2021 | 5,004 | ||||||
| 16,576 | ||||||||
| 89,045 | ||||||||
| Pipeline Transportation - 0.5% | ||||||||
| Pipeline Transportation of Natural Gas - 0.5% | ||||||||
| El Paso Corp. | ||||||||
| 2,075 | 7.00%, 06/15/2017 | 2,354 | ||||||
| 1,602 | 7.80%, 08/01/2031 | 1,798 | ||||||
| Energy Transfer Equity L.P. | ||||||||
| 6,377 | 7.50%, 10/15/2020 | 6,999 | ||||||
| Kinder Morgan Energy Partners L.P. | ||||||||
| 5,735 | 6.85%, 02/15/2020 | 6,886 | ||||||
| Kinder Morgan Finance Co. | ||||||||
| 3,980 | 6.00%, 01/15/2018 ■ | 4,139 | ||||||
| Markwest Energy | ||||||||
| 680 | 6.25%, 06/15/2022 | 700 | ||||||
| 22,876 | ||||||||
| Primary Metal Manufacturing - 0.3% | ||||||||
| Iron, Steel Mills and Ferroalloy Manufacturing - 0.3% | ||||||||
| ArcelorMittal | ||||||||
| 3,725 | 9.00%, 02/15/2015 ‡ | 4,186 | ||||||
| 7,025 | 9.85%, 06/01/2019 ‡ | 8,360 | ||||||
| 12,546 | ||||||||
| Professional, Scientific and Technical Services - 0.1% | ||||||||
| Advertising and Related Services - 0.1% | ||||||||
| Lamar Media Corp. | ||||||||
| 2,080 | 5.88%, 02/01/2022 ■ | 2,132 | ||||||
| Real Estate, Rental and Leasing - 0.5% | ||||||||
| Automotive Equipment Rental and Leasing - 0.0% | ||||||||
| Ashtead Capital, Inc. | ||||||||
| 255 | 6.50%, 07/15/2022 ■☼ | 255 | ||||||
| United Rental Financing Escrow Corp. | ||||||||
| 139 | 5.75%, 07/15/2018 ■ | 144 | ||||||
| 399 | ||||||||
| General Rental Centers - 0.2% | ||||||||
| ERAC USA Finance Co. | ||||||||
| 6,130 | 6.38%, 10/15/2017 ■ | 7,165 | ||||||
| Industrial Machinery and Equipment Rental and Leasing - 0.3% | ||||||||
| International Lease Finance Corp. | ||||||||
| 12,905 | 5.88%, 04/01/2019 | 12,917 | ||||||
| 1,597 | 8.88%, 09/01/2017 | 1,801 | ||||||
| 14,718 | ||||||||
| 22,282 | ||||||||
| Retail Trade - 1.1% | ||||||||
| Automobile Dealers - 0.1% | ||||||||
| AutoNation, Inc. | ||||||||
| 2,685 | 5.50%, 02/01/2020 ‡ | 2,766 | ||||||
| Automotive Parts, Accessories, and Tire Stores - 0.4% | ||||||||
| AutoZone, Inc. | ||||||||
| 16,810 | 3.70%, 04/15/2022 ‡ | 17,314 | ||||||
| Building Material and Supplies Dealers - 0.0% | ||||||||
| Building Materials Corp. | ||||||||
| 1,186 | 7.50%, 03/15/2020 ■ | 1,287 | ||||||
| Clothing Stores - 0.0% | ||||||||
| Ltd. Brands, Inc. | ||||||||
| 866 | 5.63%, 02/15/2022 | 892 | ||||||
| Direct Selling Establishments - 0.2% | ||||||||
| Amerigas Partners L.P. | ||||||||
| 1,554 | 6.25%, 08/20/2019 | 1,562 | ||||||
| Energy Transfer Partners | ||||||||
| 6,110 | 6.50%, 02/01/2042 | 6,547 | ||||||
| 8,109 | ||||||||
| Electronic Shopping and Mail-Order Houses - 0.1% | ||||||||
| QVC, Inc. | ||||||||
| 3,760 | 7.50%, 10/01/2019 ■ | 4,174 | ||||||
| Grocery Stores - 0.2% | ||||||||
| Ahold Lease USA, Inc. | ||||||||
| 8,202 | 8.62%, 01/02/2025 ‡ | 10,088 | ||||||
The accompanying notes are an integral part of these financial statements.
| 11 |
| Hartford Total Return Bond HLS Fund |
| Schedule of Investments – (continued) |
| June 30, 2012 (Unaudited) |
| (000’s Omitted) |
| Shares or Principal Amount | Market Value ╪ | |||||||
CORPORATE BONDS - 32.0% - (continued) | ||||||||
| Retail Trade - 1.1% - (continued) | ||||||||
| Jewelry, Luggage, and Leather Goods Stores - 0.0% | ||||||||
| Liz Claiborne, Inc. | ||||||||
| $ | 1,415 | 10.50%, 04/15/2019 ■ | $ | 1,574 | ||||
| Other Miscellaneous Store Retailers - 0.1% | ||||||||
| Sally Holdings LLC | ||||||||
| 1,515 | 5.75%, 06/01/2022 | 1,585 | ||||||
| 47,789 | ||||||||
| Transportation Equipment Manufacturing - 0.1% | ||||||||
| Ship and Boat Building - 0.1% | ||||||||
| Huntington Ingalls Industries, Inc. | ||||||||
| 3,925 | 6.88%, 03/15/2018 | 4,092 | ||||||
| Utilities - 1.7% | ||||||||
| Electric Generation, Transmission and Distribution - 1.7% | ||||||||
| AES (The) Corp. | ||||||||
| 890 | 9.75%, 04/15/2016 | 1,055 | ||||||
| AES El Salvador Trust | ||||||||
| 2,300 | 6.75%, 02/01/2016 § | 2,283 | ||||||
| Calpine Corp. | ||||||||
| 4,202 | 7.50%, 02/15/2021 ■ | 4,538 | ||||||
| 695 | 7.50%, 02/15/2021 § | 751 | ||||||
| 2,314 | 7.88%, 01/15/2023 ■ | 2,522 | ||||||
| Carolina Power & Light Co. | ||||||||
| 3,865 | 4.10%, 05/15/2042 | 4,031 | ||||||
| CenterPoint Energy, Inc. | ||||||||
| 7,475 | 6.85%, 06/01/2015 ‡ | 8,424 | ||||||
| Commonwealth Edison Co. | ||||||||
| 5,836 | 5.80%, 03/15/2018 ‡ | 7,051 | ||||||
| Dolphin Subsidiary II, Inc. | ||||||||
| 8,795 | 7.25%, 10/15/2021 ■ | 9,762 | ||||||
| Dominion Resources, Inc. | ||||||||
| 2,800 | 4.90%, 08/01/2041 | 3,164 | ||||||
| Intergen N.V. | ||||||||
| 1,105 | 9.00%, 06/30/2017 ■ | 1,083 | ||||||
| LG & E & KU Energy LLC | ||||||||
| 7,190 | 2.13%, 11/15/2015 | 7,172 | ||||||
| MidAmerican Energy Holdings Co. | ||||||||
| 8,665 | 8.48%, 09/15/2028 ‡ | 12,655 | ||||||
| Pacific Gas & Electric Co. | ||||||||
| 6,208 | 8.25%, 10/15/2018 ‡ | 8,368 | ||||||
| 72,859 | ||||||||
| Wholesale Trade - 0.6% | ||||||||
| Beer, Wine, Distilled Alcoholic Bev Wholesalers - 0.5% | ||||||||
| SABMiller Holdings, Inc. | ||||||||
| 8,140 | 2.45%, 01/15/2017 ■‡ | 8,390 | ||||||
| 8,065 | 3.75%, 01/15/2022 ■‡ | 8,577 | ||||||
| 2,344 | 4.95%, 01/15/2042 ■ | 2,594 | ||||||
| 19,561 | ||||||||
| Paper and Paper Product Merchant Wholesalers - 0.1% | ||||||||
| International Paper Co. | ||||||||
| 3,470 | 4.75%, 02/15/2022 | 3,788 | ||||||
| 23,349 | ||||||||
| Total corporate bonds | ||||||||
| (cost $1,306,340) | $ | 1,370,957 | ||||||
FOREIGN GOVERNMENT OBLIGATIONS - 0.5% | ||||||||
| Mexico - 0.2% | ||||||||
| United Mexican States | ||||||||
| $ | 7,260 | 4.75%, 03/08/2044 | $ | 7,823 | ||||
| Qatar - 0.1% | ||||||||
| Qatar (State of) | ||||||||
| 3,800 | 3.13%, 01/20/2017 ■ | 3,961 | ||||||
| Russia - 0.2% | ||||||||
| Russian Federation Government | ||||||||
| 10,200 | 3.25%, 04/04/2017 ■‡ | 10,264 | ||||||
| Total foreign government obligations | ||||||||
| (cost $21,110) | $ | 22,048 | ||||||
MUNICIPAL BONDS - 1.4% | ||||||||
| General Obligations - 0.7% | ||||||||
| California State GO | ||||||||
| $ | 3,180 | 7.50%, 04/01/2034 | $ | 3,973 | ||||
| 2,770 | 7.60%, 11/01/2040 | 3,602 | ||||||
| California State GO, Taxable | ||||||||
| 10,720 | 7.55%, 04/01/2039 ‡ | 13,785 | ||||||
| Oregon State GO | ||||||||
| 7,325 | 4.76%, 06/30/2028 | 8,583 | ||||||
| 29,943 | ||||||||
| Higher Education (Univ., Dorms, etc.) - 0.1% | ||||||||
| Curators University, System Facs Rev Build America Bonds | ||||||||
| 2,270 | 5.79%, 11/01/2041 | 3,067 | ||||||
| Miscellaneous - 0.1% | ||||||||
| Colorado State Bridge Enterprise Rev | ||||||||
| 4,000 | 6.08%, 12/01/2040 | 5,194 | ||||||
| Tax Allocation - 0.0% | ||||||||
| California Urban IDA Taxable | ||||||||
| 275 | 6.10%, 05/01/2024 | 266 | ||||||
| Utilities - Electric - 0.3% | ||||||||
| Municipal Elec Auth Georgia | ||||||||
| 10,065 | 6.64%, 04/01/2057 | 11,677 | ||||||
| Utilities - Water and Sewer - 0.2% | ||||||||
| San Franciso City & County, CA, Public Utilities | ||||||||
| 8,520 | 6.00%, 11/01/2040 ‡ | 10,422 | ||||||
| Total municipal bonds | ||||||||
| (cost $54,526) | $ | 60,569 | ||||||
SENIOR FLOATING RATE INTERESTS♦ - 0.6% | ||||||||
| Air Transportation - 0.1% | ||||||||
| Scheduled Air Transportation - 0.1% | ||||||||
| Macquarie Aircraft Leasing Finance S.A., Second Lien Term Loan | ||||||||
| $ | 1,747 | 4.25%, 11/29/2013 | $ | 1,712 | ||||
The accompanying notes are an integral part of these financial statements.
| 12 |
| Shares or Principal Amount | Market Value ╪ | |||||||
SENIOR FLOATING RATE INTERESTS♦ - 0.6% - (continued) | ||||||||
| Arts, Entertainment and Recreation - 0.1% | ||||||||
| Cable and Other Subscription Programming - 0.1% | ||||||||
| Kabel Deutschland Holding AG | ||||||||
| $ | 2,135 | 4.25%, 02/01/2019 | $ | 2,118 | ||||
| Finance and Insurance - 0.2% | ||||||||
| Captive Auto Finance - 0.2% | ||||||||
| Chrysler Group LLC | ||||||||
| 7,882 | 6.00%, 05/24/2017 | 7,931 | ||||||
| Insurance Carriers - 0.0% | ||||||||
| Asurion Corp., Second Lien Term Loan | ||||||||
| 1,176 | 9.00%, 05/24/2019 | 1,197 | ||||||
| Other Financial Investment Activities - 0.0% | ||||||||
| BNY ConvergEX Group LLC | ||||||||
| 735 | 8.75%, 12/17/2017 | 695 | ||||||
| 9,823 | ||||||||
| Information - 0.1% | ||||||||
| Cable and Other Program Distribution - 0.1% | ||||||||
| WideOpenWest Finance LLC, Second Lien Term Loan | ||||||||
| 5,623 | 6.50%, 06/29/2015 Þ | 5,575 | ||||||
| Retail Trade - 0.1% | ||||||||
| Sporting Goods, Hobby and Musical Instrument Store - 0.1% | ||||||||
| EB Sports Corp. | ||||||||
| 5,191 | 11.50%, 12/31/2015 Þ | 5,087 | ||||||
| Total senior floating rate interests | ||||||||
| (cost $24,191) | $ | 24,315 | ||||||
U.S. GOVERNMENT AGENCIES - 61.3% | ||||||||
| Federal Home Loan Mortgage Corporation - 5.9% | ||||||||
| $ | 76,507 | 0.41%, 10/25/2020 ► | $ | 1,633 | ||||
| 33,661 | 2.01%, 08/25/2018 ► | 3,405 | ||||||
| 22,224 | 4.00%, 08/01/2025 | 23,820 | ||||||
| 144,380 | 5.50%, 10/01/2018 - 06/01/2041 ‡ | 157,308 | ||||||
| 40,332 | 6.00%, 04/01/2017 - 11/01/2037 | 44,535 | ||||||
| 11,220 | 6.17%, 05/15/2037 ► | 1,773 | ||||||
| 47,994 | 6.23%, 01/15/2041 ► | 6,936 | ||||||
| 20,416 | 6.41%, 12/15/2036 ► | 3,694 | ||||||
| 6,279 | 6.50%, 07/01/2031 - 08/01/2038 | 7,041 | ||||||
| 6 | 7.50%, 09/01/2029 - 11/01/2031 | 7 | ||||||
| 250,152 | ||||||||
| Federal National Mortgage Association - 32.4% | ||||||||
| 253,400 | 3.00%, 07/15/2027 ☼ | 265,476 | ||||||
| 374,583 | 3.50%, 11/01/2026 - 07/15/2041 ☼ | 393,912 | ||||||
| 305,441 | 4.00%, 06/01/2025 - 10/01/2041 ☼ | 326,424 | ||||||
| 36,894 | 4.50%, 09/01/2024 - 08/01/2040 | 39,934 | ||||||
| 180,685 | 5.00%, 02/01/2018 - 07/15/2041 ☼ | 196,199 | ||||||
| 78,230 | 5.50%, 12/01/2013 - 01/01/2037 | 85,982 | ||||||
| 15,950 | 5.95%, 11/25/2039 ► | 3,194 | ||||||
| 56,237 | 6.00%, 11/01/2012 - 07/15/2041 ☼ | 62,107 | ||||||
| 21,921 | 6.33%, 10/25/2036 ► | 3,417 | ||||||
| 32,832 | 6.33%, 09/25/2040 Δ | 5,664 | ||||||
| 43 | 6.50%, 11/01/2014 - 07/01/2032 | 47 | ||||||
| 1,400 | 7.00%, 02/01/2016 - 10/01/2037 | 1,630 | ||||||
| 492 | 7.50%, 11/01/2015 - 05/01/2032 | 577 | ||||||
| 2 | 8.00%, 04/01/2032 | 2 | ||||||
| 1,384,565 | ||||||||
| Government National Mortgage Association - 23.0% | ||||||||
| 87,500 | 3.00%, 08/15/2042 ☼ | 90,631 | ||||||
| 95,300 | 3.50%, 07/15/2041 ☼ | 101,926 | ||||||
| 167,406 | 4.00%, 07/20/2040 - 01/15/2041 ‡ | 183,130 | ||||||
| 332,187 | 4.50%, 08/15/2033 - 09/15/2041 ☼ | 366,181 | ||||||
| 98,438 | 5.00%, 08/15/2039 - 09/20/2040 ‡ | 109,112 | ||||||
| 79,186 | 5.50%, 03/15/2033 - 07/15/2040 ☼ | 87,962 | ||||||
| 33,953 | 6.00%, 12/15/2031 - 06/15/2041 | 38,178 | ||||||
| 7,875 | 6.50%, 06/15/2028 - 09/15/2032 | 9,172 | ||||||
| 22 | 7.00%, 06/20/2030 - 08/15/2031 | 27 | ||||||
| 4 | 8.50%, 11/15/2024 | 5 | ||||||
| 986,324 | ||||||||
| Total U.S. government agencies | ||||||||
| (cost $2,566,937) | $ | 2,621,041 | ||||||
U.S. GOVERNMENT SECURITIES - 13.6% | ||||||||
| U.S. Treasury Securities - 13.6% | ||||||||
| U.S. Treasury Bonds - 7.3% | ||||||||
| $ | 7,550 | 3.00%, 05/15/2042 ‡ | $ | 7,908 | ||||
| 60,893 | 3.13%, 11/15/2041 ‡ | 65,460 | ||||||
| 1,309 | 3.75%, 08/15/2041 ‡ | 1,579 | ||||||
| 30,512 | 4.38%, 05/15/2041 ‡ | 40,753 | ||||||
| 59,223 | 4.75%, 02/15/2041 ‡ | 83,652 | ||||||
| 39,291 | 5.38%, 02/15/2031 ‡ | 57,254 | ||||||
| 35,425 | 6.25%, 05/15/2030 ‡ | 55,916 | ||||||
| 312,522 | ||||||||
| U.S. Treasury Notes - 6.3% | ||||||||
| 763 | 0.25%, 01/31/2014 ‡ | 762 | ||||||
| 1,721 | 0.38%, 10/31/2012 | 1,722 | ||||||
| 3,158 | 0.88%, 11/30/2016 - 01/31/2017 ‡ | 3,187 | ||||||
| 34,319 | 1.00%, 10/31/2016 □ | 34,842 | ||||||
| 33,254 | 2.00%, 11/15/2021 - 02/15/2022 ‡ | 34,374 | ||||||
| 175,000 | 3.13%, 04/30/2017 ‡ | 194,852 | ||||||
| 269,739 | ||||||||
| 582,261 | ||||||||
| Total U.S. government securities | ||||||||
| (cost $546,581) | $ | 582,261 | ||||||
| Contracts | Market Value ╪ | |||||||
PUT OPTIONS PURCHASED - 0.0% | ||||||||
| Interest Rate Contracts - 0.0% | ||||||||
| EURO 3-Year Mid-Curve | ||||||||
| 1 | Expiration: 12/14/2012, Exercise Rate: 98.00% | $ | 84 | |||||
| Total put options purchased | ||||||||
| (cost $549) | $ | 84 | ||||||
| Shares or Principal Amount | Market Value ╪ | |||||||
PREFERRED STOCKS - 0.1% | ||||||||
| Diversified Banks - 0.1% | ||||||||
| 2 | US Bancorp | $ | 1,771 | |||||
The accompanying notes are an integral part of these financial statements.
| 13 |
| Hartford Total Return Bond HLS Fund |
| Schedule of Investments – (continued) |
| June 30, 2012 (Unaudited) |
| (000’s Omitted) |
| Shares or Principal Amount | Market Value ╪ | |||||||||||
| PREFERRED STOCKS - 0.1% - (continued) | ||||||||||||
| Other Diversified Financial Services - 0.0% | ||||||||||||
| 10 | Citigroup Capital XIII | $ | 280 | |||||||||
| Thrifts & Mortgage Finance - 0.0% | ||||||||||||
| 330 | Federal Home Loan Mortgage Corp. | 715 | ||||||||||
| Total preferred stocks | ||||||||||||
| (cost $10,144) | $ | 2,766 | ||||||||||
| Total long-term investments | ||||||||||||
| (cost $5,020,645) | $ | 5,172,906 | ||||||||||
| SHORT-TERM INVESTMENTS - 9.7% | ||||||||||||
| Repurchase Agreements - 9.7% | ||||||||||||
| Bank of America Merrill Lynch TriParty Joint Repurchase Agreement (maturing on 07/02/2012 in the amount of $223,066, collateralized by FHLMC 5.50% - 6.50%, 2035 - 2036, FNMA 5.00% - 6.00%, 2033 - 2039, value of $227,525) | ||||||||||||
| $ | 223,064 | 0.13%, 06/29/2012 | $ | 223,064 | ||||||||
| Barclays Capital TriParty Joint Repurchase Agreement (maturing on 07/02/2012 in the amount of $80,645, collateralized by U.S. Treasury Note 1.25% - 3.63%, 2014 - 2020, value of $82,257) | ||||||||||||
| 80,644 | 0.15%, 06/29/2012 | 80,644 | ||||||||||
| Deutsche Bank Securities TriParty Joint Repurchase Agreement (maturing on 07/02/2012 in the amount of $21,607, collateralized by U.S. Treasury Note 0.88%, 2016, value of $22,039) | ||||||||||||
| 21,606 | 0.20%, 06/29/2012 | 21,606 | ||||||||||
| TD Securities TriParty Joint Repurchase Agreement (maturing on 07/02/2012 in the amount of $63,146, collateralized by FHLMC 4.00% - 6.00%, 2027 - 2041, FNMA 4.00% - 4.50%, 2025 - 2042, U.S. Treasury Bond 6.38%, 2027, U.S. Treasury Note 0.38% - 8.75%, 2012 - 2017, value of $64,408) | ||||||||||||
| 63,146 | 0.15%, 06/29/2012 | 63,146 | ||||||||||
| UBS Securities, Inc. Joint Repurchase Agreement (maturing on 07/02/2012 in the amount of $22, collateralized by U.S. Treasury Note 1.00%, 2013, value of $23) | ||||||||||||
| 22 | 0.13%, 06/29/2012 | 22 | ||||||||||
| UBS Securities, Inc. TriParty Joint Repurchase Agreement (maturing on 07/02/2012 in the amount of $28,454, collateralized by GNMA 4.00%, 2042, value of $29,023) | ||||||||||||
| 28,453 | 0.20%, 06/29/2012 | 28,453 | ||||||||||
| 416,935 | ||||||||||||
| Total short-term investments | ||||||||||||
| (cost $416,935) | $ | 416,935 | ||||||||||
| Total investments | ||||||||||||
| (cost $5,437,580) ▲ | 130.6 | % | $ | 5,589,841 | ||||||||
| Other assets and liabilities | (30.6 | )% | (1,309,012 | ) | ||||||||
| Total net assets | 100.0 | % | $ | 4,280,829 | ||||||||
The accompanying notes are an integral part of these financial statements.
| 14 |
| Note: | Percentage of investments as shown is the ratio of the total market value to total net assets. |
| ▲ | At June 30, 2012, the cost of securities for federal income tax purposes was $5,458,526 and the aggregate gross unrealized appreciation and depreciation based on that cost were: |
| Unrealized Appreciation | $ | 173,910 | ||
| Unrealized Depreciation | (42,595 | ) | ||
| Net Unrealized Appreciation | $ | 131,315 |
| Δ | Variable rate securities; the rate reported is the coupon rate in effect at June 30, 2012. |
| ► | Securities disclosed are interest-only strips. The interest rates represent effective yields based upon estimated future cash flows at June 30, 2012. |
| ♦ | Senior floating rate interests generally pay interest rates which are periodically adjusted by reference to a base short-term, floating lending rate plus a premium. These base lending rates are generally (i) the lending rate offered by one or more major European banks, such as the London Inter-Bank Offered Rate (LIBOR), (ii) the prime rate offered by one or more major United States Banks, or (iii) the bank's certificate of deposit rate. Senior floating rate interests often require prepayments from excess cash flows or permit the borrower to repay at its election. The rate at which the borrower repays cannot be predicted with accuracy. As a result, the actual remaining maturity may be substantially less than the stated maturities shown. Unless otherwise noted, the interest rate disclosed for these securities represents the average coupon as of June 30, 2012. |
| ■ | Securities issued within terms of a private placement memorandum, exempt from registration under Rule 144A under the Securities Act of 1933, as amended, and may be sold only to qualified institutional buyers. Unless otherwise indicated, these holdings are determined to be liquid. At June 30, 2012, the aggregate value of these securities was $423,631, which represents 9.9% of total net assets. |
| § | These securities were sold to the Fund under Regulation S, rules governing offers and sales made outside the United States without registration under the Securities Act of 1933. The Fund may only be able to resell these securities in the United States if an exemption from registration under the federal and state securities laws is available, or the Fund may only be able to sell these securities outside of the United States (such as on a foreign exchange) to a non-U.S. person. Unless otherwise indicated, these holdings are determined to be liquid. At June 30, 2012, the aggregate value of these securities was $3,034, which represents 0.1% of total net assets. |
| ۞ | Convertible security. |
| ♠ | Perpetual maturity security. Maturity date shown is the first call date. |
| ☼ | This security, or a portion of this security, was purchased on a when-issued, delayed delivery or delayed draw basis. The cost of these securities was $1,327,969 at June 30, 2012. |
| ‡ | This security, or a portion of this security, has been segregated to cover funding requirements on investment transactions settling in the future. |
| ╦ | This security, or a portion of this security, has been pledged as collateral in connection with swap contracts. In addition, cash of $3,960 was received from broker as collateral in connection with swap contracts. Securities valued at $18,049, held on behalf of the Fund at the custody bank, were received from broker as collateral in connection with swap contracts. |
| □ | This security, or a portion of this security, is pledged as initial margin deposit and collateral for daily variation margin loss on open futures contracts held at June 30, 2012 as listed in the table below: |
| Description | Number of Contracts* | Position | Expiration Date | Market Value ╪ | Notional Amount | Unrealized Appreciation/ (Depreciation) | ||||||||||||||||||
| Australian 10-Year Bond Future | 470 | Short | 09/17/2012 | $ | 60,351 | $ | 60,562 | $ | 211 | |||||||||||||||
| Long Gilt Future | 293 | Long | 09/26/2012 | 54,658 | 54,442 | 216 | ||||||||||||||||||
| U.S. Treasury 10-Year Note Future | 2,296 | Short | 09/19/2012 | 306,229 | 305,866 | (363 | ) | |||||||||||||||||
| U.S. Treasury 2-Year Note Future | 1,085 | Long | 09/28/2012 | 238,904 | 239,007 | (103 | ) | |||||||||||||||||
| U.S. Treasury 30-Year Bond Future | 278 | Long | 09/19/2012 | 41,135 | 41,228 | (93 | ) | |||||||||||||||||
| U.S. Treasury 5-Year Note Future | 1,404 | Long | 09/28/2012 | 174,052 | 174,047 | 5 | ||||||||||||||||||
| U.S. Treasury CME Ultra Long Term Bond Future | 149 | Short | 09/19/2012 | 24,860 | 24,485 | (375 | ) | |||||||||||||||||
| $ | (502 | ) | ||||||||||||||||||||||
| * | The number of contracts does not omit 000's. |
| Þ | This security may pay interest in additional principal instead of cash. |
The accompanying notes are an integral part of these financial statements.
| 15 |
| Hartford Total Return Bond HLS Fund |
| Schedule of Investments – (continued) |
| June 30, 2012 (Unaudited) |
| (000’s Omitted) |
Credit Default Swap Contracts Outstanding at June 30, 2012
| Reference Entity | Counterparty | Notional Amount (a) | Buy/Sell Protection | (Pay)/Receive Fixed Rate / Implied Credit Spread (b) | Expiration Date | Upfront Premiums Paid/ (Received) | Market Value ╪ | Unrealized Appreciation/ (Depreciation) | |||||||||||||||||||||||
| ABX.HE.AA.06-1 | BCLY | $ | 1,572 | Buy | (0.32 | )% | 07/25/45 | $ | 889 | $ | 852 | $ | (37 | ) | |||||||||||||||||
| ABX.HE.AAA.06-1 | BCLY | 7,979 | Buy | (0.18 | )% | 07/25/45 | 743 | 756 | 13 | ||||||||||||||||||||||
| ABX.HE.AAA.06-1 | BCLY | 8,590 | Buy | (0.18 | )% | 07/25/45 | 989 | 814 | (175 | ) | |||||||||||||||||||||
| ABX.HE.AAA.06-1 | GSC | 10,296 | Buy | (0.18 | )% | 07/25/45 | 929 | 953 | 24 | ||||||||||||||||||||||
| ABX.HE.PENAAA.06-2 | BCLY | 14,259 | Buy | (0.11 | )% | 05/25/46 | 3,924 | 3,711 | (213 | ) | |||||||||||||||||||||
| ABX.HE.PENAAA.06-2 | JPM | 1,778 | Buy | (0.11 | )% | 05/25/46 | 467 | 467 | – | ||||||||||||||||||||||
| ABX.HE.PENAAA.07-2 | JPM | 2,162 | Sell | 0.76 | % | 01/25/38 | (1,377 | ) | (1,344 | ) | 33 | ||||||||||||||||||||
| Banco Santander S.A. | BCLY | 10,100 | Buy | (1.00)% / 3.95 | % | 03/20/15 | 512 | 750 | 238 | ||||||||||||||||||||||
| CDX.NA.HY.18 | BOA | 52,505 | Buy | (5.00 | )% | 06/20/17 | 3,805 | 1,860 | (1,945 | ) | |||||||||||||||||||||
| CDX.NA.HY.18 | CSI | 93,639 | Buy | (5.00 | )% | 06/20/17 | 4,682 | 3,318 | (1,364 | ) | |||||||||||||||||||||
| CDX.NA.HY.18 | JPM | 46,322 | Buy | (5.00 | )% | 06/20/17 | 3,069 | 1,642 | (1,427 | ) | |||||||||||||||||||||
| CDX.NA.HY.18.2 | GSC | 9,925 | Buy | (5.00 | )% | 06/20/17 | 484 | 352 | (132 | ) | |||||||||||||||||||||
| CDX.NA.IG.18 | GSC | 15,350 | Sell | 1.00 | % | 06/20/17 | (112 | ) | (92 | ) | 20 | ||||||||||||||||||||
| CDX.NA.IG.18 | MSC | 83,715 | Sell | 1.00 | % | 06/20/17 | (586 | ) | (503 | ) | 83 | ||||||||||||||||||||
| CMBX.NA.A.1 | DEUT | 5,450 | Buy | (0.35 | )% | 10/12/52 | 2,518 | 2,409 | (109 | ) | |||||||||||||||||||||
| CMBX.NA.A.1 | GSC | 2,510 | Buy | (0.35 | )% | 10/12/52 | 1,135 | 1,109 | (26 | ) | |||||||||||||||||||||
| CMBX.NA.AA.1 | UBS | 6,550 | Buy | (0.25 | )% | 10/12/52 | 1,955 | 1,990 | 35 | ||||||||||||||||||||||
| CMBX.NA.AA.4 | MSC | 11,130 | Sell | 1.65 | % | 02/17/51 | (7,009 | ) | (7,299 | ) | (290 | ) | |||||||||||||||||||
| CMBX.NA.AAA.2 | DEUT | 13,570 | Sell | 0.07 | % | 03/15/49 | (763 | ) | (695 | ) | 68 | ||||||||||||||||||||
| CMBX.NA.AAA.2 | UBS | 9,655 | Sell | 0.07 | % | 03/15/49 | (514 | ) | (495 | ) | 19 | ||||||||||||||||||||
| CMBX.NA.AAA.3 | CSI | 1,195 | Sell | 0.08 | % | 12/13/49 | (92 | ) | (91 | ) | 1 | ||||||||||||||||||||
| CMBX.NA.AAA.3 | DEUT | 18,065 | Sell | 0.08 | % | 12/13/49 | (1,394 | ) | (1,377 | ) | 17 | ||||||||||||||||||||
| CMBX.NA.AAA.3 | JPM | 32,700 | Sell | 0.08 | % | 12/13/49 | (2,619 | ) | (2,501 | ) | 118 | ||||||||||||||||||||
| CMBX.NA.AAA.3 | UBS | 14,270 | Sell | 0.08 | % | 12/13/49 | (1,240 | ) | (1,088 | ) | 152 | ||||||||||||||||||||
| CMBX.NA.AAA.5 | MSC | 6,350 | Sell | 0.35 | % | 02/15/51 | (506 | ) | (483 | ) | 23 | ||||||||||||||||||||
| CMBX.NA.AJ.2 | JPM | 13,120 | Sell | 1.09 | % | 03/15/49 | �� | (3,235 | ) | (3,262 | ) | (27 | ) | ||||||||||||||||||
| CMBX.NA.AJ.3 | UBS | 5,475 | Sell | 1.47 | % | 12/13/49 | (2,154 | ) | (2,094 | ) | 60 | ||||||||||||||||||||
| CMBX.NA.AM.3 | CSI | 3,925 | Buy | (0.50 | )% | 12/13/49 | 795 | 660 | (135 | ) | |||||||||||||||||||||
| CMBX.NA.AM.3 | MSC | 3,925 | Buy | (0.50 | )% | 12/13/49 | 780 | 660 | (120 | ) | |||||||||||||||||||||
| CMBX.NA.AM.4 | CSI | 5,045 | Buy | (0.50 | )% | 02/17/51 | 1,060 | 986 | (74 | ) | |||||||||||||||||||||
| CMBX.NA.AM.4 | JPM | 4,190 | Buy | (0.50 | )% | 02/17/51 | 924 | 819 | (105 | ) | |||||||||||||||||||||
| CMBX.NA.AM.4 | MSC | 12,150 | Buy | (0.50 | )% | 02/17/51 | 2,808 | 2,373 | (435 | ) | |||||||||||||||||||||
| CMBX.NA.AM.4 | UBS | 4,335 | Buy | (0.50 | )% | 02/17/51 | 1,062 | 847 | (215 | ) | |||||||||||||||||||||
| Ireland (Republic of) | BCLY | 18,815 | Sell | 1.00% / 5.45 | % | 09/20/17 | (3,457 | ) | (3,457 | ) | – | ||||||||||||||||||||
| Italy (Republic of) | JPM | 12,315 | Sell | 1.00% / 4.81 | % | 09/20/17 | (1,988 | ) | (1,988 | ) | – | ||||||||||||||||||||
| ITRX.EUR.17 | CSI | 70,204 | Sell | 1.00 | % | 06/20/17 | (2,249 | ) | (2,116 | ) | 133 | ||||||||||||||||||||
| ITRX.EUR.17 | GSC | 13,516 | Sell | 1.00 | % | 06/20/17 | (514 | ) | (407 | ) | 107 | ||||||||||||||||||||
| ITRX.XOV.17 | GSC | 29,676 | Sell | 5.00 | % | 06/20/17 | (1,950 | ) | (1,805 | ) | 145 | ||||||||||||||||||||
| ITRX.XOV.17 | MSC | 9,978 | Sell | 5.00 | % | 06/20/17 | (763 | ) | (607 | ) | 156 | ||||||||||||||||||||
| LCDX.NA.18.2 | GSC | 6,366 | Sell | 2.50 | % | 06/20/17 | (239 | ) | (110 | ) | 129 | ||||||||||||||||||||
| Morgan Stanley | JPM | 5,975 | Buy | (1.00)% / 3.47 | % | 09/20/16 | 554 | 557 | 3 | ||||||||||||||||||||||
| Pacific Gas & Electric Co. | CSI | 7,900 | Sell | 1.00% / 1.11 | % | 09/20/16 | (64 | ) | (34 | ) | 30 | ||||||||||||||||||||
| PrimeX.ARM.1 | MSC | 3,580 | Sell | 4.42 | % | 06/25/36 | 104 | 162 | 58 | ||||||||||||||||||||||
| PrimeX.ARM.2 | MSC | 10,713 | Sell | 4.58 | % | 12/25/37 | (786 | ) | (750 | ) | 36 | ||||||||||||||||||||
| Spain (Kingdom of) | DEUT | 7,075 | Sell | 1.00% / 5.20 | % | 09/20/17 | (1,239 | ) | (1,239 | ) | – | ||||||||||||||||||||
| Spain (Kingdom of) | GSC | 5,910 | Sell | 1.00% / 5.23 | % | 09/20/17 | (1,041 | ) | (1,041 | ) | – | ||||||||||||||||||||
| $ | (1,703 | ) | $ | (6,831 | ) | $ | (5,128 | ) | |||||||||||||||||||||||
| (a) | The maximum potential amount the Fund could be required to pay as a seller of credit protection or receive as a buyer of credit protection if a credit event occurs as defined under the terms of that particular swap agreement. |
The accompanying notes are an integral part of these financial statements.
| 16 |
| (b) | Implied credit spreads, represented in absolute terms, utilized in determining the market value of credit default swap agreements on corporate issues, U.S. municipal issues or sovereign government issues as of period end serve as an indicator of the current status of the payment/performance risk and represent the likelihood or risk of default for the credit derivative. The implied credit spread of a particular referenced entity reflects the cost of buying/selling protection and may include upfront payments required to be made to enter into the agreement. Wider credit spreads represent a deterioration of the referenced entity’s credit soundness and a greater likelihood or risk of default or other credit event occurring as defined under the terms of the agreement. The percentage shown is the implied credit spread on June 30, 2012. For credit default swap agreements on indices, the quoted market prices and resulting values serve as the indicator of the current status of the payment/performance risk. |
Interest Rate Swap Contracts Outstanding at June 30, 2012
| Counterparty | Payments made by Fund | Payments received by Fund | Notional Amount | Expiration Date | Upfront Premiums Paid/ (Received) | Market Value ╪ | Unrealized Appreciation/ (Depreciation) | |||||||||||||||||||||
| CSI | CPURNSA Initial CPI 228.61 | 2.45% Fixed | $ | 56,120 | 05/21/22 | $ | – | $ | 288 | $ | 288 | |||||||||||||||||
Foreign Currency Contracts Outstanding at June 30, 2012
| Description | Counterparty | Buy / Sell | Market Value ╪ | Contract Amount | Delivery Date | Unrealized Appreciation/ (Depreciation) | ||||||||||||
| EUR | GSC | Sell | $ | 227 | $ | 224 | 07/02/2012 | $ | (3 | ) | ||||||||
| MXN | GSC | Sell | 21,500 | 20,818 | 09/19/2012 | (682 | ) | |||||||||||
| MXN | HSBC | Buy | 21,500 | 20,491 | 09/19/2012 | 1,009 | ||||||||||||
| $ | 324 | |||||||||||||||||
Shorts Outstanding at June 30, 2012
| Description | Principal Amount | Maturity Date | Market Value ╪ | Unrealized Appreciation/ Depreciation | ||||||||||||
| FNMA, 3.00% | $ | 43,400 | 07/19/2042 | $ | 44,452 | $ | (259 | ) | ||||||||
| FNMA, 4.50% | 93,400 | 07/15/2040 | 100,186 | (85 | ) | |||||||||||
| FNMA, 5.50% | 142,300 | 07/15/2040 | 155,218 | (377 | ) | |||||||||||
| GNMA, 4.00% | 106,700 | 07/15/2040 | 116,520 | (39 | ) | |||||||||||
| $ | 416,376 | $ | (760 | ) | ||||||||||||
| ╪ | See Significant Accounting Policies of accompanying Notes to Financial Statements regarding valuation of securities. |
The accompanying notes are an integral part of these financial statements.
| 17 |
| Hartford Total Return Bond HLS Fund |
| Schedule of Investments – (continued) |
| June 30, 2012 (Unaudited) |
| (000’s Omitted) |
| GLOSSARY: (abbreviations used in preceding Schedule of Investments) | |
| Counterparty Abbreviations: | |
| BCLY | Barclays |
| BOA | Banc of America Securities LLC |
| CSI | Credit Suisse International |
| DEUT | Deutsche Bank Securities, Inc. |
| GSC | Goldman Sachs & Co. |
| HSBC | HSBC Bank USA |
| JPM | JP Morgan Chase & Co. |
| MSC | Morgan Stanley |
| UBS | UBS AG |
| Currency Abbreviations: | |
| EUR | EURO |
| MXN | Mexican New Peso |
| Index Abbreviations: | |
| ABX.HE | Markit Asset Backed Security |
| CDX.NA.HY | Credit Derivatives North American High Yield |
| CDX.NA.IG | Credit Derivatives North American Investment Grade |
| CMBX.NA | Markit Commercial Mortgage Backed North American |
| CPURNSA | Consumer Price All Urban Non-Seasonally Adjusted |
| ITRX.EUR | Markit iTraxx - Europe |
| ITRX.XOV | Markit iTraxx Index - Europe Crossover |
| LCDX.NA | Credit Derivatives North American Loan |
| PrimeX.ARM | Markit PrimeX Mortgage Backed Security |
| Municipal Bond Abbreviations: | |
| GO | General Obligation |
| IDA | Industrial Development Authority Bond |
| Other Abbreviations: | |
| FHLMC | Federal Home Loan Mortgage Corp. |
| FNMA | Federal National Mortgage Association |
| GNMA | Government National Mortgage Association |
| REIT | Real Estate Investment Trust |
The accompanying notes are an integral part of these financial statements.
| 18 |
| Hartford Total Return Bond HLS Fund |
| Investment Valuation Hierarchy Level Summary |
| June 30, 2012 (Unaudited) |
| (000’s Omitted) |
| Total | Level 1 ♦ | Level 2 ♦ | Level 3 | |||||||||||||
| Assets: | ||||||||||||||||
| Asset & Commercial Mortgage Backed Securities | $ | 488,865 | $ | – | $ | 412,531 | $ | 76,334 | ||||||||
| Corporate Bonds | 1,370,957 | – | 1,359,588 | 11,369 | ||||||||||||
| Foreign Government Obligations | 22,048 | – | 22,048 | – | ||||||||||||
| Municipal Bonds | 60,569 | – | 60,569 | – | ||||||||||||
| Preferred Stocks | 2,766 | 995 | 1,771 | – | ||||||||||||
| Put Options Purchased | 84 | 84 | – | – | ||||||||||||
| Senior Floating Rate Interests | 24,315 | – | 24,315 | – | ||||||||||||
| U.S. Government Agencies | 2,621,041 | – | 2,621,041 | – | ||||||||||||
| U.S. Government Securities | 582,261 | 7,908 | 574,353 | – | ||||||||||||
| Short-Term Investments | 416,935 | – | 416,935 | – | ||||||||||||
| Total | $ | 5,589,841 | $ | 8,987 | $ | 5,493,151 | $ | 87,703 | ||||||||
| Credit Default Swaps * | 1,701 | – | 1,701 | – | ||||||||||||
| Foreign Currency Contracts * | 1,009 | – | 1,009 | – | ||||||||||||
| Futures * | 432 | 432 | – | – | ||||||||||||
| Interest Rate Swaps * | 288 | – | 288 | – | ||||||||||||
| Total | $ | 3,430 | $ | 432 | $ | 2,998 | $ | – | ||||||||
| Liabilities: | ||||||||||||||||
| Securities Sold Short | $ | 416,376 | $ | – | $ | 416,376 | $ | – | ||||||||
| Total | $ | 416,376 | $ | – | $ | 416,376 | $ | – | ||||||||
| Credit Default Swaps * | 6,829 | – | 6,829 | – | ||||||||||||
| Foreign Currency Contracts * | 685 | – | 685 | – | ||||||||||||
| Futures * | 934 | 934 | – | – | ||||||||||||
| Total | $ | 8,448 | $ | 934 | $ | 7,514 | $ | – | ||||||||
| ♦ | For the six-month period ended June 30, 2012, investments valued at $4,764 were transferred from Level 1 to Level 2, and there were no transfers from Level 2 to Level 1. Investments are transferred between Level 1 and Level 2 for a variety of reasons including, but not limited to: |
| 1) | Foreign equities for which a fair value price is more representative of exit value than the local market close (transfer into Level 2). Foreign equities for which the local market close is more representative of exit value (transfer into Level 1). |
| 2) | U.S. Treasury securities that no longer represent the most recent issue (transfer into Level 2). |
| 3) | Equity investments with no observable trading but a bid or close price is used (transfer into Level 2). Equity investments using observable quoted prices in an active market (transfer into Level 1). |
| * | Derivative instruments not reflected in the Schedule of Investments are valued at the unrealized appreciation/depreciation on the investments. |
Following is a reconciliation of Level 3 assets for which significant unobservable inputs were used to determine fair value:
| Balance as of December 31, 2011 | Realized Gain (Loss) | Change in Unrealized Appreciation (Depreciation) | Net Amortization | Purchases | Sales | Transfers Into Level 3 * | Transfers Out of Level 3 * | Balance as of June 30, 2012 | ||||||||||||||||||||||||||||
| Assets: | ||||||||||||||||||||||||||||||||||||
| Asset & Commercial Mortgage Backed Securities | $ | 24,100 | $ | (3,155 | ) | $ | 3,173 | † | $ | 1,070 | $ | 72,074 | $ | (17,281 | ) | $ | — | $ | (3,647 | ) | $ | 76,334 | ||||||||||||||
| Corporate Bonds | 12,413 | 105 | 636 | ‡ | (32 | ) | 1,912 | (2,238 | ) | — | (1,427 | ) | 11,369 | |||||||||||||||||||||||
| Total | $ | 36,513 | $ | (3,050 | ) | $ | 3,809 | $ | 1,038 | $ | 73,986 | $ | (19,519 | ) | $ | — | $ | (5,074 | ) | $ | 87,703 | |||||||||||||||
| * | Investments are transferred into and out of Level 3 for a variety of reasons including, but not limited to: |
| 1) | Investments where trading has been halted (transfer into Level 3) or investments where trading has resumed (transfer out of Level 3). |
| 2) | Broker quoted investments (transfer into Level 3) or quoted prices in active markets (transfer out of Level 3). |
| 3) | Investments that have certain restrictions on trading (transfer into Level 3) or investments where trading restrictions have expired (transfer out of Level 3). |
| † | Change in unrealized appreciation (depreciation) in the current period relating to assets still held at June 30, 2012 was $(812). |
| ‡ | Change in unrealized appreciation (depreciation) in the current period relating to assets still held at June 30, 2012 was $636. |
The accompanying notes are an integral part of these financial statements.
| 19 |
| Hartford Total Return Bond HLS Fund |
| Statement of Assets and Liabilities |
| June 30, 2012 (Unaudited) |
| (000’s Omitted) |
| Assets: | ||||
| Investments in securities, at market value (cost $5,437,580) | $ | 5,589,841 | ||
| Cash | 618 | |||
| Unrealized appreciation on foreign currency contracts | 1,009 | |||
| Unrealized appreciation on swap contracts | 1,989 | |||
| Receivables: | ||||
| Investment securities sold | 2,350,560 | |||
| Fund shares sold | 2,160 | |||
| Dividends and interest | 29,880 | |||
| Variation margin | 2,032 | |||
| Swap premiums paid | 34,188 | |||
| Total assets | 8,012,277 | |||
| Liabilities: | ||||
| Unrealized depreciation on foreign currency contracts | 685 | |||
| Unrealized depreciation on swap contracts | 6,829 | |||
| Bank overdraft - foreign cash | — | |||
| Securities sold short, at market value (proceeds $415,616) | 416,376 | |||
| Payables: | ||||
| Investment securities purchased | 3,264,379 | |||
| Fund shares redeemed | 1,585 | |||
| Collateral received from broker | 3,960 | |||
| Variation margin | 1,060 | |||
| Investment management fees | 268 | |||
| Distribution fees | 20 | |||
| Other liabilities | 215 | |||
| Accrued expenses | 180 | |||
| Swap premiums received | 35,891 | |||
| Total liabilities | 3,731,448 | |||
| Net assets | $ | 4,280,829 | ||
| Summary of Net Assets: | ||||
| Capital stock and paid-in-capital | $ | 3,968,456 | ||
| Undistributed net investment income | 238,816 | |||
| Accumulated net realized loss | (72,929 | ) | ||
| Unrealized appreciation of investments and the translations of assets and liabilities denominated in foreign currency | 146,486 | |||
| Net assets | $ | 4,280,829 | ||
| Shares authorized | 5,000,000 | |||
| Par value | $ | 0.001 | ||
| Class IA: Net asset value per share | $ | 12.04 | ||
| Shares outstanding | 305,895 | |||
| Net assets | $ | 3,683,689 | ||
| Class IB: Net asset value per share | $ | 11.94 | ||
| Shares outstanding | 50,010 | |||
| Net assets | $ | 597,140 |
The accompanying notes are an integral part of these financial statements.
| 20 |
| Hartford Total Return Bond HLS Fund |
| Statement of Operations |
| For the Six-Month Period Ended June 30, 2012 (Unaudited) |
| (000’s Omitted) |
| Investment Income: | ||||
| Dividends | $ | 110 | ||
| Interest | 78,035 | |||
| Total investment income, net | 78,145 | |||
| Expenses: | ||||
| Investment management fees | 9,899 | |||
| Transfer agent fees | 2 | |||
| Distribution fees - Class IB | 767 | |||
| Custodian fees | 7 | |||
| Accounting services fees | 432 | |||
| Board of Directors' fees | 50 | |||
| Audit fees | 18 | |||
| Other expenses | 366 | |||
| Total expenses | 11,541 | |||
| Net investment income | 66,604 | |||
| Net Realized Gain on Investments, Other Financial Instruments and Foreign Currency Transactions: | ||||
| Net realized gain on investments | 117,542 | |||
| Net realized gain on purchased options | 2,249 | |||
| Net realized loss on futures | (15,275 | ) | ||
| Net realized gain on written options | 3,080 | |||
| Net realized loss on swap contracts | (9,836 | ) | ||
| Net realized loss on foreign currency contracts | (3,305 | ) | ||
| Net realized gain on other foreign currency transactions | 18 | |||
| Net Realized Gain on Investments, Other Financial Instruments and Foreign Currency Transactions | 94,473 | |||
| Net Changes in Unrealized Depreciation of Investments, Other Financial Instruments and Foreign Currency Transactions: | ||||
| Net unrealized appreciation of investments | 5,494 | |||
| Net unrealized depreciation of purchased options | (13,453 | ) | ||
| Net unrealized appreciation of securities sold short | 302 | |||
| Net unrealized appreciation of futures | 199 | |||
| Net unrealized appreciation of written options | 2,805 | |||
| Net unrealized depreciation of swap contracts | (7,283 | ) | ||
| Net unrealized appreciation of foreign currency contracts | 338 | |||
| Net unrealized appreciation on translation of other assets and liabilities in foreign currencies | 39 | |||
| Net Changes in Unrealized Depreciation of Investments, Other Financial Instruments and Foreign Currency Transactions | (11,559 | ) | ||
| Net Gain on Investments, Other Financial Instruments and Foreign Currency Transactions | 82,914 | |||
| Net Increase in Net Assets Resulting from Operations | $ | 149,518 |
The accompanying notes are an integral part of these financial statements.
| 21 |
| Hartford Total Return Bond HLS Fund |
| Statement of Changes in Net Assets |
| (000’s Omitted) |
| For the Six-Month Period Ended June 30, 2012 (Unaudited) | For the Year Ended December 31, 2011 | |||||||
| Operations: | ||||||||
| Net investment income | $ | 66,604 | $ | 164,939 | ||||
| Net realized gain on investments, other financial instruments and foreign currency transactions | 94,473 | 114,242 | ||||||
| Net unrealized appreciation (depreciation) of investments, other financial instruments and foreign currency transactions | (11,559 | ) | 29,273 | |||||
| Net Increase In Net Assets Resulting From Operations | 149,518 | 308,454 | ||||||
| Distributions to Shareholders: | ||||||||
| From net investment income | ||||||||
| Class IA | — | (8,287 | ) | |||||
| Class IB | — | (1,420 | ) | |||||
| Total distributions | — | (9,707 | ) | |||||
| Capital Share Transactions: | ||||||||
| Class IA | ||||||||
| Sold | 187,627 | 425,018 | ||||||
| Issued on reinvestment of distributions | — | 8,287 | ||||||
| Redeemed | (351,456 | ) | (997,652 | ) | ||||
| Total capital share transactions | (163,829 | ) | (564,347 | ) | ||||
| Class IB | ||||||||
| Sold | 42,294 | 103,223 | ||||||
| Issued on reinvestment of distributions | — | 1,420 | ||||||
| Redeemed | (98,448 | ) | (236,649 | ) | ||||
| Total capital share transactions | (56,154 | ) | (132,006 | ) | ||||
| Net decrease from capital share transactions | (219,983 | ) | (696,353 | ) | ||||
| Net Decrease In Net Assets | (70,465 | ) | (397,606 | ) | ||||
| Net Assets: | ||||||||
| Beginning of period | 4,351,294 | 4,748,900 | ||||||
| End of period | $ | 4,280,829 | $ | 4,351,294 | ||||
| Undistributed (distribution in excess of) net investment income | $ | 238,816 | $ | 172,212 | ||||
| Shares: | ||||||||
| Class IA | ||||||||
| Sold | 15,895 | 38,022 | ||||||
| Issued on reinvestment of distributions | — | 727 | ||||||
| Redeemed | (29,663 | ) | (88,636 | ) | ||||
| Total share activity | (13,768 | ) | (49,887 | ) | ||||
| Class IB | ||||||||
| Sold | 3,601 | 9,236 | ||||||
| Issued on reinvestment of distributions | — | 125 | ||||||
| Redeemed | (8,374 | ) | (21,185 | ) | ||||
| Total share activity | (4,773 | ) | (11,824 | ) | ||||
The accompanying notes are an integral part of these financial statements.
| 22 |
| Hartford Total Return Bond HLS Fund |
| Notes to Financial Statements |
| June 30, 2012 (Unaudited) |
| (000’s Omitted) |
| 1. | Organization: |
Hartford Total Return Bond HLS Fund (the “Fund”) serves as an underlying investment option for certain variable annuity and variable life insurance separate accounts of Hartford Life Insurance Company (“HLIC”) and its affiliates and certain qualified retirement plans. The Fund may also serve as an underlying investment option for certain variable annuity and variable life separate accounts of other insurance companies. Owners of variable annuity contracts and policyholders of variable life insurance contracts may choose the funds permitted in the variable insurance contract prospectus. In addition, participants in certain qualified retirement plans may choose the Fund if permitted by their plans.
Hartford Series Fund, Inc. (the “Company”) is an open-end registered management investment company comprised of thirty portfolios. Financial Statements for the Fund, a series of the Company, are included in this report.
The Company is organized under the laws of the State of Maryland and is registered with the Securities and Exchange Commission (“SEC”) under the Investment Company Act of 1940, as amended (“1940 Act”). The Fund is a diversified open-end management investment company.
The Fund is divided into Class IA and Class IB shares. Each class is offered at the per share net asset value (“NAV”) without a sales charge and is subject to the same expenses, except that the Class IB shares are subject to distribution and service fees charged pursuant to a Distribution Plan adopted in accordance with Rule 12b-1 under the 1940 Act.
| 2. | Significant Accounting Policies: |
The following is a summary of significant accounting policies of the Fund in the preparation of its financial statements, which are in accordance with the United States Generally Accepted Accounting Principles (“U.S. GAAP”). The preparation of financial statements in accordance with U.S. GAAP may require management to make estimates and assumptions that affect the reported amounts of assets and liabilities and disclosure of contingent assets and liabilities at the date of the financial statements and the reported amounts of increases and decreases in net assets from operations during the reporting period. Actual results could differ from those estimates.
| a) | Determination of Net Asset Value – The NAV of each class of the Fund’s shares is determined as of the close of regular trading (normally 4:00 p.m. Eastern Time) (the “NYSE Close”) on each day that the New York Stock Exchange (the “Exchange”) is open (“Valuation Date”). Information that becomes known to the Fund after the NAV has been calculated on a particular day will not generally be used to retroactively adjust the NAV determined earlier that day. |
| b) | Investment Valuation and Fair Value Measurements – For purposes of calculating the NAV, portfolio investments and other assets held by the Fund's portfolio for which market quotes are readily available are valued at market value. Market value is generally determined on the basis of last reported sales prices or official close price. If no sales are reported, market value is based on quotes obtained from a quotation reporting system, established market makers, or independent pricing services. If market prices are not readily available or are deemed unreliable, the Fund will use the fair value of the investment as determined in good faith under policies and procedures established by and under the supervision of the Company’s Board of Directors. Market quotes are considered not readily available where there is an absence of current or reliable market-based data (e.g., trade information or broker quotes), including where events occur after the close of the relevant market, but prior to the NYSE Close that materially affect the values of the Fund’s portfolio investments or assets. In addition, market quotes are considered not readily available when, due to extraordinary circumstances, the exchanges or markets on which the investments trade do not open for trading for the entire day and no other market prices are available. In addition, prices of foreign equities that are principally traded on certain foreign markets are adjusted daily pursuant to a fair value pricing service approved by the Board of Directors in order to reflect an adjustment for the factors occurring after the close of certain foreign markets but before the NYSE Close. Investments that are primarily traded on foreign markets may trade on days that are not business days of the Fund. The value of the foreign investments in which the Fund invests may change on days when a shareholder will not be able to purchase or |
| 23 |
| Hartford Total Return Bond HLS Fund |
| Notes to Financial Statements – (continued) |
| June 30, 2012 (Unaudited) |
| (000’s Omitted) |
redeem shares of the Fund. Fair value pricing is subjective in nature and the use of fair value pricing by the Fund may cause the NAV of its shares to differ significantly from the NAV that would have been calculated using market prices at the close of the exchange on which a portfolio investment is primarily traded. There can be no assurance that the Fund could obtain the fair market value assigned to an investment if the Fund were to sell the investment at approximately the time at which the Fund determines its NAV.
Fixed income investments (other than short term obligations) and non-exchange traded derivatives held by the Fund are normally valued on the basis of quotes obtained from brokers and dealers or independent pricing services in accordance with procedures established by the Company’s Board of Directors. Prices obtained from independent pricing services use information provided by market makers or estimates of market values obtained from yield data relating to investments with similar characteristics. Generally, the Fund may use fair valuation in regard to fixed income investments when the Fund holds defaulted or distressed investments or investments in a company in which a reorganization is pending. Short-term investments maturing in 60 days or less are generally valued at amortized cost, if their original term to maturity was 60 days or less, or by amortizing their value on the 61st day prior to maturity, if the original term to maturity exceeded 60 days.
Exchange traded options, futures and options on futures are valued at the settlement price determined by the relevant exchange as of the NYSE Close. If such instruments do not trade on an exchange, values may be supplied by an independent pricing service using a formula or other objective method that may take into consideration the style, direction, expiration, strike price, notional value and volatility or other adjustments.
Investments valued in currencies other than U.S. dollars are converted to U.S. dollars using exchange rates obtained from independent pricing services for calculation of the NAV. As a result, the NAV of the Fund’s shares may be affected by changes in the value of currencies in relation to the U.S. dollar. The value of investments traded in markets outside the United States or denominated in currencies other than the U.S. dollar may be affected significantly on a day that the NYSE is closed and the market value may change on days when an investor is not able to purchase, redeem or exchange shares of the Fund.
Foreign currency contracts represent agreements to exchange currencies on specific future dates at predetermined rates. Foreign currency contracts are valued using foreign currency exchange rates and forward rates as provided by an independent pricing service on the Valuation Date.
Investments in open-end mutual funds are valued at the respective NAV of each open-end mutual fund on the Valuation Date.
Financial instruments for which prices are not available from an independent pricing service may be valued using market quotations obtained from one or more dealers that make markets in the respective financial instrument in accordance with procedures established by the Company’s Board of Directors.
U.S. GAAP defines fair value as the price that the Fund would receive to sell an asset or pay to transfer a liability in an orderly transaction between market participants. The U.S. GAAP fair value measurement standards require disclosure of a fair value hierarchy for each major category of assets and liabilities. Various inputs are used in determining the fair value of the Fund’s investments. These inputs are summarized into three broad hierarchy levels. This hierarchy is based on whether the valuation inputs are observable or unobservable. These levels are:
| · | Level 1 – Quoted prices in active markets for identical investments. Level 1 may include exchange traded instruments, such as domestic equities, some foreign equities, options, futures, mutual funds, exchange traded funds, rights and warrants. |
| · | Level 2 – Observable inputs other than Level 1 prices, such as quoted prices for similar investments; quoted prices in markets that are not active; or other inputs that are observable or can be corroborated by observable |
| 24 |
market data. Level 2 may include debt investments that are traded less frequently than exchange traded instruments and which are valued using independent pricing services; foreign equities, which are principally traded on certain foreign markets and are adjusted daily pursuant to a fair value pricing service in order to reflect an adjustment for the factors occurring after the close of certain foreign markets but before the NYSE Close; and short-term investments, which are valued at amortized cost.
| · | Level 3 – Significant unobservable inputs that are supported by limited or no market activity. Level 3 may include financial instruments whose values are determined using indicative market quotes or require significant management judgment or estimation. These unobservable valuation inputs may include estimates for current yields, maturity/duration, prepayment speed, and indicative market quotes for comparable investments along with other assumptions relating to credit quality, collateral value, complexity of the investment structure, general market conditions and liquidity. This category may include investments where trading has been halted or there are certain restrictions on trading. While these investments are priced using unobservable inputs, the valuation of these investments reflects the best available data and management believes the prices are a reasonable representation of exit price. For more information on specific valuation techniques and unobservable inputs, please see table below titled "Quantitative Information about Level 3 Fair Value Measurements". |
The Board of Directors of the Company generally reviews and approves the “Procedures for Valuation of Portfolio Securities” on an annual basis. These procedures define how investments are to be valued, including the formation of a Valuation Committee. The Valuation Committee is responsible for determining in good faith the fair value of investments when the value cannot be obtained from primary pricing services or alternative sources or if the valuation of an investment as provided by the primary pricing service or alternative source is believed not to reflect the investment’s fair value as of the Valuation Date. Members of the Valuation Committee include the Fund’s Treasurer or designee, a Vice President of the Funds with legal expertise or designee, and a Vice President of the investment manager or designee. In addition, the Fund’s chief compliance officer shall designate a member of the compliance group to attend Valuation Committee meetings as a non-voting resource, to monitor for and provide guidance with respect to compliance with these procedures. Two members of the Valuation Committee or their designees, representing different departments, shall constitute a quorum for purposes of permitting the Valuation Committee to take action. The Valuation Committee will consider all relevant factors in determining an investment’s fair value, and may seek the advice of the Fund’s sub-adviser, knowledgeable brokers and legal counsel in making such determination. The Valuation Committee reports to the Audit Committee of the Company’s Board of Directors. The Audit Committee receives quarterly written reports which include details of all fair-valued investments, including the reason for the fair valuation, and an indication, when possible, of the accuracy of the valuation by disclosing the next available reliable public price quotation or the disposition price of such investments (the “look-back” test). The Board of Directors then must consider for ratification all of the fair value determinations made during the previous quarter.
Valuation levels are not necessarily indicative of the risk associated with investing in such investments. Individual investments within any of the above mentioned asset classes may be assigned a different hierarchical level than those presented above, as individual circumstances dictate.
For additional information, refer to the Investment Valuation Hierarchy Level Summary and the Level 3 roll-forward reconciliation which follow the Schedule of Investments.
For purposes of reporting transfers between different hierarchy levels, both transfers in and out of each level, as applicable, are shown as if they occurred at the beginning of the period.
| 25 |
| Hartford Total Return Bond HLS Fund |
| Notes to Financial Statements – (continued) |
| June 30, 2012 (Unaudited) |
| (000’s Omitted) |
Quantitative Information about Level 3 Fair Value Measurements:
| Fair Value at June 30, 2012 | Valuation Technique | Unobservable Input(1) | ||||||
| Asset & Commercial Mortgage Backed Securities | $ | 76,334 | Indicative market quotes(2) | Third party indicative quote methodologies can vary significantly | ||||
| Corporate Bonds | 11,369 | Indicative market quotes(2) | Third party indicative quote methodologies can vary significantly | |||||
| Total | $ | 87,703 | ||||||
| (1) | Significant changes to any unobservable inputs may result in a significant change to the fair value. |
| (2) | For investments priced using indicative market quotes, this is the best available estimate of exit value as of June 30, 2012. |
| c) | Investment Transactions and Investment Income – Investment transactions are recorded as of the trade date (the date the order to buy or sell is executed) for financial reporting purposes. Investments purchased or sold on a when-issued or delayed-delivery basis may be settled a month or more after the trade date. Realized gains and losses are determined on the basis of identified cost. |
Trade date for senior floating rate interests purchased in the primary loan market is considered the date on which the loan allocations are determined. Trade date for senior floating rate interests purchased in the secondary loan market is the date on which the transaction is entered into.
Dividend income is recorded on the ex-dividend date, except certain dividends from foreign investments where the ex-dividend date may have passed are recorded as soon as the Fund is informed of the dividend. Interest income, including amortization of premium and accretion of discounts, is accrued on a daily basis. Paydown gains and losses on mortgage-related and other asset-backed securities are included in interest income in the Statement of Operations.
| d) | Foreign Currency Transactions – Assets and liabilities denominated in currencies other than U.S. dollars are translated into U.S. dollars at the exchange rates in effect on the valuation date. Purchases and sales of investments, income, and expenses are translated into U.S. dollars at the exchange rates on the dates of such transactions. |
The Fund does not isolate that portion of portfolio investment valuation resulting from fluctuations in the foreign currency exchange rates from the fluctuations arising from changes in the market prices of investments held. Exchange rate fluctuations are included with the net realized and unrealized gain or loss on investments in the accompanying financial statements.
Net realized foreign exchange gains or losses arise from sales of foreign currencies and the difference between asset and liability amounts initially stated in foreign currencies and the U.S. dollar value of the amounts actually received or paid. Net unrealized foreign exchange gains or losses arise from changes in the value of other assets and liabilities at the end of the reporting period, resulting from changes in the exchange rates.
| e) | Joint Trading Account – The Fund may invest cash balances into a joint trading account that may be invested in one or more repurchase agreements. |
| f) | Fund Share Valuation and Dividend Distributions to Shareholders – Orders for the Fund’s shares are executed in accordance with the investment instructions of the contract holders and plan participants. The NAV of the Fund’s shares is determined as of the close of business on each business day of the Exchange. The NAV is determined separately for each class of shares of the Fund by dividing the Fund’s net assets attributable to that class by the number of shares of the class outstanding. Each class of shares offered by the Fund has equal rights as to assets and voting privileges (except that shareholders of a class have exclusive voting rights regarding any matter relating solely to that class of shares). Income and non-class specific expenses are allocated daily to each class on the basis of the relative net assets of the class. |
| 26 |
Realized and unrealized capital gains and losses are allocated daily based on the relative net assets of each class of shares of the Fund.
Orders for the purchase of the Fund’s shares received prior to the close of the Exchange on any day the Exchange is open for business are priced at the NAV determined as of the close of the Exchange. Orders received after the close of the Exchange, or on a day on which the Exchange and/or the Fund is not open for business, are priced at the next determined NAV.
Dividends are declared pursuant to a policy adopted by the Company’s Board of Directors based upon the investment performance of the Fund. The policy of the Fund is to pay dividends from net investment income and realized capital gains, if any, at least once a year.
Distributions from net investment income, net realized capital gains and capital are determined in accordance with federal income tax regulations, which may differ from U.S. GAAP with respect to character and timing. These differences may include but are not limited to losses deferred due to wash sale adjustments, foreign currency gains and losses, adjustments related to Passive Foreign Investment Companies (“PFICs”), Real Estate Investment Trusts (“REITs”), Regulated Investment Companies (“RICs”), certain derivatives and partnerships. Permanent book and federal income tax basis differences relating to shareholder distributions will result in reclassifications to certain of the Fund’s capital accounts (see Federal Income Taxes: Reclassification of Capital Accounts note).
| 3. | Securities and Other Investments: |
| a) | Repurchase Agreements – A repurchase agreement is an agreement by which a counterparty agrees to sell an investment and agrees to repurchase the investment sold at a mutually agreed upon time and price. At the time the Fund enters into a repurchase agreement, the value of the underlying collateral, including accrued interest, will be equal to or exceed the value of the repurchase agreement. Repurchase agreements expose the Fund to counterparty risk. To minimize counterparty risk, the investments that serve to collateralize the repurchase agreement are held by the Fund’s custodian in book entry or physical form in the custodial account of the Fund or in a third party custodial account. Repurchase agreements are valued at cost plus accrued interest. The Fund, as shown on the Schedule of Investments, had outstanding repurchase agreements as of June 30, 2012. |
| b) | Illiquid and Restricted Investments – The Fund is permitted to invest up to 15% of its net assets in illiquid investments. Illiquid investments are those that may not be sold or disposed of in the ordinary course of business within seven days, at approximately the price used to determine the Fund’s NAV. The Fund may not be able to sell illiquid investments when its sub-adviser considers it desirable to do so or may have to sell such investments at a price that is lower than the price that could be obtained if the investments were more liquid. A sale of illiquid investments may require more time and may result in higher dealer discounts and other selling expenses than does the sale of those that are liquid. Illiquid investments also may be more difficult to value due to the unavailability of reliable market quotations for such investments, and an investment in them may have an adverse impact on the Fund’s NAV. The Fund may also purchase certain restricted investments that can only be resold to certain qualified investors and may be determined to be liquid pursuant to policies and guidelines established by the Company’s Board of Directors. The Fund, as shown on the Schedule of Investments, had illiquid and/or restricted investments as of June 30, 2012. |
| c) | Investments Purchased on a When-Issued or Delayed-Delivery Basis – Delivery and payment for investments that have been purchased by the Fund on a forward commitment, or when-issued or delayed-delivery basis, take place beyond the customary settlement period. A fund may dispose of or renegotiate a delayed-delivery transaction after it is entered into, and may sell delayed-delivery investments before they are delivered, which may result in a realized gain or loss. During this period, such investments are subject to market fluctuations, and the Fund identifies investments segregated in its records with a value at least equal to the amount of the commitment. The Fund, as shown on the Schedule of Investments, had when-issued or delayed delivery investments as of June 30, 2012. |
| 27 |
| Hartford Total Return Bond HLS Fund |
| Notes to Financial Statements – (continued) |
| June 30, 2012 (Unaudited) |
| (000’s Omitted) |
In connection with the Fund’s ability to purchase investments on a when-issued or forward commitment basis, the Fund may enter into to-be announced (“TBA”) commitments. TBA commitments are forward agreements for the purchase or sale of mortgage-backed securities for a fixed price, with payment and delivery on an agreed-upon future settlement date. The specific securities to be delivered are not identified at the trade date; however, delivered securities must meet specified terms, including issuer, rate and mortgage terms. The Fund generally enters into TBA commitments with intent to take possession of or deliver the underlying mortgage-backed securities but can extend the settlement or roll the transaction. In a TBA roll, the Fund generally purchases or sells the initial TBA commitment prior to the stipulated settlement date and enters into a new TBA commitment for future delivery or receipt of the mortgage-backed securities. TBA commitments involve a risk of loss if the value of the security to be purchased or sold declines or increases, respectively, prior to settlement date.
The Fund may enter into “dollar rolls” in which the Fund sells securities and contracts with the same counterparty to repurchase substantially similar securities (for example, same issuer, coupon and maturity) on a specified future date at an agreed upon price. The Fund gives up the right to receive interest paid on the investments sold. The Fund would benefit to the extent of any differences between the price received for the security and the lower forward price for the future purchase. Dollar rolls involve the risk that the market value of the securities that the Fund is required to purchase may decline below the agreed upon repurchase price of those securities. The Fund accounts for dollar roll transactions as purchases and sales and realizes gains and losses on these transactions. These transactions are excluded from the Fund’s portfolio turnover rate. The Fund had open dollar roll transactions as of June 30, 2012, as disclosed on the Schedule of Investments, the Statement of Assets and Liabilities and the Statement of Operations.
| d) | Senior Floating Rate Interests – The Fund, as shown on the Schedule of Investments, invests in senior floating rate interests. Senior floating rate interests hold the most senior position in the capital structure of a business entity (the “Borrower”), are typically secured by specific collateral and have a claim on the assets and/or stock of the Borrower that is senior to that held by subordinated debtholders and stockholders of the Borrower. Senior floating rate interests are typically structured and administered by a financial institution that acts as the agent of the lenders participating in the senior floating rate interest. The Fund may invest in multiple series or tranches of a senior floating rate interest, which may have varying terms and carry different associated risks. The Fund may also enter into unfunded loan commitments, which are contractual obligations for future funding. Unfunded loan commitments may include revolving credit facilities, which may obligate the Fund to supply additional cash to the borrower on demand. Unfunded loan commitments represent a future obligation in full. The Fund may receive a commitment fee based on the undrawn portion of the underlying line of credit portion of a senior floating rate interest. In certain circumstances, the Fund may receive various fees upon the restructure of a senior floating rate interest by a borrower. Fees earned/paid may be recorded as a component of income or realized gain/loss in the Statement of Operations. |
Senior floating rate interests are typically rated below-investment-grade, which suggests they are more likely to default and generally pay higher interest rates than investment-grade loans. A default could lead to non-payment of income, which would result in a reduction of income to the Fund, and there can be no assurance that the liquidation of any collateral would satisfy the Borrower’s obligation in the event of non-payment of scheduled interest or principal payments, or that such collateral could be readily liquidated. The Fund, as shown on the Schedule of Investments, had senior floating rate interests as of June 30, 2012.
| e) | Inflation Indexed Bonds – The Fund may invest in inflation indexed bonds. Inflation indexed bonds are fixed income investments whose principal value is periodically adjusted to the rate of inflation. The interest rate on these bonds is generally fixed at issuance at a rate lower than typical bonds. Over the life of an inflation indexed bond, however, interest will be paid based on a principal value, which is adjusted for inflation. Any increase or decrease in the principal amount of an inflation indexed bond will be included as interest income on the Statement of Operations, even though investors do not receive the principal amount until maturity. |
| f) | Mortgage Related and Other Asset Backed Securities – The Fund may invest in mortgage related and other asset backed securities. These securities include mortgage pass-through securities, collateralized mortgage obligations, commercial |
| 28 |
mortgage backed securities, stripped mortgage backed securities, asset backed securities, collateralized debt obligations and other securities that directly or indirectly represent a participation in, or are secured by and payable from, mortgage loans on real property. Mortgage related securities are created from pools of residential or commercial mortgage loans, including mortgage loans made by savings and loan institutions, mortgage bankers, commercial banks and others. Asset backed securities are created from many types of assets, including auto loans, credit card receivables, home equity loans, and student loans. These securities provide a monthly payment which consists of both interest and principal payments. Interest payments may be determined by fixed or adjustable rates. The rate of pre-payments on underlying mortgages will affect the price and volatility of a mortgage related security, and may have the effect of shortening or extending the effective duration of the security relative to what was anticipated at the time of purchase. The timely payment of principal and interest of certain mortgage related securities is guaranteed by the full faith and credit of the United States Government. Pools created and guaranteed by non-governmental issuers, including government-sponsored corporations, may be supported by various forms of insurance or guarantees, but there can be no assurance that the private insurers or guarantors can meet their obligations under the insurance policies or guarantee arrangements. The Fund, as shown on the Schedule of Investments, had mortgage related and other asset backed securities as of June 30, 2012.
| 4. | Financial Derivative Instruments: |
The following disclosures contain information on how and why the Fund uses derivative instruments, the credit-risk-related contingent features in certain derivative instruments, and how derivative instruments affect the Fund’s financial position and results of operations. The location and fair value amounts of these instruments on the Statement of Assets and Liabilities and the realized gains and losses and changes in unrealized gains and losses on the Statement of Operations, each categorized by type of derivative contract, are included in the following Additional Derivative Instrument Information footnote. The derivative instruments outstanding as of period-end are disclosed in the notes to the Schedule of Investments and the amounts of realized gains and losses and changes in unrealized gains and losses on derivative instruments during the period are disclosed in the Statement of Operations.
| a) | Foreign Currency Contracts – The Fund may enter into foreign currency contracts that obligate the Fund to purchase or sell currencies at specified future dates. Foreign currency contracts are used to hedge the currency exposure associated with some or all of the Fund’s investments and/or as part of an investment strategy. Foreign currency contracts are marked to market daily and the change in value is recorded by the Fund as an unrealized gain or loss. The Fund will record a realized gain or loss when the foreign currency contract is settled. |
Foreign currency contracts involve elements of market risk in excess of the amounts reflected in the Statement of Assets and Liabilities. In addition, risks may arise upon entering into these contracts from the potential inability of the counterparties to meet the terms of the contracts and from unanticipated movements in the value of the foreign currencies relative to the U.S. dollar. The Fund had outstanding foreign currency contracts as shown on the Schedule of Investments as of June 30, 2012.
| b) | Futures Contracts – The Fund may enter into futures contracts. A futures contract is an agreement between two parties to buy or sell an asset at a set price on a future date. The Fund uses futures contracts to manage or obtain exposure to the investment markets, commodities, or movements in interest rates and currency values. The primary risks associated with the use of futures contracts are the imperfect correlation between the change in market value of the investments held by the Fund and the prices of futures contracts and the possibility of an illiquid market. Upon entering into a futures contract, the Fund is required to deposit with a futures commission merchant (“FCM”) an amount of cash or U.S. Government or Agency Obligations in accordance with the initial margin requirements of the broker or exchange. Futures contracts are marked to market daily at the most recent settlement price reported by an exchange on which, over time, they are traded most extensively, and an appropriate payable or receivable for the change in value (“variation margin”) is recorded by the Fund. Gains or losses are recognized but not considered realized until the contracts expire or are closed. Futures contracts involve, to varying degrees, risk of loss in excess of the variation margin disclosed on the Statement of Assets and Liabilities; however, this risk is reduced through the use of an FCM. The Fund, as shown on the Schedule of Investments, had outstanding futures contracts as of June 30, 2012. |
| 29 |
| Hartford Total Return Bond HLS Fund |
| Notes to Financial Statements – (continued) |
| June 30, 2012 (Unaudited) |
| (000’s Omitted) |
| c) | Options Contracts – An option contract is a contract sold by one party to another party that offers the buyer the right, but not the obligation, to buy (call) or sell (put) an investment or other financial asset at an agreed-upon price during a specific period of time or on a specific date. The Fund may write (sell) covered call and put options on futures, swaps (“swaptions”), securities, commodities or currencies. “Covered” means that so long as the Fund is obligated as the writer of an option, it will own either the underlying investments or currency or an option to purchase the same underlying investments or currency having an expiration date of the covered option and an exercise price equal to or less than the exercise price of the covered option, or will pledge cash or other liquid investments having a value equal to or greater than the fluctuating market value of the option investment or currency. Writing put options increases the Fund’s exposure to the underlying instrument. Writing call options decreases the Fund’s exposure to the underlying instrument. Premiums received from writing options that expire are treated as realized gains. Premiums received from writing options that are exercised or closed are added to the proceeds or offset amounts paid on the underlying futures, swap, investment or currency transaction to determine the realized gain or loss. The Fund as a writer of an option has no control over whether the underlying instrument may be sold (call) or purchased (put) and as a result bears the market risk of an unfavorable change in the price of the instrument underlying the written option. There is the risk the Fund may not be able to enter into a closing transaction because of an illiquid market. The Fund may also purchase put and call options. Purchasing call options increases the Fund’s exposure to the underlying instrument. Purchasing put options decreases the Fund’s exposure to the underlying instrument. The Fund pays a premium, which is included on the Fund’s Statement of Assets and Liabilities as an investment and is subsequently marked to market to reflect the current value of the option. Premiums paid for purchasing options that expire are treated as realized losses. Certain options may be purchased with premiums to be determined on a future date. The premiums for these options are based upon implied volatility parameters at specified terms. The risk associated with purchasing put and call options is generally limited to the premium paid. Premiums paid for purchasing options that are exercised or closed are added to the amounts paid or offset against the proceeds on the underlying investment transaction to determine the realized gain or loss. Entering into over-the-counter options also exposes the Fund to counterparty risk. Counterparty risk is the possibility that the counterparty to the agreements may default on its obligation to perform or disagree as to the meaning of the contractual terms in the agreements. The Fund, as shown on the Schedule of Investments, had outstanding purchased options contracts as of June 30, 2012. Transactions involving written options contracts during the six-month period ended June 30, 2012, are summarized below: |
| Call Options Written During the Period | Number of Contracts* | Premium Amounts | ||||||
| Beginning of the period | 196,884,689 | $ | 11,916 | |||||
| Written | — | — | ||||||
| Expired | — | — | ||||||
| Closed | (196,884,689 | ) | (11,916 | ) | ||||
| Exercised | — | — | ||||||
| End of period | — | $ | — | |||||
| Put Options Written During the Period | Number of Contracts* | Premium Amounts | ||||||
| Beginning of the period | 82,185,596 | $ | 1,011 | |||||
| Written | 550 | 1,099 | ||||||
| Expired | (1,457 | ) | (1,312 | ) | ||||
| Closed | (82,184,689 | ) | (798 | ) | ||||
| Exercised | — | — | ||||||
| End of period | — | $ | — | |||||
* The number of contracts does not omit 000's.
| d) | Swap Agreements – The Fund may invest in swap agreements. Swap agreements are privately negotiated agreements between the Fund and a counterparty to exchange or swap investment cash flows, assets, foreign currencies or market-linked returns at specified future intervals. The Fund enters into credit default, total return, cross-currency, interest rate, inflation and other forms of swap agreements to manage its exposure to credit, currency, interest rate, commodity and inflation risk. Swap agreements are also used to gain exposure to certain markets. In connection with these agreements, investments or cash may be identified as collateral in accordance with the terms of the respective swap agreements to provide assets of value and recourse in the event of default or bankruptcy/insolvency. Swaps are valued based on custom valuations furnished by an independent pricing service. Swaps for which prices are not available from an independent |
| 30 |
pricing service are valued in accordance with procedures established by the Company’s Board of Directors, and the change in value, if any, is recorded as an unrealized gain or loss on the Statement of Assets and Liabilities. Payments received or made at the beginning of the measurement period are reflected as such on the Statement of Assets and Liabilities and represent payments made or received upon entering into the swap agreement to compensate for differences between the stated terms of the swap agreement and prevailing market conditions (credit spreads, currency exchange rates, interest rates, and other relevant factors). These upfront payments are recorded as realized gains or losses on the Statement of Operations upon termination or maturity of the swap. A liquidation payment received or made at the termination of the swap and some net periodic payments received or paid by the Fund are recorded as realized gains or losses on the Statement of Operations. Net periodic payments and some upfront payments received or paid by the Fund with regard to interest rate swaps are recorded as increases or decreases to income on the Statement of Operations. Entering into these agreements involves, to varying degrees, elements of credit, market and documentation risk in excess of the amounts recognized on the Statement of Assets and Liabilities. Such risks involve the possibility that there will be no liquid market for these agreements, that the counterparty to the agreements may default on its obligation to perform or disagree as to the meaning of contractual terms in the agreements, and that there may be unfavorable changes in interest rates. The Fund’s maximum risk of loss from counterparty credit risk is the discounted net value of the cash flows to be received from the counterparty over the contract’s remaining life, to the extent that amount is positive. The risk is mitigated by having a master netting arrangement between the Fund and the counterparty, which allows for the netting of payments made or received (although such amounts are presented on a gross basis within the Statement of Assets and Liabilities, as applicable) as well as the posting of collateral to the Fund to cover the Fund’s exposure to the counterparty.
Credit Default Swap Agreements – The credit default swap market allows the Fund to manage its exposure to the market or certain sectors of the market, to reduce its risk exposure to defaults of corporate and sovereign issuers, or to create exposure to corporate or sovereign issuers to which it is not otherwise exposed. Certain credit default swaps involve the exchange of a fixed rate premium for protection against the loss in value of an underlying investment or index in the event of a credit event, such as payment default or bankruptcy.
Under a credit default swap contract, one party acts as guarantor by receiving the fixed periodic payment in exchange for the commitment to purchase the underlying investment at par if the defined credit event occurs. Upon the occurrence of a defined credit event, the difference between the value of the reference obligation and the swap’s notional amount is recorded as realized gain or loss on swap transactions in the Statement of Operations. A “buyer” of credit protection agrees to pay a counterparty to assume the credit risk of an issuer upon the occurrence of certain events. The “seller” of the protection receives periodic payments and agrees to assume the credit risk of an issuer upon the occurrence of certain events. Although specified events are contract specific, credit events are generally defined as bankruptcy, failure to pay, restructuring, obligation acceleration, obligation default, or repudiation/moratorium. A “seller’s” exposure is limited to the total notional amount of the credit default swap contract. These potential amounts would be partially offset by any recovery values of the respective referenced obligations or upfront payments received upon entering into the contract.
Implied credit spreads, represented in absolute terms, utilized in determining the market value of credit default swap contracts on corporate issues, sovereign government issues or U.S. municipal issues as of period end are disclosed in the notes to the Schedule of Investments, as applicable, and serve as an indicator of the current status of the payment/performance risk and represent the likelihood or risk of default for the credit derivative. The implied credit spread of a particular referenced entity reflects the cost of buying/selling protection and may include upfront payments required to be made to enter into the contract. Wider credit spreads represent a deterioration of the referenced entity’s soundness and a greater likelihood or risk of default or other credit event occurring as defined under the terms of the contract. For credit default swap contracts on asset-backed securities and credit indices, the quoted market prices and resulting values serve as the indicator of the current status of the payment/performance risk. Increasing market values, in absolute terms when compared to the notional amount of the swap, represent a deterioration of the referenced equity’s credit soundness and a greater likelihood or risk of default or other credit event occurring as defined under the terms of the contract. The Fund, as shown on the Schedule of Investments, had outstanding credit default swaps as of June 30, 2012.
| 31 |
| Hartford Total Return Bond HLS Fund |
| Notes to Financial Statements – (continued) |
| June 30, 2012 (Unaudited) |
| (000’s Omitted) |
Interest Rate Swap Agreements – The Fund is subject to interest rate risk in the normal course of pursuing its investment objectives. Because the Fund holds fixed rate bonds, the value of these bonds may decrease if interest rates rise. To help hedge against this risk and to maintain its ability to generate income at prevailing market rates, the Fund may enter into interest rate swap agreements. In a typical interest rate swap, one party agrees to make regular payments equal to a floating interest rate, based on a specified interest rate benchmark (e.g., London Interbank Offered Rate (“LIBOR”)) or index (e.g., U.S. Consumer Price Index), multiplied by a “notional principal amount”, in return for payments equal to a fixed rate multiplied by the same amount, for a specific period of time. The net interest received or paid on interest rate swap contracts is accrued daily as interest income/expense. Interest rate swaps are marked to market daily and the change, if any, is recorded as an unrealized gain or loss in the Statement of Operations. When the interest rate swap agreement is terminated early, the Fund records a realized gain or loss equal to the difference between the current realized value and the expected cash flows.
If an interest rate swap contract provides for payments in different currencies, the parties might agree to exchange the notional principal amount as well. Interest rate swaps may also depend on other prices or rates, such as the value of an index or mortgage prepayments rates. The risks of interest rate swaps include changes in market conditions which will affect the value of the contract or the cash flows and the possible inability of the counterparty to fulfill its obligations under the agreement. The Fund’s maximum risk of loss from counterparty credit risk is the discounted net value of the cash flows to be received from the counterparty over the agreement’s remaining life, to the extent that the amount is positive. This risk may be mitigated by having a master netting arrangement between the Fund and the counterparty (although such amounts are presented on a gross basis within the Statement of Assets and Liabilities, as applicable) or by posting collateral by the counterparty to the Fund to cover the Fund’s exposure to the counterparty. The Fund, as shown on the Schedule of Investments, had outstanding interest rate swaps as of June 30, 2012.
Total Return Swap Agreements – The Fund may invest in total return swap agreements. An investment in a total return swap allows the Fund to gain or mitigate exposure to underlying referenced securities. Total return swap agreements on commodities involve commitments where cash flows are exchanged based on the price of a commodity and based on a fixed or variable rate. One party would receive payments based on the price appreciation or depreciation of a commodity index, a portion of the index, or a single commodity in exchange for paying to or receiving from the counterparty seller an agreed-upon rate. A variable rate may be correlated to a base rate, such as the LIBOR, and is adjusted each period. Therefore, if interest rates increase over the term of the swap agreement, the party paying the rate may be required to pay a higher rate at each swap reset date.
Total return swap agreements on indices involve commitments to pay interest in exchange for a market-linked return. One party pays out the total return of a specific reference asset, which may be an equity, index, or bond, and in return receives a regular stream of payments. To the extent the total return of the security or index underlying the transaction exceeds or falls short of the offsetting interest rate obligation, the Fund will receive a payment from or make a payment to the counterparty. As of June 30, 2012, the Fund did not hold any total return swap agreements.
| 32 |
| e) | Additional Derivative Instrument Information: |
Fair Values of Derivative Instruments on the Statement of Assets and Liabilities as of June 30, 2012:
| Risk Exposure Category | ||||||||||||||||||||||||||||
| Interest Rate Contracts | Foreign Exchange Contracts | Credit Contracts | Equity Contracts | Commodity Contracts | Other Contracts | Total | ||||||||||||||||||||||
| Assets: | ||||||||||||||||||||||||||||
| Investments in securities, at value (purchased options), market value | $ | 84 | $ | — | $ | — | $ | — | $ | — | $ | — | $ | 84 | ||||||||||||||
| Unrealized appreciation on foreign currency contracts | — | 1,009 | — | — | — | — | 1,009 | |||||||||||||||||||||
| Unrealized appreciation on swap contracts | 288 | — | 1,701 | — | — | — | 1,989 | |||||||||||||||||||||
| Variation margin receivable * | 2,032 | — | — | — | — | — | 2,032 | |||||||||||||||||||||
| Total | $ | 2,404 | $ | 1,009 | $ | 1,701 | $ | — | $ | — | $ | — | $ | 5,114 | ||||||||||||||
| Liabilities: | ||||||||||||||||||||||||||||
| Unrealized depreciation on foreign currency contracts | $ | — | $ | 685 | $ | — | $ | — | $ | — | $ | — | $ | 685 | ||||||||||||||
| Unrealized depreciation on swap contracts | — | — | 6,829 | — | — | — | 6,829 | |||||||||||||||||||||
| Variation margin payable * | 1,060 | — | — | — | — | 2,120 | 1,060 | |||||||||||||||||||||
| Total | $ | 1,060 | $ | 685 | $ | 6,829 | $ | — | $ | — | $ | 2,120 | $ | 8,574 | ||||||||||||||
| * | Only current day's variation margin is reported within the Statement of Assets and Liabilities. The variation margin is included in the open futures cumulative appreciation (depreciation) of $(502) as reported in the Schedule of Investments. |
The volume of derivatives that is presented in the Schedule of Investments is consistent with the derivative activity during the six-month period ended June 30, 2012.
The effect of Derivative Instruments on the Statement of Operations for the six-month period ended June 30, 2012:
| Risk Exposure Category | ||||||||||||||||||||||||||||
| Interest Rate Contracts | Foreign Exchange Contracts | Credit Contracts | Equity Contracts | Commodity Contracts | Other Contracts | Total | ||||||||||||||||||||||
| Realized Gain (Loss) on Derivatives Recognized as a Result of Operations: | ||||||||||||||||||||||||||||
| Net realized gain (loss) on investments in purchased options | $ | (3,878 | ) | $ | 6,127 | $ | — | $ | — | $ | — | $ | — | $ | 2,249 | |||||||||||||
| Net realized loss on futures | (15,275 | ) | — | — | — | — | — | (15,275 | ) | |||||||||||||||||||
| Net realized gain on written options | 1,312 | 1,768 | — | — | — | — | 3,080 | |||||||||||||||||||||
| Net realized gain (loss) on swap contracts | 678 | — | (10,514 | ) | — | — | — | (9,836 | ) | |||||||||||||||||||
| Net realized loss on foreign currency contracts | — | (3,305 | ) | — | — | — | — | (3,305 | ) | |||||||||||||||||||
| Total | $ | (17,163 | ) | $ | 4,590 | $ | (10,514 | ) | $ | — | $ | — | $ | — | $ | (23,087 | ) | |||||||||||
| Net Change in Unrealized Appreciation (Depreciation) on Derivatives Recognized as a Result of Operations: | ||||||||||||||||||||||||||||
| Net change in unrealized depreciation of investments in purchased options | $ | (293 | ) | $ | (13,160 | ) | $ | — | $ | — | $ | — | $ | — | $ | (13,453 | ) | |||||||||||
| Net change in unrealized appreciation of futures | 199 | — | — | — | — | — | 199 | |||||||||||||||||||||
| Net change in unrealized appreciation (depreciation) of written options | (140 | ) | 2,945 | — | — | — | — | 2,805 | ||||||||||||||||||||
| Net change in unrealized appreciation (depreciation) of swap contracts | 288 | — | (7,571 | ) | — | — | — | (7,283 | ) | |||||||||||||||||||
| Net change in unrealized appreciation of foreign currency contracts | — | 338 | — | — | — | — | 338 | |||||||||||||||||||||
| Total | $ | 54 | $ | (9,877 | ) | $ | (7,571 | ) | $ | — | $ | — | $ | — | $ | (17,394 | ) | |||||||||||
| 33 |
| Hartford Total Return Bond HLS Fund |
| Notes to Financial Statements – (continued) |
| June 30, 2012 (Unaudited) |
| (000’s Omitted) |
| 5. | Principal Risks: |
| a) | Credit and Counterparty Risks – Credit risk depends largely on the perceived financial health of bond issuers. In general, the credit rating is inversely related to the credit risk of the issuer. Higher rated bonds generally are deemed to have less credit risk, while lower or unrated bonds are deemed to have higher risk of default. The share price, yield and total return of a fund that holds securities with higher credit risk may be more volatile than those of a fund that holds bonds with lower credit risk. Similar to credit risk, the Fund may be exposed to counterparty risk, or the risk that an institution or other entity with which the Fund has unsettled or open transactions will default. |
| b) | Market Risks – The Fund’s investments expose the Fund to various risks including, but not limited to, interest rate, prepayment, extension, foreign currency, and equity risks. Interest rate risk is the risk that fixed income securities will decline in value because of changes in interest rates. As nominal interest rates rise, the values of certain fixed income securities held by the Fund are likely to decrease. A nominal interest rate can be described as the sum of a real interest rate and an expected inflation rate. Fixed income securities with longer durations tend to be more sensitive to changes in interest rates, usually making them more volatile than securities with shorter durations. Duration is useful primarily as a measure of the sensitivity of a fixed income security’s market price to interest rate (i.e., yield) movements. Senior floating rate interests and securities subject to prepayment and extension risk generally offer less potential for gains when interest rates decline. In addition, securities are subject to extension risk. Rising interest rates may cause prepayments to occur at a slower than expected rate, thereby effectively lengthening the maturity of the security and making the security more sensitive to interest rate changes. Prepayment and extension risk are major risks of mortgage-backed securities, senior floating rate interests, and certain asset-backed securities. For certain asset-backed securities, the actual maturity may be less than the stated maturity shown in the Schedule of Investments, if applicable. As a result, the timing of income recognition relating to these securities may vary based upon the actual maturity. If the Fund invests directly in foreign currencies or in securities that trade in, and receive revenues in, foreign currencies, or in derivatives that provide exposure to foreign currencies, it will be subject to the risk that those currencies will decline in value relative to the base currency of the Fund, or, in the case of hedging positions, that the Fund’s base currency will decline in value relative to the currency being hedged. Currency rates in foreign countries may fluctuate significantly over short periods of time for a number of reasons, including changes in interest rates, intervention (or the failure to intervene) by U.S. or foreign governments, central banks or supranational entities, such as the International Monetary Fund, or by the imposition of currency controls or other political developments in the United States or abroad. As a result, the Fund’s investments in foreign currency denominated securities may reduce the returns of the Fund. The market values of equity securities, such as common stocks and preferred stocks, or equity related investments, such as futures and options, may decline due to general market conditions which are not specifically related to a particular company, such as real or perceived adverse economic conditions, changes in the general outlook for corporate earnings, changes in interest or currency rates or adverse investor sentiment generally. The market value of equity securities may also decline due to factors which affect a particular industry or industries, such as labor shortages or increased production costs and competitive conditions within an industry. Equity securities and equity related investments generally have greater market price volatility than fixed income securities. |
| 6. | Federal Income Taxes: |
| a) | Federal Income Taxes – For federal income tax purposes, the Fund intends to continue to qualify as a RIC under Subchapter M of the Internal Revenue Code (“IRC”) by distributing substantially all of its taxable net investment income and net realized capital gains to its shareholders and otherwise complying with the requirements of RICs. The Fund has distributed substantially all of its income and capital gains in prior years, if applicable, and intends to distribute substantially all of its income and capital gains prior to the next fiscal year-end. Accordingly, no provision for federal income or excise taxes has been made in the accompanying financial statements. Distributions from short-term capital gains are treated as ordinary income distributions for federal income tax purposes. |
| b) | Net Investment Income (Loss), Net Realized Gains (Losses) – Net investment income (loss) and net realized gains (losses) may differ for financial statement and tax purposes primarily because of losses deferred due to wash sale adjustments, foreign currency gains and losses, adjustments related to PFICs, REITs, RICs, certain derivatives and |
| 34 |
partnerships. The character of distributions made during the year from net investment income or net realized gains may differ from their ultimate characterization for federal income tax purposes. Also, due to the timing of dividend distributions, the fiscal year in which amounts are distributed may differ from the year that the income or realized gains (losses) were recorded by the Fund.
| c) | Distributions and Components of Distributable Earnings – The tax character of distributions paid by the Fund for the periods indicated is as follows (as adjusted for dividends payable): |
| For the Year Ended December 31, 2011 | For the Year Ended December 31, 2010 | |||||||
| Ordinary Income | $ | 9,707 | $ | 198,500 | ||||
As of December 31, 2011, the Fund’s components of distributable earnings (deficit) on a tax basis were as follows:
| Amount | ||||
| Undistributed Ordinary Income | $ | 172,216 | ||
| Accumulated Capital and Other Losses* | (149,977 | ) | ||
| Unrealized Appreciation† | 140,619 | |||
| Total Accumulated Earnings | $ | 162,858 | ||
| * | The Fund has capital loss carryforwards that are identified in the Capital Loss Carryforward note that follows. |
| † | The difference between book-basis and tax-basis unrealized appreciation (depreciation) may be attributable to the losses deferred due to wash sale adjustments, foreign currency gains and losses, adjustments related to PFICs, REITs, RICs, certain derivatives and partnerships. |
| d) | Reclassification of Capital Accounts – The Fund may record reclassifications in its capital accounts. These reclassifications have no impact on the total net assets of the Fund. The reclassifications are a result of permanent differences between U.S. GAAP and tax accounting for such items as foreign currency, PFICs, expiration or utilization of capital loss carryforwards or net operating losses. Adjustments are made to reflect the impact these items have on current and future distributions to shareholders. Therefore, the source of the Fund’s distributions may be shown in the accompanying Statement of Changes in Net Assets as from undistributed net investment income, from accumulated net realized gains on investments or from capital depending on the type of book and tax differences that exist. For the year ended December 31, 2011, the Fund recorded reclassifications to increase (decrease) the accounts listed below: |
| Amount | ||||
| Undistributed Net Investment Income | $ | 7,277 | ||
| Accumulated Net Realized Gain (Loss) | (7,277 | ) | ||
| e) | Capital Loss Carryforward – On December 22, 2010, the Regulated Investment Company Modernization Act of 2010 (the “Act”) was enacted, which made changes to the capital loss carryforward rules. The changes are effective for taxable years beginning after the date of enactment. Under the Act, funds are permitted to carry forward capital losses for an unlimited period. However, any losses incurred during those future taxable years will be required to be utilized prior to the losses incurred in pre-enactment taxable years, which carry an expiration date. As a result of this ordering rule, pre-enactment capital loss carryforwards may be more likely to expire unused. Additionally, post-enactment capital loss carryforwards retain their character as either short-term or long-term capital losses rather than being considered all short-term as permitted under prior regulation. |
| 35 |
| Hartford Total Return Bond HLS Fund |
| Notes to Financial Statements – (continued) |
| June 30, 2012 (Unaudited) |
| (000’s Omitted) |
At December 31, 2011 (tax-year-end), the Fund had capital loss carryforwards for U.S. federal income tax purposes as follows:
| Year of Expiration | Amount | |||
| 2017 | $ | 149,977 | ||
| Total | $ | 149,977 | ||
During the year ended December 31, 2011, the Fund utilized $113,185 of prior year capital loss carryforwards.
| f) | Accounting for Uncertainty in Income Taxes – The Fund has adopted financial reporting rules that require the Fund to analyze all open tax years, as defined by the statute of limitations, for all major jurisdictions. Generally, tax authorities can examine all tax returns filed for the last three years. The Fund does not have an examination in progress. |
The Fund has reviewed all open tax years and major jurisdictions and concluded that these financial reporting rules had no effect on the Fund’s financial position or results of operations. There is no tax liability resulting from unrecognized tax benefits relating to uncertain income tax positions taken or expected to be taken on the tax return for the fiscal year ended December 31, 2011. The Fund is also not aware of any tax positions for which it is reasonably possible that the total amounts of unrecognized tax benefits will significantly change in the next twelve months.
| 7. | Expenses: |
| a) | Investment Management Agreement – HL Investment Advisors, LLC (“HL Advisors”), an indirect wholly owned subsidiary of The Hartford Financial Services Group, Inc. (“The Hartford”), serves as investment manager to the Fund pursuant to an Investment Management Agreement with the Company. As investment manager, HL Advisors has overall investment supervisory responsibility for the Fund. In addition, HL Advisors provides administrative personnel, services, equipment, facilities and office space for proper operation of the Fund. Effective March 5, 2012, HL Advisors has contracted with Wellington Management Company, LLP (“Wellington Management”) under a sub-advisory agreement for the provision of day-to-day investment management services to the Fund in accordance with the Fund’s investment objective and policies. Prior to March 5, 2012, Hartford Investment Management Company was the sub-adviser for the Fund. The Fund pays a fee to HL Advisors, a portion of which may be used to compensate sub-advisers. |
The schedule below reflects the rates of compensation paid to HL Advisors for investment management services rendered as of June 30, 2012; the rates are accrued daily and paid monthly.
| Average Daily Net Assets | Annual Fee | |||
| On first $250 million | 0.5250 | % | ||
| On next $250 million | 0.5000 | % | ||
| On next $500 million | 0.4750 | % | ||
| On next $1.5 billion | 0.4500 | % | ||
| On next $2.5 billion | 0.4450 | % | ||
| On next $5 billion | 0.4300 | % | ||
| Over $10 billion | 0.4200 | % | ||
| 36 |
The schedule below reflects the rates of compensation paid to HL Advisors for investment management services rendered during the period December 31, 2011, through February 29, 2012.
| Average Daily Net Assets | Annual Fee | |||
| On first $250 million | 0.5250 | % | ||
| On next $250 million | 0.5000 | % | ||
| On next $500 million | 0.4750 | % | ||
| On next $4 billion | 0.4500 | % | ||
| On next $5 billion | 0.4300 | % | ||
| Over $10 billion | 0.4200 | % | ||
| b) | Accounting Services Agreement – Pursuant to the Fund Accounting Agreement between HLIC and the Company, on behalf of the Fund, HLIC provides accounting services to the Fund and receives monthly compensation based on the Fund’s average daily net assets at the rates set forth below. The Fund’s accounting services fees are accrued daily and paid monthly. |
| Average Daily Net Assets | Annual Fee | |||
| On first $5 billion | 0.020 | % | ||
| On next $5 billion | 0.018 | % | ||
| Over $10 billion | 0.016 | % | ||
| c) | Operating Expenses – Allocable expenses incurred by the Company are allocated to each Fund and allocated to classes within a Fund in proportion to the average daily net assets of the Fund and each class, except where allocation of certain expenses is more fairly made directly to the Fund or to specific classes within a Fund. |
| d) | Distribution Plan for Class IB shares – The Company, on behalf of the Fund, has adopted a Distribution Plan pursuant to Rule 12b-1 of the 1940 Act to compensate the Distributor, Hartford Securities Distribution Company, Inc. (a wholly owned, ultimate subsidiary of The Hartford), from assets attributable to the Class IB shares for services rendered and expenses borne in connection with activities primarily intended to result in the sale of the Class IB shares, subject to the review and approval of the Company’s Board of Directors. |
The Distribution Plan provides that the Fund may pay annually up to 0.25% of the average daily net assets of the Fund attributable to its Class IB shares for activities primarily intended to result in the sale of Class IB shares. The Board has the authority to suspend or reduce these payments at any point in time. Under the terms of the Distribution Plan and the principal underwriting agreement, the Fund is authorized to make payments monthly to the Distributor that may be used to pay or compensate entities providing distribution and shareholder servicing with respect to the Class IB shares for such entities’ fees or expenses incurred or paid in that regard. These fees are accrued daily and paid monthly.
| e) | Other Related Party Transactions – Certain officers of the Fund are directors and/or officers of HL Advisors and/or The Hartford or its subsidiaries. For the six-month period ended June 30, 2012, a portion of the Fund’s chief compliance officer’s salary was paid by all the investment companies in the Hartford fund complex. The portion allocated to the Fund was in the amount of $3. Hartford Administrative Services Company (“HASCO”), an indirect wholly owned subsidiary of The Hartford, provides transfer agent services to the Fund. HASCO was compensated on a per account basis for providing such services. The amount paid to HASCO can be found in the Statement of Operations. These fees are accrued daily and paid monthly. |
| 37 |
| Hartford Total Return Bond HLS Fund |
| Notes to Financial Statements – (continued) |
| June 30, 2012 (Unaudited) |
| (000’s Omitted) |
| 8. | Investment Transactions: |
For the six-month period ended June 30, 2012, the Fund's aggregate purchases and sales of investment securities (excluding short-term investments) were as follows:
| Amount | ||||
| Cost of Purchases Excluding U.S. Government Obligations | $ | 7,273,410 | ||
| Sales Proceeds Excluding U.S. Government Obligations | 6,792,472 | |||
| Cost of Purchases for U.S. Government Obligations | 407,069 | |||
| Sales Proceeds for U.S. Government Obligations | 232,691 | |||
| 9. | Line of Credit: |
The Fund is one of several Hartford funds that participate in a $500 million committed revolving line of credit facility. The facility is to be used for temporary or emergency purposes. Under the arrangement, the funds are required to own securities having a market value in excess of 300% of the total bank borrowings. The interest rate on borrowings varies depending on the nature of the loan. The facility also requires a fee to be paid based on the amount of the commitment. This commitment fee is allocated to all of the funds participating in the line of credit based on the average net assets of the funds. During the six-month period ended June 30, 2012, the Fund did not have any borrowings under this facility.
| 10. | Industry Classifications: |
Other than the industry classifications “Other Investment Pools and Funds” and “Exchange Traded Funds,” equity industry classifications used in this report are the Global Industry Classification Standard, which was developed by and is the exclusive property and service mark of MSCI, Inc. and Standard & Poor’s.
| 11. | Indemnifications: |
Under the Company’s organizational documents, the Company shall indemnify its officers and directors to the full extent required or permitted under Maryland General Corporation Law and the federal securities laws. In addition, the Company, on behalf of the Fund, may enter into contracts that contain a variety of indemnifications. The Company’s maximum exposure under these arrangements is unknown. However, as of the date of these financial statements, the Company has not had prior claims or losses pursuant to these contracts and expects the risk of loss to be remote.
| 38 |
[This page is intentionally left blank]
| 39 |
| Hartford Total Return Bond HLS Fund |
| Financial Highlights |
| - Selected Per-Share Data (A) - |
| Class | Net Asset Value at Beginning of Period | Net Investment Income (Loss) | Payments from (to) Affiliate | Net Realized and Unrealized Gain (Loss) on Investments | Total from Investment Operations | Dividends from Net Investment Income | Distributions from Realized Capital Gains | Distributions from Capital | Total Distributions | Net Increase (Decrease) in Net Asset Value | Net Asset Value at End of Period | |||||||||||||||||||||||||||||||||
| For the Six-Month Period Ended June 30, 2012 (Unaudited) (D) | ||||||||||||||||||||||||||||||||||||||||||||
| IA | $ | 11.63 | $ | 0.18 | $ | – | $ | 0.23 | $ | 0.41 | $ | – | $ | – | $ | – | $ | – | $ | 0.41 | $ | 12.04 | ||||||||||||||||||||||
| IB | 11.55 | 0.17 | – | 0.22 | 0.39 | – | – | – | – | 0.39 | 11.94 | |||||||||||||||||||||||||||||||||
| For the Year Ended December 31, 2011 | ||||||||||||||||||||||||||||||||||||||||||||
| IA | 10.90 | 0.44 | – | 0.31 | 0.75 | (0.02 | ) | – | – | (0.02 | ) | 0.73 | 11.63 | |||||||||||||||||||||||||||||||
| IB | 10.84 | 0.42 | – | 0.31 | 0.73 | (0.02 | ) | – | – | (0.02 | ) | 0.71 | 11.55 | |||||||||||||||||||||||||||||||
| For the Year Ended December 31, 2010 | ||||||||||||||||||||||||||||||||||||||||||||
| IA | 10.58 | 0.45 | – | 0.34 | 0.79 | (0.47 | ) | – | – | (0.47 | ) | 0.32 | 10.90 | |||||||||||||||||||||||||||||||
| IB | 10.53 | 0.44 | – | 0.31 | 0.75 | (0.44 | ) | – | – | (0.44 | ) | 0.31 | 10.84 | |||||||||||||||||||||||||||||||
| For the Year Ended December 31, 2009 | ||||||||||||||||||||||||||||||||||||||||||||
| IA | 9.54 | 0.46 | – | 0.98 | 1.44 | (0.40 | ) | – | – | (0.40 | ) | 1.04 | 10.58 | |||||||||||||||||||||||||||||||
| IB | 9.50 | 0.46 | – | 0.95 | 1.41 | (0.38 | ) | – | – | (0.38 | ) | 1.03 | 10.53 | |||||||||||||||||||||||||||||||
| For the Year Ended December 31, 2008 | ||||||||||||||||||||||||||||||||||||||||||||
| IA | 11.15 | 0.62 | – | (1.49 | ) | (0.87 | ) | (0.74 | ) | – | – | (0.74 | ) | (1.61 | ) | 9.54 | ||||||||||||||||||||||||||||
| IB | 11.09 | 0.67 | – | (1.55 | ) | (0.88 | ) | (0.71 | ) | – | – | (0.71 | ) | (1.59 | ) | 9.50 | ||||||||||||||||||||||||||||
| For the Year Ended December 31, 2007 (D) | ||||||||||||||||||||||||||||||||||||||||||||
| IA | 11.24 | 0.60 | – | (0.08 | ) | 0.52 | (0.61 | ) | – | – | (0.61 | ) | (0.09 | ) | 11.15 | |||||||||||||||||||||||||||||
| IB | 11.19 | 0.57 | – | (0.09 | ) | 0.48 | (0.58 | ) | – | – | (0.58 | ) | (0.10 | ) | 11.09 | |||||||||||||||||||||||||||||
| (A) | Information presented relates to a share outstanding throughout the indicated period. |
| (B) | The figures do not include sales charges or other fees which may be applied at the variable life insurance, variable annuity or qualified retirement plan product level. Any such additional sales charges or other fees would lower the Fund's performance. |
| (C) | Portfolio turnover rate is calculated on the basis of the Fund as a whole without distinguishing between the classes of shares issued. |
| (D) | Per share amounts have been calculated using the average shares method. |
| (E) | Not annualized. |
| (F) | Annualized. |
| 40 |
| - Ratios and Supplemental Data - |
| Total Return(B) | Net Assets at End of Period | Ratio of Expenses to Average Net Assets Before Waivers | Ratio of Expenses to Average Net Assets After Waivers | Ratio of Net Investment Income (Loss) to Average Net Assets | Portfolio Turnover Rate(C) | |||||||||||||||||
| 3.52 | %(E) | $ | 3,683,689 | 0.50 | %(F) | 0.50 | %(F) | 3.12 | %(F) | 2 | % | |||||||||||
| 3.39 | (E) | 597,140 | 0.75 | (F) | 0.75 | (F) | 2.87 | (F) | – | |||||||||||||
| 6.99 | 3,718,609 | 0.49 | 0.49 | 3.60 | 107 | |||||||||||||||||
| 6.72 | 632,685 | 0.74 | 0.74 | 3.35 | – | |||||||||||||||||
| 7.51 | 4,026,583 | 0.50 | 0.50 | 3.90 | 188 | |||||||||||||||||
| 7.25 | 722,317 | 0.75 | 0.75 | 3.65 | – | |||||||||||||||||
| 15.01 | 3,902,957 | 0.51 | 0.51 | 4.67 | 215 | |||||||||||||||||
| 14.72 | 789,541 | 0.76 | 0.76 | 4.42 | – | |||||||||||||||||
| (7.62 | ) | 3,167,919 | 0.49 | 0.49 | 5.54 | 173 | ||||||||||||||||
| (7.85 | ) | 740,580 | 0.74 | 0.74 | 5.27 | – | ||||||||||||||||
| 4.67 | 3,458,709 | 0.49 | 0.49 | 5.27 | 223 | |||||||||||||||||
| 4.41 | 1,036,331 | 0.74 | 0.74 | 5.01 | – | |||||||||||||||||
| 41 |
| Hartford Total Return Bond HLS Fund |
| Directors and Officers (Unaudited) |
The Board of Directors of the Company appoints officers who are responsible for the day-to-day operations of the Fund and who execute policies formulated by the Directors. Each director serves until his or her death, resignation, or retirement or until the next annual meeting of shareholders is held or until his or her successor is elected and qualifies.
Directors and officers who are employed by or who have a financial interest in The Hartford are considered “interested” persons of the Fund pursuant to the 1940 Act. Each officer and two of the Company’s directors, as noted in the chart below, are “interested” persons of the Fund. Each director serves as a director for The Hartford Mutual Funds, Inc., The Hartford Mutual Funds II, Inc., Hartford Series Fund, Inc., Hartford HLS Series Fund II, Inc., and as a trustee for The Hartford Alternative Strategies Fund, which, as of June 30, 2012, collectively consist of 89 funds. Correspondence may be sent to directors and officers c/o Hartford Mutual Funds, P.O. Box 2999, Hartford, Connecticut 06104-2999, except that correspondence to Mr. Annoni, Mr. Dressen and Ms. Fagely may be sent to 500 Bielenberg Drive, Woodbury, Minnesota 55125.
The table below sets forth, for each director and officer, his or her name, year of birth, current position with the Company and date first elected or appointed to Hartford Series Fund, Inc. (“HSF”), and Hartford HLS Series Fund II, Inc. (“HSF2”), principal occupation, and, for directors, other directorships held. The Fund’s statement of additional information contains further information on the directors and is available free of charge by calling 1-800-862-6668 or writing to Hartford HLS Funds, c/o Individual Annuity Services, P.O. Box 5085, Hartford, CT 06102-5085.
Information on the aggregate remuneration paid to the directors of the Company can be found in the Statement of Operations herein. The Fund pays to The Hartford a portion of the Chief Compliance Officer’s compensation, but does not pay salaries or compensation to any of their other officers or directors who are employed by The Hartford.
Non-Interested Directors
Lynn S. Birdsong (1946) Director since 2003, Co-Chairman of the Investment Committee
Mr. Birdsong is a private investor. Mr. Birdsong currently serves as a Director of the Sovereign High Yield Investment Company (April 2010 to current). Mr. Birdsong currently serves as an Independent Director of Nomura Partners Funds, Inc. (formerly, The Japan Fund) (March 2003 to current). From 1979 to 2002, Mr. Birdsong was a managing director of Zurich Scudder Investments, an investment management firm. During his employment with Scudder, Mr. Birdsong was an Interested Director of The Japan Fund. Since 1981, Mr. Birdsong has been a partner in Birdsong Company, an advertising specialty firm.
Robert M. Gavin, Jr. (1940) Director since 2002 (HSF) and 1986 (HSF2), Chairman of the Board since 2004
Dr. Gavin is an educational consultant. Prior to September 1, 2001, he was President of Cranbrook Education Community and prior to July 1996, he was President of Macalester College, St. Paul, Minnesota.
Duane E. Hill (1945) Director since 2001 (HSF) and 2002 (HSF2), Chairman of the Nominating Committee
Mr. Hill is Partner of TSG Ventures L.P., a private equity investment company. Mr. Hill is a former partner of TSG Capital Group, a private equity investment firm that served as sponsor and lead investor in leveraged buyouts of middle market companies.
Sandra S. Jaffee (1941) Director since 2005
Ms. Jaffee is the founder and Chief Executive Officer of a private company, Homeworks Concierge, LLC, which provides residential property management services in Westchester County, New York (January 2012 to present). Ms. Jaffee served as Chairman (2008 to 2009) and Chief Executive Officer of Fortent (formerly Searchspace Group), a leading provider of compliance/regulatory technology to financial institutions from August 2005 to August 2009. Ms. Jaffe currently serves as a member of the Board of Directors of Broadridge Financial Solutions as well as a Trustee of Muhlenberg College.
William P. Johnston (1944) Director since 2005, Chairman of the Compliance Committee
In June 2006, Mr. Johnston was appointed as Senior Advisor to The Carlyle Group, a global private equity investment firm. In August 2007, Mr. Johnston was elected to the Board of Directors of LifeCare Holdings, Inc. In February 2008, Mr. Johnston was elected to the Board of Directors of HCR-ManorCare, Inc. In May 2006, Mr. Johnston was elected to the Supervisory Board of Fresenius Medical Care AG & Co. KGaA, after its acquisition of Renal Care Group, Inc. in March 2006.
Phillip O. Peterson (1944) Director since 2002 (HSF) and 2000 (HSF2), Chairman of the Audit Committee
Mr. Peterson is a mutual fund industry consultant. He was a partner of KPMG LLP (an accounting firm) until July 1999. Mr. Peterson joined William Blair Funds in February 2007 as a member of the Board of Trustees. Mr. Peterson also joined the Board of Trustees of Symetra Variable Mutual Funds Trust as a trustee in February 2012.
| 42 |
Lemma W. Senbet (1946) Director since 2005
Dr. Senbet is the William E. Mayer Chair Professor of Finance and Director, Center for Financial Policy, at the University of Maryland, Robert H. Smith School of Business. He was chair of the Finance Department from 1998 to 2006. Previously he was a chaired professor of finance at the University of Wisconsin-Madison. Also, he was director of the Fortis Funds from March 2000 to July 2002. Dr. Senbet served the finance profession in various capacities, including as director of the American Finance Association and President of the Western Finance Association. In 2006, Dr. Senbet was inducted Fellow of Financial Management Association International for his career-long distinguished scholarship and professional service.
Interested Directors and Officers
David N. Levenson (1966) Director since 2010(1)
Mr. Levenson currently serves as President of The Hartford’s Wealth Management business. He was appointed to this role in July 2010. Previously, Mr. Levenson served as Executive Vice President of Legacy Holdings for The Hartford from June 2009 to July 2010. From 2006 to 2009, Mr. Levenson was with Hartford Life Insurance K.K. where he served as President and Chief Executive Officer from 2007 to 2009. He served as Managing Director of Hartford Investment Management Company from 2005 to 2006. Additionally, Mr. Levenson serves as Executive Vice President of The Hartford and as President, Director and Chief Executive Officer of Hartford Life Insurance Company (“HLIC”) and Hartford Life, Inc. (“HL Inc.”).
(1) Mr. Levenson served as Interested Director until August 2, 2012.
Lowndes A. Smith (1939) Director since 1996 (HSF) and 2002 (HSF2), Co-Chairman of the Investment Committee
Mr. Smith served as Vice Chairman of The Hartford from February 1997 to January 2002, as President and Chief Executive Officer of HL Inc. from February 1997 to January 2002, and as President and Chief Operating Officer of The Hartford Life Insurance Companies from January 1989 to January 2002. Mr. Smith serves as a Director of White Mountains Insurance Group, Ltd., One Beacon Insurance and Symetra Financial and as Managing Director of Whittington Gray Associates.
Other Officers
James E. Davey (1964) President and Chief Executive Officer since 2010(2)
Mr. Davey serves as Executive Vice President of HLIC. Additionally, Mr. Davey serves as President, Chief Executive Officer and Manager of HIFSCO and President, Chief Executive Officer and Manager of HL Investment Advisors, LLC (“HL Advisors”). Mr. Davey joined The Hartford in 2002.
(2) Mr. Davey became an Interested Director effective August 2, 2012.
Mark A. Annoni (1964) Vice President, Controller and Treasurer since 2012(3)
Mr. Annoni serves as the Assistant Vice President and Director of Investment Finance (February 2004 to present). Mr. Annoni joined The Hartford in April 2001 as part of The Hartford’s acquisition of Fortis Financial Group. Prior to joining The Hartford, Mr. Annoni served as Manager of Mutual Fund Accounting at Fortis Financial Group (July 1997 to April 2001).
(3) Mr. Annoni was named Vice President, Controller and Treasurer on May 8, 2012.
Michael R. Dressen (1963) AML Compliance Officer since 2011
Mr. Dressen currently serves as Assistant Vice President of HLIC. He also serves as Chief Compliance Officer and AML Compliance Officer of Hartford Administrative Services Company (“HASCO”) and as Assistant Secretary and Compliance Officer of HIFSCO. Mr Dressen joined The Hartford in 2005 from State Farm Insurance Companies where he held various positions related to mutual funds, variable products, and property casualty insurance.
Tamara L. Fagely (1958) Vice President, since 2002 (HSF) and 1993 (HSF2)(4)
Ms. Fagely has been a Vice President of HASCO since 1998 and Chief Financial Officer since 2006. Currently Ms. Fagely is a Vice President of HLIC. She served as Assistant Vice President of HLIC from December 2001 through March 2005. In addition, Ms. Fagely is Controller and Chief Financial Officer of HIFSCO.
(4) Ms. Fagely served as Vice President, Controller and Treasurer until May 8, 2012.
Dr. Robert J. Froehlich (1953) Senior Managing Director since 2009(5)
Dr. Froehlich joined The Hartford as Senior Managing Director in September 2009. Prior to joining The Hartford, Dr. Froehlich served as Vice Chairman of Deutsche Asset Management from 1997-2009.
(5) Dr. Froehlich served as Senior Managing Director until March 26, 2012.
| 43 |
| Hartford Total Return Bond HLS Fund |
| Directors and Officers (Unaudited) – (continued) |
Edward P. Macdonald (1967) Vice President, Secretary and Chief Legal Officer since 2005
Mr. Macdonald serves as Vice President of HLIC and Chief Legal Officer of Mutual Funds and Vice President of HIFSCO. He also serves as Vice President and Secretary of HASCO, and Chief Legal Officer, Secretary and Vice President of HL Advisors. Mr. Macdonald joined The Hartford in 2005.
Vernon J. Meyer (1964) Vice President since 2006
Mr. Meyer serves as Senior Vice President of HLIC. He also serves as Senior Vice President of HIFSCO and HL Advisors. Mr. Meyer joined The Hartford in 2004.
Colleen B. Pernerewski (1969) Vice President and Chief Compliance Officer since 2010
Ms. Pernerewski serves as Vice President and Chief Investment Advisor Compliance Officer of HIFSCO and as Vice President and Chief Compliance Officer of HL Advisors. Ms. Pernerewski serves as Vice President and Chief Compliance Officer of Individual Annuity of HLIC. Ms. Pernerewski joined The Hartford in 2005 from Travelers Life and Annuity where she served as Counsel (2004-2005). Prior to Travelers Life and Annuity, Ms. Pernerewski held the position of Counsel at The Hartford (1998-2004).
Elizabeth L. Schroeder (1966) Vice President since 2010
Ms. Schroeder currently serves as Assistant Vice President of HLIC. Ms. Schroeder joined HLIC in 1991. She is also an Assistant Vice President of HASCO, HIFSCO and HL Advisors.
Martin Swanson (1962) Vice President since 2010
Mr. Swanson is a Vice President of HLIC. Mr. Swanson also serves as Vice President/Marketing for HIFSCO. Prior to joining HLIC in 1998, Mr. Swanson was a Vice President at PaineWebber, Inc.
Jane Wolak (1961) Vice President since 2009
Ms. Wolak currently serves as Senior Vice President of HLIC. Ms. Wolak joined HLIC as Vice President, Retail Product Services in May 2007. She is also Vice President of HASCO. Previously, Ms. Wolak was with Sun Life Financial where she held the position of Vice President, Service Center Operations from 2001-2007.
HOW TO OBTAIN A COPY OF THE FUND’S PROXY VOTING POLICIES AND VOTING RECORDS (UNAUDITED)
A description of the policies and procedures that the Fund uses to determine how to vote proxies relating to portfolio securities and a record of how the Fund voted any proxies for the twelve-month period ended June 30, 2012 are available (1) without charge, upon request, by calling 800-862-6668 and (2) on the SEC’s website at http://www.sec.gov.
QUARTERLY PORTFOLIO HOLDINGS INFORMATION (UNAUDITED)
The Fund files a complete schedule of portfolio holdings with the SEC for the first and third quarters of each fiscal year on Form N-Q. The Fund’s Forms are available (1) without charge, upon request, by calling 800-862-6668 and (2) on the SEC’s website at http://www.sec.gov. The Form N-Q may be reviewed and copied at the SEC’s Public Reference Room in Washington, DC. Information on the operation of the Public Reference Room may be obtained by calling 1-800-SEC-0330.
| 44 |
| Hartford Total Return Bond HLS Fund |
| Expense Example (Unaudited) |
Your Fund's Expenses
As a shareholder of the Fund, you incur two types of costs: (1) transaction costs and (2) ongoing costs including investment management fees, distribution fees, and other fund expenses. This example is intended to help you understand your ongoing costs (in dollars) of investing in the Fund and to compare these costs with the ongoing costs of investing in other mutual funds. The example is based on an investment of $1,000 invested at the beginning of the period and held for the period of December 31, 2011 through June 30, 2012.
Actual Expenses
The first set of columns of the table below provides information about actual account values and actual expenses. You may use the information in this column, together with the amount you invested, to estimate the expenses that you paid over the period. Simply divide your account value by $1,000 (for example, an $8,600 account value divided by $1,000 = 8.6), then multiply the result by the number in the line under the heading entitled “Expenses Paid During Period” to estimate the expenses you paid on your account during this period.
Hypothetical Example for Comparison Purposes
The second set of columns of the table below provides information about hypothetical account values and hypothetical expenses based on the Fund’s actual expense ratio and an assumed rate of return of 5% per year before expenses, which is not the Fund’s actual return. The hypothetical account values and expenses may not be used to estimate the actual ending account balance or expenses you paid for the period. You may use this information to compare the ongoing costs of investing in the Fund and other funds. To do so, compare this 5% hypothetical example with the 5% hypothetical examples that appear in the shareholder reports of the other funds.
Please note that the expenses shown in the table are meant to highlight your ongoing costs only and do not reflect any transactional costs, such as sales charges (loads) and CDSC. Therefore, the second set of columns of the table is useful in comparing ongoing costs only, and will not help you determine the relative total costs of owning different funds. In addition, if these transactional costs were included, your costs would be higher. Expenses are equal to the Fund's annualized expense ratios multiplied by average account value over the period, multiplied by 182/366 (to reflect the one-half year period).
| Actual return | Hypothetical (5% return before expenses) | |||||||||||||||||||||||||||||||||||
| Beginning Account Value December 31, 2011 | Ending Account Value June 30, 2012 | Expenses paid during the period December 31, 2011 through June 30, 2012 | Beginning Account Value December 31, 2011 | Ending Account Value June 30, 2012 | Expenses paid during the period December 31, 2011 through June 30, 2012 | Annualized expense ratio | Days in the current 1/2 year | Days in the full year | ||||||||||||||||||||||||||||
| Class IA | $ | 1,000.00 | $ | 1,035.20 | $ | 2.53 | $ | 1,000.00 | $ | 1,022.38 | $ | 2.51 | 0.50 | % | 182 | 366 | ||||||||||||||||||||
| Class IB | $ | 1,000.00 | $ | 1,033.91 | $ | 3.79 | $ | 1,000.00 | $ | 1,021.13 | $ | 3.77 | 0.75 | % | 182 | 366 | ||||||||||||||||||||
| 45 |
HARTFORD HLS FUNDS
c/o The Hartford Wealth Management - Global Annuities
P.O. Box 14293
Lexington, KY 40512-4293
Hartford Series Fund, Inc. is underwritten and distributed by Hartford Securities Distribution Company, Inc.
"The Hartford" is The Hartford Financial Services Group, Inc. and its subsidiaries.
Hartford Series Fund, Inc. inception dates range from 1977 to date. Hartford Series Fund, Inc. is not a subsidiary of The Hartford but is underwritten, distributed by and advised by subsidiaries of The Hartford. Investments in Hartford Series Fund, Inc. are not guaranteed by The Hartford or any other entity.
You should carefully consider investment objectives, risks, and charges and expenses of Hartford HLS Funds before investing. This and other information can be found in the Fund’s prospectus or summary prospectus, which can be obtained by calling 800-862-6668. Please read them carefully before you invest or send money.
| HLSSAR-TRB12 8-12 111647 Printed in U.S.A ©2012 The Hartford, Hartford, CT 06115 | |

A MESSAGE FROM THE PRESIDENT
Dear Fellow Shareholders:
I want to take this opportunity to say thank you for investing in the Hartford HLS Funds. We’ve seen continued market volatility throughout the first half of 2012, and there will likely be continued uncertainty until the Presidential election in November, but we are still optimistic about the markets in 2012.
Market Review
In the first quarter of 2012, the S&P 500 Index turned in its best quarterly performance since the third quarter of 2009. U.S. equities showed signs of improvement as investors focused on improving economic data and strong corporate earnings news and the Federal Reserve’s pledge to keep interest rates low buoyed investors’ appetites.
The second quarter ended on a high note for the stock market—the S&P 500 had its strongest June in more than a decade and the Dow Jones Industrial Average had its best month since October—but those gains weren’t enough to offset losses from April and May, and equities finished the quarter in the red. Although the S&P 500 was -2.75 for the second quarter, it was up 9.49% for the first half of 2012.
Concerns about domestic and European unemployment are having an effect on our economy. The unemployment rate in the euro zone's 17 nations rose to a record 11.1% in May, the highest level since the euro launched as a common currency more than 10 years ago. In the U.S., the labor market has been fickle this year, with job growth starting off strong in the first couple months of 2012 but slowing down in the spring, which has led many to wonder about the status of the economic recovery.
On a positive note, home prices are rising again after falling for more than five years, new and existing home sales are increasing, and home builders are ramping up construction.
The Hartford HLS Funds Expands Relationship with Wellington Management
We’re very pleased that we are expanding our relationship with Wellington Management, which will now serve as the primary sub-adviser for the Hartford HLS Funds including equity, fixed-income,* and asset-allocation funds. One of America’s oldest and largest investment management firms, Wellington Management has resources that span the entire globe, with multiple offices across the U.S. and numerous offices abroad. Wellington Management’s most distinctive strength is its proprietary research, which is shared across the entire organization.
We believe that aligning more closely with a well-respected money manager like Wellington Management puts us in a strong position to drive significant growth and to continue delivering innovative fund strategies to help our investors meet their financial goals.
Thank you again for investing with the Hartford HLS Funds.
James Davey
President
Hartford HLS Funds
*Several fixed-income funds will continue to be sub-advised by Hartford Investment Management Company.
Table of Contents
This report is prepared for the general information of contract owners and qualified retirement plan participants. It is not an offer of contracts or of qualified retirement plans. It should not be used in connection with any offer, except in conjunction with the appropriate product prospectus which contains all pertinent information including the applicable sales, administrative and other charges.
The views expressed in the Fund’s Manager Discussion under ‘‘Why did the Fund perform this way?’’ and ‘‘What is the outlook?’’ are views of the Fund’s sub-adviser and portfolio management team through the end of the period and are subject to change based on market and other conditions.
| Hartford Value HLS Fund inception 04/30/2001 | |
| (sub-advised by Wellington Management Company, LLP) | |
| Investment objective – Seeks long-term total return. | |
Performance Overview 6/30/02 - 6/30/12
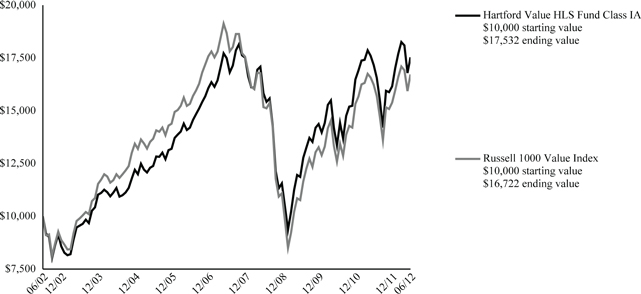
The chart above shows the growth of a $10,000 investment in Class 1A. Growth results in classes other that Class 1A will vary from what is seen above due to differences in the expenses charged to those share classes.
| Average Annual Total Returns (as of 6/30/12) |
| 6 Month† | 1 Year | 5 year | 10 year | |||||||||||||
| Value IA | 8.49 | % | 2.11 | % | 0.05 | % | 5.77 | % | ||||||||
| Value IB | 8.35 | % | 1.85 | % | -0.20 | % | 5.51 | % | ||||||||
| Russell 1000 Value Index | 8.68 | % | 3.01 | % | -2.19 | % | 5.28 | % | ||||||||
| † | Not Annualized |
PAST PERFORMANCE IS NOT INDICATIVE OF FUTURE RESULTS.
Total returns presented above were calculated using the Fund's net asset value available to shareholders for sale or redemption of Fund shares on June 30, 2012, which may exclude investment transactions as of this date.
Russell 1000 Value Index is an unmanaged index measuring the performance of those Russell 1000 Index companies with lower price-to-book ratios and lower forecasted growth values. (The Russell 1000 Index is an unmanaged index that measures the performance of the 1,000 largest companies in the Russell 3000 Index, which measures the performance of the 3,000 largest U.S. companies, based on total market capitalizations.)
You cannot invest directly in an index.
The chart represents a hypothetical investment in the Fund. Performance data represents past performance and current performance could be higher or lower.
Performance information may reflect historical or current expense waivers/reimbursements from the investment adviser, without which performance would have been lower. For information on current expense waivers/reimbursements, please see the prospectus.
The value of the Fund will fluctuate so that when redeemed, it may be worth more or less than the original investment. The chart and table do not reflect the deductions of taxes, sales charges or other fees which may be applied at the variable life insurance, variable annuity or qualified retirement plan product level. Any such additional sales charges or other fees or expenses would lower the contract’s or plan’s performance.
| 2 |
| Hartford Value HLS Fund |
| Manager Discussion |
| June 30, 2012 (Unaudited) |
| Portfolio Managers | ||
| Karen H. Grimes, CFA | W. Michael Reckmeyer, III, CFA | Ian R. Link, CFA |
| Senior Vice President and Equity Portfolio Manager | Senior Vice President and Equity Portfolio Manager | Director and Equity Portfolio Manager |
How did the Fund perform?
The Class IA shares of the Hartford Value HLS Fund returned 8.49% for the six-month period ended June 30, 2012, underperforming the benchmark, the Russell 1000 Value Index, which returned 8.68% for the same period. The Fund outperformed the 7.31% return of the average fund in the Lipper Large Cap Value VP-UF Funds peer group, a group of funds with investment strategies similar to those of the Fund.
Why did the Fund perform this way?
The first and second quarters of 2012 were near mirror images of one another in terms of what worked and what did not. U.S. equities rallied at the start of the year based on improving macroeconomic data, including lower unemployment levels and improving consumer confidence. Following a strong first quarter, equities retreated in April, fell sharply in May, and recovered modestly in June. Fears surrounding European sovereign debt difficulties reclaimed center stage.
Nine of the ten sectors within the Russell 1000 Value Index posted positive returns during the period. Telecommunication Services (+17%), Consumer Discretionary (+15%), and Financials (+13%) gained the most while Energy (-2%) was the one sector to decline during the period.
The Fund’s underperformance versus its benchmark was primarily due to weak stock selection within Financials. Sector allocation positioning, a by-product of our stock-by-stock decisions, also hindered the Fund’s relative returns: an underweight (i.e. the Fund’s sector position was less than the benchmark position) to the Telecommunication Services sector and an overweight to the Materials sector both were headwinds for the Fund during the period. On the other hand, favorable stock selection decisions within the Consumer Staples, Health Care, Materials, and Industrials sectors partially made up for the shortfalls elsewhere.
Holding Occidental Petroleum (Energy) and Unum Group (Financials) detracted most from benchmark-relative returns during the period. Shares of Occidental Petroleum, an oil and gas company, fell during the period due to falling oil prices. However, the company’s management highlighted an improving growth outlook in California and the Permian regions with some of the highest reinvestment returns in the business. Benefits insurer Unum Group declined as investors worried about the effect of low interest rates on reserve adequacy, particularly for long-term care business. Unum’s Chief Executive Officer noted at a conference that sales of new policies were at the low-end of forecasts, given slow employment growth and a cautious customer base. Walt Disney (Consumer Discretionary) is a diversified worldwide entertainment company operating in five segments: Media Networks, Parks & Resorts, Studio Entertainment, Consumer Products, and Interactive Media. Disney reported strong results with Parks & Resorts and Broadcasting both exceeding expectations. Not holding Disney hindered relative results during the period. Cisco Systems, Citigroup, and International Paper were among the top detractors from absolute (i.e. total return) performance.
Among the top contributors to benchmark-relative returns were Comcast (Consumer Discretionary) and Ingersoll-Rand (Industrials). Comcast is the largest U.S. cable communications company and the new owner of NBC Universal. Shares moved higher after the company posted strong earnings and announced stock buybacks and a dividend increase. Ingersoll-Rand provides industrial machinery, climate control systems, and security products. Shares outperformed during the period after residential markets strengthened and the company beat consensus earnings estimates. The Fund’s relative performance also benefited by not holding Procter & Gamble (Consumer Staples), a component of the benchmark that declined during the period. Procter & Gamble is a provider of consumer packaged goods. Shares were down during the period and underperformed the broader market. Top absolute contributors also included Wells Fargo and AT&T.
What is the outlook?
Global expansion continues to face a growing list of risks, including sovereign debt contagion in Europe as well as major looming fiscal problems in the U.S. Despite these macroeconomic headwinds, we believe corporate earnings remain favorable. In our view, robust balance sheets continue to be capable of supporting both investment and the return of capital to shareholders.
Within the context of these countervailing forces, we believe that global growth will continue at a muted and perhaps volatile pace. This thinking factors into our evaluation of all companies - those we hold and those we consider for
| 3 |
| Hartford Value HLS Fund |
| Manager Discussion – (continued) |
| June 30, 2012 (Unaudited) |
purchase. We remain focused on company-level fundamentals, which, as noted above, remain solid in many areas of the market.
Based on bottom-up stock decisions, we ended the period most overweight in the Consumer Discretionary, Information Technology, and Materials sectors relative to the Russell 1000 Value Index and our largest underweights were in the Energy, Utilities, and Financials sectors.
Diversification by Industry
as of June 30, 2012
| Industry (Sector) | Percentage of Net Assets | |||
| Automobiles & Components (Consumer Discretionary) | 0.8 | % | ||
| Banks (Financials) | 7.2 | |||
| Capital Goods (Industrials) | 10.8 | |||
| Consumer Durables & Apparel (Consumer Discretionary) | 1.6 | |||
| Diversified Financials (Financials) | 7.9 | |||
| Energy (Energy) | 12.8 | |||
| Food & Staples Retailing (Consumer Staples) | 1.6 | |||
| Food, Beverage & Tobacco (Consumer Staples) | 6.5 | |||
| Health Care Equipment & Services (Health Care) | 5.9 | |||
| Insurance (Financials) | 7.8 | |||
| Materials (Materials) | 5.7 | |||
| Media (Consumer Discretionary) | 3.6 | |||
| Pharmaceuticals, Biotechnology & Life Sciences (Health Care) | 7.4 | |||
| Retailing (Consumer Discretionary) | 5.0 | |||
| Semiconductors & Semiconductor Equipment (Information Technology) | 4.7 | |||
| Software & Services (Information Technology) | 1.4 | |||
| Technology Hardware & Equipment (Information Technology) | 2.6 | |||
| Telecommunication Services (Services) | 2.6 | |||
| Utilities (Utilities) | 3.8 | |||
| Short-Term Investments | 0.5 | |||
| Other Assets and Liabilities | (0.2 | ) | ||
| Total | 100.0 | % | ||
| 4 |
| Hartford Value HLS Fund |
| Schedule of Investments |
| June 30, 2012 (Unaudited) |
| (000’s Omitted) |
| Shares or Principal Amount | Market Value ╪ | |||||||
| COMMON STOCKS - 99.7% | ||||||||
| Automobiles & Components - 0.8% | ||||||||
| 85 | General Motors Co. ● | $ | 1,671 | |||||
| 306 | Goodyear Tire & Rubber Co. ● | 3,617 | ||||||
| 5,288 | ||||||||
| Banks - 7.2% | ||||||||
| 295 | BB&T Corp. | 9,094 | ||||||
| 226 | PNC Financial Services Group, Inc. | 13,840 | ||||||
| 784 | Wells Fargo & Co. | 26,211 | ||||||
| 49,145 | ||||||||
| Capital Goods - 10.8% | ||||||||
| 80 | 3M Co. | 7,165 | ||||||
| 88 | Boeing Co. | 6,553 | ||||||
| 109 | Eaton Corp. | 4,320 | ||||||
| 845 | General Electric Co. | 17,601 | ||||||
| 133 | Illinois Tool Works, Inc. | 7,038 | ||||||
| 221 | Ingersoll-Rand plc | 9,331 | ||||||
| 113 | PACCAR, Inc. | 4,414 | ||||||
| 120 | Stanley Black & Decker, Inc. | 7,700 | ||||||
| 183 | Tyco International Ltd. | 9,658 | ||||||
| 73,780 | ||||||||
| Consumer Durables & Apparel - 1.6% | ||||||||
| 230 | Mattel, Inc. | 7,476 | ||||||
| 198 | Newell Rubbermaid, Inc. | 3,588 | ||||||
| 11,064 | ||||||||
| Diversified Financials - 7.9% | ||||||||
| 136 | Ameriprise Financial, Inc. | 7,116 | ||||||
| 52 | BlackRock, Inc. | 8,853 | ||||||
| 188 | Citigroup, Inc. | 5,164 | ||||||
| 153 | Credit Suisse Group ADR | 2,804 | ||||||
| 79 | Goldman Sachs Group, Inc. | 7,607 | ||||||
| 632 | JP Morgan Chase & Co. | 22,591 | ||||||
| 230 | Solar Cayman Ltd. ⌂■●† | 21 | ||||||
| 54,156 | ||||||||
| Energy - 12.8% | ||||||||
| 52 | Apache Corp. | 4,596 | ||||||
| 124 | Baker Hughes, Inc. | 5,087 | ||||||
| 231 | Chevron Corp. | 24,387 | ||||||
| 40 | EOG Resources, Inc. | 3,619 | ||||||
| 198 | Exxon Mobil Corp. | 16,952 | ||||||
| 181 | Marathon Oil Corp. | 4,638 | ||||||
| 152 | Noble Corp. | 4,941 | ||||||
| 148 | Occidental Petroleum Corp. | 12,703 | ||||||
| 86 | Royal Dutch Shell plc ADR | 6,008 | ||||||
| 144 | Southwestern Energy Co. ● | 4,596 | ||||||
| 87,527 | ||||||||
| Food & Staples Retailing - 1.6% | ||||||||
| 227 | CVS Caremark Corp. | 10,584 | ||||||
| Food, Beverage & Tobacco - 6.5% | ||||||||
| 106 | Anheuser-Busch InBev N.V. | 8,414 | ||||||
| 177 | Archer Daniels Midland Co. | 5,230 | ||||||
| 140 | General Mills, Inc. | 5,403 | ||||||
| 173 | Kraft Foods, Inc. | 6,679 | ||||||
| 110 | PepsiCo, Inc. | 7,771 | ||||||
| 127 | Philip Morris International, Inc. | 11,051 | ||||||
| 44,548 | ||||||||
| Health Care Equipment & Services - 5.9% | ||||||||
| 110 | Baxter International, Inc. | 5,873 | ||||||
| 160 | Covidien plc | 8,572 | ||||||
| 160 | HCA Holdings, Inc. | 4,873 | ||||||
| 127 | St. Jude Medical, Inc. | 5,084 | ||||||
| 192 | UnitedHealth Group, Inc. | 11,207 | ||||||
| 72 | Zimmer Holdings, Inc. | 4,644 | ||||||
| 40,253 | ||||||||
| Insurance - 7.8% | ||||||||
| 203 | ACE Ltd. | 15,012 | ||||||
| 117 | Chubb Corp. | 8,501 | ||||||
| 338 | Marsh & McLennan Cos., Inc. | 10,908 | ||||||
| 184 | Principal Financial Group, Inc. | 4,816 | ||||||
| 99 | Swiss Re Ltd. | 6,219 | ||||||
| 386 | Unum Group | 7,386 | ||||||
| 52,842 | ||||||||
| Materials - 5.7% | ||||||||
| 226 | Dow Chemical Co. | 7,103 | ||||||
| 128 | E.I. DuPont de Nemours & Co. | 6,471 | ||||||
| 180 | International Paper Co. | 5,207 | ||||||
| 133 | Mosaic Co. | 7,274 | ||||||
| 81 | Nucor Corp. | 3,066 | ||||||
| 532 | Rexam plc | 3,511 | ||||||
| 55 | Rexam plc ADR | 1,813 | ||||||
| 372 | Steel Dynamics, Inc. | 4,368 | ||||||
| 38,813 | ||||||||
| Media - 3.6% | ||||||||
| 126 | CBS Corp. Class B | 4,127 | ||||||
| 429 | Comcast Corp. Class A | 13,707 | ||||||
| 239 | Thomson Reuters Corp. | 6,791 | ||||||
| 24,625 | ||||||||
| Pharmaceuticals, Biotechnology & Life Sciences - 7.4% | ||||||||
| 102 | Amgen, Inc. | 7,483 | ||||||
| 100 | Johnson & Johnson | 6,745 | ||||||
| 347 | Merck & Co., Inc. | 14,473 | ||||||
| 660 | Pfizer, Inc. | 15,186 | ||||||
| 170 | Teva Pharmaceutical Industries Ltd. ADR | 6,686 | ||||||
| 50,573 | ||||||||
| Retailing - 5.0% | ||||||||
| 3,040 | Buck Holdings L.P. ⌂●† | 5,538 | ||||||
| 188 | Home Depot, Inc. | 9,968 | ||||||
| 150 | Kohl's Corp. | 6,831 | ||||||
| 209 | Lowe's Co., Inc. | 5,941 | ||||||
| 110 | Nordstrom, Inc. | 5,472 | ||||||
| 33,750 | ||||||||
| Semiconductors & Semiconductor Equipment - 4.7% | ||||||||
| 191 | Analog Devices, Inc. | 7,201 | ||||||
| 444 | Intel Corp. | 11,825 | ||||||
| 225 | Maxim Integrated Products, Inc. | 5,778 | ||||||
| 225 | Xilinx, Inc. | 7,554 | ||||||
| 32,358 | ||||||||
| Software & Services - 1.4% | ||||||||
| 313 | Microsoft Corp. | 9,586 | ||||||
| Technology Hardware & Equipment - 2.6% | ||||||||
| 853 | Cisco Systems, Inc. | 14,645 | ||||||
| 159 | Hewlett-Packard Co. | 3,197 | ||||||
| 17,842 | ||||||||
| Telecommunication Services - 2.6% | ||||||||
| 489 | AT&T, Inc. | 17,451 | ||||||
| Utilities - 3.8% | ||||||||
| 148 | Edison International | 6,852 | ||||||
| 5 |
| Hartford Value HLS Fund |
| Schedule of Investments – (continued) |
| June 30, 2012 (Unaudited) |
| (000’s Omitted) |
| Shares or Principal Amount | Market Value ╪ | |||||||||||
| COMMON STOCKS - 99.7% - (continued) | ||||||||||||
| Utilities - 3.8% - (continued) | ||||||||||||
| 87 | Entergy Corp. | $ | 5,913 | |||||||||
| 54 | NextEra Energy, Inc. | 3,721 | ||||||||||
| 180 | Northeast Utilities | 6,996 | ||||||||||
| 81 | PPL Corp. | 2,246 | ||||||||||
| 25,728 | ||||||||||||
| Total common stocks | ||||||||||||
| (cost $590,540) | $ | 679,913 | ||||||||||
| Total long-term investments | ||||||||||||
| (cost $590,540) | $ | 679,913 | ||||||||||
| SHORT-TERM INVESTMENTS - 0.5% | ||||||||||||
| Repurchase Agreements - 0.5% | ||||||||||||
| Bank of America Merrill Lynch TriParty Joint Repurchase Agreement (maturing on 07/02/2012 in the amount of $1,962, collateralized by FHLMC 5.50% - 6.50%, 2035 - 2036, FNMA 5.00% - 6.00%, 2033 - 2039, value of $2,001) | ||||||||||||
| $ | 1,962 | 0.13%, 06/29/2012 | $ | 1,962 | ||||||||
| Barclays Capital TriParty Joint Repurchase Agreement (maturing on 07/02/2012 in the amount of $709, collateralized by U.S. Treasury Note 1.25% - 3.63%, 2014 - 2020, value of $723) | ||||||||||||
| 709 | 0.15%, 06/29/2012 | 709 | ||||||||||
| Deutsche Bank Securities TriParty Joint Repurchase Agreement (maturing on 07/02/2012 in the amount of $190, collateralized by U.S. Treasury Note 0.88%, 2016, value of $194) | ||||||||||||
| 190 | 0.20%, 06/29/2012 | 190 | ||||||||||
| TD Securities TriParty Joint Repurchase Agreement (maturing on 07/02/2012 in the amount of $556, collateralized by FHLMC 4.00% - 6.00%, 2027 - 2041, FNMA 4.00% - 4.50%, 2025 - 2042, U.S. Treasury Bond 6.38%, 2027, U.S. Treasury Note 0.38% - 8.75%, 2012 - 2017, value of $566) | ||||||||||||
| 556 | 0.15%, 06/29/2012 | 556 | ||||||||||
| UBS Securities, Inc. Joint Repurchase Agreement (maturing on 07/02/2012 in the amount of $-, collateralized by U.S. Treasury Note 1.00%, 2013, value of $-) | ||||||||||||
| — | 0.13%, 06/29/2012 | — | ||||||||||
| UBS Securities, Inc. TriParty Joint Repurchase Agreement (maturing on 07/02/2012 in the amount of $250, collateralized by GNMA 4.00%, 2042, value of $255) | ||||||||||||
| 250 | 0.20%, 06/29/2012 | 250 | ||||||||||
| 3,667 | ||||||||||||
| Total short-term investments | ||||||||||||
| (cost $3,667) | $ | 3,667 | ||||||||||
| Total investments | ||||||||||||
| (cost $594,207) ▲ | 100.2 | % | $ | 683,580 | ||||||||
| Other assets and liabilities | (0.2 | )% | (1,447 | ) | ||||||||
| Total net assets | 100.0 | % | $ | 682,133 | ||||||||
The accompanying notes are an integral part of these financial statements.
| 6 |
| Note: | Percentage of investments as shown is the ratio of the total market value to total net assets. |
Prices of foreign equities that are principally traded on certain foreign markets may be adjusted daily pursuant to a fair value pricing service approved by the Board of Directors in order to reflect an adjustment for factors occurring after the close of certain foreign markets but before the close of the New York Stock Exchange.
| ▲ | At June 30, 2012, the cost of securities for federal income tax purposes was $601,574 and the aggregate gross unrealized appreciation and depreciation based on that cost were: |
| Unrealized Appreciation | $ | 121,890 | ||
| Unrealized Depreciation | (39,884 | ) | ||
| Net Unrealized Appreciation | $ | 82,006 |
| † | These securities were valued in good faith at fair value as determined under policies and procedures established by and under the supervision of the Company's Board of Directors. At June 30, 2012, the aggregate value of these securities was $5,559, which represents 0.8% of total net assets. This amount excludes securities that are principally traded in certain foreign markets and whose prices are adjusted pursuant to a third party pricing service methodology approved by the Board of Directors. |
| ● | Non-income producing. |
| ■ | Securities issued within terms of a private placement memorandum, exempt from registration under Rule 144A under the Securities Act of 1933, as amended, and may be sold only to qualified institutional buyers. Unless otherwise indicated, these issues are determined to be liquid. At June 30, 2012, the aggregate value of these securities was $21, which rounds to zero percent of total net assets. |
| ⌂ | The following securities are considered illiquid. Illiquid securities are often purchased in private placement transactions, are often not registered under the Securities Act of 1933 and may have contractual restrictions on resale. A security may also be considered illiquid if the security lacks a readily available market or if its valuation has not changed for a certain period of time. |
| Period Acquired | Shares/ Par | Security | Cost Basis | |||||||
| 06/2007 | 3,040 | Buck Holdings L.P. | 1,119 | |||||||
| 03/2007 | 230 | Solar Cayman Ltd. - 144A | 67 | |||||||
At June 30, 2012, the aggregate value of these securities was $5,559, which represents 0.8% of total net assets.
| ╪ | See Significant Accounting Policies of accompanying Notes to Financial Statements regarding valuation of securities. |
| GLOSSARY: (abbreviations used in preceding Schedule of Investments) | |
| Other Abbreviations: | |
| ADR | American Depositary Receipt |
| FHLMC | Federal Home Loan Mortgage Corp. |
| FNMA | Federal National Mortgage Association |
| GNMA | Government National Mortgage Association |
The accompanying notes are an integral part of these financial statements.
| 7 |
| Hartford Value HLS Fund |
| Investment Valuation Hierarchy Level Summary |
| June 30, 2012 (Unaudited) |
| (000’s Omitted) |
| Total | Level 1 ♦ | Level 2 ♦ | Level 3 | |||||||||||||
| Assets: | ||||||||||||||||
| Common Stocks ‡ | $ | 679,913 | $ | 664,624 | $ | 9,730 | $ | 5,559 | ||||||||
| Short-Term Investments | 3,667 | – | 3,667 | – | ||||||||||||
| Total | $ | 683,580 | $ | 664,624 | $ | 13,397 | $ | 5,559 | ||||||||
| ♦ | For the six-month period ended June 30, 2012, there were no transfers between Level 1 and Level 2. |
| ‡ | The Fund has all or primarily all of the equity securities categorized in a particular level. Refer to the Schedule of Investments for further industry breakout. |
Following is a reconciliation of Level 3 assets for which significant unobservable inputs were used to determine fair value:
| Balance as of December 31, 2011 | Realized Gain (Loss) | Change in Unrealized Appreciation (Depreciation) | Net Amortization | Purchases | Sales | Transfers Into Level 3 | Transfers Out of Level 3 | Balance as of June 30, 2012 | ||||||||||||||||||||||||||||
| Assets: | ||||||||||||||||||||||||||||||||||||
| Common Stocks | $ | 6,825 | $ | 2,433 | $ | (584 | )* | $ | — | $ | — | $ | (3,115 | ) | $ | — | $ | — | $ | 5,559 | ||||||||||||||||
| Total | $ | 6,825 | $ | 2,433 | $ | (584 | ) | $ | — | $ | — | $ | (3,115 | ) | $ | — | $ | — | $ | 5,559 | ||||||||||||||||
| * | Change in unrealized appreciation (depreciation) in the current period relating to assets still held at June 30, 2012 was $(584). |
The accompanying notes are an integral part of these financial statements.
| 8 |
| Hartford Value HLS Fund |
| Statement of Assets and Liabilities |
| June 30, 2012 (Unaudited) |
| (000’s Omitted) |
| Assets: | ||||
| Investments in securities, at market value (cost $594,207) | $ | 683,580 | ||
| Cash | — | |||
| Receivables: | ||||
| Investment securities sold | 3,313 | |||
| Fund shares sold | 57 | |||
| Dividends and interest | 1,059 | |||
| Other assets | 6 | |||
| Total assets | 688,015 | |||
| Liabilities: | ||||
| Payables: | ||||
| Investment securities purchased | 4,633 | |||
| Fund shares redeemed | 1,132 | |||
| Investment management fees | 67 | |||
| Distribution fees | 3 | |||
| Accrued expenses | 47 | |||
| Total liabilities | 5,882 | |||
| Net assets | $ | 682,133 | ||
| Summary of Net Assets: | ||||
| Capital stock and paid-in-capital | $ | 745,110 | ||
| Undistributed net investment income | 7,999 | |||
| Accumulated net realized loss | (160,349 | ) | ||
| Unrealized appreciation of investments | 89,373 | |||
| Net assets | $ | 682,133 | ||
| Shares authorized | 800,000 | |||
| Par value | $ | 0.001 | ||
| Class IA: Net asset value per share | $ | 11.25 | ||
| Shares outstanding | 51,073 | |||
| Net assets | $ | 574,548 | ||
| Class IB: Net asset value per share | $ | 11.22 | ||
| Shares outstanding | 9,585 | |||
| Net assets | $ | 107,585 |
The accompanying notes are an integral part of these financial statements.
| 9 |
| Hartford Value HLS Fund |
| Statement of Operations |
| For the Six-Month Period Ended June 30, 2012 (Unaudited) |
| (000’s Omitted) |
| Investment Income: | ||||
| Dividends | $ | 10,117 | ||
| Interest | 3 | |||
| Less: Foreign tax withheld | (85 | ) | ||
| Total investment income, net | 10,035 | |||
| Expenses: | ||||
| Investment management fees | 2,583 | |||
| Distribution fees - Class IB | 141 | |||
| Custodian fees | 4 | |||
| Accounting services fees | 36 | |||
| Board of Directors' fees | 9 | |||
| Audit fees | 7 | |||
| Other expenses | 59 | |||
| Total expenses (before fees paid indirectly) | 2,839 | |||
| Commission recapture | (7 | ) | ||
| Total fees paid indirectly | (7 | ) | ||
| Total expenses, net | 2,832 | |||
| Net investment income | 7,203 | |||
| Net Realized Gain on Investments and Foreign Currency Transactions: | ||||
| Net realized gain on investments | 17,024 | |||
| Net realized loss on foreign currency contracts | (4 | ) | ||
| Net realized loss on other foreign currency transactions | (1 | ) | ||
| Net Realized Gain on Investments and Foreign Currency Transactions | 17,019 | |||
| Net Changes in Unrealized Appreciation of Investments: | ||||
| Net unrealized appreciation of investments | 34,984 | |||
| Net Changes in Unrealized Appreciation of Investments | 34,984 | |||
| Net Gain on Investments and Foreign Currency Transactions | 52,003 | |||
| Net Increase in Net Assets Resulting from Operations | $ | 59,206 |
The accompanying notes are an integral part of these financial statements.
| 10 |
| Hartford Value HLS Fund |
| Statement of Changes in Net Assets |
| (000’s Omitted) |
| For the Six-Month Period Ended June 30, 2012 (Unaudited) | For the Year Ended December 31, 2011 | |||||||
| Operations: | ||||||||
| Net investment income | $ | 7,203 | $ | 12,796 | ||||
| Net realized gain on investments and foreign currency transactions | 17,019 | 29,891 | ||||||
| Net unrealized appreciation (depreciation) of investments | 34,984 | (55,980 | ) | |||||
| Net Increase (Decrease) In Net Assets Resulting From Operations | 59,206 | (13,293 | ) | |||||
| Distributions to Shareholders: | ||||||||
| From net investment income | ||||||||
| Class IA | — | (10,698 | ) | |||||
| Class IB | — | (1,700 | ) | |||||
| Total distributions | — | (12,398 | ) | |||||
| Capital Share Transactions: | ||||||||
| Class IA | ||||||||
| Sold | 17,567 | 31,406 | ||||||
| Issued on reinvestment of distributions | — | 10,698 | ||||||
| Redeemed | (84,217 | ) | (170,093 | ) | ||||
| Total capital share transactions | (66,650 | ) | (127,989 | ) | ||||
| Class IB | ||||||||
| Sold | 5,785 | 12,495 | ||||||
| Issued on reinvestment of distributions | — | 1,700 | ||||||
| Redeemed | (18,972 | ) | (53,712 | ) | ||||
| Total capital share transactions | (13,187 | ) | (39,517 | ) | ||||
| Net decrease from capital share transactions | (79,837 | ) | (167,506 | ) | ||||
| Net Decrease In Net Assets | (20,631 | ) | (193,197 | ) | ||||
| Net Assets: | ||||||||
| Beginning of period | 702,764 | 895,961 | ||||||
| End of period | $ | 682,133 | $ | 702,764 | ||||
| Undistributed (distribution in excess of) net investment income | $ | 7,999 | $ | 796 | ||||
| Shares: | ||||||||
| Class IA | ||||||||
| Sold | 1,579 | 2,933 | ||||||
| Issued on reinvestment of distributions | — | 1,040 | ||||||
| Redeemed | (7,527 | ) | (15,762 | ) | ||||
| Total share activity | (5,948 | ) | (11,789 | ) | ||||
| Class IB | ||||||||
| Sold | 519 | 1,155 | ||||||
| Issued on reinvestment of distributions | — | 166 | ||||||
| Redeemed | (1,696 | ) | (4,943 | ) | ||||
| Total share activity | (1,177 | ) | (3,622 | ) | ||||
The accompanying notes are an integral part of these financial statements.
| 11 |
| Hartford Value HLS Fund |
| Notes to Financial Statements |
| June 30, 2012 (Unaudited) |
| (000’s Omitted) |
| 1. | Organization: |
Hartford Value HLS Fund (the “Fund”) serves as an underlying investment option for certain variable annuity and variable life insurance separate accounts of Hartford Life Insurance Company (“HLIC”) and its affiliates and certain qualified retirement plans. The Fund may also serve as an underlying investment option for certain variable annuity and variable life separate accounts of other insurance companies. Owners of variable annuity contracts and policyholders of variable life insurance contracts may choose the funds permitted in the variable insurance contract prospectus. In addition, participants in certain qualified retirement plans may choose the Fund if permitted by their plans.
Hartford Series Fund, Inc. (the “Company”) is an open-end registered management investment company comprised of thirty portfolios. Financial Statements for the Fund, a series of the Company, are included in this report.
The Company is organized under the laws of the State of Maryland and is registered with the Securities and Exchange Commission (“SEC”) under the Investment Company Act of 1940, as amended (“1940 Act”). The Fund is a diversified open-end management investment company.
The Fund is divided into Class IA and Class IB shares. Each class is offered at the per share net asset value (“NAV”) without a sales charge and is subject to the same expenses, except that the Class IB shares are subject to distribution and service fees charged pursuant to a Distribution Plan adopted in accordance with Rule 12b-1 under the 1940 Act.
| 2. | Significant Accounting Policies: |
The following is a summary of significant accounting policies of the Fund in the preparation of its financial statements, which are in accordance with the United States Generally Accepted Accounting Principles (“U.S. GAAP”). The preparation of financial statements in accordance with U.S. GAAP may require management to make estimates and assumptions that affect the reported amounts of assets and liabilities and disclosure of contingent assets and liabilities at the date of the financial statements and the reported amounts of increases and decreases in net assets from operations during the reporting period. Actual results could differ from those estimates.
| a) | Determination of Net Asset Value – The NAV of each class of the Fund’s shares is determined as of the close of regular trading (normally 4:00 p.m. Eastern Time) (the “NYSE Close”) on each day that the New York Stock Exchange (the “Exchange”) is open (“Valuation Date”). Information that becomes known to the Fund after the NAV has been calculated on a particular day will not generally be used to retroactively adjust the NAV determined earlier that day. |
| b) | Investment Valuation and Fair Value Measurements – For purposes of calculating the NAV, portfolio investments and other assets held by the Fund's portfolio for which market quotes are readily available are valued at market value. Market value is generally determined on the basis of last reported sales prices or official close price. If no sales are reported, market value is based on quotes obtained from a quotation reporting system, established market makers, or independent pricing services. If market prices are not readily available or are deemed unreliable, the Fund will use the fair value of the investment as determined in good faith under policies and procedures established by and under the supervision of the Company’s Board of Directors. Market quotes are considered not readily available where there is an absence of current or reliable market-based data (e.g., trade information or broker quotes), including where events occur after the close of the relevant market, but prior to the NYSE Close that materially affect the values of the Fund’s portfolio investments or assets. In addition, market quotes are considered not readily available when, due to extraordinary circumstances, the exchanges or markets on which the investments trade do not open for trading for the entire day and no other market prices are available. In addition, prices of foreign equities that are principally traded on certain foreign markets are adjusted daily pursuant to a fair value pricing service approved by the Board of Directors in order to reflect an adjustment for the factors occurring after the close of certain foreign markets but before the NYSE Close. Investments that are primarily traded on foreign markets may trade on days that are not business days of the Fund. The value of the foreign investments in which the Fund invests may change on days when a shareholder will not be able to purchase or redeem shares of the Fund. Fair value pricing is subjective in nature and the use of fair value pricing by the Fund may |
| 12 |
cause the NAV of its shares to differ significantly from the NAV that would have been calculated using market prices at the close of the exchange on which a portfolio investment is primarily traded. There can be no assurance that the Fund could obtain the fair market value assigned to an investment if the Fund were to sell the investment at approximately the time at which the Fund determines its NAV.
Investments valued in currencies other than U.S. dollars are converted to U.S. dollars using exchange rates obtained from independent pricing services for calculation of the NAV. As a result, the NAV of the Fund’s shares may be affected by changes in the value of currencies in relation to the U.S. dollar. The value of investments traded in markets outside the United States or denominated in currencies other than the U.S. dollar may be affected significantly on a day that the NYSE is closed and the market value may change on days when an investor is not able to purchase, redeem or exchange shares of the Fund.
Foreign currency contracts represent agreements to exchange currencies on specific future dates at predetermined rates. Foreign currency contracts are valued using foreign currency exchange rates and forward rates as provided by an independent pricing service on the Valuation Date.
Financial instruments for which prices are not available from an independent pricing service may be valued using market quotations obtained from one or more dealers that make markets in the respective financial instrument in accordance with procedures established by the Company’s Board of Directors.
U.S. GAAP defines fair value as the price that the Fund would receive to sell an asset or pay to transfer a liability in an orderly transaction between market participants. The U.S. GAAP fair value measurement standards require disclosure of a fair value hierarchy for each major category of assets and liabilities. Various inputs are used in determining the fair value of the Fund’s investments. These inputs are summarized into three broad hierarchy levels. This hierarchy is based on whether the valuation inputs are observable or unobservable. These levels are:
| · | Level 1 – Quoted prices in active markets for identical investments. Level 1 may include exchange traded instruments, such as domestic equities, some foreign equities, options, futures, mutual funds, exchange traded funds, rights and warrants. |
| · | Level 2 – Observable inputs other than Level 1 prices, such as quoted prices for similar investments; quoted prices in markets that are not active; or other inputs that are observable or can be corroborated by observable market data. Level 2 may include debt investments that are traded less frequently than exchange traded instruments and which are valued using independent pricing services; foreign equities, which are principally traded on certain foreign markets and are adjusted daily pursuant to a fair value pricing service in order to reflect an adjustment for the factors occurring after the close of certain foreign markets but before the NYSE Close; and short-term investments, which are valued at amortized cost. |
| · | Level 3 – Significant unobservable inputs that are supported by limited or no market activity. Level 3 may include financial instruments whose values are determined using indicative market quotes or require significant management judgment or estimation. These unobservable valuation inputs may include estimates for current yields, maturity/duration, prepayment speed, and indicative market quotes for comparable investments along with other assumptions relating to credit quality, collateral value, complexity of the investment structure, general market conditions and liquidity. This category may include investments where trading has been halted or there are certain restrictions on trading. While these investments are priced using unobservable inputs, the valuation of these investments reflects the best available data and management believes the prices are a reasonable representation of exit price. |
The Board of Directors of the Company generally reviews and approves the “Procedures for Valuation of Portfolio Securities” on an annual basis. These procedures define how investments are to be valued, including the formation of a Valuation Committee. The Valuation Committee is responsible for determining in good faith the fair value of investments when the value cannot be obtained from primary pricing services or alternative sources or if the valuation of an investment as provided by the primary pricing service or alternative source is
| 13 |
| Hartford Value HLS Fund |
| Notes to Financial Statements – (continued) |
| June 30, 2012 (Unaudited) |
| (000’s Omitted) |
believed not to reflect the investment’s fair value as of the Valuation Date. Members of the Valuation Committee include the Fund’s Treasurer or designee, a Vice President of the Funds with legal expertise or designee, and a Vice President of the investment manager or designee. In addition, the Fund’s chief compliance officer shall designate a member of the compliance group to attend Valuation Committee meetings as a non-voting resource, to monitor for and provide guidance with respect to compliance with these procedures. Two members of the Valuation Committee or their designees, representing different departments, shall constitute a quorum for purposes of permitting the Valuation Committee to take action. The Valuation Committee will consider all relevant factors in determining an investment’s fair value, and may seek the advice of the Fund’s sub-adviser, knowledgeable brokers and legal counsel in making such determination. The Valuation Committee reports to the Audit Committee of the Company’s Board of Directors. The Audit Committee receives quarterly written reports which include details of all fair-valued investments, including the reason for the fair valuation, and an indication, when possible, of the accuracy of the valuation by disclosing the next available reliable public price quotation or the disposition price of such investments (the “look-back” test). The Board of Directors then must consider for ratification all of the fair value determinations made during the previous quarter.
Valuation levels are not necessarily indicative of the risk associated with investing in such investments. Individual investments within any of the above mentioned asset classes may be assigned a different hierarchical level than those presented above, as individual circumstances dictate.
For additional information, refer to the Investment Valuation Hierarchy Level Summary and the Level 3 roll-forward reconciliation which follow the Schedule of Investments.
For purposes of reporting transfers between different hierarchy levels, both transfers in and out of each level, as applicable, are shown as if they occurred at the beginning of the period.
| c) | Investment Transactions and Investment Income – Investment transactions are recorded as of the trade date (the date the order to buy or sell is executed) for financial reporting purposes. Investments purchased or sold on a when-issued or delayed-delivery basis may be settled a month or more after the trade date. Realized gains and losses are determined on the basis of identified cost. |
Dividend income is accrued as of the ex-dividend date, except certain dividends from foreign investments where the ex-dividend date may have passed are recorded as soon as the Fund is informed of the dividend. Interest income, including amortization of premium and accretion of discounts, is accrued on a daily basis.
| d) | Foreign Currency Transactions – Assets and liabilities denominated in currencies other than U.S. dollars are translated into U.S. dollars at the exchange rates in effect on the valuation date. Purchases and sales of investments, income, and expenses are translated into U.S. dollars at the exchange rates on the dates of such transactions. |
The Fund does not isolate that portion of portfolio investment valuation resulting from fluctuations in the foreign currency exchange rates from the fluctuations arising from changes in the market prices of investments held. Exchange rate fluctuations are included with the net realized and unrealized gain or loss on investments in the accompanying financial statements.
Net realized foreign exchange gains or losses arise from sales of foreign currencies and the difference between asset and liability amounts initially stated in foreign currencies and the U.S. dollar value of the amounts actually received or paid. Net unrealized foreign exchange gains or losses arise from changes in the value of other assets and liabilities at the end of the reporting period, resulting from changes in the exchange rates.
| e) | Joint Trading Account – The Fund may invest cash balances into a joint trading account that may be invested in one or more repurchase agreements. |
| 14 |
| f) | Fund Share Valuation and Dividend Distributions to Shareholders – Orders for the Fund’s shares are executed in accordance with the investment instructions of the contract holders and plan participants. The NAV of the Fund’s shares is determined as of the close of business on each business day of the Exchange. The NAV is determined separately for each class of shares of the Fund by dividing the Fund’s net assets attributable to that class by the number of shares of the class outstanding. Each class of shares offered by the Fund has equal rights as to assets and voting privileges (except that shareholders of a class have exclusive voting rights regarding any matter relating solely to that class of shares). Income and non-class specific expenses are allocated daily to each class on the basis of the relative net assets of the class. Realized and unrealized capital gains and losses are allocated daily based on the relative net assets of each class of shares of the Fund. |
Orders for the purchase of the Fund’s shares received prior to the close of the Exchange on any day the Exchange is open for business are priced at the NAV determined as of the close of the Exchange. Orders received after the close of the Exchange, or on a day on which the Exchange and/or the Fund is not open for business, are priced at the next determined NAV.
Dividends are declared pursuant to a policy adopted by the Company’s Board of Directors based upon the investment performance of the Fund. The policy of the Fund is to pay dividends from net investment income and realized capital gains, if any, at least once a year.
Distributions from net investment income, net realized capital gains and capital are determined in accordance with federal income tax regulations, which may differ from U.S. GAAP with respect to character and timing. These differences may include but are not limited to losses deferred due to wash sale adjustments, foreign currency gains and losses, adjustments related to Passive Foreign Investment Companies (“PFICs”), Real Estate Investment Trusts (“REITs”), Regulated Investment Companies (“RICs”), certain derivatives and partnerships. Permanent book and federal income tax basis differences relating to shareholder distributions will result in reclassifications to certain of the Fund’s capital accounts (see Federal Income Taxes: Reclassification of Capital Accounts note).
| 3. | Securities and Other Investments: |
| a) | Repurchase Agreements – A repurchase agreement is an agreement by which a counterparty agrees to sell an investment and agrees to repurchase the investment sold at a mutually agreed upon time and price. At the time the Fund enters into a repurchase agreement, the value of the underlying collateral, including accrued interest, will be equal to or exceed the value of the repurchase agreement. Repurchase agreements expose the Fund to counterparty risk. To minimize counterparty risk, the investments that serve to collateralize the repurchase agreement are held by the Fund’s custodian in book entry or physical form in the custodial account of the Fund or in a third party custodial account. Repurchase agreements are valued at cost plus accrued interest. The Fund, as shown on the Schedule of Investments, had outstanding repurchase agreements as of June 30, 2012. |
| b) | Illiquid and Restricted Investments – The Fund is permitted to invest up to 15% of its net assets in illiquid investments. Illiquid investments are those that may not be sold or disposed of in the ordinary course of business within seven days, at approximately the price used to determine the Fund’s NAV. The Fund may not be able to sell illiquid investments when its sub-adviser considers it desirable to do so or may have to sell such investments at a price that is lower than the price that could be obtained if the investments were more liquid. A sale of illiquid investments may require more time and may result in higher dealer discounts and other selling expenses than does the sale of those that are liquid. Illiquid investments also may be more difficult to value due to the unavailability of reliable market quotations for such investments, and an investment in them may have an adverse impact on the Fund’s NAV. The Fund may also purchase certain restricted investments that can only be resold to certain qualified investors and may be determined to be liquid pursuant to policies and guidelines established by the Company’s Board of Directors. The Fund, as shown on the Schedule of Investments, had illiquid and/or restricted investments as of June 30, 2012. |
| c) | Investments Purchased on a When-Issued or Delayed-Delivery Basis – Delivery and payment for investments that have been purchased by the Fund on a forward commitment, or when-issued or delayed-delivery basis, take place beyond the |
| 15 |
| Hartford Value HLS Fund |
| Notes to Financial Statements – (continued) |
| June 30, 2012 (Unaudited) |
| (000’s Omitted) |
customary settlement period. A fund may dispose of or renegotiate a delayed-delivery transaction after it is entered into, and may sell delayed-delivery investments before they are delivered, which may result in a realized gain or loss. During this period, such investments are subject to market fluctuations, and the Fund identifies investments segregated in its records with a value at least equal to the amount of the commitment. As of June 30, 2012, the Fund had no outstanding when-issued or delayed delivery investments.
| 4. | Financial Derivative Instruments: |
The following disclosures contain information on how and why the Fund uses derivative instruments, the credit-risk-related contingent features in certain derivative instruments, and how derivative instruments affect the Fund’s financial position and results of operations. The location and fair value amounts of these instruments on the Statement of Assets and Liabilities and the realized gains and losses and changes in unrealized gains and losses on the Statement of Operations, each categorized by type of derivative contract, are included in the following Additional Derivative Instrument Information footnote. The derivative instruments outstanding as of period-end are disclosed in the notes to the Schedule of Investments and the amounts of realized gains and losses and changes in unrealized gains and losses on derivative instruments during the period are disclosed in the Statement of Operations.
| a) | Foreign Currency Contracts – The Fund may enter into foreign currency contracts that obligate the Fund to purchase or sell currencies at specified future dates. Foreign currency contracts are used to hedge the currency exposure associated with some or all of the Fund’s investments and/or as part of an investment strategy. Foreign currency contracts are marked to market daily and the change in value is recorded by the Fund as an unrealized gain or loss. The Fund will record a realized gain or loss when the foreign currency contract is settled. |
Foreign currency contracts involve elements of market risk in excess of the amounts reflected in the Statement of Assets and Liabilities. In addition, risks may arise upon entering into these contracts from the potential inability of the counterparties to meet the terms of the contracts and from unanticipated movements in the value of the foreign currencies relative to the U.S. dollar. The Fund had no outstanding foreign currency contracts as of June 30, 2012.
| b) | Additional Derivative Instrument Information: |
The volume of derivative activity was minimal during the six-month period ended June 30, 2012.
The effect of Derivative Instruments on the Statement of Operations for the six-month period ended June 30, 2012:
| Risk Exposure Category | ||||||||||||||||||||||||||||
| Interest Rate Contracts | Foreign Exchange Contracts | Credit Contracts | Equity Contracts | Commodity Contracts | Other Contracts | Total | ||||||||||||||||||||||
| Realized Gain (Loss) on Derivatives Recognized as a Result of Operations: | ||||||||||||||||||||||||||||
| Net realized loss on foreign currency contracts | $ | — | $ | (4 | ) | $ | — | $ | — | $ | — | $ | — | $ | (4 | ) | ||||||||||||
| Total | $ | — | $ | (4 | ) | $ | — | $ | — | $ | — | $ | — | $ | (4 | ) | ||||||||||||
| 5. | Principal Risks: |
| a) | Counterparty Risk – The Fund may be exposed to counterparty risk, or the risk that an institution or other entity with which the Fund has unsettled or open transactions will default. |
| b) | Market Risks – If the Fund invests directly in foreign currencies or in securities that trade in, and receive revenues in, foreign currencies, or in derivatives that provide exposure to foreign currencies, it will be subject to the risk that those currencies will decline in value relative to the base currency of the Fund, or, in the case of hedging positions, that the Fund’s base currency will decline in value relative to the currency being hedged. Currency rates in foreign countries may fluctuate significantly over short periods of time for a number of reasons, including changes in interest rates, intervention (or the failure to intervene) by U.S. or foreign governments, central banks or supranational entities, such as the |
| 16 |
International Monetary Fund, or by the imposition of currency controls or other political developments in the United States or abroad. As a result, the Fund’s investments in foreign currency denominated securities may reduce the returns of the Fund. The market values of equity securities, such as common stocks and preferred stocks, or equity related investments, such as futures and options, may decline due to general market conditions which are not specifically related to a particular company, such as real or perceived adverse economic conditions, changes in the general outlook for corporate earnings, changes in interest or currency rates or adverse investor sentiment generally. The market value of equity securities may also decline due to factors which affect a particular industry or industries, such as labor shortages or increased production costs and competitive conditions within an industry. Equity securities and equity related investments generally have greater market price volatility than fixed income securities.
| 6. | Federal Income Taxes: |
| a) | Federal Income Taxes – For federal income tax purposes, the Fund intends to continue to qualify as a RIC under Subchapter M of the Internal Revenue Code (“IRC”) by distributing substantially all of its taxable net investment income and net realized capital gains to its shareholders and otherwise complying with the requirements of RICs. The Fund has distributed substantially all of its income and capital gains in prior years, if applicable, and intends to distribute substantially all of its income and capital gains prior to the next fiscal year-end. Accordingly, no provision for federal income or excise taxes has been made in the accompanying financial statements. Distributions from short-term capital gains are treated as ordinary income distributions for federal income tax purposes. |
| b) | Net Investment Income (Loss), Net Realized Gains (Losses) – Net investment income (loss) and net realized gains (losses) may differ for financial statement and tax purposes primarily because of losses deferred due to wash sale adjustments, foreign currency gains and losses, adjustments related to PFICs, REITs, RICs, certain derivatives and partnerships. The character of distributions made during the year from net investment income or net realized gains may differ from their ultimate characterization for federal income tax purposes. Also, due to the timing of dividend distributions, the fiscal year in which amounts are distributed may differ from the year that the income or realized gains (losses) were recorded by the Fund. |
| c) | Distributions and Components of Distributable Earnings – The tax character of distributions paid by the Fund for the periods indicated is as follows (as adjusted for dividends payable): |
| For the Year Ended December 31, 2011 | For the Year Ended December 31, 2010 | |||||||
| Ordinary Income | $ | 12,398 | $ | 9,850 | ||||
As of December 31, 2011, the Fund’s components of distributable earnings (deficit) on a tax basis were as follows:
| Amount | ||||
| Undistributed Ordinary Income | $ | 796 | ||
| Accumulated Capital and Other Losses* | (170,001 | ) | ||
| Unrealized Appreciation† | 47,022 | |||
| Total Accumulated Deficit | $ | (122,183 | ) | |
| * | The Fund has capital loss carryforwards that are identified in the Capital Loss Carryforward note that follows. |
| † | The difference between book-basis and tax-basis unrealized appreciation (depreciation) may be attributable to the losses deferred due to wash sale adjustments, foreign currency gains and losses, adjustments related to PFICs, REITs, RICs, certain derivatives and partnerships. |
| d) | Reclassification of Capital Accounts – The Fund may record reclassifications in its capital accounts. These reclassifications have no impact on the total net assets of the Fund. The reclassifications are a result of permanent differences between U.S. GAAP and tax accounting for such items as foreign currency, PFICs, expiration or utilization |
| 17 |
| Hartford Value HLS Fund |
| Notes to Financial Statements – (continued) |
| June 30, 2012 (Unaudited) |
| (000’s Omitted) |
of capital loss carryforwards or net operating losses. Adjustments are made to reflect the impact these items have on current and future distributions to shareholders. Therefore, the source of the Fund’s distributions may be shown in the accompanying Statement of Changes in Net Assets as from undistributed net investment income, from accumulated net realized gains on investments or from capital depending on the type of book and tax differences that exist. For the year ended December 31, 2011, the Fund recorded reclassifications to increase (decrease) the accounts listed below:
| Amount | ||||
| Undistributed Net Investment Income | $ | (337 | ) | |
| Accumulated Net Realized Gain (Loss) | 337 | |||
| e) | Capital Loss Carryforward – On December 22, 2010, the Regulated Investment Company Modernization Act of 2010 (the “Act”) was enacted, which made changes to the capital loss carryforward rules. The changes are effective for taxable years beginning after the date of enactment. Under the Act, funds are permitted to carry forward capital losses for an unlimited period. However, any losses incurred during those future taxable years will be required to be utilized prior to the losses incurred in pre-enactment taxable years, which carry an expiration date. As a result of this ordering rule, pre-enactment capital loss carryforwards may be more likely to expire unused. Additionally, post-enactment capital loss carryforwards retain their character as either short-term or long-term capital losses rather than being considered all short-term as permitted under prior regulation. |
At December 31, 2011 (tax-year-end), the Fund had capital loss carryforwards for U.S. federal income tax purposes as follows:
| Year of Expiration | Amount | |||
| 2015 | $ | 19,072 | ||
| 2016 | 106,920 | |||
| 2017 | 44,009 | |||
| Total | $ | 170,001 | ||
During the year ended December 31, 2011, the Fund utilized $29,729 of prior year capital loss carryforwards.
| f) | Accounting for Uncertainty in Income Taxes – The Fund has adopted financial reporting rules that require the Fund to analyze all open tax years, as defined by the statute of limitations, for all major jurisdictions. Generally, tax authorities can examine all tax returns filed for the last three years. The Fund does not have an examination in progress. |
The Fund has reviewed all open tax years and major jurisdictions and concluded that these financial reporting rules had no effect on the Fund’s financial position or results of operations. There is no tax liability resulting from unrecognized tax benefits relating to uncertain income tax positions taken or expected to be taken on the tax return for the fiscal year ended December 31, 2011. The Fund is also not aware of any tax positions for which it is reasonably possible that the total amounts of unrecognized tax benefits will significantly change in the next twelve months.
| 7. | Expenses: |
| a) | Investment Management Agreement – HL Investment Advisors, LLC (“HL Advisors”), an indirect wholly owned subsidiary of The Hartford Financial Services Group, Inc. (“The Hartford”), serves as investment manager to the Fund pursuant to an Investment Management Agreement with the Company. As investment manager, HL Advisors has overall investment supervisory responsibility for the Fund. In addition, HL Advisors provides administrative personnel, services, equipment, facilities and office space for proper operation of the Fund. HL Advisors has contracted with Wellington Management Company, LLP (“Wellington Management”) under a sub-advisory agreement for the provision of day-to-day investment management services to the Fund in accordance with the Fund’s investment objective and policies. The Fund pays a fee to HL Advisors, a portion of which may be used to compensate Wellington Management. |
| 18 |
The schedule below reflects the rates of compensation paid to HL Advisors for investment management services rendered as of June 30, 2012; the rates are accrued daily and paid monthly.
| Average Daily Net Assets | Annual Fee | |||
| On first $250 million | 0.7750 | % | ||
| On next $250 million | 0.7250 | % | ||
| On next $500 million | 0.6750 | % | ||
| On next $1.5 billion | 0.6250 | % | ||
| On next $2.5 billion | 0.6200 | % | ||
| On next $5 billion | 0.6150 | % | ||
| Over $10 billion | 0.6100 | % | ||
The schedule below reflects the rates of compensation paid to HL Advisors for investment management services rendered during the period December 31, 2011, through February 29, 2012.
| Average Daily Net Assets | Annual Fee | |||
| On first $250 million | 0.7750 | % | ||
| On next $250 million | 0.7250 | % | ||
| On next $500 million | 0.6750 | % | ||
| On next $4 billion | 0.6250 | % | ||
| On next $5 billion | 0.6225 | % | ||
| Over $10 billion | 0.6200 | % | ||
| b) | Accounting Services Agreement – Pursuant to the Fund Accounting Agreement between HLIC and the Company, on behalf of the Fund, HLIC provides accounting services to the Fund and receives monthly compensation based on the Fund’s average daily net assets at the rates set forth below. The Fund’s accounting services fees are accrued daily and paid monthly. |
| Average Daily Net Assets | Annual Fee | |||
| All Assets | 0.010 | % | ||
| c) | Operating Expenses – Allocable expenses incurred by the Company are allocated to each Fund and allocated to classes within a Fund in proportion to the average daily net assets of the Fund and each class, except where allocation of certain expenses is more fairly made directly to the Fund or to specific classes within a Fund. |
| d) | Fees Paid Indirectly – The Company, on behalf of the Fund, has entered into agreements with State Street Global Markets, LLC and Russell Implementation Services, Inc. to partially recapture non-discounted trade commissions. Such rebates are used to pay a portion of the Fund’s expenses. In addition, the Fund’s custodian bank has also agreed to reduce its fees when the Fund maintains cash on deposit in a non-interest-bearing custody account. For the six-month period ended June 30, 2012, these amounts, if any, are included in the Statement of Operations. |
The ratio of expenses to average net assets in the accompanying financial highlights excludes the reduction in expenses related to fees paid indirectly. The annualized expense ratio for the period listed below reflecting the reduction for fees paid indirectly is as follows:
| Annualized Six- Month Period Ended June 30, 2012 | ||||
| Class IA | 0.76 | % | ||
| Class IB | 1.01 | % | ||
| 19 |
| Hartford Value HLS Fund |
| Notes to Financial Statements – (continued) |
| June 30, 2012 (Unaudited) |
| (000’s Omitted) |
| e) | Distribution Plan for Class IB shares – The Company, on behalf of the Fund, has adopted a Distribution Plan pursuant to Rule 12b-1 of the 1940 Act to compensate the Distributor, Hartford Securities Distribution Company, Inc. (a wholly owned, ultimate subsidiary of The Hartford), from assets attributable to the Class IB shares for services rendered and expenses borne in connection with activities primarily intended to result in the sale of the Class IB shares, subject to the review and approval of the Company’s Board of Directors. |
The Distribution Plan provides that the Fund may pay annually up to 0.25% of the average daily net assets of the Fund attributable to its Class IB shares for activities primarily intended to result in the sale of Class IB shares. The Board has the authority to suspend or reduce these payments at any point in time. Under the terms of the Distribution Plan and the principal underwriting agreement, the Fund is authorized to make payments monthly to the Distributor that may be used to pay or compensate entities providing distribution and shareholder servicing with respect to the Class IB shares for such entities’ fees or expenses incurred or paid in that regard. These fees are accrued daily and paid monthly.
| f) | Other Related Party Transactions – Certain officers of the Fund are directors and/or officers of HL Advisors and/or The Hartford or its subsidiaries. For the six-month period ended June 30, 2012, a portion of the Fund’s chief compliance officer’s salary was paid by all the investment companies in the Hartford fund complex. The portion allocated to the Fund was in the amount of $1. These fees are accrued daily and paid monthly. |
| g) | Payment from Affiliate – In July of 2007, The Hartford entered into a settlement with the Attorneys General of the states of New York, Connecticut and Illinois relating to market timing and the company's individual variable annuity contracts in which certain payments would be made directly to the variable annuity contract holders. The distribution plan provided that unclaimed money from the settlement would be distributed to certain HLS Funds that are investment options through a Hartford individual variable annuity contract. The unclaimed money was distributed to the Fund on September 18, 2009. |
The total return in the accompanying financial highlights includes a payment from an affiliate. Had the payment from the affiliate been excluded, the impact and total return for the period listed below would have been as follows:
| For the Year Ended December 31, 2009 | ||||||||
| Class IA | Class IB | |||||||
| Impact from Payment from Affiliate for Attorneys General Settlement | — | % | — | % | ||||
| Total Return Excluding Payment from Affiliate | 24.37 | % | 24.05 | % | ||||
| 8. | Investment Transactions: |
For the six-month period ended June 30, 2012, the Fund's aggregate purchases and sales of investment securities (excluding short-term investments) were as follows:
| Amount | ||||
| Cost of Purchases for U.S. Government Obligations | $ | 77,098 | ||
| Sales Proceeds for U.S. Government Obligations | 148,053 | |||
| 9. | Line of Credit: |
The Fund is one of several Hartford funds that participate in a $500 million committed revolving line of credit facility. The facility is to be used for temporary or emergency purposes. Under the arrangement, the funds are required to own securities having a market value in excess of 300% of the total bank borrowings. The interest rate on borrowings varies depending on the nature of the loan. The facility also requires a fee to be paid based on the amount of the commitment. This commitment fee is allocated to all of the funds participating in the line of credit based on the average net assets of the funds. During the six-month period ended June 30, 2012, the Fund did not have any borrowings under this facility.
| 20 |
| 10. | Industry Classifications: |
Other than the industry classifications “Other Investment Pools and Funds” and “Exchange Traded Funds,” equity industry classifications used in this report are the Global Industry Classification Standard, which was developed by and is the exclusive property and service mark of MSCI, Inc. and Standard & Poor’s.
| 11. | Indemnifications: |
Under the Company’s organizational documents, the Company shall indemnify its officers and directors to the full extent required or permitted under Maryland General Corporation Law and the federal securities laws. In addition, the Company, on behalf of the Fund, may enter into contracts that contain a variety of indemnifications. The Company’s maximum exposure under these arrangements is unknown. However, as of the date of these financial statements, the Company has not had prior claims or losses pursuant to these contracts and expects the risk of loss to be remote.
| 21 |
| Hartford Value HLS Fund |
| Financial Highlights |
| - Selected Per-Share Data (A) - |
| Class | Net Asset Value at Beginning of Period | Net Investment Income (Loss) | Payments from (to) Affiliate | Net Realized and Unrealized Gain (Loss) on Investments | Total from Investment Operations | Dividends from Net Investment Income | Distributions from Realized Capital Gains | Distributions from Capital | Total Distributions | Net Increase (Decrease) in Net Asset Value | Net Asset Value at End of Period | |||||||||||||||||||||||||||||||||
| For the Six-Month Period Ended June 30, 2012 (Unaudited) | ||||||||||||||||||||||||||||||||||||||||||||
| IA | $ | 10.37 | $ | 0.12 | $ | – | $ | 0.76 | $ | 0.88 | $ | – | $ | – | $ | – | $ | – | $ | 0.88 | $ | 11.25 | ||||||||||||||||||||||
| IB | 10.36 | 0.11 | – | 0.75 | 0.86 | – | – | – | – | 0.86 | 11.22 | |||||||||||||||||||||||||||||||||
| For the Year Ended December 31, 2011 | ||||||||||||||||||||||||||||||||||||||||||||
| IA | 10.77 | 0.20 | – | (0.41 | ) | (0.21 | ) | (0.19 | ) | – | – | (0.19 | ) | (0.40 | ) | 10.37 | ||||||||||||||||||||||||||||
| IB | 10.76 | 0.17 | – | (0.41 | ) | (0.24 | ) | (0.16 | ) | – | – | (0.16 | ) | (0.40 | ) | 10.36 | ||||||||||||||||||||||||||||
| For the Year Ended December 31, 2010 (G) | ||||||||||||||||||||||||||||||||||||||||||||
| IA | 9.50 | 0.13 | – | 1.26 | 1.39 | (0.12 | ) | – | – | (0.12 | ) | 1.27 | 10.77 | |||||||||||||||||||||||||||||||
| IB | 9.50 | 0.11 | – | 1.25 | 1.36 | (0.10 | ) | – | – | (0.10 | ) | 1.26 | 10.76 | |||||||||||||||||||||||||||||||
| For the Year Ended December 31, 2009 | ||||||||||||||||||||||||||||||||||||||||||||
| IA | 7.77 | 0.14 | – | 1.75 | 1.89 | (0.16 | ) | – | – | (0.16 | ) | 1.73 | 9.50 | |||||||||||||||||||||||||||||||
| IB | 7.77 | 0.13 | – | 1.74 | 1.87 | (0.14 | ) | – | – | (0.14 | ) | 1.73 | 9.50 | |||||||||||||||||||||||||||||||
| For the Year Ended December 31, 2008 | ||||||||||||||||||||||||||||||||||||||||||||
| IA | 12.83 | 0.20 | – | (4.36 | ) | (4.16 | ) | (0.20 | ) | (0.70 | ) | – | (0.90 | ) | (5.06 | ) | 7.77 | |||||||||||||||||||||||||||
| IB | 12.81 | 0.20 | – | (4.37 | ) | (4.17 | ) | (0.17 | ) | (0.70 | ) | – | (0.87 | ) | (5.04 | ) | 7.77 | |||||||||||||||||||||||||||
| For the Year Ended December 31, 2007 | ||||||||||||||||||||||||||||||||||||||||||||
| IA | 13.06 | 0.17 | – | 1.02 | 1.19 | (0.17 | ) | (1.25 | ) | – | (1.42 | ) | (0.23 | ) | 12.83 | |||||||||||||||||||||||||||||
| IB | 13.03 | 0.16 | – | 1.00 | 1.16 | (0.13 | ) | (1.25 | ) | – | (1.38 | ) | (0.22 | ) | 12.81 | |||||||||||||||||||||||||||||
| (A) | Information presented relates to a share outstanding throughout the indicated period. |
| (B) | The figures do not include sales charges or other fees which may be applied at the variable life insurance, variable annuity or qualified retirement plan product level. Any such additional sales charges or other fees would lower the Fund's performance. |
| (C) | Ratios do not reflect reductions for fees paid indirectly. Please see Fees Paid Indirectly in the Notes to Financial Statements. |
| (D) | Portfolio turnover rate is calculated on the basis of the Fund as a whole without distinguishing between the classes of shares issued. |
| (E) | Not annualized. |
| (F) | Annualized. |
| (G) | Per share amounts have been calculated using the average shares method. |
| (H) | During the year ended December 31, 2010, the Fund incurred $269.8 million in sales associated with the transition of assets from Hartford Equity Income HLS Fund and Hartford Value Opportunities HLS Fund, which merged into the Fund on March 19, 2010. These sales were excluded from the portfolio turnover calculation. |
| (I) | Total return without the inclusion of the Payment from (to) Affiliate can be found in Expenses in the accompanying Notes to Financial Statements. |
| 22 |
| - Ratios and Supplemental Data - |
| Total Return(B) | Net Assets at End of Period | Ratio of Expenses to Average Net Assets Before Waivers(C) | Ratio of Expenses to Average Net Assets After Waivers(C) | Ratio of Net Investment Income (Loss) to Average Net Assets | Portfolio Turnover Rate(D) | |||||||||||||||||
| 8.49 | %(E) | $ | 574,548 | 0.76 | %(F) | 0.76 | %(F) | 2.07 | %(F) | 11 | % | |||||||||||
| 8.35 | (E) | 107,585 | 1.01 | (F) | 1.01 | (F) | 1.82 | (F) | – | |||||||||||||
| (1.96 | ) | 591,278 | 0.75 | 0.75 | 1.65 | 16 | ||||||||||||||||
| (2.20 | ) | 111,486 | 1.00 | 1.00 | 1.40 | – | ||||||||||||||||
| 14.67 | 741,230 | 0.78 | 0.78 | 1.36 | 47 | (H) | ||||||||||||||||
| 14.38 | 154,731 | 1.03 | 1.03 | 1.11 | – | |||||||||||||||||
| 24.37 | (I) | 244,909 | 0.87 | 0.87 | 1.65 | 50 | ||||||||||||||||
| 24.06 | (I) | 63,003 | 1.12 | 1.12 | 1.40 | – | ||||||||||||||||
| (34.03 | ) | 217,460 | 0.84 | 0.84 | 1.87 | 57 | ||||||||||||||||
| (34.20 | ) | 63,338 | 1.09 | 1.09 | 1.62 | – | ||||||||||||||||
| 8.98 | 327,689 | 0.84 | 0.84 | 1.42 | 35 | |||||||||||||||||
| 8.70 | 131,651 | 1.09 | 1.09 | 1.14 | – | |||||||||||||||||
| 23 |
| Hartford Value HLS Fund |
| Directors and Officers (Unaudited) |
The Board of Directors of the Company appoints officers who are responsible for the day-to-day operations of the Fund and who execute policies formulated by the Directors. Each director serves until his or her death, resignation, or retirement or until the next annual meeting of shareholders is held or until his or her successor is elected and qualifies.
Directors and officers who are employed by or who have a financial interest in The Hartford are considered “interested” persons of the Fund pursuant to the 1940 Act. Each officer and two of the Company’s directors, as noted in the chart below, are “interested” persons of the Fund. Each director serves as a director for The Hartford Mutual Funds, Inc., The Hartford Mutual Funds II, Inc., Hartford Series Fund, Inc., Hartford HLS Series Fund II, Inc., and as a trustee for The Hartford Alternative Strategies Fund, which, as of June 30, 2012, collectively consist of 89 funds. Correspondence may be sent to directors and officers c/o Hartford Mutual Funds, P.O. Box 2999, Hartford, Connecticut 06104-2999, except that correspondence to Mr. Annoni, Mr. Dressen and Ms. Fagely may be sent to 500 Bielenberg Drive, Woodbury, Minnesota 55125.
The table below sets forth, for each director and officer, his or her name, year of birth, current position with the Company and date first elected or appointed to Hartford Series Fund, Inc. (“HSF”), and Hartford HLS Series Fund II, Inc. (“HSF2”), principal occupation, and, for directors, other directorships held. The Fund’s statement of additional information contains further information on the directors and is available free of charge by calling 1-800-862-6668 or writing to Hartford HLS Funds, c/o Individual Annuity Services, P.O. Box 5085, Hartford, CT 06102-5085.
Information on the aggregate remuneration paid to the directors of the Company can be found in the Statement of Operations herein. The Fund pays to The Hartford a portion of the Chief Compliance Officer’s compensation, but does not pay salaries or compensation to any of their other officers or directors who are employed by The Hartford.
Non-Interested Directors
Lynn S. Birdsong (1946) Director since 2003, Co-Chairman of the Investment Committee
Mr. Birdsong is a private investor. Mr. Birdsong currently serves as a Director of the Sovereign High Yield Investment Company (April 2010 to current). Mr. Birdsong currently serves as an Independent Director of Nomura Partners Funds, Inc. (formerly, The Japan Fund) (March 2003 to current). From 1979 to 2002, Mr. Birdsong was a managing director of Zurich Scudder Investments, an investment management firm. During his employment with Scudder, Mr. Birdsong was an Interested Director of The Japan Fund. Since 1981, Mr. Birdsong has been a partner in Birdsong Company, an advertising specialty firm.
Robert M. Gavin, Jr. (1940) Director since 2002 (HSF) and 1986 (HSF2), Chairman of the Board since 2004
Dr. Gavin is an educational consultant. Prior to September 1, 2001, he was President of Cranbrook Education Community and prior to July 1996, he was President of Macalester College, St. Paul, Minnesota.
Duane E. Hill (1945) Director since 2001 (HSF) and 2002 (HSF2), Chairman of the Nominating Committee
Mr. Hill is Partner of TSG Ventures L.P., a private equity investment company. Mr. Hill is a former partner of TSG Capital Group, a private equity investment firm that served as sponsor and lead investor in leveraged buyouts of middle market companies.
Sandra S. Jaffee (1941) Director since 2005
Ms. Jaffee is the founder and Chief Executive Officer of a private company, Homeworks Concierge, LLC, which provides residential property management services in Westchester County, New York (January 2012 to present). Ms. Jaffee served as Chairman (2008 to 2009) and Chief Executive Officer of Fortent (formerly Searchspace Group), a leading provider of compliance/regulatory technology to financial institutions from August 2005 to August 2009. Ms. Jaffe currently serves as a member of the Board of Directors of Broadridge Financial Solutions as well as a Trustee of Muhlenberg College.
William P. Johnston (1944) Director since 2005, Chairman of the Compliance Committee
In June 2006, Mr. Johnston was appointed as Senior Advisor to The Carlyle Group, a global private equity investment firm. In August 2007, Mr. Johnston was elected to the Board of Directors of LifeCare Holdings, Inc. In February 2008, Mr. Johnston was elected to the Board of Directors of HCR-ManorCare, Inc. In May 2006, Mr. Johnston was elected to the Supervisory Board of Fresenius Medical Care AG & Co. KGaA, after its acquisition of Renal Care Group, Inc. in March 2006.
Phillip O. Peterson (1944) Director since 2002 (HSF) and 2000 (HSF2), Chairman of the Audit Committee
Mr. Peterson is a mutual fund industry consultant. He was a partner of KPMG LLP (an accounting firm) until July 1999. Mr. Peterson joined William Blair Funds in February 2007 as a member of the Board of Trustees. Mr. Peterson also joined the Board of Trustees of Symetra Variable Mutual Funds Trust as a trustee in February 2012.
| 24 |
Lemma W. Senbet (1946) Director since 2005
Dr. Senbet is the William E. Mayer Chair Professor of Finance and Director, Center for Financial Policy, at the University of Maryland, Robert H. Smith School of Business. He was chair of the Finance Department from 1998 to 2006. Previously he was a chaired professor of finance at the University of Wisconsin-Madison. Also, he was director of the Fortis Funds from March 2000 to July 2002. Dr. Senbet served the finance profession in various capacities, including as director of the American Finance Association and President of the Western Finance Association. In 2006, Dr. Senbet was inducted Fellow of Financial Management Association International for his career-long distinguished scholarship and professional service.
Interested Directors and Officers
David N. Levenson (1966) Director since 2010(1)
Mr. Levenson currently serves as President of The Hartford’s Wealth Management business. He was appointed to this role in July 2010. Previously, Mr. Levenson served as Executive Vice President of Legacy Holdings for The Hartford from June 2009 to July 2010. From 2006 to 2009, Mr. Levenson was with Hartford Life Insurance K.K. where he served as President and Chief Executive Officer from 2007 to 2009. He served as Managing Director of Hartford Investment Management Company from 2005 to 2006. Additionally, Mr. Levenson serves as Executive Vice President of The Hartford and as President, Director and Chief Executive Officer of Hartford Life Insurance Company (“HLIC”) and Hartford Life, Inc. (“HL Inc.”).
(1) Mr. Levenson served as Interested Director until August 2, 2012.
Lowndes A. Smith (1939) Director since 1996 (HSF) and 2002 (HSF2), Co-Chairman of the Investment Committee
Mr. Smith served as Vice Chairman of The Hartford from February 1997 to January 2002, as President and Chief Executive Officer of HL Inc. from February 1997 to January 2002, and as President and Chief Operating Officer of The Hartford Life Insurance Companies from January 1989 to January 2002. Mr. Smith serves as a Director of White Mountains Insurance Group, Ltd., One Beacon Insurance and Symetra Financial and as Managing Director of Whittington Gray Associates.
Other Officers
James E. Davey (1964) President and Chief Executive Officer since 2010(2)
Mr. Davey serves as Executive Vice President of HLIC. Additionally, Mr. Davey serves as President, Chief Executive Officer and Manager of HIFSCO and President, Chief Executive Officer and Manager of HL Investment Advisors, LLC (“HL Advisors”). Mr. Davey joined The Hartford in 2002.
(2) Mr. Davey became an Interested Director effective August 2, 2012.
Mark A. Annoni (1964) Vice President, Controller and Treasurer since 2012(3)
Mr. Annoni serves as the Assistant Vice President and Director of Investment Finance (February 2004 to present). Mr. Annoni joined The Hartford in April 2001 as part of The Hartford’s acquisition of Fortis Financial Group. Prior to joining The Hartford, Mr. Annoni served as Manager of Mutual Fund Accounting at Fortis Financial Group (July 1997 to April 2001).
(3) Mr. Annoni was named Vice President, Controller and Treasurer on May 8, 2012.
Michael R. Dressen (1963) AML Compliance Officer since 2011
Mr. Dressen currently serves as Assistant Vice President of HLIC. He also serves as Chief Compliance Officer and AML Compliance Officer of Hartford Administrative Services Company (“HASCO”) and as Assistant Secretary and Compliance Officer of HIFSCO. Mr Dressen joined The Hartford in 2005 from State Farm Insurance Companies where he held various positions related to mutual funds, variable products, and property casualty insurance.
Tamara L. Fagely (1958) Vice President, since 2002 (HSF) and 1993 (HSF2)(4)
Ms. Fagely has been a Vice President of HASCO since 1998 and Chief Financial Officer since 2006. Currently Ms. Fagely is a Vice President of HLIC. She served as Assistant Vice President of HLIC from December 2001 through March 2005. In addition, Ms. Fagely is Controller and Chief Financial Officer of HIFSCO.
(4) Ms. Fagely served as Vice President, Controller and Treasurer until May 8, 2012.
Dr. Robert J. Froehlich (1953) Senior Managing Director since 2009(5)
Dr. Froehlich joined The Hartford as Senior Managing Director in September 2009. Prior to joining The Hartford, Dr. Froehlich served as Vice Chairman of Deutsche Asset Management from 1997-2009.
(5) Dr. Froehlich served as Senior Managing Director until March 26, 2012.
| 25 |
| Hartford Value HLS Fund |
| Directors and Officers (Unaudited) – (continued) |
Edward P. Macdonald (1967) Vice President, Secretary and Chief Legal Officer since 2005
Mr. Macdonald serves as Vice President of HLIC and Chief Legal Officer of Mutual Funds and Vice President of HIFSCO. He also serves as Vice President and Secretary of HASCO, and Chief Legal Officer, Secretary and Vice President of HL Advisors. Mr. Macdonald joined The Hartford in 2005.
Vernon J. Meyer (1964) Vice President since 2006
Mr. Meyer serves as Senior Vice President of HLIC. He also serves as Senior Vice President of HIFSCO and HL Advisors. Mr. Meyer joined The Hartford in 2004.
Colleen B. Pernerewski (1969) Vice President and Chief Compliance Officer since 2010
Ms. Pernerewski serves as Vice President and Chief Investment Advisor Compliance Officer of HIFSCO and as Vice President and Chief Compliance Officer of HL Advisors. Ms. Pernerewski serves as Vice President and Chief Compliance Officer of Individual Annuity of HLIC. Ms. Pernerewski joined The Hartford in 2005 from Travelers Life and Annuity where she served as Counsel (2004-2005). Prior to Travelers Life and Annuity, Ms. Pernerewski held the position of Counsel at The Hartford (1998-2004).
Elizabeth L. Schroeder (1966) Vice President since 2010
Ms. Schroeder currently serves as Assistant Vice President of HLIC. Ms. Schroeder joined HLIC in 1991. She is also an Assistant Vice President of HASCO, HIFSCO and HL Advisors.
Martin Swanson (1962) Vice President since 2010
Mr. Swanson is a Vice President of HLIC. Mr. Swanson also serves as Vice President/Marketing for HIFSCO. Prior to joining HLIC in 1998, Mr. Swanson was a Vice President at PaineWebber, Inc.
Jane Wolak (1961) Vice President since 2009
Ms. Wolak currently serves as Senior Vice President of HLIC. Ms. Wolak joined HLIC as Vice President, Retail Product Services in May 2007. She is also Vice President of HASCO. Previously, Ms. Wolak was with Sun Life Financial where she held the position of Vice President, Service Center Operations from 2001-2007.
HOW TO OBTAIN A COPY OF THE FUND’S PROXY VOTING POLICIES AND VOTING RECORDS (UNAUDITED)
A description of the policies and procedures that the Fund uses to determine how to vote proxies relating to portfolio securities and a record of how the Fund voted any proxies for the twelve-month period ended June 30, 2012 are available (1) without charge, upon request, by calling 800-862-6668 and (2) on the SEC’s website at http://www.sec.gov.
QUARTERLY PORTFOLIO HOLDINGS INFORMATION (UNAUDITED)
The Fund files a complete schedule of portfolio holdings with the SEC for the first and third quarters of each fiscal year on Form N-Q. The Fund’s Forms are available (1) without charge, upon request, by calling 800-862-6668 and (2) on the SEC’s website at http://www.sec.gov. The Form N-Q may be reviewed and copied at the SEC’s Public Reference Room in Washington, DC. Information on the operation of the Public Reference Room may be obtained by calling 1-800-SEC-0330.
| 26 |
| Hartford Value HLS Fund |
| Expense Example (Unaudited) |
Your Fund's Expenses
As a shareholder of the Fund, you incur two types of costs: (1) transaction costs and (2) ongoing costs including investment management fees, distribution fees, and other fund expenses. This example is intended to help you understand your ongoing costs (in dollars) of investing in the Fund and to compare these costs with the ongoing costs of investing in other mutual funds. The example is based on an investment of $1,000 invested at the beginning of the period and held for the period of December 31, 2011 through June 30, 2012.
Actual Expenses
The first set of columns of the table below provides information about actual account values and actual expenses. You may use the information in this column, together with the amount you invested, to estimate the expenses that you paid over the period. Simply divide your account value by $1,000 (for example, an $8,600 account value divided by $1,000 = 8.6), then multiply the result by the number in the line under the heading entitled “Expenses Paid During Period” to estimate the expenses you paid on your account during this period.
Hypothetical Example for Comparison Purposes
The second set of columns of the table below provides information about hypothetical account values and hypothetical expenses based on the Fund’s actual expense ratio and an assumed rate of return of 5% per year before expenses, which is not the Fund’s actual return. The hypothetical account values and expenses may not be used to estimate the actual ending account balance or expenses you paid for the period. You may use this information to compare the ongoing costs of investing in the Fund and other funds. To do so, compare this 5% hypothetical example with the 5% hypothetical examples that appear in the shareholder reports of the other funds.
Please note that the expenses shown in the table are meant to highlight your ongoing costs only and do not reflect any transactional costs, such as sales charges (loads) and CDSC. Therefore, the second set of columns of the table is useful in comparing ongoing costs only, and will not help you determine the relative total costs of owning different funds. In addition, if these transactional costs were included, your costs would be higher. Expenses are equal to the Fund's annualized expense ratios multiplied by average account value over the period, multiplied by 182/366 (to reflect the one-half year period).
| Actual return | Hypothetical (5% return before expenses) | |||||||||||||||||||||||||||||||||||
| Beginning Account Value December 31, 2011 | Ending Account Value June 30, 2012 | Expenses paid during the period December 31, 2011 through June 30, 2012 | Beginning Account Value December 31, 2011 | Ending Account Value June 30, 2012 | Expenses paid during the period December 31, 2011 through June 30, 2012 | Annualized expense ratio | Days in the current 1/2 year | Days in the full year | ||||||||||||||||||||||||||||
| Class IA | $ | 1,000.00 | $ | 1,084.88 | $ | 3.94 | $ | 1,000.00 | $ | 1,021.08 | $ | 3.82 | 0.76 | % | 182 | 366 | ||||||||||||||||||||
| Class IB | $ | 1,000.00 | $ | 1,083.53 | $ | 5.23 | $ | 1,000.00 | $ | 1,019.84 | $ | 5.07 | 1.01 | % | 182 | 366 | ||||||||||||||||||||
| 27 |
HARTFORD HLS FUNDS
c/o The Hartford Wealth Management - Global Annuities
P.O. Box 14293
Lexington, KY 40512-4293
Hartford Series Fund, Inc. is underwritten and distributed by Hartford Securities Distribution Company, Inc.
"The Hartford" is The Hartford Financial Services Group, Inc. and its subsidiaries.
Hartford Series Fund, Inc. inception dates range from 1977 to date. Hartford Series Fund, Inc. is not a subsidiary of The Hartford but is underwritten, distributed by and advised by subsidiaries of The Hartford. Investments in Hartford Series Fund, Inc. are not guaranteed by The Hartford or any other entity.
You should carefully consider investment objectives, risks, and charges and expenses of Hartford HLS Funds before investing. This and other information can be found in the Fund’s prospectus or summary prospectus, which can be obtained by calling 800-862-6668. Please read them carefully before you invest or send money.
| HLSSAR-V12 8-12 111647 Printed in U.S.A ©2012 The Hartford, Hartford, CT 06115 | |
Item 2. Code of Ethics.
Not applicable to this semi-annual filing.
Item 3. Audit Committee Financial Expert.
Not applicable to this semi-annual filing.
Item 4. Principal Accountant Fees and Services.
Not applicable to this semi-annual filing.
Item 5. Audit Committee of Listed Registrants.
Not applicable to this semi-annual filing.
Item 6. Schedule of Investments
The Schedule of Investments is included as part of the semi-annual report filed under Item 1 of this form.
Item 7. Disclosure of Proxy Voting Policies and Procedures for Closed-End Management Investment Companies.
Not applicable.
Item 8. Portfolio Managers of Closed-End Management Investment Companies.
Not applicable.
Item 9. Purchases of Equity Securities by Closed-End Management Investment Company and Affiliated Purchasers.
Not applicable.
Item 10. Submission of Matters to a Vote of Security Holders
There have been no material changes to the procedures by which shareholders may recommend nominees to the registrant’s board of directors since registrant last provided disclosure in response to this requirement.
Item 11. Controls and Procedures.
| (a) | Based on an evaluation of the Registrant's Disclosure Controls and Procedures as of a date within 90 days of the filing date of this report, the Disclosure Controls and Procedures are effectively designed to ensure that information required to be disclosed by the Registrant is recorded, processed, summarized and reported by the date of this report, including ensuring that information required to be disclosed in the report is accumulated and communicated to the Registrant's management, including the Registrant's officers, as appropriate, to allow timely decisions regarding required disclosure. |
| (b) | There was no change in the Registrant's internal control over financial reporting that occurred during the Registrant’s last fiscal half year that has materially affected, or is reasonably likely to materially affect, the registrant’s internal control over financial reporting. |
Item 12. Exhibits.
| 11(a)(2) | Section 302 certifications of the principal executive officer and principal financial officer of Registrant. |
| (b) | Section 906 certification. |
SIGNATURES
Pursuant to the requirements of the Securities Exchange Act of 1934 and the Investment Company Act of 1940, the registrant has duly caused this report to be signed on its behalf by the undersigned, thereunto duly authorized.
| HARTFORD SERIES FUND, INC. | ||||
| Date: | August 13, 2012 | By: | /s/ James E. Davey | |
| James E. Davey | ||||
| Its: President | ||||
Pursuant to the requirements of the Securities Exchange Act of 1934 and the Investment Company Act of 1940, this report has been signed below by the following persons on behalf of the registrant and in the capacities and on the dates indicated.
| Date: | August 13, 2012 | By: | /s/ James E. Davey | |
| James E. Davey | ||||
| Its: President |
| Date: | August 13, 2012 | By: | /s/ Mark A. Annoni | |
| Mark A. Annoni | ||||
| Its: Vice President, Controller and Treasurer |
EXHIBIT LIST
| 99.CERT | 11(a)(2) | Certifications |
| (i) Section 302 certification of principal executive officer | ||
| (ii) Section 302 certification of principal financial officer | ||
| 99.906CERT | 11(b) | Section 906 certification of principal executive officer and principal financial officer |