UNITED STATES
SECURITIES AND EXCHANGE COMMISSION
Washington, D.C. 20549
FORM N-CSR
CERTIFIED SHAREHOLDER REPORT OF REGISTERED MANAGEMENT
INVESTMENT COMPANIES
Investment Company Act file number: 811-08629
HARTFORD SERIES FUND, INC.
(Exact name of registrant as specified in charter)
5 Radnor Corporate Center, Suite 300, 100 Matsonford Road, Radnor, Pennsylvania 19087
(Address of Principal Executive Offices) (Zip Code)
Edward P. Macdonald, Esquire
Hartford Funds Management Company, LLC
5 Radnor Corporate Center, Suite 300
100 Matsonford Road
Radnor, Pennsylvania 19087
(Name and Address of Agent for Service)
Registrant’s telephone number, including area code: (610) 386-4068
Date of fiscal year end: December 31
Date of reporting period: June 30, 2014
Form N-CSR is to be used by management investment companies to file reports with the Commission not later than 10 days after the transmission to stockholders of any report that is required to be transmitted to stockholders under Rule 30e-1 under the Investment Company Act of 1940 (17 CFR 270.30e-1). The Commission may use the information provided on Form N-CSR in its regulatory, disclosure review, inspection, and policymaking roles.
A registrant is required to disclose the information specified by Form N-CSR, and the Commission will make this information public. A registrant is not required to respond to the collection of information contained in Form N-CSR unless the Form displays a currently valid Office of Management and Budget ("OMB") control number. Please direct comments concerning the accuracy of the information collection burden estimate and any suggestions for reducing the burden to Secretary, Securities and Exchange Commission, 100 F. Street, NE, Washington, DC 20549. The OMB has reviewed this collection of information under the clearance requirements of 44 U.S.C. § 3507.
Item 1. Reports to Stockholders.
HARTFORDFUNDS
 | | HARTFORD SERIES FUND, INC. 2014 Semi Annual Report |

A MESSAGE FROM THE PRESIDENT
Dear Fellow Shareholders:
Thank you for investing in Hartford HLS Funds.
Market Review
U.S. equities (as represented by the S&P 500 Index) started 2014 on a shaky note after posting a strong 32.39% gain in 2013. However, stocks managed to maintain modest gains throughout the first quarter and returned to a generally steady climb in the second quarter. Through June 30, 2014, the S&P 500 Index advanced 7.14%. It appears that much of the market volatility during the year can be attributed to heightened international tensions. In particular, the Russian annexation of Ukraine’s Crimean Peninsula and increased tensions in Iraq were cause for concern.
On the domestic front, subdued economic and employment reports slowed stocks’ progress early in the new year, although much of the weakness seemed to dissipate as the year’s unusually harsh winter subsided. And despite initial reactions to the idea, when the U.S. Federal Reserve began tapering its quantitative-easing program in January by reducing its bond purchases by $10 billion a month, the markets took the policy change in stride.
Despite a rough start to the year for financial markets, the global economy seems to be settling into a slow-but-steady recovery. While first-quarter U.S. gross domestic product (GDP) growth was disappointing at -2.9%, U.S. consumer spending, which is a significant contributor toward economic growth, rose by 3% during the quarter. It appears that Europe is also maintaining its own recovery: The International Monetary Fund projects that Europe’s full-year GDP growth may breach positive territory for the first time since 2011.
The impact of international affairs on stocks so far this year is an important reminder to stay informed about both domestic and international economic developments, and any effects they may have on your individual investment goals. If you have not already had a mid-year review of your portfolio, it may be a good time to meet with your financial advisor to review your progress and make certain your investments are prepared for all market environments:
| • | Is your portfolio properly diversified with an appropriate mix of stocks and bonds? |
| • | Is your portfolio positioned to take advantage of the global economic recovery, with investments in both domestic and international holdings? |
| • | Are your investments still in line with your risk tolerance and investment time horizon? |
Your financial professional can help you choose options within our fund family to help you reach your investment goals with confidence.
Thank you again for investing with Hartford HLS Funds.

James Davey
President
Hartford HLS Funds
1 The S&P 500 Index is a market capitalization-weighted price index composed of 500 widely held common stocks.
2The Dow Jones Industrial Average is an unmanaged, price-weighted index of 30 of the largest, most widely held stocks traded on the New York Stock Exchange.
Hartford Series Fund, Inc.
Table of Contents
This report is prepared for the general information of contract owners and is not an offer of contracts. It should not be used in connection with any offer, except in conjunction with the appropriate product prospectus which contains all pertinent product information including the applicable sales, administrative and other charges.
American Funds Asset Allocation HLS Fund inception 4/30/2008
(advised by Hartford Funds Management Company, LLC)
| Investment Goal: Seeks high total return (including income and capital gains) consistent with preservation of capital over the long term. |
Performance Overview 4/30/08 - 6/30/14
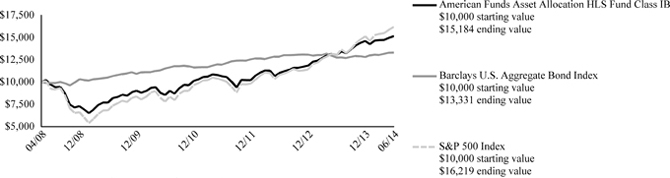
The chart above represents the hypothetical growth of a $10,000 investment in Class IB.
Average Annual Total Returns (as of 6/30/14)
| | 6 Month† | 1 Year | 5 Years | Since
Inception▲ |
| American Funds Asset Allocation HLS Fund IB | 3.80% | 16.33% | 14.51% | 7.01% |
| Barclays U.S. Aggregate Bond Index | 3.93% | 4.37% | 4.85% | 4.77% |
| S&P 500 Index | 7.14% | 24.61% | 18.83% | 8.16% |
PERFORMANCE DATA QUOTED REPRESENTS PAST PERFORMANCE AND DOES NOT GUARANTEE FUTURE RESULTS. The investment return and principal value of the investment will fluctuate so that investors’ shares, when redeemed, may be worth more or less than their original cost. Current performance may be lower or higher than the performance data quoted.
Total returns presented above were calculated using the Fund’s net asset value available to shareholders for sale or redemption of Fund shares on June 30, 2014, which may exclude investment transactions as of this date. All share class returns assume the reinvestment of all distributions at net asset value and the deduction of all fund expenses.
Barclays U.S. Aggregate Bond Index represents the U.S. investment-grade fixed-rate bond market.
S&P 500 Index is a market capitalization-weighted price index composed of 500 widely held common stocks.
The index is unmanaged, and its results include reinvested dividends and/or distributions, but do not reflect the effect of sales charges, commissions, expenses or taxes.
You cannot invest directly in an index.
As shown in the Fund's current prospectus dated May 1, 2014, the net total annual operating expense ratio for Class IB shares was 0.86% and the gross total annual operating expense ratio for Class IB shares was 1.26%. Actual expenses may be higher. Please see the accompanying Financial Highlights for expense ratios for the six-month period ended June 30, 2014.
Net operating expenses are the expenses paid to own the Fund. If the net operating expenses shown are lower than the gross operating expenses, then the net operating expenses reflect contractual fee waivers and expense reimbursements that may not be renewed. Contractual waivers or reimbursements remain in effect for as long as the Fund is a part of a master-feeder fund structure unless terminated or changed by the Fund or its Board of Directors if the fund structure changes. For more information about the fee arrangement and expiration dates, please see the expense table in the prospectus.
Gross operating expenses shown are before management fee waivers or expense caps. Performance information may reflect historical or current expense waivers or reimbursements, without which, performance would have been lower. For more information on fee waivers and/or expense reimbursements, please see the expense table in the prospectus.
The chart and table do not reflect the deductions of taxes, sales charges or other fees which may be applied at the variable life insurance, variable annuity or qualified retirement plan product level. Any such additional sales charges or other fees or expenses would lower the contract’s or plan’s performance.
All investments are subject to risk including the possible loss of principal. For a discussion of the Fund’s risks, please see the Main Risks section of this report. For more detailed information on the risks associated with an investment in the Fund, please see the prospectus.
How did the Fund perform?
The Class IB shares of the American Funds Asset Allocation HLS Fund returned 3.80% for the six-month period ended June 30, 2014, versus the returns of 7.14% for the S&P 500 Index and 3.93% for the Barclays U.S. Aggregate Bond Index. The Fund underperformed the 5.35% average return of the Variable Products-Underlying Funds Lipper Mixed-Asset Target Allocation Growth Funds peer group, a group of funds with investment strategies similar to those of the Fund.
The performance of the American Funds Asset Allocation HLS Fund is directly related to the performance of the American Funds Insurance Series – Asset Allocation Fund Class 1, in which the Fund invests. The financial statements of the American Funds Insurance Series – Asset Allocation Fund Class 1, including the Schedule of Investments, are provided in the accompanying report and should be read in conjunction with the American Funds Asset Allocation HLS Fund’s financial statements.
American Funds Blue Chip Income and Growth HLS Fund inception 4/30/2008
(advised by Hartford Funds Management Company, LLC)
| Investment Goal: Seeks to produce income exceeding the average yield on U.S. stocks generally and to provide an opportunity for growth of principal consistent with sound common stock investing. |
Performance Overview 4/30/08 - 6/30/14
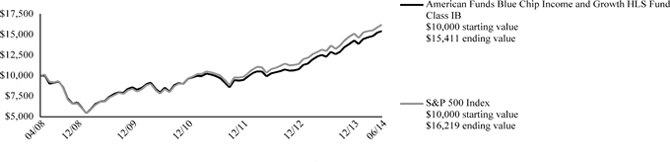
The chart above represents the hypothetical growth of a $10,000 investment in Class IB.
Average Annual Total Returns (as of 6/30/14)
| | 6 Month† | 1 Year | 5 Years | Since
Inception▲ |
| American Funds Blue Chip Income and Growth HLS Fund IB | 7.80% | 25.02% | 17.38% | 7.26% |
| S&P 500 Index | 7.14% | 24.61% | 18.83% | 8.16% |
PERFORMANCE DATA QUOTED REPRESENTS PAST PERFORMANCE AND DOES NOT GUARANTEE FUTURE RESULTS. The investment return and principal value of the investment will fluctuate so that investors’ shares, when redeemed, may be worth more or less than their original cost. Current performance may be lower or higher than the performance data quoted.
Total returns presented above were calculated using the Fund’s net asset value available to shareholders for sale or redemption of Fund shares on June 30, 2014, which may exclude investment transactions as of this date. All share class returns assume the reinvestment of all distributions at net asset value and the deduction of all fund expenses.
S&P 500 Index is a market capitalization-weighted price index composed of 500 widely held common stocks.
The index is unmanaged, and its results include reinvested dividends and/or distributions, but do not reflect the effect of sales charges, commissions, expenses or taxes.
You cannot invest directly in an index.
As shown in the Fund's current prospectus dated May 1, 2014, the net total annual operating expense ratio for Class IB shares was 0.99% and the gross total annual operating expense ratio for Class IB shares was 1.49%. Actual expenses may be higher. Please see the accompanying Financial Highlights for expense ratios for the six-month period ended June 30, 2014.
Net operating expenses are the expenses paid to own the Fund. If the net operating expenses shown are lower than the gross operating expenses, then the net operating expenses reflect contractual fee waivers and expense reimbursements that may not be renewed. Contractual waivers or reimbursements remain in effect for as long as the Fund is a part of a master-feeder fund structure unless terminated or changed by the Fund or its Board of Directors if the fund structure changes. For more information about the fee arrangement and expiration dates, please see the expense table in the prospectus.
Gross operating expenses shown are before management fee waivers or expense caps. Performance information may reflect historical or current expense waivers or reimbursements, without which, performance would have been lower. For more information on fee waivers and/or expense reimbursements, please see the expense table in the prospectus.
The chart and table do not reflect the deductions of taxes, sales charges or other fees which may be applied at the variable life insurance, variable annuity or qualified retirement plan product level. Any such additional sales charges or other fees or expenses would lower the contract’s or plan’s performance.
All investments are subject to risk including the possible loss of principal. For a discussion of the Fund’s risks, please see the Main Risks section of this report. For more detailed information on the risks associated with an investment in the Fund, please see the prospectus.
How did the Fund perform?
The Class IB shares of the American Funds Blue Chip Income and Growth HLS Fund returned 7.80% for the six-month period ended June 30, 2014, versus the return of 7.14% for the S&P 500 Index. The Fund outperformed the 6.54% average return of the Variable Products-Underlying Funds Lipper Large-Cap Core Funds peer group, a group of funds with investment strategies similar to those of the Fund.
The performance of the American Funds Blue Chip Income and Growth HLS Fund is directly related to the performance of the American Funds Insurance Series – Blue Chip Income and Growth Fund Class 1, in which the Fund invests. The financial statements of the American Funds Insurance Series – Blue Chip Income and Growth Fund Class 1, including the Schedule of Investments, are provided in the accompanying report and should be read in conjunction with the American Funds Blue Chip Income and Growth HLS Fund’s financial statements.
American Funds Bond HLS Fund inception 4/30/2008
(advised by Hartford Funds Management Company, LLC)
| Investment Goal: Seeks as high a level of current income as is consistent with the preservation of capital. |
Performance Overview 4/30/08 - 6/30/14
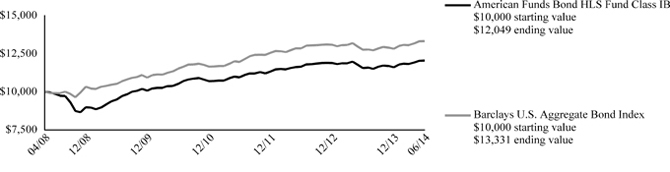
The chart above represents the hypothetical growth of a $10,000 investment in Class IB.
Average Annual Total Returns (as of 6/30/14)
| | 6 Month† | 1 Year | 5 Years | Since
Inception▲ |
| American Funds Bond HLS Fund IB | 3.79% | 4.19% | 4.87% | 3.07% |
| Barclays U.S. Aggregate Bond Index | 3.93% | 4.37% | 4.85% | 4.77% |
PERFORMANCE DATA QUOTED REPRESENTS PAST PERFORMANCE AND DOES NOT GUARANTEE FUTURE RESULTS. The investment return and principal value of the investment will fluctuate so that investors’ shares, when redeemed, may be worth more or less than their original cost. Current performance may be lower or higher than the performance data quoted.
Total returns presented above were calculated using the Fund’s net asset value available to shareholders for sale or redemption of Fund shares on June 30, 2014, which may exclude investment transactions as of this date. All share class returns assume the reinvestment of all distributions at net asset value and the deduction of all fund expenses.
Barclays U.S. Aggregate Bond Index represents the U.S. investment-grade fixed-rate bond market.
The index is unmanaged, and its results include reinvested dividends and/or distributions, but do not reflect the effect of sales charges, commissions, expenses or taxes.
You cannot invest directly in an index.
As shown in the Fund's current prospectus dated May 1, 2014, the net total annual operating expense ratio for Class IB shares was 0.93% and the gross total annual operating expense ratio for Class IB shares was 1.18%. Actual expenses may be higher. Please see the accompanying Financial Highlights for expense ratios for the six-month period ended June 30, 2014.
Net operating expenses are the expenses paid to own the Fund. If the net operating expenses shown are lower than the gross operating expenses, then the net operating expenses reflect contractual fee waivers and expense reimbursements that may not be renewed. Contractual waivers or reimbursements remain in effect for as long as the Fund is a part of a master-feeder fund structure unless terminated or changed by the Fund or its Board of Directors if the fund structure changes. For more information about the fee arrangement and expiration dates, please see the expense table in the prospectus.
Gross operating expenses shown are before management fee waivers or expense caps. Performance information may reflect historical or current expense waivers or reimbursements, without which, performance would have been lower. For more information on fee waivers and/or expense reimbursements, please see the expense table in the prospectus.
The chart and table do not reflect the deductions of taxes, sales charges or other fees which may be applied at the variable life insurance, variable annuity or qualified retirement plan product level. Any such additional sales charges or other fees or expenses would lower the contract’s or plan’s performance.
All investments are subject to risk including the possible loss of principal. For a discussion of the Fund’s risks, please see the Main Risks section of this report. For more detailed information on the risks associated with an investment in the Fund, please see the prospectus.
How did the Fund perform?
The Class IB shares of the American Funds Bond HLS Fund returned 3.79% for the six-month period ended June 30, 2014, versus the return of 3.93% for the Barclays U.S. Aggregate Bond Index. The Fund underperformed the 4.05% average return of the Variable Products-Underlying Funds Lipper Intermediate Investment Grade Debt Funds peer group, a group of funds with investment strategies similar to those of the Fund.
The performance of the American Funds Bond HLS Fund is directly related to the performance of the American Funds Insurance Series – Bond Fund Class 1, in which the Fund invests. The financial statements of the American Funds Insurance Series – Bond Fund Class 1, including the Schedule of Investments, are provided in the accompanying report and should be read in conjunction with the American Funds Bond HLS Fund’s financial statements.
American Funds Global Bond HLS Fund inception 4/30/2008
(advised by Hartford Funds Management Company, LLC)
| Investment Goal: Seeks to provide you, over the long-term, with a high level of total return consistent with prudent investment management. |
Performance Overview 4/30/08 - 6/30/14
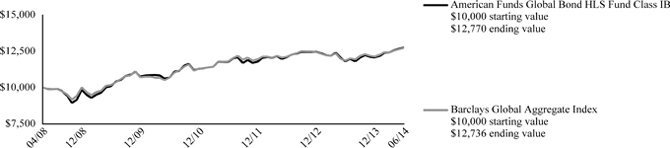
The chart above represents the hypothetical growth of a $10,000 investment in Class IB.
| Average Annual Total Returns (as of 6/30/14) |
| | 6 Month† | 1 Year | 5 Years | Since
Inception▲ |
| American Funds Global Bond HLS Fund IB | 5.59% | 8.03% | 4.81% | 4.04% |
| Barclays Global Aggregate Index | 4.94% | 7.39% | 4.60% | 4.00% |
PERFORMANCE DATA QUOTED REPRESENTS PAST PERFORMANCE AND DOES NOT GUARANTEE FUTURE RESULTS. The investment return and principal value of the investment will fluctuate so that investors’ shares, when redeemed, may be worth more or less than their original cost. Current performance may be lower or higher than the performance data quoted.
Total returns presented above were calculated using the Fund’s net asset value available to shareholders for sale or redemption of Fund shares on June 30, 2014, which may exclude investment transactions as of this date. All share class returns assume the reinvestment of all distributions at net asset value and the deduction of all fund expenses.
Barclays Global Aggregate Index represents the global investment-grade fixed-income markets.
The index is unmanaged, and its results include reinvested dividends and/or distributions, but do not reflect the effect of sales charges, commissions, expenses or taxes.
You cannot invest directly in an index.
As shown in the Fund's current prospectus dated May 1, 2014, the net total annual operating expense ratio for Class IB shares was 1.15% and the gross total annual operating expense ratio for Class IB shares was 1.65%. Actual expenses may be higher. Please see the accompanying Financial Highlights for expense ratios for the six-month period ended June 30, 2014.
Net operating expenses are the expenses paid to own the Fund. If the net operating expenses shown are lower than the gross operating expenses, then the net operating expenses reflect contractual fee waivers and expense reimbursements that may not be renewed. Contractual waivers or reimbursements remain in effect for as long as the Fund is a part of a master-feeder fund structure unless terminated or changed by the Fund or its Board of Directors if the fund structure changes. For more information about the fee arrangement and expiration dates, please see the expense table in the prospectus.
Gross operating expenses shown are before management fee waivers or expense caps. Performance information may reflect historical or current expense waivers or reimbursements, without which, performance would have been lower. For more information on fee waivers and/or expense reimbursements, please see the expense table in the prospectus.
The chart and table do not reflect the deductions of taxes, sales charges or other fees which may be applied at the variable life insurance, variable annuity or qualified retirement plan product level. Any such additional sales charges or other fees or expenses would lower the contract’s or plan’s performance.
All investments are subject to risk including the possible loss of principal. For a discussion of the Fund’s risks, please see the Main Risks section of this report. For more detailed information on the risks associated with an investment in the Fund, please see the prospectus.
How did the Fund perform?
The Class IB shares of the American Funds Global Bond HLS Fund returned 5.59% for the six-month period ended June 30, 2014, versus the return of 4.94% for the Barclays Global Aggregate Index. The Fund outperformed the 4.73% average return of the Variable Products-Underlying Funds Lipper Global Income Funds peer group, a group of funds with investment strategies similar to those of the Fund.
The performance of the American Funds Global Bond HLS Fund is directly related to the performance of the American Funds Insurance Series – Global Bond Fund Class 1, in which the Fund invests. The financial statements of the American Funds Insurance Series – Global Bond Fund Class 1, including the Schedule of Investments, are provided in the accompanying report and should be read in conjunction with the American Funds Global Bond HLS Fund’s financial statements.
American Funds Global Growth and Income HLS Fund inception 4/30/2008
(advised by Hartford Funds Management Company, LLC)
| Investment Goal: Seeks long-term growth of capital while providing current income. |
Performance Overview 4/30/08 - 6/30/14
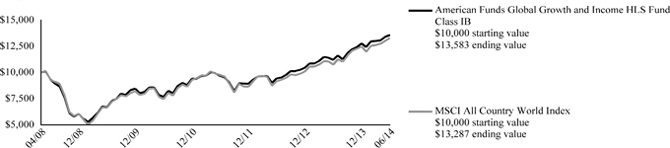
The chart above represents the hypothetical growth of a $10,000 investment in Class IB.
Average Annual Total Returns (as of 6/30/14)
| | 6 Month† | 1 Year | 5 Years | Since
Inception▲ |
| American Funds Global Growth and Income HLS Fund IB | 6.32% | 21.15% | 15.22% | 5.09% |
| MSCI All Country World Index | 6.50% | 23.58% | 14.88% | 4.72% |
PERFORMANCE DATA QUOTED REPRESENTS PAST PERFORMANCE AND DOES NOT GUARANTEE FUTURE RESULTS. The investment return and principal value of the investment will fluctuate so that investors’ shares, when redeemed, may be worth more or less than their original cost. Current performance may be lower or higher than the performance data quoted.
Total returns presented above were calculated using the Fund’s net asset value available to shareholders for sale or redemption of Fund shares on June 30, 2014, which may exclude investment transactions as of this date. All share class returns assume the reinvestment of all distributions at net asset value and the deduction of all fund expenses.
MSCI All Country World Index is a free float-adjusted market capitalization weighted index that is designed to measure equity market results in the global developed and emerging markets, consisting of more than 40 developed and emerging market country indices.
The index is unmanaged, and its results include reinvested dividends and/or distributions, but do not reflect the effect of sales charges, commissions, expenses or taxes.
You cannot invest directly in an index.
As shown in the Fund's current prospectus dated May 1, 2014, the net total annual operating expense ratio for Class IB shares was 1.18% and the gross total annual operating expense ratio for Class IB shares was 1.73%. Actual expenses may be higher. Please see the accompanying Financial Highlights for expense ratios for the six-month period ended June 30, 2014.
Net operating expenses are the expenses paid to own the Fund. If the net operating expenses shown are lower than the gross operating expenses, then the net operating expenses reflect contractual fee waivers and expense reimbursements that may not be renewed. Contractual waivers or reimbursements remain in effect for as long as the Fund is a part of a master-feeder fund structure unless terminated or changed by the Fund or its Board of Directors if the fund structure changes. For more information about the fee arrangement and expiration dates, please see the expense table in the prospectus.
Gross operating expenses shown are before management fee waivers or expense caps. Performance information may reflect historical or current expense waivers or reimbursements, without which, performance would have been lower. For more information on fee waivers and/or expense reimbursements, please see the expense table in the prospectus.
The chart and table do not reflect the deductions of taxes, sales charges or other fees which may be applied at the variable life insurance, variable annuity or qualified retirement plan product level. Any such additional sales charges or other fees or expenses would lower the contract’s or plan’s performance.
All investments are subject to risk including the possible loss of principal. For a discussion of the Fund’s risks, please see the Main Risks section of this report. For more detailed information on the risks associated with an investment in the Fund, please see the prospectus.
How did the Fund perform?
The Class IB shares of the American Funds Global Growth and Income HLS Fund returned 6.32% for the six-month period ended June 30, 2014, versus the return of 6.50% for the MSCI All Country World Index. The Fund outperformed the 3.87% average return of the Variable Products-Underlying Funds Lipper Global Multi-Cap Growth Funds peer group, a group of funds with investment strategies similar to those of the Fund.
The performance of the American Funds Global Growth and Income HLS Fund is directly related to the performance of the American Funds Insurance Series – Global Growth and Income Fund Class 1, in which the Fund invests. The financial statements of the American Funds Insurance Series – Global Growth and Income Fund Class 1, including the Schedule of Investments, are provided in the accompanying report and should be read in conjunction with the American Funds Global Growth and Income HLS Fund’s financial statements.
American Funds Global Growth HLS Fund inception 4/30/2008
(advised by Hartford Funds Management Company, LLC)
| Investment Goal: Seeks long-term growth of capital. |
Performance Overview 4/30/08 - 6/30/14
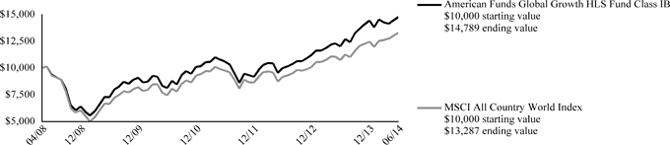
The chart above represents the hypothetical growth of a $10,000 investment in Class IB.
Average Annual Total Returns (as of 6/30/14)
| | 6 Month† | 1 Year | 5 Years | Since
Inception▲ |
| American Funds Global Growth HLS Fund IB | 2.31% | 22.79% | 15.20% | 6.55% |
| MSCI All Country World Index | 6.50% | 23.58% | 14.88% | 4.72% |
PERFORMANCE DATA QUOTED REPRESENTS PAST PERFORMANCE AND DOES NOT GUARANTEE FUTURE RESULTS. The investment return and principal value of the investment will fluctuate so that investors’ shares, when redeemed, may be worth more or less than their original cost. Current performance may be lower or higher than the performance data quoted.
Total returns presented above were calculated using the Fund’s net asset value available to shareholders for sale or redemption of Fund shares on June 30, 2014, which may exclude investment transactions as of this date. All share class returns assume the reinvestment of all distributions at net asset value and the deduction of all fund expenses.
MSCI All Country World Index is a free float-adjusted market capitalization weighted index that is designed to measure equity market results in the global developed and emerging markets, consisting of more than 40 developed and emerging market country indices.
The index is unmanaged, and its results include reinvested dividends and/or distributions, but do not reflect the effect of sales charges, commissions, expenses or taxes.
You cannot invest directly in an index.
As shown in the Fund's current prospectus dated May 1, 2014, the net total annual operating expense ratio for Class IB shares was 1.14% and the gross total annual operating expense ratio for Class IB shares was 1.89%. Actual expenses may be higher. Please see the accompanying Financial Highlights for expense ratios for the six-month period ended June 30, 2014.
Net operating expenses are the expenses paid to own the Fund. If the net operating expenses shown are lower than the gross operating expenses, then the net operating expenses reflect contractual fee waivers and expense reimbursements that may not be renewed. Contractual waivers or reimbursements remain in effect for as long as the Fund is a part of a master-feeder fund structure unless terminated or changed by the Fund or its Board of Directors if the fund structure changes. For more information about the fee arrangement and expiration dates, please see the expense table in the prospectus.
Gross operating expenses shown are before management fee waivers or expense caps. Performance information may reflect historical or current expense waivers or reimbursements, without which, performance would have been lower. For more information on fee waivers and/or expense reimbursements, please see the expense table in the prospectus.
The chart and table do not reflect the deductions of taxes, sales charges or other fees which may be applied at the variable life insurance, variable annuity or qualified retirement plan product level. Any such additional sales charges or other fees or expenses would lower the contract’s or plan’s performance.
All investments are subject to risk including the possible loss of principal. For a discussion of the Fund’s risks, please see the Main Risks section of this report. For more detailed information on the risks associated with an investment in the Fund, please see the prospectus.
How did the Fund perform?
The Class IB shares of the American Funds Global Growth HLS Fund returned 2.31% for the six-month period ended June 30, 2014, versus the return of 6.50% for the MSCI All Country World Index. The Fund underperformed the 5.08% average return of the Variable Products-Underlying Funds Lipper Global Multi-Cap Core Funds peer group, a group of funds with investment strategies similar to those of the Fund.
The performance of the American Funds Global Growth HLS Fund is directly related to the performance of the American Funds Insurance Series – Global Growth Fund Class 1, in which the Fund invests. The financial statements of the American Funds Insurance Series – Global Growth Fund Class 1, including the Schedule of Investments, are provided in the accompanying report and should be read in conjunction with the American Funds Global Growth HLS Fund’s financial statements.
American Funds Global Small Capitalization HLS Fund inception 4/30/2008
(advised by Hartford Funds Management Company, LLC)
| Investment Goal: Seeks long-term growth of capital. |
Performance Overview 4/30/08 - 6/30/14
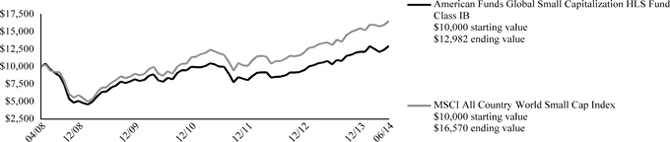
The chart above represents the hypothetical growth of a $10,000 investment in Class IB.
Average Annual Total Returns (as of 6/30/14)
| | 6 Month† | 1 Year | 5 Years | Since
Inception▲ |
| American Funds Global Small Capitalization HLS Fund IB | 6.86% | 25.63% | 14.96% | 4.32% |
| MSCI All Country World Small Cap Index | 6.74% | 26.47% | 18.63% | 8.53% |
PERFORMANCE DATA QUOTED REPRESENTS PAST PERFORMANCE AND DOES NOT GUARANTEE FUTURE RESULTS. The investment return and principal value of the investment will fluctuate so that investors’ shares, when redeemed, may be worth more or less than their original cost. Current performance may be lower or higher than the performance data quoted.
Total returns presented above were calculated using the Fund’s net asset value available to shareholders for sale or redemption of Fund shares on June 30, 2014, which may exclude investment transactions as of this date. All share class returns assume the reinvestment of all distributions at net asset value and the deduction of all fund expenses.
MSCI All Country World Small Cap Index is a free float-adjusted market capitalization-weighted index that is designed to measure equity market performance of smaller capitalization companies in both developed and emerging markets.
The index is unmanaged, and its results include reinvested dividends and/or distributions, but do not reflect the effect of sales charges, commissions, expenses or taxes.
You cannot invest directly in an index.
As shown in the Fund's current prospectus dated May 1, 2014, the net total annual operating expense ratio for Class IB shares was 1.32% and the gross total annual operating expense ratio for Class IB shares was 1.87%. Actual expenses may be higher. Please see the accompanying Financial Highlights for expense ratios for the six-month period ended June 30, 2014.
Net operating expenses are the expenses paid to own the Fund. If the net operating expenses shown are lower than the gross operating expenses, then the net operating expenses reflect contractual fee waivers and expense reimbursements that may not be renewed. Contractual waivers or reimbursements remain in effect for as long as the Fund is a part of a master-feeder fund structure unless terminated or changed by the Fund or its Board of Directors if the fund structure changes. For more information about the fee arrangement and expiration dates, please see the expense table in the prospectus.
Gross operating expenses shown are before management fee waivers or expense caps. Performance information may reflect historical or current expense waivers or reimbursements, without which, performance would have been lower. For more information on fee waivers and/or expense reimbursements, please see the expense table in the prospectus.
The chart and table do not reflect the deductions of taxes, sales charges or other fees which may be applied at the variable life insurance, variable annuity or qualified retirement plan product level. Any such additional sales charges or other fees or expenses would lower the contract’s or plan’s performance.
All investments are subject to risk including the possible loss of principal. For a discussion of the Fund’s risks, please see the Main Risks section of this report. For more detailed information on the risks associated with an investment in the Fund, please see the prospectus.
How did the Fund perform?
The Class IB shares of the American Funds Global Small Capitalization HLS Fund returned 6.86% for the six-month period ended June 30, 2014, versus the return of 6.74% for the MSCI All Country World Small Cap Index. The Fund outperformed the 4.89% average return of the Variable Products-Underlying Funds Lipper Global Small/Mid-Cap Funds peer group, a group of funds with investment strategies similar to those of the Fund.
The performance of the American Funds Global Small Capitalization HLS Fund is directly related to the performance of the American Funds Insurance Series – Global Small Capitalization Fund Class 1, in which the Fund invests. The financial statements of the American Funds Insurance Series – Global Small Capitalization Fund Class 1, including the Schedule of Investments, are provided in the accompanying report and should be read in conjunction with the American Funds Global Small Capitalization HLS Fund’s financial statements.
American Funds Growth HLS Fund inception 4/30/2008
(advised by Hartford Funds Management Company, LLC)
| Investment Goal: Seeks growth of capital. |
Performance Overview 4/30/08 - 6/30/14
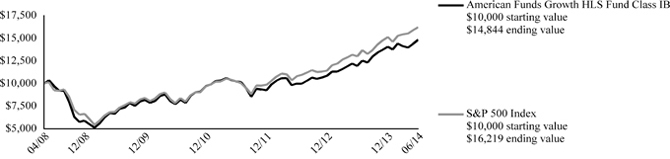
The chart above represents the hypothetical growth of a $10,000 investment in Class IB.
Average Annual Total Returns (as of 6/30/14)
| | 6 Month† | 1 Year | 5 Years | Since
Inception▲ |
| American Funds Growth HLS Fund IB | 5.35% | 24.25% | 17.48% | 6.62% |
| S&P 500 Index | 7.14% | 24.61% | 18.83% | 8.16% |
PERFORMANCE DATA QUOTED REPRESENTS PAST PERFORMANCE AND DOES NOT GUARANTEE FUTURE RESULTS. The investment return and principal value of the investment will fluctuate so that investors’ shares, when redeemed, may be worth more or less than their original cost. Current performance may be lower or higher than the performance data quoted.
Total returns presented above were calculated using the Fund’s net asset value available to shareholders for sale or redemption of Fund shares on June 30, 2014, which may exclude investment transactions as of this date. All share class returns assume the reinvestment of all distributions at net asset value and the deduction of all fund expenses.
S&P 500 Index is a market capitalization-weighted price index composed of 500 widely held common stocks.
The index is unmanaged, and its results include reinvested dividends and/or distributions, but do not reflect the effect of sales charges, commissions, expenses or taxes.
You cannot invest directly in an index.
As shown in the Fund's current prospectus dated May 1, 2014, the net total annual operating expense ratio for Class IB shares was 0.89% and the gross total annual operating expense ratio for Class IB shares was 1.39%. Actual expenses may be higher. Please see the accompanying Financial Highlights for expense ratios for the six-month period ended June 30, 2014.
Net operating expenses are the expenses paid to own the Fund. If the net operating expenses shown are lower than the gross operating expenses, then the net operating expenses reflect contractual fee waivers and expense reimbursements that may not be renewed. Contractual waivers or reimbursements remain in effect for as long as the Fund is a part of a master-feeder fund structure unless terminated or changed by the Fund or its Board of Directors if the fund structure changes. For more information about the fee arrangement and expiration dates, please see the expense table in the prospectus.
Gross operating expenses shown are before management fee waivers or expense caps. Performance information may reflect historical or current expense waivers or reimbursements, without which, performance would have been lower. For more information on fee waivers and/or expense reimbursements, please see the expense table in the prospectus.
The chart and table do not reflect the deductions of taxes, sales charges or other fees which may be applied at the variable life insurance, variable annuity or qualified retirement plan product level. Any such additional sales charges or other fees or expenses would lower the contract’s or plan’s performance.
All investments are subject to risk including the possible loss of principal. For a discussion of the Fund’s risks, please see the Main Risks section of this report. For more detailed information on the risks associated with an investment in the Fund, please see the prospectus.
How did the Fund perform?
The Class IB shares of the American Funds Growth HLS Fund returned 5.35% for the six-month period ended June 30, 2014, versus the return of 7.14% for the S&P 500 Index. The Fund outperformed the 4.58% average return of the Variable Products-Underlying Funds Lipper Large-Cap Growth Funds peer group, a group of funds with investment strategies similar to those of the Fund.
The performance of the American Funds Growth HLS Fund is directly related to the performance of the American Funds Insurance Series – Growth Fund Class 1, in which the Fund invests. The financial statements of the American Funds Insurance Series – Growth Fund Class 1, including the Schedule of Investments, are provided in the accompanying report and should be read in conjunction with the American Funds Growth HLS Fund’s financial statements.
American Funds Growth-Income HLS Fund inception 4/30/2008
(advised by Hartford Funds Management Company, LLC)
| Investment Goal: Seeks long-term growth of capital and income. |
Performance Overview 4/30/08 - 6/30/14
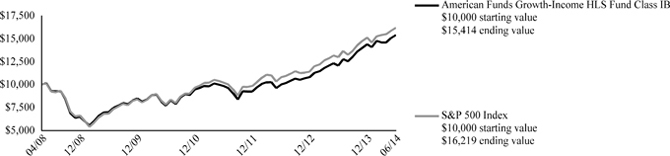
The chart above represents the hypothetical growth of a $10,000 investment in Class IB.
Average Annual Total Returns (as of 6/30/14)
| | 6 Month† | 1 Year | 5 Years | Since
Inception▲ |
| American Funds Growth-Income HLS Fund IB | 6.79% | 27.42% | 17.10% | 7.27% |
| S&P 500 Index | 7.14% | 24.61% | 18.83% | 8.16% |
PERFORMANCE DATA QUOTED REPRESENTS PAST PERFORMANCE AND DOES NOT GUARANTEE FUTURE RESULTS. The investment return and principal value of the investment will fluctuate so that investors’ shares, when redeemed, may be worth more or less than their original cost. Current performance may be lower or higher than the performance data quoted.
Total returns presented above were calculated using the Fund’s net asset value available to shareholders for sale or redemption of Fund shares on June 30, 2014, which may exclude investment transactions as of this date. All share class returns assume the reinvestment of all distributions at net asset value and the deduction of all fund expenses.
S&P 500 Index is a market capitalization-weighted price index composed of 500 widely held common stocks.
The index is unmanaged, and its results include reinvested dividends and/or distributions, but do not reflect the effect of sales charges, commissions, expenses or taxes.
You cannot invest directly in an index.
As shown in the Fund's current prospectus dated May 1, 2014, the net total annual operating expense ratio for Class IB shares was 0.83% and the gross total annual operating expense ratio for Class IB shares was 1.28%. Actual expenses may be higher. Please see the accompanying Financial Highlights for expense ratios for the six-month period ended June 30, 2014.
Net operating expenses are the expenses paid to own the Fund. If the net operating expenses shown are lower than the gross operating expenses, then the net operating expenses reflect contractual fee waivers and expense reimbursements that may not be renewed. Contractual waivers or reimbursements remain in effect for as long as the Fund is a part of a master-feeder fund structure unless terminated or changed by the Fund or its Board of Directors if the fund structure changes. For more information about the fee arrangement and expiration dates, please see the expense table in the prospectus.
Gross operating expenses shown are before management fee waivers or expense caps. Performance information may reflect historical or current expense waivers or reimbursements, without which, performance would have been lower. For more information on fee waivers and/or expense reimbursements, please see the expense table in the prospectus.
The chart and table do not reflect the deductions of taxes, sales charges or other fees which may be applied at the variable life insurance, variable annuity or qualified retirement plan product level. Any such additional sales charges or other fees or expenses would lower the contract’s or plan’s performance.
All investments are subject to risk including the possible loss of principal. For a discussion of the Fund’s risks, please see the Main Risks section of this report. For more detailed information on the risks associated with an investment in the Fund, please see the prospectus.
How did the Fund perform?
The Class IB shares of the American Funds Growth-Income HLS Fund returned 6.79% for the six-month period ended June 30, 2014, versus the return of 7.14% for the S&P 500 Index. The Fund outperformed the 6.54% average return of the Variable Products-Underlying Funds Lipper Large-Cap Core Funds peer group, a group of funds with investment strategies similar to those of the Fund.
The performance of the American Funds Growth-Income HLS Fund is directly related to the performance of the American Funds Insurance Series – Growth-Income Fund Class 1, in which the Fund invests. The financial statements of the American Funds Insurance Series – Growth-Income Fund Class 1, including the Schedule of Investments, are provided in the accompanying report and should be read in conjunction with the American Funds Growth-Income HLS Fund’s financial statements.
American Funds International HLS Fund inception 4/30/2008
(advised by Hartford Funds Management Company, LLC)
| Investment Goal: Seeks long-term growth of capital. |
Performance Overview 4/30/08 - 6/30/14
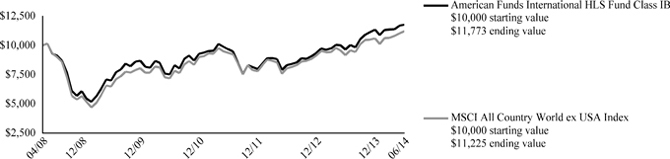
The chart above represents the hypothetical growth of a $10,000 investment in Class IB.
Average Annual Total Returns (as of 6/30/14)
| | 6 Month† | 1 Year | 5 Years | Since
Inception▲ |
| American Funds International HLS Fund IB | 3.60% | 21.77% | 10.94% | 2.68% |
| MSCI All Country World ex USA Index | 5.89% | 22.27% | 11.59% | 1.89% |
PERFORMANCE DATA QUOTED REPRESENTS PAST PERFORMANCE AND DOES NOT GUARANTEE FUTURE RESULTS. The investment return and principal value of the investment will fluctuate so that investors’ shares, when redeemed, may be worth more or less than their original cost. Current performance may be lower or higher than the performance data quoted.
Total returns presented above were calculated using the Fund’s net asset value available to shareholders for sale or redemption of Fund shares on June 30, 2014, which may exclude investment transactions as of this date. All share class returns assume the reinvestment of all distributions at net asset value and the deduction of all fund expenses.
MSCI All Country World ex USA Index is a broad-based, unmanaged, market capitalization weighted, total return index that measures the performance of both developed and emerging stock markets, excluding the U.S. The index is calculated to exclude companies and share classes which cannot be freely purchased by foreigners.
The index is unmanaged, and its results include reinvested dividends and/or distributions, but do not reflect the effect of sales charges, commissions, expenses or taxes.
You cannot invest directly in an index.
As shown in the Fund's current prospectus dated May 1, 2014, the net total annual operating expense ratio for Class IB shares was 1.09% and the gross total annual operating expense ratio for Class IB shares was 1.69%. Actual expenses may be higher. Please see the accompanying Financial Highlights for expense ratios for the six-month period ended June 30, 2014.
Net operating expenses are the expenses paid to own the Fund. If the net operating expenses shown are lower than the gross operating expenses, then the net operating expenses reflect contractual fee waivers and expense reimbursements that may not be renewed. Contractual waivers or reimbursements remain in effect for as long as the Fund is a part of a master-feeder fund structure unless terminated or changed by the Fund or its Board of Directors if the fund structure changes. For more information about the fee arrangement and expiration dates, please see the expense table in the prospectus.
Gross operating expenses shown are before management fee waivers or expense caps. Performance information may reflect historical or current expense waivers or reimbursements, without which, performance would have been lower. For more information on fee waivers and/or expense reimbursements, please see the expense table in the prospectus.
The chart and table do not reflect the deductions of taxes, sales charges or other fees which may be applied at the variable life insurance, variable annuity or qualified retirement plan product level. Any such additional sales charges or other fees or expenses would lower the contract’s or plan’s performance.
All investments are subject to risk including the possible loss of principal. For a discussion of the Fund’s risks, please see the Main Risks section of this report. For more detailed information on the risks associated with an investment in the Fund, please see the prospectus.
How did the Fund perform?
The Class IB shares of the American Funds International HLS Fund returned 3.60% for the six-month period ended June 30, 2014, versus the return of 5.89% for the MSCI All Country World ex USA Index. The Fund underperformed the 4.48% average return of the Variable Products-Underlying Funds Lipper International Multi-Cap Core Funds peer group, a group of funds with investment strategies similar to those of the Fund.
The performance of the American Funds International HLS Fund is directly related to the performance of the American Funds Insurance Series – International Fund Class 1, in which the Fund invests. The financial statements of the American Funds Insurance Series – International Fund Class 1, including the Schedule of Investments, are provided in the accompanying report and should be read in conjunction with the American Funds International HLS Fund’s financial statements.
American Funds New World HLS Fund inception 4/30/2008
(advised by Hartford Funds Management Company, LLC)
| Investment Goal: Seeks long-term capital appreciation. |
Performance Overview 4/30/08 - 6/30/14
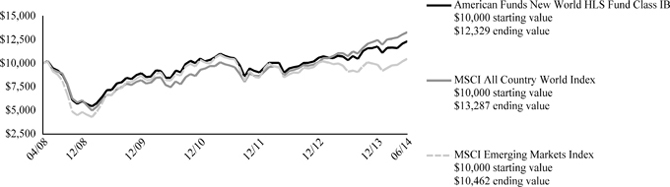
The chart above represents the hypothetical growth of a $10,000 investment in Class IB.
Average Annual Total Returns (as of 6/30/14)
| | 6 Month† | 1 Year | 5 Years | Since
Inception▲ |
| American Funds New World HLS Fund IB | 4.69% | 19.30% | 11.39% | 3.45% |
| MSCI All Country World Index | 6.50% | 23.58% | 14.88% | 4.72% |
| MSCI Emerging Markets Index | 6.32% | 14.68% | 9.58% | 0.73% |
PERFORMANCE DATA QUOTED REPRESENTS PAST PERFORMANCE AND DOES NOT GUARANTEE FUTURE RESULTS. The investment return and principal value of the investment will fluctuate so that investors’ shares, when redeemed, may be worth more or less than their original cost. Current performance may be lower or higher than the performance data quoted.
Total returns presented above were calculated using the Fund’s net asset value available to shareholders for sale or redemption of Fund shares on June 30, 2014, which may exclude investment transactions as of this date. All share class returns assume the reinvestment of all distributions at net asset value and the deduction of all fund expenses.
MSCI All Country World Index is a free float-adjusted market capitalization weighted index that is designed to measure the equity market performance of developed and emerging markets. The MSCI All Country World Index consists of 44 country indices comprising 23 developed and 21 emerging market country indices.
MSCI Emerging Markets Index is a free float-adjusted market capitalization index that is designed to measure equity market performance of emerging markets. The MSCI Emerging Markets Index consists of the following 21 emerging market country indices: Brazil, Chile, China, Colombia, Czech Republic, Egypt, Greece, Hungary, India, Indonesia, Korea, Malaysia, Mexico, Peru, Philippines, Poland, Russia, South Africa, Taiwan, Thailand, and Turkey.
The index is unmanaged, and its results include reinvested dividends and/or distributions, but do not reflect the effect of sales charges, commissions, expenses or taxes.
You cannot invest directly in an index.
As shown in the Fund's current prospectus dated May 1, 2014, the net total annual operating expense ratio for Class IB shares was 1.36% and the gross total annual operating expense ratio for Class IB shares was 2.21%. Actual expenses may be higher. Please see the accompanying Financial Highlights for expense ratios for the six-month period ended June 30, 2014.
Net operating expenses are the expenses paid to own the Fund. If the net operating expenses shown are lower than the gross operating expenses, then the net operating expenses reflect contractual fee waivers and expense reimbursements that may not be renewed. Contractual waivers or reimbursements remain in effect for as long as the Fund is a part of a master-feeder fund structure unless terminated or changed by the Fund or its Board of Directors if the fund structure changes. For more information about the fee arrangement and expiration dates, please see the expense table in the prospectus.
Gross operating expenses shown are before management fee waivers or expense caps. Performance information may reflect historical or current expense waivers or reimbursements, without which, performance would have been lower. For more information on fee waivers and/or expense reimbursements, please see the expense table in the prospectus.
The chart and table do not reflect the deductions of taxes, sales charges or other fees which may be applied at the variable life insurance, variable annuity or qualified retirement plan product level. Any such additional sales charges or other fees or expenses would lower the contract’s or plan’s performance.
All investments are subject to risk including the possible loss of principal. For a discussion of the Fund’s risks, please see the Main Risks section of this report. For more detailed information on the risks associated with an investment in the Fund, please see the prospectus.
How did the Fund perform?
The Class IB shares of the American Funds New World HLS Fund returned 4.69% for the six-month period ended June 30, 2014, versus the returns of 6.50% for the MSCI All Country World Index and 6.32% for the MSCI Emerging Markets Index. The Fund underperformed the 5.90% average return of the Variable Products-Underlying Funds Lipper Emerging Markets Funds peer group, a group of funds with investment strategies similar to those of the Fund.
The performance of the American Funds New World HLS Fund is directly related to the performance of the American Funds Insurance Series – New World Fund Class 1, in which the Fund invests. The financial statements of the American Funds Insurance Series – New World Fund Class 1, including the Schedule of Investments, are provided in the accompanying report and should be read in conjunction with the American Funds New World HLS Fund’s financial statements.
| American Funds Asset Allocation HLS Fund |
| Schedule of Investments |
| June 30, 2014 (Unaudited) |
| (000’s Omitted) |
| Shares | | | | | | Market Value ╪ | |
| Investment Companies - 100.0% |
| | 2,629 | | | American Funds Insurance Series - Asset Allocation Fund Class 1 | | | | | | $ | 58,442 | |
| | | | | | | | | | | | | |
| | | | | Total Investment Companies | | | | | | | | |
| | | | | (Cost $48,621) | | | | | | $ | 58,442 | |
| | | | | | | | | | | | | |
| | | | | Total Investments | | | | | | | | |
| | | | | (Cost $48,621) ▲ | | | 100.0 | % | | $ | 58,442 | |
| | | | | Other Assets and Liabilities | | | — | % | | | (16 | ) |
| | | | | Total Net Assets | | | 100.0 | % | | $ | 58,426 | |
| Note: | Percentage of investments as shown is the ratio of the total market value to total net assets. |
| ▲ | At June 30, 2014, the cost of securities for federal income tax purposes was $48,942 and the aggregate gross unrealized appreciation and depreciation based on that cost were: |
| Unrealized Appreciation | | $ | 9,500 | |
| Unrealized Depreciation | | | — | |
| Net Unrealized Appreciation | | $ | 9,500 | |
| ╪ | See Significant Accounting Policies of accompanying Notes to Financial Statements regarding valuation of securities. |
At June 30, 2014, the investment valuation hierarchy levels were:
| | Assets: | | | | |
| | Investment in Securities - Level 1 | | $ | 58,442 | |
| | Total | | $ | 58,442 | |
| American Funds Blue Chip Income and Growth HLS Fund |
| Schedule of Investments |
| June 30, 2014 (Unaudited) |
| (000’s Omitted) |
| Shares | | | | | | | | Market Value ╪ | |
| Investment Companies - 100.0% |
| | 3,150 | | | American Funds Insurance Series - Blue Chip Income and Growth Fund Class 1 | | | | | | $ | 44,510 | |
| | | | | | | | | | | | | |
| | | | | Total Investment Companies | | | | | | | | |
| | | | | (Cost $31,243) | | | | | | $ | 44,510 | |
| | | | | | | | | | | | | |
| | | | | Total Investments | | | | | | | | |
| | | | | (Cost $31,243) ▲ | | | 100.0 | % | | $ | 44,510 | |
| | | | | Other Assets and Liabilities | | | — | % | | | (15 | ) |
| | | | | Total Net Assets | | | 100.0 | % | | $ | 44,495 | |
| Note: | Percentage of investments as shown is the ratio of the total market value to total net assets. |
| ▲ | At June 30, 2014, the cost of securities for federal income tax purposes was $31,837 and the aggregate gross unrealized appreciation and depreciation based on that cost were: |
| Unrealized Appreciation | | $ | 12,673 | |
| Unrealized Depreciation | | | — | |
| Net Unrealized Appreciation | | $ | 12,673 | |
| ╪ | See Significant Accounting Policies of accompanying Notes to Financial Statements regarding valuation of securities. |
At June 30, 2014, the investment valuation hierarchy levels were:
| | Assets: | | | | |
| | Investment in Securities - Level 1 | | $ | 44,510 | |
| | Total | | $ | 44,510 | |
The accompanying notes are an integral part of these financial statements.
| American Funds Bond HLS Fund |
| Schedule of Investments |
| June 30, 2014 (Unaudited) |
| (000’s Omitted) |
| Shares | | | | | | Market Value ╪ | |
| Investment Companies - 100.0% |
| | 19,968 | | | American Funds Insurance Series - Bond Fund Class 1 | | | | | | $ | 222,239 | |
| | | | | | | | | | | | | |
| | | | | Total Investment Companies | | | | | | | | |
| | | | | (Cost $216,917) | | | | | | $ | 222,239 | |
| | | | | | | | | | | | | |
| | | | | Total Investments | | | | | | | | |
| | | | | (Cost $216,917) ▲ | | | 100.0 | % | | $ | 222,239 | |
| | | | | Other Assets and Liabilities | | | — | % | | | (44 | ) |
| | | | | Total Net Assets | | | 100.0 | % | | $ | 222,195 | |
| Note: | Percentage of investments as shown is the ratio of the total market value to total net assets. |
| ▲ | At June 30, 2014, the cost of securities for federal income tax purposes was $217,656 and the aggregate gross unrealized appreciation and depreciation based on that cost were: |
| Unrealized Appreciation | | $ | 4,583 | |
| Unrealized Depreciation | | | — | |
| Net Unrealized Appreciation | | $ | 4,583 | |
| ╪ | See Significant Accounting Policies of accompanying Notes to Financial Statements regarding valuation of securities. |
At June 30, 2014, the investment valuation hierarchy levels were:
| | Assets: | | | | |
| | Investment in Securities - Level 1 | | $ | 222,239 | |
| | Total | | $ | 222,239 | |
| American Funds Global Bond HLS Fund |
| Schedule of Investments |
| June 30, 2014 (Unaudited) |
| (000’s Omitted) |
| Shares | | | | | | Market Value ╪ | |
| Investment Companies - 100.1% |
| | 1,416 | | | American Funds Insurance Series - Global Bond Fund Class 1 | | | | | | $ | 17,603 | |
| | | | | | | | | | | | | |
| | | | | Total Investment Companies | | | | | | | | |
| | | | | (Cost $17,355) | | | | | | $ | 17,603 | |
| | | | | | | | | | | | | |
| | | | | Total Investments | | | | | | | | |
| | | | | (Cost $17,355) ▲ | | | 100.1 | % | | $ | 17,603 | |
| | | | | Other Assets and Liabilities | | | (0.1 | )% | | | (12 | ) |
| | | | | Total Net Assets | | | 100.0 | % | | $ | 17,591 | |
| Note: | Percentage of investments as shown is the ratio of the total market value to total net assets. |
| ▲ | At June 30, 2014, the cost of securities for federal income tax purposes was $17,366 and the aggregate gross unrealized appreciation and depreciation based on that cost were: |
| Unrealized Appreciation | | $ | 237 | |
| Unrealized Depreciation | | | — | |
| Net Unrealized Appreciation | | $ | 237 | |
| ╪ | See Significant Accounting Policies of accompanying Notes to Financial Statements regarding valuation of securities. |
At June 30, 2014, the investment valuation hierarchy levels were:
| | Assets: | | | | |
| | Investment in Securities - Level 1 | | $ | 17,603 | |
| | Total | | $ | 17,603 | |
The accompanying notes are an integral part of these financial statements.
| American Funds Global Growth and Income HLS Fund |
| Schedule of Investments |
| June 30, 2014 (Unaudited) |
| (000’s Omitted) |
| Shares | | | | | | Market Value ╪ | |
| Investment Companies - 100.0% |
| | 3,923 | | | American Funds Insurance Series - Global Growth and Income Fund Class 1 | | | | | | $ | 52,131 | |
| | | | | | | | | | | | | |
| | | | | Total Investment Companies | | | | | | | | |
| | | | | (Cost $34,350) | | | | | | $ | 52,131 | |
| | | | | | | | | | | | | |
| | | | | Total Investments | | | | | | | | |
| | | | | (Cost $34,350) ▲ | | | 100.0 | % | | $ | 52,131 | |
| | | | | Other Assets and Liabilities | | | — | % | | | (18 | ) |
| | | | | Total Net Assets | | | 100.0 | % | | $ | 52,113 | |
| Note: | Percentage of investments as shown is the ratio of the total market value to total net assets. |
| ▲ | At June 30, 2014, the cost of securities for federal income tax purposes was $36,023 and the aggregate gross unrealized appreciation and depreciation based on that cost were: |
| Unrealized Appreciation | | $ | 16,108 | |
| Unrealized Depreciation | | | — | |
| Net Unrealized Appreciation | | $ | 16,108 | |
| ╪ | See Significant Accounting Policies of accompanying Notes to Financial Statements regarding valuation of securities. |
At June 30, 2014, the investment valuation hierarchy levels were:
| | Assets: | | | | |
| | Investment in Securities - Level 1 | | $ | 52,131 | |
| | Total | | $ | 52,131 | |
| American Funds Global Growth HLS Fund |
| Schedule of Investments |
| June 30, 2014 (Unaudited) |
| (000’s Omitted) |
| Shares | | | | | | Market Value ╪ | |
| Investment Companies - 100.1% |
| | 817 | | | American Funds Insurance Series - Global Growth Fund Class 1 | | | | | | $ | 22,724 | |
| | | | | | | | | | | | | |
| | | | | Total Investment Companies | | | | | | | | |
| | | | | (Cost $17,437) | | | | | | $ | 22,724 | |
| | | | | | | | | | | | | |
| | | | | Total Investments | | | | | | | | |
| | | | | (Cost $17,437) ▲ | | | 100.1 | % | | $ | 22,724 | |
| | | | | Other Assets and Liabilities | | | (0.1 | )% | | | (12 | ) |
| | | | | Total Net Assets | | | 100.0 | % | | $ | 22,712 | |
| Note: | Percentage of investments as shown is the ratio of the total market value to total net assets. |
| ▲ | At June 30, 2014, the cost of securities for federal income tax purposes was $18,632 and the aggregate gross unrealized appreciation and depreciation based on that cost were: |
| Unrealized Appreciation | | $ | 4,092 | |
| Unrealized Depreciation | | | — | |
| Net Unrealized Appreciation | | $ | 4,092 | |
| ╪ | See Significant Accounting Policies of accompanying Notes to Financial Statements regarding valuation of securities. |
At June 30, 2014, the investment valuation hierarchy levels were:
| | Assets: | | | | |
| | Investment in Securities - Level 1 | | $ | 22,724 | |
| | Total | | $ | 22,724 | |
The accompanying notes are an integral part of these financial statements.
| American Funds Global Small Capitalization HLS Fund |
| Schedule of Investments |
| June 30, 2014 (Unaudited) |
| (000’s Omitted) |
| Shares | | | | | | Market Value ╪ | |
| Investment Companies - 100.0% |
| | 2,152 | | | American Funds Insurance Series - Global Small Capitalization Fund Class 1 | | | | | | $ | 58,993 | |
| | | | | | | | | | | | | |
| | | | | Total Investment Companies | | | | | | | | |
| | | | | (Cost $40,570) | | | | | | $ | 58,993 | |
| | | | | | | | | | | | | |
| | | | | Total Investments | | | | | | | | |
| | | | | (Cost $40,570) ▲ | | | 100.0 | % | | $ | 58,993 | |
| | | | | Other Assets and Liabilities | | | — | % | | | (22 | ) |
| | | | | Total Net Assets | | | 100.0 | % | | $ | 58,971 | |
| Note: | Percentage of investments as shown is the ratio of the total market value to total net assets. |
| ▲ | At June 30, 2014, the cost of securities for federal income tax purposes was $42,604 and the aggregate gross unrealized appreciation and depreciation based on that cost were: |
| Unrealized Appreciation | | $ | 16,389 | |
| Unrealized Depreciation | | | — | |
| Net Unrealized Appreciation | | $ | 16,389 | |
| ╪ | See Significant Accounting Policies of accompanying Notes to Financial Statements regarding valuation of securities. |
At June 30, 2014, the investment valuation hierarchy levels were:
| | Assets: | | | | |
| | Investment in Securities - Level 1 | | $ | 58,993 | |
| | Total | | $ | 58,993 | |
| American Funds Growth HLS Fund |
| Schedule of Investments |
| June 30, 2014 (Unaudited) |
| (000’s Omitted) |
| Shares | | | | | | Market Value ╪ | |
| Investment Companies - 100.0% |
| | 4,272 | | | American Funds Insurance Series - Growth Fund Class 1 | | | | | | $ | 335,833 | |
| | | | | | | | | | | | | |
| | | | | Total Investment Companies | | | | | | | | |
| | | | | (Cost $191,013) | | | | | | $ | 335,833 | |
| | | | | | | | | | | | | |
| | | | | Total Investments | | | | | | | | |
| | | | | (Cost $191,013) ▲ | | | 100.0 | % | | $ | 335,833 | |
| | | | | Other Assets and Liabilities | | | — | % | | | (73 | ) |
| | | | | Total Net Assets | | | 100.0 | % | | $ | 335,760 | |
| Note: | Percentage of investments as shown is the ratio of the total market value to total net assets. |
| ▲ | At June 30, 2014, the cost of securities for federal income tax purposes was $200,157 and the aggregate gross unrealized appreciation and depreciation based on that cost were: |
| Unrealized Appreciation | | $ | 135,676 | |
| Unrealized Depreciation | | | — | |
| Net Unrealized Appreciation | | $ | 135,676 | |
| ╪ | See Significant Accounting Policies of accompanying Notes to Financial Statements regarding valuation of securities. |
At June 30, 2014, the investment valuation hierarchy levels were:
| | Assets: | | | | |
| | Investment in Securities - Level 1 | | $ | 335,833 | |
| | Total | | $ | 335,833 | |
The accompanying notes are an integral part of these financial statements.
| American Funds Growth-Income HLS Fund |
| Schedule of Investments |
| June 30, 2014 (Unaudited) |
| (000’s Omitted) |
| Shares | | | | | | Market Value ╪ | |
| Investment Companies - 100.0% |
| | 3,667 | | | American Funds Insurance Series - Growth-Income Fund Class 1 | | | | | | $ | 189,117 | |
| | | | | | | | | | | | | |
| | | | | Total Investment Companies | | | | | | | | |
| | | | | (Cost $113,876) | | | | | | $ | 189,117 | |
| | | | | | | | | | | | | |
| | | | | Total Investments | | | | | | | | |
| | | | | (Cost $113,876) ▲ | | | 100.0 | % | | $ | 189,117 | |
| | | | | Other Assets and Liabilities | | | — | % | | | (40 | ) |
| | | | | Total Net Assets | | | 100.0 | % | | $ | 189,077 | |
| Note: | Percentage of investments as shown is the ratio of the total market value to total net assets. |
| ▲ | At June 30, 2014, the cost of securities for federal income tax purposes was $117,746 and the aggregate gross unrealized appreciation and depreciation based on that cost were: |
| Unrealized Appreciation | | $ | 71,371 | |
| Unrealized Depreciation | | | — | |
| Net Unrealized Appreciation | | $ | 71,371 | |
| ╪ | See Significant Accounting Policies of accompanying Notes to Financial Statements regarding valuation of securities. |
At June 30, 2014, the investment valuation hierarchy levels were:
| | Assets: | | | | |
| | Investment in Securities - Level 1 | | $ | 189,117 | |
| | Total | | $ | 189,117 | |
| American Funds International HLS Fund |
| Schedule of Investments |
| June 30, 2014 (Unaudited) |
| (000’s Omitted) |
| Shares | | | | | | Market Value ╪ | |
| Investment Companies - 100.0% | | | | | | | | |
| | 9,644 | | | American Funds Insurance Series - International Fund Class 1 | | | | | | $ | 212,468 | |
| | | | | | | | | | | | | |
| | | | | Total Investment Companies | | | | | | | | |
| | | | | (Cost $154,875) | | | | | | $ | 212,468 | |
| | | | | | | | | | | | | |
| | | | | Total Investments | | | | | | | | |
| | | | | (Cost $154,875) ▲ | | | 100.0 | % | | $ | 212,468 | |
| | | | | Other Assets and Liabilities | | | — | % | | | (58 | ) |
| | | | | Total Net Assets | | | 100.0 | % | | $ | 212,410 | |
| Note: | Percentage of investments as shown is the ratio of the total market value to total net assets. |
| ▲ | At June 30, 2014, the cost of securities for federal income tax purposes was $160,721 and the aggregate gross unrealized appreciation and depreciation based on that cost were: |
| Unrealized Appreciation | | $ | 51,747 | |
| Unrealized Depreciation | | | — | |
| Net Unrealized Appreciation | | $ | 51,747 | |
| ╪ | See Significant Accounting Policies of accompanying Notes to Financial Statements regarding valuation of securities. |
At June 30, 2014, the investment valuation hierarchy levels were:
| | Assets: | | | | |
| | Investment in Securities - Level 1 | | $ | 212,468 | |
| | Total | | $ | 212,468 | |
The accompanying notes are an integral part of these financial statements.
| American Funds New World HLS Fund |
| Schedule of Investments |
| June 30, 2014 (Unaudited) |
| (000’s Omitted) |
| Shares | | | | | | Market Value ╪ | |
| Investment Companies - 100.0% |
| | 1,395 | | | American Funds Insurance Series - New World Fund Class 1 | | | | | | $ | 33,249 | |
| | | | | | | | | | | | | |
| | | | | Total Investment Companies | | | | | | | | |
| | | | | (Cost $30,499) | | | | | | $ | 33,249 | |
| | | | | | | | | | | | | |
| | | | | Total Investments | | | | | | | | |
| | | | | (Cost $30,499) ▲ | | | 100.0 | % | | $ | 33,249 | |
| | | | | Other Assets and Liabilities | | | — | % | | | (16 | ) |
| | | | | Total Net Assets | | | 100.0 | % | | $ | 33,233 | |
| Note: | Percentage of investments as shown is the ratio of the total market value to total net assets. |
| ▲ | At June 30, 2014, the cost of securities for federal income tax purposes was $31,044 and the aggregate gross unrealized appreciation and depreciation based on that cost were: |
| Unrealized Appreciation | | $ | 2,205 | |
| Unrealized Depreciation | | | — | |
| Net Unrealized Appreciation | | $ | 2,205 | |
| ╪ | See Significant Accounting Policies of accompanying Notes to Financial Statements regarding valuation of securities. |
At June 30, 2014, the investment valuation hierarchy levels were:
| | Assets: | | | | |
| | Investment in Securities - Level 1 | | $ | 33,249 | |
| | Total | | $ | 33,249 | |
The accompanying notes are an integral part of these financial statements.
[This page is intentionally left blank]
| Hartford Series Fund, Inc. |
| Statements of Assets and Liabilities |
| June 30, 2014 (Unaudited) |
| (000’s Omitted) |
| | | American Funds
Asset Allocation
HLS Fund | | | American Funds
Blue Chip Income
and Growth
HLS Fund | | | American Funds
Bond
HLS Fund | |
| Assets: | | | | | | | | | | | | |
| Investments in underlying funds, at market value @ | | $ | 58,442 | | | $ | 44,510 | | | $ | 222,239 | |
| Cash | | | 242 | | | | 150 | | | | 1,361 | |
| Receivables: | | | | | | | | | | | | |
| Fund shares sold | | | — | | | | — | | | | — | |
| Other assets | | | 3 | | | | 3 | | | | 8 | |
| Total assets | | | 58,687 | | | | 44,663 | | | | 223,608 | |
| Liabilities: | | | | | | | | | | | | |
| Payables: | | | | | | | | | | | | |
| Fund shares redeemed | | | 242 | | | | 150 | | | | 1,361 | |
| Investment management fees | | | 5 | | | | 5 | | | | 15 | |
| Distribution fees | | | 2 | | | | 1 | | | | 8 | |
| Accrued expenses | | | 12 | | | | 12 | | | | 29 | |
| Total liabilities | | | 261 | | | | 168 | | | | 1,413 | |
| Net assets | | $ | 58,426 | | | $ | 44,495 | | | $ | 222,195 | |
| Summary of Net Assets: | | | | | | | | | | | | |
| Capital stock and paid-in-capital | | $ | 30,637 | | | $ | 22,789 | | | $ | 206,367 | |
| Undistributed net investment income | | | 677 | | | | 719 | | | | 3,719 | |
| Accumulated net realized gain | | | 17,291 | | | | 7,720 | | | | 6,787 | |
| Unrealized appreciation of investments | | | 9,821 | | | | 13,267 | | | | 5,322 | |
| Net assets | | $ | 58,426 | | | $ | 44,495 | | | $ | 222,195 | |
| Shares authorized | | | 200,000 | | | | 200,000 | | | | 200,000 | |
| Par value | | $ | 0.001 | | | $ | 0.001 | | | $ | 0.001 | |
| Class IB: Net asset value per share | | $ | 13.11 | | | $ | 13.27 | | | $ | 10.12 | |
| Shares outstanding | | | 4,455 | | | | 3,352 | | | | 21,950 | |
| Net assets | | $ | 58,426 | | | $ | 44,495 | | | $ | 222,195 | |
| @ Cost of investments in underlying funds | | $ | 48,621 | | | $ | 31,243 | | | $ | 216,917 | |
The accompanying notes are an integral part of these financial statements.
| Hartford Series Fund, Inc. |
| Statements of Assets and Liabilities – (continued) |
| June 30, 2014 (Unaudited) |
| (000’s Omitted) |
American Funds
Global Bond
HLS Fund | | | American Funds
Global Growth
and Income
HLS Fund | | | American Funds
Global Growth
HLS Fund | | | American Funds
Global Small
Capitalization
HLS Fund | | | American Funds
Growth
HLS Fund | | | American Funds
Growth-Income
HLS Fund | | | American Funds
International
HLS Fund | | | American Funds
New World
HLS Fund | |
| | | | | | | | | | | | | | | | | | | | | | | | | | | | | | | |
| $ | 17,603 | | | $ | 52,131 | | | $ | 22,724 | | | $ | 58,993 | | | $ | 335,833 | | | $ | 189,117 | | | $ | 212,468 | | | $ | 33,249 | |
| | 7 | | | | 128 | | | | 119 | | | | 214 | | | | 1,285 | | | | 363 | | | | 950 | | | | 123 | |
| | | | | | | | | | | | | | | | | | | | | | | | | | | | | | | |
| | — | | | | — | | | | — | | | | — | | | | — | | | | 35 | | | | — | | | | — | |
| | 1 | | | | 4 | | | | 2 | | | | 4 | | | | 23 | | | | 11 | | | | 17 | | | | 5 | |
| | 17,611 | | | | 52,263 | | | | 22,845 | | | | 59,211 | | | | 337,141 | | | | 189,526 | | | | 213,435 | | | | 33,377 | |
| | | | | | | | | | | | | | | | | | | | | | | | | | | | | | | |
| | | | | | | | | | | | | | | | | | | | | | | | | | | | | | | |
| | 7 | | | | 128 | | | | 119 | | | | 214 | | | | 1,285 | | | | 398 | | | | 950 | | | | 123 | |
| | 2 | | | | 5 | | | | 3 | | | | 6 | | | | 35 | | | | 18 | | | | 25 | | | | 5 | |
| | 1 | | | | 2 | | | | 1 | | | | 2 | | | | 11 | | | | 7 | | | | 7 | | | | 1 | |
| | 10 | | | | 15 | | | | 10 | | | | 18 | | | | 50 | | | | 26 | | | | 43 | | | | 15 | |
| | 20 | | | | 150 | | | | 133 | | | | 240 | | | | 1,381 | | | | 449 | | | | 1,025 | | | | 144 | |
| $ | 17,591 | | | $ | 52,113 | | | $ | 22,712 | | | $ | 58,971 | | | $ | 335,760 | | | $ | 189,077 | | | $ | 212,410 | | | $ | 33,233 | |
| | | | | | | | | | | | | | | | | | | | | | | | | | | | | | | |
| $ | 15,962 | | | $ | 15,817 | | | $ | 8,896 | | | $ | 32,812 | | | $ | 115,748 | | | $ | 70,848 | | | $ | 127,780 | | | $ | 20,338 | |
| | 13 | | | | 1,646 | | | | 215 | | | | — | | | | 2,811 | | | | 1,954 | | | | 1,851 | | | | 286 | |
| | 1,368 | | | | 16,869 | | | | 8,314 | | | | 7,736 | | | | 72,381 | | | | 41,034 | | | | 25,186 | | | | 9,859 | |
| | 248 | | | | 17,781 | | | | 5,287 | | | | 18,423 | | | | 144,820 | | | | 75,241 | | | | 57,593 | | | | 2,750 | |
| $ | 17,591 | | | $ | 52,113 | | | $ | 22,712 | | | $ | 58,971 | | | $ | 335,760 | | | $ | 189,077 | | | $ | 212,410 | | | $ | 33,233 | |
| | 200,000 | | | | 200,000 | | | | 200,000 | | | | 200,000 | | | | 200,000 | | | | 200,000 | | | | 200,000 | | | | 200,000 | |
| $ | 0.001 | | | $ | 0.001 | | | $ | 0.001 | | | $ | 0.001 | | | $ | 0.001 | | | $ | 0.001 | | | $ | 0.001 | | | $ | 0.001 | |
| $ | 10.20 | | | $ | 11.95 | | | $ | 12.85 | | | $ | 10.12 | | | $ | 13.79 | | | $ | 14.16 | | | $ | 10.64 | | | $ | 9.60 | |
| | 1,725 | | | | 4,362 | | | | 1,767 | | | | 5,828 | | | | 24,349 | | | | 13,357 | | | | 19,954 | | | | 3,463 | |
| $ | 17,591 | | | $ | 52,113 | | | $ | 22,712 | | | $ | 58,971 | | | $ | 335,760 | | | $ | 189,077 | | | $ | 212,410 | | | $ | 33,233 | |
| $ | 17,355 | | | $ | 34,350 | | | $ | 17,437 | | | $ | 40,570 | | | $ | 191,013 | | | $ | 113,876 | | | $ | 154,875 | | | $ | 30,499 | |
The accompanying notes are an integral part of these financial statements.
| Hartford Series Fund, Inc. |
| Statements of Operations |
| For the Six-Month Period Ended June 30, 2014 (Unaudited) |
| (000’s Omitted) |
| | | American Funds
Asset Allocation
HLS Fund | | | American Funds
Blue Chip Income
and Growth
HLS Fund | | | American Funds
Bond
HLS Fund | |
| Investment Income: | | | | | | | | | | | | |
| Dividends from underlying funds | | $ | 170 | | | $ | 193 | | | $ | 858 | |
| Total investment income | | | 170 | | | | 193 | | | | 858 | |
| | | | | | | | | | | | | |
| Expenses: | | | | | | | | | | | | |
| Investment management fees | | | 194 | | | | 162 | | | | 589 | |
| Transfer agent fees | | | 1 | | | | 1 | | | | 1 | |
| Distribution fees - Class IB | | | 74 | | | | 54 | | | | 294 | |
| Custodian fees | | | — | | | | — | | | | — | |
| Accounting services fees | | | 3 | | | | 2 | | | | 12 | |
| Board of Directors' fees | | | 1 | | | | 1 | | | | 3 | |
| Audit fees | | | 5 | | | | 5 | | | | 6 | |
| Other expenses | | | 6 | | | | 5 | | | | 23 | |
| Total expenses (before waivers) | | | 284 | | | | 230 | | | | 928 | |
| Expense waivers | | | (119 | ) | | | (108 | ) | | | (294 | ) |
| Total waivers | | | (119 | ) | | | (108 | ) | | | (294 | ) |
| Total expenses, net | | | 165 | | | | 122 | | | | 634 | |
| Net Investment Income (Loss) | | | 5 | | | | 71 | | | | 224 | |
| | | | | | | | | | | | | |
| Net Realized Gain on Investments: | | | | | | | | | | | | |
| Capital gain distribution received from underlying funds | | | 2,826 | | | | — | | | | 84 | |
| Net realized gain (loss) on investments in underlying funds | | | 2,425 | | | | 1,646 | | | | 1,828 | |
| Net Realized Gain on Investments | | | 5,251 | | | | 1,646 | | | | 1,912 | |
| | | | | | | | | | | | | |
| Net Changes in Unrealized Appreciation of Investments: | | | | | | | | | | | | |
| Net unrealized appreciation (depreciation) of investments in underlying funds | | | (3,046 | ) | | | 1,607 | | | | 6,874 | |
| Net Gain on Investments | | | 2,205 | | | | 3,253 | | | | 8,786 | |
| Net Increase in Net Assets Resulting from Operations | | $ | 2,210 | | | $ | 3,324 | | | $ | 9,010 | |
The accompanying notes are an integral part of these financial statements.
| Hartford Series Fund, Inc. |
| Statements of Operations – (continued) |
| For the Six-Month Period Ended June 30, 2014 (Unaudited) |
| (000’s Omitted) |
American Funds
Global Bond
HLS Fund | | | American Funds
Global Growth
and Income
HLS Fund | | | American Funds
Global Growth
HLS Fund | | | American Funds
Global Small
Capitalization
HLS Fund | | | American Funds
Growth
HLS Fund | | | American Funds
Growth-Income
HLS Fund | | | American Funds
International
HLS Fund | | | American Funds
New World
HLS Fund | |
| | | | | | | | | | | | | | | | | | | | | | | | | | | | | | | |
| $ | 56 | | | $ | 268 | | | $ | 89 | | | $ | — | | | $ | 1,637 | | | $ | 562 | | | $ | 221 | | | $ | 54 | |
| | 56 | | | | 268 | | | | 89 | | | | — | | | | 1,637 | | | | 562 | | | | 221 | | | | 54 | |
| | | | | | | | | | | | | | | | | | | | | | | | | | | | | | | |
| | | | | | | | | | | | | | | | | | | | | | | | | | | | | | | |
| | 64 | | | | 207 | | | | 114 | | | | 241 | | | | 1,267 | | | | 670 | | | | 925 | | | | 181 | |
| | 1 | | | | 1 | | | | 1 | | | | 1 | | | | 1 | | | | 1 | | | | 1 | | | | 1 | |
| | 21 | | | | 65 | | | | 29 | | | | 75 | | | | 423 | | | | 239 | | | | 272 | | | | 41 | |
| | — | | | | — | | | | — | | | | — | | | | — | | | | — | | | | — | | | | — | |
| | 1 | | | | 3 | | | | 1 | | | | 3 | | | | 17 | | | | 10 | | | | 11 | | | | 2 | |
| | 1 | | | | 1 | | | | 1 | | | | 1 | | | | 5 | | | | 3 | | | | 3 | | | | 1 | |
| | 5 | | | | 5 | | | | 5 | | | | 5 | | | | 6 | | | | 6 | | | | 6 | | | | 5 | |
| | 6 | | | | 8 | | | | 5 | | | | 11 | | | | 39 | | | | 20 | | | | 33 | | | | 7 | |
| | 99 | | | | 290 | | | | 156 | | | | 337 | | | | 1,758 | | | | 949 | | | | 1,251 | | | | 238 | |
| | (43 | ) | | | (142 | ) | | | (86 | ) | | | (166 | ) | | | (845 | ) | | | (431 | ) | | | (653 | ) | | | (140 | ) |
| | (43 | ) | | | (142 | ) | | | (86 | ) | | | (166 | ) | | | (845 | ) | | | (431 | ) | | | (653 | ) | | | (140 | ) |
| | 56 | | | | 148 | | | | 70 | | | | 171 | | | | 913 | | | | 518 | | | | 598 | | | | 98 | |
| | — | | | | 120 | | | | 19 | | | | (171 | ) | | | 724 | | | | 44 | | | | (377 | ) | | | (44 | ) |
| | | | | | | | | | | | | | | | | | | | | | | | | | | | | | | |
| | | | | | | | | | | | | | | | | | | | | | | | | | | | | | | |
| | 149 | | | | — | | | | 2,200 | | | | 257 | | | | 16,428 | | | | 9,217 | | | | — | | | | 3,174 | |
| | (10 | ) | | | 2,730 | | | | 1,280 | | | | 3,425 | | | | 22,387 | | | | 12,554 | | | | 11,628 | | | | 648 | |
| | 139 | | | | 2,730 | | | | 3,480 | | | | 3,682 | | | | 38,815 | | | | 21,771 | | | | 11,628 | | | | 3,822 | |
| | | | | | | | | | | | | | | | | | | | | | | | | | | | | | | |
| | | | | | | | | | | | | | | | | | | | | | | | | | | | | | | |
| | 787 | | | | 351 | | | | (3,008 | ) | | | 482 | | | | (21,621 | ) | | | (9,147 | ) | | | (3,485 | ) | | | (2,265 | ) |
| | 926 | | | | 3,081 | | | | 472 | | | | 4,164 | | | | 17,194 | | | | 12,624 | | | | 8,143 | | | | 1,557 | |
| $ | 926 | | | $ | 3,201 | | | $ | 491 | | | $ | 3,993 | | | $ | 17,918 | | | $ | 12,668 | | | $ | 7,766 | | | $ | 1,513 | |
The accompanying notes are an integral part of these financial statements.
| Hartford Series Fund, Inc. |
| Statements of Changes in Net Assets |
| |
| (000’s Omitted) |
| | | American Funds
Asset Allocation
HLS Fund | | | American Funds
Blue Chip Income and Growth
HLS Fund | |
| | | For the
Six-Month
Period Ended
June 30, 2014
(Unaudited) | | | For the
Year Ended
December 31,
2013 | | | For the
Six-Month
Period Ended
June 30, 2014
(Unaudited) | | | For the
Year Ended
December 31,
2013 | |
| Operations: | | | | | | | | | | | | | | | | |
| Net investment income (loss) | | $ | 5 | | | $ | 672 | | | $ | 71 | | | $ | 648 | |
| Net realized gain on investments | | | 5,251 | | | | 13,871 | | | | 1,646 | | | | 7,073 | |
| Net unrealized appreciation (depreciation) of investments | | | (3,046 | ) | | | (131 | ) | | | 1,607 | | | | 4,336 | |
| Net Increase (Decrease) in Net assets Resulting from Operations | | | 2,210 | | | | 14,412 | | | | 3,324 | | | | 12,057 | |
| Distributions to Shareholders: | | | | | | | | | | | | | | | | |
| From net investment income | | | | | | | | | | | | | | | | |
| Class IB | | | — | | | | (1,042 | ) | | | — | | | | (628 | ) |
| From net realized gain on investments | | | | | | | | | | | | | | | | |
| Class IB | | | — | | | | (4,503 | ) | | | — | | | | (2,802 | ) |
| Total distributions | | | — | | | | (5,545 | ) | | | — | | | | (3,430 | ) |
| Capital Share Transactions: | | | | | | | | | | | | | | | | |
| Class IB | | | | | | | | | | | | | | | | |
| Sold | | | 834 | | | | 24,495 | | | | 1,660 | | | | 12,319 | |
| Issued on reinvestment of distributions | | | — | | | | 5,545 | | | | — | | | | 3,430 | |
| Redeemed | | | (7,579 | ) | | | (40,562 | ) | | | (3,991 | ) | | | (20,794 | ) |
| Net increase (decrease) from capital share transactions | | | (6,745 | ) | | | (10,522 | ) | | | (2,331 | ) | | | (5,045 | ) |
| Net increase (decrease) in net assets | | | (4,535 | ) | | | (1,655 | ) | | | 993 | | | | 3,582 | |
| Net Assets: | | | | | | | | | | | | | | | | |
| Beginning of period | | | 62,961 | | | | 64,616 | | | | 43,502 | | | | 39,920 | |
| End of period | | $ | 58,426 | | | $ | 62,961 | | | $ | 44,495 | | | $ | 43,502 | |
| Undistributed (distribution in excess of) net investment income | | $ | 677 | | | $ | 672 | | | $ | 719 | | | $ | 648 | |
| Shares: | | | | | | | | | | | | | | | | |
| Class IB | | | | | | | | | | | | | | | | |
| Sold | | | 66 | | | | 2,034 | | | | 131 | | | | 1,090 | |
| Issued on reinvestment of distributions | | | — | | | | 475 | | | | — | | | | 307 | |
| Redeemed | | | (597 | ) | | | (3,375 | ) | | | (314 | ) | | | (1,811 | ) |
| Total share activity | | | (531 | ) | | | (866 | ) | | | (183 | ) | | | (414 | ) |
The accompanying notes are an integral part of these financial statements.
| Hartford Series Fund, Inc. |
| Statements of Changes in Net Assets – (continued) |
| |
| (000’s Omitted) |
American Funds
Bond
HLS Fund | | | American Funds
Global Bond
HLS Fund | | | American Funds
Global Growth and Income
HLS Fund | | | American Funds
Global Growth
HLS Fund | |
For the
Six-Month
Period Ended
June 30, 2014
(Unaudited) | | | For the
Year Ended
December 31,
2013 | | | For the
Six-Month
Period Ended
June 30, 2014
(Unaudited) | | | For the
Year Ended
December 31,
2013 | | | For the
Six-Month
Period Ended
June 30, 2014
(Unaudited) | | | For the
Year Ended
December 31,
2013 | | | For the
Six-Month
Period Ended
June 30, 2014
(Unaudited) | | | For the
Year Ended
December 31,
2013 | |
| | | | | | | | | | | | | | | | | | | | | | | | | | | | | | | |
| $ | 224 | | | $ | 3,495 | | | $ | — | | | $ | (168 | ) | | $ | 120 | | | $ | 1,527 | | | $ | 19 | | | $ | 196 | |
| | 1,912 | | | | 5,712 | | | | 139 | | | | 1,463 | | | | 2,730 | | | | 16,033 | | | | 3,480 | | | | 6,426 | |
| | 6,874 | | | | (13,611 | ) | | | 787 | | | | (2,614 | ) | | | 351 | | | | (4,586 | ) | | | (3,008 | ) | | | 199 | |
| | 9,010 | | | | (4,404 | ) | | | 926 | | | | (1,319 | ) | | | 3,201 | | | | 12,974 | | | | 491 | | | | 6,821 | |
| | | | | | | | | | | | | | | | | | | | | | | | | | | | | | | |
| | | | | | | | | | | | | | | | | | | | | | | | | | | | | | | |
| | — | | | | (4,314 | ) | | | — | | | | (888 | ) | | | — | | | | (1,598 | ) | | | — | | | | (147 | ) |
| | | | | | | | | | | | | | | | | | | | | | | | | | | | | | | |
| | — | | | | (5,996 | ) | | | — | | | | (1,720 | ) | | | — | | | | (986 | ) | | | — | | | | (1,740 | ) |
| | — | | | | (10,310 | ) | | | — | | | | (2,608 | ) | | | — | | | | (2,584 | ) | | | — | | | | (1,887 | ) |
| | | | | | | | | | | | | | | | | | | | | | | | | | | | | | | |
| | | | | | | | | | | | | | | | | | | | | | | | | | | | | | | |
| | 7,195 | | | | 90,232 | | | | 903 | | | | 4,223 | | | | 1,212 | | | | 4,966 | | | | 409 | | | | 4,045 | |
| | — | | | | 10,310 | | | | — | | | | 2,608 | | | | — | | | | 2,584 | | | | — | | | | 1,887 | |
| | (30,856 | ) | | | (47,990 | ) | | | (1,245 | ) | | | (24,090 | ) | | | (5,012 | ) | | | (40,155 | ) | | | (2,697 | ) | | | (15,412 | ) |
| | (23,661 | ) | | | 52,552 | | | | (342 | ) | | | (17,259 | ) | | | (3,800 | ) | | | (32,605 | ) | | | (2,288 | ) | | | (9,480 | ) |
| | (14,651 | ) | | | 37,838 | | | | 584 | | | | (21,186 | ) | | | (599 | ) | | | (22,215 | ) | | | (1,797 | ) | | | (4,546 | ) |
| | | | | | | | | | | | | | | | | | | | | | | | | | | | | | | |
| | 236,846 | | | | 199,008 | | | | 17,007 | | | | 38,193 | | | | 52,712 | | | | 74,927 | | | | 24,509 | | | | 29,055 | |
| $ | 222,195 | | | $ | 236,846 | | | $ | 17,591 | | | $ | 17,007 | | | $ | 52,113 | | | $ | 52,712 | | | $ | 22,712 | | | $ | 24,509 | |
| $ | 3,719 | | | $ | 3,495 | | | $ | 13 | | | $ | 13 | | | $ | 1,646 | | | $ | 1,526 | | | $ | 215 | | | $ | 196 | |
| | | | | | | | | | | | | | | | | | | | | | | | | | | | | | | |
| | | | | | | | | | | | | | | | | | | | | | | | | | | | | | | |
| | 729 | | | | 9,050 | | | | 91 | | | | 409 | | | | 107 | | | | 481 | | | | 33 | | | | 356 | |
| | — | | | | 1,064 | | | | — | | | | 273 | | | | — | | | | 252 | | | | — | | | | 168 | |
| | (3,083 | ) | | | (4,730 | ) | | | (126 | ) | | | (2,362 | ) | | | (436 | ) | | | (3,865 | ) | | | (217 | ) | | | (1,352 | ) |
| | (2,354 | ) | | | 5,384 | | | | (35 | ) | | | (1,680 | ) | | | (329 | ) | | | (3,132 | ) | | | (184 | ) | | | (828 | ) |
The accompanying notes are an integral part of these financial statements.
| Hartford Series Fund, Inc. |
| Statements of Changes in Net Assets – (continued) |
| |
| (000’s Omitted) |
| | | American Funds
Global Small Capitalization
HLS Fund | | | American Funds
Growth
HLS Fund | |
| | | For the
Six-Month
Period Ended
June 30, 2014
(Unaudited) | | | For the
Year Ended
December 31,
2013 | | | For the
Six-Month
Period Ended
June 30, 2014
(Unaudited) | | | For the
Year Ended
December 31,
2013 | |
| Operations: | | | | | | | | | | | | | | | | |
| Net investment income (loss) | | $ | (171 | ) | | $ | 171 | | | $ | 724 | | | $ | 2,087 | |
| Net realized gain on investments | | | 3,682 | | | | 6,456 | | | | 38,815 | | | | 42,711 | |
| Net unrealized appreciation (depreciation) of investments | | | 482 | | | | 7,590 | | | | (21,621 | ) | | | 45,996 | |
| Net Increase in Net assets Resulting from Operations | | | 3,993 | | | | 14,217 | | | | 17,918 | | | | 90,794 | |
| Distributions to Shareholders: | | | | | | | | | | | | | | | | |
| From net investment income | | | | | | | | | | | | | | | | |
| Class IB | | | — | | | | (560 | ) | | | — | | | | (1,685 | ) |
| From net realized gain on investments | | | | | | | | | | | | | | | | |
| Class IB | | | — | | | | (5,594 | ) | | | — | | | | (10,749 | ) |
| Total distributions | | | — | | | | (6,154 | ) | | | — | | | | (12,434 | ) |
| Capital Share Transactions: | | | | | | | | | | | | | | | | |
| Class IB | | | | | | | | | | | | | | | | |
| Sold | | | 1,090 | | | | 11,979 | | | | 5,227 | | | | 31,235 | |
| Issued on reinvestment of distributions | | | — | | | | 6,154 | | | | — | | | | 12,434 | |
| Redeemed | | | (7,336 | ) | | | (18,853 | ) | | | (38,403 | ) | | | (104,900 | ) |
| Net decrease from capital share transactions | | | (6,246 | ) | | | (720 | ) | | | (33,176 | ) | | | (61,231 | ) |
| Net increase (decrease) in net assets | | | (2,253 | ) | | | 7,343 | | | | (15,258 | ) | | | 17,129 | |
| Net Assets: | | | | | | | | | | | | | | | | |
| Beginning of period | | | 61,224 | | | | 53,881 | | | | 351,018 | | | | 333,889 | |
| End of period | | $ | 58,971 | | | $ | 61,224 | | | $ | 335,760 | | | $ | 351,018 | |
| Undistributed (distribution in excess of) net investment income | | $ | — | | | $ | 171 | | | $ | 2,811 | | | $ | 2,087 | |
| Shares: | | | | | | | | | | | | | | | | |
| Class IB | | | | | | | | | | | | | | | | |
| Sold | | | 112 | | | | 1,336 | | | | 406 | | | | 2,713 | |
| Issued on reinvestment of distributions | | | — | | | | 707 | | | | — | | | | 1,060 | |
| Redeemed | | | (749 | ) | | | (2,081 | ) | | | (2,881 | ) | | | (8,886 | ) |
| Total share activity | | | (637 | ) | | | (38 | ) | | | (2,475 | ) | | | (5,113 | ) |
The accompanying notes are an integral part of these financial statements.
| Hartford Series Fund, Inc. |
| Statements of Changes in Net Assets – (continued) |
| |
| (000’s Omitted) |
American Funds
Growth-Income
HLS Fund | | | American Funds
International
HLS Fund | | | American Funds
New World
HLS Fund | |
For the
Six-Month
Period Ended
June 30, 2014
(Unaudited) | | | For the
Year Ended
December 31,
2013 | | | For the
Six-Month
Period Ended
June 30, 2014
(Unaudited) | | | For the
Year Ended
December 31,
2013 | | | For the
Six-Month
Period Ended
June 30, 2014
(Unaudited) | | | For the
Year Ended
December 31,
2013 | |
| | | | | | | | | | | | | | | | | | | | | | | |
| $ | 44 | | | $ | 1,910 | | | $ | (377 | ) | | $ | 2,228 | | | $ | (44 | ) | | $ | 330 | |
| | 21,771 | | | | 23,134 | | | | 11,628 | | | | 19,588 | | | | 3,822 | | | | 8,063 | |
| | (9,147 | ) | | | 30,844 | | | | (3,485 | ) | | | 21,768 | | | | (2,265 | ) | | | (4,486 | ) |
| | 12,668 | | | | 55,888 | | | | 7,766 | | | | 43,584 | | | | 1,513 | | | | 3,907 | |
| | | | | | | | | | | | | | | | | | | | | | | |
| | | | | | | | | | | | | | | | | | | | | | | |
| | — | | | | (2,338 | ) | | | — | | | | (2,543 | ) | | | — | | | | (325 | ) |
| | | | | | | | | | | | | | | | | | | | | | | |
| | — | | | | (2,361 | ) | | | — | | | | (4,233 | ) | | | — | | | | (4,907 | ) |
| | — | | | | (4,699 | ) | | | — | | | | (6,776 | ) | | | — | | | | (5,232 | ) |
| | | | | | | | | | | | | | | | | | | | | | | |
| | | | | | | | | | | | | | | | | | | | | | | |
| | 2,089 | | | | 27,350 | | | | 1,094 | | | | 19,705 | | | | 726 | | | | 5,406 | |
| | — | | | | 4,699 | | | | — | | | | 6,776 | | | | — | | | | 5,232 | |
| | (23,369 | ) | | | (68,769 | ) | | | (22,850 | ) | | | (62,187 | ) | | | (3,310 | ) | | | (26,706 | ) |
| | (21,280 | ) | | | (36,720 | ) | | | (21,756 | ) | | | (35,706 | ) | | | (2,584 | ) | | | (16,068 | ) |
| | (8,612 | ) | | | 14,469 | | | | (13,990 | ) | | | 1,102 | | | | (1,071 | ) | | | (17,393 | ) |
| | | | | | | | | | | | | | | | | | | | | | | |
| | 197,689 | | | | 183,220 | | | | 226,400 | | | | 225,298 | | | | 34,304 | | | | 51,697 | |
| $ | 189,077 | | | $ | 197,689 | | | $ | 212,410 | | | $ | 226,400 | | | $ | 33,233 | | | $ | 34,304 | |
| $ | 1,954 | | | $ | 1,910 | | | $ | 1,851 | | | $ | 2,228 | | | $ | 286 | | | $ | 330 | |
| | | | | | | | | | | | | | | | | | | | | | | |
| | | | | | | | | | | | | | | | | | | | | | | |
| | 156 | | | | 2,387 | | | | 108 | | | | 2,147 | | | | 81 | | | | 591 | |
| | — | | | | 397 | | | | — | | | | 733 | | | | — | | | | 610 | |
| | (1,712 | ) | | | (5,833 | ) | | | (2,196 | ) | | | (6,641 | ) | | | (360 | ) | | | (2,923 | ) |
| | (1,556 | ) | | | (3,049 | ) | | | (2,088 | ) | | | (3,761 | ) | | | (279 | ) | | | (1,722 | ) |
The accompanying notes are an integral part of these financial statements.
| Hartford Series Fund, Inc. |
| Notes to Financial Statements |
| June 30, 2014 (Unaudited) |
| (000’s Omitted) |
Organization:
Hartford Series Fund, Inc. (the “Company”) is an open-end management investment company comprised of twenty-eight portfolios, eleven portfolios of which are included in these financial statements (each a “Fund” or together the “Funds”). The Funds serve as underlying investment options for certain variable annuity and variable life insurance separate accounts of Hartford Life Insurance Company (“HLIC”) and its affiliates.
These eleven portfolios of the Company are American Funds Asset Allocation HLS Fund, American Funds Blue Chip Income and Growth HLS Fund, American Funds Bond HLS Fund, American Funds Global Bond HLS Fund, American Funds Global Growth and Income HLS Fund, American Funds Global Growth HLS Fund, American Funds Global Small Capitalization HLS Fund, American Funds Growth HLS Fund, American Funds Growth-Income HLS Fund, American Funds International HLS Fund and American Funds New World HLS Fund.
The Company is organized under the laws of the State of Maryland and is registered with the Securities and Exchange Commission (“SEC”) under the Investment Company Act of 1940, as amended (“1940 Act”). Each Fund is organized as a diversified open-end management investment company, except for American Funds Global Bond HLS Fund, which is non-diversified.
Each Fund operates in the manner of a fund of funds, investing in shares of underlying mutual funds (the “Underlying Funds”). Each Underlying Fund is offered by American Funds Insurance Series, and is a registered open-end investment company. The Funds and their related Underlying Funds are listed below:
| Fund | | Underlying Fund |
| American Funds Asset Allocation HLS Fund | | Asset Allocation Fund Class 1 |
| American Funds Blue Chip Income and Growth HLS Fund | | Blue Chip Income and Growth Fund Class 1 |
| American Funds Bond HLS Fund | | Bond Fund Class 1 |
| American Funds Global Bond HLS Fund | | Global Bond Fund Class 1 |
| American Funds Global Growth and Income HLS Fund | | Global Growth and Income Fund Class 1 |
| American Funds Global Growth HLS Fund | | Global Growth Fund Class 1 |
| American Funds Global Small Capitalization HLS Fund | | Global Small Capitalization Fund Class 1 |
| American Funds Growth HLS Fund | | Growth Fund Class 1 |
| American Funds Growth-Income HLS Fund | | Growth-Income Fund Class 1 |
| American Funds International HLS Fund | | International Fund Class 1 |
| American Funds New World HLS Fund | | New World Fund Class 1 |
The Underlying Funds’ accounting policies are outlined in the Underlying Funds’ shareholder report, which accompanies this report.
Class IB shares of the Funds are offered at the per share net asset value (“NAV”) without a sales charge and are subject to distribution fees charged pursuant to a Distribution and Service Plan. The Distribution and Service Plan has been adopted in accordance with Rule 12b-1 under the 1940 Act.
Significant Accounting Policies:
The following is a summary of significant accounting policies of the Funds in the preparation of their financial statements, which are in accordance with United States Generally Accepted Accounting Principles (“U.S. GAAP”). The preparation of financial statements in accordance with U.S. GAAP may require management to make estimates and assumptions that affect the reported amounts of assets and liabilities and disclosure of contingent assets and liabilities at the date of the financial statements and the reported amounts of increases and decreases in net assets from operations during the reporting period. Actual results could differ from those estimates.
Determination of Net Asset Value – The NAV of the Funds’ shares is determined as of the close of regular trading (normally 4:00 p.m. Eastern Time) (the “NYSE Close”) on each day that the New York Stock Exchange (the “Exchange”) is open (“Valuation Date”).
| Hartford Series Fund, Inc. |
| Notes to Financial Statements – (continued) |
| June 30, 2014 (Unaudited) |
| (000’s Omitted) |
Information that becomes known to the Funds after the NAV has been calculated on a particular day will not generally be used to retroactively adjust the NAV determined earlier that day.
Investment Valuation – Investments in the Underlying Funds are valued at the respective NAV of each Underlying Fund as determined as of the NYSE Close on the Valuation Date. Valuation of investments held by the Underlying Funds is discussed in Notes to Financial Statements of the Underlying Funds, which are included in the Underlying Funds’ shareholder report, accompanying this report.
U.S. GAAP defines fair value as the price that the Fund would receive to sell an asset or pay to transfer a liability in an orderly transaction between market participants. The U.S. GAAP fair value measurement standards require disclosure of a fair value hierarchy for each major category of assets and liabilities. Various inputs are used in determining the fair value of each Fund’s investments. These inputs are summarized into three broad hierarchy levels. This hierarchy is based on whether the valuation inputs are observable or unobservable. These levels are:
Level 1 – Quoted prices in active markets for identical investments.
Level 2 – Observable inputs other than Level 1 prices, such as quoted prices for similar investments; quoted prices in markets that are not active; or other inputs that are observable or can be corroborated by observable market data.
Level 3 – Significant unobservable inputs that are supported by limited or no market activity. Level 3 may include financial instruments whose values are determined using indicative market quotes or require significant management judgment or estimation.
Valuation levels are not necessarily indicative of the risk associated with investing in such investments. Individual investments within any of the above mentioned asset classes may be assigned a different hierarchical level than those presented above, as individual circumstances dictate.
For additional information, refer to the Investment Valuation Hierarchy Level Summary which follows the Schedule of Investments for each Fund.
For purposes of reporting transfers between different hierarchy levels, both transfers in and out of each level, as applicable, are shown as if they occurred at the beginning of the period. During the six-month period ended June 30, 2014, there were no transfers between different hierarchy levels.
Investment Transactions and Investment Income – Investment transactions are recorded as of the trade date (the date the order to buy or sell is executed) for financial reporting purposes. Realized gains and losses are determined on the basis of identified cost.
Income and capital gain distributions from the Underlying Funds are accrued on the ex-dividend date.
Fund Share Valuation and Dividend Distributions to Shareholders – Orders for the Funds’ shares are executed in accordance with the investment instructions of the contract holders. The NAV of each Fund’s shares is determined as of the close of business on each business day of the Exchange. The NAV is determined for each Fund by dividing the Fund’s net assets by the number of shares outstanding. Orders for the purchase of the Funds’ shares received by an insurance company prior to the close of the Exchange on any day on which the Exchange is open for business are priced at the NAV determined as of the close of the Exchange. Orders received by an insurance company after the close of the Exchange, or on a day on which the Exchange and/or the Fund is not open for business, are priced at the next determined NAV.
Dividends are declared pursuant to a policy adopted by the Company’s Board of Directors based upon the investment performance of the Funds. The policy of all the Funds is to pay dividends from net investment income and realized capital gains, if any, at least once a year.
| Hartford Series Fund, Inc. |
| Notes to Financial Statements – (continued) |
| June 30, 2014 (Unaudited) |
| (000’s Omitted) |
Distributions from net investment income, realized capital gains and capital are determined in accordance with federal income tax regulations, which may differ from U.S. GAAP with respect to character and timing. These differences may include, but are not limited to, losses deferred due to wash sale adjustments and short-term capital gain adjustments. Permanent book and federal income tax basis differences relating to shareholder distributions will result in reclassifications to certain of the Funds’ capital accounts (see Federal Income Taxes: Reclassification of Capital Accounts note).
Principal Risks:
The Funds are exposed to the risks of the Underlying Funds in direct proportion to the amount of assets each Fund allocates to each Underlying Fund. The market values of the Underlying Funds may decline due to general market conditions which are not specifically related to a particular fund, such as real or perceived adverse economic conditions or adverse investor sentiment generally.
Federal Income Taxes:
Federal Income Taxes – For federal income tax purposes, the Funds intend to continue to qualify as Regulated Investment Companies (“RIC”) under Subchapter M of the Internal Revenue Code (“IRC”) by distributing substantially all of their taxable net investment income and net realized capital gains to their shareholders and otherwise complying with the requirements of the IRC. The Funds have distributed substantially all of their income and capital gains in the prior year and each Fund intends to distribute substantially all of its income and gains prior to the next fiscal year end. Accordingly, no provision for federal income or excise taxes has been made in the accompanying financial statements. Distributions from short-term capital gains are treated as ordinary income distributions for federal income tax purposes.
Net Investment Income (Loss), Net Realized Gains (Losses) and Distributions – Net investment income (loss) and net realized gains (losses) may differ for financial statement and tax purposes primarily because of losses deferred due to wash sale adjustments and short-term capital gain adjustments. The character of distributions made during the year from net investment income or net realized gains may differ from their ultimate characterization for federal income tax purposes. Also, due to the timing of dividend distributions, the fiscal year in which amounts are distributed may differ from the year that the net investment income (loss) or net realized gains (losses) were recorded by a Fund.
Distributions and Components of Distributable Earnings – The tax character of distributions paid by the Funds for the periods indicated is as follows (as adjusted for dividends payable, if applicable):
| | | For the Year Ended
December 31, 2013 | | | For the Year Ended
December 31, 2012 | |
| | | Ordinary
Income | | | Long-
Term
Capital
Gains(a) | | | Tax
return
of
capital | | | Ordinary
Income | | | Long-
Term
Capital
Gains(a) | | | Tax
return
of
capital | |
| American Funds Asset Allocation HLS Fund | | $ | 1,042 | | | $ | 4,503 | | | $ | — | | | $ | 1,026 | | | $ | 140 | | | $ | — | |
| American Funds Blue Chip Income and Growth HLS Fund | | | 628 | | | | 2,802 | | | | — | | | | 467 | | | | 266 | | | | — | |
| American Funds Bond HLS Fund | | | 4,314 | | | | 5,996 | | | | — | | | | 5,360 | | | | 4,400 | | | | — | |
| American Funds Global Bond HLS Fund | | | 888 | | | | 1,720 | | | | — | | | | 1,092 | | | | 825 | | | | — | |
| American Funds Global Growth and Income HLS Fund | | | 1,598 | | | | 986 | | | | — | | | | 1,976 | | | | — | | | | — | |
| American Funds Global Growth HLS Fund | | | 147 | | | | 1,740 | | | | — | | | | 313 | | | | 324 | | | | — | |
| American Funds Global Small Capitalization HLS Fund | | | 560 | | | | 5,594 | | | | — | | | | 648 | | | | 4,957 | | | | — | |
| American Funds Growth HLS Fund | | | 1,685 | | | | 10,749 | | | | — | | | | 1,117 | | | | 975 | | | | — | |
| American Funds Growth-Income HLS Fund | | | 2,338 | | | | 2,361 | | | | — | | | | 2,243 | | | | — | | | | — | |
| American Funds International HLS Fund | | | 2,543 | | | | 4,233 | | | | — | | | | 3,474 | | | | — | | | | — | |
| American Funds New World HLS Fund | | | 325 | | | | 4,907 | | | | — | | | | 835 | | | | 2,795 | | | | — | |
| (a) | The Funds designate these distributions as long-term capital dividends per IRC code Sec. 852(b) (3) (C). |
| Hartford Series Fund, Inc. |
| Notes to Financial Statements – (continued) |
| June 30, 2014 (Unaudited) |
| (000’s Omitted) |
As of December 31, 2013, the components of distributable earnings (deficit) on a tax basis were as follows:
| | | Undistributed
Ordinary
Income | | | Undistributed
Long-Term
Capital Gain | | | Accumulated Capital
and Other Losses | | | Unrealized
Appreciation
(Depreciation)@ | | | Total
Accumulated
Earnings
(Deficit) | |
| American Funds Asset Allocation HLS Fund | | $ | 672 | | | $ | 12,361 | | | $ | – | | | $ | 12,546 | | | $ | 25,579 | |
| American Funds Blue Chip Income and Growth HLS Fund | | | 648 | | | | 6,668 | | | | – | | | | 11,066 | | | | 18,382 | |
| American Funds Bond HLS Fund | | | 3,495 | | | | 5,614 | | | | – | | | | (2,291 | ) | | | 6,818 | |
| American Funds Global Bond HLS Fund | | | 13 | | | | 1,240 | | | | – | | | | (550 | ) | | | 703 | |
| American Funds Global Growth and Income HLS Fund | | | 1,526 | | | | 15,812 | | | | – | | | | 15,757 | | | | 33,095 | |
| American Funds Global Growth HLS Fund | | | 196 | | | | 6,029 | | | | – | | | | 7,100 | | | | 13,325 | |
| American Funds Global Small Capitalization HLS Fund | | | 171 | | | | 6,088 | | | | – | | | | 15,907 | | | | 22,166 | |
| American Funds Growth HLS Fund | | | 2,087 | | | | 42,710 | | | | – | | | | 157,297 | | | | 202,094 | |
| American Funds Growth-Income HLS Fund | | | 1,910 | | | | 23,133 | | | | – | | | | 80,518 | | | | 105,561 | |
| American Funds International HLS Fund | | | 2,228 | | | | 19,404 | | | | – | | | | 55,232 | | | | 76,864 | |
| American Funds New World HLS Fund | | | 330 | | | | 6,582 | | | | – | | | | 4,470 | | | | 11,382 | |
| @ | The difference between book-basis and tax-basis unrealized appreciation (depreciation) is attributable primarily to the tax deferral of wash sale losses. |
Reclassification of Capital Accounts – The Funds may record reclassifications in their capital accounts. These reclassifications have no impact on the total net assets of the Funds. The reclassifications are a result of permanent differences between U.S. GAAP and tax accounting for items such as net operating losses that reduce distribution requirements. Adjustments are made to reflect the impact these items have on current and future distributions to shareholders. Therefore, the source of a Fund’s distributable income may be shown in the accompanying Statement of Assets and Liabilities as from net investment income, from net realized gains on investments or from capital depending on the type of book and tax differences that exist. For the year ended December 31, 2013, the Funds recorded the following reclassifications to increase (decrease) the accounts listed below.
| | | Net Investment
Income (Loss) | | | Net Realized
Gain (Loss) | | | Paid-in-
Capital | |
| American Funds Global Bond HLS Fund | | $ | 182 | | | $ | (182 | ) | | $ | – | |
Capital Loss Carryforward – On December 22, 2010, the Regulated Investment Company Modernization Act of 2010 (the “Act”) was enacted, which made changes to the capital loss carryforward rules. The changes are effective for taxable years beginning after the date of enactment. Under the Act, funds are permitted to carry forward capital losses for an unlimited period. Additionally, capital loss carryforwards retain their character as either short-term or long-term capital losses rather than being considered all short-term as permitted under prior regulation.
The Funds had no capital loss carryforward for U.S. federal income tax purposes as of December 31, 2013.
Accounting for Uncertainty in Income Taxes – The Funds have adopted financial reporting rules that require the Funds to analyze all open tax years, as defined by the Statute of Limitations, for all major jurisdictions. Generally, tax authorities can examine all tax returns filed for the last three years. The Funds do not have an examination in progress.
The Funds have reviewed all open tax years and major jurisdictions and concluded that these financial reporting rules have no effect on the Funds’ financial positions or results of operations. There is no tax liability resulting from unrecognized tax benefits relating to uncertain income tax positions taken or expected to be taken on the tax returns for the fiscal year-end December 31, 2013. The Funds are also not aware of any tax positions for which it is reasonably possible that the total amounts of unrecognized tax benefits will significantly change in the next twelve months.
| Hartford Series Fund, Inc. |
| Notes to Financial Statements – (continued) |
| June 30, 2014 (Unaudited) |
| (000’s Omitted) |
Expenses:
Investment Management Agreement – Hartford Funds Management Company, LLC (“HFMC”), an indirect wholly owned subsidiary of The Hartford Financial Services Group, Inc. (“The Hartford”), serves as investment manager to the Funds pursuant to an Investment Management Agreement with the Company. The investment manager has overall investment supervisory responsibility for each Fund. In addition, the investment manager provides administrative personnel, services, equipment, facilities and office space for proper operation of the Funds.
The schedule below reflects the rates of compensation as a percentage of each Fund’s average daily net assets paid to the investment manager for investment management services rendered during the year ended December 31, 2013. The rates are accrued daily and paid monthly:
| Fund | | Annual Rate* |
| American Funds Asset Allocation HLS Fund | | 0.65% |
| American Funds Blue Chip Income and Growth HLS Fund | | 0.75% |
| American Funds Bond HLS Fund | | 0.50% |
| American Funds Global Bond HLS Fund | | 0.75% |
| American Funds Global Growth and Income HLS Fund | | 0.80% |
| American Funds Global Growth HLS Fund | | 1.00% |
| American Funds Global Small Capitalization HLS Fund | | 0.80% |
| American Funds Growth HLS Fund | | 0.75% |
| American Funds Growth-Income HLS Fund | | 0.70% |
| American Funds International HLS Fund | | 0.85% |
| American Funds New World HLS Fund | | 1.10% |
| * | The investment manager has entered into an agreement under which it will waive a portion of its investment management fee with respect to each Fund for as long as that Fund is invested in its corresponding Underlying Fund. The net investment management fee under the agreement with the investment manager, after giving effect to the waiver, is 0.25% of the average daily net assets for each Fund. |
Accounting Services Agreement – Pursuant to the Fund Accounting Agreement between HFMC and the Company, on behalf of the Funds, HFMC provides accounting services to the Funds and receives monthly compensation of 0.01% of each Fund’s average daily net assets. These fees are accrued daily and paid monthly.
Operating Expenses – Allocable expenses incurred by the Company are allocated to each Fund in proportion to the average daily net assets of each Fund, except where allocation of certain expenses is more fairly made directly to the Fund.
Distribution Plan for Class IB shares – Hartford Funds Distributors, LLC (“HFD”), an indirect wholly owned subsidiary of The Hartford, serves as the Funds’ principal underwriter and distributor. The Company, on behalf of the Funds, has adopted a Distribution Plan pursuant to Rule 12b-1 of the 1940 Act to compensate the distributor, HFD, from assets attributable to the Class IB shares for services rendered and expenses borne in connection with activities primarily intended to result in the sale of the Class IB shares, subject to the review and approval of the Company’s Board of Directors.
The Distribution Plan provides that each Fund may pay annually up to 0.25% of the average daily net assets of each Fund attributable to its Class IB shares for activities primarily intended to result in the sale of Class IB shares. The Board has the authority to suspend or reduce these payments at any point in time. Under the terms of the Distribution Plan and the principal underwriting agreement, each Fund is authorized to make payments monthly to the distributor that may be used to pay or compensate entities providing distribution and shareholder servicing with respect to the Class IB shares for such entities’ fees or expenses incurred or paid in that regard. These fees are accrued daily and paid monthly.
| Hartford Series Fund, Inc. |
| Notes to Financial Statements – (continued) |
| June 30, 2014 (Unaudited) |
| (000’s Omitted) |
Other Related Party Transactions – Hartford Administrative Services Company (“HASCO”), an indirect wholly owned subsidiary of The Hartford, provides transfer agent services to the Fund. HASCO was compensated on a per account basis for providing such services. The amount paid to HASCO can be found in the Statement of Operations. These fees are accrued daily and paid monthly.
Investment Transactions:
For the six-month period ended June 30, 2014, aggregate purchases and sales of investments in Underlying Funds (excluding short-term investments) were as follows:
| | | Cost of Purchases
Excluding U.S.
Government
Obligations | | | Sales Proceeds
Excluding U.S.
Government
Obligations | |
| American Funds Asset Allocation HLS Fund | | $ | 3,674 | | | $ | 7,592 | |
| American Funds Blue Chip Income and Growth HLS Fund | | | 1,651 | | | | 3,915 | |
| American Funds Bond HLS Fund | | | 7,730 | | | | 31,088 | |
| American Funds Global Bond HLS Fund | | | 1,051 | | | | 1,246 | |
| American Funds Global Growth and Income HLS Fund | | | 1,272 | | | | 4,953 | |
| American Funds Global Growth HLS Fund | | | 2,648 | | | | 2,720 | |
| American Funds Global Small Capitalization HLS Fund | | | 1,131 | | | | 7,292 | |
| American Funds Growth HLS Fund | | | 22,708 | | | | 38,725 | |
| American Funds Growth-Income HLS Fund | | | 11,151 | | | | 23,171 | |
| American Funds International HLS Fund | | | 1,113 | | | | 23,236 | |
| American Funds New World HLS Fund | | | 3,900 | | | | 3,355 | |
Line of Credit:
The Funds, along with several other Hartford Funds, participate in a $500 million committed revolving line of credit facility. The facility is to be used for temporary or emergency purposes. Under the arrangement, the funds are required to own securities having a market value in excess of 300% of the total bank borrowings. The interest rate on borrowings varies depending on the nature of the loan. The facility also requires a fee to be paid based on the amount of the commitment. This commitment fee is allocated to all the funds participating in the line of credit based on the average net assets of the funds. During the six-month period ended June 30, 2014, the Funds did not have any borrowings under this facility.
Indemnifications:
Under the Company’s organizational documents, the Company shall indemnify its officers and directors to the full extent required or permitted under Maryland General Corporation Law and the federal securities laws. In addition, the Company, on behalf of the Funds, may enter into contracts that contain a variety of indemnifications. The Company’s maximum exposure under these arrangements is unknown. However, as of the date of these financial statements the Company has not had prior claims or losses pursuant to these contracts and expects the risk of loss to be remote.
Pending Legal Proceedings:
On February 25, 2011, Jennifer L. Kasilag, Louis Mellinger, Judith M. Menendez, Jacqueline M. Robinson, and Linda A. Russell filed a derivative lawsuit against Hartford Investment Financial Services, LLC (“HIFSCO”) (now known as Hartford Funds Distributors, LLC) on behalf of six Hartford retail mutual funds in the United States District Court for the District of New Jersey, alleging that HIFSCO received excessive advisory and distribution fees in violation of its statutory fiduciary duty under Section 36(b) of the 1940 Act when serving as investment manager and principal underwriter, respectively, to the Hartford retail mutual funds. Although this action was purportedly filed on behalf of certain of the Hartford Funds, none of the Hartford Funds is itself a defendant to the suit. HIFSCO moved to dismiss and, in September 2011, the motion was granted in part and denied in part, with leave to amend the complaint. In November 2011, plaintiffs filed an amended complaint on behalf of certain Hartford retail mutual funds, The Hartford Global Health Fund (now known as The Hartford
| Hartford Series Fund, Inc. |
| Notes to Financial Statements – (continued) |
| June 30, 2014 (Unaudited) |
| (000’s Omitted) |
Healthcare Fund), The Hartford Conservative Allocation Fund, The Hartford Growth Opportunities Fund, The Hartford Inflation Plus Fund, The Hartford Advisers Fund (now known as The Hartford Balanced Fund), and The Hartford Capital Appreciation Fund. Plaintiffs seek to rescind the investment management agreements and distribution plans between HIFSCO and these funds and to recover the total fees charged thereunder or, in the alternative, to recover any improper compensation HIFSCO received, in addition to lost earnings. HIFSCO filed a partial motion to dismiss the amended complaint and, in December 2012, the court dismissed without prejudice the claims regarding distribution fees and denied the motion with respect to the advisory fees claims. HIFSCO disputes the allegations and intends to defend vigorously.
In March 2014, the plaintiffs filed a new complaint that added as new plaintiffs The Hartford Floating Rate Fund and The Hartford Small Company Fund and named as a defendant Hartford Funds Management Company, LLC (the “Investment Manager”), which assumed the role as investment adviser to the funds as of January 2013. The Investment Manager and HIFSCO dispute the allegations and intend to defend vigorously.
This action concerns the activities of HIFSCO in its capacity as investment manager and principal underwriter to the Hartford retail mutual funds and does not concern HIFSCO’s activities in its capacity as principal underwriter to the HLS funds. For this reason, no accrual for litigation relating to this matter has been recorded in the financial statements of the Fund.
Subsequent Event:
At a meeting held on May 6, 2014, the Board of Directors of Hartford Series Fund, Inc. approved on behalf of each Fund, the reorganization of each Fund with and into a corresponding series of HIMCO Variable Insurance Trust (each an “Acquiring Fund”) (the “Reorganization”). Each Acquiring Fund is a newly organized series of HIMCO Variable Insurance Trust.
The Board of Directors of Hartford Series Fund, Inc. has called for a special meeting of shareholders of the Funds to be held in September 2014, for the purpose of seeking approval of the Agreement and Plan of Reorganization (the “Reorganization Agreement”) by the shareholders of each Fund. If approved, each Reorganization is expected to occur in October 2014.
| Hartford Series Fund, Inc. |
| Financial Highlights |
| | | ~ Selected Per-Share Data(A) ~ | | | ~ Ratios and Supplemental Data ~ | |
| Class | | Net Asset
Value at
Beginning
of Period | | | Net
Invest-
ment
Income
(Loss) | | | Net
Realized
and Un-
realized
Gain
(Loss) on
Invest-
ments | | | Total from
Investment
Operations | | | Dividends
from Net
Invest-
ment
Income | | | Distribu-
tions from
Realized
Capital
Gains | | | Total
Dividends
and
Distributions | | | Net Asset
Value at
End of
Period
(000s) | | | Total
Return(B) | | | Net
Assets at
End of
Period
(000s) | | | Ratio of
Expenses
to Average
Net Assets
Before
Waivers(C) | | | Ratio of
Expenses
to Average
Net Assets
After
Waivers(C) | | | Ratio of
Net
Investment
Income
(Loss) to
Average
Net
Assets(C) | |
| |
| American Funds Asset Allocation HLS Fund |
| For the Six-Month Period Ended June 30, 2014 (Unaudited) |
| IB | | $ | 12.63 | | | $ | – | | | $ | 0.48 | | | $ | 0.48 | | | $ | – | | | $ | – | | | $ | – | | | $ | 13.11 | | | | 3.80 | %(D) | | $ | 58,426 | | | | 0.96 | %(E) | | | 0.56 | %(E) | | | 0.02 | %(E) |
| | | | | | | | | | | | | | | | | | | | | | | | | | | | | | | | | | | | | | | | | | | | | | | | | | | | | |
| For the Year Ended December 31, 2013 |
| IB | | | 11.04 | | | | 0.12 | | | | 2.39 | | | | 2.51 | | | | (0.17 | ) | | | (0.75 | ) | | | (0.92 | ) | | | 12.63 | | | | 23.40 | | | | 62,961 | | | | 0.95 | | | | 0.55 | | | | 0.97 | |
| | | | | | | | | | | | | | | | | | | | | | | | | | | | | | | | | | | | | | | | | | | | | | | | | | | | | |
| For the Year Ended December 31, 2012(F) |
| IB | | | 9.70 | | | | 0.19 | | | | 1.34 | | | | 1.53 | | | | (0.17 | ) | | | (0.02 | ) | | | (0.19 | ) | | | 11.04 | | | | 15.80 | | | | 64,616 | | | | 0.95 | | | | 0.55 | | | | 1.56 | |
| | | | | | | | | | | | | | | | | | | | | | | | | | | | | | | | | | | | | | | | | | | | | | | | | | | | | |
| For the Year Ended December 31, 2011(F) |
| IB | | | 9.74 | | | | 0.14 | | | | (0.05 | ) | | | 0.09 | | | | (0.13 | ) | | | – | | | | (0.13 | ) | | | 9.70 | | | | 1.02 | | | | 64,356 | | | | 0.95 | | | | 0.55 | | | | 1.61 | |
| | | | | | | | | | | | | | | | | | | | | | | | | | | | | | | | | | | | | | | | | | | | | | | | | | | | | |
| For the Year Ended December 31, 2010(F) |
| IB | | | 8.85 | | | | 0.14 | | | | 0.91 | | | | 1.05 | | | | (0.16 | ) | | | – | | | | (0.16 | ) | | | 9.74 | | | | 12.13 | | | | 58,326 | | | | 0.95 | | | | 0.55 | | | | 1.73 | |
| | | | | | | | | | | | | | | | | | | | | | | | | | | | | | | | | | | | | | | | | | | | | | | | | | | | | |
| For the Year Ended December 31, 2009 |
| IB | | | 7.31 | | | | 0.18 | | | | 1.53 | | | | 1.71 | | | | (0.14 | ) | | | (0.03 | ) | | | (0.17 | ) | | | 8.85 | | | | 23.59 | | | | 48,568 | | | | 0.95 | | | | 0.55 | | | | 2.33 | |
| | | | | | | | | | | | | | | | | | | | | | | | | | | | | | | | | | | | | | | | | | | | | | | | | | | | | |
| American Funds Blue Chip Income and Growth HLS Fund |
| For the Six-Month Period Ended June 30, 2014 (Unaudited) |
| IB | | | 12.31 | | | | 0.02 | | | | 0.94 | | | | 0.96 | | | | – | | | | – | | | | – | | | | 13.27 | | | | 7.80 | (D) | | | 44,495 | | | | 1.07 | (E) | | | 0.57 | (E) | | | 0.33 | (E) |
| | | | | | | | | | | | | | | | | | | | | | | | | | | | | | | | | | | | | | | | | | | | | | | | | | | | | |
| For the Year Ended December 31, 2013 |
| IB | | | 10.11 | | | | 0.17 | | | | 3.02 | | | | 3.19 | | | | (0.18 | ) | | | (0.81 | ) | | | (0.99 | ) | | | 12.31 | | | | 32.55 | | | | 43,502 | | | | 1.07 | | | | 0.57 | | | | 1.51 | |
| | | | | | | | | | | | | | | | | | | | | | | | | | | | | | | | | | | | | | | | | | | | | | | | | | | | | |
| For the Year Ended December 31, 2012(F) |
| IB | | | 9.07 | | | | 0.15 | | | | 1.07 | | | | 1.22 | | | | (0.12 | ) | | | (0.06 | ) | | | (0.18 | ) | | | 10.11 | | | | 13.53 | | | | 39,920 | | | | 1.07 | | | | 0.57 | | | | 1.67 | |
| | | | | | | | | | | | | | | | | | | | | | | | | | | | | | | | | | | | | | | | | | | | | | | | | | | | | |
| For the Year Ended December 31, 2011(F) |
| IB | | | 9.18 | | | | 0.13 | | | | (0.24 | ) | | | (0.11 | ) | | | – | | | | – | | | | – | | | | 9.07 | | | | (1.19 | ) | | | 32,425 | | | | 1.07 | | | | 0.57 | | | | 1.44 | |
| | | | | | | | | | | | | | | | | | | | | | | | | | | | | | | | | | | | | | | | | | | | | | | | | | | | | |
| For the Year Ended December 31, 2010(F) |
| IB | | | 8.44 | | | | 0.12 | | | | 0.86 | | | | 0.98 | | | | (0.24 | ) | | | – | | | | (0.24 | ) | | | 9.18 | | | | 11.98 | | | | 34,030 | | | | 1.07 | | | | 0.57 | | | | 1.48 | |
| | | | | | | | | | | | | | | | | | | | | | | | | | | | | | | | | | | | | | | | | | | | | | | | | | | | | |
| For the Year Ended December 31, 2009 |
| IB | | | 6.74 | | | | 0.15 | | | | 1.68 | | | | 1.83 | | | | (0.09 | ) | | | (0.04 | ) | | | (0.13 | ) | | | 8.44 | | | | 27.46 | | | | 29,030 | | | | 1.07 | | | | 0.57 | | | | 2.06 | |
| | | | | | | | | | | | | | | | | | | | | | | | | | | | | | | | | | | | | | | | | | | | | | | | | | | | | |
| American Funds Bond HLS Fund |
| For the Six-Month Period Ended June 30, 2014 (Unaudited) |
| IB | | | 9.75 | | | | 0.01 | | | | 0.36 | | | | 0.37 | | | | – | | | | – | | | | – | | | | 10.12 | | | | 3.79 | (D) | | | 222,195 | | | | 0.79 | (E) | | | 0.54 | (E) | | | 0.19 | (E) |
| | | | | | | | | | | | | | | | | | | | | | | | | | | | | | | | | | | | | | | | | | | | | | | | | | | | | |
| For the Year Ended December 31, 2013 |
| IB | | | 10.52 | | | | 0.17 | | | | (0.42 | ) | | | (0.25 | ) | | | (0.22 | ) | | | (0.30 | ) | | | (0.52 | ) | | | 9.75 | | | | (2.37 | ) | | | 236,846 | | | | 0.79 | | | | 0.54 | | | | 1.67 | |
| | | | | | | | | | | | | | | | | | | | | | | | | | | | | | | | | | | | | | | | | | | | | | | | | | | | | |
| For the Year Ended December 31, 2012(F) |
| IB | | | 10.52 | | | | 0.23 | | | | 0.29 | | | | 0.52 | | | | (0.29 | ) | | | (0.23 | ) | | | (0.52 | ) | | | 10.52 | | | | 5.01 | | | | 199,008 | | | | 0.79 | | | | 0.54 | | | | 2.13 | |
| | | | | | | | | | | | | | | | | | | | | | | | | | | | | | | | | | | | | | | | | | | | | | | | | | | | | |
| For the Year Ended December 31, 2011(F) |
| IB | | | 10.21 | | | | 0.29 | | | | 0.30 | | | | 0.59 | | | | (0.28 | ) | | | – | | | | (0.28 | ) | | | 10.52 | | | | 5.84 | | | | 198,203 | | | | 0.79 | | | | 0.54 | | | | 2.57 | |
| | | | | | | | | | | | | | | | | | | | | | | | | | | | | | | | | | | | | | | | | | | | | | | | | | | | | |
| For the Year Ended December 31, 2010(F) |
| IB | | | 9.84 | | | | 0.26 | | | | 0.35 | | | | 0.61 | | | | (0.24 | ) | | | – | | | | (0.24 | ) | | | 10.21 | | | | 6.15 | | | | 206,360 | | | | 0.80 | | | | 0.55 | | | | 2.75 | |
| | | | | | | | | | | | | | | | | | | | | | | | | | | | | | | | | | | | | | | | | | | | | | | | | | | | | |
| For the Year Ended December 31, 2009 |
| IB | | | 8.98 | | | | 0.35 | | | | 0.74 | | | | 1.09 | | | | (0.23 | ) | | | – | | | | (0.23 | ) | | | 9.84 | | | | 12.23 | | | | 181,550 | | | | 0.78 | | | | 0.53 | | | | 3.75 | |
See Portfolio Turnover information at the conclusion of Financial Highlights.
| Hartford Series Fund, Inc. |
| Financial Highlights – (continued) |
| | | ~ Selected Per-Share Data(A) ~ | | | ~ Ratios and Supplemental Data ~ | |
| Class | | Net Asset
Value at
Beginning
of Period | | | Net
Invest-
ment
Income
(Loss) | | | Net
Realized
and Un-
realized
Gain
(Loss) on
Invest-
ments | | | Total from
Investment
Operations | | | Dividends
from Net
Invest-
ment
Income | | | Distribu-
tions
from
Realized
Capital
Gains | | | Total
Dividends
and
Distributions | | | Net Asset
Value at
End of
Period
(000s) | | | Total
Return(B) | | | Net
Assets at
End of
Period
(000s) | | | Ratio of
Expenses
to Average
Net Assets
Before
Waivers(C) | | | Ratio of
Expenses
to Average
Net Assets
After
Waivers(C) | | | Ratio of
Net
Investment
Income
(Loss) to
Average
Net
Assets(C) | |
| | | | | | | | | | | | | | | | | | | | | | | | | | | | | | | | | | | | | | | | |
| American Funds Global Bond HLS Fund |
| For the Six-Month Period Ended June 30, 2014 (Unaudited) |
| IB | | $ | 9.66 | | | $ | – | | | $ | 0.54 | | | $ | 0.54 | | | $ | – | | | $ | – | | | $ | – | | | $ | 10.20 | | | | 5.59 | %(D) | | $ | 17,591 | | | | 1.15 | %(E) | | | 0.65 | %(E) | | | 0.02 | %(E) |
| | | | | | | | | | | | | | | | | | | | | | | | | | | | | | | | | | | | | | | | | | | | | | | | | | | | | |
| For the Year Ended December 31, 2013 |
| IB | | | 11.10 | | | | (0.06 | ) | | | (0.29 | ) | | | (0.35 | ) | | | (0.37 | ) | | | (0.72 | ) | | | (1.09 | ) | | | 9.66 | | | | (3.03 | ) | | | 17,007 | | | | 1.09 | | | | 0.59 | | | | (0.59 | ) |
| | | | | | | | | | | | | | | | | | | | | | | | | | | | | | | | | | | | | | | | | | | | | | | | | | | | | |
| For the Year Ended December 31, 2012(F) |
| IB | | | 11.02 | | | | 0.24 | | | | 0.38 | | | | 0.62 | | | | (0.31 | ) | | | (0.23 | ) | | | (0.54 | ) | | | 11.10 | | | | 5.83 | | | | 38,193 | | | | 1.07 | | | | 0.57 | | | | 1.69 | |
| | | | | | | | | | | | | | | | | | | | | | | | | | | | | | | | | | | | | | | | | | | | | | | | | | | | | |
| For the Year Ended December 31, 2011(F) |
| IB | | | 10.86 | | | | 0.23 | | | | 0.24 | | | | 0.47 | | | | (0.23 | ) | | | (0.08 | ) | | | (0.31 | ) | | | 11.02 | | | | 4.28 | | | | 44,352 | | | | 1.06 | | | | 0.56 | | | | 2.56 | |
| | | | | | | | | | | | | | | | | | | | | | | | | | | | | | | | | | | | | | | | | | | | | | | | | | | | | |
| For the Year Ended December 31, 2010(F) |
| IB | | | 10.47 | | | | 0.27 | | | | 0.24 | | | | 0.51 | | | | (0.11 | ) | | | (0.01 | ) | | | (0.12 | ) | | | 10.86 | | | | 4.85 | | | | 38,654 | | | | 1.07 | | | | 0.57 | | | | 2.49 | |
| | | | | | | | | | | | | | | | | | | | | | | | | | | | | | | | | | | | | | | | | | | | | | | | | | | | | |
| For the Year Ended December 31, 2009 |
| IB | | | 9.85 | | | | 0.13 | | | | 0.79 | | | | 0.92 | | | | (0.30 | ) | | | – | | | | (0.30 | ) | | | 10.47 | | | | 9.43 | | | | 38,533 | | | | 1.06 | | | | 0.56 | | | | 1.29 | |
| | | | | | | | | | | | | | | | | | | | | | | | | | | | | | | | | | | | | | | | | | | | | | | | | | | | | |
| American Funds Global Growth and Income HLS Fund |
| For the Six-Month Period Ended June 30, 2014 (Unaudited) |
| IB | | | 11.24 | | | | 0.03 | | | | 0.68 | | | | 0.71 | | | | – | | | | – | | | | – | | | | 11.95 | | | | 6.32 | (D) | | | 52,113 | | | | 1.12 | (E) | | | 0.57 | (E) | | | 0.47 | (E) |
| | | | | | | | | | | | | | | | | | | | | | | | | | | | | | | | | | | | | | | | | | | | | | | | | | | | | |
| For the Year Ended December 31, 2013 |
| IB | | | 9.58 | | | | 0.24 | | | | 1.84 | | | | 2.08 | | | | (0.26 | ) | | | (0.16 | ) | | | (0.42 | ) | | | 11.24 | | | | 22.16 | | | | 52,712 | | | | 1.11 | | | | 0.56 | | | | 2.28 | |
| | | | | | | | | | | | | | | | | | | | | | | | | | | | | | | | | | | | | | | | | | | | | | | | | | | | | |
| For the Year Ended December 31, 2012(F) |
| IB | | | 8.38 | | | | 0.23 | | | | 1.20 | | | | 1.43 | | | | (0.23 | ) | | | – | | | | (0.23 | ) | | | 9.58 | | | | 17.30 | | | | 74,927 | | | | 1.10 | | | | 0.55 | | | | 2.05 | |
| | | | | | | | | | | | | | | | | | | | | | | | | | | | | | | | | | | | | | | | | | | | | | | | | | | | | |
| For the Year Ended December 31, 2011(F) |
| IB | | | 9.06 | | | | 0.22 | | | | (0.70 | ) | | | (0.48 | ) | | | (0.20 | ) | | | – | | | | (0.20 | ) | | | 8.38 | | | | (5.19 | ) | | | 78,639 | | | | 1.09 | | | | 0.54 | | | | 2.30 | |
| | | | | | | | | | | | | | | | | | | | | | | | | | | | | | | | | | | | | | | | | | | | | | | | | | | | | |
| For the Year Ended December 31, 2010(F) |
| IB | | | 8.30 | | | | 0.20 | | | | 0.72 | | | | 0.92 | | | | (0.16 | ) | | | – | | | | (0.16 | ) | | | 9.06 | | | | 11.41 | | | | 91,254 | | | | 1.10 | | | | 0.55 | | | | 2.25 | |
| | | | | | | | | | | | | | | | | | | | | | | | | | | | | | | | | | | | | | | | | | | | | | | | | | | | | |
| For the Year Ended December 31, 2009 |
| IB | | | 6.06 | | | | 0.16 | | | | 2.21 | | | | 2.37 | | | | (0.13 | ) | | | – | | | | (0.13 | ) | | | 8.30 | | | | 39.37 | | | | 88,762 | | | | 1.09 | | | | 0.54 | | | | 2.39 | |
| | | | | | | | | | | | | | | | | | | | | | | | | | | | | | | | | | | | | | | | | | | | | | | | | | | | | |
| American Funds Global Growth HLS Fund |
| For the Six-Month Period Ended June 30, 2014 (Unaudited) |
| IB | | | 12.56 | | | | 0.01 | | | | 0.28 | | | | 0.29 | | | | – | | | | – | | | | – | | | | 12.85 | | | | 2.31 | (D) | | | 22,712 | | | | 1.36 | (E) | | | 0.61 | (E) | | | 0.18 | (E) |
| | | | | | | | | | | | | | | | | | | | | | | | | | | | | | | | | | | | | | | | | | | | | | | | | | | | | |
| For the Year Ended December 31, 2013 |
| IB | | | 10.45 | | | | 0.08 | | | | 2.83 | | | | 2.91 | | | | (0.06 | ) | | | (0.74 | ) | | | (0.80 | ) | | | 12.56 | | | | 28.77 | | | | 24,509 | | | | 1.34 | | | | 0.59 | | | | 0.71 | |
| | | | | | | | | | | | | | | | | | | | | | | | | | | | | | | | | | | | | | | | | | | | | | | | | | | | | |
| For the Year Ended December 31, 2012(F) |
| IB | | | 8.74 | | | | 0.06 | | | | 1.86 | | | | 1.92 | | | | (0.10 | ) | | | (0.11 | ) | | | (0.21 | ) | | | 10.45 | | | | 22.19 | | | | 29,055 | | | | 1.33 | | | | 0.58 | | | | 0.48 | |
| | | | | | | | | | | | | | | | | | | | | | | | | | | | | | | | | | | | | | | | | | | | | | | | | | | | | |
| For the Year Ended December 31, 2011(F) |
| IB | | | 9.74 | | | | 0.10 | | | | (0.99 | ) | | | (0.89 | ) | | | (0.11 | ) | | | – | | | | (0.11 | ) | | | 8.74 | | | | (9.18 | ) | | | 29,319 | | | | 1.32 | | | | 0.57 | | | | 0.95 | |
| | | | | | | | | | | | | | | | | | | | | | | | | | | | | | | | | | | | | | | | | | | | | | | | | | | | | |
| For the Year Ended December 31, 2010(F) |
| IB | | | 8.83 | | | | 0.10 | | | | 0.89 | | | | 0.99 | | | | (0.08 | ) | | | – | | | | (0.08 | ) | | | 9.74 | | | | 11.41 | | | | 34,245 | | | | 1.32 | | | | 0.57 | | | | 1.17 | |
| | | | | | | | | | | | | | | | | | | | | | | | | | | | | | | | | | | | | | | | | | | | | | | | | | | | | |
| For the Year Ended December 31, 2009 |
| IB | | | 6.40 | | | | 0.09 | | | | 2.57 | | | | 2.66 | | | | (0.12 | ) | | | (0.11 | ) | | | (0.23 | ) | | | 8.83 | | | | 41.78 | | | | 30,457 | | | | 1.32 | | | | 0.57 | | | | 1.24 | |
See Portfolio Turnover information at the conclusion of Financial Highlights.
| Hartford Series Fund, Inc. |
| Financial Highlights – (continued) |
| | | ~ Selected Per-Share Data(A) ~ | | | ~ Ratios and Supplemental Data ~ | |
| Class | | Net Asset
Value at
Beginning
of Period | | | Net
Invest-
ment
Income
(Loss) | | | Net
Realized
and Un-
realized
Gain
(Loss) on
Invest-
ments | | | Total from
Investment
Operations | | | Dividends
from Net
Invest-
ment
Income | | | Distribu-
tions
from
Realized
Capital
Gains | | | Total
Dividends
and
Distributions | | | Net Asset
Value at
End of
Period
(000s) | | | Total
Return(B) | | | Net
Assets at
End of
Period
(000s) | | | Ratio of
Expenses
to Average
Net Assets
Before
Waivers(C) | | | Ratio of
Expenses
to Average
Net Assets
After
Waivers(C) | | | Ratio of
Net
Investment
Income
(Loss) to
Average
Net
Assets(C) | |
| | | | | | | | | | | | | | | | | | | | | | | | | | | | | | | | | | | | | | | | |
| American Funds Global Small Capitalization HLS Fund |
| For the Six-Month Period Ended June 30, 2014 (Unaudited) |
| IB | | $ | 9.47 | | | $ | (0.03 | ) | | $ | 0.68 | | | $ | 0.65 | | | $ | – | | | $ | – | | | $ | – | | | $ | 10.12 | | | | 6.86 | %(D) | | $ | 58,971 | | | | 1.12 | %(E) | | | 0.57 | %(E) | | | (0.57 | )%(E) |
| | | | | | | | | | | | | | | | | | | | | | | | | | | | | | | | | | | | | | | | | | | | | | | | | | | | | |
| For the Year Ended December 31, 2013 |
| IB | | | 8.29 | | | | 0.03 | | | | 2.18 | | | | 2.21 | | | | (0.09 | ) | | | (0.94 | ) | | | (1.03 | ) | | | 9.47 | | | | 27.89 | | | | 61,224 | | | | 1.13 | | | | 0.58 | | | | 0.30 | |
| | | | | | | | | | | | | | | | | | | | | | | | | | | | | | | | | | | | | | | | | | | | | | | | | | | | | |
| For the Year Ended December 31, 2012(F) |
| IB | | | 7.83 | | | | 0.10 | | | | 1.23 | | | | 1.33 | | | | (0.10 | ) | | | (0.77 | ) | | | (0.87 | ) | | | 8.29 | | | | 17.85 | | | | 53,881 | | | | 1.11 | | | | 0.56 | | | | 0.99 | |
| | | | | | | | | | | | | | | | | | | | | | | | | | | | | | | | | | | | | | | | | | | | | | | | | | | | | |
| For the Year Ended December 31, 2011(F) |
| IB | | | 9.92 | | | | 0.10 | | | | (2.01 | ) | | | (1.91 | ) | | | (0.13 | ) | | | (0.05 | ) | | | (0.18 | ) | | | 7.83 | | | | (19.40 | ) | | | 55,658 | | | | 1.11 | | | | 0.56 | | | | 0.98 | |
| | | | | | | | | | | | | | | | | | | | | | | | | | | | | | | | | | | | | | | | | | | | | | | | | | | | | |
| For the Year Ended December 31, 2010(F) |
| IB | | | 8.13 | | | | 0.11 | | | | 1.68 | | | | 1.79 | | | | – | | | | – | | | | – | | | | 9.92 | | | | 22.06 | | | | 74,999 | | | | 1.12 | | | | 0.57 | | | | 1.35 | |
| | | | | | | | | | | | | | | | | | | | | | | | | | | | | | | | | | | | | | | | | | | | | | | | | | | | | |
| For the Year Ended December 31, 2009 |
| IB | | | 5.10 | | | | – | | | | 3.08 | | | | 3.08 | | | | – | | | | (0.05 | ) | | | (0.05 | ) | | | 8.13 | | | | 60.77 | | | | 61,519 | | | | 1.10 | | | | 0.55 | | | | 0.02 | |
| | | | | | | | | | | | | | | | | | | | | | | | | | | | | | | | | | | | | | | | | | | | | | | | | | | | | |
| American Funds Growth HLS Fund |
| For the Six-Month Period Ended June 30, 2014 (Unaudited) |
| IB | | | 13.09 | | | | 0.03 | | | | 0.67 | | | | 0.70 | | | | – | | | | – | | | | – | | | | 13.79 | | | | 5.35 | (D) | | | 335,760 | | | | 1.04 | (E) | | | 0.54 | (E) | | | 0.43 | (E) |
| | | | | | | | | | | | | | | | | | | | | | | | | | | | | | | | | | | | | | | | | | | | | | | | | | | | | |
| For the Year Ended December 31, 2013 |
| IB | | | 10.45 | | | | 0.07 | | | | 3.00 | | | | 3.07 | | | | (0.06 | ) | | | (0.37 | ) | | | (0.43 | ) | | | 13.09 | | | | 29.78 | | | | 351,018 | | | | 1.04 | | | | 0.54 | | | | 0.60 | |
| | | | | | | | | | | | | | | | | | | | | | | | | | | | | | | | | | | | | | | | | | | | | | | | | | | | | |
| For the Year Ended December 31, 2012(F) |
| IB | | | 8.95 | | | | 0.05 | | | | 1.51 | | | | 1.56 | | | | (0.03 | ) | | | (0.03 | ) | | | (0.06 | ) | | | 10.45 | | | | 17.56 | | | | 333,889 | | | | 1.04 | | | | 0.54 | | | | 0.50 | |
| | | | | | | | | | | | | | | | | | | | | | | | | | | | | | | | | | | | | | | | | | | | | | | | | | | | | |
| For the Year Ended December 31, 2011(F) |
| IB | | | 9.38 | | | | 0.03 | | | | (0.46 | ) | | | (0.43 | ) | | | – | | | | – | | | | – | | | | 8.95 | | | | (4.57 | ) | | | 317,968 | | | | 1.04 | | | | 0.54 | | | | 0.33 | |
| | | | | | | | | | | | | | | | | | | | | | | | | | | | | | | | | | | | | | | | | | | | | | | | | | | | | |
| For the Year Ended December 31, 2010(F) |
| IB | | | 7.96 | | | | 0.04 | | | | 1.42 | | | | 1.46 | | | | (0.04 | ) | | | – | | | | (0.04 | ) | | | 9.38 | | | | 18.36 | | | | 356,162 | | | | 1.05 | | | | 0.55 | | | | 0.43 | |
| | | | | | | | | | | | | | | | | | | | | | | | | | | | | | | | | | | | | | | | | | | | | | | | | | | | | |
| For the Year Ended December 31, 2009 |
| IB | | | 5.81 | | | | 0.03 | | | | 2.22 | | | | 2.25 | | | | (0.03 | ) | | | (0.07 | ) | | | (0.10 | ) | | | 7.96 | | | | 39.02 | | | | 296,659 | | | | 1.03 | | | | 0.53 | | | | 0.47 | |
| | | | | | | | | | | | | | | | | | | | | | | | | | | | | | | | | | | | | | | | | | | | | | | | | | | | | |
| American Funds Growth-Income HLS Fund |
| For the Six-Month Period Ended June 30, 2014 (Unaudited) |
| IB | | | 13.26 | | | | – | | | | 0.90 | | | | 0.90 | | | | – | | | | – | | | | – | | | | 14.16 | | | | 6.79 | (D) | | | 189,077 | | | | 0.99 | (E) | | | 0.54 | (E) | | | 0.05 | (E) |
| | | | | | | | | | | | | | | | | | | | | | | | | | | | | | | | | | | | | | | | | | | | | | | | | | | | | |
| For the Year Ended December 31, 2013 |
| IB | | | 10.20 | | | | 0.11 | | | | 3.23 | | | | 3.34 | | | | (0.14 | ) | | | (0.14 | ) | | | (0.28 | ) | | | 13.26 | | | | 33.14 | | | | 197,689 | | | | 0.99 | | | | 0.54 | | | | 0.97 | |
| | | | | | | | | | | | | | | | | | | | | | | | | | | | | | | | | | | | | | | | | | | | | | | | | | | | | |
| For the Year Ended December 31, 2012(F) |
| IB | | | 8.81 | | | | 0.13 | | | | 1.38 | | | | 1.51 | | | | (0.12 | ) | | | – | | | | (0.12 | ) | | | 10.20 | | | | 17.16 | | | | 183,220 | | | | 0.99 | | | | 0.54 | | | | 1.29 | |
| | | | | | | | | | | | | | | | | | | | | | | | | | | | | | | | | | | | | | | | | | | | | | | | | | | | | |
| For the Year Ended December 31, 2011(F) |
| IB | | | 9.00 | | | | 0.12 | | | | (0.31 | ) | | | (0.19 | ) | | | – | | | | – | | | | – | | | | 8.81 | | | | (2.12 | ) | | | 170,059 | | | | 0.98 | | | | 0.53 | | | | 1.26 | |
| | | | | | | | | | | | | | | | | | | | | | | | | | | | | | | | | | | | | | | | | | | | | | | | | | | | | |
| For the Year Ended December 31, 2010(F) |
| IB | | | 8.20 | | | | 0.10 | | | | 0.81 | | | | 0.91 | | | | (0.11 | ) | | | – | | | | (0.11 | ) | | | 9.00 | | | | 11.11 | | | | 185,836 | | | | 0.99 | | | | 0.54 | | | | 1.19 | |
| | | | | | | | | | | | | | | | | | | | | | | | | | | | | | | | | | | | | | | | | | | | | | | | | | | | | |
| For the Year Ended December 31, 2009 |
| IB | | | 6.39 | | | | 0.11 | | | | 1.86 | | | | 1.97 | | | | (0.11 | ) | | | (0.05 | ) | | | (0.16 | ) | | | 8.20 | | | | 30.85 | | | | 168,690 | | | | 0.98 | | | | 0.53 | | | | 1.56 | |
See Portfolio Turnover information at the conclusion of Financial Highlights.
| Hartford Series Fund, Inc. |
| Financial Highlights – (continued) |
| | | ~ Selected Per-Share Data(A) ~ | | | ~ Ratios and Supplemental Data ~ | |
| Class | | Net Asset
Value at
Beginning
of Period | | | Net
Invest-
ment
Income
(Loss) | | | Net
Realized
and Un-
realized
Gain
(Loss) on
Invest-
ments | | | Total from
Investment
Operations | | | Dividends
from Net
Invest-
ment
Income | | | Distribu-
tions
from
Realized
Capital
Gains | | | Total
Dividends
and
Distributions | | | Net Asset
Value at
End of
Period
(000s) | | | Total
Return(B) | | | Net
Assets at
End of
Period
(000s) | | | Ratio of
Expenses
to Average
Net Assets
Before
Waivers(C) | | | Ratio of
Expenses
to Average
Net Assets
After
Waivers(C) | | | Ratio of
Net
Investment
Income
(Loss) to
Average
Net
Assets(C) | |
| | | | | | | | | | | | | | | | | | | | | | | | | | | | | | | | | | | | | | | | |
| American Funds International HLS Fund |
| For the Six-Month Period Ended June 30, 2014 (Unaudited) |
| IB | | $ | 10.27 | | | $ | (0.02 | ) | | $ | 0.39 | | | $ | 0.37 | | | $ | – | | | $ | – | | | $ | – | | | $ | 10.64 | | | | 3.60 | %(D) | | $ | 212,410 | | | | 1.15 | %(E) | | | 0.55 | %(E) | | | (0.35 | )%(E) |
| | | | | | | | | | | | | | | | | | | | | | | | | | | | | | | | | | | | | | | | | | | | | | | | | | | | | |
| For the Year Ended December 31, 2013 |
| IB | | | 8.73 | | | | 0.09 | | | | 1.74 | | | | 1.83 | | | | (0.11 | ) | | | (0.18 | ) | | | (0.29 | ) | | | 10.27 | | | | 21.23 | | | | 226,400 | | | | 1.15 | | | | 0.55 | | | | 0.99 | |
| | | | | | | | | | | | | | | | | | | | | | | | | | | | | | | | | | | | | | | | | | | | | | | | | | | | | |
| For the Year Ended December 31, 2012(F) |
| IB | | | 7.54 | | | | 0.10 | | | | 1.22 | | | | 1.32 | | | | (0.13 | ) | | | – | | | | (0.13 | ) | | | 8.73 | | | | 17.58 | | | | 225,298 | | | | 1.14 | | | | 0.54 | | | | 1.15 | |
| | | | | | | | | | | | | | | | | | | | | | | | | | | | | | | | | | | | | | | | | | | | | | | | | | | | | |
| For the Year Ended December 31, 2011(F) |
| IB | | | 8.96 | | | | 0.13 | | | | (1.40 | ) | | | (1.27 | ) | | | (0.15 | ) | | | – | | | | (0.15 | ) | | | 7.54 | | | | (14.23 | ) | | | 208,399 | | | | 1.14 | | | | 0.54 | | | | 1.52 | |
| | | | | | | | | | | | | | | | | | | | | | | | | | | | | | | | | | | | | | | | | | | | | | | | | | | | | |
| For the Year Ended December 31, 2010(F) |
| IB | | | 8.50 | | | | 0.13 | | | | 0.44 | | | | 0.57 | | | | (0.08 | ) | | | (0.03 | ) | | | (0.11 | ) | | | 8.96 | | | | 6.92 | | | | 235,702 | | | | 1.16 | | | | 0.56 | | | | 1.78 | |
| | | | | | | | | | | | | | | | | | | | | | | | | | | | | | | | | | | | | | | | | | | | | | | | | | | | | |
| For the Year Ended December 31, 2009 |
| IB | | | 6.09 | | | | 0.11 | | | | 2.48 | | | | 2.59 | | | | (0.11 | ) | | | (0.07 | ) | | | (0.18 | ) | | | 8.50 | | | | 42.75 | | | | 197,258 | | | | 1.13 | | | | 0.53 | | | | 1.53 | |
| | | | | | | | | | | | | | | | | | | | | | | | | | | | | | | | | | | | | | | | | | | | | | | | | | | | | |
| American Funds New World HLS Fund |
| For the Six-Month Period Ended June 30, 2014 (Unaudited) |
| IB | | | 9.17 | | | | (0.01 | ) | | | 0.44 | | | | 0.43 | | | | – | | | | – | | | | – | | | | 9.60 | | | | 4.69 | (D) | | | 33,233 | | | | 1.45 | (E) | | | 0.60 | (E) | | | (0.27 | )(E) |
| | | | | | | | | | | | | | | | | | | | | | | | | | | | | | | | | | | | | | | | | | | | | | | | | | | | | |
| For the Year Ended December 31, 2013 |
| IB | | | 9.46 | | | | 0.07 | | | | 0.89 | | | | 0.96 | | | | (0.08 | ) | | | (1.17 | ) | | | (1.25 | ) | | | 9.17 | | | | 11.06 | | | | 34,304 | | | | 1.43 | | | | 0.58 | | | | 0.77 | |
| | | | | | | | | | | | | | | | | | | | | | | | | | | | | | | | | | | | | | | | | | | | | | | | | | | | | |
| For the Year Ended December 31, 2012(F) |
| IB | | | 8.66 | | | | 0.07 | | | | 1.38 | | | | 1.45 | | | | (0.15 | ) | | | (0.50 | ) | | | (0.65 | ) | | | 9.46 | | | | 17.47 | | | | 51,697 | | | | 1.41 | | | | 0.56 | | | | 0.61 | |
| | | | | | | | | | | | | | | | | | | | | | | | | | | | | | | | | | | | | | | | | | | | | | | | | | | | | |
| For the Year Ended December 31, 2011(F) |
| IB | | | 10.24 | | | | 0.15 | | | | (1.60 | ) | | | (1.45 | ) | | | (0.13 | ) | | | – | | | | (0.13 | ) | | | 8.66 | | | | (14.23 | ) | | | 52,569 | | | | 1.41 | | | | 0.56 | | | | 1.33 | |
| | | | | | | | | | | | | | | | | | | | | | | | | | | | | | | | | | | | | | | | | | | | | | | | | | | | | |
| For the Year Ended December 31, 2010(F) |
| IB | | | 8.80 | | | | 0.11 | | | | 1.42 | | | | 1.53 | | | | (0.09 | ) | | | – | | | | (0.09 | ) | | | 10.24 | | | | 17.54 | | | | 72,257 | | | | 1.42 | | | | 0.57 | | | | 1.30 | |
| | | | | | | | | | | | | | | | | | | | | | | | | | | | | | | | | | | | | | | | | | | | | | | | | | | | | |
| For the Year Ended December 31, 2009 |
| IB | | | 6.00 | | | | 0.10 | | | | 2.84 | | | | 2.94 | | | | (0.08 | ) | | | (0.06 | ) | | | (0.14 | ) | | | 8.80 | | | | 49.14 | | | | 58,578 | | | | 1.40 | | | | 0.55 | | | | 1.44 | |
| (A) | Information presented relates to a share outstanding throughout the indicated period. Net investment income (loss) per share amounts are calculated based on average shares outstanding unless otherwise noted. |
| (B) | The figures do not include sales charges or other fees which may be applied at the variable life insurance, variable annuity or qualified retirement plan product level. Any such additional sales charges or other fees would lower the Fund's performance. |
| (C) | Ratios do not include expenses of the Underlying Funds. |
| (F) | Net investment income (loss) per share amounts have been calculated using the SEC method. |
See Portfolio Turnover information at the conclusion of Financial Highlights.
| Hartford Series Fund, Inc. |
| Financial Highlights – (continued) |
| | | Portfolio Turnover Rate | |
| | | For the Six-Month
Period Ended
June 30, 2014 | | | For the Year Ended
December 31, 2013 | | | For the Year Ended
December 31, 2012 | | | For the Year Ended
December 31, 2011 | | | For the Year Ended
December 31, 2010 | | | For the Year Ended
December 31, 2009 | |
| | | | | | | | | | | | | | | | | | | |
| American Funds Asset Allocation HLS Fund | | | 6 | % | | | 29 | % | | | 14 | % | | | 9 | % | | | 11 | % | | | 8 | % |
| American Funds Blue Chip Income and Growth HLS Fund | | | 4 | | | | 16 | | | | 23 | | | | 14 | | | | 11 | | | | 6 | |
| American Funds Bond HLS Fund | | | 3 | | | | 15 | | | | 15 | | | | 15 | | | | 13 | | | | 2 | |
| American Funds Global Bond HLS Fund | | | 6 | | | | 10 | | | | 8 | | | | 16 | | | | 17 | | | | 5 | |
| American Funds Global Growth and Income HLS Fund | | | 2 | | | | 4 | | | | 5 | | | | 5 | | | | 8 | | | | 3 | |
| American Funds Global Growth HLS Fund | | | 11 | | | | 7 | | | | 4 | | | | 11 | | | | 11 | | | | 12 | |
| American Funds Global Small Capitalization HLS Fund | | | 2 | | | | 11 | | | | 4 | | | | 11 | | | | 16 | | | | 10 | |
| American Funds Growth HLS Fund | | | 7 | | | | 3 | | | | 4 | | | | 5 | | | | 7 | | | | 3 | |
| American Funds Growth-Income HLS Fund | | | 6 | | | | 6 | | | | 9 | | | | 5 | | | | 8 | | | | 1 | |
| American Funds International HLS Fund | | | 1 | | | | 4 | | | | 7 | | | | 9 | | | | 7 | | | | 7 | |
| American Funds New World HLS Fund | | | 10 | | | | 6 | | | | 8 | | | | 9 | | | | 12 | | | | 8 | |
| Hartford Series Fund, Inc. |
| Directors and Officers (Unaudited) |
The Board of Directors of the Company (the "Directors") appoints officers who are responsible for the day-to-day operations of the Funds and who execute policies formulated by the Directors. Each Director serves until his or her death, resignation, or retirement or until the next annual meeting of shareholders is held or until his or her successor is elected and qualifies.
Directors and officers who are employed by or who have a financial interest in The Hartford are considered “interested” persons of the Funds pursuant to the 1940 Act. Each officer and two of the Company's Directors, as noted in the chart below, are “interested” persons of the Funds. Each Director serves as a director for The Hartford Mutual Funds, Inc., The Hartford Mutual Funds II, Inc., Hartford Series Fund, Inc., and Hartford HLS Series Fund II, Inc., and as a trustee for The Hartford Alternative Strategies Fund, which, as of June 30, 2014, collectively consist of 78 funds. Correspondence may be sent to Directors and officers c/o Hartford Funds, 5 Radnor Corporate Center, Suite 300, 100 Matsonford Road, Radnor, Pennsylvania 19087, except that correspondence to Mr. Annoni, Mr. Dressen and Ms. Quade may be sent to 500 Bielenberg Drive, Suite 500, Woodbury, Minnesota 55125.
The table below sets forth, for each Director and officer, his or her name, year of birth, current position with the Company and date first elected or appointed to Hartford Series Fund, Inc. ("HSF") and Hartford HLS Series Fund II, Inc. ("HSF2"), principal occupation, and, for Directors, other directorships held. The Funds' Statement of Additional Information contains further information on the Directors and is available free of charge by calling 1-800-862-6668 or writing to Hartford HLS Funds, c/o Hartford Life Insurance Company, Hartford Life and Annuity Insurance Company, P.O. Box 14293, Lexington, KY 40512-4293.
Information on the aggregate remuneration paid to the directors of the Company can be found in the Statements of Operations herein. The Funds pay to The Hartford a portion of the Chief Compliance Officer’s compensation, but do not pay salaries or compensation to any of their other officers or Directors who are employed by The Hartford.
Non-Interested Directors
Lynn S. Birdsong (1946) Director since 2003, Co-Chairman of the Investment Committee since 2005
Mr. Birdsong is a private investor. Mr. Birdsong currently serves as a Director of the Sovereign High Yield Investment Company (April 2010 to current). Mr. Birdsong currently serves as an Independent Director of Nomura Partners Funds, Inc. (formerly, The Japan Fund) (April 2003 to current). From 2003 to March 2005, Mr. Birdsong was an Independent Director of the Atlantic Whitehall Funds. From 1979 to 2002, Mr. Birdsong was a Managing Director of Zurich Scudder Investments, an investment management firm. During his employment with Scudder, Mr. Birdsong was an Interested Director of The Japan Fund. From January 1981 through December 2013, Mr. Birdsong was a partner in Birdsong Company, an advertising specialty firm.
Robert M. Gavin, Jr. (1940) Director since 2002 (HSF) and 1986 (HSF2), Chairman of the Board since 2004
Dr. Gavin is an educational consultant. Prior to September 1, 2001, he was President of Cranbrook Education Community and prior to July 1996, he was President of Macalester College, St. Paul, Minnesota.
Duane E. Hill (1945) Director since 2001 (HSF) and 2002 (HSF2), Chairman of the Nominating Committee since 2003
Mr. Hill is a Partner of TSG Ventures L.P., a private equity investment company. Mr. Hill is a former partner of TSG Capital Group, a private equity investment firm that served as sponsor and lead investor in leveraged buyouts of middle market companies.
Sandra S. Jaffee (1941) Director since 2005
Ms. Jaffee is the founder and Chief Executive Officer of a private company, Homeworks Concierge, LLC, which provides residential property management services in Westchester County, New York (January 2012 to present). Ms. Jaffee served as Chairman (2008 to 2009) and Chief Executive Officer of Fortent (formerly Searchspace Group), a leading provider of compliance/regulatory technology to financial institutions from August 2005 to August 2009. From August 2004 to August 2005, Ms. Jaffee served as an Entrepreneur in Residence with Warburg Pincus, a private equity firm. Prior to joining Warburg Pincus, Ms. Jaffee served as Executive Vice President at Citigroup, from September 1995 to July 2004, where she was President and Chief Executive Officer of Citibank’s Global Securities Services (1995 to 2003). Ms. Jaffee currently serves as a member of the Board of Directors of Broadridge Financial Solutions as well as a Trustee of Muhlenberg College.
William P. Johnston (1944) Director since 2005, Chairman of the Compliance Committee since 2005
In June 2006, Mr. Johnston was appointed as Senior Advisor to The Carlyle Group, a global private equity and other alternative asset investment firm and currently serves as an Operating Executive. In July 2006, Mr. Johnston was elected to the Board of Directors of
| Hartford Series Fund, Inc. |
| Directors and Officers (Unaudited) – (continued) |
MultiPlan, Inc. and served as a Director (July 2006 to August 2010). In August 2007, Mr. Johnston was elected to the Board of Directors of LifeCare Holdings, Inc. and served as a Director (August 2007 to June 2013). In February 2008, Mr. Johnston was elected to the Board of Directors of HCR-ManorCare, Inc. In May 2006, Mr. Johnston was elected to the Supervisory Board of Fresenius Medical Care AG & Co. KGaA, after its acquisition of Renal Care Group, Inc. in March 2006. Mr. Johnston joined Renal Care Group in November 2002 as a member of the Board of Directors and served as Chairman of the Board from March 2003 through March 2006. From 2002 through 2013, Mr. Johnston served as a Board member of the Georgia O’Keefe Museum. From September 1987 to December 2002, Mr. Johnston was with Equitable Securities Corporation (and its successors, SunTrust Equitable Securities and SunTrust Robinson Humphrey) serving in various investment banking and managerial positions, including Managing Director and Head of Investment Banking, Chief Executive Officer and Vice Chairman.
Phillip O. Peterson (1944) Director since 2002 (HSF) and 2000 (HSF2), Chairman of the Audit Committee since 2002
Mr. Peterson is a mutual fund industry consultant. He was a partner of KPMG LLP (an accounting firm) until July 1999. Mr. Peterson joined William Blair Funds in February 2007 as a member of the Board of Trustees. From February 2012 to February 2014, Mr. Peterson served as a Trustee of Symetra Variable Mutual Funds. From January 2004 to April 2005, Mr. Peterson served as Independent President of the Strong Mutual Funds.
Lemma W. Senbet (1946) Director since 2005
Dr. Senbet is the William E. Mayer Chair Professor of Finance and Founding Director, Center for Financial Policy, at the University of Maryland, Robert H. Smith School of Business. He was chair of the Finance Department of the University of Maryland, Robert H. Smith School of Business from 1998 to 2006. Since June 2013, he has been on leave from the University to serve as Executive Director of African Economic Research Consortium which focuses on economic policy research and training. Previously, he was a chaired professor of finance at the University of Wisconsin-Madison. Also, he was a Director of the Fortis Funds from March 2000 to July 2002. Dr. Senbet served as Director of the American Finance Association and President of the Western Finance Association. In 2006, Dr. Senbet was inducted Fellow of Financial Management Association International for his career-long distinguished scholarship and professional service.
Interested Directors and Officers
James E. Davey (1964) Director since 2012, President and Chief Executive Officer since 2010
Mr. Davey serves as Executive Vice President of Hartford Life Insurance Company (“HLIC”) and The Hartford Financial Services Group, Inc. Additionally, Mr. Davey serves as Chairman of the Board, Manager and Senior Managing Director of Hartford Funds Distributors, LLC (“HFD”). He also currently serves as Director, Chairman of the Board, President and Senior Managing Director of Hartford Administrative Services Company (“HASCO”). Mr. Davey also serves as Manager, Chairman of the Board and Senior Managing Director for Hartford Funds Management Company, LLC (“HFMC”) and Director, Chairman of the Board and Senior Managing Director for Hartford Funds Management Group, Inc. ("HFMG"). Mr. Davey has served in various positions within The Hartford and its subsidiaries in connection with the operation of the Hartford Funds. Mr. Davey joined The Hartford in 2002.
Lowndes A. Smith (1939) Director since 1996 (HSF) and 2002 (HSF2), Co-Chairman of the Investment Committee since 2005
Mr. Smith served as Vice Chairman of The Hartford from February 1997 to January 2002, as President and Chief Executive Officer of Hartford Life, Inc. from February 1997 to January 2002, and as President and Chief Operating Officer of The Hartford Life Insurance Companies from January 1989 to January 2002. Mr. Smith serves as a Director of White Mountains Insurance Group Ltd. (October 2003 to current); One Beacon Insurance (October 2006 to current); Symetra Financial (August 2007 to current) and is a Managing Director of Whittington Gray Associates (January 2007 to current).
Other Officers
Mark A. Annoni (1964) Vice President, Controller and Treasurer since 2012
Mr. Annoni currently serves as the Assistant Vice President of HLIC (February 2004 to present) and Senior Vice President of HFMG (December 2013 to present). Mr. Annoni has served in various positions within The Hartford and its subsidiaries in connection with the operation of the Hartford Funds. Mr. Annoni joined The Hartford in 2001.
| Hartford Series Fund, Inc. |
| Directors and Officers (Unaudited) – (continued) |
Michael R. Dressen (1963) AML Compliance Officer since 2011
Mr. Dressen currently serves as Assistant Vice President of HLIC. He also serves as Chief Compliance Officer and AML Compliance Officer of HASCO and as AML Officer of HFD. Mr. Dressen has served in various positions within The Hartford and its subsidiaries in connection with the operation of the Hartford Funds.
Edward P. Macdonald (1967) Vice President, Secretary and Chief Legal Officer since 2005
Mr. Macdonald currently serves as Assistant Secretary, Executive Vice President and Deputy General Counsel of HFD, HASCO, HFMC and HFMG. He also serves as Vice President of HLIC. Mr. Macdonald has served in various positions within The Hartford and its subsidiaries in connection with the operation of the Hartford Funds. Mr. Macdonald joined The Hartford in 2005.
Joseph G. Melcher (1973) Vice President and Chief Compliance Officer since 2013
Mr. Melcher currently serves as Executive Vice President of HFD, HFMG and HASCO. Mr. Melcher also currently serves as Executive Vice President and Chief Compliance Officer of HFMC. Mr. Melcher has served in various positions within The Hartford and its subsidiaries in connection with the operation of the Hartford Funds since joining The Hartford in 2012. Prior to joining The Hartford, Mr. Melcher worked at Touchstone Investments, a member of the Western & Southern Financial Group, where he held the position of Vice President and Chief Compliance Officer from 2010 through 2012 and Assistant Vice President, Compliance from 2005 to 2010.
Vernon J. Meyer (1964) Vice President since 2006
Mr. Meyer currently serves as Senior Vice President of HLIC. He also currently serves as Managing Director and Chief Investment Officer of HFMC and Managing Director of HFMG. Mr. Meyer has served in various positions within The Hartford and its subsidiaries in connection with the operation of the Hartford Funds. Mr. Meyer joined The Hartford in 2004.
Laura S. Quade (1969) Vice President since 2012
Ms. Quade currently serves as Vice President of HASCO, HFD and HFMG. She is the Head of Operations of HASCO and also serves as Director, Enterprise Operations of HLIC. Ms. Quade has served in various positions within The Hartford and its subsidiaries in connection with the operation of the Hartford Funds.
Martin A. Swanson (1962) Vice President since 2010
Mr. Swanson currently serves as Vice President of HLIC. Mr. Swanson also serves as Managing Director, Chief Marketing Officer and Principal of HFD and Managing Director of HFMG. Mr. Swanson has served in various positions within The Hartford and its subsidiaries in connection with the operation of the Hartford Funds.
HOW TO OBTAIN A COPY OF THE FUND’S PROXY VOTING POLICIES AND VOTING RECORDS (UNAUDITED)
A description of the policies and procedures that the Funds use to determine how to vote proxies relating to portfolio securities and information about how the Funds voted proxies relating to portfolio securities during the most recent twelve-month period ended June 30 are available (1) without charge, upon request, by calling 800-862-6668 and (2) on the SEC’s website at http://www.sec.gov.
QUARTERLY PORTFOLIO HOLDINGS INFORMATION (UNAUDITED)
The Funds file a complete schedule of portfolio holdings with the SEC for the first and third quarters of each fiscal year on Form N-Q. The Funds’ Forms N-Q are available (1) without charge, upon request, by calling 800-862-6668 and (2) on the SEC’s website at http://www.sec.gov. The Form N-Q may be reviewed and copied at the SEC’s Public Reference Room in Washington, DC. Information on the operation of the Public Reference Room may be obtained by calling 1-800-SEC-0330.
| Hartford Series Fund, Inc. |
| Expense Example (Unaudited) |
Your Fund's Expenses
As a shareholder of the Fund, you incur two types of costs: (1) transaction costs and (2) ongoing costs, including investment management fees, distribution and/or service (12b-1) fees, if any, and other fund expenses. This example is intended to help you understand your ongoing costs (in dollars) of investing in the Fund and to compare these costs with the ongoing costs of investing in other mutual funds. The example is based on an investment of $1,000 invested at the beginning of the period and held for the entire period of December 31, 2013 through June 30, 2014.
Actual Expenses
The first set of columns of the table below provides information about actual account values and actual expenses. You may use the information in this column, together with the amount you invested, to estimate the expenses that you paid over the period. Simply divide your account value by $1,000 (for example, an $8,600 account value divided by $1,000 = 8.6), then multiply the result by the number in the line under the heading entitled “Expenses Paid During Period” to estimate the expenses you paid on your account during this period.
Hypothetical Example for Comparison Purposes
The second set of columns of the table below provides information about hypothetical account values and hypothetical expenses based on the Fund's actual expense ratio and an assumed rate of return of 5% per year before expenses, which is not the Fund's actual return. The hypothetical account values and expenses may not be used to estimate the actual ending account balance or expenses you paid for the period. You may use this information to compare the ongoing costs of investing in the Fund and other funds. To do so, compare this 5% hypothetical example with the 5% hypothetical examples that appear in the shareholder reports of the other funds.
Please note that the expenses shown in the table are meant to highlight your ongoing costs only and do not reflect any transactional costs, such as sales charges (loads) and CDSC. Therefore, the second set of columns of the table is useful in comparing ongoing costs only, and will not help you determine the relative total costs of owning different funds. In addition, if these transactional costs were included, your costs would be higher. Expenses are equal to the Fund's annualized expense ratios multiplied by average account value over the period, multiplied by 181/365 (to reflect the one-half year period).
| | | Actual return | | | Hypothetical (5% return before expenses) | | | | | | | | | | |
| | | Beginning Account
Value
December 31, 2013 | | | Ending Account
Value
June 30, 2014 | | | Expenses paid
during the period
December 31, 2013
through
June 30, 2014 | | | Beginning
Account Value
December 31, 2013 | | | Ending Account
Value
June 30, 2014 | | | Expenses paid
during the period
December 31,
2013 through
June 30, 2014 | | | Annualized
expense
ratio* | | | Days
in the
current
1/2
year | | | Days
in the
full
year | |
| American Funds Asset Allocation HLS Fund |
| Class IB | | $ | 1,000.00 | | | $ | 1,038.00 | | | $ | 2.83 | | | $ | 1,000.00 | | | $ | 1,022.02 | | | $ | 2.81 | | | | 0.56 | % | | | 181 | | | | 365 | |
| American Funds Blue Chip Income and Growth HLS Fund |
| Class IB | | $ | 1,000.00 | | | $ | 1,078.00 | | | $ | 2.94 | | | $ | 1,000.00 | | | $ | 1,021.97 | | | $ | 2.86 | | | | 0.57 | % | | | 181 | | | | 365 | |
| American Funds Bond HLS Fund |
| Class IB | | $ | 1,000.00 | | | $ | 1,037.90 | | | $ | 2.73 | | | $ | 1,000.00 | | | $ | 1,022.12 | | | $ | 2.71 | | | | 0.54 | % | | | 181 | | | | 365 | |
| American Funds Global Bond HLS Fund |
| Class IB | | $ | 1,000.00 | | | $ | 1,055.90 | | | $ | 3.31 | | | $ | 1,000.00 | | | $ | 1,021.57 | | | $ | 3.26 | | | | 0.65 | % | | | 181 | | | | 365 | |
| American Funds Global Growth and Income HLS Fund |
| Class IB | | $ | 1,000.00 | | | $ | 1,063.20 | | | $ | 2.92 | | | $ | 1,000.00 | | | $ | 1,021.97 | | | $ | 2.86 | | | | 0.57 | % | | | 181 | | | | 365 | |
| American Funds Global Growth HLS Fund |
| Class IB | | $ | 1,000.00 | | | $ | 1,023.10 | | | $ | 3.06 | | | $ | 1,000.00 | | | $ | 1,021.77 | | | $ | 3.06 | | | | 0.61 | % | | | 181 | | | | 365 | |
| American Funds Global Small Capitalization HLS Fund |
| Class IB | | $ | 1,000.00 | | | $ | 1,068.60 | | | $ | 2.92 | | | $ | 1,000.00 | | | $ | 1,021.97 | | | $ | 2.86 | | | | 0.57 | % | | | 181 | | | | 365 | |
| American Funds Growth HLS Fund |
| Class IB | | $ | 1,000.00 | | | $ | 1,053.50 | | | $ | 2.75 | | | $ | 1,000.00 | | | $ | 1,022.12 | | | $ | 2.71 | | | | 0.54 | % | | | 181 | | | | 365 | |
| American Funds Growth-Income HLS Fund |
| Class IB | | $ | 1,000.00 | | | $ | 1,067.90 | | | $ | 2.77 | | | $ | 1,000.00 | | | $ | 1,022.12 | | | $ | 2.71 | | | | 0.54 | % | | | 181 | | | | 365 | |
| American Funds International HLS Fund |
| Class IB | | $ | 1,000.00 | | | $ | 1,036.00 | | | $ | 2.78 | | | $ | 1,000.00 | | | $ | 1,022.07 | | | $ | 2.76 | | | | 0.55 | % | | | 181 | | | | 365 | |
| American Funds New World HLS Fund |
| Class IB | | $ | 1,000.00 | | | $ | 1,046.90 | | | $ | 3.05 | | | $ | 1,000.00 | | | $ | 1,021.82 | | | $ | 3.01 | | | | 0.60 | % | | | 181 | | | | 365 | |
| Hartford Series Fund, Inc. |
| Main Risks (Unaudited) |
The main risks of investing in the Funds are described below. Each Fund is exposed to these risks through its investment in the corresponding Underlying Fund.
American Funds Asset Allocation HLS Fund 1,2,3,4,6,7,8,9,10,11,12
American Funds Blue Chip Income and Growth HLS Fund 4,6,7,9,11,12
American Funds Bond HLS Fund 2,3,6,8,9,10,11,12,13,16,17,18
American Funds Global Bond HLS Fund 2,3,5,6,8,9,10,11,12,14
American Funds Global Growth and Income HLS Fund 4,5,6,7,9,11,12
American Funds Global Growth HLS Fund 5,6,7,9,11,12
American Funds Global Small Capitalization HLS Fund 5,6,7,9,11,12,15
American Funds Growth HLS Fund 6,7,9,11,12
American Funds Growth-Income HLS Fund 4,6,7,9,11,12
American Funds International HLS Fund 5,6,7,9,11,12
American Funds New World HLS Fund 2,3,5,6,7,8,9,10,11,12,15
| 1. | Asset Allocation Risk - The risk that if the strategy of the Underlying Fund’s investment adviser for allocating assets among different asset classes does not work as intended, the Fund may not achieve its objective or may underperform other funds with similar investment strategies. |
| 2. | Call Risk - Call risk is the risk that an issuer, especially during a period of falling interest rates, may redeem a security by repaying it early, which may reduce the Fund’s income if the proceeds are reinvested at lower interest rates. |
| 3. | Credit Risk - Credit risk is the risk that the issuer of a security or other instrument will not be able to make principal and interest payments when due. Changes in an issuer’s credit rating or the market’s perception of an issuer’s creditworthiness may also affect the value of the Fund’s investment in that issuer. The degree of credit risk depends on both the financial condition of the issuer and the terms of the obligation. |
| 4. | Dividend Paying Security Investment Risk - Securities that pay high dividends as a group can fall out of favor with the market, causing the Fund during such periods to underperform funds that do not focus on dividends. The Fund’s focus on dividend paying investments may cause the Fund’s share price and total return to fluctuate more than the share price and total return of funds that do not focus their investments on dividend paying securities. In addition, income provided by the Fund may be affected by changes in the dividend policies of the companies in which the Fund invests and the capital resources available for such payments at such companies. |
| 5. | Emerging Markets Risk - The risks related to investing in foreign securities are generally greater with respect to securities of companies that conduct their principal business activities in emerging markets or whose securities are traded principally on exchanges in emerging markets. The risks of investing in emerging markets include risks of illiquidity, increased price volatility, smaller market capitalizations, less government regulation, less extensive and less frequent accounting, financial and other reporting requirements, risk of loss resulting from problems in share registration and custody and substantial economic and political disruptions. |
| 6. | Foreign Investments Risk - Investments in foreign securities may be riskier than investments in U.S. securities. Differences between the U.S. and foreign regulatory regimes and securities markets, including the less stringent investor protection and disclosure standards of some foreign markets, as well as political and economic developments in foreign countries and regions, may affect the value of the Fund’s investments in foreign securities. Changes in currency exchange rates may also adversely affect the Fund’s foreign investments. |
| 7. | Growth Orientation Risk - The price of a growth company’s stock may decrease, or it may not increase to the level that the Underlying Fund’s investment adviser had anticipated. In addition, growth stocks may be more volatile than other stocks because they are more sensitive to investors’ perceptions of the issuing company’s growth potential. Also, the growth investing style may over time go in and out of favor. At times when the investing style used by the Underlying Fund is out of favor, the Underlying Fund may underperform other equity funds that use different investing styles. |
| 8. | Interest Rate Risk - The risk that your investment may go down in value when interest rates rise, because when interest rates rise, the prices of bonds and fixed rate loans fall. Generally, the longer the maturity of a bond or fixed rate loan, the more sensitive it is to this risk. Falling interest rates also create the potential for a decline in the Fund’s income. These risks are greater during periods of rising |
| Hartford Series Fund, Inc. |
| Main Risks (Unaudited) - (continued) |
inflation. Volatility in interest rates and in fixed income markets may increase the risk that the Fund’s investment in fixed income securities will go down in value.
| 9. | Investment Strategy Risk - The investment strategy of the Underlying Fund’s investment adviser will influence performance significantly. If the investment strategy of the Underlying Fund’s investment adviser does not perform as expected, the Fund could underperform its peers or lose money. There is no guarantee that the Underlying Fund’s investment objective will be achieved. |
| 10. | Junk Bond Risk - Investments rated below investment grade (also referred to as “junk bonds”) are considered to be speculative and are subject to heightened credit risk, which may make the Fund more sensitive to adverse developments in the U.S. and abroad. Lower rated debt securities generally involve greater risk of default or price changes due to changes in the issuer’s creditworthiness than higher rated debt securities. The market prices of these securities may fluctuate more than higher quality securities and may decline significantly in periods of general economic difficulty. There may be little trading in the secondary market for particular debt securities, which may make them more difficult to value or sell. |
| 11. | Master-Feeder Structure Risk - Because it invests in the Underlying Fund, the Fund is also subject to risks related to the master-feeder structure. Other “feeder” funds may also invest in an Underlying Fund. As shareholders of an Underlying Fund, feeder funds, including the Fund, vote on matters pertaining to their respective Underlying Fund. Feeder funds with a greater pro rata ownership in an Underlying Fund could have effective voting control of the operations of the Underlying Fund. Also, a large-scale redemption by another feeder fund may increase the proportionate share of the costs of an Underlying Fund borne by the remaining feeder fund shareholders, including the applicable fund. |
| 12. | Market Risk - Market risk is the risk that one or more markets in which the Fund invests will go down in value, including the possibility that the markets will go down sharply and unpredictably. Securities may decline in value due to the activities and financial prospects of individual companies or to general market and economic movements and trends. |
| 13. | Mortgage- and Asset-Backed Securities Risk - Mortgage- and asset-backed securities represent interests in “pools” of mortgages or other assets, including consumer loans or receivables held in trust. Mortgage-backed securities are subject to credit risk, interest rate risk, “prepayment risk” (the risk that borrowers will repay a loan more quickly in periods of falling interest rates) and “extension risk” (the risk that borrowers will repay a loan more slowly in periods of rising interest rates). If the Fund invests in mortgage-backed or asset-backed securities that are subordinated to other interests in the same mortgage pool, the Fund may only receive payments after the pool’s obligations to other investors have been satisfied. An unexpectedly high rate of defaults on the mortgages held by a mortgage pool may limit substantially the pool’s ability to make payments of principal or interest to the Fund, reducing the values of those securities or in some cases rendering them worthless. The risk of such defaults is generally higher in the case of mortgage pools that include so-called “subprime” mortgages. |
| 14. | Non-Diversification Risk - The Underlying Fund is non-diversified, which means it is permitted to invest more of its assets in fewer issuers than a “diversified” fund. Thus, the Fund may be more exposed to the risks associated with and developments affecting an individual issuer than a fund that invests more widely. The Fund may also be subject to greater market fluctuation and price volatility than a more broadly diversified Fund. |
| 15. | Small Cap Stock Risk – Small capitalization stocks may be more risky than stocks of larger companies. Historically, small market capitalization stocks and stocks of recently organized companies are subject to increased price volatility due to: |
| · | less certain growth prospects |
| · | lower degree of liquidity in the markets for such stocks |
| · | thin trading that could result in the stocks being sold at a discount or in small lots over an extended period of time |
| · | limited product lines, markets or financial resources |
| · | dependence on a few key management personnel |
| · | increased susceptibility to losses and bankruptcy increased transaction costs |
| Hartford Series Fund, Inc. |
| Main Risks (Unaudited) - (continued) |
| 16. | U.S. Government Securities Risk - Treasury obligations may differ in their interest rates, maturities, times of issuance and other characteristics. Obligations of U.S. Government agencies and authorities are supported by varying degrees of credit but generally are not backed by the full faith and credit of the U.S. Government. No assurance can be given that the U.S. Government will provide financial support to its agencies and authorities if it is not obligated by law to do so. In addition, the value of U.S. Government securities may be affected by changes in the credit rating of the U.S. Government. U.S. Government securities are also subject to default risk, that is the risk that the U.S. Treasury will be unable to meet its payment obligations. |
| 17. | Dollar Rolls Risk – Dollar rolls involve the risk that the market value of the securities that the Fund is committed to buy may decline below the price of the securities the Fund has sold. These transactions may involve leverage. |
| 18. | To Be Announced (TBA) Securities Risk – TBA securities involve the risk that the security the Fund buys will lose value prior to its delivery. There also is the risk that the security will not be issued or that the other party to the transaction will not meet its obligation. If this occurs, the Fund loses both the investment opportunity for the assets it set aside to pay for the security and any gain in the security’s price. |
THIS PRIVACY POLICY IS NOT PART OF THIS REPORT
Privacy Policy and Practices of The Hartford Financial Services Group, Inc. and its Affiliates
(herein called “we, our and us”)
This Privacy Policy applies to our United States Operations
We value your trust. We are committed to the responsible: a) management; b) use; and c) protection; of Personal Information. This notice describes how we collect, disclose, and protect Personal Information. We collect Personal Information to: a) service your Transactions with us; and b) support our business functions. We may obtain Personal Information from: a) You; b) your Transactions with us; and c) third parties such as a consumer-reporting agency. Based on the type of product or service You apply for or get from us, Personal Information such as: a) your name; b) your address; c) your income; d) your payment; or e) your credit history; may be gathered from sources such as applications, Transactions, and consumer reports. To serve You and service our business, we may share certain Personal Information. We will share Personal Information, only as allowed by law, with affiliates such as: a) our insurance companies; b) our employee agents; c) our brokerage firms; and d) our administrators. As allowed by law, we may share Personal Financial Information with our affiliates to: a) market our products; or b) market our services; to You without providing You with an option to prevent these disclosures. | | | We may also share Personal Information, only as allowed by law, with unaffiliated third parties including: a) independent agents; b) brokerage firms; c) insurance companies; d) administrators; and e) service providers; who help us serve You and service our business. When allowed by law, we may share certain Personal Financial Information with other unaffiliated third parties who assist us by performing services or functions such as: a) taking surveys; b) marketing our products or services; or c) offering financial products or services under a joint agreement between us and one or more financial institutions. We, and third parties we partner with, may track some of the pages You visit through the use of: a) cookies; b) pixel tagging; or c) other technologies; and currently do not process or comply with any web browser’s “do not track” signal or similar mechanism that indicates a request to disable online tracking of individual users who visit our websites or use our services. We will not sell or share your Personal Financial Information with anyone for purposes unrelated to our business functions without offering You the opportunity to: a) “opt-out;” or b) “opt-in;” as required by law. We only disclose Personal Health Information with: a) your proper written authorization; or b) as otherwise allowed or required by law. Our employees have access to Personal Information in the course of doing their jobs, such as: a) underwriting policies; b) paying claims; c) developing new products; or d) advising customers of our products and services. |
We use manual and electronic security procedures to maintain: a) the confidentiality; and b) the integrity of; Personal Information that we have. We use these procedures to guard against unauthorized access. Some techniques we use to protect Personal Information include: a) secured files; b) user authentication; c) encryption; d) firewall technology; and e) the use of detection software. We are responsible for and must: a) identify information to be protected; b) provide an adequate level of protection for that data; c) grant access to protected data only to those people who must use it in the performance of their job-related duties. Employees who violate our Privacy Policy will be subject to discipline, which may include ending their employment with us. At the start of our business relationship, we will give You a copy of our current Privacy Policy. We will also give You a copy of our current Privacy Policy once a year if You maintain a continuing business relationship with us. We will continue to follow our Privacy Policy regarding Personal Information even when a business relationship no longer exists between us. | | | As used in this Privacy Notice: Application means your request for our product or service. Personal Financial Information means financial information such as: a) credit history; b) income; c) financial benefits; or d) policy or claim information. Personal Health Information means health information such as: a) your medical records; or b) information about your illness, disability or injury. Personal Information means information that identifies You personally and is not otherwise available to the public. It includes: a) Personal Financial Information; and b) Personal Health Information. Transaction means your business dealings with us, such as: a) your Application; b) your request for us to pay a claim; and c) your request for us to take an action on your account. You means an individual who has given us Personal Information in conjunction with: a) asking about; b) applying for; or c) obtaining; a financial product or service from us if the product or service is used mainly for personal, family, or household purposes. |
This Privacy Policy is being provided on behalf of the following affiliates of The Hartford Financial Services Group, Inc.:
1stAGChoice, Inc.; Access CoverageCorp, Inc.; Access CoverageCorp Technologies, Inc.; American Maturity Life Insurance Company; Archway 60 R, LLC; Business Management Group, Inc.; Champlain Life Reinsurance Company; DMS R, LLC; Eloy R, LLC; Ersatz Corporation; First State Insurance Company; Hartford Accident and Indemnity Company; Hartford Administrative Services Company; Hartford Casualty General Agency, Inc.; Hartford Casualty Insurance Company; Hartford-Comprehensive Employee Benefit Service Company; Hartford Equity Sales Company, Inc.; Hartford Fire General Agency, Inc.; Hartford Fire Insurance Company; Hartford Funds Management Company, LLC; Hartford Funds Management Group, Inc.; Hartford HLS Series Fund II, Inc.; Hartford Insurance Company of Illinois; Hartford Insurance Company of the Midwest; Hartford Insurance Company of the Southeast; Hartford Integrated Technologies, Inc.; Hartford International Life Reassurance Corporation; Hartford Funds Distributors, LLC; Hartford Investment Management Company; Hartford Life and Accident Insurance Company; Hartford Life and Annuity Insurance Company; Hartford Life Insurance Company; Hartford Life Private Placement, LLC; Hartford Lloyd’s Corporation; Hartford Lloyd’s Insurance Company; Hartford Mezzanine Investors I, LLC; Hartford Residual Market, L.C.C.; Hartford Retirement Services, LLC; Hartford Securities Distribution Company, Inc.; Hartford Series Fund, Inc.; Hartford Specialty Insurance Services of Texas, LLC; Hartford Strategic Investments, LLC; Hartford Underwriters Insurance Company; Hartford Technology Services Company, L.L.C.; Hartford of Texas General Agency, Inc.; Hartford Underwriters General Agency, Inc.; HARTRE Company, L.C.C.; HL Investment Advisors, LLC; HLA LLC; Horizon Management Group, LLC; HRA Brokerage Services, Inc.; Lanidex Class B, LLC; M-CAP Insurance Agency, LLC; New England Insurance Company; New England Reinsurance Corporation; Nutmeg Insurance Agency, Inc.; Nutmeg Insurance Company; Pacific Insurance Company, Limited; Planco, LLC: Property and Casualty Insurance Company of Hartford; Revere R, LLC; RVR R, LLC; Sentinel Insurance Company, Ltd.; Sunstone R, LLC; Symphony R, LLC; The Evergreen Group Incorporated; The Hartford Alternative Strategies Fund; The Hartford Mutual Funds, Inc.; The Hartford Mutual Funds II, Inc.; Trumbull Flood Management, L.L.C.; Trumbull Insurance Company; Twin City Fire Insurance Company; White River Life Reinsurance Company.
HPP Revised January 2014
HARTFORD HLS FUNDS
c/o Hartford Life and Annuity Insurance Company
P.O. Box 14293
Lexington, KY 40512-4293
HARTFORDFUNDS
hartfordfunds.com
Hartford Series Fund, Inc. is underwritten and distributed by Hartford Funds Distributors, LLC.
Hartford Series Fund, Inc. inception dates range from 1977 to date. Hartford Series Fund, Inc. is not a subsidiary of The Hartford Financial Services Group, Inc. ("The Hartford") but is underwritten, distributed by and advised by subsidiaries of The Hartford. Investments in Hartford Series Fund, Inc. are not guaranteed by The Hartford or any other entity.
This report is submitted for the general information of the shareholders of the Funds. It is not authorized for distribution unless preceded or accompanied by a current prospectus for the Funds.
Investors should carefully consider the investment objectives, risks, charges, and expenses of Hartford Funds before investing. This and other information can be found in the prospectus, which can be obtained by calling 800-862-6668 (or 800-279-1541 for institutional investors). Investors should read them carefully before they invest.
AFHLSSAR-14 8-14 113558-3 Printed in U.S.A.
HARTFORDFUNDS
| | HARTFORD BALANCED HLS FUND 2014 Semi Annual Report |
A MESSAGE FROM THE PRESIDENT
Dear Fellow Shareholders:
Thank you for investing in Hartford HLS Funds.
Market Review
U.S. equities (as represented by the S&P 500 Index) started 2014 on a shaky note after posting a strong 32.39% gain in 2013. However, stocks managed to maintain modest gains throughout the first quarter and returned to a generally steady climb in the second quarter. Through June 30, 2014, the S&P 500 Index advanced 7.14%. It appears that much of the market volatility during the year can be attributed to heightened international tensions. In particular, the Russian annexation of Ukraine’s Crimean Peninsula and increased tensions in Iraq were cause for concern.
On the domestic front, subdued economic and employment reports slowed stocks’ progress early in the new year, although much of the weakness seemed to dissipate as the year’s unusually harsh winter subsided. And despite initial reactions to the idea, when the U.S. Federal Reserve began tapering its quantitative-easing program in January by reducing its bond purchases by $10 billion a month, the markets took the policy change in stride.
Despite a rough start to the year for financial markets, the global economy seems to be settling into a slow-but-steady recovery. While first-quarter U.S. gross domestic product (GDP) growth was disappointing at -2.9%, U.S. consumer spending, which is a significant contributor toward economic growth, rose by 3% during the quarter. It appears that Europe is also maintaining its own recovery: The International Monetary Fund projects that Europe’s full-year GDP growth may breach positive territory for the first time since 2011.
The impact of international affairs on stocks so far this year is an important reminder to stay informed about both domestic and international economic developments, and any effects they may have on your individual investment goals. If you have not already had a mid-year review of your portfolio, it may be a good time to meet with your financial advisor to review your progress and make certain your investments are prepared for all market environments:
| • | Is your portfolio properly diversified with an appropriate mix of stocks and bonds? |
| • | Is your portfolio positioned to take advantage of the global economic recovery, with investments in both domestic and international holdings? |
| • | Are your investments still in line with your risk tolerance and investment time horizon? |
Your financial professional can help you choose options within our fund family to help you reach your investment goals with confidence.
Thank you again for investing with Hartford HLS Funds.
James Davey
President
Hartford HLS Funds
1 The S&P 500 Index is a market capitalization-weighted price index composed of 500 widely held common stocks.
2The Dow Jones Industrial Average is an unmanaged, price-weighted index of 30 of the largest, most widely held stocks traded on the New York Stock Exchange.
Hartford Balanced HLS Fund
Table of Contents
This report is prepared for the general information of contract owners and qualified retirement plan participants. It is not an offer of contracts or of qualified retirement plans. It should not be used in connection with any offer, except in conjunction with the appropriate product prospectus which contains all pertinent information including the applicable sales, administrative and other charges.
The views expressed in the Fund’s Manager Discussion under “Why did the Fund perform this way?” and “What is the outlook?” are views of the Fund’s sub-adviser and portfolio management team through the end of the period and are subject to change based on market and other conditions. The Fund’s Manager Discussion is for informational purposes only and does not represent an offer, recommendation or solicitation to buy, hold or sell any security. The specific securities identified and described, if any, do not represent all of the securities purchased or sold and you should not assume that investments in the securities identified and discussed will be profitable.
| Hartford Balanced HLS Fund inception 03/31/1983 |
| (sub-advised by Wellington Management Company, LLP) |
| |
| Investment objective – The Fund seeks long-term total return. |
Performance Overview 6/30/04 - 6/30/14
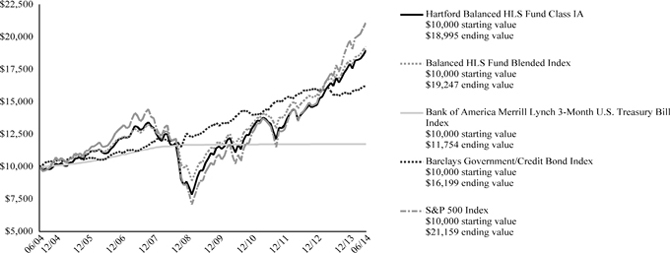
The chart above represents the hypothetical growth of a $10,000 investment in Class IA. Growth results in classes other than Class IA will vary from what is seen above due to differences in the expenses charged to those share classes.
Average Annual Total Returns (as of 6/30/14)
| | 6 Month† | 1 Year | 5 Years | 10 Years |
| Balanced IA | 5.93% | 17.02% | 14.32% | 6.63% |
| Balanced IB | 5.78% | 16.70% | 14.03% | 6.36% |
| Balanced HLS Fund Blended Index | 5.70% | 15.96% | 13.15% | 6.77% |
| Bank of America Merrill Lynch 3-Month U.S. Treasury Bill Index | 0.02% | 0.05% | 0.11% | 1.63% |
| Barclays Government/Credit Bond Index | 3.94% | 4.28% | 5.09% | 4.94% |
| S&P 500 Index | 7.14% | 24.61% | 18.83% | 7.78% |
PERFORMANCE DATA QUOTED REPRESENTS PAST PERFORMANCE AND DOES NOT GUARANTEE FUTURE RESULTS. The investment return and principal value of the investment will fluctuate so that investors’ shares, when redeemed, may be worth more or less than their original cost. Current performance may be lower or higher than the performance data quoted. To obtain performance data current to the most recent month-end, please visit our website www.hartfordfunds.com.
Total returns presented above were calculated using the Fund’s net asset value available to shareholders for sale or redemption of Fund shares on June 30, 2014, which may exclude investment transactions as of this date. All share class returns assume the reinvestment of all distributions at net asset value and the deduction of all fund expenses.
Balanced HLS Fund Blended Index is calculated by Hartford Funds Management Company, LLC and represents the weighted return of 60% S&P 500 Index, 35% Barclays Government/Credit Bond Index and 5% Bank of America Merrill Lynch 3-Month U.S. Treasury Bill Index.
Bank of America Merrill Lynch 3-Month U.S. Treasury Bill Index is an unmanaged index that tracks the performance of U.S. dollar denominated U.S. Treasury bills publicly issued in the U.S. domestic markets with maturities of 90 days or less that assumes reinvestment of all income.
Barclays Government/Credit Bond Index is an unmanaged, market-value-weighted index of all debt obligations of the U.S. Treasury and U.S. Government agencies (excluding mortgaged-backed securities) and of all publicly-issued fixed-rate, nonconvertible, investment grade domestic corporate debt.
S&P 500 Index is a market capitalization-weighted price index composed of 500 widely held common stocks.
The index is unmanaged, and its results include reinvested dividends and/or distributions, but do not reflect the effect of sales charges, commissions, expenses or taxes.
You cannot invest directly in an index.
As shown in the Fund's current prospectus dated May 1, 2014, the total annual operating expense ratios for Class IA and Class IB were 0.65% and 0.90%, respectively. Actual expenses may be higher. Please see the accompanying Financial Highlights for expense ratios for the six-month period ended June 30, 2014.
All investments are subject to risk including the possible loss of principal. For a discussion of the Fund’s risks, please see the Main Risks section of this report. For more detailed information on the risks associated with an investment in the Fund, please see the prospectus.
The chart and table do not reflect the deductions of taxes, sales charges or other fees which may be applied at the variable life insurance, variable annuity or qualified retirement plan product level. Any such additional sales charges or other fees or expenses would lower the contract’s or plan’s performance.
| Hartford Balanced HLS Fund |
| Manager Discussion |
| June 30, 2014 (Unaudited) |
| Portfolio Managers | |
| John C. Keogh | Karen H. Grimes, CFA |
| Senior Vice President and Fixed Income Portfolio Manager | Senior Vice President and Equity Portfolio Manager |
How did the Fund perform?
The Class IA shares of the Hartford Balanced HLS Fund returned 5.93% for the six-month period ended June 30, 2014, outperforming the Fund’s blended benchmark, 60% S&P 500 Index, 35% Barclays Government/Credit Bond Index, and 5% Bank of America Merrill Lynch 3-Month U.S. Treasury Bill Index, which returned 5.70% for the same period. The S&P 500, Barclays Government/Credit Bond, and Bank of America Merrill Lynch 3-Month U.S. Treasury Bill Indices returned 7.14%, 3.94%, and 0.02%, respectively. The Fund also outperformed the 5.35% average return of the Lipper Mixed-Asset Target Allocation Growth Funds peer group, a group of funds that hold between 60%-80% in equity securities, with the remainder invested in bonds, cash, and cash equivalents.
Why did the Fund perform this way?
U.S. equities surged during the period, ending June near an all-time high. From its closing low on March 9, 2009, the S&P 500 Index ended June 2014 up 224%. After finishing their best year since 1997, U.S. stocks began 2014 with their worst month in nearly two years. Worries about a slowdown in China and general angst surrounding emerging markets overshadowed a fairly benign domestic environment. However, robust merger and acquisition activity and an uncontested increase in the debt ceiling from Congress helped stoke investors' risk appetites in February. Earnings season in April provided a varied yet encouraging picture, with companies generally reporting healthy earnings but more subdued revenues. The rally marched on in May amid renewed signs of life in the housing market and the best payroll gain in more than two years. In June, strong manufacturing activity, coupled with continued positive momentum in housing and employment data, helped to offset a large negative revision to first quarter economic growth.
Equity markets, as measured by the S&P 500 Index, returned +7% during the period. Within the S&P 500 Index, Utilities (+19%), Energy (+13%), and Healthcare (+11%) posted the largest gains while Consumer Discretionary (+1%), Industrials (+4%), and Telecommunication Services (+4%) lagged the broader index.
Global fixed income markets gained during the period as expectations of prolonged easy monetary policy by major central banks and an improving, albeit below-trend, macroeconomic environment suppressed volatility. Early in the period emerging markets dominated headlines as economic and political developments sparked risk aversion across global markets, pushing bond prices higher and yields lower amid a flight to quality. Meanwhile, central bank policies diverged. The U.S. Federal Reserve (Fed) began to wind down its quantitative easing program and the Bank of England started to prepare for interest rate rises. In contrast, the European Central Bank (ECB) announced a host of stimulus measures and the Bank of Japan maintained its easy monetary policy framework. European government bond yields fell sharply as the ECB loosened monetary policy further. In the U.S. and U.K., the Treasury curve continued to flatten as markets braced themselves for the end of quantitative easing in these economies.
The Barclays Government/Credit Bond Index returned +4% for the period. Globally, credit spread sectors posted positive absolute returns and outperformed duration-equivalent government bonds as credit spreads tightened. Most currencies appreciated versus the U.S. dollar with the notable exception of European currencies, which declined following the European Central Bank’s easing measures.
The Fund has three primary levers to generate investment performance: equity investments, fixed income investments, and asset allocation among stocks, bonds, and cash. During the period, the equity portion of the Fund outperformed the S&P 500 Index and the fixed income portion of the Fund slightly underperformed the Barclays Government/Credit Bond Index. Asset allocation contributed to benchmark-relative outperformance during the period. The Fund was generally overweight equities and underweight fixed income and cash relative to the benchmark.
Equity outperformance versus the S&P 500 Index was driven in part by sector allocation, which is a result of our bottom-up stock selection process. An overweight to Healthcare and an underweight to Industrials aided results. Security selection also contributed positively to returns relative to the S&P 500 Index, driven primarily by selection in the Energy and Healthcare sectors. This was partially offset by weak selection in the Consumer Discretionary sector.
Top contributors to relative performance of the equity portion of the Fund during the period were Covidien (Healthcare), Halliburton (Energy), and Anadarko Petroleum (Energy). Shares of Covidien, a medical products, manufacturing, and distribution company, surged after Medtronic agreed to acquire Covidien for $42.9 billion in the second quarter. Halliburton, a leading global oil service company, saw its shares gain as the growth outlook for U.S. onshore activity in the energy sector continues to strengthen as new equity capital supports increased budgets for capital expenditures by exploration and production companies. Shares of Anadarko Petroleum, a U.S.-based independent oil exploration and production company, outperformed during the period on rumors of a potential takeover by ExxonMobil and also on news the company had settled the Tronox litigation for much less than investors anticipated. Our position in
| Hartford Balanced HLS Fund |
| Manager Discussion – (continued) |
| June 30, 2014 (Unaudited) |
Wells Fargo (Financials) also contributed positively to the Fund’s returns on an absolute basis.
Stocks that detracted the most from relative returns in the equity portion of the Fund during the period were Allstar CoInvest (Consumer Discretionary), Apple (Information Technology), and PVH (Consumer Discretionary). Shares of Allstar CoInvest, a sporting goods retailer, lagged, as the retail conditions were tough in the first quarter given the harsh winter weather. Shares of Apple, U.S.-based designer and manufacturer of consumer electronics, software, and computers, continued to rebound following April's solid earnings report. During the period, Apple also announced it was acquiring Beats Electronics for $3 billion. Our underweight position detracted from benchmark-relative performance. PVH, a leading global apparel company, saw shares fall as conservative guidance raised investor concerns about softening trends in southern Europe. Citigroup (Financials) also detracted from the Fund’s returns on an absolute basis.
Underperformance of the fixed income portion of the Fund relative to the Barclays Government/Credit Bond Index during the period was driven by duration positioning. The Fund’s short duration positioning detracted from results relative to the Barclays Government/Credit Bond Index as rates fell over the period. An overweight to and security selection within investment grade financials, as well as an overweight to taxable municipal bonds contributed to benchmark-relative performance. Allocations to agency MBS pass-throughs and CMBS also contributed to relative outperformance.
Derivatives are not used in a significant manner in this Fund and did not have a material impact on performance during the period.
What is the outlook?
We believe the U.S. economy remains poised for continued moderate growth. Following the weak -2.9% first quarter GDP revision, which had a number of weather- and health-care related distortions, we believe the U.S. economy is poised for stronger activity in the second half of the year. An easing of fiscal policy restraints, an end to inventory adjustments, and fading impact of higher interest rates should all help. Housing has been weaker than we expected, but recent data points have shown signs of reacceleration. We believe the Fed remains on track to end quantitative easing in the fourth quarter of this year and is likely to start raising policy rates by next spring. As the labor market continues to tighten, we are closely watching the direction and course of wage gains, as this is something that could cause the Fed to act sooner than consensus expectations. Globally, the risks are higher than what we saw at the beginning of the year, but the overall environment is still supportive for global growth, in our opinion. The stabilization of the European economy appears to be intact and we continue to see signs that it is slowly improving. Prime Minister Shinzo Abe recently unveiled a package of reform measures aimed at boosting Japan’s long-term economic growth, including lowering the corporate tax rate. China remains one of the largest risks in the global economy. Growth has been slowing, and we are beginning to see signs of stress in their banking system. So far the slowdown has been moderate and manageable, but we will be watching the situation closely.
At the end of the period, our largest overweights relative to the S&P 500 Index in the equity portion of the Fund were in the Healthcare and Financials sectors. Our largest underweights were in the Consumer Staples and Industrials sectors.
Within the fixed income portion of the Fund, we ended the period with a slightly short duration posture. We continued to be positioned with an underweight to the U.S. Government sector, as we believe that there are more compelling opportunities in other sectors such as agency MBS. Within investment grade corporates, we continue to focus on financials and communications issuers. Financial companies have de-levered significantly, and communications issuers have solid balance sheets. We also maintained an overweight to taxable municipals and an allocation to agency MBS pass-throughs.
The equity and fixed income managers will continue to work collaboratively to make decisions regarding portfolio weights in stocks, bonds, and cash. As of June 30, 2014, the Fund’s equity exposure was at 66%, compared to 60% in its benchmark, and at the upper end of the Fund’s 50-70% range.
| Hartford Balanced HLS Fund |
| Manager Discussion – (continued) |
| June 30, 2014 (Unaudited) |
Diversification by Security Type
as of June 30, 2014
| Category | | Percentage of
Net Assets | |
| Equity Securities |
| Common Stocks | | | 66.3 | % |
| Total | | | 66.3 | % |
| Fixed Income Securities |
| Asset & Commercial Mortgage Backed Securities | | | 0.2 | % |
| Corporate Bonds | | | 13.1 | |
| Foreign Government Obligations | | | 0.1 | |
| Municipal Bonds | | | 1.0 | |
| U.S. Government Agencies | | | 2.4 | |
| U.S. Government Securities | | | 14.8 | |
| Total | | | 31.6 | % |
| Short-Term Investments | | | 2.3 | |
| Other Assets and Liabilities | | | (0.2 | ) |
| Total | | | 100.0 | % |
Credit Exposure
as of June 30, 2014
| Credit Rating * | | Percentage of
Net Assets | |
| Aaa / AAA | | | 2.8 | |
| Aa / AA | | | 16.7 | |
| A | | | 5.1 | |
| Baa / BBB | | | 6.3 | |
| Ba / BB | | | 0.2 | |
| Not Rated | | | 0.5 | |
| Non-Debt Securities and Other Short-Term Instruments | | | 68.6 | |
| Other Assets and Liabilities | | | (0.2 | ) |
| Total | | | 100.0 | % |
| * | Credit exposure is the long-term credit ratings for the Fund's holdings, as of the date noted, as provided by Standard and Poor's (S&P) or Moody's Investors Service and typically range from AAA/Aaa (highest) to C/D (lowest). Presentation of S&P and Moody's credit ratings in this report have been selected for several reasons, including access to information and materials provided by S&P and Moody's, as well as the Fund's consideration of industry practice. If Moody's and S&P assign different ratings, the lower rating is used. Fixed income securities that are not rated by either agency are listed as "Not Rated." Ratings do not apply to the Fund itself or to Fund shares. Ratings may change. |
| Hartford Balanced HLS Fund |
| Schedule of Investments |
| June 30, 2014 (Unaudited) |
| (000’s Omitted) |
| Shares or Principal Amount | | Market Value ╪ | |
Common Stocks - 66.3% |
| | | | | Automobiles and Components - 0.6% | | | | |
| | 1,093 | | | Ford Motor Co. | | $ | 18,840 | |
| | | | | | | | | |
| | | | | Banks - 3.9% | | | | |
| | 447 | | | BB&T Corp. | | | 17,642 | |
| | 422 | | | PNC Financial Services Group, Inc. | | | 37,554 | |
| | 1,207 | | | Wells Fargo & Co. | | | 63,422 | |
| | | | | | | | 118,618 | |
| | | | | Capital Goods - 4.4% | | | | |
| | 257 | | | 3M Co. | | | 36,752 | |
| | 286 | | | Eaton Corp. plc | | | 22,073 | |
| | 378 | | | Fortune Brands Home & Security, Inc. | | | 15,090 | |
| | 394 | | | Ingersoll-Rand plc | | | 24,610 | |
| | 259 | | | PACCAR, Inc. | | | 16,294 | |
| | 191 | | | United Technologies Corp. | | | 22,108 | |
| | | | | | | | 136,927 | |
| | | | | Consumer Durables and Apparel - 0.5% | | | | |
| | 144 | | | PVH Corp. | | | 16,814 | |
| | | | | | | | | |
| | | | | Diversified Financials - 6.3% | | | | |
| | 152 | | | Ameriprise Financial, Inc. | | | 18,222 | |
| | 95 | | | BlackRock, Inc. | | | 30,333 | |
| | 693 | | | Citigroup, Inc. | | | 32,638 | |
| | 127 | | | Goldman Sachs Group, Inc. | | | 21,193 | |
| | 626 | | | Invesco Ltd. | | | 23,637 | |
| | 1,018 | | | JP Morgan Chase & Co. | | | 58,650 | |
| | 437 | | | Santander Consumer USA Holdings, Inc. | | | 8,503 | |
| | | | | | | | 193,176 | |
| | | | | Energy - 6.9% | | | | |
| | 258 | | | Anadarko Petroleum Corp. | | | 28,284 | |
| | 953 | | | BG Group plc | | | 20,103 | |
| | 246 | | | Chevron Corp. | | | 32,093 | |
| | 190 | | | EOG Resources, Inc. | | | 22,222 | |
| | 404 | | | Exxon Mobil Corp. | | | 40,668 | |
| | 444 | | | Halliburton Co. | | | 31,544 | |
| | 222 | | | Occidental Petroleum Corp. | | | 22,798 | |
| | 288 | | | Southwestern Energy Co. ● | | | 13,094 | |
| | | | | | | | 210,806 | |
| | | | | Food and Staples Retailing - 0.9% | | | | |
| | 368 | | | CVS Caremark Corp. | | | 27,700 | |
| | | | | | | | | |
| | | | | Food, Beverage and Tobacco - 3.4% | | | | |
| | 134 | | | Anheuser-Busch InBev N.V. ADR | | | 15,379 | |
| | 147 | | | Diageo plc ADR | | | 18,658 | |
| | 259 | | | Kraft Foods Group, Inc. | | | 15,523 | |
| | 465 | | | Mondelez International, Inc. | | | 17,496 | |
| | 192 | | | Philip Morris International, Inc. | | | 16,218 | |
| | 502 | | | Unilever N.V. NY Shares ADR | | | 21,964 | |
| | | | | | | | 105,238 | |
| | | | | Health Care Equipment and Services - 3.0% | | | | |
| | 263 | | | Baxter International, Inc. | | | 19,017 | |
| | 381 | | | Covidien plc | | | 34,345 | |
| | 162 | | | Medtronic, Inc. | | | 10,342 | |
| | 342 | | | UnitedHealth Group, Inc. | | | 27,992 | |
| | | | | | | | 91,696 | |
| | | | | Insurance - 2.4% | | | | |
| | 447 | | | American International Group, Inc. | | | 24,388 | |
| | 675 | | | Marsh & McLennan Cos., Inc. | | | 34,989 | |
| | 436 | | | Unum Group | | | 15,161 | |
| | | | | | | | 74,538 | |
| | | | | Materials - 1.9% | | | | |
| | 497 | | | Dow Chemical Co. | | | 25,552 | |
| | 408 | | | International Paper Co. | | | 20,567 | |
| | 254 | | | Nucor Corp. | | | 12,495 | |
| | | | | | | | 58,614 | |
| | | | | Media - 2.8% | | | | |
| | 237 | | | CBS Corp. Class B | | | 14,749 | |
| | 455 | | | Comcast Corp. Class A | | | 24,407 | |
| | 467 | | | Thomson Reuters Corp. | | | 16,976 | |
| | 363 | | | Walt Disney Co. | | | 31,094 | |
| | | | | | | | 87,226 | |
| | | | | Pharmaceuticals, Biotechnology and Life Sciences - 9.9% | | | | |
| | 311 | | | Agilent Technologies, Inc. | | | 17,846 | |
| | 181 | | | Amgen, Inc. | | | 21,401 | |
| | 328 | | | AstraZeneca plc ADR | | | 24,351 | |
| | 637 | | | Bristol-Myers Squibb Co. | | | 30,881 | |
| | 254 | | | Celgene Corp. ● | | | 21,807 | |
| | 280 | | | Gilead Sciences, Inc. ● | | | 23,232 | |
| | 116 | | | Johnson & Johnson | | | 12,176 | |
| | 904 | | | Merck & Co., Inc. | | | 52,277 | |
| | 115 | | | Roche Holding AG | | | 34,207 | |
| | 399 | | | UCB S.A. | | | 33,718 | |
| | 249 | | | Vertex Pharmaceuticals, Inc. ● | | | 23,554 | |
| | 244 | | | Zoetis, Inc. | | | 7,879 | |
| | | | | | | | 303,329 | |
| | | | | Retailing - 2.8% | | | | |
| | 11,702 | | | Allstar Co. ⌂●† | | | 12,650 | |
| | 39 | | | AutoZone, Inc. ● | | | 21,112 | |
| | 302 | | | Home Depot, Inc. | | | 24,409 | |
| | 258 | | | Nordstrom, Inc. | | | 17,499 | |
| | 163 | | | Tory Burch LLC ⌂●† | | | 11,047 | |
| | | | | | | | 86,717 | |
| | | | | Semiconductors and Semiconductor Equipment - 3.7% | | | | |
| | 478 | | | Analog Devices, Inc. | | | 25,848 | |
| | 1,146 | | | Intel Corp. | | | 35,405 | |
| | 1,178 | | | Maxim Integrated Products, Inc. | | | 39,839 | |
| | 268 | | | Xilinx, Inc. | | | 12,669 | |
| | | | | | | | 113,761 | |
| | | | | Software and Services - 6.2% | | | | |
| | 321 | | | Accenture plc | | | 25,935 | |
| | 398 | | | eBay, Inc. ● | | | 19,901 | |
| | 76 | | | Google, Inc. Class C ● | | | 43,883 | |
| | 1,237 | | | Microsoft Corp. | | | 51,585 | |
| | 566 | | | Oracle Corp. | | | 22,920 | |
| | 1,186 | | | Symantec Corp. | | | 27,156 | |
| | | | | | | | 191,380 | |
| | | | | Technology Hardware and Equipment - 4.3% | | | | |
| | 337 | | | Apple, Inc. | | | 31,321 | |
| | 2,176 | | | Cisco Systems, Inc. | | | 54,066 | |
| | 1,164 | | | EMC Corp. | | | 30,659 | |
| | 210 | | | Qualcomm, Inc. | | | 16,597 | |
| | | | | | | | 132,643 | |
| | | | | Telecommunication Services - 0.4% | | | | |
| | 228 | | | Verizon Communications, Inc. | | | 11,169 | |
| | | | | | | | | |
| | | | | Transportation - 0.8% | | | | |
| | 162 | | | FedEx Corp. | | | 24,502 | |
The accompanying notes are an integral part of these financial statements.
| Hartford Balanced HLS Fund |
| Schedule of Investments – (continued) |
| June 30, 2014 (Unaudited) |
| (000’s Omitted) |
| Shares or Principal Amount | | Market Value ╪ | |
Common Stocks - 66.3% - (continued) |
| | | | | Utilities - 1.2% | | | | |
| | 356 | | | NextEra Energy, Inc. | | $ | 36,502 | |
| | | | | | | | | |
| | | | | Total Common Stocks | | | | |
| | | | | ( Cost $1,376,383) | | $ | 2,040,196 | |
| | | | | | | | | |
Asset and Commercial Mortgage Backed Securities - 0.2% |
| | | | | Finance and Insurance - 0.2% | | | | |
| | | | | Ally Master Owner Trust | | | | |
| $ | 4,885 | | | 1.54%, 09/15/2019 | | $ | 4,887 | |
| | | | | Hilton USA Trust | | | | |
| | 1,765 | | | 2.66%, 11/05/2030 ■ | | | 1,787 | |
| | | | | New Century Home Equity Loan Trust | | | | |
| | 8 | | | 0.73%, 03/25/2035 Δ | | | 8 | |
| | | | | | | | 6,682 | |
| | | | | | | | | |
| | | | | Total Asset and Commercial Mortgage Backed Securities | | | | |
| | | | | (Cost $6,657) | | $ | 6,682 | |
| | | | | | | | | |
Corporate Bonds - 13.1% |
| | | | | Air Transportation - 0.3% | | | | |
| | | | | Continental Airlines, Inc. | | | | |
| $ | 3,489 | | | 5.98%, 04/19/2022 | | $ | 3,907 | |
| | | | | Southwest Airlines Co. | | | | |
| | 2,700 | | | 5.75%, 12/15/2016 | | | 2,983 | |
| | 2,639 | | | 6.15%, 08/01/2022 | | | 3,008 | |
| | | | | | | | 9,898 | |
| | | | | Arts, Entertainment and Recreation - 0.9% | | | | |
| | | | | 21st Century Fox America | | | | |
| | 385 | | | 4.00%, 10/01/2023 | | | 401 | |
| | | | | CBS Corp. | | | | |
| | 3,760 | | | 3.38%, 03/01/2022 | | | 3,768 | |
| | | | | Comcast Corp. | | | | |
| | 1,360 | | | 3.60%, 03/01/2024 | | | 1,397 | |
| | 1,740 | | | 4.65%, 07/15/2042 | | | 1,804 | |
| | 310 | | | 4.75%, 03/01/2044 | | | 328 | |
| | 4,500 | | | 5.90%, 03/15/2016 | | | 4,899 | |
| | | | | DirecTV Holdings LLC | | | | |
| | 2,900 | | | 4.45%, 04/01/2024 | | | 3,075 | |
| | 2,010 | | | 6.38%, 03/01/2041 | | | 2,431 | |
| | | | | Discovery Communications, Inc. | | | | |
| | 280 | | | 3.25%, 04/01/2023 | | | 275 | |
| | 325 | | | 4.88%, 04/01/2043 | | | 328 | |
| | 250 | | | 4.95%, 05/15/2042 | | | 255 | |
| | | | | Grupo Televisa SAB | | | | |
| | 420 | | | 5.00%, 05/13/2045 | | | 421 | |
| | | | | News America, Inc. | | | | |
| | 1,275 | | | 4.50%, 02/15/2021 | | | 1,399 | |
| | | | | Time Warner Cable, Inc. | | | | |
| | 4,120 | | | 5.85%, 05/01/2017 | | | 4,634 | |
| | 40 | | | 5.88%, 11/15/2040 | | | 47 | |
| | 395 | | | 6.55%, 05/01/2037 | | | 491 | |
| | 265 | | | 6.75%, 06/15/2039 | | | 342 | |
| | 250 | | | 7.30%, 07/01/2038 | | | 336 | |
| | | | | Viacom, Inc. | | | | |
| | 835 | | | 3.88%, 12/15/2021 | | | 875 | |
| | | | | Walt Disney Co. | | | | |
| | 785 | | | 4.13%, 06/01/2044 | | | 772 | |
| | | | | | | | 28,278 | |
| | | | | Beverage and Tobacco Product Manufacturing - 0.6% | | | | |
| | | | | Altria Group, Inc. | | | | |
| 2,050 | | | 4.50%, 05/02/2043 | | | 1,976 | |
| | 2,445 | | | 4.75%, 05/05/2021 | | | 2,697 | |
| | | | | Anheuser-Busch InBev Worldwide, Inc. | | | | |
| | 3,205 | | | 7.75%, 01/15/2019 | | | 3,960 | |
| | | | | BAT International Finance plc | | | | |
| | 2,775 | | | 3.25%, 06/07/2022 ■ | | | 2,745 | |
| | | | | Coca-Cola Co. | | | | |
| | 500 | | | 3.30%, 09/01/2021 | | | 521 | |
| | | | | Coca-Cola FEMSA SAB CV | | | | |
| | 1,176 | | | 2.38%, 11/26/2018 | | | 1,190 | |
| | 1,300 | | | 3.88%, 11/26/2023 | | | 1,335 | |
| | | | | Diageo Capital plc | | | | |
| | 1,925 | | | 2.63%, 04/29/2023 | | | 1,845 | |
| | | | | Molson Coors Brewing Co. | | | | |
| | 60 | | | 2.00%, 05/01/2017 | | | 61 | |
| | 765 | | | 3.50%, 05/01/2022 | | | 773 | |
| | 495 | | | 5.00%, 05/01/2042 | | | 518 | |
| | | | | Philip Morris International, Inc. | | | | |
| | 270 | | | 5.65%, 05/16/2018 | | | 310 | |
| | | | | | | | 17,931 | |
| | | | | Chemical Manufacturing - 0.0% | | | | |
| | | | | Monsanto Co. | | | | |
| | 300 | | | 4.70%, 07/15/2064 | | | 301 | |
| | | | | | | | | |
| | | | | Computer and Electronic Product Manufacturing - 0.2% | | | | |
| | | | | Apple, Inc. | | | | |
| | 1,500 | | | 2.85%, 05/06/2021 | | | 1,513 | |
| | 1,360 | | | 3.45%, 05/06/2024 | | | 1,375 | |
| | 175 | | | 4.45%, 05/06/2044 | | | 177 | |
| | | | | Cisco Systems, Inc. | | | | |
| | 300 | | | 2.13%, 03/01/2019 | | | 302 | |
| | 180 | | | 2.90%, 03/04/2021 | | | 183 | |
| | | | | SBA Tower Trust | | | | |
| | 2,035 | | | 4.25%, 04/15/2015 ■Δ | | | 2,090 | |
| | | | | | | | 5,640 | |
| | | | | Couriers and Messengers - 0.1% | | | | |
| | | | | FedEx Corp. | | | | |
| | 270 | | | 2.63%, 08/01/2022 | | | 259 | |
| | 405 | | | 2.70%, 04/15/2023 | | | 384 | |
| | 845 | | | 4.90%, 01/15/2034 | | | 907 | |
| | 1,435 | | | 5.10%, 01/15/2044 | | | 1,552 | |
| | | | | | | | 3,102 | |
| | | | | Finance and Insurance - 6.3% | | | | |
| | | | | Ace INA Holdings, Inc. | | | | |
| | 840 | | | 3.35%, 05/15/2024 | | | 847 | |
| | | | | American Express Centurion Bank | | | | |
| | 6,350 | | | 6.00%, 09/13/2017 | | | 7,274 | |
| | | | | American International Group, Inc. | | | | |
| | 925 | | | 4.13%, 02/15/2024 | | | 974 | |
| | | | | Avalonbay Communities, Inc. | | | | |
| | 760 | | | 3.63%, 10/01/2020 | | | 794 | |
| | | | | Bank of America Corp. | | | | |
| | 4,500 | | | 5.00%, 05/13/2021 | | | 5,023 | |
| | | | | Barclays Bank plc | | | | |
| | 1,100 | | | 2.50%, 02/20/2019 | | | 1,114 | |
| | 1,300 | | | 3.75%, 05/15/2024 | | | 1,305 | |
| | 800 | | | 6.05%, 12/04/2017 ■ | | | 907 | |
The accompanying notes are an integral part of these financial statements.
| Hartford Balanced HLS Fund |
| Schedule of Investments – (continued) |
| June 30, 2014 (Unaudited) |
| (000’s Omitted) |
| Shares or Principal Amount | | Market Value ╪ | |
Corporate Bonds - 13.1% - (continued) |
| | | | | Finance and Insurance - 6.3% - (continued) | | | | |
| | | | | BNP Paribas | | | | |
| $ | 2,075 | | | 2.40%, 12/12/2018 | | $ | 2,093 | |
| | 305 | | | 3.25%, 03/03/2023 | | | 301 | |
| | | | | BP Capital Markets plc | | | | |
| | 140 | | | 3.99%, 09/26/2023 | | | 148 | |
| | 2,850 | | | 4.75%, 03/10/2019 | | | 3,196 | |
| | | | | BPCE S.A. | | | | |
| | 365 | | | 2.50%, 12/10/2018 | | | 370 | |
| | 1,075 | | | 4.00%, 04/15/2024 | | | 1,097 | |
| | 1,275 | | | 5.15%, 07/21/2024 ■ | | | 1,346 | |
| | | | | Brandywine Operating Partnership L.P. | | | | |
| | 2,010 | | | 6.00%, 04/01/2016 | | | 2,167 | |
| | | | | Capital One Bank | | | | |
| | 1,655 | | | 2.15%, 11/21/2018 | | | 1,665 | |
| | | | | Capital One Financial Corp. | | | | |
| | 2,460 | | | 2.15%, 03/23/2015 | | | 2,490 | |
| | 2,875 | | | 3.75%, 04/24/2024 | | | 2,918 | |
| | | | | Caterpillar Financial Services Corp. | | | | |
| | 2,000 | | | 3.30%, 06/09/2024 | | | 1,999 | |
| | | | | CDP Financial, Inc. | | | | |
| | 3,475 | | | 4.40%, 11/25/2019 ■ | | | 3,865 | |
| | | | | Citigroup, Inc. | | | | |
| | 1,000 | | | 4.95%, 11/07/2043 | | | 1,068 | |
| | 690 | | | 5.30%, 05/06/2044 | | | 720 | |
| | 3,000 | | | 5.85%, 08/02/2016 | | | 3,291 | |
| | 2,700 | | | 6.13%, 05/15/2018 | | | 3,111 | |
| | 520 | | | 8.13%, 07/15/2039 | | | 780 | |
| | | | | Credit Agricole S.A. | | | | |
| | 1,950 | | | 2.50%, 04/15/2019 ■ | | | 1,968 | |
| | | | | Credit Suisse New York | | | | |
| | 945 | | | 2.30%, 05/28/2019 | | | 947 | |
| | | | | Deutsche Bank AG London | | | | |
| | 2,000 | | | 2.50%, 02/13/2019 | | | 2,039 | |
| | 1,290 | | | 3.70%, 05/30/2024 | | | 1,290 | |
| | | | | Discover Financial Services | | | | |
| | 3,620 | | | 6.45%, 06/12/2017 | | | 4,118 | |
| | | | | Eaton Vance Corp. | | | | |
| | 614 | | | 6.50%, 10/02/2017 | | | 705 | |
| | | | | Everest Reinsurance Holdings, Inc. | | | | |
| | 4,525 | | | 5.40%, 10/15/2014 | | | 4,583 | |
| | | | | Five Corners Funding Trust | | | | |
| | 1,440 | | | 4.42%, 11/15/2023 ■ | | | 1,518 | |
| | | | | Ford Motor Credit Co. LLC | | | | |
| | 2,985 | | | 2.38%, 03/12/2019 | | | 3,000 | |
| | | | | General Electric Capital Corp. | | | | |
| | 4,300 | | | 4.63%, 01/07/2021 | | | 4,788 | |
| | 5,000 | | | 5.88%, 01/14/2038 | | | 6,066 | |
| | | | | Goldman Sachs Group, Inc. | | | | |
| | 3,335 | | | 2.38%, 01/22/2018 | | | 3,387 | |
| | 2,975 | | | 5.63%, 01/15/2017 | | | 3,274 | |
| | 1,700 | | | 6.15%, 04/01/2018 | | | 1,950 | |
| | 2,590 | | | 6.25%, 02/01/2041 | | | 3,159 | |
| | | | | HCP, Inc. | | | | |
| | 2,030 | | | 6.00%, 01/30/2017 | | | 2,272 | |
| | | | | HSBC Holdings plc | | | | |
| | 3,010 | | | 6.10%, 01/14/2042 | | | 3,794 | |
| | | | | Huntington National Bank | | | | |
| | 760 | | | 2.20%, 04/01/2019 | | | 761 | |
| | | | | ING Bank N.V. | | | | |
| | 5,200 | | | 3.75%, 03/07/2017 ■ | | | 5,531 | |
| | | | | JP Morgan Chase & Co. | | | | |
| | 2,240 | | | 3.25%, 09/23/2022 | | | 2,250 | |
| | 850 | | | 3.38%, 05/01/2023 | | | 834 | |
| | 2,000 | | | 4.95%, 03/25/2020 | | | 2,252 | |
| | 6,035 | | | 5.13%, 09/15/2014 | | | 6,092 | |
| | 1,080 | | | 5.40%, 01/06/2042 | | | 1,233 | |
| | | | | Korea Finance Corp. | | | | |
| | 965 | | | 2.88%, 08/22/2018 | | | 991 | |
| | | | | Liberty Mutual Group, Inc. | | | | |
| | 550 | | | 4.25%, 06/15/2023 ■ | | | 570 | |
| | | | | Loews Corp. | | | | |
| | 835 | | | 2.63%, 05/15/2023 | | | 788 | |
| | | | | Merrill Lynch & Co., Inc. | | | | |
| | 1,000 | | | 6.40%, 08/28/2017 | | | 1,142 | |
| | 6,000 | | | 6.88%, 04/25/2018 | | | 7,069 | |
| | | | | MetLife, Inc. | | | | |
| | 2,385 | | | 3.60%, 04/10/2024 | | | 2,429 | |
| | 1,210 | | | 4.88%, 11/13/2043 | | | 1,308 | |
| | | | | Morgan Stanley | | | | |
| | 4,875 | | | 2.50%, 01/24/2019 | | | 4,930 | |
| | 250 | | | 5.63%, 09/23/2019 | | | 287 | |
| | | | | National City Corp. | | | | |
| | 4,250 | | | 6.88%, 05/15/2019 | | | 5,076 | |
| | | | | Nordea Bank AB | | | | |
| | 1,790 | | | 3.70%, 11/13/2014 ■ | | | 1,812 | |
| | | | | Postal Square L.P. | | | | |
| | 11,812 | | | 8.95%, 06/15/2022 | | | 15,152 | |
| | | | | Prudential Financial, Inc. | | | | |
| | 1,500 | | | 3.50%, 05/15/2024 | | | 1,495 | |
| | 3,000 | | | 5.50%, 03/15/2016 | | | 3,225 | |
| | | | | Rabobank Nederland | | | | |
| | 3,900 | | | 3.20%, 03/11/2015 ■ | | | 3,978 | |
| | | | | Republic New York Capital I | | | | |
| | 500 | | | 7.75%, 11/15/2026 | | | 506 | |
| | | | | Sovereign Bancorp, Inc. | | | | |
| | 4,795 | | | 8.75%, 05/30/2018 | | | 5,837 | |
| | | | | State Grid Overseas Investment | | | | |
| | 1,795 | | | 2.75%, 05/07/2019 ■ | | | 1,810 | |
| | | | | U.S. Bancorp | | | | |
| | 780 | | | 3.70%, 01/30/2024 | | | 808 | |
| | | | | UBS AG Stamford CT | | | | |
| | 235 | | | 5.88%, 12/20/2017 | | | 268 | |
| | | | | Wachovia Corp. | | | | |
| | 1,000 | | | 5.75%, 06/15/2017 | | | 1,131 | |
| | | | | WEA Finance LLC | | | | |
| | 1,450 | | | 7.13%, 04/15/2018 ■ | | | 1,765 | |
| | | | | Wellpoint, Inc. | | | | |
| | 421 | | | 3.30%, 01/15/2023 | | | 421 | |
| | | | | Wells Fargo & Co. | | | | |
| | 10,344 | | | 4.48%, 01/16/2024 | | | 10,956 | |
| | | | | | | | 192,428 | |
| | | | | Food Manufacturing - 0.2% | | | | |
| | | | | ConAgra Foods, Inc. | | | | |
| | 265 | | | 1.90%, 01/25/2018 | | | 266 | |
| | | | | Grupo Bimbo S.A.B. de C.V. | | | | |
| | 425 | | | 3.88%, 06/27/2024 ■ | | | 424 | |
| | | | | Kraft Foods Group, Inc. | | | | |
| | 555 | | | 2.25%, 06/05/2017 | | | 570 | |
| | 535 | | | 3.50%, 06/06/2022 | | | 549 | |
| | 605 | | | 5.00%, 06/04/2042 | | | 647 | |
The accompanying notes are an integral part of these financial statements.
| Hartford Balanced HLS Fund |
| Schedule of Investments – (continued) |
| June 30, 2014 (Unaudited) |
| (000’s Omitted) |
| Shares or Principal Amount | | Market Value ╪ | |
Corporate Bonds - 13.1% - (continued) |
| | | | | Food Manufacturing - 0.2% - (continued) | | | | |
| | | | | Mondelez International, Inc. | | | | |
| $ | 3,800 | | | 4.13%, 02/09/2016 | | $ | 3,996 | |
| | | | | | | | 6,452 | |
| | | | | Health Care and Social Assistance - 0.8% | | | | |
| | | | | Actavis Funding SCS | | | | |
| | 215 | | | 2.45%, 06/15/2019 ■ | | | 216 | |
| | 1,200 | | | 4.85%, 06/15/2044 ■ | | | 1,211 | |
| | | | | Amgen, Inc. | | | | |
| | 3,300 | | | 5.15%, 11/15/2041 | | | 3,541 | |
| | | | | Catholic Health Initiatives | | | | |
| | 765 | | | 2.60%, 08/01/2018 | | | 769 | |
| | | | | Celgene Corp. | | | | |
| | 230 | | | 2.25%, 05/15/2019 | | | 231 | |
| | 535 | | | 3.63%, 05/15/2024 | | | 536 | |
| | | | | CVS Caremark Corp. | | | | |
| | 2,350 | | | 4.00%, 12/05/2023 | | | 2,459 | |
| | | | | Eli Lilly & Co. | | | | |
| | 1,015 | | | 4.65%, 06/15/2044 | | | 1,072 | |
| | | | | Express Scripts Holding Co. | | | | |
| | 1,525 | | | 2.25%, 06/15/2019 | | | 1,519 | |
| | | | | Express Scripts, Inc. | | | | |
| | 2,195 | | | 3.50%, 06/15/2024 | | | 2,172 | |
| | | | | Gilead Sciences, Inc. | | | | |
| | 930 | | | 3.70%, 04/01/2024 | | | 954 | |
| | | | | GlaxoSmithKline Capital, Inc. | | | | |
| | 2,370 | | | 2.80%, 03/18/2023 | | | 2,305 | |
| | | | | Kaiser Foundation Hospitals | | | | |
| | 326 | | | 3.50%, 04/01/2022 | | | 329 | |
| | 640 | | | 4.88%, 04/01/2042 | | | 695 | |
| | | | | McKesson Corp. | | | | |
| | 100 | | | 2.85%, 03/15/2023 | | | 97 | |
| | 990 | | | 3.80%, 03/15/2024 | | | 1,012 | |
| | | | | Medtronic, Inc. | | | | |
| | 310 | | | 3.63%, 03/15/2024 | | | 318 | |
| | | | | Merck & Co., Inc. | | | | |
| | 1,640 | | | 2.80%, 05/18/2023 | | | 1,603 | |
| | 630 | | | 4.15%, 05/18/2043 | | | 616 | |
| | | | | Novartis Capital Corp. | | | | |
| | 2,650 | | | 3.40%, 05/06/2024 | | | 2,684 | |
| | | | | Zoetis, Inc. | | | | |
| | 150 | | | 3.25%, 02/01/2023 | | | 148 | |
| | 180 | | | 4.70%, 02/01/2043 | | | 183 | |
| | | | | | | | 24,670 | |
| | | | | Information - 0.9% | | | | |
| | | | | America Movil S.A.B. de C.V. | | | | |
| | 635 | | | 3.13%, 07/16/2022 | | | 625 | |
| | 530 | | | 4.38%, 07/16/2042 | | | 500 | |
| | | | | AT&T, Inc. | | | | |
| | 2,510 | | | 6.80%, 05/15/2036 | | | 3,173 | |
| | | | | Orange S.A. | | | | |
| | 3,200 | | | 4.13%, 09/14/2021 | | | 3,437 | |
| | | | | Verizon Communications, Inc. | | | | |
| | 425 | | | 3.45%, 03/15/2021 | | | 439 | |
| | 2,415 | | | 3.50%, 11/01/2021 | | | 2,488 | |
| | 4,795 | | | 4.50%, 09/15/2020 | | | 5,274 | |
| | 715 | | | 4.75%, 11/01/2041 | | | 722 | |
| | 3,590 | | | 6.40%, 09/15/2033 | | | 4,398 | |
| | 4,215 | | | 6.55%, 09/15/2043 | | | 5,304 | |
| | | | | | | | 26,360 | |
| | | | | Machinery Manufacturing - 0.0% | | | | |
| | | | | Caterpillar, Inc. | | | | |
| | 835 | | | 3.40%, 05/15/2024 | | | 845 | |
| | 450 | | | 4.30%, 05/15/2044 | | | 451 | |
| | | | | | | | 1,296 | |
| | | | | Mining - 0.1% | | | | |
| | | | | BHP Billiton Finance USA Ltd. | | | | |
| | 1,720 | | | 3.85%, 09/30/2023 | | | 1,804 | |
| | | | | Rio Tinto Finance USA Ltd. | | | | |
| | 1,905 | | | 3.75%, 09/20/2021 | | | 2,006 | |
| | | | | | | | 3,810 | |
| | | | | Miscellaneous Manufacturing - 0.0% | | | | |
| | | | | United Technologies Corp. | | | | |
| | 365 | | | 3.10%, 06/01/2022 | | | 370 | |
| | | | | | | | | |
| | | | | Motor Vehicle and Parts Manufacturing - 0.2% | | | | |
| | | | | Daimler Finance NA LLC | | | | |
| | 5,600 | | | 2.63%, 09/15/2016 ■ | | | 5,786 | |
| | | | | | | | | |
| | | | | Other Services - 0.1% | | | | |
| | | | | Illinois Tool Works, Inc. | | | | |
| | 1,710 | | | 3.50%, 03/01/2024 | | | 1,753 | |
| | | | | | | | | |
| | | | | Petroleum and Coal Products Manufacturing - 0.6% | | | | |
| | | | | Atmos Energy Corp. | | | | |
| | 5,875 | | | 6.35%, 06/15/2017 | | | 6,742 | |
| | | | | Chevron Corp. | | | | |
| | 950 | | | 3.19%, 06/24/2023 | | | 965 | |
| | | | | EnCana Corp. | | | | |
| | 305 | | | 5.90%, 12/01/2017 | | | 347 | |
| | | | | Gazprom Neft OAO via GPN Capital S.A. | | | | |
| | 1,100 | | | 4.38%, 09/19/2022 ■ | | | 1,020 | |
| | | | | Motiva Enterprises LLC | | | | |
| | 420 | | | 5.75%, 01/15/2020 ■ | | | 477 | |
| | | | | Ras Laffan Liquefied Natural Gas Co., Ltd. | | | | |
| | 1,200 | | | 5.50%, 09/30/2014 ■ | | | 1,214 | |
| | | | | Schlumberger Investment S.A. | | | | |
| | 1,625 | | | 3.65%, 12/01/2023 | | | 1,690 | |
| | | | | Shell International Finance B.V. | | | | |
| | 2,250 | | | 4.38%, 03/25/2020 | | | 2,503 | |
| | | | | Statoil ASA | | | | |
| | 1,635 | | | 2.90%, 11/08/2020 | | | 1,681 | |
| | | | | Total Capital S.A. | | | | |
| | 1,375 | | | 2.70%, 01/25/2023 | | | 1,328 | |
| | | | | | | | 17,967 | |
| | | | | Pipeline Transportation - 0.2% | | | | |
| | | | | Kinder Morgan Energy Partners L.P. | | | | |
| | 5,000 | | | 6.95%, 01/15/2038 | | | 6,164 | |
| | | | | | | | | |
| | | | | Professional, Scientific and Technical Services - 0.1% | | | | |
| | | | | IBM Corp. | | | | |
| | 2,900 | | | 3.63%, 02/12/2024 | | | 2,976 | |
| | | | | | | | | |
| | | | | Real Estate, Rental and Leasing - 0.2% | | | | |
| | | | | ERAC USA Finance Co. | | | | |
| | 655 | | | 2.35%, 10/15/2019 ■ | | | 654 | |
| | 340 | | | 2.75%, 03/15/2017 ■ | | | 351 | |
| | 1,800 | | | 4.50%, 08/16/2021 ■ | | | 1,958 | |
| | 1,500 | | | 5.63%, 03/15/2042 ■ | | | 1,697 | |
| | | | | | | | 4,660 | |
The accompanying notes are an integral part of these financial statements.
| Hartford Balanced HLS Fund |
| Schedule of Investments – (continued) |
| June 30, 2014 (Unaudited) |
| (000’s Omitted) |
| Shares or Principal Amount | | Market Value ╪ | |
Corporate Bonds - 13.1% - (continued) |
| | | | | Retail Trade - 0.3% | | | | |
| | | | | Amazon.com, Inc. | | | | |
| $ | 1,550 | | | 2.50%, 11/29/2022 | | $ | 1,466 | |
| | | | | AutoZone, Inc. | | | | |
| | 900 | | | 3.13%, 07/15/2023 | | | 870 | |
| | 1,908 | | | 3.70%, 04/15/2022 | | | 1,963 | |
| | | | | Home Depot, Inc. | | | | |
| | 325 | | | 4.40%, 03/15/2045 | | | 330 | |
| | | | | Kroger (The) Co. | | | | |
| | 620 | | | 3.30%, 01/15/2021 | | | 635 | |
| | 1,065 | | | 4.00%, 02/01/2024 | | | 1,105 | |
| | | | | Lowe's Cos., Inc. | | | | |
| | 3,400 | | | 4.63%, 04/15/2020 | | | 3,750 | |
| | | | | | | | 10,119 | |
| | | | | Soap, Cleaning Compound and Toilet Manufacturing - 0.3% | | | | |
| | | | | Procter & Gamble Co. | | | | |
| | 8,191 | | | 9.36%, 01/01/2021 | | | 10,313 | |
| | | | | | | | | |
| | | | | Utilities - 0.7% | | | | |
| | | | | Consolidated Edison Co. of NY | | | | |
| | 4,605 | | | 5.30%, 12/01/2016 | | | 5,084 | |
| | | | | Electricitie De France | | | | |
| | 2,375 | | | 4.88%, 01/22/2044 ■ | | | 2,532 | |
| | 2,375 | | | 5.63%, 01/22/2024 ■♠ | | | 2,482 | |
| | | | | Indianapolis Power and Light | | | | |
| | 3,750 | | | 6.60%, 06/01/2037 ■ | | | 4,979 | |
| | | | | Pacific Gas & Electric Co. | | | | |
| | 695 | | | 3.85%, 11/15/2023 | | | 724 | |
| | 435 | | | 5.13%, 11/15/2043 | | | 487 | |
| | | | | Southern California Edison Co. | | | | |
| | 4,000 | | | 5.55%, 01/15/2037 | | | 4,792 | |
| | | | | | | | 21,080 | |
| | | | | Wholesale Trade - 0.0% | | | | |
| | | | | Heineken N.V. | | | | |
| | 1,330 | | | 2.75%, 04/01/2023 ■ | | | 1,271 | |
| | 50 | | | 4.00%, 10/01/2042 ■ | | | 46 | |
| | | | | | | | 1,317 | |
| | | | | Total Corporate Bonds | | | | |
| | | | | (Cost $370,821) | | $ | 402,671 | |
| | | | | | | | | |
Foreign Government Obligations - 0.1% |
| | | | | Mexico - 0.1% | | | | |
| | | | | Mexico (United Mexican States) | | | | |
| $ | 1,674 | | | 3.50%, 01/21/2021 | | $ | 1,738 | |
| | | | | | | | | |
| | | | | Poland - 0.0% | | | | |
| | | | | Poland (Republic of) | | | | |
| | 1,400 | | | 4.00%, 01/22/2024 | | | 1,453 | |
| | | | | | | | | |
| | | | | Total Foreign Government Obligations | | | | |
| | | | | (Cost $3,052) | | $ | 3,191 | |
| | | | | | | | | |
Municipal Bonds - 1.0% |
| | | | | General Obligations - 0.3% | | | | |
| | | | | California State GO, Taxable, | | | | |
| $ | 1,235 | | | 7.55%, 04/01/2039 | | $ | 1,856 | |
| | | | | Chicago, IL, Metropolitan Water Reclamation GO, | | | | |
| | 685 | | | 5.72%, 12/01/2038 | | | 821 | |
| | | | | Illinois State GO, | | | | |
| | 775 | | | 5.10%, 06/01/2033 | | | 779 | |
| | | | | Los Angeles, CA, USD GO, | | | | |
| | 4,300 | | | 5.75%, 07/01/2034 | | | 5,231 | |
| | | | | | | | 8,687 | |
| | | | | Health Care/Services - 0.1% | | | | |
| | | | | University of California, Regents MedCenter Pooled Rev, | | | | |
| | 1,935 | | | 6.58%, 05/15/2049 | | | 2,532 | |
| | | | | | | | | |
| | | | | Higher Education (Univ., Dorms, etc.) - 0.0% | | | | |
| | | | | University of California, Build America Bonds Rev, | | | | |
| | 1,960 | | | 5.77%, 05/15/2043 | | | 2,367 | |
| | | | | | | | | |
| | | | | Tax Allocation - 0.1% | | | | |
| | | | | Dallas, TX, Area Rapid Transit Sales Tax Rev, | | | | |
| | 2,200 | | | 6.00%, 12/01/2044 | | | 2,836 | |
| | | | | | | | | |
| | | | | Transportation - 0.5% | | | | |
| | | | | Bay Area, CA, Toll Auth Bridge Rev, | | | | |
| | 3,100 | | | 6.26%, 04/01/2049 | | | 4,176 | |
| | | | | Illinois State Toll Highway Auth, Taxable Rev, | | | | |
| | 1,875 | | | 6.18%, 01/01/2034 | | | 2,351 | |
| | | | | Maryland State Transportation Auth, | | | | |
| | 1,350 | | | 5.89%, 07/01/2043 | | | 1,709 | |
| | | | | New York and New Jersey PA, Taxable Rev, | | | | |
| | 975 | | | 5.86%, 12/01/2024 | | | 1,192 | |
| | 570 | | | 6.04%, 12/01/2029 | | | 709 | |
| | | | | North Texas Tollway Auth Rev, | | | | |
| | 3,400 | | | 6.72%, 01/01/2049 | | | 4,672 | |
| | | | | | | | 14,809 | |
| | | | | Utilities - Combined - 0.0% | | | | |
| | | | | Utility Debt Securitization Auth, New York, | | | | |
| | 485 | | | 3.44%, 12/15/2025 | | | 506 | |
| | | | | | | | | |
| | | | | Total Municipal Bonds | | | | |
| | | | | (Cost $25,173) | | $ | 31,737 | |
| | | | | | | | | |
| U.S. Government Agencies - 2.4% |
| | | | | FHLMC - 0.9% | | | | |
| $ | 99 | | | 2.27%, 04/01/2029 Δ | | $ | 102 | |
| | 49 | | | 4.00%, 03/01/2041 | | | 52 | |
| | 26,403 | | | 4.50%, 08/01/2033 - 01/01/2044 | | | 28,603 | |
| | | | | | | | 28,757 | |
| | | | | FNMA - 1.2% | | | | |
| | 34,150 | | | 4.50%, 07/15/2044 ☼ | | | 36,983 | |
| | 104 | | | 5.00%, 02/01/2019 - 04/01/2019 | | | 111 | |
| | 1 | | | 7.00%, 02/01/2029 | | | 1 | |
| | | | | | | | 37,095 | |
| | | | | GNMA - 0.3% | | | | |
| | 251 | | | 5.00%, 07/15/2037 | | | 278 | |
| | 2,380 | | | 6.00%, 06/15/2024 - 06/15/2035 | | | 2,698 | |
| | 811 | | | 6.50%, 03/15/2026 - 02/15/2035 | | | 924 | |
| | 3,565 | | | 7.00%, 11/15/2031 - 11/15/2033 | | | 4,195 | |
| | 174 | | | 7.50%, 09/16/2035 | | | 201 | |
| | 694 | | | 8.00%, 09/15/2026 - 02/15/2031 | | | 760 | |
| | 22 | | | 9.00%, 07/20/2016 - 06/15/2022 | | | 22 | |
| | | | | | | | 9,078 | |
| | | | | Total U.S. Government Agencies | | | | |
| | | | | (Cost $73,048) | | $ | 74,930 | |
The accompanying notes are an integral part of these financial statements.
| Hartford Balanced HLS Fund |
| Schedule of Investments – (continued) |
| June 30, 2014 (Unaudited) |
| (000’s Omitted) |
| Shares or Principal Amount | | | | | | Market Value ╪ | |
| U.S. Government Securities - 14.8% |
| Other Direct Federal Obligations - 0.8% |
| | | | | Tennessee Valley Authority - 0.8% | | | | | | | | |
| $ | 22,300 | | | 4.38%, 06/15/2015 | | | | | | $ | 23,201 | |
| | | | | | | | | | | | | |
| U.S. Treasury Securities - 14.0% |
| | | | | U.S. Treasury Bonds - 1.5% | | | | | | | | |
| | 18,211 | | | 2.88%, 05/15/2043 ‡ | | | | | | | 16,640 | |
| | 362 | | | 3.13%, 02/15/2043 | | | | | | | 348 | |
| | 22,000 | | | 4.38%, 02/15/2038 □ | | | | | | | 26,266 | |
| | 1,750 | | | 6.00%, 02/15/2026 | | | | | | | 2,339 | |
| | | | | | | | | | | | 45,593 | |
| | | | | U.S. Treasury Notes - 12.5% | | | | | | | | |
| | 82,000 | | | 0.25%, 09/30/2015 - 11/30/2015 ‡ | | | | | | | 82,056 | |
| | 15,800 | | | 0.38%, 05/31/2016 | | | | | | | 15,786 | |
| | 8,300 | | | 0.63%, 05/31/2017 | | | | | | | 8,245 | |
| | 5,343 | | | 0.88%, 01/31/2017 | | | | | | | 5,367 | |
| | 7,000 | | | 1.00%, 05/31/2018 | | | | | | | 6,924 | |
| | 121,500 | | | 1.25%, 10/31/2015 - 11/30/2018 | | | | | | | 123,017 | |
| | 36,835 | | | 1.38%, 09/30/2018 | | | | | | | 36,789 | |
| | 28,700 | | | 1.50%, 06/30/2016 | | | | | | | 29,292 | |
| | 5,300 | | | 2.00%, 04/30/2016 | | | | | | | 5,456 | |
| | 43,000 | | | 2.75%, 02/15/2019 - 02/15/2024 | | | | | | | 44,745 | |
| | 24,575 | | | 3.88%, 05/15/2018 | | | | | | | 27,036 | |
| | | | | | | | | | | | 384,713 | |
| | | | | | | | | | | | 430,306 | |
| | | | | Total U.S. Government Securities | | | | | | | | |
| | | | | (Cost $439,000) | | | | | | $ | 453,507 | |
| | | | | | | | | | | | | |
| | | | | Total Long-Term Investments | | | | | | | | |
| | | | | (Cost $2,294,134) | | | | | | $ | 3,012,914 | |
| | | | | | | | | | | | | |
| Short-Term Investments - 2.3% |
| Repurchase Agreements - 2.3% | | | | | | | | |
| | | | | Bank of America Merrill Lynch TriParty Repurchase
Agreement (maturing on 07/01/2014 in the
amount of $6,081, collateralized by FHLMC
2.23% - 5.99%, 2030 - 2044, FNMA 2.31% -
6.34%, 2020 - 2042, value of $6,202) | | | | | | | | |
| $ | 6,081 | | | 0.10%, 6/30/2014 | | | | | | $ | 6,081 | |
| | | | | Bank of Montreal TriParty Repurchase Agreement
(maturing on 07/01/2014 in the amount of
$9,289, collateralized by U.S. Treasury Bill
0.13%, 2015, U.S. Treasury Bond 2.75% -
10.63%, 2015 - 2044, U.S. Treasury Note
0.13% - 4.50%, 2014 - 2024, value of $9,475) | | | | | | | | |
| | 9,289 | | | 0.09%, 6/30/2014 | | | | | | | 9,289 | |
| | | | | Bank of Montreal TriParty Repurchase Agreement
(maturing on 07/01/2014 in the amount of
$3,961, collateralized by FHLMC 2.00% -
5.50%, 2018 - 2041, FNMA 2.00% - 4.50%,
2026 - 2042, GNMA 3.00% - 4.00%, 2042 -
2043, U.S. Treasury Bill 0.05%, 2014, U.S.
Treasury Note 0.75%, 2018, value of $4,040) | | | | | | | | |
| | 3,961 | | | 0.11%, 6/30/2014 | | | | | | | 3,961 | |
| | | | | Barclays Capital TriParty Repurchase Agreement
(maturing on 07/01/2014 in the amount of
$3,664, collateralized by U.S. Treasury Note
0.63% - 0.88%, 2018 - 2019, value of $3,737) | | | | | | | | |
| | 3,664 | | | 0.07%, 6/30/2014 | | | | | | | 3,664 | |
| | | | | Citigroup Global Markets, Inc. TriParty Repurchase
Agreement (maturing on 07/01/2014 in the
amount of $8,441, collateralized by U.S.
Treasury Bond 4.38% - 7.50%, 2016 - 2040,
U.S. Treasury Note 0.50% - 3.00%, 2014 -
2020, value of $8,610) | | | | | | | | |
| 8,441 | | | 0.06%, 6/30/2014 | | | | | | | 8,441 | |
| | | | | RBS Securities Inc. TriParty Repurchase
Agreement (maturing on 07/01/2014 in the
amount of $12,937, collateralized by U.S.
Treasury Note 0.38% - 3.13%, 2015 - 2022,
value of $13,196) | | | | | | | | |
| | 12,937 | | | 0.08%, 6/30/2014 | | | | | | | 12,937 | |
| | | | | TD Securities TriParty Repurchase Agreement
(maturing on 07/01/2014 in the amount of
$26,928, collateralized by FHLMC 3.50% -
4.00%, 2026 - 2044, FNMA 2.50% - 5.00%,
2025 - 2043, value of $27,467) | | | | | | | | |
| | 26,928 | | | 0.11%, 6/30/2014 | | | | | | | 26,928 | |
| | | | | UBS Securities Repurchase Agreement (maturing
on 07/01/2014 in the amount of $111,
collateralized by U.S. Treasury Note 2.13%,
2020, value of $113) | | | | | | | | |
| | 111 | | | 0.05%, 6/30/2014 | | | | | | | 111 | |
| | | | | | | | | | | | 71,412 | |
| | | | | Total Short-Term Investments | | | | | | | | |
| | | | | (Cost $71,412) | | | | | | $ | 71,412 | |
| | | | | | | | | | | | | |
| | | | Total Investments | | | | | | | | |
| | | | | (Cost $2,365,546) ▲ | | | 100.2 | % | | $ | 3,084,326 | |
| | | | | Other Assets and Liabilities | | | (0.2 | )% | | | (6,744 | ) |
| | | | | Total Net Assets | | | 100.0 | % | | $ | 3,077,582 | |
The accompanying notes are an integral part of these financial statements.
| Hartford Balanced HLS Fund |
| Schedule of Investments – (continued) |
| June 30, 2014 (Unaudited) |
| (000’s Omitted) |
| Note: | Percentage of investments as shown is the ratio of the total market value to total net assets. |
| | |
| | Prices of foreign equities that are principally traded on certain foreign markets may be adjusted daily pursuant to a fair value pricing service approved by the Board of Directors in order to reflect an adjustment for factors occurring after the close of certain foreign markets but before the close of the New York Stock Exchange. |
| ▲ | At June 30, 2014, the cost of securities for federal income tax purposes was $2,378,468 and the aggregate gross unrealized appreciation and depreciation based on that cost were: |
| Unrealized Appreciation | | $ | 726,697 | |
| Unrealized Depreciation | | | (20,839 | ) |
| Net Unrealized Appreciation | | $ | 705,858 | |
| † | These securities were valued in good faith at fair value as determined under policies and procedures established by and under the supervision of the Board of Directors. At June 30, 2014, the aggregate value of these securities was $23,697, which represents 0.8% of total net assets. This amount excludes securities that are principally traded in certain foreign markets and whose prices are adjusted pursuant to a third party pricing service methodology approved by the Board of Directors. |
| Δ | Variable rate securities; the rate reported is the coupon rate in effect at June 30, 2014. |
| ■ | Securities issued within terms of a private placement memorandum, exempt from registration under Rule 144A under the Securities Act of 1933, as amended, and may be sold only to qualified institutional buyers. Unless otherwise indicated, these holdings are determined to be liquid. At June 30, 2014, the aggregate value of these securities was $58,010, which represents 1.9% of total net assets. |
| ⌂ | The following securities are considered illiquid. Illiquid securities are often purchased in private placement transactions, are often not registered under the Securities Act of 1933, as amended, and may have contractual restrictions on resale. A security may also be considered illiquid if the security lacks a readily available market or if its valuation has not changed for a certain period of time. |
| Period Acquired | | Shares/ Par | | | Security | | Cost Basis | |
| 08/2011 | | | 11,702 | | | Allstar Co. | | $ | 5,091 | |
| 11/2013 | | | 163 | | | Tory Burch LLC | | | 12,794 | |
At June 30, 2014, the aggregate value of these securities was $23,697, which represents 0.8% of total net assets.
| ♠ | Perpetual maturity security. Maturity date shown is the next call date or final legal maturity date, whichever comes first. |
| ☼ | This security, or a portion of this security, was purchased on a when-issued, delayed-delivery or delayed-draw basis. The cost of these securities was $36,731 at June 30, 2014. |
| ‡ | This security, or a portion of this security, has been segregated to cover funding requirements on investment transactions settling in the future. |
| □ | This security, or a portion of this security, is pledged as initial margin deposit and collateral for daily variation margin loss on open futures contracts held at June 30, 2014. |
Futures Contracts Outstanding at June 30, 2014
| | | Number of | | Expiration | | Notional | | | Market | | | Unrealized
Appreciation/(Depreciation) | | | Variation Margin | |
Description | | Contracts* | | Date | | Amount | | | Value ╪ | | | Asset | | | Liability | | | Asset | | | Liability | |
| Long position contracts: | | | | | | | | | | | | | | | | | | | | | | | | | | | | |
U.S. Treasury 10-Year Note Future | | 163 | | 09/19/2014 | | $ | 20,243 | | | $ | 20,403 | | | $ | 160 | | | $ | – | | | $ | 13 | | | $ | – | |
U.S. Treasury CME Ultra Long Term Bond Future | | 62 | | 09/19/2014 | | | 9,239 | | | | 9,296 | | | | 57 | | | | – | | | | 40 | | | | – | |
| Total | | | | | | | | | | | | | | $ | 217 | | | $ | – | | | $ | 53 | | | $ | – | |
| * | The number of contracts does not omit 000's. |
| ╪ | See Significant Accounting Policies of accompanying Notes to Financial Statements regarding valuation of securities. |
The accompanying notes are an integral part of these financial statements.
| Hartford Balanced HLS Fund |
| Schedule of Investments – (continued) |
| June 30, 2014 (Unaudited) |
| (000’s Omitted) |
| GLOSSARY: (abbreviations used in preceding Schedule of Investments) |
| |
| Municipal Bond Abbreviations: |
| GO | General Obligation | |
| PA | Port Authority | |
| Rev | Revenue | |
| USD | United School District | |
| | |
| Other Abbreviations: |
| ADR | American Depositary Receipt |
| FHLMC | Federal Home Loan Mortgage Corp. |
| FNMA | Federal National Mortgage Association |
| GNMA | Government National Mortgage Association |
| | |
The accompanying notes are an integral part of these financial statements.
| Hartford Balanced HLS Fund |
| Investment Valuation Hierarchy Level Summary |
| June 30, 2014 (Unaudited) |
| (000’s Omitted) |
| | | Total | | | Level 1 ♦ | | | Level 2 ♦ | | | Level 3 | |
| Assets: | | | | | | | | | | | | | | | | |
| Asset and Commercial Mortgage Backed Securities | | $ | 6,682 | | | $ | – | | | $ | 6,674 | | | $ | 8 | |
| Common Stocks ‡ | | | 2,040,196 | | | | 1,928,471 | | | | 88,028 | | | | 23,697 | |
| Corporate Bonds | | | 402,671 | | | | – | | | | 380,604 | | | | 22,067 | |
| Foreign Government Obligations | | | 3,191 | | | | – | | | | 3,191 | | | | – | |
| Municipal Bonds | | | 31,737 | | | | – | | | | 31,737 | | | | – | |
| U.S. Government Agencies | | | 74,930 | | | | – | | | | 74,930 | | | | – | |
| U.S. Government Securities | | | 453,507 | | | | – | | | | 453,507 | | | | – | |
| Short-Term Investments | | | 71,412 | | | | – | | | | 71,412 | | | | – | |
| Total | | $ | 3,084,326 | | | $ | 1,928,471 | | | $ | 1,110,083 | | | $ | 45,772 | |
| Futures * | | $ | 217 | | | $ | 217 | | | $ | – | | | $ | – | |
| Total | | $ | 217 | | | $ | 217 | | | $ | – | | | $ | – | |
| ♦ | For the six-month period ended June 30, 2014, investments valued at $21,767 were transferred from Level 1 to Level 2, and there were no transfers from Level 2 to Level 1. Investments are transferred between Level 1 and Level 2 for a variety of reasons including, but not limited to: |
| 1) | Foreign equities for which a fair value price is more representative of exit value than the local market close (transfer into Level 2). Foreign equities for which the local market close is more representative of exit value (transfer into Level 1). |
| 2) | U.S. Treasury securities that no longer represent the most recent issue (transfer into Level 2). |
| 3) | Equity investments with no observable trading but a bid or mean price is used (transfer into Level 2). Equity investments using observable quoted prices in an active market (transfer into Level 1). |
| ‡ | The Fund has all or primarily all of the equity securities categorized in a particular level. Refer to the Schedule of Investments for further industry breakout. |
| * | Derivative instruments (excluding purchased and written options, if applicable) are valued at the unrealized appreciation/depreciation on the investments. |
Following is a reconciliation of Level 3 assets for which significant unobservable inputs were used to determine fair value:
| | | Balance as
of
December
31, 2013 | | | Realized
Gain
(Loss) | | | Change in
Unrealized
Appreciation
(Depreciation) | | | Net
Amortization | | | Purchases | | | Sales | | | Transfers
Into
Level 3 | | | Transfers
Out of
Level 3 | | | Balance as
of June 30,
2014 | |
| Assets: | | | | | | | | | | | | | | | | | | | | | | | | | | | | | | | | | | | | |
| Asset & Commercial Mortgage Backed Securities | | $ | 8 | | | $ | — | | | $ | — | * | | $ | — | | | $ | — | | | $ | — | | | $ | — | | | $ | — | | | $ | 8 | |
| Common Stocks | | | 38,005 | | | | — | | | | (12,484 | )† | | | — | | | | — | | | | (1,824 | ) | | | — | | | | — | | | | 23,697 | |
| Corporate Bonds | | | 22,994 | | | | (49 | ) | | | (148 | )‡ | | | (51 | ) | | | — | | | | (679 | ) | | | — | | | | — | | | | 22,067 | |
| Total | | $ | 61,007 | | | $ | (49 | ) | | $ | (12,632 | ) | | $ | (51 | ) | | $ | — | | | $ | (2,503 | ) | | $ | — | | | $ | — | | | $ | 45,772 | |
| * | Change in unrealized appreciation (depreciation) in the current period relating to assets still held at June 30, 2014 rounds to zero. |
| † | Change in unrealized appreciation (depreciation) in the current period relating to assets still held at June 30, 2014 was $(12,484). |
| ‡ | Change in unrealized appreciation (depreciation) in the current period relating to assets still held at June 30, 2014 was $(146). |
| Note: | For purposes of reporting transfers between different hierarchy levels, both transfers in and out of each level, as applicable, are shown as if they occurred at the beginning of the period. |
The accompanying notes are an integral part of these financial statements.
| Hartford Balanced HLS Fund |
| Statement of Assets and Liabilities |
| June 30, 2014 (Unaudited) |
| (000’s Omitted) |
| Assets: | | | | |
| Investments in securities, at market value (cost $2,365,546) | | $ | 3,084,326 | |
| Cash | | | 21 | |
| Receivables: | | | | |
| Investment securities sold | | | 27,655 | |
| Fund shares sold | | | 6 | |
| Dividends and interest | | | 9,143 | |
| Variation margin on financial derivative instruments | | | 53 | |
| Other assets | | | 2 | |
| Total assets | | | 3,121,206 | |
| Liabilities: | | | | |
| Payables: | | | | |
| Investment securities purchased | | | 39,686 | |
| Fund shares redeemed | | | 3,383 | |
| Investment management fees | | | 260 | |
| Distribution fees | | | 13 | |
| Other liabilities | | | 20 | |
| Accrued expenses | | | 262 | |
| Total liabilities | | | 43,624 | |
| Net assets | | $ | 3,077,582 | |
| Summary of Net Assets: | | | | |
| Capital stock and paid-in-capital | | $ | 2,848,507 | |
| Undistributed net investment income | | | 38,073 | |
| Accumulated net realized loss | | | (528,016 | ) |
| Unrealized appreciation of investments and the translations of assets and liabilities denominated in foreign currency | | | 719,018 | |
| Net assets | | $ | 3,077,582 | |
| Shares authorized | | | 9,500,000 | |
| Par value | | $ | 0.001 | |
| Class IA: Net asset value per share | | $ | 26.60 | |
| Shares outstanding | | | 101,299 | |
| Net assets | | $ | 2,694,193 | |
| Class IB: Net asset value per share | | $ | 26.91 | |
| Shares outstanding | | | 14,245 | |
| Net assets | | $ | 383,389 | |
The accompanying notes are an integral part of these financial statements.
| Hartford Balanced HLS Fund |
| Statement of Operations |
| For the Six-Month Period Ended June 30, 2014 (Unaudited) |
| (000’s Omitted) |
| Investment Income: | | | | |
| Dividends | | $ | 24,575 | |
| Interest | | | 14,256 | |
| Less: Foreign tax withheld | | | (440 | ) |
| Total investment income, net | | | 38,391 | |
| | | | | |
| Expenses: | | | | |
| Investment management fees | | | 9,419 | |
| Transfer agent fees | | | 3 | |
| Distribution fees - Class IB | | | 480 | |
| Custodian fees | | | 11 | |
| Accounting services fees | | | 245 | |
| Board of Directors' fees | | | 41 | |
| Audit fees | | | 16 | |
| Other expenses | | | 211 | |
| Total expenses (before fees paid indirectly) | | | 10,426 | |
| Commission recapture | | | (2 | ) |
| Total fees paid indirectly | | | (2 | ) |
| Total expenses, net | | | 10,424 | |
| Net Investment Income | | | 27,967 | |
| | | | | |
| Net Realized Gain on Investments, Other Financial Instruments and Foreign Currency Transactions: | | | | |
| Net realized gain on investments | | | 168,572 | |
| Net realized loss on securities sold short | | | (60 | ) |
| Net realized loss on futures contracts | | | (461 | ) |
| Net realized gain on swap contracts | | | 185 | |
| Net realized gain on foreign currency contracts | | | 41 | |
| Net realized gain on other foreign currency transactions | | | 6 | |
| Net Realized Gain on Investments, Other Financial Instruments and Foreign Currency Transactions | | | 168,283 | |
| | | | | |
| Net Changes in Unrealized Depreciation of Investments, Other Financial Instruments and Foreign Currency Transactions: | | | | |
| Net unrealized depreciation of investments | | | (20,979 | ) |
| Net unrealized depreciation of securities sold short | | | (4 | ) |
| Net unrealized appreciation of futures contracts | | | 217 | |
| Net unrealized depreciation of swap contracts | | | (158 | ) |
| Net unrealized depreciation on translation of other assets and liabilities in foreign currencies | | | (1 | ) |
| Net Changes in Unrealized Depreciation of Investments, Other Financial Instruments and Foreign Currency Transactions | | | (20,925 | ) |
| Net Gain on Investments, Other Financial Instruments and Foreign Currency Transactions | | | 147,358 | |
| Net Increase in Net Assets Resulting from Operations | | $ | 175,325 | |
The accompanying notes are an integral part of these financial statements.
| Hartford Balanced HLS Fund |
| Statement of Changes in Net Assets |
| |
| (000’s Omitted) |
| | | For the
Six-Month
Period Ended
June 30, 2014
(Unaudited) | | | For the
Year Ended
December 31,
2013 | |
| Operations: | | | | | | | | |
| Net investment income | | $ | 27,967 | | | $ | 55,047 | |
| Net realized gain on investments, other financial instruments and foreign currency transactions | | | 168,283 | | | | 249,371 | |
| Net unrealized appreciation (depreciation) of investments, other financial instruments and foreign currency transactions | | | (20,925 | ) | | | 311,490 | |
| Net Increase in Net Assets Resulting from Operations | | | 175,325 | | | | 615,908 | |
| Distributions to Shareholders: | | | | | | | | |
| From net investment income | | | | | | | | |
| Class IA | | | — | | | | (40,827 | ) |
| Class IB | | | — | | | | (4,827 | ) |
| Total distributions | | | — | | | | (45,654 | ) |
| Capital Share Transactions: | | | | | | | | |
| Class IA | | | | | | | | |
| Sold | | | 7,873 | | | | 66,768 | |
| Issued on reinvestment of distributions | | | — | | | | 40,827 | |
| Redeemed | | | (250,261 | ) | | | (576,929 | ) |
| Total capital share transactions | | | (242,388 | ) | | | (469,334 | ) |
| Class IB | | | | | | | | |
| Sold | | | 948 | | | | 32,394 | |
| Issued on reinvestment of distributions | | | — | | | | 4,827 | |
| Redeemed | | | (38,682 | ) | | | (116,032 | ) |
| Total capital share transactions | | | (37,734 | ) | | | (78,811 | ) |
| Net decrease from capital share transactions | | | (280,122 | ) | | | (548,145 | ) |
| Net Increase (Decrease) in Net Assets | | | (104,797 | ) | | | 22,109 | |
| Net Assets: | | | | | | | | |
| Beginning of period | | | 3,182,379 | | | | 3,160,270 | |
| End of period | | $ | 3,077,582 | | | $ | 3,182,379 | |
| Undistributed (distribution in excess of) net investment income | | $ | 38,073 | | | $ | 10,106 | |
| Shares: | | | | | | | | |
| Class IA | | | | | | | | |
| Sold | | | 309 | | | | 2,884 | |
| Issued on reinvestment of distributions | | | — | | | | 1,648 | |
| Redeemed | | | (9,814 | ) | | | (24,684 | ) |
| Total share activity | | | (9,505 | ) | | | (20,152 | ) |
| Class IB | | | | | | | | |
| Sold | | | 37 | | | | 1,370 | |
| Issued on reinvestment of distributions | | | — | | | | 192 | |
| Redeemed | | | (1,500 | ) | | | (4,918 | ) |
| Total share activity | | | (1,463 | ) | | | (3,356 | ) |
The accompanying notes are an integral part of these financial statements.
| Hartford Balanced HLS Fund |
| Notes to Financial Statements |
| June 30, 2014 (Unaudited) |
| (000’s Omitted) |
Organization:
Hartford Balanced HLS Fund (the "Fund") serves as an underlying investment option for certain variable annuity and variable life insurance separate accounts of Hartford Life Insurance Company (“HLIC”) and its affiliates and certain qualified retirement plans. The Fund may also serve as an underlying investment option for certain variable annuity and variable life separate accounts of other insurance companies. Owners of variable annuity contracts and policyholders of variable life insurance contracts may choose the funds permitted in the variable insurance contract prospectus. In addition, participants in certain qualified retirement plans may choose the Fund if permitted by their plans.
Hartford Series Fund, Inc. (the “Company”) is an open-end registered management investment company comprised of twenty-eight portfolios. Financial statements for the Fund, a series of the Company, are included in this report.
The Company is organized under the laws of the State of Maryland and is registered with the Securities and Exchange Commission (“SEC”) under the Investment Company Act of 1940, as amended (“1940 Act”). The Fund is a diversified open-end management investment company.
The Fund is divided into Class IA, Class IB and Class IC shares. Each class is offered at the per share net asset value (“NAV”) without a sales charge and is subject to the same expenses, except that the Class IB shares are subject to distribution and service fees charged pursuant to a Distribution Plan adopted in accordance with Rule 12b-1 under the 1940 Act and Class IC shares are subject to distribution fees charged pursuant to a Distribution Plan adopted in accordance with Rule 12b-1 under the 1940 Act and are also subject to an administrative service fee. Class IC shares have not commenced operations and are not currently offered for sale as of the date of this report.
Significant Accounting Policies:
The following is a summary of significant accounting policies of the Fund in the preparation of its financial statements, which are in accordance with United States Generally Accepted Accounting Principles (“U.S. GAAP”). The preparation of financial statements in accordance with U.S. GAAP may require management to make estimates and assumptions that affect the reported amounts of assets and liabilities and disclosure of contingent assets and liabilities at the date of the financial statements and the reported amounts of increases and decreases in net assets from operations during the reporting period. Actual results could differ from those estimates.
Determination of Net Asset Value – The NAV of each class of the Fund's shares is determined as of the close of regular trading (normally 4:00 p.m. Eastern Time) (the “NYSE Close”) on each day that the New York Stock Exchange (the “Exchange”) is open (“Valuation Date”). Information that becomes known to the Fund after the NAV has been calculated on a particular day will not generally be used to retroactively adjust the NAV determined earlier that day.
Investment Valuation and Fair Value Measurements – For purposes of calculating the NAV, portfolio investments and other assets held by the Fund's portfolio for which market quotes are readily available are valued at market value. Market value is generally determined on the basis of last reported sales prices or official close price. If no sales are reported, market value is based on quotes obtained from a quotation reporting system, established market makers, or independent pricing services. If market prices are not readily available or are deemed unreliable, the Fund will use the fair value of the investment as determined in good faith under policies and procedures established by and under the supervision of the Company's Board of Directors. Market quotes are considered not readily available where there is an absence of current or reliable market-based data (e.g., trade information or indicative market quotes), including where events occur after the close of the relevant market, but prior to the NYSE Close, that materially affect the values of the Fund's portfolio investments or assets. In addition, market quotes are considered not readily available when, due to extraordinary circumstances, the exchanges or markets on which the investments trade do not open for trading for the entire day and no other market prices are available. In addition, prices of foreign equities that are principally traded on certain foreign markets may be adjusted daily pursuant to a fair value pricing service approved by the Board of Directors in order to reflect an adjustment for the factors occurring after the close of certain foreign markets but before the NYSE Close. Investments that are primarily traded on foreign markets may trade on days that are not business days of the Fund. The value of the foreign investments in which the Fund invests may change on days when a shareholder will not be able to purchase or redeem shares of the Fund. Fair value pricing is subjective in nature and the use of fair value pricing by the Fund may cause the NAV of its shares to differ significantly from the NAV
| Hartford Balanced HLS Fund |
| Notes to Financial Statements – (continued) |
| June 30, 2014 (Unaudited) |
| (000’s Omitted) |
that would have been calculated using market prices at the close of the exchange on which a portfolio investment is primarily traded. There can be no assurance that the Fund could obtain the fair market value assigned to an investment if the Fund were to sell the investment at approximately the time at which the Fund determines its NAV.
Fixed income investments (other than short-term obligations), non-exchange traded derivatives and centrally cleared swaps held by the Fund are normally valued on the basis of quotes obtained from independent pricing services or brokers and dealers in accordance with procedures established by the Company's Board of Directors. Prices obtained from independent pricing services use information provided by market makers or estimates of market values through accepted market modeling, trading and pricing conventions. Inputs to the models may include, but are not limited to, prepayment speeds, pricing spread, yield, trade information, dealer quotes, market color, cash flow models and the investment’s terms and conditions. Generally, the Fund may use fair valuation in regard to fixed income investments when the Fund holds defaulted or distressed investments or investments in a company in which a reorganization is pending. Short-term investments maturing in 60 days or less are generally valued at amortized cost, if their original term to maturity was 60 days or less, or by amortizing their value on the 61st day prior to maturity, if the original term to maturity exceeded 60 days.
Exchange traded options, futures and options on futures are valued at the settlement price or last trade price determined by the relevant exchange as of the NYSE Close. If the last trade price for exchange traded options does not fall between the bid and ask prices, the value will be the mean of the bid and ask prices as of the NYSE Close. If a last trade price is not available, the value will be the mean of the bid and ask prices as of the NYSE Close. If a mean of the bid and ask prices cannot be calculated for the day, the value will be the bid price as of the NYSE Close. In the case of over-the-counter ("OTC") options and such instruments that do not trade on an exchange, values may be supplied by a pricing service using a formula or other objective method that may take into consideration the style, direction, expiration, strike price, notional value and volatility or other special adjustments.
Investments valued in currencies other than U.S. dollars are converted to U.S. dollars using exchange rates obtained from independent pricing services for calculation of the NAV. As a result, the NAV of the Fund’s shares may be affected by changes in the value of currencies in relation to the U.S. dollar. The value of investments traded in markets outside the United States or denominated in currencies other than the U.S. dollar may be affected significantly on a day that the NYSE is closed and the market value may change on days when an investor is not able to purchase, redeem or exchange shares of the Fund.
Foreign currency contracts represent agreements to exchange currencies on specific future dates at predetermined rates. Foreign currency contracts are valued using foreign currency exchange rates and forward rates as provided by an independent pricing service on the Valuation Date.
Financial instruments for which prices are not available from an independent pricing service may be valued using market quotations obtained from one or more dealers that make markets in the respective financial instrument in accordance with procedures established by the Company's Board of Directors.
U.S. GAAP defines fair value as the price that the Fund would receive to sell an asset or pay to transfer a liability in an orderly transaction between market participants. The U.S. GAAP fair value measurement standards require disclosure of a fair value hierarchy for each major category of assets and liabilities. Various inputs are used in determining the fair value of the Fund’s investments. These inputs are summarized into three broad hierarchy levels. This hierarchy is based on whether the valuation inputs are observable or unobservable. These levels are:
Level 1 – Quoted prices in active markets for identical investments. Level 1 may include exchange traded instruments, such as domestic equities, some foreign equities, options, futures, mutual funds, exchange traded funds, rights and warrants.
Level 2 – Observable inputs other than Level 1 prices, such as quoted prices for similar investments; quoted prices in markets that are not active; or other inputs that are observable or can be corroborated by observable market data. Level 2 may include debt investments that are traded less frequently than exchange traded instruments and which are valued using independent pricing services; foreign equities, which are principally traded on certain foreign markets and are adjusted daily pursuant to a fair value pricing service in order to reflect an adjustment for the factors occurring after the close of certain foreign markets but before the NYSE Close; senior floating rate interests, which are valued using an aggregate of dealer bids; short-term investments, which are valued at amortized cost; and swaps, which are valued based upon the terms of each swap contract.
| Hartford Balanced HLS Fund |
| Notes to Financial Statements – (continued) |
| June 30, 2014 (Unaudited) |
| (000’s Omitted) |
Level 3 – Significant unobservable inputs that are supported by limited or no market activity. Level 3 may include financial instruments whose values are determined using indicative market quotes or require significant management judgment or estimation. These unobservable valuation inputs may include estimates for current yields, maturity/duration, prepayment speed, and indicative market quotes for comparable investments along with other assumptions relating to credit quality, collateral value, complexity of the investment structure, general market conditions and liquidity. This category may include investments where trading has been halted or there are certain restrictions on trading. While these investments are priced using unobservable inputs, the valuation of these investments reflects the best available data and management believes the prices are a reasonable representation of exit price.
The Board of Directors of the Company generally reviews and approves the “Procedures for Valuation of Portfolio Securities” at least once a year. These procedures define how investments are to be valued, including the formation and activities of a Valuation Committee. The Valuation Committee is responsible for determining in good faith the fair value of investments when the value cannot be obtained from primary pricing services or alternative sources or if the valuation of an investment as provided by the primary pricing service or alternative source is believed not to reflect the investment’s fair value as of the Valuation Date. Voting members of the Valuation Committee include the Fund's Treasurer or designee and a Vice President of the investment manager or designee. An Assistant Vice President of the Fund with legal expertise or designee is also included on the Valuation Committee as a non-voting advisory member. In addition, the Fund’s Chief Compliance Officer shall designate a member of the compliance group to attend Valuation Committee meetings as a non-voting resource, to monitor for and provide guidance with respect to compliance with these procedures. Two members of the Valuation Committee or their designees, representing different departments, shall constitute a quorum for purposes of permitting the Valuation Committee to take action. The Valuation Committee will consider all relevant factors in determining an investment’s fair value, and may seek the advice of the Fund’s sub-adviser, knowledgeable brokers, and legal counsel in making such determination. The Valuation Committee reports to the Audit Committee of the Company's Board of Directors. The Audit Committee receives quarterly written reports which include details of all fair-valued investments, including the reason for the fair valuation, and an indication, when possible, of the accuracy of the valuation by disclosing the next available reliable public price quotation or the disposition price of such investments (the “look-back” test). The Board of Directors then must consider for ratification all of the fair value determinations made during the previous quarter.
Valuation levels are not necessarily indicative of the risk associated with investing in such investments. Individual investments within any of the above mentioned asset classes may be assigned a different hierarchical level than those presented above, as individual circumstances dictate.
For additional information, refer to the Investment Valuation Hierarchy Level Summary and the Level 3 roll-forward reconciliation, if applicable, which follow the Schedule of Investments.
Investment Transactions and Investment Income – Investment transactions are recorded as of the trade date (the date the order to buy or sell is executed) for financial reporting purposes. Investments purchased or sold on a when-issued or delayed-delivery basis may be settled a month or more after the trade date. Realized gains and losses are determined on the basis of identified cost.
Dividend income from domestic securities is accrued on the ex-dividend date. In general, dividend income from foreign securities is recorded on the ex-date; however, dividend notifications in certain foreign jurisdictions may not be available in a timely manner and as a result, the Fund will record the dividend as soon as the relevant details (i.e., rate per share, payment date, shareholders of record, etc.) are publicly available. Interest income, including amortization of premium, accretion of discounts and additional principal received in-kind in lieu of cash, is accrued on a daily basis. Paydown gains and losses on mortgage related and other asset backed securities are included in interest income in the Statement of Operations, as applicable.
Foreign Currency Transactions – Assets and liabilities denominated in currencies other than U.S. dollars are translated into U.S. dollars at the exchange rates in effect on the valuation date. Purchases and sales of investments, income and expenses are translated into U.S. dollars at the exchange rates on the dates of such transactions.
| Hartford Balanced HLS Fund |
| Notes to Financial Statements – (continued) |
| June 30, 2014 (Unaudited) |
| (000’s Omitted) |
The Fund does not isolate that portion of portfolio investment valuation resulting from fluctuations in the foreign currency exchange rates from the fluctuations arising from changes in the market prices of investments held. Exchange rate fluctuations are included with the net realized and unrealized gain or loss on investments in the accompanying financial statements.
Net realized foreign exchange gains or losses arise from sales of foreign currencies and the difference between asset and liability amounts initially stated in foreign currencies and the U.S. dollar value of the amounts actually received or paid. Net unrealized foreign exchange gains or losses arise from changes in the value of other assets and liabilities at the end of the reporting period, resulting from changes in the exchange rates.
Joint Trading Account – The Fund may invest cash balances into a joint trading account that may be invested in one or more repurchase agreements.
Fund Share Valuation and Dividend Distributions to Shareholders – Orders for the Fund’s shares are executed in accordance with the investment instructions of the contract holders and plan participants. The NAV of the Fund’s shares is determined as of the close of business on each business day of the Exchange. The NAV is determined separately for each class of shares of the Fund by dividing the Fund’s net assets attributable to that class by the number of shares of the class outstanding. Each class of shares offered by the Fund has equal rights as to assets and voting privileges (except that shareholders of a class have exclusive voting rights regarding any matter relating solely to that class of shares). Income and non-class specific expenses are allocated daily to each class on the basis of the relative net assets of the class. Realized and unrealized gains and losses are allocated daily based on the relative net assets of each class of shares of the Fund.
Orders for the purchase of the Fund’s shares received prior to the close of the Exchange on any day the Exchange is open for business are priced at the NAV determined as of the close of the Exchange. Orders received after the close of the Exchange, or on a day on which the Exchange and/or the Fund is not open for business, are priced at the next determined NAV.
Dividends are declared pursuant to a policy adopted by the Company's Board of Directors based upon the investment performance of the Fund. The policy of the Fund is to pay dividends from net investment income and realized gains, if any, at least once a year.
Distributions from net investment income, net realized gains and capital are determined in accordance with federal income tax regulations, which may differ from U.S. GAAP with respect to character and timing. These differences may include, but are not limited to, losses deferred due to wash sale adjustments, foreign currency gains and losses, adjustments related to Passive Foreign Investment Companies ("PFICs"), Real Estate Investment Trusts ("REITs"), Regulated Investment Companies ("RICs"), certain derivatives and partnerships. Permanent book and federal income tax basis differences relating to shareholder distributions will result in reclassifications to certain of the Fund’s capital accounts (see Federal Income Taxes: Reclassification of Capital Accounts note).
Securities and Other Investments:
Repurchase Agreements – A repurchase agreement is an agreement by which a counterparty agrees to sell an investment and agrees to repurchase the investment sold from the buyer at a mutually agreed upon time and price. During the period of the repurchase agreement, the counterparty will deposit cash and or securities in a third party custodial account to serve as collateral. At the time the Fund enters into a repurchase agreement, the value of the underlying collateral, including accrued interest, will be equal to or exceed the value of the repurchase agreement. Repurchase agreements expose the Fund to counterparty risk - that is, the risk that the counterparty will not fulfill its obligations. To minimize counterparty risk, the investments that serve to collateralize the repurchase agreement are held by the Fund’s custodian in book entry or physical form in the custodial account of the Fund or in a third party custodial account. Repurchase agreements are valued at cost plus accrued interest, which approximates fair value. Repurchase agreements have master netting arrangements which allow the Fund to offset amounts owed to a counterparty with amounts owed by the counterparty, including any collateral. Upon an event of default under a master repurchase agreement, the non-defaulting party may close out all transactions traded under such agreement and net amounts owed under each transaction to one net amount payable by one party to the other. Absent an event of default, the master repurchase agreement does not result in an offset of reported amounts of assets and liabilities in the Statement of Assets and Liabilities across transactions between the Fund and the applicable counterparty. The Fund, as shown on the Schedule of Investments, had outstanding repurchase agreements and related collateral as of June 30, 2014.
| Hartford Balanced HLS Fund |
| Notes to Financial Statements – (continued) |
| June 30, 2014 (Unaudited) |
| (000’s Omitted) |
Illiquid and Restricted Investments – The Fund is permitted to invest up to 15% of its net assets in illiquid investments. Illiquid investments are those that may not be sold or disposed of in the ordinary course of business within seven days, at approximately the price used to determine the Fund’s NAV. The Fund may not be able to sell illiquid investments when its sub-adviser considers it desirable to do so or may have to sell such investments at a price that is lower than the price that could be obtained if the investments were more liquid. A sale of illiquid investments may require more time and may result in higher dealer discounts and other selling expenses than does the sale of those that are liquid. Illiquid investments also may be more difficult to value due to the unavailability of reliable market quotations for such investments, and an investment in them may have an adverse impact on the Fund’s NAV. The Fund may also purchase certain restricted investments that can only be resold to certain qualified investors and may be determined to be liquid pursuant to policies and guidelines established by the Company's Board of Directors. The Fund, as shown on the Schedule of Investments, had illiquid or restricted investments as of June 30, 2014.
Investments Purchased on a When-Issued or Delayed-Delivery Basis – Delivery and payment for investments that have been purchased by the Fund on a forward commitment, or when-issued or delayed-delivery basis, take place beyond the customary settlement period. The Fund may dispose of or renegotiate a delayed-delivery transaction after it is entered into, and may sell delayed-delivery investments before they are delivered, which may result in a realized gain or loss. During this period, such investments are subject to market fluctuations, and the Fund identifies investments segregated in its records with a value at least equal to the amount of the commitment. The Fund, as shown on the Schedule of Investments, had when-issued or delayed-delivery investments as of June 30, 2014.
In connection with the Fund’s ability to purchase investments on a when-issued or forward commitment basis, the Fund may enter into to-be announced (“TBA”) commitments. TBA commitments are forward agreements for the purchase or sale of mortgage backed securities for a fixed price, with payment and delivery on an agreed-upon future settlement date. The specific securities to be delivered are not identified at the trade date; however, delivered securities must meet specified terms, including issuer, rate and mortgage terms. Although the Fund may enter into TBA commitments with the intention of acquiring or delivering securities for its portfolio, the Fund can extend the settlement date, roll the transaction, or dispose of a commitment prior to settlement if deemed appropriate to do so. If the TBA commitment is closed through the acquisition of an offsetting TBA commitment, the Fund realizes a gain or loss. In a TBA roll transaction, the Fund generally purchases or sells the initial TBA commitment prior to the agreed upon settlement date and enters into a new TBA commitment for future delivery or receipt of the mortgage backed securities. TBA commitments involve a risk of loss if the value of the security to be purchased or sold declines or increases, respectively, prior to settlement date.
The Fund may enter into “dollar rolls” in which the Fund sells securities and contracts with the same counterparty to repurchase substantially similar securities (for example, same issuer, coupon and maturity) on a specified future date at an agreed upon price. The Fund gives up the right to receive interest paid on the investments sold. The Fund would benefit to the extent of any differences between the price received for the security and the lower forward price for the future purchase. Dollar rolls involve the risk that the market value of the securities that the Fund is required to purchase may decline below the agreed upon repurchase price of those securities. The Fund records dollar roll transactions as purchases and sales and realizes gains and losses on these transactions. These transactions are excluded from the Fund’s portfolio turnover rate. The Fund had no open dollar roll transactions as of June 30, 2014.
Mortgage Related and Other Asset Backed Securities – The Fund may invest in mortgage related and other asset backed securities. These securities include mortgage pass-through securities, collateralized mortgage obligations, commercial mortgage backed securities, stripped mortgage backed securities, asset backed securities, collateralized debt obligations and other securities that directly or indirectly represent a participation in, or are secured by and payable from, mortgage loans on real property. Mortgage related securities are created from pools of residential or commercial mortgage loans, including mortgage loans made by savings and loan institutions, mortgage bankers, commercial banks and others. Asset backed securities are created from many types of assets, including auto loans, credit card receivables, home equity loans, and student loans. These securities provide a monthly payment that consists of both interest and principal payments. Interest payments may be determined by fixed or adjustable rates. The rate of pre-payments on underlying mortgages will affect the price and volatility of a mortgage related security, and may have the effect of shortening or extending the effective duration of the security relative to what was anticipated at the time of purchase. The timely payment of principal and interest of certain mortgage related securities is guaranteed by the full faith and credit of the United States Government. Mortgage related and other asset backed securities created and guaranteed by non-governmental issuers, including
| Hartford Balanced HLS Fund |
| Notes to Financial Statements – (continued) |
| June 30, 2014 (Unaudited) |
| (000’s Omitted) |
government-sponsored corporations, may be supported by various forms of insurance or guarantees, but there can be no assurance that the private insurers or guarantors can meet their obligations under the insurance policies or guarantee arrangements. The Fund, as shown on the Schedule of Investments, had outstanding mortgage related and other asset backed securities as of June 30, 2014.
Financial Derivative Instruments:
The following disclosures contain information on how and why the Fund uses derivative instruments, the credit-risk-related contingent features in certain derivative instruments, and how derivative instruments affect the Fund’s financial position and results of operations. The location and fair value amounts of these instruments on the Statement of Assets and Liabilities and the realized gains and losses and changes in unrealized gains and losses on the Statement of Operations, each categorized by type of derivative contract, are included in the following Additional Derivative Instrument Information footnote. The derivative instruments outstanding as of period-end are disclosed in the notes to or within the Schedule of Investments for purchased options, if applicable. The amounts of realized gains and losses and changes in unrealized gains and losses on derivative instruments during the period are disclosed in the Statement of Operations.
Foreign Currency Contracts – The Fund may enter into foreign currency contracts that obligate the Fund to purchase or sell currencies at specified future dates. Foreign currency contracts are used to hedge the currency exposure associated with some or all of the Fund’s investments and/or as part of an investment strategy. Foreign currency contracts are marked to market daily and the change in value is recorded by the Fund as an unrealized gain or loss. The Fund will record a realized gain or loss when the foreign currency contract is settled.
Foreign currency contracts involve elements of market risk in excess of the amounts reflected in the Statement of Assets and Liabilities. In addition, risks may arise upon entering into these contracts from the potential inability of the counterparties to meet the terms of the contracts and from unanticipated movements in the value of the foreign currencies relative to the U.S. dollar. The Fund had no outstanding foreign currency contracts as of June 30, 2014.
Futures Contracts – The Fund may enter into futures contracts. A futures contract is an agreement between two parties to buy or sell an asset at a set price on a future date. The Fund uses futures contracts to manage or obtain exposure to the investment markets, commodities, or movements in interest rates and currency values. The primary risks associated with the use of futures contracts are the imperfect correlation between the change in market value of the investments held by the Fund and the prices of futures contracts and the possibility of an illiquid market. Upon entering into a futures contract, the Fund is required to deposit with a futures commission merchant (“FCM”) an amount of cash or U.S. Government or Agency Obligations in accordance with the initial margin requirements of the broker or exchange. Futures contracts are marked to market daily at the most recent settlement price reported by an exchange on which, over time, they are traded most extensively, and an appropriate payable or receivable for the change in value (“variation margin”) is recorded by the Fund. Gains or losses are recognized but not considered realized until the contracts expire or are closed. Futures contracts involve, to varying degrees, risk of loss in excess of the variation margin disclosed on the Statement of Assets and Liabilities; however, the Fund seeks to reduce this risk through the use of an FCM. The Fund, as shown on the Schedule of Investments, had outstanding futures contracts as of June 30, 2014.
Swap Contracts – The Fund may invest in swap contracts. Swap contracts are agreements to exchange or swap investment cash flows, assets, foreign currencies or market-linked returns at specified, future intervals. Swap contracts are either privately negotiated in the over-the-counter market (“OTC swaps”) or executed in a multilateral or other trade facility platform, such as a registered exchange (“centrally cleared swaps”). The Fund may enter into credit default, total return, cross-currency, interest rate, inflation and other forms of swap contracts to manage its exposure to credit, currency, interest rate, commodity and inflation risk. Swap contracts are also used to gain exposure to certain markets. In connection with these contracts, investments or cash may be identified as collateral or margin in accordance with the terms of the respective swap contracts and/or master netting arrangement to provide assets of value and recourse in the event of default or bankruptcy/insolvency.
Swaps are valued based on custom valuations furnished by an independent pricing service. Swaps for which prices are not available from an independent pricing service are valued in accordance with procedures established by the Company's Board of Directors. Changes in market value, if any, are reflected as a component of net changes in unrealized appreciation or depreciation on the Statement of Operations. Daily changes in valuation of centrally cleared swaps, if any, are recorded as a receivable or payable for the change in value as appropriate (“variation margin”) on the Statement of Assets and Liabilities. Realized gains or losses on centrally
| Hartford Balanced HLS Fund |
| Notes to Financial Statements – (continued) |
| June 30, 2014 (Unaudited) |
| (000’s Omitted) |
cleared swaps are recorded upon the termination of the swap. OTC swap payments received or made at the beginning of the measurement period are reflected as such on the Statement of Assets and Liabilities and represent premiums paid or received upon entering into the swap contract to compensate for differences between the stated terms of the swap contract and prevailing market conditions (credit spreads, currency exchange rates, interest rates and other relevant factors). These upfront premiums are recorded as realized gains or losses on the Statement of Operations upon termination or maturity of the swap. A liquidation payment received or made at the termination or maturity of the swap is recorded as a realized gain or loss on the Statement of Operations. Net periodic payments received or paid by the Fund are included as part of realized gains or losses on the Statement of Operations.
Entering into these contracts involves, to varying degrees, elements of liquidation, counterparty, credit and market risk in excess of the amounts recognized on the Statement of Assets and Liabilities. Such risks involve the possibility that there will be no liquid market for these contracts, that the counterparty to the contracts may default on its obligation to perform or disagree as to the meaning of contractual terms in the contracts, and that there may be unfavorable changes in market conditions (credit spreads, currency exchange rates, interest rates and other relevant factors).
The Fund’s maximum risk of loss from credit risk for OTC swaps is the net value of the discounted cash flows to be received from the counterparty over the contract’s remaining life, and current market value, to the extent that amount is positive. The risk is mitigated by having a master netting arrangement between the Fund and the counterparty, which allows for the netting of payments made or received (although such amounts are presented on a gross basis within the Statement of Assets and Liabilities, as applicable) as well as the posting of collateral to the Fund to cover the Fund’s exposure to the counterparty. In a centrally cleared swap, while the Fund enters into an agreement with a clearing broker to execute contracts with a counterparty, the performance of the swap is guaranteed by the central clearinghouse, which reduces the Fund’s exposure to credit risk. The Fund is still exposed to the credit risk of the clearing broker and clearinghouse. The clearinghouse attempts to minimize this risk to all of its participants through the use of mandatory margin requirements, daily cash settlements, and other procedures designed to protect counterparties utilizing the clearinghouse. Likewise, the clearing broker reduces its risk through margin requirements and required segregation of customer balances.
Credit Default Swap Contracts – The credit default swap market allows the Fund to manage its exposure to the market or certain sectors of the market, to reduce its risk exposure to defaults of corporate and sovereign issuers, or to create exposure to corporate or sovereign issuers to which it is not otherwise exposed. Certain credit default swaps involve the exchange of a fixed rate premium for protection against the loss in value of an underlying investment or index in the event of a credit event, such as payment default or bankruptcy.
Under a credit default swap contract, one party acts as guarantor by receiving the fixed periodic payment in exchange for the commitment to purchase the underlying investment at par if the defined credit event occurs. Upon the occurrence of a defined credit event, the difference between the value of the reference obligation and the swap’s notional amount is recorded as realized gain or loss on swap transactions in the Statement of Operations. A “buyer” of credit protection agrees to pay a counterparty to assume the credit risk of an issuer upon the occurrence of certain events. The “seller” of the protection receives periodic payments and agrees to assume the credit risk of an issuer upon the occurrence of certain events. Although specified events are contract specific, credit events are generally defined as bankruptcy, failure to pay, restructuring, obligation acceleration, obligation default or repudiation/moratorium. A “seller’s” exposure is limited to the total notional amount of the credit default swap contract. These potential amounts would be partially offset by any recovery values of the respective referenced obligations or upfront payments received upon entering into the contract.
Implied credit spreads, represented in absolute terms, utilized in determining the market value of credit default swap contracts on corporate issues, sovereign government issues or U.S. municipal issues as of six-month period-end are disclosed in the notes to the Schedule of Investments, as applicable, and serve as an indicator of the current status of the payment/performance risk and represent the likelihood or risk of default for the credit derivative. The implied credit spread of a particular referenced entity reflects the cost of buying/selling protection and may include upfront payments required to be made to enter into the contract. Wider credit spreads represent a deterioration of the referenced entity’s credit soundness and a greater likelihood or risk of default or other credit event occurring as defined under the terms of the contract. For credit default swap contracts on asset backed securities and credit indices, the quoted market prices and resulting values serve as the indicator of the current status of the payment/performance risk. Increasing market values, in absolute terms when compared to the notional amount of the swap, represent a deterioration of the referenced
| Hartford Balanced HLS Fund |
| Notes to Financial Statements – (continued) |
| June 30, 2014 (Unaudited) |
| (000’s Omitted) |
equity’s credit soundness and a greater likelihood or risk of default or other credit event occurring as defined under the terms of the contract. The Fund had no outstanding credit default swap contracts as of June 30, 2014.
Additional Derivative Instrument Information:
Fair Value of Derivative Instruments on the Statement of Assets and Liabilities as of June 30, 2014:
| | | Risk Exposure Category | |
| | | Interest Rate
Contracts | | | Foreign
Exchange
Contracts | | | Credit
Contracts | | | Equity
Contracts | | | Commodity
Contracts | | | Other
Contracts | | | Total | |
| Assets: | | | | | | | | | | | | | | | | | | | | | | | | | | | | |
| Variation margin receivable * | | $ | 53 | | | $ | — | | | $ | — | | | $ | — | | | $ | — | | | $ | — | | | $ | 53 | |
| Total | | $ | 53 | | | $ | — | | | $ | — | | | $ | — | | | $ | — | | | $ | — | | | $ | 53 | |
* Only current day's variation margin is reported within the Statement of Assets and Liabilities. The variation margin is included in the open futures
cumulative appreciation of $217 as reported in the Schedule of Investments.
The volume of derivatives that is presented in the Schedule of Investments is consistent with the derivative activity during the six-month period ended June 30, 2014.
| The Effect of Derivative Instruments on the Statement of Operations for the six-month period ended June 30, 2014: |
| | | Risk Exposure Category | |
| | | Interest Rate
Contracts | | | Foreign
Exchange
Contracts | | | Credit
Contracts | | |
Equity
Contracts | | | Commodity
Contracts | | | Other
Contracts | | | Total | |
| Realized Gain (Loss) on Derivatives Recognized as a Result of Operations: |
| Net realized loss on futures contracts | | $ | (461 | ) | | $ | — | | | $ | — | | | $ | — | | | $ | — | | | $ | — | | | $ | (461 | ) |
| Net realized gain on swap contracts | | | — | | | | — | | | | 185 | | | | — | | | | — | | | | — | | | | 185 | |
| Net realized gain on foreign currency contracts | | | — | | | | 41 | | | | — | | | | — | | | | — | | | | — | | | | 41 | |
| Total | | $ | (461 | ) | | $ | 41 | | | $ | 185 | | | $ | — | | | $ | — | | | $ | — | | | $ | (235 | ) |
| | | | | | | | | | | | | | | | | | | | | | | | | | | | | |
| Net Change in Unrealized Appreciation (Depreciation) on Derivatives Recognized as a Result of Operations: |
| Net change in unrealized appreciation of futures contracts | | $ | 217 | | | $ | — | | | $ | — | | | $ | — | | | $ | — | | | $ | — | | | $ | 217 | |
| Net change in unrealized depreciation of swap contracts | | | — | | | | — | | | | (158 | ) | | | — | | | | — | | | | — | | | | (158 | ) |
| Total | | $ | 217 | | | $ | — | | | $ | (158 | ) | | $ | — | | | $ | — | | | $ | — | | | $ | 59 | |
Balance Sheet Offsetting Information - Set forth below are tables which disclose both gross information and net information about instruments and transactions eligible for offset in the financial statements, and instruments and transactions that are subject to a master netting arrangement, as well as amounts related to margin, reflected as financial collateral (including cash collateral), held at clearing brokers, counterparties and the Fund’s custodian. The master netting arrangements allow the clearing brokers to net any collateral held in or on behalf of the Fund, or liabilities or payment obligations of the clearing brokers to the Fund, against any liabilities or payment obligations of the Fund to the clearing brokers. The Fund is required to deposit financial collateral (including cash collateral) at the Futures Commission Merchant's ("FCM") custodian on behalf of clearing brokers and counterparties to continually meet the original and maintenance requirements established by the clearing brokers and counterparties. Such requirements are specific to the respective clearing broker or counterparty. Certain master netting arrangements may not be enforceable in a bankruptcy.
| Hartford Balanced HLS Fund |
| Notes to Financial Statements – (continued) |
| June 30, 2014 (Unaudited) |
| (000’s Omitted) |
| Offsetting of Financial Assets and Derivative Assets as of June 30, 2014: |
| | | Gross Amounts*
of Assets
Presented in
Statement of
Assets and
Liabilities | | | Financial
Instruments with
Allowable Netting | | | Non-cash
Collateral
Received | | | Cash Collateral
Received | | | Net Amount (not
less than $0) | |
| Description | | | | | | | | | | | | | | | | | | | | |
| Futures contracts - Variation margin receivable | | $ | 53 | | | $ | — | | | $ | — | | | $ | — | | | $ | 53 | |
| Total subject to a master netting or similar arrangement | | $ | 53 | | | $ | — | | | $ | — | | | $ | — | | | $ | 53 | |
* Gross amounts presented as no amounts are netted within the Statements of Assets and Liabilities.
Offsetting of Financial Liabilities and Derivative Liabilities as of June 30, 2014:
| | | Gross Amounts*
of Liabilities
Presented in
Statement of
Assets and
Liabilities | | | Financial
Instruments with
Allowable Netting | | | Non-cash
Collateral
Pledged | | | Cash Collateral
Pledged | | | Net Amount (not
less than $0) | |
| Description | | | | | | | | | | | | | | | | | | | | |
| Futures contracts - Variation margin payable | | $ | — | | | $ | — | | | $ | (514 | )† | | $ | — | | | $ | — | |
| Total subject to a master netting or similar arrangement | | $ | — | | | $ | — | | | $ | (514 | ) | | $ | — | | | $ | — | |
| * | Gross amounts presented as no amounts are netted within the Statement of Assets and Liabilities. |
| † | Pledged as initial margin deposit and collateral for daily variation margin loss on open financial derivative contracts held at June 30, 2014. |
Principal Risks:
Credit risk depends largely on the perceived financial health of bond issuers. In general, the credit rating is inversely related to the credit risk of the issuer. Higher rated bonds generally are deemed to have less credit risk, while lower or unrated bonds are deemed to have higher risk of default. The share price, yield and total return of a fund that holds securities with higher credit risk may be more volatile than those of a fund that holds bonds with lower credit risk. Similar to credit risk, the Fund may be exposed to counterparty risk, or the risk that an institution or other entity with which the Fund has unsettled or open transactions will default.
The Fund’s investments expose the Fund to various risks including, but not limited to, interest rate, prepayment, extension, foreign currency and equity risks. Interest rate risk is the risk that fixed income securities will decline in value because of changes in interest rates. As nominal interest rates rise, the values of certain fixed income securities held by the Fund are likely to decrease. A nominal interest rate can be described as the sum of a real interest rate and an expected inflation rate. Fixed income securities with longer durations tend to be more sensitive to changes in interest rates, usually making them more volatile than securities with shorter durations. Duration is useful primarily as a measure of the sensitivity of a fixed income security’s market price to interest rate (i.e., yield) movements. Rising interest rates may cause prepayments to occur at a slower than expected rate, thereby effectively lengthening the maturity of the security and making the security more sensitive to interest rate changes. Prepayment and extension risk are major risks of mortgage backed securities and certain asset backed securities. For certain asset backed securities, the actual maturity may be less than the stated maturity shown in the Schedule of Investments, if applicable. As a result, the timing of income recognition relating to these securities may vary based upon the actual maturity.
If the Fund invests directly in foreign currencies or in securities that trade in, and receive revenues in, foreign currencies, or in derivatives that provide exposure to foreign currencies, it will be subject to the risk that those currencies will decline in value relative to the base currency (U.S. dollars) of the Fund, or, in the case of hedging positions, that the Fund’s base currency will decline in value relative to the currency being hedged. Currency rates in foreign countries may fluctuate significantly over short periods of time for a number of reasons, including changes in interest rates, intervention (or the failure to intervene) by U.S. or foreign governments, central banks or supranational entities, such as the International Monetary Fund, or by the imposition of currency controls or other political developments in the United States or abroad. As a result, the Fund’s investments in foreign currency denominated securities
| Hartford Balanced HLS Fund |
| Notes to Financial Statements – (continued) |
| June 30, 2014 (Unaudited) |
| (000’s Omitted) |
may reduce the returns of the Fund. The market values of equity securities, such as common stocks and preferred stocks, or equity related investments, such as futures and options, may decline due to general market conditions which are not specifically related to a particular company, such as real or perceived adverse economic conditions, changes in the general outlook for corporate earnings, changes in interest or currency rates or adverse investor sentiment generally. The market value of equity securities may also decline due to factors which affect a particular industry or industries, such as labor shortages or increased production costs and competitive conditions within an industry. Equity securities and equity related investments generally have greater market price volatility than fixed income securities.
Federal Income Taxes:
Federal Income Taxes – For federal income tax purposes, the Fund intends to continue to qualify as a RIC under Subchapter M of the Internal Revenue Code (“IRC”) by distributing substantially all of its taxable net investment income and net realized capital gains to its shareholders and otherwise complying with the requirements of the IRC. The Fund has distributed substantially all of its income and capital gains in prior years, if applicable, and intends to distribute substantially all of its income and capital gains prior to the next fiscal year-end. Accordingly, no provision for federal income or excise taxes has been made in the accompanying financial statements. Distributions from short-term capital gains are treated as ordinary income distributions for federal income tax purposes.
Net Investment Income (Loss), Net Realized Gains (Losses) and Distributions – Net investment income (loss) and net realized gains (losses) may differ for financial statement and tax purposes primarily because of losses deferred due to wash sale adjustments, foreign currency gains and losses, adjustments related to PFICs, REITs, RICs, certain derivatives and partnerships. The character of distributions made during the year from net investment income or net realized gains may differ from their ultimate characterization for federal income tax purposes. Also, due to the timing of dividend distributions, the fiscal year in which amounts are distributed may differ from the year that the income or realized gains (losses) were recorded by the Fund.
Distributions and Components of Distributable Earnings – The tax character of distributions paid by the Fund for the periods indicated is as follows (as adjusted for dividends payable, if applicable):
| | | For the Year Ended
December 31, 2013 | | | For the Year Ended
December 31, 2012 | |
| Ordinary Income | | $ | 45,654 | | | $ | 93,156 | |
As of December 31, 2013, the Fund’s components of distributable earnings (deficit) on a tax basis are as follows:
| | | Amount | |
| Undistributed Ordinary Income | | $ | 10,106 | |
| Accumulated Capital and Other Losses* | | | (683,377 | ) |
| Unrealized Appreciation† | | | 727,021 | |
| Total Accumulated Earnings | | $ | 53,750 | |
| * | The Fund has capital loss carryforwards that are identified in the Capital Loss Carryforward note that follows. |
| † | Differences between book-basis and tax-basis unrealized appreciation (depreciation) may be attributable to the losses deferred due to wash sale adjustments, foreign currency gains and losses, adjustments related to PFICs, REITs, RICs, certain derivatives and partnerships. |
| Hartford Balanced HLS Fund |
| Notes to Financial Statements – (continued) |
| June 30, 2014 (Unaudited) |
| (000’s Omitted) |
Reclassification of Capital Accounts – The Fund may record reclassifications in its capital accounts. These reclassifications have no impact on the total net assets of the Fund. The reclassifications are a result of permanent differences between U.S. GAAP and tax accounting for such items as foreign currency, PFICs, expiration or utilization of capital loss carryforwards or net operating losses. Adjustments are made to reflect the impact these items have on current and future distributions to shareholders. Therefore, the source of the Fund’s distributions may be shown in the accompanying Statement of Changes in Net Assets as from undistributed net investment income, from accumulated net realized gains on investments or from capital depending on the type of book and tax differences that exist. For the year ended December 31, 2013, the Fund recorded reclassifications to increase (decrease) the accounts listed below:
| | | Amount | |
| Undistributed Net Investment Income (Loss) | | $ | 49 | |
| Accumulated Net Realized Gain (Loss) | | | (49 | ) |
Capital Loss Carryforward – On December 22, 2010, the Regulated Investment Company Modernization Act of 2010 (the “Act”) was enacted, which made changes to the capital loss carryforward rules. The changes are effective for taxable years beginning after the date of enactment. Under the Act, funds are permitted to carry forward capital losses for an unlimited period. However, any losses incurred during those future taxable years will be required to be utilized prior to the losses incurred in pre-enactment taxable years, which carry an expiration date. As a result of this ordering rule, pre-enactment capital loss carryforwards may be more likely to expire unused. Additionally, post-enactment capital loss carryforwards retain their character as either short-term or long-term capital losses rather than being considered all short-term as permitted under prior regulation.
At December 31, 2013 (tax year end), the Fund had capital loss carryforwards for U.S. federal income tax purposes as follows:
| Year of Expiration | | Amount | |
| 2017 | | $ | 683,377 | |
| Total | | $ | 683,377 | |
During the year ended December 31, 2013, the Fund utilized $242,056 of prior year capital loss carryforwards.
Accounting for Uncertainty in Income Taxes – The Fund has adopted financial reporting rules that require the Fund to analyze all open tax years, as defined by the statute of limitations, for all major jurisdictions. Generally, tax authorities can examine all tax returns filed for the last three years. The Fund does not have an examination in progress.
The Fund has reviewed all open tax years and major jurisdictions and concluded that these financial reporting rules had no effect on the Fund’s financial position or results of operations. There is no tax liability resulting from unrecognized tax benefits relating to uncertain income tax positions taken or expected to be taken on the tax return for the fiscal year ended December 31, 2013. The Fund is also not aware of any tax positions for which it is reasonably possible that the total amounts of unrecognized tax benefits will significantly change in the next twelve months.
Expenses:
Investment Management Agreement – Hartford Funds Management Company, LLC ("HFMC") serves as the Fund’s investment manager pursuant to an Investment Management Agreement with the Company. HFMC is an indirect wholly owned subsidiary of The Hartford Financial Services Group, Inc. ("The Hartford"). The investment manager has overall investment supervisory responsibility for the Fund. In addition, the investment manager provides administrative personnel, services, equipment, facilities and office space for proper operation of the Fund. HFMC has contracted with Wellington Management Company, LLP ("Wellington Management") under a sub-advisory agreement for the provision of day-to-day investment management services to the Fund in accordance with the Fund’s investment objective and policies. The Fund pays a fee to the investment manager, a portion of which may be used to compensate Wellington Management.
| Hartford Balanced HLS Fund |
| Notes to Financial Statements – (continued) |
| June 30, 2014 (Unaudited) |
| (000’s Omitted) |
The schedule below reflects the rates of compensation paid to the investment manager for investment management services rendered as of June 30, 2014; the rates are accrued daily and paid monthly:
| Average Daily Net Assets | Annual Fee |
| On first $250 million | 0.6800% |
| On next $250 million | 0.6550% |
| On next $500 million | 0.6450% |
| On next $4 billion | 0.5950% |
| On next $5 billion | 0.5925% |
| Over $10 billion | 0.5900% |
Accounting Services Agreement – Pursuant to the Fund Accounting Agreement between HFMC and the Company, on behalf of the Fund, HFMC provides accounting services to the Fund and receives monthly compensation based on the Fund’s average daily net assets at the rates set forth below. The Fund’s accounting services fees are accrued daily and paid monthly.
| Average Daily Net Assets | Annual Fee |
| On first $5 billion | 0.016% |
| On next $5 billion | 0.013% |
| Over $10 billion | 0.010% |
Operating Expenses – Allocable expenses incurred by the Company are allocated to each Fund and allocated to classes within a Fund in proportion to the average daily net assets of the Fund and each class, except where allocation of certain expenses is more fairly made directly to the Fund or to specific classes within a Fund.
Fees Paid Indirectly – The Company, on behalf of the Fund, has entered into agreements with State Street Global Markets, LLC and Russell Implementation Services, Inc. to partially recapture non-discounted trade commissions. Such rebates are used to pay a portion of the Fund's expenses. For the six-month period ended June 30, 2014, this amount, if any, is included in the Statement of Operations.
The ratio of expenses to average net assets in the accompanying financial highlights excludes the reduction in expenses related to fees paid indirectly. The annualized expense ratio after waivers for the period listed below reflecting the reduction for fees paid indirectly is as follows:
| | | Annualized Six-
Month Period Ended
June 30, 2014 | |
| Class IA | | | 0.65% | |
| Class IB | | | 0.90 | |
Distribution Plan for Class IB Shares – Hartford Funds Distributors, LLC (“HFD”), an indirect wholly owned subsidiary of The Hartford, is the principal underwriter and distributor of the Fund. The Company, on behalf of the Fund, has adopted a Distribution Plan pursuant to Rule 12b-1 of the 1940 Act for Class IB shares.
The Distribution Plan provides that the Fund may pay annually up to 0.25% of the average daily net assets of the Fund attributable to its Class IB shares for activities primarily intended to result in the sale of Class IB shares. The Board has the authority to suspend or reduce these payments at any point in time. Under the terms of the Distribution Plan and the principal underwriting agreement, the Fund is authorized to make payments monthly to the distributor that may be used to pay or reimburse entities providing distribution and shareholder servicing with respect to the Class IB shares for such entities’ fees or expenses incurred or paid in that regard. The distribution fee paid during the period can be found on the Statement of Operations. These fees are accrued daily and paid monthly.
| Hartford Balanced HLS Fund |
| Notes to Financial Statements – (continued) |
| June 30, 2014 (Unaudited) |
| (000’s Omitted) |
Other Related Party Transactions – Hartford Administrative Services Company (“HASCO”), an indirect wholly owned subsidiary of The Hartford, provides transfer agent services to the Fund. HASCO was compensated on a per account basis for providing such services. The amount paid to HASCO can be found in the Statement of Operations. These fees are accrued daily and paid monthly.
Investment Transactions:
For the six-month period ended June 30, 2014, the cost of purchases and proceeds from sales of investment securities (excluding short-term investments) were as follows:
| | | Excluding U.S.
Government
Obligations | | | U.S.
Government
Obligations | | | Total | |
| Cost of Purchases | | $ | 738,822 | | | $ | 32,687 | | | $ | 771,509 | |
| Sales Proceeds | | | 991,796 | | | | 34,540 | | | | 1,026,336 | |
Line of Credit:
The Fund is one of several Hartford Funds that participate in a $500 million committed revolving line of credit facility. The facility is to be used for temporary or emergency purposes. Under the arrangement, the funds are required to own securities having a market value in excess of 300% of the total bank borrowings. The interest rate on borrowings varies depending on the nature of the loan. The facility also requires a fee to be paid based on the amount of the commitment. This commitment fee is allocated to all the funds participating in the line of credit based on the average net assets of the funds. During the six-month period ended June 30, 2014, the Fund did not have any borrowings under this facility.
Industry Classifications:
Other than the industry classifications "Other Investment Pools and Funds" and "Exchange Traded Funds," equity industry classifications used in this report are the Global Industry Classification Standard, which was developed by and is the exclusive property and service mark of MSCI, Inc. and Standard & Poor's.
Indemnifications:
Under the Company's organizational documents, the Company shall indemnify its officers and directors to the full extent required or permitted under Maryland General Corporation Law and the federal securities laws. In addition, the Company, on behalf of the Fund, may enter into contracts that contain a variety of indemnifications. The Company's maximum exposure under these arrangements is unknown. However, as of the date of these financial statements, the Company has not had prior claims or losses pursuant to these contracts and expects the risk of loss to be remote.
Pending Legal Proceedings:
On February 25, 2011, Jennifer L. Kasilag, Louis Mellinger, Judith M. Menendez, Jacqueline M. Robinson, and Linda A. Russell filed a derivative lawsuit against Hartford Investment Financial Services, LLC (“HIFSCO”) (now known as Hartford Funds Distributors, LLC) on behalf of six Hartford retail mutual funds in the United States District Court for the District of New Jersey, alleging that HIFSCO received excessive advisory and distribution fees in violation of its statutory fiduciary duty under Section 36(b) of the 1940 Act when serving as investment manager and principal underwriter, respectively, to the Hartford retail mutual funds. Although this action was purportedly filed on behalf of certain of the Hartford Funds, none of the Hartford Funds is itself a defendant to the suit. HIFSCO moved to dismiss and, in September 2011, the motion was granted in part and denied in part, with leave to amend the complaint. In November 2011, plaintiffs filed an amended complaint on behalf of certain Hartford retail mutual funds, The Hartford Global Health Fund (now known as The Hartford Healthcare Fund), The Hartford Conservative Allocation Fund, The Hartford Growth Opportunities Fund, The Hartford Inflation Plus Fund, The Hartford Advisers Fund (now known as The Hartford Balanced Fund), and The Hartford Capital Appreciation Fund. Plaintiffs seek to rescind the investment management agreements and distribution plans between HIFSCO and these funds and to recover the total fees charged thereunder or, in the alternative, to recover any improper compensation HIFSCO received, in addition to lost earnings. HIFSCO
| Hartford Balanced HLS Fund |
| Notes to Financial Statements – (continued) |
| June 30, 2014 (Unaudited) |
| (000’s Omitted) |
filed a partial motion to dismiss the amended complaint and, in December 2012, the court dismissed without prejudice the claims regarding distribution fees and denied the motion with respect to the advisory fees claims. HIFSCO disputes the allegations and intends to defend vigorously.
In March 2014, the plaintiffs filed a new complaint that added as new plaintiffs The Hartford Floating Rate Fund and The Hartford Small Company Fund and named as a defendant Hartford Funds Management Company, LLC (the “Investment Manager”), which assumed the role as investment adviser to the funds as of January 2013. The Investment Manager and HIFSCO dispute the allegations and intend to defend vigorously.
This action concerns the activities of HIFSCO in its capacity as investment manager and principal underwriter to the Hartford retail mutual funds and does not concern HIFSCO’s activities in its capacity as principal underwriter to the HLS funds. For this reason, no accrual for litigation relating to this matter has been recorded in the financial statements of the Fund.
| Hartford Balanced HLS Fund |
| Financial Highlights |
| | | ─Selected Per-Share Data(A) ─ | | | ─Ratios and Supplemental Data ─ | |
Class | | Net Asset
Value at
Beginning
of Period | | | Net
Investment
Income
(Loss) | | | Net
Realized
and
Unrealized
Gain (Loss)
on
Investments | | | Total from
Investment
Operations | | | Dividends
from Net
Investment
Income | | | Distributions
from
Realized
Capital
Gains | | | Total
Dividends
and
Distributions | | | Net
Asset
Value at
End of
Period | | | Total
Return(B) | | | Net Assets
at End of
Period
(000s) | | | Ratio of
Expenses
to
Average
Net
Assets
Before
Adjust-
ments(C) | | | Ratio of
Expenses
to
Average
Net
Assets
After
Adjust-
ments(C) | | | Ratio of
Net
Investment
Income
(Loss) to
Average
Net Assets | |
| | | | | | | | | | | | | | | | | | | | | | | | | | | | | | | | | | | | | | | | |
| For the Six-Month Period Ended June 30, 2014 (Unaudited) |
| IA | | $ | 25.11 | | | $ | 0.23 | | | $ | 1.26 | | | $ | 1.49 | | | $ | – | | | $ | – | | | $ | – | | | $ | 26.60 | | | | 5.93 | %(D) | | $ | 2,694,193 | | | | 0.65 | %(E) | | | 0.65 | %(E) | | | 1.86 | %(E) |
| IB | | | 25.44 | | | | 0.21 | | | | 1.26 | | | | 1.47 | | | | – | | | | – | | | | – | | | | 26.91 | | | | 5.78 | (D) | | | 383,389 | | | | 0.90 | (E) | | | 0.90 | (E) | | | 1.61 | (E) |
| | | | | | | | | | | | | | | | | | | | | | | | | | | | | | | | | | | | | | | | | | | | | | | | | | | | | |
| For the Year Ended December 31, 2013 |
| IA | | $ | 21.03 | | | $ | 0.41 | | | $ | 4.04 | | | $ | 4.45 | | | $ | (0.37 | ) | | $ | – | | | $ | (0.37 | ) | | $ | 25.11 | | | | 21.19 | % | | $ | 2,782,698 | | | | 0.65 | % | | | 0.65 | % | | | 1.75 | % |
| IB | | | 21.30 | | | | 0.35 | | | | 4.10 | | | | 4.45 | | | | (0.31 | ) | | | – | | | | (0.31 | ) | | | 25.44 | | | | 20.88 | | | | 399,681 | | | | 0.90 | | | | 0.90 | | | | 1.50 | |
| | | | | | | | | | | | | | | | | | | | | | | | | | | | | | | | | | | | | | | | | | | | | | | | | | | | | |
| For the Year Ended December 31, 2012 (F) |
| IA | | $ | 19.34 | | | $ | 0.47 | | | $ | 1.85 | | | $ | 2.32 | | | $ | (0.63 | ) | | $ | – | | | $ | (0.63 | ) | | $ | 21.03 | | | | 12.02 | % | | $ | 2,754,114 | | | | 0.65 | % | | | 0.65 | % | | | 1.98 | % |
| IB | | | 19.58 | | | | 0.43 | | | | 1.86 | | | | 2.29 | | | | (0.57 | ) | | | – | | | | (0.57 | ) | | | 21.30 | | | | 11.74 | | | | 406,156 | | | | 0.90 | | | | 0.90 | | | | 1.73 | |
| | | | | | | | | | | | | | | | | | | | | | | | | | | | | | | | | | | | | | | | | | | | | | | | | | | | | |
| For the Year Ended December 31, 2011 (F) |
| IA | | $ | 19.32 | | | $ | 0.41 | | | $ | (0.06 | ) | | $ | 0.35 | | | $ | (0.33 | ) | | $ | – | | | $ | (0.33 | ) | | $ | 19.34 | | | | 1.86 | % | | $ | 2,959,019 | | | | 0.64 | % | | | 0.64 | % | | | 1.84 | % |
| IB | | | 19.55 | | | | 0.36 | | | | (0.05 | ) | | | 0.31 | | | | (0.28 | ) | | | – | | | | (0.28 | ) | | | 19.58 | | | | 1.61 | | | | 455,939 | | | | 0.89 | | | | 0.89 | | | | 1.59 | |
| | | | | | | | | | | | | | | | | | | | | | | | | | | | | | | | | | | | | | | | | | | | | | | | | | | | | |
| For the Year Ended December 31, 2010 |
| IA | | $ | 17.47 | | | $ | 0.30 | | | $ | 1.82 | | | $ | 2.12 | | | $ | (0.27 | ) | | $ | – | | | $ | (0.27 | ) | | $ | 19.32 | | | | 12.14 | % | | $ | 3,539,983 | | | | 0.65 | % | | | 0.65 | % | | | 1.68 | % |
| IB | | | 17.68 | | | | 0.26 | | | | 1.83 | | | | 2.09 | | | | (0.22 | ) | | | – | | | | (0.22 | ) | | | 19.55 | | | | 11.86 | | | | 556,169 | | | | 0.90 | | | | 0.90 | | | | 1.43 | |
| | | | | | | | | | | | | | | | | | | | | | | | | | | | | | | | | | | | | | | | | | | | | | | | | | | | | |
| For the Year Ended December 31, 2009 (F) |
| IA | | $ | 13.69 | | | $ | 0.36 | | | $ | 3.78 | | | $ | 4.14 | | | $ | (0.36 | ) | | $ | – | | | $ | (0.36 | ) | | $ | 17.47 | | | | 30.29 | % | | $ | 3,607,929 | | | | 0.65 | % | | | 0.65 | % | | | 2.15 | % |
| IB | | | 13.85 | | | | 0.32 | | | | 3.83 | | | | 4.15 | | | | (0.32 | ) | | | – | | | | (0.32 | ) | | | 17.68 | | | | 29.96 | | | | 578,338 | | | | 0.90 | | | | 0.90 | | | | 1.90 | |
| (A) | Information presented relates to a share outstanding throughout the indicated period. Net investment income (loss) per share amounts are calculated based on average shares outstanding unless otherwise noted. |
| (B) | The figures do not include sales charges or other fees which may be applied at the variable life insurance, variable annuity or qualified retirement plan product level. Any such additional sales charges or other fees would lower the Fund's performance. |
| (C) | Adjustments include waivers and reimbursements, if applicable. Ratios do not include fees paid indirectly (see Expenses in the accompanying Notes to Financial Statements). |
| (F) | Net investment income (loss) per share amounts have been calculated using the SEC method. |
| | | Portfolio Turnover
Rate for
All Share Classes | |
| For the Six-Month Period Ended June 30, 2014 (Unaudited) | | | 13% | |
| For the Year Ended December 31, 2013 | | | 31 | |
| For the Year Ended December 31, 2012 | | | 28 | |
| For the Year Ended December 31, 2011 | | | 34 | |
| For the Year Ended December 31, 2010 | | | 65(A) | |
| For the Year Ended December 31, 2009 | | | 73 | |
| (A) | During the year ended December 31, 2010, the Fund incurred $204.5 million in purchases associated with the transition of assets from Hartford Global Advisers HLS Fund, which merged into the Fund on March 19, 2010. These purchases were excluded from the portfolio turnover calculation. |
| Hartford Balanced HLS Fund |
| Directors and Officers (Unaudited) |
The Board of Directors of the Company (the "Directors") appoints officers who are responsible for the day-to-day operations of the Fund and who execute policies formulated by the Directors. Each Director serves until his or her death, resignation, or retirement or until the next annual meeting of shareholders is held or until his or her successor is elected and qualifies.
Directors and officers who are employed by or who have a financial interest in The Hartford are considered “interested” persons of the Fund pursuant to the 1940 Act. Each officer and two of the Company's Directors, as noted in the chart below, are “interested” persons of the Fund. Each Director serves as a director for The Hartford Mutual Funds, Inc., The Hartford Mutual Funds II, Inc., Hartford Series Fund, Inc., and Hartford HLS Series Fund II, Inc., and as a trustee for The Hartford Alternative Strategies Fund, which, as of June 30, 2014, collectively consist of 78 funds. Correspondence may be sent to Directors and officers c/o Hartford Funds, 5 Radnor Corporate Center, Suite 300, 100 Matsonford Road, Radnor, Pennsylvania 19087, except that correspondence to Mr. Annoni, Mr. Dressen and Ms. Quade may be sent to 500 Bielenberg Drive, Suite 500, Woodbury, Minnesota 55125.
The table below sets forth, for each Director and officer, his or her name, year of birth, current position with the Company and date first elected or appointed to Hartford Series Fund, Inc. ("HSF") and Hartford HLS Series Fund II, Inc. ("HSF2"), principal occupation, and, for Directors, other directorships held. The Fund’s Statement of Additional Information contains further information on the Directors and is available free of charge by calling 1-888-843-7824 or writing to: Hartford HLS Funds, c/o Hartford Life Insurance Company/Hartford Life and Annuity Insurance Company, P.O. Box 14293, Lexington, KY 40512-4293 for variable annuity and variable life insurance separate accounts of Hartford Life Insurance Company and its affiliates; Hartford Funds, P.O. Box 55022, Boston, MA 02205-5022 for all shareholders except variable annuity and variable life insurance separate accounts of Hartford Life Insurance Company and its affiliates.
Information on the aggregate remuneration paid to the directors of the Company can be found in the Statement of Operations herein. The Fund pays to The Hartford a portion of the Chief Compliance Officer’s compensation, but does not pay salaries or compensation to any of its other officers or Directors who are employed by The Hartford.
Non-Interested Directors
Lynn S. Birdsong (1946) Director since 2003, Co-Chairman of the Investment Committee since 2005
Mr. Birdsong is a private investor. Mr. Birdsong currently serves as a Director of the Sovereign High Yield Investment Company (April 2010 to current). Mr. Birdsong currently serves as an Independent Director of Nomura Partners Funds, Inc. (formerly, The Japan Fund) (April 2003 to current). From 2003 to March 2005, Mr. Birdsong was an Independent Director of the Atlantic Whitehall Funds. From 1979 to 2002, Mr. Birdsong was a Managing Director of Zurich Scudder Investments, an investment management firm. During his employment with Scudder, Mr. Birdsong was an Interested Director of The Japan Fund. From January 1981 through December 2013, Mr. Birdsong was a partner in Birdsong Company, an advertising specialty firm.
Robert M. Gavin, Jr. (1940) Director since 2002 (HSF) and 1986 (HSF2), Chairman of the Board since 2004
Dr. Gavin is an educational consultant. Prior to September 1, 2001, he was President of Cranbrook Education Community and prior to July 1996, he was President of Macalester College, St. Paul, Minnesota.
Duane E. Hill (1945) Director since 2001 (HSF) and 2002 (HSF2), Chairman of the Nominating Committee since 2003
Mr. Hill is a Partner of TSG Ventures L.P., a private equity investment company. Mr. Hill is a former partner of TSG Capital Group, a private equity investment firm that served as sponsor and lead investor in leveraged buyouts of middle market companies.
Sandra S. Jaffee (1941) Director since 2005
Ms. Jaffee is the founder and Chief Executive Officer of a private company, Homeworks Concierge, LLC, which provides residential property management services in Westchester County, New York (January 2012 to present). Ms. Jaffee served as Chairman (2008 to 2009) and Chief Executive Officer of Fortent (formerly Searchspace Group), a leading provider of compliance/regulatory technology to financial institutions from August 2005 to August 2009. From August 2004 to August 2005, Ms. Jaffee served as an Entrepreneur in Residence with Warburg Pincus, a private equity firm. Prior to joining Warburg Pincus, Ms. Jaffee served as Executive Vice President at Citigroup, from September 1995 to July 2004, where she was President and Chief Executive Officer of Citibank’s Global Securities Services (1995 to 2003). Ms. Jaffee currently serves as a member of the Board of Directors of Broadridge Financial Solutions as well as a Trustee of Muhlenberg College.
| Hartford Balanced HLS Fund |
| Directors and Officers (Unaudited) – (continued) |
William P. Johnston (1944) Director since 2005, Chairman of the Compliance Committee since 2005
In June 2006, Mr. Johnston was appointed as Senior Advisor to The Carlyle Group, a global private equity and other alternative asset investment firm and currently serves as an Operating Executive. In July 2006, Mr. Johnston was elected to the Board of Directors of MultiPlan, Inc. and served as a Director (July 2006 to August 2010). In August 2007, Mr. Johnston was elected to the Board of Directors of LifeCare Holdings, Inc. and served as a Director (August 2007 to June 2013). In February 2008, Mr. Johnston was elected to the Board of Directors of HCR-ManorCare, Inc. In May 2006, Mr. Johnston was elected to the Supervisory Board of Fresenius Medical Care AG & Co. KGaA, after its acquisition of Renal Care Group, Inc. in March 2006. Mr. Johnston joined Renal Care Group in November 2002 as a member of the Board of Directors and served as Chairman of the Board from March 2003 through March 2006. From 2002 through 2013, Mr. Johnston served as a Board member of the Georgia O’Keefe Museum. From September 1987 to December 2002, Mr. Johnston was with Equitable Securities Corporation (and its successors, SunTrust Equitable Securities and SunTrust Robinson Humphrey) serving in various investment banking and managerial positions, including Managing Director and Head of Investment Banking, Chief Executive Officer and Vice Chairman.
Phillip O. Peterson (1944) Director since 2002 (HSF) and 2000 (HSF2), Chairman of the Audit Committee since 2002
Mr. Peterson is a mutual fund industry consultant. He was a partner of KPMG LLP (an accounting firm) until July 1999. Mr. Peterson joined William Blair Funds in February 2007 as a member of the Board of Trustees. From February 2012 to February 2014, Mr. Peterson served as a Trustee of Symetra Variable Mutual Funds. From January 2004 to April 2005, Mr. Peterson served as Independent President of the Strong Mutual Funds.
Lemma W. Senbet (1946) Director since 2005
Dr. Senbet is the William E. Mayer Chair Professor of Finance and Founding Director, Center for Financial Policy, at the University of Maryland, Robert H. Smith School of Business. He was chair of the Finance Department of the University of Maryland, Robert H. Smith School of Business from 1998 to 2006. Since June 2013, he has been on leave from the University to serve as Executive Director of African Economic Research Consortium which focuses on economic policy research and training. Previously, he was a chaired professor of finance at the University of Wisconsin-Madison. Also, he was a Director of the Fortis Funds from March 2000 to July 2002. Dr. Senbet served as Director of the American Finance Association and President of the Western Finance Association. In 2006, Dr. Senbet was inducted Fellow of Financial Management Association International for his career-long distinguished scholarship and professional service.
Interested Directors and Officers
James E. Davey (1964) Director since 2012, President and Chief Executive Officer since 2010
Mr. Davey serves as Executive Vice President of Hartford Life Insurance Company (“HLIC”) and The Hartford Financial Services Group, Inc. Additionally, Mr. Davey serves as Chairman of the Board, Manager and Senior Managing Director of Hartford Funds Distributors, LLC (“HFD”). He also currently serves as Director, Chairman of the Board, President and Senior Managing Director of Hartford Administrative Services Company (“HASCO”). Mr. Davey also serves as Manager, Chairman of the Board and Senior Managing Director for Hartford Funds Management Company, LLC (“HFMC”) and Director, Chairman of the Board and Senior Managing Director for Hartford Funds Management Group, Inc. ("HFMG"). Mr. Davey has served in various positions within The Hartford and its subsidiaries in connection with the operation of the Hartford Funds. Mr. Davey joined The Hartford in 2002.
Lowndes A. Smith (1939) Director since 1996 (HSF) and 2002 (HSF2), Co-Chairman of the Investment Committee since 2005
Mr. Smith served as Vice Chairman of The Hartford from February 1997 to January 2002, as President and Chief Executive Officer of Hartford Life, Inc. from February 1997 to January 2002, and as President and Chief Operating Officer of The Hartford Life Insurance Companies from January 1989 to January 2002. Mr. Smith serves as a Director of White Mountains Insurance Group Ltd. (October 2003 to current); One Beacon Insurance (October 2006 to current); Symetra Financial (August 2007 to current) and is a Managing Director of Whittington Gray Associates (January 2007 to current).
Other Officers
Mark A. Annoni (1964) Vice President, Controller and Treasurer since 2012
Mr. Annoni currently serves as the Assistant Vice President of HLIC (February 2004 to present) and Senior Vice President of HFMG (December 2013 to present). Mr. Annoni has served in various positions within The Hartford and its subsidiaries in connection with the operation of the Hartford Funds. Mr. Annoni joined The Hartford in 2001.
| Hartford Balanced HLS Fund |
| Directors and Officers (Unaudited) – (continued) |
Michael R. Dressen (1963) AML Compliance Officer since 2011
Mr. Dressen currently serves as Assistant Vice President of HLIC. He also serves as Chief Compliance Officer and AML Compliance Officer of HASCO and as AML Officer of HFD. Mr. Dressen has served in various positions within The Hartford and its subsidiaries in connection with the operation of the Hartford Funds.
Edward P. Macdonald (1967) Vice President, Secretary and Chief Legal Officer since 2005
Mr. Macdonald currently serves as Assistant Secretary, Executive Vice President and Deputy General Counsel of HFD, HASCO, HFMC and HFMG. He also serves as Vice President of HLIC. Mr. Macdonald has served in various positions within The Hartford and its subsidiaries in connection with the operation of the Hartford Funds. Mr. Macdonald joined The Hartford in 2005.
Joseph G. Melcher (1973) Vice President and Chief Compliance Officer since 2013
Mr. Melcher currently serves as Executive Vice President of HFD, HFMG and HASCO. Mr. Melcher also currently serves as Executive Vice President and Chief Compliance Officer of HFMC. Mr. Melcher has served in various positions within The Hartford and its subsidiaries in connection with the operation of the Hartford Funds since joining The Hartford in 2012. Prior to joining The Hartford, Mr. Melcher worked at Touchstone Investments, a member of the Western & Southern Financial Group, where he held the position of Vice President and Chief Compliance Officer from 2010 through 2012 and Assistant Vice President, Compliance from 2005 to 2010.
Vernon J. Meyer (1964) Vice President since 2006
Mr. Meyer currently serves as Senior Vice President of HLIC. He also currently serves as Managing Director and Chief Investment Officer of HFMC and Managing Director of HFMG. Mr. Meyer has served in various positions within The Hartford and its subsidiaries in connection with the operation of the Hartford Funds. Mr. Meyer joined The Hartford in 2004.
Laura S. Quade (1969) Vice President since 2012
Ms. Quade currently serves as Vice President of HASCO, HFD and HFMG. She is the Head of Operations of HASCO and also serves as Director, Enterprise Operations of HLIC. Ms. Quade has served in various positions within The Hartford and its subsidiaries in connection with the operation of the Hartford Funds.
Martin A. Swanson (1962) Vice President since 2010
Mr. Swanson currently serves as Vice President of HLIC. Mr. Swanson also serves as Managing Director, Chief Marketing Officer and Principal of HFD and Managing Director of HFMG. Mr. Swanson has served in various positions within The Hartford and its subsidiaries in connection with the operation of the Hartford Funds.
HOW TO OBTAIN A COPY OF THE FUND’S PROXY VOTING POLICIES AND VOTING RECORDS (UNAUDITED)
A description of the policies and procedures that the Fund uses to determine how to vote proxies relating to portfolio securities and information about how the Fund voted proxies relating to portfolio securities during the most recent twelve-month period ended June 30 are available (1) without charge, upon request, by calling 888-843-7824 and (2) on the SEC’s website at http://www.sec.gov.
QUARTERLY PORTFOLIO HOLDINGS INFORMATION (UNAUDITED)
The Fund files a complete schedule of portfolio holdings with the SEC for the first and third quarters of each fiscal year on Form N-Q. The Fund’s Forms N-Q are available (1) without charge, upon request, by calling 888-843-7824 and (2) on the SEC’s website at http://www.sec.gov. The Form N-Q may be reviewed and copied at the SEC’s Public Reference Room in Washington, DC. Information on the operation of the Public Reference Room may be obtained by calling 1-800-SEC-0330.
| Hartford Balanced HLS Fund |
| Expense Example (Unaudited) |
Your Fund's Expenses
As a shareholder of the Fund, you incur two types of costs: (1) transaction costs and (2) ongoing costs, including investment management fees, distribution and/or service (12b-1) fees, if any, and other fund expenses. This example is intended to help you understand your ongoing costs (in dollars) of investing in the Fund and to compare these costs with the ongoing costs of investing in other mutual funds. The example is based on an investment of $1,000 invested at the beginning of the period and held for the entire period of December 31, 2013 through June 30, 2014.
Actual Expenses
The first set of columns of the table below provides information about actual account values and actual expenses. You may use the information in this column, together with the amount you invested, to estimate the expenses that you paid over the period. Simply divide your account value by $1,000 (for example, an $8,600 account value divided by $1,000 = 8.6), then multiply the result by the number in the line under the heading entitled “Expenses Paid During Period” to estimate the expenses you paid on your account during this period.
Hypothetical Example for Comparison Purposes
The second set of columns of the table below provides information about hypothetical account values and hypothetical expenses based on the Fund's actual expense ratio and an assumed rate of return of 5% per year before expenses, which is not the Fund's actual return. The hypothetical account values and expenses may not be used to estimate the actual ending account balance or expenses you paid for the period. You may use this information to compare the ongoing costs of investing in the Fund and other funds. To do so, compare this 5% hypothetical example with the 5% hypothetical examples that appear in the shareholder reports of the other funds.
Please note that the expenses shown in the table are meant to highlight your ongoing costs only and do not reflect any transactional costs, such as sales charges (loads) and CDSC. Therefore, the second set of columns of the table is useful in comparing ongoing costs only, and will not help you determine the relative total costs of owning different funds. In addition, if these transactional costs were included, your costs would be higher. Expenses are equal to the Fund's annualized expense ratios multiplied by average account value over the period, multiplied by 181/365 (to reflect the one-half year period).
| | | Actual return | | | Hypothetical (5% return before expenses) | | | | | | | | |
| | | Beginning
Account Value
December 31,
2013 | | | Ending Account
Value
June 30, 2014 | | | Expenses paid
during the period
December 31, 2013
through
June 30, 2014 | | | Beginning
Account Value
December 31,
2013 | | | Ending Account
Value
June 30, 2014 | | | Expenses paid
during the period
December 31,
2013
through
June 30, 2014 | | | Annualized
expense
ratio | | | Days
in the
current
1/2
year | | Days
in the
full
year |
| Class IA | | $ | 1,000.00 | | | $ | 1,059.30 | | | $ | 3.32 | | | $ | 1,000.00 | | | $ | 1,021.57 | | | $ | 3.26 | | | | 0.65 | % | | 181 | | 365 |
| Class IB | | $ | 1,000.00 | | | $ | 1,057.80 | | | $ | 4.59 | | | $ | 1,000.00 | | | $ | 1,020.33 | | | $ | 4.51 | | | | 0.90 | | | 181 | | 365 |
| Hartford Balanced HLS Fund |
| Main Risks (Unaudited) |
The main risks of investing in the Fund are described below.
Market, Selection and Strategy Risk: The Fund’s share price may fluctuate due to market risk and/or security selections that may underperform the market or relevant benchmarks. If the sub-adviser's investment strategy does not perform as expected, the Fund could underperform its peers or lose money. There is no guarantee the Fund will achieve its stated objective.
Asset Allocation Strategy Risk: The portfolio managers' asset allocation strategy may not always work as intended, and asset allocation does not guarantee better performance or reduce the risk of investment loss.
Fixed Income Risk: The Fund is subject to interest rate risk (the risk that the value of an investment decreases when interest rates rise) and credit risk (the risk that the issuing company of a security is unable to pay interest and principal when due) and call risk (the risk that an investment may be redeemed early).
Mortgage-Backed Securities Risk: Mortgage-backed securities are subject to interest rate risk, credit risk, prepayment risk, extension risk, and the risk that an investment’s value may be reduced or become worthless if it receives interest or income payments only after other investments in the same pool.
THIS PRIVACY POLICY IS NOT PART OF THIS REPORT
Privacy Policy and Practices of The Hartford Financial Services Group, Inc. and its Affiliates
(herein called “we, our and us”)
This Privacy Policy applies to our United States Operations
We value your trust. We are committed to the responsible: a) management; b) use; and c) protection; of Personal Information. This notice describes how we collect, disclose, and protect Personal Information. We collect Personal Information to: a) service your Transactions with us; and b) support our business functions. We may obtain Personal Information from: a) You; b) your Transactions with us; and c) third parties such as a consumer-reporting agency. Based on the type of product or service You apply for or get from us, Personal Information such as: a) your name; b) your address; c) your income; d) your payment; or e) your credit history; may be gathered from sources such as applications, Transactions, and consumer reports. To serve You and service our business, we may share certain Personal Information. We will share Personal Information, only as allowed by law, with affiliates such as: a) our insurance companies; b) our employee agents; c) our brokerage firms; and d) our administrators. As allowed by law, we may share Personal Financial Information with our affiliates to: a) market our products; or b) market our services; to You without providing You with an option to prevent these disclosures. | | | We may also share Personal Information, only as allowed by law, with unaffiliated third parties including: a) independent agents; b) brokerage firms; c) insurance companies; d) administrators; and e) service providers; who help us serve You and service our business. When allowed by law, we may share certain Personal Financial Information with other unaffiliated third parties who assist us by performing services or functions such as: a) taking surveys; b) marketing our products or services; or c) offering financial products or services under a joint agreement between us and one or more financial institutions. We, and third parties we partner with, may track some of the pages You visit through the use of: a) cookies; b) pixel tagging; or c) other technologies; and currently do not process or comply with any web browser’s “do not track” signal or similar mechanism that indicates a request to disable online tracking of individual users who visit our websites or use our services. We will not sell or share your Personal Financial Information with anyone for purposes unrelated to our business functions without offering You the opportunity to: a) “opt-out;” or b) “opt-in;” as required by law. We only disclose Personal Health Information with: a) your proper written authorization; or b) as otherwise allowed or required by law. Our employees have access to Personal Information in the course of doing their jobs, such as: a) underwriting policies; b) paying claims; c) developing new products; or d) advising customers of our products and services. |
We use manual and electronic security procedures to maintain: a) the confidentiality; and b) the integrity of; Personal Information that we have. We use these procedures to guard against unauthorized access. Some techniques we use to protect Personal Information include: a) secured files; b) user authentication; c) encryption; d) firewall technology; and e) the use of detection software. We are responsible for and must: a) identify information to be protected; b) provide an adequate level of protection for that data; c) grant access to protected data only to those people who must use it in the performance of their job-related duties. Employees who violate our Privacy Policy will be subject to discipline, which may include ending their employment with us. At the start of our business relationship, we will give You a copy of our current Privacy Policy. We will also give You a copy of our current Privacy Policy once a year if You maintain a continuing business relationship with us. We will continue to follow our Privacy Policy regarding Personal Information even when a business relationship no longer exists between us. | | | As used in this Privacy Notice: Application means your request for our product or service. Personal Financial Information means financial information such as: a) credit history; b) income; c) financial benefits; or d) policy or claim information. Personal Health Information means health information such as: a) your medical records; or b) information about your illness, disability or injury. Personal Information means information that identifies You personally and is not otherwise available to the public. It includes: a) Personal Financial Information; and b) Personal Health Information. Transaction means your business dealings with us, such as: a) your Application; b) your request for us to pay a claim; and c) your request for us to take an action on your account. You means an individual who has given us Personal Information in conjunction with: a) asking about; b) applying for; or c) obtaining; a financial product or service from us if the product or service is used mainly for personal, family, or household purposes. |
This Privacy Policy is being provided on behalf of the following affiliates of The Hartford Financial Services Group, Inc.:
1stAGChoice, Inc.; Access CoverageCorp, Inc.; Access CoverageCorp Technologies, Inc.; American Maturity Life Insurance Company; Archway 60 R, LLC; Business Management Group, Inc.; Champlain Life Reinsurance Company; DMS R, LLC; Eloy R, LLC; Ersatz Corporation; First State Insurance Company; Hartford Accident and Indemnity Company; Hartford Administrative Services Company; Hartford Casualty General Agency, Inc.; Hartford Casualty Insurance Company; Hartford-Comprehensive Employee Benefit Service Company; Hartford Equity Sales Company, Inc.; Hartford Fire General Agency, Inc.; Hartford Fire Insurance Company; Hartford Funds Management Company, LLC; Hartford Funds Management Group, Inc.; Hartford HLS Series Fund II, Inc.; Hartford Insurance Company of Illinois; Hartford Insurance Company of the Midwest; Hartford Insurance Company of the Southeast; Hartford Integrated Technologies, Inc.; Hartford International Life Reassurance Corporation; Hartford Funds Distributors, LLC; Hartford Investment Management Company; Hartford Life and Accident Insurance Company; Hartford Life and Annuity Insurance Company; Hartford Life Insurance Company; Hartford Life Private Placement, LLC; Hartford Lloyd’s Corporation; Hartford Lloyd’s Insurance Company; Hartford Mezzanine Investors I, LLC; Hartford Residual Market, L.C.C.; Hartford Retirement Services, LLC; Hartford Securities Distribution Company, Inc.; Hartford Series Fund, Inc.; Hartford Specialty Insurance Services of Texas, LLC; Hartford Strategic Investments, LLC; Hartford Underwriters Insurance Company; Hartford Technology Services Company, L.L.C.; Hartford of Texas General Agency, Inc.; Hartford Underwriters General Agency, Inc.; HARTRE Company, L.C.C.; HL Investment Advisors, LLC; HLA LLC; Horizon Management Group, LLC; HRA Brokerage Services, Inc.; Lanidex Class B, LLC; M-CAP Insurance Agency, LLC; New England Insurance Company; New England Reinsurance Corporation; Nutmeg Insurance Agency, Inc.; Nutmeg Insurance Company; Pacific Insurance Company, Limited; Planco, LLC: Property and Casualty Insurance Company of Hartford; Revere R, LLC; RVR R, LLC; Sentinel Insurance Company, Ltd.; Sunstone R, LLC; Symphony R, LLC; The Evergreen Group Incorporated; The Hartford Alternative Strategies Fund; The Hartford Mutual Funds, Inc.; The Hartford Mutual Funds II, Inc.; Trumbull Flood Management, L.L.C.; Trumbull Insurance Company; Twin City Fire Insurance Company; White River Life Reinsurance Company.
HPP Revised January 2014
HARTFORD HLS FUNDS
P.O. Box 14293
Lexington, KY 40512-4293
HARTFORDFUNDS
hartfordfunds.com
Hartford Series Fund, Inc. is underwritten and distributed by Hartford Funds Distributors, LLC.
Hartford Series Fund, Inc. inception dates range from 1977 to date. Hartford Series Fund, Inc. is not a subsidiary of The Hartford Financial Services Group, Inc. ("The Hartford") but is underwritten, distributed by and advised by subsidiaries of The Hartford. Investments in Hartford Series Fund, Inc. are not guaranteed by The Hartford or any other entity.
This report is submitted for the general information of the shareholders of the Funds. It is not authorized for distribution unless preceded or accompanied by a current prospectus for the Funds.
Investors should carefully consider the investment objectives, risks, charges, and expenses of Hartford Funds before investing. This and other information can be found in the prospectus, which can be obtained by calling 800-862-6668 (or 800-279-1541 for institutional investors). Investors should read them carefully before they invest.
HLSSAR-B14 8-14 115336-1 Printed in U.S.A.
HARTFORDFUNDS
| | HARTFORD CAPITAL
APPRECIATION HLS FUND
2014 Semi Annual Report |
A MESSAGE FROM THE PRESIDENT
Dear Fellow Shareholders:
Thank you for investing in Hartford HLS Funds.
Market Review
U.S. equities (as represented by the S&P 500 Index) started 2014 on a shaky note after posting a strong 32.39% gain in 2013. However, stocks managed to maintain modest gains throughout the first quarter and returned to a generally steady climb in the second quarter. Through June 30, 2014, the S&P 500 Index advanced 7.14%. It appears that much of the market volatility during the year can be attributed to heightened international tensions. In particular, the Russian annexation of Ukraine’s Crimean Peninsula and increased tensions in Iraq were cause for concern.
On the domestic front, subdued economic and employment reports slowed stocks’ progress early in the new year, although much of the weakness seemed to dissipate as the year’s unusually harsh winter subsided. And despite initial reactions to the idea, when the U.S. Federal Reserve began tapering its quantitative-easing program in January by reducing its bond purchases by $10 billion a month, the markets took the policy change in stride.
Despite a rough start to the year for financial markets, the global economy seems to be settling into a slow-but-steady recovery. While first-quarter U.S. gross domestic product (GDP) growth was disappointing at -2.9%, U.S. consumer spending, which is a significant contributor toward economic growth, rose by 3% during the quarter. It appears that Europe is also maintaining its own recovery: The International Monetary Fund projects that Europe’s full-year GDP growth may breach positive territory for the first time since 2011.
The impact of international affairs on stocks so far this year is an important reminder to stay informed about both domestic and international economic developments, and any effects they may have on your individual investment goals. If you have not already had a mid-year review of your portfolio, it may be a good time to meet with your financial advisor to review your progress and make certain your investments are prepared for all market environments:
| • | Is your portfolio properly diversified with an appropriate mix of stocks and bonds? |
| • | Is your portfolio positioned to take advantage of the global economic recovery, with investments in both domestic and international holdings? |
| • | Are your investments still in line with your risk tolerance and investment time horizon? |
Your financial professional can help you choose options within our fund family to help you reach your investment goals with confidence.
Thank you again for investing with Hartford HLS Funds.
James Davey
President
Hartford HLS Funds
1 The S&P 500 Index is a market capitalization-weighted price index composed of 500 widely held common stocks.
2The Dow Jones Industrial Average is an unmanaged, price-weighted index of 30 of the largest, most widely held stocks traded on the New York Stock Exchange.
Hartford Capital Appreciation HLS Fund
Table of Contents
This report is prepared for the general information of contract owners and qualified retirement plan participants. It is not an offer of contracts or of qualified retirement plans. It should not be used in connection with any offer, except in conjunction with the appropriate product prospectus which contains all pertinent information including the applicable sales, administrative and other charges.
The views expressed in the Fund’s Manager Discussion under “Why did the Fund perform this way?” and “What is the outlook?” are views of the Fund’s sub-adviser and portfolio management team through the end of the period and are subject to change based on market and other conditions. The Fund’s Manager Discussion is for informational purposes only and does not represent an offer, recommendation or solicitation to buy, hold or sell any security. The specific securities identified and described, if any, do not represent all of the securities purchased or sold and you should not assume that investments in the securities identified and discussed will be profitable.
Hartford Capital Appreciation HLS Fund inception 04/02/1984
(sub-advised by Wellington Management Company, LLP)
| Investment objective – The Fund seeks growth of capital. |
Performance Overview 6/30/04 - 6/30/14

The chart above represents the hypothetical growth of a $10,000 investment in Class IA. Growth results in classes other than Class IA will vary from what is seen above due to differences in the expenses charged to those share classes.
| Average Annual Total Returns (as of 6/30/14) |
| | | 6 Month† | | 1 Year | | 5 Years | | 10 Years |
| Capital Appreciation IA | | 5.57% | | 25.59% | | 17.73% | | 9.48% |
| Capital Appreciation IB | | 5.42% | | 25.26% | | 17.43% | | 9.20% |
| Capital Appreciation IC | | 5.31% | | 24.97% | | 17.15% | | 8.93% |
| Russell 3000 Index | | 6.94% | | 25.22% | | 19.33% | | 8.23% |
| S&P 500 Index | | 7.14% | | 24.61% | | 18.83% | | 7.78% |
PERFORMANCE DATA QUOTED REPRESENTS PAST PERFORMANCE AND DOES NOT GUARANTEE FUTURE RESULTS. The investment return and principal value of the investment will fluctuate so that investors’ shares, when redeemed, may be worth more or less than their original cost. Current performance may be lower or higher than the performance data quoted. To obtain performance data current to the most recent month-end, please visit our website www.hartfordfunds.com.
Total returns presented above were calculated using the Fund’s net asset value available to shareholders for sale or redemption of Fund shares on June 30, 2014, which may exclude investment transactions as of this date. All share class returns assume the reinvestment of all distributions at net asset value and the deduction of all fund expenses.
Class IC shares commenced operations on April 30, 2014. Returns prior to the inception date of Class IC shares reflect the returns of Class IA shares adjusted to reflect the estimated fees and expenses of Class IC shares.
Russell 3000 Index is an unmanaged index that measures the performance of the 3,000 largest U.S. companies based on total market capitalization.
S&P 500 Index is a market capitalization-weighted price index composed of 500 widely held common stocks.
The index is unmanaged, and its results include reinvested dividends and/or distributions, but do not reflect the effect of sales charges, commissions, expenses or taxes.
You cannot invest directly in an index.
As shown in the Fund's current prospectus dated May 1, 2014, the total annual operating expense ratios for Class IA, Class IB and IC were 0.67%, 0.92% and 1.17%, respectively. Actual expenses may be higher. Please see the accompanying Financial Highlights for expense ratios for the six-month period ended June 30, 2014.
All investments are subject to risk including the possible loss of principal. For a discussion of the Fund’s risks, please see the Main Risks section of this report. For more detailed information on the risks associated with an investment in the Fund, please see the prospectus.
The chart and table do not reflect the deductions of taxes, sales charges or other fees which may be applied at the variable life insurance, variable annuity or qualified retirement plan product level. Any such additional sales charges or other fees or expenses would lower the contract’s or plan’s performance.
Hartford Capital Appreciation HLS Fund
Manager Discussion
| June 30, 2014 (Unaudited) |
| Portfolio Managers | | |
| Saul J. Pannell, CFA | Gregg R. Thomas, CFA | Kent M. Stahl, CFA |
| Senior Vice President and Equity Portfolio Manager | Senior Vice President and Director,
Risk Management | Senior Vice President and Director, Investments and Risk Management |
| Francis J. Boggan, CFA | Nicolas M. Choumenkovitch | Peter I. Higgins, CFA |
| Senior Vice President and Equity Portfolio Manager | Senior Vice President and Equity Portfolio Manager | Senior Vice President and Equity Portfolio Manager |
| Donald J. Kilbride | Paul E. Marrkand, CFA | Stephen Mortimer |
| Senior Vice President and Equity Portfolio Manager | Senior Vice President and Equity Portfolio Manager | Senior Vice President and Equity Portfolio Manager |
| David W. Palmer, CFA | Philip W. Ruedi, CFA | |
| Senior Vice President and Equity Portfolio Manager | Senior Vice President and Equity Porfolio Manager * | |
| * Effective June 3, 2014, Philip W. Ruedi replaced Paul E. Marrkand as a portfolio manager. |
How did the Fund perform?
The Class IA shares of the Hartford Capital Appreciation HLS Fund returned 5.57% for the six-month period ended June 30, 2014, underperforming the Fund’s benchmark, the Russell 3000 Index, which returned 6.94% for the same period. The Fund also underperformed the 6.21% average return of the Lipper Multi-Cap Core Funds peer group, a group of funds with investment strategies similar to those of the Fund.
Why did the Fund perform this way?
U.S. equities surged during the period, ending June near an all-time high. After finishing 2013 with their best year since 1997, U.S. stocks began 2014 with their worst month in nearly two years. Worries about a slowdown in China and general concern surrounding emerging markets overshadowed a fairly benign domestic environment. However, robust merger and acquisition activity and an uncontested increase in the debt ceiling from Congress helped stoke investors' risk appetites in February. Earnings season in April provided a varied yet encouraging picture, with companies generally reporting healthy earnings but more subdued revenues. The rally continued in May amid renewed signs of life in the housing market and the best payroll gains in more than two years. In June, strong manufacturing activity, coupled with continued positive momentum in housing and employment data, helped to offset a large negative revision to first quarter economic growth. Within the Russell 3000 Index, all ten sectors posted positive gains. Utilities (+18%), Energy (+14%) and Healthcare (+10%) led the index higher while Consumer Discretionary (+1%), Industrials (+4%) and Telecommunication Services (+4%) lagged on a relative basis.
The Fund underperformed the Russell 3000 Index primarily due to sector allocation, a result of our bottom-up security selection process. An overweight to the Consumer Discretionary sector and an underweight to the Utilities sector detracted from returns relative to the Russell 3000 Index, which was partially offset by an underweight to Consumer Staples and an overweight to Information Technology. A modest cash position also detracted from performance in an upward trending environment. Security selection detracted from returns relative to the Russell 3000 Index, primarily due to selection within the Consumer Discretionary, Financials, and Industrials sectors. This was partially offset by strong selection within Information Technology, Healthcare, and Consumer Staples.
The largest detractors from absolute and relative returns were Best Buy (Consumer Discretionary), Groupon (Consumer Discretionary), and ParkerVision (Information Technology). Best Buy, a U.S.-based electronics retailer, underperformed after pre-announcing disappointing sales and margins. Shares of Groupon, a web-based coupon business offering discounts to individuals when a certain threshold of deal purchasers is reached, fell as profit margins have been under pressure from management investment in the business. Shares of ParkerVision, a U.S.-based manufacturer of wireless integrated circuits with proprietary amplifier and receiver technology used in mobile phones, underperformed following a surprise ruling that reverses a victory in their patent infringement lawsuit against Qualcomm.
The top contributors to relative and absolute performance during the quarter included Micron Technology (Information Technology), NXP Semiconductors (Information Technology) and AstraZeneca (Healthcare). Shares of Micron Technology, a semiconductor manufacturer specializing in NAND Flash, DRAM, and NOR Flash memory devices, rose during the period due to improving expectations for demand for the company's products and solid execution. Shares of NXP Semiconductors, a Netherlands-based semiconductor company, rose around speculation that NXP will provide NFC technology (short-range communications between compatible devices) to Apple's iPhone 6 and iWatch. Shares of AstraZeneca, a U.K.-based multinational pharmaceutical company focused on cardiovascular, gastrointestinal, respiratory, oncology, and neuroscience treatments, rose on news that U.S.-based pharmaceutical giant Pfizer offered to acquire the company. While AstraZeneca ultimately dismissed the bid, the share price remained elevated relative to the beginning of the quarter due to material
Hartford Capital Appreciation HLS Fund
Manager Discussion – (continued)
| June 30, 2014 (Unaudited) |
pipeline advancement/news since the bidding process was disclosed in mid-April.
Derivatives are not used in a significant manner in this Fund and did not have a material impact on performance during the period.
What is the outlook?
Global economic growth has been remarkably stable in the aggregate, yet below the surface many regional shifts are taking place. The U.S. appears positioned for a second-half rebound. U.S. economic fundamentals are generally healthy. The fiscal drag appears to be waning and leading indicators continue to improve. As we expected, labor markets are tightening and wages are rising in accordance. Due to these factors, we are more optimistic about the U.S. growth trajectory.
We are also closely watching the U.S. Federal Reserve (Fed) as it gradually unwinds accommodative policy. We believe the Fed remains on track to end quantitative easing in the fourth quarter of this year and is likely to further normalize policy in 2015.
As a result of our bottom-up investment process, at the end of the period the Fund was most overweight the Information Technology, Consumer Discretionary, and Healthcare sectors relative to the Russell 3000 Index. The Fund was most underweight the Consumer Staples, Utilities, and Telecommunication Services sectors at the end of the period relative to the Russell 3000 Index.
| Diversification by Sector |
| as of June 30, 2014 |
| Sector | | Percentage of
Net Assets | |
| Equity Securities | | | | |
| Consumer Discretionary | | | 16.2 | % |
| Consumer Staples | | | 5.2 | |
| Energy | | | 9.4 | |
| Financials | | | 15.9 | |
| Health Care | | | 14.3 | |
| Industrials | | | 11.5 | |
| Information Technology | | | 21.7 | |
| Materials | | | 3.4 | |
| Services | | | 0.9 | |
| Utilities | | | 1.2 | |
| Total | | | 99.7 | % |
| Short-Term Investments | | | 1.2 | |
| Other Assets and Liabilities | | | (0.9 | ) |
| Total | | | 100.0 | % |
| A sector may be comprised of several industries. For Fund compliance purposes, the Fund may not use the same classification system and these sector classifications are used for reporting ease. |
Hartford Capital Appreciation HLS Fund
Schedule of Investments
June 30, 2014 (Unaudited)
| Shares or Principal Amount | | Market Value ╪ | |
| Common Stocks - 99.4% | | | |
| | | | | Automobiles and Components - 2.3% | | | | |
| | 2,830 | | | Brilliance China Automotive Holdings, Ltd. | | $ | 5,312 | |
| | 263 | | | Dana Holding Corp. | | | 6,427 | |
| | 82 | | | Delphi Automotive plc | | | 5,651 | |
| | 1,428 | | | Dongfeng Motor Group Co., Ltd. | | | 2,558 | |
| | 203 | | | Fiat S.p.A. | | | 2,001 | |
| | 824 | | | Ford Motor Co. | | | 14,202 | |
| | 61 | | | General Motors Co. | | | 2,223 | |
| | 2,255 | | | Goodyear (The) Tire & Rubber Co. | | | 62,652 | |
| | 433 | | | Harley-Davidson, Inc. | | | 30,228 | |
| | 45 | | | Hyundai Motor Co., Ltd. | | | 10,271 | |
| | 469 | | | Isuzu Motors Ltd. | | | 3,106 | |
| | 67 | | | Tenneco Automotive, Inc. ● | | | 4,427 | |
| | 317 | | | TRW Automotive Holdings Corp. ● | | | 28,342 | |
| | | | | | | | 177,400 | |
| | | | | Banks - 4.8% | | | | |
| | 6,377 | | | Alpha Bank A.E. ● | | | 5,930 | |
| | 2,554 | | | Banco Bilbao Vizcaya Argentaria S.A. | | | 32,547 | |
| | 1,118 | | | Barclays Bank plc ADR | | | 4,072 | |
| | 289 | | | BNP Paribas | | | 19,668 | |
| | 290 | | | Erste Group Bank AG | | | 9,384 | |
| | 389 | | | FinecoBank S.p.A. ● | | | 1,971 | |
| | 185 | | | First Republic Bank | | | 10,183 | |
| | 1,145 | | | Itau Unibanco Banco Multiplo S.A. ADR | | | 16,467 | |
| | 130 | | | M&T Bank Corp. | | | 16,123 | |
| | 11,148 | | | Mitsubishi UFJ Financial Group, Inc. | | | 68,433 | |
| | 7 | | | Ocwen Financial Corp. ● | | | 248 | |
| | 988 | | | PNC Financial Services Group, Inc. | | | 87,982 | |
| | 3,225 | | | Standard Chartered plc | | | 65,928 | |
| | 574 | | | Wells Fargo & Co. | | | 30,157 | |
| | | | | | | | 369,093 | |
| | | | | Capital Goods - 8.0% | | | | |
| | 57 | | | 3M Co. | | | 8,222 | |
| | 52 | | | Acuity Brands, Inc. | | | 7,213 | |
| | 185 | | | AGCO Corp. | | | 10,406 | |
| | 403 | | | AMETEK, Inc. | | | 21,088 | |
| | 208 | | | Armstrong World Industries, Inc. ● | | | 11,933 | |
| | 145 | | | Assa Abloy Ab | | | 7,397 | |
| | 251 | | | Belden, Inc. | | | 19,647 | |
| | 5,328 | | | Capstone Turbine Corp. ● | | | 8,046 | |
| | 72 | | | Danaher Corp. | | | 5,634 | |
| | 133 | | | DigitalGlobe, Inc. ● | | | 3,688 | |
| | 293 | | | Eaton Corp. plc | | | 22,588 | |
| | 221 | | | Fastenal Co. | | | 10,917 | |
| | 144 | | | Flowserve Corp. | | | 10,686 | |
| | 456 | | | HD Supply Holdings, Inc. ● | | | 12,948 | |
| | 199 | | | Jacobs Engineering Group, Inc. ● | | | 10,600 | |
| | 217 | | | KBR, Inc. | | | 5,164 | |
| | 168 | | | Lockheed Martin Corp. | | | 27,065 | |
| | 466 | | | Nidec Corp. | | | 28,683 | |
| | 199 | | | Northrop Grumman Corp. | | | 23,764 | |
| | 469 | | | Owens Corning, Inc. | | | 18,159 | |
| | 60 | | | Pall Corp. | | | 5,119 | |
| | 72 | | | Parker-Hannifin Corp. | | | 9,066 | |
| | 91 | | | Pentair plc | | | 6,585 | |
| | 126 | | | Polypore International, Inc. ● | | | 6,038 | |
| | 766 | | | Raytheon Co. | | | 70,640 | |
| | 1,883 | | | Rexel S.A. | | | 44,047 | |
| | 1,835 | | | Rolls-Royce Holdings plc | | | 33,524 | |
| | 773 | | | Safran S.A. | | | 50,631 | |
| | 141 | | | Schneider Electric S.A. | | | 13,266 | |
| | 89 | | | Siemens AG | | | 11,776 | |
| | 98 | | | Teledyne Technologies, Inc. ● | | | 9,543 | |
| | 147 | | | Textron, Inc. | | | 5,627 | |
| | 141 | | | TransDigm Group, Inc. | | | 23,510 | |
| | 131 | | | United Technologies Corp. | | | 15,127 | |
| | 34 | | | W.W. Grainger, Inc. | | | 8,729 | |
| | 29 | | | Wabtec Corp. | | | 2,391 | |
| | 263 | | | WESCO International, Inc. ● | | | 22,716 | |
| | | | | | | | 612,183 | |
| | | | | Commercial and Professional Services - 1.0% | | | | |
| | 108 | | | Clean Harbors, Inc. ● | | | 6,935 | |
| | 540 | | | Enernoc, Inc. ● | | | 10,231 | |
| | 319 | | | Equifax, Inc. ● | | | 23,151 | |
| | 463 | | | Herman Miller, Inc. | | | 14,010 | |
| | 51 | | | IHS, Inc. ● | | | 6,986 | |
| | 374 | | | Knoll, Inc. | | | 6,490 | |
| | 72 | | | Manpowergroup, Inc. | | | 6,129 | |
| | 113 | | | Robert Half International, Inc. | | | 5,414 | |
| | | | | | | | 79,346 | |
| | | | | Consumer Durables and Apparel - 2.2% | | | | |
| | 57 | | | Cloudera, Inc. ⌂●† | | | 743 | |
| | 773 | | | D.R. Horton, Inc. | | | 18,988 | |
| | 316 | | | Electrolux AB Series B | | | 7,967 | |
| | 95 | | | Fossil Group, Inc. ● | | | 9,956 | |
| | 51 | | | Harman International Industries, Inc. | | | 5,483 | |
| | 137 | | | Kate Spade & Co. ● | | | 5,209 | |
| | 298 | | | Lennar Corp. | | | 12,498 | |
| | 612 | | | Mattel, Inc. | | | 23,846 | |
| | 128 | | | One Kings Lane, Inc. ⌂●† | | | 2,049 | |
| | 2,573 | | | Pulte Group, Inc. | | | 51,881 | |
| | 159 | | | PVH Corp. | | | 18,504 | |
| | 215 | | | Vera Bradley, Inc. ● | | | 4,705 | |
| | 48 | | | Whirlpool Corp. | | | 6,750 | |
| | | | | | | | 168,579 | |
| | | | | Consumer Services - 2.7% | | | | |
| | 373 | | | American Public Education, Inc. ● | | | 12,809 | |
| | 204 | | | Bloomin' Brands, Inc. ● | | | 4,569 | |
| | 355 | | | Boyd Gaming Corp. ● | | | 4,307 | |
| | 33 | | | Buffalo Wild Wings, Inc. ● | | | 5,526 | |
| | 377 | | | Grand Canyon Education, Inc. ● | | | 17,326 | |
| | 224 | | | Hilton Worldwide Holdings, Inc. ● | | | 5,222 | |
| | 378 | | | Las Vegas Sands Corp. | | | 28,805 | |
| | 315 | | | McDonald's Corp. | | | 31,708 | |
| | 104 | | | Melco PBL Entertainment Ltd. ADR | | | 3,698 | |
| | 161 | | | Norwegian Cruise Line Holdings Ltd. ● | | | 5,110 | |
| | 95 | | | Outerwall, Inc. ● | | | 5,620 | |
| | 54 | | | Panera Bread Co. Class A ● | | | 8,080 | |
| | 66 | | | Starwood Hotels & Resorts, Inc. | | | 5,303 | |
| | 165 | | | Tim Hortons, Inc. | | | 9,020 | |
| | 788 | | | Wyndham Worldwide Corp. | | | 59,673 | |
| | | | | | | | 206,776 | |
| | | | | Diversified Financials - 5.1% | | | | |
| | 104 | | | Ameriprise Financial, Inc. | | | 12,428 | |
| | 225 | | | Artisan Partners Asset Management, Inc. | | | 12,769 | |
| | 272 | | | Banca Generali S.p.A. | | | 7,466 | |
| | 165 | | | BlackRock, Inc. | | | 52,732 | |
| | 1,774 | | | Citigroup, Inc. | | | 83,571 | |
| | 85 | | | Goldman Sachs Group, Inc. | | | 14,266 | |
| | 25 | | | Intercontinental Exchange, Inc. | | | 4,704 | |
| | 235 | | | Japan Exchange Group, Inc. | | | 5,789 | |
The accompanying notes are an integral part of these financial statements.
Hartford Capital Appreciation HLS Fund
Schedule of Investments – (continued)
June 30, 2014 (Unaudited)
| Shares or Principal Amount | | Market Value ╪ | |
| Common Stocks - 99.4% - (continued) | | | | |
| | | | | Diversified Financials - 5.1% - (continued) | | | | |
| | 1,984 | | | JP Morgan Chase & Co. | | $ | 114,345 | |
| | 730 | | | Julius Baer Group Ltd. | | | 30,092 | |
| | 138 | | | Northern Trust Corp. | | | 8,874 | |
| | 611 | | | ORIX Corp. | | | 10,125 | |
| | 140 | | | Platform Specialty Products Corp. ● | | | 3,918 | |
| | 101 | | | Raymond James Financial, Inc. | | | 5,119 | |
| | 75 | | | Solar Cayman Ltd. ⌂■●† | | | 5 | |
| | 380 | | | Waddell & Reed Financial, Inc. Class A | | | 23,765 | |
| | 327 | | | Wisdomtree Investment, Inc. ● | | | 4,042 | |
| | | | | | | | 394,010 | |
| | | | | Energy - 9.4% | | | | |
| | 126 | | | Anadarko Petroleum Corp. | | | 13,811 | |
| | 232 | | | Atwood Oceanics, Inc. ● | | | 12,155 | |
| | 61 | | | Baker Hughes, Inc. | | | 4,527 | |
| | 1,863 | | | BG Group plc | | | 39,322 | |
| | 221 | | | Cabot Oil & Gas Corp. | | | 7,528 | |
| | 954 | | | Cameco Corp. | | | 18,705 | |
| | 173 | | | Cameron International Corp. ● | | | 11,739 | |
| | 294 | | | Canadian Natural Resources Ltd. ADR | | | 13,503 | |
| | 394 | | | Chevron Corp. | | | 51,400 | |
| | 49,072 | | | China Petroleum & Chemical Corp. Class H | | | 46,655 | |
| | 1,797 | | | Cobalt International Energy, Inc. ● | | | 32,972 | |
| | 199 | | | Continental Resources, Inc. ● | | | 31,462 | |
| | 239 | | | Energen Corp. | | | 21,210 | |
| | 128 | | | EQT Corp. | | | 13,706 | |
| | 148 | | | Exxon Mobil Corp. | | | 14,907 | |
| | 341 | | | Halliburton Co. | | | 24,184 | |
| | 187 | | | HollyFrontier Corp. | | | 8,161 | |
| | 206 | | | Imperial Oil Ltd. | | | 10,844 | |
| | 3,277 | | | Karoon Gas Australia Ltd. ● | | | 9,487 | |
| | 850 | | | McDermott International, Inc. ● | | | 6,877 | |
| | 217 | | | National Oilwell Varco, Inc. | | | 17,901 | |
| | 73 | | | Occidental Petroleum Corp. | | | 7,510 | |
| | 3,996 | | | Petroleo Brasileiro S.A. ADR | | | 62,494 | |
| | 477 | | | Pioneer Natural Resources Co. | | | 109,596 | |
| | 275 | | | QEP Resources, Inc. | | | 9,485 | |
| | 231 | | | Range Resources Corp. | | | 20,073 | |
| | 119 | | | Reliance Industries Ltd. GDR ■ | | | 4,008 | |
| | 409 | | | Southwestern Energy Co. ● | | | 18,625 | |
| | 333 | | | Suncor Energy, Inc. | | | 14,182 | |
| | 156 | | | Superior Energy Services, Inc. | | | 5,629 | |
| | 1,026 | | | Trican Well Service Ltd. | | | 16,565 | |
| | 1,161 | | | Tsakos Energy Navigation Ltd. | | | 7,765 | |
| | 33 | | | Whiting Petroleum Corp. ● | | | 2,676 | |
| | 935 | | | YPF Sociedad Anonima ADR | | | 30,566 | |
| | | | | | | | 720,230 | |
| | | | | Food and Staples Retailing - 1.2% | | | | |
| | 704 | | | CVS Caremark Corp. | | | 53,056 | |
| | 222 | | | Seven & I Holdings Co., Ltd. | | | 9,353 | |
| | 130 | | | Sprouts Farmers Markets, Inc. ● | | | 4,260 | |
| | 207 | | | Wal-Mart Stores, Inc. | | | 15,547 | |
| | 212 | | | Whole Foods Market, Inc. | | | 8,177 | |
| | | | | | | | 90,393 | |
| | | | | Food, Beverage and Tobacco - 3.6% | | | | |
| | 331 | | | Anheuser-Busch InBev N.V. | | | 38,083 | |
| | 232 | | | Anheuser-Busch InBev N.V. ADR | | | 26,630 | |
| | 165 | | | British American Tobacco plc | | | 9,801 | |
| | 47 | | | Bunge Ltd. Finance Corp. | | | 3,517 | |
| | 954 | | | Diageo Capital plc | | | 30,372 | |
| | 64 | | | Diageo plc ADR | | | 8,124 | |
| | 358 | | | Imperial Tobacco Group plc | | | 16,097 | |
| | 85 | | | Keurig Green Mountain, Inc. | | | 10,597 | |
| | 368 | | | Kraft Foods Group, Inc. | | | 22,072 | |
| | 1,681 | | | Mondelez International, Inc. | | | 63,231 | |
| | 328 | | | Monster Beverage Corp. ● | | | 23,271 | |
| | 70 | | | Philip Morris International, Inc. | | | 5,926 | |
| | 1,456 | | | Treasury Wine Estates Ltd. | | | 6,877 | |
| | 200 | | | Unilever N.V. NY Shares ADR | | | 8,757 | |
| | 172 | | | WhiteWave Foods Co. Class A ● | | | 5,568 | |
| | | | | | | | 278,923 | |
| | | | | Health Care Equipment and Services - 3.5% | | | | |
| | 803 | | | Aetna, Inc. | | | 65,131 | |
| | 351 | | | Cardinal Health, Inc. | | | 24,087 | |
| | 8,503 | | | CareView Communications, Inc. ●† | | | 5,400 | |
| | 183 | | | Dexcom, Inc. ● | | | 7,244 | |
| | 1,229 | | | HCA Holdings, Inc. ● | | | 69,299 | |
| | 61 | | | Heartware International, Inc. ● | | | 5,360 | |
| | 519 | | | IMS Health Holdings, Inc. ● | | | 13,328 | |
| | 325 | | | Medtronic, Inc. | | | 20,747 | |
| | 88 | | | Team Health Holdings ● | | | 4,394 | |
| | 371 | | | UnitedHealth Group, Inc. | | | 30,356 | |
| | 116 | | | Universal Health Services, Inc. Class B | | | 11,099 | |
| | 105 | | | Wellpoint, Inc. | | | 11,299 | |
| | | | | | | | 267,744 | |
| | | | | Household and Personal Products - 0.4% | | | | |
| | 323 | | | Coty, Inc. | | | 5,540 | |
| | 1,074 | | | Svenska Cellulosa AB Class B | | | 27,972 | |
| | | | | | | | 33,512 | |
| | | | | Insurance - 5.3% | | | | |
| | 387 | | | ACE Ltd. | | | 40,120 | |
| | 125 | | | Aflac, Inc. | | | 7,796 | |
| | 2,022 | | | American International Group, Inc. | | | 110,376 | |
| | 628 | | | Assicurazioni Generali S.p.A. | | | 13,752 | |
| | 654 | | | Assured Guaranty Ltd. | | | 16,016 | |
| | 376 | | | Delta Lloyd N.V. | | | 9,558 | |
| | 26 | | | Fairfax Financial Holdings Ltd. | | | 12,233 | |
| | 264 | | | Lincoln National Corp. | | | 13,586 | |
| | 24 | | | Markel Corp. ● | | | 15,427 | |
| | 800 | | | Marsh & McLennan Cos., Inc. | | | 41,439 | |
| | 727 | | | MetLife, Inc. | | | 40,407 | |
| | 258 | | | Principal Financial Group, Inc. | | | 13,039 | |
| | 432 | | | Prudential Financial, Inc. | | | 38,358 | |
| | 178 | | | Reinsurance Group of America, Inc. | | | 14,036 | |
| | 63 | | | Swiss Re Ltd. | | | 5,619 | |
| | 544 | | | T&D Holdings, Inc. | | | 7,403 | |
| | 28 | | | Zurich Financial Services AG | | | 8,344 | |
| | | | | | | | 407,509 | |
| | | | | Materials - 3.4% | | | | |
| | 112 | | | Air Liquide | | | 15,101 | |
| | 134 | | | Akzo Nobel N.V. | | | 10,019 | |
| | 1,416 | | | Barrick Gold Corp. | | | 25,907 | |
| | 158 | | | Celanese Corp. | | | 10,130 | |
| | 196 | | | Dow Chemical Co. | | | 10,099 | |
| | 126 | | | Ecolab, Inc. | | | 14,003 | |
| | 2,636 | | | Fortescue Metals Group Ltd. | | | 10,886 | |
| | 161 | | | International Paper Co. | | | 8,111 | |
| | 2,646 | | | Ivanhoe Mines Ltd. PIPE ● | | | 3,373 | |
| | 1,437 | | | JSR Corp. | | | 24,675 | |
| | 309 | | | Louisiana-Pacific Corp. ● | | | 4,635 | |
| | 109 | | | Methanex Corp. ADR | | | 6,711 | |
The accompanying notes are an integral part of these financial statements.
Hartford Capital Appreciation HLS Fund
Schedule of Investments – (continued)
June 30, 2014 (Unaudited)
| Shares or Principal Amount | | Market Value ╪ | |
| Common Stocks - 99.4% - (continued) | | | | |
| | | | | Materials - 3.4% - (continued) | | | | |
| | 437 | | | Norbord, Inc. | | $ | 10,715 | |
| | 12 | | | OCI Co., Ltd. | | | 2,086 | |
| | 191 | | | Packaging Corp. of America | | | 13,683 | |
| | 209 | | | Praxair, Inc. | | | 27,767 | |
| | 208 | | | Reliance Steel & Aluminum | | | 15,355 | |
| | 119 | | | Rio Tinto plc ADR | | | 6,470 | |
| | 7,205 | | | Turquoise Hill Resources Ltd. ● | | | 24,065 | |
| | 150 | | | Vulcan Materials Co. | | | 9,542 | |
| | 72 | | | Wacker Chemie AG | | | 8,238 | |
| | | | | | | | 261,571 | |
| | | | | Media - 1.7% | | | | |
| | 178 | | | CBS Corp. Class B | | | 11,044 | |
| | 90 | | | DirecTV ● | | | 7,654 | |
| | 3 | | | DISH Network Corp. ● | | | 186 | |
| | 165 | | | DreamWorks Animation SKG, Inc. ● | | | 3,848 | |
| | 30 | | | Harvey Weinstein Co. Holdings Class A-1 ⌂●†∞ | | | – | |
| | 143 | | | Imax Corp. ● | | | 4,064 | |
| | 1,005 | | | Pandora Media, Inc. ● | | | 29,649 | |
| | 307 | | | Quebecor, Inc. | | | 7,438 | |
| | 11 | | | Time Warner Cable, Inc. | | | 1,626 | |
| | 679 | | | Time Warner, Inc. | | | 47,721 | |
| | 33 | | | Tribune Co. ● | | | 2,807 | |
| | 621 | | | WPP plc | | | 13,540 | |
| | | | | | | | 129,577 | |
| | | | | Pharmaceuticals, Biotechnology and Life Sciences - 10.8% | | | | |
| | 485 | | | Actavis plc ● | | | 108,118 | |
| | 95 | | | Alkermes plc ● | | | 4,765 | |
| | 349 | | | Almirall S.A. | | | 5,658 | |
| | 139 | | | Amgen, Inc. | | | 16,453 | |
| | 1,046 | | | Arena Pharmaceuticals, Inc. ● | | | 6,132 | |
| | 389 | | | AstraZeneca plc | | | 28,952 | |
| | 3,287 | | | Bristol-Myers Squibb Co. | | | 159,451 | |
| | 52 | | | Covance, Inc. ● | | | 4,479 | |
| | 156 | | | Eli Lilly & Co. | | | 9,692 | |
| | 1,386 | | | Gilead Sciences, Inc. ● | | | 114,921 | |
| | 66 | | | H. Lundbeck A/S | | | 1,632 | |
| | 59 | | | Illumina, Inc. ● | | | 10,511 | |
| | 295 | | | Incyte Corp. ● | | | 16,661 | |
| | 363 | | | Johnson & Johnson | | | 38,017 | |
| | 230 | | | Medivation, Inc. ● | | | 17,726 | |
| | 1,809 | | | Merck & Co., Inc. | | | 104,642 | |
| | 62 | | | Ono Pharmaceutical Co., Ltd. | | | 5,447 | |
| | 307 | | | Portola Pharmaceuticals, Inc. ● | | | 8,951 | |
| | 85 | | | Regeneron Pharmaceuticals, Inc. ● | | | 24,078 | |
| | 198 | | | Roche Holding AG | | | 59,008 | |
| | 312 | | | Salix Pharmaceuticals Ltd. ● | | | 38,449 | |
| | 4,480 | | | TherapeuticsMD, Inc. ● | | | 19,802 | |
| | 213 | | | Vertex Pharmaceuticals, Inc. ● | | | 20,204 | |
| | 329 | | | Zoetis, Inc. | | | 10,614 | |
| | | | | | | | 834,363 | |
| | | | | Real Estate - 0.7% | | | | |
| | 91 | | | AvalonBay Communities, Inc. REIT | | | 12,899 | |
| | 58 | | | Boston Properties, Inc. REIT | | | 6,874 | |
| | 208 | | | Mitsui Fudosan Co., Ltd. | | | 7,008 | |
| | 119 | | | Plum Creek Timber Co., Inc. REIT | | | 5,385 | |
| | 417 | | | Realogy Holdings Corp. ● | | | 15,725 | |
| | 18 | | | SL Green Realty Corp. REIT | | | 1,937 | |
| | 174 | | | Weyerhaeuser Co. REIT | | | 5,748 | |
| | | | | | | | 55,576 | |
| | | | | Retailing - 7.0% | | | | |
| | 349 | | | Advance Automotive Parts, Inc. | | | 47,082 | |
| | 8,452 | | | Allstar Co. ⌂●† | | | 9,136 | |
| | 26 | | | Amazon.com, Inc. ● | | | 8,309 | |
| | 67 | | | AutoZone, Inc. ● | | | 35,819 | |
| | 41 | | | Bed Bath & Beyond, Inc. ● | | | 2,364 | |
| | 846 | | | Best Buy Co., Inc. | | | 26,249 | |
| | 337 | | | CarMax, Inc. ● | | | 17,528 | |
| | 313 | | | Conns, Inc. ● | | | 15,443 | |
| | 200 | | | Dollar Tree, Inc. ● | | | 10,901 | |
| | 127 | | | GameStop Corp. Class A | | | 5,137 | |
| | 265 | | | GNC Holdings, Inc. | | | 9,040 | |
| | 3,687 | | | Groupon, Inc. ● | | | 24,407 | |
| | 240 | | | Home Depot, Inc. | | | 19,398 | |
| | 405 | | | Intime Retail Group Co., Ltd. | | | 356 | |
| | 1,496 | | | Kingfisher plc | | | 9,185 | |
| | 790 | | | Lowe's Cos., Inc. | | | 37,916 | |
| | 22 | | | Netflix, Inc. ● | | | 9,552 | |
| | 687 | | | Office Depot, Inc. ● | | | 3,912 | |
| | 73 | | | Priceline (The) Group, Inc. ● | | | 88,203 | |
| | 636 | | | Rakuten, Inc. | | | 8,227 | |
| | 62 | | | Ross Stores, Inc. | | | 4,082 | |
| | 256 | | | Signet Jewelers Ltd. | | | 28,283 | |
| | 1,355 | | | TJX Cos., Inc. | | | 72,004 | |
| | 281 | | | Tory Burch LLC ⌂●† | | | 18,982 | |
| | 241 | | | TripAdvisor, Inc. ● | | | 26,214 | |
| | | | | | | | 537,729 | |
| | | | | Semiconductors and Semiconductor Equipment - 6.3% | | | | |
| | 108 | | | Analog Devices, Inc. | | | 5,823 | |
| | 3,651 | | | Applied Materials, Inc. | | | 82,333 | |
| | 999 | | | Freescale Semiconductor Holdings Ltd. ● | | | 23,480 | |
| | 47,231 | | | GCL-Poly Energy Holdings Ltd. | | | 15,788 | |
| | 1,069 | | | GT Advanced Technologies, Inc. ● | | | 19,878 | |
| | 142 | | | Hynix Semiconductor, Inc. | | | 6,798 | |
| | 736 | | | Intel Corp. | | | 22,730 | |
| | 645 | | | Marvell Technology Group Ltd. | | | 9,246 | |
| | 1,041 | | | Maxim Integrated Products, Inc. | | | 35,184 | |
| | 3,184 | | | Micron Technology, Inc. ● | | | 104,929 | |
| | 1,469 | | | NXP Semiconductors N.V. ● | | | 97,201 | |
| | 9 | | | Samsung Electronics Co., Ltd. | | | 11,387 | |
| | 1,078 | | | Sumco Corp. | | | 9,880 | |
| | 962 | | | SunEdison, Inc. ● | | | 21,738 | |
| | 491 | | | SunPower Corp. ● | | | 20,101 | |
| | | | | | | | 486,496 | |
| | | | | Software and Services - 9.6% | | | | |
| | 509 | | | 21Vianet Group, Inc. ADR ● | | | 15,240 | |
| | 311 | | | Accenture plc | | | 25,147 | |
| | 5,375 | | | Activision Blizzard, Inc. | | | 119,864 | |
| | 518 | | | Adobe Systems, Inc. ● | | | 37,478 | |
| | 548 | | | Akamai Technologies, Inc. ● | | | 33,471 | |
| | 772 | | | Angie's List, Inc. ● | | | 9,218 | |
| | 417 | | | AOL, Inc. ● | | | 16,609 | |
| | 455 | | | Autodesk, Inc. ● | | | 25,656 | |
| | 175 | | | Automatic Data Processing, Inc. | | | 13,880 | |
| | 124 | | | Booz Allen Hamilton Holding Corp. | | | 2,631 | |
| | 426 | | | Cadence Design Systems, Inc. ● | | | 7,449 | |
| | 198 | | | Cognizant Technology Solutions Corp. ● | | | 9,704 | |
| | 77 | | | Concur Technologies, Inc. ● | | | 7,180 | |
| | 106 | | | CoStar Group, Inc. ● | | | 16,768 | |
| | 208 | | | Dropbox, Inc. ⌂●† | | | 3,580 | |
| | 227 | | | Ellie Mae, Inc. ● | | | 7,071 | |
The accompanying notes are an integral part of these financial statements.
Hartford Capital Appreciation HLS Fund
Schedule of Investments – (continued)
June 30, 2014 (Unaudited)
| Shares or Principal Amount | | Market Value ╪ | |
| Common Stocks - 99.4% - (continued) | | | | |
| | | | | Software and Services - 9.6% - (continued) | | | | |
| | 345 | | | Facebook, Inc. ● | | $ | 23,182 | |
| | 45 | | | Global Payments, Inc. | | | 3,264 | |
| | 20 | | | Google, Inc. Class A ● | | | 11,586 | |
| | 174 | | | Google, Inc. Class C ● | | | 100,376 | |
| | 80 | | | IAC/InterActiveCorp. | | | 5,549 | |
| | 175 | | | Intuit, Inc. | | | 14,057 | |
| | 160 | | | Markit, Ltd. ● | | | 4,320 | |
| | 1,974 | | | Microsoft Corp. | | | 82,306 | |
| | 1,585 | | | Monster Worldwide, Inc. ● | | | 10,367 | |
| | 30 | | | New Relic, Inc. ⌂●† | | | 785 | |
| | 1,018 | | | Optimal Payments plc ● | | | 6,967 | |
| | 483 | | | Oracle Corp. | | | 19,561 | |
| | 241 | | | Salesforce.com, Inc. ● | | | 14,003 | |
| | 8 | | | ServiceNow, Inc. ● | | | 465 | |
| | 575 | | | Symantec Corp. | | | 13,173 | |
| | 23 | | | Tableau Software, Inc. ● | | | 1,661 | |
| | 321 | | | Teradata Corp. ● | | | 12,892 | |
| | 44 | | | Tyler Corp. ● | | | 3,986 | |
| | 204 | | | Uber Technologies, Inc. ⌂●† | | | 11,381 | |
| | 266 | | | UbiSoft Entertainment S.A. ● | | | 4,892 | |
| | 93 | | | Verint Systems, Inc. ● | | | 4,556 | |
| | 259 | | | VeriSign, Inc. ● | | | 12,635 | |
| | 651 | | | Web.com Group, Inc. ● | | | 18,784 | |
| | 78 | | | Yahoo!, Inc. ● | | | 2,733 | |
| | 78 | | | Yelp, Inc. ● | | | 6,008 | |
| | | | | | | | 740,435 | |
| | | | | Technology Hardware and Equipment - 5.8% | | | | |
| | 159 | | | Amphenol Corp. Class A | | | 15,309 | |
| | 550 | | | Apple, Inc. | | | 51,148 | |
| | 578 | | | CDW Corp. of Delaware | | | 18,417 | |
| | 2,530 | | | Cisco Systems, Inc. | | | 62,859 | |
| | 155 | | | Cognex Corp. ● | | | 5,963 | |
| | 1,109 | | | EMC Corp. | | | 29,220 | |
| | 68 | | | F5 Networks, Inc. ● | | | 7,529 | |
| | 357 | | | Hewlett-Packard Co. | | | 12,011 | |
| | 2,065 | | | Japan Display, Inc. ● | | | 12,693 | |
| | 10,230 | | | Lenovo Group Ltd. | | | 13,976 | |
| | 88 | | | Mobileye N.V. ⌂●† | | | 4,304 | |
| | 71 | | | Palo Alto Networks, Inc. ● | | | 5,958 | |
| | 4,658 | | | ParkerVision, Inc. ● | | | 6,894 | |
| | 467 | | | Pure Storage, Inc. ⌂●† | | | 6,609 | |
| | 1,087 | | | Qualcomm, Inc. | | | 86,095 | |
| | 51 | | | SanDisk Corp. | | | 5,351 | |
| | 298 | | | Stratasys Ltd. ● | | | 33,907 | |
| | 890 | | | TE Connectivity Ltd. | | | 55,008 | |
| | 438 | | | Trimble Navigation Ltd. ● | | | 16,200 | |
| | | | | | | | 449,451 | |
| | | | | Telecommunication Services - 0.9% | | | | |
| | 77 | | | DocuSign, Inc. ⌂●† | | | 1,574 | |
| | 644 | | | Gogo, Inc. ● | | | 12,588 | |
| | 258 | | | Intelsat S.A. ● | | | 4,863 | |
| | 248 | | | KDDI Corp. | | | 15,149 | |
| | 435 | | | NTT DoCoMo, Inc. | | | 7,431 | |
| | 470 | | | Orange S.A. | | | 7,441 | |
| | 284 | | | Telenor ASA | | | 6,468 | |
| | 245 | | | Verizon Communications, Inc. | | | 11,974 | |
| | | | | | | | 67,488 | |
| | | | | Transportation - 2.5% | | | | |
| | 602 | | | Air Canada Class A ● | | | 5,361 | |
| | 211 | | | Canadian National Railway Co. | | | 13,693 | |
| | 6 | | | Controladora Vuela Cia De Aviacion ● | | | 54 | |
| | 91 | | | FedEx Corp. | | | 13,791 | |
| | 118 | | | Kansas City Southern | | | 12,651 | |
| | 1,091 | | | Mitsui O.S.K. Lines Ltd. | | | 4,064 | |
| | 911 | | | Nippon Yusen | | | 2,629 | |
| | 64 | | | Norfolk Southern Corp. | | | 6,635 | |
| | 116 | | | Spirit Airlines, Inc. ● | | | 7,312 | |
| | 1,832 | | | United Continental Holdings, Inc. ● | | | 75,232 | |
| | 435 | | | United Parcel Service, Inc. Class B | | | 44,633 | |
| | 98 | | | XPO Logistics, Inc. ● | | | 2,801 | |
| | | | | | | | 188,856 | |
| | | | | Utilities - 1.2% | | | | |
| | 13,383 | | | China Longyuan Power Group Corp. | | | 14,528 | |
| | 233 | | | Edison International | | | 13,522 | |
| | 461 | | | National Grid plc | | | 6,642 | |
| | 360 | | | NRG Energy, Inc. | | | 13,375 | |
| | 1,651 | | | Snam S.p.A. | | | 9,947 | |
| | 295 | | | UGI Corp. | | | 14,911 | |
| | 719 | | | Xcel Energy, Inc. | | | 23,188 | |
| | | | | | | | 96,113 | |
| | | | | Total Common Stocks | | | | |
| | | | | ( Cost $6,685,596) | | $ | 7,653,353 | |
| | | | | | | | | |
| Preferred Stocks - 0.3% | | | | |
| | | | | Media - 0.3% | | | | |
| | 499 | | | ProSieben Sat.1 Media AG | | $ | 22,224 | |
| | | | | | | | | |
| | | | | Total Preferred Stocks | | | | |
| | | | | (Cost $22,525) | | $ | 22,224 | |
| | | | | | | | | |
| | | | | Total Long-Term Investments | | | | |
| | | | | (Cost $6,708,121) | | $ | 7,675,577 | |
| | | | | | | | | |
| Short-Term Investments - 1.2% | | | | |
| | Repurchase Agreements - 1.2% | | | | |
| | | | | Bank of America Merrill Lynch TriParty Repurchase
Agreement (maturing on 07/01/2014 in the
amount of $7,623, collateralized by FHLMC
2.23% - 5.99%, 2030 - 2044, FNMA 2.31% -
6.34%, 2020 - 2042, value of $7,776) | | | | |
| $ | 7,623 | | | 0.10%, 6/30/2014 | | $ | 7,623 | |
| | | | | Bank of Montreal TriParty Repurchase Agreement
(maturing on 07/01/2014 in the amount of
$11,646, collateralized by U.S. Treasury Bill
0.13%, 2015, U.S. Treasury Bond 2.75% -
10.63%, 2015 - 2044, U.S. Treasury Note 0.13%
- 4.50%, 2014 - 2024, value of $11,879) | | | | |
| | 11,646 | | | 0.09%, 6/30/2014 | | | 11,646 | |
| | | | | Bank of Montreal TriParty Repurchase Agreement
(maturing on 07/01/2014 in the amount of
$4,966, collateralized by FHLMC 2.00% -
5.50%, 2018 - 2041, FNMA 2.00% - 4.50%,
2026 - 2042, GNMA 3.00% - 4.00%, 2042 -
2043, U.S. Treasury Bill 0.05%, 2014, U.S.
Treasury Note 0.75%, 2018, value of $5,066) | | | | |
| | 4,966 | | | 0.11%, 6/30/2014 | | | 4,966 | |
The accompanying notes are an integral part of these financial statements.
Hartford Capital Appreciation HLS Fund
Schedule of Investments – (continued)
June 30, 2014 (Unaudited)
| Shares or Principal Amount | | | | | Market Value ╪ | |
| Short-Term Investments - 1.2% - (continued) | | | | | | | | |
| | Repurchase Agreements - 1.2% - (continued) | | | | | | | | |
| | | | | Barclays Capital TriParty Repurchase Agreement
(maturing on 07/01/2014 in the amount of
$4,594, collateralized by U.S. Treasury Note
0.63% - 0.88%, 2018 - 2019, value of $4,686) | | | | | | | | |
| $ | 4,594 | | | 0.07%, 6/30/2014 | | | | | | $ | 4,594 | |
| | | | | Citigroup Global Markets, Inc. TriParty Repurchase
Agreement (maturing on 07/01/2014 in the
amount of $10,583, collateralized by U.S.
Treasury Bond 4.38% - 7.50%, 2016 - 2040,
U.S. Treasury Note 0.50% - 3.00%, 2014 - 2020,
value of $10,795) | | | | | | | | |
| | 10,583 | | | 0.06%, 6/30/2014 | | | | | | | 10,583 | |
| | | | | RBS Securities Inc. TriParty Repurchase
Agreement (maturing on 07/01/2014 in the
amount of $16,220, collateralized by U.S.
Treasury Note 0.38% - 3.13%, 2015 - 2022,
value of $16,545) | | | | | | | | |
| | 16,220 | | | 0.08%, 6/30/2014 | | | | | | | 16,220 | |
| | | | | TD Securities TriParty Repurchase Agreement
(maturing on 07/01/2014 in the amount of
$33,761, collateralized by FHLMC 3.50% -
4.00%, 2026 - 2044, FNMA 2.50% - 5.00%,
2025 - 2043, value of $34,436) | | | | | | | | |
| | 33,761 | | | 0.11%, 6/30/2014 | | | | | | | 33,761 | |
| | | | | UBS Securities Repurchase Agreement (maturing
on 07/01/2014 in the amount of $139,
collateralized by U.S. Treasury Note 2.13%,
2020, value of $142) | | | | | | | | |
| | 139 | | | 0.05%, 6/30/2014 | | | | | | | 139 | |
| | | | | | | | | | | | 89,532 | |
| | | | | Total Short-Term Investments | | | | | | | | |
| | | | | (Cost $89,532) | | | | | | $ | 89,532 | |
| | | | | | | | | | | | | |
| | | | | Total Investments | | | | | | | | |
| | | | | (Cost $6,797,653) ▲ | | | 100.9 | % | | $ | 7,765,109 | |
| | | | | Other Assets and Liabilities | | | (0.9 | )% | | | (70,987 | ) |
| | | | | Total Net Assets | | | 100.0 | % | | $ | 7,694,122 | |
The accompanying notes are an integral part of these financial statements.
Hartford Capital Appreciation HLS Fund
Schedule of Investments – (continued)
June 30, 2014 (Unaudited)
| Note: | Percentage of investments as shown is the ratio of the total market value to total net assets. |
| | |
| | Prices of foreign equities that are principally traded on certain foreign markets may be adjusted daily pursuant to a fair value pricing service approved by the Board of Directors in order to reflect an adjustment for factors occurring after the close of certain foreign markets but before the close of the New York Stock Exchange. |
| ▲ | At June 30, 2014, the cost of securities for federal income tax purposes was $6,857,137 and the aggregate gross unrealized appreciation and depreciation based on that cost were: |
| Unrealized Appreciation | | $ | 1,116,381 | |
| Unrealized Depreciation | | | (208,409 | ) |
| Net Unrealized Appreciation | | $ | 907,972 | |
| † | These securities were valued in good faith at fair value as determined under policies and procedures established by and under the supervision of the Board of Directors. At June 30, 2014, the aggregate value of these securities was $64,548, which represents 0.8% of total net assets. This amount excludes securities that are principally traded in certain foreign markets and whose prices are adjusted pursuant to a third party pricing service methodology approved by the Board of Directors. |
| ■ | Securities issued within terms of a private placement memorandum, exempt from registration under Rule 144A under the Securities Act of 1933, as amended, and may be sold only to qualified institutional buyers. Unless otherwise indicated, these holdings are determined to be liquid. At June 30, 2014, the aggregate value of these securities was $4,013, which represents 0.1% of total net assets. |
| ∞ | Securities exempt from registration under Regulation D of the Securities Act of 1933, as amended. The Fund may only be able to resell these securities if they are subsequently registered or if an exemption from registration under the federal and state securities laws is available. Unless otherwise indicated, these holdings are determined to be liquid. At June 30, 2014, the aggregate value and percentage of net assets of these securities rounds to zero. |
| ⌂ | The following securities are considered illiquid. Illiquid securities are often purchased in private placement transactions, are often not registered under the Securities Act of 1933, as amended, and may have contractual restrictions on resale. A security may also be considered illiquid if the security lacks a readily available market or if its valuation has not changed for a certain period of time. |
| |
| Period Acquired | | Shares/ Par | | | Security | | Cost Basis | |
| 08/2011 | | | 8,452 | | | Allstar Co. | | $ | 3,677 | |
| 02/2014 | | | 57 | | | Cloudera, Inc. | | | 826 | |
| 02/2014 | | | 77 | | | DocuSign, Inc. | | | 1,012 | |
| 05/2012 | | | 208 | | | Dropbox, Inc. | | | 1,885 | |
| 10/2005 | | | 30 | | | Harvey Weinstein Co. Holdings Class A-1 - Reg D | | | 27,951 | |
| 08/2013 | | | 88 | | | Mobileye N.V. | | | 3,055 | |
| 04/2014 | | | 30 | | | New Relic, Inc. | | | 873 | |
| 01/2014 | | | 128 | | | One Kings Lane, Inc. | | | 1,972 | |
| 04/2014 | | | 467 | | | Pure Storage, Inc. | | | 7,343 | |
| 03/2007 | | | 75 | | | Solar Cayman Ltd. - 144A | | | 22 | |
| 11/2013 | | | 281 | | | Tory Burch LLC | | | 21,985 | |
| 06/2014 | | | 204 | | | Uber Technologies, Inc. | | | 12,646 | |
At June 30, 2014, the aggregate value of these securities was $59,148, which represents 0.8% of total net assets.
| Foreign Currency Contracts Outstanding at June 30, 2014 |
| | | | | | | | | | | | | | | Unrealized Appreciation/(Depreciation) | |
| Currency | | Buy / Sell | | Delivery Date | | Counterparty | | Contract Amount | | | Market Value ╪ | | | Asset | | | Liability | |
| CHF | | Sell | | 07/01/2014 | | CSFB | | $ | 983 | | | $ | 990 | | | $ | – | | | $ | (7 | ) |
| EUR | | Buy | | 07/03/2014 | | BCLY | | | 472 | | | | 472 | | | | – | | | | – | |
| EUR | | Buy | | 07/02/2014 | | CBK | | | 5,624 | | | | 5,645 | | | | 21 | | | | – | |
| EUR | | Buy | | 07/01/2014 | | CSFB | | | 8 | | | | 8 | | | | – | | | | – | |
| EUR | | Sell | | 07/02/2014 | | CBK | | | 1,583 | | | | 1,589 | | | | – | | | | (6 | ) |
| HKD | | Buy | | 07/02/2014 | | BCLY | | | 2,626 | | | | 2,626 | | | | – | | | | – | |
| HKD | | Buy | | 07/03/2014 | | UBS | | | 4,558 | | | | 4,558 | | | | – | | | | – | |
| JPY | | Buy | | 12/03/2014 | | BCLY | | | 12,720 | | | | 12,747 | | | | 27 | | | | – | |
| JPY | | Buy | | 12/03/2014 | | DEUT | | | 5,726 | | | | 5,796 | | | | 70 | | | | – | |
The accompanying notes are an integral part of these financial statements.
Hartford Capital Appreciation HLS Fund
Schedule of Investments – (continued)
June 30, 2014 (Unaudited)
| Foreign Currency Contracts Outstanding at June 30, 2014 - (continued) |
| | | | | | | | | | | | | | | Unrealized Appreciation/(Depreciation) | |
| Currency | | Buy / Sell | | Delivery Date | | Counterparty | | Contract Amount | | | Market Value ╪ | | | Asset | | | Liability | |
| JPY | | Buy | | 12/03/2014 | | MSC | | $ | 8,501 | | | $ | 8,559 | | | $ | 58 | | | $ | – | |
| JPY | | Buy | | 12/03/2014 | | SCB | | | 9,372 | | | | 9,387 | | | | 15 | | | | – | |
| JPY | | Sell | | 07/02/2014 | | BCLY | | | 1,532 | | | | 1,533 | | | | – | | | | (1 | ) |
| JPY | | Sell | | 12/03/2014 | | BCLY | | | 67,424 | | | | 67,894 | | | | – | | | | (470 | ) |
| JPY | | Sell | | 07/03/2014 | | BOA | | | 2,742 | | | | 2,744 | | | | – | | | | (2 | ) |
| JPY | | Sell | | 12/03/2014 | | BOA | | | 40,883 | | | | 41,142 | | | | – | | | | (259 | ) |
| JPY | | Sell | | 12/03/2014 | | CBK | | | 31,738 | | | | 31,948 | | | | – | | | | (210 | ) |
| JPY | | Sell | | 12/03/2014 | | DEUT | | | 5,955 | | | | 6,116 | | | | – | | | | (161 | ) |
| JPY | | Sell | | 07/01/2014 | | RBC | | | 1,290 | | | | 1,296 | | | | – | | | | (6 | ) |
| SEK | | Buy | | 07/03/2014 | | BCLY | | | 725 | | | | 725 | | | | – | | | | – | |
| Total | | | | | | | | | | | | | | | | $ | 191 | | | $ | (1,122 | ) |
| ╪ | See Significant Accounting Policies of accompanying Notes to Financial Statements regarding valuation of securities. |
The accompanying notes are an integral part of these financial statements.
Hartford Capital Appreciation HLS Fund
Schedule of Investments – (continued)
June 30, 2014 (Unaudited)
| GLOSSARY: (abbreviations used in preceding Schedule of Investments) |
| |
| Counterparty Abbreviations: |
| BCLY | Barclays |
| BOA | Banc of America Securities LLC |
| CBK | Citibank NA |
| CSFB | Credit Suisse First Boston Corp. |
| DEUT | Deutsche Bank Securities, Inc. |
| MSC | Morgan Stanley |
| RBC | RBC Dominion Securities, Inc. |
| SCB | Standard Chartered Bank |
| UBS | UBS AG |
| |
| Currency Abbreviations: |
| CHF | Swiss Franc |
| EUR | EURO |
| HKD | Hong Kong Dollar |
| JPY | Japanese Yen |
| SEK | Swedish Krona |
| |
| Other Abbreviations: |
| ADR | American Depositary Receipt |
| FHLMC | Federal Home Loan Mortgage Corp. |
| FNMA | Federal National Mortgage Association |
| GDR | Global Depositary Receipt |
| GNMA | Government National Mortgage Association |
| PIPE | Private Investment in Public Equity |
| REIT | Real Estate Investment Trust |
The accompanying notes are an integral part of these financial statements.
Hartford Capital Appreciation HLS Fund
Investment Valuation Hierarchy Level Summary
June 30, 2014 (Unaudited)
| | | Total | | | Level 1 ♦ | | | Level 2 ♦ | | | Level 3 | |
| Assets: | | | | | | | | | | | | | | | | |
| Common Stocks | | | | | | | | | | | | | | | | |
| Automobiles and Components | | $ | 177,400 | | | $ | 154,152 | | | $ | 23,248 | | | $ | – | |
| Banks | | | 369,093 | | | | 161,160 | | | | 207,933 | | | | – | |
| Capital Goods | | | 612,183 | | | | 466,906 | | | | 145,277 | | | | – | |
| Commercial and Professional Services | | | 79,346 | | | | 79,346 | | | | – | | | | – | |
| Consumer Durables and Apparel | | | 168,579 | | | | 157,820 | | | | 7,967 | | | | 2,792 | |
| Consumer Services | | | 206,776 | | | | 206,776 | | | | – | | | | – | |
| Diversified Financials | | | 394,010 | | | | 340,533 | | | | 53,472 | | | | 5 | |
| Energy | | | 720,230 | | | | 624,766 | | | | 95,464 | | | | – | |
| Food and Staples Retailing | | | 90,393 | | | | 81,040 | | | | 9,353 | | | | – | |
| Food, Beverage and Tobacco | | | 278,923 | | | | 177,693 | | | | 101,230 | | | | – | |
| Health Care Equipment and Services | | | 267,744 | | | | 267,744 | | | | – | | | | – | |
| Household and Personal Products | | | 33,512 | | | | 5,540 | | | | 27,972 | | | | – | |
| Insurance | | | 407,509 | | | | 362,833 | | | | 44,676 | | | | – | |
| Materials | | | 261,571 | | | | 190,566 | | | | 71,005 | | | | – | |
| Media | | | 129,577 | | | | 116,037 | | | | 13,540 | | | | – | |
| Pharmaceuticals, Biotechnology and Life Sciences | | | 834,363 | | | | 735,298 | | | | 99,065 | | | | – | |
| Real Estate | | | 55,576 | | | | 48,568 | | | | 7,008 | | | | – | |
| Retailing | | | 537,729 | | | | 491,843 | | | | 17,768 | | | | 28,118 | |
| Semiconductors and Semiconductor Equipment | | | 486,496 | | | | 442,643 | | | | 43,853 | | | | – | |
| Software and Services | | | 740,435 | | | | 719,797 | | | | 4,892 | | | | 15,746 | |
| Technology Hardware and Equipment | | | 449,451 | | | | 411,869 | | | | 26,669 | | | | 10,913 | |
| Telecommunication Services | | | 67,488 | | | | 29,425 | | | | 36,489 | | | | 1,574 | |
| Transportation | | | 188,856 | | | | 182,163 | | | | 6,693 | | | | – | |
| Utilities | | | 96,113 | | | | 64,996 | | | | 31,117 | | | | – | |
| Total | | | 7,653,353 | | | | 6,519,514 | | | | 1,074,691 | | | | 59,148 | |
| Preferred Stocks | | | 22,224 | | | | – | | | | 22,224 | | | | – | |
| Short–Term Investments | | | 89,532 | | | | – | | | | 89,532 | | | | – | |
| Total | | $ | 7,765,109 | | | $ | 6,519,514 | | | $ | 1,186,447 | | | $ | 59,148 | |
| Foreign Currency Contracts* | | $ | 191 | | | $ | – | | | $ | 191 | | | $ | – | |
| Total | | $ | 191 | | | $ | – | | | $ | 191 | | | $ | – | |
| Liabilities: | | | | | | | | | | | | | | | | |
| Foreign Currency Contracts* | | $ | 1,122 | | | $ | – | | | $ | 1,122 | | | $ | – | |
| Total | | $ | 1,122 | | | $ | – | | | $ | 1,122 | | | $ | – | |
| ♦ | For the six-month period ended June 30, 2014, investments valued at $5,601 were transferred from Level 1 to Level 2, and investments valued at $31,886 were transferred from Level 2 to Level 1. Investments are transferred between Level 1 and Level 2 for a variety of reasons including, but not limited to: |
| 1) | Foreign equities for which a fair value price is more representative of exit value than the local market close (transfer into Level 2). Foreign equities for which the local market close is more representative of exit value (transfer into Level 1). |
| 2) | U.S. Treasury securities that no longer represent the most recent issue (transfer into Level 2). |
| 3) | Equity investments with no observable trading but a bid or mean price is used (transfer into Level 2). Equity investments using observable quoted prices in an active market (transfer into Level 1). |
| * | Derivative instruments (excluding purchased and written options, if applicable) are valued at the unrealized appreciation/depreciation on the investments. |
The accompanying notes are an integral part of these financial statements.
Hartford Capital Appreciation HLS Fund
Investment Valuation Hierarchy Level Summary – (continued)
June 30, 2014 (Unaudited)
Following is a reconciliation of Level 3 assets for which significant unobservable inputs were used to determine fair value:
| | | Balance as
of
December
31, 2013 | | | Realized
Gain
(Loss) | | | Change in
Unrealized
Appreciation
(Depreciation) | | | Net
Amortization | | | Purchases | | | Sales | | | Transfers
Into
Level 3 * | | | Transfers
Out of
Level 3 * | | | Balance as
of June 30,
2014 | |
| Assets: | | | | | | | | | | | | | | | | | | | | | | | | | | | | | | | | | | | | |
| Common Stocks | | $ | 56,067 | | | $ | — | | | $ | (10,099 | )† | | $ | — | | | $ | 24,671 | | | $ | (1,318 | ) | | $ | — | | | $ | (10,173 | ) | | $ | 59,148 | |
| Warrants | | | 147 | | | | — | | | | — | | | | — | | | | — | | | | — | | | | — | | | | (147 | ) | | | — | |
| Total | | $ | 56,214 | | | $ | — | | | $ | (10,099 | ) | | $ | — | | | $ | 24,671 | | | $ | (1,318 | ) | | $ | — | | | $ | (10,320 | ) | | $ | 59,148 | |
| * | Investments are transferred into and out of Level 3 for a variety of reasons including, but not limited to: |
| 1) | Investments where trading has been halted (transfer into Level 3) or investments where trading has resumed (transfer out of Level 3). |
| 2) | Broker quoted investments (transfer into Level 3) or quoted prices in active markets (transfer out of Level 3). |
| 3) | Investments that have certain restrictions on trading (transfer into Level 3) or investments where trading restrictions have expired (transfer out of Level 3). |
| † | Change in unrealized appreciation (depreciation) in the current period relating to assets still held at June 30, 2014 was $(10,099). |
| Note: | For purposes of reporting transfers between different hierarchy levels, both transfers in and out of each level, as applicable, are shown as if they occurred at the beginning of the period. |
The accompanying notes are an integral part of these financial statements.
Hartford Capital Appreciation HLS Fund
Statement of Assets and Liabilities
June 30, 2014 (Unaudited)
| Assets: | | | | |
| Investments in securities, at market value (cost $6,797,653) | | $ | 7,765,109 | |
| Foreign currency on deposit with custodian (cost $979) | | | 980 | |
| Unrealized appreciation on foreign currency contracts | | | 191 | |
| Receivables: | | | | |
| Investment securities sold | | | 55,244 | |
| Fund shares sold | | | 376 | |
| Dividends and interest | | | 8,153 | |
| Other assets | | | 12 | |
| Total assets | | | 7,830,065 | |
| Liabilities: | | | | |
| Unrealized depreciation on foreign currency contracts | | | 1,122 | |
| Bank overdraft | | | 19 | |
| Payables: | | | | |
| Investment securities purchased | | | 57,488 | |
| Fund shares redeemed | | | 75,926 | |
| Investment management fees | | | 671 | |
| Administrative fees | | | — | |
| Distribution fees | | | 29 | |
| Accrued expenses | | | 688 | |
| Total liabilities | | | 135,943 | |
| Net assets | | $ | 7,694,122 | |
| Summary of Net Assets: | | | | |
| Capital stock and paid-in-capital | | $ | 4,822,408 | |
| Undistributed net investment income | | | 53,571 | |
| Accumulated net realized gain | | | 1,851,525 | |
| Unrealized appreciation of investments and the translations of assets and liabilities denominated in foreign currency | | | 966,618 | |
| Net assets | | $ | 7,694,122 | |
| Shares authorized | | | 5,450,000 | |
| Par value | | $ | 0.001 | |
| Class IA: Net asset value per share | | $ | 62.97 | |
| Shares outstanding | | | 108,890 | |
| Net assets | | $ | 6,856,638 | |
| Class IB: Net asset value per share | | $ | 62.39 | |
| Shares outstanding | | | 13,421 | |
| Net assets | | $ | 837,374 | |
| Class IC: Net asset value per share | | $ | 62.92 | |
| Shares outstanding | | | 2 | |
| Net assets | | $ | 110 | |
The accompanying notes are an integral part of these financial statements.
Hartford Capital Appreciation HLS Fund
Statement of Operations
For the Six-Month Period Ended June 30, 2014 (Unaudited)
| Investment Income: | | | | |
| Dividends | | $ | 77,230 | |
| Interest | | | 65 | |
| Less: Foreign tax withheld | | | (3,445 | ) |
| Total investment income, net | | | 73,850 | |
| | | | | |
| Expenses: | | | | |
| Investment management fees | | | 24,214 | |
| Administrative service fees | | | — | |
| Transfer agent fees | | | 3 | |
| Distribution fees - Class IB | | | 1,105 | |
| Distribution fees - Class IC | | | — | |
| Custodian fees | | | 84 | |
| Accounting services fees | | | 636 | |
| Board of Directors' fees | | | 103 | |
| Audit fees | | | 44 | |
| Other expenses | | | 400 | |
| Total expenses (before fees paid indirectly) | | | 26,589 | |
| Commission recapture | | | (110 | ) |
| Total fees paid indirectly | | | (110 | ) |
| Total expenses, net | | | 26,479 | |
| Net Investment Income | | | 47,371 | |
| | | | | |
| Net Realized Gain on Investments and Foreign Currency Transactions: | | | | |
| Net realized gain on investments | | | 894,895 | |
| Less: Foreign taxes paid on realized capital gains | | | (686 | ) |
| Net realized loss on purchased option contracts | | | (449 | ) |
| Net realized gain on foreign currency contracts | | | 59 | |
| Net realized loss on other foreign currency transactions | | | (89 | ) |
| Net Realized Gain on Investments and Foreign Currency Transactions | | | 893,730 | |
| | | | | |
| Net Changes in Unrealized Depreciation of Investments and Foreign Currency Transactions: | | | | |
| Net unrealized depreciation of investments | | | (522,116 | ) |
| Net unrealized appreciation of purchased option contracts | | | 361 | |
| Net unrealized depreciation of foreign currency contracts | | | (4,854 | ) |
| Net unrealized appreciation on translation of other assets and liabilities in foreign currencies | | | 27 | |
| Net Changes in Unrealized Depreciation of Investments and Foreign Currency Transactions | | | (526,582 | ) |
| Net Gain on Investments and Foreign Currency Transactions | | | 367,148 | |
| Net Increase in Net Assets Resulting from Operations | | $ | 414,519 | |
The accompanying notes are an integral part of these financial statements.
Hartford Capital Appreciation HLS Fund
Statement of Changes in Net Assets
| | | For the
Six-Month
Period Ended
June 30, 2014
(Unaudited) | | | For the
Year Ended
December 31,
2013 | |
| Operations: | | | | | | | | |
| Net investment income | | $ | 47,371 | | | $ | 68,026 | |
| Net realized gain on investments and foreign currency transactions | | | 893,730 | | | | 1,589,271 | |
| Net unrealized appreciation (depreciation) of investments and foreign currency transactions | | | (526,582 | ) | | | 984,486 | |
| Net Increase in Net Assets Resulting from Operations | | | 414,519 | | | | 2,641,783 | |
| Distributions to Shareholders: | | | | | | | | |
| From net investment income | | | | | | | | |
| Class IA | | | — | | | | (59,301 | ) |
| Class IB | | | — | | | | (6,059 | ) |
| Total from net investment income | | | — | | | | (65,360 | ) |
| From net realized gain on investments | | | | | | | | |
| Class IA | | | — | | | | (17,709 | ) |
| Class IB | | | — | | | | (2,473 | ) |
| Total from net realized gain on investments | | | — | | | | (20,182 | ) |
| Total distributions | | | — | | | | (85,542 | ) |
| Capital Share Transactions: | | | | | | | | |
| Class IA | | | | | | | | |
| Sold | | | 187,175 | | | | 232,572 | |
| Issued on reinvestment of distributions | | | — | | | | 77,010 | |
| Redeemed | | | (728,805 | ) | | | (3,293,542 | ) |
| Total capital share transactions | | | (541,630 | ) | | | (2,983,960 | ) |
| Class IB | | | | | | | | |
| Sold | | | 4,592 | | | | 67,775 | |
| Issued on reinvestment of distributions | | | — | | | | 8,532 | |
| Redeemed | | | (182,277 | ) | | | (275,086 | ) |
| Total capital share transactions | | | (177,685 | ) | | | (198,779 | ) |
| Class IC | | | | | | | | |
| Sold | | | 106 | | | | — | |
| Redeemed | | | — | | | | — | |
| Total capital share transactions | | | 106 | | | | — | |
| Net decrease from capital share transactions | | | (719,209 | ) | | | (3,182,739 | ) |
| Net Decrease in Net Assets | | | (304,690 | ) | | | (626,498 | ) |
| Net Assets: | | | | | | | | |
| Beginning of period | | | 7,998,812 | | | | 8,625,310 | |
| End of period | | $ | 7,694,122 | | | $ | 7,998,812 | |
| Undistributed (distribution in excess of) net investment income | | $ | 53,571 | | | $ | 6,200 | |
| Shares: | | | | | | | | |
| Class IA | | | | | | | | |
| Sold | | | 3,097 | | | | 4,446 | |
| Issued on reinvestment of distributions | | | — | | | | 1,320 | |
| Redeemed | | | (12,043 | ) | | | (66,631 | ) |
| Total share activity | | | (8,946 | ) | | | (60,865 | ) |
| Class IB | | | | | | | | |
| Sold | | | 77 | | | | 1,338 | |
| Issued on reinvestment of distributions | | | — | | | | 147 | |
| Redeemed | | | (3,040 | ) | | | (5,413 | ) |
| Total share activity | | | (2,963 | ) | | | (3,928 | ) |
| Class IC | | | | | | | | |
| Sold | | | 2 | | | | — | |
| Redeemed | | | — | | | | — | |
| Total share activity | | | 2 | | | | — | |
The accompanying notes are an integral part of these financial statements.
Hartford Capital Appreciation HLS Fund
Notes to Financial Statements
June 30, 2014 (Unaudited)
Organization:
Hartford Capital Appreciation HLS Fund (the "Fund") serves as an underlying investment option for certain variable annuity and variable life insurance separate accounts of Hartford Life Insurance Company (“HLIC”) and its affiliates and certain qualified retirement plans. The Fund may also serve as an underlying investment option for certain variable annuity and variable life separate accounts of other insurance companies. Owners of variable annuity contracts and policyholders of variable life insurance contracts may choose the funds permitted in the variable insurance contract prospectus. In addition, participants in certain qualified retirement plans may choose the Fund if permitted by their plans.
Hartford Series Fund, Inc. (the “Company”) is an open-end registered management investment company comprised of twenty-eight portfolios. Financial statements for the Fund, a series of the Company, are included in this report.
The Company is organized under the laws of the State of Maryland and is registered with the Securities and Exchange Commission (“SEC”) under the Investment Company Act of 1940, as amended (“1940 Act”). The Fund is a diversified open-end management investment company.
The Fund is divided into Class IA, Class IB and Class IC shares. Each class is offered at the per share net asset value (“NAV”) without a sales charge and is subject to the same expenses, except that the Class IB shares are subject to distribution and service fees charged pursuant to a Distribution Plan adopted in accordance with Rule 12b-1 under the 1940 Act and Class IC shares are subject to distribution fees charged pursuant to a Distribution Plan adopted in accordance with Rule 12b-1 under the 1940 Act and are also subject to an administrative service fee.
Significant Accounting Policies:
The following is a summary of significant accounting policies of the Fund in the preparation of its financial statements, which are in accordance with United States Generally Accepted Accounting Principles (“U.S. GAAP”). The preparation of financial statements in accordance with U.S. GAAP may require management to make estimates and assumptions that affect the reported amounts of assets and liabilities and disclosure of contingent assets and liabilities at the date of the financial statements and the reported amounts of increases and decreases in net assets from operations during the reporting period. Actual results could differ from those estimates.
Determination of Net Asset Value – The NAV of each class of the Fund's shares is determined as of the close of regular trading (normally 4:00 p.m. Eastern Time) (the “NYSE Close”) on each day that the New York Stock Exchange (the “Exchange”) is open (“Valuation Date”). Information that becomes known to the Fund after the NAV has been calculated on a particular day will not generally be used to retroactively adjust the NAV determined earlier that day.
Investment Valuation and Fair Value Measurements – For purposes of calculating the NAV, portfolio investments and other assets held by the Fund's portfolio for which market quotes are readily available are valued at market value. Market value is generally determined on the basis of last reported sales prices or official close price. If no sales are reported, market value is based on quotes obtained from a quotation reporting system, established market makers, or independent pricing services. If market prices are not readily available or are deemed unreliable, the Fund will use the fair value of the investment as determined in good faith under policies and procedures established by and under the supervision of the Company's Board of Directors. Market quotes are considered not readily available where there is an absence of current or reliable market-based data (e.g., trade information or indicative market quotes), including where events occur after the close of the relevant market, but prior to the NYSE Close, that materially affect the values of the Fund's portfolio investments or assets. In addition, market quotes are considered not readily available when, due to extraordinary circumstances, the exchanges or markets on which the investments trade do not open for trading for the entire day and no other market prices are available. In addition, prices of foreign equities that are principally traded on certain foreign markets may be adjusted daily pursuant to a fair value pricing service approved by the Board of Directors in order to reflect an adjustment for the factors occurring after the close of certain foreign markets but before the NYSE Close. Investments that are primarily traded on foreign markets may trade on days that are not business days of the Fund. The value of the foreign investments in which the Fund invests may change on days when a shareholder will not be able to purchase or redeem shares of the Fund. Fair value pricing is subjective in nature and the use of fair value pricing by the Fund may cause the NAV of its shares to differ significantly from the NAV that would have been calculated using market prices at the close of the exchange on which a portfolio investment is primarily
Hartford Capital Appreciation HLS Fund
Notes to Financial Statements – (continued)
June 30, 2014 (Unaudited)
traded. There can be no assurance that the Fund could obtain the fair market value assigned to an investment if the Fund were to sell the investment at approximately the time at which the Fund determines its NAV.
Fixed income investments (other than short-term obligations), non-exchange traded derivatives and centrally cleared swaps held by the Fund are normally valued on the basis of quotes obtained from independent pricing services or brokers and dealers in accordance with procedures established by the Company's Board of Directors. Prices obtained from independent pricing services use information provided by market makers or estimates of market values through accepted market modeling, trading and pricing conventions. Inputs to the models may include, but are not limited to, prepayment speeds, pricing spread, yield, trade information, dealer quotes, market color, cash flow models and the investment’s terms and conditions. Generally, the Fund may use fair valuation in regard to fixed income investments when the Fund holds defaulted or distressed investments or investments in a company in which a reorganization is pending. Short-term investments maturing in 60 days or less are generally valued at amortized cost, if their original term to maturity was 60 days or less, or by amortizing their value on the 61st day prior to maturity, if the original term to maturity exceeded 60 days.
Exchange traded options, futures and options on futures are valued at the settlement price or last trade price determined by the relevant exchange as of the NYSE Close. If the last trade price for exchange traded options does not fall between the bid and ask prices, the value will be the mean of the bid and ask prices as of the NYSE Close. If a last trade price is not available, the value will be the mean of the bid and ask prices as of the NYSE Close. If a mean of the bid and ask prices cannot be calculated for the day, the value will be the bid price as of the NYSE Close. In the case of over-the-counter ("OTC") options and such instruments that do not trade on an exchange, values may be supplied by a pricing service using a formula or other objective method that may take into consideration the style, direction, expiration, strike price, notional value and volatility or other special adjustments.
Investments valued in currencies other than U.S. dollars are converted to U.S. dollars using exchange rates obtained from independent pricing services for calculation of the NAV. As a result, the NAV of the Fund’s shares may be affected by changes in the value of currencies in relation to the U.S. dollar. The value of investments traded in markets outside the United States or denominated in currencies other than the U.S. dollar may be affected significantly on a day that the NYSE is closed and the market value may change on days when an investor is not able to purchase, redeem or exchange shares of the Fund.
Foreign currency contracts represent agreements to exchange currencies on specific future dates at predetermined rates. Foreign currency contracts are valued using foreign currency exchange rates and forward rates as provided by an independent pricing service on the Valuation Date.
Financial instruments for which prices are not available from an independent pricing service may be valued using market quotations obtained from one or more dealers that make markets in the respective financial instrument in accordance with procedures established by the Company's Board of Directors.
U.S. GAAP defines fair value as the price that the Fund would receive to sell an asset or pay to transfer a liability in an orderly transaction between market participants. The U.S. GAAP fair value measurement standards require disclosure of a fair value hierarchy for each major category of assets and liabilities. Various inputs are used in determining the fair value of the Fund’s investments. These inputs are summarized into three broad hierarchy levels. This hierarchy is based on whether the valuation inputs are observable or unobservable. These levels are:
Level 1 – Quoted prices in active markets for identical investments. Level 1 may include exchange traded instruments, such as domestic equities, some foreign equities, options, futures, mutual funds, exchange traded funds, rights and warrants.
Level 2 – Observable inputs other than Level 1 prices, such as quoted prices for similar investments; quoted prices in markets that are not active; or other inputs that are observable or can be corroborated by observable market data. Level 2 may include debt investments that are traded less frequently than exchange traded instruments and which are valued using independent pricing services; foreign equities, which are principally traded on certain foreign markets and are adjusted daily pursuant to a fair value pricing service in order to reflect an adjustment for the factors occurring after the close of certain foreign markets but before the NYSE Close; senior floating rate interests, which are valued using an aggregate of dealer bids; short-term investments, which are valued at amortized cost; and swaps, which are valued based upon the terms of each swap contract.
Hartford Capital Appreciation HLS Fund
Notes to Financial Statements – (continued)
June 30, 2014 (Unaudited)
Level 3 – Significant unobservable inputs that are supported by limited or no market activity. Level 3 may include financial instruments whose values are determined using indicative market quotes or require significant management judgment or estimation. These unobservable valuation inputs may include estimates for current yields, maturity/duration, prepayment speed, and indicative market quotes for comparable investments along with other assumptions relating to credit quality, collateral value, complexity of the investment structure, general market conditions and liquidity. This category may include investments where trading has been halted or there are certain restrictions on trading. While these investments are priced using unobservable inputs, the valuation of these investments reflects the best available data and management believes the prices are a reasonable representation of exit price.
The Board of Directors of the Company generally reviews and approves the “Procedures for Valuation of Portfolio Securities” at least once a year. These procedures define how investments are to be valued, including the formation and activities of a Valuation Committee. The Valuation Committee is responsible for determining in good faith the fair value of investments when the value cannot be obtained from primary pricing services or alternative sources or if the valuation of an investment as provided by the primary pricing service or alternative source is believed not to reflect the investment’s fair value as of the Valuation Date. Voting members of the Valuation Committee include the Fund's Treasurer or designee and a Vice President of the investment manager or designee. An Assistant Vice President of the Fund with legal expertise or designee is also included on the Valuation Committee as a non-voting advisory member. In addition, the Fund’s Chief Compliance Officer shall designate a member of the compliance group to attend Valuation Committee meetings as a non-voting resource, to monitor for and provide guidance with respect to compliance with these procedures. Two members of the Valuation Committee or their designees, representing different departments, shall constitute a quorum for purposes of permitting the Valuation Committee to take action. The Valuation Committee will consider all relevant factors in determining an investment’s fair value, and may seek the advice of the Fund’s sub-adviser, knowledgeable brokers, and legal counsel in making such determination. The Valuation Committee reports to the Audit Committee of the Company's Board of Directors. The Audit Committee receives quarterly written reports which include details of all fair-valued investments, including the reason for the fair valuation, and an indication, when possible, of the accuracy of the valuation by disclosing the next available reliable public price quotation or the disposition price of such investments (the “look-back” test). The Board of Directors then must consider for ratification all of the fair value determinations made during the previous quarter.
Valuation levels are not necessarily indicative of the risk associated with investing in such investments. Individual investments within any of the above mentioned asset classes may be assigned a different hierarchical level than those presented above, as individual circumstances dictate.
For additional information, refer to the Investment Valuation Hierarchy Level Summary and the Level 3 roll-forward reconciliation, if applicable, which follow the Schedule of Investments.
Investment Transactions and Investment Income – Investment transactions are recorded as of the trade date (the date the order to buy or sell is executed) for financial reporting purposes. Investments purchased or sold on a when-issued or delayed-delivery basis may be settled a month or more after the trade date. Realized gains and losses are determined on the basis of identified cost.
Dividend income from domestic securities is accrued on the ex-dividend date. In general, dividend income from foreign securities is recorded on the ex-date; however, dividend notifications in certain foreign jurisdictions may not be available in a timely manner and as a result, the Fund will record the dividend as soon as the relevant details (i.e., rate per share, payment date, shareholders of record, etc.) are publicly available. Interest income, including amortization of premium, accretion of discounts and additional principal received in-kind in lieu of cash, is accrued on a daily basis.
Foreign Currency Transactions – Assets and liabilities denominated in currencies other than U.S. dollars are translated into U.S. dollars at the exchange rates in effect on the valuation date. Purchases and sales of investments, income and expenses are translated into U.S. dollars at the exchange rates on the dates of such transactions.
The Fund does not isolate that portion of portfolio investment valuation resulting from fluctuations in the foreign currency exchange rates from the fluctuations arising from changes in the market prices of investments held. Exchange rate fluctuations are included with the net realized and unrealized gain or loss on investments in the accompanying financial statements.
Hartford Capital Appreciation HLS Fund
Notes to Financial Statements – (continued)
June 30, 2014 (Unaudited)
Net realized foreign exchange gains or losses arise from sales of foreign currencies and the difference between asset and liability amounts initially stated in foreign currencies and the U.S. dollar value of the amounts actually received or paid. Net unrealized foreign exchange gains or losses arise from changes in the value of other assets and liabilities at the end of the reporting period, resulting from changes in the exchange rates.
Joint Trading Account – The Fund may invest cash balances into a joint trading account that may be invested in one or more repurchase agreements.
Fund Share Valuation and Dividend Distributions to Shareholders – Orders for the Fund’s shares are executed in accordance with the investment instructions of the contract holders and plan participants. The NAV of the Fund’s shares is determined as of the close of business on each business day of the Exchange. The NAV is determined separately for each class of shares of the Fund by dividing the Fund’s net assets attributable to that class by the number of shares of the class outstanding. Each class of shares offered by the Fund has equal rights as to assets and voting privileges (except that shareholders of a class have exclusive voting rights regarding any matter relating solely to that class of shares). Income and non-class specific expenses are allocated daily to each class on the basis of the relative net assets of the class. Realized and unrealized gains and losses are allocated daily based on the relative net assets of each class of shares of the Fund.
Orders for the purchase of the Fund’s shares received prior to the close of the Exchange on any day the Exchange is open for business are priced at the NAV determined as of the close of the Exchange. Orders received after the close of the Exchange, or on a day on which the Exchange and/or the Fund is not open for business, are priced at the next determined NAV.
Dividends are declared pursuant to a policy adopted by the Company's Board of Directors based upon the investment performance of the Fund. The policy of the Fund is to pay dividends from net investment income and realized gains, if any, at least once a year.
Distributions from net investment income, net realized gains and capital are determined in accordance with federal income tax regulations, which may differ from U.S. GAAP with respect to character and timing. These differences may include, but are not limited to, losses deferred due to wash sale adjustments, foreign currency gains and losses, adjustments related to Passive Foreign Investment Companies ("PFICs"), Real Estate Investment Trusts ("REITs"), Regulated Investment Companies ("RICs"), certain derivatives and partnerships. Permanent book and federal income tax basis differences relating to shareholder distributions will result in reclassifications to certain of the Fund’s capital accounts (see Federal Income Taxes: Reclassification of Capital Accounts note).
Securities and Other Investments:
Repurchase Agreements – A repurchase agreement is an agreement by which a counterparty agrees to sell an investment and agrees to repurchase the investment sold from the buyer at a mutually agreed upon time and price. During the period of the repurchase agreement, the counterparty will deposit cash and or securities in a third party custodial account to serve as collateral. At the time the Fund enters into a repurchase agreement, the value of the underlying collateral, including accrued interest, will be equal to or exceed the value of the repurchase agreement. Repurchase agreements expose the Fund to counterparty risk - that is, the risk that the counterparty will not fulfill its obligations. To minimize counterparty risk, the investments that serve to collateralize the repurchase agreement are held by the Fund’s custodian in book entry or physical form in the custodial account of the Fund or in a third party custodial account. Repurchase agreements are valued at cost plus accrued interest, which approximates fair value. Repurchase agreements have master netting arrangements which allow the Fund to offset amounts owed to a counterparty with amounts owed by the counterparty, including any collateral. Upon an event of default under a master repurchase agreement, the non-defaulting party may close out all transactions traded under such agreement and net amounts owed under each transaction to one net amount payable by one party to the other. Absent an event of default, the master repurchase agreement does not result in an offset of reported amounts of assets and liabilities in the Statement of Assets and Liabilities across transactions between the Fund and the applicable counterparty. The Fund, as shown on the Schedule of Investments, had outstanding repurchase agreements and related collateral as of June 30, 2014.
Illiquid and Restricted Investments – The Fund is permitted to invest up to 15% of its net assets in illiquid investments. Illiquid investments are those that may not be sold or disposed of in the ordinary course of business within seven days, at approximately the price used to determine the Fund’s NAV. The Fund may not be able to sell illiquid investments when its sub-adviser considers it
Hartford Capital Appreciation HLS Fund
Notes to Financial Statements – (continued)
June 30, 2014 (Unaudited)
desirable to do so or may have to sell such investments at a price that is lower than the price that could be obtained if the investments were more liquid. A sale of illiquid investments may require more time and may result in higher dealer discounts and other selling expenses than does the sale of those that are liquid. Illiquid investments also may be more difficult to value due to the unavailability of reliable market quotations for such investments, and an investment in them may have an adverse impact on the Fund’s NAV. The Fund may also purchase certain restricted investments that can only be resold to certain qualified investors and may be determined to be liquid pursuant to policies and guidelines established by the Company's Board of Directors. The Fund, as shown on the Schedule of Investments, had illiquid or restricted investments as of June 30, 2014.
Investments Purchased on a When-Issued or Delayed-Delivery Basis – Delivery and payment for investments that have been purchased by the Fund on a forward commitment, or when-issued or delayed-delivery basis, take place beyond the customary settlement period. The Fund may dispose of or renegotiate a delayed-delivery transaction after it is entered into, and may sell delayed-delivery investments before they are delivered, which may result in a realized gain or loss. During this period, such investments are subject to market fluctuations, and the Fund identifies investments segregated in its records with a value at least equal to the amount of the commitment. The Fund had no when-issued or delayed-delivery investments as of June 30, 2014.
Financial Derivative Instruments:
The following disclosures contain information on how and why the Fund uses derivative instruments, the credit-risk-related contingent features in certain derivative instruments, and how derivative instruments affect the Fund’s financial position and results of operations. The location and fair value amounts of these instruments on the Statement of Assets and Liabilities and the realized gains and losses and changes in unrealized gains and losses on the Statement of Operations, each categorized by type of derivative contract, are included in the following Additional Derivative Instrument Information footnote. The derivative instruments outstanding as of period-end are disclosed in the notes to or within the Schedule of Investments for purchased options, if applicable. The amounts of realized gains and losses and changes in unrealized gains and losses on derivative instruments during the period are disclosed in the Statement of Operations.
Foreign Currency Contracts – The Fund may enter into foreign currency contracts that obligate the Fund to purchase or sell currencies at specified future dates. Foreign currency contracts are used to hedge the currency exposure associated with some or all of the Fund’s investments and/or as part of an investment strategy. Foreign currency contracts are marked to market daily and the change in value is recorded by the Fund as an unrealized gain or loss. The Fund will record a realized gain or loss when the foreign currency contract is settled.
Foreign currency contracts involve elements of market risk in excess of the amounts reflected in the Statement of Assets and Liabilities. In addition, risks may arise upon entering into these contracts from the potential inability of the counterparties to meet the terms of the contracts and from unanticipated movements in the value of the foreign currencies relative to the U.S. dollar. The Fund, as shown on the Schedule of Investments, had outstanding foreign currency contracts as of June 30, 2014.
Options Contracts – An option contract is a contract sold by one party to another party that offers the buyer the right, but not the obligation, to buy (call) or sell (put) an investment or other financial asset at an agreed-upon price during a specific period of time or on a specific date. The Fund may write (sell) covered call and put options on futures, swaps (“swaptions”), securities, commodities or currencies. “Covered” means that so long as the Fund is obligated as the writer of an option, it will own either the underlying investments or currency or an option to purchase the same underlying investments or currency having an expiration date of the covered option and an exercise price equal to or less than the exercise price of the covered option, or will pledge cash or other liquid investments having a value equal to or greater than the fluctuating market value of the option investment or currency. Writing put options increases the Fund’s exposure to the underlying instrument. Writing call options decreases the Fund’s exposure to the underlying instrument. Premiums received from writing options that expire are treated as realized gains. Premiums received from writing options that are exercised or closed are added to the proceeds or offset amounts paid on the underlying futures, swap, investment or currency transaction to determine the realized gain or loss. The Fund as a writer of an option has no control over whether the underlying instrument may be sold (call) or purchased (put) and as a result bears the market risk of an unfavorable change in the price of the instrument underlying the written option. There is the risk the Fund may not be able to enter into a closing transaction because of an illiquid market. The Fund may also purchase put and call options. Purchasing call options increases the Fund’s exposure to the underlying instrument. Purchasing put options decreases the Fund’s exposure to the underlying instrument. The Fund pays a premium, which is included on the Fund’s Statement of Assets and Liabilities as an investment and is subsequently
Hartford Capital Appreciation HLS Fund
Notes to Financial Statements – (continued)
June 30, 2014 (Unaudited)
marked to market to reflect the current value of the option. Premiums paid for purchasing options that expire are treated as realized losses. Certain options may be purchased with premiums to be determined on a future date. The premiums for these options are based upon implied volatility parameters at specified terms. The risk associated with purchasing put and call options is generally limited to the premium paid. Premiums paid for purchasing options that are exercised or closed are added to the amounts paid or offset against the proceeds on the underlying investment transaction to determine the realized gain or loss. Entering into over-the-counter options also exposes the Fund to counterparty risk. Counterparty risk is the possibility that the counterparty to the agreements may default on its obligation to perform or disagree as to the meaning of the contractual terms in the agreements.
As of June 30, 2014 the Fund had no outstanding purchased option or written option contracts. There were no transactions involving written option contracts during the six-month period ended June 30, 2014.
Additional Derivative Instrument Information:
Fair Value of Derivative Instruments on the Statement of Assets and Liabilities as of June 30, 2014:
| | | Risk Exposure Category |
| | | Interest Rate
Contracts | | | Foreign
Exchange
Contracts | | | Credit
Contracts | | | Equity
Contracts | | | Commodity
Contracts | | | Other
Contracts | | | Total | |
| Assets: | | | | | | | | | | | | | | | | | | | | | | | | | | | | |
| Unrealized appreciation on foreign currency contracts | | $ | — | | | $ | 191 | | | $ | — | | | $ | — | | | $ | — | | | $ | — | | | $ | 191 | |
| Total | | $ | — | | | $ | 191 | | | $ | — | | | $ | — | | | $ | — | | | $ | — | | | $ | 191 | |
| | | | | | | | | | | | | | | | | | | | | | | | | | | | | |
| Liabilities: | | | | | | | | | | | | | | | | | | | | | | | | | | | | |
| Unrealized depreciation on foreign currency contracts | | $ | — | | | $ | 1,122 | | | $ | — | | | $ | — | | | $ | — | | | $ | — | | | $ | 1,122 | |
| Total | | $ | — | | | $ | 1,122 | | | $ | — | | | $ | — | | | $ | — | | | $ | — | | | $ | 1,122 | |
The volume of derivatives that is presented in the Schedule of Investments is consistent with the derivative activity during the six-month period ended June 30, 2014.
The Effect of Derivative Instruments on the Statement of Operations for the six-month period ended June 30, 2014:
| | | Risk Exposure Category |
| | | Interest Rate
Contracts | | | Foreign
Exchange
Contracts | | | Credit
Contracts | | | Equity
Contracts | | | Commodity
Contracts | | | Other
Contracts | | | Total | |
| Realized Gain (Loss) on Derivatives Recognized as a Result of Operations: |
| Net realized loss on purchased option contracts | | $ | — | | | $ | — | | | $ | — | | | $ | (449 | ) | | $ | — | | | $ | — | | | $ | (449 | ) |
| Net realized gain on foreign currency contracts | | | — | | | | 59 | | | | — | | | | — | | | | — | | | | — | | | | 59 | |
| Total | | $ | — | | | $ | 59 | | | $ | — | | | $ | (449 | ) | | $ | — | | | $ | — | | | $ | (390 | ) |
| | | | | | | | | | | | | | | | | | | | | | | | | | | | | |
| Net Change in Unrealized Appreciation (Depreciation) on Derivatives Recognized as a Result of Operations: |
| Net change in unrealized appreciation of investments in purchased option contracts | | $ | — | | | $ | — | | | $ | — | | | $ | 361 | | | $ | — | | | $ | — | | | $ | 361 | |
| Net change in unrealized depreciation of foreign currency contracts | | | — | | | | (4,854 | ) | | | — | | | | — | | | | — | | | | — | | | | (4,854 | ) |
| Total | | $ | — | | | $ | (4,854 | ) | | $ | — | | | $ | 361 | | | $ | — | | | $ | — | | | $ | (4,493 | ) |
Balance Sheet Offsetting Information - Set forth below are tables which disclose both gross information and net information about instruments and transactions eligible for offset in the financial statements, and instruments and transactions that are subject to a master netting arrangement, as well as amounts related to margin, reflected as financial collateral (including cash collateral), held at clearing brokers, counterparties and the Fund’s custodian. The master netting arrangements allow the clearing brokers to net any collateral held in or on behalf of the Fund, or liabilities or payment obligations of the clearing brokers to the Fund, against any liabilities or payment obligations of the Fund to the clearing brokers. The Fund is required to deposit financial collateral (including cash collateral) at the Futures Commission Merchant's (FCM) custodian on behalf of clearing brokers and counterparties to continually meet the original and maintenance requirements established by the clearing brokers and counterparties. Such requirements are
Hartford Capital Appreciation HLS Fund
Notes to Financial Statements – (continued)
June 30, 2014 (Unaudited)
specific to the respective clearing broker or counterparty. Certain master netting arrangements may not be enforceable in a bankruptcy.
Offsetting of Financial Assets and Derivative Assets as of June 30, 2014:
| | | Gross Amounts*
of Assets
Presented in
Statement of
Assets and
Liabilities | | | Financial
Instruments with
Allowable Netting | | | Non-cash
Collateral
Received | | | Cash Collateral
Received | | | Net Amount (not
less than $0) | |
| Description | | | | | | | | | | | | | | | | | | | | |
| Unrealized appreciation on foreign currency contracts | | $ | 170 | | | $ | (97 | ) | | $ | — | | | $ | — | | | $ | 73 | |
| Total subject to a master netting or similar arrangement | | $ | 170 | | | $ | (97 | ) | | $ | — | | | $ | — | | | $ | 73 | |
* Gross amounts presented as no amounts are netted within the Statements of Assets and Liabilities.
Offsetting of Financial Liabilities and Derivative Liabilities as of June 30, 2014:
| | | Gross Amounts*
of Liabilities
Presented in
Statement of
Assets and
Liabilities | | | Financial
Instruments with
Allowable Netting | | | Non-cash
Collateral
Pledged | | | Cash Collateral
Pledged | | | Net Amount (not
less than $0) | |
| Description | | | | | | | | | | | | | | | | | | | | |
| Unrealized depreciation on foreign currency contracts | | $ | 1,100 | | | $ | (97 | ) | | $ | — | | | $ | — | | | $ | 1,003 | |
| Total subject to a master netting or similar arrangement | | $ | 1,100 | | | $ | (97 | ) | | $ | — | | | $ | — | | | $ | 1,003 | |
* Gross amounts presented as no amounts are netted within the Statement of Assets and Liabilities.
Certain derivatives held by the Fund, as of June 30, 2014, are not subject to a master netting arrangement and are excluded from the table above.
Principal Risks:
Credit risk depends largely on the perceived financial health of bond issuers. In general, the credit rating is inversely related to the credit risk of the issuer. Higher rated bonds generally are deemed to have less credit risk, while lower or unrated bonds are deemed to have higher risk of default. The share price, yield and total return of a fund that holds securities with higher credit risk may be more volatile than those of a fund that holds bonds with lower credit risk. Similar to credit risk, the Fund may be exposed to counterparty risk, or the risk that an institution or other entity with which the Fund has unsettled or open transactions will default.
The Fund’s investments expose the Fund to various risks including, but not limited to, interest rate, prepayment, extension, foreign currency and equity risks. Interest rate risk is the risk that fixed income securities will decline in value because of changes in interest rates. As nominal interest rates rise, the values of certain fixed income securities held by the Fund are likely to decrease. A nominal interest rate can be described as the sum of a real interest rate and an expected inflation rate. Fixed income securities with longer durations tend to be more sensitive to changes in interest rates, usually making them more volatile than securities with shorter durations. Duration is useful primarily as a measure of the sensitivity of a fixed income security’s market price to interest rate (i.e., yield) movements. Rising interest rates may cause prepayments to occur at a slower than expected rate, thereby effectively lengthening the maturity of the security and making the security more sensitive to interest rate changes. Prepayment and extension risk are major risks of mortgage backed securities and certain asset backed securities. For certain asset backed securities, the actual maturity may be less than the stated maturity shown in the Schedule of Investments, if applicable. As a result, the timing of income recognition relating to these securities may vary based upon the actual maturity.
If the Fund invests directly in foreign currencies or in securities that trade in, and receive revenues in, foreign currencies, or in derivatives that provide exposure to foreign currencies, it will be subject to the risk that those currencies will decline in value relative to
Hartford Capital Appreciation HLS Fund
Notes to Financial Statements – (continued)
June 30, 2014 (Unaudited)
the base currency (U.S. dollars) of the Fund, or, in the case of hedging positions, that the Fund’s base currency will decline in value relative to the currency being hedged. Currency rates in foreign countries may fluctuate significantly over short periods of time for a number of reasons, including changes in interest rates, intervention (or the failure to intervene) by U.S. or foreign governments, central banks or supranational entities, such as the International Monetary Fund, or by the imposition of currency controls or other political developments in the United States or abroad. As a result, the Fund’s investments in foreign currency denominated securities may reduce the returns of the Fund. The market values of equity securities, such as common stocks and preferred stocks, or equity related investments, such as futures and options, may decline due to general market conditions which are not specifically related to a particular company, such as real or perceived adverse economic conditions, changes in the general outlook for corporate earnings, changes in interest or currency rates or adverse investor sentiment generally. The market value of equity securities may also decline due to factors which affect a particular industry or industries, such as labor shortages or increased production costs and competitive conditions within an industry. Equity securities and equity related investments generally have greater market price volatility than fixed income securities.
Federal Income Taxes:
Federal Income Taxes – For federal income tax purposes, the Fund intends to continue to qualify as a RIC under Subchapter M of the Internal Revenue Code (“IRC”) by distributing substantially all of its taxable net investment income and net realized capital gains to its shareholders and otherwise complying with the requirements of the IRC. The Fund has distributed substantially all of its income and capital gains in prior years, if applicable, and intends to distribute substantially all of its income and capital gains prior to the next fiscal year-end. Accordingly, no provision for federal income or excise taxes has been made in the accompanying financial statements. Distributions from short-term capital gains are treated as ordinary income distributions for federal income tax purposes.
Net Investment Income (Loss), Net Realized Gains (Losses) and Distributions – Net investment income (loss) and net realized gains (losses) may differ for financial statement and tax purposes primarily because of losses deferred due to wash sale adjustments, foreign currency gains and losses, adjustments related to PFICs, REITs, RICs, certain derivatives and partnerships. The character of distributions made during the year from net investment income or net realized gains may differ from their ultimate characterization for federal income tax purposes. Also, due to the timing of dividend distributions, the fiscal year in which amounts are distributed may differ from the year that the income or realized gains (losses) were recorded by the Fund.
Distributions and Components of Distributable Earnings – The tax character of distributions paid by the Fund for the periods indicated is as follows (as adjusted for dividends payable, if applicable):
| | | For the Year Ended
December 31, 2013 | | | For the Year Ended
December 31, 2012 | |
| Ordinary Income | | $ | 85,542 | | | $ | 123,430 | |
As of December 31, 2013, the Fund’s components of distributable earnings (deficit) on a tax basis are as follows:
| | | Amount | |
| Undistributed Ordinary Income | | $ | 371,714 | |
| Undistributed Long-Term Capital Gain | �� | | 655,691 | |
| Unrealized Appreciation* | | | 1,429,790 | |
| Total Accumulated Earnings | | $ | 2,457,195 | |
| * | Differences between book-basis and tax-basis unrealized appreciation (depreciation) may be attributable to the losses deferred due to wash sale adjustments, foreign currency gains and losses, adjustments related to PFICs, REITs, RICs, certain derivatives and partnerships. |
Reclassification of Capital Accounts – The Fund may record reclassifications in its capital accounts. These reclassifications have no impact on the total net assets of the Fund. The reclassifications are a result of permanent differences between U.S. GAAP and tax accounting for such items as foreign currency, PFICs, expiration or utilization of capital loss carryforwards or net operating losses. Adjustments are made to reflect the impact these items have on current and future distributions to shareholders. Therefore, the source of the Fund’s distributions may be shown in the accompanying Statement of Changes in Net Assets as from undistributed net
Hartford Capital Appreciation HLS Fund
Notes to Financial Statements – (continued)
June 30, 2014 (Unaudited)
investment income, from accumulated net realized gains on investments or from capital depending on the type of book and tax differences that exist. For the year ended December 31, 2013, the Fund recorded reclassifications to increase (decrease) the accounts listed below:
| | | Amount | |
| Undistributed Net Investment Income (Loss) | | $ | 5,684 | |
| Accumulated Net Realized Gain (Loss) | | | (4,701 | ) |
| Capital Stock and Paid-in-Capital | | | (983 | ) |
Capital Loss Carryforward – On December 22, 2010, the Regulated Investment Company Modernization Act of 2010 (the “Act”) was enacted, which made changes to the capital loss carryforward rules. The changes are effective for taxable years beginning after the date of enactment. Under the Act, funds are permitted to carry forward capital losses for an unlimited period. Additionally, capital loss carryforwards retain their character as either short-term or long-term capital losses rather than being considered all short-term as permitted under prior regulation.
The Fund had no capital loss carryforward for U.S. federal income tax purposes as of December 31, 2013.
During the year ended December 31, 2013, the Fund utilized $435,246 of prior year capital loss carryforwards.
Accounting for Uncertainty in Income Taxes – The Fund has adopted financial reporting rules that require the Fund to analyze all open tax years, as defined by the statute of limitations, for all major jurisdictions. Generally, tax authorities can examine all tax returns filed for the last three years. The Fund does not have an examination in progress.
The Fund has reviewed all open tax years and major jurisdictions and concluded that these financial reporting rules had no effect on the Fund’s financial position or results of operations. There is no tax liability resulting from unrecognized tax benefits relating to uncertain income tax positions taken or expected to be taken on the tax return for the fiscal year ended December 31, 2013. The Fund is also not aware of any tax positions for which it is reasonably possible that the total amounts of unrecognized tax benefits will significantly change in the next twelve months.
Expenses:
Investment Management Agreement – Hartford Funds Management Company, LLC ("HFMC") serves as the Fund’s investment manager pursuant to an Investment Management Agreement with the Company. HFMC is an indirect wholly owned subsidiary of The Hartford Financial Services Group, Inc. ("The Hartford"). The investment manager has overall investment supervisory responsibility for the Fund. In addition, the investment manager provides administrative personnel, services, equipment, facilities and office space for proper operation of the Fund. HFMC has contracted with Wellington Management Company, LLP ("Wellington Management") under a sub-advisory agreement for the provision of day-to-day investment management services to the Fund in accordance with the Fund’s investment objective and policies. The Fund pays a fee to the investment manager, a portion of which may be used to compensate Wellington Management.
The schedule below reflects the rates of compensation paid to the investment manager for investment management services rendered as of June 30, 2014; the rates are accrued daily and paid monthly:
| Average Daily Net Assets | | Annual Fee |
| On first $250 million | | 0.7750% |
| On next $250 million | | 0.7250% |
| On next $500 million | | 0.6750% |
| On next $1.5 billion | | 0.6250% |
| On next $2.5 billion | | 0.6200% |
| On next $5 billion | | 0.6150% |
| Over $10 billion | | 0.6100% |
Hartford Capital Appreciation HLS Fund
Notes to Financial Statements – (continued)
June 30, 2014 (Unaudited)
Accounting Services Agreement – Pursuant to the Fund Accounting Agreement between HFMC and the Company, on behalf of the Fund, HFMC provides accounting services to the Fund and receives monthly compensation based on the Fund’s average daily net assets at the rates set forth below. The Fund’s accounting services fees are accrued daily and paid monthly.
| Average Daily Net Assets | | Annual Fee |
| On first $5 billion | | 0.018% |
| On next $5 billion | | 0.014% |
| Over $10 billion | | 0.010% |
Operating Expenses – Allocable expenses incurred by the Company are allocated to each Fund and allocated to classes within a Fund in proportion to the average daily net assets of the Fund and each class, except where allocation of certain expenses is more fairly made directly to the Fund or to specific classes within a Fund.
Fees Paid Indirectly – The Company, on behalf of the Fund, has entered into agreements with State Street Global Markets, LLC and Russell Implementation Services, Inc. to partially recapture non-discounted trade commissions. Such rebates are used to pay a portion of the Fund's expenses. For the six-month period ended June 30, 2014, this amount, if any, is included in the Statement of Operations.
The ratio of expenses to average net assets in the accompanying financial highlights excludes the reduction in expenses related to fees paid indirectly. The annualized expense ratio after waivers for the period listed below reflecting the reduction for fees paid indirectly is as follows:
| | | Annualized Six-
Month Period Ended
June 30, 2014 | |
| Class IA | | | 0.66% | |
| Class IB | | | 0.91 | |
| Class IC | | | 1.16* | |
* From April 30, 2014 (commencement of operations), through June 30, 2014.
Distribution Plan for Class IB and IC Shares – Hartford Funds Distributors, LLC (“HFD”), an indirect wholly owned subsidiary of The Hartford, is the principal underwriter and distributor of the Fund. The Company, on behalf of the Fund, has adopted Distribution Plans pursuant to Rule 12b-1 of the 1940 Act for Class IB and Class IC shares.
The Distribution Plans provide that the Fund may pay annually up to 0.25% of the average daily net assets of the Fund attributable to its Class IB shares, and 0.25% of the average daily net assets of the Fund attributable to its Class IC shares, for activities primarily intended to result in the sale of Class IB and Class IC shares, respectively. The Board has the authority to suspend or reduce these payments at any point in time. Under the terms of the Distribution Plans and the principal underwriting agreement, the Fund is authorized to make payments monthly to the distributor that may be used to pay or reimburse entities providing distribution and shareholder servicing with respect to the Class IB shares, and distribution services for Class IC shares, for such entities’ fees or expenses incurred or paid in that regard. The distribution fees paid during the period can be found on the Statement of Operations. These fees are accrued daily and paid monthly.
Administrative Services Fee for Class IC Shares - The Fund may pay an administrative services fee to third party insurance companies annually up to 0.25% of the average daily net assets of the Fund attributable to its Class IC shares for recordkeeping and/or other administrative services provided to such Class IC shares. The total administrative services fees paid during the period are shown on the Statement of Operations. This fee is accrued daily and paid monthly.
Hartford Capital Appreciation HLS Fund
Notes to Financial Statements – (continued)
June 30, 2014 (Unaudited)
Other Related Party Transactions – Hartford Administrative Services Company (“HASCO”), an indirect wholly owned subsidiary of The Hartford, provides transfer agent services to the Fund. HASCO was compensated on a per account basis for providing such services. The amount paid to HASCO can be found in the Statement of Operations. These fees are accrued daily and paid monthly.
Payment from Affiliate – In July of 2007, The Hartford entered into a settlement with the Attorneys General of the states of New York, Connecticut and Illinois relating to market timing and the company's individual variable annuity contracts in which certain payments would be made directly to the variable annuity contract holders. The distribution plan provided that unclaimed money from the settlement would be distributed to certain HLS Funds that are investment options through a Hartford individual variable annuity contract. The unclaimed money was distributed to the Fund on September 18, 2009.
The total return in the accompanying financial highlights includes a payment from an affiliate. Had the payment from the affiliate been excluded, the impact and total return for the period listed below would have been as follows:
| | | For the Year Ended December 31, 2009 | |
| | | Class IA | | | Class IB | |
| Impact from Payment from Affiliate for Attorneys General Settlement | | | —% | | | | —% | |
| Total Return Excluding Payment from Affiliate | | | 45.66% | | | | 45.30% | |
Affiliate Holdings:
As of June 30, 2014, affiliates of The Hartford had ownership of shares in the Fund as follows:
| | | Percentage of
Class | |
| Class IC | | | 95% | |
Investment Transactions:
For the six-month period ended June 30, 2014, the cost of purchases and proceeds from sales of investment securities (excluding short-term investments) were as follows:
| | | Excluding U.S.
Government
Obligations | | | U.S.
Government
Obligations | | | Total | |
| Cost of Purchases | | $ | 3,979,961 | | | $ | — | | | $ | 3,979,961 | |
| Sales Proceeds | | | 4,453,796 | | | | — | | | | 4,453,796 | |
Line of Credit:
The Fund is one of several Hartford Funds that participate in a $500 million committed revolving line of credit facility. The facility is to be used for temporary or emergency purposes. Under the arrangement, the funds are required to own securities having a market value in excess of 300% of the total bank borrowings. The interest rate on borrowings varies depending on the nature of the loan. The facility also requires a fee to be paid based on the amount of the commitment. This commitment fee is allocated to all the funds participating in the line of credit based on the average net assets of the funds. During the six-month period ended June 30, 2014, the Fund did not have any borrowings under this facility.
Industry Classifications:
Other than the industry classifications "Other Investment Pools and Funds" and "Exchange Traded Funds," equity industry classifications used in this report are the Global Industry Classification Standard, which was developed by and is the exclusive property and service mark of MSCI, Inc. and Standard & Poor's.
Hartford Capital Appreciation HLS Fund
Notes to Financial Statements – (continued)
June 30, 2014 (Unaudited)
Indemnifications:
Under the Company's organizational documents, the Company shall indemnify its officers and directors to the full extent required or permitted under Maryland General Corporation Law and the federal securities laws. In addition, the Company, on behalf of the Fund, may enter into contracts that contain a variety of indemnifications. The Company's maximum exposure under these arrangements is unknown. However, as of the date of these financial statements, the Company has not had prior claims or losses pursuant to these contracts and expects the risk of loss to be remote.
Pending Legal Proceedings:
On February 25, 2011, Jennifer L. Kasilag, Louis Mellinger, Judith M. Menendez, Jacqueline M. Robinson, and Linda A. Russell filed a derivative lawsuit against Hartford Investment Financial Services, LLC (“HIFSCO”) (now known as Hartford Funds Distributors, LLC) on behalf of six Hartford retail mutual funds in the United States District Court for the District of New Jersey, alleging that HIFSCO received excessive advisory and distribution fees in violation of its statutory fiduciary duty under Section 36(b) of the 1940 Act when serving as investment manager and principal underwriter, respectively, to the Hartford retail mutual funds. Although this action was purportedly filed on behalf of certain of the Hartford Funds, none of the Hartford Funds is itself a defendant to the suit. HIFSCO moved to dismiss and, in September 2011, the motion was granted in part and denied in part, with leave to amend the complaint. In November 2011, plaintiffs filed an amended complaint on behalf of certain Hartford retail mutual funds, The Hartford Global Health Fund (now known as The Hartford Healthcare Fund), The Hartford Conservative Allocation Fund, The Hartford Growth Opportunities Fund, The Hartford Inflation Plus Fund, The Hartford Advisers Fund (now known as The Hartford Balanced Fund), and The Hartford Capital Appreciation Fund. Plaintiffs seek to rescind the investment management agreements and distribution plans between HIFSCO and these funds and to recover the total fees charged thereunder or, in the alternative, to recover any improper compensation HIFSCO received, in addition to lost earnings. HIFSCO filed a partial motion to dismiss the amended complaint and, in December 2012, the court dismissed without prejudice the claims regarding distribution fees and denied the motion with respect to the advisory fees claims. HIFSCO disputes the allegations and intends to defend vigorously.
In March 2014, the plaintiffs filed a new complaint that added as new plaintiffs The Hartford Floating Rate Fund and The Hartford Small Company Fund and named as a defendant Hartford Funds Management Company, LLC (the “Investment Manager”), which assumed the role as investment adviser to the funds as of January 2013. The Investment Manager and HIFSCO dispute the allegations and intend to defend vigorously.
This action concerns the activities of HIFSCO in its capacity as investment manager and principal underwriter to the Hartford retail mutual funds and does not concern HIFSCO’s activities in its capacity as principal underwriter to the HLS funds. For this reason, no accrual for litigation relating to this matter has been recorded in the financial statements of the Fund.
Hartford Capital Appreciation HLS Fund
| | | ─ Selected Per-Share Data(A) ─ | | | ─ Ratios and Supplemental Data ─ | |
| Class | | Net Asset
Value at
Beginning
of Period | | | Net
Investment
Income
(Loss) | | | Net
Realized
and
Unrealized
Gain (Loss)
on
Investments | | | Total from
Investment
Operations | | | Dividends
from Net
Investment
Income | | | Distributions
from
Realized
Capital
Gains | | | Total
Dividends
and
Distributions | | | Net
Asset
Value at
End of
Period | | | Total
Return(B) | | | Net Assets
at End of
Period
(000s) | | | Ratio of
Expenses
to
Average
Net
Assets
Before
Adjust-
ments(C) | | | Ratio of
Expenses
to
Average
Net
Assets
After
Adjust-
ments(C) | | | Ratio of
Net
Investment
Income
(Loss) to
Average
Net Assets | |
| |
| For the Six-Month Period Ended June 30, 2014 (Unaudited) |
| IA | | $ | 59.65 | | | $ | 0.38 | | | $ | 2.94 | | | $ | 3.32 | | | $ | – | | | $ | – | | | $ | – | | | $ | 62.97 | | | | 5.57 | %(D) | | $ | 6,856,638 | | | | 0.66 | %(E) | | | 0.66 | %(E) | | | 1.27 | %(E) |
| IB | | | 59.18 | | | | 0.30 | | | | 2.91 | | | | 3.21 | | | | – | | | | – | | | | – | | | | 62.39 | | | | 5.42 | (D) | | | 837,374 | | | | 0.91 | (E) | | | 0.91 | (E) | | | 1.01 | (E) |
| IC(F) | | | 60.21 | | | | 0.12 | | | | 2.59 | | | | 2.71 | | | | – | | | | – | | | | – | | | | 62.92 | | | | 4.50 | (D) | | | 110 | | | | 1.16 | (E) | | | 1.16 | (E) | | | 1.11 | (E) |
| | | | | | | | | | | | | | | | | | | | | | | | | | | | | | | | | | | | | | | | | | | | | | | | | | | | | |
| For the Year Ended December 31, 2013 |
| IA | | $ | 43.37 | | | $ | 0.45 | | | $ | 16.49 | | | $ | 16.94 | | | $ | (0.51 | ) | | $ | (0.15 | ) | | $ | (0.66 | ) | | $ | 59.65 | | | | 39.08 | % | | $ | 7,029,201 | | | | 0.67 | % | | | 0.67 | % | | | 0.88 | % |
| IB | | | 43.05 | | | | 0.32 | | | | 16.33 | | | | 16.65 | | | | (0.37 | ) | | | (0.15 | ) | | | (0.52 | ) | | | 59.18 | | | | 38.72 | | | | 969,611 | | | | 0.92 | | | | 0.92 | | | | 0.63 | |
| | | | | | | | | | | | | | | | | | | | | | | | | | | | | | | | | | | | | | | | | | | | | | | | | | | | | |
| For the Year Ended December 31, 2012 (G) |
| IA | | $ | 37.20 | | | $ | 0.57 | | | $ | 6.24 | | | $ | 6.81 | | | $ | (0.64 | ) | | $ | – | | | $ | (0.64 | ) | | $ | 43.37 | | | | 18.34 | % | | $ | 7,750,924 | | | | 0.67 | % | | | 0.67 | % | | | 1.24 | % |
| IB | | | 36.90 | | | | 0.52 | | | | 6.14 | | | | 6.66 | | | | (0.51 | ) | | | – | | | | (0.51 | ) | | | 43.05 | | | | 18.04 | | | | 874,386 | | | | 0.92 | | | | 0.92 | | | | 0.99 | |
| | | | | | | | | | | | | | | | | | | | | | | | | | | | | | | | | | | | | | | | | | | | | | | | | | | | | |
| For the Year Ended December 31, 2011 (G) |
| IA | | $ | 42.36 | | | $ | 0.37 | | | $ | (5.20 | ) | | $ | (4.83 | ) | | $ | (0.33 | ) | | $ | – | | | $ | (0.33 | ) | | $ | 37.20 | | | | (11.41 | )% | | $ | 8,169,178 | | | | 0.67 | % | | | 0.67 | % | | | 0.95 | % |
| IB | | | 42.00 | | | | 0.32 | | | | (5.20 | ) | | | (4.88 | ) | | | (0.22 | ) | | | – | | | | (0.22 | ) | | | 36.90 | | | | (11.62 | ) | | | 1,102,054 | | | | 0.92 | | | | 0.92 | | | | 0.71 | |
| | | | | | | | | | | | | | | | | | | | | | | | | | | | | | | | | | | | | | | | | | | | | | | | | | | | | |
| For the Year Ended December 31, 2010 (G) |
| IA | | $ | 36.63 | | | $ | 0.30 | | | $ | 5.72 | | | $ | 6.02 | | | $ | (0.29 | )(H) | | $ | – | | | $ | (0.29 | ) | | $ | 42.36 | | | | 16.50 | % | | $ | 8,889,906 | | | | 0.67 | % | | | 0.67 | % | | | 0.77 | % |
| IB | | | 36.32 | | | | 0.21 | | | | 5.66 | | | | 5.87 | | | | (0.19 | )(H) | | | – | | | | (0.19 | ) | | | 42.00 | | | | 16.21 | | | | 1,522,218 | | | | 0.92 | | | | 0.92 | | | | 0.52 | |
| | | | | | | | | | | | | | | | | | | | | | | | | | | | | | | | | | | | | | | | | | | | | | | | | | | | | |
| For the Year Ended December 31, 2009 (G) |
| IA | | $ | 25.34 | | | $ | 0.31 | | | $ | 11.27 | | | $ | 11.58 | | | $ | (0.29 | ) | | $ | – | | | $ | (0.29 | ) | | $ | 36.63 | | | | 45.67 | %(I) | | $ | 8,410,214 | | | | 0.68 | % | | | 0.68 | % | | | 1.03 | % |
| IB | | | 25.14 | | | | 0.25 | | | | 11.14 | | | | 11.39 | | | | (0.21 | ) | | | – | | | | (0.21 | ) | | | 36.32 | | | | 45.30 | (I) | | | 1,595,912 | | | | 0.93 | | | | 0.93 | | | | 0.79 | |
| (A) | Information presented relates to a share outstanding throughout the indicated period. Net investment income (loss) per share amounts are calculated based on average shares outstanding unless otherwise noted. |
| (B) | The figures do not include sales charges or other fees which may be applied at the variable life insurance, variable annuity or qualified retirement plan product level. Any such additional sales charges or other fees would lower the Fund's performance. |
| (C) | Adjustments include waivers and reimbursements, if applicable. Ratios do not include fees paid indirectly (see Expenses in the accompanying Notes to Financial Statements). |
| (F) | Commenced operations on April 30, 2014. |
| (G) | Net investment income (loss) per share amounts have been calculated using the SEC method. |
| (H) | The impact of Distributions from Capital was ($0.03). |
| (I) | Total return without the inclusion of the Payment from (to) Affiliate can be found in Expenses in the accompanying Notes to Financial Statements. |
| | | Portfolio Turnover
Rate for
All Share Classes | |
| For the Six-Month Period Ended June 30, 2014 (Unaudited) | | | 49% | |
| For the Year Ended December 31, 2013 | | | 86 | |
| For the Year Ended December 31, 2012 | | | 142 | |
| For the Year Ended December 31, 2011 | | | 113 | |
| For the Year Ended December 31, 2010 | | | 95 | |
| For the Year Ended December 31, 2009 | | | 128 | |
Hartford Capital Appreciation HLS Fund
Directors and Officers (Unaudited) |
The Board of Directors of the Company (the "Directors") appoints officers who are responsible for the day-to-day operations of the Fund and who execute policies formulated by the Directors. Each Director serves until his or her death, resignation, or retirement or until the next annual meeting of shareholders is held or until his or her successor is elected and qualifies.
Directors and officers who are employed by or who have a financial interest in The Hartford are considered “interested” persons of the Fund pursuant to the 1940 Act. Each officer and two of the Company's Directors, as noted in the chart below, are “interested” persons of the Fund. Each Director serves as a director for The Hartford Mutual Funds, Inc., The Hartford Mutual Funds II, Inc., Hartford Series Fund, Inc., and Hartford HLS Series Fund II, Inc., and as a trustee for The Hartford Alternative Strategies Fund, which, as of June 30, 2014, collectively consist of 78 funds. Correspondence may be sent to Directors and officers c/o Hartford Funds, 5 Radnor Corporate Center, Suite 300, 100 Matsonford Road, Radnor, Pennsylvania 19087, except that correspondence to Mr. Annoni, Mr. Dressen and Ms. Quade may be sent to 500 Bielenberg Drive, Suite 500, Woodbury, Minnesota 55125.
The table below sets forth, for each Director and officer, his or her name, year of birth, current position with the Company and date first elected or appointed to Hartford Series Fund, Inc. ("HSF") and Hartford HLS Series Fund II, Inc. ("HSF2"), principal occupation, and, for Directors, other directorships held. The Fund’s Statement of Additional Information contains further information on the Directors and is available free of charge by calling 1-888-843-7824 or writing to: Hartford HLS Funds, c/o Hartford Life Insurance Company/Hartford Life and Annuity Insurance Company, P.O. Box 14293, Lexington, KY 40512-4293 for variable annuity and variable life insurance separate accounts of Hartford Life Insurance Company and its affiliates; Hartford Funds, P.O. Box 55022, Boston, MA 02205-5022 for all shareholders except variable annuity and variable life insurance separate accounts of Hartford Life Insurance Company and its affiliates.
Information on the aggregate remuneration paid to the directors of the Company can be found in the Statement of Operations herein. The Fund pays to The Hartford a portion of the Chief Compliance Officer’s compensation, but does not pay salaries or compensation to any of its other officers or Directors who are employed by The Hartford.
Non-Interested Directors
Lynn S. Birdsong (1946) Director since 2003, Co-Chairman of the Investment Committee since 2005
Mr. Birdsong is a private investor. Mr. Birdsong currently serves as a Director of the Sovereign High Yield Investment Company (April 2010 to current). Mr. Birdsong currently serves as an Independent Director of Nomura Partners Funds, Inc. (formerly, The Japan Fund) (April 2003 to current). From 2003 to March 2005, Mr. Birdsong was an Independent Director of the Atlantic Whitehall Funds. From 1979 to 2002, Mr. Birdsong was a Managing Director of Zurich Scudder Investments, an investment management firm. During his employment with Scudder, Mr. Birdsong was an Interested Director of The Japan Fund. From January 1981 through December 2013, Mr. Birdsong was a partner in Birdsong Company, an advertising specialty firm.
Robert M. Gavin, Jr. (1940) Director since 2002 (HSF) and 1986 (HSF2), Chairman of the Board since 2004
Dr. Gavin is an educational consultant. Prior to September 1, 2001, he was President of Cranbrook Education Community and prior to July 1996, he was President of Macalester College, St. Paul, Minnesota.
Duane E. Hill (1945) Director since 2001 (HSF) and 2002 (HSF2), Chairman of the Nominating Committee since 2003
Mr. Hill is a Partner of TSG Ventures L.P., a private equity investment company. Mr. Hill is a former partner of TSG Capital Group, a private equity investment firm that served as sponsor and lead investor in leveraged buyouts of middle market companies.
Sandra S. Jaffee (1941) Director since 2005
Ms. Jaffee is the founder and Chief Executive Officer of a private company, Homeworks Concierge, LLC, which provides residential property management services in Westchester County, New York (January 2012 to present). Ms. Jaffee served as Chairman (2008 to 2009) and Chief Executive Officer of Fortent (formerly Searchspace Group), a leading provider of compliance/regulatory technology to financial institutions from August 2005 to August 2009. From August 2004 to August 2005, Ms. Jaffee served as an Entrepreneur in Residence with Warburg Pincus, a private equity firm. Prior to joining Warburg Pincus, Ms. Jaffee served as Executive Vice President at Citigroup, from September 1995 to July 2004, where she was President and Chief Executive Officer of Citibank’s Global Securities Services (1995 to 2003). Ms. Jaffee currently serves as a member of the Board of Directors of Broadridge Financial Solutions as well as a Trustee of Muhlenberg College.
Hartford Capital Appreciation HLS Fund
Directors and Officers (Unaudited) – (continued) |
William P. Johnston (1944) Director since 2005, Chairman of the Compliance Committee since 2005
In June 2006, Mr. Johnston was appointed as Senior Advisor to The Carlyle Group, a global private equity and other alternative asset investment firm and currently serves as an Operating Executive. In July 2006, Mr. Johnston was elected to the Board of Directors of MultiPlan, Inc. and served as a Director (July 2006 to August 2010). In August 2007, Mr. Johnston was elected to the Board of Directors of LifeCare Holdings, Inc. and served as a Director (August 2007 to June 2013). In February 2008, Mr. Johnston was elected to the Board of Directors of HCR-ManorCare, Inc. In May 2006, Mr. Johnston was elected to the Supervisory Board of Fresenius Medical Care AG & Co. KGaA, after its acquisition of Renal Care Group, Inc. in March 2006. Mr. Johnston joined Renal Care Group in November 2002 as a member of the Board of Directors and served as Chairman of the Board from March 2003 through March 2006. From 2002 through 2013, Mr. Johnston served as a Board member of the Georgia O’Keefe Museum. From September 1987 to December 2002, Mr. Johnston was with Equitable Securities Corporation (and its successors, SunTrust Equitable Securities and SunTrust Robinson Humphrey) serving in various investment banking and managerial positions, including Managing Director and Head of Investment Banking, Chief Executive Officer and Vice Chairman.
Phillip O. Peterson (1944) Director since 2002 (HSF) and 2000 (HSF2), Chairman of the Audit Committee since 2002
Mr. Peterson is a mutual fund industry consultant. He was a partner of KPMG LLP (an accounting firm) until July 1999. Mr. Peterson joined William Blair Funds in February 2007 as a member of the Board of Trustees. From February 2012 to February 2014, Mr. Peterson served as a Trustee of Symetra Variable Mutual Funds. From January 2004 to April 2005, Mr. Peterson served as Independent President of the Strong Mutual Funds.
Lemma W. Senbet (1946) Director since 2005
Dr. Senbet is the William E. Mayer Chair Professor of Finance and Founding Director, Center for Financial Policy, at the University of Maryland, Robert H. Smith School of Business. He was chair of the Finance Department of the University of Maryland, Robert H. Smith School of Business from 1998 to 2006. Since June 2013, he has been on leave from the University to serve as Executive Director of African Economic Research Consortium which focuses on economic policy research and training. Previously, he was a chaired professor of finance at the University of Wisconsin-Madison. Also, he was a Director of the Fortis Funds from March 2000 to July 2002. Dr. Senbet served as Director of the American Finance Association and President of the Western Finance Association. In 2006, Dr. Senbet was inducted Fellow of Financial Management Association International for his career-long distinguished scholarship and professional service.
Interested Directors and Officers
James E. Davey (1964) Director since 2012, President and Chief Executive Officer since 2010
Mr. Davey serves as Executive Vice President of Hartford Life Insurance Company (“HLIC”) and The Hartford Financial Services Group, Inc. Additionally, Mr. Davey serves as Chairman of the Board, Manager and Senior Managing Director of Hartford Funds Distributors, LLC (“HFD”). He also currently serves as Director, Chairman of the Board, President and Senior Managing Director of Hartford Administrative Services Company (“HASCO”). Mr. Davey also serves as Manager, Chairman of the Board and Senior Managing Director for Hartford Funds Management Company, LLC (“HFMC”) and Director, Chairman of the Board and Senior Managing Director for Hartford Funds Management Group, Inc. ("HFMG"). Mr. Davey has served in various positions within The Hartford and its subsidiaries in connection with the operation of the Hartford Funds. Mr. Davey joined The Hartford in 2002.
Lowndes A. Smith (1939) Director since 1996 (HSF) and 2002 (HSF2), Co-Chairman of the Investment Committee since 2005
Mr. Smith served as Vice Chairman of The Hartford from February 1997 to January 2002, as President and Chief Executive Officer of Hartford Life, Inc. from February 1997 to January 2002, and as President and Chief Operating Officer of The Hartford Life Insurance Companies from January 1989 to January 2002. Mr. Smith serves as a Director of White Mountains Insurance Group Ltd. (October 2003 to current); One Beacon Insurance (October 2006 to current); Symetra Financial (August 2007 to current) and is a Managing Director of Whittington Gray Associates (January 2007 to current).
Other Officers
Mark A. Annoni (1964) Vice President, Controller and Treasurer since 2012
Mr. Annoni currently serves as the Assistant Vice President of HLIC (February 2004 to present) and Senior Vice President of HFMG (December 2013 to present). Mr. Annoni has served in various positions within The Hartford and its subsidiaries in connection with the operation of the Hartford Funds. Mr. Annoni joined The Hartford in 2001.
Hartford Capital Appreciation HLS Fund
Directors and Officers (Unaudited) – (continued) |
Michael R. Dressen (1963) AML Compliance Officer since 2011
Mr. Dressen currently serves as Assistant Vice President of HLIC. He also serves as Chief Compliance Officer and AML Compliance Officer of HASCO and as AML Officer of HFD. Mr. Dressen has served in various positions within The Hartford and its subsidiaries in connection with the operation of the Hartford Funds.
Edward P. Macdonald (1967) Vice President, Secretary and Chief Legal Officer since 2005
Mr. Macdonald currently serves as Assistant Secretary, Executive Vice President and Deputy General Counsel of HFD, HASCO, HFMC and HFMG. He also serves as Vice President of HLIC. Mr. Macdonald has served in various positions within The Hartford and its subsidiaries in connection with the operation of the Hartford Funds. Mr. Macdonald joined The Hartford in 2005.
Joseph G. Melcher (1973) Vice President and Chief Compliance Officer since 2013
Mr. Melcher currently serves as Executive Vice President of HFD, HFMG and HASCO. Mr. Melcher also currently serves as Executive Vice President and Chief Compliance Officer of HFMC. Mr. Melcher has served in various positions within The Hartford and its subsidiaries in connection with the operation of the Hartford Funds since joining The Hartford in 2012. Prior to joining The Hartford, Mr. Melcher worked at Touchstone Investments, a member of the Western & Southern Financial Group, where he held the position of Vice President and Chief Compliance Officer from 2010 through 2012 and Assistant Vice President, Compliance from 2005 to 2010.
Vernon J. Meyer (1964) Vice President since 2006
Mr. Meyer currently serves as Senior Vice President of HLIC. He also currently serves as Managing Director and Chief Investment Officer of HFMC and Managing Director of HFMG. Mr. Meyer has served in various positions within The Hartford and its subsidiaries in connection with the operation of the Hartford Funds. Mr. Meyer joined The Hartford in 2004.
Laura S. Quade (1969) Vice President since 2012
Ms. Quade currently serves as Vice President of HASCO, HFD and HFMG. She is the Head of Operations of HASCO and also serves as Director, Enterprise Operations of HLIC. Ms. Quade has served in various positions within The Hartford and its subsidiaries in connection with the operation of the Hartford Funds.
Martin A. Swanson (1962) Vice President since 2010
Mr. Swanson currently serves as Vice President of HLIC. Mr. Swanson also serves as Managing Director, Chief Marketing Officer and Principal of HFD and Managing Director of HFMG. Mr. Swanson has served in various positions within The Hartford and its subsidiaries in connection with the operation of the Hartford Funds.
HOW TO OBTAIN A COPY OF THE FUND’S PROXY VOTING POLICIES AND VOTING RECORDS (UNAUDITED)
A description of the policies and procedures that the Fund uses to determine how to vote proxies relating to portfolio securities and information about how the Fund voted proxies relating to portfolio securities during the most recent twelve-month period ended June 30 are available (1) without charge, upon request, by calling 888-843-7824 and (2) on the SEC’s website at http://www.sec.gov.
QUARTERLY PORTFOLIO HOLDINGS INFORMATION (UNAUDITED)
The Fund files a complete schedule of portfolio holdings with the SEC for the first and third quarters of each fiscal year on Form N-Q. The Fund’s Forms N-Q are available (1) without charge, upon request, by calling 888-843-7824 and (2) on the SEC’s website at http://www.sec.gov. The Form N-Q may be reviewed and copied at the SEC’s Public Reference Room in Washington, DC. Information on the operation of the Public Reference Room may be obtained by calling 1-800-SEC-0330.
Hartford Capital Appreciation HLS Fund
| Expense Example (Unaudited) |
Your Fund's Expenses
As a shareholder of the Fund, you incur two types of costs: (1) transaction costs and (2) ongoing costs, including investment management fees, distribution and/or service (12b-1) fees, if any, and other fund expenses. This example is intended to help you understand your ongoing costs (in dollars) of investing in the Fund and to compare these costs with the ongoing costs of investing in other mutual funds. The example is based on an investment of $1,000 invested at the beginning of the period and held for the entire period of December 31, 2013 through June 30, 2014.
Actual Expenses
The first set of columns of the table below provides information about actual account values and actual expenses. You may use the information in this column, together with the amount you invested, to estimate the expenses that you paid over the period. Simply divide your account value by $1,000 (for example, an $8,600 account value divided by $1,000 = 8.6), then multiply the result by the number in the line under the heading entitled “Expenses Paid During Period” to estimate the expenses you paid on your account during this period.
Hypothetical Example for Comparison Purposes
The second set of columns of the table below provides information about hypothetical account values and hypothetical expenses based on the Fund's actual expense ratio and an assumed rate of return of 5% per year before expenses, which is not the Fund's actual return. The hypothetical account values and expenses may not be used to estimate the actual ending account balance or expenses you paid for the period. You may use this information to compare the ongoing costs of investing in the Fund and other funds. To do so, compare this 5% hypothetical example with the 5% hypothetical examples that appear in the shareholder reports of the other funds.
Please note that the expenses shown in the table are meant to highlight your ongoing costs only and do not reflect any transactional costs, such as sales charges (loads) and CDSC. Therefore, the second set of columns of the table is useful in comparing ongoing costs only, and will not help you determine the relative total costs of owning different funds. In addition, if these transactional costs were included, your costs would be higher. Expenses are equal to the Fund's annualized expense ratios multiplied by average account value over the period, multiplied by 181/365 (to reflect the one-half year period).
| | | Actual return | | | Hypothetical (5% return before expenses) | | | | | | | | | | |
| | | Beginning
Account Value
December 31,
2013 | | | Ending Account
Value
June 30, 2014 | | | Expenses paid
during the period
December 31, 2013
through
June 30, 2014 | | | Beginning
Account Value
December 31,
2013 | | | Ending Account
Value
June 30, 2014 | | | Expenses paid
during the period
December 31,
2013
through
June 30, 2014 | | | Annualized
expense
ratio | | | Days
in the
current
1/2
year | | | Days
in the
full
year | |
| Class IA | | $ | 1,000.00 | | | $ | 1,055.70 | | | $ | 3.36 | | | $ | 1,000.00 | | | $ | 1,021.52 | | | $ | 3.31 | | | | 0.66 | % | | | 181 | | | | 365 | |
| Class IB | | $ | 1,000.00 | | | $ | 1,054.20 | | | $ | 4.63 | | | $ | 1,000.00 | | | $ | 1,020.28 | | | $ | 4.56 | | | | 0.91 | | | | 181 | | | | 365 | |
| Class IC* | | $ | 1,000.00 | | | $ | 1,045.00 | | | $ | 1.98 | | | $ | 1,000.00 | | | $ | 1,006.42 | | | $ | 1.94 | | | | 1.16 | | | | 61 | | | | 365 | |
| * Commenced operations on April 30, 2014. |
Hartford Capital Appreciation HLS Fund
The main risks of investing in the Fund are described below.
Market, Selection and Strategy Risk: The Fund’s share price may fluctuate due to market risk and/or security selections that may underperform the market or relevant benchmarks. If the sub-adviser's investment strategy does not perform as expected, the Fund could underperform its peers or lose money. There is no guarantee the Fund will achieve its stated objective.
Small/Mid-cap Stock Risk: Small- and mid-cap stocks are generally more volatile and risky and may be less liquid than large-cap stocks because they may have limited operating histories, narrow product lines, and focus on niche markets.
Foreign Investment and Emerging Markets Risk: Investments in foreign securities may be riskier than investments in U.S. securities. Potential risks include the risks of illiquidity, increased price volatility, less government regulation, less extensive and less frequent accounting and other reporting requirements, unfavorable changes in currency exchange rates, and economic and political disruptions. These risks are generally greater for investments in emerging markets.
Asset Allocation Strategy Risk: The portfolio managers' asset allocation strategy may not always work as intended, and asset allocation does not guarantee better performance or reduce the risk of investment loss. The investment styles employed by the portfolio managers may not be complimentary, which could adversely affect the performance of the Fund.
Active Trading Risk: Actively trading investments may result in higher costs (thus affecting performance).
THIS PRIVACY POLICY IS NOT PART OF THIS REPORT
Privacy Policy and Practices of The Hartford Financial Services Group, Inc. and its Affiliates
(herein called “we, our and us”)
This Privacy Policy applies to our United States Operations
We value your trust. We are committed to the responsible: a) management; b) use; and c) protection; of Personal Information. This notice describes how we collect, disclose, and protect Personal Information. We collect Personal Information to: a) service your Transactions with us; and b) support our business functions. We may obtain Personal Information from: a) You; b) your Transactions with us; and c) third parties such as a consumer-reporting agency. Based on the type of product or service You apply for or get from us, Personal Information such as: a) your name; b) your address; c) your income; d) your payment; or e) your credit history; may be gathered from sources such as applications, Transactions, and consumer reports. To serve You and service our business, we may share certain Personal Information. We will share Personal Information, only as allowed by law, with affiliates such as: a) our insurance companies; b) our employee agents; c) our brokerage firms; and d) our administrators. As allowed by law, we may share Personal Financial Information with our affiliates to: a) market our products; or b) market our services; to You without providing You with an option to prevent these disclosures. | | | We may also share Personal Information, only as allowed by law, with unaffiliated third parties including: a) independent agents; b) brokerage firms; c) insurance companies; d) administrators; and e) service providers; who help us serve You and service our business. When allowed by law, we may share certain Personal Financial Information with other unaffiliated third parties who assist us by performing services or functions such as: a) taking surveys; b) marketing our products or services; or c) offering financial products or services under a joint agreement between us and one or more financial institutions. We, and third parties we partner with, may track some of the pages You visit through the use of: a) cookies; b) pixel tagging; or c) other technologies; and currently do not process or comply with any web browser’s “do not track” signal or similar mechanism that indicates a request to disable online tracking of individual users who visit our websites or use our services. We will not sell or share your Personal Financial Information with anyone for purposes unrelated to our business functions without offering You the opportunity to: a) “opt-out;” or b) “opt-in;” as required by law. We only disclose Personal Health Information with: a) your proper written authorization; or b) as otherwise allowed or required by law. Our employees have access to Personal Information in the course of doing their jobs, such as: a) underwriting policies; b) paying claims; c) developing new products; or d) advising customers of our products and services. |
We use manual and electronic security procedures to maintain: a) the confidentiality; and b) the integrity of; Personal Information that we have. We use these procedures to guard against unauthorized access. Some techniques we use to protect Personal Information include: a) secured files; b) user authentication; c) encryption; d) firewall technology; and e) the use of detection software. We are responsible for and must: a) identify information to be protected; b) provide an adequate level of protection for that data; c) grant access to protected data only to those people who must use it in the performance of their job-related duties. Employees who violate our Privacy Policy will be subject to discipline, which may include ending their employment with us. At the start of our business relationship, we will give You a copy of our current Privacy Policy. We will also give You a copy of our current Privacy Policy once a year if You maintain a continuing business relationship with us. We will continue to follow our Privacy Policy regarding Personal Information even when a business relationship no longer exists between us. | | | As used in this Privacy Notice: Application means your request for our product or service. Personal Financial Information means financial information such as: a) credit history; b) income; c) financial benefits; or d) policy or claim information. Personal Health Information means health information such as: a) your medical records; or b) information about your illness, disability or injury. Personal Information means information that identifies You personally and is not otherwise available to the public. It includes: a) Personal Financial Information; and b) Personal Health Information. Transaction means your business dealings with us, such as: a) your Application; b) your request for us to pay a claim; and c) your request for us to take an action on your account. You means an individual who has given us Personal Information in conjunction with: a) asking about; b) applying for; or c) obtaining; a financial product or service from us if the product or service is used mainly for personal, family, or household purposes. |
This Privacy Policy is being provided on behalf of the following affiliates of The Hartford Financial Services Group, Inc.:
1stAGChoice, Inc.; Access CoverageCorp, Inc.; Access CoverageCorp Technologies, Inc.; American Maturity Life Insurance Company; Archway 60 R, LLC; Business Management Group, Inc.; Champlain Life Reinsurance Company; DMS R, LLC; Eloy R, LLC; Ersatz Corporation; First State Insurance Company; Hartford Accident and Indemnity Company; Hartford Administrative Services Company; Hartford Casualty General Agency, Inc.; Hartford Casualty Insurance Company; Hartford-Comprehensive Employee Benefit Service Company; Hartford Equity Sales Company, Inc.; Hartford Fire General Agency, Inc.; Hartford Fire Insurance Company; Hartford Funds Management Company, LLC; Hartford Funds Management Group, Inc.; Hartford HLS Series Fund II, Inc.; Hartford Insurance Company of Illinois; Hartford Insurance Company of the Midwest; Hartford Insurance Company of the Southeast; Hartford Integrated Technologies, Inc.; Hartford International Life Reassurance Corporation; Hartford Funds Distributors, LLC; Hartford Investment Management Company; Hartford Life and Accident Insurance Company; Hartford Life and Annuity Insurance Company; Hartford Life Insurance Company; Hartford Life Private Placement, LLC; Hartford Lloyd’s Corporation; Hartford Lloyd’s Insurance Company; Hartford Mezzanine Investors I, LLC; Hartford Residual Market, L.C.C.; Hartford Retirement Services, LLC; Hartford Securities Distribution Company, Inc.; Hartford Series Fund, Inc.; Hartford Specialty Insurance Services of Texas, LLC; Hartford Strategic Investments, LLC; Hartford Underwriters Insurance Company; Hartford Technology Services Company, L.L.C.; Hartford of Texas General Agency, Inc.; Hartford Underwriters General Agency, Inc.; HARTRE Company, L.C.C.; HL Investment Advisors, LLC; HLA LLC; Horizon Management Group, LLC; HRA Brokerage Services, Inc.; Lanidex Class B, LLC; M-CAP Insurance Agency, LLC; New England Insurance Company; New England Reinsurance Corporation; Nutmeg Insurance Agency, Inc.; Nutmeg Insurance Company; Pacific Insurance Company, Limited; Planco, LLC: Property and Casualty Insurance Company of Hartford; Revere R, LLC; RVR R, LLC; Sentinel Insurance Company, Ltd.; Sunstone R, LLC; Symphony R, LLC; The Evergreen Group Incorporated; The Hartford Alternative Strategies Fund; The Hartford Mutual Funds, Inc.; The Hartford Mutual Funds II, Inc.; Trumbull Flood Management, L.L.C.; Trumbull Insurance Company; Twin City Fire Insurance Company; White River Life Reinsurance Company.
HPP Revised January 2014
HARTFORD HLS FUNDS
P.O. Box 14293
Lexington, KY 40512-4293
HARTFORDFUNDS
hartfordfunds.com
Hartford Series Fund, Inc. is underwritten and distributed by Hartford Funds Distributors, LLC.
Hartford Series Fund, Inc. inception dates range from 1977 to date. Hartford Series Fund, Inc. is not a subsidiary of The Hartford Financial Services Group, Inc. ("The Hartford") but is underwritten, distributed by and advised by subsidiaries of The Hartford. Investments in Hartford Series Fund, Inc. are not guaranteed by The Hartford or any other entity.
This report is submitted for the general information of the shareholders of the Funds. It is not authorized for distribution unless preceded or accompanied by a current prospectus for the Funds.
Investors should carefully consider the investment objectives, risks, charges, and expenses of Hartford Funds before investing. This and other information can be found in the prospectus, which can be obtained by calling 800-862-6668 (or 800-279-1541 for institutional investors). Investors should read them carefully before they invest.
HLSSAR-CA14 8-14 115337-1 Printed in U.S.A.
HARTFORDFUNDS
| | HARTFORD DISCIPLINED EQUITY HLS FUND 2014 Semi Annual Report |
A MESSAGE FROM THE PRESIDENT
Dear Fellow Shareholders:
Thank you for investing in Hartford HLS Funds.
Market Review
U.S. equities (as represented by the S&P 500 Index) started 2014 on a shaky note after posting a strong 32.39% gain in 2013. However, stocks managed to maintain modest gains throughout the first quarter and returned to a generally steady climb in the second quarter. Through June 30, 2014, the S&P 500 Index advanced 7.14%. It appears that much of the market volatility during the year can be attributed to heightened international tensions. In particular, the Russian annexation of Ukraine’s Crimean Peninsula and increased tensions in Iraq were cause for concern.
On the domestic front, subdued economic and employment reports slowed stocks’ progress early in the new year, although much of the weakness seemed to dissipate as the year’s unusually harsh winter subsided. And despite initial reactions to the idea, when the U.S. Federal Reserve began tapering its quantitative-easing program in January by reducing its bond purchases by $10 billion a month, the markets took the policy change in stride.
Despite a rough start to the year for financial markets, the global economy seems to be settling into a slow-but-steady recovery. While first-quarter U.S. gross domestic product (GDP) growth was disappointing at -2.9%, U.S. consumer spending, which is a significant contributor toward economic growth, rose by 3% during the quarter. It appears that Europe is also maintaining its own recovery: The International Monetary Fund projects that Europe’s full-year GDP growth may breach positive territory for the first time since 2011.
The impact of international affairs on stocks so far this year is an important reminder to stay informed about both domestic and international economic developments, and any effects they may have on your individual investment goals. If you have not already had a mid-year review of your portfolio, it may be a good time to meet with your financial advisor to review your progress and make certain your investments are prepared for all market environments:
| • | Is your portfolio properly diversified with an appropriate mix of stocks and bonds? |
| • | Is your portfolio positioned to take advantage of the global economic recovery, with investments in both domestic and international holdings? |
| • | Are your investments still in line with your risk tolerance and investment time horizon? |
Your financial professional can help you choose options within our fund family to help you reach your investment goals with confidence.
Thank you again for investing with Hartford HLS Funds.
James Davey
President
Hartford HLS Funds
1 The S&P 500 Index is a market capitalization-weighted price index composed of 500 widely held common stocks.
2The Dow Jones Industrial Average is an unmanaged, price-weighted index of 30 of the largest, most widely held stocks traded on the New York Stock Exchange.
Hartford Disciplined Equity HLS Fund
Table of Contents
This report is prepared for the general information of contract owners and qualified retirement plan participants. It is not an offer of contracts or of qualified retirement plans. It should not be used in connection with any offer, except in conjunction with the appropriate product prospectus which contains all pertinent information including the applicable sales, administrative and other charges.
The views expressed in the Fund’s Manager Discussion under “Why did the Fund perform this way?” and “What is the outlook?” are views of the Fund’s sub-adviser and portfolio management team through the end of the period and are subject to change based on market and other conditions. The Fund’s Manager Discussion is for informational purposes only and does not represent an offer, recommendation or solicitation to buy, hold or sell any security. The specific securities identified and described, if any, do not represent all of the securities purchased or sold and you should not assume that investments in the securities identified and discussed will be profitable.
Hartford Disciplined Equity HLS Fund inception 05/29/1998
(sub-advised by Wellington Management Company, LLP)
| Investment objective – The Fund seeks growth of capital |
Performance Overview 6/30/04 - 6/30/14
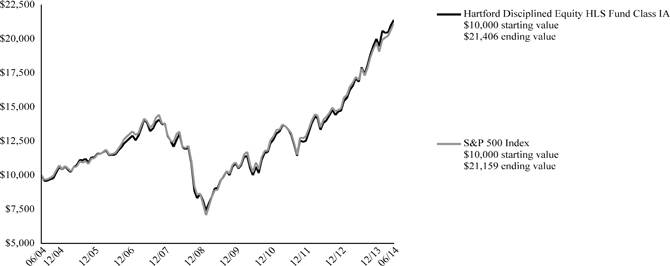
The chart above represents the hypothetical growth of a $10,000 investment in Class IA. Growth result in classes other than Class IA will vary from what is seen above due to differences in the expenses charged to those share classes.
Average Annual Total Returns (as of 6/30/14)
| | 6 Month† | 1 Year | 5 Years | 10 Years |
| Disciplined Equity IA | 6.97% | 26.94% | 18.77% | 7.91% |
| Disciplined Equity IB | 6.84% | 26.62% | 18.47% | 7.64% |
| S&P 500 Index | 7.14% | 24.61% | 18.83% | 7.78% |
PERFORMANCE DATA QUOTED REPRESENTS PAST PERFORMANCE AND DOES NOT GUARANTEE FUTURE RESULTS. The investment return and principal value of the investment will fluctuate so that investors’ shares, when redeemed, may be worth more or less than their original cost. Current performance may be lower or higher than the performance data quoted. To obtain performance data current to the most recent month-end, please visit our website www.hartfordfunds.com.
Total returns presented above were calculated using the Fund’s net asset value available to shareholders for sale or redemption of Fund shares on June 30, 2014, which may exclude investment transactions as of this date. All share class returns assume the reinvestment of all distributions at net asset value and the deduction of all fund expenses.
S&P 500 Index is a market capitalization-weighted price index composed of 500 widely held common stocks.
The index is unmanaged, and its results include reinvested dividends and/or distributions, but do not reflect the effect of sales charges, commissions, expenses or taxes.
You cannot invest directly in an index.
As shown in the Fund's current prospectus dated May 1, 2014, the total annual operating expense ratios for Class IA and Class IB were 0.76% and 1.01%, respectively. Actual expenses may be higher. Please see the accompanying Financial Highlights for expense ratios for the six-month period ended June 30, 2014.
The chart and table do not reflect the deductions of taxes, sales charges or other fees which may be applied at the variable life insurance, variable annuity or qualified retirement plan product level. Any such additional sales charges or other fees or expenses would lower the contract’s or plan’s performance.
All investments are subject to risk including the possible loss of principal. For a discussion of the Fund’s risks, please see the Main Risks section of this report. For more detailed information on the risks associated with an investment in the Fund, please see the prospectus.
| Hartford Disciplined Equity HLS Fund |
| Manager Discussion |
| June 30, 2014 (Unaudited) |
| Portfolio Manager |
| Mammen Chally, CFA |
| Vice President and Equity Portfolio Manager |
How did the Fund perform?
The Class IA shares of the Hartford Disciplined Equity HLS Fund returned 6.97% for the six-month period ended June 30, 2014, underperforming the Fund’s benchmark, the S&P 500 Index, which returned 7.14% for the same period. The Fund outperformed the 6.54% average return of the Lipper Large-Cap Core Funds peer group, a group of funds with investment strategies similar to those of the Fund.
Why did the Fund perform this way?
U.S. equities surged during the period, ending June near an all-time high. After finishing 2013 with their best year since 1997, U.S. stocks began 2014 with their worst month in nearly two years. Worries about a slowdown in China and general concern surrounding emerging markets overshadowed a fairly benign domestic environment. However, robust merger and acquisition activity and an uncontested increase in the debt ceiling from Congress helped stoke investors' risk appetites in February. Earnings season in April provided a varied yet encouraging picture, with companies generally reporting healthy earnings but more subdued revenues. The rally continued in May amid renewed signs of life in the housing market and the best payroll gains in more than two years. In June, strong manufacturing activity, coupled with continued positive momentum in housing and employment data, helped to offset a large negative revision to first quarter economic growth.
Overall equity market performance was positive for the period across all market capitalizations: mid cap (+8%), large cap (+7%), and small cap equities (+3%) all rose significantly as represented by the S&P MidCap 400, S&P 500, and Russell 2000 Indices respectively. During the six-month period all ten sectors within the S&P 500 Index posted positive returns, led by Utilities (+19%), Energy (+13%), and Healthcare (+11%).
The Fund underperformed the S&P 500 Index primarily due to sector allocation, which is a fallout of our bottom-up stock selection process. Underweight allocations to the Energy and Information Technology sectors, along with an overweight to the Consumer Discretionary sector, more than offset the positive impacts from an underweight to Financials. Strong security selection modestly offset the negative impact from sector allocation. Positive selection within Healthcare, Energy, and Consumer Staples more than offset weaker selection within Information Technology and Consumer Discretionary.
The largest detractors from performance relative to the S&P 500 Index were Apple (Information Technology), TJX Companies (Consumer Discretionary), and PVH (Consumer Discretionary). Shares of Apple, a U.S.-based designer and manufacturer of consumer electronics, software, and computers, rose during the period as the stock continued to rebound following April’s solid earnings report. Our relative underweight position in this strong performing S&P 500 constituent detracted from relative returns during the period. Shares of TJX Companies, an off-price apparel retailer, fell during the period after the company posted disappointing first quarter earnings, in part due to colder-than-average winter temperatures having a material impact on sales and store traffic. Shares of PVH, a leading global apparel company with brands such as Calvin Klein and Tommy Hilfiger, fell towards the end of the period after the company issued earning per share guidance below analyst expectations. Bristol-Myers Squibb (Healthcare) also detracted from performance on an absolute basis.
The largest contributors to both absolute and benchmark-relative performance were Forest Labs (Healthcare), Actavis (Healthcare), and Halliburton (Energy). Shares of Forest Labs, a U.S.-based pharmaceutical company, rose during the period on news of a planned merger between Actavis and Forest Labs that was viewed favorably by investors. Shares of Actavis, a specialty pharmaceutical company that develops generic and branded pharmaceutical products, rose during the period as the company has been a direct beneficiary of the drive towards lower cost treatments associated with the implementation of the Affordable Care Act. Shares of Halliburton, a U.S.-based global oilfield services company, rose during the period as the growth outlook for U.S. onshore activity in the energy sector continues to strengthen as new equity capital supports increased budgets for capital expenditures by exploration and production companies. In addition, pricing for its services remains strong as Halliburton is sold out of capacity for the remainder of this year.
Derivatives are not used in a significant manner in this Fund and did not have a material impact on performance during the period.
What is the outlook?
Overall, we continue to find what we believe are attractively valued stocks with the characteristics we seek. We are cautiously optimistic about the outlook for the U.S. economy and for equity markets, and we continue to monitor policy decisions and economic trends that may impact our holdings. We remain consistent in adhering to our disciplined portfolio construction process that allows us to assess risk, weight individual positions accordingly, and in the process build a portfolio that focuses largely on stock selection for generating benchmark relative outperformance. Based on individual stock
| Hartford Disciplined Equity HLS Fund |
| Manager Discussion – (continued) |
| June 30, 2014 (Unaudited) |
decisions, the Fund ended the period most overweight the Healthcare, Consumer Discretionary, and Utilities sectors, and most underweight Financials, Energy, and Telecommunication Services relative to the S&P 500 Index, the Fund’s benchmark.
Diversification by Sector
as of June 30, 2014
| Sector | | Percentage of
Net Assets | |
| Equity Securities | | | | |
| Consumer Discretionary | | | 14.4 | % |
| Consumer Staples | | | 10.6 | |
| Energy | | | 6.1 | |
| Financials | | | 10.3 | |
| Health Care | | | 21.8 | |
| Industrials | | | 10.4 | |
| Information Technology | | | 16.7 | |
| Materials | | | 2.9 | |
| Utilities | | | 4.6 | |
| Total | | | 97.8 | % |
| Short-Term Investments | | | 2.3 | |
| Other Assets and Liabilities | | | (0.1 | ) |
| Total | | | 100.0 | % |
A sector may be comprised of several industries. For Fund compliance purposes, the Fund may not use the same classification system and these sector classifications are used for reporting ease.
| Hartford Disciplined Equity HLS Fund |
| Schedule of Investments |
| June 30, 2014 (Unaudited) |
| (000’s Omitted) |
| Shares or Principal Amount | | Market Value ╪ | |
| Common Stocks - 97.8% | | | | |
| | | | | Banks - 3.5% | | | | |
| | 757 | | | EverBank Financial Corp. | | $ | 15,255 | |
| | 173 | | | PNC Financial Services Group, Inc. | | | 15,412 | |
| | | | | | | | 30,667 | |
| | | | | Capital Goods - 5.8% | | | | |
| | 153 | | | AMETEK, Inc. | | | 7,988 | |
| | 60 | | | Boeing Co. | | | 7,644 | |
| | 91 | | | Dover Corp. | | | 8,248 | |
| | 112 | | | Illinois Tool Works, Inc. | | | 9,783 | |
| | 148 | | | United Technologies Corp. | | | 17,126 | |
| | | | | | | | 50,789 | |
| | | | | Commercial and Professional Services - 3.0% | | | | |
| | 151 | | | Equifax, Inc. ● | | | 10,972 | |
| | 106 | | | Quintiles Transnational Holdings ● | | | 5,630 | |
| | 156 | | | Verisk Analytics, Inc. ● | | | 9,343 | |
| | | | | | | | 25,945 | |
| | | | | Consumer Durables and Apparel - 2.3% | | | | |
| | 81 | | | PVH Corp. | | | 9,400 | |
| | 66 | | | Ralph Lauren Corp. | | | 10,559 | |
| | | | | | | | 19,959 | |
| | | | | Consumer Services - 0.8% | | | | |
| | 92 | | | Starwood Hotels & Resorts, Inc. | | | 7,473 | |
| | | | | | | | | |
| | | | | Diversified Financials - 2.5% | | | | |
| | 376 | | | JP Morgan Chase & Co. | | | 21,658 | |
| | | | | | | | | |
| | | | | Energy - 6.1% | | | | |
| | 104 | | | Anadarko Petroleum Corp. | | | 11,355 | |
| | 159 | | | Chevron Corp. | | | 20,722 | |
| | 80 | | | EOG Resources, Inc. | | | 9,369 | |
| | 168 | | | Halliburton Co. | | | 11,954 | |
| | | | | | | | 53,400 | |
| | | | | Food and Staples Retailing - 4.0% | | | | |
| | 141 | | | Costco Wholesale Corp. | | | 16,211 | |
| | 255 | | | CVS Caremark Corp. | | | 19,212 | |
| | | | | | | | 35,423 | |
| | | | | Food, Beverage and Tobacco - 4.1% | | | | |
| | 209 | | | Altria Group, Inc. | | | 8,757 | |
| | 471 | | | Mondelez International, Inc. | | | 17,722 | |
| | 138 | | | Monster Beverage Corp. ● | | | 9,826 | |
| | | | | | | | 36,305 | |
| | | | | Health Care Equipment and Services - 11.9% | | | | |
| | 135 | | | Cerner Corp. ● | | | 6,940 | |
| | 129 | | | Covidien plc | | | 11,673 | |
| | 237 | | | Envision Healthcare Holdings ● | | | 8,499 | |
| | 102 | | | McKesson Corp. | | | 18,984 | |
| | 233 | | | MEDNAX, Inc. ● | | | 13,531 | |
| | 201 | | | Omnicare, Inc. | | | 13,409 | |
| | 179 | | | Team Health Holdings ● | | | 8,932 | |
| | 167 | | | UnitedHealth Group, Inc. | | | 13,625 | |
| | 85 | | | Zimmer Holdings, Inc. | | | 8,850 | |
| | | | | | | | 104,443 | |
| | | | | Household and Personal Products - 2.5% | | | | |
| | 521 | | | Coty, Inc. | | | 8,918 | |
| | 173 | | | Estee Lauder Co., Inc. | | | 12,816 | |
| | | | | | | | 21,734 | |
| | | | | Insurance - 4.3% | | | | |
| | 164 | | | ACE Ltd. | | | 16,971 | |
| | 179 | | | American International Group, Inc. | | | 9,752 | |
| | 122 | | | Aon plc | | | 10,994 | |
| | | | | | | | 37,717 | |
| | | | | Materials - 2.9% | | | | |
| | 60 | | | Airgas, Inc. | | | 6,574 | |
| | 188 | | | Crown Holdings, Inc. ● | | | 9,370 | |
| | 47 | | | Sherwin-Williams Co. | | | 9,707 | |
| | | | | | | | 25,651 | |
| | | | | Media - 3.8% | | | | |
| | 289 | | | Comcast Corp. Special Class A | | | 15,398 | |
| | 213 | | | DirecTV ● | | | 18,102 | |
| | | | | | | | 33,500 | |
| | | | | Pharmaceuticals, Biotechnology and Life Sciences - 9.9% | | | | |
| | 48 | | | Actavis plc ● | | | 10,641 | |
| | 307 | | | Bristol-Myers Squibb Co. | | | 14,909 | |
| | 318 | | | Eli Lilly & Co. | | | 19,798 | |
| | 178 | | | Gilead Sciences, Inc. ● | | | 14,784 | |
| | 340 | | | Merck & Co., Inc. | | | 19,679 | |
| | 61 | | | Salix Pharmaceuticals Ltd. ● | | | 7,480 | |
| | | | | | | | 87,291 | |
| | | | | Retailing - 7.5% | | | | |
| | 35 | | | AutoZone, Inc. ● | | | 18,575 | |
| | 257 | | | Dollar Tree, Inc. ● | | | 13,988 | |
| | 259 | | | Lowe's Cos., Inc. | | | 12,439 | |
| | 150 | | | Ross Stores, Inc. | | | 9,930 | |
| | 200 | | | TJX Cos., Inc. | | | 10,627 | |
| | | | | | | | 65,559 | |
| | | | | Software and Services - 13.5% | | | | |
| | 144 | | | Accenture plc | | | 11,673 | |
| | 548 | | | Activision Blizzard, Inc. | | | 12,209 | |
| | 204 | | | Automatic Data Processing, Inc. | | | 16,150 | |
| | 488 | | | Genpact Ltd. ● | | | 8,552 | |
| | 20 | | | Google, Inc. Class A ● | | | 11,653 | |
| | 22 | | | Google, Inc. Class C ● | | | 12,383 | |
| | 192 | | | Intuit, Inc. | | | 15,458 | |
| | 142 | | | Jack Henry & Associates, Inc. | | | 8,424 | |
| | 115 | | | Mastercard, Inc. | | | 8,457 | |
| | 169 | | | Microsoft Corp. | | | 7,058 | |
| | 129 | | | VeriSign, Inc. ● | | | 6,279 | |
| | | | | | | | 118,296 | |
| | | | | Technology Hardware and Equipment - 3.2% | | | | |
| | 116 | | | Apple, Inc. | | | 10,806 | |
| | 217 | | | Qualcomm, Inc. | | | 17,205 | |
| | | | | | | | 28,011 | |
| | | | | Transportation - 1.6% | | | | |
| | 133 | | | United Parcel Service, Inc. Class B | | | 13,630 | |
| | | | | | | | | |
| | | | | Utilities - 4.6% | | | | |
| | 268 | | | American Electric Power Co., Inc. | | | 14,971 | |
| | 160 | | | NextEra Energy, Inc. | | | 16,444 | |
| | 152 | | | Pinnacle West Capital Corp. | | | 8,807 | |
| | | | | | | | 40,222 | |
| | | | | Total Common Stocks | | | | |
| | | | | (Cost $667,797) | | $ | 857,673 | |
| | | | | | | | | |
| | | | | Total Long-Term Investments | | | | |
| | | | | (Cost $667,797) | | $ | 857,673 | |
The accompanying notes are an integral part of these financial statements.
| Hartford Disciplined Equity HLS Fund |
| Schedule of Investments – (continued) |
| June 30, 2014 (Unaudited) |
| (000’s Omitted) |
| Shares or Principal Amount | | | | | Market Value ╪ | |
| Short-Term Investments - 2.3% | | | | | | |
| | Repurchase Agreements - 2.3% | | | | | | | | |
| | | | | Bank of America Merrill Lynch TriParty Repurchase
Agreement (maturing on 07/01/2014 in the
amount of $1,726, collateralized by FHLMC
2.23% - 5.99%, 2030 - 2044, FNMA 2.31% -
6.34%, 2020 - 2042, value of $1,760) | | | | | | | | |
| $ | 1,726 | | | 0.10%, 6/30/2014 | | | | | | $ | 1,726 | |
| | | | | Bank of Montreal TriParty Repurchase Agreement
(maturing on 07/01/2014 in the amount of
$2,636, collateralized by U.S. Treasury Bill
0.13%, 2015, U.S. Treasury Bond 2.75% -
10.63%, 2015 - 2044, U.S. Treasury Note 0.13%
- 4.50%, 2014 - 2024, value of $2,689) | | | | | | | | |
| | 2,636 | | | 0.09%, 6/30/2014 | | | | | | | 2,636 | |
| | | | | Bank of Montreal TriParty Repurchase Agreement
(maturing on 07/01/2014 in the amount of
$1,124, collateralized by FHLMC 2.00% - 5.50%,
2018 - 2041, FNMA 2.00% - 4.50%, 2026 -
2042, GNMA 3.00% - 4.00%, 2042 - 2043, U.S.
Treasury Bill 0.05%, 2014, U.S. Treasury Note
0.75%, 2018, value of $1,147) | | | | | | | | |
| | 1,124 | | | 0.11%, 6/30/2014 | | | | | | | 1,124 | |
| | | | | Barclays Capital TriParty Repurchase Agreement
(maturing on 07/01/2014 in the amount of
$1,040, collateralized by U.S. Treasury Note
0.63% - 0.88%, 2018 - 2019, value of $1,061) | | | | | | | | |
| | 1,040 | | | 0.07%, 6/30/2014 | | | | | | | 1,040 | |
| | | | | Citigroup Global Markets, Inc. TriParty Repurchase
Agreement (maturing on 07/01/2014 in the
amount of $2,395, collateralized by U.S.
Treasury Bond 4.38% - 7.50%, 2016 - 2040,
U.S. Treasury Note 0.50% - 3.00%, 2014 - 2020,
value of $2,443) | | | | | | | | |
| | 2,395 | | | 0.06%, 6/30/2014 | | | | | | | 2,395 | |
| | | | | RBS Securities Inc. TriParty Repurchase
Agreement (maturing on 07/01/2014 in the
amount of $3,671, collateralized by U.S.
Treasury Note 0.38% - 3.13%, 2015 - 2022,
value of $3,745) | | | | | | | | |
| | 3,671 | | | 0.08%, 6/30/2014 | | | | | | | 3,671 | |
| | | | | TD Securities TriParty Repurchase Agreement
(maturing on 07/01/2014 in the amount of
$7,642, collateralized by FHLMC 3.50% - 4.00%,
2026 - 2044, FNMA 2.50% - 5.00%, 2025 -
2043, value of $7,794) | | | | | | | | |
| | 7,642 | | | 0.11%, 6/30/2014 | | | | | | | 7,642 | |
| | | | | UBS Securities Repurchase Agreement (maturing
on 07/01/2014 in the amount of $31,
collateralized by U.S. Treasury Note 2.13%,
2020, value of $32) | | | | | | | | |
| | 31 | | | 0.05%, 6/30/2014 | | | | | | | 31 | |
| | | | | | | | | | | | 20,265 | |
| | | | | Total Short-Term Investments | | | | | | | | |
| | | | | (Cost $20,265) | | | | | | $ | 20,265 | |
| | | | | | | | | | | | | |
| | | | | Total Investments | | | | | | | | |
| | | | | (Cost $688,062) ▲ | | | 100.1 | % | | $ | 877,938 | |
| | | | | Other Assets and Liabilities | | | (0.1 | )% | | | (534 | ) |
| | | | | Total Net Assets | | | 100.0 | % | | $ | 877,404 | |
The accompanying notes are an integral part of these financial statements.
| Hartford Disciplined Equity HLS Fund |
| Schedule of Investments – (continued) |
| June 30, 2014 (Unaudited) |
| (000’s Omitted) |
| Note: | Percentage of investments as shown is the ratio of the total market value to total net assets. |
| ▲ | At June 30, 2014, the cost of securities for federal income tax purposes was $687,875 and the aggregate gross unrealized appreciation and depreciation based on that cost were: |
| Unrealized Appreciation | | $ | 191,755 | |
| Unrealized Depreciation | | | (1,692 | ) |
| Net Unrealized Appreciation | | $ | 190,063 | |
Cash pledged and received as collateral in connection with derivatives at June 30, 2014.
| | | Pledged | | | Received | |
| Futures contracts | | $ | 809 | | | $ | – | |
| Total | | $ | 809 | | | $ | – | |
Futures Contracts Outstanding at June 30, 2014
| | | Number of | | | Expiration | | Notional | | | Market | | | Unrealized
Appreciation/(Depreciation) | | | Variation Margin | |
| Description | | Contracts* | | | Date | | Amount | | | Value ╪ | | | Asset | | | Liability | | | Asset | | | Liability | |
| Long position contracts: | | | | | | | | | | | | | | | | | | | | | | | | | | | | | | |
| S&P 500 (E-Mini) Future | | | 187 | | | 09/19/2014 | | $ | 18,090 | | | $ | 18,255 | | | $ | 165 | | | $ | – | | | $ | 4 | | | $ | – | |
| * | The number of contracts does not omit 000's. |
| ╪ | See Significant Accounting Policies of accompanying Notes to Financial Statements regarding valuation of securities. |
| GLOSSARY: (abbreviations used in preceding Schedule of Investments) | |
| | |
| Index Abbreviations: | |
| S&P | Standard & Poors | |
| | | |
| Other Abbreviations: | |
| FHLMC | Federal Home Loan Mortgage Corp. | |
| FNMA | Federal National Mortgage Association | |
| GNMA | Government National Mortgage Association | |
The accompanying notes are an integral part of these financial statements.
| Hartford Disciplined Equity HLS Fund |
| Investment Valuation Hierarchy Level Summary |
| June 30, 2014 (Unaudited) |
| (000’s Omitted) |
| | | Total | | | Level 1 ♦ | | | Level 2 ♦ | | | Level 3 | |
| Assets: | | | | | | | | | | | | | | | | |
| Common Stocks ‡ | | $ | 857,673 | | | $ | 857,673 | | | $ | – | | | $ | – | |
| Short-Term Investments | | | 20,265 | | | | – | | | | 20,265 | | | | – | |
| Total | | $ | 877,938 | | | $ | 857,673 | | | $ | 20,265 | | | $ | – | |
| Futures * | | $ | 165 | | | $ | 165 | | | $ | – | | | $ | – | |
| Total | | $ | 165 | | | $ | 165 | | | $ | – | | | $ | – | |
| ♦ | For the six-month period ended June 30, 2014, there were no transfers between Level 1 and Level 2. |
| ‡ | The Fund has all or primarily all of the equity securities categorized in a particular level. Refer to the Schedule of Investments for further industry breakout. |
| * | Derivative instruments (excluding purchased and written options, if applicable) are valued at the unrealized appreciation/depreciation on the investments. |
| Note: | For purposes of reporting transfers between different hierarchy levels, both transfers in and out of each level, as applicable, are shown as if they occurred at the beginning of the period. |
The accompanying notes are an integral part of these financial statements.
| Hartford Disciplined Equity HLS Fund |
| Statement of Assets and Liabilities |
| June 30, 2014 (Unaudited) |
| (000’s Omitted) |
| Assets: | | | | |
| Investments in securities, at market value (cost $688,062) | | $ | 877,938 | |
| Cash | | | 813 | * |
| Receivables: | | | | |
| Fund shares sold | | | 9 | |
| Dividends and interest | | | 603 | |
| Variation margin on financial derivative instruments | | | 4 | |
| Total assets | | | 879,367 | |
| Liabilities: | | | | |
| Payables: | | | | |
| Fund shares redeemed | | | 1,733 | |
| Investment management fees | | | 87 | |
| Distribution fees | | | 4 | |
| Accrued expenses | | | 139 | |
| Total liabilities | | | 1,963 | |
| Net assets | | $ | 877,404 | |
| Summary of Net Assets: | | | | |
| Capital stock and paid-in-capital | | $ | 496,532 | |
| Undistributed net investment income | | | 3,200 | |
| Accumulated net realized gain | | | 187,631 | |
| Unrealized appreciation of investments | | | 190,041 | |
| Net assets | | $ | 877,404 | |
| Shares authorized | | | 3,500,000 | |
| Par value | | $ | 0.001 | |
| Class IA: Net asset value per share | | $ | 19.64 | |
| Shares outstanding | | | 39,034 | |
| Net assets | | $ | 766,730 | |
| Class IB: Net asset value per share | | $ | 19.52 | |
| Shares outstanding | | | 5,669 | |
| Net assets | | $ | 110,674 | |
| * | Cash of $809 was pledged as initial margin deposit and collateral for daily variation margin loss on open financial derivative instruments at June 30, 2014. |
The accompanying notes are an integral part of these financial statements.
| Hartford Disciplined Equity HLS Fund |
| Statement of Operations |
| For the Six-Month Period Ended June 30, 2014 (Unaudited) |
| (000’s Omitted) |
| Investment Income: | | | | |
| Dividends | | $ | 6,286 | |
| Interest | | | 2 | |
| Total investment income, net | | | 6,288 | |
| | | | | |
| Expenses: | | | | |
| Investment management fees | | | 3,155 | |
| Transfer agent fees | | | 3 | |
| Distribution fees - Class IB | | | 139 | |
| Custodian fees | | | 3 | |
| Accounting services fees | | | 53 | |
| Board of Directors' fees | | | 12 | |
| Audit fees | | | 9 | |
| Other expenses | | | 92 | |
| Total expenses (before fees paid indirectly) | | | 3,466 | |
| Commission recapture | | | (1 | ) |
| Total fees paid indirectly | | | (1 | ) |
| Total expenses, net | | | 3,465 | |
| Net Investment Income | | | 2,823 | |
| | | | | |
| Net Realized Gain on Investments and Other Financial Instruments: | | | | |
| Net realized gain on investments | | | 188,363 | |
| Net realized gain on futures contracts | | | 249 | |
| Net realized gain on written option contracts | | | 92 | |
| Net Realized Gain on Investments and Other Financial Instruments | | | 188,704 | |
| | | | | |
| Net Changes in Unrealized Depreciation of Investments and Other Financial Instruments: | | | | |
| Net unrealized depreciation of investments | | | (132,906 | ) |
| Net unrealized appreciation of futures contracts | | | 165 | |
| Net unrealized appreciation of written option contracts | | | 49 | |
| Net Changes in Unrealized Depreciation of Investments and Other Financial Instruments | | | (132,692 | ) |
| Net Gain on Investments and Other Financial Instruments | | | 56,012 | |
| Net Increase in Net Assets Resulting from Operations | | $ | 58,835 | |
The accompanying notes are an integral part of these financial statements.
| Hartford Disciplined Equity HLS Fund |
| Statement of Changes in Net Assets |
| |
| (000’s Omitted) |
| | | For the
Six-Month
Period Ended
June 30, 2014
(Unaudited) | | | For the
Year Ended
December 31,
2013 | |
| Operations: | | | | | | | | |
| Net investment income | | $ | 2,823 | | | $ | 9,717 | |
| Net realized gain on investments and other financial instruments | | | 188,704 | | | | 139,246 | |
| Net unrealized appreciation (depreciation) of investments and other financial instruments | | | (132,692 | ) | | | 136,571 | |
| Net Increase in Net Assets Resulting from Operations | | | 58,835 | | | | 285,534 | |
| Distributions to Shareholders: | | | | | | | | |
| From net investment income | | | | | | | | |
| Class IA | | | — | | | | (7,372 | ) |
| Class IB | | | — | | | | (797 | ) |
| Total distributions | | | — | | | | (8,169 | ) |
| Capital Share Transactions: | | | | | | | | |
| Class IA | | | | | | | | |
| Sold | | | 2,413 | | | | 57,246 | |
| Issued on reinvestment of distributions | | | — | | | | 7,372 | |
| Redeemed | | | (98,325 | ) | | | (293,919 | ) |
| Total capital share transactions | | | (95,912 | ) | | | (229,301 | ) |
| Class IB | | | | | | | | |
| Sold | | | 310 | | | | 9,794 | |
| Issued on reinvestment of distributions | | | — | | | | 797 | |
| Redeemed | | | (15,526 | ) | | | (43,219 | ) |
| Total capital share transactions | | | (15,216 | ) | | | (32,628 | ) |
| Net decrease from capital share transactions | | | (111,128 | ) | | | (261,929 | ) |
| Net Increase (Decrease) in Net Assets | | | (52,293 | ) | | | 15,436 | |
| Net Assets: | | | | | | | | |
| Beginning of period | | | 929,697 | | | | 914,261 | |
| End of period | | $ | 877,404 | | | $ | 929,697 | |
| Undistributed (distribution in excess of) net investment income | | $ | 3,200 | | | $ | 377 | |
| Shares: | | | | | | | | |
| Class IA | | | | | | | | |
| Sold | | | 129 | | | | 3,665 | |
| Issued on reinvestment of distributions | | | — | | | | 408 | |
| Redeemed | | | (5,264 | ) | | | (18,406 | ) |
| Total share activity | | | (5,135 | ) | | | (14,333 | ) |
| Class IB | | | | | | | | |
| Sold | | | 17 | | | | 624 | |
| Issued on reinvestment of distributions | | | — | | | | 44 | |
| Redeemed | | | (838 | ) | | | (2,729 | ) |
| Total share activity | | | (821 | ) | | | (2,061 | ) |
The accompanying notes are an integral part of these financial statements.
| Hartford Disciplined Equity HLS Fund |
| Notes to Financial Statements |
| June 30, 2014 (Unaudited) |
| (000’s Omitted) |
Organization:
Hartford Disciplined Equity HLS Fund (the "Fund") serves as an underlying investment option for certain variable annuity and variable life insurance separate accounts of Hartford Life Insurance Company (“HLIC”) and its affiliates and certain qualified retirement plans. The Fund may also serve as an underlying investment option for certain variable annuity and variable life separate accounts of other insurance companies. Owners of variable annuity contracts and policyholders of variable life insurance contracts may choose the funds permitted in the variable insurance contract prospectus. In addition, participants in certain qualified retirement plans may choose the Fund if permitted by their plans.
Hartford Series Fund, Inc. (the “Company”) is an open-end registered management investment company comprised of twenty-eight portfolios. Financial statements for the Fund, a series of the Company, are included in this report.
The Company is organized under the laws of the State of Maryland and is registered with the Securities and Exchange Commission (“SEC”) under the Investment Company Act of 1940, as amended (“1940 Act”). The Fund is a diversified open-end management investment company.
The Fund is divided into Class IA and Class IB shares. Each class is offered at the per share net asset value (“NAV”) without a sales charge and is subject to the same expenses, except that the Class IB shares are subject to distribution and service fees charged pursuant to a Distribution Plan adopted in accordance with Rule 12b-1 under the 1940 Act.
Significant Accounting Policies:
The following is a summary of significant accounting policies of the Fund in the preparation of its financial statements, which are in accordance with United States Generally Accepted Accounting Principles (“U.S. GAAP”). The preparation of financial statements in accordance with U.S. GAAP may require management to make estimates and assumptions that affect the reported amounts of assets and liabilities and disclosure of contingent assets and liabilities at the date of the financial statements and the reported amounts of increases and decreases in net assets from operations during the reporting period. Actual results could differ from those estimates.
Determination of Net Asset Value – The NAV of each class of the Fund's shares is determined as of the close of regular trading (normally 4:00 p.m. Eastern Time) (the “NYSE Close”) on each day that the New York Stock Exchange (the “Exchange”) is open (“Valuation Date”). Information that becomes known to the Fund after the NAV has been calculated on a particular day will not generally be used to retroactively adjust the NAV determined earlier that day.
Investment Valuation and Fair Value Measurements – For purposes of calculating the NAV, portfolio investments and other assets held by the Fund's portfolio for which market quotes are readily available are valued at market value. Market value is generally determined on the basis of last reported sales prices or official close price. If no sales are reported, market value is based on quotes obtained from a quotation reporting system, established market makers, or independent pricing services. If market prices are not readily available or are deemed unreliable, the Fund will use the fair value of the investment as determined in good faith under policies and procedures established by and under the supervision of the Company's Board of Directors. Market quotes are considered not readily available where there is an absence of current or reliable market-based data (e.g., trade information or indicative market quotes), including where events occur after the close of the relevant market, but prior to the NYSE Close, that materially affect the values of the Fund's portfolio investments or assets. In addition, market quotes are considered not readily available when, due to extraordinary circumstances, the exchanges or markets on which the investments trade do not open for trading for the entire day and no other market prices are available. In addition, prices of foreign equities that are principally traded on certain foreign markets may be adjusted daily pursuant to a fair value pricing service approved by the Board of Directors in order to reflect an adjustment for the factors occurring after the close of certain foreign markets but before the NYSE Close. Investments that are primarily traded on foreign markets may trade on days that are not business days of the Fund. The value of the foreign investments in which the Fund invests may change on days when a shareholder will not be able to purchase or redeem shares of the Fund. Fair value pricing is subjective in nature and the use of fair value pricing by the Fund may cause the NAV of its shares to differ significantly from the NAV that would have been calculated using market prices at the close of the exchange on which a portfolio investment is primarily traded. There can be no assurance that the Fund could obtain the fair market value assigned to an investment if the Fund were to sell the investment at approximately the time at which the Fund determines its NAV.
| Hartford Disciplined Equity HLS Fund |
| Notes to Financial Statements – (continued) |
| June 30, 2014 (Unaudited) |
| (000’s Omitted) |
Exchange traded options, futures and options on futures are valued at the settlement price or last trade price determined by the relevant exchange as of the NYSE Close. If the last trade price for exchange traded options does not fall between the bid and ask prices, the value will be the mean of the bid and ask prices as of the NYSE Close. If a last trade price is not available, the value will be the mean of the bid and ask prices as of the NYSE Close. If a mean of the bid and ask prices cannot be calculated for the day, the value will be the bid price as of the NYSE Close. In the case of over-the-counter ("OTC") options and such instruments that do not trade on an exchange, values may be supplied by a pricing service using a formula or other objective method that may take into consideration the style, direction, expiration, strike price, notional value and volatility or other special adjustments.
Financial instruments for which prices are not available from an independent pricing service may be valued using market quotations obtained from one or more dealers that make markets in the respective financial instrument in accordance with procedures established by the Company's Board of Directors.
U.S. GAAP defines fair value as the price that the Fund would receive to sell an asset or pay to transfer a liability in an orderly transaction between market participants. The U.S. GAAP fair value measurement standards require disclosure of a fair value hierarchy for each major category of assets and liabilities. Various inputs are used in determining the fair value of the Fund’s investments. These inputs are summarized into three broad hierarchy levels. This hierarchy is based on whether the valuation inputs are observable or unobservable. These levels are:
Level 1 – Quoted prices in active markets for identical investments. Level 1 may include exchange traded instruments, such as domestic equities, some foreign equities, options, futures, mutual funds, exchange traded funds, rights and warrants.
Level 2 – Observable inputs other than Level 1 prices, such as quoted prices for similar investments; quoted prices in markets that are not active; or other inputs that are observable or can be corroborated by observable market data. Level 2 may include debt investments that are traded less frequently than exchange traded instruments and which are valued using independent pricing services; foreign equities, which are principally traded on certain foreign markets and are adjusted daily pursuant to a fair value pricing service in order to reflect an adjustment for the factors occurring after the close of certain foreign markets but before the NYSE Close; senior floating rate interests, which are valued using an aggregate of dealer bids; short-term investments, which are valued at amortized cost; and swaps, which are valued based upon the terms of each swap contract.
Level 3 – Significant unobservable inputs that are supported by limited or no market activity. Level 3 may include financial instruments whose values are determined using indicative market quotes or require significant management judgment or estimation. These unobservable valuation inputs may include estimates for current yields, maturity/duration, prepayment speed, and indicative market quotes for comparable investments along with other assumptions relating to credit quality, collateral value, complexity of the investment structure, general market conditions and liquidity. This category may include investments where trading has been halted or there are certain restrictions on trading. While these investments are priced using unobservable inputs, the valuation of these investments reflects the best available data and management believes the prices are a reasonable representation of exit price.
The Board of Directors of the Company generally reviews and approves the “Procedures for Valuation of Portfolio Securities” at least once a year. These procedures define how investments are to be valued, including the formation and activities of a Valuation Committee. The Valuation Committee is responsible for determining in good faith the fair value of investments when the value cannot be obtained from primary pricing services or alternative sources or if the valuation of an investment as provided by the primary pricing service or alternative source is believed not to reflect the investment’s fair value as of the Valuation Date. Voting members of the Valuation Committee include the Fund's Treasurer or designee and a Vice President of the investment manager or designee. An Assistant Vice President of the Fund with legal expertise or designee is also included on the Valuation Committee as a non-voting advisory member. In addition, the Fund’s Chief Compliance Officer shall designate a member of the compliance group to attend Valuation Committee meetings as a non-voting resource, to monitor for and provide guidance with respect to compliance with these procedures. Two members of the Valuation Committee or their designees, representing different departments, shall constitute a quorum for purposes of permitting the Valuation Committee to take action. The Valuation Committee will consider all relevant factors in determining an investment’s fair value, and may seek the advice of the Fund’s sub-adviser, knowledgeable brokers, and legal counsel in making such determination. The Valuation Committee reports to the Audit Committee of the Company's Board of Directors. The Audit Committee receives quarterly written reports which include details of
| Hartford Disciplined Equity HLS Fund |
| Notes to Financial Statements – (continued) |
| June 30, 2014 (Unaudited) |
| (000’s Omitted) |
all fair-valued investments, including the reason for the fair valuation, and an indication, when possible, of the accuracy of the valuation by disclosing the next available reliable public price quotation or the disposition price of such investments (the “look-back” test). The Board of Directors then must consider for ratification all of the fair value determinations made during the previous quarter.
Valuation levels are not necessarily indicative of the risk associated with investing in such investments. Individual investments within any of the above mentioned asset classes may be assigned a different hierarchical level than those presented above, as individual circumstances dictate.
For additional information, refer to the Investment Valuation Hierarchy Level Summary which follows the Schedule of Investments.
Investment Transactions and Investment Income – Investment transactions are recorded as of the trade date (the date the order to buy or sell is executed) for financial reporting purposes. Investments purchased or sold on a when-issued or delayed-delivery basis may be settled a month or more after the trade date. Realized gains and losses are determined on the basis of identified cost.
Dividend income from domestic securities is accrued on the ex-dividend date. Interest income, including amortization of premium, accretion of discounts and additional principal received in-kind in lieu of cash, is accrued on a daily basis.
Joint Trading Account – The Fund may invest cash balances into a joint trading account that may be invested in one or more repurchase agreements.
Fund Share Valuation and Dividend Distributions to Shareholders – Orders for the Fund’s shares are executed in accordance with the investment instructions of the contract holders and plan participants. The NAV of the Fund’s shares is determined as of the close of business on each business day of the Exchange. The NAV is determined separately for each class of shares of the Fund by dividing the Fund’s net assets attributable to that class by the number of shares of the class outstanding. Each class of shares offered by the Fund has equal rights as to assets and voting privileges (except that shareholders of a class have exclusive voting rights regarding any matter relating solely to that class of shares). Income and non-class specific expenses are allocated daily to each class on the basis of the relative net assets of the class. Realized and unrealized gains and losses are allocated daily based on the relative net assets of each class of shares of the Fund.
Orders for the purchase of the Fund’s shares received prior to the close of the Exchange on any day the Exchange is open for business are priced at the NAV determined as of the close of the Exchange. Orders received after the close of the Exchange, or on a day on which the Exchange and/or the Fund is not open for business, are priced at the next determined NAV.
Dividends are declared pursuant to a policy adopted by the Company's Board of Directors based upon the investment performance of the Fund. The policy of the Fund is to pay dividends from net investment income and realized gains, if any, at least once a year.
Distributions from net investment income, net realized gains and capital are determined in accordance with federal income tax regulations, which may differ from U.S. GAAP with respect to character and timing. These differences may include, but are not limited to, losses deferred due to wash sale adjustments, foreign currency gains and losses, adjustments related to Passive Foreign Investment Companies ("PFICs"), Real Estate Investment Trusts ("REITs"), Regulated Investment Companies ("RICs"), certain derivatives and partnerships. Permanent book and federal income tax basis differences relating to shareholder distributions will result in reclassifications to certain of the Fund’s capital accounts (see Federal Income Taxes: Reclassification of Capital Accounts note).
Securities and Other Investments:
Repurchase Agreements – A repurchase agreement is an agreement by which a counterparty agrees to sell an investment and agrees to repurchase the investment sold from the buyer at a mutually agreed upon time and price. During the period of the repurchase agreement, the counterparty will deposit cash and or securities in a third party custodial account to serve as collateral. At the time the Fund enters into a repurchase agreement, the value of the underlying collateral, including accrued interest, will be equal to or exceed the value of the repurchase agreement. Repurchase agreements expose the Fund to counterparty risk - that is, the risk that the counterparty will not fulfill its obligations. To minimize counterparty risk, the investments that serve to collateralize the
| Hartford Disciplined Equity HLS Fund |
| Notes to Financial Statements – (continued) |
| June 30, 2014 (Unaudited) |
| (000’s Omitted) |
repurchase agreement are held by the Fund’s custodian in book entry or physical form in the custodial account of the Fund or in a third party custodial account. Repurchase agreements are valued at cost plus accrued interest, which approximates fair value. Repurchase agreements have master netting arrangements which allow the Fund to offset amounts owed to a counterparty with amounts owed by the counterparty, including any collateral. Upon an event of default under a master repurchase agreement, the non-defaulting party may close out all transactions traded under such agreement and net amounts owed under each transaction to one net amount payable by one party to the other. Absent an event of default, the master repurchase agreement does not result in an offset of reported amounts of assets and liabilities in the Statement of Assets and Liabilities across transactions between the Fund and the applicable counterparty. The Fund, as shown on the Schedule of Investments, had outstanding repurchase agreements and related collateral as of June 30, 2014.
Financial Derivative Instruments:
The following disclosures contain information on how and why the Fund uses derivative instruments, the credit-risk-related contingent features in certain derivative instruments, and how derivative instruments affect the Fund’s financial position and results of operations. The location and fair value amounts of these instruments on the Statement of Assets and Liabilities and the realized gains and losses and changes in unrealized gains and losses on the Statement of Operations, each categorized by type of derivative contract, are included in the following Additional Derivative Instrument Information footnote. The derivative instruments outstanding as of period-end are disclosed in the notes to or within the Schedule of Investments for purchased options, if applicable. The amounts of realized gains and losses and changes in unrealized gains and losses on derivative instruments during the period are disclosed in the Statement of Operations.
Futures Contracts – The Fund may enter into futures contracts. A futures contract is an agreement between two parties to buy or sell an asset at a set price on a future date. The Fund uses futures contracts to manage or obtain exposure to the investment markets, commodities, or movements in interest rates and currency values. The primary risks associated with the use of futures contracts are the imperfect correlation between the change in market value of the investments held by the Fund and the prices of futures contracts and the possibility of an illiquid market. Upon entering into a futures contract, the Fund is required to deposit with a futures commission merchant (“FCM”) an amount of cash or U.S. Government or Agency Obligations in accordance with the initial margin requirements of the broker or exchange. Futures contracts are marked to market daily at the most recent settlement price reported by an exchange on which, over time, they are traded most extensively, and an appropriate payable or receivable for the change in value (“variation margin”) is recorded by the Fund. Gains or losses are recognized but not considered realized until the contracts expire or are closed. Futures contracts involve, to varying degrees, risk of loss in excess of the variation margin disclosed on the Statement of Assets and Liabilities; however, the Fund seeks to reduce this risk through the use of an FCM. The Fund, as shown on the Schedule of Investments, had outstanding futures contracts as of June 30, 2014.
Options Contracts – An option contract is a contract sold by one party to another party that offers the buyer the right, but not the obligation, to buy (call) or sell (put) an investment or other financial asset at an agreed-upon price during a specific period of time or on a specific date. The Fund may write (sell) covered call and put options on futures, swaps (“swaptions”), securities, commodities or currencies. “Covered” means that so long as the Fund is obligated as the writer of an option, it will own either the underlying investments or currency or an option to purchase the same underlying investments or currency having an expiration date of the covered option and an exercise price equal to or less than the exercise price of the covered option, or will pledge cash or other liquid investments having a value equal to or greater than the fluctuating market value of the option investment or currency. Writing put options increases the Fund’s exposure to the underlying instrument. Writing call options decreases the Fund’s exposure to the underlying instrument. Premiums received from writing options that expire are treated as realized gains. Premiums received from writing options that are exercised or closed are added to the proceeds or offset amounts paid on the underlying futures, swap, investment or currency transaction to determine the realized gain or loss. The Fund as a writer of an option has no control over whether the underlying instrument may be sold (call) or purchased (put) and as a result bears the market risk of an unfavorable change in the price of the instrument underlying the written option. There is the risk the Fund may not be able to enter into a closing transaction because of an illiquid market. The Fund may also purchase put and call options. Purchasing call options increases the Fund’s exposure to the underlying instrument. Purchasing put options decreases the Fund’s exposure to the underlying instrument. The Fund pays a premium, which is included on the Fund’s Statement of Assets and Liabilities as an investment and is subsequently marked to market to reflect the current value of the option. Premiums paid for purchasing options that expire are treated as realized losses. Certain options may be purchased with premiums to be determined on a future date. The premiums for these options are based upon implied volatility parameters at specified terms. The risk associated with purchasing put and call options is generally
| Hartford Disciplined Equity HLS Fund |
| Notes to Financial Statements – (continued) |
| June 30, 2014 (Unaudited) |
| (000’s Omitted) |
limited to the premium paid. Premiums paid for purchasing options that are exercised or closed are added to the amounts paid or offset against the proceeds on the underlying investment transaction to determine the realized gain or loss. Entering into over-the-counter options also exposes the Fund to counterparty risk. Counterparty risk is the possibility that the counterparty to the agreements may default on its obligation to perform or disagree as to the meaning of the contractual terms in the agreements.
As of June 30, 2014 the Fund had no outstanding purchased option or written option contracts. Transactions involving written option contracts during the six-month period June 30, 2014, are summarized below:
| | | Options Contract Activity During the
Six-month Period Ended June 30, 2014 | |
| Call Options Written During the Period | | Number of Contracts* | | | Premium Amounts | |
| Beginning of the period | | | 395 | | | $ | 39 | |
| Written | | | 1,679 | | | | 129 | |
| Expired | | | (155 | ) | | | (31 | ) |
| Closed | | | (1,785 | ) | | | (121 | ) |
| Exercised | | | (134 | ) | | | (16 | ) |
| End of period | | | — | | | $ | — | |
| | | | | | | | | |
| Put Options Written During the Period | | | Number of Contracts* | | | | Premium Amounts | |
| Beginning of the period | | | 528 | | | $ | 18 | |
| Written | | | 871 | | | | 61 | |
| Expired | | | (432 | ) | | | (30 | ) |
| Closed | | | (967 | ) | | | (49 | ) |
| Exercised | | | — | | | | — | |
| End of period | | | — | | | $ | — | |
* The number of contracts does not omit 000's.
Additional Derivative Instrument Information:
Fair Value of Derivative Instruments on the Statement of Assets and Liabilities as of June 30, 2014:
| | | Risk Exposure Category | |
| | | Interest Rate
Contracts | | | Foreign
Exchange
Contracts | | | Credit
Contracts | | | Equity
Contracts | | | Commodity
Contracts | | | Other
Contracts | | | Total | |
| Assets: | | | | | | | | | | | | | | | | | | | | | | | | | | | | |
| Variation margin receivable * | | $ | — | | | $ | — | | | $ | — | | | $ | 4 | | | $ | — | | | $ | — | | | $ | 4 | |
| Total | | $ | — | | | $ | — | | | $ | — | | | $ | 4 | | | $ | — | | | $ | — | | | $ | 4 | |
| * | Only current day's variation margin is reported within the Statement of Assets and Liabilities. The variation margin is included in the open futures cumulative appreciation of $165 as reported in the Schedule of Investments. |
The volume of derivatives that is presented in the Schedule of Investments is consistent with the derivative activity during the six-month period ended June 30, 2014.
| Hartford Disciplined Equity HLS Fund |
| Notes to Financial Statements – (continued) |
| June 30, 2014 (Unaudited) |
| (000’s Omitted) |
The Effect of Derivative Instruments on the Statement of Operations for the six-month period ended June 30, 2014:
| | | Risk Exposure Category | |
| | | Interest Rate
Contracts | | | Foreign
Exchange
Contracts | | | Credit
Contracts | | | Equity
Contracts | | | Commodity
Contracts | | | Other
Contracts | | | Total | |
| Realized Gain on Derivatives Recognized as a Result of Operations: | |
| Net realized gain on futures contracts | | $ | — | | | $ | — | | | $ | — | | | $ | 249 | | | $ | — | | | $ | — | | | $ | 249 | |
| Net realized gain on written option contracts | | | — | | | | — | | | | — | | | | 92 | | | | — | | | | — | | | | 92 | |
| Total | | $ | — | | | $ | — | | | $ | — | | | $ | 341 | | | $ | — | | | $ | — | | | $ | 341 | |
| | | | | | | | | | | | | | | | | | | | | | | | | | | | | |
| Net Change in Unrealized Appreciation (Depreciation) on Derivatives Recognized as a Result of Operations: |
| Net change in unrealized appreciation of futures contracts | | $ | — | | | $ | — | | | $ | — | | | $ | 165 | | | $ | — | | | $ | — | | | $ | 165 | |
| Net change in unrealized appreciation of written option contracts | | | — | | | | — | | | | — | | | | 49 | | | | — | | | | — | | | | 49 | |
| Total | | $ | — | | | $ | — | | | $ | — | | | $ | 214 | | | $ | — | | | $ | — | | | $ | 214 | |
Balance Sheet Offsetting Information - Set forth below are tables which disclose both gross information and net information about instruments and transactions eligible for offset in the financial statements, and instruments and transactions that are subject to a master netting arrangement, as well as amounts related to margin, reflected as financial collateral (including cash collateral), held at clearing brokers, counterparties and the Fund’s custodian. The master netting arrangements allow the clearing brokers to net any collateral held in or on behalf of the Fund, or liabilities or payment obligations of the clearing brokers to the Fund, against any liabilities or payment obligations of the Fund to the clearing brokers. The Fund is required to deposit financial collateral (including cash collateral) at the Futures Commission Merchant's ("FCM") custodian on behalf of clearing brokers and counterparties to continually meet the original and maintenance requirements established by the clearing brokers and counterparties. Such requirements are specific to the respective clearing broker or counterparty. Certain master netting arrangements may not be enforceable in a bankruptcy.
Offsetting of Financial Assets and Derivative Assets as of June 30, 2014:
| | | Gross Amounts*
of Assets
Presented in
Statement of
Assets and
Liabilities | | | Financial
Instruments with
Allowable Netting | | | Non-cash
Collateral
Received | | | Cash Collateral
Received | | | Net Amount (not
less than $0) | |
| Description | | | | | | | | | | | | | | | | | | | | |
| Futures contracts - Variation margin receivable | | $ | 4 | | | $ | — | | | $ | — | | | $ | — | | | $ | 4 | |
| Total subject to a master netting or similar arrangement | | $ | 4 | | | $ | — | | | $ | — | | | $ | — | | | $ | 4 | |
| * | Gross amounts presented as no amounts are netted within the Statements of Assets and Liabilities. |
Offsetting of Financial Liabilities and Derivative Liabilities as of June 30, 2014:
| | | Gross Amounts*
of Liabilities
Presented in
Statement of
Assets and
Liabilities | | | Financial
Instruments with
Allowable Netting | | | Non-cash
Collateral
Pledged | | | Cash Collateral
Pledged | | | Net Amount (not
less than $0) | |
| Description | | | | | | | | | | | | | | | | | | | | |
| Futures contracts - Variation margin payable | | $ | — | | | $ | — | | | $ | — | | | $ | (809 | )† | | $ | — | |
| Total subject to a master netting or similar arrangement | | $ | — | | | $ | — | | | $ | — | | | $ | (809 | ) | | $ | — | |
| * | Gross amounts presented as no amounts are netted within the Statement of Assets and Liabilities. |
| † | Pledged as initial margin deposit and collateral for daily variation margin loss on open financial derivative contracts held at June 30, 2014. |
| Hartford Disciplined Equity HLS Fund |
| Notes to Financial Statements – (continued) |
| June 30, 2014 (Unaudited) |
| (000’s Omitted) |
Principal Risks:
The Fund may be exposed to counterparty risk, or the risk that an institution or other entity with which the Fund has unsettled or open transactions will default.
The market values of equity securities, such as common stocks and preferred stocks, or equity related investments, such as futures and options, may decline due to general market conditions which are not specifically related to a particular company, such as real or perceived adverse economic conditions, changes in the general outlook for corporate earnings, changes in interest or currency rates or adverse investor sentiment generally. The market value of equity securities may also decline due to factors which affect a particular industry or industries, such as labor shortages or increased production costs and competitive conditions within an industry. Equity securities and equity related investments generally have greater market price volatility than fixed income securities.
Federal Income Taxes:
Federal Income Taxes – For federal income tax purposes, the Fund intends to continue to qualify as a RIC under Subchapter M of the Internal Revenue Code (“IRC”) by distributing substantially all of its taxable net investment income and net realized capital gains to its shareholders and otherwise complying with the requirements of the IRC. The Fund has distributed substantially all of its income and capital gains in prior years, if applicable, and intends to distribute substantially all of its income and capital gains prior to the next fiscal year-end. Accordingly, no provision for federal income or excise taxes has been made in the accompanying financial statements. Distributions from short-term capital gains are treated as ordinary income distributions for federal income tax purposes.
Net Investment Income (Loss), Net Realized Gains (Losses) and Distributions – Net investment income (loss) and net realized gains (losses) may differ for financial statement and tax purposes primarily because of losses deferred due to wash sale adjustments, foreign currency gains and losses, adjustments related to PFICs, REITs, RICs, certain derivatives and partnerships. The character of distributions made during the year from net investment income or net realized gains may differ from their ultimate characterization for federal income tax purposes. Also, due to the timing of dividend distributions, the fiscal year in which amounts are distributed may differ from the year that the income or realized gains (losses) were recorded by the Fund.
Distributions and Components of Distributable Earnings – The tax character of distributions paid by the Fund for the periods indicated is as follows (as adjusted for dividends payable, if applicable):
| | | For the Year Ended
December 31, 2013 | | | For the Year Ended
December 31, 2012 | |
| Ordinary Income | | $ | 8,169 | | | $ | 13,968 | |
As of December 31, 2013, the Fund’s components of distributable earnings (deficit) on a tax basis are as follows:
| | | Amount | |
| Undistributed Ordinary Income | | $ | 377 | |
| Accumulated Capital and Other Losses* | | | (1,260 | ) |
| Unrealized Appreciation† | | | 322,920 | |
| Total Accumulated Earnings | | $ | 322,037 | |
| * | The Fund has capital loss carryforwards that are identified in the Capital Loss Carryforward note that follows. |
| † | Differences between book-basis and tax-basis unrealized appreciation (depreciation) may be attributable to the losses deferred due to wash sale adjustments, foreign currency gains and losses, adjustments related to PFICs, REITs, RICs, certain derivatives and partnerships. |
Reclassification of Capital Accounts – The Fund may record reclassifications in its capital accounts. These reclassifications have no impact on the total net assets of the Fund. The reclassifications are a result of permanent differences between U.S. GAAP and tax accounting for such items as foreign currency, PFICs, expiration or utilization of capital loss carryforwards or net operating losses. Adjustments are made to reflect the impact these items have on current and future distributions to shareholders. Therefore, the
| Hartford Disciplined Equity HLS Fund |
| Notes to Financial Statements – (continued) |
| June 30, 2014 (Unaudited) |
| (000’s Omitted) |
source of the Fund’s distributions may be shown in the accompanying Statement of Changes in Net Assets as from undistributed net investment income, from accumulated net realized gains on investments or from capital depending on the type of book and tax differences that exist. For the year ended December 31, 2013, the Fund recorded reclassifications to increase (decrease) the accounts listed below:
| | | Amount | |
| Undistributed Net Investment Income (Loss) | | $ | (1,171 | ) |
| Accumulated Net Realized Gain (Loss) | | | 1,171 | |
Capital Loss Carryforward – On December 22, 2010, the Regulated Investment Company Modernization Act of 2010 (the “Act”) was enacted, which made changes to the capital loss carryforward rules. The changes are effective for taxable years beginning after the date of enactment. Under the Act, funds are permitted to carry forward capital losses for an unlimited period. However, any losses incurred during those future taxable years will be required to be utilized prior to the losses incurred in pre-enactment taxable years, which carry an expiration date. As a result of this ordering rule, pre-enactment capital loss carryforwards may be more likely to expire unused. Additionally, post-enactment capital loss carryforwards retain their character as either short-term or long-term capital losses rather than being considered all short-term as permitted under prior regulation.
At December 31, 2013 (tax year end), the Fund had capital loss carryforwards for U.S. federal income tax purposes as follows:
| Year of Expiration | | Amount | |
| 2017 | | $ | 1,260 | |
| Total | | $ | 1,260 | |
During the year ended December 31, 2013, the Fund utilized $139,515 of prior year capital loss carryforwards.
Accounting for Uncertainty in Income Taxes – The Fund has adopted financial reporting rules that require the Fund to analyze all open tax years, as defined by the statute of limitations, for all major jurisdictions. Generally, tax authorities can examine all tax returns filed for the last three years. The Fund does not have an examination in progress.
The Fund has reviewed all open tax years and major jurisdictions and concluded that these financial reporting rules had no effect on the Fund’s financial position or results of operations. There is no tax liability resulting from unrecognized tax benefits relating to uncertain income tax positions taken or expected to be taken on the tax return for the fiscal year ended December 31, 2013. The Fund is also not aware of any tax positions for which it is reasonably possible that the total amounts of unrecognized tax benefits will significantly change in the next twelve months.
Expenses:
Investment Management Agreement – Hartford Funds Management Company, LLC ("HFMC") serves as the Fund’s investment manager pursuant to an Investment Management Agreement with the Company. HFMC is an indirect wholly owned subsidiary of The Hartford Financial Services Group, Inc. ("The Hartford"). The investment manager has overall investment supervisory responsibility for the Fund. In addition, the investment manager provides administrative personnel, services, equipment, facilities and office space for proper operation of the Fund. HFMC has contracted with Wellington Management Company, LLP ("Wellington Management") under a sub-advisory agreement for the provision of day-to-day investment management services to the Fund in accordance with the Fund’s investment objective and policies. The Fund pays a fee to the investment manager, a portion of which may be used to compensate Wellington Management.
| Hartford Disciplined Equity HLS Fund |
| Notes to Financial Statements – (continued) |
| June 30, 2014 (Unaudited) |
| (000’s Omitted) |
The schedule below reflects the rates of compensation paid to the investment manager for investment management services rendered as of June 30, 2014; the rates are accrued daily and paid monthly:
| Average Daily Net Assets | | Annual Fee | |
| On first $250 million | | | 0.7750% | |
| On next $250 million | | | 0.7250% | |
| On next $500 million | | | 0.6750% | |
| On next $4 billion | | | 0.6250% | |
| On next $5 billion | | | 0.6225% | |
| Over $10 billion | | | 0.6200% | |
Accounting Services Agreement – Pursuant to the Fund Accounting Agreement between HFMC and the Company, on behalf of the Fund, HFMC provides accounting services to the Fund and receives monthly compensation based on the Fund’s average daily net assets at the rates set forth below. The Fund’s accounting services fees are accrued daily and paid monthly.
| Average Daily Net Assets | | Annual Fee | |
| On first $5 billion | | | 0.012% | |
| Over $5 billion | | | 0.010% | |
Operating Expenses – Allocable expenses incurred by the Company are allocated to each Fund and allocated to classes within a Fund in proportion to the average daily net assets of the Fund and each class, except where allocation of certain expenses is more fairly made directly to the Fund or to specific classes within a Fund.
Fees Paid Indirectly – The Company, on behalf of the Fund, has entered into agreements with State Street Global Markets, LLC and Russell Implementation Services, Inc. to partially recapture non-discounted trade commissions. Such rebates are used to pay a portion of the Fund's expenses. For the six-month period ended June 30, 2014, this amount, if any, is included in the Statement of Operations.
The ratio of expenses to average net assets in the accompanying financial highlights excludes the reduction in expenses related to fees paid indirectly. The annualized expense ratio after waivers for the period listed below reflecting the reduction for fees paid indirectly is as follows:
| | | Annualized Six-
Month Period Ended
June 30, 2014 | |
| Class IA | | | 0.76% | |
| Class IB | | | 1.01 | |
Distribution Plan for Class IB Shares – Hartford Funds Distributors, LLC (“HFD”), an indirect wholly owned subsidiary of The Hartford, is the principal underwriter and distributor of the Fund. The Company, on behalf of the Fund, has adopted a Distribution Plan pursuant to Rule 12b-1 of the 1940 Act for Class IB shares.
The Distribution Plan provides that the Fund may pay annually up to 0.25% of the average daily net assets of the Fund attributable to its Class IB shares for activities primarily intended to result in the sale of Class IB shares. The Board has the authority to suspend or reduce these payments at any point in time. Under the terms of the Distribution Plan and the principal underwriting agreement, the Fund is authorized to make payments monthly to the distributor that may be used to pay or reimburse entities providing distribution and shareholder servicing with respect to the Class IB shares for such entities’ fees or expenses incurred or paid in that regard. The distribution fee paid during the period can be found on the Statement of Operations. These fees are accrued daily and paid monthly.
| Hartford Disciplined Equity HLS Fund |
| Notes to Financial Statements – (continued) |
| June 30, 2014 (Unaudited) |
| (000’s Omitted) |
Other Related Party Transactions – Hartford Administrative Services Company (“HASCO”), an indirect wholly owned subsidiary of The Hartford, provides transfer agent services to the Fund. HASCO was compensated on a per account basis for providing such services. The amount paid to HASCO can be found in the Statement of Operations. These fees are accrued daily and paid monthly.
Payment from Affiliate – In July of 2007, The Hartford entered into a settlement with the Attorneys General of the states of New York, Connecticut and Illinois relating to market timing and the company's individual variable annuity contracts in which certain payments would be made directly to the variable annuity contract holders. The distribution plan provided that unclaimed money from the settlement would be distributed to certain HLS Funds that are investment options through a Hartford individual variable annuity contract. The unclaimed money was distributed to the Fund on September 18, 2009.
The total return in the accompanying financial highlights includes a payment from an affiliate. Had the payment from the affiliate been excluded, the impact and total return for the period listed below would have been as follows:
| | | For the Year Ended December 31, 2009 | |
| | | Class IA | | | Class IB | |
| Impact from Payment from Affiliate for Attorneys General Settlement | | | 0.01% | | | | 0.01% | |
| Total Return Excluding Payment from Affiliate | | | 25.64% | | | | 25.32% | |
Investment Transactions:
For the six-month period ended June 30, 2014, the cost of purchases and proceeds from sales of investment securities (excluding short-term investments) were as follows:
| | | Excluding U.S.
Government
Obligations | | | U.S.
Government
Obligations | | | Total | |
| Cost of Purchases | | $ | 417,881 | | | $ | — | | | $ | 417,881 | |
| Sales Proceeds | | | 533,794 | | | | — | | | | 533,794 | |
Line of Credit:
The Fund is one of several Hartford Funds that participate in a $500 million committed revolving line of credit facility. The facility is to be used for temporary or emergency purposes. Under the arrangement, the funds are required to own securities having a market value in excess of 300% of the total bank borrowings. The interest rate on borrowings varies depending on the nature of the loan. The facility also requires a fee to be paid based on the amount of the commitment. This commitment fee is allocated to all the funds participating in the line of credit based on the average net assets of the funds. During the six-month period ended June 30, 2014, the Fund did not have any borrowings under this facility.
Industry Classifications:
Other than the industry classifications "Other Investment Pools and Funds" and "Exchange Traded Funds," equity industry classifications used in this report are the Global Industry Classification Standard, which was developed by and is the exclusive property and service mark of MSCI, Inc. and Standard & Poor's.
Indemnifications:
Under the Company's organizational documents, the Company shall indemnify its officers and directors to the full extent required or permitted under Maryland General Corporation Law and the federal securities laws. In addition, the Company, on behalf of the Fund, may enter into contracts that contain a variety of indemnifications. The Company's maximum exposure under these arrangements is unknown. However, as of the date of these financial statements, the Company has not had prior claims or losses pursuant to these contracts and expects the risk of loss to be remote.
| Hartford Disciplined Equity HLS Fund |
| Notes to Financial Statements – (continued) |
| June 30, 2014 (Unaudited) |
| (000’s Omitted) |
Pending Legal Proceedings:
On February 25, 2011, Jennifer L. Kasilag, Louis Mellinger, Judith M. Menendez, Jacqueline M. Robinson, and Linda A. Russell filed a derivative lawsuit against Hartford Investment Financial Services, LLC (“HIFSCO”) (now known as Hartford Funds Distributors, LLC) on behalf of six Hartford retail mutual funds in the United States District Court for the District of New Jersey, alleging that HIFSCO received excessive advisory and distribution fees in violation of its statutory fiduciary duty under Section 36(b) of the 1940 Act when serving as investment manager and principal underwriter, respectively, to the Hartford retail mutual funds. Although this action was purportedly filed on behalf of certain of the Hartford Funds, none of the Hartford Funds is itself a defendant to the suit. HIFSCO moved to dismiss and, in September 2011, the motion was granted in part and denied in part, with leave to amend the complaint. In November 2011, plaintiffs filed an amended complaint on behalf of certain Hartford retail mutual funds, The Hartford Global Health Fund (now known as The Hartford Healthcare Fund), The Hartford Conservative Allocation Fund, The Hartford Growth Opportunities Fund, The Hartford Inflation Plus Fund, The Hartford Advisers Fund (now known as The Hartford Balanced Fund), and The Hartford Capital Appreciation Fund. Plaintiffs seek to rescind the investment management agreements and distribution plans between HIFSCO and these funds and to recover the total fees charged thereunder or, in the alternative, to recover any improper compensation HIFSCO received, in addition to lost earnings. HIFSCO filed a partial motion to dismiss the amended complaint and, in December 2012, the court dismissed without prejudice the claims regarding distribution fees and denied the motion with respect to the advisory fees claims. HIFSCO disputes the allegations and intends to defend vigorously.
In March 2014, the plaintiffs filed a new complaint that added as new plaintiffs The Hartford Floating Rate Fund and The Hartford Small Company Fund and named as a defendant Hartford Funds Management Company, LLC (the “Investment Manager”), which assumed the role as investment adviser to the funds as of January 2013. The Investment Manager and HIFSCO dispute the allegations and intend to defend vigorously.
This action concerns the activities of HIFSCO in its capacity as investment manager and principal underwriter to the Hartford retail mutual funds and does not concern HIFSCO’s activities in its capacity as principal underwriter to the HLS funds. For this reason, no accrual for litigation relating to this matter has been recorded in the financial statements of the Fund.
| Hartford Disciplined Equity HLS Fund |
| Financial Highlights |
| | | ─ Selected Per-Share Data(A) ─ | | ─ Ratios and Supplemental Data ─ | |
| Class | | Net Asset
Value at
Beginning
of Period | | | Net
Investment
Income
(Loss) | | | Net
Realized
and
Unrealized
Gain (Loss)
on
Investments | | | Total from
Investment
Operations | | | Dividends
from Net
Investment
Income | | | Distributions
from
Realized
Capital
Gains | | | Total
Dividends
and
Distributions | | | Net
Asset
Value at
End of
Period | | | Total
Return(B) | | | Net Assets
at End of
Period
(000s) | | | Ratio of
Expenses
to
Average
Net
Assets
Before
Adjust-
ments(C) | | | Ratio of
Expenses
to
Average
Net
Assets
After
Adjust-
ments(C) | | | Ratio of
Net
Investment
Income
(Loss) to
Average
Net Assets | |
| | | | | | | | | | | | | | | | | | | | | | | | | | | | | | | | | | | | | | | | |
| For the Six-Month Period Ended June 30, 2014 (Unaudited) |
| IA | | $ | 18.36 | | | $ | 0.06 | | | $ | 1.22 | | | $ | 1.28 | | | $ | – | | | $ | – | | | $ | – | | | $ | 19.64 | | | | 6.97 | %(D) | | $ | 766,730 | | | | 0.76 | %(E) | | | 0.76 | %(E) | | | 0.67 | %(E) |
| IB | | | 18.27 | | | | 0.04 | | | | 1.21 | | | | 1.25 | | | | – | | | | – | | | | – | | | | 19.52 | | | | 6.84 | (D) | | | 110,674 | | | | 1.01 | (E) | | | 1.01 | (E) | | | 0.42 | (E) |
| | | | | | | | | | | | | | | | | | | | | | | | | | | | | | | | | | | | | | | | | | | | | | | | | | | | | |
| For the Year Ended December 31, 2013 |
| IA | | $ | 13.64 | | | $ | 0.17 | | | $ | 4.72 | | | $ | 4.89 | | | $ | (0.17 | ) | | $ | – | | | $ | (0.17 | ) | | $ | 18.36 | | | | 35.82 | % | | $ | 811,099 | | | | 0.76 | % | | | 0.76 | % | | | 1.07 | % |
| IB | | | 13.58 | | | | 0.13 | | | | 4.68 | | | | 4.81 | | | | (0.12 | ) | | | – | | | | (0.12 | ) | | | 18.27 | | | | 35.47 | | | | 118,598 | | | | 1.01 | | | | 1.01 | | | | 0.82 | |
| | | | | | | | | | | | | | | | | | | | | | | | | | | | | | | | | | | | | | | | | | | | | | | | | | | | | |
| For the Year Ended December 31, 2012 (F) |
| IA | | $ | 11.78 | | | $ | 0.22 | | | $ | 1.86 | | | $ | 2.08 | | | $ | (0.22 | ) | | $ | – | | | $ | (0.22 | ) | | $ | 13.64 | | | | 17.62 | % | | $ | 798,148 | | | | 0.75 | % | | | 0.75 | % | | | 1.45 | % |
| IB | | | 11.73 | | | | 0.18 | | | | 1.85 | | | | 2.03 | | | | (0.18 | ) | | | – | | | | (0.18 | ) | | | 13.58 | | | | 17.33 | | | | 116,113 | | | | 1.00 | | | | 1.00 | | | | 1.20 | |
| | | | | | | | | | | | | | | | | | | | | | | | | | | | | | | | | | | | | | | | | | | | | | | | | | | | | |
| For the Year Ended December 31, 2011 (F) |
| IA | | $ | 11.79 | | | $ | 0.14 | | | $ | (0.01 | ) | | $ | 0.13 | | | $ | (0.14 | ) | | $ | – | | | $ | (0.14 | ) | | $ | 11.78 | | | | 1.15 | % | | $ | 852,312 | | | | 0.74 | % | | | 0.74 | % | | | 1.06 | % |
| IB | | | 11.73 | | | | 0.11 | | | | – | | | | 0.11 | | | | (0.11 | ) | | | – | | | | (0.11 | ) | | | 11.73 | | | | 0.90 | | | | 129,416 | | | | 0.99 | | | | 0.99 | | | | 0.81 | |
| | | | | | | | | | | | | | | | | | | | | | | | | | | | | | | | | | | | | | | | | | | | | | | | | | | | | |
| For the Year Ended December 31, 2010 (F) |
| IA | | $ | 10.47 | | | $ | 0.15 | | | $ | 1.32 | | | $ | 1.47 | | | $ | (0.15 | ) | | $ | – | | | $ | (0.15 | ) | | $ | 11.79 | | | | 14.04 | % | | $ | 1,022,321 | | | | 0.75 | % | | | 0.75 | % | | | 1.35 | % |
| IB | | | 10.42 | | | | 0.13 | | | | 1.30 | | | | 1.43 | | | | (0.12 | ) | | | – | | | | (0.12 | ) | | | 11.73 | | | | 13.76 | | | | 159,898 | | | | 1.00 | | | | 1.00 | | | | 1.10 | |
| | | | | | | | | | | | | | | | | | | | | | | | | | | | | | | | | | | | | | | | | | | | | | | | | | | | | |
| For the Year Ended December 31, 2009 (F) |
| IA | | $ | 8.46 | | | $ | 0.15 | | | $ | 2.01 | | | $ | 2.16 | | | $ | (0.15 | ) | | $ | – | | | $ | (0.15 | ) | | $ | 10.47 | | | | 25.65 | %(G) | | $ | 1,008,875 | | | | 0.75 | % | | | 0.75 | % | | | 1.56 | % |
| IB | | | 8.41 | | | | 0.13 | | | | 2.00 | | | | 2.13 | | | | (0.12 | ) | | | – | | | | (0.12 | ) | | | 10.42 | | | | 25.33 | (G) | | | 173,063 | | | | 1.00 | | | | 1.00 | | | | 1.31 | |
| (A) | Information presented relates to a share outstanding throughout the indicated period. Net investment income (loss) per share amounts are calculated based on average shares outstanding unless otherwise noted. |
| (B) | The figures do not include sales charges or other fees which may be applied at the variable life insurance, variable annuity or qualified retirement plan product level. Any such additional sales charges or other fees would lower the Fund's performance. |
| (C) | Adjustments include waivers and reimbursements, if applicable. Ratios do not include fees paid indirectly (see Expenses in the accompanying Notes to Financial Statements). |
| (F) | Net investment income (loss) per share amounts have been calculated using the SEC method. |
| (G) | Total return without the inclusion of the Payment from (to) Affiliate can be found in Expenses in the accompanying Notes to Financial Statements. |
| | | Portfolio Turnover
Rate for
All Share Classes | |
| For the Six-Month Period Ended June 30, 2014 (Unaudited) | | | 48% | |
| For the Year Ended December 31, 2013 | | | 23 | |
| For the Year Ended December 31, 2012 | | | 34 | |
| For the Year Ended December 31, 2011 | | | 44 | |
| For the Year Ended December 31, 2010 | | | 44 | |
| For the Year Ended December 31, 2009 | | | 59 | |
| Hartford Disciplined Equity HLS Fund |
| Directors and Officers (Unaudited) |
The Board of Directors of the Company (the "Directors") appoints officers who are responsible for the day-to-day operations of the Fund and who execute policies formulated by the Directors. Each Director serves until his or her death, resignation, or retirement or until the next annual meeting of shareholders is held or until his or her successor is elected and qualifies.
Directors and officers who are employed by or who have a financial interest in The Hartford are considered “interested” persons of the Fund pursuant to the 1940 Act. Each officer and two of the Company's Directors, as noted in the chart below, are “interested” persons of the Fund. Each Director serves as a director for The Hartford Mutual Funds, Inc., The Hartford Mutual Funds II, Inc., Hartford Series Fund, Inc., and Hartford HLS Series Fund II, Inc., and as a trustee for The Hartford Alternative Strategies Fund, which, as of June 30, 2014, collectively consist of 78 funds. Correspondence may be sent to Directors and officers c/o Hartford Funds, 5 Radnor Corporate Center, Suite 300, 100 Matsonford Road, Radnor, Pennsylvania 19087, except that correspondence to Mr. Annoni, Mr. Dressen and Ms. Quade may be sent to 500 Bielenberg Drive, Suite 500, Woodbury, Minnesota 55125.
The table below sets forth, for each Director and officer, his or her name, year of birth, current position with the Company and date first elected or appointed to Hartford Series Fund, Inc. ("HSF") and Hartford HLS Series Fund II, Inc. ("HSF2"), principal occupation, and, for Directors, other directorships held. The Fund’s Statement of Additional Information contains further information on the Directors and is available free of charge by calling 1-888-843-7824 or writing to: Hartford HLS Funds, c/o Hartford Life Insurance Company/Hartford Life and Annuity Insurance Company, P.O. Box 14293, Lexington, KY 40512-4293 for variable annuity and variable life insurance separate accounts of Hartford Life Insurance Company and its affiliates; Hartford Funds, P.O. Box 55022, Boston, MA 02205-5022 for all shareholders except variable annuity and variable life insurance separate accounts of Hartford Life Insurance Company and its affiliates.
Information on the aggregate remuneration paid to the directors of the Company can be found in the Statement of Operations herein. The Fund pays to The Hartford a portion of the Chief Compliance Officer’s compensation, but does not pay salaries or compensation to any of its other officers or Directors who are employed by The Hartford.
Non-Interested Directors
Lynn S. Birdsong (1946) Director since 2003, Co-Chairman of the Investment Committee since 2005
Mr. Birdsong is a private investor. Mr. Birdsong currently serves as a Director of the Sovereign High Yield Investment Company (April 2010 to current). Mr. Birdsong currently serves as an Independent Director of Nomura Partners Funds, Inc. (formerly, The Japan Fund) (April 2003 to current). From 2003 to March 2005, Mr. Birdsong was an Independent Director of the Atlantic Whitehall Funds. From 1979 to 2002, Mr. Birdsong was a Managing Director of Zurich Scudder Investments, an investment management firm. During his employment with Scudder, Mr. Birdsong was an Interested Director of The Japan Fund. From January 1981 through December 2013, Mr. Birdsong was a partner in Birdsong Company, an advertising specialty firm.
Robert M. Gavin, Jr. (1940) Director since 2002 (HSF) and 1986 (HSF2), Chairman of the Board since 2004
Dr. Gavin is an educational consultant. Prior to September 1, 2001, he was President of Cranbrook Education Community and prior to July 1996, he was President of Macalester College, St. Paul, Minnesota.
Duane E. Hill (1945) Director since 2001 (HSF) and 2002 (HSF2), Chairman of the Nominating Committee since 2003
Mr. Hill is a Partner of TSG Ventures L.P., a private equity investment company. Mr. Hill is a former partner of TSG Capital Group, a private equity investment firm that served as sponsor and lead investor in leveraged buyouts of middle market companies.
Sandra S. Jaffee (1941) Director since 2005
Ms. Jaffee is the founder and Chief Executive Officer of a private company, Homeworks Concierge, LLC, which provides residential property management services in Westchester County, New York (January 2012 to present). Ms. Jaffee served as Chairman (2008 to 2009) and Chief Executive Officer of Fortent (formerly Searchspace Group), a leading provider of compliance/regulatory technology to financial institutions from August 2005 to August 2009. From August 2004 to August 2005, Ms. Jaffee served as an Entrepreneur in Residence with Warburg Pincus, a private equity firm. Prior to joining Warburg Pincus, Ms. Jaffee served as Executive Vice President at Citigroup, from September 1995 to July 2004, where she was President and Chief Executive Officer of Citibank’s Global Securities Services (1995 to 2003). Ms. Jaffee currently serves as a member of the Board of Directors of Broadridge Financial Solutions as well as a Trustee of Muhlenberg College.
| Hartford Disciplined Equity HLS Fund |
| Directors and Officers (Unaudited) – (continued) |
William P. Johnston (1944) Director since 2005, Chairman of the Compliance Committee since 2005
In June 2006, Mr. Johnston was appointed as Senior Advisor to The Carlyle Group, a global private equity and other alternative asset investment firm and currently serves as an Operating Executive. In July 2006, Mr. Johnston was elected to the Board of Directors of MultiPlan, Inc. and served as a Director (July 2006 to August 2010). In August 2007, Mr. Johnston was elected to the Board of Directors of LifeCare Holdings, Inc. and served as a Director (August 2007 to June 2013). In February 2008, Mr. Johnston was elected to the Board of Directors of HCR-ManorCare, Inc. In May 2006, Mr. Johnston was elected to the Supervisory Board of Fresenius Medical Care AG & Co. KGaA, after its acquisition of Renal Care Group, Inc. in March 2006. Mr. Johnston joined Renal Care Group in November 2002 as a member of the Board of Directors and served as Chairman of the Board from March 2003 through March 2006. From 2002 through 2013, Mr. Johnston served as a Board member of the Georgia O’Keefe Museum. From September 1987 to December 2002, Mr. Johnston was with Equitable Securities Corporation (and its successors, SunTrust Equitable Securities and SunTrust Robinson Humphrey) serving in various investment banking and managerial positions, including Managing Director and Head of Investment Banking, Chief Executive Officer and Vice Chairman.
Phillip O. Peterson (1944) Director since 2002 (HSF) and 2000 (HSF2), Chairman of the Audit Committee since 2002
Mr. Peterson is a mutual fund industry consultant. He was a partner of KPMG LLP (an accounting firm) until July 1999. Mr. Peterson joined William Blair Funds in February 2007 as a member of the Board of Trustees. From February 2012 to February 2014, Mr. Peterson served as a Trustee of Symetra Variable Mutual Funds. From January 2004 to April 2005, Mr. Peterson served as Independent President of the Strong Mutual Funds.
Lemma W. Senbet (1946) Director since 2005
Dr. Senbet is the William E. Mayer Chair Professor of Finance and Founding Director, Center for Financial Policy, at the University of Maryland, Robert H. Smith School of Business. He was chair of the Finance Department of the University of Maryland, Robert H. Smith School of Business from 1998 to 2006. Since June 2013, he has been on leave from the University to serve as Executive Director of African Economic Research Consortium which focuses on economic policy research and training. Previously, he was a chaired professor of finance at the University of Wisconsin-Madison. Also, he was a Director of the Fortis Funds from March 2000 to July 2002. Dr. Senbet served as Director of the American Finance Association and President of the Western Finance Association. In 2006, Dr. Senbet was inducted Fellow of Financial Management Association International for his career-long distinguished scholarship and professional service.
Interested Directors and Officers
James E. Davey (1964) Director since 2012, President and Chief Executive Officer since 2010
Mr. Davey serves as Executive Vice President of Hartford Life Insurance Company (“HLIC”) and The Hartford Financial Services Group, Inc. Additionally, Mr. Davey serves as Chairman of the Board, Manager and Senior Managing Director of Hartford Funds Distributors, LLC (“HFD”). He also currently serves as Director, Chairman of the Board, President and Senior Managing Director of Hartford Administrative Services Company (“HASCO”). Mr. Davey also serves as Manager, Chairman of the Board and Senior Managing Director for Hartford Funds Management Company, LLC (“HFMC”) and Director, Chairman of the Board and Senior Managing Director for Hartford Funds Management Group, Inc. ("HFMG"). Mr. Davey has served in various positions within The Hartford and its subsidiaries in connection with the operation of the Hartford Funds. Mr. Davey joined The Hartford in 2002.
Lowndes A. Smith (1939) Director since 1996 (HSF) and 2002 (HSF2), Co-Chairman of the Investment Committee since 2005
Mr. Smith served as Vice Chairman of The Hartford from February 1997 to January 2002, as President and Chief Executive Officer of Hartford Life, Inc. from February 1997 to January 2002, and as President and Chief Operating Officer of The Hartford Life Insurance Companies from January 1989 to January 2002. Mr. Smith serves as a Director of White Mountains Insurance Group Ltd. (October 2003 to current); One Beacon Insurance (October 2006 to current); Symetra Financial (August 2007 to current) and is a Managing Director of Whittington Gray Associates (January 2007 to current).
Other Officers
Mark A. Annoni (1964) Vice President, Controller and Treasurer since 2012
Mr. Annoni currently serves as the Assistant Vice President of HLIC (February 2004 to present) and Senior Vice President of HFMG (December 2013 to present). Mr. Annoni has served in various positions within The Hartford and its subsidiaries in connection with the operation of the Hartford Funds. Mr. Annoni joined The Hartford in 2001.
| Hartford Disciplined Equity HLS Fund |
| Directors and Officers (Unaudited) – (continued) |
Michael R. Dressen (1963) AML Compliance Officer since 2011
Mr. Dressen currently serves as Assistant Vice President of HLIC. He also serves as Chief Compliance Officer and AML Compliance Officer of HASCO and as AML Officer of HFD. Mr. Dressen has served in various positions within The Hartford and its subsidiaries in connection with the operation of the Hartford Funds.
Edward P. Macdonald (1967) Vice President, Secretary and Chief Legal Officer since 2005
Mr. Macdonald currently serves as Assistant Secretary, Executive Vice President and Deputy General Counsel of HFD, HASCO, HFMC and HFMG. He also serves as Vice President of HLIC. Mr. Macdonald has served in various positions within The Hartford and its subsidiaries in connection with the operation of the Hartford Funds. Mr. Macdonald joined The Hartford in 2005.
Joseph G. Melcher (1973) Vice President and Chief Compliance Officer since 2013
Mr. Melcher currently serves as Executive Vice President of HFD, HFMG and HASCO. Mr. Melcher also currently serves as Executive Vice President and Chief Compliance Officer of HFMC. Mr. Melcher has served in various positions within The Hartford and its subsidiaries in connection with the operation of the Hartford Funds since joining The Hartford in 2012. Prior to joining The Hartford, Mr. Melcher worked at Touchstone Investments, a member of the Western & Southern Financial Group, where he held the position of Vice President and Chief Compliance Officer from 2010 through 2012 and Assistant Vice President, Compliance from 2005 to 2010.
Vernon J. Meyer (1964) Vice President since 2006
Mr. Meyer currently serves as Senior Vice President of HLIC. He also currently serves as Managing Director and Chief Investment Officer of HFMC and Managing Director of HFMG. Mr. Meyer has served in various positions within The Hartford and its subsidiaries in connection with the operation of the Hartford Funds. Mr. Meyer joined The Hartford in 2004.
Laura S. Quade (1969) Vice President since 2012
Ms. Quade currently serves as Vice President of HASCO, HFD and HFMG. She is the Head of Operations of HASCO and also serves as Director, Enterprise Operations of HLIC. Ms. Quade has served in various positions within The Hartford and its subsidiaries in connection with the operation of the Hartford Funds.
Martin A. Swanson (1962) Vice President since 2010
Mr. Swanson currently serves as Vice President of HLIC. Mr. Swanson also serves as Managing Director, Chief Marketing Officer and Principal of HFD and Managing Director of HFMG. Mr. Swanson has served in various positions within The Hartford and its subsidiaries in connection with the operation of the Hartford Funds.
HOW TO OBTAIN A COPY OF THE FUND’S PROXY VOTING POLICIES AND VOTING RECORDS (UNAUDITED)
A description of the policies and procedures that the Fund uses to determine how to vote proxies relating to portfolio securities and information about how the Fund voted proxies relating to portfolio securities during the most recent twelve-month period ended June 30 are available (1) without charge, upon request, by calling 888-843-7824 and (2) on the SEC’s website at http://www.sec.gov.
QUARTERLY PORTFOLIO HOLDINGS INFORMATION (UNAUDITED)
The Fund files a complete schedule of portfolio holdings with the SEC for the first and third quarters of each fiscal year on Form N-Q. The Fund’s Forms N-Q are available (1) without charge, upon request, by calling 888-843-7824 and (2) on the SEC’s website at http://www.sec.gov. The Form N-Q may be reviewed and copied at the SEC’s Public Reference Room in Washington, DC. Information on the operation of the Public Reference Room may be obtained by calling 1-800-SEC-0330.
| Hartford Disciplined Equity HLS Fund |
| Expense Example (Unaudited) |
Your Fund's Expenses
As a shareholder of the Fund, you incur two types of costs: (1) transaction costs and (2) ongoing costs, including investment management fees, distribution and/or service (12b-1) fees, if any, and other fund expenses. This example is intended to help you understand your ongoing costs (in dollars) of investing in the Fund and to compare these costs with the ongoing costs of investing in other mutual funds. The example is based on an investment of $1,000 invested at the beginning of the period and held for the entire period of December 31, 2013 through June 30, 2014.
Actual Expenses
The first set of columns of the table below provides information about actual account values and actual expenses. You may use the information in this column, together with the amount you invested, to estimate the expenses that you paid over the period. Simply divide your account value by $1,000 (for example, an $8,600 account value divided by $1,000 = 8.6), then multiply the result by the number in the line under the heading entitled “Expenses Paid During Period” to estimate the expenses you paid on your account during this period.
Hypothetical Example for Comparison Purposes
The second set of columns of the table below provides information about hypothetical account values and hypothetical expenses based on the Fund's actual expense ratio and an assumed rate of return of 5% per year before expenses, which is not the Fund's actual return. The hypothetical account values and expenses may not be used to estimate the actual ending account balance or expenses you paid for the period. You may use this information to compare the ongoing costs of investing in the Fund and other funds. To do so, compare this 5% hypothetical example with the 5% hypothetical examples that appear in the shareholder reports of the other funds.
Please note that the expenses shown in the table are meant to highlight your ongoing costs only and do not reflect any transactional costs, such as sales charges (loads) and CDSC. Therefore, the second set of columns of the table is useful in comparing ongoing costs only, and will not help you determine the relative total costs of owning different funds. In addition, if these transactional costs were included, your costs would be higher. Expenses are equal to the Fund's annualized expense ratios multiplied by average account value over the period, multiplied by 181/365 (to reflect the one-half year period).
| | | Actual return | | | Hypothetical (5% return before expenses) | | | | | | | | | | |
| | | Beginning
Account Value
December 31,
2013 | | | Ending Account
Value
June 30, 2014 | | | Expenses paid
during the period
December 31, 2013
through
June 30, 2014 | | | Beginning
Account Value
December 31,
2013 | | | Ending Account
Value
June 30, 2014 | | | Expenses paid
during the period
December 31,
2013
through
June 30, 2014 | | | Annualized
expense
ratio | | | Days
in the
current
1/2
year | | | Days
in the
full
year | |
| Class IA | | $ | 1,000.00 | | | $ | 1,069.70 | | | $ | 3.90 | | | $ | 1,000.00 | | | $ | 1,021.03 | | | $ | 3.81 | | | | 0.76 | % | | | 181 | | | | 365 | |
| Class IB | | $ | 1,000.00 | | | $ | 1,068.40 | | | $ | 5.18 | | | $ | 1,000.00 | | | $ | 1,019.79 | | | $ | 5.06 | | | | 1.01 | | | | 181 | | | | 365 | |
| Hartford Disciplined Equity HLS Fund |
| Main Risks (Unaudited) |
The main risks of investing in the Fund are described below.
Market, Selection and Strategy Risk: The Fund’s share price may fluctuate due to market risk and/or security selections that may underperform the market or relevant benchmarks. If the sub-adviser's investment strategy does not perform as expected, the Fund could underperform its peers or lose money. There is no guarantee the Fund will achieve its stated objective.
Foreign Investment Risk: Investments in foreign securities may be riskier than investments in U.S. securities. Potential risks include the risks of illiquidity, increased price volatility, less government regulation, less extensive and less frequent accounting and other reporting requirements, unfavorable changes in currency exchange rates, and economic and political disruptions.
Quantitative Analysis Risk: The Fund uses quantitative analysis in its securities selection; securities selected by this method may perform differently from the broader stock market.
Active Trading Risk: Actively trading investments may result in higher costs (thus affecting performance).
THIS PRIVACY POLICY IS NOT PART OF THIS REPORT
Privacy Policy and Practices of The Hartford Financial Services Group, Inc. and its Affiliates
(herein called “we, our and us”)
This Privacy Policy applies to our United States Operations
We value your trust. We are committed to the responsible: a) management; b) use; and c) protection; of Personal Information. This notice describes how we collect, disclose, and protect Personal Information. We collect Personal Information to: a) service your Transactions with us; and b) support our business functions. We may obtain Personal Information from: a) You; b) your Transactions with us; and c) third parties such as a consumer-reporting agency. Based on the type of product or service You apply for or get from us, Personal Information such as: a) your name; b) your address; c) your income; d) your payment; or e) your credit history; may be gathered from sources such as applications, Transactions, and consumer reports. To serve You and service our business, we may share certain Personal Information. We will share Personal Information, only as allowed by law, with affiliates such as: a) our insurance companies; b) our employee agents; c) our brokerage firms; and d) our administrators. As allowed by law, we may share Personal Financial Information with our affiliates to: a) market our products; or b) market our services; to You without providing You with an option to prevent these disclosures. | | | We may also share Personal Information, only as allowed by law, with unaffiliated third parties including: a) independent agents; b) brokerage firms; c) insurance companies; d) administrators; and e) service providers; who help us serve You and service our business. When allowed by law, we may share certain Personal Financial Information with other unaffiliated third parties who assist us by performing services or functions such as: a) taking surveys; b) marketing our products or services; or c) offering financial products or services under a joint agreement between us and one or more financial institutions. We, and third parties we partner with, may track some of the pages You visit through the use of: a) cookies; b) pixel tagging; or c) other technologies; and currently do not process or comply with any web browser’s “do not track” signal or similar mechanism that indicates a request to disable online tracking of individual users who visit our websites or use our services. We will not sell or share your Personal Financial Information with anyone for purposes unrelated to our business functions without offering You the opportunity to: a) “opt-out;” or b) “opt-in;” as required by law. We only disclose Personal Health Information with: a) your proper written authorization; or b) as otherwise allowed or required by law. Our employees have access to Personal Information in the course of doing their jobs, such as: a) underwriting policies; b) paying claims; c) developing new products; or d) advising customers of our products and services. |
We use manual and electronic security procedures to maintain: a) the confidentiality; and b) the integrity of; Personal Information that we have. We use these procedures to guard against unauthorized access. Some techniques we use to protect Personal Information include: a) secured files; b) user authentication; c) encryption; d) firewall technology; and e) the use of detection software. We are responsible for and must: a) identify information to be protected; b) provide an adequate level of protection for that data; c) grant access to protected data only to those people who must use it in the performance of their job-related duties. Employees who violate our Privacy Policy will be subject to discipline, which may include ending their employment with us. At the start of our business relationship, we will give You a copy of our current Privacy Policy. We will also give You a copy of our current Privacy Policy once a year if You maintain a continuing business relationship with us. We will continue to follow our Privacy Policy regarding Personal Information even when a business relationship no longer exists between us. | | | As used in this Privacy Notice: Application means your request for our product or service. Personal Financial Information means financial information such as: a) credit history; b) income; c) financial benefits; or d) policy or claim information. Personal Health Information means health information such as: a) your medical records; or b) information about your illness, disability or injury. Personal Information means information that identifies You personally and is not otherwise available to the public. It includes: a) Personal Financial Information; and b) Personal Health Information. Transaction means your business dealings with us, such as: a) your Application; b) your request for us to pay a claim; and c) your request for us to take an action on your account. You means an individual who has given us Personal Information in conjunction with: a) asking about; b) applying for; or c) obtaining; a financial product or service from us if the product or service is used mainly for personal, family, or household purposes. |
This Privacy Policy is being provided on behalf of the following affiliates of The Hartford Financial Services Group, Inc.:
1stAGChoice, Inc.; Access CoverageCorp, Inc.; Access CoverageCorp Technologies, Inc.; American Maturity Life Insurance Company; Archway 60 R, LLC; Business Management Group, Inc.; Champlain Life Reinsurance Company; DMS R, LLC; Eloy R, LLC; Ersatz Corporation; First State Insurance Company; Hartford Accident and Indemnity Company; Hartford Administrative Services Company; Hartford Casualty General Agency, Inc.; Hartford Casualty Insurance Company; Hartford-Comprehensive Employee Benefit Service Company; Hartford Equity Sales Company, Inc.; Hartford Fire General Agency, Inc.; Hartford Fire Insurance Company; Hartford Funds Management Company, LLC; Hartford Funds Management Group, Inc.; Hartford HLS Series Fund II, Inc.; Hartford Insurance Company of Illinois; Hartford Insurance Company of the Midwest; Hartford Insurance Company of the Southeast; Hartford Integrated Technologies, Inc.; Hartford International Life Reassurance Corporation; Hartford Funds Distributors, LLC; Hartford Investment Management Company; Hartford Life and Accident Insurance Company; Hartford Life and Annuity Insurance Company; Hartford Life Insurance Company; Hartford Life Private Placement, LLC; Hartford Lloyd’s Corporation; Hartford Lloyd’s Insurance Company; Hartford Mezzanine Investors I, LLC; Hartford Residual Market, L.C.C.; Hartford Retirement Services, LLC; Hartford Securities Distribution Company, Inc.; Hartford Series Fund, Inc.; Hartford Specialty Insurance Services of Texas, LLC; Hartford Strategic Investments, LLC; Hartford Underwriters Insurance Company; Hartford Technology Services Company, L.L.C.; Hartford of Texas General Agency, Inc.; Hartford Underwriters General Agency, Inc.; HARTRE Company, L.C.C.; HL Investment Advisors, LLC; HLA LLC; Horizon Management Group, LLC; HRA Brokerage Services, Inc.; Lanidex Class B, LLC; M-CAP Insurance Agency, LLC; New England Insurance Company; New England Reinsurance Corporation; Nutmeg Insurance Agency, Inc.; Nutmeg Insurance Company; Pacific Insurance Company, Limited; Planco, LLC: Property and Casualty Insurance Company of Hartford; Revere R, LLC; RVR R, LLC; Sentinel Insurance Company, Ltd.; Sunstone R, LLC; Symphony R, LLC; The Evergreen Group Incorporated; The Hartford Alternative Strategies Fund; The Hartford Mutual Funds, Inc.; The Hartford Mutual Funds II, Inc.; Trumbull Flood Management, L.L.C.; Trumbull Insurance Company; Twin City Fire Insurance Company; White River Life Reinsurance Company.
HPP Revised January 2014
HARTFORD HLS FUNDS
P.O. Box 14293
Lexington, KY 40512-4293
HARTFORDFUNDS
hartfordfunds.com
Hartford Series Fund, Inc. is underwritten and distributed by Hartford Funds Distributors, LLC.
Hartford Series Fund, Inc. inception dates range from 1977 to date. Hartford Series Fund, Inc. is not a subsidiary of The Hartford Financial Services Group, Inc. ("The Hartford") but is underwritten, distributed by and advised by subsidiaries of The Hartford. Investments in Hartford Series Fund, Inc. are not guaranteed by The Hartford or any other entity.
This report is submitted for the general information of the shareholders of the Funds. It is not authorized for distribution unless preceded or accompanied by a current prospectus for the Funds.
Investors should carefully consider the investment objectives, risks, charges, and expenses of Hartford Funds before investing. This and other information can be found in the prospectus, which can be obtained by calling 800-862-6668 (or 800-279-1541 for institutional investors). Investors should read them carefully before they invest.
HLSSAR-DE14 8-14 115338-1 Printed in U.S.A.
HARTFORDFUNDS
| | HARTFORD DIVIDEND AND GROWTH HLS FUND 2014 Semi Annual Report |
A MESSAGE FROM THE PRESIDENT
Dear Fellow Shareholders:
Thank you for investing in Hartford HLS Funds.
Market Review
U.S. equities (as represented by the S&P 500 Index) started 2014 on a shaky note after posting a strong 32.39% gain in 2013. However, stocks managed to maintain modest gains throughout the first quarter and returned to a generally steady climb in the second quarter. Through June 30, 2014, the S&P 500 Index advanced 7.14%. It appears that much of the market volatility during the year can be attributed to heightened international tensions. In particular, the Russian annexation of Ukraine’s Crimean Peninsula and increased tensions in Iraq were cause for concern.
On the domestic front, subdued economic and employment reports slowed stocks’ progress early in the new year, although much of the weakness seemed to dissipate as the year’s unusually harsh winter subsided. And despite initial reactions to the idea, when the U.S. Federal Reserve began tapering its quantitative-easing program in January by reducing its bond purchases by $10 billion a month, the markets took the policy change in stride.
Despite a rough start to the year for financial markets, the global economy seems to be settling into a slow-but-steady recovery. While first-quarter U.S. gross domestic product (GDP) growth was disappointing at -2.9%, U.S. consumer spending, which is a significant contributor toward economic growth, rose by 3% during the quarter. It appears that Europe is also maintaining its own recovery: The International Monetary Fund projects that Europe’s full-year GDP growth may breach positive territory for the first time since 2011.
The impact of international affairs on stocks so far this year is an important reminder to stay informed about both domestic and international economic developments, and any effects they may have on your individual investment goals. If you have not already had a mid-year review of your portfolio, it may be a good time to meet with your financial advisor to review your progress and make certain your investments are prepared for all market environments:
| • | Is your portfolio properly diversified with an appropriate mix of stocks and bonds? |
| • | Is your portfolio positioned to take advantage of the global economic recovery, with investments in both domestic and international holdings? |
| • | Are your investments still in line with your risk tolerance and investment time horizon? |
Your financial professional can help you choose options within our fund family to help you reach your investment goals with confidence.
Thank you again for investing with Hartford HLS Funds.
James Davey
President
Hartford HLS Funds
1 The S&P 500 Index is a market capitalization-weighted price index composed of 500 widely held common stocks.
2The Dow Jones Industrial Average is an unmanaged, price-weighted index of 30 of the largest, most widely held stocks traded on the New York Stock Exchange.
Hartford Dividend and Growth HLS Fund
Table of Contents
This report is prepared for the general information of contract owners and qualified retirement plan participants. It is not an offer of contracts or of qualified retirement plans. It should not be used in connection with any offer, except in conjunction with the appropriate product prospectus which contains all pertinent information including the applicable sales, administrative and other charges.
The views expressed in the Fund’s Manager Discussion under ‘‘Why did the Fund perform this way?’’ and ‘‘What is the outlook?’’ are views of the Fund’s sub-adviser and portfolio management team through the end of the period and are subject to change based on market and other conditions. The Fund’s Manager Discussion is for informational purposes only and does not represent an offer, recommendation or solicitation to buy, hold or sell any security. The specific securities identified and described, if any, do not represent all of the securities purchased or sold and you should not assume that investments in the securities identified and discussed will be profitable.
Hartford Dividend and Growth HLS Fund inception 03/09/1994
(sub-advised by Wellington Management Company, LLP)
Investment objective – The Fund seeks a high level of current income consistent with growth of capital.
Performance Overview 6/30/04 - 6/30/14
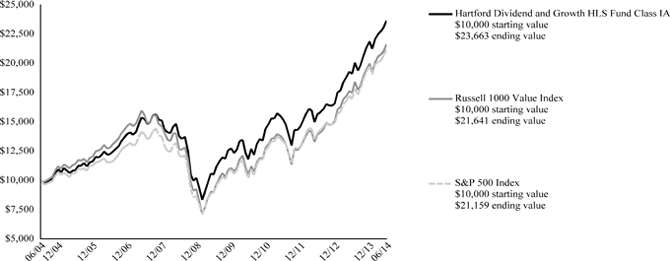
The chart above represents the hypothetical growth of a $10,000 investment in Class IA. Growth results in classes other than Class IA will vary from what is seen above due to differences in the expenses charged to those share classes.
Average Annual Total Returns (as of 6/30/14)
| | 6 Month† | 1 Year | 5 Years | 10 Years |
| Dividend and Growth IA | 8.13% | 23.83% | 17.67% | 9.00% |
| Dividend and Growth IB | 8.00% | 23.51% | 17.38% | 8.72% |
| Russell 1000 Value Index | 8.28% | 23.81% | 19.23% | 8.03% |
| S&P 500 Index | 7.14% | 24.61% | 18.83% | 7.78% |
PERFORMANCE DATA QUOTED REPRESENTS PAST PERFORMANCE AND DOES NOT GUARANTEE FUTURE RESULTS. The investment return and principal value of the investment will fluctuate so that investors’ shares, when redeemed, may be worth more or less than their original cost. Current performance may be lower or higher than the performance data quoted. To obtain performance data current to the most recent month-end, please visit our website www.hartfordfunds.com.
Total returns presented above were calculated using the Fund’s net asset value available to shareholders for sale or redemption of Fund shares on June 30, 2014, which may exclude investment transactions as of this date. All share class returns assume the reinvestment of all distributions at net asset value and the deduction of all fund expenses.
Russell 1000 Value Index is an unmanaged index that measures the performance of those Russell 1000 Index companies with lower price-to-book ratios and lower forecasted growth values. The Russell 1000 Index is an unmanaged index that measures the performance of the 1,000 largest companies in the Russell 3000 Index, which measures the performance of the 3,000 largest U.S. companies, based on total market capitalizations.
S&P 500 Index is a market capitalization-weighted price index composed of 500 widely held common stocks.
The index is unmanaged, and its results include reinvested dividends and/or distributions, but do not reflect the effect of sales charges, commissions, expenses or taxes.
You cannot invest directly in an index.
As shown in the Fund's current prospectus dated May 1, 2014, the total annual operating expense ratios for Class IA and Class IB were 0.67% and 0.92%, respectively. Actual expenses may be higher. Please see the accompanying Financial Highlights for expense ratios for the six-month period ended June 30, 2014.
The chart and table do not reflect the deductions of taxes, sales charges or other fees which may be applied at the variable life insurance, variable annuity or qualified retirement plan product level. Any such additional sales charges or other fees or expenses would lower the contract’s or plan’s performance.
All investments are subject to risk including the possible loss of principal. For a discussion of the Fund’s risks, please see the Main Risks section of this report. For more detailed information on the risks associated with an investment in the Fund, please see the prospectus.
| Hartford Dividend and Growth HLS Fund |
| Manager Discussion |
| June 30, 2014 (Unaudited) |
| Portfolio Managers | | |
| Edward P. Bousa, CFA | Donald J. Kilbride | Matthew G. Baker |
| Senior Vice President and Equity Portfolio Manager | Senior Vice President and Equity Portfolio Manager | Senior Vice President and Equity Portfolio Manager |
How did the Fund perform?
The Class IA shares of the Hartford Dividend and Growth HLS Fund returned 8.13% for the six-month period ended June 30, 2014, outperforming the Fund’s benchmark, the S&P 500 Index, which returned 7.14% for the same period. The Fund underperformed the Russell 1000 Value Index, which returned 8.28% for the same period. The Fund outperformed the 7.33% average return of the Lipper Equity Income Funds peer group, a group of funds with investment strategies similar to those of the Fund.
Why did the Fund perform this way?
U.S. equities surged during the period, ending June near an all-time high. From its closing low on March 9, 2009, the S&P 500 Index ended June 2014 up 224%. After finishing their best year since 1997, U.S. stocks began 2014 with their worst month in nearly two years. Worries about a slowdown in China and general angst surrounding emerging markets overshadowed a fairly benign domestic environment. However, robust merger and acquisition activity and an uncontested increase in the debt ceiling from Congress helped stoke investors' risk appetites in February. Earnings season in April provided a varied yet encouraging picture, with companies generally reporting healthy earnings but more subdued revenues. The rally marched on in May amid renewed signs of life in the housing market and the best payroll gain in more than two years. In June, strong manufacturing activity, coupled with continued positive momentum in housing and employment data, helped to offset a large negative revision to first quarter economic growth.
Overall equity market performance was positive for the period across all market capitalizations: Mid caps (+8%), large cap equities (+7%), and small caps (+3%) all rose as represented by the S&P MidCap 400, S&P 500, and Russell 2000 Indices, respectively. During the six-month period, all ten sectors within the S&P 500 Index posted positive returns, led by Utilities (+19%), Energy (+13%), and Healthcare (+11%).
The Fund’s performance relative to the S&P 500 was driven primarily by stock selection. Security selection within Healthcare, Consumer Discretionary, and Financials contributed positively to relative performance, while selection within Consumer Staples and Telecommunication Services detracted from relative performance. Sector allocation, a result of our bottom-up security selection process, contributed modestly to relative returns. Our underweight position in Consumer Discretionary and overweight position in Healthcare positively contributed to relative performance, while an overweight to Financials and underweight to Information Technology detracted from relative performance. A modest cash position detracted in an upward trending market.
The Fund’s top contributors to performance relative to the S&P 500 Index during the period were AstraZeneca (Healthcare), Anadarko Petroleum (Energy), and Wells Fargo (Financials). Shares of AstraZeneca, a U.K.-based multinational pharmaceutical company focused on cardiovascular, gastrointestinal respiratory, oncology, and neuroscience treatments, outperformed during the period on news that U.S.-based pharmaceutical giant Pfizer offered to acquire the company at a price that AstraZeneca dismissed as being too low. Shares of Anadarko Petroleum, a U.S.-based independent oil exploration and production company, outperformed during the period after the company announced it had settled the Tronox litigation for $5.15 billion, a much lower figure than many investors feared. Shares of Wells Fargo, a U.S.-based diversified bank, outperformed after the company reported first quarter earnings results well ahead of expectations. Deposit growth remained solid and loans rose solidly with a better outlook going forward. Merck (Healthcare) was among the top contributors to absolute performance.
The Fund’s top detractors from returns relative to the S&P 500 Index were Prudential Financial (Financials), Apple (Information Technology), and JPMorgan Chase (Financials). Shares of Prudential Financial, a large U.S. life insurer with a sizable business in Japan, fell during the period after the company delivered weaker-than-expected fourth quarter earnings, in part due to disappointing results in the International division. Lower-than-anticipated long-term interest rates also weighed on the shares. Shares of Apple, a U.S.-based designer and manufacturer of consumer electronics, software, and computers, rose during the period after the company posted strong quarterly results led by much better-than-expected iPhone sales. Our underweight position in Apple, a strong performing S&P 500 constituent, detracted from relative returns. Shares of JPMorgan Chase, a U.S.-based global financial services firm, underperformed during the period after the company posted quarterly results that were below expectations on both the top and bottom lines, driven by disappointing mortgage results and lower activity levels across the business. Citigroup (Financials), General Electric (Industrials), and Bristol-Meyers Squibb (Healthcare) also detracted from absolute returns.
Derivatives are not used in a significant manner in this Fund and did not have a material impact on performance during the period.
| Hartford Dividend and Growth HLS Fund |
| Manager Discussion – (continued) |
| June 30, 2014 (Unaudited) |
What is the outlook?
Overall, our view on the U.S. economy is more cautious than it was last year. For some time, we have been below consensus in our outlook for U.S. growth and we believe that this now appears to have been borne out. From a portfolio perspective, we believe we are well positioned for a tepid economic environment. We remain focused on the significance of dividends, effective use of capital, and franchise value. We believe we have a solid portfolio of undervalued market leaders, stocks in industries with improving supply/demand trends, and solid companies that are temporarily out of favor. At the end of the period, our largest overweights were to the Financials and Healthcare sectors, while we remained underweight the Consumer Discretionary and Information Technology sectors, relative to the S&P 500 Index.
| Diversification by Sector |
| as of June 30, 2014 |
| Sector | | Percentage of
Net Assets | |
| Equity Securities | | | | |
| Consumer Discretionary | | | 7.6 | % |
| Consumer Staples | | | 7.2 | |
| Energy | | | 11.2 | |
| Financials | | | 21.3 | |
| Health Care | | | 16.7 | |
| Industrials | | | 12.6 | |
| Information Technology | | | 14.2 | |
| Materials | | | 2.3 | |
| Services | | | 2.6 | |
| Utilities | | | 3.2 | |
| Total | | | 98.9 | % |
| Short-Term Investments | | | 1.0 | |
| Other Assets and Liabilities | | | 0.1 | |
| Total | | | 100.0 | % |
A sector may be comprised of several industries. For Fund compliance purposes, the Fund may not use the same classification system and these sector classifications are used for reporting ease.
| Hartford Dividend and Growth HLS Fund |
| Schedule of Investments |
| June 30, 2014 (Unaudited) |
| (000’s Omitted) |
| Shares or Principal Amount | | Market Value ╪ | |
| Common Stocks - 98.9% | | | | |
| | | | | Automobiles and Components - 1.7% | | | | |
| | 3,503 | | | Ford Motor Co. | | $ | 60,392 | |
| | 366 | | | Honda Motor Co., Ltd. ADR | | | 12,817 | |
| | | | | | | | 73,209 | |
| | | | | Banks - 7.7% | | | | |
| | 460 | | | Bank of Nova Scotia | | | 30,636 | |
| | 880 | | | PNC Financial Services Group, Inc. | | | 78,377 | |
| | 742 | | | US Bancorp | | | 32,127 | |
| | 3,612 | | | Wells Fargo & Co. | | | 189,858 | |
| | | | | | | | 330,998 | |
| | | | | Capital Goods - 7.0% | | | | |
| | 152 | | | Caterpillar, Inc. | | | 16,489 | |
| | 368 | | | Deere & Co. | | | 33,314 | |
| | 538 | | | Eaton Corp. plc | | | 41,487 | |
| | 72 | | | General Dynamics Corp. | | | 8,408 | |
| | 1,690 | | | General Electric Co. | | | 44,419 | |
| | 496 | | | Honeywell International, Inc. | | | 46,063 | |
| | 81 | | | Lockheed Martin Corp. | | | 12,987 | |
| | 437 | | | Raytheon Co. | | | 40,275 | |
| | 633 | | | Textron, Inc. | | | 24,248 | |
| | 293 | | | United Technologies Corp. | | | 33,771 | |
| | | | | | | | 301,461 | |
| | | | | Commercial and Professional Services - 1.0% | | | | |
| | 605 | | | Equifax, Inc. ● | | | 43,887 | |
| | | | | | | | | |
| | | | | Diversified Financials - 6.8% | | | | |
| | 399 | | | Ameriprise Financial, Inc. | | | 47,839 | |
| | 1,633 | | | Bank of America Corp. | | | 25,099 | |
| | 185 | | | BlackRock, Inc. | | | 59,203 | |
| | 931 | | | Citigroup, Inc. | | | 43,854 | |
| | 1,990 | | | JP Morgan Chase & Co. | | | 114,684 | |
| | | | | | | | 290,679 | |
| | | | | Energy - 11.2% | | | | |
| | 624 | | | Anadarko Petroleum Corp. | | | 68,362 | |
| | 916 | | | BP plc ADR | | | 48,335 | |
| | 965 | | | Chevron Corp. | | | 125,935 | |
| | 968 | | | Exxon Mobil Corp. | | | 97,420 | |
| | 486 | | | Halliburton Co. | | | 34,478 | |
| | 376 | | | Imperial Oil Ltd. | | | 19,768 | |
| | 230 | | | Phillips 66 | | | 18,488 | |
| | 360 | | | Schlumberger Ltd. | | | 42,476 | |
| | 577 | | | Suncor Energy, Inc. | | | 24,592 | |
| | | | | | | | 479,854 | |
| | | | | Food and Staples Retailing - 2.7% | | | | |
| | 982 | | | CVS Caremark Corp. | | | 74,022 | |
| | 548 | | | Wal-Mart Stores, Inc. | | | 41,168 | |
| | | | | | | | 115,190 | |
| | | | | Food, Beverage and Tobacco - 3.5% | | | | |
| | 57 | | | Anheuser-Busch InBev N.V. ADR | | | 6,506 | |
| | 583 | | | Kraft Foods Group, Inc. | | | 34,933 | |
| | 607 | | | Mondelez International, Inc. | | | 22,844 | |
| | 492 | | | Philip Morris International, Inc. | | | 41,484 | |
| | 1,038 | | | Unilever N.V. Class NY ADR | | | 45,414 | |
| | | | | | | | 151,181 | |
| | | | | Health Care Equipment and Services - 4.0% | | | | |
| | 820 | | | Cardinal Health, Inc. | | | 56,225 | |
| | 1,119 | | | Medtronic, Inc. | | | 71,374 | |
| | 540 | | | UnitedHealth Group, Inc. | | | 44,178 | |
| | | | | | | | 171,777 | |
| | | | | Household and Personal Products - 1.0% | | | | |
| | 541 | | | Procter & Gamble Co. | | | 42,537 | |
| | | | | | | | | |
| | | | | Insurance - 6.8% | | | | |
| | 734 | | | ACE Ltd. | | | 76,160 | |
| | 477 | | | Aflac, Inc. | | | 29,662 | |
| | 583 | | | Marsh & McLennan Cos., Inc. | | | 30,205 | |
| | 737 | | | MetLife, Inc. | | | 40,959 | |
| | 777 | | | Principal Financial Group, Inc. | | | 39,229 | |
| | 849 | | | Prudential Financial, Inc. | | | 75,377 | |
| | | | | | | | 291,592 | |
| | | | | Materials - 2.3% | | | | |
| | 832 | | | Dow Chemical Co. | | | 42,791 | |
| | 719 | | | Goldcorp, Inc. | | | 20,070 | |
| | 746 | | | International Paper Co. | | | 37,635 | |
| | | | | | | | 100,496 | |
| | | | | Media - 4.8% | | | | |
| | 2,059 | | | Comcast Corp. Class A | | | 110,504 | |
| | 839 | | | Time Warner, Inc. | | | 58,921 | |
| | 442 | | | Walt Disney Co. | | | 37,911 | |
| | | | | | | | 207,336 | |
| | | | | Pharmaceuticals, Biotechnology and Life Sciences - 12.7% | | | | |
| | 798 | | | AstraZeneca plc ADR | | | 59,325 | |
| | 974 | | | Bristol-Myers Squibb Co. | | | 47,242 | |
| | 1,161 | | | Eli Lilly & Co. | | | 72,195 | |
| | 1,021 | | | Johnson & Johnson | | | 106,865 | |
| | 2,692 | | | Merck & Co., Inc. | | | 155,739 | |
| | 2,413 | | | Pfizer, Inc. | | | 71,603 | |
| | 1,083 | | | Zoetis, Inc. | | | 34,936 | |
| | | | | | | | 547,905 | |
| | | | | Retailing - 1.1% | | | | |
| | 984 | | | Lowe's Cos., Inc. | | | 47,223 | |
| | | | | | | | | |
| | | | | Semiconductors and Semiconductor Equipment - 3.1% | | | | |
| | 422 | | | Analog Devices, Inc. | | | 22,828 | |
| | 2,322 | | | Intel Corp. | | | 71,739 | |
| | 843 | | | Texas Instruments, Inc. | | | 40,281 | |
| | | | | | | | 134,848 | |
| | | | | Software and Services - 7.4% | | | | |
| | 693 | | | Accenture plc | | | 55,986 | |
| | 511 | | | eBay, Inc. ● | | | 25,569 | |
| | 3 | | | Google, Inc. Class C ● | | | 1,783 | |
| | 177 | | | IBM Corp. | | | 32,172 | |
| | 2,617 | | | Microsoft Corp. | | | 109,132 | |
| | 743 | | | Oracle Corp. | | | 30,109 | |
| | 1,324 | | | Symantec Corp. | | | 30,320 | |
| | 2,474 | | | Xerox Corp. | | | 30,772 | |
| | | | | | | | 315,843 | |
| | | | | Technology Hardware and Equipment - 3.7% | | | | |
| | 691 | | | Apple, Inc. | | | 64,173 | |
| | 2,273 | | | Cisco Systems, Inc. | | | 56,475 | |
| | 500 | | | Qualcomm, Inc. | | | 39,625 | |
| | | | | | | | 160,273 | |
| | | | | Telecommunication Services - 2.6% | | | | |
| | 2,305 | | | Verizon Communications, Inc. | | | 112,792 | |
| | | | | | | | | |
| | | | | Transportation - 4.6% | | | | |
| | 1,434 | | | CSX Corp. | | | 44,180 | |
| | 1,210 | | | Delta Air Lines, Inc. | | | 46,836 | |
| | 250 | | | FedEx Corp. | | | 37,836 | |
The accompanying notes are an integral part of these financial statements.
| Hartford Dividend and Growth HLS Fund |
| Schedule of Investments – (continued) |
| June 30, 2014 (Unaudited) |
| (000’s Omitted) |
| Shares or Principal Amount | | | | | Market Value ╪ | |
| Common Stocks - 98.9% - (continued) | | | | | | | | |
| | | | | Transportation - 4.6% - (continued) | | | | | | | | |
| | 668 | | | United Parcel Service, Inc. Class B | | | | | | $ | 68,533 | |
| | | | | | | | | | | | 197,385 | |
| | | | | Utilities - 3.2% | | | | | | | | |
| | 457 | | | Dominion Resources, Inc. | | | | | | | 32,663 | |
| | 744 | | | Exelon Corp. | | | | | | | 27,128 | |
| | 529 | | | NextEra Energy, Inc. | | | | | | | 54,216 | |
| | 577 | | | NRG Energy, Inc. | | | | | | | 21,457 | |
| | | | | | | | | | | | 135,464 | |
| | | | | Total Common Stocks | | | | | | | | |
| | | | | (Cost $2,782,771) | | | | | | $ | 4,251,930 | |
| | | | | | | | | | | | | |
| | | | | Total Long-Term Investments | | | | | | | | |
| | | | | (Cost $2,782,771) | | | | | | $ | 4,251,930 | |
| | | | | | | | | | | | | |
| Short-Term Investments - 1.0% | | | | | | | | |
| | | | | Repurchase Agreements - 1.0% | | | | | | | | |
| | | | | Bank of America Merrill Lynch TriParty Repurchase
Agreement (maturing on 07/01/2014 in the
amount of $3,511, collateralized by FHLMC
2.23% - 5.99%, 2030 - 2044, FNMA 2.31% -
6.34%, 2020 - 2042, value of $3,582) | | | | | | | | |
| $ | 3,511 | | | 0.10%, 6/30/2014 | | | | | | $ | 3,511 | |
| | | | | Bank of Montreal TriParty Repurchase Agreement
(maturing on 07/01/2014 in the amount of
$5,364, collateralized by U.S. Treasury Bill
0.13%, 2015, U.S. Treasury Bond 2.75% -
10.63%, 2015 - 2044, U.S. Treasury Note 0.13%
- 4.50%, 2014 - 2024, value of $5,472) | | | | | | | | |
| | 5,364 | | | 0.09%, 6/30/2014 | | | | | | | 5,364 | |
| | | | | Bank of Montreal TriParty Repurchase Agreement
(maturing on 07/01/2014 in the amount of
$2,288, collateralized by FHLMC 2.00% -
5.50%, 2018 - 2041, FNMA 2.00% - 4.50%,
2026 - 2042, GNMA 3.00% - 4.00%, 2042 -
2043, U.S. Treasury Bill 0.05%, 2014, U.S.
Treasury Note 0.75%, 2018, value of $2,333) | | | | | | | | |
| | 2,288 | | | 0.11%, 6/30/2014 | | | | | | | 2,288 | |
| | | | | Barclays Capital TriParty Repurchase Agreement
(maturing on 07/01/2014 in the amount of
$2,116, collateralized by U.S. Treasury Note
0.63% - 0.88%, 2018 - 2019, value of $2,158) | | | | | | | | |
| | 2,116 | | | 0.07%, 6/30/2014 | | | | | | | 2,116 | |
| | | | | Citigroup Global Markets, Inc. TriParty Repurchase
Agreement (maturing on 07/01/2014 in the
amount of $4,875, collateralized by U.S.
Treasury Bond 4.38% - 7.50%, 2016 - 2040,
U.S. Treasury Note 0.50% - 3.00%, 2014 -
2020, value of $4,972) | | | | | | | | |
| | 4,875 | | | 0.06%, 6/30/2014 | | | | | | | 4,875 | |
| | | | | RBS Securities Inc. TriParty Repurchase
Agreement (maturing on 07/01/2014 in the
amount of $7,471, collateralized by U.S.
Treasury Note 0.38% - 3.13%, 2015 - 2022,
value of $7,621) | | | | | | | | |
| | 7,471 | | | 0.08%, 6/30/2014 | | | | | | | 7,471 | |
| | | | | TD Securities TriParty Repurchase Agreement
(maturing on 07/01/2014 in the amount of
$15,551, collateralized by FHLMC 3.50% -
4.00%, 2026 - 2044, FNMA 2.50% - 5.00%,
2025 - 2043, value of $15,862) | | | | | | | | |
| | 15,551 | | | 0.11%, 6/30/2014 | | | | | | | 15,551 | |
| | | | | UBS Securities Repurchase Agreement (maturing
on 07/01/2014 in the amount of $64,
collateralized by U.S. Treasury Note 2.13%,
2020, value of $65) | | | | | | | | |
| | 64 | | | 0.05%, 6/30/2014 | | | | | | | 64 | |
| | | | | | | | | | | | 41,240 | |
| | | | | Total Short-Term Investments | | | | | | | | |
| | | | | (Cost $41,240) | | | | | | $ | 41,240 | |
| | | | | | | | | | | | | |
| | | | | Total Investments | | | | | | | | |
| | | | | (Cost $2,824,011) ▲ | | | 99.9 | % | | $ | 4,293,170 | |
| | | | | Other Assets and Liabilities | | | 0.1 | % | | | 4,280 | |
| | | | | Total Net Assets | | | 100.0 | % | | $ | 4,297,450 | |
The accompanying notes are an integral part of these financial statements.
| Hartford Dividend and Growth HLS Fund |
| Schedule of Investments – (continued) |
| June 30, 2014 (Unaudited) |
| (000’s Omitted) |
| Note: | Percentage of investments as shown is the ratio of the total market value to total net assets. |
| ▲ | At June 30, 2014, the cost of securities for federal income tax purposes was $2,828,056 and the aggregate gross unrealized appreciation and depreciation based on that cost were: |
| Unrealized Appreciation | | $ | 1,477,951 | |
| Unrealized Depreciation | | | (12,837 | ) |
| Net Unrealized Appreciation | | $ | 1,465,114 | |
| ╪ | See Significant Accounting Policies of accompanying Notes to Financial Statements regarding valuation of securities. |
| GLOSSARY: (abbreviations used in preceding Schedule of Investments) |
| |
| Other Abbreviations: |
| ADR | American Depositary Receipt |
| FHLMC | Federal Home Loan Mortgage Corp. |
| FNMA | Federal National Mortgage Association |
| GNMA | Government National Mortgage Association |
The accompanying notes are an integral part of these financial statements.
| Hartford Dividend and Growth HLS Fund |
| Investment Valuation Hierarchy Level Summary |
| June 30, 2014 (Unaudited) |
| (000’s Omitted) |
| | | Total | | | Level 1 ♦ | | | Level 2 ♦ | | | Level 3 | |
| Assets: | | | | | | | | | | | | | | | | |
| Common Stocks ‡ | | $ | 4,251,930 | | | $ | 4,251,930 | | | $ | – | | | $ | – | |
| Short-Term Investments | | | 41,240 | | | | – | | | | 41,240 | | | | – | |
| Total | | $ | 4,293,170 | | | $ | 4,251,930 | | | $ | 41,240 | | | $ | – | |
| ♦ | For the six-month period ended June 30, 2014, there were no transfers between Level 1 and Level 2. |
| ‡ | The Fund has all or primarily all of the equity securities categorized in a particular level. Refer to the Schedule of Investments for further industry breakout. |
| Note: | For purposes of reporting transfers between different hierarchy levels, both transfers in and out of each level, as applicable, are shown as if they occurred at the beginning of the period. |
The accompanying notes are an integral part of these financial statements.
| Hartford Dividend and Growth HLS Fund |
| Statement of Assets and Liabilities |
| June 30, 2014 (Unaudited) |
| (000’s Omitted) |
| Assets: | | | | |
| Investments in securities, at market value (cost $2,824,011) | | $ | 4,293,170 | |
| Cash | | | 1 | |
| Receivables: | | | | |
| Investment securities sold | | | 13,795 | |
| Fund shares sold | | | 429 | |
| Dividends and interest | | | 4,535 | |
| Other assets | | | 5 | |
| Total assets | | | 4,311,935 | |
| Liabilities: | | | | |
| Payables: | | | | |
| Fund shares redeemed | | | 13,773 | |
| Investment management fees | | | 381 | |
| Distribution fees | | | 21 | |
| Accrued expenses | | | 310 | |
| Total liabilities | | | 14,485 | |
| Net assets | | $ | 4,297,450 | |
| Summary of Net Assets: | | | | |
| Capital stock and paid-in-capital | | $ | 2,074,892 | |
| Undistributed net investment income | | | 40,477 | |
| Accumulated net realized gain | | | 712,921 | |
| Unrealized appreciation of investments and the translations of assets and liabilities denominated in foreign currency | | | 1,469,160 | |
| Net assets | | $ | 4,297,450 | |
| Shares authorized | | | 4,000,000 | |
| Par value | | $ | 0.001 | |
| Class IA: Net asset value per share | | $ | 29.25 | |
| Shares outstanding | | | 125,962 | |
| Net assets | | $ | 3,684,876 | |
| Class IB: Net asset value per share | | $ | 29.15 | |
| Shares outstanding | | | 21,011 | |
| Net assets | | $ | 612,574 | |
The accompanying notes are an integral part of these financial statements.
| Hartford Dividend and Growth HLS Fund |
| Statement of Operations |
| For the Six-Month Period Ended June 30, 2014 (Unaudited) |
| (000’s Omitted) |
| Investment Income: | | | | |
| Dividends | | $ | 53,010 | |
| Interest | | | 13 | |
| Less: Foreign tax withheld | | | (276 | ) |
| Total investment income, net | | | 52,747 | |
| | | | | |
| Expenses: | | | | |
| Investment management fees | | | 13,629 | |
| Transfer agent fees | | | 3 | |
| Distribution fees - Class IB | | | 750 | |
| Custodian fees | | | 7 | |
| Accounting services fees | | | 254 | |
| Board of Directors' fees | | | 50 | |
| Audit fees | | | 23 | |
| Other expenses | | | 247 | |
| Total expenses (before fees paid indirectly) | | | 14,963 | |
| Commission recapture | | | (14 | ) |
| Total fees paid indirectly | | | (14 | ) |
| Total expenses, net | | | 14,949 | |
| Net Investment Income | | | 37,798 | |
| | | | | |
| Net Realized Gain on Investments and Foreign Currency Transactions: | | | | |
| Net realized gain on investments | | | 239,797 | |
| Net realized gain on foreign currency contracts | | | — | |
| Net realized loss on other foreign currency transactions | | | (3 | ) |
| Net Realized Gain on Investments and Foreign Currency Transactions | | | 239,794 | |
| | | | | |
| Net Changes in Unrealized Appreciation of Investments and Foreign Currency Transactions: | | | | |
| Net unrealized appreciation of investments | | | 55,461 | |
| Net unrealized appreciation on translation of other assets and liabilities in foreign currencies | | | 1 | |
| Net Changes in Unrealized Appreciation of Investments and Foreign Currency Transactions | | | 55,462 | |
| Net Gain on Investments and Foreign Currency Transactions | | | 295,256 | |
| Net Increase in Net Assets Resulting from Operations | | $ | 333,054 | |
The accompanying notes are an integral part of these financial statements.
| Hartford Dividend and Growth HLS Fund |
| Statement of Changes in Net Assets |
| |
| (000’s Omitted) |
| | | For the
Six-Month
Period Ended
June 30, 2014
(Unaudited) | | | For the
Year Ended
December 31,
2013 | |
| Operations: | | | | | | | | |
| Net investment income | | $ | 37,798 | | | $ | 81,116 | |
| Net realized gain on investments and foreign currency transactions | | | 239,794 | | | | 504,606 | |
| Net unrealized appreciation of investments and foreign currency transactions | | | 55,462 | | | | 630,298 | |
| Net Increase in Net Assets Resulting from Operations | | | 333,054 | | | | 1,216,020 | |
| Distributions to Shareholders: | | | | | | | | |
| From net investment income | | | | | | | | |
| Class IA | | | — | | | | (69,768 | ) |
| Class IB | | | — | | | | (10,132 | ) |
| Total from net investment income | | | — | | | | (79,900 | ) |
| From net realized gain on investments | | | | | | | | |
| Class IA | | | — | | | | (100,606 | ) |
| Class IB | | | — | | | | (16,432 | ) |
| Total from net realized gain on investments | | | — | | | | (117,038 | ) |
| Total distributions | | | — | | | | (196,938 | ) |
| Capital Share Transactions: | | | | | | | | |
| Class IA | | | | | | | | |
| Sold | | | 17,193 | | | | 143,649 | |
| Issued on reinvestment of distributions | | | — | | | | 170,374 | |
| Redeemed | | | (379,074 | ) | | | (1,089,386 | ) |
| Total capital share transactions | | | (361,881 | ) | | | (775,363 | ) |
| Class IB | | | | | | | | |
| Sold | | | 5,568 | | | | 57,875 | |
| Issued on reinvestment of distributions | | | — | | | | 26,564 | |
| Redeemed | | | (61,225 | ) | | | (193,494 | ) |
| Total capital share transactions | | | (55,657 | ) | | | (109,055 | ) |
| Net decrease from capital share transactions | | | (417,538 | ) | | | (884,418 | ) |
| Net Increase (Decrease) in Net Assets | | | (84,484 | ) | | | 134,664 | |
| Net Assets: | | | | | | | | |
| Beginning of period | | | 4,381,934 | | | | 4,247,270 | |
| End of period | | $ | 4,297,450 | | | $ | 4,381,934 | |
| Undistributed (distribution in excess of) net investment income | | $ | 40,477 | | | $ | 2,679 | |
| Shares: | | | | | | | | |
| Class IA | | | | | | | | |
| Sold | | | 620 | | | | 5,815 | |
| Issued on reinvestment of distributions | | | — | | | | 6,547 | |
| Redeemed | | | (13,674 | ) | | | (43,794 | ) |
| Total share activity | | | (13,054 | ) | | | (31,432 | ) |
| Class IB | | | | | | | | |
| Sold | | | 201 | | | | 2,348 | |
| Issued on reinvestment of distributions | | | — | | | | 1,025 | |
| Redeemed | | | (2,226 | ) | | | (7,843 | ) |
| Total share activity | | | (2,025 | ) | | | (4,470 | ) |
The accompanying notes are an integral part of these financial statements.
| Hartford Dividend and Growth HLS Fund |
| Notes to Financial Statements |
| June 30, 2014 (Unaudited) |
| (000’s Omitted) |
Organization:
Hartford Dividend and Growth HLS Fund (the "Fund") serves as an underlying investment option for certain variable annuity and variable life insurance separate accounts of Hartford Life Insurance Company (“HLIC”) and its affiliates and certain qualified retirement plans. The Fund may also serve as an underlying investment option for certain variable annuity and variable life separate accounts of other insurance companies. Owners of variable annuity contracts and policyholders of variable life insurance contracts may choose the funds permitted in the variable insurance contract prospectus. In addition, participants in certain qualified retirement plans may choose the Fund if permitted by their plans.
Hartford Series Fund, Inc. (the “Company”) is an open-end registered management investment company comprised of twenty-eight portfolios. Financial statements for the Fund, a series of the Company, are included in this report.
The Company is organized under the laws of the State of Maryland and is registered with the Securities and Exchange Commission (“SEC”) under the Investment Company Act of 1940, as amended (“1940 Act”). The Fund is a diversified open-end management investment company.
The Fund is divided into Class IA, Class IB and Class IC shares. Each class is offered at the per share net asset value (“NAV”) without a sales charge and is subject to the same expenses, except that the Class IB shares are subject to distribution and service fees charged pursuant to a Distribution Plan adopted in accordance with Rule 12b-1 under the 1940 Act and Class IC shares are subject to distribution fees charged pursuant to a Distribution Plan adopted in accordance with Rule 12b-1 under the 1940 Act and are also subject to an administrative service fee. Class IC shares have not commenced operations and are not currently offered for sale as of the date of this report.
Significant Accounting Policies:
The following is a summary of significant accounting policies of the Fund in the preparation of its financial statements, which are in accordance with United States Generally Accepted Accounting Principles (“U.S. GAAP”). The preparation of financial statements in accordance with U.S. GAAP may require management to make estimates and assumptions that affect the reported amounts of assets and liabilities and disclosure of contingent assets and liabilities at the date of the financial statements and the reported amounts of increases and decreases in net assets from operations during the reporting period. Actual results could differ from those estimates.
Determination of Net Asset Value – The NAV of each class of the Fund's shares is determined as of the close of regular trading (normally 4:00 p.m. Eastern Time) (the “NYSE Close”) on each day that the New York Stock Exchange (the “Exchange”) is open (“Valuation Date”). Information that becomes known to the Fund after the NAV has been calculated on a particular day will not generally be used to retroactively adjust the NAV determined earlier that day.
Investment Valuation and Fair Value Measurements – For purposes of calculating the NAV, portfolio investments and other assets held by the Fund's portfolio for which market quotes are readily available are valued at market value. Market value is generally determined on the basis of last reported sales prices or official close price. If no sales are reported, market value is based on quotes obtained from a quotation reporting system, established market makers, or independent pricing services. If market prices are not readily available or are deemed unreliable, the Fund will use the fair value of the investment as determined in good faith under policies and procedures established by and under the supervision of the Company's Board of Directors. Market quotes are considered not readily available where there is an absence of current or reliable market-based data (e.g., trade information or indicative market quotes), including where events occur after the close of the relevant market, but prior to the NYSE Close, that materially affect the values of the Fund's portfolio investments or assets. In addition, market quotes are considered not readily available when, due to extraordinary circumstances, the exchanges or markets on which the investments trade do not open for trading for the entire day and no other market prices are available. In addition, prices of foreign equities that are principally traded on certain foreign markets may be adjusted daily pursuant to a fair value pricing service approved by the Board of Directors in order to reflect an adjustment for the factors occurring after the close of certain foreign markets but before the NYSE Close. Investments that are primarily traded on foreign markets may trade on days that are not business days of the Fund. The value of the foreign investments in which the Fund invests may change on days when a shareholder will not be able to purchase or redeem shares of the Fund. Fair value pricing is subjective in nature and the use of fair value pricing by the Fund may cause the NAV of its shares to differ significantly from the NAV
| Hartford Dividend and Growth HLS Fund |
| Notes to Financial Statements – (continued) |
| June 30, 2014 (Unaudited) |
| (000’s Omitted) |
that would have been calculated using market prices at the close of the exchange on which a portfolio investment is primarily traded. There can be no assurance that the Fund could obtain the fair market value assigned to an investment if the Fund were to sell the investment at approximately the time at which the Fund determines its NAV.
Investments valued in currencies other than U.S. dollars are converted to U.S. dollars using exchange rates obtained from independent pricing services for calculation of the NAV. As a result, the NAV of the Fund’s shares may be affected by changes in the value of currencies in relation to the U.S. dollar. The value of investments traded in markets outside the United States or denominated in currencies other than the U.S. dollar may be affected significantly on a day that the NYSE is closed and the market value may change on days when an investor is not able to purchase, redeem or exchange shares of the Fund.
Foreign currency contracts represent agreements to exchange currencies on specific future dates at predetermined rates. Foreign currency contracts are valued using foreign currency exchange rates and forward rates as provided by an independent pricing service on the Valuation Date.
Financial instruments for which prices are not available from an independent pricing service may be valued using market quotations obtained from one or more dealers that make markets in the respective financial instrument in accordance with procedures established by the Company's Board of Directors.
U.S. GAAP defines fair value as the price that the Fund would receive to sell an asset or pay to transfer a liability in an orderly transaction between market participants. The U.S. GAAP fair value measurement standards require disclosure of a fair value hierarchy for each major category of assets and liabilities. Various inputs are used in determining the fair value of the Fund’s investments. These inputs are summarized into three broad hierarchy levels. This hierarchy is based on whether the valuation inputs are observable or unobservable. These levels are:
Level 1 – Quoted prices in active markets for identical investments. Level 1 may include exchange traded instruments, such as domestic equities, some foreign equities, options, futures, mutual funds, exchange traded funds, rights and warrants.
Level 2 – Observable inputs other than Level 1 prices, such as quoted prices for similar investments; quoted prices in markets that are not active; or other inputs that are observable or can be corroborated by observable market data. Level 2 may include debt investments that are traded less frequently than exchange traded instruments and which are valued using independent pricing services; foreign equities, which are principally traded on certain foreign markets and are adjusted daily pursuant to a fair value pricing service in order to reflect an adjustment for the factors occurring after the close of certain foreign markets but before the NYSE Close; senior floating rate interests, which are valued using an aggregate of dealer bids; short-term investments, which are valued at amortized cost; and swaps, which are valued based upon the terms of each swap contract.
Level 3 – Significant unobservable inputs that are supported by limited or no market activity. Level 3 may include financial instruments whose values are determined using indicative market quotes or require significant management judgment or estimation. These unobservable valuation inputs may include estimates for current yields, maturity/duration, prepayment speed, and indicative market quotes for comparable investments along with other assumptions relating to credit quality, collateral value, complexity of the investment structure, general market conditions and liquidity. This category may include investments where trading has been halted or there are certain restrictions on trading. While these investments are priced using unobservable inputs, the valuation of these investments reflects the best available data and management believes the prices are a reasonable representation of exit price.
The Board of Directors of the Company generally reviews and approves the “Procedures for Valuation of Portfolio Securities” at least once a year. These procedures define how investments are to be valued, including the formation and activities of a Valuation Committee. The Valuation Committee is responsible for determining in good faith the fair value of investments when the value cannot be obtained from primary pricing services or alternative sources or if the valuation of an investment as provided by the primary pricing service or alternative source is believed not to reflect the investment’s fair value as of the Valuation Date. Voting members of the Valuation Committee include the Fund's Treasurer or designee and a Vice President of the investment manager or designee. An Assistant Vice President of the Fund with legal expertise or designee is also included on the Valuation Committee as a non-voting advisory member. In addition, the Fund’s Chief Compliance Officer shall designate a member of the
| Hartford Dividend and Growth HLS Fund |
| Notes to Financial Statements – (continued) |
| June 30, 2014 (Unaudited) |
| (000’s Omitted) |
compliance group to attend Valuation Committee meetings as a non-voting resource, to monitor for and provide guidance with respect to compliance with these procedures. Two members of the Valuation Committee or their designees, representing different departments, shall constitute a quorum for purposes of permitting the Valuation Committee to take action. The Valuation Committee will consider all relevant factors in determining an investment’s fair value, and may seek the advice of the Fund’s sub-adviser, knowledgeable brokers, and legal counsel in making such determination. The Valuation Committee reports to the Audit Committee of the Company's Board of Directors. The Audit Committee receives quarterly written reports which include details of all fair-valued investments, including the reason for the fair valuation, and an indication, when possible, of the accuracy of the valuation by disclosing the next available reliable public price quotation or the disposition price of such investments (the “look-back” test). The Board of Directors then must consider for ratification all of the fair value determinations made during the previous quarter.
Valuation levels are not necessarily indicative of the risk associated with investing in such investments. Individual investments within any of the above mentioned asset classes may be assigned a different hierarchical level than those presented above, as individual circumstances dictate.
For additional information, refer to the Investment Valuation Hierarchy Level Summary which follows the Schedule of Investments.
Investment Transactions and Investment Income – Investment transactions are recorded as of the trade date (the date the order to buy or sell is executed) for financial reporting purposes. Investments purchased or sold on a when-issued or delayed-delivery basis may be settled a month or more after the trade date. Realized gains and losses are determined on the basis of identified cost.
Dividend income from domestic securities is accrued on the ex-dividend date. In general, dividend income from foreign securities is recorded on the ex-date; however, dividend notifications in certain foreign jurisdictions may not be available in a timely manner and as a result, the Fund will record the dividend as soon as the relevant details (i.e., rate per share, payment date, shareholders of record, etc.) are publicly available. Interest income, including amortization of premium, accretion of discounts and additional principal received in-kind in lieu of cash, is accrued on a daily basis.
Foreign Currency Transactions – Assets and liabilities denominated in currencies other than U.S. dollars are translated into U.S. dollars at the exchange rates in effect on the valuation date. Purchases and sales of investments, income and expenses are translated into U.S. dollars at the exchange rates on the dates of such transactions.
The Fund does not isolate that portion of portfolio investment valuation resulting from fluctuations in the foreign currency exchange rates from the fluctuations arising from changes in the market prices of investments held. Exchange rate fluctuations are included with the net realized and unrealized gain or loss on investments in the accompanying financial statements.
Net realized foreign exchange gains or losses arise from sales of foreign currencies and the difference between asset and liability amounts initially stated in foreign currencies and the U.S. dollar value of the amounts actually received or paid. Net unrealized foreign exchange gains or losses arise from changes in the value of other assets and liabilities at the end of the reporting period, resulting from changes in the exchange rates.
Joint Trading Account – The Fund may invest cash balances into a joint trading account that may be invested in one or more repurchase agreements.
Fund Share Valuation and Dividend Distributions to Shareholders – Orders for the Fund’s shares are executed in accordance with the investment instructions of the contract holders and plan participants. The NAV of the Fund’s shares is determined as of the close of business on each business day of the Exchange. The NAV is determined separately for each class of shares of the Fund by dividing the Fund’s net assets attributable to that class by the number of shares of the class outstanding. Each class of shares offered by the Fund has equal rights as to assets and voting privileges (except that shareholders of a class have exclusive voting rights regarding any matter relating solely to that class of shares). Income and non-class specific expenses are allocated daily to each class on the basis of the relative net assets of the class. Realized and unrealized gains and losses are allocated daily based on the relative net assets of each class of shares of the Fund.
| Hartford Dividend and Growth HLS Fund |
| Notes to Financial Statements – (continued) |
| June 30, 2014 (Unaudited) |
| (000’s Omitted) |
Orders for the purchase of the Fund’s shares received prior to the close of the Exchange on any day the Exchange is open for business are priced at the NAV determined as of the close of the Exchange. Orders received after the close of the Exchange, or on a day on which the Exchange and/or the Fund is not open for business, are priced at the next determined NAV.
Dividends are declared pursuant to a policy adopted by the Company's Board of Directors based upon the investment performance of the Fund. The policy of the Fund is to pay dividends from net investment income and realized gains, if any, at least once a year.
Distributions from net investment income, net realized gains and capital are determined in accordance with federal income tax regulations, which may differ from U.S. GAAP with respect to character and timing. These differences may include, but are not limited to, losses deferred due to wash sale adjustments, foreign currency gains and losses, adjustments related to Passive Foreign Investment Companies ("PFICs"), Real Estate Investment Trusts ("REITs"), Regulated Investment Companies ("RICs"), certain derivatives and partnerships. Permanent book and federal income tax basis differences relating to shareholder distributions will result in reclassifications to certain of the Fund’s capital accounts (see Federal Income Taxes: Reclassification of Capital Accounts note).
Securities and Other Investments:
Repurchase Agreements – A repurchase agreement is an agreement by which a counterparty agrees to sell an investment and agrees to repurchase the investment sold from the buyer at a mutually agreed upon time and price. During the period of the repurchase agreement, the counterparty will deposit cash and or securities in a third party custodial account to serve as collateral. At the time the Fund enters into a repurchase agreement, the value of the underlying collateral, including accrued interest, will be equal to or exceed the value of the repurchase agreement. Repurchase agreements expose the Fund to counterparty risk - that is, the risk that the counterparty will not fulfill its obligations. To minimize counterparty risk, the investments that serve to collateralize the repurchase agreement are held by the Fund’s custodian in book entry or physical form in the custodial account of the Fund or in a third party custodial account. Repurchase agreements are valued at cost plus accrued interest, which approximates fair value. Repurchase agreements have master netting arrangements which allow the Fund to offset amounts owed to a counterparty with amounts owed by the counterparty, including any collateral. Upon an event of default under a master repurchase agreement, the non-defaulting party may close out all transactions traded under such agreement and net amounts owed under each transaction to one net amount payable by one party to the other. Absent an event of default, the master repurchase agreement does not result in an offset of reported amounts of assets and liabilities in the Statement of Assets and Liabilities across transactions between the Fund and the applicable counterparty. The Fund, as shown on the Schedule of Investments, had outstanding repurchase agreements and related collateral as of June 30, 2014.
Investments Purchased on a When-Issued or Delayed-Delivery Basis – Delivery and payment for investments that have been purchased by the Fund on a forward commitment, or when-issued or delayed-delivery basis, take place beyond the customary settlement period. The Fund may dispose of or renegotiate a delayed-delivery transaction after it is entered into, and may sell delayed-delivery investments before they are delivered, which may result in a realized gain or loss. During this period, such investments are subject to market fluctuations, and the Fund identifies investments segregated in its records with a value at least equal to the amount of the commitment. The Fund had no when-issued or delayed-delivery investments as of June 30, 2014.
Financial Derivative Investments:
The following disclosures contain information on how and why the Fund uses derivative instruments, the credit-risk-related contingent features in certain derivative instruments, and how derivative instruments affect the Fund’s financial position and results of operations. The location and fair value amounts of these instruments on the Statement of Assets and Liabilities and the realized gains and losses and changes in unrealized gains and losses on the Statement of Operations, each categorized by type of derivative contract, are included in the following Additional Derivative Instrument Information footnote. The derivative instruments outstanding as of period-end are disclosed in the notes to or within the Schedule of Investments for purchased options, if applicable. The amounts of realized gains and losses and changes in unrealized gains and losses on derivative instruments during the period are disclosed in the Statement of Operations.
Foreign Currency Contracts – The Fund may enter into foreign currency contracts that obligate the Fund to purchase or sell currencies at specified future dates. Foreign currency contracts are used to hedge the currency exposure associated with some or all of the Fund’s investments and/or as part of an investment strategy. Foreign currency contracts are marked to market daily and the
| Hartford Dividend and Growth HLS Fund |
| Notes to Financial Statements – (continued) |
| June 30, 2014 (Unaudited) |
| (000’s Omitted) |
change in value is recorded by the Fund as an unrealized gain or loss. The Fund will record a realized gain or loss when the foreign currency contract is settled.
Foreign currency contracts involve elements of market risk in excess of the amounts reflected in the Statement of Assets and Liabilities. In addition, risks may arise upon entering into these contracts from the potential inability of the counterparties to meet the terms of the contracts and from unanticipated movements in the value of the foreign currencies relative to the U.S. dollar. The Fund had no outstanding foreign currency contracts as of June 30, 2014.
Additional Derivative Instrument Information:
The volume of derivative activity was minimal during the six-month period ended June 30, 2014.
The Effect of Derivative Instruments on the Statement of Operations for the six-month period ended June 30, 2014:
| | | Risk Exposure Category | |
| | | Interest Rate
Contracts | | | Foreign
Exchange
Contracts | | | Credit
Contracts | | | Equity
Contracts | | | Commodity
Contracts | | | Other
Contracts | | | Total | |
| Realized Gain on Derivatives Recognized as a Result of Operations: | | | | | | | | | | | | | | | | | |
| Net realized gain on foreign currency contracts | | $ | — | | | $ | — | | | $ | — | | | $ | — | | | $ | — | | | $ | — | | | $ | — | |
| Total | | $ | — | | | $ | — | | | $ | — | | | $ | — | | | $ | — | | | $ | — | | | $ | — | |
Principal Risks:
The Fund may be exposed to counterparty risk, or the risk that an institution or other entity with which the Fund has unsettled or open transactions will default.
If the Fund invests directly in foreign currencies or in securities that trade in, and receive revenues in, foreign currencies, or in derivatives that provide exposure to foreign currencies, it will be subject to the risk that those currencies will decline in value relative to the base currency (U.S. dollars) of the Fund, or, in the case of hedging positions, that the Fund’s base currency will decline in value relative to the currency being hedged. Currency rates in foreign countries may fluctuate significantly over short periods of time for a number of reasons, including changes in interest rates, intervention (or the failure to intervene) by U.S. or foreign governments, central banks or supranational entities, such as the International Monetary Fund, or by the imposition of currency controls or other political developments in the United States or abroad. As a result, the Fund’s investments in foreign currency denominated securities may reduce the returns of the Fund. The market values of equity securities, such as common stocks and preferred stocks, or equity related investments, such as futures and options, may decline due to general market conditions which are not specifically related to a particular company, such as real or perceived adverse economic conditions, changes in the general outlook for corporate earnings, changes in interest or currency rates or adverse investor sentiment generally. The market value of equity securities may also decline due to factors which affect a particular industry or industries, such as labor shortages or increased production costs and competitive conditions within an industry. Equity securities and equity related investments generally have greater market price volatility than fixed income securities.
Federal Income Taxes:
Federal Income Taxes – For federal income tax purposes, the Fund intends to continue to qualify as a RIC under Subchapter M of the Internal Revenue Code (“IRC”) by distributing substantially all of its taxable net investment income and net realized capital gains to its shareholders and otherwise complying with the requirements of the IRC. The Fund has distributed substantially all of its income and capital gains in prior years, if applicable, and intends to distribute substantially all of its income and capital gains prior to the next fiscal year-end. Accordingly, no provision for federal income or excise taxes has been made in the accompanying financial statements. Distributions from short-term capital gains are treated as ordinary income distributions for federal income tax purposes.
Net Investment Income (Loss), Net Realized Gains (Losses) and Distributions – Net investment income (loss) and net realized gains (losses) may differ for financial statement and tax purposes primarily because of losses deferred due to wash sale adjustments,
| Hartford Dividend and Growth HLS Fund |
| Notes to Financial Statements – (continued) |
| June 30, 2014 (Unaudited) |
| (000’s Omitted) |
foreign currency gains and losses, adjustments related to PFICs, REITs, RICs, certain derivatives and partnerships. The character of distributions made during the year from net investment income or net realized gains may differ from their ultimate characterization for federal income tax purposes. Also, due to the timing of dividend distributions, the fiscal year in which amounts are distributed may differ from the year that the income or realized gains (losses) were recorded by the Fund.
Distributions and Components of Distributable Earnings – The tax character of distributions paid by the Fund for the periods indicated is as follows (as adjusted for dividends payable, if applicable):
| | | For the Year Ended
December 31, 2013 | | | For the Year Ended
December 31, 2012 | |
| Ordinary Income | | $ | 79,900 | | | $ | 96,007 | |
| Long-Term Capital Gains* | | | 117,038 | | | | — | |
| * | The Fund designates these distributions as long-term capital gain ividends pursuant to IRC Sec. 852(b)(3)(C). |
As of December 31, 2013, the Fund’s components of distributable earnings (deficit) on a tax basis are as follows:
| | | Amount | |
| Undistributed Ordinary Income | | $ | 52,045 | |
| Undistributed Long-Term Capital Gain | | | 427,806 | |
| Unrealized Appreciation* | | | 1,409,653 | |
| Total Accumulated Earnings | | $ | 1,889,504 | |
| * | Differences between book-basis and tax-basis unrealized appreciation (depreciation) may be attributable to the losses deferred due to wash sale adjustments, foreign currency gains and losses, adjustments related to PFICs, REITs, RICs, certain derivatives and partnerships. |
Reclassification of Capital Accounts – The Fund may record reclassifications in its capital accounts. These reclassifications have no impact on the total net assets of the Fund. The reclassifications are a result of permanent differences between U.S. GAAP and tax accounting for such items as foreign currency, PFICs, expiration or utilization of capital loss carryforwards or net operating losses. Adjustments are made to reflect the impact these items have on current and future distributions to shareholders. Therefore, the source of the Fund’s distributions may be shown in the accompanying Statement of Changes in Net Assets as from undistributed net investment income, from accumulated net realized gains on investments or from capital depending on the type of book and tax differences that exist. For the year ended December 31, 2013, the Fund recorded reclassifications to increase (decrease) the accounts listed below:
| | | Amount | |
| Undistributed Net Investment Income (Loss) | | $ | (96 | ) |
| Accumulated Net Realized Gain (Loss) | | | 96 | |
Capital Loss Carryforward – On December 22, 2010, the Regulated Investment Company Modernization Act of 2010 (the “Act”) was enacted, which made changes to the capital loss carryforward rules. The changes are effective for taxable years beginning after the date of enactment. Under the Act, funds are permitted to carry forward capital losses for an unlimited period. Additionally, capital loss carryforwards retain their character as either short-term or long-term capital losses rather than being considered all short-term as permitted under prior regulation.
The Fund had no capital loss carryforward for U.S. federal income tax purposes as of December 31, 2013.
Accounting for Uncertainty in Income Taxes – The Fund has adopted financial reporting rules that require the Fund to analyze all open tax years, as defined by the statute of limitations, for all major jurisdictions. Generally, tax authorities can examine all tax returns filed for the last three years. The Fund does not have an examination in progress.
| Hartford Dividend and Growth HLS Fund |
| Notes to Financial Statements – (continued) |
| June 30, 2014 (Unaudited) |
| (000’s Omitted) |
The Fund has reviewed all open tax years and major jurisdictions and concluded that these financial reporting rules had no effect on the Fund’s financial position or results of operations. There is no tax liability resulting from unrecognized tax benefits relating to uncertain income tax positions taken or expected to be taken on the tax return for the fiscal year ended December 31, 2013. The Fund is also not aware of any tax positions for which it is reasonably possible that the total amounts of unrecognized tax benefits will significantly change in the next twelve months.
Expenses:
Investment Management Agreement – Hartford Funds Management Company, LLC ("HFMC") serves as the Fund’s investment manager pursuant to an Investment Management Agreement with the Company. HFMC is an indirect wholly owned subsidiary of The Hartford Financial Services Group, Inc. ("The Hartford"). The investment manager has overall investment supervisory responsibility for the Fund. In addition, the investment manager provides administrative personnel, services, equipment, facilities and office space for proper operation of the Fund. HFMC has contracted with Wellington Management Company, LLP ("Wellington Management") under a sub-advisory agreement for the provision of day-to-day investment management services to the Fund in accordance with the Fund’s investment objective and policies. The Fund pays a fee to the investment manager, a portion of which may be used to compensate Wellington Management.
The schedule below reflects the rates of compensation paid to the investment manager for investment management services rendered as of June 30, 2014; the rates are accrued daily and paid monthly:
| Average Daily Net Assets | | Annual Fee |
| On first $250 million | | 0.7750% |
| On next $250 million | | 0.7250% |
| On next $500 million | | 0.6750% |
| On next $1.5 billion | | 0.6250% |
| On next $2.5 billion | | 0.6200% |
| On next $5 billion | | 0.6150% |
| Over $10 billion | | 0.6100% |
Accounting Services Agreement – Pursuant to the Fund Accounting Agreement between HFMC and the Company, on behalf of the Fund, HFMC provides accounting services to the Fund and receives monthly compensation based on the Fund’s average daily net assets at the rates set forth below. The Fund’s accounting services fees are accrued daily and paid monthly.
| Average Daily Net Assets | | Annual Fee |
| On first $5 billion | | 0.012% |
| Over $5 billion | | 0.010% |
Operating Expenses – Allocable expenses incurred by the Company are allocated to each Fund and allocated to classes within a Fund in proportion to the average daily net assets of the Fund and each class, except where allocation of certain expenses is more fairly made directly to the Fund or to specific classes within a Fund.
Fees Paid Indirectly – The Company, on behalf of the Fund, has entered into agreements with State Street Global Markets, LLC and Russell Implementation Services, Inc. to partially recapture non-discounted trade commissions. Such rebates are used to pay a portion of the Fund's expenses. For the six-month period ended June 30, 2014, this amount, if any, is included in the Statement of Operations.
| Hartford Dividend and Growth HLS Fund |
| Notes to Financial Statements – (continued) |
| June 30, 2014 (Unaudited) |
| (000’s Omitted) |
The ratio of expenses to average net assets in the accompanying financial highlights excludes the reduction in expenses related to fees paid indirectly. The annualized expense ratio after waivers for the period listed below reflecting the reduction for fees paid indirectly is as follows:
| | | Annualized Six-
Month Period Ended
June 30, 2014 | |
| Class IA | | | 0.67% | |
| Class IB | | | 0.92 | |
Distribution Plan for Class IB Shares – Hartford Funds Distributors, LLC (“HFD”), an indirect wholly owned subsidiary of The Hartford, is the principal underwriter and distributor of the Fund. The Company, on behalf of the Fund, has adopted a Distribution Plan pursuant to Rule 12b-1 of the 1940 Act for Class IB shares.
The Distribution Plan provides that the Fund may pay annually up to 0.25% of the average daily net assets of the Fund attributable to its Class IB shares for activities primarily intended to result in the sale of Class IB shares. The Board has the authority to suspend or reduce these payments at any point in time. Under the terms of the Distribution Plan and the principal underwriting agreement, the Fund is authorized to make payments monthly to the distributor that may be used to pay or reimburse entities providing distribution and shareholder servicing with respect to the Class IB shares for such entities’ fees or expenses incurred or paid in that regard. The distribution fee paid during the period can be found on the Statement of Operations. These fees are accrued daily and paid monthly.
Other Related Party Transactions – Hartford Administrative Services Company (“HASCO”), an indirect wholly owned subsidiary of The Hartford, provides transfer agent services to the Fund. HASCO was compensated on a per account basis for providing such services. The amount paid to HASCO can be found in the Statement of Operations. These fees are accrued daily and paid monthly.
Payment from Affiliate – In July of 2007, The Hartford entered into a settlement with the Attorneys General of the states of New York, Connecticut and Illinois relating to market timing and the company's individual variable annuity contracts in which certain payments would be made directly to the variable annuity contract holders. The distribution plan provided that unclaimed money from the settlement would be distributed to certain HLS Funds that are investment options through a Hartford individual variable annuity contract. The unclaimed money was distributed to the Fund on September 18, 2009.
The total return in the accompanying financial highlights includes a payment from an affiliate. Had the payment from the affiliate been excluded, the impact and total return for the period listed below would have been as follows:
| | | For the Year Ended December 31, 2009 | |
| | | Class IA | | | Class IB | |
| Impact from Payment from Affiliate for Attorneys General Settlement | | | —% | | | | —% | |
| Total Return Excluding Payment from Affiliate | | | 24.67 | | | | 24.36 | |
Investment Transactions:
For the six-month period ended June 30, 2014, the cost of purchases and proceeds from sales of investment securities (excluding short-term investments) were as follows:
| | | Excluding U.S.
Government
Obligations | | | U.S.
Government
Obligations | | | Total | |
| Cost of Purchases | | $ | 363,893 | | | $ | — | | | $ | 363,893 | |
| Sales Proceeds | | | 726,415 | | | | — | | | | 726,415 | |
| Hartford Dividend and Growth HLS Fund |
| Notes to Financial Statements – (continued) |
| June 30, 2014 (Unaudited) |
| (000’s Omitted) |
Line of Credit:
The Fund is one of several Hartford Funds that participate in a $500 million committed revolving line of credit facility. The facility is to be used for temporary or emergency purposes. Under the arrangement, the funds are required to own securities having a market value in excess of 300% of the total bank borrowings. The interest rate on borrowings varies depending on the nature of the loan. The facility also requires a fee to be paid based on the amount of the commitment. This commitment fee is allocated to all the funds participating in the line of credit based on the average net assets of the funds. During the six-month period ended June 30, 2014, the Fund did not have any borrowings under this facility.
Industry Classifications:
Other than the industry classifications "Other Investment Pools and Funds" and "Exchange Traded Funds," equity industry classifications used in this report are the Global Industry Classification Standard, which was developed by and is the exclusive property and service mark of MSCI, Inc. and Standard & Poor's.
Indemnifications:
Under the Company's organizational documents, the Company shall indemnify its officers and directors to the full extent required or permitted under Maryland General Corporation Law and the federal securities laws. In addition, the Company, on behalf of the Fund, may enter into contracts that contain a variety of indemnifications. The Company's maximum exposure under these arrangements is unknown. However, as of the date of these financial statements, the Company has not had prior claims or losses pursuant to these contracts and expects the risk of loss to be remote.
Pending Legal Proceedings:
On February 25, 2011, Jennifer L. Kasilag, Louis Mellinger, Judith M. Menendez, Jacqueline M. Robinson, and Linda A. Russell filed a derivative lawsuit against Hartford Investment Financial Services, LLC (“HIFSCO”) (now known as Hartford Funds Distributors, LLC) on behalf of six Hartford retail mutual funds in the United States District Court for the District of New Jersey, alleging that HIFSCO received excessive advisory and distribution fees in violation of its statutory fiduciary duty under Section 36(b) of the 1940 Act when serving as investment manager and principal underwriter, respectively, to the Hartford retail mutual funds. Although this action was purportedly filed on behalf of certain of the Hartford Funds, none of the Hartford Funds is itself a defendant to the suit. HIFSCO moved to dismiss and, in September 2011, the motion was granted in part and denied in part, with leave to amend the complaint. In November 2011, plaintiffs filed an amended complaint on behalf of certain Hartford retail mutual funds, The Hartford Global Health Fund (now known as The Hartford Healthcare Fund), The Hartford Conservative Allocation Fund, The Hartford Growth Opportunities Fund, The Hartford Inflation Plus Fund, The Hartford Advisers Fund (now known as The Hartford Balanced Fund), and The Hartford Capital Appreciation Fund. Plaintiffs seek to rescind the investment management agreements and distribution plans between HIFSCO and these funds and to recover the total fees charged thereunder or, in the alternative, to recover any improper compensation HIFSCO received, in addition to lost earnings. HIFSCO filed a partial motion to dismiss the amended complaint and, in December 2012, the court dismissed without prejudice the claims regarding distribution fees and denied the motion with respect to the advisory fees claims. HIFSCO disputes the allegations and intends to defend vigorously.
In March 2014, the plaintiffs filed a new complaint that added as new plaintiffs The Hartford Floating Rate Fund and The Hartford Small Company Fund and named as a defendant Hartford Funds Management Company, LLC (the “Investment Manager”), which assumed the role as investment adviser to the funds as of January 2013. The Investment Manager and HIFSCO dispute the allegations and intend to defend vigorously.
This action concerns the activities of HIFSCO in its capacity as investment manager and principal underwriter to the Hartford retail mutual funds and does not concern HIFSCO’s activities in its capacity as principal underwriter to the HLS funds. For this reason, no accrual for litigation relating to this matter has been recorded in the financial statements of the Fund.
| Hartford Dividend and Growth HLS Fund |
| Financial Highlights |
| | | ─ Selected Per-Share Data(A) ─ | | | ─ Ratios and Supplemental Data ─ | |
| Class | | Net Asset
Value at
Beginning
of Period | | | Net
Investment
Income
(Loss) | | | Net
Realized
and
Unrealized
Gain (Loss)
on
Investments | | | Total from
Investment
Operations | | | Dividends
from Net
Investment
Income | | | Distributions
from
Realized
Capital
Gains | | | Total
Dividends
and
Distributions | | | Net
Asset
Value at
End of
Period | | | Total
Return(B) | | | Net Assets
at End of
Period
(000s) | | | Ratio of
Expenses
to
Average
Net
Assets
Before
Adjust-
ments(C) | | | Ratio of
Expenses
to
Average
Net
Assets
After
Adjust-
ments(C) | | | Ratio of
Net
Investment
Income
(Loss) to
Average
Net Assets | |
| | | | | | | | | | | | | | | | | | | | | | | | | | | | | | | | | | | | | | | | |
| For the Six-Month Period Ended June 30, 2014 (Unaudited) | | | | | | | | | | | | | | | | | | | | | | | | | | | | | | | | | |
| IA | | $ | 27.05 | | | $ | 0.25 | | | $ | 1.95 | | | $ | 2.20 | | | $ | – | | | $ | – | | | $ | – | | | $ | 29.25 | | | | 8.13 | %(D) | | $ | 3,684,876 | | | | 0.67 | %(E) | | | 0.67 | %(E) | | | 1.82 | %(E) |
| IB | | | 26.99 | | | | 0.21 | | | | 1.95 | | | | 2.16 | | | | – | | | | – | | | | – | | | | 29.15 | | | | 8.00 | (D) | | | 612,574 | | | | 0.92 | (E) | | | 0.92 | (E) | | | 1.57 | (E) |
| | | | | | | | | | | | | | | | | | | | | | | | | | | | | | | | | | | | | | | | | | | | | | | | | | | | | |
| For the Year Ended December 31, 2013 | | | | | | | | | | | | | | | | | | | | | | | | | | | | | | | | |
| IA | | $ | 21.46 | | | $ | 0.46 | | | $ | 6.33 | | | $ | 6.79 | | | $ | (0.51 | ) | | $ | (0.69 | ) | | $ | (1.20 | ) | | $ | 27.05 | | | | 31.92 | % | | $ | 3,760,183 | | | | 0.67 | % | | | 0.67 | % | | | 1.88 | % |
| IB | | | 21.42 | | | | 0.40 | | | | 6.31 | | | | 6.71 | | | | (0.45 | ) | | | (0.69 | ) | | | (1.14 | ) | | | 26.99 | | | | 31.58 | | | | 621,751 | | | | 0.92 | | | | 0.92 | | | | 1.62 | |
| | | | | | | | | | | | | | | | | | | | | | | | | | | | | | | | | | | | | | | | | | | | | | | | | | | | | |
| For the Year Ended December 31, 2012 (F) | | | | | | | | | | | | | | | | | | | | | | | | | | | | | | | | |
| IA | | $ | 19.34 | | | $ | 0.49 | | | $ | 2.13 | | | $ | 2.62 | | | $ | (0.50 | ) | | $ | – | | | $ | (0.50 | ) | | $ | 21.46 | | | | 13.59 | % | | $ | 3,658,076 | | | | 0.67 | % | | | 0.67 | % | | | 2.13 | % |
| IB | | | 19.30 | | | | 0.45 | | | | 2.11 | | | | 2.56 | | | | (0.44 | ) | | | – | | | | (0.44 | ) | | | 21.42 | | | | 13.31 | | | | 589,194 | | | | 0.92 | | | | 0.92 | | | | 1.88 | |
| | | | | | | | | | | | | | | | | | | | | | | | | | | | | | | | | | | | | | | | | | | | | | | | | | | | | |
| For the Year Ended December 31, 2011 (F) | | | | | | | | | | | | | | | | | | | | | | | | | | | | | | | | |
| IA | | $ | 19.50 | | | $ | 0.42 | | | $ | (0.16 | ) | | $ | 0.26 | | | $ | (0.42 | ) | | $ | – | | | $ | (0.42 | ) | | $ | 19.34 | | | | 1.32 | % | | $ | 3,851,657 | | | | 0.67 | % | | | 0.67 | % | | | 1.98 | % |
| IB | | | 19.46 | | | | 0.36 | | | | (0.16 | ) | | | 0.20 | | | | (0.36 | ) | | | – | | | | (0.36 | ) | | | 19.30 | | | | 1.06 | | | | 658,419 | | | | 0.92 | | | | 0.92 | | | | 1.73 | |
| | | | | | | | | | | | | | | | | | | | | | | | | | | | | | | | | | | | | | | | | | | | | | | | | | | | | |
| For the Year Ended December 31, 2010 (F) | | | | | | | | | | | | | | | | | | | | | | | | | | | | | | | | |
| IA | | $ | 17.55 | | | $ | 0.35 | | | $ | 1.96 | | | $ | 2.31 | | | $ | (0.36 | ) | | $ | – | | | $ | (0.36 | ) | | $ | 19.50 | | | | 13.21 | % | | $ | 4,409,787 | | | | 0.68 | % | | | 0.68 | % | | | 1.87 | % |
| IB | | | 17.51 | | | | 0.32 | | | | 1.94 | | | | 2.26 | | | | (0.31 | ) | | | – | | | | (0.31 | ) | | | 19.46 | | | | 12.93 | | | | 756,001 | | | | 0.93 | | | | 0.93 | | | | 1.62 | |
| | | | | | | | | | | | | | | | | | | | | | | | | | | | | | | | | | | | | | | | | | | | | | | | | | | | | |
| For the Year Ended December 31, 2009 (F) | | | | | | | | | | | | | | | | | | | | | | | | | | | | | | | | |
| IA | | $ | 14.37 | | | $ | 0.35 | | | $ | 3.19 | | | $ | 3.54 | | | $ | (0.36 | ) | | $ | – | | | $ | (0.36 | ) | | $ | 17.55 | | | | 24.68 | %(G) | | $ | 4,247,031 | | | | 0.69 | % | | | 0.69 | % | | | 2.24 | % |
| IB | | | 14.34 | | | | 0.33 | | | | 3.16 | | | | 3.49 | | | | (0.32 | ) | | | – | | | | (0.32 | ) | | | 17.51 | | | | 24.36 | (G) | | | 815,752 | | | | 0.94 | | | | 0.94 | | | | 2.00 | |
| (A) | Information presented relates to a share outstanding throughout the indicated period. Net investment income (loss) per share amounts are calculated based on average shares outstanding unless otherwise noted. |
| (B) | The figures do not include sales charges or other fees which may be applied at the variable life insurance, variable annuity or qualified retirement plan product level. Any such additional sales charges or other fees would lower the Fund's performance. |
| (C) | Adjustments include waivers and reimbursements, if applicable. Ratios do not include fees paid indirectly (see Expenses in the accompanying Notes to Financial Statements). |
| (F) | Net investment income (loss) per share amounts have been calculated using the SEC method. |
| (G) | Total return without the inclusion of the Payment from (to) Affiliate can be found in Expenses in the accompanying Notes to Financial Statements. |
| | | Portfolio Turnover
Rate for
All Share Classes | |
| For the Six-Month Period Ended June 30, 2014 (Unaudited) | | | 9% | |
| For the Year Ended December 31, 2013 | | | 25 | |
| For the Year Ended December 31, 2012 | | | 20 | |
| For the Year Ended December 31, 2011 | | | 24 | |
| For the Year Ended December 31, 2010 | | | 32 | |
| For the Year Ended December 31, 2009 | | | 34 | |
| Hartford Dividend and Growth HLS Fund |
| Directors and Officers (Unaudited) |
The Board of Directors of the Company (the "Directors") appoints officers who are responsible for the day-to-day operations of the Fund and who execute policies formulated by the Directors. Each Director serves until his or her death, resignation, or retirement or until the next annual meeting of shareholders is held or until his or her successor is elected and qualifies.
Directors and officers who are employed by or who have a financial interest in The Hartford are considered “interested” persons of the Fund pursuant to the 1940 Act. Each officer and two of the Company's Directors, as noted in the chart below, are “interested” persons of the Fund. Each Director serves as a director for The Hartford Mutual Funds, Inc., The Hartford Mutual Funds II, Inc., Hartford Series Fund, Inc., and Hartford HLS Series Fund II, Inc., and as a trustee for The Hartford Alternative Strategies Fund, which, as of June 30, 2014, collectively consist of 78 funds. Correspondence may be sent to Directors and officers c/o Hartford Funds, 5 Radnor Corporate Center, Suite 300, 100 Matsonford Road, Radnor, Pennsylvania 19087, except that correspondence to Mr. Annoni, Mr. Dressen and Ms. Quade may be sent to 500 Bielenberg Drive, Suite 500, Woodbury, Minnesota 55125.
The table below sets forth, for each Director and officer, his or her name, year of birth, current position with the Company and date first elected or appointed to Hartford Series Fund, Inc. ("HSF") and Hartford HLS Series Fund II, Inc. ("HSF2"), principal occupation, and, for Directors, other directorships held. The Fund’s Statement of Additional Information contains further information on the Directors and is available free of charge by calling 1-888-843-7824 or writing to: Hartford HLS Funds, c/o Hartford Life Insurance Company/Hartford Life and Annuity Insurance Company, P.O. Box 14293, Lexington, KY 40512-4293 for variable annuity and variable life insurance separate accounts of Hartford Life Insurance Company and its affiliates; Hartford Funds, P.O. Box 55022, Boston, MA 02205-5022 for all shareholders except variable annuity and variable life insurance separate accounts of Hartford Life Insurance Company and its affiliates.
Information on the aggregate remuneration paid to the directors of the Company can be found in the Statement of Operations herein. The Fund pays to The Hartford a portion of the Chief Compliance Officer’s compensation, but does not pay salaries or compensation to any of its other officers or Directors who are employed by The Hartford.
Non-Interested Directors
Lynn S. Birdsong (1946) Director since 2003, Co-Chairman of the Investment Committee since 2005
Mr. Birdsong is a private investor. Mr. Birdsong currently serves as a Director of the Sovereign High Yield Investment Company (April 2010 to current). Mr. Birdsong currently serves as an Independent Director of Nomura Partners Funds, Inc. (formerly, The Japan Fund) (April 2003 to current). From 2003 to March 2005, Mr. Birdsong was an Independent Director of the Atlantic Whitehall Funds. From 1979 to 2002, Mr. Birdsong was a Managing Director of Zurich Scudder Investments, an investment management firm. During his employment with Scudder, Mr. Birdsong was an Interested Director of The Japan Fund. From January 1981 through December 2013, Mr. Birdsong was a partner in Birdsong Company, an advertising specialty firm.
Robert M. Gavin, Jr. (1940) Director since 2002 (HSF) and 1986 (HSF2), Chairman of the Board since 2004
Dr. Gavin is an educational consultant. Prior to September 1, 2001, he was President of Cranbrook Education Community and prior to July 1996, he was President of Macalester College, St. Paul, Minnesota.
Duane E. Hill (1945) Director since 2001 (HSF) and 2002 (HSF2), Chairman of the Nominating Committee since 2003
Mr. Hill is a Partner of TSG Ventures L.P., a private equity investment company. Mr. Hill is a former partner of TSG Capital Group, a private equity investment firm that served as sponsor and lead investor in leveraged buyouts of middle market companies.
Sandra S. Jaffee (1941) Director since 2005
Ms. Jaffee is the founder and Chief Executive Officer of a private company, Homeworks Concierge, LLC, which provides residential property management services in Westchester County, New York (January 2012 to present). Ms. Jaffee served as Chairman (2008 to 2009) and Chief Executive Officer of Fortent (formerly Searchspace Group), a leading provider of compliance/regulatory technology to financial institutions from August 2005 to August 2009. From August 2004 to August 2005, Ms. Jaffee served as an Entrepreneur in Residence with Warburg Pincus, a private equity firm. Prior to joining Warburg Pincus, Ms. Jaffee served as Executive Vice President at Citigroup, from September 1995 to July 2004, where she was President and Chief Executive Officer of Citibank’s Global Securities Services (1995 to 2003). Ms. Jaffee currently serves as a member of the Board of Directors of Broadridge Financial Solutions as well as a Trustee of Muhlenberg College.
| Hartford Dividend and Growth HLS Fund |
| Directors and Officers (Unaudited) – (continued) |
William P. Johnston (1944) Director since 2005, Chairman of the Compliance Committee since 2005
In June 2006, Mr. Johnston was appointed as Senior Advisor to The Carlyle Group, a global private equity and other alternative asset investment firm and currently serves as an Operating Executive. In July 2006, Mr. Johnston was elected to the Board of Directors of MultiPlan, Inc. and served as a Director (July 2006 to August 2010). In August 2007, Mr. Johnston was elected to the Board of Directors of LifeCare Holdings, Inc. and served as a Director (August 2007 to June 2013). In February 2008, Mr. Johnston was elected to the Board of Directors of HCR-ManorCare, Inc. In May 2006, Mr. Johnston was elected to the Supervisory Board of Fresenius Medical Care AG & Co. KGaA, after its acquisition of Renal Care Group, Inc. in March 2006. Mr. Johnston joined Renal Care Group in November 2002 as a member of the Board of Directors and served as Chairman of the Board from March 2003 through March 2006. From 2002 through 2013, Mr. Johnston served as a Board member of the Georgia O’Keefe Museum. From September 1987 to December 2002, Mr. Johnston was with Equitable Securities Corporation (and its successors, SunTrust Equitable Securities and SunTrust Robinson Humphrey) serving in various investment banking and managerial positions, including Managing Director and Head of Investment Banking, Chief Executive Officer and Vice Chairman.
Phillip O. Peterson (1944) Director since 2002 (HSF) and 2000 (HSF2), Chairman of the Audit Committee since 2002
Mr. Peterson is a mutual fund industry consultant. He was a partner of KPMG LLP (an accounting firm) until July 1999. Mr. Peterson joined William Blair Funds in February 2007 as a member of the Board of Trustees. From February 2012 to February 2014, Mr. Peterson served as a Trustee of Symetra Variable Mutual Funds. From January 2004 to April 2005, Mr. Peterson served as Independent President of the Strong Mutual Funds.
Lemma W. Senbet (1946) Director since 2005
Dr. Senbet is the William E. Mayer Chair Professor of Finance and Founding Director, Center for Financial Policy, at the University of Maryland, Robert H. Smith School of Business. He was chair of the Finance Department of the University of Maryland, Robert H. Smith School of Business from 1998 to 2006. Since June 2013, he has been on leave from the University to serve as Executive Director of African Economic Research Consortium which focuses on economic policy research and training. Previously, he was a chaired professor of finance at the University of Wisconsin-Madison. Also, he was a Director of the Fortis Funds from March 2000 to July 2002. Dr. Senbet served as Director of the American Finance Association and President of the Western Finance Association. In 2006, Dr. Senbet was inducted Fellow of Financial Management Association International for his career-long distinguished scholarship and professional service.
Interested Directors and Officers
James E. Davey (1964) Director since 2012, President and Chief Executive Officer since 2010
Mr. Davey serves as Executive Vice President of Hartford Life Insurance Company (“HLIC”) and The Hartford Financial Services Group, Inc. Additionally, Mr. Davey serves as Chairman of the Board, Manager and Senior Managing Director of Hartford Funds Distributors, LLC (“HFD”). He also currently serves as Director, Chairman of the Board, President and Senior Managing Director of Hartford Administrative Services Company (“HASCO”). Mr. Davey also serves as Manager, Chairman of the Board and Senior Managing Director for Hartford Funds Management Company, LLC (“HFMC”) and Director, Chairman of the Board and Senior Managing Director for Hartford Funds Management Group, Inc. ("HFMG"). Mr. Davey has served in various positions within The Hartford and its subsidiaries in connection with the operation of the Hartford Funds. Mr. Davey joined The Hartford in 2002.
Lowndes A. Smith (1939) Director since 1996 (HSF) and 2002 (HSF2), Co-Chairman of the Investment Committee since 2005
Mr. Smith served as Vice Chairman of The Hartford from February 1997 to January 2002, as President and Chief Executive Officer of Hartford Life, Inc. from February 1997 to January 2002, and as President and Chief Operating Officer of The Hartford Life Insurance Companies from January 1989 to January 2002. Mr. Smith serves as a Director of White Mountains Insurance Group Ltd. (October 2003 to current); One Beacon Insurance (October 2006 to current); Symetra Financial (August 2007 to current) and is a Managing Director of Whittington Gray Associates (January 2007 to current).
Other Officers
Mark A. Annoni (1964) Vice President, Controller and Treasurer since 2012
Mr. Annoni currently serves as the Assistant Vice President of HLIC (February 2004 to present) and Senior Vice President of HFMG (December 2013 to present). Mr. Annoni has served in various positions within The Hartford and its subsidiaries in connection with the operation of the Hartford Funds. Mr. Annoni joined The Hartford in 2001.
| Hartford Dividend and Growth HLS Fund |
| Directors and Officers (Unaudited) – (continued) |
Michael R. Dressen (1963) AML Compliance Officer since 2011
Mr. Dressen currently serves as Assistant Vice President of HLIC. He also serves as Chief Compliance Officer and AML Compliance Officer of HASCO and as AML Officer of HFD. Mr. Dressen has served in various positions within The Hartford and its subsidiaries in connection with the operation of the Hartford Funds.
Edward P. Macdonald (1967) Vice President, Secretary and Chief Legal Officer since 2005
Mr. Macdonald currently serves as Assistant Secretary, Executive Vice President and Deputy General Counsel of HFD, HASCO, HFMC and HFMG. He also serves as Vice President of HLIC. Mr. Macdonald has served in various positions within The Hartford and its subsidiaries in connection with the operation of the Hartford Funds. Mr. Macdonald joined The Hartford in 2005.
Joseph G. Melcher (1973) Vice President and Chief Compliance Officer since 2013
Mr. Melcher currently serves as Executive Vice President of HFD, HFMG and HASCO. Mr. Melcher also currently serves as Executive Vice President and Chief Compliance Officer of HFMC. Mr. Melcher has served in various positions within The Hartford and its subsidiaries in connection with the operation of the Hartford Funds since joining The Hartford in 2012. Prior to joining The Hartford, Mr. Melcher worked at Touchstone Investments, a member of the Western & Southern Financial Group, where he held the position of Vice President and Chief Compliance Officer from 2010 through 2012 and Assistant Vice President, Compliance from 2005 to 2010.
Vernon J. Meyer (1964) Vice President since 2006
Mr. Meyer currently serves as Senior Vice President of HLIC. He also currently serves as Managing Director and Chief Investment Officer of HFMC and Managing Director of HFMG. Mr. Meyer has served in various positions within The Hartford and its subsidiaries in connection with the operation of the Hartford Funds. Mr. Meyer joined The Hartford in 2004.
Laura S. Quade (1969) Vice President since 2012
Ms. Quade currently serves as Vice President of HASCO, HFD and HFMG. She is the Head of Operations of HASCO and also serves as Director, Enterprise Operations of HLIC. Ms. Quade has served in various positions within The Hartford and its subsidiaries in connection with the operation of the Hartford Funds.
Martin A. Swanson (1962) Vice President since 2010
Mr. Swanson currently serves as Vice President of HLIC. Mr. Swanson also serves as Managing Director, Chief Marketing Officer and Principal of HFD and Managing Director of HFMG. Mr. Swanson has served in various positions within The Hartford and its subsidiaries in connection with the operation of the Hartford Funds.
HOW TO OBTAIN A COPY OF THE FUND’S PROXY VOTING POLICIES AND VOTING RECORDS (UNAUDITED)
A description of the policies and procedures that the Fund uses to determine how to vote proxies relating to portfolio securities and information about how the Fund voted proxies relating to portfolio securities during the most recent twelve-month period ended June 30 are available (1) without charge, upon request, by calling 888-843-7824 and (2) on the SEC’s website at http://www.sec.gov.
QUARTERLY PORTFOLIO HOLDINGS INFORMATION (UNAUDITED)
The Fund files a complete schedule of portfolio holdings with the SEC for the first and third quarters of each fiscal year on Form N-Q. The Fund’s Forms N-Q are available (1) without charge, upon request, by calling 888-843-7824 and (2) on the SEC’s website at http://www.sec.gov. The Form N-Q may be reviewed and copied at the SEC’s Public Reference Room in Washington, DC. Information on the operation of the Public Reference Room may be obtained by calling 1-800-SEC-0330.
| Hartford Dividend and Growth HLS Fund |
| Expense Example (Unaudited) |
Your Fund's Expenses
As a shareholder of the Fund, you incur two types of costs: (1) transaction costs and (2) ongoing costs, including investment management fees, distribution and/or service (12b-1) fees, if any, and other fund expenses. This example is intended to help you understand your ongoing costs (in dollars) of investing in the Fund and to compare these costs with the ongoing costs of investing in other mutual funds. The example is based on an investment of $1,000 invested at the beginning of the period and held for the entire period of December 31, 2013 through June 30, 2014.
Actual Expenses
The first set of columns of the table below provides information about actual account values and actual expenses. You may use the information in this column, together with the amount you invested, to estimate the expenses that you paid over the period. Simply divide your account value by $1,000 (for example, an $8,600 account value divided by $1,000 = 8.6), then multiply the result by the number in the line under the heading entitled “Expenses Paid During Period” to estimate the expenses you paid on your account during this period.
Hypothetical Example for Comparison Purposes
The second set of columns of the table below provides information about hypothetical account values and hypothetical expenses based on the Fund's actual expense ratio and an assumed rate of return of 5% per year before expenses, which is not the Fund's actual return. The hypothetical account values and expenses may not be used to estimate the actual ending account balance or expenses you paid for the period. You may use this information to compare the ongoing costs of investing in the Fund and other funds. To do so, compare this 5% hypothetical example with the 5% hypothetical examples that appear in the shareholder reports of the other funds.
Please note that the expenses shown in the table are meant to highlight your ongoing costs only and do not reflect any transactional costs, such as sales charges (loads) and CDSC. Therefore, the second set of columns of the table is useful in comparing ongoing costs only, and will not help you determine the relative total costs of owning different funds. In addition, if these transactional costs were included, your costs would be higher. Expenses are equal to the Fund's annualized expense ratios multiplied by average account value over the period, multiplied by 181/365 (to reflect the one-half year period).
| | | Actual return | | | Hypothetical (5% return before expenses) | | | | | | | | | | |
| | | Beginning
Account Value
December 31,
2013 | | | Ending Account
Value
June 30, 2014 | | | Expenses paid
during the period
December 31, 2013
through
June 30, 2014 | | | Beginning
Account Value
December 31,
2013 | | | Ending Account
Value
June 30, 2014 | | | Expenses paid
during the period
December 31,
2013
through
June 30, 2014 | | | Annualized
expense
ratio | | | Days
in the
current
1/2
year | | | Days
in the
full
year | |
| Class IA | | $ | 1,000.00 | | | $ | 1,081.30 | | | $ | 3.46 | | | $ | 1,000.00 | | | $ | 1,021.47 | | | $ | 3.36 | | | | 0.67 | % | | | 181 | | | | 365 | |
| Class IB | | $ | 1,000.00 | | | $ | 1,080.00 | | | $ | 4.74 | | | $ | 1,000.00 | | | $ | 1,020.23 | | | $ | 4.61 | | | | 0.92 | | | | 181 | | | | 365 | |
| Hartford Dividend and Growth HLS Fund |
| Main Risks (Unaudited) |
The main risks of investing in the Fund are described below.
Market, Selection and Strategy Risk: The Fund’s share price may fluctuate due to market risk and/or security selections that may underperform the market or relevant benchmarks. If the sub-adviser's investment strategy does not perform as expected, the Fund could underperform its peers or lose money. There is no guarantee the Fund will achieve its stated objective.
Foreign Investment Risk: Investments in foreign securities may be riskier than investments in U.S. securities. Potential risks include the risks of illiquidity, increased price volatility, less government regulation, less extensive and less frequent accounting and other reporting requirements, unfavorable changes in currency exchange rates, and economic and political disruptions.
Dividend Paying Security Investment Risk: Dividends are not guaranteed and are subject to change. Dividend paying securities as a group can fall out of favor with the market, causing the Fund to underperform.
THIS PRIVACY POLICY IS NOT PART OF THIS REPORT
Privacy Policy and Practices of The Hartford Financial Services Group, Inc. and its Affiliates
(herein called “we, our and us”)
This Privacy Policy applies to our United States Operations
We value your trust. We are committed to the responsible: a) management; b) use; and c) protection; of Personal Information. This notice describes how we collect, disclose, and protect Personal Information. We collect Personal Information to: a) service your Transactions with us; and b) support our business functions. We may obtain Personal Information from: a) You; b) your Transactions with us; and c) third parties such as a consumer-reporting agency. Based on the type of product or service You apply for or get from us, Personal Information such as: a) your name; b) your address; c) your income; d) your payment; or e) your credit history; may be gathered from sources such as applications, Transactions, and consumer reports. To serve You and service our business, we may share certain Personal Information. We will share Personal Information, only as allowed by law, with affiliates such as: a) our insurance companies; b) our employee agents; c) our brokerage firms; and d) our administrators. As allowed by law, we may share Personal Financial Information with our affiliates to: a) market our products; or b) market our services; to You without providing You with an option to prevent these disclosures. | | | We may also share Personal Information, only as allowed by law, with unaffiliated third parties including: a) independent agents; b) brokerage firms; c) insurance companies; d) administrators; and e) service providers; who help us serve You and service our business. When allowed by law, we may share certain Personal Financial Information with other unaffiliated third parties who assist us by performing services or functions such as: a) taking surveys; b) marketing our products or services; or c) offering financial products or services under a joint agreement between us and one or more financial institutions. We, and third parties we partner with, may track some of the pages You visit through the use of: a) cookies; b) pixel tagging; or c) other technologies; and currently do not process or comply with any web browser’s “do not track” signal or similar mechanism that indicates a request to disable online tracking of individual users who visit our websites or use our services. We will not sell or share your Personal Financial Information with anyone for purposes unrelated to our business functions without offering You the opportunity to: a) “opt-out;” or b) “opt-in;” as required by law. We only disclose Personal Health Information with: a) your proper written authorization; or b) as otherwise allowed or required by law. Our employees have access to Personal Information in the course of doing their jobs, such as: a) underwriting policies; b) paying claims; c) developing new products; or d) advising customers of our products and services. |
We use manual and electronic security procedures to maintain: a) the confidentiality; and b) the integrity of; Personal Information that we have. We use these procedures to guard against unauthorized access. Some techniques we use to protect Personal Information include: a) secured files; b) user authentication; c) encryption; d) firewall technology; and e) the use of detection software. We are responsible for and must: a) identify information to be protected; b) provide an adequate level of protection for that data; c) grant access to protected data only to those people who must use it in the performance of their job-related duties. Employees who violate our Privacy Policy will be subject to discipline, which may include ending their employment with us. At the start of our business relationship, we will give You a copy of our current Privacy Policy. We will also give You a copy of our current Privacy Policy once a year if You maintain a continuing business relationship with us. We will continue to follow our Privacy Policy regarding Personal Information even when a business relationship no longer exists between us. | | | As used in this Privacy Notice: Application means your request for our product or service. Personal Financial Information means financial information such as: a) credit history; b) income; c) financial benefits; or d) policy or claim information. Personal Health Information means health information such as: a) your medical records; or b) information about your illness, disability or injury. Personal Information means information that identifies You personally and is not otherwise available to the public. It includes: a) Personal Financial Information; and b) Personal Health Information. Transaction means your business dealings with us, such as: a) your Application; b) your request for us to pay a claim; and c) your request for us to take an action on your account. You means an individual who has given us Personal Information in conjunction with: a) asking about; b) applying for; or c) obtaining; a financial product or service from us if the product or service is used mainly for personal, family, or household purposes. |
This Privacy Policy is being provided on behalf of the following affiliates of The Hartford Financial Services Group, Inc.:
1stAGChoice, Inc.; Access CoverageCorp, Inc.; Access CoverageCorp Technologies, Inc.; American Maturity Life Insurance Company; Archway 60 R, LLC; Business Management Group, Inc.; Champlain Life Reinsurance Company; DMS R, LLC; Eloy R, LLC; Ersatz Corporation; First State Insurance Company; Hartford Accident and Indemnity Company; Hartford Administrative Services Company; Hartford Casualty General Agency, Inc.; Hartford Casualty Insurance Company; Hartford-Comprehensive Employee Benefit Service Company; Hartford Equity Sales Company, Inc.; Hartford Fire General Agency, Inc.; Hartford Fire Insurance Company; Hartford Funds Management Company, LLC; Hartford Funds Management Group, Inc.; Hartford HLS Series Fund II, Inc.; Hartford Insurance Company of Illinois; Hartford Insurance Company of the Midwest; Hartford Insurance Company of the Southeast; Hartford Integrated Technologies, Inc.; Hartford International Life Reassurance Corporation; Hartford Funds Distributors, LLC; Hartford Investment Management Company; Hartford Life and Accident Insurance Company; Hartford Life and Annuity Insurance Company; Hartford Life Insurance Company; Hartford Life Private Placement, LLC; Hartford Lloyd’s Corporation; Hartford Lloyd’s Insurance Company; Hartford Mezzanine Investors I, LLC; Hartford Residual Market, L.C.C.; Hartford Retirement Services, LLC; Hartford Securities Distribution Company, Inc.; Hartford Series Fund, Inc.; Hartford Specialty Insurance Services of Texas, LLC; Hartford Strategic Investments, LLC; Hartford Underwriters Insurance Company; Hartford Technology Services Company, L.L.C.; Hartford of Texas General Agency, Inc.; Hartford Underwriters General Agency, Inc.; HARTRE Company, L.C.C.; HL Investment Advisors, LLC; HLA LLC; Horizon Management Group, LLC; HRA Brokerage Services, Inc.; Lanidex Class B, LLC; M-CAP Insurance Agency, LLC; New England Insurance Company; New England Reinsurance Corporation; Nutmeg Insurance Agency, Inc.; Nutmeg Insurance Company; Pacific Insurance Company, Limited; Planco, LLC: Property and Casualty Insurance Company of Hartford; Revere R, LLC; RVR R, LLC; Sentinel Insurance Company, Ltd.; Sunstone R, LLC; Symphony R, LLC; The Evergreen Group Incorporated; The Hartford Alternative Strategies Fund; The Hartford Mutual Funds, Inc.; The Hartford Mutual Funds II, Inc.; Trumbull Flood Management, L.L.C.; Trumbull Insurance Company; Twin City Fire Insurance Company; White River Life Reinsurance Company.
HPP Revised January 2014
HARTFORD HLS FUNDS
P.O. Box 14293
Lexington, KY 40512-4293
HARTFORDFUNDS
hartfordfunds.com
Hartford Series Fund, Inc. is underwritten and distributed by Hartford Funds Distributors, LLC.
Hartford Series Fund, Inc. inception dates range from 1977 to date. Hartford Series Fund, Inc. is not a subsidiary of The Hartford Financial Services Group, Inc. ("The Hartford") but is underwritten, distributed by and advised by subsidiaries of The Hartford. Investments in Hartford Series Fund, Inc. are not guaranteed by The Hartford or any other entity.
This report is submitted for the general information of the shareholders of the Funds. It is not authorized for distribution unless preceded or accompanied by a current prospectus for the Funds.
Investors should carefully consider the investment objectives, risks, charges, and expenses of Hartford Funds before investing. This and other information can be found in the prospectus, which can be obtained by calling 800-862-6668 (or 800-279-1541 for institutional investors). Investors should read them carefully before they invest.
HLSSAR-DG14 8-14 113538-3 Printed in U.S.A.
HARTFORDFUNDS
| | HARTFORD GLOBAL GROWTH HLS FUND 2014 Semi Annual Report |
A MESSAGE FROM THE PRESIDENT
Dear Fellow Shareholders:
Thank you for investing in Hartford HLS Funds.
Market Review
U.S. equities (as represented by the S&P 500 Index) started 2014 on a shaky note after posting a strong 32.39% gain in 2013. However, stocks managed to maintain modest gains throughout the first quarter and returned to a generally steady climb in the second quarter. Through June 30, 2014, the S&P 500 Index advanced 7.14%. It appears that much of the market volatility during the year can be attributed to heightened international tensions. In particular, the Russian annexation of Ukraine’s Crimean Peninsula and increased tensions in Iraq were cause for concern.
On the domestic front, subdued economic and employment reports slowed stocks’ progress early in the new year, although much of the weakness seemed to dissipate as the year’s unusually harsh winter subsided. And despite initial reactions to the idea, when the U.S. Federal Reserve began tapering its quantitative-easing program in January by reducing its bond purchases by $10 billion a month, the markets took the policy change in stride.
Despite a rough start to the year for financial markets, the global economy seems to be settling into a slow-but-steady recovery. While first-quarter U.S. gross domestic product (GDP) growth was disappointing at -2.9%, U.S. consumer spending, which is a significant contributor toward economic growth, rose by 3% during the quarter. It appears that Europe is also maintaining its own recovery: The International Monetary Fund projects that Europe’s full-year GDP growth may breach positive territory for the first time since 2011.
The impact of international affairs on stocks so far this year is an important reminder to stay informed about both domestic and international economic developments, and any effects they may have on your individual investment goals. If you have not already had a mid-year review of your portfolio, it may be a good time to meet with your financial advisor to review your progress and make certain your investments are prepared for all market environments:
| • | Is your portfolio properly diversified with an appropriate mix of stocks and bonds? |
| • | Is your portfolio positioned to take advantage of the global economic recovery, with investments in both domestic and international holdings? |
| • | Are your investments still in line with your risk tolerance and investment time horizon? |
Your financial professional can help you choose options within our fund family to help you reach your investment goals with confidence.
Thank you again for investing with Hartford HLS Funds.
James Davey
President
Hartford HLS Funds
1 The S&P 500 Index is a market capitalization-weighted price index composed of 500 widely held common stocks.
2The Dow Jones Industrial Average is an unmanaged, price-weighted index of 30 of the largest, most widely held stocks traded on the New York Stock Exchange.
Hartford Global Growth HLS Fund
Table of Contents
This report is prepared for the general information of contract owners and qualified retirement plan participants. It is not an offer of contracts or of qualified retirement plans. It should not be used in connection with any offer, except in conjunction with the appropriate product prospectus which contains all pertinent information including the applicable sales, administrative and other charges.
The views expressed in the Fund’s Manager Discussion under ‘‘Why did the Fund perform this way?’’ and ‘‘What is the outlook?’’ are views of the Fund’s sub-adviser and portfolio management team through the end of the period and are subject to change based on market and other conditions. The Fund’s Manager Discussion is for informational purposes only and does not represent an offer, recommendation or solicitation to buy, hold or sell any security. The specific securities identified and described, if any, do not represent all of the securities purchased or sold and you should not assume that investments in the securities identified and discussed will be profitable.
| Hartford Global Growth HLS Fund inception 09/30/1998 |
| (sub-advised by Wellington Management Company, LLP) |
| |
| Investment objective – The Fund seeks growth of capital. |
Performance Overview 6/30/04 - 6/30/14
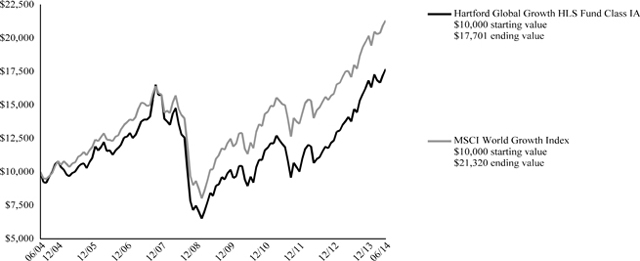
The chart above represents the hypothetical growth of a $10,000 investment in Class IA. Growth results in classes other than Class IA will vary from what is seen above due to differences in the expenses charged to those share classes.
| Average Annual Total Returns (as of 6/30/14) |
| | | 6 Month† | | 1 Year | | 5 Years | | 10 Years |
| Global Growth IA | | | 5.06% | | | | 28.46% | | | | 16.63% | | | | 5.88% | |
| Global Growth IB | | | 4.96% | | | | 28.14% | | | | 16.34% | | | | 5.61% | |
MSCI World Growth Index | | | 5.57% | | | | 24.67% | | | | 15.86% | | | | 7.86% | |
PERFORMANCE DATA QUOTED REPRESENTS PAST PERFORMANCE AND DOES NOT GUARANTEE FUTURE RESULTS. The investment return and principal value of the investment will fluctuate so that investors’ shares, when redeemed, may be worth more or less than their original cost. Current performance may be lower or higher than the performance data quoted. To obtain performance data current to the most recent month-end, please visit our website www.hartfordfunds.com.
Total returns presented above were calculated using the Fund’s net asset value available to shareholders for sale or redemption of Fund shares on June 30, 2014, which may exclude investment transactions as of this date. All share class returns assume the reinvestment of all distributions at net asset value and the deduction of all fund expenses.
MSCI World Growth Index is a broad-based unmanaged market capitalization-weighted total return index which measures the performance of growth securities in 23 developed-country global equity markets including the United States, Canada, Europe, Australia, New Zealand and the Far East.
The index is unmanaged, and its results include reinvested dividends and/or distributions, but do not reflect the effect of sales charges, commissions, expenses or taxes.
You cannot invest directly in an index.
As shown in the Fund's current prospectus dated May 1, 2014, the total annual operating expense ratios for Class IA and Class IB were 0.82% and 1.07%, respectively. Actual expenses may be higher. Please see the accompanying Financial Highlights for expense ratios for the six-month period ended June 30, 2014.
The chart and table do not reflect the deductions of taxes, sales charges or other fees which may be applied at the variable life insurance, variable annuity or qualified retirement plan product level. Any such additional sales charges or other fees or expenses would lower the contract’s or plan’s performance.
All investments are subject to risk including the possible loss of principal. For a discussion of the Fund’s risks, please see the Main Risks section of this report. For more detailed information on the risks associated with an investment in the Fund, please see the prospectus.
Hartford Global Growth HLS Fund
Manager Discussion
June 30, 2014 (Unaudited)
| Portfolio Managers | |
| John A. Boselli, CFA | Matthew D. Hudson, CFA |
| Senior Vice President and Equity Portfolio Manager | Vice President and Equity Portfolio Manager |
| | |
How did the Fund perform?
The Class IA shares of the Hartford Global Growth HLS Fund returned 5.06% for the six-month period ended June 30, 2014, underperforming the Fund’s benchmark, the MSCI World Growth Index, which returned 5.57% for the same period. The Fund outperformed the 4.15% average return of the Lipper Global Large-Cap Growth Funds peer group, a group of funds with investment strategies similar to those of the Fund.
Why did the Fund perform this way?
Global equities rose during the semi-annual period. Despite ongoing geopolitical tensions surrounding the crisis in Ukraine, concerns about a Chinese growth slowdown, and unsettling economic and political developments in several other emerging market countries, the five-year-old stock market rally continued in the first half of 2014. Robust merger and acquisition activity, along with continued accommodative monetary policy from central banks around the globe, supported bullish sentiment in the second half of the period. The European Central Bank (ECB) introduced a set of unconventional monetary policy measures to fight disinflationary forces and rekindle growth in the Eurozone. In addition, the People's Bank of China announced a cut in the reserve requirement ratio for major banks to stimulate lending and support growth. Emerging market equities modestly underperformed their developed market counterparts despite seeing strong gains in the second half of the period.
For the semi-annual period, growth stocks (+5.6%) underperformed value stocks (+7.5%) as measured by the MSCI World Growth Index and the MSCI World Value Index, respectively. Within the MSCI World Growth Index, all ten sectors posted positive returns. Energy (+20%), Healthcare (+11%) and Materials (+8%) gained the most, while the Telecommunication Services (+1%), Consumer Discretionary (+1%), and Financials (+2%) sectors lagged on a relative basis.
The Fund’s modest underperformance versus the MSCI World Growth Index was primarily due to negative sector allocation, a residual of our bottom-up stock selection process. An underweight allocation to the Energy sector and an overweight allocation to the Financials sector detracted from relative returns. A small cash position detracted in an upward trending market environment. Security selection contributed to relative performance driven by strong selection in Information Technology, Consumer Staples, and Energy. This was partially offset by weaker selection in the Financials, Healthcare, and Consumer Discretionary sectors.
The top detractors from the Fund’s relative performance were Apple (Information Technology), Lululemon Athletica (Consumer Discretionary), and Julius Baer (Financials). Apple, a U.S.-based designer, manufacturer, and retailer of a range of personal electronic products, saw its stock continue to rebound following April's solid earnings report and the announcement that it was acquiring Beats Electronics for $3 billion. Our underweight position in Apple detracted from performance relative to the MSCI World Growth Index. Shares of U.S.-based Lululemon Athletica, a manufacturer and retailer of premium athletic apparel, declined as the company has yet to recover from prior product issues, and a new management team has come on board which will take time to chart a new course. Private Swiss bank franchise Julius Baer saw its shares decline on speculation that heightened regulatory fines for other financial firms are a proxy for what the company may have to pay to settle charges it helped its customers evade taxes. Top absolute detractors also included Ocwen Financial (Financials) and LinkedIn (Information Technology).
Top contributors to relative and absolute performance included Largan Precision (Information Technology), Green Mountain Coffee (Consumer Staples) and Pandora (Consumer Discretionary). Shares of Taiwan-based Largan Precision, the leading manufacturer of camera lenses for smartphones, moved higher as first quarter earnings and sales in April and May exceeded expectations driven by features upgrades in Apple and Chinese smartphones. Shares of Keurig Green Mountain, the leading producer of single-cup coffee brewers and other beverages, rose on news that Coca-Cola Co. would increase its stake in Keurig to 16% from 10% as part of a strategic partnership. Shares of Denmark-based, Pandora, a company engaged in the design, manufacture and marketing of jewelry, outperformed after the company posted quarterly earnings in line with market expectations and raised fiscal year revenue guidance.
Please note, derivatives are not used in a significant manner in this Fund and did not have a material impact on performance during the period.
What is the outlook?
Overall, the global economy continues to grow slowly but steadily. The portfolio ended the period overweight stocks in the United States as strong relative growth continues, driven by consumer lending growth of 8% and increasing corporate spending. Over the past few years emerging markets have underperformed the broader global market, while Europe has generally done well compared to emerging markets. The portfolio ended the period overweight in its
Hartford Global Growth HLS Fund
Manager Discussion – (continued)
June 30, 2014 (Unaudited)
exposure to emerging markets while being underweight to Europe because we find fewer opportunities to buy what we believe are high quality growth companies trading at a discount to the market there.
At the end of the period, our largest sector overweights were to Information Technology, Financials, and Healthcare, while we remained underweight industrials, Consumer Staples, and Materials, relative to the MSCI World Growth Index.
Our focus remains on stock selection that is driven by bottom-up, fundamental research, diligent meetings with the managements of leading companies globally, and leveraging the deep research capabilities of our firm. As always, we invest in companies with improving fundamentals and catalysts that we think will lead to accelerating earnings growth above consensus expectations.
Diversification by Country
as of June 30, 2014
| | | Percentage of | |
| Country | | Net Assets | |
| Austria | | | 0.5 | % |
| Belgium | | | 2.4 | |
| British Virgin Islands | | | 0.0 | |
| China | | | 2.7 | |
| Denmark | | | 1.6 | |
| Finland | | | 0.6 | |
| France | | | 1.9 | |
| Germany | | | 3.7 | |
| Hong Kong | | | 3.2 | |
| India | | | 0.2 | |
| Ireland | | | 0.6 | |
| Japan | | | 3.6 | |
| Mexico | | | 0.5 | |
| Netherlands | | | 0.0 | |
| Spain | | | 0.5 | |
| Sweden | | | 0.9 | |
| Switzerland | | | 4.1 | |
| Taiwan | | | 1.5 | |
| United Kingdom | | | 6.3 | |
| United States | | | 63.3 | |
| Short-Term Investments | | | 1.7 | |
| Other Assets and Liabilities | | | 0.2 | |
| Total | | | 100.0 | % |
Hartford Global Growth HLS Fund
Schedule of Investments
June 30, 2014 (Unaudited)
(000’s Omitted)
| Shares or Principal Amount | | Market Value ╪ | |
| Common Stocks - 96.9% | |
| | | | | Automobiles and Components - 0.6% | | | | |
| | 43 | | | Delphi Automotive plc | | $ | 2,929 | |
| | | | | | | | | |
| | | | | Banks - 2.4% | | | | |
| | 203 | | | Banco Bilbao Vizcaya Argentaria S.A. | | | 2,589 | |
| | 43 | | | BNP Paribas | | | 2,913 | |
| | 84 | | | Erste Group Bank AG | | | 2,713 | |
| | 23 | | | ICICI Bank Ltd. | | | 1,158 | |
| | 429 | | | Mitsubishi UFJ Financial Group, Inc. | | | 2,636 | |
| | | | | | | | 12,009 | |
| | | | | Capital Goods - 6.9% | | | | |
| | 107 | | | ABB Ltd. ADR | | | 2,462 | |
| | 27 | | | Honeywell International, Inc. | | | 2,488 | |
| | 22 | | | Lockheed Martin Corp. | | | 3,615 | |
| | 491 | | | Mitsubishi Heavy Industries Ltd. | | | 3,067 | |
| | 24 | | | Northrop Grumman Corp. | | | 2,915 | |
| | 22 | | | Parker-Hannifin Corp. | | | 2,814 | |
| | 54 | | | Safran S.A. | | | 3,568 | |
| | 31 | | | Schneider Electric S.A. | | | 2,895 | |
| | 95 | | | SKF AB Class B | | | 2,425 | |
| | 9 | | | SMC Corp. of America | | | 2,525 | |
| | 74 | | | Textron, Inc. | | | 2,815 | |
| | — | | | Vallourec S.A. | | | 1 | |
| | 33 | | | Wabco Holdings, Inc. ● | | | 3,568 | |
| | | | | | | | 35,158 | |
| | | | | Commercial and Professional Services - 0.5% | | | | |
| | 37 | | | Equifax, Inc. ● | | | 2,692 | |
| | | | | | | | | |
| | | | | Consumer Durables and Apparel - 2.5% | | | | |
| | 27 | | | Hugo Boss AG | | | 3,999 | |
| | 44 | | | JD.com, Inc. ● | | | 1,260 | |
| | 51 | | | Pandora A/S | | | 3,924 | |
| | 164 | | | Pulte Group, Inc. | | | 3,311 | |
| | | | | | | | 12,494 | |
| | | | | Consumer Services - 4.2% | | | | |
| | 183 | | | Compass Group plc | | | 3,177 | |
| | 229 | | | Galaxy Entertainment Group Ltd. | | | 1,828 | |
| | 97 | | | MGM Resorts International ● | | | 2,569 | |
| | 934 | | | Sands China Ltd. | | | 7,047 | |
| | 37 | | | Starbucks Corp. | | | 2,880 | |
| | 53 | | | Wyndham Worldwide Corp. | | | 4,009 | |
| | | | | | | | 21,510 | |
| | | | | Diversified Financials - 8.9% | | | | |
| | 76 | | | American Express Co. ‡ | | | 7,245 | |
| | 36 | | | Ameriprise Financial, Inc. | | | 4,369 | |
| | 16 | | | Atlas Mara Co-Nvest Ltd. ⌂●† | | | 172 | |
| | 22 | | | BlackRock, Inc. | | | 7,087 | |
| | 64 | | | Discover Financial Services | | | 3,980 | |
| | 74 | | | Franklin Resources, Inc. | | | 4,266 | |
| | 489 | | | Henderson Group plc | | | 2,012 | |
| | 12 | | | Intercontinental Exchange, Inc. | | | 2,324 | |
| | 56 | | | JP Morgan Chase & Co. | | | 3,201 | |
| | 69 | | | Julius Baer Group Ltd. | | | 2,834 | |
| | 47 | | | Moody's Corp. | | | 4,115 | |
| | 113 | | | SEI Investments Co. | | | 3,713 | |
| | | | | | | | 45,318 | |
| | | | | Energy - 3.4% | | | | |
| | 1 | | | BP plc | | | 8 | |
| | 109 | | | Cobalt International Energy, Inc. ● | | | 1,991 | |
| | 28 | | | EOG Resources, Inc. | | | 3,246 | |
| | 67 | | | Halliburton Co. | | | 4,763 | |
| | 17 | | | Pioneer Natural Resources Co. | | | 3,881 | |
| | — | | | Royal Dutch Shell plc | | | 6 | |
| | 30 | | | Schlumberger Ltd. | | | 3,554 | |
| | | | | | | | 17,449 | |
| | | | | Food and Staples Retailing - 2.3% | | | | |
| | 106 | | | CVS Caremark Corp. | | | 7,987 | |
| | 86 | | | Seven & I Holdings Co., Ltd. | | | 3,630 | |
| | | | | | | | 11,617 | |
| | | | | Food, Beverage and Tobacco - 5.1% | | | | |
| | 78 | | | Anheuser-Busch InBev N.V. | | | 8,915 | |
| | 100 | | | Diageo Capital plc | | | 3,184 | |
| | 65 | | | Imperial Tobacco Group plc | | | 2,940 | |
| | 32 | | | Keurig Green Mountain, Inc. | | | 4,042 | |
| | 62 | | | Lorillard, Inc. | | | 3,784 | |
| | 42 | | | Monster Beverage Corp. ● | | | 2,978 | |
| | — | | | Naturex ☼ | | | 27 | |
| | 2 | | | United Spirits Ltd. | | | 92 | |
| | | | | | | | 25,962 | |
| | | | | Health Care Equipment and Services - 1.8% | | | | |
| | 40 | | | Aetna, Inc. | | | 3,241 | |
| | 49 | | | Medtronic, Inc. | | | 3,124 | |
| | 29 | | | Zimmer Holdings, Inc. | | | 3,012 | |
| | | | | | | | 9,377 | |
| | | | | Insurance - 5.2% | | | | |
| | 44 | | | Aflac, Inc. | | | 2,764 | |
| | 800 | | | AIA Group Ltd. | | | 4,018 | |
| | 124 | | | American International Group, Inc. | | | 6,781 | |
| | 116 | | | Assured Guaranty Ltd. | | | 2,854 | |
| | 161 | | | Prudential plc | | | 3,687 | |
| | 58 | | | Sampo Oyj Class A | | | 2,918 | |
| | 282 | | | St. James's Place Capital plc | | | 3,678 | |
| | | | | | | | 26,700 | |
| | | | | Materials - 1.6% | | | | |
| | 203 | | | Cemex S.A.B. de C.V. ADR ● | | | 2,687 | |
| | 33 | | | HeidelbergCement AG | | | 2,844 | |
| | 216 | | | James Hardie Industries plc | | | 2,816 | |
| | | | | | | | 8,347 | |
| | | | | Media - 4.5% | | | | |
| | 63 | | | Comcast Corp. Class A | | | 3,366 | |
| | 51 | | | DirecTV ● | | | 4,310 | |
| | 40 | | | Scripps Networks Interactive Class A | | | 3,229 | |
| | 326 | | | Sky Deutschland AG ● | | | 3,005 | |
| | 99 | | | Twenty-First Century Fox, Inc. | | | 3,470 | |
| | 36 | | | Walt Disney Co. | | | 3,065 | |
| | 120 | | | WPP plc | | | 2,622 | |
| | | | | | | | 23,067 | |
| | | | | Pharmaceuticals, Biotechnology and Life Sciences - 15.2% | | | | |
| | 33 | | | Actelion Ltd. | | | 4,122 | |
| | 33 | | | Amgen, Inc. | | | 3,915 | |
| | 75 | | | AstraZeneca plc | | | 5,580 | |
| | 15 | | | Biogen Idec, Inc. ● | | | 4,730 | |
| | 165 | | | Bristol-Myers Squibb Co. | | | 8,014 | |
| | 44 | | | Celgene Corp. ● | | | 3,809 | |
| | 4 | | | Forest Laboratories, Inc. ● | | | 398 | |
| | 117 | | | Gilead Sciences, Inc. ● | | | 9,710 | |
| | 130 | | | Merck & Co., Inc. | | | 7,521 | |
| | 63 | | | Mylan, Inc. ● | | | 3,242 | |
| | 93 | | | Novo Nordisk A/S | | | 4,283 | |
| | 14 | | | Regeneron Pharmaceuticals, Inc. ● | | | 3,998 | |
The accompanying notes are an integral part of these financial statements.
Hartford Global Growth HLS Fund
Schedule of Investments – (continued)
June 30, 2014 (Unaudited)
(000’s Omitted)
| Shares or Principal Amount | | Market Value ╪ | |
| Common Stocks - 96.9% - (continued) | |
| | | | | Pharmaceuticals, Biotechnology and Life Sciences - 15.2% - (continued) | | | | |
| | 38 | | | Roche Holding AG | | $ | 11,209 | |
| | 39 | | | UCB S.A. | | | 3,338 | |
| | 37 | | | Vertex Pharmaceuticals, Inc. ● | | | 3,525 | |
| | | | | | | | 77,394 | |
| | | | | Real Estate - 0.7% | | | | |
| | 38 | | | American Tower Corp. REIT | | | 3,406 | |
| | 1 | | | Retail Opportunity Investments Corp. REIT | | | 17 | |
| | | | | | | | 3,423 | |
| | | | | Retailing - 4.1% | | | | |
| | 8 | | | Amazon.com, Inc. ● | | | 2,615 | |
| | 31 | | | Intime Retail Group Co., Ltd. | | | 27 | |
| | 395 | | | Kingfisher plc | | | 2,427 | |
| | 160 | | | Lowe's Cos., Inc. | | | 7,678 | |
| | 7 | | | Priceline (The) Group, Inc. ● | | | 8,284 | |
| | | | | | | | 21,031 | |
| | | | | Semiconductors and Semiconductor Equipment - 1.9% | | | | |
| | 245 | | | Infineon Technologies AG | | | 3,062 | |
| | 186 | | | MediaTek, Inc. | | | 3,139 | |
| | 99 | | | Micron Technology, Inc. ● | | | 3,254 | |
| | | | | | | | 9,455 | |
| | | | | Software and Services - 16.9% | | | | |
| | 167 | | | Activision Blizzard, Inc. | | | 3,720 | |
| | 47 | | | Adobe Systems, Inc. ● | | | 3,410 | |
| | 66 | | | Akamai Technologies, Inc. ● | | | 4,011 | |
| | 10 | | | Alliance Data Systems Corp. ● | | | 2,762 | |
| | 54 | | | Amdocs Ltd. | | | 2,517 | |
| | 53 | | | Automatic Data Processing, Inc. | | | 4,170 | |
| | 38 | | | Baidu, Inc. ADR ● | | | 7,025 | |
| | 120 | | | Cognizant Technology Solutions Corp. ● | | | 5,873 | |
| | 4 | | | Dropbox, Inc. ⌂●† | | | 69 | |
| | 84 | | | Facebook, Inc. ● | | | 5,655 | |
| | 8 | | | Google, Inc. Class A ● | | | 4,402 | |
| | 21 | | | Google, Inc. Class C ● | | | 12,124 | |
| | 40 | | | IAC/InterActiveCorp. | | | 2,789 | |
| | 53 | | | Jack Henry & Associates, Inc. | | | 3,132 | |
| | 66 | | | Mastercard, Inc. | | | 4,845 | |
| | 51 | | | Salesforce.com, Inc. ● | | | 2,966 | |
| | 238 | | | Tencent Holdings Ltd. | | | 3,616 | |
| | 92 | | | Vantiv, Inc. ● | | | 3,091 | |
| | 26 | | | Visa, Inc. | | | 5,375 | |
| | 26 | | | Yahoo!, Inc. ● | | | 904 | |
| | 49 | | | Yelp, Inc. ● | | | 3,749 | |
| | | | | | | | 86,205 | |
| | | | | Technology Hardware and Equipment - 5.0% | | | | |
| | 25 | | | F5 Networks, Inc. ● | | | 2,808 | |
| | 472 | | | Hitachi Ltd. | | | 3,458 | |
| | 54 | | | Largan Precision Co., Ltd. | | | 4,268 | |
| | 2,635 | | | Lenovo Group Ltd. | | | 3,599 | |
| | 2 | | | Pure Storage, Inc. ⌂●† | | | 34 | |
| | 64 | | | Qualcomm, Inc. | | | 5,086 | |
| | 38 | | | SanDisk Corp. | | | 4,009 | |
| | 163 | | | Telefonaktiebolaget LM Ericsson Class B | | | 1,969 | |
| | | | | | | | 25,231 | |
| | | | | Telecommunication Services - 1.2% | | | | |
| | 38 | | | SoftBank Corp. | | | 2,802 | |
| | 94 | | | T-Mobile US, Inc. ● | | | 3,158 | |
| | | | | | | | 5,960 | |
| | | | | Transportation - 1.6% | | | | |
| | 59 | | | Delta Air Lines, Inc. | | | 2,270 | |
| | 19 | | | FedEx Corp. | | | 2,851 | |
| | 26 | | | Kansas City Southern | | | 2,754 | |
| | | | | | | | 7,875 | |
| | | | | Utilities - 0.4% | | | | |
| | 276 | | | ENN Energy Holdings Ltd. | | | 1,982 | |
| | | | | | | | | |
| | | | | Total Common Stocks | | | | |
| | | | | ( Cost $377,181) | | $ | 493,185 | |
| | | | | | | | | |
| Preferred Stocks - 1.2% | | | | |
| | | | | Automobiles and Components - 0.6% | | | | |
| | 11 | | | Volkswagen AG N.V. | | $ | 2,938 | |
| | | | | | | | | |
| | | | | Media - 0.6% | | | | |
| | 64 | | | ProSieben Sat.1 Media AG | | | 2,842 | |
| | | | | | | | | |
| | | | | Total Preferred Stocks | | | | |
| | | | | (Cost $4,961) | | $ | 5,780 | |
| | | | | | | | | |
| Warrants - 0.0% | | | | |
| | | | | Diversified Financials - 0.0% | | | | |
| | 16 | | | Atlas Mara Co-Nvest Ltd. ⌂† | | $ | 24 | |
| | | | | | | | | |
| | | | | Total Warrants | | | | |
| | | | | (Cost $–) | | $ | 24 | |
| | | | | | | | | |
| | | | | Total Long-Term Investments | | | | |
| | | | | (Cost $382,142) | | $ | 498,989 | |
| | | | | | | | | |
| Short-Term Investments - 1.7% | | | | |
| Repurchase Agreements - 1.7% | | | | |
| | | | | Bank of America Merrill Lynch TriParty Repurchase
Agreement (maturing on 07/01/2014 in the
amount of $746, collateralized by FHLMC 2.23%
- 5.99%, 2030 - 2044, FNMA 2.31% - 6.34%,
2020 - 2042, value of $761) | | | | |
| $ | 746 | | | 0.10%, 6/30/2014 | | $ | 746 | |
| | | | | Bank of Montreal TriParty Repurchase Agreement
(maturing on 07/01/2014 in the amount of
$1,140, collateralized by U.S. Treasury Bill
0.13%, 2015, U.S. Treasury Bond 2.75% -
10.63%, 2015 - 2044, U.S. Treasury Note 0.13%
- 4.50%, 2014 - 2024, value of $1,163) | | | | |
| | 1,140 | | | 0.09%, 6/30/2014 | | | 1,140 | |
| | | | | Bank of Montreal TriParty Repurchase Agreement
(maturing on 07/01/2014 in the amount of $486,
collateralized by FHLMC 2.00% - 5.50%, 2018 -
2041, FNMA 2.00% - 4.50%, 2026 - 2042,
GNMA 3.00% - 4.00%, 2042 - 2043, U.S.
Treasury Bill 0.05%, 2014, U.S. Treasury Note
0.75%, 2018, value of $496) | | | | |
| | 486 | | | 0.11%, 6/30/2014 | | | 486 | |
| | | | | Barclays Capital TriParty Repurchase Agreement
(maturing on 07/01/2014 in the amount of $450,
collateralized by U.S. Treasury Note 0.63% -
0.88%, 2018 - 2019, value of $459) | | | | |
| | 450 | | | 0.07%, 6/30/2014 | | | 450 | |
The accompanying notes are an integral part of these financial statements.
Hartford Global Growth HLS Fund
Schedule of Investments – (continued)
June 30, 2014 (Unaudited)
(000’s Omitted)
| Shares or Principal Amount | | | | Market Value ╪ | |
| Short-Term Investments - 1.7% - (continued) | | | | | | | | |
| Repurchase Agreements - 1.7% - (continued) | | | | | | | | |
| | | | | Citigroup Global Markets, Inc. TriParty Repurchase
Agreement (maturing on 07/01/2014 in the
amount of $1,036, collateralized by U.S.
Treasury Bond 4.38% - 7.50%, 2016 - 2040,
U.S. Treasury Note 0.50% - 3.00%, 2014 - 2020,
value of $1,057) | | | | | | | | |
| $ | 1,036 | | | 0.06%, 6/30/2014 | | | | | | $ | 1,036 | |
| | | | | RBS Securities Inc. TriParty Repurchase
Agreement (maturing on 07/01/2014 in the
amount of $1,588, collateralized by U.S.
Treasury Note 0.38% - 3.13%, 2015 - 2022,
value of $1,620) | | | | | | | | |
| | 1,588 | | | 0.08%, 6/30/2014 | | | | | | | 1,588 | |
| | | | | TD Securities TriParty Repurchase Agreement
(maturing on 07/01/2014 in the amount of
$3,306, collateralized by FHLMC 3.50% - 4.00%,
2026 - 2044, FNMA 2.50% - 5.00%, 2025 -
2043, value of $3,372) | | | | | | | | |
| | 3,306 | | | 0.11%, 6/30/2014 | | | | | | | 3,306 | |
| | | | | UBS Securities Repurchase Agreement (maturing
on 07/01/2014 in the amount of $14,
collateralized by U.S. Treasury Note 2.13%,
2020, value of $14) | | | | | | | | |
| | 14 | | | 0.05%, 6/30/2014 | | | | | | | 14 | |
| | | | | | | | | | | | 8,766 | |
| | | | | Total Short-Term Investments | | | | | | | | |
| | | | | (Cost $8,766) | | | | | | $ | 8,766 | |
| | | | | | | | | | | | | |
| | | | | Total Investments | | | | | | | | |
| | | | | (Cost $390,908) ▲ | | | 99.8 | % | | $ | 507,755 | |
| | | | | Other Assets and Liabilities | | | 0.2 | % | | | 1,243 | |
| | | | | Total Net Assets | | | 100.0 | % | | $ | 508,998 | |
The accompanying notes are an integral part of these financial statements.
Hartford Global Growth HLS Fund
Schedule of Investments – (continued)
June 30, 2014 (Unaudited)
(000’s Omitted)
| Note: | Percentage of investments as shown is the ratio of the total market value to total net assets. |
| | Prices of foreign equities that are principally traded on certain foreign markets may be adjusted daily pursuant to a fair value pricing service approved by the Board of Directors in order to reflect an adjustment for factors occurring after the close of certain foreign markets but before the close of the New York Stock Exchange. |
| ▲ | At June 30, 2014, the cost of securities for federal income tax purposes was $391,951 and the aggregate gross unrealized appreciation and depreciation based on that cost were: |
| Unrealized Appreciation | | $ | 118,641 | |
| Unrealized Depreciation | | | (2,837 | ) |
| Net Unrealized Appreciation | | $ | 115,804 | |
| † | These securities were valued in good faith at fair value as determined under policies and procedures established by and under the supervision of the Board of Directors. At June 30, 2014, the aggregate value of these securities was $299, which represents 0.1% of total net assets. This amount excludes securities that are principally traded in certain foreign markets and whose prices are adjusted pursuant to a third party pricing service methodology approved by the Board of Directors. |
| ⌂ | The following securities are considered illiquid. Illiquid securities are often purchased in private placement transactions, are often not registered under the Securities Act of 1933, as amended, and may have contractual restrictions on resale. A security may also be considered illiquid if the security lacks a readily available market or if its valuation has not changed for a certain period of time. |
| Period Acquired | | | Shares/ Par | | | Security | | Cost Basis | |
| 12/2013 | | | | 16 | | | Atlas Mara Co-Nvest Ltd. | | $ | 162 | |
| 12/2013 | | | | 16 | | | Atlas Mara Co-Nvest Ltd. Warrants | | | – | |
| 05/2012 | | | | 4 | | | Dropbox, Inc. | | | 36 | |
| 04/2014 | | | | 2 | | | Pure Storage, Inc. | | | 37 | |
| | | | | | | | | | | | | |
At June 30, 2014, the aggregate value of these securities was $299, which represents 0.1% of total net assets.
| ☼ | This security, or a portion of this security, was purchased on a when-issued, delayed-delivery or delayed-draw basis. The cost of these securities was $20 at June 30, 2014. |
| ‡ | This security, or a portion of this security, has been segregated to cover funding requirements on investment transactions settling in the future. |
Foreign Currency Contracts Outstanding at June 30, 2014
| | | | | | | | | | | | | | | | | Unrealized Appreciation/(Depreciation) | |
| Currency | | Buy / Sell | | Delivery Date | | | Counterparty | | | Contract Amount | | | Market Value ╪ | | | Asset | | | Liability | |
| CAD | | Sell | | | 07/08/2014 | | | | BCLY | | | $ | 31 | | | $ | 31 | | | $ | – | | | $ | – | |
| CAD | | Sell | | | 07/09/2014 | | | | BCLY | | | | 7 | | | | 7 | | | | – | | | | – | |
| CHF | | Sell | | | 07/02/2014 | | | | JPM | | | | 3,808 | | | | 3,826 | | | | – | | | | (18 | ) |
| EUR | | Sell | | | 07/01/2014 | | | | CSFB | | | | 9 | | | | 9 | | | | – | | | | – | |
| HKD | | Sell | | | 07/03/2014 | | | | UBS | | | | 26 | | | | 26 | | | | – | | | | – | |
| MYR | | Sell | | | 07/01/2014 | | | | JPM | | | | 159 | | | | 159 | | | | – | | | | – | |
| Total | | | | | | | | | | | | | | | | | | | | $ | – | | | $ | (18 | ) |
| ╪ | See Significant Accounting Policies of accompanying Notes to Financial Statements regarding valuation of securities. |
The accompanying notes are an integral part of these financial statements.
Hartford Global Growth HLS Fund
Schedule of Investments – (continued)
June 30, 2014 (Unaudited)
(000’s Omitted)
| GLOSSARY: (abbreviations used in preceding Schedule of Investments) |
| |
| Counterparty Abbreviations: |
| BCLY | Barclays |
| CSFB | Credit Suisse First Boston Corp. |
| JPM | JP Morgan Chase & Co. | |
| UBS | UBS AG |
| |
| Currency Abbreviations: |
| CAD | Canadian Dollar | |
| CHF | Swiss Franc | |
| EUR | EURO | |
| HKD | Hong Kong Dollar | |
| MYR | Malaysian Ringgit | |
| |
| Other Abbreviations: |
| ADR | American Depositary Receipt |
| FHLMC | Federal Home Loan Mortgage Corp. |
| FNMA | Federal National Mortgage Association |
| GNMA | Government National Mortgage Association |
| REIT | Real Estate Investment Trust |
| | |
The accompanying notes are an integral part of these financial statements.
Hartford Global Growth HLS Fund
Investment Valuation Hierarchy Level Summary
June 30, 2014 (Unaudited)
(000’s Omitted)
| | | Total | | | Level 1 ♦ | | | Level 2 ♦ | | | Level 3 | |
| Assets: | | | | | | | | | | | | | | | | |
| Common Stocks | | | | | | | | | | | | | | | | |
| Automobiles and Components | | $ | 2,929 | | | $ | 2,929 | | | $ | – | | | $ | – | |
| Banks | | | 12,009 | | | | 1,158 | | | | 10,851 | | | | – | |
| Capital Goods | | | 35,158 | | | | 18,215 | | | | 16,943 | | | | – | |
| Commercial and Professional Services | | | 2,692 | | | | 2,692 | | | | – | | | | – | |
| Consumer Durables and Apparel | | | 12,494 | | | | 4,571 | | | | 7,923 | | | | – | |
| Consumer Services | | | 21,510 | | | | 9,458 | | | | 12,052 | | | | – | |
| Diversified Financials | | | 45,318 | | | | 40,300 | | | | 4,846 | | | | 172 | |
| Energy | | | 17,449 | | | | 17,435 | | | | 14 | | | | – | |
| Food and Staples Retailing | | | 11,617 | | | | 7,987 | | | | 3,630 | | | | – | |
| Food, Beverage and Tobacco | | | 25,962 | | | | 10,896 | | | | 15,066 | | | | – | |
| Health Care Equipment and Services | | | 9,377 | | | | 9,377 | | | | – | | | | – | |
| Insurance | | | 26,700 | | | | 12,399 | | | | 14,301 | | | | – | |
| Materials | | | 8,347 | | | | 2,687 | | | | 5,660 | | | | – | |
| Media | | | 23,067 | | | | 17,440 | | | | 5,627 | | | | – | |
| Pharmaceuticals, Biotechnology and Life Sciences | | | 77,394 | | | | 48,862 | | | | 28,532 | | | | – | |
| Real Estate | | | 3,423 | | | | 3,423 | | | | – | | | | – | |
| Retailing | | | 21,031 | | | | 18,577 | | | | 2,454 | | | | – | |
| Semiconductors and Semiconductor Equipment | | | 9,455 | | | | 3,254 | | | | 6,201 | | | | – | |
| Software and Services | | | 86,205 | | | | 82,520 | | | | 3,616 | | | | 69 | |
| Technology Hardware and Equipment | | | 25,231 | | | | 11,903 | | | | 13,294 | | | | 34 | |
| Telecommunication Services | | | 5,960 | | | | 3,158 | | | | 2,802 | | | | – | |
| Transportation | | | 7,875 | | | | 7,875 | | | | – | | | | – | |
| Utilities | | | 1,982 | | | | – | | | | 1,982 | | | | – | |
| Total | | | 493,185 | | | | 337,116 | | | | 155,794 | | | | 275 | |
| Preferred Stocks | | | 5,780 | | | | – | | | | 5,780 | | | | – | |
| Warrants | | | 24 | | | | – | | | | – | | | | 24 | |
| Short-Term Investments | | | 8,766 | | | | – | | | | 8,766 | | | | – | |
| Total | | $ | 507,755 | | | $ | 337,116 | | | $ | 170,340 | | | $ | 299 | |
| Liabilities: | | | | | | | | | | | | | | | | |
| Foreign Currency Contracts* | | $ | 18 | | | $ | – | | | $ | 18 | | | $ | – | |
| Total | | $ | 18 | | | $ | – | | | $ | 18 | | | $ | – | |
| ♦ | For the six-month period ended June 30, 2014, investments valued at $3,131 were transferred from Level 1 to Level 2, and there were no transfers from Level 2 to Level 1. Investments are transferred between Level 1 and Level 2 for a variety of reasons including, but not limited to: |
| 1) | Foreign equities for which a fair value price is more representative of exit value than the local market close (transfer into Level 2). Foreign equities for which the local market close is more representative of exit value (transfer into Level 1). |
| 2) | U.S. Treasury securities that no longer represent the most recent issue (transfer into Level 2). |
| 3) | Equity investments with no observable trading but a bid or mean price is used (transfer into Level 2). Equity investments using observable quoted prices in an active market (transfer into Level 1). |
| * | Derivative instruments (excluding purchased and written options, if applicable) are valued at the unrealized appreciation/depreciation on the investments. |
The accompanying notes are an integral part of these financial statements.
Hartford Global Growth HLS Fund
Investment Valuation Hierarchy Level Summary – (continued)
June 30, 2014 (Unaudited)
(000’s Omitted)
Following is a reconciliation of Level 3 assets for which significant unobservable inputs were used to determine fair value:
| | | Balance as
of December 31, 2013 | | | Realized
Gain (Loss) | | | Change in
Unrealized
Appreciation
(Depreciation) | | | Net
Amortization | | | Purchases | | | Sales | | | Transfers
Into
Level 3 | | | Transfers
Out of
Level 3 | | | Balance as
of June 30,
2014 | |
| Assets: | | | | | | | | | | | | | | | | | | | | | | | | | | | | | | | | | | | | |
| Common Stocks | | $ | — | | | $ | — | | | $ | 39 | * | | $ | — | | | $ | 236 | | | $ | — | | | $ | — | | | $ | — | | | $ | 275 | |
| Warrants | | | — | | | | — | | | | 24 | † | | | — | | | | — | | | | — | | | | — | | | | — | | | | 24 | |
| Total | | $ | — | | | $ | — | | | $ | 63 | | | $ | — | | | $ | 236 | | | $ | — | | | $ | — | | | $ | — | | | $ | 299 | |
| * | Change in unrealized appreciation (depreciation) in the current period relating to assets still held at June 30, 2014 was $39. |
| † | Change in unrealized appreciation (depreciation) in the current period relating to assets still held at June 30, 2014 was $24. |
| Note: | For purposes of reporting transfers between different hierarchy levels, both transfers in and out of each level, as applicable, are shown as if they occurred at the beginning of the period. |
The accompanying notes are an integral part of these financial statements.
Hartford Global Growth HLS Fund
Statement of Assets and Liabilities
June 30, 2014 (Unaudited)
(000’s Omitted)
| Assets: | | | | |
| Investments in securities, at market value (cost $390,908) | | $ | 507,755 | |
| Cash | | | 90 | |
| Foreign currency on deposit with custodian (cost $149) | | | 150 | |
| Receivables: | | | | |
| Investment securities sold | | | 6,468 | |
| Fund shares sold | | | 3 | |
| Dividends and interest | | | 780 | |
| Other assets | | | — | |
| Total assets | | | 515,246 | |
| Liabilities: | | | | |
| Unrealized depreciation on foreign currency contracts | | | 18 | |
| Payables: | | | | |
| Investment securities purchased | | | 5,727 | |
| Fund shares redeemed | | | 320 | |
| Investment management fees | | | 52 | |
| Distribution fees | | | 3 | |
| Accrued expenses | | | 128 | |
| Total liabilities | | | 6,248 | |
| Net assets | | $ | 508,998 | |
| Summary of Net Assets: | | | | |
| Capital stock and paid-in-capital | | $ | 407,888 | |
| Undistributed net investment income | | | 3,679 | |
| Accumulated net realized loss | | | (19,429 | ) |
| Unrealized appreciation of investments and the translations of assets and liabilities denominated in foreign currency | | | 116,860 | |
| Net assets | | $ | 508,998 | |
| Shares authorized | | | 3,400,000 | |
| Par value | | $ | 0.001 | |
| Class IA: Net asset value per share | | $ | 23.46 | |
| Shares outstanding | | | 17,453 | |
| Net assets | | $ | 409,381 | |
| Class IB: Net asset value per share | | $ | 23.26 | |
| Shares outstanding | | | 4,283 | |
| Net assets | | $ | 99,617 | |
The accompanying notes are an integral part of these financial statements.
Hartford Global Growth HLS Fund
Statement of Operations
For the Six-Month Period Ended June 30, 2014 (Unaudited)
(000’s Omitted)
| Investment Income: | | | | |
| Dividends | | $ | 3,664 | |
| Interest | | | 43 | |
| Less: Foreign tax withheld | | | (221 | ) |
| Total investment income, net | | | 3,486 | |
| | | | | |
| Expenses: | | | | |
| Investment management fees | | | 1,596 | |
| Transfer agent fees | | | 2 | |
| Distribution fees - Class IB | | | 96 | |
| Custodian fees | | | 8 | |
| Accounting services fees | | | 30 | |
| Board of Directors' fees | | | 6 | |
| Audit fees | | | 8 | |
| Other expenses | | | 68 | |
| Total expenses (before fees paid indirectly) | | | 1,814 | |
| Commission recapture | | | (1 | ) |
| Total fees paid indirectly | | | (1 | ) |
| Total expenses, net | | | 1,813 | |
| Net Investment Income | | | 1,673 | |
| | | | | |
| Net Realized Gain on Investments and Foreign Currency Transactions: | | | | |
| Net realized gain on investments | | | 40,872 | |
| Net realized gain on foreign currency contracts | | | 42 | |
| Net realized loss on other foreign currency transactions | | | (45 | ) |
| Net Realized Gain on Investments and Foreign Currency Transactions | | | 40,869 | |
| | | | | |
| Net Changes in Unrealized Depreciation of Investments and Foreign Currency Transactions: | | | | |
| Net unrealized depreciation of investments | | | (21,673 | ) |
| Net unrealized depreciation of foreign currency contracts | | | (19 | ) |
| Net unrealized appreciation on translation of other assets and liabilities in foreign currencies | | | 22 | |
| Net Changes in Unrealized Depreciation of Investments and Foreign Currency Transactions | | | (21,670 | ) |
| Net Gain on Investments and Foreign Currency Transactions | | | 19,199 | |
| Net Increase in Net Assets Resulting from Operations | | $ | 20,872 | |
The accompanying notes are an integral part of these financial statements.
Hartford Global Growth HLS Fund
Statement of Changes in Net Assets
(000’s Omitted)
| | | For the
Six-Month
Period Ended
June 30, 2014
(Unaudited) | | | For the
Year Ended
December 31,
2013 | |
| Operations: | | | | | | | | |
| Net investment income | | $ | 1,673 | | | $ | 2,153 | |
| Net realized gain on investments and foreign currency transactions | | | 40,869 | | | | 64,240 | |
| Net unrealized appreciation (depreciation) of investments and foreign currency transactions | | | (21,670 | ) | | | 62,249 | |
| Net Increase in Net Assets Resulting from Operations | | | 20,872 | | | | 128,642 | |
| Distributions to Shareholders: | | | | | | | | |
| From net investment income | | | | | | | | |
| Class IA | | | — | | | | (2,480 | ) |
| Class IB | | | — | | | | (371 | ) |
| Total distributions | | | — | | | | (2,851 | ) |
| Capital Share Transactions: | | | | | | | | |
| Class IA | | | | | | | | |
| Sold | | | 2,049 | | | | 16,538 | |
| Issued in merger | | | 60,232 | | | | — | |
| Issued on reinvestment of distributions | | | — | | | | 2,480 | |
| Redeemed | | | (30,183 | ) | | | (82,410 | ) |
| Total capital share transactions | | | 32,098 | | | | (63,392 | ) |
| Class IB | | | | | | | | |
| Sold | | | 850 | | | | 8,653 | |
| Issued in merger | | | 24,368 | | | | — | |
| Issued on reinvestment of distributions | | | — | | | | 371 | |
| Redeemed | | | (9,099 | ) | | | (30,109 | ) |
| Total capital share transactions | | | 16,119 | | | | (21,085 | ) |
| Net increase (decrease) from capital share transactions | | | 48,217 | | | | (84,477 | ) |
| Net Increase in Net Assets | | | 69,089 | | | | 41,314 | |
| Net Assets: | | | | | | | | |
| Beginning of period | | | 439,909 | | | | 398,595 | |
| End of period | | $ | 508,998 | | | $ | 439,909 | |
| Undistributed (distribution in excess of) net investment income | | $ | 3,679 | | | $ | 2,048 | |
| Shares: | | | | | | | | |
| Class IA | | | | | | | | |
| Sold | | | 197 | | | | 869 | |
| Issued in merger | | | 2,474 | | | | — | |
| Issued on reinvestment of distributions | | | — | | | | 125 | |
| Redeemed | | | (1,347 | ) | | | (4,338 | ) |
| Total share activity | | | 1,324 | | | | (3,344 | ) |
| Class IB | | | | | | | | |
| Sold | | | 38 | | | | 458 | |
| Issued in merger | | | 1,053 | | | | — | |
| Issued on reinvestment of distributions | | | — | | | | 19 | |
| Redeemed | | | (410 | ) | | | (1,589 | ) |
| Total share activity | | | 681 | | | | (1,112 | ) |
The accompanying notes are an integral part of these financial statements.
Hartford Global Growth HLS Fund
Notes to Financial Statements
June 30, 2014 (Unaudited)
(000’s Omitted)
Organization:
Hartford Global Growth HLS Fund (the "Fund") serves as an underlying investment option for certain variable annuity and variable life insurance separate accounts of Hartford Life Insurance Company (“HLIC”) and its affiliates and certain qualified retirement plans. The Fund may also serve as an underlying investment option for certain variable annuity and variable life separate accounts of other insurance companies. Owners of variable annuity contracts and policyholders of variable life insurance contracts may choose the funds permitted in the variable insurance contract prospectus. In addition, participants in certain qualified retirement plans may choose the Fund if permitted by their plans.
Hartford Series Fund, Inc. (the “Company”) is an open-end registered management investment company comprised of twenty-eight portfolios. Financial statements for the Fund, a series of the Company, are included in this report.
The Company is organized under the laws of the State of Maryland and is registered with the Securities and Exchange Commission (“SEC”) under the Investment Company Act of 1940, as amended (“1940 Act”). The Fund is a diversified open-end management investment company.
The Fund is divided into Class IA, Class IB and Class IC shares. Each class is offered at the per share net asset value (“NAV”) without a sales charge and is subject to the same expenses, except that the Class IB shares are subject to distribution and service fees charged pursuant to a Distribution Plan adopted in accordance with Rule 12b-1 under the 1940 Act and Class IC shares are subject to distribution fees charged pursuant to a Distribution Plan adopted in accordance with Rule 12b-1 under the 1940 Act and are also subject to an administrative service fee. Class IC shares have not commenced operations and are not currently offered for sale as of the date of this report.
Significant Accounting Policies:
The following is a summary of significant accounting policies of the Fund in the preparation of its financial statements, which are in accordance with United States Generally Accepted Accounting Principles (“U.S. GAAP”). The preparation of financial statements in accordance with U.S. GAAP may require management to make estimates and assumptions that affect the reported amounts of assets and liabilities and disclosure of contingent assets and liabilities at the date of the financial statements and the reported amounts of increases and decreases in net assets from operations during the reporting period. Actual results could differ from those estimates.
Determination of Net Asset Value – The NAV of each class of the Fund's shares is determined as of the close of regular trading (normally 4:00 p.m. Eastern Time) (the “NYSE Close”) on each day that the New York Stock Exchange (the “Exchange”) is open (“Valuation Date”). Information that becomes known to the Fund after the NAV has been calculated on a particular day will not generally be used to retroactively adjust the NAV determined earlier that day.
Investment Valuation and Fair Value Measurements – For purposes of calculating the NAV, portfolio investments and other assets held by the Fund's portfolio for which market quotes are readily available are valued at market value. Market value is generally determined on the basis of last reported sales prices or official close price. If no sales are reported, market value is based on quotes obtained from a quotation reporting system, established market makers, or independent pricing services. If market prices are not readily available or are deemed unreliable, the Fund will use the fair value of the investment as determined in good faith under policies and procedures established by and under the supervision of the Company's Board of Directors. Market quotes are considered not readily available where there is an absence of current or reliable market-based data (e.g., trade information or indicative market quotes), including where events occur after the close of the relevant market, but prior to the NYSE Close, that materially affect the values of the Fund's portfolio investments or assets. In addition, market quotes are considered not readily available when, due to extraordinary circumstances, the exchanges or markets on which the investments trade do not open for trading for the entire day and no other market prices are available. In addition, prices of foreign equities that are principally traded on certain foreign markets may be adjusted daily pursuant to a fair value pricing service approved by the Board of Directors in order to reflect an adjustment for the factors occurring after the close of certain foreign markets but before the NYSE Close. Investments that are primarily traded on foreign markets may trade on days that are not business days of the Fund. The value of the foreign investments in which the Fund invests may change on days when a shareholder will not be able to purchase or redeem shares of the Fund. Fair value pricing is subjective in nature and the use of fair value pricing by the Fund may cause the NAV of its shares to differ significantly from the NAV
Hartford Global Growth HLS Fund
Notes to Financial Statements – (continued)
June 30, 2014 (Unaudited)
(000’s Omitted)
that would have been calculated using market prices at the close of the exchange on which a portfolio investment is primarily traded. There can be no assurance that the Fund could obtain the fair market value assigned to an investment if the Fund were to sell the investment at approximately the time at which the Fund determines its NAV.
Investments valued in currencies other than U.S. dollars are converted to U.S. dollars using exchange rates obtained from independent pricing services for calculation of the NAV. As a result, the NAV of the Fund’s shares may be affected by changes in the value of currencies in relation to the U.S. dollar. The value of investments traded in markets outside the United States or denominated in currencies other than the U.S. dollar may be affected significantly on a day that the NYSE is closed and the market value may change on days when an investor is not able to purchase, redeem or exchange shares of the Fund.
Foreign currency contracts represent agreements to exchange currencies on specific future dates at predetermined rates. Foreign currency contracts are valued using foreign currency exchange rates and forward rates as provided by an independent pricing service on the Valuation Date.
Financial instruments for which prices are not available from an independent pricing service may be valued using market quotations obtained from one or more dealers that make markets in the respective financial instrument in accordance with procedures established by the Company's Board of Directors.
U.S. GAAP defines fair value as the price that the Fund would receive to sell an asset or pay to transfer a liability in an orderly transaction between market participants. The U.S. GAAP fair value measurement standards require disclosure of a fair value hierarchy for each major category of assets and liabilities. Various inputs are used in determining the fair value of the Fund’s investments. These inputs are summarized into three broad hierarchy levels. This hierarchy is based on whether the valuation inputs are observable or unobservable. These levels are:
Level 1 – Quoted prices in active markets for identical investments. Level 1 may include exchange traded instruments, such as domestic equities, some foreign equities, options, futures, mutual funds, exchange traded funds, rights and warrants.
Level 2 – Observable inputs other than Level 1 prices, such as quoted prices for similar investments; quoted prices in markets that are not active; or other inputs that are observable or can be corroborated by observable market data. Level 2 may include debt investments that are traded less frequently than exchange traded instruments and which are valued using independent pricing services; foreign equities, which are principally traded on certain foreign markets and are adjusted daily pursuant to a fair value pricing service in order to reflect an adjustment for the factors occurring after the close of certain foreign markets but before the NYSE Close; senior floating rate interests, which are valued using an aggregate of dealer bids; short-term investments, which are valued at amortized cost; and swaps, which are valued based upon the terms of each swap contract.
Level 3 – Significant unobservable inputs that are supported by limited or no market activity. Level 3 may include financial instruments whose values are determined using indicative market quotes or require significant management judgment or estimation. These unobservable valuation inputs may include estimates for current yields, maturity/duration, prepayment speed, and indicative market quotes for comparable investments along with other assumptions relating to credit quality, collateral value, complexity of the investment structure, general market conditions and liquidity. This category may include investments where trading has been halted or there are certain restrictions on trading. While these investments are priced using unobservable inputs, the valuation of these investments reflects the best available data and management believes the prices are a reasonable representation of exit price.
The Board of Directors of the Company generally reviews and approves the “Procedures for Valuation of Portfolio Securities” at least once a year. These procedures define how investments are to be valued, including the formation and activities of a Valuation Committee. The Valuation Committee is responsible for determining in good faith the fair value of investments when the value cannot be obtained from primary pricing services or alternative sources or if the valuation of an investment as provided by the primary pricing service or alternative source is believed not to reflect the investment’s fair value as of the Valuation Date. Voting members of the Valuation Committee include the Fund's Treasurer or designee and a Vice President of the investment manager or designee. An Assistant Vice President of the Fund with legal expertise or designee is also included on the Valuation Committee as a non-voting advisory member. In addition, the Fund’s Chief Compliance Officer shall designate a member of the
Hartford Global Growth HLS Fund
Notes to Financial Statements – (continued)
June 30, 2014 (Unaudited)
(000’s Omitted)
compliance group to attend Valuation Committee meetings as a non-voting resource, to monitor for and provide guidance with respect to compliance with these procedures. Two members of the Valuation Committee or their designees, representing different departments, shall constitute a quorum for purposes of permitting the Valuation Committee to take action. The Valuation Committee will consider all relevant factors in determining an investment’s fair value, and may seek the advice of the Fund’s sub-adviser, knowledgeable brokers, and legal counsel in making such determination. The Valuation Committee reports to the Audit Committee of the Company's Board of Directors. The Audit Committee receives quarterly written reports which include details of all fair-valued investments, including the reason for the fair valuation, and an indication, when possible, of the accuracy of the valuation by disclosing the next available reliable public price quotation or the disposition price of such investments (the “look-back” test). The Board of Directors then must consider for ratification all of the fair value determinations made during the previous quarter.
Valuation levels are not necessarily indicative of the risk associated with investing in such investments. Individual investments within any of the above mentioned asset classes may be assigned a different hierarchical level than those presented above, as individual circumstances dictate.
For additional information, refer to the Investment Valuation Hierarchy Level Summary and the Level 3 roll-forward reconciliation, if applicable, which follow the Schedule of Investments.
Investment Transactions and Investment Income – Investment transactions are recorded as of the trade date (the date the order to buy or sell is executed) for financial reporting purposes. Investments purchased or sold on a when-issued or delayed-delivery basis may be settled a month or more after the trade date. Realized gains and losses are determined on the basis of identified cost.
Dividend income from domestic securities is accrued on the ex-dividend date. In general, dividend income from foreign securities is recorded on the ex-date; however, dividend notifications in certain foreign jurisdictions may not be available in a timely manner and as a result, the Fund will record the dividend as soon as the relevant details (i.e., rate per share, payment date, shareholders of record, etc.) are publicly available. Interest income, including amortization of premium, accretion of discounts and additional principal received in-kind in lieu of cash, is accrued on a daily basis.
Foreign Currency Transactions – Assets and liabilities denominated in currencies other than U.S. dollars are translated into U.S. dollars at the exchange rates in effect on the valuation date. Purchases and sales of investments, income and expenses are translated into U.S. dollars at the exchange rates on the dates of such transactions.
The Fund does not isolate that portion of portfolio investment valuation resulting from fluctuations in the foreign currency exchange rates from the fluctuations arising from changes in the market prices of investments held. Exchange rate fluctuations are included with the net realized and unrealized gain or loss on investments in the accompanying financial statements.
Net realized foreign exchange gains or losses arise from sales of foreign currencies and the difference between asset and liability amounts initially stated in foreign currencies and the U.S. dollar value of the amounts actually received or paid. Net unrealized foreign exchange gains or losses arise from changes in the value of other assets and liabilities at the end of the reporting period, resulting from changes in the exchange rates.
Joint Trading Account – The Fund may invest cash balances into a joint trading account that may be invested in one or more repurchase agreements.
Fund Share Valuation and Dividend Distributions to Shareholders – Orders for the Fund’s shares are executed in accordance with the investment instructions of the contract holders and plan participants. The NAV of the Fund’s shares is determined as of the close of business on each business day of the Exchange. The NAV is determined separately for each class of shares of the Fund by dividing the Fund’s net assets attributable to that class by the number of shares of the class outstanding. Each class of shares offered by the Fund has equal rights as to assets and voting privileges (except that shareholders of a class have exclusive voting rights regarding any matter relating solely to that class of shares). Income and non-class specific expenses are allocated daily to each class on the basis of the relative net assets of the class. Realized and unrealized gains and losses are allocated daily based on the relative net assets of each class of shares of the Fund.
Hartford Global Growth HLS Fund
Notes to Financial Statements – (continued)
June 30, 2014 (Unaudited)
(000’s Omitted)
Orders for the purchase of the Fund’s shares received prior to the close of the Exchange on any day the Exchange is open for business are priced at the NAV determined as of the close of the Exchange. Orders received after the close of the Exchange, or on a day on which the Exchange and/or the Fund is not open for business, are priced at the next determined NAV.
Dividends are declared pursuant to a policy adopted by the Company's Board of Directors based upon the investment performance of the Fund. The policy of the Fund is to pay dividends from net investment income and realized gains, if any, at least once a year.
Distributions from net investment income, net realized gains and capital are determined in accordance with federal income tax regulations, which may differ from U.S. GAAP with respect to character and timing. These differences may include, but are not limited to, losses deferred due to wash sale adjustments, foreign currency gains and losses, adjustments related to Passive Foreign Investment Companies ("PFICs"), Real Estate Investment Trusts ("REITs"), Regulated Investment Companies ("RICs"), certain derivatives and partnerships. Permanent book and federal income tax basis differences relating to shareholder distributions will result in reclassifications to certain of the Fund’s capital accounts (see Federal Income Taxes: Reclassification of Capital Accounts note).
Securities and Other Investments:
Repurchase Agreements – A repurchase agreement is an agreement by which a counterparty agrees to sell an investment and agrees to repurchase the investment sold from the buyer at a mutually agreed upon time and price. During the period of the repurchase agreement, the counterparty will deposit cash and or securities in a third party custodial account to serve as collateral. At the time the Fund enters into a repurchase agreement, the value of the underlying collateral, including accrued interest, will be equal to or exceed the value of the repurchase agreement. Repurchase agreements expose the Fund to counterparty risk - that is, the risk that the counterparty will not fulfill its obligations. To minimize counterparty risk, the investments that serve to collateralize the repurchase agreement are held by the Fund’s custodian in book entry or physical form in the custodial account of the Fund or in a third party custodial account. Repurchase agreements are valued at cost plus accrued interest, which approximates fair value. Repurchase agreements have master netting arrangements which allow the Fund to offset amounts owed to a counterparty with amounts owed by the counterparty, including any collateral. Upon an event of default under a master repurchase agreement, the non-defaulting party may close out all transactions traded under such agreement and net amounts owed under each transaction to one net amount payable by one party to the other. Absent an event of default, the master repurchase agreement does not result in an offset of reported amounts of assets and liabilities in the Statement of Assets and Liabilities across transactions between the Fund and the applicable counterparty. The Fund, as shown on the Schedule of Investments, had outstanding repurchase agreements and related collateral as of June 30, 2014.
Investments Purchased on a When-Issued or Delayed-Delivery Basis – Delivery and payment for investments that have been purchased by the Fund on a forward commitment, or when-issued or delayed-delivery basis, take place beyond the customary settlement period. The Fund may dispose of or renegotiate a delayed-delivery transaction after it is entered into, and may sell delayed-delivery investments before they are delivered, which may result in a realized gain or loss. During this period, such investments are subject to market fluctuations, and the Fund identifies investments segregated in its records with a value at least equal to the amount of the commitment. The Fund, as shown on the Schedule of Investments, had when-issued or delayed-delivery investments as of June 30, 2014.
Financial Derivative Instruments:
The following disclosures contain information on how and why the Fund uses derivative instruments, the credit-risk-related contingent features in certain derivative instruments, and how derivative instruments affect the Fund’s financial position and results of operations. The location and fair value amounts of these instruments on the Statement of Assets and Liabilities and the realized gains and losses and changes in unrealized gains and losses on the Statement of Operations, each categorized by type of derivative contract, are included in the following Additional Derivative Instrument Information footnote. The derivative instruments outstanding as of period-end are disclosed in the notes to or within the Schedule of Investments for purchased options, if applicable. The amounts of realized gains and losses and changes in unrealized gains and losses on derivative instruments during the period are disclosed in the Statement of Operations.
Foreign Currency Contracts – The Fund may enter into foreign currency contracts that obligate the Fund to purchase or sell currencies at specified future dates. Foreign currency contracts are used to hedge the currency exposure associated with some or all
Hartford Global Growth HLS Fund
Notes to Financial Statements – (continued)
June 30, 2014 (Unaudited)
(000’s Omitted)
of the Fund’s investments and/or as part of an investment strategy. Foreign currency contracts are marked to market daily and the change in value is recorded by the Fund as an unrealized gain or loss. The Fund will record a realized gain or loss when the foreign currency contract is settled.
Foreign currency contracts involve elements of market risk in excess of the amounts reflected in the Statement of Assets and Liabilities. In addition, risks may arise upon entering into these contracts from the potential inability of the counterparties to meet the terms of the contracts and from unanticipated movements in the value of the foreign currencies relative to the U.S. dollar. The Fund, as shown on the Schedule of Investments, had outstanding foreign currency contracts as of June 30, 2014.
Additional Derivative Instrument Information:
| Fair Value of Derivative Instruments on the Statement of Assets and Liabilities as of June 30, 2014: |
| | | Risk Exposure Category | |
| | | Interest Rate
Contracts | | | Foreign Exchange Contracts | | | Credit Contracts | | | Equity
Contracts | | | Commodity
Contracts | | | Other Contracts | | | Total | |
| | | | | | | | | | | | | | | | | | | | | | |
| Liabilities: | | | | | | | | | | | | | | | | | | | | | | | | | | | | |
| Unrealized depreciation on foreign currency contracts | | $ | — | | | $ | 18 | | | $ | — | | | $ | — | | | $ | — | | | $ | — | | | $ | 18 | |
| Total | | $ | — | | | $ | 18 | | | $ | — | | | $ | — | | | $ | — | | | $ | — | | | $ | 18 | |
The volume of derivatives that is presented in the Schedule of Investments is consistent with the derivative activity during the six-month period ended June 30, 2014.
| The Effect of Derivative Instruments on the Statement of Operations for the six-month period ended June 30, 2014: |
| | | Risk Exposure Category | |
| | | Interest Rate
Contracts | | | Foreign
Exchange
Contracts | | | Credit
Contracts | | | Equity
Contracts | | | Commodity
Contracts | | | Other
Contracts | | | Total | |
| Realized Gain on Derivatives Recognized as a Result of Operations: |
| Net realized gain on foreign currency contracts | | $ | — | | | $ | 42 | | | $ | — | | | $ | — | | | $ | — | | | $ | — | | | $ | 42 | |
| Total | | $ | — | | | $ | 42 | | | $ | — | | | $ | — | | | $ | — | | | $ | — | | | $ | 42 | |
| | | | | | | | | | | | | | | | | | | | | | | | | | | | | |
| Net Change in Unrealized Appreciation (Depreciation) on Derivatives Recognized as a Result of Operations: |
| Net change in unrealized depreciation of foreign currency contracts | | $ | — | | | $ | (19 | ) | | $ | — | | | $ | — | | | $ | — | | | $ | — | | | $ | (19 | ) |
| Total | | $ | — | | | $ | (19 | ) | | $ | — | | | $ | — | | | $ | — | | | $ | — | | | $ | (19 | ) |
The derivatives held by the Fund as of June 30, 2014 are not subject to a master netting arrangement; therefore, no balance sheet offsetting disclosure is presented.
Principal Risks:
The Fund may be exposed to counterparty risk, or the risk that an institution or other entity with which the Fund has unsettled or open transactions will default.
If the Fund invests directly in foreign currencies or in securities that trade in, and receive revenues in, foreign currencies, or in derivatives that provide exposure to foreign currencies, it will be subject to the risk that those currencies will decline in value relative to the base currency (U.S. dollars) of the Fund, or, in the case of hedging positions, that the Fund’s base currency will decline in value relative to the currency being hedged. Currency rates in foreign countries may fluctuate significantly over short periods of time for a number of reasons, including changes in interest rates, intervention (or the failure to intervene) by U.S. or foreign governments, central banks or supranational entities, such as the International Monetary Fund, or by the imposition of currency controls or other political developments in the United States or abroad. As a result, the Fund’s investments in foreign currency denominated securities may reduce the returns of the Fund. The market values of equity securities, such as common stocks and preferred stocks, or equity
Hartford Global Growth HLS Fund
Notes to Financial Statements – (continued)
June 30, 2014 (Unaudited)
(000’s Omitted)
related investments, such as futures and options, may decline due to general market conditions which are not specifically related to a particular company, such as real or perceived adverse economic conditions, changes in the general outlook for corporate earnings, changes in interest or currency rates or adverse investor sentiment generally. The market value of equity securities may also decline due to factors which affect a particular industry or industries, such as labor shortages or increased production costs and competitive conditions within an industry. Equity securities and equity related investments generally have greater market price volatility than fixed income securities.
Federal Income Taxes:
Federal Income Taxes – For federal income tax purposes, the Fund intends to continue to qualify as a RIC under Subchapter M of the Internal Revenue Code (“IRC”) by distributing substantially all of its taxable net investment income and net realized capital gains to its shareholders and otherwise complying with the requirements of the IRC. The Fund has distributed substantially all of its income and capital gains in prior years, if applicable, and intends to distribute substantially all of its income and capital gains prior to the next fiscal year-end. Accordingly, no provision for federal income or excise taxes has been made in the accompanying financial statements. Distributions from short-term capital gains are treated as ordinary income distributions for federal income tax purposes.
Net Investment Income (Loss), Net Realized Gains (Losses) and Distributions – Net investment income (loss) and net realized gains (losses) may differ for financial statement and tax purposes primarily because of losses deferred due to wash sale adjustments, foreign currency gains and losses, adjustments related to PFICs, REITs, RICs, certain derivatives and partnerships. The character of distributions made during the year from net investment income or net realized gains may differ from their ultimate characterization for federal income tax purposes. Also, due to the timing of dividend distributions, the fiscal year in which amounts are distributed may differ from the year that the income or realized gains (losses) were recorded by the Fund.
Distributions and Components of Distributable Earnings – The tax character of distributions paid by the Fund for the periods indicated is as follows (as adjusted for dividends payable, if applicable):
| | | For the Year Ended
December 31, 2013 | | | For the Year Ended
December 31, 2012 | |
| Ordinary Income | | $ | 2,851 | | | $ | 2,204 | |
As of December 31, 2013, the Fund’s components of distributable earnings (deficit) on a tax basis are as follows:
| | | Amount | |
| Undistributed Ordinary Income | | $ | 2,048 | |
| Accumulated Capital and Other Losses* | | | (58,773 | ) |
| Unrealized Appreciation† | | | 123,712 | |
| Total Accumulated Earnings | | $ | 66,987 | |
| * | The Fund has capital loss carryforwards that are identified in the Capital Loss Carryforward note that follows. |
| † | Differences between book-basis and tax-basis unrealized appreciation (depreciation) may be attributable to the losses deferred due to wash sale adjustments, foreign currency gains and losses, adjustments related to PFICs, REITs, RICs, certain derivatives and partnerships. |
Hartford Global Growth HLS Fund
Notes to Financial Statements – (continued)
June 30, 2014 (Unaudited)
(000’s Omitted)
Reclassification of Capital Accounts – The Fund may record reclassifications in its capital accounts. These reclassifications have no impact on the total net assets of the Fund. The reclassifications are a result of permanent differences between U.S. GAAP and tax accounting for such items as foreign currency, PFICs, expiration or utilization of capital loss carryforwards or net operating losses. Adjustments are made to reflect the impact these items have on current and future distributions to shareholders. Therefore, the source of the Fund’s distributions may be shown in the accompanying Statement of Changes in Net Assets as from undistributed net investment income, from accumulated net realized gains on investments or from capital depending on the type of book and tax differences that exist. For the year ended December 31, 2013, the Fund recorded reclassifications to increase (decrease) the accounts listed below:
| | | Amount | |
| Undistributed Net Investment Income (Loss) | | $ | (104 | ) |
| Accumulated Net Realized Gain (Loss) | | | 104 | |
Capital Loss Carryforward – On December 22, 2010, the Regulated Investment Company Modernization Act of 2010 (the “Act”) was enacted, which made changes to the capital loss carryforward rules. The changes are effective for taxable years beginning after the date of enactment. Under the Act, funds are permitted to carry forward capital losses for an unlimited period. However, any losses incurred during those future taxable years will be required to be utilized prior to the losses incurred in pre-enactment taxable years, which carry an expiration date. As a result of this ordering rule, pre-enactment capital loss carryforwards may be more likely to expire unused. Additionally, post-enactment capital loss carryforwards retain their character as either short-term or long-term capital losses rather than being considered all short-term as permitted under prior regulation.
At December 31, 2013 (tax year end), the Fund had capital loss carryforwards for U.S. federal income tax purposes as follows:
| Year of Expiration | | Amount | |
| 2017 | | $ | 58,773 | |
| Total | | $ | 58,773 | |
During the year ended December 31, 2013, the Fund utilized $63,706 of prior year capital loss carryforwards.
Accounting for Uncertainty in Income Taxes – The Fund has adopted financial reporting rules that require the Fund to analyze all open tax years, as defined by the statute of limitations, for all major jurisdictions. Generally, tax authorities can examine all tax returns filed for the last three years. The Fund does not have an examination in progress.
The Fund has reviewed all open tax years and major jurisdictions and concluded that these financial reporting rules had no effect on the Fund’s financial position or results of operations. There is no tax liability resulting from unrecognized tax benefits relating to uncertain income tax positions taken or expected to be taken on the tax return for the fiscal year ended December 31, 2013. The Fund is also not aware of any tax positions for which it is reasonably possible that the total amounts of unrecognized tax benefits will significantly change in the next twelve months.
Expenses:
Investment Management Agreement – Hartford Funds Management Company, LLC ("HFMC") serves as the Fund’s investment manager pursuant to an Investment Management Agreement with the Company. HFMC is an indirect wholly owned subsidiary of The Hartford Financial Services Group, Inc. ("The Hartford"). The investment manager has overall investment supervisory responsibility for the Fund. In addition, the investment manager provides administrative personnel, services, equipment, facilities and office space for proper operation of the Fund. HFMC has contracted with Wellington Management Company, LLP ("Wellington Management") under a sub-advisory agreement for the provision of day-to-day investment management services to the Fund in accordance with the Fund’s investment objective and policies. The Fund pays a fee to the investment manager, a portion of which may be used to compensate Wellington Management.
Hartford Global Growth HLS Fund
Notes to Financial Statements – (continued)
June 30, 2014 (Unaudited)
(000’s Omitted)
The schedule below reflects the rates of compensation paid to the investment manager for investment management services rendered as of June 30, 2014; the rates are accrued daily and paid monthly:
| Average Daily Net Assets | Annual Fee |
| On first $250 million | 0.7750% |
| On next $250 million | 0.7250% |
| On next $500 million | 0.6750% |
| On next $4 billion | 0.6250% |
| On next $5 billion | 0.6225% |
| Over $10 billion | 0.6200% |
Accounting Services Agreement – Pursuant to the Fund Accounting Agreement between HFMC and the Company, on behalf of the Fund, HFMC provides accounting services to the Fund and receives monthly compensation based on the Fund’s average daily net assets at the rates set forth below. The Fund’s accounting services fees are accrued daily and paid monthly.
| Average Daily Net Assets | Annual Fee |
| On first $5 billion | 0.014% |
| On next $5 billion | 0.012% |
| Over $10 billion | 0.010% |
Operating Expenses – Allocable expenses incurred by the Company are allocated to each Fund and allocated to classes within a Fund in proportion to the average daily net assets of the Fund and each class, except where allocation of certain expenses is more fairly made directly to the Fund or to specific classes within a Fund.
Fees Paid Indirectly – The Company, on behalf of the Fund, has entered into agreements with State Street Global Markets, LLC and Russell Implementation Services, Inc. to partially recapture non-discounted trade commissions. Such rebates are used to pay a portion of the Fund's expenses. For the six-month period ended June 30, 2014, this amount, if any, is included in the Statement of Operations.
The ratio of expenses to average net assets in the accompanying financial highlights excludes the reduction in expenses related to fees paid indirectly. The annualized expense ratio after waivers for the period listed below reflecting the reduction for fees paid indirectly is as follows:
| | | Annualized Six-
Month Period Ended
June 30, 2014 | |
| Class IA | | | 0.81% | |
| Class IB | | | 1.06 | |
Distribution Plan for Class IB Shares – Hartford Funds Distributors, LLC (“HFD”), an indirect wholly owned subsidiary of The Hartford, is the principal underwriter and distributor of the Fund. The Company, on behalf of the Fund, has adopted a Distribution Plan pursuant to Rule 12b-1 of the 1940 Act for Class IB shares.
The Distribution Plan provides that the Fund may pay annually up to 0.25% of the average daily net assets of the Fund attributable to its Class IB shares for activities primarily intended to result in the sale of Class IB shares. The Board has the authority to suspend or reduce these payments at any point in time. Under the terms of the Distribution Plan and the principal underwriting agreement, the Fund is authorized to make payments monthly to the distributor that may be used to pay or reimburse entities providing distribution and shareholder servicing with respect to the Class IB shares for such entities’ fees or expenses incurred or paid in that regard. The distribution fee paid during the period can be found on the Statement of Operations. These fees are accrued daily and paid monthly.
Hartford Global Growth HLS Fund
Notes to Financial Statements – (continued)
June 30, 2014 (Unaudited)
(000’s Omitted)
Other Related Party Transactions – Hartford Administrative Services Company (“HASCO”), an indirect wholly owned subsidiary of The Hartford, provides transfer agent services to the Fund. HASCO was compensated on a per account basis for providing such services. The amount paid to HASCO can be found in the Statement of Operations. These fees are accrued daily and paid monthly.
Payment from Affiliate – In July of 2007, The Hartford entered into a settlement with the Attorneys General of the states of New York, Connecticut and Illinois relating to market timing and the company's individual variable annuity contracts in which certain payments would be made directly to the variable annuity contract holders. The distribution plan provided that unclaimed money from the settlement would be distributed to certain HLS Funds that are investment options through a Hartford individual variable annuity contract. The unclaimed money was distributed to the Fund on September 18, 2009.
The total return in the accompanying financial highlights includes a payment from an affiliate. Had the payment from the affiliate been excluded, the impact and total return for the period listed below would have been as follows:
| | | For the Year Ended December 31, 2009 | |
| | | Class IA | | | Class IB | |
| Impact from Payment from Affiliate for Attorneys General Settlement | | | 0.04% | | | | 0.04% | |
| Total Return Excluding Payment from Affiliate | | | 35.59% | | | | 35.26% | |
Investment Transactions:
For the six-month period ended June 30, 2014, the cost of purchases and proceeds from sales of investment securities (excluding short-term investments) were as follows:
| | | Excluding U.S.
Government
Obligations | | | U.S.
Government
Obligations | | | Total | |
| Cost of Purchases | | $ | 258,027 | | | $ | — | | | $ | 258,027 | |
| Sales Proceeds | | | 225,293 | | | | — | | | | 225,293 | |
Line of Credit:
The Fund is one of several Hartford Funds that participate in a $500 million committed revolving line of credit facility. The facility is to be used for temporary or emergency purposes. Under the arrangement, the funds are required to own securities having a market value in excess of 300% of the total bank borrowings. The interest rate on borrowings varies depending on the nature of the loan. The facility also requires a fee to be paid based on the amount of the commitment. This commitment fee is allocated to all the funds participating in the line of credit based on the average net assets of the funds. During the six-month period ended June 30, 2014, the Fund did not have any borrowings under this facility.
Fund Merger:
Reorganization of Hartford Global Research HLS Fund into the Fund: At a meeting held on February 5, 2014, the Board of Directors of Hartford Series Fund, Inc. approved an Agreement and Plan of Reorganization providing for the acquisition of all the assets and liabilities of Hartford Global Research HLS Fund (“Target Fund”) by the Fund (“Acquiring Fund”).
Under the terms of the Agreement and Plan of Reorganization, the assets and liabilities of the Target Fund were acquired by the Fund immediately before the opening of business on June 23, 2014. The Fund acquired the assets and liabilities of the Target Fund in exchange for shares in the Fund, which were distributed pro rata by the Target Fund to shareholders, in complete liquidation of the Target Fund.
Hartford Global Growth HLS Fund
Notes to Financial Statements – (continued)
June 30, 2014 (Unaudited)
(000’s Omitted)
This merger was accomplished by tax free exchange as detailed below:
| | | Net assets of Target
Fund on June 20,
2014 | | | Net assets of
Acquiring Fund
immediately before
merger | | | Net assets of
Acquiring Fund
immediately after
merger | | | Target Fund shares
exchanged | | | Acquiring Fund
shares issued to the
Target Fund's
shareholders | |
| | | | | | | | | | | | | | | | |
| Class IA | | $ | 60,232 | | | $ | 349,166 | | | $ | 409,398 | | | | 4,416 | | | | 2,474 | |
| Class IB | | | 24,368 | | | | 75,419 | | | | 99,787 | | | | 1,789 | | | | 1,053 | |
| Total | | $ | 84,600 | | | $ | 424,585 | | | $ | 509,185 | | | | 6,205 | | | | 3,527 | |
The Target Fund had the following unrealized appreciation, accumulated net realized losses and capital stock as of June 20, 2014:
| Fund | | Undistributed
Income | | | Unrealized
Appreciation
(Depreciation) | | | Accumulated
Net Realized
Gains (Losses) | | | Capital Stock | | | Total | |
| Target Fund | | $ | (42 | ) | | $ | 13,775 | | | $ | (482 | ) | | $ | 71,349 | | | $ | 84,600 | |
Assuming the acquisition had been completed on January 1, 2014, the beginning of the annual reporting period of the Funds, the Fund’s pro forma results of operations for the six-month period ended June 30, 2014, are as follows:
| Fund | | Net Investment Income | | | Net Gain on Investments | | | Net Increase in Net Assets
Resulting From Operations | |
| Acquiring Fund | | $ | 2,228 | | | $ | 27,473 | | | $ | 29,701 | |
Because the combined investment portfolios have been managed as a single integrated portfolio since the acquisition was completed, it is not practical to separate the amounts of revenue and earnings of the Target Fund that have been included in the Fund’s Statement of Operations since the merger date.
Industry Classifications:
Other than the industry classifications "Other Investment Pools and Funds" and "Exchange Traded Funds," equity industry classifications used in this report are the Global Industry Classification Standard, which was developed by and is the exclusive property and service mark of MSCI, Inc. and Standard & Poor's.
Indemnifications:
Under the Company's organizational documents, the Company shall indemnify its officers and directors to the full extent required or permitted under Maryland General Corporation Law and the federal securities laws. In addition, the Company, on behalf of the Fund, may enter into contracts that contain a variety of indemnifications. The Company's maximum exposure under these arrangements is unknown. However, as of the date of these financial statements, the Company has not had prior claims or losses pursuant to these contracts and expects the risk of loss to be remote.
Pending Legal Proceedings:
On February 25, 2011, Jennifer L. Kasilag, Louis Mellinger, Judith M. Menendez, Jacqueline M. Robinson, and Linda A. Russell filed a derivative lawsuit against Hartford Investment Financial Services, LLC (“HIFSCO”) (now known as Hartford Funds Distributors, LLC) on behalf of six Hartford retail mutual funds in the United States District Court for the District of New Jersey, alleging that HIFSCO received excessive advisory and distribution fees in violation of its statutory fiduciary duty under Section 36(b) of the 1940 Act when serving as investment manager and principal underwriter, respectively, to the Hartford retail mutual funds. Although this action was purportedly filed on behalf of certain of the Hartford Funds, none of the Hartford Funds is itself a defendant to the suit. HIFSCO moved to dismiss and, in
Hartford Global Growth HLS Fund
Notes to Financial Statements – (continued)
June 30, 2014 (Unaudited)
(000’s Omitted)
September 2011, the motion was granted in part and denied in part, with leave to amend the complaint. In November 2011, plaintiffs filed an amended complaint on behalf of certain Hartford retail mutual funds, The Hartford Global Health Fund (now known as The Hartford Healthcare Fund), The Hartford Conservative Allocation Fund, The Hartford Growth Opportunities Fund, The Hartford Inflation Plus Fund, The Hartford Advisers Fund (now known as The Hartford Balanced Fund), and The Hartford Capital Appreciation Fund. Plaintiffs seek to rescind the investment management agreements and distribution plans between HIFSCO and these funds and to recover the total fees charged thereunder or, in the alternative, to recover any improper compensation HIFSCO received, in addition to lost earnings. HIFSCO filed a partial motion to dismiss the amended complaint and, in December 2012, the court dismissed without prejudice the claims regarding distribution fees and denied the motion with respect to the advisory fees claims. HIFSCO disputes the allegations and intends to defend vigorously.
In March 2014, the plaintiffs filed a new complaint that added as new plaintiffs The Hartford Floating Rate Fund and The Hartford Small Company Fund and named as a defendant Hartford Funds Management Company, LLC (the “Investment Manager”), which assumed the role as investment adviser to the funds as of January 2013. The Investment Manager and HIFSCO dispute the allegations and intend to defend vigorously.
This action concerns the activities of HIFSCO in its capacity as investment manager and principal underwriter to the Hartford retail mutual funds and does not concern HIFSCO’s activities in its capacity as principal underwriter to the HLS funds. For this reason, no accrual for litigation relating to this matter has been recorded in the financial statements of the Fund.
Hartford Global Growth HLS Fund
Financial Highlights
| | | ─Selected Per-Share Data(A) ─ | | | ─Ratios and Supplemental Data ─ | |
Class
| | Net Asset
Value at
Beginning
of Period | | | Net
Investment
Income
(Loss) | | | Net
Realized
and
Unrealized
Gain (Loss)
on
Investments | | | Total from
Investment
Operations | | | Dividends
from Net
Investment
Income | | | Distributions
from
Realized
Capital
Gains | | | Total
Dividends
and
Distributions | | | Net
Asset
Value at
End of
Period | | | Total
Return(B) | | | Net
Assets
at End of
Period
(000s) | | | Ratio of
Expenses
to
Average
Net
Assets
Before
Adjust-
ments(C) | | | Ratio of
Expenses
to
Average
Net
Assets
After
Adjust-
ments(C) | | | Ratio of
Net
Investment
Income
(Loss) to
Average
Net Assets | |
| | | | | | | | | | | | | | | | | | | | | | | | | | | | | | | | | | | | | | | | |
| For the Six-Month Period Ended June 30, 2014 (Unaudited) |
| IA | | $ | 22.33 | | | $ | 0.11 | | | $ | 1.02 | | | $ | 1.13 | | | $ | – | | | $ | – | | | $ | – | | | $ | 23.46 | | | | 5.06 | %(D) | | $ | 409,381 | | | | 0.81 | %(E) | | | 0.81 | %(E) | | | 1.01 | %(E) |
| IB | | | 22.16 | | | | (0.03 | ) | | | 1.13 | | | | 1.10 | | | | – | | | | – | | | | – | | | | 23.26 | | | | 4.96 | (D) | | | 99,617 | | | | 1.06 | (E) | | | 1.06 | (E) | | | (0.30 | )(E) |
| | | | | | | | | | | | | | | | | | | | | | | | | | | | | | | | | | | | | | | | | | | | | | | | | | | | | |
| For the Year Ended December 31, 2013 |
| IA | | $ | 16.50 | | | $ | 0.11 | | | $ | 5.86 | | | $ | 5.97 | | | $ | (0.14 | ) | | $ | – | | | $ | (0.14 | ) | | $ | 22.33 | | | | 36.30 | % | | $ | 360,086 | | | | 0.82 | % | | | 0.82 | % | | | 0.56 | % |
| IB | | | 16.38 | | | | 0.06 | | | | 5.81 | | | | 5.87 | | | | (0.09 | ) | | | – | | | | (0.09 | ) | | | 22.16 | | | | 35.90 | | | | 79,823 | | | | 1.07 | | | | 1.07 | | | | 0.32 | |
| | | | | | | | | | | | | | | | | | | | | | | | | | | | | | | | | | | | | | | | | | | | | | | | | | | | | |
| For the Year Ended December 31, 2012 (F) |
| IA | | $ | 13.45 | | | $ | 0.14 | | | $ | 3.00 | | | $ | 3.14 | | | $ | (0.09 | ) | | $ | – | | | $ | (0.09 | ) | | $ | 16.50 | | | | 23.41 | % | | $ | 321,371 | | | | 0.82 | % | | | 0.82 | % | | | 0.73 | % |
| IB | | | 13.34 | | | | 0.09 | | | | 2.99 | | | | 3.08 | | | | (0.04 | ) | | | – | | | | (0.04 | ) | | | 16.38 | | | | 23.10 | | | | 77,224 | | | | 1.07 | | | | 1.07 | | | | 0.47 | |
| | | | | | | | | | | | | | | | | | | | | | | | | | | | | | | | | | | | | | | | | | | | | | | | | | | | | |
| For the Year Ended December 31, 2011 (F) |
| IA | | $ | 15.62 | | | $ | 0.08 | | | $ | (2.24 | ) | | $ | (2.16 | ) | | $ | (0.01 | ) | | $ | – | | | $ | (0.01 | ) | | $ | 13.45 | | | | (13.89 | )% | | $ | 352,947 | | | | 0.80 | % | | | 0.80 | % | | | 0.46 | % |
| IB | | | 15.53 | | | | 0.04 | | | | (2.23 | ) | | | (2.19 | ) | | | – | | | | – | | | | – | | | | 13.34 | | | | (14.10 | ) | | | 82,204 | | | | 1.05 | | | | 1.05 | | | | 0.22 | |
| | | | | | | | | | | | | | | | | | | | | | | | | | | | | | | | | | | | | | | | | | | | | | | | | | | | | |
| For the Year Ended December 31, 2010 (F) |
| IA | | $ | 13.71 | | | $ | 0.04 | | | $ | 1.91 | | | $ | 1.95 | | | $ | (0.04 | ) | | $ | – | | | $ | (0.04 | ) | | $ | 15.62 | | | | 14.25 | % | | $ | 484,754 | | | | 0.81 | % | | | 0.81 | % | | | 0.28 | % |
| IB | | | 13.64 | | | | – | | | | 1.90 | | | | 1.90 | | | | (0.01 | ) | | | – | | | | (0.01 | ) | | | 15.53 | | | | 13.96 | | | | 118,824 | | | | 1.06 | | | | 1.06 | | | | 0.03 | |
| | | | | | | | | | | | | | | | | | | | | | | | | | | | | | | | | | | | | | | | | | | | | | | | | | | | | |
| For the Year Ended December 31, 2009 (F) |
| IA | | $ | 10.17 | | | $ | 0.08 | | | $ | 3.55 | | | $ | 3.63 | | | $ | (0.09 | ) | | $ | – | | | $ | (0.09 | ) | | $ | 13.71 | | | | 35.64 | %(G) | | $ | 488,720 | | | | 0.81 | % | | | 0.81 | % | | | 0.67 | % |
| IB | | | 10.12 | | | | 0.05 | | | | 3.53 | | | | 3.58 | | | | (0.06 | ) | | | – | | | | (0.06 | ) | | | 13.64 | | | | 35.31 | (G) | | | 126,320 | | | | 1.06 | | | | 1.06 | | | | 0.42 | |
| (A) | Information presented relates to a share outstanding throughout the indicated period. Net investment income (loss) per share amounts are calculated based on average shares outstanding unless otherwise noted. |
| (B) | The figures do not include sales charges or other fees which may be applied at the variable life insurance, variable annuity or qualified retirement plan product level. Any such additional sales charges or other fees would lower the Fund's performance. |
| (C) | Adjustments include waivers and reimbursements, if applicable. Ratios do not include fees paid indirectly (see Expenses in the accompanying Notes to Financial Statements). |
| (F) | Net investment income (loss) per share amounts have been calculated using the SEC method. |
| (G) | Total return without the inclusion of the Payment from (to) Affiliate can be found in Expenses in the accompanying Notes to Financial Statements. |
| | | Portfolio Turnover
Rate for
All Share Classes | |
| For the Six-Month Period Ended June 30, 2014 (Unaudited) | | | 39%(A) | |
| For the Year Ended December 31, 2013 | | | 71 | |
| For the Year Ended December 31, 2012 | | | 108 | |
| For the Year Ended December 31, 2011 | | | 57 | |
| For the Year Ended December 31, 2010 | | | 62 | |
| For the Year Ended December 31, 2009 | | | 70 | |
| (A) | During the six-month period ended June 30, 2014, the Fund incurred $61.8 million in sales associated with the transition of assets from Hartford Global Research HLS Fund, which merged into the Fund on June 23, 2014. These sales were excluded from the portfolio turnover rate calculation. |
Hartford Global Growth HLS Fund
Directors and Officers (Unaudited)
The Board of Directors of the Company (the "Directors") appoints officers who are responsible for the day-to-day operations of the Fund and who execute policies formulated by the Directors. Each Director serves until his or her death, resignation, or retirement or until the next annual meeting of shareholders is held or until his or her successor is elected and qualifies.
Directors and officers who are employed by or who have a financial interest in The Hartford are considered “interested” persons of the Fund pursuant to the 1940 Act. Each officer and two of the Company's Directors, as noted in the chart below, are “interested” persons of the Fund. Each Director serves as a director for The Hartford Mutual Funds, Inc., The Hartford Mutual Funds II, Inc., Hartford Series Fund, Inc., and Hartford HLS Series Fund II, Inc., and as a trustee for The Hartford Alternative Strategies Fund, which, as of June 30, 2014, collectively consist of 78 funds. Correspondence may be sent to Directors and officers c/o Hartford Funds, 5 Radnor Corporate Center, Suite 300, 100 Matsonford Road, Radnor, Pennsylvania 19087, except that correspondence to Mr. Annoni, Mr. Dressen and Ms. Quade may be sent to 500 Bielenberg Drive, Suite 500, Woodbury, Minnesota 55125.
The table below sets forth, for each Director and officer, his or her name, year of birth, current position with the Company and date first elected or appointed to Hartford Series Fund, Inc. ("HSF") and Hartford HLS Series Fund II, Inc. ("HSF2"), principal occupation, and, for Directors, other directorships held. The Fund’s Statement of Additional Information contains further information on the Directors and is available free of charge by calling 1-888-843-7824 or writing to: Hartford HLS Funds, c/o Hartford Life Insurance Company/Hartford Life and Annuity Insurance Company, P.O. Box 14293, Lexington, KY 40512-4293 for variable annuity and variable life insurance separate accounts of Hartford Life Insurance Company and its affiliates; Hartford Funds, P.O. Box 55022, Boston, MA 02205-5022 for all shareholders except variable annuity and variable life insurance separate accounts of Hartford Life Insurance Company and its affiliates.
Information on the aggregate remuneration paid to the directors of the Company can be found in the Statement of Operations herein. The Fund pays to The Hartford a portion of the Chief Compliance Officer’s compensation, but does not pay salaries or compensation to any of its other officers or Directors who are employed by The Hartford.
Non-Interested Directors
Lynn S. Birdsong (1946) Director since 2003, Co-Chairman of the Investment Committee since 2005
Mr. Birdsong is a private investor. Mr. Birdsong currently serves as a Director of the Sovereign High Yield Investment Company (April 2010 to current). Mr. Birdsong currently serves as an Independent Director of Nomura Partners Funds, Inc. (formerly, The Japan Fund) (April 2003 to current). From 2003 to March 2005, Mr. Birdsong was an Independent Director of the Atlantic Whitehall Funds. From 1979 to 2002, Mr. Birdsong was a Managing Director of Zurich Scudder Investments, an investment management firm. During his employment with Scudder, Mr. Birdsong was an Interested Director of The Japan Fund. From January 1981 through December 2013, Mr. Birdsong was a partner in Birdsong Company, an advertising specialty firm.
Robert M. Gavin, Jr. (1940) Director since 2002 (HSF) and 1986 (HSF2), Chairman of the Board since 2004
Dr. Gavin is an educational consultant. Prior to September 1, 2001, he was President of Cranbrook Education Community and prior to July 1996, he was President of Macalester College, St. Paul, Minnesota.
Duane E. Hill (1945) Director since 2001 (HSF) and 2002 (HSF2), Chairman of the Nominating Committee since 2003
Mr. Hill is a Partner of TSG Ventures L.P., a private equity investment company. Mr. Hill is a former partner of TSG Capital Group, a private equity investment firm that served as sponsor and lead investor in leveraged buyouts of middle market companies.
Sandra S. Jaffee (1941) Director since 2005
Ms. Jaffee is the founder and Chief Executive Officer of a private company, Homeworks Concierge, LLC, which provides residential property management services in Westchester County, New York (January 2012 to present). Ms. Jaffee served as Chairman (2008 to 2009) and Chief Executive Officer of Fortent (formerly Searchspace Group), a leading provider of compliance/regulatory technology to financial institutions from August 2005 to August 2009. From August 2004 to August 2005, Ms. Jaffee served as an Entrepreneur in Residence with Warburg Pincus, a private equity firm. Prior to joining Warburg Pincus, Ms. Jaffee served as Executive Vice President at Citigroup, from September 1995 to July 2004, where she was President and Chief Executive Officer of Citibank’s Global Securities Services (1995 to 2003). Ms. Jaffee currently serves as a member of the Board of Directors of Broadridge Financial Solutions as well as a Trustee of Muhlenberg College.
Hartford Global Growth HLS Fund
Directors and Officers (Unaudited) – (continued)
William P. Johnston (1944) Director since 2005, Chairman of the Compliance Committee since 2005
In June 2006, Mr. Johnston was appointed as Senior Advisor to The Carlyle Group, a global private equity and other alternative asset investment firm and currently serves as an Operating Executive. In July 2006, Mr. Johnston was elected to the Board of Directors of MultiPlan, Inc. and served as a Director (July 2006 to August 2010). In August 2007, Mr. Johnston was elected to the Board of Directors of LifeCare Holdings, Inc. and served as a Director (August 2007 to June 2013). In February 2008, Mr. Johnston was elected to the Board of Directors of HCR-ManorCare, Inc. In May 2006, Mr. Johnston was elected to the Supervisory Board of Fresenius Medical Care AG & Co. KGaA, after its acquisition of Renal Care Group, Inc. in March 2006. Mr. Johnston joined Renal Care Group in November 2002 as a member of the Board of Directors and served as Chairman of the Board from March 2003 through March 2006. From 2002 through 2013, Mr. Johnston served as a Board member of the Georgia O’Keefe Museum. From September 1987 to December 2002, Mr. Johnston was with Equitable Securities Corporation (and its successors, SunTrust Equitable Securities and SunTrust Robinson Humphrey) serving in various investment banking and managerial positions, including Managing Director and Head of Investment Banking, Chief Executive Officer and Vice Chairman.
Phillip O. Peterson (1944) Director since 2002 (HSF) and 2000 (HSF2), Chairman of the Audit Committee since 2002
Mr. Peterson is a mutual fund industry consultant. He was a partner of KPMG LLP (an accounting firm) until July 1999. Mr. Peterson joined William Blair Funds in February 2007 as a member of the Board of Trustees. From February 2012 to February 2014, Mr. Peterson served as a Trustee of Symetra Variable Mutual Funds. From January 2004 to April 2005, Mr. Peterson served as Independent President of the Strong Mutual Funds.
Lemma W. Senbet (1946) Director since 2005
Dr. Senbet is the William E. Mayer Chair Professor of Finance and Founding Director, Center for Financial Policy, at the University of Maryland, Robert H. Smith School of Business. He was chair of the Finance Department of the University of Maryland, Robert H. Smith School of Business from 1998 to 2006. Since June 2013, he has been on leave from the University to serve as Executive Director of African Economic Research Consortium which focuses on economic policy research and training. Previously, he was a chaired professor of finance at the University of Wisconsin-Madison. Also, he was a Director of the Fortis Funds from March 2000 to July 2002. Dr. Senbet served as Director of the American Finance Association and President of the Western Finance Association. In 2006, Dr. Senbet was inducted Fellow of Financial Management Association International for his career-long distinguished scholarship and professional service.
Interested Directors and Officers
James E. Davey (1964) Director since 2012, President and Chief Executive Officer since 2010
Mr. Davey serves as Executive Vice President of Hartford Life Insurance Company (“HLIC”) and The Hartford Financial Services Group, Inc. Additionally, Mr. Davey serves as Chairman of the Board, Manager and Senior Managing Director of Hartford Funds Distributors, LLC (“HFD”). He also currently serves as Director, Chairman of the Board, President and Senior Managing Director of Hartford Administrative Services Company (“HASCO”). Mr. Davey also serves as Manager, Chairman of the Board and Senior Managing Director for Hartford Funds Management Company, LLC (“HFMC”) and Director, Chairman of the Board and Senior Managing Director for Hartford Funds Management Group, Inc. ("HFMG"). Mr. Davey has served in various positions within The Hartford and its subsidiaries in connection with the operation of the Hartford Funds. Mr. Davey joined The Hartford in 2002.
Lowndes A. Smith (1939) Director since 1996 (HSF) and 2002 (HSF2), Co-Chairman of the Investment Committee since 2005
Mr. Smith served as Vice Chairman of The Hartford from February 1997 to January 2002, as President and Chief Executive Officer of Hartford Life, Inc. from February 1997 to January 2002, and as President and Chief Operating Officer of The Hartford Life Insurance Companies from January 1989 to January 2002. Mr. Smith serves as a Director of White Mountains Insurance Group Ltd. (October 2003 to current); One Beacon Insurance (October 2006 to current); Symetra Financial (August 2007 to current) and is a Managing Director of Whittington Gray Associates (January 2007 to current).
Other Officers
Mark A. Annoni (1964) Vice President, Controller and Treasurer since 2012
Mr. Annoni currently serves as the Assistant Vice President of HLIC (February 2004 to present) and Senior Vice President of HFMG (December 2013 to present). Mr. Annoni has served in various positions within The Hartford and its subsidiaries in connection with the operation of the Hartford Funds. Mr. Annoni joined The Hartford in 2001.
Hartford Global Growth HLS Fund
Directors and Officers (Unaudited) – (continued)
Michael R. Dressen (1963) AML Compliance Officer since 2011
Mr. Dressen currently serves as Assistant Vice President of HLIC. He also serves as Chief Compliance Officer and AML Compliance Officer of HASCO and as AML Officer of HFD. Mr. Dressen has served in various positions within The Hartford and its subsidiaries in connection with the operation of the Hartford Funds.
Edward P. Macdonald (1967) Vice President, Secretary and Chief Legal Officer since 2005
Mr. Macdonald currently serves as Assistant Secretary, Executive Vice President and Deputy General Counsel of HFD, HASCO, HFMC and HFMG. He also serves as Vice President of HLIC. Mr. Macdonald has served in various positions within The Hartford and its subsidiaries in connection with the operation of the Hartford Funds. Mr. Macdonald joined The Hartford in 2005.
Joseph G. Melcher (1973) Vice President and Chief Compliance Officer since 2013
Mr. Melcher currently serves as Executive Vice President of HFD, HFMG and HASCO. Mr. Melcher also currently serves as Executive Vice President and Chief Compliance Officer of HFMC. Mr. Melcher has served in various positions within The Hartford and its subsidiaries in connection with the operation of the Hartford Funds since joining The Hartford in 2012. Prior to joining The Hartford, Mr. Melcher worked at Touchstone Investments, a member of the Western & Southern Financial Group, where he held the position of Vice President and Chief Compliance Officer from 2010 through 2012 and Assistant Vice President, Compliance from 2005 to 2010.
Vernon J. Meyer (1964) Vice President since 2006
Mr. Meyer currently serves as Senior Vice President of HLIC. He also currently serves as Managing Director and Chief Investment Officer of HFMC and Managing Director of HFMG. Mr. Meyer has served in various positions within The Hartford and its subsidiaries in connection with the operation of the Hartford Funds. Mr. Meyer joined The Hartford in 2004.
Laura S. Quade (1969) Vice President since 2012
Ms. Quade currently serves as Vice President of HASCO, HFD and HFMG. She is the Head of Operations of HASCO and also serves as Director, Enterprise Operations of HLIC. Ms. Quade has served in various positions within The Hartford and its subsidiaries in connection with the operation of the Hartford Funds.
Martin A. Swanson (1962) Vice President since 2010
Mr. Swanson currently serves as Vice President of HLIC. Mr. Swanson also serves as Managing Director, Chief Marketing Officer and Principal of HFD and Managing Director of HFMG. Mr. Swanson has served in various positions within The Hartford and its subsidiaries in connection with the operation of the Hartford Funds.
HOW TO OBTAIN A COPY OF THE FUND’S PROXY VOTING POLICIES AND VOTING RECORDS (UNAUDITED)
A description of the policies and procedures that the Fund uses to determine how to vote proxies relating to portfolio securities and information about how the Fund voted proxies relating to portfolio securities during the most recent twelve-month period ended June 30 are available (1) without charge, upon request, by calling 888-843-7824 and (2) on the SEC’s website at http://www.sec.gov.
QUARTERLY PORTFOLIO HOLDINGS INFORMATION (UNAUDITED)
The Fund files a complete schedule of portfolio holdings with the SEC for the first and third quarters of each fiscal year on Form N-Q. The Fund’s Forms N-Q are available (1) without charge, upon request, by calling 888-843-7824 and (2) on the SEC’s website at http://www.sec.gov. The Form N-Q may be reviewed and copied at the SEC’s Public Reference Room in Washington, DC. Information on the operation of the Public Reference Room may be obtained by calling 1-800-SEC-0330.
Hartford Global Growth HLS Fund
Expense Example (Unaudited)
Your Fund's Expenses
As a shareholder of the Fund, you incur two types of costs: (1) transaction costs and (2) ongoing costs, including investment management fees, distribution and/or service (12b-1) fees, if any, and other fund expenses. This example is intended to help you understand your ongoing costs (in dollars) of investing in the Fund and to compare these costs with the ongoing costs of investing in other mutual funds. The example is based on an investment of $1,000 invested at the beginning of the period and held for the entire period of December 31, 2013 through June 30, 2014.
Actual Expenses
The first set of columns of the table below provides information about actual account values and actual expenses. You may use the information in this column, together with the amount you invested, to estimate the expenses that you paid over the period. Simply divide your account value by $1,000 (for example, an $8,600 account value divided by $1,000 = 8.6), then multiply the result by the number in the line under the heading entitled “Expenses Paid During Period” to estimate the expenses you paid on your account during this period.
Hypothetical Example for Comparison Purposes
The second set of columns of the table below provides information about hypothetical account values and hypothetical expenses based on the Fund's actual expense ratio and an assumed rate of return of 5% per year before expenses, which is not the Fund's actual return. The hypothetical account values and expenses may not be used to estimate the actual ending account balance or expenses you paid for the period. You may use this information to compare the ongoing costs of investing in the Fund and other funds. To do so, compare this 5% hypothetical example with the 5% hypothetical examples that appear in the shareholder reports of the other funds.
Please note that the expenses shown in the table are meant to highlight your ongoing costs only and do not reflect any transactional costs, such as sales charges (loads) and CDSC. Therefore, the second set of columns of the table is useful in comparing ongoing costs only, and will not help you determine the relative total costs of owning different funds. In addition, if these transactional costs were included, your costs would be higher. Expenses are equal to the Fund's annualized expense ratios multiplied by average account value over the period, multiplied by 181/365 (to reflect the one-half year period).
| | | Actual return | | | Hypothetical (5% return before expenses) | | | | | | | | |
| | | Beginning
Account Value
December 31,
2013 | | | Ending Account
Value
June 30, 2014 | | | Expenses paid
during the period
December 31, 2013
through
June 30, 2014 | | | Beginning
Account Value
December 31,
2013 | | | Ending Account
Value
June 30, 2014 | | | Expenses paid
during the period
December 31,
2013
through
June 30, 2014 | | | Annualized
expense
ratio | | | Days
in the
current
1/2
year | | Days
in the
full
year |
| Class IA | | $ | 1,000.00 | | | $ | 1,050.60 | | | $ | 4.12 | | | $ | 1,000.00 | | | $ | 1,020.78 | | | $ | 4.06 | | | | 0.81 | % | | 181 | | 365 |
| Class IB | | $ | 1,000.00 | | | $ | 1,049.60 | | | $ | 5.39 | | | $ | 1,000.00 | | | $ | 1,019.54 | | | $ | 5.31 | | | | 1.06 | | | 181 | | 365 |
Hartford Global Growth HLS Fund
Main Risks (Unaudited)
The main risks of investing in the Fund are described below.
Market, Selection and Strategy Risk: The Fund’s share price may fluctuate due to market risk and/or security selections that may underperform the market or relevant benchmarks. If the sub-adviser's investment strategy does not perform as expected, the Fund could underperform its peers or lose money. There is no guarantee the Fund will achieve its stated objective.
Foreign Investment and Emerging Markets Risk: Investments in foreign securities may be riskier than investments in U.S. securities. Potential risks include the risks of illiquidity, increased price volatility, less government regulation, less extensive and less frequent accounting and other reporting requirements, unfavorable changes in currency exchange rates, and economic and political disruptions. These risks are generally greater for investments in emerging markets.
Growth Investing Risk: Growth investments can be volatile, and may fail to increase earnings or grow as quickly as anticipated. Growth-style investing falls in and out of favor, which may result in periods of underperformance.
Mid-cap Stock Risk: Mid-cap stocks are generally more volatile and risky and may be less liquid than large-cap stocks because they may have limited operating histories, narrow product lines, and focus on niche markets.
Active Trading Risk: Actively trading investments may result in higher costs (thus affecting performance).
THIS PRIVACY POLICY IS NOT PART OF THIS REPORT
Privacy Policy and Practices of The Hartford Financial Services Group, Inc. and its Affiliates
(herein called “we, our and us”)
This Privacy Policy applies to our United States Operations
We value your trust. We are committed to the responsible: a) management; b) use; and c) protection; of Personal Information. This notice describes how we collect, disclose, and protect Personal Information. We collect Personal Information to: a) service your Transactions with us; and b) support our business functions. We may obtain Personal Information from: a) You; b) your Transactions with us; and c) third parties such as a consumer-reporting agency. Based on the type of product or service You apply for or get from us, Personal Information such as: a) your name; b) your address; c) your income; d) your payment; or e) your credit history; may be gathered from sources such as applications, Transactions, and consumer reports. To serve You and service our business, we may share certain Personal Information. We will share Personal Information, only as allowed by law, with affiliates such as: a) our insurance companies; b) our employee agents; c) our brokerage firms; and d) our administrators. As allowed by law, we may share Personal Financial Information with our affiliates to: a) market our products; or b) market our services; to You without providing You with an option to prevent these disclosures. | | | We may also share Personal Information, only as allowed by law, with unaffiliated third parties including: a) independent agents; b) brokerage firms; c) insurance companies; d) administrators; and e) service providers; who help us serve You and service our business. When allowed by law, we may share certain Personal Financial Information with other unaffiliated third parties who assist us by performing services or functions such as: a) taking surveys; b) marketing our products or services; or c) offering financial products or services under a joint agreement between us and one or more financial institutions. We, and third parties we partner with, may track some of the pages You visit through the use of: a) cookies; b) pixel tagging; or c) other technologies; and currently do not process or comply with any web browser’s “do not track” signal or similar mechanism that indicates a request to disable online tracking of individual users who visit our websites or use our services. We will not sell or share your Personal Financial Information with anyone for purposes unrelated to our business functions without offering You the opportunity to: a) “opt-out;” or b) “opt-in;” as required by law. We only disclose Personal Health Information with: a) your proper written authorization; or b) as otherwise allowed or required by law. Our employees have access to Personal Information in the course of doing their jobs, such as: a) underwriting policies; b) paying claims; c) developing new products; or d) advising customers of our products and services. |
We use manual and electronic security procedures to maintain: a) the confidentiality; and b) the integrity of; Personal Information that we have. We use these procedures to guard against unauthorized access. Some techniques we use to protect Personal Information include: a) secured files; b) user authentication; c) encryption; d) firewall technology; and e) the use of detection software. We are responsible for and must: a) identify information to be protected; b) provide an adequate level of protection for that data; c) grant access to protected data only to those people who must use it in the performance of their job-related duties. Employees who violate our Privacy Policy will be subject to discipline, which may include ending their employment with us. At the start of our business relationship, we will give You a copy of our current Privacy Policy. We will also give You a copy of our current Privacy Policy once a year if You maintain a continuing business relationship with us. We will continue to follow our Privacy Policy regarding Personal Information even when a business relationship no longer exists between us. | | | As used in this Privacy Notice: Application means your request for our product or service. Personal Financial Information means financial information such as: a) credit history; b) income; c) financial benefits; or d) policy or claim information. Personal Health Information means health information such as: a) your medical records; or b) information about your illness, disability or injury. Personal Information means information that identifies You personally and is not otherwise available to the public. It includes: a) Personal Financial Information; and b) Personal Health Information. Transaction means your business dealings with us, such as: a) your Application; b) your request for us to pay a claim; and c) your request for us to take an action on your account. You means an individual who has given us Personal Information in conjunction with: a) asking about; b) applying for; or c) obtaining; a financial product or service from us if the product or service is used mainly for personal, family, or household purposes. |
This Privacy Policy is being provided on behalf of the following affiliates of The Hartford Financial Services Group, Inc.:
1stAGChoice, Inc.; Access CoverageCorp, Inc.; Access CoverageCorp Technologies, Inc.; American Maturity Life Insurance Company; Archway 60 R, LLC; Business Management Group, Inc.; Champlain Life Reinsurance Company; DMS R, LLC; Eloy R, LLC; Ersatz Corporation; First State Insurance Company; Hartford Accident and Indemnity Company; Hartford Administrative Services Company; Hartford Casualty General Agency, Inc.; Hartford Casualty Insurance Company; Hartford-Comprehensive Employee Benefit Service Company; Hartford Equity Sales Company, Inc.; Hartford Fire General Agency, Inc.; Hartford Fire Insurance Company; Hartford Funds Management Company, LLC; Hartford Funds Management Group, Inc.; Hartford HLS Series Fund II, Inc.; Hartford Insurance Company of Illinois; Hartford Insurance Company of the Midwest; Hartford Insurance Company of the Southeast; Hartford Integrated Technologies, Inc.; Hartford International Life Reassurance Corporation; Hartford Funds Distributors, LLC; Hartford Investment Management Company; Hartford Life and Accident Insurance Company; Hartford Life and Annuity Insurance Company; Hartford Life Insurance Company; Hartford Life Private Placement, LLC; Hartford Lloyd’s Corporation; Hartford Lloyd’s Insurance Company; Hartford Mezzanine Investors I, LLC; Hartford Residual Market, L.C.C.; Hartford Retirement Services, LLC; Hartford Securities Distribution Company, Inc.; Hartford Series Fund, Inc.; Hartford Specialty Insurance Services of Texas, LLC; Hartford Strategic Investments, LLC; Hartford Underwriters Insurance Company; Hartford Technology Services Company, L.L.C.; Hartford of Texas General Agency, Inc.; Hartford Underwriters General Agency, Inc.; HARTRE Company, L.C.C.; HL Investment Advisors, LLC; HLA LLC; Horizon Management Group, LLC; HRA Brokerage Services, Inc.; Lanidex Class B, LLC; M-CAP Insurance Agency, LLC; New England Insurance Company; New England Reinsurance Corporation; Nutmeg Insurance Agency, Inc.; Nutmeg Insurance Company; Pacific Insurance Company, Limited; Planco, LLC: Property and Casualty Insurance Company of Hartford; Revere R, LLC; RVR R, LLC; Sentinel Insurance Company, Ltd.; Sunstone R, LLC; Symphony R, LLC; The Evergreen Group Incorporated; The Hartford Alternative Strategies Fund; The Hartford Mutual Funds, Inc.; The Hartford Mutual Funds II, Inc.; Trumbull Flood Management, L.L.C.; Trumbull Insurance Company; Twin City Fire Insurance Company; White River Life Reinsurance Company.
HPP Revised January 2014
HARTFORD HLS FUNDS
P.O. Box 14293
Lexington, KY 40512-4293
HARTFORDFUNDS
hartfordfunds.com
Hartford Series Fund, Inc. is underwritten and distributed by Hartford Funds Distributors, LLC.
Hartford Series Fund, Inc. inception dates range from 1977 to date. Hartford Series Fund, Inc. is not a subsidiary of The Hartford Financial Services Group, Inc. ("The Hartford") but is underwritten, distributed by and advised by subsidiaries of The Hartford. Investments in Hartford Series Fund, Inc. are not guaranteed by The Hartford or any other entity.
This report is submitted for the general information of the shareholders of the Funds. It is not authorized for distribution unless preceded or accompanied by a current prospectus for the Funds.
Investors should carefully consider the investment objectives, risks, charges, and expenses of Hartford Funds before investing. This and other information can be found in the prospectus, which can be obtained by calling 800-862-6668 (or 800-279-1541 for institutional investors). Investors should read them carefully before they invest.
HLSSAR-GG14 8-14 113539-3 Printed in U.S.A.
HARTFORDFUNDS
| | HARTFORD HEALTHCARE HLS FUND 2014 Semi Annual Report |
A MESSAGE FROM THE PRESIDENT
Dear Fellow Shareholders:
Thank you for investing in Hartford HLS Funds.
Market Review
U.S. equities (as represented by the S&P 500 Index) started 2014 on a shaky note after posting a strong 32.39% gain in 2013. However, stocks managed to maintain modest gains throughout the first quarter and returned to a generally steady climb in the second quarter. Through June 30, 2014, the S&P 500 Index advanced 7.14%. It appears that much of the market volatility during the year can be attributed to heightened international tensions. In particular, the Russian annexation of Ukraine’s Crimean Peninsula and increased tensions in Iraq were cause for concern.
On the domestic front, subdued economic and employment reports slowed stocks’ progress early in the new year, although much of the weakness seemed to dissipate as the year’s unusually harsh winter subsided. And despite initial reactions to the idea, when the U.S. Federal Reserve began tapering its quantitative-easing program in January by reducing its bond purchases by $10 billion a month, the markets took the policy change in stride.
Despite a rough start to the year for financial markets, the global economy seems to be settling into a slow-but-steady recovery. While first-quarter U.S. gross domestic product (GDP) growth was disappointing at -2.9%, U.S. consumer spending, which is a significant contributor toward economic growth, rose by 3% during the quarter. It appears that Europe is also maintaining its own recovery: The International Monetary Fund projects that Europe’s full-year GDP growth may breach positive territory for the first time since 2011.
The impact of international affairs on stocks so far this year is an important reminder to stay informed about both domestic and international economic developments, and any effects they may have on your individual investment goals. If you have not already had a mid-year review of your portfolio, it may be a good time to meet with your financial advisor to review your progress and make certain your investments are prepared for all market environments:
| • | Is your portfolio properly diversified with an appropriate mix of stocks and bonds? |
| • | Is your portfolio positioned to take advantage of the global economic recovery, with investments in both domestic and international holdings? |
| • | Are your investments still in line with your risk tolerance and investment time horizon? |
Your financial professional can help you choose options within our fund family to help you reach your investment goals with confidence.
Thank you again for investing with Hartford HLS Funds.
James Davey
President
Hartford HLS Funds
1 The S&P 500 Index is a market capitalization-weighted price index composed of 500 widely held common stocks.
2The Dow Jones Industrial Average is an unmanaged, price-weighted index of 30 of the largest, most widely held stocks traded on the New York Stock Exchange.
Hartford Healthcare HLS Fund
Table of Contents
This report is prepared for the general information of contract owners and qualified retirement plan participants. It is not an offer of contracts or of qualified retirement plans. It should not be used in connection with any offer, except in conjunction with the appropriate product prospectus which contains all pertinent information including the applicable sales, administrative and other charges.
The views expressed in the Fund’s Manager Discussion under “Why did the Fund perform this way?” and “What is the outlook?” are views of the Fund’s sub-adviser and portfolio management team through the end of the period and are subject to change based on market and other conditions. The Fund’s Manager Discussion is for informational purposes only and does not represent an offer, recommendation or solicitation to buy, hold or sell any security. The specific securities identified and described, if any, do not represent all of the securities purchased or sold and you should not assume that investments in the securities identified and discussed will be profitable.
Hartford Healthcare HLS Fund inception 05/01/2000
(sub-advised by Wellington Management Company, LLP)
Investment objective – The Fund seeks long-term capital appreciation.
Performance Overview 6/30/04 - 6/30/14
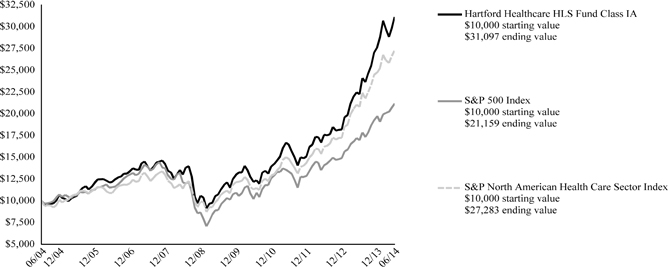
The chart above represents the hypothetical growth of a $10,000 investment in Class IA. Growth results in classes other than Class IA will vary from what is seen above due to differences in the expenses charged to those share classes.
Average Annual Total Returns (as of 6/30/14)
| | | 6 Month† | | 1 Year | | 5 Years | | 10 Years |
| Healthcare IA | | 12.47% | | 39.78% | | 23.71% | | 12.01% |
| Healthcare IB | | 12.29% | | 39.43% | | 23.40% | | 11.73% |
| S&P 500 Index | | 7.14% | | 24.61% | | 18.83% | | 7.78% |
| S&P North American Health Care Sector Index | | 10.20% | | 31.12% | | 21.84% | | 10.56% |
PERFORMANCE DATA QUOTED REPRESENTS PAST PERFORMANCE AND DOES NOT GUARANTEE FUTURE RESULTS. The investment return and principal value of the investment will fluctuate so that investors’ shares, when redeemed, may be worth more or less than their original cost. Current performance may be lower or higher than the performance data quoted. To obtain performance data current to the most recent month-end, please visit our website www.hartfordfunds.com.
Total returns presented above were calculated using the Fund’s net asset value available to shareholders for sale or redemption of Fund shares on June 30, 2014, which may exclude investment transactions as of this date. All share class returns assume the reinvestment of all distributions at net asset value and the deduction of all fund expenses.
S&P 500 Index is a market capitalization-weighted price index composed of 500 widely held common stocks.
S&P North American Health Care Sector Index is a modified capitalization-weighted index based on United States headquartered health care companies. Stocks in the index are weighted such that each stock is no more than 7.5% of the market capitalization as of the most recent reconstitution date. The companies included in the index must be common stocks and be traded on the NYSE MKT LLC, Nasdaq or the New York Stock Exchange and meet certain established market capitalization levels.
The index is unmanaged, and its results include reinvested dividends and/or distributions, but do not reflect the effect of sales charges, commissions, expenses or taxes.
You cannot invest directly in an index.
As shown in the Fund's current prospectus dated May 1, 2014, the total annual operating expense ratios for Class IA and Class IB were 0.89% and 1.14%, respectively. Actual expenses may be higher. Please see the accompanying Financial Highlights for expense ratios for the six-month period ended June 30, 2014.
The chart and table do not reflect the deductions of taxes, sales charges or other fees which may be applied at the variable life insurance, variable annuity or qualified retirement plan product level. Any such additional sales charges or other fees or expenses would lower the contract’s or plan’s performance.
All investments are subject to risk including the possible loss of principal. For a discussion of the Fund’s risks, please see the Main Risks section of this report. For more detailed information on the risks associated with an investment in the Fund, please see the prospectus.
| Hartford Healthcare HLS Fund |
Manager Discussion
June 30, 2014 (Unaudited)
| Portfolio Managers | | | |
| Jean M. Hynes, CFA | Ann C. Gallo | Kirk J. Mayer, CFA | Robert L. Deresiewicz |
| Senior Vice President and Global Industry Analyst | Senior Vice President and Global Industry Analyst | Senior Vice President and Global Industry Analyst | Senior Vice President and Global Industry Analyst |
How did the Fund perform?
The Class IA shares of the Hartford Healthcare HLS Fund returned 12.47% for the six-month period ended June 30, 2014, outperforming the Fund’s benchmark, the S&P North American Health Care Sector Index, which returned 10.20% for the same period. The Fund underperformed the 13.05% average return of the Lipper Global Health and Biotechnology peer group, a group of funds with investment strategies similar to those of the Fund.
Why did the Fund perform this way?
Health care stocks (+10%) outperformed both the broader U.S. market (+7%) and the global equity market (+7%) during the period, as measured by the S&P North American Health Care Index, S&P 500 Index, and the MSCI World Index respectively. Within the S&P North American Health Care Index, small-cap biopharma returned (+14%), mid-cap biopharma returned (+13%), and large-cap biopharma returned (+10%), while medical technology returned (+11%) and health services returned (+8%).
The Fund outperformed the S&P North American Health Care Sector Index primarily due to strong security selection which was positive performance factor across all subsectors. The largest contributors to benchmark-relative performance on a security selection basis included health services and mid-cap biopharma. A modest cash position detracted from relative performance in an upward trending market.
Holdings of Forest Labs (mid-cap biopharma), and Covidien (medical technology), and having no exposure to Pfizer (large-cap biopharma) contributed most to results relative to the S&P North American Health Care Sector Index. Shares of Forest Labs, a U.S.-based pharmaceutical company, soared on news the company was being acquired by Actavis for U.S.$25 billion. Shares of Pfizer, a U.S.-based multinational pharmaceutical company, underperformed after Pfizer’s offer to acquire AstraZeneca was rejected. Not owning this benchmark component contributed to relative results. Covidien, a U.S.-based medical products, manufacturing, and distribution company, saw its shares rise on news that Medtronic offered to buy the company for $42.9 billion with a mix of both cash and stock. Top contributors to absolute performance during the period also included Actavis (large-cap biopharma).
Allergan (biopharma large-cap), Bristol-Myers Squibb (biopharma large-cap), and Johnson & Johnson (biopharma large-cap) were the top detractors from performance relative to the S&P North American Health Care Sector Index. Shares of Allergan, a specialty pharmaceutical company, rose during the period after Valeant Pharmaceuticals offered to acquire the company for approximately $45 billion. Not owning this strong performing constituent of the Index weighed on relative returns. Shares of Bristol-Myers Squibb, a U.S.-based pharmaceutical company, pulled back after the company reported high toxicity levels in a combination (Yervoy + Nivolumab) of lung cancer treatment drugs. Johnson & Johnson, a U.S.-based multinational medical devices, pharmaceutical, and consumer packaged goods manufacturer, saw its shares rise on solid quarterly earnings results. Holding an underweight allocation to this large Index constituent detracted from relative results. Top detractors from absolute performance during the period also included Medicines (mid-cap biopharma) and Exelixis (small-cap biopharma).
Derivatives are not used in a significant manner in this Fund and did not have a material impact on performance during the period.
What is the outlook?
We continue to emphasize pharmaceutical companies with active immuno-oncology programs. At this year’s American Society of Clinical Oncology meeting, the transformative potential of immune checkpoint modulation was on full display, with activity of checkpoint modulators now established or suggested in malignant melanoma, and in lung, kidney, ovarian, bladder, and head and neck cancers. We expect to see multiple winners in this massive new market.
Stocks of hospital companies continue to profit from the rollout of the Affordable Care Act commercial exchanges and Medicaid expansion program and the corresponding reduction in the number of uninsured Americans. Given that we are still in the early stages of the implementation of these programs, we expect that as the year progresses, benefits to hospitals will intensify in the form of accelerating admissions growth and a reduction in bad debt. In addition to hospitals, we believe ER-outsourcing providers will also be beneficiaries.
While the reduction in the number of uninsured Americans should create a positive tailwind for healthcare spending in the aggregate, on an individual (or per member per month (PMPM)) basis healthcare spending growth remains subdued. The continuation of muted acceleration in healthcare spending on a PMPM basis is supportive of our investments in health care service companies.
Finally, we remain favorably inclined to the pharmaceutical supply chain sector as we anticipate stable to improving utilization growth and robust drug price inflation.
| Hartford Healthcare HLS Fund |
Manager Discussion – (continued)
June 30, 2014 (Unaudited)
Diversification by Sector
as of June 30, 2014
| Sector | | Percentage of
Net Assets | |
| Equity Securities | | | | |
| Consumer Staples | | | 3.4 | % |
| Health Care | | | 95.4 | |
| Industrials | | | 1.0 | |
| Information Technology | | | 0.4 | |
| Total | | | 100.2 | % |
| Short-Term Investments | | | 1.8 | |
| Other Assets and Liabilities | | | (2.0 | ) |
| Total | | | 100.0 | % |
A sector may be comprised of several industries. For Fund compliance purposes, the Fund may not use the same classification system and these sector classifications are used for reporting ease.
| Hartford Healthcare HLS Fund |
Schedule of Investments
June 30, 2014 (Unaudited)
(000’s Omitted)
| Shares or Principal Amount | | Market Value ╪ | |
| Common Stocks - 100.2% | | | | |
| | | | | Biotechnology - 22.2% | | | | |
| | 24 | | | Acorda Therapeutics, Inc. ● | | $ | 806 | |
| | 153 | | | Alkermes plc ● | | | 7,699 | |
| | 44 | | | Alnylam Pharmaceuticals, Inc. ● | | | 2,798 | |
| | 137 | | | Anacor Pharmaceuticals, Inc. ● | | | 2,425 | |
| | 424 | | | Arena Pharmaceuticals, Inc. ● | | | 2,482 | |
| | 211 | | | BioCryst Pharmaceuticals, Inc. ● | | | 2,686 | |
| | 8 | | | Biogen Idec, Inc. ● | | | 2,523 | |
| | 26 | | | Cubist Pharmaceuticals, Inc. ● | | | 1,845 | |
| | 263 | | | Exelixis, Inc. ● | | | 892 | |
| | 30 | | | Foundation Medicine, Inc. ● | | | 811 | |
| | 191 | | | Gilead Sciences, Inc. ● | | | 15,802 | |
| | 105 | | | Glycomimetics, Inc. ● | | | 884 | |
| | 68 | | | Incyte Corp. ● | | | 3,858 | |
| | 45 | | | Innate Pharma S.A. ● | | | 551 | |
| | 118 | | | Ironwood Pharmaceuticals, Inc. ● | | | 1,806 | |
| | 3 | | | Kite Pharma, Inc. ● | | | 95 | |
| | 160 | | | NPS Pharmaceuticals, Inc. ● | | | 5,302 | |
| | 22 | | | Portola Pharmaceuticals, Inc. ● | | | 648 | |
| | 31 | | | PTC Therapeutics, Inc. ● | | | 803 | |
| | 24 | | | Regeneron Pharmaceuticals, Inc. ● | | | 6,832 | |
| | 256 | | | Rigel Pharmaceuticals, Inc. ● | | | 927 | |
| | 38 | | | Seattle Genetics, Inc. ● | | | 1,452 | |
| | 80 | | | Tesaro, Inc. ● | | | 2,502 | |
| | 91 | | | Tetraphase Pharmaceuticals, Inc. ● | | | 1,230 | |
| | 20 | | | Trevana, Inc. ● | | | 115 | |
| | 2 | | | Ultragenyx Pharmaceutical, Inc. ● | | | 67 | |
| | 2 | | | Versartis, Inc. ● | | | 42 | |
| | 24 | | | Vertex Pharmaceuticals, Inc. ● | | | 2,266 | |
| | | | | | | | 70,149 | |
| | | | | Drug Retail - 3.4% | | | | |
| | 76 | | | CVS Caremark Corp. | | | 5,746 | |
| | 66 | | | Walgreen Co. | | | 4,889 | |
| | | | | | | | 10,635 | |
| | | | | Health Care Distributors - 5.3% | | | | |
| | 83 | | | Cardinal Health, Inc. | | | 5,692 | |
| | 59 | | | McKesson Corp. | | | 11,050 | |
| | | | | | | | 16,742 | |
| | | | | Health Care Equipment - 20.1% | | | | |
| | 129 | | | Abbott Laboratories | | | 5,264 | |
| | 408 | | | Boston Scientific Corp. ● | | | 5,210 | |
| | 133 | | | Covidien plc | | | 12,009 | |
| | 119 | | | Globus Medical, Inc. ● | | | 2,841 | |
| | 27 | | | Heartware International, Inc. ● | | | 2,382 | |
| | 29 | | | Hologic, Inc. ● | | | 744 | |
| | 91 | | | K2M Group Holdings, Inc. ● | | | 1,347 | |
| | 136 | | | Medtronic, Inc. | | | 8,687 | |
| | 58 | | | Orthofix International N.V. ● | | | 2,099 | |
| | 100 | | | St. Jude Medical, Inc. | | | 6,892 | |
| | 60 | | | Stryker Corp. | | | 5,059 | |
| | 127 | | | Tornier N.V. ● | | | 2,979 | |
| | 113 | | | TriVascular Techonologies, Inc. ● | | | 1,759 | |
| | 92 | | | Volcano Corp. ● | | | 1,627 | |
| | 43 | | | Zimmer Holdings, Inc. | | | 4,427 | |
| | | | | | | | 63,326 | |
| | | | | Health Care Facilities - 4.4% | | | | |
| | 48 | | | Acadia Healthcare Co., Inc. ● | | | 2,198 | |
| | 123 | | | HCA Holdings, Inc. ● | | | 6,933 | |
| | 207 | | | NMC Health plc | | | 1,772 | |
| | 871 | | | Phoenix Healthcare Group Co., Ltd. | | | 1,313 | |
| | 17 | | | Universal Health Services, Inc. Class B | | | 1,656 | |
| | | | | | | | 13,872 | |
| | | | | Health Care Services - 2.7% | | | | |
| | 88 | | | Al Noor Hospitals Group | | | 1,540 | |
| | 104 | | | Envision Healthcare Holdings ● | | | 3,735 | |
| | 44 | | | Express Scripts Holding Co. ● | | | 3,047 | |
| | 8 | | | iKang Healthcare Group, Inc. ● | | | 146 | |
| | | | | | | | 8,468 | |
| | | | | Health Care Supplies - 0.8% | | | | |
| | 52 | | | Dentsply International, Inc. | | | 2,472 | |
| | | | | | | | | |
| | | | | Health Care Technology - 1.6% | | | | |
| | 88 | | | Allscripts Healthcare Solutions, Inc. ● | | | 1,406 | |
| | 13 | | | athenahealth, Inc. ● | | | 1,577 | |
| | 84 | | | IMS Health Holdings, Inc. ● | | | 2,162 | |
| | | | | | | | 5,145 | |
| | | | | Internet Software and Services - 0.4% | | | | |
| | 77 | | | Everyday Health, Inc. ● | | | 1,419 | |
| | | | | | | | | |
| | | | | Life Sciences Tools and Services - 1.6% | | | | |
| | 46 | | | Agilent Technologies, Inc. | | | 2,613 | |
| | 15 | | | Covance, Inc. ● | | | 1,277 | |
| | 12 | | | MorphoSys AG ● | | | 1,128 | |
| | | | | | | | 5,018 | |
| | | | | Managed Health Care - 6.3% | | | | |
| | 117 | | | Aetna, Inc. | | | 9,490 | |
| | 72 | | | CIGNA Corp. | | | 6,603 | |
| | 71 | | | Qualicorp S.A. ● | | | 839 | |
| | 38 | | | UnitedHealth Group, Inc. | | | 3,079 | |
| | | | | | | | 20,011 | |
| | | | | Pharmaceuticals - 30.4% | | | | |
| | 34 | | | Actavis plc ● | | | 7,557 | |
| | 105 | | | Aerie Pharmaceuticals, Inc. ● | | | 2,611 | |
| | 39 | | | Almirall S.A. | | | 636 | |
| | 87 | | | AstraZeneca plc ADR | | | 6,450 | |
| | 372 | | | Bristol-Myers Squibb Co. | | | 18,025 | |
| | 129 | | | Daiichi Sankyo Co., Ltd. | | | 2,408 | |
| | 20 | | | Dr. Reddy's Laboratories Ltd. ADR | | | 871 | |
| | 50 | | | Eisai Co., Ltd. | | | 2,118 | |
| | 96 | | | Eli Lilly & Co. | | | 5,992 | |
| | 111 | | | Forest Laboratories, Inc. ● | | | 10,960 | |
| | 35 | | | Hospira, Inc. ● | | | 1,813 | |
| | 28 | | | Johnson & Johnson | | | 2,968 | |
| | 93 | | | Medicines Co. ● | | | 2,715 | |
| | 87 | | | MediWound Ltd. ● | | | 984 | |
| | 103 | | | Merck & Co., Inc. | | | 5,944 | |
| | 95 | | | Mylan, Inc. ● | | | 4,901 | |
| | 17 | | | Ono Pharmaceutical Co., Ltd. | | | 1,476 | |
| | 10 | | | Salix Pharmaceuticals Ltd. ● | | | 1,280 | |
| | 205 | | | Shionogi & Co., Ltd. | | | 4,290 | |
| | 108 | | | Teva Pharmaceutical Industries Ltd. ADR | | | 5,680 | |
| | 42 | | | UCB S.A. | | | 3,557 | |
| | 127 | | | Xenoport, Inc. ● | | | 611 | |
| | 64 | | | Zoetis, Inc. | | | 2,054 | |
| | | | | | | | 95,901 | |
The accompanying notes are an integral part of these financial statements.
| Hartford Healthcare HLS Fund |
Schedule of Investments – (continued)
June 30, 2014 (Unaudited)
(000’s Omitted)
| Shares or Principal Amount | | Market Value ╪ | |
| Common Stocks - 100.2% - (continued) |
| | | | | Research and Consulting Services - 1.0% | | | | |
| | 57 | | | Quintiles Transnational Holdings ● | | $ | 3,034 | |
| | | | | | | | | |
| | | | | Total Common Stocks
(Cost $207,820) | | $ | 316,192 | |
| | | | | | | | | |
| | | | | Total Long-Term Investments
(Cost $207,820) | | $ | 316,192 | |
| Short-Term Investments - 1.8% | | | | | | | |
| | | | | Repurchase Agreements - 1.8% | | | | | | | |
| | | | | Bank of America Merrill Lynch TriParty Repurchase
Agreement (maturing on 07/01/2014 in the
amount of $484, collateralized by FHLMC 2.23%
- 5.99%, 2030 - 2044, FNMA 2.31% - 6.34%,
2020 - 2042, value of $493) | | | | | | | |
| $ | 484 | | | 0.10%, 6/30/2014 | | | | | $ | 484 | |
| | | | | Bank of Montreal TriParty Repurchase Agreement
(maturing on 07/01/2014 in the amount of $739,
collateralized by U.S. Treasury Bill 0.13%, 2015,
U.S. Treasury Bond 2.75% - 10.63%, 2015 -
2044, U.S. Treasury Note 0.13% - 4.50%, 2014 -
2024, value of $754) | | | | | | | |
| | 739 | | | 0.09%, 6/30/2014 | | | | | | 739 | |
| | | | | Bank of Montreal TriParty Repurchase Agreement
(maturing on 07/01/2014 in the amount of $315,
collateralized by FHLMC 2.00% - 5.50%, 2018 -
2041, FNMA 2.00% - 4.50%, 2026 - 2042,
GNMA 3.00% - 4.00%, 2042 - 2043, U.S.
Treasury Bill 0.05%, 2014, U.S. Treasury Note
0.75%, 2018, value of $321) | | | | | | | |
| | 315 | | | 0.11%, 6/30/2014 | | | | | | 315 | |
| | | | | Barclays Capital TriParty Repurchase Agreement
(maturing on 07/01/2014 in the amount of $291,
collateralized by U.S. Treasury Note 0.63% -
0.88%, 2018 - 2019, value of $297) | | | | | | | |
| | 291 | | | 0.07%, 6/30/2014 | | | | | | 291 | |
| | | | | Citigroup Global Markets, Inc. TriParty Repurchase
Agreement (maturing on 07/01/2014 in the
amount of $671, collateralized by U.S. Treasury
Bond 4.38% - 7.50%, 2016 - 2040, U.S.
Treasury Note 0.50% - 3.00%, 2014 - 2020,
value of $685) | | | | | | | |
| | 671 | | | 0.06%, 6/30/2014 | | | | | | 671 | |
| | | | | RBS Securities Inc. TriParty Repurchase
Agreement (maturing on 07/01/2014 in the
amount of $1,029, collateralized by U.S.
Treasury Note 0.38% - 3.13%, 2015 - 2022,
value of $1,050) | | | | | | | |
| | 1,029 | | | 0.08%, 6/30/2014 | | | | | | 1,029 | |
| | | | | TD Securities TriParty Repurchase Agreement
(maturing on 07/01/2014 in the amount of
$2,142, collateralized by FHLMC 3.50% - 4.00%,
2026 - 2044, FNMA 2.50% - 5.00%, 2025 -
2043, value of $2,185) | | | | | | | |
| | 2,142 | | | 0.11%, 6/30/2014 | | | | | | 2,142 | |
| | | | | UBS Securities Repurchase Agreement (maturing
on 07/01/2014 in the amount of $9, collateralized
by U.S. Treasury Note 2.13%, 2020, value of $9) | | | | | | | |
| | 9 | | | 0.05%, 6/30/2014 | | | | | | 9 | |
| | | | | | | | | | | 5,680 | |
| | | | | Total Short-Term Investments
(Cost $5,680) | | | | | $ | 5,680 | |
| | | | | | | | | | | | |
| | | | | Total Investments
(Cost $213,500) ▲ | | | 102.0 | % | $ | 321,872 | |
| | | | | Other Assets and Liabilities | | | (2.0 | )% | | (6,330 | ) |
| | | | | Total Net Assets | | | 100.0 | % | $ | 315,542 | |
The accompanying notes are an integral part of these financial statements.
| Hartford Healthcare HLS Fund |
Schedule of Investments – (continued)
June 30, 2014 (Unaudited)
(000’s Omitted)
| Note: | Percentage of investments as shown is the ratio of the total market value to total net assets. |
| | |
| | Prices of foreign equities that are principally traded on certain foreign markets may be adjusted daily pursuant to a fair value pricing service approved by the Board of Directors in order to reflect an adjustment for factors occurring after the close of certain foreign markets but before the close of the New York Stock Exchange. |
| ▲ | At June 30, 2014, the cost of securities for federal income tax purposes was $215,017 and the aggregate gross unrealized appreciation and depreciation based on that cost were: |
| Unrealized Appreciation | | $ | 111,201 | |
| Unrealized Depreciation | | | (4,346 | ) |
| Net Unrealized Appreciation | | $ | 106,855 | |
Foreign Currency Contracts Outstanding at June 30, 2014
| | | | | | | | | | | | | | | Unrealized Appreciation/(Depreciation) | |
| Currency | | Buy / Sell | | Delivery Date | | Counterparty | | Contract Amount | | | Market Value ╪ | | | Asset | | | Liability | |
| JPY | | Sell | | 09/17/2014 | | CBA | | $ | 5,279 | | | $ | 5,325 | | | $ | — | | | $ | (46 | ) |
| ╪ | See Significant Accounting Policies of accompanying Notes to Financial Statements regarding valuation of securities. |
| GLOSSARY: (abbreviations used in preceding Schedule of Investments) |
| |
| Counterparty Abbreviations: |
| CBA | Commonwealth Bank of Australia |
| |
| Currency Abbreviations: |
| JPY | Japanese Yen |
| |
| Other Abbreviations: |
| ADR | American Depositary Receipt |
| FHLMC | Federal Home Loan Mortgage Corp. |
| FNMA | Federal National Mortgage Association |
| GNMA | Government National Mortgage Association |
The accompanying notes are an integral part of these financial statements.
| Hartford Healthcare HLS Fund |
Investment Valuation Hierarchy Level Summary
June 30, 2014 (Unaudited)
(000’s Omitted)
| | | Total | | | Level 1 ♦ | | | Level 2 ♦ | | | Level 3 | |
| Assets: | | | | | | | | | | | | | | | | |
| Common Stocks ‡ | | $ | 316,192 | | | $ | 298,715 | | | $ | 17,477 | | | $ | – | |
| Short-Term Investments | | | 5,680 | | | | – | | | | 5,680 | | | | – | |
| Total | | $ | 321,872 | | | $ | 298,715 | | | $ | 23,157 | | | $ | – | |
| Liabilities: | | | | | | | | | | | | | | | | |
| Foreign Currency Contracts * | | $ | 46 | | | $ | – | | | $ | 46 | | | $ | – | |
| Total | | $ | 46 | | | $ | – | | | $ | 46 | | | $ | – | |
| ♦ | For the six-month period ended June 30, 2014, investments valued at $1,932 were transferred from Level 1 to Level 2, and there were no transfers from Level 2 to Level 1. Investments are transferred between Level 1 and Level 2 for a variety of reasons including, but not limited to: |
| 1) | Foreign equities for which a fair value price is more representative of exit value than the local market close (transfer into Level 2). Foreign equities for which the local market close is more representative of exit value (transfer into Level 1). |
| 2) | U.S. Treasury securities that no longer represent the most recent issue (transfer into Level 2). |
| 3) | Equity investments with no observable trading but a bid or mean price is used (transfer into Level 2). Equity investments using observable quoted prices in an active market (transfer into Level 1). |
| ‡ | The Fund has all or primarily all of the equity securities categorized in a particular level. Refer to the Schedule of Investments for further industry breakout. |
| * | Derivative instruments (excluding purchased and written options, if applicable) are valued at the unrealized appreciation/depreciation on the investments. |
| Note: | For purposes of reporting transfers between different hierarchy levels, both transfers in and out of each level, as applicable, are shown as if they occurred at the beginning of the period. |
The accompanying notes are an integral part of these financial statements.
| Hartford Healthcare HLS Fund |
Statement of Assets and Liabilities
June 30, 2014 (Unaudited)
(000’s Omitted)
| Assets: | | | | |
| Investments in securities, at market value (cost $213,500) | | $ | 321,872 | |
| Cash | | | — | |
| Foreign currency on deposit with custodian (cost $13) | | | 13 | |
| Receivables: | | | | |
| Investment securities sold | | | 1,357 | |
| Fund shares sold | | | 22 | |
| Dividends and interest | | | 189 | |
| Other assets | | | 1 | |
| Total assets | | | 323,454 | |
| Liabilities: | | | | |
| Unrealized depreciation on foreign currency contracts | | | 46 | |
| Payables: | | | | |
| Investment securities purchased | | | 742 | |
| Fund shares redeemed | | | 7,059 | |
| Investment management fees | | | 37 | |
| Distribution fees | | | 2 | |
| Accrued expenses | | | 26 | |
| Total liabilities | | | 7,912 | |
| Net assets | | $ | 315,542 | |
| Summary of Net Assets: | | | | |
| Capital stock and paid-in-capital | | $ | 155,263 | |
| Undistributed net investment income | | | 223 | |
| Accumulated net realized gain | | | 51,729 | |
| Unrealized appreciation of investments and the translations of assets and liabilities denominated in foreign currency | | | 108,327 | |
| Net assets | | $ | 315,542 | |
| Shares authorized | | | 800,000 | |
| Par value | | $ | 0.001 | |
| Class IA: Net asset value per share | | $ | 28.87 | |
| Shares outstanding | | | 8,879 | |
| Net assets | | $ | 256,390 | |
| Class IB: Net asset value per share | | $ | 28.15 | |
| Shares outstanding | | | 2,101 | |
| Net assets | | $ | 59,152 | |
The accompanying notes are an integral part of these financial statements.
| Hartford Healthcare HLS Fund |
Statement of Operations
For the Six-Month Period Ended June 30, 2014 (Unaudited)
(000’s Omitted)
| Investment Income: | | | | |
| Dividends | | $ | 1,431 | |
| Interest | | | 2 | |
| Less: Foreign tax withheld | | | (31 | ) |
| Total investment income, net | | | 1,402 | |
| | | | | |
| Expenses: | | | | |
| Investment management fees | | | 1,318 | |
| Transfer agent fees | | | 3 | |
| Distribution fees - Class IB | | | 72 | |
| Custodian fees | | | 3 | |
| Accounting services fees | | | 16 | |
| Board of Directors' fees | | | 3 | |
| Audit fees | | | 7 | |
| Other expenses | | | 28 | |
| Total expenses (before fees paid indirectly) | | | 1,450 | |
| Commission recapture | | | (3 | ) |
| Total fees paid indirectly | | | (3 | ) |
| Total expenses, net | | | 1,447 | |
| Net Investment Loss | | | (45 | ) |
| | | | | |
| Net Realized Gain on Investments and Foreign Currency Transactions: | | | | |
| Net realized gain on investments | | | 26,921 | |
| Net realized loss on foreign currency contracts | | | (50 | ) |
| Net realized gain on other foreign currency transactions | | | 3 | |
| Net Realized Gain on Investments and Foreign Currency Transactions | | | 26,874 | |
| | | | | |
| Net Changes in Unrealized Appreciation of Investments and Foreign Currency Transactions: | | | | |
| Net unrealized appreciation of investments | | | 9,372 | |
| Net unrealized depreciation of foreign currency contracts | | | (162 | ) |
| Net unrealized appreciation on translation of other assets and liabilities in foreign currencies | | | — | |
| Net Changes in Unrealized Appreciation of Investments and Foreign Currency Transactions | | | 9,210 | |
| Net Gain on Investments and Foreign Currency Transactions | | | 36,084 | |
| Net Increase in Net Assets Resulting from Operations | | $ | 36,039 | |
The accompanying notes are an integral part of these financial statements.
| Hartford Healthcare HLS Fund |
Statement of Changes in Net Assets
(000’s Omitted)
| | | For the
Six-Month
Period Ended
June 30, 2014
(Unaudited) | | | For the
Year Ended
December 31,
2013 | |
| Operations: | | | | | | | | |
| Net investment income (loss) | | $ | (45 | ) | | $ | 339 | |
| Net realized gain on investments and foreign currency transactions | | | 26,874 | | | | 26,595 | |
| Net unrealized appreciation of investments | | | 9,210 | | | | 75,045 | |
| Net Increase in Net Assets Resulting from Operations | | | 36,039 | | | | 101,979 | |
| Distributions to Shareholders: | | | | | | | | |
| From net investment income | | | | | | | | |
| Class IA | | | — | | | | (1,076 | ) |
| Class IB | | | — | | | | (150 | ) |
| Total from net investment income | | | — | | | | (1,226 | ) |
| From net realized gain on investments | | | | | | | | |
| Class IA | | | — | | | | (13,067 | ) |
| Class IB | | | — | | | | (3,368 | ) |
| Total from net realized gain on investments | | | — | | | | (16,435 | ) |
| Total distributions | | | — | | | | (17,661 | ) |
| Capital Share Transactions: | | | | | | | | |
| Class IA | | | | | | | | |
| Sold | | | 33,472 | | | | 61,195 | |
| Issued on reinvestment of distributions | | | — | | | | 14,143 | |
| Redeemed | | | (50,069 | ) | | | (47,935 | ) |
| Total capital share transactions | | | (16,597 | ) | | | 27,403 | |
| Class IB | | | | | | | | |
| Sold | | | 2,293 | | | | 9,853 | |
| Issued on reinvestment of distributions | | | — | | | | 3,518 | |
| Redeemed | | | (7,099 | ) | | | (19,293 | ) |
| Total capital share transactions | | | (4,806 | ) | | | (5,922 | ) |
| Net increase (decrease) from capital share transactions | | | (21,403 | ) | | | 21,481 | |
| Net Increase in Net Assets | | | 14,636 | | | | 105,799 | |
| Net Assets: | | | | | | | | |
| Beginning of period | | | 300,906 | | | | 195,107 | |
| End of period | | $ | 315,542 | | | $ | 300,906 | |
| Undistributed (distribution in excess of) net investment income | | $ | 223 | | | $ | 268 | |
| Shares: | | | | | | | | |
| Class IA | | | | | | | | |
| Sold | | | 1,220 | | | | 2,741 | |
| Issued on reinvestment of distributions | | | — | | | | 630 | |
| Redeemed | | | (1,833 | ) | | | (2,152 | ) |
| Total share activity | | | (613 | ) | | | 1,219 | |
| Class IB | | | | | | | | |
| Sold | | | 86 | | | | 457 | |
| Issued on reinvestment of distributions | | | — | | | | 161 | |
| Redeemed | | | (266 | ) | | | (895 | ) |
| Total share activity | | | (180 | ) | | | (277 | ) |
The accompanying notes are an integral part of these financial statements.
| Hartford Healthcare HLS Fund |
Notes to Financial Statements
June 30, 2014 (Unaudited)
(000’s Omitted)
Organization:
Hartford Healthcare HLS Fund (the "Fund") serves as an underlying investment option for certain variable annuity and variable life insurance separate accounts of Hartford Life Insurance Company (“HLIC”) and its affiliates and certain qualified retirement plans. The Fund may also serve as an underlying investment option for certain variable annuity and variable life separate accounts of other insurance companies. Owners of variable annuity contracts and policyholders of variable life insurance contracts may choose the funds permitted in the variable insurance contract prospectus. In addition, participants in certain qualified retirement plans may choose the Fund if permitted by their plans.
Hartford Series Fund, Inc. (the “Company”) is an open-end registered management investment company comprised of twenty-eight portfolios. Financial statements for the Fund, a series of the Company, are included in this report.
The Company is organized under the laws of the State of Maryland and is registered with the Securities and Exchange Commission (“SEC”) under the Investment Company Act of 1940, as amended (“1940 Act”). The Fund is a diversified open-end management investment company.
The Fund is divided into Class IA and Class IB shares. Each class is offered at the per share net asset value (“NAV”) without a sales charge and is subject to the same expenses, except that the Class IB shares are subject to distribution and service fees charged pursuant to a Distribution Plan adopted in accordance with Rule 12b-1 under the 1940 Act.
Significant Accounting Policies:
The following is a summary of significant accounting policies of the Fund in the preparation of its financial statements, which are in accordance with United States Generally Accepted Accounting Principles (“U.S. GAAP”). The preparation of financial statements in accordance with U.S. GAAP may require management to make estimates and assumptions that affect the reported amounts of assets and liabilities and disclosure of contingent assets and liabilities at the date of the financial statements and the reported amounts of increases and decreases in net assets from operations during the reporting period. Actual results could differ from those estimates.
Determination of Net Asset Value – The NAV of each class of the Fund's shares is determined as of the close of regular trading (normally 4:00 p.m. Eastern Time) (the “NYSE Close”) on each day that the New York Stock Exchange (the “Exchange”) is open (“Valuation Date”). Information that becomes known to the Fund after the NAV has been calculated on a particular day will not generally be used to retroactively adjust the NAV determined earlier that day.
Investment Valuation and Fair Value Measurements – For purposes of calculating the NAV, portfolio investments and other assets held by the Fund's portfolio for which market quotes are readily available are valued at market value. Market value is generally determined on the basis of last reported sales prices or official close price. If no sales are reported, market value is based on quotes obtained from a quotation reporting system, established market makers, or independent pricing services. If market prices are not readily available or are deemed unreliable, the Fund will use the fair value of the investment as determined in good faith under policies and procedures established by and under the supervision of the Company's Board of Directors. Market quotes are considered not readily available where there is an absence of current or reliable market-based data (e.g., trade information or indicative market quotes), including where events occur after the close of the relevant market, but prior to the NYSE Close, that materially affect the values of the Fund's portfolio investments or assets. In addition, market quotes are considered not readily available when, due to extraordinary circumstances, the exchanges or markets on which the investments trade do not open for trading for the entire day and no other market prices are available. In addition, prices of foreign equities that are principally traded on certain foreign markets may be adjusted daily pursuant to a fair value pricing service approved by the Board of Directors in order to reflect an adjustment for the factors occurring after the close of certain foreign markets but before the NYSE Close. Investments that are primarily traded on foreign markets may trade on days that are not business days of the Fund. The value of the foreign investments in which the Fund invests may change on days when a shareholder will not be able to purchase or redeem shares of the Fund. Fair value pricing is subjective in nature and the use of fair value pricing by the Fund may cause the NAV of its shares to differ significantly from the NAV that would have been calculated using market prices at the close of the exchange on which a portfolio investment is primarily traded. There can be no assurance that the Fund could obtain the fair market value assigned to an investment if the Fund were to sell the investment at approximately the time at which the Fund determines its NAV.
| Hartford Healthcare HLS Fund |
Notes to Financial Statements - (continued)
June 30, 2014 (Unaudited)
(000’s Omitted)
Investments valued in currencies other than U.S. dollars are converted to U.S. dollars using exchange rates obtained from independent pricing services for calculation of the NAV. As a result, the NAV of the Fund’s shares may be affected by changes in the value of currencies in relation to the U.S. dollar. The value of investments traded in markets outside the United States or denominated in currencies other than the U.S. dollar may be affected significantly on a day that the NYSE is closed and the market value may change on days when an investor is not able to purchase, redeem or exchange shares of the Fund.
Foreign currency contracts represent agreements to exchange currencies on specific future dates at predetermined rates. Foreign currency contracts are valued using foreign currency exchange rates and forward rates as provided by an independent pricing service on the Valuation Date.
Financial instruments for which prices are not available from an independent pricing service may be valued using market quotations obtained from one or more dealers that make markets in the respective financial instrument in accordance with procedures established by the Company's Board of Directors.
U.S. GAAP defines fair value as the price that the Fund would receive to sell an asset or pay to transfer a liability in an orderly transaction between market participants. The U.S. GAAP fair value measurement standards require disclosure of a fair value hierarchy for each major category of assets and liabilities. Various inputs are used in determining the fair value of the Fund’s investments. These inputs are summarized into three broad hierarchy levels. This hierarchy is based on whether the valuation inputs are observable or unobservable. These levels are:
Level 1 – Quoted prices in active markets for identical investments. Level 1 may include exchange traded instruments, such as domestic equities, some foreign equities, options, futures, mutual funds, exchange traded funds, rights and warrants.
Level 2 – Observable inputs other than Level 1 prices, such as quoted prices for similar investments; quoted prices in markets that are not active; or other inputs that are observable or can be corroborated by observable market data. Level 2 may include debt investments that are traded less frequently than exchange traded instruments and which are valued using independent pricing services; foreign equities, which are principally traded on certain foreign markets and are adjusted daily pursuant to a fair value pricing service in order to reflect an adjustment for the factors occurring after the close of certain foreign markets but before the NYSE Close; senior floating rate interests, which are valued using an aggregate of dealer bids; short-term investments, which are valued at amortized cost; and swaps, which are valued based upon the terms of each swap contract.
Level 3 – Significant unobservable inputs that are supported by limited or no market activity. Level 3 may include financial instruments whose values are determined using indicative market quotes or require significant management judgment or estimation. These unobservable valuation inputs may include estimates for current yields, maturity/duration, prepayment speed, and indicative market quotes for comparable investments along with other assumptions relating to credit quality, collateral value, complexity of the investment structure, general market conditions and liquidity. This category may include investments where trading has been halted or there are certain restrictions on trading. While these investments are priced using unobservable inputs, the valuation of these investments reflects the best available data and management believes the prices are a reasonable representation of exit price.
The Board of Directors of the Company generally reviews and approves the “Procedures for Valuation of Portfolio Securities” at least once a year. These procedures define how investments are to be valued, including the formation and activities of a Valuation Committee. The Valuation Committee is responsible for determining in good faith the fair value of investments when the value cannot be obtained from primary pricing services or alternative sources or if the valuation of an investment as provided by the primary pricing service or alternative source is believed not to reflect the investment’s fair value as of the Valuation Date. Voting members of the Valuation Committee include the Fund's Treasurer or designee and a Vice President of the investment manager or designee. An Assistant Vice President of the Fund with legal expertise or designee is also included on the Valuation Committee as a non-voting advisory member. In addition, the Fund’s Chief Compliance Officer shall designate a member of the compliance group to attend Valuation Committee meetings as a non-voting resource, to monitor for and provide guidance with respect to compliance with these procedures. Two members of the Valuation Committee or their designees, representing different departments, shall constitute a quorum for purposes of permitting the Valuation Committee to take action. The Valuation Committee will consider all relevant factors in determining an investment’s fair value, and may seek the advice of the Fund’s sub-
| Hartford Healthcare HLS Fund |
Notes to Financial Statements - (continued)
June 30, 2014 (Unaudited)
(000’s Omitted)
adviser, knowledgeable brokers, and legal counsel in making such determination. The Valuation Committee reports to the Audit Committee of the Company's Board of Directors. The Audit Committee receives quarterly written reports which include details of all fair-valued investments, including the reason for the fair valuation, and an indication, when possible, of the accuracy of the valuation by disclosing the next available reliable public price quotation or the disposition price of such investments (the “look-back” test). The Board of Directors then must consider for ratification all of the fair value determinations made during the previous quarter.
Valuation levels are not necessarily indicative of the risk associated with investing in such investments. Individual investments within any of the above mentioned asset classes may be assigned a different hierarchical level than those presented above, as individual circumstances dictate.
For additional information, refer to the Investment Valuation Hierarchy Level Summary which follows the Schedule of Investments.
Investment Transactions and Investment Income – Investment transactions are recorded as of the trade date (the date the order to buy or sell is executed) for financial reporting purposes. Investments purchased or sold on a when-issued or delayed-delivery basis may be settled a month or more after the trade date. Realized gains and losses are determined on the basis of identified cost.
Dividend income from domestic securities is accrued on the ex-dividend date. In general, dividend income from foreign securities is recorded on the ex-date; however, dividend notifications in certain foreign jurisdictions may not be available in a timely manner and as a result, the Fund will record the dividend as soon as the relevant details (i.e., rate per share, payment date, shareholders of record, etc.) are publicly available. Interest income, including amortization of premium, accretion of discounts and additional principal received in-kind in lieu of cash, is accrued on a daily basis.
Foreign Currency Transactions – Assets and liabilities denominated in currencies other than U.S. dollars are translated into U.S. dollars at the exchange rates in effect on the valuation date. Purchases and sales of investments, income and expenses are translated into U.S. dollars at the exchange rates on the dates of such transactions.
The Fund does not isolate that portion of portfolio investment valuation resulting from fluctuations in the foreign currency exchange rates from the fluctuations arising from changes in the market prices of investments held. Exchange rate fluctuations are included with the net realized and unrealized gain or loss on investments in the accompanying financial statements.
Net realized foreign exchange gains or losses arise from sales of foreign currencies and the difference between asset and liability amounts initially stated in foreign currencies and the U.S. dollar value of the amounts actually received or paid. Net unrealized foreign exchange gains or losses arise from changes in the value of other assets and liabilities at the end of the reporting period, resulting from changes in the exchange rates.
Joint Trading Account – The Fund may invest cash balances into a joint trading account that may be invested in one or more repurchase agreements.
Fund Share Valuation and Dividend Distributions to Shareholders – Orders for the Fund’s shares are executed in accordance with the investment instructions of the contract holders and plan participants. The NAV of the Fund’s shares is determined as of the close of business on each business day of the Exchange. The NAV is determined separately for each class of shares of the Fund by dividing the Fund’s net assets attributable to that class by the number of shares of the class outstanding. Each class of shares offered by the Fund has equal rights as to assets and voting privileges (except that shareholders of a class have exclusive voting rights regarding any matter relating solely to that class of shares). Income and non-class specific expenses are allocated daily to each class on the basis of the relative net assets of the class. Realized and unrealized gains and losses are allocated daily based on the relative net assets of each class of shares of the Fund.
Orders for the purchase of the Fund’s shares received prior to the close of the Exchange on any day the Exchange is open for business are priced at the NAV determined as of the close of the Exchange. Orders received after the close of the Exchange, or on a day on which the Exchange and/or the Fund is not open for business, are priced at the next determined NAV.
| Hartford Healthcare HLS Fund |
Notes to Financial Statements - (continued)
June 30, 2014 (Unaudited)
(000’s Omitted)
Dividends are declared pursuant to a policy adopted by the Company's Board of Directors based upon the investment performance of the Fund. The policy of the Fund is to pay dividends from net investment income and realized gains, if any, at least once a year.
Distributions from net investment income, net realized gains and capital are determined in accordance with federal income tax regulations, which may differ from U.S. GAAP with respect to character and timing. These differences may include, but are not limited to, losses deferred due to wash sale adjustments, foreign currency gains and losses, adjustments related to Passive Foreign Investment Companies ("PFICs"), Real Estate Investment Trusts ("REITs"), Regulated Investment Companies ("RICs"), certain derivatives and partnerships. Permanent book and federal income tax basis differences relating to shareholder distributions will result in reclassifications to certain of the Fund’s capital accounts (see Federal Income Taxes: Reclassification of Capital Accounts note).
Securities and Other Investments:
Repurchase Agreements – A repurchase agreement is an agreement by which a counterparty agrees to sell an investment and agrees to repurchase the investment sold from the buyer at a mutually agreed upon time and price. During the period of the repurchase agreement, the counterparty will deposit cash and or securities in a third party custodial account to serve as collateral. At the time the Fund enters into a repurchase agreement, the value of the underlying collateral, including accrued interest, will be equal to or exceed the value of the repurchase agreement. Repurchase agreements expose the Fund to counterparty risk - that is, the risk that the counterparty will not fulfill its obligations. To minimize counterparty risk, the investments that serve to collateralize the repurchase agreement are held by the Fund’s custodian in book entry or physical form in the custodial account of the Fund or in a third party custodial account. Repurchase agreements are valued at cost plus accrued interest, which approximates fair value. Repurchase agreements have master netting arrangements which allow the Fund to offset amounts owed to a counterparty with amounts owed by the counterparty, including any collateral. Upon an event of default under a master repurchase agreement, the non-defaulting party may close out all transactions traded under such agreement and net amounts owed under each transaction to one net amount payable by one party to the other. Absent an event of default, the master repurchase agreement does not result in an offset of reported amounts of assets and liabilities in the Statement of Assets and Liabilities across transactions between the Fund and the applicable counterparty. The Fund, as shown on the Schedule of Investments, had outstanding repurchase agreements and related collateral as of June 30, 2014.
Investments Purchased on a When-Issued or Delayed-Delivery Basis – Delivery and payment for investments that have been purchased by the Fund on a forward commitment, or when-issued or delayed-delivery basis, take place beyond the customary settlement period. The Fund may dispose of or renegotiate a delayed-delivery transaction after it is entered into, and may sell delayed-delivery investments before they are delivered, which may result in a realized gain or loss. During this period, such investments are subject to market fluctuations, and the Fund identifies investments segregated in its records with a value at least equal to the amount of the commitment. The Fund had no when-issued or delayed-delivery investments as of June 30, 2014.
Financial Derivative Instruments:
The following disclosures contain information on how and why the Fund uses derivative instruments, the credit-risk-related contingent features in certain derivative instruments, and how derivative instruments affect the Fund’s financial position and results of operations. The location and fair value amounts of these instruments on the Statement of Assets and Liabilities and the realized gains and losses and changes in unrealized gains and losses on the Statement of Operations, each categorized by type of derivative contract, are included in the following Additional Derivative Instrument Information footnote. The derivative instruments outstanding as of period-end are disclosed in the notes to or within the Schedule of Investments for purchased options, if applicable. The amounts of realized gains and losses and changes in unrealized gains and losses on derivative instruments during the period are disclosed in the Statement of Operations.
Foreign Currency Contracts – The Fund may enter into foreign currency contracts that obligate the Fund to purchase or sell currencies at specified future dates. Foreign currency contracts are used to hedge the currency exposure associated with some or all of the Fund’s investments and/or as part of an investment strategy. Foreign currency contracts are marked to market daily and the change in value is recorded by the Fund as an unrealized gain or loss. The Fund will record a realized gain or loss when the foreign currency contract is settled.
| Hartford Healthcare HLS Fund |
Notes to Financial Statements - (continued)
June 30, 2014 (Unaudited)
(000’s Omitted)
Foreign currency contracts involve elements of market risk in excess of the amounts reflected in the Statement of Assets and Liabilities. In addition, risks may arise upon entering into these contracts from the potential inability of the counterparties to meet the terms of the contracts and from unanticipated movements in the value of the foreign currencies relative to the U.S. dollar. The Fund, as shown on the Schedule of Investments, had outstanding foreign currency contracts as of June 30, 2014.
Additional Derivative Instrument Information:
Fair Value of Derivative Instruments on the Statement of Assets and Liabilities as of June 30, 2014:
| | | Risk Exposure Category | |
| | | Interest Rate
Contracts | | | Foreign
Exchange
Contracts | | | Credit
Contracts | | | Equity
Contracts | | | Commodity
Contracts | | | Other
Contracts | | | Total | |
| | | | | | | | | | | | | | | | | | | | | | |
| Liabilities: | | | | | | | | | | | | | | | | | | | | | | | | | | | | |
| Unrealized depreciation on foreign currency contracts | | $ | — | | | $ | 46 | | | $ | — | | | $ | — | | | $ | — | | | $ | — | | | $ | 46 | |
| Total | | $ | — | | | $ | 46 | | | $ | — | | | $ | — | | | $ | — | | | $ | — | | | $ | 46 | |
The volume of derivatives that is presented in the Schedule of Investments is consistent with the derivative activity during the six-month period ended June 30, 2014.
The Effect of Derivative Instruments on the Statement of Operations for the six-month period ended June 30, 2014:
| | | Risk Exposure Category | |
| | | Interest Rate
Contracts | | | Foreign
Exchange
Contracts | | | Credit
Contracts | | | Equity
Contracts | | | Commodity
Contracts | | | Other
Contracts | | | Total | |
| Realized Loss on Derivatives Recognized as a Result of Operations: |
| Net realized loss on foreign currency contracts | | $ | — | | | $ | (50 | ) | | $ | — | | | $ | — | | | $ | — | | | $ | — | | | $ | (50 | ) |
| Total | | $ | — | | | $ | (50 | ) | | $ | — | | | $ | — | | | $ | — | | | $ | — | | | $ | (50 | ) |
| | | | | | | | | | | | | | | | | | | | | | | | | | | | | |
| Net Change in Unrealized Appreciation (Depreciation) on Derivatives Recognized as a Result of Operations: | | | |
| Net change in unrealized depreciation of foreign currency contracts | | $ | — | | | $ | (162 | ) | | $ | — | | | $ | — | | | $ | — | | | $ | — | | | $ | (162 | ) |
| Total | | $ | — | | | $ | (162 | ) | | $ | — | | | $ | — | | | $ | — | | | $ | — | | | $ | (162 | ) |
Balance Sheet Offsetting Information - Set forth below are tables which disclose both gross information and net information about instruments and transactions eligible for offset in the financial statements, and instruments and transactions that are subject to a master netting arrangement, as well as amounts related to margin, reflected as financial collateral (including cash collateral), held at clearing brokers, counterparties and the Fund’s custodian. The master netting arrangements allow the clearing brokers to net any collateral held in or on behalf of the Fund, or liabilities or payment obligations of the clearing brokers to the Fund, against any liabilities or payment obligations of the Fund to the clearing brokers. The Fund is required to deposit financial collateral (including cash collateral) at the Futures Commission Merchant's ("FCM") custodian on behalf of clearing brokers and counterparties to continually meet the original and maintenance requirements established by the clearing brokers and counterparties. Such requirements are specific to the respective clearing broker or counterparty. Certain master netting arrangements may not be enforceable in a bankruptcy.
| Hartford Healthcare HLS Fund |
Notes to Financial Statements - (continued)
June 30, 2014 (Unaudited)
(000’s Omitted)
Offsetting of Financial Liabilities and Derivative Liabilities as of June 30, 2014:
| | | Gross Amounts*
of Liabilities
Presented in
Statement of
Assets and
Liabilities | | | Financial
Instruments with
Allowable Netting | | | Non-cash
Collateral
Pledged | | | Cash Collateral
Pledged | | | Net Amount (not
less than $0) | |
| Description | | | | | | | | | | | | | | | | | | | | |
| Unrealized depreciation on foreign currency contracts | | $ | 46 | | | $ | — | | | $ | — | | | $ | — | | | $ | 46 | |
| Total subject to a master netting or similar arrangement | | $ | 46 | | | $ | — | | | $ | — | | | $ | — | | | $ | 46 | |
* Gross amounts presented as no amounts are netted within the Statement of Assets and Liabilities.
Principal Risks:
The Fund may be exposed to counterparty risk, or the risk that an institution or other entity with which the Fund has unsettled or open transactions will default.
If the Fund invests directly in foreign currencies or in securities that trade in, and receive revenues in, foreign currencies, or in derivatives that provide exposure to foreign currencies, it will be subject to the risk that those currencies will decline in value relative to the base currency (U.S. dollars) of the Fund, or, in the case of hedging positions, that the Fund’s base currency will decline in value relative to the currency being hedged. Currency rates in foreign countries may fluctuate significantly over short periods of time for a number of reasons, including changes in interest rates, intervention (or the failure to intervene) by U.S. or foreign governments, central banks or supranational entities, such as the International Monetary Fund, or by the imposition of currency controls or other political developments in the United States or abroad. As a result, the Fund’s investments in foreign currency denominated securities may reduce the returns of the Fund. The market values of equity securities, such as common stocks and preferred stocks, or equity related investments, such as futures and options, may decline due to general market conditions which are not specifically related to a particular company, such as real or perceived adverse economic conditions, changes in the general outlook for corporate earnings, changes in interest or currency rates or adverse investor sentiment generally. The market value of equity securities may also decline due to factors which affect a particular industry or industries, such as labor shortages or increased production costs and competitive conditions within an industry. Equity securities and equity related investments generally have greater market price volatility than fixed income securities.
Federal Income Taxes:
Federal Income Taxes – For federal income tax purposes, the Fund intends to continue to qualify as a RIC under Subchapter M of the Internal Revenue Code (“IRC”) by distributing substantially all of its taxable net investment income and net realized capital gains to its shareholders and otherwise complying with the requirements of the IRC. The Fund has distributed substantially all of its income and capital gains in prior years, if applicable, and intends to distribute substantially all of its income and capital gains prior to the next fiscal year-end. Accordingly, no provision for federal income or excise taxes has been made in the accompanying financial statements. Distributions from short-term capital gains are treated as ordinary income distributions for federal income tax purposes.
Net Investment Income (Loss), Net Realized Gains (Losses) and Distributions – Net investment income (loss) and net realized gains (losses) may differ for financial statement and tax purposes primarily because of losses deferred due to wash sale adjustments, foreign currency gains and losses, adjustments related to PFICs, REITs, RICs, certain derivatives and partnerships. The character of distributions made during the year from net investment income or net realized gains may differ from their ultimate characterization for federal income tax purposes. Also, due to the timing of dividend distributions, the fiscal year in which amounts are distributed may differ from the year that the income or realized gains (losses) were recorded by the Fund.
| Hartford Healthcare HLS Fund |
Notes to Financial Statements - (continued)
June 30, 2014 (Unaudited)
(000’s Omitted)
Distributions and Components of Distributable Earnings – The tax character of distributions paid by the Fund for the periods indicated is as follows (as adjusted for dividends payable, if applicable):
| | | For the Year Ended
December 31, 2013 | | | For the Year Ended
December 31, 2012 | |
| Ordinary Income | | $ | 1,226 | | | $ | 650 | |
| Long-Term Capital Gains* | | | 16,435 | | | | — | |
* The Fund designates these distributions as long-term capital gain dividends pursuant to IRC Sec. 852(b)(3)(C).
As of December 31, 2013, the Fund’s components of distributable earnings (deficit) on a tax basis are as follows:
| | | Amount | |
| Undistributed Ordinary Income | | $ | 4,632 | |
| Undistributed Long-Term Capital Gain | | | 22,124 | |
| Unrealized Appreciation* | | | 97,484 | |
| Total Accumulated Earnings | | $ | 124,240 | |
| * | Differences between book-basis and tax-basis unrealized appreciation (depreciation) may be attributable to the losses deferred due to wash sale adjustments, foreign currency gains and losses, adjustments related to PFICs, REITs, RICs, certain derivatives and partnerships. |
Reclassification of Capital Accounts – The Fund may record reclassifications in its capital accounts. These reclassifications have no impact on the total net assets of the Fund. The reclassifications are a result of permanent differences between U.S. GAAP and tax accounting for such items as foreign currency, PFICs, expiration or utilization of capital loss carryforwards or net operating losses. Adjustments are made to reflect the impact these items have on current and future distributions to shareholders. Therefore, the source of the Fund’s distributions may be shown in the accompanying Statement of Changes in Net Assets as from undistributed net investment income, from accumulated net realized gains on investments or from capital depending on the type of book and tax differences that exist. For the year ended December 31, 2013, the Fund recorded reclassifications to increase (decrease) the accounts listed below:
| | | Amount | |
| Undistributed Net Investment Income (Loss) | | $ | (18 | ) |
| Accumulated Net Realized Gain (Loss) | | | 18 | |
Capital Loss Carryforward – On December 22, 2010, the Regulated Investment Company Modernization Act of 2010 (the “Act”) was enacted, which made changes to the capital loss carryforward rules. The changes are effective for taxable years beginning after the date of enactment. Under the Act, funds are permitted to carry forward capital losses for an unlimited period. Additionally, capital loss carryforwards retain their character as either short-term or long-term capital losses rather than being considered all short-term as permitted under prior regulation.
The Fund had no capital loss carryforward for U.S. federal income tax purposes as of December 31, 2013.
Accounting for Uncertainty in Income Taxes – The Fund has adopted financial reporting rules that require the Fund to analyze all open tax years, as defined by the statute of limitations, for all major jurisdictions. Generally, tax authorities can examine all tax returns filed for the last three years. The Fund does not have an examination in progress.
The Fund has reviewed all open tax years and major jurisdictions and concluded that these financial reporting rules had no effect on the Fund’s financial position or results of operations. There is no tax liability resulting from unrecognized tax benefits relating to uncertain income tax positions taken or expected to be taken on the tax return for the fiscal year ended December 31, 2013. The Fund is also not aware of any tax positions for which it is reasonably possible that the total amounts of unrecognized tax benefits will significantly change in the next twelve months.
| Hartford Healthcare HLS Fund |
Notes to Financial Statements - (continued)
June 30, 2014 (Unaudited)
(000’s Omitted)
Expenses:
Investment Management Agreement – Hartford Funds Management Company, LLC ("HFMC") serves as the Fund’s investment manager pursuant to an Investment Management Agreement with the Company. HFMC is an indirect wholly owned subsidiary of The Hartford Financial Services Group, Inc. ("The Hartford"). The investment manager has overall investment supervisory responsibility for the Fund. In addition, the investment manager provides administrative personnel, services, equipment, facilities and office space for proper operation of the Fund. HFMC has contracted with Wellington Management Company, LLP ("Wellington Management") under a sub-advisory agreement for the provision of day-to-day investment management services to the Fund in accordance with the Fund’s investment objective and policies. The Fund pays a fee to the investment manager, a portion of which may be used to compensate Wellington Management.
The schedule below reflects the rates of compensation paid to the investment manager for investment management services rendered as of June 30, 2014; the rates are accrued daily and paid monthly:
| Average Daily Net Assets | | Annual Fee |
| On first $250 million | | 0.8500% |
| On next $250 million | | 0.8000% |
| On next $4.5 billion | | 0.7500% |
| On next $5 billion | | 0.7475% |
| Over $10 billion | | 0.7450% |
Accounting Services Agreement – Pursuant to the Fund Accounting Agreement between HFMC and the Company, on behalf of the Fund, HFMC provides accounting services to the Fund and receives monthly compensation based on the Fund’s average daily net assets at the rates set forth below. The Fund’s accounting services fees are accrued daily and paid monthly.
| Average Daily Net Assets | | Annual Fee |
| All Assets | | 0.010% |
Operating Expenses – Allocable expenses incurred by the Company are allocated to each Fund and allocated to classes within a Fund in proportion to the average daily net assets of the Fund and each class, except where allocation of certain expenses is more fairly made directly to the Fund or to specific classes within a Fund.
Fees Paid Indirectly – The Company, on behalf of the Fund, has entered into agreements with State Street Global Markets, LLC and Russell Implementation Services, Inc. to partially recapture non-discounted trade commissions. Such rebates are used to pay a portion of the Fund's expenses. For the six-month period ended June 30, 2014, this amount, if any, is included in the Statement of Operations.
The ratio of expenses to average net assets in the accompanying financial highlights excludes the reduction in expenses related to fees paid indirectly. The annualized expense ratio after waivers for the period listed below reflecting the reduction for fees paid indirectly is as follows:
| | | Annualized Six-
Month Period Ended
June 30, 2014 | |
| Class IA | | 0.88% | |
| Class IB | | 1.13 | |
Distribution Plan for Class IB Shares – Hartford Funds Distributors, LLC (“HFD”), an indirect wholly owned subsidiary of The Hartford, is the principal underwriter and distributor of the Fund. The Company, on behalf of the Fund, has adopted a Distribution Plan pursuant to Rule 12b-1 of the 1940 Act for Class IB shares.
| Hartford Healthcare HLS Fund |
Notes to Financial Statements - (continued)
June 30, 2014 (Unaudited)
(000’s Omitted)
The Distribution Plan provides that the Fund may pay annually up to 0.25% of the average daily net assets of the Fund attributable to its Class IB shares for activities primarily intended to result in the sale of Class IB shares. The Board has the authority to suspend or reduce these payments at any point in time. Under the terms of the Distribution Plan and the principal underwriting agreement, the Fund is authorized to make payments monthly to the distributor that may be used to pay or reimburse entities providing distribution and shareholder servicing with respect to the Class IB shares for such entities’ fees or expenses incurred or paid in that regard. The distribution fee paid during the period can be found on the Statement of Operations. These fees are accrued daily and paid monthly.
Other Related Party Transactions – Hartford Administrative Services Company (“HASCO”), an indirect wholly owned subsidiary of The Hartford, provides transfer agent services to the Fund. HASCO was compensated on a per account basis for providing such services. The amount paid to HASCO can be found in the Statement of Operations. These fees are accrued daily and paid monthly.
Payment from Affiliate – In July of 2007, The Hartford entered into a settlement with the Attorneys General of the states of New York, Connecticut and Illinois relating to market timing and the company's individual variable annuity contracts in which certain payments would be made directly to the variable annuity contract holders. The distribution plan provided that unclaimed money from the settlement would be distributed to certain HLS Funds that are investment options through a Hartford individual variable annuity contract. The unclaimed money was distributed to the Fund on September 18, 2009.
The total return in the accompanying financial highlights includes a payment from an affiliate. Had the payment from the affiliate been excluded, the impact and total return for the period listed below would have been as follows:
| | | For the Year Ended December 31, 2009 | |
| | | Class IA | | | Class IB | |
| Impact from Payment from Affiliate for Attorneys General Settlement | | | 0.01% | | | | 0.01% | |
| Total Return Excluding Payment from Affiliate | | | 22.70% | | | | 22.39% | |
Investment Transactions:
For the six-month period ended June 30, 2014, the cost of purchases and proceeds from sales of investment securities (excluding short-term investments) were as follows:
| | | Excluding U.S.
Government
Obligations | | | U.S.
Government
Obligations | | | Total | |
| Cost of Purchases | | $ | 54,862 | | | $ | — | | | $ | 54,862 | |
| Sales Proceeds | | | 65,564 | | | | — | | | | 65,564 | |
Line of Credit:
The Fund is one of several Hartford Funds that participate in a $500 million committed revolving line of credit facility. The facility is to be used for temporary or emergency purposes. Under the arrangement, the funds are required to own securities having a market value in excess of 300% of the total bank borrowings. The interest rate on borrowings varies depending on the nature of the loan. The facility also requires a fee to be paid based on the amount of the commitment. This commitment fee is allocated to all the funds participating in the line of credit based on the average net assets of the funds. During the six-month period ended June 30, 2014, the Fund did not have any borrowings under this facility.
Industry Classifications:
Other than the industry classifications "Other Investment Pools and Funds" and "Exchange Traded Funds," equity industry classifications used in this report are the Global Industry Classification Standard, which was developed by and is the exclusive property and service mark of MSCI, Inc. and Standard & Poor's.
| Hartford Healthcare HLS Fund |
Notes to Financial Statements - (continued)
June 30, 2014 (Unaudited)
(000’s Omitted)
Indemnifications:
Under the Company's organizational documents, the Company shall indemnify its officers and directors to the full extent required or permitted under Maryland General Corporation Law and the federal securities laws. In addition, the Company, on behalf of the Fund, may enter into contracts that contain a variety of indemnifications. The Company's maximum exposure under these arrangements is unknown. However, as of the date of these financial statements, the Company has not had prior claims or losses pursuant to these contracts and expects the risk of loss to be remote.
Pending Legal Proceedings:
On February 25, 2011, Jennifer L. Kasilag, Louis Mellinger, Judith M. Menendez, Jacqueline M. Robinson, and Linda A. Russell filed a derivative lawsuit against Hartford Investment Financial Services, LLC (“HIFSCO”) (now known as Hartford Funds Distributors, LLC) on behalf of six Hartford retail mutual funds in the United States District Court for the District of New Jersey, alleging that HIFSCO received excessive advisory and distribution fees in violation of its statutory fiduciary duty under Section 36(b) of the 1940 Act when serving as investment manager and principal underwriter, respectively, to the Hartford retail mutual funds. Although this action was purportedly filed on behalf of certain of the Hartford Funds, none of the Hartford Funds is itself a defendant to the suit. HIFSCO moved to dismiss and, in September 2011, the motion was granted in part and denied in part, with leave to amend the complaint. In November 2011, plaintiffs filed an amended complaint on behalf of certain Hartford retail mutual funds, The Hartford Global Health Fund (now known as The Hartford Healthcare Fund), The Hartford Conservative Allocation Fund, The Hartford Growth Opportunities Fund, The Hartford Inflation Plus Fund, The Hartford Advisers Fund (now known as The Hartford Balanced Fund), and The Hartford Capital Appreciation Fund. Plaintiffs seek to rescind the investment management agreements and distribution plans between HIFSCO and these funds and to recover the total fees charged thereunder or, in the alternative, to recover any improper compensation HIFSCO received, in addition to lost earnings. HIFSCO filed a partial motion to dismiss the amended complaint and, in December 2012, the court dismissed without prejudice the claims regarding distribution fees and denied the motion with respect to the advisory fees claims. HIFSCO disputes the allegations and intends to defend vigorously.
In March 2014, the plaintiffs filed a new complaint that added as new plaintiffs The Hartford Floating Rate Fund and The Hartford Small Company Fund and named as a defendant Hartford Funds Management Company, LLC (the “Investment Manager”), which assumed the role as investment adviser to the funds as of January 2013. The Investment Manager and HIFSCO dispute the allegations and intend to defend vigorously.
This action concerns the activities of HIFSCO in its capacity as investment manager and principal underwriter to the Hartford retail mutual funds and does not concern HIFSCO’s activities in its capacity as principal underwriter to the HLS funds. For this reason, no accrual for litigation relating to this matter has been recorded in the financial statements of the Fund.
| Hartford Healthcare HLS Fund |
Financial Highlights
| | | | ─ Selected Per-Share Data(A ) ─ | | | ─ Ratios and Supplemental Data ─ |
Class | | | Net Asset
Value at
Beginning
of Period | | | Net
Investment
Income
(Loss) | | | Net
Realized
and
Unrealized
Gain (Loss)
on
Investments | | | Total from
Investment
Operations | | | Dividends
from Net
Investment
Income | | | Distributions
from
Realized
Capital
Gains | | | Total
Dividends
and
Distributions | | | Net
Asset
Value at
End of
Period | | | Total
Return(B) | | | Net
Assets
at End of
Period
(000s) | | | Ratio of
Expenses
to
Average
Net
Assets
Before
Adjust-
ments(C) | | | Ratio of
Expenses
to
Average
Net
Assets
After
Adjust-
ments(C) | | | Ratio of
Net
Investment
Income
(Loss) to
Average
Net Assets | |
| | | | | | | | | | | | | | | | | | | | | | | | | | | | | | | | | | | | | | | | | |
| For the Six-Month Period Ended June 30, 2014 (Unaudited) | |
| IA | | | $ | 25.67 | | | $ | – | | | $ | 3.20 | | | $ | 3.20 | | | $ | – | | | $ | – | | | $ | – | | | $ | 28.87 | | | | 12.47 | %(D) | | $ | 256,390 | | | | 0.88 | %(E) | | | 0.88 | %(E) | | | 0.02 | %(E) |
| IB | | | | 25.07 | | | | (0.03 | ) | | | 3.11 | | | | 3.08 | | | | – | | | | – | | | | – | | | | 28.15 | | | | 12.29 | (D) | | | 59,152 | | | | 1.13 | (E) | | | 1.13 | (E) | | | (0.24 | )(E) |
| | | | | | | | | | | | | | | | | | | | | | | | | | | | | | | | | | | | | | | | | | | | | | | | | | | | | | |
| For the Year Ended December 31, 2013 |
| IA | | | $ | 18.11 | | | $ | 0.04 | | | $ | 9.12 | | | $ | 9.16 | | | $ | (0.12 | ) | | $ | (1.48 | ) | | $ | (1.60 | ) | | $ | 25.67 | | | | 51.84 | % | | $ | 243,719 | | | | 0.89 | % | | | 0.89 | % | | | 0.19 | % |
| IB | | | | 17.71 | | | | (0.01 | ) | | | 8.92 | | | | 8.91 | | | | (0.07 | ) | | | (1.48 | ) | | | (1.55 | ) | | | 25.07 | | | | 51.50 | | | | 57,187 | | | | 1.14 | | | | 1.14 | | | | (0.06 | ) |
| | | | | | | | | | | | | | | | | | | | | | | | | | | | | | | | | | | | | | | | | | | | | | | | | | | | | | |
| For the Year Ended December 31, 2012 (F) |
| IA | | | $ | 15.07 | | | $ | 0.13 | | | $ | 2.98 | | | $ | 3.11 | | | $ | (0.07 | ) | | $ | – | | | $ | (0.07 | ) | | $ | 18.11 | | | | 20.62 | % | | $ | 149,801 | | | | 0.91 | % | | | 0.91 | % | | | 0.69 | % |
| IB | | | | 14.74 | | | | 0.09 | | | | 2.90 | | | | 2.99 | | | | (0.02 | ) | | | – | | | | (0.02 | ) | | | 17.71 | | | | 20.32 | | | | 45,306 | | | | 1.16 | | | | 1.16 | | | | 0.43 | |
| | | | | | | | | | | | | | | | | | | | | | | | | | | | | | | | | | | | | | | | | | | | | | | | | | | | | | |
| For the Year Ended December 31, 2011 (F) |
| IA | | | $ | 13.89 | | | $ | 0.06 | | | $ | 1.13 | | | $ | 1.19 | | | $ | (0.01 | ) | | $ | – | | | $ | (0.01 | ) | | $ | 15.07 | | | | 8.54 | % | | $ | 137,088 | | | | 0.91 | % | | | 0.91 | % | | | 0.33 | % |
| IB | | | | 13.61 | | | | 0.02 | | | | 1.11 | | | | 1.13 | | | | – | | | | – | | | | – | | | | 14.74 | | | | 8.27 | | | | 48,933 | | | | 1.16 | | | | 1.16 | | | | 0.08 | |
| | | | | | | | | | | | | | | | | | | | | | | | | | | | | | | | | | | | | | | | | | | | | | | | | | | | | | |
| For the Year Ended December 31, 2010 (F) |
| IA | | | $ | 12.99 | | | $ | 0.08 | | | $ | 0.84 | | | $ | 0.92 | | | $ | (0.02 | ) | | $ | – | | | $ | (0.02 | ) | | $ | 13.89 | | | | 7.10 | % | | $ | 137,454 | | | | 0.90 | % | | | 0.90 | % | | | 0.55 | % |
| IB | | | | 12.74 | | | | 0.04 | | | | 0.83 | | | | 0.87 | | | | – | | | | – | | | | – | | | | 13.61 | | | | 6.84 | | | | 54,753 | | | | 1.15 | | | | 1.15 | | | | 0.30 | |
| | | | | | | | | | | | | | | | | | | | | | | | | | | | | | | | | | | | | | | | | | | | | | | | | | | | | | |
| For the Year Ended December 31, 2009 (F) |
| IA | | | $ | 10.66 | | | $ | 0.07 | | | $ | 2.35 | | | $ | 2.42 | | | $ | (0.07 | ) | | $ | (0.02 | ) | | $ | (0.09 | ) | | $ | 12.99 | | | | 22.72 | %(G) | | $ | 154,216 | | | | 0.91 | % | | | 0.91 | % | | | 0.51 | % |
| IB | | | | | 10.46 | | | | 0.03 | | | | 2.31 | | | | 2.34 | | | | (0.04 | ) | | | (0.02 | ) | | | (0.06 | ) | | | 12.74 | | | | 22.41 | (G) | | | 63,065 | | | | 1.16 | | | | 1.16 | | | | 0.26 | |
| (A) | Information presented relates to a share outstanding throughout the indicated period. Net investment income (loss) per share amounts are calculated based on average shares outstanding unless otherwise noted. |
| (B) | The figures do not include sales charges or other fees which may be applied at the variable life insurance, variable annuity or qualified retirement plan product level. Any such additional sales charges or other fees would lower the Fund's performance. |
| (C) | Adjustments include waivers and reimbursements, if applicable. Ratios do not include fees paid indirectly (see Expenses in the accompanying Notes to Financial Statements). |
| (F) | Net investment income (loss) per share amounts have been calculated using the SEC method. |
| (G) | Total return without the inclusion of the Payment from (to) Affiliate can be found in Expenses in the accompanying Notes to Financial Statements. |
| | | Portfolio Turnover
Rate for
All Share Classes | |
| For the Six-Month Period Ended June 30, 2014 (Unaudited) | | | 18% | |
| For the Year Ended December 31, 2013 | | | 33 | |
| For the Year Ended December 31, 2012 | | | 46 | |
| For the Year Ended December 31, 2011 | | | 45 | |
| For the Year Ended December 31, 2010 | | | 32 | |
| For the Year Ended December 31, 2009 | | | 73 | |
| Hartford Healthcare HLS Fund |
Directors and Officers (Unaudited)
The Board of Directors of the Company (the "Directors") appoints officers who are responsible for the day-to-day operations of the Fund and who execute policies formulated by the Directors. Each Director serves until his or her death, resignation, or retirement or until the next annual meeting of shareholders is held or until his or her successor is elected and qualifies.
Directors and officers who are employed by or who have a financial interest in The Hartford are considered “interested” persons of the Fund pursuant to the 1940 Act. Each officer and two of the Company's Directors, as noted in the chart below, are “interested” persons of the Fund. Each Director serves as a director for The Hartford Mutual Funds, Inc., The Hartford Mutual Funds II, Inc., Hartford Series Fund, Inc., and Hartford HLS Series Fund II, Inc., and as a trustee for The Hartford Alternative Strategies Fund, which, as of June 30, 2014, collectively consist of 78 funds. Correspondence may be sent to Directors and officers c/o Hartford Funds, 5 Radnor Corporate Center, Suite 300, 100 Matsonford Road, Radnor, Pennsylvania 19087, except that correspondence to Mr. Annoni, Mr. Dressen and Ms. Quade may be sent to 500 Bielenberg Drive, Suite 500, Woodbury, Minnesota 55125.
The table below sets forth, for each Director and officer, his or her name, year of birth, current position with the Company and date first elected or appointed to Hartford Series Fund, Inc. ("HSF") and Hartford HLS Series Fund II, Inc. ("HSF2"), principal occupation, and, for Directors, other directorships held. The Fund’s Statement of Additional Information contains further information on the Directors and is available free of charge by calling 1-888-843-7824 or writing to: Hartford HLS Funds, c/o Hartford Life Insurance Company/Hartford Life and Annuity Insurance Company, P.O. Box 14293, Lexington, KY 40512-4293 for variable annuity and variable life insurance separate accounts of Hartford Life Insurance Company and its affiliates; Hartford Funds, P.O. Box 55022, Boston, MA 02205-5022 for all shareholders except variable annuity and variable life insurance separate accounts of Hartford Life Insurance Company and its affiliates.
Information on the aggregate remuneration paid to the directors of the Company can be found in the Statement of Operations herein. The Fund pays to The Hartford a portion of the Chief Compliance Officer’s compensation, but does not pay salaries or compensation to any of its other officers or Directors who are employed by The Hartford.
Non-Interested Directors
Lynn S. Birdsong (1946) Director since 2003, Co-Chairman of the Investment Committee since 2005
Mr. Birdsong is a private investor. Mr. Birdsong currently serves as a Director of the Sovereign High Yield Investment Company (April 2010 to current). Mr. Birdsong currently serves as an Independent Director of Nomura Partners Funds, Inc. (formerly, The Japan Fund) (April 2003 to current). From 2003 to March 2005, Mr. Birdsong was an Independent Director of the Atlantic Whitehall Funds. From 1979 to 2002, Mr. Birdsong was a Managing Director of Zurich Scudder Investments, an investment management firm. During his employment with Scudder, Mr. Birdsong was an Interested Director of The Japan Fund. From January 1981 through December 2013, Mr. Birdsong was a partner in Birdsong Company, an advertising specialty firm.
Robert M. Gavin, Jr. (1940) Director since 2002 (HSF) and 1986 (HSF2), Chairman of the Board since 2004
Dr. Gavin is an educational consultant. Prior to September 1, 2001, he was President of Cranbrook Education Community and prior to July 1996, he was President of Macalester College, St. Paul, Minnesota.
Duane E. Hill (1945) Director since 2001 (HSF) and 2002 (HSF2), Chairman of the Nominating Committee since 2003
Mr. Hill is a Partner of TSG Ventures L.P., a private equity investment company. Mr. Hill is a former partner of TSG Capital Group, a private equity investment firm that served as sponsor and lead investor in leveraged buyouts of middle market companies.
Sandra S. Jaffee (1941) Director since 2005
Ms. Jaffee is the founder and Chief Executive Officer of a private company, Homeworks Concierge, LLC, which provides residential property management services in Westchester County, New York (January 2012 to present). Ms. Jaffee served as Chairman (2008 to 2009) and Chief Executive Officer of Fortent (formerly Searchspace Group), a leading provider of compliance/regulatory technology to financial institutions from August 2005 to August 2009. From August 2004 to August 2005, Ms. Jaffee served as an Entrepreneur in Residence with Warburg Pincus, a private equity firm. Prior to joining Warburg Pincus, Ms. Jaffee served as Executive Vice President at Citigroup, from September 1995 to July 2004, where she was President and Chief Executive Officer of Citibank’s Global Securities Services (1995 to 2003). Ms. Jaffee currently serves as a member of the Board of Directors of Broadridge Financial Solutions as well as a Trustee of Muhlenberg College.
| Hartford Healthcare HLS Fund |
Directors and Officers (Unaudited) – (continued)
William P. Johnston (1944) Director since 2005, Chairman of the Compliance Committee since 2005
In June 2006, Mr. Johnston was appointed as Senior Advisor to The Carlyle Group, a global private equity and other alternative asset investment firm and currently serves as an Operating Executive. In July 2006, Mr. Johnston was elected to the Board of Directors of MultiPlan, Inc. and served as a Director (July 2006 to August 2010). In August 2007, Mr. Johnston was elected to the Board of Directors of LifeCare Holdings, Inc. and served as a Director (August 2007 to June 2013). In February 2008, Mr. Johnston was elected to the Board of Directors of HCR-ManorCare, Inc. In May 2006, Mr. Johnston was elected to the Supervisory Board of Fresenius Medical Care AG & Co. KGaA, after its acquisition of Renal Care Group, Inc. in March 2006. Mr. Johnston joined Renal Care Group in November 2002 as a member of the Board of Directors and served as Chairman of the Board from March 2003 through March 2006. From 2002 through 2013, Mr. Johnston served as a Board member of the Georgia O’Keefe Museum. From September 1987 to December 2002, Mr. Johnston was with Equitable Securities Corporation (and its successors, SunTrust Equitable Securities and SunTrust Robinson Humphrey) serving in various investment banking and managerial positions, including Managing Director and Head of Investment Banking, Chief Executive Officer and Vice Chairman.
Phillip O. Peterson (1944) Director since 2002 (HSF) and 2000 (HSF2), Chairman of the Audit Committee since 2002
Mr. Peterson is a mutual fund industry consultant. He was a partner of KPMG LLP (an accounting firm) until July 1999. Mr. Peterson joined William Blair Funds in February 2007 as a member of the Board of Trustees. From February 2012 to February 2014, Mr. Peterson served as a Trustee of Symetra Variable Mutual Funds. From January 2004 to April 2005, Mr. Peterson served as Independent President of the Strong Mutual Funds.
Lemma W. Senbet (1946) Director since 2005
Dr. Senbet is the William E. Mayer Chair Professor of Finance and Founding Director, Center for Financial Policy, at the University of Maryland, Robert H. Smith School of Business. He was chair of the Finance Department of the University of Maryland, Robert H. Smith School of Business from 1998 to 2006. Since June 2013, he has been on leave from the University to serve as Executive Director of African Economic Research Consortium which focuses on economic policy research and training. Previously, he was a chaired professor of finance at the University of Wisconsin-Madison. Also, he was a Director of the Fortis Funds from March 2000 to July 2002. Dr. Senbet served as Director of the American Finance Association and President of the Western Finance Association. In 2006, Dr. Senbet was inducted Fellow of Financial Management Association International for his career-long distinguished scholarship and professional service.
Interested Directors and Officers
James E. Davey (1964) Director since 2012, President and Chief Executive Officer since 2010
Mr. Davey serves as Executive Vice President of Hartford Life Insurance Company (“HLIC”) and The Hartford Financial Services Group, Inc. Additionally, Mr. Davey serves as Chairman of the Board, Manager and Senior Managing Director of Hartford Funds Distributors, LLC (“HFD”). He also currently serves as Director, Chairman of the Board, President and Senior Managing Director of Hartford Administrative Services Company (“HASCO”). Mr. Davey also serves as Manager, Chairman of the Board and Senior Managing Director for Hartford Funds Management Company, LLC (“HFMC”) and Director, Chairman of the Board and Senior Managing Director for Hartford Funds Management Group, Inc. ("HFMG"). Mr. Davey has served in various positions within The Hartford and its subsidiaries in connection with the operation of the Hartford Funds. Mr. Davey joined The Hartford in 2002.
Lowndes A. Smith (1939) Director since 1996 (HSF) and 2002 (HSF2), Co-Chairman of the Investment Committee since 2005
Mr. Smith served as Vice Chairman of The Hartford from February 1997 to January 2002, as President and Chief Executive Officer of Hartford Life, Inc. from February 1997 to January 2002, and as President and Chief Operating Officer of The Hartford Life Insurance Companies from January 1989 to January 2002. Mr. Smith serves as a Director of White Mountains Insurance Group Ltd. (October 2003 to current); One Beacon Insurance (October 2006 to current); Symetra Financial (August 2007 to current) and is a Managing Director of Whittington Gray Associates (January 2007 to current).
Other Officers
Mark A. Annoni (1964) Vice President, Controller and Treasurer since 2012
Mr. Annoni currently serves as the Assistant Vice President of HLIC (February 2004 to present) and Senior Vice President of HFMG (December 2013 to present). Mr. Annoni has served in various positions within The Hartford and its subsidiaries in connection with the operation of the Hartford Funds. Mr. Annoni joined The Hartford in 2001.
| Hartford Healthcare HLS Fund |
Directors and Officers (Unaudited) – (continued)
Michael R. Dressen (1963) AML Compliance Officer since 2011
Mr. Dressen currently serves as Assistant Vice President of HLIC. He also serves as Chief Compliance Officer and AML Compliance Officer of HASCO and as AML Officer of HFD. Mr. Dressen has served in various positions within The Hartford and its subsidiaries in connection with the operation of the Hartford Funds.
Edward P. Macdonald (1967) Vice President, Secretary and Chief Legal Officer since 2005
Mr. Macdonald currently serves as Assistant Secretary, Executive Vice President and Deputy General Counsel of HFD, HASCO, HFMC and HFMG. He also serves as Vice President of HLIC. Mr. Macdonald has served in various positions within The Hartford and its subsidiaries in connection with the operation of the Hartford Funds. Mr. Macdonald joined The Hartford in 2005.
Joseph G. Melcher (1973) Vice President and Chief Compliance Officer since 2013
Mr. Melcher currently serves as Executive Vice President of HFD, HFMG and HASCO. Mr. Melcher also currently serves as Executive Vice President and Chief Compliance Officer of HFMC. Mr. Melcher has served in various positions within The Hartford and its subsidiaries in connection with the operation of the Hartford Funds since joining The Hartford in 2012. Prior to joining The Hartford, Mr. Melcher worked at Touchstone Investments, a member of the Western & Southern Financial Group, where he held the position of Vice President and Chief Compliance Officer from 2010 through 2012 and Assistant Vice President, Compliance from 2005 to 2010.
Vernon J. Meyer (1964) Vice President since 2006
Mr. Meyer currently serves as Senior Vice President of HLIC. He also currently serves as Managing Director and Chief Investment Officer of HFMC and Managing Director of HFMG. Mr. Meyer has served in various positions within The Hartford and its subsidiaries in connection with the operation of the Hartford Funds. Mr. Meyer joined The Hartford in 2004.
Laura S. Quade (1969) Vice President since 2012
Ms. Quade currently serves as Vice President of HASCO, HFD and HFMG. She is the Head of Operations of HASCO and also serves as Director, Enterprise Operations of HLIC. Ms. Quade has served in various positions within The Hartford and its subsidiaries in connection with the operation of the Hartford Funds.
Martin A. Swanson (1962) Vice President since 2010
Mr. Swanson currently serves as Vice President of HLIC. Mr. Swanson also serves as Managing Director, Chief Marketing Officer and Principal of HFD and Managing Director of HFMG. Mr. Swanson has served in various positions within The Hartford and its subsidiaries in connection with the operation of the Hartford Funds.
HOW TO OBTAIN A COPY OF THE FUND’S PROXY VOTING POLICIES AND VOTING RECORDS (UNAUDITED)
A description of the policies and procedures that the Fund uses to determine how to vote proxies relating to portfolio securities and information about how the Fund voted proxies relating to portfolio securities during the most recent twelve-month period ended June 30 are available (1) without charge, upon request, by calling 888-843-7824 and (2) on the SEC’s website at http://www.sec.gov.
QUARTERLY PORTFOLIO HOLDINGS INFORMATION (UNAUDITED)
The Fund files a complete schedule of portfolio holdings with the SEC for the first and third quarters of each fiscal year on Form N-Q. The Fund’s Forms N-Q are available (1) without charge, upon request, by calling 888-843-7824 and (2) on the SEC’s website at http://www.sec.gov. The Form N-Q may be reviewed and copied at the SEC’s Public Reference Room in Washington, DC. Information on the operation of the Public Reference Room may be obtained by calling 1-800-SEC-0330.
| Hartford Healthcare HLS Fund |
Expense Example (Unaudited)
Your Fund's Expenses
As a shareholder of the Fund, you incur two types of costs: (1) transaction costs and (2) ongoing costs, including investment management fees, distribution and/or service (12b-1) fees, if any, and other fund expenses. This example is intended to help you understand your ongoing costs (in dollars) of investing in the Fund and to compare these costs with the ongoing costs of investing in other mutual funds. The example is based on an investment of $1,000 invested at the beginning of the period and held for the entire period of December 31, 2013 through June 30, 2014.
Actual Expenses
The first set of columns of the table below provides information about actual account values and actual expenses. You may use the information in this column, together with the amount you invested, to estimate the expenses that you paid over the period. Simply divide your account value by $1,000 (for example, an $8,600 account value divided by $1,000 = 8.6), then multiply the result by the number in the line under the heading entitled “Expenses Paid During Period” to estimate the expenses you paid on your account during this period.
Hypothetical Example for Comparison Purposes
The second set of columns of the table below provides information about hypothetical account values and hypothetical expenses based on the Fund's actual expense ratio and an assumed rate of return of 5% per year before expenses, which is not the Fund's actual return. The hypothetical account values and expenses may not be used to estimate the actual ending account balance or expenses you paid for the period. You may use this information to compare the ongoing costs of investing in the Fund and other funds. To do so, compare this 5% hypothetical example with the 5% hypothetical examples that appear in the shareholder reports of the other funds.
Please note that the expenses shown in the table are meant to highlight your ongoing costs only and do not reflect any transactional costs, such as sales charges (loads) and CDSC. Therefore, the second set of columns of the table is useful in comparing ongoing costs only, and will not help you determine the relative total costs of owning different funds. In addition, if these transactional costs were included, your costs would be higher. Expenses are equal to the Fund's annualized expense ratios multiplied by average account value over the period, multiplied by 181/365 (to reflect the one-half year period).
| | | Actual return | | | Hypothetical (5% return before expenses) | | | | | | | | | | |
| | | Beginning
Account Value
December 31,
2013 | | | Ending Account
Value
June 30, 2014 | | | Expenses paid
during the period
December 31, 2013
through
June 30, 2014 | | | Beginning
Account Value
December 31,
2013 | | | Ending Account
Value
June 30, 2014 | | | Expenses paid
during the period
December 31,
2013
through
June 30, 2014 | | | Annualized
expense
ratio | | | Days
in the
current
1/2
year | | | Days
in the
full
year | |
| Class IA | | $ | 1,000.00 | | | $ | 1,124.70 | | | $ | 4.64 | | | $ | 1,000.00 | | | $ | 1,020.43 | | | $ | 4.41 | | | | 0.88 | % | | | 181 | | | | 365 | |
| Class IB | | $ | 1,000.00 | | | $ | 1,122.90 | | | $ | 5.95 | | | $ | 1,000.00 | | | $ | 1,019.19 | | | $ | 5.66 | | | | 1.13 | | | | 181 | | | | 365 | |
| Hartford Healthcare HLS Fund |
Main Risks (Unaudited)
The main risks of investing in the Fund are described below.
Market, Selection and Strategy Risk: The Fund’s share price may fluctuate due to market risk and/or security selections that may underperform the market or relevant benchmarks. If the sub-adviser's investment strategy does not perform as expected, the Fund could underperform its peers or lose money. There is no guarantee the Fund will achieve its stated objective.
Health Sector Risk: Risks of focusing investments on the health care sector include regulatory and legal developments, patent considerations, intense competitive pressures, rapid technological changes and potential product obsolescence, and liquidity risk.
Foreign Investment and Emerging Markets Risk: Investments in foreign securities may be riskier than investments in U.S. securities. Potential risks include the risks of illiquidity, increased price volatility, less government regulation, less extensive and less frequent accounting and other reporting requirements, unfavorable changes in currency exchange rates, and economic and political disruptions. These risks are generally greater for investments in emerging markets.
Small/Mid-cap Stock Risk: Small- and mid-cap stocks are generally more volatile and risky and may be less liquid than large-cap stocks because they may have limited operating histories, narrow product lines, and focus on niche markets.
THIS PRIVACY POLICY IS NOT PART OF THIS REPORT
Privacy Policy and Practices of The Hartford Financial Services Group, Inc. and its Affiliates
(herein called “we, our and us”)
This Privacy Policy applies to our United States Operations
We value your trust. We are committed to the responsible: a) management; b) use; and c) protection; of Personal Information. This notice describes how we collect, disclose, and protect Personal Information. We collect Personal Information to: a) service your Transactions with us; and b) support our business functions. We may obtain Personal Information from: a) You; b) your Transactions with us; and c) third parties such as a consumer-reporting agency. Based on the type of product or service You apply for or get from us, Personal Information such as: a) your name; b) your address; c) your income; d) your payment; or e) your credit history; may be gathered from sources such as applications, Transactions, and consumer reports. To serve You and service our business, we may share certain Personal Information. We will share Personal Information, only as allowed by law, with affiliates such as: a) our insurance companies; b) our employee agents; c) our brokerage firms; and d) our administrators. As allowed by law, we may share Personal Financial Information with our affiliates to: a) market our products; or b) market our services; to You without providing You with an option to prevent these disclosures. | | | We may also share Personal Information, only as allowed by law, with unaffiliated third parties including: a) independent agents; b) brokerage firms; c) insurance companies; d) administrators; and e) service providers; who help us serve You and service our business. When allowed by law, we may share certain Personal Financial Information with other unaffiliated third parties who assist us by performing services or functions such as: a) taking surveys; b) marketing our products or services; or c) offering financial products or services under a joint agreement between us and one or more financial institutions. We, and third parties we partner with, may track some of the pages You visit through the use of: a) cookies; b) pixel tagging; or c) other technologies; and currently do not process or comply with any web browser’s “do not track” signal or similar mechanism that indicates a request to disable online tracking of individual users who visit our websites or use our services. We will not sell or share your Personal Financial Information with anyone for purposes unrelated to our business functions without offering You the opportunity to: a) “opt-out;” or b) “opt-in;” as required by law. We only disclose Personal Health Information with: a) your proper written authorization; or b) as otherwise allowed or required by law. Our employees have access to Personal Information in the course of doing their jobs, such as: a) underwriting policies; b) paying claims; c) developing new products; or d) advising customers of our products and services. |
We use manual and electronic security procedures to maintain: a) the confidentiality; and b) the integrity of; Personal Information that we have. We use these procedures to guard against unauthorized access. Some techniques we use to protect Personal Information include: a) secured files; b) user authentication; c) encryption; d) firewall technology; and e) the use of detection software. We are responsible for and must: a) identify information to be protected; b) provide an adequate level of protection for that data; c) grant access to protected data only to those people who must use it in the performance of their job-related duties. Employees who violate our Privacy Policy will be subject to discipline, which may include ending their employment with us. At the start of our business relationship, we will give You a copy of our current Privacy Policy. We will also give You a copy of our current Privacy Policy once a year if You maintain a continuing business relationship with us. We will continue to follow our Privacy Policy regarding Personal Information even when a business relationship no longer exists between us. | | | As used in this Privacy Notice: Application means your request for our product or service. Personal Financial Information means financial information such as: a) credit history; b) income; c) financial benefits; or d) policy or claim information. Personal Health Information means health information such as: a) your medical records; or b) information about your illness, disability or injury. Personal Information means information that identifies You personally and is not otherwise available to the public. It includes: a) Personal Financial Information; and b) Personal Health Information. Transaction means your business dealings with us, such as: a) your Application; b) your request for us to pay a claim; and c) your request for us to take an action on your account. You means an individual who has given us Personal Information in conjunction with: a) asking about; b) applying for; or c) obtaining; a financial product or service from us if the product or service is used mainly for personal, family, or household purposes. |
This Privacy Policy is being provided on behalf of the following affiliates of The Hartford Financial Services Group, Inc.:
1stAGChoice, Inc.; Access CoverageCorp, Inc.; Access CoverageCorp Technologies, Inc.; American Maturity Life Insurance Company; Archway 60 R, LLC; Business Management Group, Inc.; Champlain Life Reinsurance Company; DMS R, LLC; Eloy R, LLC; Ersatz Corporation; First State Insurance Company; Hartford Accident and Indemnity Company; Hartford Administrative Services Company; Hartford Casualty General Agency, Inc.; Hartford Casualty Insurance Company; Hartford-Comprehensive Employee Benefit Service Company; Hartford Equity Sales Company, Inc.; Hartford Fire General Agency, Inc.; Hartford Fire Insurance Company; Hartford Funds Management Company, LLC; Hartford Funds Management Group, Inc.; Hartford HLS Series Fund II, Inc.; Hartford Insurance Company of Illinois; Hartford Insurance Company of the Midwest; Hartford Insurance Company of the Southeast; Hartford Integrated Technologies, Inc.; Hartford International Life Reassurance Corporation; Hartford Funds Distributors, LLC; Hartford Investment Management Company; Hartford Life and Accident Insurance Company; Hartford Life and Annuity Insurance Company; Hartford Life Insurance Company; Hartford Life Private Placement, LLC; Hartford Lloyd’s Corporation; Hartford Lloyd’s Insurance Company; Hartford Mezzanine Investors I, LLC; Hartford Residual Market, L.C.C.; Hartford Retirement Services, LLC; Hartford Securities Distribution Company, Inc.; Hartford Series Fund, Inc.; Hartford Specialty Insurance Services of Texas, LLC; Hartford Strategic Investments, LLC; Hartford Underwriters Insurance Company; Hartford Technology Services Company, L.L.C.; Hartford of Texas General Agency, Inc.; Hartford Underwriters General Agency, Inc.; HARTRE Company, L.C.C.; HL Investment Advisors, LLC; HLA LLC; Horizon Management Group, LLC; HRA Brokerage Services, Inc.; Lanidex Class B, LLC; M-CAP Insurance Agency, LLC; New England Insurance Company; New England Reinsurance Corporation; Nutmeg Insurance Agency, Inc.; Nutmeg Insurance Company; Pacific Insurance Company, Limited; Planco, LLC: Property and Casualty Insurance Company of Hartford; Revere R, LLC; RVR R, LLC; Sentinel Insurance Company, Ltd.; Sunstone R, LLC; Symphony R, LLC; The Evergreen Group Incorporated; The Hartford Alternative Strategies Fund; The Hartford Mutual Funds, Inc.; The Hartford Mutual Funds II, Inc.; Trumbull Flood Management, L.L.C.; Trumbull Insurance Company; Twin City Fire Insurance Company; White River Life Reinsurance Company.
HPP Revised January 2014
HARTFORD HLS FUNDS
P.O. Box 14293
Lexington, KY 40512-4293
HARTFORDFUNDS
hartfordfunds.com
Hartford Series Fund, Inc. is underwritten and distributed by Hartford Funds Distributors, LLC.
Hartford Series Fund, Inc. inception dates range from 1977 to date. Hartford Series Fund, Inc. is not a subsidiary of The Hartford Financial Services Group, Inc. ("The Hartford") but is underwritten, distributed by and advised by subsidiaries of The Hartford. Investments in Hartford Series Fund, Inc. are not guaranteed by The Hartford or any other entity.
This report is submitted for the general information of the shareholders of the Funds. It is not authorized for distribution unless preceded or accompanied by a current prospectus for the Funds.
Investors should carefully consider the investment objectives, risks, charges, and expenses of Hartford Funds before investing. This and other information can be found in the prospectus, which can be obtained by calling 800-862-6668 (or 800-279-1541 for institutional investors). Investors should read them carefully before they invest.
HLSSAR-HC14 8-14 113543-3 Printed in U.S.A.
HARTFORDFUNDS
| | HARTFORD HIGH YIELD HLS FUND 2014 Semi Annual Report |
A MESSAGE FROM THE PRESIDENT
Dear Fellow Shareholders:
Thank you for investing in Hartford HLS Funds.
Market Review
U.S. equities (as represented by the S&P 500 Index) started 2014 on a shaky note after posting a strong 32.39% gain in 2013. However, stocks managed to maintain modest gains throughout the first quarter and returned to a generally steady climb in the second quarter. Through June 30, 2014, the S&P 500 Index advanced 7.14%. It appears that much of the market volatility during the year can be attributed to heightened international tensions. In particular, the Russian annexation of Ukraine’s Crimean Peninsula and increased tensions in Iraq were cause for concern.
On the domestic front, subdued economic and employment reports slowed stocks’ progress early in the new year, although much of the weakness seemed to dissipate as the year’s unusually harsh winter subsided. And despite initial reactions to the idea, when the U.S. Federal Reserve began tapering its quantitative-easing program in January by reducing its bond purchases by $10 billion a month, the markets took the policy change in stride.
Despite a rough start to the year for financial markets, the global economy seems to be settling into a slow-but-steady recovery. While first-quarter U.S. gross domestic product (GDP) growth was disappointing at -2.9%, U.S. consumer spending, which is a significant contributor toward economic growth, rose by 3% during the quarter. It appears that Europe is also maintaining its own recovery: The International Monetary Fund projects that Europe’s full-year GDP growth may breach positive territory for the first time since 2011.
The impact of international affairs on stocks so far this year is an important reminder to stay informed about both domestic and international economic developments, and any effects they may have on your individual investment goals. If you have not already had a mid-year review of your portfolio, it may be a good time to meet with your financial advisor to review your progress and make certain your investments are prepared for all market environments:
| • | Is your portfolio properly diversified with an appropriate mix of stocks and bonds? |
| • | Is your portfolio positioned to take advantage of the global economic recovery, with investments in both domestic and international holdings? |
| • | Are your investments still in line with your risk tolerance and investment time horizon? |
Your financial professional can help you choose options within our fund family to help you reach your investment goals with confidence.
Thank you again for investing with Hartford HLS Funds.
James Davey
President
Hartford HLS Funds
1 The S&P 500 Index is a market capitalization-weighted price index composed of 500 widely held common stocks.
2The Dow Jones Industrial Average is an unmanaged, price-weighted index of 30 of the largest, most widely held stocks traded on the New York Stock Exchange.
Hartford High Yield HLS Fund
Table of Contents
This report is prepared for the general information of contract owners and qualified retirement plan participants. It is not an offer of contracts or of qualified retirement plans. It should not be used in connection with any offer, except in conjunction with the appropriate product prospectus which contains all pertinent information including the applicable sales, administrative and other charges.
The views expressed in the Fund’s Manager Discussion under “Why did the Fund perform this way?” and “What is the outlook?” are views of the Fund’s sub-adviser and portfolio management team through the end of the period and are subject to change based on market and other conditions. The Fund’s Manager Discussion is for informational purposes only and does not represent an offer, recommendation or solicitation to buy, hold or sell any security. The specific securities identified and described, if any, do not represent all of the securities purchased or sold and you should not assume that investments in the securities identified and discussed will be profitable.
Hartford High Yield HLS Fund inception 09/30/1998
(sub-advised by Wellington Management Company, LLP)
Investment objective – The Fund seeks to provide high current income, and long-term total return.
Performance Overview 6/30/04 - 6/30/14

The chart above represents the hypothetical growth of a $10,000 investment in Class IA. Growth results in classes other than Class IA will vary from what is seen above due to differences in the expenses charged to those share classes.
Average Annual Total Returns (as of 6/30/14)
| | 6 Month† | 1 Year | 5 Years | 10 Years |
| High Yield IA | 5.51% | 11.20% | 14.06% | 8.28% |
| High Yield IB | 5.36% | 10.91% | 13.77% | 8.01% |
| Barclays U.S. Corporate High Yield Bond Index | 5.46% | 11.73% | 13.98% | 9.05% |
PERFORMANCE DATA QUOTED REPRESENTS PAST PERFORMANCE AND DOES NOT GUARANTEE FUTURE RESULTS. The investment return and principal value of the investment will fluctuate so that investors’ shares, when redeemed, may be worth more or less than their original cost. Current performance may be lower or higher than the performance data quoted. To obtain performance data current to the most recent month-end, please visit our website www.hartfordfunds.com.
Total returns presented above were calculated using the Fund’s net asset value available to shareholders for sale or redemption of Fund shares on June 30, 2014, which may exclude investment transactions as of this date. All share class returns assume the reinvestment of all distributions at net asset value and the deduction of all fund expenses.
Performance information includes performance under the Fund’s previous sub-adviser, Hartford Investment Management Company. As of March 5, 2012, Hartford Investment Management Company no longer served as the sub-adviser to the Fund.
Barclays U.S. Corporate High Yield Bond Index is an unmanaged broad-based market-value-weighted index that tracks the total return performance of non-investment grade, fixed-rate, publicly placed, dollar denominated and nonconvertible debt registered with the Securities and Exchange Commission.
The index is unmanaged, and its results include reinvested dividends and/or distributions, but do not reflect the effect of sales charges, commissions, expenses or taxes.
You cannot invest directly in an index.
As shown in the Fund's current prospectus dated May 1, 2014, the total annual operating expense ratios for Class IA and Class IB were 0.75% and 1.00%, respectively. Actual expenses may be higher. Please see the accompanying Financial Highlights for expense ratios for the six-month period ended June 30, 2014.
The chart and table do not reflect the deductions of taxes, sales charges or other fees which may be applied at the variable life insurance, variable annuity or qualified retirement plan product level. Any such additional sales charges or other fees or expenses would lower the contract’s or plan’s performance.
All investments are subject to risk including the possible loss of principal. For a discussion of the Fund’s risks, please see the Main Risks section of this report. For more detailed information on the risks associated with an investment in the Fund, please see the prospectus.
| Hartford High Yield HLS Fund |
| Manager Discussion |
| June 30, 2014 (Unaudited) |
| Portfolio Manager | | |
| Christopher A. Jones, CFA | | |
Senior Vice President and Fixed Income Portfolio
Manager | | |
How did the Fund perform?
The Class IA shares of the Hartford High Yield HLS Fund returned 5.51% for the six-month period ended June 30, 2014, outperforming the Fund’s benchmark, the Barclays U.S. Corporate High Yield Bond Index, which returned 5.46% for the same period. The Fund also outperformed the 4.71% average return of the Lipper High Yield Funds peer group, a group of funds with investment strategies similar to those of the Fund.
Why did the Fund perform this way?
Global fixed income markets gained during the period as expectations of prolonged easy monetary policy by major central banks and an improving, albeit below-trend, macroeconomic environment suppressed volatility. Early in the period emerging markets dominated headlines as economic and political developments sparked risk aversion across global markets, pushing bond prices higher and yields lower amid a flight to quality. Meanwhile, central bank policies diverged. The U.S. Federal Reserve began to wind down its quantitative easing program and the Bank of England started to prepare for interest rate rises. In contrast, the European Central Bank (ECB) announced a host of stimulus measures and the Bank of Japan maintained its easy monetary policy framework. European government bond yields fell sharply as the ECB loosened monetary policy further. In the U.S. and U.K., the Treasury curve continued to flatten as markets braced themselves for the end of quantitative easing in these economies.
Globally, credit spread sectors posted positive absolute returns and outperformed duration-equivalent government bonds as credit spreads tightened. Most currencies appreciated versus the U.S. dollar with the notable exception of European currencies, which declined following the ECB’s easing measures.
High yield performed strongly over the first six months of 2014. The Barclays U.S. Corporate High Yield Bond Index returned 5.46% for the six-month period ended June 30, 2014 and outperformed duration equivalent treasuries by 3.42%. The Option-Adjusted Spread of the High Yield index was 3.37% on June 30, 2014, a decrease of 0.45% from December 31, 2013.
The Fund outperformed the Barclays U.S. Corporate High Yield Bond Index over the first six months of 2014 (primarily as a result of security selection) even though the Fund maintained a slightly defensive risk position over the time period. We continue to believe that maintaining a slightly defensive risk position at this point in the credit cycle is prudent, as historically investors have not generally been adequately compensated for taking on additional default risk in the high yield market.
In aggregate, security selection contributed the most to benchmark-relative results with strongest selection coming in the financial services sector.
Within the Financial Services sector our exposure to Nuveen Investments benefitted performance following the announcement that the company would be purchased by TIAA-CREF for $6.25 billion, including the assumption of debt. The Fund also benefitted from positive security selection in Utilities, driven primarily by our position in TXU. TXU formally filed for bankruptcy protection, a move that was already anticipated by the market. The senior, secured securities held in the portfolio performed well following the news, on the expectation of favorable treatment for securities at the top of the capital structure.
In aggregate, industry allocation contributed modestly to benchmark-relative performance, in part due to underweight allocations to gaming and metal. We maintain a cautious view on the gaming sector due to the recent increases in gaming capacity while gaming revenues have been declining. Metals and mining has become one of our most significant underweights, as we have become concerned about the effect of near term supply/demand imbalances on pricing. A number of commodities have seen tremendous increases in demand over the last decade, driven by the industrialization of emerging markets (notably China). Producers have responded by bringing on significant new supply (at higher cost points) and have generally financed these investments with debt (which gives us caution).
Our underweight position in the wireline sector detracted from relative performance during the period. The wireline industry has historically been a small sector within the High Yield market (around 3%). In the 4th quarter of last year, our underweight to this sector increased with the downgrade of Telecom Italia (which by itself makes up approximately 0.6% of the U.S. High Yield universe). We are wary of the newly downgraded issuer as their high margin fixed line business in Italy continues to decline and with their current high leverage, we don’t believe a speedy return to investment grade is likely.
A modest cash position detracted from benchmark-relative returns in an upward trending environment. In addition, our credit default swap positions on the CDX index, which are used to tactically adjust our
| Hartford High Yield HLS Fund |
| Manager Discussion – (continued) |
| June 30, 2014 (Unaudited) |
exposure to the market, detracted from relative performance during the period.
What is the outlook?
Our outlook for U.S. high yield bonds remains positive, based on a steadily improving macroeconomic backdrop, low default expectations, and positive corporate fundamentals. Valuations are now richer, with spreads inside their long-term historical averages, but reasonable for this point in the cycle; the trailing 12-month par-weighted default rate remains below the long-term average. While acknowledging a recent pickup in shareholder-friendly actions such as M&A activity and leveraged buyouts at the margin, we do not believe this is likely to affect default rates over the near to medium term.
Diversification by Security Type
as of June 30, 2014
| Category | | Percentage of
Net Assets | |
| Equity Securities | | | | |
| Common Stocks | | | 0.4 | % |
| Preferred Stocks | | | 1.6 | |
| Total | | | 2.0 | % |
| Fixed Income Securities | | | | |
| Asset & Commercial Mortgage Backed Securities | | | 0.0 | % |
| Corporate Bonds | | | 88.9 | |
| Senior Floating Rate Interests | | | 6.1 | |
| Total | | | 95.0 | % |
| Short-Term Investments | | | 3.3 | |
| Other Assets and Liabilities | | | (0.3 | ) |
| Total | | | 100.0 | % |
Credit Exposure
as of June 30, 2014
| Credit Rating * | | Percentage of
Net Assets | |
| Baa / BBB | | | 0.5 | |
| Ba / BB | | | 26.3 | |
| B | | | 41.3 | |
| Caa / CCC or Lower | | | 23.2 | |
| Not Rated | | | 3.7 | |
| Non-Debt Securities and Other Short-Term Instruments | | | 5.3 | |
| Other Assets and Liabilities | | | (0.3 | ) |
| Total | | | 100.0 | % |
| * | Credit exposure is the long-term credit ratings for the Fund's holdings, as of the date noted, as provided by Standard and Poor's (S&P) or Moody's Investors Service and typically range from AAA/Aaa (highest) to C/D (lowest). Presentation of S&P and Moody's credit ratings in this report have been selected for several reasons, including access to information and materials provided by S&P and Moody's, as well as the Fund's consideration of industry practice. If Moody's and S&P assign different ratings, the lower rating is used. Fixed income securities that are not rated by either agency are listed as "Not Rated." Ratings do not apply to the Fund itself or to Fund shares. Ratings may change. |
| Hartford High Yield HLS Fund |
| Schedule of Investments |
| June 30, 2014 (Unaudited) |
| (000’s Omitted) |
| Shares or Principal Amount ╬ | | Market Value ╪ | |
| Asset and Commercial Mortgage Backed Securities - 0.0% | | | | |
| | | | | Finance and Insurance - 0.0% | | | | |
| | | | | Soundview NIM Trust | | | | |
| $ | 2,490 | | | 0.00%, 12/25/2036 ■● | | $ | — | |
| | | | | | | | | |
| | | | | Total Asset and Commercial Mortgage Backed Securities | | | | |
| | | | | (Cost $2,479) | | $ | — | |
| | | | | | | | | |
| Corporate Bonds - 88.9% | | | | |
| | | | | Administrative Waste Management and Remediation - 2.0% | | | | |
| | | | | Carlson Travel Holdings, Inc. | | | | |
| $ | 470 | | | 7.50%, 08/15/2019 ■☼ | | $ | 480 | |
| | | | | Carlson Wagonlit B.V. | | | | |
| | 1,675 | | | 6.88%, 06/15/2019 ■ | | | 1,801 | |
| | | | | Casella Waste Systems, Inc. | | | | |
| | 1,665 | | | 7.75%, 02/15/2019 | | | 1,740 | |
| | | | | Equinix, Inc. | | | | |
| | 165 | | | 4.88%, 04/01/2020 | | | 169 | |
| | 2,050 | | | 7.00%, 07/15/2021 | | | 2,265 | |
| | | | | Servicemaster (The) Co. | | | | |
| | 3,220 | | | 7.00%, 08/15/2020 | | | 3,425 | |
| | | | | | | | 9,880 | |
| | | | | Arts, Entertainment and Recreation - 5.9% | | | | |
| | | | | AMC Entertainment, Inc. | | | | |
| | 4,944 | | | 9.75%, 12/01/2020 | | | 5,636 | |
| | | | | CCO Holdings LLC | | | | |
| | 120 | | | 5.13%, 02/15/2023 | | | 121 | |
| | 95 | | | 5.25%, 09/30/2022 | | | 96 | |
| | 545 | | | 5.75%, 09/01/2023 | | | 565 | |
| | 4,042 | | | 7.38%, 06/01/2020 | | | 4,406 | |
| | | | | Emdeon, Inc. | | | | |
| | 1,640 | | | 11.00%, 12/31/2019 | | | 1,886 | |
| | | | | Gannett Co., Inc. | | | | |
| | 4,390 | | | 5.13%, 10/15/2019 ■ | | | 4,544 | |
| | | | | Gray Television, Inc. | | | | |
| | 3,521 | | | 7.50%, 10/01/2020 | | | 3,794 | |
| | | | | NBC Universal Enterprise | | | | |
| | 2,180 | | | 5.25%, 12/19/2049 ■ | | | 2,278 | |
| | | | | Sirius XM Radio, Inc. | | | | |
| | 860 | | | 4.25%, 05/15/2020 ■ | | | 848 | |
| | 2,420 | | | 4.63%, 05/15/2023 ■ | | | 2,317 | |
| | 376 | | | 5.25%, 08/15/2022 ■ | | | 405 | |
| | | | | Univision Communications, Inc. | | | | |
| | 2,437 | | | 6.75%, 09/15/2022 ■ | | | 2,696 | |
| | | | | | | | 29,592 | |
| | | | | Chemical Manufacturing - 2.3% | | | | |
| | | | | Ferro Corp. | | | | |
| | 3,873 | | | 7.88%, 08/15/2018 | | | 4,047 | |
| | | | | Hexion Specialty Chemicals | | | | |
| | 3,055 | | | 8.88%, 02/01/2018 | | | 3,177 | |
| | | | | Hexion U.S. Finance Corp. | | | | |
| | 1,245 | | | 6.63%, 04/15/2020 | | | 1,320 | |
| | | | | Ineos Group Holdings plc | | | | |
| | 760 | | | 5.88%, 02/15/2019 ■ | | | 779 | |
| | 2,040 | | | 6.13%, 08/15/2018 ■ | | | 2,111 | |
| | | | | | | | 11,434 | |
| | | | | Computer and Electronic Product Manufacturing - 2.7% | | | | |
| | | | | Alcatel-Lucent USA, Inc. | | | | |
| | 2,430 | | | 6.75%, 11/15/2020 ■ | | | 2,588 | |
| | | | | CDW Escrow Corp. | | | | |
| | 2,255 | | | 8.50%, 04/01/2019 | | | 2,441 | |
| | | | | Freescale Semiconductor, Inc. | | | | |
| | 4,895 | | | 6.00%, 01/15/2022 ■ | | | 5,213 | |
| | | | | Lucent Technologies, Inc. | | | | |
| | 2,681 | | | 6.45%, 03/15/2029 | | | 2,654 | |
| | 765 | | | 6.50%, 01/15/2028 | | | 758 | |
| | | | | | | | 13,654 | |
| | | | | Construction - 4.8% | | | | |
| | | | | K Hovnanian Enterprises, Inc. | | | | |
| | 1,705 | | | 7.00%, 01/15/2019 ■ | | | 1,739 | |
| | 1,775 | | | 9.13%, 11/15/2020 ■ | | | 1,979 | |
| | | | | KB Home | | | | |
| | 2,206 | | | 7.50%, 09/15/2022 | | | 2,449 | |
| | 2,930 | | | 8.00%, 03/15/2020 | | | 3,362 | |
| | | | | Lennar Corp. | | | | |
| | 6,475 | | | 4.75%, 12/15/2017 - 11/15/2022 | | | 6,775 | |
| | | | | M/I Homes, Inc. | | | | |
| | 566 | | | 3.00%, 03/01/2018 β | | | 617 | |
| | | | | MPH Acquisition Holdings LLC | | | | |
| | 1,785 | | | 6.63%, 04/01/2022 ■ | | | 1,870 | |
| | | | | Ply Gem Industries, Inc. | | | | |
| | 4,000 | | | 6.50%, 02/01/2022 ■ | | | 3,870 | |
| | | | | Pulte Homes, Inc. | | | | |
| | 615 | | | 6.38%, 05/15/2033 | | | 618 | |
| | | | | Ryland Group, Inc. | | | | |
| | 910 | | | 5.38%, 10/01/2022 | | | 903 | |
| | | | | | | | 24,182 | |
| | | | | Fabricated Metal Product Manufacturing - 1.3% | | | | |
| | | | | BOE Intermediate Holdings Corp. | | | | |
| | 2,314 | | | 9.00%, 11/01/2017 ■Þ | | | 2,426 | |
| | | | | Entegris, Inc. | | | | |
| | 2,665 | | | 6.00%, 04/01/2022 ■ | | | 2,745 | |
| | | | | Masco Corp. | | | | |
| | 1,135 | | | 5.95%, 03/15/2022 | | | 1,254 | |
| | 320 | | | 7.13%, 03/15/2020 | | | 377 | |
| | | | | | | | 6,802 | |
| | | | | Finance and Insurance - 9.7% | | | | |
| | | | | Banco Bilbao Vizcaya Argentaria S.A. | | | | |
| EUR | 3,600 | | | 7.00%, 12/29/2049 § | | | 5,213 | |
| | | | | Barclays Bank plc | | | | |
| | 3,640 | | | 8.25%, 12/15/2018 ♠β | | | 3,858 | |
| | | | | CIT Group, Inc. | | | | |
| | 3,011 | | | 5.25%, 03/15/2018 | | | 3,233 | |
| | | | | Credit Agricole S.A. | | | | |
| | 1,015 | | | 7.88%, 01/23/2024 ■♠ | | | 1,109 | |
| | | | | Credit Suisse Group AG | | | | |
| | 1,400 | | | 7.50%, 12/11/2023 ■♠ | | | 1,550 | |
| | | | | Ineos Finance plc | | | | |
| | 1,220 | | | 7.50%, 05/01/2020 ■ | | | 1,328 | |
| | 715 | | | 8.38%, 02/15/2019 ■ | | | 781 | |
| | | | | Nationstar Mortgage LLC | | | | |
| | 6,335 | | | 6.50%, 08/01/2018 - 07/01/2021 | | | 6,440 | |
| | | | | Nuveen Investments, Inc. | | | | |
| | 1,850 | | | 9.13%, 10/15/2017 ■ | | | 2,005 | |
| | | | | Provident Funding Associates L.P. | | | | |
| | 5,300 | | | 6.75%, 06/15/2021 ■ | | | 5,366 | |
| | | | | Royal Bank of Scotland Group plc | | | | |
| | 2,520 | | | 6.99%, 10/05/2017 ■♠ | | | 2,936 | |
| | 1,000 | | | 7.64%, 09/27/2017 ♠Δ | | | 1,069 | |
The accompanying notes are an integral part of these financial statements.
| Hartford High Yield HLS Fund |
| Schedule of Investments – (continued) |
| June 30, 2014 (Unaudited) |
| (000’s Omitted) |
| Shares or Principal Amount ╬ | | Market Value ╪ | |
| Corporate Bonds - 88.9% - (continued) | | | | |
| | | | | Finance and Insurance - 9.7% - (continued) | | | | |
| | | | | Societe Generale | | | | |
| $ | 1,355 | | | 6.00%, 01/27/2020 ■♠ | | $ | 1,335 | |
| | 3,780 | | | 7.88%, 12/18/2023 ■♠ | | | 4,030 | |
| | 1,600 | | | 8.25%, 11/29/2018 §♠ | | | 1,741 | |
| | | | | Softbank Corp. | | | | |
| | 2,825 | | | 4.50%, 04/15/2020 ■ | | | 2,871 | |
| | | | | TMX Finance LLC | | | | |
| | 3,625 | | | 8.50%, 09/15/2018 ■ | | | 3,842 | |
| | | | | | | | 48,707 | |
| | | | | Food Services - 1.3% | | | | |
| | | | | ARAMARK Corp. | | | | |
| | 3,825 | | | 5.75%, 03/15/2020 | | | 4,045 | |
| | | | | CEC Entertainment, Inc. | | | | |
| | 2,490 | | | 8.00%, 02/15/2022 ■ | | | 2,577 | |
| | | | | | | | 6,622 | |
| | | | | Health Care and Social Assistance - 8.8% | | | | |
| | | | | Alere, Inc. | | | | |
| | 2,340 | | | 6.50%, 06/15/2020 | | | 2,457 | |
| | | | | Biomet, Inc. | | | | |
| | 2,710 | | | 6.50%, 08/01/2020 - 10/01/2020 | | | 2,907 | |
| | | | | Community Health Systems, Inc. | | | | |
| | 2,076 | | | 5.13%, 08/15/2018 | | | 2,177 | |
| | 5,640 | | | 6.88%, 02/01/2022 ■ | | | 5,978 | |
| | 2,935 | | | 7.13%, 07/15/2020 | | | 3,177 | |
| | | | | Cubist Pharmaceuticals | | | | |
| | 707 | | | 1.88%, 09/01/2020 ■β | | | 806 | |
| | | | | Envision Healthcare Corp. | | | | |
| | 1,040 | | | 5.13%, 07/01/2022 ■ | | | 1,049 | |
| | | | | Exelixis, Inc. | | | | |
| | 317 | | | 4.25%, 08/15/2019 β | | | 268 | |
| | | | | Grifols Worldwide Operations Ltd. | | | | |
| | 1,155 | | | 5.25%, 04/01/2022 ■ | | | 1,198 | |
| | | | | HCA Holdings, Inc. | | | | |
| | 1,835 | | | 6.25%, 02/15/2021 | | | 1,970 | |
| | | | | HCA, Inc. | | | | |
| | 5,919 | | | 7.50%, 11/15/2095 ‡ | | | 5,564 | |
| | | | | Pinnacle Merger Sub, Inc. | | | | |
| | 3,180 | | | 9.50%, 10/01/2023 ■ | | | 3,534 | |
| | | | | Salix Pharmaceuticals Ltd. | | | | |
| | 4,500 | | | 6.00%, 01/15/2021 ■ | | | 4,826 | |
| | | | | Savient Pharmaceuticals, Inc. | | | | |
| | 3,885 | | | 4.75%, 02/01/2018 Ψ | | | 5 | |
| | | | | Tenet Healthcare Corp. | | | | |
| | 3,030 | | | 5.00%, 03/01/2019 ■ | | | 3,072 | |
| | 3,425 | | | 8.13%, 04/01/2022 | | | 3,965 | |
| | | | | Wellcare Health Plans, Inc. | | | | |
| | 1,255 | | | 5.75%, 11/15/2020 | | | 1,337 | |
| | | | | | | | 44,290 | |
| | | | | Information - 22.9% | | | | |
| | | | | Activision Blizzard, Inc. | | | | |
| | 6,152 | | | 5.63%, 09/15/2021 ■ | | | 6,629 | |
| | | | | Altice Financing S.A. | | | | |
| | 885 | | | 6.50%, 01/15/2022 ■ | | | 943 | |
| | 1,500 | | | 7.88%, 12/15/2019 ■ | | | 1,642 | |
| | 295 | | | 8.13%, 01/15/2024 ■ | | | 325 | |
| | 1,080 | | | 9.88%, 12/15/2020 ■ | | | 1,245 | |
| | | | | Audatex North America, Inc. | | | | |
| | 1,485 | | | 6.00%, 06/15/2021 ■ | | | 1,585 | |
| | | | | DISH DBS Corp. | | | | |
| | 2,170 | | | 5.00%, 03/15/2023 | | | 2,211 | |
| | 3,725 | | | 5.88%, 07/15/2022 | | | 4,042 | |
| | 945 | | | 6.75%, 06/01/2021 | | | 1,077 | |
| | 4,886 | | | 7.88%, 09/01/2019 | | | 5,802 | |
| | | | | First Data Corp. | | | | |
| | 1,800 | | | 6.75%, 11/01/2020 ■ | | | 1,948 | |
| | 3,975 | | | 7.38%, 06/15/2019 ■ | | | 4,268 | |
| | 4,130 | | | 8.25%, 01/15/2021 ■ | | | 4,522 | |
| | 3,547 | | | 14.50%, 09/24/2019 ■Þ | | | 3,941 | |
| | | | | Infor Software Parent LLC | | | | |
| | 3,710 | | | 7.13%, 05/01/2021 ■ | | | 3,793 | |
| | | | | Infor US, Inc. | | | | |
| | 1,890 | | | 9.38%, 04/01/2019 | | | 2,105 | |
| | | | | Intelsat Jackson Holdings S.A. | | | | |
| | 2,330 | | | 6.63%, 12/15/2022 | | | 2,432 | |
| | | | | Intelsat Luxembourg S.A. | | | | |
| | 695 | | | 6.75%, 06/01/2018 | | | 736 | |
| | 6,550 | | | 7.75%, 06/01/2021 | | | 6,935 | |
| | | | | Level 3 Financing, Inc. | | | | |
| | 970 | | | 6.13%, 01/15/2021 ■ | | | 1,039 | |
| | | | | MetroPCS Wireless, Inc. | | | | |
| | 1,425 | | | 6.63%, 11/15/2020 | | | 1,521 | |
| | | | | Nara Cable Funding Ltd. | | | | |
| | 3,615 | | | 8.88%, 12/01/2018 ■ | | | 3,859 | |
| | | | | Sprint Communications, Inc. | | | | |
| | 507 | | | 7.00%, 03/01/2020 ■ | | | 583 | |
| | 6,120 | | | 7.25%, 09/15/2021 ■ | | | 6,747 | |
| | 5,715 | | | 7.88%, 09/15/2023 ■ | | | 6,358 | |
| | 3,092 | | | 9.00%, 11/15/2018 ■ | | | 3,749 | |
| | | | | Syniverse Holdings, Inc. | | | | |
| | 3,470 | | | 9.13%, 01/15/2019 | | | 3,717 | |
| | | | | T-Mobile USA, Inc. | | | | |
| | 330 | | | 6.13%, 01/15/2022 | | | 350 | |
| | 2,490 | | | 6.46%, 04/28/2019 | | | 2,621 | |
| | 490 | | | 6.50%, 01/15/2024 | | | 524 | |
| | 1,030 | | | 6.63%, 04/28/2021 | | | 1,115 | |
| | 2,865 | | | 6.73%, 04/28/2022 | | | 3,091 | |
| | 405 | | | 6.84%, 04/28/2023 | | | 441 | |
| | | | | Unitymedia Hessen GmbH & Co. | | | | |
| | 2,555 | | | 5.50%, 01/15/2023 ■ | | | 2,644 | |
| | | | | UPCB Finance III Ltd. | | | | |
| | 2,868 | | | 6.63%, 07/01/2020 ■ | | | 3,054 | |
| | | | | UPCB Finance VI Ltd. | | | | |
| | 1,845 | | | 6.88%, 01/15/2022 ■ | | | 2,016 | |
| | | | | Verint Systems, Inc. | | | | |
| | 1,101 | | | 1.50%, 06/01/2021 β | | | 1,129 | |
| | | | | Videotron Ltd. | | | | |
| | 249 | | | 9.13%, 04/15/2018 | | | 256 | |
| | | | | Wind Acquisition Finance S.A. | | | | |
| EUR | 3,565 | | | 4.00%, 07/15/2020 ■☼ | | | 4,869 | |
| | 1,145 | | | 6.50%, 04/30/2020 ■ | | | 1,241 | |
| | 4,510 | | | 7.25%, 02/15/2018 ■ | | | 4,765 | |
| | | | | Windstream Corp. | | | | |
| | 3,400 | | | 7.50%, 04/01/2023 | | | 3,681 | |
| | | | | | | | 115,551 | |
| | | | | | | | | |
| | | | | Machinery Manufacturing - 1.0% | | | | |
| | | | | Case New Holland Industrial, Inc. | | | | |
| | 4,301 | | | 7.88%, 12/01/2017 ‡ | | | 5,011 | |
The accompanying notes are an integral part of these financial statements.
| Hartford High Yield HLS Fund |
| Schedule of Investments – (continued) |
| June 30, 2014 (Unaudited) |
| (000’s Omitted) |
| Shares or Principal Amount ╬ | | Market Value ╪ | |
| Corporate Bonds - 88.9% - (continued) | | | | |
| | | | | Mining - 1.0% | | | | |
| | | | | AK Steel Corp. | | | | |
| $ | 2,805 | | | 7.63%, 05/15/2020 | | $ | 2,889 | |
| | 1,285 | | | 8.38%, 04/01/2022 | | | 1,362 | |
| | | | | AuRico Gold, Inc. | | | | |
| | 920 | | | 7.75%, 04/01/2020 ■ | | | 911 | |
| | | | | | | | 5,162 | |
| | | | | Miscellaneous Manufacturing - 0.9% | | | | |
| | | | | BE Aerospace, Inc. | | | | |
| | 1,286 | | | 5.25%, 04/01/2022 | | | 1,400 | |
| | | | | DigitalGlobe, Inc. | | | | |
| | 2,945 | | | 5.25%, 02/01/2021 | | | 2,916 | |
| | | | | | | | 4,316 | |
| | | | | Motor Vehicle and Parts Manufacturing - 1.5% | | | | |
| | | | | Chrysler Group LLC | | | | |
| | 2,095 | | | 8.00%, 06/15/2019 | | | 2,276 | |
| | 3,085 | | | 8.25%, 06/15/2021 | | | 3,486 | |
| | | | | General Motors Co. | | | | |
| | 1,850 | | | 4.88%, 10/02/2023 ■ | | | 1,947 | |
| | | | | | | | 7,709 | |
| | | | | Nonmetallic Mineral Product Manufacturing - 1.7% | | | | |
| | | | | Ardagh Finance Holdings S.A. | | | | |
| | 1,185 | | | 8.63%, 06/15/2019 ■ | | | 1,220 | |
| | | | | Ardagh Packaging Finance plc | | | | |
| | 2,065 | | | 6.00%, 06/30/2021 ■☼ | | | 2,062 | |
| | 278 | | | 7.00%, 11/15/2020 ■ | | | 288 | |
| | 511 | | | 9.13%, 10/15/2020 ■ | | | 566 | |
| | | | | Cemex Finance LLC | | | | |
| | 2,830 | | | 6.00%, 04/01/2024 ■ | | | 2,947 | |
| | | | | Cemex S.A.B. de C.V. | | | | |
| | 870 | | | 3.75%, 03/15/2018 β | | | 1,320 | |
| | | | | | | | 8,403 | |
| | | | | Other Services - 1.6% | | | | |
| | | | | Abengoa Finance | | | | |
| EUR | 855 | | | 6.00%, 03/31/2021 ■ | | | 1,232 | |
| | 2,255 | | | 7.75%, 02/01/2020 ■ | | | 2,512 | |
| | | | | Service Corp. International | | | | |
| | 520 | | | 5.38%, 01/15/2022 | | | 538 | |
| | 3,415 | | | 7.63%, 10/01/2018 | | | 4,004 | |
| | | | | | | | 8,286 | |
| | | | | Petroleum and Coal Products Manufacturing - 5.8% | | | | |
| | | | | Antero Resources Finance Corp. | | | | |
| | 2,700 | | | 6.00%, 12/01/2020 | | | 2,896 | |
| | | | | Bonanza Creek Energy, Inc. | | | | |
| | 1,940 | | | 6.75%, 04/15/2021 | | | 2,076 | |
| | | | | Cimarex Energy Co. | | | | |
| | 330 | | | 4.38%, 06/01/2024 | | | 336 | |
| | | | | Cobalt International Energy, Inc. | | | | |
| | 1,790 | | | 2.63%, 12/01/2019 β | | | 1,651 | |
| | | | | Concho Resources, Inc. | | | | |
| | 1,020 | | | 5.50%, 10/01/2022 | | | 1,098 | |
| | | | | Diamondback Energy, Inc. | | | | |
| | 2,485 | | | 7.63%, 10/01/2021 ■ | | | 2,733 | |
| | | | | Everest Acquisition LLC | | | | |
| | 570 | | | 6.88%, 05/01/2019 | | | 606 | |
| | 3,792 | | | 9.38%, 05/01/2020 | | | 4,342 | |
| | | | | Harvest Operations Corp. | | | | |
| | 1,315 | | | 6.88%, 10/01/2017 | | | 1,427 | |
| | | | | Range Resources Corp. | | | | |
| | 500 | | | 5.00%, 08/15/2022 | | | 530 | |
| | | | | Rosetta Resources, Inc. | | | | |
| | 1,875 | | | 5.63%, 05/01/2021 | | | 1,929 | |
| | 1,860 | | | 5.88%, 06/01/2022 | | | 1,944 | |
| | | | | Seadrill Ltd. | | | | |
| | 2,585 | | | 6.13%, 09/15/2017 ■ | | | 2,721 | |
| | | | | Seventy Seven Energy, Inc. | | | | |
| | 430 | | | 6.50%, 07/15/2022 ■ | | | 441 | |
| | | | | Tullow Oil plc | | | | |
| | 1,725 | | | 6.00%, 11/01/2020 ■ | | | 1,789 | |
| | 2,865 | | | 6.25%, 04/15/2022 ■ | | | 2,972 | |
| | | | | | | | 29,491 | |
| | | | | Pipeline Transportation - 1.2% | | | | |
| | | | | Energy Transfer Equity L.P. | | | | |
| | 2,588 | | | 7.50%, 10/15/2020 | | | 2,989 | |
| | | | | Kinder Morgan Finance Co. | | | | |
| | 2,850 | | | 6.00%, 01/15/2018 ■ | | | 3,114 | |
| | | | | | | | 6,103 | |
| | | | | Plastics and Rubber Products Manufacturing - 0.8% | | | | |
| | | | | Associated Materials LLC | | | | |
| | 1,005 | | | 9.13%, 11/01/2017 | | | 1,043 | |
| | | | | Nortek, Inc. | | | | |
| | 2,785 | | | 8.50%, 04/15/2021 | | | 3,077 | |
| | | | | | | | 4,120 | |
| | | | | Primary Metal Manufacturing - 0.8% | | | | |
| | | | | Constellium N.V. | | | | |
| | 535 | | | 5.75%, 05/15/2024 ■ | | | 562 | |
| | | | | United States Steel Corp. | | | | |
| | 3,026 | | | 7.38%, 04/01/2020 | | | 3,336 | |
| | | | | | | | 3,898 | |
| | | | | Printing and Related Support Activities - 0.5% | | | | |
| | | | | Quad Graphics, Inc. | | | | |
| | 2,385 | | | 7.00%, 05/01/2022 ■ | | | 2,385 | |
| | | | | | | | | |
| | | | | Professional, Scientific and Technical Services - 1.3% | | | | |
| | | | | Getty Images, Inc. | | | | |
| | 2,865 | | | 7.00%, 10/15/2020 ■ | | | 2,625 | |
| | | | | SunGard Data Systems, Inc. | | | | |
| | 490 | | | 6.63%, 11/01/2019 | | | 516 | |
| | 1,808 | | | 7.38%, 11/15/2018 | | | 1,909 | |
| | 1,520 | | | 7.63%, 11/15/2020 | | | 1,657 | |
| | | | | | | | 6,707 | |
| | | | | Real Estate, Rental and Leasing - 2.6% | | | | |
| | | | | Hertz Global Holdings, Inc. | | | | |
| | 1,075 | | | 5.88%, 10/15/2020 | | | 1,123 | |
| | 695 | | | 6.25%, 10/15/2022 | | | 736 | |
| | | | | International Lease Finance Corp. | | | | |
| | 8,421 | | | 5.88%, 04/01/2019 - 08/15/2022 | | | 9,259 | |
| | 1,720 | | | 6.25%, 05/15/2019 | | | 1,926 | |
| | | | | | | | 13,044 | |
| | | | | Retail Trade - 3.7% | | | | |
| | | | | 99 Cents Only Stores | | | | |
| | 2,260 | | | 11.00%, 12/15/2019 | | | 2,503 | |
| | | | | AmeriGas Partners L.P. | | | | |
| | 3,336 | | | 6.25%, 08/20/2019 ╦ | | | 3,561 | |
| | | | | GRD Holding III Corp. | | | | |
| | 3,095 | | | 10.75%, 06/01/2019 ■ | | | 3,466 | |
The accompanying notes are an integral part of these financial statements.
| Hartford High Yield HLS Fund |
| Schedule of Investments – (continued) |
| June 30, 2014 (Unaudited) |
| (000’s Omitted) |
| Shares or Principal Amount ╬ | | Market Value ╪ | |
| Corporate Bonds - 88.9% - (continued) | | | | |
| | | | | Retail Trade - 3.7% - (continued) | | | | |
| | | | | Michaels Stores, Inc. | | | | |
| $ | 1,350 | | | 5.88%, 12/15/2020 ■ | | $ | 1,380 | |
| | 3,190 | | | 7.75%, 11/01/2018 | | | 3,374 | |
| | | | | Party City Holdings, Inc. | | | | |
| | 1,080 | | | 8.88%, 08/01/2020 | | | 1,196 | |
| | | | | Party City Nextco Holdings | | | | |
| | 2,995 | | | 8.75%, 08/15/2019 ■ | | | 3,059 | |
| | | | | | | | 18,539 | |
| | | | | Soap, Cleaning Compound and Toilet Manufacturing - 0.3% | | | | |
| | | | | Sun Products Corp. | | | | |
| | 1,845 | | | 7.75%, 03/15/2021 ■ | | | 1,605 | |
| | | | | | | | | |
| | | | | Transportation Equipment Manufacturing - 0.4% | | | | |
| | | | | Huntington Ingalls Industries, Inc. | | | | |
| | 1,785 | | | 7.13%, 03/15/2021 | | | 1,950 | |
| | | | | | | | | |
| | | | | Utilities - 1.4% | | | | |
| | | | | AES (The) Corp. | | | | |
| | 393 | | | 8.00%, 10/15/2017 | | | 458 | |
| | | | | Dolphin Subsidiary II, Inc. | | | | |
| | 3,890 | | | 7.25%, 10/15/2021 | | | 4,279 | |
| | | | | Texas Competitive Electric Co. | | | | |
| | 2,765 | | | 0.00%, 10/01/2020 ■Ω | | | 2,523 | |
| | | | | | | | 7,260 | |
| | | | | Wholesale Trade - 0.7% | | | | |
| | | | | Dynegy, Inc. | | | | |
| | 835 | | | 5.88%, 06/01/2023 | | | 841 | |
| | | | | J.M. Huber Corp. | | | | |
| | 2,290 | | | 9.88%, 11/01/2019 ■ | | | 2,608 | |
| | | | | | | | 3,449 | |
| | | | | Total Corporate Bonds | | | | |
| | | | | (Cost $425,615) | | $ | 448,152 | |
| | | | | | | | | |
| Senior Floating Rate Interests ♦ - 6.1% | | | | |
| | | | | Arts, Entertainment and Recreation - 0.6% | | | | |
| | | | | Tribune Co. | | | | |
| $ | 2,796 | | | 0.40%, 12/27/2020 | | $ | 2,800 | |
| | | | | | | | | |
| | | | | Computer and Electronic Product Manufacturing - 0.4% | | | | |
| | | | | Freescale Semiconductor, Inc. | | | | |
| | 2,035 | | | 0.50%, 01/15/2021 | | | 2,042 | |
| | | | | | | | | |
| | | | | Finance and Insurance - 1.2% | | | | |
| | | | | Asurion LLC | | | | |
| | 2,616 | | | 0.43%, 07/08/2020 ☼ | | | 2,613 | |
| | 2,451 | | | 0.50%, 05/24/2019 | | | 2,465 | |
| | 945 | | | 0.85%, 03/03/2021 | | | 979 | |
| | | | | | | | 6,057 | |
| | | | | Mining - 0.5% | | | | |
| | | | | Arch Coal, Inc. | | | | |
| | 2,620 | | | 0.63%, 05/16/2018 | | | 2,573 | |
| | | | | | | | | |
| | | | | Other Services - 1.3% | | | | |
| | | | | Gardner Denver, Inc. | | | | |
| | 2,992 | | | 0.43%, 07/30/2020 | | | 2,990 | |
| | | | | Rexnord LLC | | | | |
| | 3,662 | | | 0.40%, 08/21/2020 | | | 3,657 | |
| | | | | | | | 6,647 | |
| | | | | | | | | |
| | | | | Petroleum and Coal Products Manufacturing - 0.4% | | | | |
| | | | | Crosby Worldwide Ltd. | | | | |
| | 2,140 | | | 0.40%, 11/23/2020 | | | 2,137 | |
| | | | | | | | | |
| | | | | Retail Trade - 0.7% | | | | |
| | | | | Lands' End, Inc. | | | | |
| | 1,400 | | | 0.43%, 04/04/2021 | | | 1,398 | |
| | | | | Neiman Marcus (The) Group, Inc. | | | | |
| | 2,210 | | | 0.43%, 10/25/2020 | | | 2,203 | |
| | | | | | | | 3,601 | |
| | | | | Utilities - 1.0% | | | | |
| | | | | Calpine Corp. | | | | |
| | 512 | | | 0.40%, 10/31/2020 | | | 513 | |
| | | | | Texas Competitive Electric Holdings Co. LLC | | | | |
| | 5,425 | | | 0.47%, 10/10/2017 Ω | | | 4,433 | |
| | | | | | | | 4,946 | |
| | | | | Total Senior Floating Rate Interests | | | | |
| | | | | (Cost $30,030) | | $ | 30,803 | |
| | | | | | | | | |
| Common Stocks - 0.4% | | | | |
| | | | | Energy - 0.4% | | | | |
| | 206,275 | | | KCA Deutag ⌂●† | | $ | 1,865 | |
| | | | | | | | | |
| | | | | Total Common Stocks | | | | |
| | | | | (Cost $2,795) | | $ | 1,865 | |
| | | | | | | | | |
| Preferred Stocks - 1.6% | | | | |
| | | | | Diversified Financials - 1.2% | | | | |
| | 5 | | | Citigroup Capital XIII | | $ | 147 | |
| | 221 | | | GMAC Capital Trust I β | | | 6,025 | |
| | | | | | | | 6,172 | |
| | | | | Telecommunication Services - 0.4% | | | | |
| | 36 | | | Intelsat S.A., 5.75% β | | | 1,830 | |
| | | | | | | | | |
| | | | | Total Preferred Stocks | | | | |
| | | | | (Cost $7,203) | | $ | 8,002 | |
| | | | | | | | | |
| | | | | Total Long-Term Investments | | | | |
| | | | | (Cost $468,122) | | $ | 488,822 | |
| | | | | | | | | |
| Short-Term Investments - 3.3% | | | | |
| | | | | Repurchase Agreements - 3.3% | | | | |
| | | | | Bank of America Merrill Lynch TriParty
Repurchase Agreement (maturing on
07/01/2014 in the amount of $1,412,
collateralized by FHLMC 2.23% - 5.99%, 2030
- 2044, FNMA 2.31% - 6.34%, 2020 - 2042,
value of $1,440) | | | | |
| $ | 1,412 | | | 0.10%, 6/30/2014 | | $ | 1,412 | |
| | | | | Bank of Montreal TriParty Repurchase
Agreement (maturing on 07/01/2014 in the
amount of $2,157, collateralized by U.S.
Treasury Bill 0.13%, 2015, U.S. Treasury
Bond 2.75% - 10.63%, 2015 - 2044, U.S.
Treasury Note 0.13% - 4.50%, 2014 - 2024,
value of $2,200) | | | | |
| | 2,157 | | | 0.09%, 6/30/2014 | | | 2,157 | |
The accompanying notes are an integral part of these financial statements.
| Hartford High Yield HLS Fund |
| Schedule of Investments – (continued) |
| June 30, 2014 (Unaudited) |
| (000’s Omitted) |
| Shares or Principal Amount ╬ | | | | | Market Value ╪ | |
| Short-Term Investments - 3.3% - (continued) | | | | | | | | |
| | | | | Repurchase Agreements - 3.3% - (continued) | | | | | | | | |
| | | | | Bank of Montreal TriParty Repurchase
Agreement (maturing on 07/01/2014 in the
amount of $920, collateralized by FHLMC
2.00% - 5.50%, 2018 - 2041, FNMA 2.00% -
4.50%, 2026 - 2042, GNMA 3.00% - 4.00%,
2042 - 2043, U.S. Treasury Bill 0.05%, 2014,
U.S. Treasury Note 0.75%, 2018, value of
$938) | | | | | | | | |
| $ | 920 | | | 0.11%, 6/30/2014 | | | | | | $ | 920 | |
| | | | | Barclays Capital TriParty Repurchase Agreement
(maturing on 07/01/2014 in the amount of
$851, collateralized by U.S. Treasury Note
0.63% - 0.88%, 2018 - 2019, value of $868) | | | | | | | | |
| | 851 | | | 0.07%, 6/30/2014 | | | | | | | 851 | |
| | | | | Citigroup Global Markets, Inc. TriParty
Repurchase Agreement (maturing on
07/01/2014 in the amount of $1,960,
collateralized by U.S. Treasury Bond 4.38% -
7.50%, 2016 - 2040, U.S. Treasury Note
0.50% - 3.00%, 2014 - 2020, value of $1,999) | | | | | | | | |
| | 1,960 | | | 0.06%, 6/30/2014 | | | | | | | 1,960 | |
| | | | | RBS Securities Inc. TriParty Repurchase
Agreement (maturing on 07/01/2014 in the
amount of $3,004, collateralized by U.S.
Treasury Note 0.38% - 3.13%, 2015 - 2022,
value of $3,064) | | | | | | | | |
| | 3,004 | | | 0.08%, 6/30/2014 | | | | | | | 3,004 | |
| | | | | TD Securities TriParty Repurchase Agreement
(maturing on 07/01/2014 in the amount of
$6,253, collateralized by FHLMC 3.50% -
4.00%, 2026 - 2044, FNMA 2.50% - 5.00%,
2025 - 2043, value of $6,378) | | | | | | | | |
| | 6,253 | | | 0.11%, 6/30/2014 | | | | | | | 6,253 | |
| | | | | UBS Securities Repurchase Agreement
(maturing on 07/01/2014 in the amount of $26,
collateralized by U.S. Treasury Note 2.13%,
2020, value of $26) | | | | | | | | |
| | 25 | | | 0.05%, 6/30/2014 | | | | | | | 25 | |
| | | | | | | | | | | | 16,582 | |
| | | | | Total Short-Term Investments | | | | | | | | |
| | | | | (Cost $16,582) | | | | | | $ | 16,582 | |
| | | | | | | | | | | | | |
| | | | | Total Investments | | | | | | | | |
| | | | | (Cost $484,704) ▲ | | | 100.3 | % | | $ | 505,404 | |
| | | | | Other Assets and Liabilities | | | (0.3 | )% | | | (1,518 | ) |
| | | | | Total Net Assets | | | 100.0 | % | | $ | 503,886 | |
The accompanying notes are an integral part of these financial statements.
| Hartford High Yield HLS Fund |
| Schedule of Investments – (continued) |
| June 30, 2014 (Unaudited) |
| (000’s Omitted) |
| Note: | Percentage of investments as shown is the ratio of the total market value to total net assets. |
| ▲ | At June 30, 2014, the cost of securities for federal income tax purposes was $484,842 and the aggregate gross unrealized appreciation and depreciation based on that cost were: |
| Unrealized Appreciation | | $ | 26,837 | |
| Unrealized Depreciation | | | (6,275 | ) |
| Net Unrealized Appreciation | | $ | 20,562 | |
| ╬ | All principal or contract amounts are in U.S. dollars unless otherwise indicated. |
| † | These securities are valued in good faith at fair value as determined under policies and procedures established by and under the supervision of the Board of Directors. At June 30, 2014, the aggregate value of these securities was $1,865, which represents 0.4% of total net assets. |
| ● | Non-income producing. For long-term debt securities, items identified are in default as to payment of interest and/or principal. |
| Ψ | The company is in bankruptcy. The investment held by the Fund is current with respect to interest payments. |
| Ω | Debt security in default due to bankruptcy. |
| Δ | Variable rate securities; the rate reported is the coupon rate in effect at June 30, 2014. |
| ♦ | Senior floating rate interests generally pay interest rates which are periodically adjusted by reference to a base short-term, floating lending rate plus a premium. The base lending rates are primarily the LIBOR, and secondarily the prime rate offered by one or more major United States banks (the "Prime Rate") and the certificate of deposit rate or other base lending rates used by commercial lenders. Senior floating rate interests often require prepayments from excess cash flows or permit the borrower to repay at its election. The rate at which the borrower repays cannot be predicted with accuracy. As a result, the actual remaining maturity may be substantially less than the stated maturities shown. Unless otherwise noted, the interest rate disclosed for these securities represents the average coupon as of June 30, 2014. |
| ■ | Securities issued within terms of a private placement memorandum, exempt from registration under Rule 144A under the Securities Act of 1933, as amended, and may be sold only to qualified institutional buyers. Unless otherwise indicated, these holdings are determined to be liquid. At June 30, 2014, the aggregate value of these securities was $210,315, which represents 41.7% of total net assets. |
| § | These securities were sold to the Fund under Regulation S, rules governing offers and sales made outside the United States without registration under the Securities Act of 1933, as amended. The Fund may only be able to resell these securities in the United States if an exemption from registration under the federal and state securities laws is available, or the Fund may only be able to sell these securities outside of the United States (such as on a foreign exchange) to a non-U.S. person. Unless otherwise indicated, these holdings are determined to be liquid. At June 30, 2014, the aggregate value of these securities was $6,954, which represents 1.4% of total net assets. |
| ⌂ | The following securities are considered illiquid. Illiquid securities are often purchased in private placement transactions, are often not registered under the Securities Act of 1933, as amended, and may have contractual restrictions on resale. A security may also be considered illiquid if the security lacks a readily available market or if its valuation has not changed for a certain period of time. |
| Period Acquired | | Shares/ Par | | | Security | | Cost Basis | |
| 03/2011 | | | 206,275 | | | KCA Deutag | | $ | 2,795 | |
At June 30, 2014, the aggregate value of these securities was $1,865, which represents 0.4% of total net assets.
| ♠ | Perpetual maturity security. Maturity date shown is the next call date or final legal maturity date, whichever comes first. |
| Þ | This security may pay interest in additional principal instead of cash. |
| ☼ | This security, or a portion of this security, was purchased on a when-issued, delayed-delivery or delayed-draw basis. The cost of these securities was $7,763 at June 30, 2014. |
| ‡ | This security, or a portion of this security, has been segregated to cover funding requirements on investment transactions settling in the future. |
| ╦ | This security, or a portion of this security, has been pledged as collateral in connection with OTC swap contracts. |
The accompanying notes are an integral part of these financial statements.
| Hartford High Yield HLS Fund |
| Schedule of Investments – (continued) |
| June 30, 2014 (Unaudited) |
| (000’s Omitted) |
Foreign Currency Contracts Outstanding at June 30, 2014
| | | | | | | | | | | | | | | Unrealized Appreciation/(Depreciation) | |
| Currency | | Buy / Sell | | Delivery Date | | Counterparty | | Contract Amount | | | Market Value ╪ | | | Asset | | | Liability | |
| CAD | | Buy | | 07/31/2014 | | RBC | | $ | 116 | | | $ | 117 | | | $ | 1 | | | $ | – | |
| CAD | | Sell | | 07/31/2014 | | BCLY | | | 117 | | | | 117 | | | | – | | | | – | |
| EUR | | Buy | | 07/10/2014 | | MSC | | | 4,850 | | | | 4,882 | | | | 32 | | | | – | |
| EUR | | Sell | | 07/31/2014 | | BOA | | | 6,202 | | | | 6,248 | | | | – | | | | (46 | ) |
| EUR | | Sell | | 07/31/2014 | | MSC | | | 4,849 | | | | 4,882 | | | | – | | | | (33 | ) |
| Total | | | | | | | | | | | | | | | | $ | 33 | | | $ | (79 | ) |
| ╪ | See Significant Accounting Policies of accompanying Notes to Financial Statements regarding valuation of securities. |
OTC Credit Default Swap Contracts Outstanding at June 30, 2014
| | | Counter- | | Notional | | (Pay)/ Receive Fixed
Rate/ Implied | | Expiration | | Upfront
Premiums | | | Upfront
Premiums | | | Market | | | Unrealized Appreciation/
(Depreciation) | |
| Reference Entity | | party | | Amount (a) | | Credit Spread (b) | | Date | | Paid | | | Received | | | Value ╪ | | | Asset | | | Liability | |
| Credit default swaps on single-name issues: |
| Buy protection: |
| Valeant Pharmaceuticals | | GSC | | USD | 240 | | (5.00)% / (2.38)% | | 06/20/19 | | $ | – | | | $ | (29 | ) | | $ | (29 | ) | | $ | – | | | $ | – | |
| (a) | The maximum potential amount the Fund could be required to pay as a seller of credit protection or receive as a buyer of credit protection if a credit event occurs as defined under the terms of that particular swap agreement. |
| (b) | Implied credit spreads, utilized in determining the market value of credit default swap agreements on corporate issues, U.S. municipal issues or sovereign government issues as of period end serve as an indicator of the current status of the payment/performance risk and represent the likelihood of risk of default for the credit derivative. The implied credit spread of a particular entity reflects the cost of buying/selling protection and may include upfront payments required to be made to enter into the agreement. Wider credit spreads represent a deterioration of the reference entity's credit soundness and a greater likelihood or risk of default or other credit event occurring as defined under the terms of the agreement. The percentage shown is the implied credit spread on June 30, 2014. For credit default swap agreements on indices, the quoted market prices and resulting values serve as the indicator of the current status of the payment/performance risk. |
The accompanying notes are an integral part of these financial statements.
| Hartford High Yield HLS Fund |
| Schedule of Investments – (continued) |
| June 30, 2014 (Unaudited) |
| (000’s Omitted) |
| GLOSSARY: (abbreviations used in preceding Schedule of Investments) |
| |
| Counterparty Abbreviations: |
| BCLY | Barclays |
| BOA | Banc of America Securities LLC |
| GSC | Goldman Sachs & Co. |
| MSC | Morgan Stanley |
| RBC | RBC Dominion Securities, Inc. |
| |
| Currency Abbreviations: |
| CAD | Canadian Dollar |
| EUR | EURO |
| USD | U.S. Dollar |
| |
| Other Abbreviations: |
| FHLMC | Federal Home Loan Mortgage Corp. |
| FNMA | Federal National Mortgage Association |
| GNMA | Government National Mortgage Association |
| LIBOR | London Interbank Offered Rate |
| OTC | Over-the-Counter |
The accompanying notes are an integral part of these financial statements.
| Hartford High Yield HLS Fund |
| Investment Valuation Hierarchy Level Summary |
| June 30, 2014 (Unaudited) |
| (000’s Omitted) |
| | | Total | | | Level 1 ♦ | | | Level 2 ♦ | | | Level 3 | |
| Assets: | | | | | | | | | | | | | | | | |
| Asset and Commercial Mortgage Backed Securities | | $ | – | | | $ | – | | | $ | – | | | $ | – | |
| Common Stocks ‡ | | | 1,865 | | | | – | | | | – | | | | 1,865 | |
| Corporate Bonds | | | 448,152 | | | | – | | | | 448,152 | | | | – | |
| Preferred Stocks | | | 8,002 | | | | 8,002 | | | | – | | | | – | |
| Senior Floating Rate Interests | | | 30,803 | | | | – | | | | 30,803 | | | | – | |
| Short-Term Investments | | | 16,582 | | | | – | | | | 16,582 | | | | – | |
| Total | | $ | 505,404 | | | $ | 8,002 | | | $ | 495,537 | | | $ | 1,865 | |
| Foreign Currency Contracts * | | $ | 33 | | | $ | – | | | $ | 33 | | | $ | – | |
| Swaps - Credit Default * | | | – | | | | – | | | | – | | | | – | |
| Total | | $ | 33 | | | $ | – | | | $ | 33 | | | $ | – | |
| Liabilities: | | | | | | | | | | | | | | | | |
| Foreign Currency Contracts * | | $ | 79 | | | $ | – | | | $ | 79 | | | $ | – | |
| Total | | $ | 79 | | | $ | – | | | $ | 79 | | | $ | – | |
| ♦ | For the six-month period ended June 30, 2014, there were no transfers between Level 1 and Level 2. |
| ‡ | The Fund has all or primarily all of the equity securities categorized in a particular level. Refer to the Schedule of Investments for further industry breakout. |
| * | Derivative instruments (excluding purchased and written options, if applicable) are valued at the unrealized appreciation/depreciation on the investments. |
Following is a reconciliation of Level 3 assets for which significant unobservable inputs were used to determine fair value:
| | | Balance as
of
December
31, 2013 | | | Realized
Gain (Loss) | | | Change in
Unrealized
Appreciation
(Depreciation) | | | Net
Amortization | | | Purchases | | | Sales | | | Transfers
Into
Level 3 | | | Transfers
Out of
Level 3 | | | Balance as
of June 30,
2014 | |
| Assets: | | | | | | | | | | | | | | | | | | | | | | | | | | | | | | | | | | | | |
| Asset & Commercial Mortgage Backed Securities | | $ | — | | | $ | — | | | $ | — | * | | $ | — | | | $ | — | | | $ | — | | | $ | — | | | $ | — | | | $ | — | |
| Common Stocks | | | 1,526 | | | | (17 | ) | | | 356 | † | | | — | | | | — | | | | — | | | | — | | | | — | | | | 1,865 | |
| Preferred Stocks | | | 160 | | | | (160 | ) | | | — | | | | — | | | | — | | | | — | | | | — | | | | — | | | | — | |
| Total | | $ | 1,686 | | | $ | (177 | ) | | $ | 356 | | | $ | — | | | $ | — | | | $ | — | | | $ | — | | | $ | — | | | $ | 1,865 | |
| * | Change in unrealized appreciation (depreciation) in the current period relating to assets still held at June 30, 2014 was zero. |
| † | Change in unrealized appreciation (depreciation) in the current period relating to assets still held at June 30, 2014 was $356. |
| Note: | For purposes of reporting transfers between different hierarchy levels, both transfers in and out of each level, as applicable, are shown as if they occurred at the beginning of the period. |
The accompanying notes are an integral part of these financial statements.
| Hartford High Yield HLS Fund |
| Statement of Assets and Liabilities |
| June 30, 2014 (Unaudited) |
| (000’s Omitted) |
| Assets: | | | | |
| Investments in securities, at market value (cost $484,704) | | $ | 505,404 | |
| Cash | | | 227 | |
| Unrealized appreciation on foreign currency contracts | | | 33 | |
| Unrealized appreciation on OTC swap contracts | | | — | |
| Receivables: | | | | |
| Investment securities sold | | | 50 | |
| Fund shares sold | | | 31 | |
| Dividends and interest | | | 6,868 | |
| Total assets | | | 512,613 | |
| Liabilities: | | | | |
| Unrealized depreciation on foreign currency contracts | | | 79 | |
| Payables: | | | | |
| Investment securities purchased | | | 7,844 | |
| Fund shares redeemed | | | 618 | |
| Investment management fees | | | 48 | |
| Distribution fees | | | 4 | |
| Other liabilities | | | — | |
| Accrued expenses | | | 105 | |
| OTC swap premiums received | | | 29 | |
| Total liabilities | | | 8,727 | |
| Net assets | | $ | 503,886 | |
| Summary of Net Assets: | | | | |
| Capital stock and paid-in-capital | | $ | 448,891 | |
| Undistributed net investment income | | | 48,103 | |
| Accumulated net realized loss | | | (13,698 | ) |
| Unrealized appreciation of investments and the translations of assets and liabilities denominated in foreign currency | | | 20,590 | |
| Net assets | | $ | 503,886 | |
| Shares authorized | | | 2,800,000 | |
| Par value | | $ | 0.001 | |
| Class IA: Net asset value per share | | $ | 9.39 | |
| Shares outstanding | | | 40,594 | |
| Net assets | | $ | 381,251 | |
| Class IB: Net asset value per share | | $ | 9.24 | |
| Shares outstanding | | | 13,269 | |
| Net assets | | $ | 122,635 | |
The accompanying notes are an integral part of these financial statements.
| Hartford High Yield HLS Fund |
| Statement of Operations |
| For the Six-Month Period Ended June 30, 2014 (Unaudited) |
| (000’s Omitted) |
| Investment Income: | | | | |
| Dividends | | $ | 277 | |
| Interest | | | 15,421 | |
| Total investment income, net | | | 15,698 | |
| | | | | |
| Expenses: | | | | |
| Investment management fees | | | 1,774 | |
| Transfer agent fees | | | 2 | |
| Distribution fees - Class IB | | | 154 | |
| Custodian fees | | | 5 | |
| Accounting services fees | | | 51 | |
| Board of Directors' fees | | | 8 | |
| Audit fees | | | 8 | |
| Other expenses | | | 75 | |
| Total expenses (before fees paid indirectly) | | | 2,077 | |
| Custodian fee offset | | | — | |
| Total fees paid indirectly | | | — | |
| Total expenses, net | | | 2,077 | |
| Net Investment Income | | | 13,621 | |
| | | | | |
| Net Realized Gain on Investments, Other Financial Instruments and Foreign Currency Transactions: | | | | |
| Net realized gain on investments | | | 5,474 | |
| Net realized gain on swap contracts | | | 88 | |
| Net realized gain on foreign currency contracts | | | 109 | |
| Net realized gain on other foreign currency transactions | | | 24 | |
| Net Realized Gain on Investments, Other Financial Instruments and Foreign Currency Transactions | | | 5,695 | |
| | | | | |
| Net Changes in Unrealized Appreciation of Investments, Other Financial Instruments and Foreign Currency Transactions: | | | | |
| Net unrealized appreciation of investments | | | 9,011 | |
| Net unrealized depreciation of swap contracts | | | (632 | ) |
| Net unrealized depreciation of foreign currency contracts | | | (44 | ) |
| Net unrealized depreciation on translation of other assets and liabilities in foreign currencies | | | (63 | ) |
| Net Changes in Unrealized Appreciation of Investments, Other Financial Instruments and Foreign Currency Transactions | | | 8,272 | |
| Net Gain on Investments, Other Financial Instruments and Foreign Currency Transactions | | | 13,967 | |
| Net Increase in Net Assets Resulting from Operations | | $ | 27,588 | |
The accompanying notes are an integral part of these financial statements.
| Hartford High Yield HLS Fund |
| Statement of Changes in Net Assets |
| |
| (000’s Omitted) |
| | | For the
Six-Month
Period Ended
June 30, 2014
(Unaudited) | | | For the
Year Ended
December 31,
2013 | |
| Operations: | | | | | | | | |
| Net investment income | | $ | 13,621 | | | $ | 34,064 | |
| Net realized gain on investments, other financial instruments and foreign currency transactions | | | 5,695 | | | | 14,695 | |
| Net unrealized appreciation (depreciation) of investments, other financial instruments and foreign currency transactions | | | 8,272 | | | | (13,756 | ) |
| Net Increase in Net Assets Resulting from Operations | | | 27,588 | | | | 35,003 | |
| Distributions to Shareholders: | | | | | | | | |
| From net investment income | | | | | | | | |
| Class IA | | | — | | | | (33,749 | ) |
| Class IB | | | — | | | | (10,240 | ) |
| Total distributions | | | — | | | | (43,989 | ) |
| Capital Share Transactions: | | | | | | | | |
| Class IA | | | | | | | | |
| Sold | | | 13,114 | | | | 71,995 | |
| Issued on reinvestment of distributions | | | — | | | | 33,749 | |
| Redeemed | | | (42,199 | ) | | | (213,606 | ) |
| Total capital share transactions | | | (29,085 | ) | | | (107,862 | ) |
| Class IB | | | | | | | | |
| Sold | | | 2,235 | | | | 26,312 | |
| Issued on reinvestment of distributions | | | — | | | | 10,240 | |
| Redeemed | | | (11,893 | ) | | | (57,755 | ) |
| Total capital share transactions | | | (9,658 | ) | | | (21,203 | ) |
| Net decrease from capital share transactions | | | (38,743 | ) | | | (129,065 | ) |
| Net Decrease in Net Assets | | | (11,155 | ) | | | (138,051 | ) |
| Net Assets: | | | | | | | | |
| Beginning of period | | | 515,041 | | | | 653,092 | |
| End of period | | $ | 503,886 | | | $ | 515,041 | |
| Undistributed (distribution in excess of) net investment income | | $ | 48,103 | | | $ | 34,482 | |
| Shares: | | | | | | | | |
| Class IA | | | | | | | | |
| Sold | | | 1,437 | | | | 7,914 | |
| Issued on reinvestment of distributions | | | — | | | | 3,933 | |
| Redeemed | | | (4,609 | ) | | | (23,548 | ) |
| Total share activity | | | (3,172 | ) | | | (11,701 | ) |
| Class IB | | | | | | | | |
| Sold | | | 248 | | | | 2,947 | |
| Issued on reinvestment of distributions | | | — | | | | 1,210 | |
| Redeemed | | | (1,320 | ) | | | (6,452 | ) |
| Total share activity | | | (1,072 | ) | | | (2,295 | ) |
The accompanying notes are an integral part of these financial statements.
| Hartford High Yield HLS Fund |
| Notes to Financial Statements |
| June 30, 2014 (Unaudited) |
| (000’s Omitted) |
Organization:
Hartford High Yield HLS Fund (the "Fund") serves as an underlying investment option for certain variable annuity and variable life insurance separate accounts of Hartford Life Insurance Company (“HLIC”) and its affiliates and certain qualified retirement plans. The Fund may also serve as an underlying investment option for certain variable annuity and variable life separate accounts of other insurance companies. Owners of variable annuity contracts and policyholders of variable life insurance contracts may choose the funds permitted in the variable insurance contract prospectus. In addition, participants in certain qualified retirement plans may choose the Fund if permitted by their plans.
Hartford Series Fund, Inc. (the “Company”) is an open-end registered management investment company comprised of twenty-eight portfolios. Financial statements for the Fund, a series of the Company, are included in this report.
The Company is organized under the laws of the State of Maryland and is registered with the Securities and Exchange Commission (“SEC”) under the Investment Company Act of 1940, as amended (“1940 Act”). The Fund is a diversified open-end management investment company.
The Fund is divided into Class IA and Class IB shares. Each class is offered at the per share net asset value (“NAV”) without a sales charge and is subject to the same expenses, except that the Class IB shares are subject to distribution and service fees charged pursuant to a Distribution Plan adopted in accordance with Rule 12b-1 under the 1940 Act.
Significant Accounting Policies:
The following is a summary of significant accounting policies of the Fund in the preparation of its financial statements, which are in accordance with United States Generally Accepted Accounting Principles (“U.S. GAAP”). The preparation of financial statements in accordance with U.S. GAAP may require management to make estimates and assumptions that affect the reported amounts of assets and liabilities and disclosure of contingent assets and liabilities at the date of the financial statements and the reported amounts of increases and decreases in net assets from operations during the reporting period. Actual results could differ from those estimates.
Determination of Net Asset Value – The NAV of each class of the Fund's shares is determined as of the close of regular trading (normally 4:00 p.m. Eastern Time) (the “NYSE Close”) on each day that the New York Stock Exchange (the “Exchange”) is open (“Valuation Date”). Information that becomes known to the Fund after the NAV has been calculated on a particular day will not generally be used to retroactively adjust the NAV determined earlier that day.
Investment Valuation and Fair Value Measurements – For purposes of calculating the NAV, portfolio investments and other assets held by the Fund's portfolio for which market quotes are readily available are valued at market value. Market value is generally determined on the basis of last reported sales prices or official close price. If no sales are reported, market value is based on quotes obtained from a quotation reporting system, established market makers, or independent pricing services. If market prices are not readily available or are deemed unreliable, the Fund will use the fair value of the investment as determined in good faith under policies and procedures established by and under the supervision of the Company's Board of Directors. Market quotes are considered not readily available where there is an absence of current or reliable market-based data (e.g., trade information or indicative market quotes), including where events occur after the close of the relevant market, but prior to the NYSE Close, that materially affect the values of the Fund's portfolio investments or assets. In addition, market quotes are considered not readily available when, due to extraordinary circumstances, the exchanges or markets on which the investments trade do not open for trading for the entire day and no other market prices are available. There can be no assurance that the Fund could obtain the fair market value assigned to an investment if the Fund were to sell the investment at approximately the time at which the Fund determines its NAV.
Fixed income investments (other than short-term obligations), non-exchange traded derivatives and centrally cleared swaps held by the Fund are normally valued on the basis of quotes obtained from independent pricing services or brokers and dealers in accordance with procedures established by the Company's Board of Directors. Prices obtained from independent pricing services use information provided by market makers or estimates of market values through accepted market modeling, trading and pricing conventions. Inputs to the models may include, but are not limited to, prepayment speeds, pricing spread, yield, trade information, dealer quotes, market color, cash flow models and the investment’s terms and conditions. Generally, the Fund may use fair valuation in regard to fixed
| Hartford High Yield HLS Fund |
| Notes to Financial Statements – (continued) |
| June 30, 2014 (Unaudited) |
| (000’s Omitted) |
income investments when the Fund holds defaulted or distressed investments or investments in a company in which a reorganization is pending. Senior floating rate interests generally trade in over-the-counter (“OTC”) markets and are priced through an independent pricing service utilizing independent market quotations from loan dealers or financial institutions. A composite bid price is used, which is an average of the dealer marks and dealer runs.Short-term investments maturing in 60 days or less are generally valued at amortized cost, if their original term to maturity was 60 days or less, or by amortizing their value on the 61st day prior to maturity, if the original term to maturity exceeded 60 days.
Investments valued in currencies other than U.S. dollars are converted to U.S. dollars using exchange rates obtained from independent pricing services for calculation of the NAV. As a result, the NAV of the Fund’s shares may be affected by changes in the value of currencies in relation to the U.S. dollar. The value of investments traded in markets outside the United States or denominated in currencies other than the U.S. dollar may be affected significantly on a day that the NYSE is closed and the market value may change on days when an investor is not able to purchase, redeem or exchange shares of the Fund.
Foreign currency contracts represent agreements to exchange currencies on specific future dates at predetermined rates. Foreign currency contracts are valued using foreign currency exchange rates and forward rates as provided by an independent pricing service on the Valuation Date.
Financial instruments for which prices are not available from an independent pricing service may be valued using market quotations obtained from one or more dealers that make markets in the respective financial instrument in accordance with procedures established by the Company's Board of Directors.
U.S. GAAP defines fair value as the price that the Fund would receive to sell an asset or pay to transfer a liability in an orderly transaction between market participants. The U.S. GAAP fair value measurement standards require disclosure of a fair value hierarchy for each major category of assets and liabilities. Various inputs are used in determining the fair value of the Fund’s investments. These inputs are summarized into three broad hierarchy levels. This hierarchy is based on whether the valuation inputs are observable or unobservable. These levels are:
Level 1 – Quoted prices in active markets for identical investments. Level 1 may include exchange traded instruments, such as domestic equities, some foreign equities, options, futures, mutual funds, exchange traded funds, rights and warrants.
Level 2 – Observable inputs other than Level 1 prices, such as quoted prices for similar investments; quoted prices in markets that are not active; or other inputs that are observable or can be corroborated by observable market data. Level 2 may include debt investments that are traded less frequently than exchange traded instruments and which are valued using independent pricing services; foreign equities, which are principally traded on certain foreign markets and are adjusted daily pursuant to a fair value pricing service in order to reflect an adjustment for the factors occurring after the close of certain foreign markets but before the NYSE Close; senior floating rate interests, which are valued using an aggregate of dealer bids; short-term investments, which are valued at amortized cost; and swaps, which are valued based upon the terms of each swap contract.
Level 3 – Significant unobservable inputs that are supported by limited or no market activity. Level 3 may include financial instruments whose values are determined using indicative market quotes or require significant management judgment or estimation. These unobservable valuation inputs may include estimates for current yields, maturity/duration, prepayment speed, and indicative market quotes for comparable investments along with other assumptions relating to credit quality, collateral value, complexity of the investment structure, general market conditions and liquidity. This category may include investments where trading has been halted or there are certain restrictions on trading. While these investments are priced using unobservable inputs, the valuation of these investments reflects the best available data and management believes the prices are a reasonable representation of exit price.
The Board of Directors of the Company generally reviews and approves the “Procedures for Valuation of Portfolio Securities” at least once a year. These procedures define how investments are to be valued, including the formation and activities of a Valuation Committee. The Valuation Committee is responsible for determining in good faith the fair value of investments when the value cannot be obtained from primary pricing services or alternative sources or if the valuation of an investment as provided by the primary pricing service or alternative source is believed not to reflect the investment’s fair value as of the Valuation Date.
| Hartford High Yield HLS Fund |
| Notes to Financial Statements – (continued) |
| June 30, 2014 (Unaudited) |
| (000’s Omitted) |
Voting members of the Valuation Committee include the Fund's Treasurer or designee and a Vice President of the investment manager or designee. An Assistant Vice President of the Fund with legal expertise or designee is also included on the Valuation Committee as a non-voting advisory member. In addition, the Fund’s Chief Compliance Officer shall designate a member of the compliance group to attend Valuation Committee meetings as a non-voting resource, to monitor for and provide guidance with respect to compliance with these procedures. Two members of the Valuation Committee or their designees, representing different departments, shall constitute a quorum for purposes of permitting the Valuation Committee to take action. The Valuation Committee will consider all relevant factors in determining an investment’s fair value, and may seek the advice of the Fund’s sub-adviser, knowledgeable brokers, and legal counsel in making such determination. The Valuation Committee reports to the Audit Committee of the Company's Board of Directors. The Audit Committee receives quarterly written reports which include details of all fair-valued investments, including the reason for the fair valuation, and an indication, when possible, of the accuracy of the valuation by disclosing the next available reliable public price quotation or the disposition price of such investments (the “look-back” test). The Board of Directors then must consider for ratification all of the fair value determinations made during the previous quarter.
Valuation levels are not necessarily indicative of the risk associated with investing in such investments. Individual investments within any of the above mentioned asset classes may be assigned a different hierarchical level than those presented above, as individual circumstances dictate.
For additional information, refer to the Investment Valuation Hierarchy Level Summary and the Level 3 roll-forward reconciliation, if applicable, which follow the Schedule of Investments.
Investment Transactions and Investment Income – Investment transactions are recorded as of the trade date (the date the order to buy or sell is executed) for financial reporting purposes. Investments purchased or sold on a when-issued or delayed-delivery basis may be settled a month or more after the trade date. Realized gains and losses are determined on the basis of identified cost.
Trade date for senior floating rate interests purchased in the primary loan market is considered the date on which the loan allocations are determined. Trade date for senior floating rate interests purchased in the secondary loan market is the date on which the transaction is entered into.
Dividend income from domestic securities is accrued on the ex-dividend date. Interest income, including amortization of premium, accretion of discounts and additional principal received in-kind in lieu of cash, is accrued on a daily basis. Paydown gains and losses on mortgage related and other asset backed securities are included in interest income in the Statement of Operations, as applicable.
Foreign Currency Transactions – Assets and liabilities denominated in currencies other than U.S. dollars are translated into U.S. dollars at the exchange rates in effect on the valuation date. Purchases and sales of investments, income and expenses are translated into U.S. dollars at the exchange rates on the dates of such transactions.
The Fund does not isolate that portion of portfolio investment valuation resulting from fluctuations in the foreign currency exchange rates from the fluctuations arising from changes in the market prices of investments held. Exchange rate fluctuations are included with the net realized and unrealized gain or loss on investments in the accompanying financial statements.
Net realized foreign exchange gains or losses arise from sales of foreign currencies and the difference between asset and liability amounts initially stated in foreign currencies and the U.S. dollar value of the amounts actually received or paid. Net unrealized foreign exchange gains or losses arise from changes in the value of other assets and liabilities at the end of the reporting period, resulting from changes in the exchange rates.
Joint Trading Account – The Fund may invest cash balances into a joint trading account that may be invested in one or more repurchase agreements.
Fund Share Valuation and Dividend Distributions to Shareholders – Orders for the Fund’s shares are executed in accordance with the investment instructions of the contract holders and plan participants. The NAV of the Fund’s shares is determined as of the close of business on each business day of the Exchange. The NAV is determined separately for each class of shares of the Fund by
| Hartford High Yield HLS Fund |
| Notes to Financial Statements – (continued) |
| June 30, 2014 (Unaudited) |
| (000’s Omitted) |
dividing the Fund’s net assets attributable to that class by the number of shares of the class outstanding. Each class of shares offered by the Fund has equal rights as to assets and voting privileges (except that shareholders of a class have exclusive voting rights regarding any matter relating solely to that class of shares). Income and non-class specific expenses are allocated daily to each class on the basis of the relative net assets of the class. Realized and unrealized gains and losses are allocated daily based on the relative net assets of each class of shares of the Fund.
Orders for the purchase of the Fund’s shares received prior to the close of the Exchange on any day the Exchange is open for business are priced at the NAV determined as of the close of the Exchange. Orders received after the close of the Exchange, or on a day on which the Exchange and/or the Fund is not open for business, are priced at the next determined NAV.
Dividends are declared pursuant to a policy adopted by the Company's Board of Directors based upon the investment performance of the Fund. The policy of the Fund is to pay dividends from net investment income and realized gains, if any, at least once a year.
Distributions from net investment income, net realized gains and capital are determined in accordance with federal income tax regulations, which may differ from U.S. GAAP with respect to character and timing. These differences may include, but are not limited to, losses deferred due to wash sale adjustments, foreign currency gains and losses, adjustments related to Passive Foreign Investment Companies ("PFICs"), Real Estate Investment Trusts ("REITs"), Regulated Investment Companies ("RICs"), certain derivatives and partnerships. Permanent book and federal income tax basis differences relating to shareholder distributions will result in reclassifications to certain of the Fund’s capital accounts (see Federal Income Taxes: Reclassification of Capital Accounts note).
Securities and Other Investments:
Repurchase Agreements – A repurchase agreement is an agreement by which a counterparty agrees to sell an investment and agrees to repurchase the investment sold from the buyer at a mutually agreed upon time and price. During the period of the repurchase agreement, the counterparty will deposit cash and or securities in a third party custodial account to serve as collateral. At the time the Fund enters into a repurchase agreement, the value of the underlying collateral, including accrued interest, will be equal to or exceed the value of the repurchase agreement. Repurchase agreements expose the Fund to counterparty risk - that is, the risk that the counterparty will not fulfill its obligations. To minimize counterparty risk, the investments that serve to collateralize the repurchase agreement are held by the Fund’s custodian in book entry or physical form in the custodial account of the Fund or in a third party custodial account. Repurchase agreements are valued at cost plus accrued interest, which approximates fair value. Repurchase agreements have master netting arrangements which allow the Fund to offset amounts owed to a counterparty with amounts owed by the counterparty, including any collateral. Upon an event of default under a master repurchase agreement, the non-defaulting party may close out all transactions traded under such agreement and net amounts owed under each transaction to one net amount payable by one party to the other. Absent an event of default, the master repurchase agreement does not result in an offset of reported amounts of assets and liabilities in the Statement of Assets and Liabilities across transactions between the Fund and the applicable counterparty. The Fund, as shown on the Schedule of Investments, had outstanding repurchase agreements and related collateral as of June 30, 2014.
Illiquid and Restricted Investments – The Fund is permitted to invest up to 15% of its net assets in illiquid investments. Illiquid investments are those that may not be sold or disposed of in the ordinary course of business within seven days, at approximately the price used to determine the Fund’s NAV. The Fund may not be able to sell illiquid investments when its sub-adviser considers it desirable to do so or may have to sell such investments at a price that is lower than the price that could be obtained if the investments were more liquid. A sale of illiquid investments may require more time and may result in higher dealer discounts and other selling expenses than does the sale of those that are liquid. Illiquid investments also may be more difficult to value due to the unavailability of reliable market quotations for such investments, and an investment in them may have an adverse impact on the Fund’s NAV. The Fund may also purchase certain restricted investments that can only be resold to certain qualified investors and may be determined to be liquid pursuant to policies and guidelines established by the Company's Board of Directors. The Fund, as shown on the Schedule of Investments, had illiquid or restricted investments as of June 30, 2014.
Investments Purchased on a When-Issued or Delayed-Delivery Basis – Delivery and payment for investments that have been purchased by the Fund on a forward commitment, or when-issued or delayed-delivery basis, take place beyond the customary settlement period. The Fund may dispose of or renegotiate a delayed-delivery transaction after it is entered into, and may sell
| Hartford High Yield HLS Fund |
| Notes to Financial Statements – (continued) |
| June 30, 2014 (Unaudited) |
| (000’s Omitted) |
delayed-delivery investments before they are delivered, which may result in a realized gain or loss. During this period, such investments are subject to market fluctuations, and the Fund identifies investments segregated in its records with a value at least equal to the amount of the commitment. The Fund, as shown on the Schedule of Investments, had when-issued or delayed-delivery investments as of June 30, 2014.
Senior Floating Rate Interests – The Fund may invest in senior floating rate interests. Senior floating rate interests hold the most senior position in the capital structure of a business entity (the “Borrower”), are typically secured by specific collateral and have a claim on the assets and/or stock of the Borrower that is senior to that held by subordinated debtholders and stockholders of the Borrower. Senior floating rate interests are typically structured and administered by a financial institution that acts as the agent of the lenders participating in the senior floating rate interest. The Fund may invest in multiple series or tranches of a senior floating rate interest, which may have varying terms and carry different associated risks. The Fund may also enter into unfunded loan commitments, which are contractual obligations for future funding. Unfunded loan commitments may include revolving credit facilities, which may obligate the Fund to supply additional cash to the borrower on demand. Unfunded loan commitments represent a future obligation in full. The Fund may receive a commitment fee based on the undrawn portion of the underlying line of credit portion of a senior floating rate interest. In certain circumstances, the Fund may receive various fees upon the restructure of a senior floating rate interest by a borrower. Fees earned/paid may be recorded as a component of income or realized gain/loss in the Statement of Operations.
Senior floating rate interests are typically rated below-investment-grade, which suggests they are more likely to default and generally pay higher interest rates than investment-grade loans. A default could lead to non-payment of income, which would result in a reduction of income to the Fund, and there can be no assurance that the liquidation of any collateral would satisfy the Borrower’s obligation in the event of non-payment of scheduled interest or principal payments, or that such collateral could be readily liquidated. The Fund, as shown on the Schedule of Investments, had senior floating rate interests as of June 30, 2014.
Mortgage Related and Other Asset Backed Securities – The Fund may invest in mortgage related and other asset backed securities. These securities include mortgage pass-through securities, collateralized mortgage obligations, commercial mortgage backed securities, stripped mortgage backed securities, asset backed securities, collateralized debt obligations and other securities that directly or indirectly represent a participation in, or are secured by and payable from, mortgage loans on real property. Mortgage related securities are created from pools of residential or commercial mortgage loans, including mortgage loans made by savings and loan institutions, mortgage bankers, commercial banks and others. Asset backed securities are created from many types of assets, including auto loans, credit card receivables, home equity loans, and student loans. These securities provide a monthly payment that consists of both interest and principal payments. Interest payments may be determined by fixed or adjustable rates. The rate of pre-payments on underlying mortgages will affect the price and volatility of a mortgage related security, and may have the effect of shortening or extending the effective duration of the security relative to what was anticipated at the time of purchase. The timely payment of principal and interest of certain mortgage related securities is guaranteed by the full faith and credit of the United States Government. Mortgage related and other asset backed securities created and guaranteed by non-governmental issuers, including government-sponsored corporations, may be supported by various forms of insurance or guarantees, but there can be no assurance that the private insurers or guarantors can meet their obligations under the insurance policies or guarantee arrangements. The Fund, as shown on the Schedule of Investments, had outstanding mortgage related and other asset backed securities as of June 30, 2014.
Financial Derivative Instruments:
The following disclosures contain information on how and why the Fund uses derivative instruments, the credit-risk-related contingent features in certain derivative instruments, and how derivative instruments affect the Fund’s financial position and results of operations. The location and fair value amounts of these instruments on the Statement of Assets and Liabilities and the realized gains and losses and changes in unrealized gains and losses on the Statement of Operations, each categorized by type of derivative contract, are included in the following Additional Derivative Instrument Information footnote. The derivative instruments outstanding as of period-end are disclosed in the notes to or within the Schedule of Investments for purchased options, if applicable. The amounts of realized gains and losses and changes in unrealized gains and losses on derivative instruments during the period are disclosed in the Statement of Operations.
Foreign Currency Contracts – The Fund may enter into foreign currency contracts that obligate the Fund to purchase or sell currencies at specified future dates. Foreign currency contracts are used to hedge the currency exposure associated with some or all
| Hartford High Yield HLS Fund |
| Notes to Financial Statements – (continued) |
| June 30, 2014 (Unaudited) |
| (000’s Omitted) |
of the Fund’s investments and/or as part of an investment strategy. Foreign currency contracts are marked to market daily and the change in value is recorded by the Fund as an unrealized gain or loss. The Fund will record a realized gain or loss when the foreign currency contract is settled.
Foreign currency contracts involve elements of market risk in excess of the amounts reflected in the Statement of Assets and Liabilities. In addition, risks may arise upon entering into these contracts from the potential inability of the counterparties to meet the terms of the contracts and from unanticipated movements in the value of the foreign currencies relative to the U.S. dollar. The Fund, as shown on the Schedule of Investments, had outstanding foreign currency contracts as of June 30, 2014.
Swap Contracts – The Fund may invest in swap contracts. Swap contracts are agreements to exchange or swap investment cash flows, assets, foreign currencies or market-linked returns at specified, future intervals. Swap contracts are either privately negotiated in the over-the-counter market (“OTC swaps”) or executed in a multilateral or other trade facility platform, such as a registered exchange (“centrally cleared swaps”). The Fund may enter into credit default, total return, cross-currency, interest rate, inflation and other forms of swap contracts to manage its exposure to credit, currency, interest rate, commodity and inflation risk. Swap contracts are also used to gain exposure to certain markets. In connection with these contracts, investments or cash may be identified as collateral or margin in accordance with the terms of the respective swap contracts and/or master netting arrangement to provide assets of value and recourse in the event of default or bankruptcy/insolvency.
Swaps are valued based on custom valuations furnished by an independent pricing service. Swaps for which prices are not available from an independent pricing service are valued in accordance with procedures established by the Company's Board of Directors. Changes in market value, if any, are reflected as a component of net changes in unrealized appreciation or depreciation on the Statement of Operations. Daily changes in valuation of centrally cleared swaps, if any, are recorded as a receivable or payable for the change in value as appropriate (“variation margin”) on the Statement of Assets and Liabilities. Realized gains or losses on centrally cleared swaps are recorded upon the termination of the swap. OTC swap payments received or made at the beginning of the measurement period are reflected as such on the Statement of Assets and Liabilities and represent premiums paid or received upon entering into the swap contract to compensate for differences between the stated terms of the swap contract and prevailing market conditions (credit spreads, currency exchange rates, interest rates and other relevant factors). These upfront premiums are recorded as realized gains or losses on the Statement of Operations upon termination or maturity of the swap. A liquidation payment received or made at the termination or maturity of the swap is recorded as a realized gain or loss on the Statement of Operations. Net periodic payments received or paid by the Fund are included as part of realized gains or losses on the Statement of Operations.
Entering into these contracts involves, to varying degrees, elements of liquidation, counterparty, credit and market risk in excess of the amounts recognized on the Statement of Assets and Liabilities. Such risks involve the possibility that there will be no liquid market for these contracts, that the counterparty to the contracts may default on its obligation to perform or disagree as to the meaning of contractual terms in the contracts, and that there may be unfavorable changes in market conditions (credit spreads, currency exchange rates, interest rates and other relevant factors).
The Fund’s maximum risk of loss from credit risk for OTC swaps is the net value of the discounted cash flows to be received from the counterparty over the contract’s remaining life, and current market value, to the extent that amount is positive. The risk is mitigated by having a master netting arrangement between the Fund and the counterparty, which allows for the netting of payments made or received (although such amounts are presented on a gross basis within the Statement of Assets and Liabilities, as applicable) as well as the posting of collateral to the Fund to cover the Fund’s exposure to the counterparty. In a centrally cleared swap, while the Fund enters into an agreement with a clearing broker to execute contracts with a counterparty, the performance of the swap is guaranteed by the central clearinghouse, which reduces the Fund’s exposure to credit risk. The Fund is still exposed to the credit risk of the clearing broker and clearinghouse. The clearinghouse attempts to minimize this risk to all of its participants through the use of mandatory margin requirements, daily cash settlements, and other procedures designed to protect counterparties utilizing the clearinghouse. Likewise, the clearing broker reduces its risk through margin requirements and required segregation of customer balances.
Credit Default Swap Contracts – The credit default swap market allows the Fund to manage its exposure to the market or certain sectors of the market, to reduce its risk exposure to defaults of corporate and sovereign issuers, or to create exposure to corporate or sovereign issuers to which it is not otherwise exposed. Certain credit default swaps involve the exchange of a fixed rate premium for
| Hartford High Yield HLS Fund |
| Notes to Financial Statements – (continued) |
| June 30, 2014 (Unaudited) |
| (000’s Omitted) |
protection against the loss in value of an underlying investment or index in the event of a credit event, such as payment default or bankruptcy.
Under a credit default swap contract, one party acts as guarantor by receiving the fixed periodic payment in exchange for the commitment to purchase the underlying investment at par if the defined credit event occurs. Upon the occurrence of a defined credit event, the difference between the value of the reference obligation and the swap’s notional amount is recorded as realized gain or loss on swap transactions in the Statement of Operations. A “buyer” of credit protection agrees to pay a counterparty to assume the credit risk of an issuer upon the occurrence of certain events. The “seller” of the protection receives periodic payments and agrees to assume the credit risk of an issuer upon the occurrence of certain events. Although specified events are contract specific, credit events are generally defined as bankruptcy, failure to pay, restructuring, obligation acceleration, obligation default or repudiation/moratorium. A “seller’s” exposure is limited to the total notional amount of the credit default swap contract. These potential amounts would be partially offset by any recovery values of the respective referenced obligations or upfront payments received upon entering into the contract.
Implied credit spreads, represented in absolute terms, utilized in determining the market value of credit default swap contracts on corporate issues, sovereign government issues or U.S. municipal issues as of six-month period-end are disclosed in the notes to the Schedule of Investments, as applicable, and serve as an indicator of the current status of the payment/performance risk and represent the likelihood or risk of default for the credit derivative. The implied credit spread of a particular referenced entity reflects the cost of buying/selling protection and may include upfront payments required to be made to enter into the contract. Wider credit spreads represent a deterioration of the referenced entity’s credit soundness and a greater likelihood or risk of default or other credit event occurring as defined under the terms of the contract. For credit default swap contracts on asset backed securities and credit indices, the quoted market prices and resulting values serve as the indicator of the current status of the payment/performance risk. Increasing market values, in absolute terms when compared to the notional amount of the swap, represent a deterioration of the referenced equity’s credit soundness and a greater likelihood or risk of default or other credit event occurring as defined under the terms of the contract. The Fund, as shown on the Schedule of Investments, had outstanding credit default swap contracts as of June 30, 2014.
Additional Derivative Instrument Information:
Fair Value of Derivative Instruments on the Statement of Assets and Liabilities as of June 30, 2014:
| | | Risk Exposure Category | |
| | | Interest Rate
Contracts | | | Foreign
Exchange
Contracts | | | Credit
Contracts | | | Equity
Contracts | | | Commodity
Contracts | | | Other
Contracts | | | Total | |
| Assets: | | | | | | | | | | | | | | | | | | | | | | | | | | | | |
| Unrealized appreciation on foreign currency contracts | | $ | — | | | $ | 33 | | | $ | — | | | $ | — | | | $ | — | | | $ | — | | | $ | 33 | |
| Unrealized appreciation on OTC swap contracts | | | — | | | | — | | | | — | | | | — | | | | — | | | | — | | | | — | |
| Total | | $ | — | | | $ | 33 | | | $ | — | | | $ | — | | | $ | — | | | $ | — | | | $ | 33 | |
| | | | | | | | | | | | | | | | | | | | | | | | | | | | | |
| Liabilities: | | | | | | | | | | | | | | | | | | | | | | | | | | | | |
| Unrealized depreciation on foreign currency contracts | | $ | — | | | $ | 79 | | | $ | — | | | $ | — | | | $ | — | | | $ | — | | | $ | 79 | |
| Total | | $ | — | | | $ | 79 | | | $ | — | | | $ | — | | | $ | — | | | $ | — | | | $ | 79 | |
The volume of derivatives that is presented in the Schedule of Investments is consistent with the derivative activity during the six-month period ended June 30, 2014.
| Hartford High Yield HLS Fund |
| Notes to Financial Statements – (continued) |
| June 30, 2014 (Unaudited) |
| (000’s Omitted) |
The Effect of Derivative Instruments on the Statement of Operations for the six-month period ended June 30, 2014:
| | | Risk Exposure Category | |
| | | Interest Rate
Contracts | | | Foreign
Exchange
Contracts | | | Credit
Contracts | | | Equity
Contracts | | | Commodity
Contracts | | | Other
Contracts | | | Total | |
| Realized Gain on Derivatives Recognized as a Result of Operations: | | | | | | | | | | | | | |
| Net realized gain on swap contracts | | $ | — | | | $ | — | | | $ | 88 | | | $ | — | | | $ | — | | | $ | — | | | $ | 88 | |
| Net realized gain on foreign currency contracts | | | — | | | | 109 | | | | — | | | | — | | | | — | | | | — | | | | 109 | |
| Total | | $ | — | | | $ | 109 | | | $ | 88 | | | $ | — | | | $ | — | | | $ | — | | | $ | 197 | |
| | | | | | | | | | | | | | | | | | | | | | | | | | | | | |
| Net Change in Unrealized Appreciation (Depreciation) on Derivatives Recognized as a Result of Operations: | | | | | | | | | | | | | |
| Net change in unrealized depreciation of swap contracts | | $ | — | | | $ | — | | | $ | (632 | ) | | $ | — | | | $ | — | | | $ | — | | | $ | (632 | ) |
| Net change in unrealized depreciation of foreign currency contracts | | | — | | | | (44 | ) | | | — | | | | — | | | | — | | | | — | | | | (44 | ) |
| Total | | $ | — | | | $ | (44 | ) | | $ | (632 | ) | | $ | — | | | $ | — | | | $ | — | | | $ | (676 | ) |
Balance Sheet Offsetting Information - Set forth below are tables which disclose both gross information and net information about instruments and transactions eligible for offset in the financial statements, and instruments and transactions that are subject to a master netting arrangement, as well as amounts related to margin, reflected as financial collateral (including cash collateral), held at clearing brokers, counterparties and the Fund’s custodian. The master netting arrangements allow the clearing brokers to net any collateral held in or on behalf of the Fund, or liabilities or payment obligations of the clearing brokers to the Fund, against any liabilities or payment obligations of the Fund to the clearing brokers. The Fund is required to deposit financial collateral (including cash collateral) at the Futures Commission Merchant's (FCM) custodian on behalf of clearing brokers and counterparties to continually meet the original and maintenance requirements established by the clearing brokers and counterparties. Such requirements are specific to the respective clearing broker or counterparty. Certain master netting arrangements may not be enforceable in a bankruptcy.
Offsetting of Financial Assets and Derivative Assets as of June 30, 2014:
| | | Gross Amounts*
of Assets
Presented in
Statement of
Assets and
Liabilities | | | Financial
Instruments with
Allowable Netting | | | Non-cash
Collateral
Received | | | Cash Collateral
Received | | | Net Amount (not
less than $0) | |
| Description | | | | | | | | | | | | | | | | | | | | |
| Unrealized appreciation on foreign currency contracts | | $ | 1 | | | $ | — | | | $ | — | | | $ | — | | | $ | 1 | |
| Total subject to a master netting or similar arrangement | | $ | 1 | | | $ | — | | | $ | — | | | $ | — | | | $ | 1 | |
* Gross amounts presented as no amounts are netted within the Statements of Assets and Liabilities.
Offsetting of Financial Liabilities and Derivative Liabilities as of June 30, 2014:
| | | Gross Amounts*
of Liabilities
Presented in
Statement of
Assets and
Liabilities | | | Financial
Instruments with
Allowable Netting | | | Non-cash
Collateral
Pledged | | | Cash Collateral
Pledged | | | Net Amount (not
less than $0) | |
| Description | | | | | | | | | | | | | | | | | | | | |
| OTC swap contracts at market value | | $ | 29 | | | $ | — | | | $ | — | | | $ | — | | | $ | 29 | |
| Unrealized depreciation on foreign currency contracts | | | 79 | | | | — | | | | — | | | | — | | | | 79 | |
| Total subject to a master netting or similar arrangement | | $ | 108 | | | $ | — | | | $ | — | | | $ | — | | | $ | 108 | |
* Gross amounts presented as no amounts are netted within the Statement of Assets and Liabilities.
Certain derivatives held by the Fund, as of June 30, 2014, are not subject to a master netting arrangement and are excluded from the table above.
| Hartford High Yield HLS Fund |
| Notes to Financial Statements – (continued) |
| June 30, 2014 (Unaudited) |
| (000’s Omitted) |
Principal Risks:
Credit risk depends largely on the perceived financial health of bond issuers. In general, the credit rating is inversely related to the credit risk of the issuer. Higher rated bonds generally are deemed to have less credit risk, while lower or unrated bonds are deemed to have higher risk of default. The share price, yield and total return of a fund that holds securities with higher credit risk may be more volatile than those of a fund that holds bonds with lower credit risk. Similar to credit risk, the Fund may be exposed to counterparty risk, or the risk that an institution or other entity with which the Fund has unsettled or open transactions will default.
The Fund’s investments expose the Fund to various risks including, but not limited to, interest rate, prepayment, extension, foreign currency and equity risks. Interest rate risk is the risk that fixed income securities will decline in value because of changes in interest rates. As nominal interest rates rise, the values of certain fixed income securities held by the Fund are likely to decrease. A nominal interest rate can be described as the sum of a real interest rate and an expected inflation rate. Fixed income securities with longer durations tend to be more sensitive to changes in interest rates, usually making them more volatile than securities with shorter durations. Duration is useful primarily as a measure of the sensitivity of a fixed income security’s market price to interest rate (i.e., yield) movements. Senior floating rate interests and securities subject to prepayment and extension risk generally offer less potential for gains when interest rates decline. Rising interest rates may cause prepayments to occur at a slower than expected rate, thereby effectively lengthening the maturity of the security and making the security more sensitive to interest rate changes. Prepayment and extension risk are major risks of mortgage backed securities, senior floating rate interests and certain asset backed securities. For certain asset backed securities, the actual maturity may be less than the stated maturity shown in the Schedule of Investments, if applicable. As a result, the timing of income recognition relating to these securities may vary based upon the actual maturity.
If the Fund invests directly in foreign currencies or in securities that trade in, and receive revenues in, foreign currencies, or in derivatives that provide exposure to foreign currencies, it will be subject to the risk that those currencies will decline in value relative to the base currency (U.S. dollars) of the Fund, or, in the case of hedging positions, that the Fund’s base currency will decline in value relative to the currency being hedged. Currency rates in foreign countries may fluctuate significantly over short periods of time for a number of reasons, including changes in interest rates, intervention (or the failure to intervene) by U.S. or foreign governments, central banks or supranational entities, such as the International Monetary Fund, or by the imposition of currency controls or other political developments in the United States or abroad. As a result, the Fund’s investments in foreign currency denominated securities may reduce the returns of the Fund. The market values of equity securities, such as common stocks and preferred stocks, or equity related investments, such as futures and options, may decline due to general market conditions which are not specifically related to a particular company, such as real or perceived adverse economic conditions, changes in the general outlook for corporate earnings, changes in interest or currency rates or adverse investor sentiment generally. The market value of equity securities may also decline due to factors which affect a particular industry or industries, such as labor shortages or increased production costs and competitive conditions within an industry. Equity securities and equity related investments generally have greater market price volatility than fixed income securities.
Federal Income Taxes:
Federal Income Taxes – For federal income tax purposes, the Fund intends to continue to qualify as a RIC under Subchapter M of the Internal Revenue Code (“IRC”) by distributing substantially all of its taxable net investment income and net realized capital gains to its shareholders and otherwise complying with the requirements of the IRC. The Fund has distributed substantially all of its income and capital gains in prior years, if applicable, and intends to distribute substantially all of its income and capital gains prior to the next fiscal year-end. Accordingly, no provision for federal income or excise taxes has been made in the accompanying financial statements. Distributions from short-term capital gains are treated as ordinary income distributions for federal income tax purposes.
Net Investment Income (Loss), Net Realized Gains (Losses) and Distributions – Net investment income (loss) and net realized gains (losses) may differ for financial statement and tax purposes primarily because of losses deferred due to wash sale adjustments, foreign currency gains and losses, adjustments related to PFICs, REITs, RICs, certain derivatives and partnerships. The character of distributions made during the year from net investment income or net realized gains may differ from their ultimate characterization for federal income tax purposes. Also, due to the timing of dividend distributions, the fiscal year in which amounts are distributed may differ from the year that the income or realized gains (losses) were recorded by the Fund.
| Hartford High Yield HLS Fund |
| Notes to Financial Statements – (continued) |
| June 30, 2014 (Unaudited) |
| (000’s Omitted) |
Distributions and Components of Distributable Earnings – The tax character of distributions paid by the Fund for the periods indicated is as follows (as adjusted for dividends payable, if applicable):
| | | For the Year Ended
December 31, 2013 | | | For the Year Ended
December 31, 2012 | |
| Ordinary Income | | $ | 43,989 | | | $ | 57,181 | |
As of December 31, 2013, the Fund’s components of distributable earnings (deficit) on a tax basis are as follows:
| | | Amount | |
| Undistributed Ordinary Income | | $ | 35,155 | |
| Accumulated Capital and Other Losses* | | | (19,258 | ) |
| Unrealized Appreciation† | | | 12,182 | |
| Total Accumulated Earnings | | $ | 28,079 | |
| * | The Fund has capital loss carryforwards that are identified in the Capital Loss Carryforward note that follows. |
| † | Differences between book-basis and tax-basis unrealized appreciation (depreciation) may be attributable to the losses deferred due to wash sale adjustments, foreign currency gains and losses, adjustments related to PFICs, REITs, RICs, certain derivatives and partnerships. |
Reclassification of Capital Accounts – The Fund may record reclassifications in its capital accounts. These reclassifications have no impact on the total net assets of the Fund. The reclassifications are a result of permanent differences between U.S. GAAP and tax accounting for such items as foreign currency, PFICs, expiration or utilization of capital loss carryforwards or net operating losses. Adjustments are made to reflect the impact these items have on current and future distributions to shareholders. Therefore, the source of the Fund’s distributions may be shown in the accompanying Statement of Changes in Net Assets as from undistributed net investment income, from accumulated net realized gains on investments or from capital depending on the type of book and tax differences that exist. For the year ended December 31, 2013, the Fund recorded reclassifications to increase (decrease) the accounts listed below:
| | | Amount | |
| Undistributed Net Investment Income (Loss) | | $ | 453 | |
| Accumulated Net Realized Gain (Loss) | | | (453 | ) |
Capital Loss Carryforward – On December 22, 2010, the Regulated Investment Company Modernization Act of 2010 (the “Act”) was enacted, which made changes to the capital loss carryforward rules. The changes are effective for taxable years beginning after the date of enactment. Under the Act, funds are permitted to carry forward capital losses for an unlimited period. However, any losses incurred during those future taxable years will be required to be utilized prior to the losses incurred in pre-enactment taxable years, which carry an expiration date. As a result of this ordering rule, pre-enactment capital loss carryforwards may be more likely to expire unused. Additionally, post-enactment capital loss carryforwards retain their character as either short-term or long-term capital losses rather than being considered all short-term as permitted under prior regulation.
At December 31, 2013 (tax year end), the Fund had capital loss carryforwards for U.S. federal income tax purposes as follows:
| Year of Expiration | | Amount | |
| 2017 | | $ | 19,258 | |
| Total | | $ | 19,258 | |
During the year ended December 31, 2013, the Fund utilized $13,881 of prior year capital loss carryforwards.
Accounting for Uncertainty in Income Taxes – The Fund has adopted financial reporting rules that require the Fund to analyze all open tax years, as defined by the statute of limitations, for all major jurisdictions. Generally, tax authorities can examine all tax returns filed for the last three years. The Fund does not have an examination in progress.
| Hartford High Yield HLS Fund |
| Notes to Financial Statements – (continued) |
| June 30, 2014 (Unaudited) |
| (000’s Omitted) |
The Fund has reviewed all open tax years and major jurisdictions and concluded that these financial reporting rules had no effect on the Fund’s financial position or results of operations. There is no tax liability resulting from unrecognized tax benefits relating to uncertain income tax positions taken or expected to be taken on the tax return for the fiscal year ended December 31, 2013. The Fund is also not aware of any tax positions for which it is reasonably possible that the total amounts of unrecognized tax benefits will significantly change in the next twelve months.
Expenses:
Investment Management Agreement – Hartford Funds Management Company, LLC ("HFMC") serves as the Fund’s investment manager pursuant to an Investment Management Agreement with the Company. HFMC is an indirect wholly owned subsidiary of The Hartford Financial Services Group, Inc. ("The Hartford"). The investment manager has overall investment supervisory responsibility for the Fund. In addition, the investment manager provides administrative personnel, services, equipment, facilities and office space for proper operation of the Fund. HFMC has contracted with Wellington Management Company, LLP ("Wellington Management") under a sub-advisory agreement for the provision of day-to-day investment management services to the Fund in accordance with the Fund’s investment objective and policies. The Fund pays a fee to the investment manager, a portion of which may be used to compensate Wellington Management.
The schedule below reflects the rates of compensation paid to the investment manager for investment management services rendered as of June 30, 2014; the rates are accrued daily and paid monthly:
| Average Daily Net Assets | | Annual Fee |
| On first $500 million | | 0.7000% |
| On next $500 million | | 0.6750% |
| On next $1.5 billion | | 0.6250% |
| On next $2.5 billion | | 0.6150% |
| On next $5 billion | | 0.6050% |
| Over $10 billion | | 0.5950% |
Accounting Services Agreement – Pursuant to the Fund Accounting Agreement between HFMC and the Company, on behalf of the Fund, HFMC provides accounting services to the Fund and receives monthly compensation based on the Fund’s average daily net assets at the rates set forth below. The Fund’s accounting services fees are accrued daily and paid monthly.
| Average Daily Net Assets | | Annual Fee |
| On first $5 billion | | 0.020% |
| On next $5 billion | | 0.015% |
| Over $10 billion | | 0.010% |
Operating Expenses – Allocable expenses incurred by the Company are allocated to each Fund and allocated to classes within a Fund in proportion to the average daily net assets of the Fund and each class, except where allocation of certain expenses is more fairly made directly to the Fund or to specific classes within a Fund.
Fees Paid Indirectly – The Fund's custodian bank has agreed to reduce its fees when the Fund maintains cash on deposit in a non-interest-bearing custody account. For the six-month period ended June 30, 2014, this amount, if any, is included in the Statement of Operations.
| Hartford High Yield HLS Fund |
| Notes to Financial Statements – (continued) |
| June 30, 2014 (Unaudited) |
| (000’s Omitted) |
The ratio of expenses to average net assets in the accompanying financial highlights excludes the reduction in expenses related to fees paid indirectly. The annualized expense ratio after waivers for the period listed below reflecting the reduction for fees paid indirectly is as follows:
| | | Annualized Six-
Month Period Ended
June 30, 2014 | |
| Class IA | | | 0.76% | |
| Class IB | | | 1.01 | |
Distribution Plan for Class IB Shares – Hartford Funds Distributors, LLC (“HFD”), an indirect wholly owned subsidiary of The Hartford, is the principal underwriter and distributor of the Fund. The Company, on behalf of the Fund, has adopted a Distribution Plan pursuant to Rule 12b-1 of the 1940 Act for Class IB shares.
The Distribution Plan provides that the Fund may pay annually up to 0.25% of the average daily net assets of the Fund attributable to its Class IB shares for activities primarily intended to result in the sale of Class IB shares. The Board has the authority to suspend or reduce these payments at any point in time. Under the terms of the Distribution Plan and the principal underwriting agreement, the Fund is authorized to make payments monthly to the distributor that may be used to pay or reimburse entities providing distribution and shareholder servicing with respect to the Class IB shares for such entities’ fees or expenses incurred or paid in that regard. The distribution fee paid during the period can be found on the Statement of Operations. These fees are accrued daily and paid monthly.
Other Related Party Transactions – Hartford Administrative Services Company (“HASCO”), an indirect wholly owned subsidiary of The Hartford, provides transfer agent services to the Fund. HASCO was compensated on a per account basis for providing such services. The amount paid to HASCO can be found in the Statement of Operations. These fees are accrued daily and paid monthly.
Payment from Affiliate – In July of 2007, The Hartford entered into a settlement with the Attorneys General of the states of New York, Connecticut and Illinois relating to market timing and the company's individual variable annuity contracts in which certain payments would be made directly to the variable annuity contract holders. The distribution plan provided that unclaimed money from the settlement would be distributed to certain HLS Funds that are investment options through a Hartford individual variable annuity contract. The unclaimed money was distributed to the Fund on September 18, 2009.
The total return in the accompanying financial highlights includes a payment from an affiliate. Had the payment from the affiliate been excluded, the impact and total return for the period listed below would have been as follows:
| | | For the Year Ended December 31, 2009 | |
| | | Class IA | | | Class IB | |
| Impact from Payment from Affiliate for Attorneys General Settlement | | | 0.03% | | | | 0.03% | |
| Total Return Excluding Payment from Affiliate | | | 50.41% | | | | 50.04% | |
Investment Transactions:
For the six-month period ended June 30, 2014, the cost of purchases and proceeds from sales of investment securities (excluding short-term investments) were as follows:
| | | Excluding U.S.
Government
Obligations | | | U.S.
Government
Obligations | | | Total | |
| Cost of Purchases | | $ | 115,542 | | | $ | — | | | $ | 115,542 | |
| Sales Proceeds | | | 146,210 | | | | — | | | | 146,210 | |
| Hartford High Yield HLS Fund |
| Notes to Financial Statements – (continued) |
| June 30, 2014 (Unaudited) |
| (000’s Omitted) |
Line of Credit:
The Fund is one of several Hartford Funds that participate in a $500 million committed revolving line of credit facility. The facility is to be used for temporary or emergency purposes. Under the arrangement, the funds are required to own securities having a market value in excess of 300% of the total bank borrowings. The interest rate on borrowings varies depending on the nature of the loan. The facility also requires a fee to be paid based on the amount of the commitment. This commitment fee is allocated to all the funds participating in the line of credit based on the average net assets of the funds. During the six-month period ended June 30, 2014, the Fund did not have any borrowings under this facility.
Industry Classifications:
Other than the industry classifications "Other Investment Pools and Funds" and "Exchange Traded Funds," equity industry classifications used in this report are the Global Industry Classification Standard, which was developed by and is the exclusive property and service mark of MSCI, Inc. and Standard & Poor's.
Indemnifications:
Under the Company's organizational documents, the Company shall indemnify its officers and directors to the full extent required or permitted under Maryland General Corporation Law and the federal securities laws. In addition, the Company, on behalf of the Fund, may enter into contracts that contain a variety of indemnifications. The Company's maximum exposure under these arrangements is unknown. However, as of the date of these financial statements, the Company has not had prior claims or losses pursuant to these contracts and expects the risk of loss to be remote.
Pending Legal Proceedings:
On February 25, 2011, Jennifer L. Kasilag, Louis Mellinger, Judith M. Menendez, Jacqueline M. Robinson, and Linda A. Russell filed a derivative lawsuit against Hartford Investment Financial Services, LLC (“HIFSCO”) (now known as Hartford Funds Distributors, LLC) on behalf of six Hartford retail mutual funds in the United States District Court for the District of New Jersey, alleging that HIFSCO received excessive advisory and distribution fees in violation of its statutory fiduciary duty under Section 36(b) of the 1940 Act when serving as investment manager and principal underwriter, respectively, to the Hartford retail mutual funds. Although this action was purportedly filed on behalf of certain of the Hartford Funds, none of the Hartford Funds is itself a defendant to the suit. HIFSCO moved to dismiss and, in September 2011, the motion was granted in part and denied in part, with leave to amend the complaint. In November 2011, plaintiffs filed an amended complaint on behalf of certain Hartford retail mutual funds, The Hartford Global Health Fund (now known as The Hartford Healthcare Fund), The Hartford Conservative Allocation Fund, The Hartford Growth Opportunities Fund, The Hartford Inflation Plus Fund, The Hartford Advisers Fund (now known as The Hartford Balanced Fund), and The Hartford Capital Appreciation Fund. Plaintiffs seek to rescind the investment management agreements and distribution plans between HIFSCO and these funds and to recover the total fees charged thereunder or, in the alternative, to recover any improper compensation HIFSCO received, in addition to lost earnings. HIFSCO filed a partial motion to dismiss the amended complaint and, in December 2012, the court dismissed without prejudice the claims regarding distribution fees and denied the motion with respect to the advisory fees claims. HIFSCO disputes the allegations and intends to defend vigorously.
In March 2014, the plaintiffs filed a new complaint that added as new plaintiffs The Hartford Floating Rate Fund and The Hartford Small Company Fund and named as a defendant Hartford Funds Management Company, LLC (the “Investment Manager”), which assumed the role as investment adviser to the funds as of January 2013. The Investment Manager and HIFSCO dispute the allegations and intend to defend vigorously.
This action concerns the activities of HIFSCO in its capacity as investment manager and principal underwriter to the Hartford retail mutual funds and does not concern HIFSCO’s activities in its capacity as principal underwriter to the HLS funds. For this reason, no accrual for litigation relating to this matter has been recorded in the financial statements of the Fund.
| Hartford High Yield HLS Fund |
| Financial Highlights |
| | | ─ Selected Per-Share Data(A) ─ | | | ─ Ratios and Supplemental Data ─ | |
| Class | | Net Asset
Value at
Beginning
of Period | | | Net
Investment
Income
(Loss) | | | Net
Realized
and
Unrealized
Gain (Loss)
on
Investments | | | Total from
Investment
Operations | | | Dividends
from Net
Investment
Income | | | Distributions
from
Realized
Capital
Gains | | | Total
Dividends
and
Distributions | | | Net
Asset
Value
at End
of
Period | | | Total
Return(B) | | | Net
Assets at
End of
Period
(000s) | | | Ratio of
Expenses
to
Average
Net
Assets
Before
Adjust-
ments(C) | | | Ratio of
Expenses
to
Average
Net
Assets
After
Adjust-
ments(C) | | | Ratio of
Net
Investment
Income
(Loss) to
Average
Net Assets | |
| | | | | | | | | | | | | | | | | | | | | | | | | | | | | | | | | | | | | | | | |
| For the Six-Month Period Ended June 30, 2014 (Unaudited) |
| IA | | $ | 8.90 | | | $ | 0.25 | | | $ | 0.24 | | | $ | 0.49 | | | $ | – | | | $ | – | | | $ | – | | | $ | 9.39 | | | | 5.51 | %(D) | | $ | 381,251 | | | | 0.76 | %(E) | | | 0.76 | %(E) | | | 5.43 | %(E) |
| IB | | | 8.77 | | | | 0.23 | | | | 0.24 | | | | 0.47 | | | | – | | | | – | | | | – | | | | 9.24 | | | | 5.36 | (D) | | | 122,635 | | | | 1.01 | (E) | | | 1.01 | (E) | | | 5.18 | (E) |
| | | | | | | | | | | | | | | | | | | | | | | | | | | | | | | | | | | | | | | | | | | | | | | | | | | | | |
| For the Year Ended December 31, 2013 |
| IA | | $ | 9.09 | | | $ | 0.54 | | | $ | 0.01 | | | $ | 0.55 | | | $ | (0.74 | ) | | $ | – | | | $ | (0.74 | ) | | $ | 8.90 | | | | 6.43 | % | | $ | 389,340 | | | | 0.75 | % | | | 0.75 | % | | | 5.90 | % |
| IB | | | 8.96 | | | | 0.50 | | | | 0.03 | | | | 0.53 | | | | (0.72 | ) | | | – | | | | (0.72 | ) | | | 8.77 | | | | 6.17 | | | | 125,701 | | | | 1.00 | | | | 1.00 | | | | 5.64 | |
| | | | | | | | | | | | | | | | | | | | | | | | | | | | | | | | | | | | | | | | | | | | | | | | | | | | | |
| For the Year Ended December 31, 2012 |
| IA | | $ | 8.70 | | | $ | 0.58 | | | $ | 0.63 | | | $ | 1.21 | | | $ | (0.82 | ) | | $ | – | | | $ | (0.82 | ) | | $ | 9.09 | | | | 14.31 | % | | $ | 504,042 | | | | 0.75 | % | | | 0.75 | % | | | 6.37 | % |
| IB | | | 8.59 | | | | 0.55 | | | | 0.62 | | | | 1.17 | | | | (0.80 | ) | | | – | | | | (0.80 | ) | | | 8.96 | | | | 14.03 | | | | 149,050 | | | | 1.00 | | | | 1.00 | | | | 6.12 | |
| | | | | | | | | | | | | | | | | | | | | | | | | | | | | | | | | | | | | | | | | | | | | | | | | | | | | |
| For the Year Ended December 31, 2011 |
| IA | | $ | 9.15 | | | $ | 0.71 | | | $ | (0.31 | ) | | $ | 0.40 | | | $ | (0.85 | ) | | $ | – | | | $ | (0.85 | ) | | $ | 8.70 | | | | 4.69 | % | | $ | 548,608 | | | | 0.74 | % | | | 0.74 | % | | | 7.68 | % |
| IB | | | 9.04 | | | | 0.67 | | | | (0.30 | ) | | | 0.37 | | | | (0.82 | ) | | | – | | | | (0.82 | ) | | | 8.59 | | | | 4.44 | | | | 160,060 | | | | 0.99 | | | | 0.99 | | | | 7.43 | |
| | | | | | | | | | | | | | | | | | | | | | | | | | | | | | | | | | | | | | | | | | | | | | | | | | | | | |
| For the Year Ended December 31, 2010 |
| IA | | $ | 7.94 | | | $ | 0.75 | | | $ | 0.52 | | | $ | 1.27 | | | $ | (0.06 | ) | | $ | – | | | $ | (0.06 | ) | | $ | 9.15 | | | | 16.15 | % | | $ | 602,493 | | | | 0.75 | % | | | 0.75 | % | | | 8.80 | % |
| IB | | | 7.86 | | | | 0.72 | | | | 0.52 | | | | 1.24 | | | | (0.06 | ) | | | – | | | | (0.06 | ) | | | 9.04 | | | | 15.86 | | | | 186,357 | | | | 1.00 | | | | 1.00 | | | | 8.57 | |
| | | | | | | | | | | | | | | | | | | | | | | | | | | | | | | | | | | | | | | | | | | | | | | | | | | | | |
| For the Year Ended December 31, 2009 |
| IA | | $ | 5.73 | | | $ | 0.73 | | | $ | 2.16 | | | $ | 2.89 | | | $ | (0.68 | ) | | $ | – | | | $ | (0.68 | ) | | $ | 7.94 | | | | 50.46 | %(F) | | $ | 527,000 | | | | 0.75 | % | | | 0.75 | % | | | 10.32 | % |
| IB | | | 5.68 | | | | 0.70 | | | | 2.14 | | | | 2.84 | | | | (0.66 | ) | | | – | | | | (0.66 | ) | | | 7.86 | | | | 50.08 | (F) | | | 188,832 | | | | 1.00 | | | | 1.00 | | | | 10.08 | |
| (A) | Information presented relates to a share outstanding throughout the indicated period. Net investment income (loss) per share amounts are calculated based on average shares outstanding unless otherwise noted. |
| (B) | The figures do not include sales charges or other fees which may be applied at the variable life insurance, variable annuity or qualified retirement plan product level. Any such additional sales charges or other fees would lower the Fund's performance. |
| (C) | Adjustments include waivers and reimbursements, if applicable. Ratios do not include fees paid indirectly (see Expenses in the accompanying Notes to Financial Statements). |
| (F) | Total return without the inclusion of the Payment from (to) Affiliate can be found in Expenses in the accompanying Notes to Financial Statements. |
| | | Portfolio Turnover
Rate for
All Share Classes | |
| For the Six-Month Period Ended June 30, 2014 (Unaudited) | | | 24% | |
| For the Year Ended December 31, 2013 | | | 46 | |
| For the Year Ended December 31, 2012 | | | 94 | |
| For the Year Ended December 31, 2011 | | | 88 | |
| For the Year Ended December 31, 2010 | | | 139 | |
| For the Year Ended December 31, 2009 | | | 173 | |
| Hartford High Yield HLS Fund |
| Directors and Officers (Unaudited) |
The Board of Directors of the Company (the "Directors") appoints officers who are responsible for the day-to-day operations of the Fund and who execute policies formulated by the Directors. Each Director serves until his or her death, resignation, or retirement or until the next annual meeting of shareholders is held or until his or her successor is elected and qualifies.
Directors and officers who are employed by or who have a financial interest in The Hartford are considered “interested” persons of the Fund pursuant to the 1940 Act. Each officer and two of the Company's Directors, as noted in the chart below, are “interested” persons of the Fund. Each Director serves as a director for The Hartford Mutual Funds, Inc., The Hartford Mutual Funds II, Inc., Hartford Series Fund, Inc., and Hartford HLS Series Fund II, Inc., and as a trustee for The Hartford Alternative Strategies Fund, which, as of June 30, 2014, collectively consist of 78 funds. Correspondence may be sent to Directors and officers c/o Hartford Funds, 5 Radnor Corporate Center, Suite 300, 100 Matsonford Road, Radnor, Pennsylvania 19087, except that correspondence to Mr. Annoni, Mr. Dressen and Ms. Quade may be sent to 500 Bielenberg Drive, Suite 500, Woodbury, Minnesota 55125.
The table below sets forth, for each Director and officer, his or her name, year of birth, current position with the Company and date first elected or appointed to Hartford Series Fund, Inc. ("HSF") and Hartford HLS Series Fund II, Inc. ("HSF2"), principal occupation, and, for Directors, other directorships held. The Fund’s Statement of Additional Information contains further information on the Directors and is available free of charge by calling 1-888-843-7824 or writing to: Hartford HLS Funds, c/o Hartford Life Insurance Company/Hartford Life and Annuity Insurance Company, P.O. Box 14293, Lexington, KY 40512-4293 for variable annuity and variable life insurance separate accounts of Hartford Life Insurance Company and its affiliates; Hartford Funds, P.O. Box 55022, Boston, MA 02205-5022 for all shareholders except variable annuity and variable life insurance separate accounts of Hartford Life Insurance Company and its affiliates.
Information on the aggregate remuneration paid to the directors of the Company can be found in the Statement of Operations herein. The Fund pays to The Hartford a portion of the Chief Compliance Officer’s compensation, but does not pay salaries or compensation to any of its other officers or Directors who are employed by The Hartford.
Non-Interested Directors
Lynn S. Birdsong (1946) Director since 2003, Co-Chairman of the Investment Committee since 2005
Mr. Birdsong is a private investor. Mr. Birdsong currently serves as a Director of the Sovereign High Yield Investment Company (April 2010 to current). Mr. Birdsong currently serves as an Independent Director of Nomura Partners Funds, Inc. (formerly, The Japan Fund) (April 2003 to current). From 2003 to March 2005, Mr. Birdsong was an Independent Director of the Atlantic Whitehall Funds. From 1979 to 2002, Mr. Birdsong was a Managing Director of Zurich Scudder Investments, an investment management firm. During his employment with Scudder, Mr. Birdsong was an Interested Director of The Japan Fund. From January 1981 through December 2013, Mr. Birdsong was a partner in Birdsong Company, an advertising specialty firm.
Robert M. Gavin, Jr. (1940) Director since 2002 (HSF) and 1986 (HSF2), Chairman of the Board since 2004
Dr. Gavin is an educational consultant. Prior to September 1, 2001, he was President of Cranbrook Education Community and prior to July 1996, he was President of Macalester College, St. Paul, Minnesota.
Duane E. Hill (1945) Director since 2001 (HSF) and 2002 (HSF2), Chairman of the Nominating Committee since 2003
Mr. Hill is a Partner of TSG Ventures L.P., a private equity investment company. Mr. Hill is a former partner of TSG Capital Group, a private equity investment firm that served as sponsor and lead investor in leveraged buyouts of middle market companies.
Sandra S. Jaffee (1941) Director since 2005
Ms. Jaffee is the founder and Chief Executive Officer of a private company, Homeworks Concierge, LLC, which provides residential property management services in Westchester County, New York (January 2012 to present). Ms. Jaffee served as Chairman (2008 to 2009) and Chief Executive Officer of Fortent (formerly Searchspace Group), a leading provider of compliance/regulatory technology to financial institutions from August 2005 to August 2009. From August 2004 to August 2005, Ms. Jaffee served as an Entrepreneur in Residence with Warburg Pincus, a private equity firm. Prior to joining Warburg Pincus, Ms. Jaffee served as Executive Vice President at Citigroup, from September 1995 to July 2004, where she was President and Chief Executive Officer of Citibank’s Global Securities Services (1995 to 2003). Ms. Jaffee currently serves as a member of the Board of Directors of Broadridge Financial Solutions as well as a Trustee of Muhlenberg College.
| Hartford High Yield HLS Fund |
| Directors and Officers (Unaudited) – (continued) |
William P. Johnston (1944) Director since 2005, Chairman of the Compliance Committee since 2005
In June 2006, Mr. Johnston was appointed as Senior Advisor to The Carlyle Group, a global private equity and other alternative asset investment firm and currently serves as an Operating Executive. In July 2006, Mr. Johnston was elected to the Board of Directors of MultiPlan, Inc. and served as a Director (July 2006 to August 2010). In August 2007, Mr. Johnston was elected to the Board of Directors of LifeCare Holdings, Inc. and served as a Director (August 2007 to June 2013). In February 2008, Mr. Johnston was elected to the Board of Directors of HCR-ManorCare, Inc. In May 2006, Mr. Johnston was elected to the Supervisory Board of Fresenius Medical Care AG & Co. KGaA, after its acquisition of Renal Care Group, Inc. in March 2006. Mr. Johnston joined Renal Care Group in November 2002 as a member of the Board of Directors and served as Chairman of the Board from March 2003 through March 2006. From 2002 through 2013, Mr. Johnston served as a Board member of the Georgia O’Keefe Museum. From September 1987 to December 2002, Mr. Johnston was with Equitable Securities Corporation (and its successors, SunTrust Equitable Securities and SunTrust Robinson Humphrey) serving in various investment banking and managerial positions, including Managing Director and Head of Investment Banking, Chief Executive Officer and Vice Chairman.
Phillip O. Peterson (1944) Director since 2002 (HSF) and 2000 (HSF2), Chairman of the Audit Committee since 2002
Mr. Peterson is a mutual fund industry consultant. He was a partner of KPMG LLP (an accounting firm) until July 1999. Mr. Peterson joined William Blair Funds in February 2007 as a member of the Board of Trustees. From February 2012 to February 2014, Mr. Peterson served as a Trustee of Symetra Variable Mutual Funds. From January 2004 to April 2005, Mr. Peterson served as Independent President of the Strong Mutual Funds.
Lemma W. Senbet (1946) Director since 2005
Dr. Senbet is the William E. Mayer Chair Professor of Finance and Founding Director, Center for Financial Policy, at the University of Maryland, Robert H. Smith School of Business. He was chair of the Finance Department of the University of Maryland, Robert H. Smith School of Business from 1998 to 2006. Since June 2013, he has been on leave from the University to serve as Executive Director of African Economic Research Consortium which focuses on economic policy research and training. Previously, he was a chaired professor of finance at the University of Wisconsin-Madison. Also, he was a Director of the Fortis Funds from March 2000 to July 2002. Dr. Senbet served as Director of the American Finance Association and President of the Western Finance Association. In 2006, Dr. Senbet was inducted Fellow of Financial Management Association International for his career-long distinguished scholarship and professional service.
Interested Directors and Officers
James E. Davey (1964) Director since 2012, President and Chief Executive Officer since 2010
Mr. Davey serves as Executive Vice President of Hartford Life Insurance Company (“HLIC”) and The Hartford Financial Services Group, Inc. Additionally, Mr. Davey serves as Chairman of the Board, Manager and Senior Managing Director of Hartford Funds Distributors, LLC (“HFD”). He also currently serves as Director, Chairman of the Board, President and Senior Managing Director of Hartford Administrative Services Company (“HASCO”). Mr. Davey also serves as Manager, Chairman of the Board and Senior Managing Director for Hartford Funds Management Company, LLC (“HFMC”) and Director, Chairman of the Board and Senior Managing Director for Hartford Funds Management Group, Inc. ("HFMG"). Mr. Davey has served in various positions within The Hartford and its subsidiaries in connection with the operation of the Hartford Funds. Mr. Davey joined The Hartford in 2002.
Lowndes A. Smith (1939) Director since 1996 (HSF) and 2002 (HSF2), Co-Chairman of the Investment Committee since 2005
Mr. Smith served as Vice Chairman of The Hartford from February 1997 to January 2002, as President and Chief Executive Officer of Hartford Life, Inc. from February 1997 to January 2002, and as President and Chief Operating Officer of The Hartford Life Insurance Companies from January 1989 to January 2002. Mr. Smith serves as a Director of White Mountains Insurance Group Ltd. (October 2003 to current); One Beacon Insurance (October 2006 to current); Symetra Financial (August 2007 to current) and is a Managing Director of Whittington Gray Associates (January 2007 to current).
Other Officers
Mark A. Annoni (1964) Vice President, Controller and Treasurer since 2012
Mr. Annoni currently serves as the Assistant Vice President of HLIC (February 2004 to present) and Senior Vice President of HFMG (December 2013 to present). Mr. Annoni has served in various positions within The Hartford and its subsidiaries in connection with the operation of the Hartford Funds. Mr. Annoni joined The Hartford in 2001.
| Hartford High Yield HLS Fund |
| Directors and Officers (Unaudited) – (continued) |
Michael R. Dressen (1963) AML Compliance Officer since 2011
Mr. Dressen currently serves as Assistant Vice President of HLIC. He also serves as Chief Compliance Officer and AML Compliance Officer of HASCO and as AML Officer of HFD. Mr. Dressen has served in various positions within The Hartford and its subsidiaries in connection with the operation of the Hartford Funds.
Edward P. Macdonald (1967) Vice President, Secretary and Chief Legal Officer since 2005
Mr. Macdonald currently serves as Assistant Secretary, Executive Vice President and Deputy General Counsel of HFD, HASCO, HFMC and HFMG. He also serves as Vice President of HLIC. Mr. Macdonald has served in various positions within The Hartford and its subsidiaries in connection with the operation of the Hartford Funds. Mr. Macdonald joined The Hartford in 2005.
Joseph G. Melcher (1973) Vice President and Chief Compliance Officer since 2013
Mr. Melcher currently serves as Executive Vice President of HFD, HFMG and HASCO. Mr. Melcher also currently serves as Executive Vice President and Chief Compliance Officer of HFMC. Mr. Melcher has served in various positions within The Hartford and its subsidiaries in connection with the operation of the Hartford Funds since joining The Hartford in 2012. Prior to joining The Hartford, Mr. Melcher worked at Touchstone Investments, a member of the Western & Southern Financial Group, where he held the position of Vice President and Chief Compliance Officer from 2010 through 2012 and Assistant Vice President, Compliance from 2005 to 2010.
Vernon J. Meyer (1964) Vice President since 2006
Mr. Meyer currently serves as Senior Vice President of HLIC. He also currently serves as Managing Director and Chief Investment Officer of HFMC and Managing Director of HFMG. Mr. Meyer has served in various positions within The Hartford and its subsidiaries in connection with the operation of the Hartford Funds. Mr. Meyer joined The Hartford in 2004.
Laura S. Quade (1969) Vice President since 2012
Ms. Quade currently serves as Vice President of HASCO, HFD and HFMG. She is the Head of Operations of HASCO and also serves as Director, Enterprise Operations of HLIC. Ms. Quade has served in various positions within The Hartford and its subsidiaries in connection with the operation of the Hartford Funds.
Martin A. Swanson (1962) Vice President since 2010
Mr. Swanson currently serves as Vice President of HLIC. Mr. Swanson also serves as Managing Director, Chief Marketing Officer and Principal of HFD and Managing Director of HFMG. Mr. Swanson has served in various positions within The Hartford and its subsidiaries in connection with the operation of the Hartford Funds.
HOW TO OBTAIN A COPY OF THE FUND’S PROXY VOTING POLICIES AND VOTING RECORDS (UNAUDITED)
A description of the policies and procedures that the Fund uses to determine how to vote proxies relating to portfolio securities and information about how the Fund voted proxies relating to portfolio securities during the most recent twelve-month period ended June 30 are available (1) without charge, upon request, by calling 888-843-7824 and (2) on the SEC’s website at http://www.sec.gov.
QUARTERLY PORTFOLIO HOLDINGS INFORMATION (UNAUDITED)
The Fund files a complete schedule of portfolio holdings with the SEC for the first and third quarters of each fiscal year on Form N-Q. The Fund’s Forms N-Q are available (1) without charge, upon request, by calling 888-843-7824 and (2) on the SEC’s website at http://www.sec.gov. The Form N-Q may be reviewed and copied at the SEC’s Public Reference Room in Washington, DC. Information on the operation of the Public Reference Room may be obtained by calling 1-800-SEC-0330.
| Hartford High Yield HLS Fund |
| Expense Example (Unaudited) |
Your Fund's Expenses
As a shareholder of the Fund, you incur two types of costs: (1) transaction costs and (2) ongoing costs, including investment management fees, distribution and/or service (12b-1) fees, if any, and other fund expenses. This example is intended to help you understand your ongoing costs (in dollars) of investing in the Fund and to compare these costs with the ongoing costs of investing in other mutual funds. The example is based on an investment of $1,000 invested at the beginning of the period and held for the entire period of December 31, 2013 through June 30, 2014.
Actual Expenses
The first set of columns of the table below provides information about actual account values and actual expenses. You may use the information in this column, together with the amount you invested, to estimate the expenses that you paid over the period. Simply divide your account value by $1,000 (for example, an $8,600 account value divided by $1,000 = 8.6), then multiply the result by the number in the line under the heading entitled “Expenses Paid During Period” to estimate the expenses you paid on your account during this period.
Hypothetical Example for Comparison Purposes
The second set of columns of the table below provides information about hypothetical account values and hypothetical expenses based on the Fund's actual expense ratio and an assumed rate of return of 5% per year before expenses, which is not the Fund's actual return. The hypothetical account values and expenses may not be used to estimate the actual ending account balance or expenses you paid for the period. You may use this information to compare the ongoing costs of investing in the Fund and other funds. To do so, compare this 5% hypothetical example with the 5% hypothetical examples that appear in the shareholder reports of the other funds.
Please note that the expenses shown in the table are meant to highlight your ongoing costs only and do not reflect any transactional costs, such as sales charges (loads) and CDSC. Therefore, the second set of columns of the table is useful in comparing ongoing costs only, and will not help you determine the relative total costs of owning different funds. In addition, if these transactional costs were included, your costs would be higher. Expenses are equal to the Fund's annualized expense ratios multiplied by average account value over the period, multiplied by 181/365 (to reflect the one-half year period).
| | | Actual return | | | Hypothetical (5% return before expenses) | | | | | | | | |
| | | Beginning
Account Value
December 31,
2013 | | | Ending Account
Value
June 30, 2014 | | | Expenses paid
during the period
December 31, 2013
through
June 30, 2014 | | | Beginning
Account Value
December 31,
2013 | | | Ending Account
Value
June 30, 2014 | | | Expenses paid
during the period
December 31,
2013
through
June 30, 2014 | | | Annualized
expense
ratio | | | Days
in the
current
1/2
year | | | Days
in the
full
year | |
| Class IA | | $ | 1,000.00 | | | $ | 1,055.10 | | | $ | 3.87 | | | $ | 1,000.00 | | | $ | 1,021.03 | | | $ | 3.81 | | | | 0.76 | % | | 181 | | | 365 | |
| Class IB | | $ | 1,000.00 | | | $ | 1,053.60 | | | $ | 5.14 | | | $ | 1,000.00 | | | $ | 1,019.79 | | | $ | 5.06 | | | | 1.01 | | | 181 | | | 365 | |
| Hartford High Yield HLS Fund |
| Main Risks (Unaudited) |
The main risks of investing in the Fund are described below.
Market, Selection and Strategy Risk: The Fund’s share price may fluctuate due to market risk and/or security selections that may underperform the market or relevant benchmarks. If the sub-adviser's investment strategy does not perform as expected, the Fund could underperform its peers or lose money. There is no guarantee the Fund will achieve its stated objective.
Junk Bond Risk: Investments in junk bonds involve greater risk of price volatility, illiquidity, and default than higher-rated debt securities.
Fixed Income Risk: The Fund is subject to interest rate risk (the risk that the value of an investment decreases when interest rates rise) and credit risk (the risk that the issuing company of a security is unable to pay interest and principal when due) and call risk (the risk that an investment may be redeemed early).
Foreign Investment Risk: Investments in foreign securities may be riskier than investments in U.S. securities. Potential risks include the risks of illiquidity, increased price volatility, less government regulation, less extensive and less frequent accounting and other reporting requirements, unfavorable changes in currency exchange rates, and economic and political disruptions.
Derivatives Risk: Investments in derivatives can be volatile. Potential risks include currency risk, leverage risk (the risk that small market movements may result in large changes in the value of an investment), liquidity risk, index risk, pricing risk, and counterparty risk (the risk that the counterparty may be unwilling or unable to honor its obligations).
Active Trading Risk: Actively trading investments may result in higher costs (thus affecting performance).
THIS PRIVACY POLICY IS NOT PART OF THIS REPORT
Privacy Policy and Practices of The Hartford Financial Services Group, Inc. and its Affiliates
(herein called “we, our and us”)
This Privacy Policy applies to our United States Operations
We value your trust. We are committed to the responsible: a) management; b) use; and c) protection; of Personal Information. This notice describes how we collect, disclose, and protect Personal Information. We collect Personal Information to: a) service your Transactions with us; and b) support our business functions. We may obtain Personal Information from: a) You; b) your Transactions with us; and c) third parties such as a consumer-reporting agency. Based on the type of product or service You apply for or get from us, Personal Information such as: a) your name; b) your address; c) your income; d) your payment; or e) your credit history; may be gathered from sources such as applications, Transactions, and consumer reports. To serve You and service our business, we may share certain Personal Information. We will share Personal Information, only as allowed by law, with affiliates such as: a) our insurance companies; b) our employee agents; c) our brokerage firms; and d) our administrators. As allowed by law, we may share Personal Financial Information with our affiliates to: a) market our products; or b) market our services; to You without providing You with an option to prevent these disclosures. | | | We may also share Personal Information, only as allowed by law, with unaffiliated third parties including: a) independent agents; b) brokerage firms; c) insurance companies; d) administrators; and e) service providers; who help us serve You and service our business. When allowed by law, we may share certain Personal Financial Information with other unaffiliated third parties who assist us by performing services or functions such as: a) taking surveys; b) marketing our products or services; or c) offering financial products or services under a joint agreement between us and one or more financial institutions. We, and third parties we partner with, may track some of the pages You visit through the use of: a) cookies; b) pixel tagging; or c) other technologies; and currently do not process or comply with any web browser’s “do not track” signal or similar mechanism that indicates a request to disable online tracking of individual users who visit our websites or use our services. We will not sell or share your Personal Financial Information with anyone for purposes unrelated to our business functions without offering You the opportunity to: a) “opt-out;” or b) “opt-in;” as required by law. We only disclose Personal Health Information with: a) your proper written authorization; or b) as otherwise allowed or required by law. Our employees have access to Personal Information in the course of doing their jobs, such as: a) underwriting policies; b) paying claims; c) developing new products; or d) advising customers of our products and services. |
We use manual and electronic security procedures to maintain: a) the confidentiality; and b) the integrity of; Personal Information that we have. We use these procedures to guard against unauthorized access. Some techniques we use to protect Personal Information include: a) secured files; b) user authentication; c) encryption; d) firewall technology; and e) the use of detection software. We are responsible for and must: a) identify information to be protected; b) provide an adequate level of protection for that data; c) grant access to protected data only to those people who must use it in the performance of their job-related duties. Employees who violate our Privacy Policy will be subject to discipline, which may include ending their employment with us. At the start of our business relationship, we will give You a copy of our current Privacy Policy. We will also give You a copy of our current Privacy Policy once a year if You maintain a continuing business relationship with us. We will continue to follow our Privacy Policy regarding Personal Information even when a business relationship no longer exists between us. | | | As used in this Privacy Notice: Application means your request for our product or service. Personal Financial Information means financial information such as: a) credit history; b) income; c) financial benefits; or d) policy or claim information. Personal Health Information means health information such as: a) your medical records; or b) information about your illness, disability or injury. Personal Information means information that identifies You personally and is not otherwise available to the public. It includes: a) Personal Financial Information; and b) Personal Health Information. Transaction means your business dealings with us, such as: a) your Application; b) your request for us to pay a claim; and c) your request for us to take an action on your account. You means an individual who has given us Personal Information in conjunction with: a) asking about; b) applying for; or c) obtaining; a financial product or service from us if the product or service is used mainly for personal, family, or household purposes. |
This Privacy Policy is being provided on behalf of the following affiliates of The Hartford Financial Services Group, Inc.:
1stAGChoice, Inc.; Access CoverageCorp, Inc.; Access CoverageCorp Technologies, Inc.; American Maturity Life Insurance Company; Archway 60 R, LLC; Business Management Group, Inc.; Champlain Life Reinsurance Company; DMS R, LLC; Eloy R, LLC; Ersatz Corporation; First State Insurance Company; Hartford Accident and Indemnity Company; Hartford Administrative Services Company; Hartford Casualty General Agency, Inc.; Hartford Casualty Insurance Company; Hartford-Comprehensive Employee Benefit Service Company; Hartford Equity Sales Company, Inc.; Hartford Fire General Agency, Inc.; Hartford Fire Insurance Company; Hartford Funds Management Company, LLC; Hartford Funds Management Group, Inc.; Hartford HLS Series Fund II, Inc.; Hartford Insurance Company of Illinois; Hartford Insurance Company of the Midwest; Hartford Insurance Company of the Southeast; Hartford Integrated Technologies, Inc.; Hartford International Life Reassurance Corporation; Hartford Funds Distributors, LLC; Hartford Investment Management Company; Hartford Life and Accident Insurance Company; Hartford Life and Annuity Insurance Company; Hartford Life Insurance Company; Hartford Life Private Placement, LLC; Hartford Lloyd’s Corporation; Hartford Lloyd’s Insurance Company; Hartford Mezzanine Investors I, LLC; Hartford Residual Market, L.C.C.; Hartford Retirement Services, LLC; Hartford Securities Distribution Company, Inc.; Hartford Series Fund, Inc.; Hartford Specialty Insurance Services of Texas, LLC; Hartford Strategic Investments, LLC; Hartford Underwriters Insurance Company; Hartford Technology Services Company, L.L.C.; Hartford of Texas General Agency, Inc.; Hartford Underwriters General Agency, Inc.; HARTRE Company, L.C.C.; HL Investment Advisors, LLC; HLA LLC; Horizon Management Group, LLC; HRA Brokerage Services, Inc.; Lanidex Class B, LLC; M-CAP Insurance Agency, LLC; New England Insurance Company; New England Reinsurance Corporation; Nutmeg Insurance Agency, Inc.; Nutmeg Insurance Company; Pacific Insurance Company, Limited; Planco, LLC: Property and Casualty Insurance Company of Hartford; Revere R, LLC; RVR R, LLC; Sentinel Insurance Company, Ltd.; Sunstone R, LLC; Symphony R, LLC; The Evergreen Group Incorporated; The Hartford Alternative Strategies Fund; The Hartford Mutual Funds, Inc.; The Hartford Mutual Funds II, Inc.; Trumbull Flood Management, L.L.C.; Trumbull Insurance Company; Twin City Fire Insurance Company; White River Life Reinsurance Company.
HPP Revised January 2014
HARTFORD HLS FUNDS
P.O. Box 14293
Lexington, KY 40512-4293
HARTFORDFUNDS
hartfordfunds.com
Hartford Series Fund, Inc. is underwritten and distributed by Hartford Funds Distributors, LLC.
Hartford Series Fund, Inc. inception dates range from 1977 to date. Hartford Series Fund, Inc. is not a subsidiary of The Hartford Financial Services Group, Inc. ("The Hartford") but is underwritten, distributed by and advised by subsidiaries of The Hartford. Investments in Hartford Series Fund, Inc. are not guaranteed by The Hartford or any other entity.
This report is submitted for the general information of the shareholders of the Funds. It is not authorized for distribution unless preceded or accompanied by a current prospectus for the Funds.
Investors should carefully consider the investment objectives, risks, charges, and expenses of Hartford Funds before investing. This and other information can be found in the prospectus, which can be obtained by calling 800-862-6668 (or 800-279-1541 for institutional investors). Investors should read them carefully before they invest.
HLSSAR-HY14 8-14 113544-3 Printed in U.S.A.
HARTFORDFUNDS
| | HARTFORD INDEX HLS FUND 2014 Semi Annual Report |
A MESSAGE FROM THE PRESIDENT
Dear Fellow Shareholders:
Thank you for investing in Hartford HLS Funds.
Market Review
U.S. equities (as represented by the S&P 500 Index) started 2014 on a shaky note after posting a strong 32.39% gain in 2013. However, stocks managed to maintain modest gains throughout the first quarter and returned to a generally steady climb in the second quarter. Through June 30, 2014, the S&P 500 Index advanced 7.14%. It appears that much of the market volatility during the year can be attributed to heightened international tensions. In particular, the Russian annexation of Ukraine’s Crimean Peninsula and increased tensions in Iraq were cause for concern.
On the domestic front, subdued economic and employment reports slowed stocks’ progress early in the new year, although much of the weakness seemed to dissipate as the year’s unusually harsh winter subsided. And despite initial reactions to the idea, when the U.S. Federal Reserve began tapering its quantitative-easing program in January by reducing its bond purchases by $10 billion a month, the markets took the policy change in stride.
Despite a rough start to the year for financial markets, the global economy seems to be settling into a slow-but-steady recovery. While first-quarter U.S. gross domestic product (GDP) growth was disappointing at -2.9%, U.S. consumer spending, which is a significant contributor toward economic growth, rose by 3% during the quarter. It appears that Europe is also maintaining its own recovery: The International Monetary Fund projects that Europe’s full-year GDP growth may breach positive territory for the first time since 2011.
The impact of international affairs on stocks so far this year is an important reminder to stay informed about both domestic and international economic developments, and any effects they may have on your individual investment goals. If you have not already had a mid-year review of your portfolio, it may be a good time to meet with your financial advisor to review your progress and make certain your investments are prepared for all market environments:
| • | Is your portfolio properly diversified with an appropriate mix of stocks and bonds? |
| • | Is your portfolio positioned to take advantage of the global economic recovery, with investments in both domestic and international holdings? |
| • | Are your investments still in line with your risk tolerance and investment time horizon? |
Your financial professional can help you choose options within our fund family to help you reach your investment goals with confidence.
Thank you again for investing with Hartford HLS Funds.
James Davey
President
Hartford HLS Funds
1 The S&P 500 Index is a market capitalization-weighted price index composed of 500 widely held common stocks.
2The Dow Jones Industrial Average is an unmanaged, price-weighted index of 30 of the largest, most widely held stocks traded on the New York Stock Exchange.
Hartford Index HLS Fund
Table of Contents
This report is prepared for the general information of contract owners and qualified retirement plan participants. It is not an offer of contracts or of qualified retirement plans. It should not be used in connection with any offer, except in conjunction with the appropriate product prospectus which contains all pertinent information including the applicable sales, administrative and other charges.
The views expressed in the Fund’s Manager Discussion under “Why did the Fund perform this way?” and “What is the outlook?” are views of the Fund’s sub-adviser and portfolio management team through the end of the period and are subject to change based on market and other conditions. The Fund’s Manager Discussion is for informational purposes only and does not represent an offer, recommendation or solicitation to buy, hold or sell any security. The specific securities identified and described, if any, do not represent all of the securities purchased or sold and you should not assume that investments in the securities identified and discussed will be profitable.
Hartford Index HLS Fund inception 05/01/1987
(sub-advised by Hartford Investment Management Company)
| Investment objective – The Fund seeks to provide investment results which approximate the price and yield performance of publicly traded common stocks in the aggregate. |
Performance Overview 6/30/04 - 6/30/14
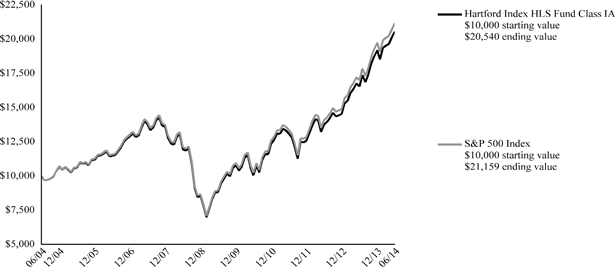
The chart above represents the hypothetical growth of a $10,000 investment in Class IA. Growth results in classes other than Class IA will vary from what is seen above due to differences in the expenses charged to those share classes.
Average Annual Total Returns (as of 6/30/14)
| | 6 Month† | 1 Year | 5 Years | 10 Years |
| Index IA | 6.98% | 24.21% | 18.46% | 7.46% |
| Index IB | 6.83% | 23.89% | 18.17% | 7.20% |
| S&P 500 Index | 7.14% | 24.61% | 18.83% | 7.78% |
PERFORMANCE DATA QUOTED REPRESENTS PAST PERFORMANCE AND DOES NOT GUARANTEE FUTURE RESULTS. The investment return and principal value of the investment will fluctuate so that investors’ shares, when redeemed, may be worth more or less than their original cost. Current performance may be lower or higher than the performance data quoted.
Total returns presented above were calculated using the Fund’s net asset value available to shareholders for sale or redemption of Fund shares on June 30, 2014, which may exclude investment transactions as of this date. All share class returns assume the reinvestment of all distributions at net asset value and the deduction of all fund expenses.
S&P 500 Index is a market capitalization-weighted price index composed of 500 widely held common stocks.
The index is unmanaged, and its results include reinvested dividends and/or distributions, but do not reflect the effect of sales charges, commissions, expenses or taxes.
You cannot invest directly in an index.
As shown in the Fund's current prospectus dated May 1, 2014, the total annual operating expense ratios for Class IA and Class IB were 0.33% and 0.58%, respectively. Actual expenses may be higher. Please see the accompanying Financial Highlights for expense ratios for the six-month period ended June 30, 2014.
The chart and table do not reflect the deductions of taxes, sales charges or other fees which may be applied at the variable life insurance, variable annuity or qualified retirement plan product level. Any such additional sales charges or other fees or expenses would lower the contract’s or plan’s performance.
All investments are subject to risk including the possible loss of principal. For a discussion of the Fund’s risks, please see the Main Risks section of this report. For more detailed information on the risks associated with an investment in the Fund, please see the prospectus.
| Hartford Index HLS Fund |
| Manager Discussion |
| June 30, 2014 (Unaudited) |
| Portfolio Manager | | |
| Deane Gyllenhaal * | Edward Caputo, CFA * | Paul Bukowski, CFA * |
| Vice President | Senior Vice President | Executive Vice President and Head of Quantitative Equities and Asset Allocation |
* Effective July 31, 2014 Edward Caputo and Paul Bukoski replaced Deane Gyllenhaal as portfolio managers.
How did the Fund perform?
The Class IA shares of the Hartford Index HLS Fund returned 6.98% for the six-month period ended June 30, 2014. The Fund performed very closely to its benchmark, the S&P 500 Index, which returned 7.14% and outperformed the Variable Products-Underlying Funds Lipper S&P 500 Index Funds category, a group of funds with investment strategies similar to those of the Fund, which returned 6.91%.
Why did the Fund perform this way?
By design, the Fund is managed to mimic the performance of the S&P 500 Index and is expected to perform in line with the index. However, we do not purchase the stock of our parent, The Hartford Financial Services Group, Inc. (“HIG”). This exposure to HIG is reallocated across the Life/Health, Property/Casualty and Multi-line Insurance industries. The performance of the Fund tends to marginally differ from the benchmark, primarily due to trading in futures contracts, index events, minimal cash exposure, and lack of exposure to HIG.
All 10 of the sectors (as defined by the Global Industry Classification System) within the index had positive returns for the first half of 2014. Utilities and Energy led the way, gaining 18.4% and 13.1%, respectively, as investors looked for yield and turned defensive. Healthcare also contributed, adding 10.6%. The sector that produced the lowest return so far was Consumer Discretionary, which rose only 0.7%.
On a stock level, the leading constituents in the S&P 500 Index for the first half of 2014 were Newfield Exploration Co., which rallied 79.5%, followed by Nabors Industries, which gained 73.4%. Forest Laboratories rounded out the top three, finishing up 64.9%, as it left the index June 30 due to its acquisition by Actavis PLC. Laggards for the period included the retailer Coach, which fell 38.1%, followed by grocery chain Whole Foods, which dropped 32.9%.
Derivatives are not used in a significant manner in this Fund and did not have a material impact on performance during the period.
What is the outlook?
The Fund will continue to invest in the S&P 500 Index. Performance of the Fund is expected to be similar to that of the index.
The U.S. equities market in general is showing fundamentals remaining supportive and valuations slightly above average based on the belief they can be supported by rising interest rates. Conversely, it is our view that technicals could provide a potential headwind as the market continues to march higher despite an already exhibiting a significant amount of buying interest with little apparent concern for risk as volume and volatility have trended lower. As a result, we expect a stagnant broader market during the second half of 2014.
Possible risks to this outlook include heightened geopolitical tensions, the potential for surprises regarding the pace of the U.S. Federal Reserve’s tapering program, and unexpected but continued weakness in economic indicators beyond the weather-impacted first quarter data.
Diversification by Sector
as of June 30, 2014
| Sector | | Percentage of
Net Assets | |
| Equity Securities | | | | |
| Consumer Discretionary | | | 11.9 | % |
| Consumer Staples | | | 9.4 | |
| Energy | | | 10.7 | |
| Financials | | | 15.7 | |
| Health Care | | | 13.2 | |
| Industrials | | | 10.4 | |
| Information Technology | | | 18.7 | |
| Materials | | | 3.4 | |
| Services | | | 2.5 | |
| Utilities | | | 3.2 | |
| Total | | | 99.1 | % |
| Short-Term Investments | | | 0.9 | |
| Other Assets and Liabilities | | | 0.0 | |
| Total | | | 100.0 | % |
A sector may be comprised of several industries. For Fund compliance purposes, the Fund may not use the same classification system and these sector classifications are used for reporting ease.
| Hartford Index HLS Fund |
| Schedule of Investments |
| June 30, 2014 (Unaudited) |
| (000’s Omitted) |
| Shares or Principal Amount | | Market Value ╪ | |
| Common Stocks - 99.1% | | | | |
| | | | | Automobiles and Components - 1.2% | | | | |
| | 16 | | | BorgWarner, Inc. | | $ | 1,022 | |
| | 19 | | | Delphi Automotive plc | | | 1,303 | |
| | 271 | | | Ford Motor Co. | | | 4,672 | |
| | 90 | | | General Motors Co. | | | 3,272 | |
| | 19 | | | Goodyear (The) Tire & Rubber Co. | | | 525 | |
| | 15 | | | Harley-Davidson, Inc. | | | 1,047 | |
| | 46 | | | Johnson Controls, Inc. | | | 2,275 | |
| | | | | | | | 14,116 | |
| | | | | Banks - 3.0% | | | | |
| | 49 | | | BB&T Corp. | | | 1,943 | |
| | 12 | | | Comerica, Inc. | | | 623 | |
| | 58 | | | Fifth Third Bancorp | | | 1,244 | |
| | 33 | | | Hudson City Bancorp, Inc. | | | 320 | |
| | 57 | | | Huntington Bancshares, Inc. | | | 541 | |
| | 61 | | | KeyCorp | | | 867 | |
| | 9 | | | M&T Bank Corp. | | | 1,115 | |
| | 21 | | | People's United Financial, Inc. | | | 322 | |
| | 37 | | | PNC Financial Services Group, Inc. | | | 3,262 | |
| | 95 | | | Regions Financial Corp. | | | 1,004 | |
| | 36 | | | SunTrust Banks, Inc. | | | 1,462 | |
| | 124 | | | US Bancorp | | | 5,390 | |
| | 329 | | | Wells Fargo & Co. | | | 17,268 | |
| | 13 | | | Zions Bancorporation | | | 372 | |
| | | | | | | | 35,733 | |
| | | | | Capital Goods - 7.7% | | | | |
| | 43 | | | 3M Co. | | | 6,102 | |
| | 17 | | | AMETEK, Inc. | | | 878 | |
| | 46 | | | Boeing Co. | | | 5,847 | |
| | 43 | | | Caterpillar, Inc. | | | 4,650 | |
| | 12 | | | Cummins, Inc. | | | 1,813 | |
| | 41 | | | Danaher Corp. | | | 3,247 | |
| | 25 | | | Deere & Co. | | | 2,254 | |
| | 11 | | | Dover Corp. | | | 1,040 | |
| | 33 | | | Eaton Corp. plc | | | 2,521 | |
| | 48 | | | Emerson Electric Co. | | | 3,188 | |
| | 19 | | | Fastenal Co. | | | 925 | |
| | 9 | | | Flowserve Corp. | | | 700 | |
| | 11 | | | Fluor Corp. | | | 842 | |
| | 22 | | | General Dynamics Corp. | | | 2,605 | |
| | 687 | | | General Electric Co. | | | 18,062 | |
| �� | 54 | | | Honeywell International, Inc. | | | 4,990 | |
| | 26 | | | Illinois Tool Works, Inc. | | | 2,276 | |
| | 17 | | | Ingersoll-Rand plc | | | 1,075 | |
| | 9 | | | Jacobs Engineering Group, Inc. ● | | | 483 | |
| | 7 | | | Joy Global, Inc. | | | 422 | |
| | 6 | | | L-3 Communications Holdings, Inc. | | | 709 | |
| | 18 | | | Lockheed Martin Corp. | | | 2,932 | |
| | 24 | | | Masco Corp. | | | 543 | |
| | 15 | | | Northrop Grumman Corp. | | | 1,759 | |
| | 24 | | | PACCAR, Inc. | | | 1,528 | |
| | 8 | | | Pall Corp. | | | 646 | |
| | 10 | | | Parker-Hannifin Corp. | | | 1,287 | |
| | 13 | | | Pentair plc | | | 964 | |
| | 10 | | | Precision Castparts Corp. | | | 2,498 | |
| | 15 | | | Quanta Services, Inc. ● | | | 515 | |
| | 21 | | | Raytheon Co. | | | 1,980 | |
| | 10 | | | Rockwell Automation, Inc. | | | 1,191 | |
| | 9 | | | Rockwell Collins, Inc. | | | 729 | |
| | 7 | | | Roper Industries, Inc. | | | 998 | |
| | 4 | | | Snap-On, Inc. | | | 473 | |
| | 11 | | | Stanley Black & Decker, Inc. | | | 942 | |
| | 19 | | | Textron, Inc. | | | 732 | |
| | 58 | | | United Technologies Corp. | | | 6,669 | |
| | 4 | | | W.W. Grainger, Inc. | | | 1,059 | |
| | 13 | | | Xylem, Inc. | | | 491 | |
| | | | | | | | 92,565 | |
| | | | | Commercial and Professional Services - 0.7% | | | | |
| | 12 | | | ADT (The) Corp. | | | 416 | |
| | 6 | | | Avery Dennison Corp. | | | 333 | |
| | 7 | | | Cintas Corp. | | | 440 | |
| | 3 | | | Dun & Bradstreet Corp. | | | 276 | |
| | 8 | | | Equifax, Inc. ● | | | 604 | |
| | 12 | | | Iron Mountain, Inc. | | | 414 | |
| | 21 | | | Nielsen N.V. | | | 1,007 | |
| | 14 | | | Pitney Bowes, Inc. | | | 385 | |
| | 18 | | | Republic Services, Inc. | | | 697 | |
| | 9 | | | Robert Half International, Inc. | | | 448 | |
| | 6 | | | Stericycle, Inc. ● | | | 686 | |
| | 32 | | | Tyco International Ltd. | | | 1,442 | |
| | 30 | | | Waste Management, Inc. | | | 1,326 | |
| | | | | | | | 8,474 | |
| | | | | Consumer Durables and Apparel - 1.3% | | | | |
| | 19 | | | Coach, Inc. | | | 641 | |
| | 20 | | | D.R. Horton, Inc. | | | 481 | |
| | 3 | | | Fossil Group, Inc. ● | | | 345 | |
| | 8 | | | Garmin Ltd. | | | 515 | |
| | 5 | | | Harman International Industries, Inc. | | | 506 | |
| | 8 | | | Hasbro, Inc. | | | 421 | |
| | 9 | | | Leggett & Platt, Inc. | | | 324 | |
| | 12 | | | Lennar Corp. | | | 507 | |
| | 23 | | | Mattel, Inc. | | | 906 | |
| | 12 | | | Michael Kors Holdings Ltd. ● | | | 1,090 | |
| | 4 | | | Mohawk Industries, Inc. ● | | | 581 | |
| | 19 | | | Newell Rubbermaid, Inc. | | | 588 | |
| | 51 | | | NIKE, Inc. Class B | | | 3,920 | |
| | 23 | | | Pulte Group, Inc. | | | 472 | |
| | 6 | | | PVH Corp. | | | 653 | |
| | 4 | | | Ralph Lauren Corp. | | | 641 | |
| | 11 | | | Under Armour, Inc. Class A ● | | | 660 | |
| | 24 | | | V.F. Corp. | | | 1,485 | |
| | 5 | | | Whirlpool Corp. | | | 740 | |
| | | | | | | | 15,476 | |
| | | | | Consumer Services - 1.7% | | | | |
| | 30 | | | Carnival Corp. | | | 1,133 | |
| | 2 | | | Chipotle Mexican Grill, Inc. ● | | | 1,251 | |
| | 9 | | | Darden Restaurants, Inc. | | | 416 | |
| | 19 | | | H & R Block, Inc. | | | 629 | |
| | 15 | | | Marriott International, Inc. Class A | | | 967 | |
| | 68 | | | McDonald's Corp. | | | 6,828 | |
| | 52 | | | Starbucks Corp. | | | 3,992 | |
| | 13 | | | Starwood Hotels & Resorts, Inc. | | | 1,064 | |
| | 9 | | | Wyndham Worldwide Corp. | | | 658 | |
| | 6 | | | Wynn Resorts Ltd. | | | 1,147 | |
| | 30 | | | Yum! Brands, Inc. | | | 2,458 | |
| | | | | | | | 20,543 | |
| | | | | Diversified Financials - 6.5% | | | | |
| | 4 | | | Affiliated Managers Group, Inc. ● | | | 781 | |
| | 62 | | | American Express Co. | | | 5,922 | |
| | 13 | | | Ameriprise Financial, Inc. | | | 1,559 | |
| | 721 | | | Bank of America Corp. | | | 11,077 | |
The accompanying notes are an integral part of these financial statements.
| Hartford Index HLS Fund |
| Schedule of Investments – (continued) |
| June 30, 2014 (Unaudited) |
| (000’s Omitted) |
| Shares or Principal Amount | | Market Value ╪ | |
| Common Stocks - 99.1% - (continued) | | | | |
| | | | | Diversified Financials - 6.5% - (continued) | | | | |
| | 78 | | | Bank of New York Mellon Corp. | | $ | 2,931 | |
| | 9 | | | BlackRock, Inc. | | | 2,738 | |
| | 39 | | | Capital One Financial Corp. | | | 3,237 | |
| | 80 | | | Charles Schwab Corp. | | | 2,162 | |
| | 208 | | | Citigroup, Inc. | | | 9,806 | |
| | 22 | | | CME Group, Inc. | | | 1,535 | |
| | 32 | | | Discover Financial Services | | | 1,981 | |
| | 20 | | | E*Trade Financial Corp. ● | | | 421 | |
| | 28 | | | Franklin Resources, Inc. | | | 1,592 | |
| | 29 | | | Goldman Sachs Group, Inc. | | | 4,773 | |
| | 8 | | | Intercontinental Exchange, Inc. | | | 1,486 | |
| | 30 | | | Invesco Ltd. | | | 1,118 | |
| | 259 | | | JP Morgan Chase & Co. | | | 14,944 | |
| | 7 | | | Legg Mason, Inc. | | | 361 | |
| | 22 | | | Leucadia National Corp. | | | 568 | |
| | 13 | | | Moody's Corp. | | | 1,128 | |
| | 96 | | | Morgan Stanley | | | 3,100 | |
| | 8 | | | Nasdaq OMX Group, Inc. | | | 310 | |
| | 29 | | | Navient Corp. | | | 514 | |
| | 15 | | | Northern Trust Corp. | | | 980 | |
| | 30 | | | State Street Corp. | | | 1,989 | |
| | 18 | | | T. Rowe Price Group, Inc. | | | 1,516 | |
| | | | | | | | 78,529 | |
| | | | | Energy - 10.7% | | | | |
| | 35 | | | Anadarko Petroleum Corp. | | | 3,784 | |
| | 26 | | | Apache Corp. | | | 2,657 | |
| | 30 | | | Baker Hughes, Inc. | | | 2,228 | |
| | 29 | | | Cabot Oil & Gas Corp. | | | 977 | |
| | 14 | | | Cameron International Corp. ● | | | 951 | |
| | 35 | | | Chesapeake Energy Corp. | | | 1,080 | |
| | 131 | | | Chevron Corp. | | | 17,038 | |
| | 6 | | | Cimarex Energy Co. | | | 861 | |
| | 84 | | | ConocoPhillips Holding Co. | | | 7,212 | |
| | 16 | | | Consol Energy, Inc. | | | 724 | |
| | 24 | | | Denbury Resources, Inc. | | | 445 | |
| | 26 | | | Devon Energy Corp. | | | 2,089 | |
| | 5 | | | Diamond Offshore Drilling, Inc. | | | 235 | |
| | 16 | | | Ensco plc | | | 892 | |
| | 37 | | | EOG Resources, Inc. | | | 4,377 | |
| | 10 | | | EQT Corp. | | | 1,116 | |
| | 294 | | | Exxon Mobil Corp. | | | 29,633 | |
| | 16 | | | FMC Technologies, Inc. ● | | | 983 | |
| | 58 | | | Halliburton Co. | | | 4,108 | |
| | 7 | | | Helmerich & Payne, Inc. | | | 858 | |
| | 18 | | | Hess Corp. | | | 1,790 | |
| | 46 | | | Kinder Morgan, Inc. | | | 1,660 | |
| | 46 | | | Marathon Oil Corp. | | | 1,851 | |
| | 20 | | | Marathon Petroleum Corp. | | | 1,544 | |
| | 12 | | | Murphy Oil Corp. | | | 769 | |
| | 18 | | | Nabors Industries Ltd. | | | 527 | |
| | 29 | | | National Oilwell Varco, Inc. | | | 2,424 | |
| | 9 | | | Newfield Exploration Co. ● | | | 414 | |
| | 17 | | | Noble Corp. plc | | | 586 | |
| | 25 | | | Noble Energy, Inc. | | | 1,907 | |
| | 54 | | | Occidental Petroleum Corp. | | | 5,524 | |
| | 19 | | | Peabody Energy Corp. | | | 303 | |
| | 39 | | | Phillips 66 | | | 3,122 | |
| | 10 | | | Pioneer Natural Resources Co. | | | 2,249 | |
| | 12 | | | QEP Resources, Inc. | | | 425 | |
| | 12 | | | Range Resources Corp. | | | 1,005 | |
| | 9 | | | Rowan Cos. plc Class A | | | 274 | |
| | 89 | | | Schlumberger Ltd. | | | 10,523 | |
| | 24 | | | Southwestern Energy Co. ● | | | 1,099 | |
| | 46 | | | Spectra Energy Corp. | | | 1,953 | |
| | 9 | | | Tesoro Corp. | | | 517 | |
| | 23 | | | Transocean, Inc. | | | 1,051 | |
| | 37 | | | Valero Energy Corp. | | | 1,834 | |
| | 51 | | | Williams Cos., Inc. | | | 2,949 | |
| | | | | | | | 128,548 | |
| | | | | Food and Staples Retailing - 2.2% | | | | |
| | 30 | | | Costco Wholesale Corp. | | | 3,464 | |
| | 80 | | | CVS Caremark Corp. | | | 6,037 | |
| | 35 | | | Kroger (The) Co. | | | 1,728 | |
| | 16 | | | Safeway, Inc. | | | 543 | |
| | 40 | | | Sysco Corp. | | | 1,500 | |
| | 60 | | | Walgreen Co. | | | 4,462 | |
| | 110 | | | Wal-Mart Stores, Inc. | | | 8,292 | |
| | 25 | | | Whole Foods Market, Inc. | | | 973 | |
| | | | | | | | 26,999 | |
| | | | | Food, Beverage and Tobacco - 5.2% | | | | |
| | 136 | | | Altria Group, Inc. | | | 5,710 | |
| | 45 | | | Archer-Daniels-Midland Co. | | | 1,977 | |
| | 11 | | | Brown-Forman Corp. | | | 1,048 | |
| | 12 | | | Campbell Soup Co. | | | 563 | |
| | 259 | | | Coca-Cola Co. | | | 10,973 | |
| | 16 | | | Coca-Cola Enterprises, Inc. | | | 767 | |
| | 29 | | | ConAgra Foods, Inc. | | | 856 | |
| | 12 | | | Constellation Brands, Inc. Class A ● | | | 1,018 | |
| | 13 | | | Dr. Pepper Snapple Group | | | 789 | |
| | 42 | | | General Mills, Inc. | | | 2,211 | |
| | 10 | | | Hershey Co. | | | 1,001 | |
| | 9 | | | Hormel Foods Corp. | | | 454 | |
| | 7 | | | J.M. Smucker Co. | | | 752 | |
| | 17 | | | Kellogg Co. | | | 1,147 | |
| | 9 | | | Keurig Green Mountain, Inc. | | | 1,084 | |
| | 41 | | | Kraft Foods Group, Inc. | | | 2,448 | |
| | 25 | | | Lorillard, Inc. | | | 1,515 | |
| | 9 | | | McCormick & Co., Inc. | | | 639 | |
| | 14 | | | Mead Johnson Nutrition Co. | | | 1,286 | |
| | 11 | | | Molson Coors Brewing Co. | | | 807 | |
| | 116 | | | Mondelez International, Inc. | | | 4,360 | |
| | 9 | | | Monster Beverage Corp. ● | | | 661 | |
| | 104 | | | PepsiCo, Inc. | | | 9,283 | |
| | 108 | | | Philip Morris International, Inc. | | | 9,091 | |
| | 21 | | | Reynolds American, Inc. | | | 1,287 | |
| | 19 | | | Tyson Foods, Inc. Class A | | | 709 | |
| | | | | | | | 62,436 | |
| | | | | Health Care Equipment and Services - 4.2% | | | | |
| | 103 | | | Abbott Laboratories | | | 4,208 | |
| | 25 | | | Aetna, Inc. | | | 1,990 | |
| | 15 | | | AmerisourceBergen Corp. | | | 1,123 | |
| | 5 | | | Bard (C.R.), Inc. | | | 745 | |
| | 37 | | | Baxter International, Inc. | | | 2,691 | |
| | 13 | | | Becton, Dickinson & Co. | | | 1,561 | |
| | 91 | | | Boston Scientific Corp. ● | | | 1,157 | |
| | 23 | | | Cardinal Health, Inc. | | | 1,596 | |
| | 14 | | | CareFusion Corp. ● | | | 632 | |
| | 20 | | | Cerner Corp. ● | | | 1,045 | |
| | 18 | | | CIGNA Corp. | | | 1,692 | |
| | 31 | | | Covidien plc | | | 2,784 | |
The accompanying notes are an integral part of these financial statements.
| Hartford Index HLS Fund |
| Schedule of Investments – (continued) |
| June 30, 2014 (Unaudited) |
| (000’s Omitted) |
| Shares or Principal Amount | | Market Value ╪ | |
| Common Stocks - 99.1% - (continued) | | | | |
| | | | | Health Care Equipment and Services - 4.2% - (continued) | | | | |
| | 12 | | | DaVita HealthCare Partners, Inc. ● | | $ | 878 | |
| | 10 | | | Dentsply International, Inc. | | | 459 | |
| | 7 | | | Edwards Lifesciences Corp. ● | | | 619 | |
| | 53 | | | Express Scripts Holding Co. ● | | | 3,676 | |
| | 11 | | | Humana, Inc. | | | 1,353 | |
| | 3 | | | Intuitive Surgical, Inc. ● | | | 1,093 | |
| | 6 | | | Laboratory Corp. of America Holdings ● | | | 594 | |
| | 16 | | | McKesson Corp. | | | 2,937 | |
| | 69 | | | Medtronic, Inc. | | | 4,368 | |
| | 6 | | | Patterson Cos., Inc. | | | 221 | |
| | 10 | | | Quest Diagnostics, Inc. | | | 579 | |
| | 19 | | | St. Jude Medical, Inc. | | | 1,349 | |
| | 20 | | | Stryker Corp. | | | 1,711 | |
| | 7 | | | Tenet Healthcare Corp. ● | | | 315 | |
| | 67 | | | UnitedHealth Group, Inc. | | | 5,487 | |
| | 7 | | | Varian Medical Systems, Inc. ● | | | 595 | |
| | 19 | | | Wellpoint, Inc. | | | 2,061 | |
| | 12 | | | Zimmer Holdings, Inc. | | | 1,199 | |
| | | | | | | | 50,718 | |
| | | | | Household and Personal Products - 2.0% | | | | |
| | 30 | | | Avon Products, Inc. | | | 435 | |
| | 9 | | | Clorox Co. | | | 803 | |
| | 60 | | | Colgate-Palmolive Co. | | | 4,062 | |
| | 17 | | | Estee Lauder Co., Inc. | | | 1,287 | |
| | 26 | | | Kimberly-Clark Corp. | | | 2,874 | |
| | 185 | | | Procter & Gamble Co. | | | 14,577 | |
| | | | | | | | 24,038 | |
| | | | | Insurance - 4.1% | | | | |
| | 24 | | | ACE Ltd. | | | 2,438 | |
| | 33 | | | Aflac, Inc. | | | 2,035 | |
| | 30 | | | Allstate (The) Corp. | | | 1,774 | |
| | 101 | | | American International Group, Inc. | | | 5,494 | |
| | 20 | | | Aon plc | | | 1,828 | |
| | 5 | | | Assurant, Inc. | | | 326 | |
| | 125 | | | Berkshire Hathaway, Inc. Class B ● | | | 15,852 | |
| | 17 | | | Chubb Corp. | | | 1,567 | |
| | 10 | | | Cincinnati Financial Corp. | | | 493 | |
| | 35 | | | Genworth Financial, Inc. ● | | | 602 | |
| | 19 | | | Lincoln National Corp. | | | 976 | |
| | 21 | | | Loews Corp. | | | 934 | |
| | 38 | | | Marsh & McLennan Cos., Inc. | | | 1,951 | |
| | 81 | | | MetLife, Inc. | | | 4,503 | |
| | 20 | | | Principal Financial Group, Inc. | | | 993 | |
| | 38 | | | Progressive Corp. | | | 961 | |
| | 33 | | | Prudential Financial, Inc. | | | 2,954 | |
| | 6 | | | Torchmark Corp. | | | 519 | |
| | 24 | | | Travelers Cos., Inc. | | | 2,272 | |
| | 18 | | | Unum Group | | | 643 | |
| | 19 | | | XL Group plc | | | 617 | |
| | | | | | | | 49,732 | |
| | | | | Materials - 3.4% | | | | |
| | 15 | | | Air Products & Chemicals, Inc. | | | 1,870 | |
| | 5 | | | Airgas, Inc. | | | 498 | |
| | 80 | | | Alcoa, Inc. | | | 1,196 | |
| | 7 | | | Allegheny Technologies, Inc. | | | 337 | |
| | 10 | | | Ball Corp. | | | 600 | |
| | 7 | | | Bemis Co., Inc. | | | 281 | |
| | 4 | | | CF Industries Holdings, Inc. | | | 868 | |
| | 82 | | | Dow Chemical Co. | | | 4,244 | |
| | 63 | | | E.I. DuPont de Nemours & Co. | | | 4,122 | |
| | 10 | | | Eastman Chemical Co. | | | 901 | |
| | 19 | | | Ecolab, Inc. | | | 2,064 | |
| | 9 | | | FMC Corp. | | | 651 | |
| | 71 | | | Freeport-McMoRan Copper & Gold, Inc. | | | 2,600 | |
| | 6 | | | International Flavors & Fragrances, Inc. | | | 581 | |
| | 30 | | | International Paper Co. | | | 1,497 | |
| | 29 | | | LyondellBasell Industries Class A | | | 2,793 | |
| | 12 | | | MeadWestvaco Corp. | | | 510 | |
| | 36 | | | Monsanto Co. | | | 4,483 | |
| | 22 | | | Mosaic Co. | | | 1,096 | |
| | 34 | | | Newmont Mining Corp. | | | 869 | |
| | 22 | | | Nucor Corp. | | | 1,077 | |
| | 11 | | | Owens-Illinois, Inc. ● | | | 390 | |
| | 9 | | | PPG Industries, Inc. | | | 1,993 | |
| | 20 | | | Praxair, Inc. | | | 2,662 | |
| | 13 | | | Sealed Air Corp. | | | 456 | |
| | 6 | | | Sherwin-Williams Co. | | | 1,203 | |
| | 8 | | | Sigma-Aldrich Corp. | | | 828 | |
| | 10 | | | United States Steel Corp. | | | 258 | |
| | 9 | | | Vulcan Materials Co. | | | 572 | |
| | | | | | | | 41,500 | |
| | | | | Media - 3.7% | | | | |
| | 15 | | | Cablevision Systems Corp. | | | 261 | |
| | 36 | | | CBS Corp. Class B | | | 2,252 | |
| | 178 | | | Comcast Corp. Class A | | | 9,568 | |
| | 32 | | | DirecTV ● | | | 2,728 | |
| | 15 | | | Discovery Communications, Inc. ● | | | 1,112 | |
| | 16 | | | Gannett Co., Inc. | | | 485 | |
| | — | | | Graham Holdings Co. | | | 244 | |
| | 29 | | | Interpublic Group of Cos., Inc. | | | 567 | |
| | 19 | | | McGraw Hill Financial, Inc. | | | 1,548 | |
| | 34 | | | News Corp. Class A ● | | | 612 | |
| | 18 | | | Omnicom Group, Inc. | | | 1,264 | |
| | 7 | | | Scripps Networks Interactive Class A | | | 593 | |
| | 19 | | | Time Warner Cable, Inc. | | | 2,812 | |
| | 60 | | | Time Warner, Inc. | | | 4,246 | |
| | 131 | | | Twenty-First Century Fox, Inc. | | | 4,613 | |
| | 27 | | | Viacom, Inc. Class B | | | 2,323 | |
| | 110 | | | Walt Disney Co. | | | 9,467 | |
| | | | | | | | 44,695 | |
| | | | | Pharmaceuticals, Biotechnology and Life Sciences - 9.0% | | | | |
| | 109 | | | AbbVie, Inc. | | | 6,149 | |
| | 12 | | | Actavis plc ● | | | 2,697 | |
| | 23 | | | Agilent Technologies, Inc. | | | 1,312 | |
| | 14 | | | Alexion Pharmaceuticals, Inc. ● | | | 2,125 | |
| | 20 | | | Allergan, Inc. | | | 3,449 | |
| | 52 | | | Amgen, Inc. | | | 6,145 | |
| | 16 | | | Biogen Idec, Inc. ● | | | 5,127 | |
| | 114 | | | Bristol-Myers Squibb Co. | | | 5,508 | |
| | 55 | | | Celgene Corp. ● | | | 4,715 | |
| | 68 | | | Eli Lilly & Co. | | | 4,198 | |
| | 17 | | | Forest Laboratories, Inc. ● | | | 1,647 | |
| | 105 | | | Gilead Sciences, Inc. ● | | | 8,728 | |
| | 11 | | | Hospira, Inc. ● | | | 588 | |
| | 194 | | | Johnson & Johnson | | | 20,291 | |
| | 200 | | | Merck & Co., Inc. | | | 11,589 | |
| | 26 | | | Mylan, Inc. ● | | | 1,322 | |
| | 8 | | | PerkinElmer, Inc. | | | 365 | |
| | 9 | | | Perrigo Co. plc | | | 1,338 | |
| | 437 | | | Pfizer, Inc. | | | 12,977 | |
The accompanying notes are an integral part of these financial statements.
| Hartford Index HLS Fund |
| Schedule of Investments – (continued) |
| June 30, 2014 (Unaudited) |
| (000’s Omitted) |
| Shares or Principal Amount | | Market Value ╪ | |
| Common Stocks - 99.1% - (continued) | | | | |
| | | | | Pharmaceuticals, Biotechnology and Life Sciences - 9.0% - (continued) | | | | |
| | 5 | | | Regeneron Pharmaceuticals, Inc. ● | | $ | 1,539 | |
| | 27 | | | Thermo Fisher Scientific, Inc. | | | 3,221 | |
| | 16 | | | Vertex Pharmaceuticals, Inc. ● | | | 1,534 | |
| | 6 | | | Waters Corp. ● | | | 611 | |
| | 34 | | | Zoetis, Inc. | | | 1,108 | |
| | | | | | | | 108,283 | |
| | | | | Real Estate - 2.1% | | | | |
| | 27 | | | American Tower Corp. REIT | | | 2,445 | |
| | 10 | | | Apartment Investment & Management Co. Class A REIT | | | 324 | |
| | 8 | | | AvalonBay Communities, Inc. REIT | | | 1,191 | |
| | 10 | | | Boston Properties, Inc. REIT | | | 1,241 | |
| | 19 | | | CBRE Group, Inc. ● | | | 612 | |
| | 23 | | | Equity Residential Properties Trust REIT | | | 1,448 | |
| | 4 | | | Essex Property Trust, Inc. REIT | | | 795 | |
| | 36 | | | General Growth Properties, Inc. REIT | | | 841 | |
| | 31 | | | HCP, Inc. REIT | | | 1,299 | |
| | 21 | | | Health Care REIT, Inc. | | | 1,315 | |
| | 52 | | | Host Hotels & Resorts, Inc. REIT | | | 1,142 | |
| | 28 | | | Kimco Realty Corp. REIT | | | 646 | |
| | 10 | | | Macerich Co. REIT | | | 644 | |
| | 12 | | | Plum Creek Timber Co., Inc. REIT | | | 549 | |
| | 34 | | | ProLogis L.P. REIT | | | 1,407 | |
| | 10 | | | Public Storage REIT | | | 1,700 | |
| | 21 | | | Simon Property Group, Inc. REIT | | | 3,540 | |
| | 20 | | | Ventas, Inc. REIT | | | 1,290 | |
| | 12 | | | Vornado Realty Trust REIT | | | 1,276 | |
| | 40 | | | Weyerhaeuser Co. REIT | | | 1,328 | |
| | | | | | | | 25,033 | |
| | | | | Retailing - 4.0% | | | | |
| | 26 | | | Amazon.com, Inc. ● | | | 8,283 | |
| | 4 | | | AutoNation, Inc. ● | | | 258 | |
| | 2 | | | AutoZone, Inc. ● | | | 1,212 | |
| | 14 | | | Bed Bath & Beyond, Inc. ● | | | 803 | |
| | 19 | | | Best Buy Co., Inc. | | | 584 | |
| | 15 | | | CarMax, Inc. ● | | | 787 | |
| | 21 | | | Dollar General Corp. ● | | | 1,190 | |
| | 14 | | | Dollar Tree, Inc. ● | | | 773 | |
| | 7 | | | Expedia, Inc. | | | 553 | |
| | 7 | | | Family Dollar Stores, Inc. | | | 434 | |
| | 8 | | | GameStop Corp. Class A | | | 317 | |
| | 18 | | | Gap, Inc. | | | 739 | |
| | 10 | | | Genuine Parts Co. | | | 921 | |
| | 94 | | | Home Depot, Inc. | | | 7,595 | |
| | 13 | | | Kohl's Corp. | | | 702 | |
| | 17 | | | L Brands, Inc. | | | 983 | |
| | 68 | | | Lowe's Cos., Inc. | | | 3,281 | |
| | 25 | | | Macy's, Inc. | | | 1,434 | |
| | 4 | | | Netflix, Inc. ● | | | 1,823 | |
| | 10 | | | Nordstrom, Inc. | | | 651 | |
| | 7 | | | O'Reilly Automotive, Inc. ● | | | 1,092 | |
| | 7 | | | PetSmart, Inc. | | | 407 | |
| | 4 | | | Priceline (The) Group, Inc. ● | | | 4,342 | |
| | 15 | | | Ross Stores, Inc. | | | 962 | |
| | 44 | | | Staples, Inc. | | | 481 | |
| | 43 | | | Target Corp. | | | 2,515 | |
| | 8 | | | Tiffany & Co. | | | 766 | |
| | 48 | | | TJX Cos., Inc. | | | 2,549 | |
| | 10 | | | Tractor Supply Co. | | | 574 | |
| | 8 | | | TripAdvisor, Inc. ● | | | 829 | |
| | 7 | | | Urban Outfitters, Inc. ● | | | 236 | |
| | | | | | | | 48,076 | |
| | | | | Semiconductors and Semiconductor Equipment - 2.3% | | | | |
| | 21 | | | Altera Corp. | | | 745 | |
| | 21 | | | Analog Devices, Inc. | | | 1,162 | |
| | 83 | | | Applied Materials, Inc. | | | 1,881 | |
| | 17 | | | Avago Technologies Ltd. | | | 1,247 | |
| | 38 | | | Broadcom Corp. Class A | | | 1,414 | |
| | 5 | | | First Solar, Inc. ● | | | 350 | |
| | 341 | | | Intel Corp. | | | 10,542 | |
| | 11 | | | KLA-Tencor Corp. | | | 824 | |
| | 11 | | | Lam Research Corp. | | | 748 | |
| | 16 | | | Linear Technology Corp. | | | 762 | |
| | 14 | | | Microchip Technology, Inc. | | | 669 | |
| | 73 | | | Micron Technology, Inc. ● | | | 2,419 | |
| | 38 | | | NVIDIA Corp. | | | 709 | |
| | 74 | | | Texas Instruments, Inc. | | | 3,537 | |
| | 18 | | | Xilinx, Inc. | | | 870 | |
| | | | | | | | 27,879 | |
| | | | | Software and Services - 9.9% | | | | |
| | 43 | | | Accenture plc | | | 3,509 | |
| | 32 | | | Adobe Systems, Inc. ● | | | 2,294 | |
| | 12 | | | Akamai Technologies, Inc. ● | | | 747 | |
| | 4 | | | Alliance Data Systems Corp. ● | | | 1,041 | |
| | 16 | | | Autodesk, Inc. ● | | | 878 | |
| | 33 | | | Automatic Data Processing, Inc. | | | 2,618 | |
| | 22 | | | CA, Inc. | | | 628 | |
| | 11 | | | Citrix Systems, Inc. ● | | | 701 | |
| | 42 | | | Cognizant Technology Solutions Corp. ● | | | 2,041 | |
| | 10 | | | Computer Sciences Corp. | | | 629 | |
| | 78 | | | eBay, Inc. ● | | | 3,915 | |
| | 22 | | | Electronic Arts, Inc. ● | | | 772 | |
| | 118 | | | Facebook, Inc. ● | | | 7,934 | |
| | 20 | | | Fidelity National Information Services, Inc. | | | 1,082 | |
| | 17 | | | Fiserv, Inc. ● | | | 1,033 | |
| | 19 | | | Google, Inc. Class A ● | | | 11,377 | |
| | 19 | | | Google, Inc. Class C ● | | | 11,194 | |
| | 65 | | | IBM Corp. | | | 11,815 | |
| | 19 | | | Intuit, Inc. | | | 1,564 | |
| | 69 | | | Mastercard, Inc. | | | 5,057 | |
| | 515 | | | Microsoft Corp. | | | 21,485 | |
| | 235 | | | Oracle Corp. | | | 9,539 | |
| | 22 | | | Paychex, Inc. | | | 921 | |
| | 13 | | | Red Hat, Inc. ● | | | 716 | |
| | 39 | | | Salesforce.com, Inc. ● | | | 2,249 | |
| | 47 | | | Symantec Corp. | | | 1,087 | |
| | 11 | | | Teradata Corp. ● | | | 433 | |
| | 11 | | | Total System Services, Inc. | | | 356 | |
| | 8 | | | VeriSign, Inc. ● | | | 411 | |
| | 34 | | | Visa, Inc. | | | 7,256 | |
| | 37 | | | Western Union Co. | | | 640 | |
| | 75 | | | Xerox Corp. | | | 931 | |
| | 64 | | | Yahoo!, Inc. ● | | | 2,256 | |
| | | | | | | | 119,109 | |
| | | | | Technology Hardware and Equipment - 6.5% | | | | |
| | 6 | | | Allegion plc | | | 351 | |
| | 11 | | | Amphenol Corp. Class A | | | 1,038 | |
| | 413 | | | Apple, Inc. | | | 38,403 | |
| | 351 | | | Cisco Systems, Inc. | | | 8,724 | |
The accompanying notes are an integral part of these financial statements.
| Hartford Index HLS Fund |
| Schedule of Investments – (continued) |
| June 30, 2014 (Unaudited) |
| (000’s Omitted) |
| Shares or Principal Amount | | | | | | Market Value ╪ | |
| Common Stocks - 99.1% - (continued) | | | | | | | | |
| | | | | Technology Hardware and Equipment - 6.5% - (continued) | | | | | | | | |
| | 90 | | | Corning, Inc. | | | | | | $ | 1,968 | |
| | 140 | | | EMC Corp. | | | | | | | 3,697 | |
| | 5 | | | F5 Networks, Inc. ● | | | | | | | 575 | |
| | 10 | | | FLIR Systems, Inc. | | | | | | | 338 | |
| | 7 | | | Harris Corp. | | | | | | | 553 | |
| | 128 | | | Hewlett-Packard Co. | | | | | | | 4,321 | |
| | 13 | | | Jabil Circuit, Inc. | | | | | | | 266 | |
| | 32 | | | Juniper Networks, Inc. ● | | | | | | | 796 | |
| | 15 | | | Motorola Solutions, Inc. | | | | | | | 1,030 | |
| | 23 | | | NetApp, Inc. | | | | | | | 829 | |
| | 116 | | | Qualcomm, Inc. | | | | | | | 9,165 | |
| | 16 | | | SanDisk Corp. | | | | | | | 1,623 | |
| | 22 | | | Seagate Technology plc | | | | | | | 1,270 | |
| | 28 | | | TE Connectivity Ltd. | | | | | | | 1,733 | |
| | 14 | | | Western Digital Corp. | | | | | | | 1,320 | |
| | | | | | | | | | | | 78,000 | |
| | | | | Telecommunication Services - 2.5% | | | | | | | | |
| | 356 | | | AT&T, Inc. | | | | | | | 12,577 | |
| | 39 | | | CenturyLink, Inc. | | | | | | | 1,420 | |
| | 23 | | | Crown Castle International Corp. | | | | | | | 1,697 | |
| | 69 | | | Frontier Communications Co. | | | | | | | 401 | |
| | 284 | | | Verizon Communications, Inc. | | | | | | | 13,886 | |
| | 41 | | | Windstream Holdings, Inc. | | | | | | | 411 | |
| | | | | | | | | | | | 30,392 | |
| | | | | Transportation - 2.0% | | | | | | | | |
| | 10 | | | C.H. Robinson Worldwide, Inc. | | | | | | | 652 | |
| | 69 | | | CSX Corp. | | | | | | | 2,122 | |
| | 58 | | | Delta Air Lines, Inc. | | | | | | | 2,252 | |
| | 13 | | | Expeditors International of Washington, Inc. | | | | | | | 595 | |
| | 19 | | | FedEx Corp. | | | | | | | 2,883 | |
| | 8 | | | Kansas City Southern | | | | | | | 812 | |
| | 21 | | | Norfolk Southern Corp. | | | | | | | 2,182 | |
| | 4 | | | Ryder System, Inc. | | | | | | | 323 | |
| | 47 | | | Southwest Airlines Co. | | | | | | | 1,274 | |
| | 62 | | | Union Pacific Corp. | | | | | | | 6,192 | |
| | 48 | | | United Parcel Service, Inc. Class B | | | | | | | 4,957 | |
| | | | | | | | | | | | 24,244 | |
| | | | | Utilities - 3.2% | | | | | | | | |
| | 45 | | | AES (The) Corp. | | | | | | | 703 | |
| | 8 | | | AGL Resources, Inc. | | | | | | | 450 | |
| | 17 | | | Ameren Corp. | | | | | | | 678 | |
| | 33 | | | American Electric Power Co., Inc. | | | | | | | 1,863 | |
| | 29 | | | CenterPoint Energy, Inc. | | | | | | | 752 | |
| | 18 | | | CMS Energy Corp. | | | | | | | 575 | |
| | 20 | | | Consolidated Edison, Inc. | | | | | | | 1,162 | |
| | 40 | | | Dominion Resources, Inc. | | | | | | | 2,849 | |
| | 12 | | | DTE Energy Co. | | | | | | | 943 | |
| | 48 | | | Duke Energy Corp. | | | | | | | 3,597 | |
| | 22 | | | Edison International | | | | | | | 1,300 | |
| | 12 | | | Entergy Corp. | | | | | | | 1,005 | |
| | 59 | | | Exelon Corp. | | | | | | | 2,147 | |
| | 29 | | | FirstEnergy Corp. | | | | | | | 999 | |
| | 6 | | | Integrys Energy Group, Inc. | | | | | | | 393 | |
| | 30 | | | NextEra Energy, Inc. | | | | | | | 3,067 | |
| | 22 | | | NiSource, Inc. | | | | | | | 847 | |
| | 22 | | | Northeast Utilities | | | | | | | 1,022 | |
| | 23 | | | NRG Energy, Inc. | | | | | | | 858 | |
| | 14 | | | Oneok, Inc. | | | | | | | 972 | |
| | 17 | | | Pepco Holdings, Inc. | | | | | | | 472 | |
| | 32 | | | PG&E Corp. | | | | | | | 1,527 | |
| | 8 | | | Pinnacle West Capital Corp. | | | | | | | 436 | |
| | 43 | | | PPL Corp. | | | | | | | 1,537 | |
| | 35 | | | Public Service Enterprise Group, Inc. | | | | | | | 1,414 | |
| | 10 | | | SCANA Corp. | | | | | | | 523 | |
| | 16 | | | Sempra Energy | | | | | | | 1,640 | |
| | 61 | | | Southern Co. | | | | | | | 2,769 | |
| | 14 | | | TECO Energy, Inc. | | | | | | | 259 | |
| | 15 | | | Wisconsin Energy Corp. | | | | | | | 724 | |
| | 34 | | | Xcel Energy, Inc. | | | | | | | 1,108 | |
| | | | | | | | | | | | 38,591 | |
| | | | | Total Common Stocks | | | | | | | | |
| | | | | ( Cost $689,796) | | | | | | $ | 1,193,709 | |
| | | | | | | | | | | | | |
| | | | | Total Long-Term Investments | | | | | | | | |
| | | | | (Cost $689,796) | | | | | | $ | 1,193,709 | |
| | | | | | | | | | | | | |
| Short-Term Investments - 0.9% | | | | | | | | |
| Repurchase Agreements - 0.8% | | | | | | | | |
| | | | | RBS Greenwich TriParty Repurchase Agreement
(maturing on 07/01/2014 in the amount of
$9,799, collateralized by U.S. Treasury Note
2.00%, 2021, value of $9,999) | | | | | | | | |
| $ | 9,799 | | | 0.07%, 6/30/2014 | | | | | | $ | 9,799 | |
| | | | | | | | | | | | | |
| | | | | U.S. Treasury Bills - 0.1% | | | | | | | | |
| | 850 | | | 0.07%, 07/10/2014 □ ○ | | | | | | $ | 850 | |
| | | | | | | | | | | | | |
| | | | | Total Short-Term Investments | | | | | | | | |
| | | | | (Cost $10,649) | | | | | | $ | 10,649 | |
| | | | | | | | | | | | | |
| | | | | Total Investments | | | | | | | | |
| | | | | (Cost $700,445) ▲ | | | 100.0 | % | | $ | 1,204,358 | |
| | | | | Other Assets and Liabilities | | | – | % | | | 86 | |
| | | | | Total Net Assets | | | 100.0 | % | | $ | 1,204,444 | |
The accompanying notes are an integral part of these financial statements.
| Hartford Index HLS Fund |
| Schedule of Investments – (continued) |
| June 30, 2014 (Unaudited) |
| (000’s Omitted) |
| Note: | Percentage of investments as shown is the ratio of the total market value to total net assets. |
| ▲ | At June 30, 2014, the cost of securities for federal income tax purposes was $737,253 and the aggregate gross unrealized appreciation and depreciation based on that cost were: |
| Unrealized Appreciation | | $ | 529,975 | |
| Unrealized Depreciation | | | (62,870 | ) |
| Net Unrealized Appreciation | | $ | 467,105 | |
| ○ | The interest rate disclosed for these securities represents the effective yield on the date of the acquisition. |
| □ | This security, or a portion of this security, is pledged as initial margin deposit and collateral for daily variation margin loss on open futures contracts held at June 30, 2014. |
Cash pledged and received as collateral in connection with derivatives at June 30, 2014.
| | | Pledged | | | Received | |
| Futures contracts | | $ | 300 | | | $ | – | |
| Total | | $ | 300 | | | $ | – | |
Futures Contracts Outstanding at June 30, 2014
| | | Number of | | Expiration | | Notional | | | Market | | | Unrealized
Appreciation/(Depreciation) | | | Variation Margin | |
| Description | | Contracts* | | Date | | Amount | | | Value ╪ | | | Asset | | | Liability | | | Asset | | | Liability | |
| Long position contracts: | | | | | | | | | | | | | | | | | | | | | | | | | | | | |
| S&P 500 Futures | | 23 | | 09/18/2014 | | $ | 11,180 | | | $ | 11,226 | | | $ | 46 | | | $ | – | | | $ | 3 | | | $ | – | |
* The number of contracts does not omit 000's.
| ╪ | See Significant Accounting Policies of accompanying Notes to Financial Statements regarding valuation of securities. |
| GLOSSARY: (abbreviations used in preceding Schedule of Investments) |
| |
| Index Abbreviations: |
| S&P | Standard & Poors |
| |
| Other Abbreviations: |
| REIT | Real Estate Investment Trust |
The accompanying notes are an integral part of these financial statements.
| Hartford Index HLS Fund |
| Investment Valuation Hierarchy Level Summary |
| June 30, 2014 (Unaudited) |
| (000’s Omitted) |
| | | Total | | | Level 1 ♦ | | | Level 2 ♦ | | | Level 3 | |
| Assets: | | | | | | | | | | | | | | | | |
| Common Stocks ‡ | | $ | 1,193,709 | | | $ | 1,193,709 | | | $ | – | | | $ | – | |
| Short-Term Investments | | | 10,649 | | | | – | | | | 10,649 | | | | – | |
| Total | | $ | 1,204,358 | | | $ | 1,193,709 | | | $ | 10,649 | | | $ | – | |
| Futures * | | $ | 46 | | | $ | 46 | | | $ | – | | | $ | – | |
| Total | | $ | 46 | | | $ | 46 | | | $ | – | | | $ | – | |
| ♦ | For the six-month period ended June 30, 2014, there were no transfers between Level 1 and Level 2. |
| ‡ | The Fund has all or primarily all of the equity securities categorized in a particular level. Refer to the Schedule of Investments for further industry breakout. |
| * | Derivative instruments (excluding purchased and written options, if applicable) are valued at the unrealized appreciation/depreciation on the investments. |
| Note: | For purposes of reporting transfers between different hierarchy levels, both transfers in and out of each level, as applicable, are shown as if they occurred at the beginning of the period. |
The accompanying notes are an integral part of these financial statements.
| Hartford Index HLS Fund |
| Statement of Assets and Liabilities |
| June 30, 2014 (Unaudited) |
| (000’s Omitted) |
| Assets: | | | | |
| Investments in securities, at market value (cost $700,445) | | $ | 1,204,358 | |
| Cash | | | 302 | * |
| Receivables: | | | | |
| Investment securities sold | | | 11,636 | |
| Fund shares sold | | | 924 | |
| Dividends and interest | | | 1,274 | |
| Variation margin on financial derivative instruments | | | 3 | |
| Other assets | | | 6 | |
| Total assets | | | 1,218,503 | |
| Liabilities: | | | | |
| Payables: | | | | |
| Investment securities purchased | | | 997 | |
| Fund shares redeemed | | | 12,905 | |
| Variation margin on financial derivative instruments | | | — | |
| Investment management fees | | | 50 | |
| Distribution fees | | | 16 | |
| Accrued expenses | | | 91 | |
| Total liabilities | | | 14,059 | |
| Net assets | | $ | 1,204,444 | |
| Summary of Net Assets: | | | | |
| Capital stock and paid-in-capital | | $ | 684,139 | |
| Undistributed net investment income | | | 10,757 | |
| Accumulated net realized gain | | | 5,589 | |
| Unrealized appreciation of investments | | | 503,959 | |
| Net assets | | $ | 1,204,444 | |
| Shares authorized | | | 4,000,000 | |
| Par value | | $ | 0.001 | |
| Class IA: Net asset value per share | | $ | 41.23 | |
| Shares outstanding | | | 18,295 | |
| Net assets | | $ | 754,276 | |
| Class IB: Net asset value per share | | $ | 40.97 | |
| Shares outstanding | | | 10,988 | |
| Net assets | | $ | 450,168 | |
| * | Cash of $300 was pledged as initial margin deposit and collateral for daily variation margin loss on open financial derivative instruments at June 30, 2014. |
The accompanying notes are an integral part of these financial statements.
| Hartford Index HLS Fund |
| Statement of Operations |
| For the Six-Month Period Ended June 30, 2014 (Unaudited) |
| (000’s Omitted) |
| Investment Income: | | | | |
| Dividends | | $ | 11,859 | |
| Interest | | | 2 | |
| Less: Foreign tax withheld | | | (1 | ) |
| Total investment income, net | | | 11,860 | |
| | | | | |
| Expenses: | | | | |
| Investment management fees | | | 1,744 | |
| Transfer agent fees | | | 3 | |
| Distribution fees - Class IB | | | 524 | |
| Custodian fees | | | 3 | |
| Accounting services fees | | | 58 | |
| Board of Directors' fees | | | 14 | |
| Audit fees | | | 10 | |
| Other expenses | | | 71 | |
| Total expenses | | | 2,427 | |
| Net Investment Income | | | 9,433 | |
| | | | | |
| Net Realized Gain on Investments and Other Financial Instruments: | | | | |
| Net realized gain on investments | | | 21,940 | |
| Net realized gain on futures contracts | | | 1,073 | |
| Net Realized Gain on Investments and Other Financial Instruments | | | 23,013 | |
| | | | | |
| Net Changes in Unrealized Appreciation of Investments and Other Financial Instruments: | | | | |
| Net unrealized appreciation of investments | | | 47,006 | |
| Net unrealized depreciation of futures contracts | | | (247 | ) |
| Net Changes in Unrealized Appreciation of Investments and Other Financial Instruments | | | 46,759 | |
| Net Gain on Investments and Other Financial Instruments | | | 69,772 | |
| Net Increase in Net Assets Resulting from Operations | | $ | 79,205 | |
The accompanying notes are an integral part of these financial statements.
| Hartford Index HLS Fund |
| Statement of Changes in Net Assets |
| |
| (000’s Omitted) |
| | | For the
Six-Month
Period Ended
June 30, 2014
(Unaudited) | | | For the
Year Ended
December 31,
2013 | |
| Operations: | | | | | | | | |
| Net investment income | | $ | 9,433 | | | $ | 18,832 | |
| Net realized gain on investments and other financial instruments | | | 23,013 | | | | 28,994 | |
| Net unrealized appreciation of investments and other financial instruments | | | 46,759 | | | | 254,916 | |
| Net Increase in Net Assets Resulting from Operations | | | 79,205 | | | | 302,742 | |
| Distributions to Shareholders: | | | | | | | | |
| From net investment income | | | | | | | | |
| Class IA | | | — | | | | (12,238 | ) |
| Class IB | | | — | | | | (5,814 | ) |
| Total distributions | | | — | | | | (18,052 | ) |
| Capital Share Transactions: | | | | | | | | |
| Class IA | | | | | | | | |
| Sold | | | 8,020 | | | | 45,696 | |
| Issued on reinvestment of distributions | | | — | | | | 12,238 | |
| Redeemed | | | (68,083 | ) | | | (176,785 | ) |
| Total capital share transactions | | | (60,063 | ) | | | (118,851 | ) |
| Class IB | | | | | | | | |
| Sold | | | 33,089 | | | | 102,184 | |
| Issued on reinvestment of distributions | | | — | | | | 5,814 | |
| Redeemed | | | (24,774 | ) | | | (95,765 | ) |
| Total capital share transactions | | | 8,315 | | | | 12,233 | |
| Net decrease from capital share transactions | | | (51,748 | ) | | | (106,618 | ) |
| Net Increase in Net Assets | | | 27,457 | | | | 178,072 | |
| Net Assets: | | | | | | | | |
| Beginning of period | | | 1,176,987 | | | | 998,915 | |
| End of period | | $ | 1,204,444 | | | $ | 1,176,987 | |
| Undistributed (distribution in excess of) net investment income | | $ | 10,757 | | | $ | 1,324 | |
| Shares: | | | | | | | | |
| Class IA | | | | | | | | |
| Sold | | | 203 | | | | 1,353 | |
| Issued on reinvestment of distributions | | | — | | | | 323 | |
| Redeemed | | | (1,726 | ) | | | (5,158 | ) |
| Total share activity | | | (1,523 | ) | | | (3,482 | ) |
| Class IB | | | | | | | | |
| Sold | | | 855 | | | | 3,033 | |
| Issued on reinvestment of distributions | | | — | | | | 155 | |
| Redeemed | | | (639 | ) | | | (2,806 | ) |
| Total share activity | | | 216 | | | | 382 | |
The accompanying notes are an integral part of these financial statements.
| Hartford Index HLS Fund |
| Notes to Financial Statements |
| June 30, 2014 (Unaudited) |
| (000’s Omitted) |
Organization:
Hartford Index HLS Fund (the "Fund") serves as an underlying investment option for certain variable annuity and variable life insurance separate accounts of Hartford Life Insurance Company (“HLIC”) and its affiliates and certain qualified retirement plans. The Fund may also serve as an underlying investment option for certain variable annuity and variable life separate accounts of other insurance companies. Owners of variable annuity contracts and policyholders of variable life insurance contracts may choose the funds permitted in the variable insurance contract prospectus. In addition, participants in certain qualified retirement plans may choose the Fund if permitted by their plans.
Hartford Series Fund, Inc. (the “Company”) is an open-end registered management investment company comprised of twenty-eight portfolios. Financial statements for the Fund, a series of the Company, are included in this report.
The Company is organized under the laws of the State of Maryland and is registered with the Securities and Exchange Commission (“SEC”) under the Investment Company Act of 1940, as amended (“1940 Act”). The Fund is a diversified open-end management investment company.
The Fund is divided into Class IA and Class IB shares. Each class is offered at the per share net asset value (“NAV”) without a sales charge and is subject to the same expenses, except that the Class IB shares are subject to distribution and service fees charged pursuant to a Distribution Plan adopted in accordance with Rule 12b-1 under the 1940 Act.
Significant Accounting Policies:
The following is a summary of significant accounting policies of the Fund in the preparation of its financial statements, which are in accordance with United States Generally Accepted Accounting Principles (“U.S. GAAP”). The preparation of financial statements in accordance with U.S. GAAP may require management to make estimates and assumptions that affect the reported amounts of assets and liabilities and disclosure of contingent assets and liabilities at the date of the financial statements and the reported amounts of increases and decreases in net assets from operations during the reporting period. Actual results could differ from those estimates.
Determination of Net Asset Value – The NAV of each class of the Fund's shares is determined as of the close of regular trading (normally 4:00 p.m. Eastern Time) (the “NYSE Close”) on each day that the New York Stock Exchange (the “Exchange”) is open (“Valuation Date”). Information that becomes known to the Fund after the NAV has been calculated on a particular day will not generally be used to retroactively adjust the NAV determined earlier that day.
Investment Valuation and Fair Value Measurements – For purposes of calculating the NAV, portfolio investments and other assets held by the Fund's portfolio for which market quotes are readily available are valued at market value. Market value is generally determined on the basis of last reported sales prices or official close price. If no sales are reported, market value is based on quotes obtained from a quotation reporting system, established market makers, or independent pricing services. If market prices are not readily available or are deemed unreliable, the Fund will use the fair value of the investment as determined in good faith under policies and procedures established by and under the supervision of the Company's Board of Directors. Market quotes are considered not readily available where there is an absence of current or reliable market-based data (e.g., trade information or indicative market quotes), including where events occur after the close of the relevant market, but prior to the NYSE Close, that materially affect the values of the Fund's portfolio investments or assets. In addition, market quotes are considered not readily available when, due to extraordinary circumstances, the exchanges or markets on which the investments trade do not open for trading for the entire day and no other market prices are available. There can be no assurance that the Fund could obtain the fair market value assigned to an investment if the Fund were to sell the investment at approximately the time at which the Fund determines its NAV.
Short-term investments maturing in 60 days or less are generally valued at amortized cost, if their original term to maturity was 60 days or less, or by amortizing their value on the 61st day prior to maturity, if the original term to maturity exceeded 60 days.
Exchange traded options, futures and options on futures are valued at the settlement price or last trade price determined by the relevant exchange as of the NYSE Close. If the last trade price for exchange traded options does not fall between the bid and ask prices, the value will be
| Hartford Index HLS Fund |
| Notes to Financial Statements – (continued) |
| June 30, 2014 (Unaudited) |
| (000’s Omitted) |
the mean of the bid and ask prices as of the NYSE Close. If a last trade price is not available, the value will be the mean of the bid and ask prices as of the NYSE Close. If a mean of the bid and ask prices cannot be calculated for the day, the value will be the bid price as of the NYSE Close. In the case of over-the-counter ("OTC") options and such instruments that do not trade on an exchange, values may be supplied by a pricing service using a formula or other objective method that may take into consideration the style, direction, expiration, strike price, notional value and volatility or other special adjustments.
Financial instruments for which prices are not available from an independent pricing service may be valued using market quotations obtained from one or more dealers that make markets in the respective financial instrument in accordance with procedures established by the Company's Board of Directors.
U.S. GAAP defines fair value as the price that the Fund would receive to sell an asset or pay to transfer a liability in an orderly transaction between market participants. The U.S. GAAP fair value measurement standards require disclosure of a fair value hierarchy for each major category of assets and liabilities. Various inputs are used in determining the fair value of the Fund’s investments. These inputs are summarized into three broad hierarchy levels. This hierarchy is based on whether the valuation inputs are observable or unobservable. These levels are:
Level 1 – Quoted prices in active markets for identical investments. Level 1 may include exchange traded instruments, such as domestic equities, some foreign equities, options, futures, mutual funds, exchange traded funds, rights and warrants.
Level 2 – Observable inputs other than Level 1 prices, such as quoted prices for similar investments; quoted prices in markets that are not active; or other inputs that are observable or can be corroborated by observable market data. Level 2 may include debt investments that are traded less frequently than exchange traded instruments and which are valued using independent pricing services; foreign equities, which are principally traded on certain foreign markets and are adjusted daily pursuant to a fair value pricing service in order to reflect an adjustment for the factors occurring after the close of certain foreign markets but before the NYSE Close; senior floating rate interests, which are valued using an aggregate of dealer bids; short-term investments, which are valued at amortized cost; and swaps, which are valued based upon the terms of each swap contract.
Level 3 – Significant unobservable inputs that are supported by limited or no market activity. Level 3 may include financial instruments whose values are determined using indicative market quotes or require significant management judgment or estimation. These unobservable valuation inputs may include estimates for current yields, maturity/duration, prepayment speed, and indicative market quotes for comparable investments along with other assumptions relating to credit quality, collateral value, complexity of the investment structure, general market conditions and liquidity. This category may include investments where trading has been halted or there are certain restrictions on trading. While these investments are priced using unobservable inputs, the valuation of these investments reflects the best available data and management believes the prices are a reasonable representation of exit price.
The Board of Directors of the Company generally reviews and approves the “Procedures for Valuation of Portfolio Securities” at least once a year. These procedures define how investments are to be valued, including the formation and activities of a Valuation Committee. The Valuation Committee is responsible for determining in good faith the fair value of investments when the value cannot be obtained from primary pricing services or alternative sources or if the valuation of an investment as provided by the primary pricing service or alternative source is believed not to reflect the investment’s fair value as of the Valuation Date. Voting members of the Valuation Committee include the Fund's Treasurer or designee and a Vice President of the investment manager or designee. An Assistant Vice President of the Fund with legal expertise or designee is also included on the Valuation Committee as a non-voting advisory member. In addition, the Fund’s Chief Compliance Officer shall designate a member of the compliance group to attend Valuation Committee meetings as a non-voting resource, to monitor for and provide guidance with respect to compliance with these procedures. Two members of the Valuation Committee or their designees, representing different departments, shall constitute a quorum for purposes of permitting the Valuation Committee to take action. The Valuation Committee will consider all relevant factors in determining an investment’s fair value, and may seek the advice of the Fund’s sub-adviser, knowledgeable brokers, and legal counsel in making such determination. The Valuation Committee reports to the Audit Committee of the Company's Board of Directors. The Audit Committee receives quarterly written reports which include details of all fair-valued investments, including the reason for the fair valuation, and an indication, when possible, of the accuracy of the valuation by disclosing the next available reliable public price quotation or the disposition price of such investments (the “look-
| Hartford Index HLS Fund |
| Notes to Financial Statements – (continued) |
| June 30, 2014 (Unaudited) |
| (000’s Omitted) |
back” test). The Board of Directors then must consider for ratification all of the fair value determinations made during the previous quarter.
Valuation levels are not necessarily indicative of the risk associated with investing in such investments. Individual investments within any of the above mentioned asset classes may be assigned a different hierarchical level than those presented above, as individual circumstances dictate.
For additional information, refer to the Investment Valuation Hierarchy Level Summary which follows the Schedule of Investments.
Investment Transactions and Investment Income – Investment transactions are recorded as of the trade date (the date the order to buy or sell is executed) for financial reporting purposes. Investments purchased or sold on a when-issued or delayed-delivery basis may be settled a month or more after the trade date. Realized gains and losses are determined on the basis of identified cost.
Dividend income from domestic securities is accrued on the ex-dividend date. Interest income, including amortization of premium, accretion of discounts and additional principal received in-kind in lieu of cash, is accrued on a daily basis.
Fund Share Valuation and Dividend Distributions to Shareholders – Orders for the Fund’s shares are executed in accordance with the investment instructions of the contract holders and plan participants. The NAV of the Fund’s shares is determined as of the close of business on each business day of the Exchange. The NAV is determined separately for each class of shares of the Fund by dividing the Fund’s net assets attributable to that class by the number of shares of the class outstanding. Each class of shares offered by the Fund has equal rights as to assets and voting privileges (except that shareholders of a class have exclusive voting rights regarding any matter relating solely to that class of shares). Income and non-class specific expenses are allocated daily to each class on the basis of the relative net assets of the class. Realized and unrealized gains and losses are allocated daily based on the relative net assets of each class of shares of the Fund.
Orders for the purchase of the Fund’s shares received prior to the close of the Exchange on any day the Exchange is open for business are priced at the NAV determined as of the close of the Exchange. Orders received after the close of the Exchange, or on a day on which the Exchange and/or the Fund is not open for business, are priced at the next determined NAV.
Dividends are declared pursuant to a policy adopted by the Company's Board of Directors based upon the investment performance of the Fund. The policy of the Fund is to pay dividends from net investment income and realized gains, if any, at least once a year.
Distributions from net investment income, net realized gains and capital are determined in accordance with federal income tax regulations, which may differ from U.S. GAAP with respect to character and timing. These differences may include, but are not limited to, losses deferred due to wash sale adjustments, foreign currency gains and losses, adjustments related to Passive Foreign Investment Companies ("PFICs"), Real Estate Investment Trusts ("REITs"), Regulated Investment Companies ("RICs"), certain derivatives and partnerships. Permanent book and federal income tax basis differences relating to shareholder distributions will result in reclassifications to certain of the Fund’s capital accounts (see Federal Income Taxes: Reclassification of Capital Accounts note).
Securities and Other Investments:
Repurchase Agreements – A repurchase agreement is an agreement by which a counterparty agrees to sell an investment and agrees to repurchase the investment sold from the buyer at a mutually agreed upon time and price. During the period of the repurchase agreement, the counterparty will deposit cash and or securities in a third party custodial account to serve as collateral. At the time the Fund enters into a repurchase agreement, the value of the underlying collateral, including accrued interest, will be equal to or exceed the value of the repurchase agreement. Repurchase agreements expose the Fund to counterparty risk - that is, the risk that the counterparty will not fulfill its obligations. To minimize counterparty risk, the investments that serve to collateralize the repurchase agreement are held by the Fund’s custodian in book entry or physical form in the custodial account of the Fund or in a third party custodial account. Repurchase agreements are valued at cost plus accrued interest, which approximates fair value. Repurchase agreements have master netting arrangements which allow the Fund to offset amounts owed to a counterparty with amounts owed by the counterparty, including any collateral. Upon an event of default under a master repurchase agreement, the non-defaulting party may close out all transactions traded under such agreement and net amounts owed under each transaction to one net
| Hartford Index HLS Fund |
| Notes to Financial Statements – (continued) |
| June 30, 2014 (Unaudited) |
| (000’s Omitted) |
amount payable by one party to the other. Absent an event of default, the master repurchase agreement does not result in an offset of reported amounts of assets and liabilities in the Statement of Assets and Liabilities across transactions between the Fund and the applicable counterparty. The Fund, as shown on the Schedule of Investments, had outstanding repurchase agreements and related collateral as of June 30, 2014.
Investments Purchased on a When-Issued or Delayed-Delivery Basis – Delivery and payment for investments that have been purchased by the Fund on a forward commitment, or when-issued or delayed-delivery basis, take place beyond the customary settlement period. The Fund may dispose of or renegotiate a delayed-delivery transaction after it is entered into, and may sell delayed-delivery investments before they are delivered, which may result in a realized gain or loss. During this period, such investments are subject to market fluctuations, and the Fund identifies investments segregated in its records with a value at least equal to the amount of the commitment. The Fund had no when-issued or delayed-delivery investments as of June 30, 2014.
Financial Derivative Instruments:
The following disclosures contain information on how and why the Fund uses derivative instruments, the credit-risk-related contingent features in certain derivative instruments, and how derivative instruments affect the Fund’s financial position and results of operations. The location and fair value amounts of these instruments on the Statement of Assets and Liabilities and the realized gains and losses and changes in unrealized gains and losses on the Statement of Operations, each categorized by type of derivative contract, are included in the following Additional Derivative Instrument Information footnote. The derivative instruments outstanding as of period-end are disclosed in the notes to or within the Schedule of Investments for purchased options, if applicable. The amounts of realized gains and losses and changes in unrealized gains and losses on derivative instruments during the period are disclosed in the Statement of Operations.
Futures Contracts – The Fund may enter into futures contracts. A futures contract is an agreement between two parties to buy or sell an asset at a set price on a future date. The Fund uses futures contracts to manage or obtain exposure to the investment markets, commodities, or movements in interest rates and currency values. The primary risks associated with the use of futures contracts are the imperfect correlation between the change in market value of the investments held by the Fund and the prices of futures contracts and the possibility of an illiquid market. Upon entering into a futures contract, the Fund is required to deposit with a futures commission merchant (“FCM”) an amount of cash or U.S. Government or Agency Obligations in accordance with the initial margin requirements of the broker or exchange. Futures contracts are marked to market daily at the most recent settlement price reported by an exchange on which, over time, they are traded most extensively, and an appropriate payable or receivable for the change in value (“variation margin”) is recorded by the Fund. Gains or losses are recognized but not considered realized until the contracts expire or are closed. Futures contracts involve, to varying degrees, risk of loss in excess of the variation margin disclosed on the Statement of Assets and Liabilities; however, the Fund seeks to reduce this risk through the use of an FCM. The Fund, as shown on the Schedule of Investments, had outstanding futures contracts as of June 30, 2014.
Additional Derivative Instrument Information:
Fair Value of Derivative Instruments on the Statement of Assets and Liabilities as of June 30, 2014:
| | | Risk Exposure Category | |
| | | Interest Rate
Contracts | | | Foreign
Exchange
Contracts | | | Credit
Contracts | | | Equity
Contracts | | | Commodity
Contracts | | | Other
Contracts | | | Total | |
| Assets: | | | | | | | | | | | | | | | | | | | | | | | | | | | | |
| Variation margin receivable * | | $ | — | | | $ | — | | | $ | — | | | $ | 3 | | | $ | — | | | $ | — | | | $ | 3 | |
| Total | | $ | — | | | $ | — | | | $ | — | | | $ | 3 | | | $ | — | | | $ | — | | | $ | 3 | |
| | | | | | | | | | | | | | | | | | | | | | | | | | | | | |
| Liabilities: | | | | | | | | | | | | | | | | | | | | | | | | | | | | |
| Variation margin payable * | | $ | — | | | $ | — | | | $ | — | | | $ | — | | | $ | — | | | $ | — | | | $ | — | |
| Total | | $ | — | | | $ | — | | | $ | — | | | $ | — | | | $ | — | | | $ | — | | | $ | — | |
| * | Only current day's variation margin is reported within the Statement of Assets and Liabilities. The variation margin is included in the open futures cumulative appreciation of $46 as reported in the Schedule of Investments. |
| Hartford Index HLS Fund |
| Notes to Financial Statements – (continued) |
| June 30, 2014 (Unaudited) |
| (000’s Omitted) |
The volume of derivatives that is presented in the Schedule of Investments is consistent with the derivative activity during the six-month period ended June 30, 2014.
The Effect of Derivative Instruments on the Statement of Operations for the six-month period ended June 30, 2014:
| | | Risk Exposure Category | |
| | | Interest Rate
Contracts | | | Foreign
Exchange
Contracts | | | Credit
Contracts | | | Equity
Contracts | | | Commodity
Contracts | | | Other
Contracts | | | Total | |
| Realized Gain on Derivatives Recognized as a Result of Operations: | |
| Net realized gain on futures contracts | | $ | — | | | $ | — | | | $ | — | | | $ | 1,073 | | | $ | — | | | $ | — | | | $ | 1,073 | |
| Total | | $ | — | | | $ | — | | | $ | — | | | $ | 1,073 | | | $ | — | | | $ | — | | | $ | 1,073 | |
| | | | | | | | | | | | | | | | | | | | | | | | | | | | | |
| Net Change in Unrealized Appreciation (Depreciation) on Derivatives Recognized as a Result of Operations: | |
| Net change in unrealized depreciation of futures contracts | | $ | — | | | $ | — | | | $ | — | | | $ | (247 | ) | | $ | — | | | $ | — | | | $ | (247 | ) |
| Total | | $ | — | | | $ | — | | | $ | — | | | $ | (247 | ) | | $ | — | | | $ | — | | | $ | (247 | ) |
The derivatives held by the Fund as of June 30, 2014 are not subject to a master netting arrangement; therefore, no balance sheet offsetting disclosure is presented.
Principal Risks:
The Fund may be exposed to counterparty risk, or the risk that an institution or other entity with which the Fund has unsettled or open transactions will default.
The market values of equity securities, such as common stocks and preferred stocks, or equity related investments, such as futures and options, may decline due to general market conditions which are not specifically related to a particular company, such as real or perceived adverse economic conditions, changes in the general outlook for corporate earnings, changes in interest or currency rates or adverse investor sentiment generally. The market value of equity securities may also decline due to factors which affect a particular industry or industries, such as labor shortages or increased production costs and competitive conditions within an industry. Equity securities and equity related investments generally have greater market price volatility than fixed income securities.
Federal Income Taxes:
Federal Income Taxes – For federal income tax purposes, the Fund intends to continue to qualify as a RIC under Subchapter M of the Internal Revenue Code (“IRC”) by distributing substantially all of its taxable net investment income and net realized capital gains to its shareholders and otherwise complying with the requirements of the IRC. The Fund has distributed substantially all of its income and capital gains in prior years, if applicable, and intends to distribute substantially all of its income and capital gains prior to the next fiscal year-end. Accordingly, no provision for federal income or excise taxes has been made in the accompanying financial statements. Distributions from short-term capital gains are treated as ordinary income distributions for federal income tax purposes.
Net Investment Income (Loss), Net Realized Gains (Losses) and Distributions – Net investment income (loss) and net realized gains (losses) may differ for financial statement and tax purposes primarily because of losses deferred due to wash sale adjustments, foreign currency gains and losses, adjustments related to PFICs, REITs, RICs, certain derivatives and partnerships. The character of distributions made during the year from net investment income or net realized gains may differ from their ultimate characterization for federal income tax purposes. Also, due to the timing of dividend distributions, the fiscal year in which amounts are distributed may differ from the year that the income or realized gains (losses) were recorded by the Fund.
Distributions and Components of Distributable Earnings – The tax character of distributions paid by the Fund for the periods indicated is as follows (as adjusted for dividends payable, if applicable):
| | | For the Year Ended
December 31, 2013 | | | For the Year Ended
December 31, 2012 | |
| Ordinary Income | | $ | 18,052 | | | $ | 19,295 | |
| Hartford Index HLS Fund |
| Notes to Financial Statements – (continued) |
| June 30, 2014 (Unaudited) |
| (000’s Omitted) |
As of December 31, 2013, the Fund’s components of distributable earnings (deficit) on a tax basis are as follows:
| | | Amount | |
| Undistributed Ordinary Income | | $ | 1,324 | |
| Undistributed Long-Term Capital Gain | | | 19,676 | |
| Unrealized Appreciation* | | | 420,100 | |
| Total Accumulated Earnings | | $ | 441,100 | |
| * | Differences between book-basis and tax-basis unrealized appreciation (depreciation) may be attributable to the losses deferred due to wash sale adjustments, foreign currency gains and losses, adjustments related to PFICs, REITs, RICs, certain derivatives and partnerships. |
Reclassification of Capital Accounts – The Fund may record reclassifications in its capital accounts. These reclassifications have no impact on the total net assets of the Fund. The reclassifications are a result of permanent differences between U.S. GAAP and tax accounting for such items as foreign currency, PFICs, expiration or utilization of capital loss carryforwards or net operating losses. Adjustments are made to reflect the impact these items have on current and future distributions to shareholders. Therefore, the source of the Fund’s distributions may be shown in the accompanying Statement of Changes in Net Assets as from undistributed net investment income, from accumulated net realized gains on investments or from capital depending on the type of book and tax differences that exist. For the year ended December 31, 2013, the Fund recorded reclassifications to increase (decrease) the accounts listed below:
| | | Amount | |
| Undistributed Net Investment Income (Loss) | | $ | (277 | ) |
| Accumulated Net Realized Gain (Loss) | | | 277 | |
Capital Loss Carryforward – On December 22, 2010, the Regulated Investment Company Modernization Act of 2010 (the “Act”) was enacted, which made changes to the capital loss carryforward rules. The changes are effective for taxable years beginning after the date of enactment. Under the Act, funds are permitted to carry forward capital losses for an unlimited period. Additionally, capital loss carryforwards retain their character as either short-term or long-term capital losses rather than being considered all short-term as permitted under prior regulation.
The Fund had no capital loss carryforward for U.S. federal income tax purposes as of December 31, 2013.
During the year ended December 31, 2013, the Fund utilized $2,042 of prior year capital loss carryforwards.
Accounting for Uncertainty in Income Taxes – The Fund has adopted financial reporting rules that require the Fund to analyze all open tax years, as defined by the statute of limitations, for all major jurisdictions. Generally, tax authorities can examine all tax returns filed for the last three years. The Fund does not have an examination in progress.
The Fund has reviewed all open tax years and major jurisdictions and concluded that these financial reporting rules had no effect on the Fund’s financial position or results of operations. There is no tax liability resulting from unrecognized tax benefits relating to uncertain income tax positions taken or expected to be taken on the tax return for the fiscal year ended December 31, 2013. The Fund is also not aware of any tax positions for which it is reasonably possible that the total amounts of unrecognized tax benefits will significantly change in the next twelve months.
Expenses:
Investment Management Agreement – Hartford Funds Management Company, LLC (“HFMC”) serves as the Fund’s investment manager pursuant to an Investment Management Agreement with the Company. HFMC is an indirect wholly owned subsidiary of The Hartford Financial Services Group, Inc. (“The Hartford”). The investment manager has overall investment supervisory responsibility for the Fund. In addition, the investment manager provides administrative personnel, services, equipment, facilities and office space for proper operation of the Fund. HFMC has contracted with Hartford Investment Management Company (“Hartford Investment
| Hartford Index HLS Fund |
| Notes to Financial Statements – (continued) |
| June 30, 2014 (Unaudited) |
| (000’s Omitted) |
Management”) under a sub-advisory agreement for the provision of day-to-day investment management services to the Fund in accordance with the Fund’s investment objective and policies. The Fund pays a fee to the investment manager, a portion of which may be used to compensate Hartford Investment Management.
The schedule below reflects the rates of compensation paid to the investment manager for investment management services rendered as of June 30, 2014; the rates are accrued daily and paid monthly:
| Average Daily Net Assets | Annual Fee |
| On first $2 billion | 0.3000% |
| On next $3 billion | 0.2000% |
| On next $5 billion | 0.1800% |
| Over $10 billion | 0.1700% |
Accounting Services Agreement – Pursuant to the Fund Accounting Agreement between HFMC and the Company, on behalf of the Fund, HFMC provides accounting services to the Fund and receives monthly compensation based on the Fund’s average daily net assets at the rates set forth below. The Fund’s accounting services fees are accrued daily and paid monthly.
| Average Daily Net Assets | Annual Fee |
| All Assets | 0.010% |
Operating Expenses – Allocable expenses incurred by the Company are allocated to each Fund and allocated to classes within a Fund in proportion to the average daily net assets of the Fund and each class, except where allocation of certain expenses is more fairly made directly to the Fund or to specific classes within a Fund.
Distribution Plan for Class IB Shares – Hartford Funds Distributors, LLC (“HFD”), an indirect wholly owned subsidiary of The Hartford, is the principal underwriter and distributor of the Fund. The Company, on behalf of the Fund, has adopted a Distribution Plan pursuant to Rule 12b-1 of the 1940 Act for Class IB shares.
The Distribution Plan provides that the Fund may pay annually up to 0.25% of the average daily net assets of the Fund attributable to its Class IB shares for activities primarily intended to result in the sale of Class IB shares. The Board has the authority to suspend or reduce these payments at any point in time. Under the terms of the Distribution Plan and the principal underwriting agreement, the Fund is authorized to make payments monthly to the distributor that may be used to pay or reimburse entities providing distribution and shareholder servicing with respect to the Class IB shares for such entities’ fees or expenses incurred or paid in that regard. The distribution fee paid during the period can be found on the Statement of Operations. These fees are accrued daily and paid monthly.
Other Related Party Transactions – Hartford Administrative Services Company (“HASCO”), an indirect wholly owned subsidiary of The Hartford, provides transfer agent services to the Fund. HASCO was compensated on a per account basis for providing such services. The amount paid to HASCO can be found in the Statement of Operations. These fees are accrued daily and paid monthly.
Investment Transactions:
For the six-month period ended June 30, 2014, the cost of purchases and proceeds from sales of investment securities (excluding short-term investments) were as follows:
| | | Excluding U.S.
Government
Obligations | | | U.S.
Government
Obligations | | | Total | |
| Cost of Purchases | | $ | 16,338 | | | $ | — | | | $ | 16,338 | |
| Sales Proceeds | | | 58,926 | | | | — | | | | 58,926 | |
| Hartford Index HLS Fund |
| Notes to Financial Statements – (continued) |
| June 30, 2014 (Unaudited) |
| (000’s Omitted) |
Line of Credit:
The Fund is one of several Hartford Funds that participate in a $500 million committed revolving line of credit facility. The facility is to be used for temporary or emergency purposes. Under the arrangement, the funds are required to own securities having a market value in excess of 300% of the total bank borrowings. The interest rate on borrowings varies depending on the nature of the loan. The facility also requires a fee to be paid based on the amount of the commitment. This commitment fee is allocated to all the funds participating in the line of credit based on the average net assets of the funds. During the six-month period ended June 30, 2014, the Fund did not have any borrowings under this facility.
Industry Classifications:
Other than the industry classifications "Other Investment Pools and Funds" and "Exchange Traded Funds," equity industry classifications used in this report are the Global Industry Classification Standard, which was developed by and is the exclusive property and service mark of MSCI, Inc. and Standard & Poor's.
Indemnifications:
Under the Company's organizational documents, the Company shall indemnify its officers and directors to the full extent required or permitted under Maryland General Corporation Law and the federal securities laws. In addition, the Company, on behalf of the Fund, may enter into contracts that contain a variety of indemnifications. The Company's maximum exposure under these arrangements is unknown. However, as of the date of these financial statements, the Company has not had prior claims or losses pursuant to these contracts and expects the risk of loss to be remote.
Pending Legal Proceedings:
On February 25, 2011, Jennifer L. Kasilag, Louis Mellinger, Judith M. Menendez, Jacqueline M. Robinson, and Linda A. Russell filed a derivative lawsuit against Hartford Investment Financial Services, LLC (“HIFSCO”) (now known as Hartford Funds Distributors, LLC) on behalf of six Hartford retail mutual funds in the United States District Court for the District of New Jersey, alleging that HIFSCO received excessive advisory and distribution fees in violation of its statutory fiduciary duty under Section 36(b) of the 1940 Act when serving as investment manager and principal underwriter, respectively, to the Hartford retail mutual funds. Although this action was purportedly filed on behalf of certain of the Hartford Funds, none of the Hartford Funds is itself a defendant to the suit. HIFSCO moved to dismiss and, in September 2011, the motion was granted in part and denied in part, with leave to amend the complaint. In November 2011, plaintiffs filed an amended complaint on behalf of certain Hartford retail mutual funds, The Hartford Global Health Fund (now known as The Hartford Healthcare Fund), The Hartford Conservative Allocation Fund, The Hartford Growth Opportunities Fund, The Hartford Inflation Plus Fund, The Hartford Advisers Fund (now known as The Hartford Balanced Fund), and The Hartford Capital Appreciation Fund. Plaintiffs seek to rescind the investment management agreements and distribution plans between HIFSCO and these funds and to recover the total fees charged thereunder or, in the alternative, to recover any improper compensation HIFSCO received, in addition to lost earnings. HIFSCO filed a partial motion to dismiss the amended complaint and, in December 2012, the court dismissed without prejudice the claims regarding distribution fees and denied the motion with respect to the advisory fees claims. HIFSCO disputes the allegations and intends to defend vigorously.
In March 2014, the plaintiffs filed a new complaint that added as new plaintiffs The Hartford Floating Rate Fund and The Hartford Small Company Fund and named as a defendant Hartford Funds Management Company, LLC (the “Investment Manager”), which assumed the role as investment adviser to the funds as of January 2013. The Investment Manager and HIFSCO dispute the allegations and intend to defend vigorously.
This action concerns the activities of HIFSCO in its capacity as investment manager and principal underwriter to the Hartford retail mutual funds and does not concern HIFSCO’s activities in its capacity as principal underwriter to the HLS funds. For this reason, no accrual for litigation relating to this matter has been recorded in the financial statements of the Fund.
On June 2, 2011, a complaint was filed against Hartford Investment Management Company in the United States District Court of Connecticut (Deutsche Bank Trust Company Americas v. Aetna, Inc., ING Investment Trust Co., Milan E. Chilla, Hartford Investment
| Hartford Index HLS Fund |
| Notes to Financial Statements – (continued) |
| June 30, 2014 (Unaudited) |
| (000’s Omitted) |
Management Co., and UBS AG (D. Conn.)). In a similar action, plaintiffs filed a complaint listing Hartford Series Fund, Inc. and Hartford HLS Series Fund II, Inc. as members of the defendant class (The Official Committee of Unsecured Creditors of Tribune Company v. Fitzsimons, et al. (Bankr. D. Del.)). The complaints relate to the bankruptcy of the Tribune Company, which was a public company that repurchased its shares in a leveraged buyout in 2007, but entered bankruptcy a year later. The plaintiffs in each case allege that the repurchase of shares acted as a fraudulent transfer. The plaintiffs in each case seek to recover from each class member the amount of consideration received in the buyout. Each action was transferred to the United States District Court for the Southern District of New York. In September 2013, the court dismissed the Deutsche Bank Trust Company Americas action. Plaintiffs appealed and the appeals court has not yet rendered a decision. Defendants filed a motion to dismiss The Official Committee of Unsecured Creditors of Tribune Company action, but the court has not yet issued a decision. The Hartford intends to vigorously defend these actions.
Subsequent Event:
At a meeting held on May 6, 2014, the Board of Directors of the Company approved on behalf of the Fund, the reorganization of the Fund with and into the HIMCO VIT Index Fund (the “HVIT Index Fund”) (the “Reorganization”). The HVIT Index Fund is a newly organized series of HIMCO Variable Insurance Trust.
The Board of Directors of the Company has called for a Special Meeting of Shareholders of the Fund to be held in September 2014, for the purpose of seeking approval of the Agreement and Plan of Reorganization by the shareholders of the Fund. If approved, the Reorganization is expected to occur in October 2014.
| Hartford Index HLS Fund |
| Financial Highlights |
| | | ─ Selected Per-Share Data(A) ─ | | | ─ Ratios and Supplemental Data ─ | |
| Class | | Net Asset
Value at
Beginning
of Period | | | Net
Investment
Income
(Loss) | | | Net
Realized
and
Unrealized
Gain (Loss)
on
Investments | | | Total from
Investment
Operations | | | Dividends
from Net
Investment
Income | | | Distributions
from
Realized
Capital
Gains | | | Total
Dividends
and
Distributions | | | Net
Asset
Value at
End of
Period | | | Total
Return(B) | | | Net
Assets at
End of
Period
(000s) | | | Ratio of
Expenses
to
Average
Net
Assets
Before
Adjust-
ments(C) | | | Ratio of
Expenses
to
Average
Net
Assets
After
Adjust-
ments(C) | | | Ratio of
Net
Investment
Income
(Loss) to
Average
Net Assets | |
| | | | | | | | | | | | | | | | | | | | | | | | | | | | | | | | | | | | | | | | |
| For the Six-Month Period Ended June 30, 2014 (Unaudited) | |
| IA | | $ | 38.54 | | | $ | 0.33 | | | $ | 2.36 | | | $ | 2.69 | | | $ | – | | | $ | – | | | $ | – | | | $ | 41.23 | | | | 6.98 | %(D) | | $ | 754,276 | | | | 0.33 | %(E) | | | 0.33 | %(E) | | | 1.71 | %(E) |
| IB | | | 38.35 | | | | 0.28 | | | | 2.34 | | | | 2.62 | | | | – | | | | – | | | | – | | | | 40.97 | | | | 6.83 | (D) | | | 450,168 | | | | 0.58 | (E) | | | 0.58 | (E) | | | 1.46 | (E) |
| | | | | | | | | | | | | | | | | | | | | | | | | | | | | | | | | | | | | | | | | | | | | | | | | | | | | |
| For the Year Ended December 31, 2013 | |
| IA | | $ | 29.69 | | | $ | 0.62 | | | $ | 8.85 | | | $ | 9.47 | | | $ | (0.62 | ) | | $ | – | | | $ | (0.62 | ) | | $ | 38.54 | | | | 31.95 | % | | $ | 763,868 | | | | 0.33 | % | | | 0.33 | % | | | 1.79 | % |
| IB | | | 29.56 | | | | 0.53 | | | | 8.80 | | | | 9.33 | | | | (0.54 | ) | | | – | | | | (0.54 | ) | | | 38.35 | | | | 31.61 | | | | 413,119 | | | | 0.58 | | | | 0.58 | | | | 1.54 | |
| | | | | | | | | | | | | | | | | | | | | | | | | | | | | | | | | | | | | | | | | | | | | | | | | | | | | |
| For the Year Ended December 31, 2012 (F) | |
| IA | | $ | 26.20 | | | $ | 0.61 | | | $ | 3.48 | | | $ | 4.09 | | | $ | (0.60 | ) | | $ | – | | | $ | (0.60 | ) | | $ | 29.69 | | | | 15.63 | % | | $ | 691,786 | | | | 0.33 | % | | | 0.33 | % | | | 1.98 | % |
| IB | | | 26.09 | | | | 0.49 | | | | 3.51 | | | | 4.00 | | | | (0.53 | ) | | | – | | | | (0.53 | ) | | | 29.56 | | | | 15.34 | | | | 307,129 | | | | 0.58 | | | | 0.58 | | | | 1.75 | |
| | | | | | | | | | | | | | | | | | | | | | | | | | | | | | | | | | | | | | | | | | | | | | | | | | | | | |
| For the Year Ended December 31, 2011 (F) | |
| IA | | $ | 26.20 | | | $ | 0.52 | | | $ | (0.05 | ) | | $ | 0.47 | | | $ | (0.47 | ) | | $ | – | | | $ | (0.47 | ) | | $ | 26.20 | | | | 1.81 | % | | $ | 673,275 | | | | 0.33 | % | | | 0.33 | % | | | 1.74 | % |
| IB | | | 26.08 | | | | 0.39 | | | | 0.03 | | | | 0.42 | | | | (0.41 | ) | | | – | | | | (0.41 | ) | | | 26.09 | | | | 1.60 | | | | 232,459 | | | | 0.58 | | | | 0.58 | | | | 1.51 | |
| | | | | | | | | | | | | | | | | | | | | | | | | | | | | | | | | | | | | | | | | | | | | | | | | | | | | |
| For the Year Ended December 31, 2010 (F) | |
| IA | | $ | 23.22 | | | $ | 0.44 | | | $ | 2.97 | | | $ | 3.41 | | | $ | (0.43 | ) | | $ | – | | | $ | (0.43 | ) | | $ | 26.20 | | | | 14.73 | % | | $ | 809,629 | | | | 0.34 | % | | | 0.34 | % | | | 1.73 | % |
| IB | | | 23.12 | | | | 0.34 | | | | 2.99 | | | | 3.33 | | | | (0.37 | ) | | | – | | | | (0.37 | ) | | | 26.08 | | | | 14.45 | | | | 209,260 | | | | 0.59 | | | | 0.59 | | | | 1.48 | |
| | | | | | | | | | | | | | | | | | | | | | | | | | | | | | | | | | | | | | | | | | | | | | | | | | | | | |
| For the Year Ended December 31, 2009 (F) | |
| IA | | $ | 18.75 | | | $ | 0.42 | | | $ | 4.48 | | | $ | 4.90 | | | $ | (0.42 | ) | | $ | (0.01 | ) | | $ | (0.43 | ) | | $ | 23.22 | | | | 26.15 | % | | $ | 811,634 | | | | 0.35 | % | | | 0.35 | % | | | 2.00 | % |
| IB | | | 18.69 | | | | 0.35 | | | | 4.46 | | | | 4.81 | | | | (0.37 | ) | | | (0.01 | ) | | | (0.38 | ) | | | 23.12 | | | | 25.81 | | | | 166,162 | | | | 0.60 | | | | 0.60 | | | | 1.75 | |
| (A) | Information presented relates to a share outstanding throughout the indicated period. Net investment income (loss) per share amounts are calculated based on average shares outstanding unless otherwise noted. |
| (B) | The figures do not include sales charges or other fees which may be applied at the variable life insurance, variable annuity or qualified retirement plan product level. Any such additional sales charges or other fees would lower the Fund's performance. |
| (C) | Adjustments include waivers and reimbursements, if applicable. |
| (F) | Net investment income (loss) per share amounts have been calculated using the SEC method. |
| | | Portfolio Turnover
Rate for
All Share Classes | |
| For the Six-Month Period Ended June 30, 2014 (Unaudited) | | | 1% | |
| For the Year Ended December 31, 2013 | | | 3 | |
| For the Year Ended December 31, 2012 | | | 7 | |
| For the Year Ended December 31, 2011 | | | 3 | |
| For the Year Ended December 31, 2010 | | | 4 | |
| For the Year Ended December 31, 2009 | | | 6 | |
| Hartford Index HLS Fund |
| Directors and Officers (Unaudited) |
The Board of Directors of the Company (the "Directors") appoints officers who are responsible for the day-to-day operations of the Fund and who execute policies formulated by the Directors. Each Director serves until his or her death, resignation, or retirement or until the next annual meeting of shareholders is held or until his or her successor is elected and qualifies.
Directors and officers who are employed by or who have a financial interest in The Hartford are considered “interested” persons of the Fund pursuant to the 1940 Act. Each officer and two of the Company's Directors, as noted in the chart below, are “interested” persons of the Fund. Each Director serves as a director for The Hartford Mutual Funds, Inc., The Hartford Mutual Funds II, Inc., Hartford Series Fund, Inc., and Hartford HLS Series Fund II, Inc., and as a trustee for The Hartford Alternative Strategies Fund, which, as of June 30, 2014, collectively consist of 78 funds. Correspondence may be sent to Directors and officers c/o Hartford Funds, 5 Radnor Corporate Center, Suite 300, 100 Matsonford Road, Radnor, Pennsylvania 19087, except that correspondence to Mr. Annoni, Mr. Dressen and Ms. Quade may be sent to 500 Bielenberg Drive, Suite 500, Woodbury, Minnesota 55125.
The table below sets forth, for each Director and officer, his or her name, year of birth, current position with the Company and date first elected or appointed to Hartford Series Fund, Inc. ("HSF") and Hartford HLS Series Fund II, Inc. ("HSF2"), principal occupation, and, for Directors, other directorships held. The Fund’s Statement of Additional Information contains further information on the Directors and is available free of charge by calling 1-888-843-7824 or writing to: Hartford HLS Funds, c/o Hartford Life Insurance Company/Hartford Life and Annuity Insurance Company, P.O. Box 14293, Lexington, KY 40512-4293 for variable annuity and variable life insurance separate accounts of Hartford Life Insurance Company and its affiliates; Hartford Funds, P.O. Box 55022, Boston, MA 02205-5022 for all shareholders except variable annuity and variable life insurance separate accounts of Hartford Life Insurance Company and its affiliates.
Information on the aggregate remuneration paid to the directors of the Company can be found in the Statement of Operations herein. The Fund pays to The Hartford a portion of the Chief Compliance Officer’s compensation, but does not pay salaries or compensation to any of its other officers or Directors who are employed by The Hartford.
Non-Interested Directors
Lynn S. Birdsong (1946) Director since 2003, Co-Chairman of the Investment Committee since 2005
Mr. Birdsong is a private investor. Mr. Birdsong currently serves as a Director of the Sovereign High Yield Investment Company (April 2010 to current). Mr. Birdsong currently serves as an Independent Director of Nomura Partners Funds, Inc. (formerly, The Japan Fund) (April 2003 to current). From 2003 to March 2005, Mr. Birdsong was an Independent Director of the Atlantic Whitehall Funds. From 1979 to 2002, Mr. Birdsong was a Managing Director of Zurich Scudder Investments, an investment management firm. During his employment with Scudder, Mr. Birdsong was an Interested Director of The Japan Fund. From January 1981 through December 2013, Mr. Birdsong was a partner in Birdsong Company, an advertising specialty firm.
Robert M. Gavin, Jr. (1940) Director since 2002 (HSF) and 1986 (HSF2), Chairman of the Board since 2004
Dr. Gavin is an educational consultant. Prior to September 1, 2001, he was President of Cranbrook Education Community and prior to July 1996, he was President of Macalester College, St. Paul, Minnesota.
Duane E. Hill (1945) Director since 2001 (HSF) and 2002 (HSF2), Chairman of the Nominating Committee since 2003
Mr. Hill is a Partner of TSG Ventures L.P., a private equity investment company. Mr. Hill is a former partner of TSG Capital Group, a private equity investment firm that served as sponsor and lead investor in leveraged buyouts of middle market companies.
Sandra S. Jaffee (1941) Director since 2005
Ms. Jaffee is the founder and Chief Executive Officer of a private company, Homeworks Concierge, LLC, which provides residential property management services in Westchester County, New York (January 2012 to present). Ms. Jaffee served as Chairman (2008 to 2009) and Chief Executive Officer of Fortent (formerly Searchspace Group), a leading provider of compliance/regulatory technology to financial institutions from August 2005 to August 2009. From August 2004 to August 2005, Ms. Jaffee served as an Entrepreneur in Residence with Warburg Pincus, a private equity firm. Prior to joining Warburg Pincus, Ms. Jaffee served as Executive Vice President at Citigroup, from September 1995 to July 2004, where she was President and Chief Executive Officer of Citibank’s Global Securities Services (1995 to 2003). Ms. Jaffee currently serves as a member of the Board of Directors of Broadridge Financial Solutions as well as a Trustee of Muhlenberg College.
| Hartford Index HLS Fund |
| Directors and Officers (Unaudited) – (continued) |
William P. Johnston (1944) Director since 2005, Chairman of the Compliance Committee since 2005
In June 2006, Mr. Johnston was appointed as Senior Advisor to The Carlyle Group, a global private equity and other alternative asset investment firm and currently serves as an Operating Executive. In July 2006, Mr. Johnston was elected to the Board of Directors of MultiPlan, Inc. and served as a Director (July 2006 to August 2010). In August 2007, Mr. Johnston was elected to the Board of Directors of LifeCare Holdings, Inc. and served as a Director (August 2007 to June 2013). In February 2008, Mr. Johnston was elected to the Board of Directors of HCR-ManorCare, Inc. In May 2006, Mr. Johnston was elected to the Supervisory Board of Fresenius Medical Care AG & Co. KGaA, after its acquisition of Renal Care Group, Inc. in March 2006. Mr. Johnston joined Renal Care Group in November 2002 as a member of the Board of Directors and served as Chairman of the Board from March 2003 through March 2006. From 2002 through 2013, Mr. Johnston served as a Board member of the Georgia O’Keefe Museum. From September 1987 to December 2002, Mr. Johnston was with Equitable Securities Corporation (and its successors, SunTrust Equitable Securities and SunTrust Robinson Humphrey) serving in various investment banking and managerial positions, including Managing Director and Head of Investment Banking, Chief Executive Officer and Vice Chairman.
Phillip O. Peterson (1944) Director since 2002 (HSF) and 2000 (HSF2), Chairman of the Audit Committee since 2002
Mr. Peterson is a mutual fund industry consultant. He was a partner of KPMG LLP (an accounting firm) until July 1999. Mr. Peterson joined William Blair Funds in February 2007 as a member of the Board of Trustees. From February 2012 to February 2014, Mr. Peterson served as a Trustee of Symetra Variable Mutual Funds. From January 2004 to April 2005, Mr. Peterson served as Independent President of the Strong Mutual Funds.
Lemma W. Senbet (1946) Director since 2005
Dr. Senbet is the William E. Mayer Chair Professor of Finance and Founding Director, Center for Financial Policy, at the University of Maryland, Robert H. Smith School of Business. He was chair of the Finance Department of the University of Maryland, Robert H. Smith School of Business from 1998 to 2006. Since June 2013, he has been on leave from the University to serve as Executive Director of African Economic Research Consortium which focuses on economic policy research and training. Previously, he was a chaired professor of finance at the University of Wisconsin-Madison. Also, he was a Director of the Fortis Funds from March 2000 to July 2002. Dr. Senbet served as Director of the American Finance Association and President of the Western Finance Association. In 2006, Dr. Senbet was inducted Fellow of Financial Management Association International for his career-long distinguished scholarship and professional service.
Interested Directors and Officers
James E. Davey (1964) Director since 2012, President and Chief Executive Officer since 2010
Mr. Davey serves as Executive Vice President of Hartford Life Insurance Company (“HLIC”) and The Hartford Financial Services Group, Inc. Additionally, Mr. Davey serves as Chairman of the Board, Manager and Senior Managing Director of Hartford Funds Distributors, LLC (“HFD”). He also currently serves as Director, Chairman of the Board, President and Senior Managing Director of Hartford Administrative Services Company (“HASCO”). Mr. Davey also serves as Manager, Chairman of the Board and Senior Managing Director for Hartford Funds Management Company, LLC (“HFMC”) and Director, Chairman of the Board and Senior Managing Director for Hartford Funds Management Group, Inc. ("HFMG"). Mr. Davey has served in various positions within The Hartford and its subsidiaries in connection with the operation of the Hartford Funds. Mr. Davey joined The Hartford in 2002.
Lowndes A. Smith (1939) Director since 1996 (HSF) and 2002 (HSF2), Co-Chairman of the Investment Committee since 2005
Mr. Smith served as Vice Chairman of The Hartford from February 1997 to January 2002, as President and Chief Executive Officer of Hartford Life, Inc. from February 1997 to January 2002, and as President and Chief Operating Officer of The Hartford Life Insurance Companies from January 1989 to January 2002. Mr. Smith serves as a Director of White Mountains Insurance Group Ltd. (October 2003 to current); One Beacon Insurance (October 2006 to current); Symetra Financial (August 2007 to current) and is a Managing Director of Whittington Gray Associates (January 2007 to current).
Other Officers
Mark A. Annoni (1964) Vice President, Controller and Treasurer since 2012
Mr. Annoni currently serves as the Assistant Vice President of HLIC (February 2004 to present) and Senior Vice President of HFMG (December 2013 to present). Mr. Annoni has served in various positions within The Hartford and its subsidiaries in connection with the operation of the Hartford Funds. Mr. Annoni joined The Hartford in 2001.
| Hartford Index HLS Fund |
| Directors and Officers (Unaudited) – (continued) |
Michael R. Dressen (1963) AML Compliance Officer since 2011
Mr. Dressen currently serves as Assistant Vice President of HLIC. He also serves as Chief Compliance Officer and AML Compliance Officer of HASCO and as AML Officer of HFD. Mr. Dressen has served in various positions within The Hartford and its subsidiaries in connection with the operation of the Hartford Funds.
Edward P. Macdonald (1967) Vice President, Secretary and Chief Legal Officer since 2005
Mr. Macdonald currently serves as Assistant Secretary, Executive Vice President and Deputy General Counsel of HFD, HASCO, HFMC and HFMG. He also serves as Vice President of HLIC. Mr. Macdonald has served in various positions within The Hartford and its subsidiaries in connection with the operation of the Hartford Funds. Mr. Macdonald joined The Hartford in 2005.
Joseph G. Melcher (1973) Vice President and Chief Compliance Officer since 2013
Mr. Melcher currently serves as Executive Vice President of HFD, HFMG and HASCO. Mr. Melcher also currently serves as Executive Vice President and Chief Compliance Officer of HFMC. Mr. Melcher has served in various positions within The Hartford and its subsidiaries in connection with the operation of the Hartford Funds since joining The Hartford in 2012. Prior to joining The Hartford, Mr. Melcher worked at Touchstone Investments, a member of the Western & Southern Financial Group, where he held the position of Vice President and Chief Compliance Officer from 2010 through 2012 and Assistant Vice President, Compliance from 2005 to 2010.
Vernon J. Meyer (1964) Vice President since 2006
Mr. Meyer currently serves as Senior Vice President of HLIC. He also currently serves as Managing Director and Chief Investment Officer of HFMC and Managing Director of HFMG. Mr. Meyer has served in various positions within The Hartford and its subsidiaries in connection with the operation of the Hartford Funds. Mr. Meyer joined The Hartford in 2004.
Laura S. Quade (1969) Vice President since 2012
Ms. Quade currently serves as Vice President of HASCO, HFD and HFMG. She is the Head of Operations of HASCO and also serves as Director, Enterprise Operations of HLIC. Ms. Quade has served in various positions within The Hartford and its subsidiaries in connection with the operation of the Hartford Funds.
Martin A. Swanson (1962) Vice President since 2010
Mr. Swanson currently serves as Vice President of HLIC. Mr. Swanson also serves as Managing Director, Chief Marketing Officer and Principal of HFD and Managing Director of HFMG. Mr. Swanson has served in various positions within The Hartford and its subsidiaries in connection with the operation of the Hartford Funds.
HOW TO OBTAIN A COPY OF THE FUND’S PROXY VOTING POLICIES AND VOTING RECORDS (UNAUDITED)
A description of the policies and procedures that the Fund uses to determine how to vote proxies relating to portfolio securities and information about how the Fund voted proxies relating to portfolio securities during the most recent twelve-month period ended June 30 are available (1) without charge, upon request, by calling 888-843-7824 and (2) on the SEC’s website at http://www.sec.gov.
QUARTERLY PORTFOLIO HOLDINGS INFORMATION (UNAUDITED)
The Fund files a complete schedule of portfolio holdings with the SEC for the first and third quarters of each fiscal year on Form N-Q. The Fund’s Forms N-Q are available (1) without charge, upon request, by calling 888-843-7824 and (2) on the SEC’s website at http://www.sec.gov. The Form N-Q may be reviewed and copied at the SEC’s Public Reference Room in Washington, DC. Information on the operation of the Public Reference Room may be obtained by calling 1-800-SEC-0330.
| Hartford Index HLS Fund |
| Expense Example (Unaudited) |
Your Fund's Expenses
As a shareholder of the Fund, you incur two types of costs: (1) transaction costs and (2) ongoing costs, including investment management fees, distribution and/or service (12b-1) fees, if any, and other fund expenses. This example is intended to help you understand your ongoing costs (in dollars) of investing in the Fund and to compare these costs with the ongoing costs of investing in other mutual funds. The example is based on an investment of $1,000 invested at the beginning of the period and held for the entire period of December 31, 2013 through June 30, 2014.
Actual Expenses
The first set of columns of the table below provides information about actual account values and actual expenses. You may use the information in this column, together with the amount you invested, to estimate the expenses that you paid over the period. Simply divide your account value by $1,000 (for example, an $8,600 account value divided by $1,000 = 8.6), then multiply the result by the number in the line under the heading entitled “Expenses Paid During Period” to estimate the expenses you paid on your account during this period.
Hypothetical Example for Comparison Purposes
The second set of columns of the table below provides information about hypothetical account values and hypothetical expenses based on the Fund's actual expense ratio and an assumed rate of return of 5% per year before expenses, which is not the Fund's actual return. The hypothetical account values and expenses may not be used to estimate the actual ending account balance or expenses you paid for the period. You may use this information to compare the ongoing costs of investing in the Fund and other funds. To do so, compare this 5% hypothetical example with the 5% hypothetical examples that appear in the shareholder reports of the other funds.
Please note that the expenses shown in the table are meant to highlight your ongoing costs only and do not reflect any transactional costs, such as sales charges (loads) and CDSC. Therefore, the second set of columns of the table is useful in comparing ongoing costs only, and will not help you determine the relative total costs of owning different funds. In addition, if these transactional costs were included, your costs would be higher. Expenses are equal to the Fund's annualized expense ratios multiplied by average account value over the period, multiplied by 181/365 (to reflect the one-half year period).
| | | Actual return | | | Hypothetical (5% return before expenses) | | | | | | | | |
| | | Beginning
Account Value
December 31,
2013 | | | Ending Account
Value
June 30, 2014 | | | Expenses paid
during the period
December 31, 2013
through
June 30, 2014 | | | Beginning
Account Value
December 31,
2013 | | | Ending Account
Value
June 30, 2014 | | | Expenses paid
during the period
December 31,
2013
through
June 30, 2014 | | | Annualized
expense
ratio | | | Days
in the
current
1/2
year | | Days
in the
full
year |
| Class IA | | $ | 1,000.00 | | | $ | 1,069.80 | | | $ | 1.69 | | | $ | 1,000.00 | | | $ | 1,023.16 | | | $ | 1.66 | | | | 0.33 | % | | 181 | | 365 |
| Class IB | | $ | 1,000.00 | | | $ | 1,068.30 | | | $ | 2.97 | | | $ | 1,000.00 | | | $ | 1,021.92 | | | $ | 2.91 | | | | 0.58 | | | 181 | | 365 |
| Hartford Index HLS Fund |
| Main Risks (Unaudited) |
The main risks of investing in the Fund are described below.
Market, Selection and Strategy Risk: The Fund’s share price may fluctuate due to market risk and/or security selections that may underperform the market or relevant benchmarks. If the sub-adviser's investment strategy does not perform as expected, the Fund could underperform its peers or lose money. There is no guarantee the Fund will achieve its stated objective.
Passive Management Risk: The Fund is not actively managed, and will generally remain fully invested even when stock prices are falling.
Index Tracking Risk: The Fund’s performance may not match or correlate to that of its index, which may cause the Fund’s performance to be lower than expected.
"Standard & Poor's"®, "S&P"®, "S&P 500"®, "Standard & Poor's 500" and "500" are trademarks of The McGraw-Hill Companies, Inc. and have been licensed for use by Hartford Life Insurance Company and Hartford Life and Annuity Insurance Company. Investment Options are not sponsored, endorsed, sold or promoted by Standard & Poor's and Standard & Poor's makes no representation regarding the advisability of investing in the Investment Options.
THIS PRIVACY POLICY IS NOT PART OF THIS REPORT
Privacy Policy and Practices of The Hartford Financial Services Group, Inc. and its Affiliates
(herein called “we, our and us”)
This Privacy Policy applies to our United States Operations
We value your trust. We are committed to the responsible: a) management; b) use; and c) protection; of Personal Information. This notice describes how we collect, disclose, and protect Personal Information. We collect Personal Information to: a) service your Transactions with us; and b) support our business functions. We may obtain Personal Information from: a) You; b) your Transactions with us; and c) third parties such as a consumer-reporting agency. Based on the type of product or service You apply for or get from us, Personal Information such as: a) your name; b) your address; c) your income; d) your payment; or e) your credit history; may be gathered from sources such as applications, Transactions, and consumer reports. To serve You and service our business, we may share certain Personal Information. We will share Personal Information, only as allowed by law, with affiliates such as: a) our insurance companies; b) our employee agents; c) our brokerage firms; and d) our administrators. As allowed by law, we may share Personal Financial Information with our affiliates to: a) market our products; or b) market our services; to You without providing You with an option to prevent these disclosures. | | | We may also share Personal Information, only as allowed by law, with unaffiliated third parties including: a) independent agents; b) brokerage firms; c) insurance companies; d) administrators; and e) service providers; who help us serve You and service our business. When allowed by law, we may share certain Personal Financial Information with other unaffiliated third parties who assist us by performing services or functions such as: a) taking surveys; b) marketing our products or services; or c) offering financial products or services under a joint agreement between us and one or more financial institutions. We, and third parties we partner with, may track some of the pages You visit through the use of: a) cookies; b) pixel tagging; or c) other technologies; and currently do not process or comply with any web browser’s “do not track” signal or similar mechanism that indicates a request to disable online tracking of individual users who visit our websites or use our services. We will not sell or share your Personal Financial Information with anyone for purposes unrelated to our business functions without offering You the opportunity to: a) “opt-out;” or b) “opt-in;” as required by law. We only disclose Personal Health Information with: a) your proper written authorization; or b) as otherwise allowed or required by law. Our employees have access to Personal Information in the course of doing their jobs, such as: a) underwriting policies; b) paying claims; c) developing new products; or d) advising customers of our products and services. |
We use manual and electronic security procedures to maintain: a) the confidentiality; and b) the integrity of; Personal Information that we have. We use these procedures to guard against unauthorized access. Some techniques we use to protect Personal Information include: a) secured files; b) user authentication; c) encryption; d) firewall technology; and e) the use of detection software. We are responsible for and must: a) identify information to be protected; b) provide an adequate level of protection for that data; c) grant access to protected data only to those people who must use it in the performance of their job-related duties. Employees who violate our Privacy Policy will be subject to discipline, which may include ending their employment with us. At the start of our business relationship, we will give You a copy of our current Privacy Policy. We will also give You a copy of our current Privacy Policy once a year if You maintain a continuing business relationship with us. We will continue to follow our Privacy Policy regarding Personal Information even when a business relationship no longer exists between us. | | | As used in this Privacy Notice: Application means your request for our product or service. Personal Financial Information means financial information such as: a) credit history; b) income; c) financial benefits; or d) policy or claim information. Personal Health Information means health information such as: a) your medical records; or b) information about your illness, disability or injury. Personal Information means information that identifies You personally and is not otherwise available to the public. It includes: a) Personal Financial Information; and b) Personal Health Information. Transaction means your business dealings with us, such as: a) your Application; b) your request for us to pay a claim; and c) your request for us to take an action on your account. You means an individual who has given us Personal Information in conjunction with: a) asking about; b) applying for; or c) obtaining; a financial product or service from us if the product or service is used mainly for personal, family, or household purposes. |
This Privacy Policy is being provided on behalf of the following affiliates of The Hartford Financial Services Group, Inc.:
1stAGChoice, Inc.; Access CoverageCorp, Inc.; Access CoverageCorp Technologies, Inc.; American Maturity Life Insurance Company; Archway 60 R, LLC; Business Management Group, Inc.; Champlain Life Reinsurance Company; DMS R, LLC; Eloy R, LLC; Ersatz Corporation; First State Insurance Company; Hartford Accident and Indemnity Company; Hartford Administrative Services Company; Hartford Casualty General Agency, Inc.; Hartford Casualty Insurance Company; Hartford-Comprehensive Employee Benefit Service Company; Hartford Equity Sales Company, Inc.; Hartford Fire General Agency, Inc.; Hartford Fire Insurance Company; Hartford Funds Management Company, LLC; Hartford Funds Management Group, Inc.; Hartford HLS Series Fund II, Inc.; Hartford Insurance Company of Illinois; Hartford Insurance Company of the Midwest; Hartford Insurance Company of the Southeast; Hartford Integrated Technologies, Inc.; Hartford International Life Reassurance Corporation; Hartford Funds Distributors, LLC; Hartford Investment Management Company; Hartford Life and Accident Insurance Company; Hartford Life and Annuity Insurance Company; Hartford Life Insurance Company; Hartford Life Private Placement, LLC; Hartford Lloyd’s Corporation; Hartford Lloyd’s Insurance Company; Hartford Mezzanine Investors I, LLC; Hartford Residual Market, L.C.C.; Hartford Retirement Services, LLC; Hartford Securities Distribution Company, Inc.; Hartford Series Fund, Inc.; Hartford Specialty Insurance Services of Texas, LLC; Hartford Strategic Investments, LLC; Hartford Underwriters Insurance Company; Hartford Technology Services Company, L.L.C.; Hartford of Texas General Agency, Inc.; Hartford Underwriters General Agency, Inc.; HARTRE Company, L.C.C.; HL Investment Advisors, LLC; HLA LLC; Horizon Management Group, LLC; HRA Brokerage Services, Inc.; Lanidex Class B, LLC; M-CAP Insurance Agency, LLC; New England Insurance Company; New England Reinsurance Corporation; Nutmeg Insurance Agency, Inc.; Nutmeg Insurance Company; Pacific Insurance Company, Limited; Planco, LLC: Property and Casualty Insurance Company of Hartford; Revere R, LLC; RVR R, LLC; Sentinel Insurance Company, Ltd.; Sunstone R, LLC; Symphony R, LLC; The Evergreen Group Incorporated; The Hartford Alternative Strategies Fund; The Hartford Mutual Funds, Inc.; The Hartford Mutual Funds II, Inc.; Trumbull Flood Management, L.L.C.; Trumbull Insurance Company; Twin City Fire Insurance Company; White River Life Reinsurance Company.
HPP Revised January 2014
HARTFORD HLS FUNDS
P.O. Box 14293
Lexington, KY 40512-4293
HARTFORDFUNDS
hartfordfunds.com
Hartford Series Fund, Inc. is underwritten and distributed by Hartford Funds Distributors, LLC.
Hartford Series Fund, Inc. inception dates range from 1977 to date. Hartford Series Fund, Inc. is not a subsidiary of The Hartford Financial Services Group, Inc. ("The Hartford") but is underwritten, distributed by and advised by subsidiaries of The Hartford. Investments in Hartford Series Fund, Inc. are not guaranteed by The Hartford or any other entity.
This report is submitted for the general information of the shareholders of the Funds. It is not authorized for distribution unless preceded or accompanied by a current prospectus for the Funds.
Investors should carefully consider the investment objectives, risks, charges, and expenses of Hartford Funds before investing. This and other information can be found in the prospectus, which can be obtained by calling 800-862-6668 (or 800-279-1541 for institutional investors). Investors should read them carefully before they invest.
HLSSAR-IX14 8-14 113545-3 Printed in U.S.A.
HARTFORDFUNDS
| | HARTFORD INTERNATIONAL OPPORTUNITIES HLS FUND 2014 Semi Annual Report |
A MESSAGE FROM THE PRESIDENT
Dear Fellow Shareholders:
Thank you for investing in Hartford HLS Funds.
Market Review
U.S. equities (as represented by the S&P 500 Index) started 2014 on a shaky note after posting a strong 32.39% gain in 2013. However, stocks managed to maintain modest gains throughout the first quarter and returned to a generally steady climb in the second quarter. Through June 30, 2014, the S&P 500 Index advanced 7.14%. It appears that much of the market volatility during the year can be attributed to heightened international tensions. In particular, the Russian annexation of Ukraine’s Crimean Peninsula and increased tensions in Iraq were cause for concern.
On the domestic front, subdued economic and employment reports slowed stocks’ progress early in the new year, although much of the weakness seemed to dissipate as the year’s unusually harsh winter subsided. And despite initial reactions to the idea, when the U.S. Federal Reserve began tapering its quantitative-easing program in January by reducing its bond purchases by $10 billion a month, the markets took the policy change in stride.
Despite a rough start to the year for financial markets, the global economy seems to be settling into a slow-but-steady recovery. While first-quarter U.S. gross domestic product (GDP) growth was disappointing at -2.9%, U.S. consumer spending, which is a significant contributor toward economic growth, rose by 3% during the quarter. It appears that Europe is also maintaining its own recovery: The International Monetary Fund projects that Europe’s full-year GDP growth may breach positive territory for the first time since 2011.
The impact of international affairs on stocks so far this year is an important reminder to stay informed about both domestic and international economic developments, and any effects they may have on your individual investment goals. If you have not already had a mid-year review of your portfolio, it may be a good time to meet with your financial advisor to review your progress and make certain your investments are prepared for all market environments:
| • | Is your portfolio properly diversified with an appropriate mix of stocks and bonds? |
| • | Is your portfolio positioned to take advantage of the global economic recovery, with investments in both domestic and international holdings? |
| • | Are your investments still in line with your risk tolerance and investment time horizon? |
Your financial professional can help you choose options within our fund family to help you reach your investment goals with confidence.
Thank you again for investing with Hartford HLS Funds.
James Davey
President
Hartford HLS Funds
1 The S&P 500 Index is a market capitalization-weighted price index composed of 500 widely held common stocks.
2The Dow Jones Industrial Average is an unmanaged, price-weighted index of 30 of the largest, most widely held stocks traded on the New York Stock Exchange.
Hartford International Opportunities HLS Fund
Table of Contents
This report is prepared for the general information of contract owners and qualified retirement plan participants. It is not an offer of contracts or of qualified retirement plans. It should not be used in connection with any offer, except in conjunction with the appropriate product prospectus which contains all pertinent information including the applicable sales, administrative and other charges.
The views expressed in the Fund’s Manager Discussion under “Why did the Fund perform this way?” and “What is the outlook?” are views of the Fund’s sub-adviser and portfolio management team through the end of the period and are subject to change based on market and other conditions. The Fund’s Manager Discussion is for informational purposes only and does not represent an offer, recommendation or solicitation to buy, hold or sell any security. The specific securities identified and described, if any, do not represent all of the securities purchased or sold and you should not assume that investments in the securities identified and discussed will be profitable.
Hartford International Opportunities HLS Fund inception 07/02/1990
(sub-advised by Wellington Management Company, LLP)
| Investment objective – The Fund seeks long-term growth of capital. |
Performance Overview 6/30/04 - 6/30/14
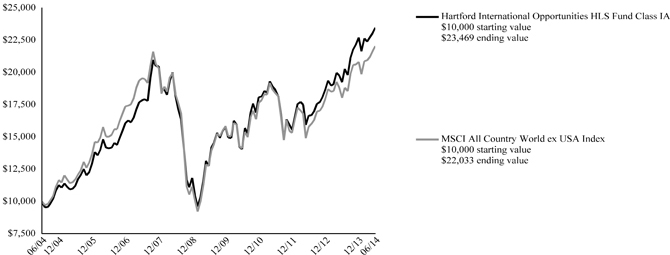
The chart above represents the hypothetical growth of a $10,000 investment in Class IA. Growth result in classes other than Class IA will vary from what is seen above due to differences in the expenses charged to those share classes.
Average Annual Total Returns (as of 6/30/14)
| | 6 Month† | 1 Year | 5 Years | 10 Years |
| International Opportunities IA | 3.33% | 21.99% | 12.96% | 8.91% |
| International Opportunities IB | 3.22% | 21.74% | 12.69% | 8.64% |
| MSCI All Country World ex USA Index | 5.89% | 22.27% | 11.59% | 8.22% |
PERFORMANCE DATA QUOTED REPRESENTS PAST PERFORMANCE AND DOES NOT GUARANTEE FUTURE RESULTS. The investment return and principal value of the investment will fluctuate so that investors’ shares, when redeemed, may be worth more or less than their original cost. Current performance may be lower or higher than the performance data quoted. To obtain performance data current to the most recent month-end, please visit our website www.hartfordfunds.com.
Total returns presented above were calculated using the Fund’s net asset value available to shareholders for sale or redemption of Fund shares on June 30, 2014, which may exclude investment transactions as of this date. All share class returns assume the reinvestment of all distributions at net asset value and the deduction of all fund expenses.
MSCI All Country World ex USA Index is a broad-based, unmanaged, market capitalization weighted, total return index that measures the performance of both developed and emerging stock markets, excluding the U.S. The index is calculated to exclude companies and share classes which cannot be freely purchased by foreigners.
The index is unmanaged, and its results include reinvested dividends and/or distributions, but do not reflect the effect of sales charges, commissions, expenses or taxes.
You cannot invest directly in an index.
As shown in the Fund's current prospectus dated May 1, 2014, the total annual operating expense ratios for Class IA and Class IB were 0.74% and 0.99%, respectively. Actual expenses may be higher. Please see the accompanying Financial Highlights for expense ratios for the six-month period ended June 30, 2014.
The chart and table do not reflect the deductions of taxes, sales charges or other fees which may be applied at the variable life insurance, variable annuity or qualified retirement plan product level. Any such additional sales charges or other fees or expenses would lower the contract’s or plan’s performance.
All investments are subject to risk including the possible loss of principal. For a discussion of the Fund’s risks, please see the Main Risks section of this report. For more detailed information on the risks associated with an investment in the Fund, please see the prospectus.
| Hartford International Opportunities HLS Fund |
| Manager Discussion |
| June 30, 2014 (Unaudited) |
| Portfolio Managers | | |
| Nicolas M. Choumenkovitch | | Tara Connolly Stilwell, CFA |
| Senior Vice President and Equity Portfolio Manager | | Vice President and Equity Portfolio Manager |
How did the Fund perform?
The Class IA of the Hartford International Opportunities HLS Fund returned 3.33% for the six-month period ended June 30, 2014, underperforming the Fund’s benchmark, the MSCI All Country World ex-USA Index, which returned 5.89% for the same period. The Fund also underperformed the 3.48% average return of the Lipper International Growth Variable Products-Underlying Funds Fund peer group, a group of funds with investment strategies similar to those of the Fund.
Why did the Fund perform this way?
Global equities surged during the period. Despite ongoing geopolitical tensions surrounding the crisis in Ukraine, concerns about a Chinese growth slowdown, and unsettling economic and political developments in several other emerging market countries, the five-year-old stock rally continued in the first half of 2014. Robust merger and acquisition activity, along with continued accommodative monetary policy from central banks around the globe, aided bullish sentiment in the second half of the period. The European Central Bank (ECB) introduced a set of unconventional monetary policy measures to fight disinflationary forces and rekindle growth in the Eurozone. In addition, the People's Bank of China announced a cut in the reserve requirement ratio for major banks to stimulate lending and support growth. Emerging market equities modestly underperformed their developed market counterparts despite seeing strong gains in the second half of the period.
Non-U.S. stocks, as measured by the MSCI AC World ex-USA Index, performed well during the period (+5.89%). All ten sectors in the index posted positive returns, led by Utilities (+14%), Energy (+13%), and Healthcare (+12%), while Telecommunication Services (+2%), Consumer Discretionary (+3%), and Financials (+4%) lagged on a relative basis.
The Fund’s underperformance versus the MSCI All Country World ex-USA Index was primarily due to weak stock selection, particularly within the Financials, Industrials, and Energy sectors. This was modestly offset by strong selection in Information Technology and Healthcare. Allocation among sectors, a result of the bottom-up stock selection process, contributed modestly to relative returns, largely due to an overweight to Healthcare and an underweight to Telecommunication Services. A modest cash position detracted from relative performance in an upward trending environment.
The largest absolute and relative detractors from returns relative to the MSCI All Country World ex-USA Index were Julius Baer Group (Financials), Rolls-Royce (Industrials), and Sberbank of Russia (Financials). Shares of Julius Baer Group, a private Swiss bank franchise, underperformed due to speculation that heightened regulatory fines for other financial firms are a proxy for what the company may have to pay to settle charges it helped its customers evade taxes. Shares of Rolls-Royce, a U.K.-based manufacturer of engines and power systems for aircraft, particularly those used for long-haul routes, underperformed as margin improvements are taking longer than the market anticipated. Shares of Sberbank of Russa, a leading commercial bank and lending institution in Russia, fell amid a weakening local economy and currency combined with economic sanctions levied against Russia for its role in fomenting the crisis in Ukraine. At the end of the period, we had fully exited the position.
Top contributors to performance relative to the MSCI All Country World ex-USA Index during the period included AstraZeneca (Healthcare), NXP Semiconductors (Information Technology), and SK Hynix (Information Technology). Shares of AstraZeneca, a U.K.-based multinational pharmaceutical company focused on cardiovascular, gastrointestinal, respiratory, oncology, and neuroscience treatments, rose over the period as the market began to appreciate the potential for immuno-oncology treatments, in which the company has been investing, to completely change the way cancer is treated. Shares of NXP Semiconductors, a Netherlands-based semiconductor company, outperformed as the company’s earnings results exceeded expectations as the market appreciated the company’s free cash flow, moves to buy back shares, and competitive advantage in sizable growth markets, such as identification and smart mobile businesses. Shares of SK Hynix, the world's second largest memory chip maker and supplier of DRAM and flash memory chips based in South Korea, outperformed as recent quarterly earnings results exceeded consensus expectations and investors began to appreciate that DRAM pricing is more resilient than originally expected and demand remains strong. Novartis (Healthcare) also contributed to performance on an absolute basis.
Derivatives are not used in a significant manner in this Fund and did not have a material impact on performance during the period.
What is the outlook?
As developed economies continue to improve, we do not see looming structural change or obvious dislocations but slow growth should remain steady in a low interest rate environment. We continue to look for opportunities in what we view as undervalued regions and sectors. Emerging markets, however, appear to be in the opposite cycle, as after two years of underperformance, they now appear to be closer to an inflection point of improvement.
| Hartford International Opportunities HLS Fund |
| Manager Discussion – (continued) |
| June 30, 2014 (Unaudited) |
As is consistent with our investment approach, we continue to look for opportunities at a company-by-company level, focusing on those companies that we believe can deliver improvements in return on invested capital (ROIC) or sustain ROIC for longer than the market anticipates.
At the end of the period, relative to the MSCI All Country World ex-USA Index we were most overweight Healthcare, Industrials, and Information Technology, and most underweight Financials, Materials, and Consumer Staples. On a regional basis, we ended the period with an overweight to select European countries, including Belgium, France, Italy, and Switzerland, and underweight positions in Australia, Canada, China and Germany.
Diversification by Sector
as of June 30, 2014
| Sector | | Percentage of
Net Assets | |
| Equity Securities | | | | |
| Consumer Discretionary | | | 9.8 | % |
| Consumer Staples | | | 8.1 | |
| Energy | | | 9.7 | |
| Financials | | | 20.3 | |
| Health Care | | | 15.4 | |
| Industrials | | | 13.0 | |
| Information Technology | | | 8.9 | |
| Materials | | | 6.3 | |
| Services | | | 4.2 | |
| Utilities | | | 2.8 | |
| Total | | | 98.5 | % |
| Short-Term Investments | | | 0.8 | |
| Other Assets and Liabilities | | | 0.7 | |
| Total | | | 100.0 | % |
A sector may be comprised of several industries. For Fund compliance purposes, the Fund may not use the same classification system and these sector classifications are used for reporting ease.
Currency Concentration of Securities
as of June 30, 2014
| | | Percentage of | |
| Description | | Net Assets | |
| Brazilian Real | | | 0.1 | % |
| British Pound | | | 17.1 | |
| Canadian Dollar | | | 4.3 | |
| Danish Kroner | | | 0.2 | |
| Euro | | | 29.3 | |
| Hong Kong Dollar | | | 2.9 | |
| Indian Rupee | | | 1.1 | |
| Japanese Yen | | | 24.2 | |
| Mexican New Peso | | | 0.2 | |
| Norwegian Krone | | | 0.1 | |
| Republic of Korea Won | | | 0.7 | |
| Swedish Krona | | | 1.4 | |
| Swiss Franc | | | 9.6 | |
| Taiwanese Dollar | | | 1.9 | |
| United States Dollar | | | 6.2 | |
| Other Assets and Liabilities | | | 0.7 | |
| Total | | | 100.0 | % |
| Hartford International Opportunities HLS Fund |
| Schedule of Investments |
| June 30, 2014 (Unaudited) |
| (000’s Omitted) |
| Shares or Principal Amount | | Market Value ╪ | |
| Common Stocks - 97.2% | | | | |
| | | | | Austria - 0.2% | | | | |
| | 101 | | | Erste Group Bank AG | | $ | 3,253 | |
| | | | | | | | | |
| | | | | Belgium - 4.0% | | | | |
| | 425 | | | Anheuser-Busch InBev N.V. | | | 48,821 | |
| | 293 | | | Umicore S.A. | | | 13,654 | |
| | | | | | | | 62,475 | |
| | | | | Brazil - 0.1% | | | | |
| | 120 | | | Mills Estruturas e Servicos de Engenharia S.A. | | | 1,416 | |
| | | | | | | | | |
| | | | | Canada - 3.8% | | | | |
| | 974 | | | Air Canada Class A ● | | | 8,684 | |
| | 594 | | | Cameco Corp. | | | 11,648 | |
| | 246 | | | Canadian National Railway Co. | | | 16,003 | |
| | 430 | | | Tim Hortons, Inc. | | | 23,548 | |
| | | | | | | | 59,883 | |
| | | | | China - 4.4% | | | | |
| | 55 | | | Baidu, Inc. ADR ● | | | 10,331 | |
| | 1,366 | | | ENN Energy Holdings Ltd. | | | 9,809 | |
| | 358 | | | Imperial Oil Ltd. | | | 18,843 | |
| | 11,302 | | | Lenovo Group Ltd. | | | 15,440 | |
| | 11,931 | | | PetroChina Co., Ltd. | | | 15,009 | |
| | | | | | | | 69,432 | |
| | | | | Denmark - 0.2% | | | | |
| | 105 | | | H. Lundbeck A/S | | | 2,577 | |
| | | | | | | | | |
| | | | | Finland - 0.4% | | | | |
| | 143 | | | Kone Oyj Class B | | | 5,965 | |
| | | | | | | | | |
| | | | | France - 12.9% | | | | |
| | 49 | | | Accor S.A. | | | 2,538 | |
| | 304 | | | Air Liquide | | | 41,037 | |
| | 169 | | | AtoS | | | 14,042 | |
| | 221 | | | BNP Paribas | | | 15,042 | |
| | 147 | | | Capital Gemini S.A. | | | 10,503 | |
| | 156 | | | Cie Generale d'Optique Essilor International S.A. | | | 16,561 | |
| | 283 | | | Groupe Eurotunnel S.A. | | | 3,832 | |
| | 980 | | | Orange S.A. | | | 15,502 | |
| | 191 | | | Peugeot S.A. | | | 2,827 | |
| | 944 | | | Rexel S.A. | | | 22,087 | |
| | 332 | | | Schneider Electric S.A. | | | 31,317 | |
| | 114 | | | Societe Generale Class A | | | 5,985 | |
| | 18 | | | Technip S.A. | | | 1,980 | |
| | 65 | | | Unibail Rodamco REIT | | | 18,916 | |
| | | | | | | | 202,169 | |
| | | | | Germany - 2.2% | | | | |
| | 48 | | | Brenntag AG | | | 8,608 | |
| | 47 | | | Continental AG | | | 10,925 | |
| | 682 | | | Deutsche Lufthansa AG | | | 14,637 | |
| | | | | | | | 34,170 | |
| | | | | Greece - 0.7% | | | | |
| | 11,577 | | | Alpha Bank A.E. ● | | | 10,765 | |
| | | | | | | | | |
| | | | | Hong Kong - 0.3% | | | | |
| | 1,349 | | | MGM China Holdings Ltd. | | | 4,680 | |
| | | | | | | | | |
| | | | | India - 1.1% | | | | |
| | 891 | | | ITC Ltd. | | | 4,817 | |
| | 634 | | | Reliance Industries Ltd. | | | 10,712 | |
| | 58 | | | United Spirits Ltd. | | | 2,323 | |
| | | | | | | | 17,852 | |
| | | | | Ireland - 2.6% | | | | |
| | 130 | | | Covidien plc | | | 11,732 | |
| | 1,124 | | | CRH plc | | | 28,805 | |
| | | | | | | | 40,537 | |
| | | | | Italy - 4.6% | | | | |
| | 1,280 | | | Assicurazioni Generali S.p.A. | | | 28,021 | |
| | 333 | | | Banca Generali S.p.A. | | | 9,146 | |
| | 1,303 | | | FinecoBank S.p.A. ● | | | 6,602 | |
| | 1,463 | | | Intesa Sanpaolo S.p.A. | | | 4,514 | |
| | 3,897 | | | Snam S.p.A. | | | 23,469 | |
| | | | | | | | 71,752 | |
| | | | | Japan - 24.2% | | | | |
| | 547 | | | AEON Co., Ltd. | | | 6,735 | |
| | 114 | | | AEON Mall Co., Ltd. | | | 3,002 | |
| | 328 | | | Aisin Seiki Co., Ltd. | | | 13,036 | |
| | 563 | | | Asahi Group Holdings Ltd. | | | 17,689 | |
| | 140 | | | Asics Corp. | | | 3,278 | |
| | 420 | | | Bank of Yokohama Ltd. | | | 2,420 | |
| | 416 | | | Bridgestone Corp. | | | 14,553 | |
| | 112 | | | Daito Trust Construction Co., Ltd. | | | 13,204 | |
| | 456 | | | Daiwa House Industry Co., Ltd. | | | 9,453 | |
| | 265 | | | Eisai Co., Ltd. | | | 11,121 | |
| | 2,536 | | | Isuzu Motors Ltd. | | | 16,793 | |
| | 316 | | | Japan Exchange Group, Inc. | | | 7,781 | |
| | 178 | | | Kansai Electric Power Co., Inc. | | | 1,674 | |
| | 243 | | | KDDI Corp. | | | 14,824 | |
| | 212 | | | Kyushu Electric Power Co., Inc. | | | 2,388 | |
| | 765 | | | M3, Inc. | | | 12,183 | |
| | 1,077 | | | Mitsubishi Electric Corp. | | | 13,307 | |
| | 4,322 | | | Mitsubishi UFJ Financial Group, Inc. | | | 26,531 | |
| | 394 | | | Mitsui Fudosan Co., Ltd. | | | 13,305 | |
| | 314 | | | Nippon Telegraph & Telephone Corp. | | | 19,560 | |
| | 254 | | | Nomura Research Institute Ltd. | | | 8,012 | |
| | 333 | | | Olympus Corp. | | | 11,440 | |
| | 201 | | | Ono Pharmaceutical Co., Ltd. | | | 17,695 | |
| | 1,371 | | | ORIX Corp. | | | 22,739 | |
| | 1,381 | | | Rakuten, Inc. | | | 17,858 | |
| | 180 | | | Rohm Co., Ltd. | | | 10,312 | |
| | 458 | | | Seven & I Holdings Co., Ltd. | | | 19,310 | |
| | 129 | | | Shikoku Electric Power Co. | | | 1,799 | |
| | 1,177 | | | T&D Holdings, Inc. | | | 16,011 | |
| | 265 | | | Takeda Pharmaceutical Co., Ltd. | | | 12,309 | |
| | 158 | | | THK Co., Ltd. | | | 3,723 | |
| | 3,482 | | | Toshiba Corp. | | | 16,276 | |
| | | | | | | | 380,321 | |
| | | | | Marshall Islands - 0.1% | | | | |
| | 180 | | | Tanker Investments Ltd. ● | | | 2,008 | |
| | | | | | | | | |
| | | | | Mexico - 1.2% | | | | |
| | 1,167 | | | Cemex S.A.B. de C.V. ADR ● | | | 15,443 | |
| | 842 | | | Fibra Uno Administracion S.A. REIT | | | 2,952 | |
| | | | | | | | 18,395 | |
| | | | | Netherlands - 3.7% | | | | |
| | 1,565 | | | ING Groep N.V. ● | | | 21,967 | |
| | 4,334 | | | Koninklijke (Royal) KPN N.V. | | | 15,801 | |
| | 299 | | | NXP Semiconductors N.V. ● | | | 19,807 | |
| | | | | | | | 57,575 | |
The accompanying notes are an integral part of these financial statements.
| Hartford International Opportunities HLS Fund |
| Schedule of Investments – (continued) |
| June 30, 2014 (Unaudited) |
| (000’s Omitted) |
| Shares or Principal Amount | | Market Value ╪ | |
| Common Stocks - 97.2% - (continued) | | | | |
| | | | | Panama - 0.3% | | | | |
| | 155 | | | Avianca Holdings S.A. ADR | | $ | 2,480 | |
| | 13 | | | Copa Holdings S.A. Class A | | | 1,897 | |
| | | | | | | | 4,377 | |
| | | | | Portugal - 0.6% | | | | |
| | 562 | | | Galp Energia SGPS S.A. | | | 10,306 | |
| | | | | | | | | |
| | | | | Romania - 0.3% | | | | |
| | 300 | | | Electrica, S.A. ■●☼ | | | 4,091 | |
| | | | | | | | | |
| | | | | South Korea - 0.7% | | | | |
| | 243 | | | Hynix Semiconductor, Inc. | | | 11,677 | |
| | | | | | | | | |
| | | | | Sweden - 1.4% | | | | |
| | 440 | | | Assa Abloy Ab | | | 22,372 | |
| | | | | | | | | |
| | | | | Switzerland - 9.5% | | | | |
| | 131 | | | Adecco S.A. | | | 10,815 | |
| | 42 | | | Compagnie Financiere Richemont S.A. | | | 4,363 | |
| | 738 | | | Julius Baer Group Ltd. | | | 30,412 | |
| | 565 | | | Novartis AG | | | 51,173 | |
| | 110 | | | Roche Holding AG | | | 32,871 | |
| | 1,121 | | | UBS AG | | | 20,547 | |
| | | | | | | | 150,181 | |
| | | | | Taiwan - 1.9% | | | | |
| | 7,182 | | | Taiwan Semiconductor Manufacturing Co., Ltd. | | | 30,391 | |
| | | | | | | | | |
| | | | | United Kingdom - 15.3% | | | | |
| | 227 | | | Al Noor Hospitals Group | | | 3,969 | |
| | 704 | | | AstraZeneca plc | | | 52,358 | |
| | 1,884 | | | BG Group plc | | | 39,755 | |
| | 5,404 | | | BP plc | | | 47,588 | |
| | 1,247 | | | British Sky Broadcasting Group plc ‡ | | | 19,290 | |
| | 73 | | | Derwent London plc REIT | | | 3,340 | |
| | 940 | | | Diageo Capital plc | | | 29,925 | |
| | 1,459 | | | Direct Line Insurance Group plc | | | 6,734 | |
| | 316 | | | Great Portland Est | | | 3,476 | |
| | 673 | | | NMC Health plc | | | 5,762 | |
| | 515 | | | Rolls-Royce Holdings plc | | | 9,407 | |
| | 984 | | | Royal Mail plc ● | | | 8,398 | |
| | 238 | | | Schroders plc | | | 10,200 | |
| | | | | | | | 240,202 | |
| | | | | United States - 0.5% | | | | |
| | 279 | | | Markit, Ltd. ● | | | 7,535 | |
| | | | | | | | | |
| | | | | Total Common Stocks | | | | |
| | | | | (Cost $1,343,813) | | $ | 1,526,357 | |
| | | | | | | | | |
| Preferred Stocks - 1.3% | | | | |
| | | | | Germany - 1.3% | | | | |
| | 46 | | | ProSieben Sat.1 Media AG | | $ | 2,052 | |
| | 73 | | | Volkswagen AG N.V. | | | 19,205 | |
| | | | | | | | 21,257 | |
| | | | | Total Preferred Stocks | | | | |
| | | | | (Cost $18,994) | | $ | 21,257 | |
| | | | | | | | | |
| | | | | Total Long-Term Investments | | | | |
| | | | | (Cost $1,362,807) | | $ | 1,547,614 | |
| | | | | | | | | | | | | |
| Short-Term Investments - 0.8% | | | | | | | | |
| | | | | Repurchase Agreements - 0.8% | | | | | | | | |
| | | | | Bank of America Merrill Lynch TriParty Repurchase
Agreement (maturing on 07/01/2014 in the
amount of $1,041, collateralized by FHLMC
2.23% - 5.99%, 2030 - 2044, FNMA 2.31% -
6.34%, 2020 - 2042, value of $1,062) | | | | | | | | |
| $ | 1,041 | | | 0.10%, 6/30/2014 | | | | | | $ | 1,041 | |
| | | | | Bank of Montreal TriParty Repurchase Agreement
(maturing on 07/01/2014 in the amount of
$1,591, collateralized by U.S. Treasury Bill
0.13%, 2015, U.S. Treasury Bond 2.75% -
10.63%, 2015 - 2044, U.S. Treasury Note 0.13%
- 4.50%, 2014 - 2024, value of $1,623) | | | | | | | | |
| | 1,591 | | | 0.09%, 6/30/2014 | | | | | | | 1,591 | |
| | | | | Bank of Montreal TriParty Repurchase Agreement
(maturing on 07/01/2014 in the amount of $678,
collateralized by FHLMC 2.00% - 5.50%, 2018 -
2041, FNMA 2.00% - 4.50%, 2026 - 2042,
GNMA 3.00% - 4.00%, 2042 - 2043, U.S.
Treasury Bill 0.05%, 2014, U.S. Treasury Note
0.75%, 2018, value of $692) | | | | | | | | |
| | 678 | | | 0.11%, 6/30/2014 | | | | | | | 678 | |
| | | | | Barclays Capital TriParty Repurchase Agreement
(maturing on 07/01/2014 in the amount of $628,
collateralized by U.S. Treasury Note 0.63%
- 0.88%, 2018 - 2019, value of $640) | | | | | | | | |
| | 627 | | | 0.07%, 6/30/2014 | | | | | | | 627 | |
| | | | | Citigroup Global Markets, Inc. TriParty Repurchase
Agreement (maturing on 07/01/2014 in the
amount of $1,446, collateralized by U.S.
Treasury Bond 4.38% - 7.50%, 2016 - 2040,
U.S. Treasury Note 0.50% - 3.00%, 2014 - 2020,
value of $1,475) | | | | | | | | |
| | 1,446 | | | 0.06%, 6/30/2014 | | | | | | | 1,446 | |
| | | | | RBS Securities Inc. TriParty Repurchase Agreement
(maturing on 07/01/2014 in the
amount of $2,216, collateralized by U.S.
Treasury Note 0.38% - 3.13%, 2015 - 2022,
value of $2,260) | | | | | | | | |
| | 2,216 | | | 0.08%, 6/30/2014 | | | | | | | 2,216 | |
| | | | | TD Securities TriParty Repurchase Agreement
(maturing on 07/01/2014 in the amount of
$4,612, collateralized by FHLMC 3.50% -
4.00%, 2026 - 2044, FNMA 2.50% - 5.00%,
2025 - 2043, value of $4,704) | | | | | | | | |
| | 4,612 | | | 0.11%, 6/30/2014 | | | | | | | 4,612 | |
| | | | | UBS Securities Repurchase Agreement (maturing
on 07/01/2014 in the amount of $19,
collateralized by U.S. Treasury Note 2.13%,
2020, value of $19) | | | | | | | | |
| | 19 | | | 0.05%, 6/30/2014 | | | | | | | 19 | |
| | | | | | | | | | | | 12,230 | |
| | | | | Total Short-Term Investments | | | | | | | | |
| | | | | (Cost $12,230) | | | | | | $ | 12,230 | |
| | | | | | | | | | | | | |
| | | | | Total Investments | | | | | | | | |
| | | | | (Cost $1,375,037) ▲ | | | 99.3 | % | | $ | 1,559,844 | |
| | | | | Other Assets and Liabilities | | | 0.7 | % | | | 10,790 | |
| | | | | Total Net Assets | | | 100.0 | % | | $ | 1,570,634 | |
The accompanying notes are an integral part of these financial statements.
| Hartford International Opportunities HLS Fund |
| Schedule of Investments – (continued) |
| June 30, 2014 (Unaudited) |
| (000’s Omitted) |
| Note: | Percentage of investments as shown is the ratio of the total market value to total net assets. |
Prices of foreign equities that are principally traded on certain foreign markets may be adjusted daily pursuant to a fair value pricing service approved by the Board of Directors in order to reflect an adjustment for factors occurring after the close of certain foreign markets but before the close of the New York Stock Exchange.
| ▲ | At June 30, 2014, the cost of securities for federal income tax purposes was $1,384,399 and the aggregate gross unrealized appreciation and depreciation based on that cost were: |
| Unrealized Appreciation | | $ | 196,291 | |
| Unrealized Depreciation | | | (20,846 | ) |
| Net Unrealized Appreciation | | $ | 175,445 | |
| ■ | Securities issued within terms of a private placement memorandum, exempt from registration under Rule 144A under the Securities Act of 1933, as amended, and may be sold only to qualified institutional buyers. Unless otherwise indicated, these holdings are determined to be liquid. At June 30, 2014, the aggregate value of these securities was $4,091, which represents 0.3% of total net assets. |
| ☼ | This security, or a portion of this security, was purchased on a when-issued, delayed-delivery or delayed-draw basis. The cost of these securities was $4,091 at June 30, 2014. |
| ‡ | This security, or a portion of this security, has been segregated to cover funding requirements on investment transactions settling in the future. |
Foreign Currency Contracts Outstanding at June 30, 2014
| | | | | | | | | | | | | | | Unrealized Appreciation/(Depreciation) | |
| Currency | | Buy / Sell | | Delivery Date | | Counterparty | | Contract Amount | | | Market Value ╪ | | | Asset | | | Liability | |
| CAD | | Sell | | 07/07/2014 | | BCLY | | $ | 1,647 | | | $ | 1,648 | | | $ | – | | | $ | (1 | ) |
| CHF | | Sell | | 07/03/2014 | | CBK | | | 3,414 | | | | 3,415 | | | | – | | | | (1 | ) |
| EUR | | Buy | | 07/02/2014 | | CBK | | | 6,578 | | | | 6,602 | | | | 24 | | | | – | |
| EUR | | Buy | | 07/01/2014 | | CSFB | | | 790 | | | | 795 | | | | 5 | | | | – | |
| EUR | | Sell | | 07/02/2014 | | BCLY | | | 1,092 | | | | 1,092 | | | | – | | | | – | |
| EUR | | Sell | | 07/03/2014 | | BCLY | | | 4,813 | | | | 4,812 | | | | 1 | | | | – | |
| GBP | | Sell | | 07/03/2014 | | CBK | | | 5,335 | | | | 5,337 | | | | – | | | | (2 | ) |
| JPY | | Sell | | 07/03/2014 | | BOA | | | 1,183 | | | | 1,184 | | | | – | | | | (1 | ) |
| MXN | | Sell | | 07/03/2014 | | BCLY | | | 72 | | | | 72 | | | | – | | | | – | |
| NOK | | Sell | | 07/03/2014 | | BCLY | | | 49 | | | | 49 | | | | – | | | | – | |
| SEK | | Buy | | 07/03/2014 | | BCLY | | | 1,213 | | | | 1,214 | | | | 1 | | | | – | |
| Total | | | | | | | | | | | | | | | | $ | 31 | | | $ | (5 | ) |
| ╪ | See Significant Accounting Policies of accompanying Notes to Financial Statements regarding valuation of securities. |
The accompanying notes are an integral part of these financial statements.
| Hartford International Opportunities HLS Fund |
| Schedule of Investments – (continued) |
| June 30, 2014 (Unaudited) |
| (000’s Omitted) |
| GLOSSARY: (abbreviations used in preceding Schedule of Investments) | |
| | | |
| Counterparty Abbreviations: | |
| BCLY | Barclays | |
| BOA | Banc of America Securities LLC | |
| CBK | Citibank NA | |
| CSFB | Credit Suisse First Boston Corp. | |
| | | |
| Currency Abbreviations: | |
| CAD | Canadian Dollar | |
| CHF | Swiss Franc | |
| EUR | EURO | |
| GBP | British Pound | |
| JPY | Japanese Yen | |
| MXN | Mexican New Peso | |
| NOK | Norwegian Krone | |
| SEK | Swedish Krona | |
| | | |
| Other Abbreviations: | |
| ADR | American Depositary Receipt | |
| FHLMC | Federal Home Loan Mortgage Corp. | |
| FNMA | Federal National Mortgage Association | |
| GNMA | Government National Mortgage Association | |
| REIT | Real Estate Investment Trust | |
The accompanying notes are an integral part of these financial statements.
| Hartford International Opportunities HLS Fund |
| Investment Valuation Hierarchy Level Summary |
| June 30, 2014 (Unaudited) |
| (000’s Omitted) |
| | | Total | | | Level 1 ♦ | | | Level 2 ♦ | | | Level 3 | |
| Assets: | | | | | | | | | | | | | | | | |
| Common Stocks | | | | | | | | | | | | | | | | |
| Austria | | $ | 3,253 | | | $ | – | | | $ | 3,253 | | | $ | – | |
| Belgium | | | 62,475 | | | | – | | | | 62,475 | | | | – | |
| Brazil | | | 1,416 | | | | 1,416 | | | | – | | | | – | |
| Canada | | | 59,883 | | | | 59,883 | | | | – | | | | – | |
| China | | | 69,432 | | | | 29,174 | | | | 40,258 | | | | – | |
| Denmark | | | 2,577 | | | | 2,577 | | | | – | | | | – | |
| Finland | | | 5,965 | | | | – | | | | 5,965 | | | | – | |
| France | | | 202,169 | | | | 22,087 | | | | 180,082 | | | | – | |
| Germany | | | 34,170 | | | | – | | | | 34,170 | | | | – | |
| Greece | | | 10,765 | | | | – | | | | 10,765 | | | | – | |
| Hong Kong | | | 4,680 | | | | – | | | | 4,680 | | | | – | |
| India | | | 17,852 | | | | 2,323 | | | | 15,529 | | | | – | |
| Ireland | | | 40,537 | | | | 11,732 | | | | 28,805 | | | | – | |
| Italy | | | 71,752 | | | | – | | | | 71,752 | | | | – | |
| Japan | | | 380,321 | | | | – | | | | 380,321 | | | | – | |
| Marshall Islands | | | 2,008 | | | | 2,008 | | | | – | | | | – | |
| Mexico | | | 18,395 | | | | 18,395 | | | | – | | | | – | |
| Netherlands | | | 57,575 | | | | 19,807 | | | | 37,768 | | | | – | |
| Panama | | | 4,377 | | | | 4,377 | | | | – | | | | – | |
| Portugal | | | 10,306 | | | | – | | | | 10,306 | | | | – | |
| Romania | | | 4,091 | | | | 4,091 | | | | – | | | | – | |
| South Korea | | | 11,677 | | | | – | | | | 11,677 | | | | – | |
| Sweden | | | 22,372 | | | | – | | | | 22,372 | | | | – | |
| Switzerland | | | 150,181 | | | | – | | | | 150,181 | | | | – | |
| Taiwan | | | 30,391 | | | | – | | | | 30,391 | | | | – | |
| United Kingdom | | | 240,202 | | | | 29,021 | | | | 211,181 | | | | – | |
| United States | | | 7,535 | | | | 7,535 | | | | – | | | | – | |
| Total | | $ | 1,526,357 | | | $ | 214,426 | | | $ | 1,311,931 | | | $ | – | |
| Preferred Stocks | | | 21,257 | | | | – | | | | 21,257 | | | | – | |
| Short-Term Investments | | | 12,230 | | | | – | | | | 12,230 | | | | – | |
| Total | | $ | 1,559,844 | | | $ | 214,426 | | | $ | 1,345,418 | | | $ | – | |
| Foreign Currency Contracts* | | $ | 31 | | | $ | – | | | $ | 31 | | | $ | – | |
| Total | | $ | 31 | | | $ | – | | | $ | 31 | | | $ | – | |
| Liabilities: | | | | | | | | | | | | | | | | |
| Foreign Currency Contracts* | | $ | 5 | | | $ | – | | | $ | 5 | | | $ | – | |
| Total | | $ | 5 | | | $ | – | | | $ | 5 | | | $ | – | |
| ♦ | For the six-month period ended June 30, 2014, investments valued at $9,218 were transferred from Level 1 to Level 2, and investments valued at $27,981 were transferred from Level 2 to Level 1. Investments are transferred between Level 1 and Level 2 for a variety of reasons including, but not limited to: |
| 1) | Foreign equities for which a fair value price is more representative of exit value than the local market close (transfer into Level 2). Foreign equities for which the local market close is more representative of exit value (transfer into Level 1). |
| 2) | U.S. Treasury securities that no longer represent the most recent issue (transfer into Level 2). |
| 3) | Equity investments with no observable trading but a bid or mean price is used (transfer into Level 2). Equity investments using observable quoted prices in an active market (transfer into Level 1). |
| * | Derivative instruments (excluding purchased and written options, if applicable) are valued at the unrealized appreciation/depreciation on the investments. |
| Note: | For purposes of reporting transfers between different hierarchy levels, both transfers in and out of each level, as applicable, are shown as if they occurred at the beginning of the period. |
The accompanying notes are an integral part of these financial statements.
| Hartford International Opportunities HLS Fund |
| Statement of Assets and Liabilities |
| June 30, 2014 (Unaudited) |
| (000’s Omitted) |
| Assets: | | | | |
| Investments in securities, at market value (cost $1,375,037) | | $ | 1,559,844 | |
| Foreign currency on deposit with custodian (cost $620) | | | 620 | |
| Unrealized appreciation on foreign currency contracts | | | 31 | |
| Receivables: | | | | |
| Investment securities sold | | | 26,664 | |
| Fund shares sold | | | 321 | |
| Dividends and interest | | | 3,884 | |
| Other assets | | | 3 | |
| Total assets | | | 1,591,367 | |
| Liabilities: | | | | |
| Unrealized depreciation on foreign currency contracts | | | 5 | |
| Bank overdraft | | | 131 | |
| Payables: | | | | |
| Investment securities purchased | | | 15,553 | |
| Fund shares redeemed | | | 4,638 | |
| Investment management fees | | | 147 | |
| Distribution fees | | | 8 | |
| Accrued expenses | | | 251 | |
| Total liabilities | | | 20,733 | |
| Net assets | | $ | 1,570,634 | |
| Summary of Net Assets: | | | | |
| Capital stock and paid-in-capital | | $ | 1,778,735 | |
| Undistributed net investment income | | | 42,557 | |
| Accumulated net realized loss | | | (435,502 | ) |
| Unrealized appreciation of investments and the translations of assets and liabilities denominated in foreign currency | | | 184,844 | |
| Net assets | | $ | 1,570,634 | |
| Shares authorized | | | 2,625,000 | |
| Par value | | $ | 0.001 | |
| Class IA: Net asset value per share | | $ | 15.53 | |
| Shares outstanding | | | 86,828 | |
| Net assets | | $ | 1,348,784 | |
| Class IB: Net asset value per share | | $ | 15.69 | |
| Shares outstanding | | | 14,144 | |
| Net assets | | $ | 221,850 | |
The accompanying notes are an integral part of these financial statements.
| Hartford International Opportunities HLS Fund |
| Statement of Operations |
| For the Six-Month Period Ended June 30, 2014 (Unaudited) |
| (000’s Omitted) |
| Investment Income: | | | | |
| Dividends | | $ | 25,773 | |
| Interest | | | 7 | |
| Less: Foreign tax withheld | | | (3,025 | ) |
| Total investment income, net | | | 22,755 | |
| | | | | |
| Expenses: | | | | |
| Investment management fees | | | 5,352 | |
| Transfer agent fees | | | 3 | |
| Distribution fees - Class IB | | | 253 | |
| Custodian fees | | | 78 | |
| Accounting services fees | | | 126 | |
| Board of Directors' fees | | | 20 | |
| Audit fees | | | 20 | |
| Other expenses | | | 150 | |
| Total expenses (before fees paid indirectly) | | | 6,002 | |
| Commission recapture | | | (31 | ) |
| Total fees paid indirectly | | | (31 | ) |
| Total expenses, net | | | 5,971 | |
| Net Investment Income | | | 16,784 | |
| | | | | |
| Net Realized Gain on Investments and Foreign Currency Transactions: | | | | |
| Net realized gain on investments | | | 123,775 | |
| Net realized loss on foreign currency contracts | | | (123 | ) |
| Net realized gain on other foreign currency transactions | | | 93 | |
| Net Realized Gain on Investments and Foreign Currency Transactions | | | 123,745 | |
| | | | | |
| Net Changes in Unrealized Depreciation of Investments and Foreign Currency Transactions: | | | | |
| Net unrealized depreciation of investments | | | (92,077 | ) |
| Net unrealized appreciation of foreign currency contracts | | | 31 | |
| Net unrealized depreciation on translation of other assets and liabilities in foreign currencies | | | (49 | ) |
| Net Changes in Unrealized Depreciation of Investments and Foreign Currency Transactions | | | (92,095 | ) |
| Net Gain on Investments and Foreign Currency Transactions | | | 31,650 | |
| Net Increase in Net Assets Resulting from Operations | | $ | 48,434 | |
The accompanying notes are an integral part of these financial statements.
| Hartford International Opportunities HLS Fund |
| Statement of Changes in Net Assets |
| |
| (000’s Omitted) |
| | | For the
Six-Month
Period Ended
June 30, 2014
(Unaudited) | | | For the
Year Ended
December 31,
2013 | |
| Operations: | | | | | | | | |
| Net investment income | | $ | 16,784 | | | $ | 26,814 | |
| Net realized gain on investments and foreign currency transactions | | | 123,745 | | | | 165,288 | |
| Net unrealized appreciation (depreciation) of investments and foreign currency transactions | | | (92,095 | ) | | | 113,198 | |
| Net Increase in Net Assets Resulting from Operations | | | 48,434 | | | | 305,300 | |
| Distributions to Shareholders: | | | | | | | | |
| From net investment income | | | | | | | | |
| Class IA | | | — | | | | (28,319 | ) |
| Class IB | | | — | | | | (3,870 | ) |
| Total distributions | | | — | | | | (32,189 | ) |
| Capital Share Transactions: | | | | | | | | |
| Class IA | | | | | | | | |
| Sold | | | 72,730 | | | | 170,972 | |
| Issued on reinvestment of distributions | | | — | | | | 28,319 | |
| Redeemed | | | (220,349 | ) | | | (284,350 | ) |
| Total capital share transactions | | | (147,619 | ) | | | (85,059 | ) |
| Class IB | | | | | | | | |
| Sold | | | 25,984 | | | | 25,317 | |
| Issued on reinvestment of distributions | | | — | | | | 3,870 | |
| Redeemed | | | (25,630 | ) | | | (71,682 | ) |
| Total capital share transactions | | | 354 | | | | (42,495 | ) |
| Net decrease from capital share transactions | | | (147,265 | ) | | | (127,554 | ) |
| Net Increase (Decrease) in Net Assets | | | (98,831 | ) | | | 145,557 | |
| Net Assets: | | | | | | | | |
| Beginning of period | | | 1,669,465 | | | | 1,523,908 | |
| End of period | | $ | 1,570,634 | | | $ | 1,669,465 | |
| Undistributed (distribution in excess of) net investment income | | $ | 42,557 | | | $ | 25,773 | |
| Shares: | | | | | | | | |
| Class IA | | | | | | | | |
| Sold | | | 4,914 | | | | 12,510 | |
| Issued on reinvestment of distributions | | | — | | | | 2,067 | |
| Redeemed | | | (14,798 | ) | | | (21,051 | ) |
| Total share activity | | | (9,884 | ) | | | (6,474 | ) |
| Class IB | | | | | | | | |
| Sold | | | 1,663 | | | | 1,861 | |
| Issued on reinvestment of distributions | | | — | | | | 279 | |
| Redeemed | | | (1,692 | ) | | | (5,258 | ) |
| Total share activity | | | (29 | ) | | | (3,118 | ) |
The accompanying notes are an integral part of these financial statements.
| Hartford International Opportunities HLS Fund |
| Notes to Financial Statements |
| June 30, 2014 (Unaudited) |
| (000’s Omitted) |
Organization:
Hartford International Opportunities HLS Fund (the "Fund") serves as an underlying investment option for certain variable annuity and variable life insurance separate accounts of Hartford Life Insurance Company (“HLIC”) and its affiliates and certain qualified retirement plans. The Fund may also serve as an underlying investment option for certain variable annuity and variable life separate accounts of other insurance companies. Owners of variable annuity contracts and policyholders of variable life insurance contracts may choose the funds permitted in the variable insurance contract prospectus. In addition, participants in certain qualified retirement plans may choose the Fund if permitted by their plans.
Hartford Series Fund, Inc. (the “Company”) is an open-end registered management investment company comprised of twenty-eight portfolios. Financial statements for the Fund, a series of the Company, are included in this report.
The Company is organized under the laws of the State of Maryland and is registered with the Securities and Exchange Commission (“SEC”) under the Investment Company Act of 1940, as amended (“1940 Act”). The Fund is a diversified open-end management investment company.
The Fund is divided into Class IA, Class IB and Class IC shares. Each class is offered at the per share net asset value (“NAV”) without a sales charge and is subject to the same expenses, except that the Class IB shares are subject to distribution and service fees charged pursuant to a Distribution Plan adopted in accordance with Rule 12b-1 under the 1940 Act and Class IC shares are subject to distribution fees charged pursuant to a Distribution Plan adopted in accordance with Rule 12b-1 under the 1940 Act and are also subject to an administrative service fee. Class IC shares have not commenced operations and are not currently offered for sale as of the date of this report.
Significant Accounting Policies:
The following is a summary of significant accounting policies of the Fund in the preparation of its financial statements, which are in accordance with United States Generally Accepted Accounting Principles (“U.S. GAAP”). The preparation of financial statements in accordance with U.S. GAAP may require management to make estimates and assumptions that affect the reported amounts of assets and liabilities and disclosure of contingent assets and liabilities at the date of the financial statements and the reported amounts of increases and decreases in net assets from operations during the reporting period. Actual results could differ from those estimates.
Determination of Net Asset Value – The NAV of each class of the Fund's shares is determined as of the close of regular trading (normally 4:00 p.m. Eastern Time) (the “NYSE Close”) on each day that the New York Stock Exchange (the “Exchange”) is open (“Valuation Date”). Information that becomes known to the Fund after the NAV has been calculated on a particular day will not generally be used to retroactively adjust the NAV determined earlier that day.
Investment Valuation and Fair Value Measurements – For purposes of calculating the NAV, portfolio investments and other assets held by the Fund's portfolio for which market quotes are readily available are valued at market value. Market value is generally determined on the basis of last reported sales prices or official close price. If no sales are reported, market value is based on quotes obtained from a quotation reporting system, established market makers, or independent pricing services. If market prices are not readily available or are deemed unreliable, the Fund will use the fair value of the investment as determined in good faith under policies and procedures established by and under the supervision of the Company's Board of Directors. Market quotes are considered not readily available where there is an absence of current or reliable market-based data (e.g., trade information or indicative market quotes), including where events occur after the close of the relevant market, but prior to the NYSE Close, that materially affect the values of the Fund's portfolio investments or assets. In addition, market quotes are considered not readily available when, due to extraordinary circumstances, the exchanges or markets on which the investments trade do not open for trading for the entire day and no other market prices are available. In addition, prices of foreign equities that are principally traded on certain foreign markets may be adjusted daily pursuant to a fair value pricing service approved by the Board of Directors in order to reflect an adjustment for the factors occurring after the close of certain foreign markets but before the NYSE Close. Investments that are primarily traded on foreign markets may trade on days that are not business days of the Fund. The value of the foreign investments in which the Fund invests may change on days when a shareholder will not be able to purchase or redeem shares of the Fund. Fair value pricing is subjective in nature and the use of fair value pricing by the Fund may cause the NAV of its shares to differ significantly from the NAV
Hartford International Opportunities HLS Fund
Notes to Financial Statements – (continued)
June 30, 2014 (Unaudited)
(000’s Omitted)
that would have been calculated using market prices at the close of the exchange on which a portfolio investment is primarily traded. There can be no assurance that the Fund could obtain the fair market value assigned to an investment if the Fund were to sell the investment at approximately the time at which the Fund determines its NAV.
Investments valued in currencies other than U.S. dollars are converted to U.S. dollars using exchange rates obtained from independent pricing services for calculation of the NAV. As a result, the NAV of the Fund’s shares may be affected by changes in the value of currencies in relation to the U.S. dollar. The value of investments traded in markets outside the United States or denominated in currencies other than the U.S. dollar may be affected significantly on a day that the NYSE is closed and the market value may change on days when an investor is not able to purchase, redeem or exchange shares of the Fund.
Foreign currency contracts represent agreements to exchange currencies on specific future dates at predetermined rates. Foreign currency contracts are valued using foreign currency exchange rates and forward rates as provided by an independent pricing service on the Valuation Date.
Financial instruments for which prices are not available from an independent pricing service may be valued using market quotations obtained from one or more dealers that make markets in the respective financial instrument in accordance with procedures established by the Company's Board of Directors.
U.S. GAAP defines fair value as the price that the Fund would receive to sell an asset or pay to transfer a liability in an orderly transaction between market participants. The U.S. GAAP fair value measurement standards require disclosure of a fair value hierarchy for each major category of assets and liabilities. Various inputs are used in determining the fair value of the Fund’s investments. These inputs are summarized into three broad hierarchy levels. This hierarchy is based on whether the valuation inputs are observable or unobservable. These levels are:
Level 1 – Quoted prices in active markets for identical investments. Level 1 may include exchange traded instruments, such as domestic equities, some foreign equities, options, futures, mutual funds, exchange traded funds, rights and warrants.
Level 2 – Observable inputs other than Level 1 prices, such as quoted prices for similar investments; quoted prices in markets that are not active; or other inputs that are observable or can be corroborated by observable market data. Level 2 may include debt investments that are traded less frequently than exchange traded instruments and which are valued using independent pricing services; foreign equities, which are principally traded on certain foreign markets and are adjusted daily pursuant to a fair value pricing service in order to reflect an adjustment for the factors occurring after the close of certain foreign markets but before the NYSE Close; senior floating rate interests, which are valued using an aggregate of dealer bids; short-term investments, which are valued at amortized cost; and swaps, which are valued based upon the terms of each swap contract.
Level 3 – Significant unobservable inputs that are supported by limited or no market activity. Level 3 may include financial instruments whose values are determined using indicative market quotes or require significant management judgment or estimation. These unobservable valuation inputs may include estimates for current yields, maturity/duration, prepayment speed, and indicative market quotes for comparable investments along with other assumptions relating to credit quality, collateral value, complexity of the investment structure, general market conditions and liquidity. This category may include investments where trading has been halted or there are certain restrictions on trading. While these investments are priced using unobservable inputs, the valuation of these investments reflects the best available data and management believes the prices are a reasonable representation of exit price.
The Board of Directors of the Company generally reviews and approves the “Procedures for Valuation of Portfolio Securities” at least once a year. These procedures define how investments are to be valued, including the formation and activities of a Valuation Committee. The Valuation Committee is responsible for determining in good faith the fair value of investments when the value cannot be obtained from primary pricing services or alternative sources or if the valuation of an investment as provided by the primary pricing service or alternative source is believed not to reflect the investment’s fair value as of the Valuation Date. Voting members of the Valuation Committee include the Fund's Treasurer or designee and a Vice President of the investment manager or designee. An Assistant Vice President of the Fund with legal expertise or designee is also included on the Valuation Committee as a non-voting advisory member. In addition, the Fund’s Chief Compliance Officer shall designate a member of the
Hartford International Opportunities HLS Fund
Notes to Financial Statements – (continued)
June 30, 2014 (Unaudited)
(000’s Omitted)
compliance group to attend Valuation Committee meetings as a non-voting resource, to monitor for and provide guidance with respect to compliance with these procedures. Two members of the Valuation Committee or their designees, representing different departments, shall constitute a quorum for purposes of permitting the Valuation Committee to take action. The Valuation Committee will consider all relevant factors in determining an investment’s fair value, and may seek the advice of the Fund’s sub-adviser, knowledgeable brokers, and legal counsel in making such determination. The Valuation Committee reports to the Audit Committee of the Company's Board of Directors. The Audit Committee receives quarterly written reports which include details of all fair-valued investments, including the reason for the fair valuation, and an indication, when possible, of the accuracy of the valuation by disclosing the next available reliable public price quotation or the disposition price of such investments (the “look-back” test). The Board of Directors then must consider for ratification all of the fair value determinations made during the previous quarter.
Valuation levels are not necessarily indicative of the risk associated with investing in such investments. Individual investments within any of the above mentioned asset classes may be assigned a different hierarchical level than those presented above, as individual circumstances dictate.
For additional information, refer to the Investment Valuation Hierarchy Level Summary which follows the Schedule of Investments.
Investment Transactions and Investment Income – Investment transactions are recorded as of the trade date (the date the order to buy or sell is executed) for financial reporting purposes. Investments purchased or sold on a when-issued or delayed-delivery basis may be settled a month or more after the trade date. Realized gains and losses are determined on the basis of identified cost.
Dividend income from domestic securities is accrued on the ex-dividend date. In general, dividend income from foreign securities is recorded on the ex-date; however, dividend notifications in certain foreign jurisdictions may not be available in a timely manner and as a result, the Fund will record the dividend as soon as the relevant details (i.e., rate per share, payment date, shareholders of record, etc.) are publicly available. Interest income, including amortization of premium, accretion of discounts and additional principal received in-kind in lieu of cash, is accrued on a daily basis.
Foreign Currency Transactions – Assets and liabilities denominated in currencies other than U.S. dollars are translated into U.S. dollars at the exchange rates in effect on the valuation date. Purchases and sales of investments, income and expenses are translated into U.S. dollars at the exchange rates on the dates of such transactions.
The Fund does not isolate that portion of portfolio investment valuation resulting from fluctuations in the foreign currency exchange rates from the fluctuations arising from changes in the market prices of investments held. Exchange rate fluctuations are included with the net realized and unrealized gain or loss on investments in the accompanying financial statements.
Net realized foreign exchange gains or losses arise from sales of foreign currencies and the difference between asset and liability amounts initially stated in foreign currencies and the U.S. dollar value of the amounts actually received or paid. Net unrealized foreign exchange gains or losses arise from changes in the value of other assets and liabilities at the end of the reporting period, resulting from changes in the exchange rates.
Joint Trading Account – The Fund may invest cash balances into a joint trading account that may be invested in one or more repurchase agreements.
Fund Share Valuation and Dividend Distributions to Shareholders – Orders for the Fund’s shares are executed in accordance with the investment instructions of the contract holders and plan participants. The NAV of the Fund’s shares is determined as of the close of business on each business day of the Exchange. The NAV is determined separately for each class of shares of the Fund by dividing the Fund’s net assets attributable to that class by the number of shares of the class outstanding. Each class of shares offered by the Fund has equal rights as to assets and voting privileges (except that shareholders of a class have exclusive voting rights regarding any matter relating solely to that class of shares). Income and non-class specific expenses are allocated daily to each class on the basis of the relative net assets of the class. Realized and unrealized gains and losses are allocated daily based on the relative net assets of each class of shares of the Fund.
Hartford International Opportunities HLS Fund
Notes to Financial Statements – (continued)
June 30, 2014 (Unaudited)
(000’s Omitted)
Orders for the purchase of the Fund’s shares received prior to the close of the Exchange on any day the Exchange is open for business are priced at the NAV determined as of the close of the Exchange. Orders received after the close of the Exchange, or on a day on which the Exchange and/or the Fund is not open for business, are priced at the next determined NAV.
Dividends are declared pursuant to a policy adopted by the Company's Board of Directors based upon the investment performance of the Fund. The policy of the Fund is to pay dividends from net investment income and realized gains, if any, at least once a year.
Distributions from net investment income, net realized gains and capital are determined in accordance with federal income tax regulations, which may differ from U.S. GAAP with respect to character and timing. These differences may include, but are not limited to, losses deferred due to wash sale adjustments, foreign currency gains and losses, adjustments related to Passive Foreign Investment Companies ("PFICs"), Real Estate Investment Trusts ("REITs"), Regulated Investment Companies ("RICs"), certain derivatives and partnerships. Permanent book and federal income tax basis differences relating to shareholder distributions will result in reclassifications to certain of the Fund’s capital accounts (see Federal Income Taxes: Reclassification of Capital Accounts note).
Securities and Other Investments:
Repurchase Agreements – A repurchase agreement is an agreement by which a counterparty agrees to sell an investment and agrees to repurchase the investment sold from the buyer at a mutually agreed upon time and price. During the period of the repurchase agreement, the counterparty will deposit cash and or securities in a third party custodial account to serve as collateral. At the time the Fund enters into a repurchase agreement, the value of the underlying collateral, including accrued interest, will be equal to or exceed the value of the repurchase agreement. Repurchase agreements expose the Fund to counterparty risk - that is, the risk that the counterparty will not fulfill its obligations. To minimize counterparty risk, the investments that serve to collateralize the repurchase agreement are held by the Fund’s custodian in book entry or physical form in the custodial account of the Fund or in a third party custodial account. Repurchase agreements are valued at cost plus accrued interest, which approximates fair value. Repurchase agreements have master netting arrangements which allow the Fund to offset amounts owed to a counterparty with amounts owed by the counterparty, including any collateral. Upon an event of default under a master repurchase agreement, the non-defaulting party may close out all transactions traded under such agreement and net amounts owed under each transaction to one net amount payable by one party to the other. Absent an event of default, the master repurchase agreement does not result in an offset of reported amounts of assets and liabilities in the Statement of Assets and Liabilities across transactions between the Fund and the applicable counterparty. The Fund, as shown on the Schedule of Investments, had outstanding repurchase agreements and related collateral as of June 30, 2014.
Illiquid and Restricted Investments – The Fund is permitted to invest up to 15% of its net assets in illiquid investments. Illiquid investments are those that may not be sold or disposed of in the ordinary course of business within seven days, at approximately the price used to determine the Fund’s NAV. The Fund may not be able to sell illiquid investments when its sub-adviser considers it desirable to do so or may have to sell such investments at a price that is lower than the price that could be obtained if the investments were more liquid. A sale of illiquid investments may require more time and may result in higher dealer discounts and other selling expenses than does the sale of those that are liquid. Illiquid investments also may be more difficult to value due to the unavailability of reliable market quotations for such investments, and an investment in them may have an adverse impact on the Fund’s NAV. The Fund may also purchase certain restricted investments that can only be resold to certain qualified investors and may be determined to be liquid pursuant to policies and guidelines established by the Company's Board of Directors. The Fund, as shown on the Schedule of Investments, had illiquid or restricted investments as of June 30, 2014.
Investments Purchased on a When-Issued or Delayed-Delivery Basis – Delivery and payment for investments that have been purchased by the Fund on a forward commitment, or when-issued or delayed-delivery basis, take place beyond the customary settlement period. The Fund may dispose of or renegotiate a delayed-delivery transaction after it is entered into, and may sell delayed-delivery investments before they are delivered, which may result in a realized gain or loss. During this period, such investments are subject to market fluctuations, and the Fund identifies investments segregated in its records with a value at least equal to the amount of the commitment. The Fund, as shown on the Schedule of Investments, had when-issued or delayed-delivery investments as of June 30, 2014.
Hartford International Opportunities HLS Fund
Notes to Financial Statements – (continued)
June 30, 2014 (Unaudited)
(000’s Omitted)
Financial Derivative Instruments:
The following disclosures contain information on how and why the Fund uses derivative instruments, the credit-risk-related contingent features in certain derivative instruments, and how derivative instruments affect the Fund’s financial position and results of operations. The location and fair value amounts of these instruments on the Statement of Assets and Liabilities and the realized gains and losses and changes in unrealized gains and losses on the Statement of Operations, each categorized by type of derivative contract, are included in the following Additional Derivative Instrument Information footnote. The derivative instruments outstanding as of period-end are disclosed in the notes to or within the Schedule of Investments for purchased options, if applicable. The amounts of realized gains and losses and changes in unrealized gains and losses on derivative instruments during the period are disclosed in the Statement of Operations.
Foreign Currency Contracts – The Fund may enter into foreign currency contracts that obligate the Fund to purchase or sell currencies at specified future dates. Foreign currency contracts are used to hedge the currency exposure associated with some or all of the Fund’s investments and/or as part of an investment strategy. Foreign currency contracts are marked to market daily and the change in value is recorded by the Fund as an unrealized gain or loss. The Fund will record a realized gain or loss when the foreign currency contract is settled.
Foreign currency contracts involve elements of market risk in excess of the amounts reflected in the Statement of Assets and Liabilities. In addition, risks may arise upon entering into these contracts from the potential inability of the counterparties to meet the terms of the contracts and from unanticipated movements in the value of the foreign currencies relative to the U.S. dollar. The Fund, as shown on the Schedule of Investments, had outstanding foreign currency contracts as of June 30, 2014.
Additional Derivative Instrument Information:
Fair Value of Derivative Instruments on the Statement of Assets and Liabilities as of June 30, 2014:
| | | Risk Exposure Category | |
| | | Interest Rate
Contracts | | | Foreign
Exchange
Contracts | | | Credit
Contracts | | | Equity
Contracts | | | Commodity
Contracts | | | Other
Contracts | | | Total | |
| Assets: | | | | | | | | | | | | | | | | | | | | | | | | | | | | |
| Unrealized appreciation on foreign currency contracts | | $ | — | | | $ | 31 | | | $ | — | | | $ | — | | | $ | — | | | $ | — | | | $ | 31 | |
| Total | | $ | — | | | $ | 31 | | | $ | — | | | $ | — | | | $ | — | | | $ | — | | | $ | 31 | |
| | | | | | | | | | | | | | | | | | | | | | | | | | | | | |
| Liabilities: | | | | | | | | | | | | | | | | | | | | | | | | | | | | |
| Unrealized depreciation on foreign currency contracts | | $ | — | | | $ | 5 | | | $ | — | | | $ | — | | | $ | — | | | $ | — | | | $ | 5 | |
| Total | | $ | — | | | $ | 5 | | | $ | — | | | $ | — | | | $ | — | | | $ | — | | | $ | 5 | |
The volume of derivatives that is presented in the Schedule of Investments is consistent with the derivative activity during the six-month period ended June 30, 2014.
The Effect of Derivative Instruments on the Statement of Operations for the six-month period ended June 30, 2014:
| | | Risk Exposure Category | |
| | | Interest Rate
Contracts | | | Foreign
Exchange
Contracts | | | Credit
Contracts | | | Equity
Contracts | | | Commodity
Contracts | | | Other
Contracts | | | Total | |
| Realized Loss on Derivatives Recognized as a Result of Operations: |
| Net realized loss on foreign currency contracts | | $ | — | | | $ | (123 | ) | | $ | — | | | $ | — | | | $ | — | | | $ | — | | | $ | (123 | ) |
| Total | | $ | — | | | $ | (123 | ) | | $ | — | | | $ | — | | | $ | — | | | $ | — | | | $ | (123 | ) |
| | | | | | | | | | | | | | | | | | | | | | | | | | | | | |
| Net Change in Unrealized Appreciation (Depreciation) on Derivatives Recognized as a Result of Operations: |
| Net change in unrealized appreciation of foreign currency contracts | | $ | — | | | $ | 31 | | | $ | — | | | $ | — | | | $ | — | | | $ | — | | | $ | 31 | |
| Total | | $ | — | | | $ | 31 | | | $ | — | | | $ | — | | | $ | — | | | $ | — | | | $ | 31 | |
Hartford International Opportunities HLS Fund
Notes to Financial Statements – (continued)
June 30, 2014 (Unaudited)
(000’s Omitted)
The derivatives held by the Fund as of June 30, 2014 are not subject to a master netting arrangement; therefore, no balance sheet offsetting disclosure is presented.
Principal Risks:
The Fund may be exposed to counterparty risk, or the risk that an institution or other entity with which the Fund has unsettled or open transactions will default.
If the Fund invests directly in foreign currencies or in securities that trade in, and receive revenues in, foreign currencies, or in derivatives that provide exposure to foreign currencies, it will be subject to the risk that those currencies will decline in value relative to the base currency (U.S. dollars) of the Fund, or, in the case of hedging positions, that the Fund’s base currency will decline in value relative to the currency being hedged. Currency rates in foreign countries may fluctuate significantly over short periods of time for a number of reasons, including changes in interest rates, intervention (or the failure to intervene) by U.S. or foreign governments, central banks or supranational entities, such as the International Monetary Fund, or by the imposition of currency controls or other political developments in the United States or abroad. As a result, the Fund’s investments in foreign currency denominated securities may reduce the returns of the Fund. The market values of equity securities, such as common stocks and preferred stocks, or equity related investments, such as futures and options, may decline due to general market conditions which are not specifically related to a particular company, such as real or perceived adverse economic conditions, changes in the general outlook for corporate earnings, changes in interest or currency rates or adverse investor sentiment generally. The market value of equity securities may also decline due to factors which affect a particular industry or industries, such as labor shortages or increased production costs and competitive conditions within an industry. Equity securities and equity related investments generally have greater market price volatility than fixed income securities.
Federal Income Taxes:
Federal Income Taxes – For federal income tax purposes, the Fund intends to continue to qualify as a RIC under Subchapter M of the Internal Revenue Code (“IRC”) by distributing substantially all of its taxable net investment income and net realized capital gains to its shareholders and otherwise complying with the requirements of the IRC. The Fund has distributed substantially all of its income and capital gains in prior years, if applicable, and intends to distribute substantially all of its income and capital gains prior to the next fiscal year-end. Accordingly, no provision for federal income or excise taxes has been made in the accompanying financial statements. Distributions from short-term capital gains are treated as ordinary income distributions for federal income tax purposes.
Net Investment Income (Loss), Net Realized Gains (Losses) and Distributions – Net investment income (loss) and net realized gains (losses) may differ for financial statement and tax purposes primarily because of losses deferred due to wash sale adjustments, foreign currency gains and losses, adjustments related to PFICs, REITs, RICs, certain derivatives and partnerships. The character of distributions made during the year from net investment income or net realized gains may differ from their ultimate characterization for federal income tax purposes. Also, due to the timing of dividend distributions, the fiscal year in which amounts are distributed may differ from the year that the income or realized gains (losses) were recorded by the Fund.
Distributions and Components of Distributable Earnings – The tax character of distributions paid by the Fund for the periods indicated is as follows (as adjusted for dividends payable, if applicable):
| | | For the Year Ended
December 31, 2013 | | | For the Year Ended
December 31, 2012 | |
| Ordinary Income | | $ | 32,189 | | | $ | 28,135 | |
Hartford International Opportunities HLS Fund
Notes to Financial Statements – (continued)
June 30, 2014 (Unaudited)
(000’s Omitted)
As of December 31, 2013, the Fund’s components of distributable earnings (deficit) on a tax basis are as follows:
| | | Amount | |
| Undistributed Ordinary Income | | $ | 32,481 | |
| Accumulated Capital and Other Losses* | | | (556,593 | ) |
| Unrealized Appreciation† | | | 267,577 | |
| Total Accumulated Deficit | | $ | (256,535 | ) |
| * | The Fund has capital loss carryforwards that are identified in the Capital Loss Carryforward note that follows. |
| † | Differences between book-basis and tax-basis unrealized appreciation (depreciation) may be attributable to the losses deferred due to wash sale adjustments, foreign currency gains and losses, adjustments related to PFICs, REITs, RICs, certain derivatives and partnerships. |
Reclassification of Capital Accounts – The Fund may record reclassifications in its capital accounts. These reclassifications have no impact on the total net assets of the Fund. The reclassifications are a result of permanent differences between U.S. GAAP and tax accounting for such items as foreign currency, PFICs, expiration or utilization of capital loss carryforwards or net operating losses. Adjustments are made to reflect the impact these items have on current and future distributions to shareholders. Therefore, the source of the Fund’s distributions may be shown in the accompanying Statement of Changes in Net Assets as from undistributed net investment income, from accumulated net realized gains on investments or from capital depending on the type of book and tax differences that exist. For the year ended December 31, 2013, the Fund recorded reclassifications to increase (decrease) the accounts listed below:
| | | Amount | |
| Undistributed Net Investment Income (Loss) | | $ | 2,549 | |
| Accumulated Net Realized Gain (Loss) | | | (2,549 | ) |
Capital Loss Carryforward – On December 22, 2010, the Regulated Investment Company Modernization Act of 2010 (the “Act”) was enacted, which made changes to the capital loss carryforward rules. The changes are effective for taxable years beginning after the date of enactment. Under the Act, funds are permitted to carry forward capital losses for an unlimited period. However, any losses incurred during those future taxable years will be required to be utilized prior to the losses incurred in pre-enactment taxable years, which carry an expiration date. As a result of this ordering rule, pre-enactment capital loss carryforwards may be more likely to expire unused. Additionally, post-enactment capital loss carryforwards retain their character as either short-term or long-term capital losses rather than being considered all short-term as permitted under prior regulation.
At December 31, 2013 (tax year end), the Fund had capital loss carryforwards for U.S. federal income tax purposes as follows:
| Year of Expiration | | Amount | |
| 2016 | | $ | 268,993 | |
| 2017 | | | 287,600 | |
| Total | | $ | 556,593 | |
During the year ended December 31, 2013, the Fund utilized $154,388 of prior year capital loss carryforwards.
Accounting for Uncertainty in Income Taxes – The Fund has adopted financial reporting rules that require the Fund to analyze all open tax years, as defined by the statute of limitations, for all major jurisdictions. Generally, tax authorities can examine all tax returns filed for the last three years. The Fund does not have an examination in progress.
The Fund has reviewed all open tax years and major jurisdictions and concluded that these financial reporting rules had no effect on the Fund’s financial position or results of operations. There is no tax liability resulting from unrecognized tax benefits relating to uncertain income tax positions taken or expected to be taken on the tax return for the fiscal year ended December 31, 2013. The Fund is also not aware of any tax positions for which it is reasonably possible that the total amounts of unrecognized tax benefits will significantly change in the next twelve months.
Hartford International Opportunities HLS Fund
Notes to Financial Statements – (continued)
June 30, 2014 (Unaudited)
(000’s Omitted)
Expenses:
Investment Management Agreement – Hartford Funds Management Company, LLC ("HFMC") serves as the Fund’s investment manager pursuant to an Investment Management Agreement with the Company. HFMC is an indirect wholly owned subsidiary of The Hartford Financial Services Group, Inc. ("The Hartford"). The investment manager has overall investment supervisory responsibility for the Fund. In addition, the investment manager provides administrative personnel, services, equipment, facilities and office space for proper operation of the Fund. HFMC has contracted with Wellington Management Company, LLP ("Wellington Management") under a sub-advisory agreement for the provision of day-to-day investment management services to the Fund in accordance with the Fund’s investment objective and policies. The Fund pays a fee to the investment manager, a portion of which may be used to compensate Wellington Management.
The schedule below reflects the rates of compensation paid to the investment manager for investment management services rendered as of June 30, 2014; the rates are accrued daily and paid monthly:
| Average Daily Net Assets | | Annual Fee | |
| On first $250 million | | | 0.7750% | |
| On next $250 million | | | 0.7250% | |
| On next $500 million | | | 0.6750% | |
| On next $1.5 billion | | | 0.6250% | |
| On next $2.5 billion | | | 0.6200% | |
| On next $5 billion | | | 0.6150% | |
| Over $10 billion | | | 0.6100% | |
Accounting Services Agreement – Pursuant to the Fund Accounting Agreement between HFMC and the Company, on behalf of the Fund, HFMC provides accounting services to the Fund and receives monthly compensation based on the Fund’s average daily net assets at the rates set forth below. The Fund’s accounting services fees are accrued daily and paid monthly.
| Average Daily Net Assets | | Annual Fee | |
| On first $5 billion | | | 0.016% | |
| On next $5 billion | | | 0.013% | |
| Over $10 billion | | | 0.010% | |
Operating Expenses – Allocable expenses incurred by the Company are allocated to each Fund and allocated to classes within a Fund in proportion to the average daily net assets of the Fund and each class, except where allocation of certain expenses is more fairly made directly to the Fund or to specific classes within a Fund.
Fees Paid Indirectly – The Company, on behalf of the Fund, has entered into agreements with State Street Global Markets, LLC and Russell Implementation Services, Inc. to partially recapture non-discounted trade commissions. Such rebates are used to pay a portion of the Fund's expenses. For the six-month period ended June 30, 2014, this amount, if any, is included in the Statement of Operations.
The ratio of expenses to average net assets in the accompanying financial highlights excludes the reduction in expenses related to fees paid indirectly. The annualized expense ratio after waivers for the period listed below reflecting the reduction for fees paid indirectly is as follows:
| | | Annualized Six-
Month Period Ended
June 30, 2014 | |
| Class IA | | | 0.73% | |
| Class IB | | | 0.98 | |
Hartford International Opportunities HLS Fund
Notes to Financial Statements – (continued)
June 30, 2014 (Unaudited)
(000’s Omitted)
Distribution Plan for Class IB Shares – Hartford Funds Distributors, LLC (“HFD”), an indirect wholly owned subsidiary of The Hartford, is the principal underwriter and distributor of the Fund. The Company, on behalf of the Fund, has adopted a Distribution Plan pursuant to Rule 12b-1 of the 1940 Act for Class IB shares.
The Distribution Plan provides that the Fund may pay annually up to 0.25% of the average daily net assets of the Fund attributable to its Class IB shares for activities primarily intended to result in the sale of Class IB shares. The Board has the authority to suspend or reduce these payments at any point in time. Under the terms of the Distribution Plan and the principal underwriting agreement, the Fund is authorized to make payments monthly to the distributor that may be used to pay or reimburse entities providing distribution and shareholder servicing with respect to the Class IB shares for such entities’ fees or expenses incurred or paid in that regard. The distribution fee paid during the period can be found on the Statement of Operations. These fees are accrued daily and paid monthly.
Other Related Party Transactions – Hartford Administrative Services Company (“HASCO”), an indirect wholly owned subsidiary of The Hartford, provides transfer agent services to the Fund. HASCO was compensated on a per account basis for providing such services. The amount paid to HASCO can be found in the Statement of Operations. These fees are accrued daily and paid monthly.
Payment from Affiliate – In July of 2007, The Hartford entered into a settlement with the Attorneys General of the states of New York, Connecticut and Illinois relating to market timing and the company's individual variable annuity contracts in which certain payments would be made directly to the variable annuity contract holders. The distribution plan provided that unclaimed money from the settlement would be distributed to certain HLS Funds that are investment options through a Hartford individual variable annuity contract. The unclaimed money was distributed to the Fund on September 18, 2009.
The total return in the accompanying financial highlights includes a payment from an affiliate. Had the payment from the affiliate been excluded, the impact and total return for the period listed below would have been as follows:
| | | For the Year Ended December 31, 2009 | |
| | | Class IA | | | Class IB | |
| Impact from Payment from Affiliate for Attorneys General Settlement | | | 0.23% | | | | 0.23% | |
| Total Return Excluding Payment from Affiliate | | | 33.15% | | | | 32.83% | |
Investment Transactions:
For the six-month period ended June 30, 2014, the cost of purchases and proceeds from sales of investment securities (excluding short-term investments) were as follows:
| | | Excluding U.S.
Government
Obligations | | | U.S.
Government
Obligations | | | Total | |
| Cost of Purchases | | $ | 646,270 | | | $ | — | | | $ | 646,270 | |
| Sales Proceeds | | | 773,147 | | | | — | | | | 773,147 | |
Line of Credit:
The Fund is one of several Hartford Funds that participate in a $500 million committed revolving line of credit facility. The facility is to be used for temporary or emergency purposes. Under the arrangement, the funds are required to own securities having a market value in excess of 300% of the total bank borrowings. The interest rate on borrowings varies depending on the nature of the loan. The facility also requires a fee to be paid based on the amount of the commitment. This commitment fee is allocated to all the funds participating in the line of credit based on the average net assets of the funds. During the six-month period ended June 30, 2014, the Fund did not have any borrowings under this facility.
Hartford International Opportunities HLS Fund
Notes to Financial Statements – (continued)
June 30, 2014 (Unaudited)
(000’s Omitted)
Industry Classifications:
Other than the industry classifications "Other Investment Pools and Funds" and "Exchange Traded Funds," equity industry classifications used in this report are the Global Industry Classification Standard, which was developed by and is the exclusive property and service mark of MSCI, Inc. and Standard & Poor's.
Indemnifications:
Under the Company's organizational documents, the Company shall indemnify its officers and directors to the full extent required or permitted under Maryland General Corporation Law and the federal securities laws. In addition, the Company, on behalf of the Fund, may enter into contracts that contain a variety of indemnifications. The Company's maximum exposure under these arrangements is unknown. However, as of the date of these financial statements, the Company has not had prior claims or losses pursuant to these contracts and expects the risk of loss to be remote.
Pending Legal Proceedings:
On February 25, 2011, Jennifer L. Kasilag, Louis Mellinger, Judith M. Menendez, Jacqueline M. Robinson, and Linda A. Russell filed a derivative lawsuit against Hartford Investment Financial Services, LLC (“HIFSCO”) (now known as Hartford Funds Distributors, LLC) on behalf of six Hartford retail mutual funds in the United States District Court for the District of New Jersey, alleging that HIFSCO received excessive advisory and distribution fees in violation of its statutory fiduciary duty under Section 36(b) of the 1940 Act when serving as investment manager and principal underwriter, respectively, to the Hartford retail mutual funds. Although this action was purportedly filed on behalf of certain of the Hartford Funds, none of the Hartford Funds is itself a defendant to the suit. HIFSCO moved to dismiss and, in September 2011, the motion was granted in part and denied in part, with leave to amend the complaint. In November 2011, plaintiffs filed an amended complaint on behalf of certain Hartford retail mutual funds, The Hartford Global Health Fund (now known as The Hartford Healthcare Fund), The Hartford Conservative Allocation Fund, The Hartford Growth Opportunities Fund, The Hartford Inflation Plus Fund, The Hartford Advisers Fund (now known as The Hartford Balanced Fund), and The Hartford Capital Appreciation Fund. Plaintiffs seek to rescind the investment management agreements and distribution plans between HIFSCO and these funds and to recover the total fees charged thereunder or, in the alternative, to recover any improper compensation HIFSCO received, in addition to lost earnings. HIFSCO filed a partial motion to dismiss the amended complaint and, in December 2012, the court dismissed without prejudice the claims regarding distribution fees and denied the motion with respect to the advisory fees claims. HIFSCO disputes the allegations and intends to defend vigorously.
In March 2014, the plaintiffs filed a new complaint that added as new plaintiffs The Hartford Floating Rate Fund and The Hartford Small Company Fund and named as a defendant Hartford Funds Management Company, LLC (the “Investment Manager”), which assumed the role as investment adviser to the funds as of January 2013. The Investment Manager and HIFSCO dispute the allegations and intend to defend vigorously.
This action concerns the activities of HIFSCO in its capacity as investment manager and principal underwriter to the Hartford retail mutual funds and does not concern HIFSCO’s activities in its capacity as principal underwriter to the HLS funds. For this reason, no accrual for litigation relating to this matter has been recorded in the financial statements of the Fund.
Hartford International Opportunities HLS Fund
Financial Highlights
| | | ─ Selected Per-Share Data(A) ─ | | | ─ Ratios and Supplemental Data ─ | |
| Class | | Net Asset
Value at
Beginning
of Period | | | Net
Investment
Income
(Loss) | | | Net
Realized
and
Unrealized
Gain (Loss)
on
Investments | | | Total from
Investment
Operations | | | Dividends
from
Net
Investment
Income | | | Distributions
from
Realized
Capital
Gains | | | Total
Dividends
and
Distributions | | | Net
Asset
Value at
End of
Period | | | Total
Return(B) | | | Net Assets
at End of
Period
(000s) | | | Ratio of
Expenses
to
Average Net
Assets
Before
Adjust-
ments(C) | | | Ratio of
Expenses
to
Average
Net
Assets
After
Adjust-
ments(C) | | | Ratio of
Net
Investment
Income
(Loss) to
Average
Net
Assets | |
| | | | | | | | | | | | | | | | | | | | | | | | | | | | | | | | | | | | | | | | |
| For the Six-Month Period Ended June 30, 2014 (Unaudited) |
| IA | | $ | 15.03 | | | $ | 0.16 | | | $ | 0.34 | | | $ | 0.50 | | | $ | – | | | $ | – | | | $ | – | | | $ | 15.53 | | | | 3.33 | %(D) | | $ | 1,348,784 | | | | 0.73 | %(E) | | | 0.73 | %(E) | | | 2.17 | %(E) |
| IB | | | 15.20 | | | | 0.14 | | | | 0.35 | | | | 0.49 | | | | – | | | | – | | | | – | | | | 15.69 | | | | 3.22 | (D) | | | 221,850 | | | | 0.98 | (E) | | | 0.98 | (E) | | | 1.90 | (E) |
| | | | | | | | | | | | | | | | | | | | | | | | | | | | | | | | | | | | | | | | | | | | | | | | | | | | | |
| For the Year Ended December 31, 2013 |
| IA | | $ | 12.63 | | | $ | 0.24 | | | $ | 2.45 | | | $ | 2.69 | | | $ | (0.29 | ) | | $ | – | | | $ | (0.29 | ) | | $ | 15.03 | | | | 21.55 | % | | $ | 1,454,018 | | | | 0.74 | % | | | 0.74 | % | | | 1.76 | % |
| IB | | | 12.76 | | | | 0.21 | | | | 2.49 | | | | 2.70 | | | | (0.26 | ) | | | – | | | | (0.26 | ) | | | 15.20 | | | | 21.28 | | | | 215,447 | | | | 0.99 | | | | 0.99 | | | | 1.55 | |
| | | | | | | | | | | | | | | | | | | | | | | | | | | | | | | | | | | | | | | | | | | | | | | | | | | | | |
| For the Year Ended December 31, 2012 (F) |
| IA | | $ | 10.72 | | | $ | 0.26 | | | $ | 1.88 | | | $ | 2.14 | | | $ | (0.23 | ) | | $ | – | | | $ | (0.23 | ) | | $ | 12.63 | | | | 20.20 | % | | $ | 1,303,209 | | | | 0.74 | % | | | 0.74 | % | | | 1.88 | % |
| IB | | | 10.82 | | | | 0.25 | | | | 1.88 | | | | 2.13 | | | | (0.19 | ) | | | – | | | | (0.19 | ) | | | 12.76 | | | | 19.89 | | | | 220,699 | | | | 0.99 | | | | 0.99 | | | | 1.64 | |
| | | | | | | | | | | | | | | | | | | | | | | | | | | | | | | | | | | | | | | | | | | | | | | | | | | | | |
| For the Year Ended December 31, 2011 (F) |
| IA | | $ | 12.46 | | | $ | 0.21 | | | $ | (1.94 | ) | | $ | (1.73 | ) | | $ | (0.01 | ) | | $ | – | | | $ | (0.01 | ) | | $ | 10.72 | | | | (13.97 | )% | | $ | 1,287,917 | | | | 0.73 | % | | | 0.73 | % | | | 1.66 | % |
| IB | | | 12.61 | | | | 0.19 | | | | (1.97 | ) | | | (1.78 | ) | | | (0.01 | ) | | | – | | | | (0.01 | ) | | | 10.82 | | | | (14.19 | ) | | | 232,707 | | | | 0.98 | | | | 0.98 | | | | 1.41 | |
| | | | | | | | | | | | | | | | | | | | | | | | | | | | | | | | | | | | | | | | | | | | | | | | | | | | | |
| For the Year Ended December 31, 2010 |
| IA | | $ | 11.01 | | | $ | 0.13 | | | $ | 1.46 | | | $ | 1.59 | | | $ | (0.14 | ) | | $ | – | | | $ | (0.14 | ) | | $ | 12.46 | | | | 14.49 | % | | $ | 1,705,757 | | | | 0.74 | % | | | 0.74 | % | | | 1.19 | % |
| IB | | | 11.15 | | | | 0.11 | | | | 1.46 | | | | 1.57 | | | | (0.11 | ) | | | – | | | | (0.11 | ) | | | 12.61 | | | | 14.20 | | | | 328,671 | | | | 0.99 | | | | 0.99 | | | | 0.94 | |
| | | | | | | | | | | | | | | | | | | | | | | | | | | | | | | | | | | | | | | | | | | | | | | | | | | | | |
| For the Year Ended December 31, 2009 (F) |
| IA | | $ | 8.40 | | | $ | 0.19 | (G) | | $ | 2.61 | | | $ | 2.80 | | | $ | (0.19 | ) | | $ | – | | | $ | (0.19 | ) | | $ | 11.01 | | | | 33.46 | %(H) | | $ | 1,247,179 | | | | 0.76 | % | | | 0.76 | % | | | 1.68 | % |
| IB | | | 8.51 | | | | 0.17 | (G) | | | 2.64 | | | | 2.81 | | | | (0.17 | ) | | | – | | | | (0.17 | ) | | | 11.15 | | | | 33.13 | (H) | | | 216,882 | | | | 1.01 | | | | 1.01 | | | | 1.43 | |
| (A) | Information presented relates to a share outstanding throughout the indicated period. Net investment income (loss) per share amounts are calculated based on average shares outstanding unless otherwise noted. |
| (B) | The figures do not include sales charges or other fees which may be applied at the variable life insurance, variable annuity or qualified retirement plan product level. Any such additional sales charges or other fees would lower the Fund's performance. |
| (C) | Adjustments include waivers and reimbursements, if applicable. Ratios do not include fees paid indirectly (see Expenses in the accompanying Notes to Financial Statements). |
| (F) | Net investment income (loss) per share amounts have been calculated using the SEC method. |
| (G) | The impact of Payment from Affiliate per share was $0.03. |
| (H) | Total return without the inclusion of the Payment from (to) Affiliate can be found in Expenses in the accompanying Notes to Financial Statements. |
| | | Portfolio Turnover
Rate for
All Share Classes | |
| For the Six-Month Period Ended June 30, 2014 (Unaudited) | | | 42% | |
| For the Year Ended December 31, 2013 | | | 100 | |
| For the Year Ended December 31, 2012 | | | 95 | |
| For the Year Ended December 31, 2011 | | | 111 | |
| For the Year Ended December 31, 2010 | | | 128(A) | |
| For the Year Ended December 31, 2009 | | | 152 | |
(A) During the year ended December 31, 2010, the Fund incurred $456.2 million in sales associated with the transition of assets from Hartford International Growth HLS Fund and Hartford International Small Company HLS Fund, which merged into the Fund on April 16, 2010. These sales were excluded from the portfolio turnover calculation.
Hartford International Opportunities HLS Fund
Directors and Officers (Unaudited)
The Board of Directors of the Company (the "Directors") appoints officers who are responsible for the day-to-day operations of the Fund and who execute policies formulated by the Directors. Each Director serves until his or her death, resignation, or retirement or until the next annual meeting of shareholders is held or until his or her successor is elected and qualifies.
Directors and officers who are employed by or who have a financial interest in The Hartford are considered “interested” persons of the Fund pursuant to the 1940 Act. Each officer and two of the Company's Directors, as noted in the chart below, are “interested” persons of the Fund. Each Director serves as a director for The Hartford Mutual Funds, Inc., The Hartford Mutual Funds II, Inc., Hartford Series Fund, Inc., and Hartford HLS Series Fund II, Inc., and as a trustee for The Hartford Alternative Strategies Fund, which, as of June 30, 2014, collectively consist of 78 funds. Correspondence may be sent to Directors and officers c/o Hartford Funds, 5 Radnor Corporate Center, Suite 300, 100 Matsonford Road, Radnor, Pennsylvania 19087, except that correspondence to Mr. Annoni, Mr. Dressen and Ms. Quade may be sent to 500 Bielenberg Drive, Suite 500, Woodbury, Minnesota 55125.
The table below sets forth, for each Director and officer, his or her name, year of birth, current position with the Company and date first elected or appointed to Hartford Series Fund, Inc. ("HSF") and Hartford HLS Series Fund II, Inc. ("HSF2"), principal occupation, and, for Directors, other directorships held. The Fund’s Statement of Additional Information contains further information on the Directors and is available free of charge by calling 1-888-843-7824 or writing to: Hartford HLS Funds, c/o Hartford Life Insurance Company/Hartford Life and Annuity Insurance Company, P.O. Box 14293, Lexington, KY 40512-4293 for variable annuity and variable life insurance separate accounts of Hartford Life Insurance Company and its affiliates; Hartford Funds, P.O. Box 55022, Boston, MA 02205-5022 for all shareholders except variable annuity and variable life insurance separate accounts of Hartford Life Insurance Company and its affiliates.
Information on the aggregate remuneration paid to the directors of the Company can be found in the Statement of Operations herein. The Fund pays to The Hartford a portion of the Chief Compliance Officer’s compensation, but does not pay salaries or compensation to any of its other officers or Directors who are employed by The Hartford.
Non-Interested Directors
Lynn S. Birdsong (1946) Director since 2003, Co-Chairman of the Investment Committee since 2005
Mr. Birdsong is a private investor. Mr. Birdsong currently serves as a Director of the Sovereign High Yield Investment Company (April 2010 to current). Mr. Birdsong currently serves as an Independent Director of Nomura Partners Funds, Inc. (formerly, The Japan Fund) (April 2003 to current). From 2003 to March 2005, Mr. Birdsong was an Independent Director of the Atlantic Whitehall Funds. From 1979 to 2002, Mr. Birdsong was a Managing Director of Zurich Scudder Investments, an investment management firm. During his employment with Scudder, Mr. Birdsong was an Interested Director of The Japan Fund. From January 1981 through December 2013, Mr. Birdsong was a partner in Birdsong Company, an advertising specialty firm.
Robert M. Gavin, Jr. (1940) Director since 2002 (HSF) and 1986 (HSF2), Chairman of the Board since 2004
Dr. Gavin is an educational consultant. Prior to September 1, 2001, he was President of Cranbrook Education Community and prior to July 1996, he was President of Macalester College, St. Paul, Minnesota.
Duane E. Hill (1945) Director since 2001 (HSF) and 2002 (HSF2), Chairman of the Nominating Committee since 2003
Mr. Hill is a Partner of TSG Ventures L.P., a private equity investment company. Mr. Hill is a former partner of TSG Capital Group, a private equity investment firm that served as sponsor and lead investor in leveraged buyouts of middle market companies.
Sandra S. Jaffee (1941) Director since 2005
Ms. Jaffee is the founder and Chief Executive Officer of a private company, Homeworks Concierge, LLC, which provides residential property management services in Westchester County, New York (January 2012 to present). Ms. Jaffee served as Chairman (2008 to 2009) and Chief Executive Officer of Fortent (formerly Searchspace Group), a leading provider of compliance/regulatory technology to financial institutions from August 2005 to August 2009. From August 2004 to August 2005, Ms. Jaffee served as an Entrepreneur in Residence with Warburg Pincus, a private equity firm. Prior to joining Warburg Pincus, Ms. Jaffee served as Executive Vice President at Citigroup, from September 1995 to July 2004, where she was President and Chief Executive Officer of Citibank’s Global Securities Services (1995 to 2003). Ms. Jaffee currently serves as a member of the Board of Directors of Broadridge Financial Solutions as well as a Trustee of Muhlenberg College.
Hartford International Opportunities HLS Fund
Directors and Officers (Unaudited) – (continued)
William P. Johnston (1944) Director since 2005, Chairman of the Compliance Committee since 2005
In June 2006, Mr. Johnston was appointed as Senior Advisor to The Carlyle Group, a global private equity and other alternative asset investment firm and currently serves as an Operating Executive. In July 2006, Mr. Johnston was elected to the Board of Directors of MultiPlan, Inc. and served as a Director (July 2006 to August 2010). In August 2007, Mr. Johnston was elected to the Board of Directors of LifeCare Holdings, Inc. and served as a Director (August 2007 to June 2013). In February 2008, Mr. Johnston was elected to the Board of Directors of HCR-ManorCare, Inc. In May 2006, Mr. Johnston was elected to the Supervisory Board of Fresenius Medical Care AG & Co. KGaA, after its acquisition of Renal Care Group, Inc. in March 2006. Mr. Johnston joined Renal Care Group in November 2002 as a member of the Board of Directors and served as Chairman of the Board from March 2003 through March 2006. From 2002 through 2013, Mr. Johnston served as a Board member of the Georgia O’Keefe Museum. From September 1987 to December 2002, Mr. Johnston was with Equitable Securities Corporation (and its successors, SunTrust Equitable Securities and SunTrust Robinson Humphrey) serving in various investment banking and managerial positions, including Managing Director and Head of Investment Banking, Chief Executive Officer and Vice Chairman.
Phillip O. Peterson (1944) Director since 2002 (HSF) and 2000 (HSF2), Chairman of the Audit Committee since 2002
Mr. Peterson is a mutual fund industry consultant. He was a partner of KPMG LLP (an accounting firm) until July 1999. Mr. Peterson joined William Blair Funds in February 2007 as a member of the Board of Trustees. From February 2012 to February 2014, Mr. Peterson served as a Trustee of Symetra Variable Mutual Funds. From January 2004 to April 2005, Mr. Peterson served as Independent President of the Strong Mutual Funds.
Lemma W. Senbet (1946) Director since 2005
Dr. Senbet is the William E. Mayer Chair Professor of Finance and Founding Director, Center for Financial Policy, at the University of Maryland, Robert H. Smith School of Business. He was chair of the Finance Department of the University of Maryland, Robert H. Smith School of Business from 1998 to 2006. Since June 2013, he has been on leave from the University to serve as Executive Director of African Economic Research Consortium which focuses on economic policy research and training. Previously, he was a chaired professor of finance at the University of Wisconsin-Madison. Also, he was a Director of the Fortis Funds from March 2000 to July 2002. Dr. Senbet served as Director of the American Finance Association and President of the Western Finance Association. In 2006, Dr. Senbet was inducted Fellow of Financial Management Association International for his career-long distinguished scholarship and professional service.
Interested Directors and Officers
James E. Davey (1964) Director since 2012, President and Chief Executive Officer since 2010
Mr. Davey serves as Executive Vice President of Hartford Life Insurance Company (“HLIC”) and The Hartford Financial Services Group, Inc. Additionally, Mr. Davey serves as Chairman of the Board, Manager and Senior Managing Director of Hartford Funds Distributors, LLC (“HFD”). He also currently serves as Director, Chairman of the Board, President and Senior Managing Director of Hartford Administrative Services Company (“HASCO”). Mr. Davey also serves as Manager, Chairman of the Board and Senior Managing Director for Hartford Funds Management Company, LLC (“HFMC”) and Director, Chairman of the Board and Senior Managing Director for Hartford Funds Management Group, Inc. ("HFMG"). Mr. Davey has served in various positions within The Hartford and its subsidiaries in connection with the operation of the Hartford Funds. Mr. Davey joined The Hartford in 2002.
Lowndes A. Smith (1939) Director since 1996 (HSF) and 2002 (HSF2), Co-Chairman of the Investment Committee since 2005
Mr. Smith served as Vice Chairman of The Hartford from February 1997 to January 2002, as President and Chief Executive Officer of Hartford Life, Inc. from February 1997 to January 2002, and as President and Chief Operating Officer of The Hartford Life Insurance Companies from January 1989 to January 2002. Mr. Smith serves as a Director of White Mountains Insurance Group Ltd. (October 2003 to current); One Beacon Insurance (October 2006 to current); Symetra Financial (August 2007 to current) and is a Managing Director of Whittington Gray Associates (January 2007 to current).
Other Officers
Mark A. Annoni (1964) Vice President, Controller and Treasurer since 2012
Mr. Annoni currently serves as the Assistant Vice President of HLIC (February 2004 to present) and Senior Vice President of HFMG (December 2013 to present). Mr. Annoni has served in various positions within The Hartford and its subsidiaries in connection with the operation of the Hartford Funds. Mr. Annoni joined The Hartford in 2001.
Hartford International Opportunities HLS Fund
Directors and Officers (Unaudited) – (continued)
Michael R. Dressen (1963) AML Compliance Officer since 2011
Mr. Dressen currently serves as Assistant Vice President of HLIC. He also serves as Chief Compliance Officer and AML Compliance Officer of HASCO and as AML Officer of HFD. Mr. Dressen has served in various positions within The Hartford and its subsidiaries in connection with the operation of the Hartford Funds.
Edward P. Macdonald (1967) Vice President, Secretary and Chief Legal Officer since 2005
Mr. Macdonald currently serves as Assistant Secretary, Executive Vice President and Deputy General Counsel of HFD, HASCO, HFMC and HFMG. He also serves as Vice President of HLIC. Mr. Macdonald has served in various positions within The Hartford and its subsidiaries in connection with the operation of the Hartford Funds. Mr. Macdonald joined The Hartford in 2005.
Joseph G. Melcher (1973) Vice President and Chief Compliance Officer since 2013
Mr. Melcher currently serves as Executive Vice President of HFD, HFMG and HASCO. Mr. Melcher also currently serves as Executive Vice President and Chief Compliance Officer of HFMC. Mr. Melcher has served in various positions within The Hartford and its subsidiaries in connection with the operation of the Hartford Funds since joining The Hartford in 2012. Prior to joining The Hartford, Mr. Melcher worked at Touchstone Investments, a member of the Western & Southern Financial Group, where he held the position of Vice President and Chief Compliance Officer from 2010 through 2012 and Assistant Vice President, Compliance from 2005 to 2010.
Vernon J. Meyer (1964) Vice President since 2006
Mr. Meyer currently serves as Senior Vice President of HLIC. He also currently serves as Managing Director and Chief Investment Officer of HFMC and Managing Director of HFMG. Mr. Meyer has served in various positions within The Hartford and its subsidiaries in connection with the operation of the Hartford Funds. Mr. Meyer joined The Hartford in 2004.
Laura S. Quade (1969) Vice President since 2012
Ms. Quade currently serves as Vice President of HASCO, HFD and HFMG. She is the Head of Operations of HASCO and also serves as Director, Enterprise Operations of HLIC. Ms. Quade has served in various positions within The Hartford and its subsidiaries in connection with the operation of the Hartford Funds.
Martin A. Swanson (1962) Vice President since 2010
Mr. Swanson currently serves as Vice President of HLIC. Mr. Swanson also serves as Managing Director, Chief Marketing Officer and Principal of HFD and Managing Director of HFMG. Mr. Swanson has served in various positions within The Hartford and its subsidiaries in connection with the operation of the Hartford Funds.
HOW TO OBTAIN A COPY OF THE FUND’S PROXY VOTING POLICIES AND VOTING RECORDS (UNAUDITED)
A description of the policies and procedures that the Fund uses to determine how to vote proxies relating to portfolio securities and information about how the Fund voted proxies relating to portfolio securities during the most recent twelve-month period ended June 30 are available (1) without charge, upon request, by calling 888-843-7824 and (2) on the SEC’s website at http://www.sec.gov.
QUARTERLY PORTFOLIO HOLDINGS INFORMATION (UNAUDITED)
The Fund files a complete schedule of portfolio holdings with the SEC for the first and third quarters of each fiscal year on Form N-Q. The Fund’s Forms N-Q are available (1) without charge, upon request, by calling 888-843-7824 and (2) on the SEC’s website at http://www.sec.gov. The Form N-Q may be reviewed and copied at the SEC’s Public Reference Room in Washington, DC. Information on the operation of the Public Reference Room may be obtained by calling 1-800-SEC-0330.
Hartford International Opportunities HLS Fund
Expense Example (Unaudited)
Your Fund's Expenses
As a shareholder of the Fund, you incur two types of costs: (1) transaction costs and (2) ongoing costs, including investment management fees, distribution and/or service (12b-1) fees, if any, and other fund expenses. This example is intended to help you understand your ongoing costs (in dollars) of investing in the Fund and to compare these costs with the ongoing costs of investing in other mutual funds. The example is based on an investment of $1,000 invested at the beginning of the period and held for the entire period of December 31, 2013 through June 30, 2014.
Actual Expenses
The first set of columns of the table below provides information about actual account values and actual expenses. You may use the information in this column, together with the amount you invested, to estimate the expenses that you paid over the period. Simply divide your account value by $1,000 (for example, an $8,600 account value divided by $1,000 = 8.6), then multiply the result by the number in the line under the heading entitled “Expenses Paid During Period” to estimate the expenses you paid on your account during this period.
Hypothetical Example for Comparison Purposes
The second set of columns of the table below provides information about hypothetical account values and hypothetical expenses based on the Fund's actual expense ratio and an assumed rate of return of 5% per year before expenses, which is not the Fund's actual return. The hypothetical account values and expenses may not be used to estimate the actual ending account balance or expenses you paid for the period. You may use this information to compare the ongoing costs of investing in the Fund and other funds. To do so, compare this 5% hypothetical example with the 5% hypothetical examples that appear in the shareholder reports of the other funds.
Please note that the expenses shown in the table are meant to highlight your ongoing costs only and do not reflect any transactional costs, such as sales charges (loads) and CDSC. Therefore, the second set of columns of the table is useful in comparing ongoing costs only, and will not help you determine the relative total costs of owning different funds. In addition, if these transactional costs were included, your costs would be higher. Expenses are equal to the Fund's annualized expense ratios multiplied by average account value over the period, multiplied by 181/365 (to reflect the one-half year period).
| | | Actual return | | | Hypothetical (5% return before expenses) | | | | | | | |
| | | Beginning
Account Value
December 31,
2013 | | | Ending Account
Value
June 30, 2014 | | | Expenses paid
during the period
December 31, 2013
through
June 30, 2014 | | | Beginning
Account Value
December 31,
2013 | | | Ending Account
Value
June 30, 2014 | | | Expenses paid
during the period
December 31,
2013
through
June 30, 2014 | | | Annualized
expense
ratio | | | Days
in the
current
1/2
year | | | Days
in the
full
year | |
| Class IA | | $ | 1,000.00 | | | $ | 1,033.30 | | | $ | 3.68 | | | $ | 1,000.00 | | | $ | 1,021.17 | | | $ | 3.66 | | | | 0.73 | % | | 181 | | | 365 | |
| Class IB | | $ | 1,000.00 | | | $ | 1,032.20 | | | $ | 4.94 | | | $ | 1,000.00 | | | $ | 1,019.93 | | | $ | 4.91 | | | | 0.98 | | | 181 | | | 365 | |
Hartford International Opportunities HLS Fund
Main Risks (Unaudited)
The main risks of investing in the Fund are described below.
Market, Selection and Strategy Risk: The Fund’s share price may fluctuate due to market risk and/or security selections that may underperform the market or relevant benchmarks. If the sub-adviser's investment strategy does not perform as expected, the Fund could underperform its peers or lose money. There is no guarantee the Fund will achieve its stated objective.
Foreign Investment and Emerging Markets Risk: Investments in foreign securities may be riskier than investments in U.S. securities. Potential risks include the risks of illiquidity, increased price volatility, less government regulation, less extensive and less frequent accounting and other reporting requirements, unfavorable changes in currency exchange rates, and economic and political disruptions. These risks are generally greater for investments in emerging markets.
Mid-cap Stock Risk: Mid-cap stocks are generally more volatile and risky and may be less liquid than large-cap stocks because they may have limited operating histories, narrow product lines, and focus on niche markets.
Active Trading Risk: Actively trading investments may result in higher costs (thus affecting performance).
THIS PRIVACY POLICY IS NOT PART OF THIS REPORT
Privacy Policy and Practices of The Hartford Financial Services Group, Inc. and its Affiliates
(herein called “we, our and us”)
This Privacy Policy applies to our United States Operations
We value your trust. We are committed to the responsible: a) management; b) use; and c) protection; of Personal Information. This notice describes how we collect, disclose, and protect Personal Information. We collect Personal Information to: a) service your Transactions with us; and b) support our business functions. We may obtain Personal Information from: a) You; b) your Transactions with us; and c) third parties such as a consumer-reporting agency. Based on the type of product or service You apply for or get from us, Personal Information such as: a) your name; b) your address; c) your income; d) your payment; or e) your credit history; may be gathered from sources such as applications, Transactions, and consumer reports. To serve You and service our business, we may share certain Personal Information. We will share Personal Information, only as allowed by law, with affiliates such as: a) our insurance companies; b) our employee agents; c) our brokerage firms; and d) our administrators. As allowed by law, we may share Personal Financial Information with our affiliates to: a) market our products; or b) market our services; to You without providing You with an option to prevent these disclosures. | | | We may also share Personal Information, only as allowed by law, with unaffiliated third parties including: a) independent agents; b) brokerage firms; c) insurance companies; d) administrators; and e) service providers; who help us serve You and service our business. When allowed by law, we may share certain Personal Financial Information with other unaffiliated third parties who assist us by performing services or functions such as: a) taking surveys; b) marketing our products or services; or c) offering financial products or services under a joint agreement between us and one or more financial institutions. We, and third parties we partner with, may track some of the pages You visit through the use of: a) cookies; b) pixel tagging; or c) other technologies; and currently do not process or comply with any web browser’s “do not track” signal or similar mechanism that indicates a request to disable online tracking of individual users who visit our websites or use our services. We will not sell or share your Personal Financial Information with anyone for purposes unrelated to our business functions without offering You the opportunity to: a) “opt-out;” or b) “opt-in;” as required by law. We only disclose Personal Health Information with: a) your proper written authorization; or b) as otherwise allowed or required by law. Our employees have access to Personal Information in the course of doing their jobs, such as: a) underwriting policies; b) paying claims; c) developing new products; or d) advising customers of our products and services. |
We use manual and electronic security procedures to maintain: a) the confidentiality; and b) the integrity of; Personal Information that we have. We use these procedures to guard against unauthorized access. Some techniques we use to protect Personal Information include: a) secured files; b) user authentication; c) encryption; d) firewall technology; and e) the use of detection software. We are responsible for and must: a) identify information to be protected; b) provide an adequate level of protection for that data; c) grant access to protected data only to those people who must use it in the performance of their job-related duties. Employees who violate our Privacy Policy will be subject to discipline, which may include ending their employment with us. At the start of our business relationship, we will give You a copy of our current Privacy Policy. We will also give You a copy of our current Privacy Policy once a year if You maintain a continuing business relationship with us. We will continue to follow our Privacy Policy regarding Personal Information even when a business relationship no longer exists between us. | | | As used in this Privacy Notice: Application means your request for our product or service. Personal Financial Information means financial information such as: a) credit history; b) income; c) financial benefits; or d) policy or claim information. Personal Health Information means health information such as: a) your medical records; or b) information about your illness, disability or injury. Personal Information means information that identifies You personally and is not otherwise available to the public. It includes: a) Personal Financial Information; and b) Personal Health Information. Transaction means your business dealings with us, such as: a) your Application; b) your request for us to pay a claim; and c) your request for us to take an action on your account. You means an individual who has given us Personal Information in conjunction with: a) asking about; b) applying for; or c) obtaining; a financial product or service from us if the product or service is used mainly for personal, family, or household purposes. |
This Privacy Policy is being provided on behalf of the following affiliates of The Hartford Financial Services Group, Inc.:
1stAGChoice, Inc.; Access CoverageCorp, Inc.; Access CoverageCorp Technologies, Inc.; American Maturity Life Insurance Company; Archway 60 R, LLC; Business Management Group, Inc.; Champlain Life Reinsurance Company; DMS R, LLC; Eloy R, LLC; Ersatz Corporation; First State Insurance Company; Hartford Accident and Indemnity Company; Hartford Administrative Services Company; Hartford Casualty General Agency, Inc.; Hartford Casualty Insurance Company; Hartford-Comprehensive Employee Benefit Service Company; Hartford Equity Sales Company, Inc.; Hartford Fire General Agency, Inc.; Hartford Fire Insurance Company; Hartford Funds Management Company, LLC; Hartford Funds Management Group, Inc.; Hartford HLS Series Fund II, Inc.; Hartford Insurance Company of Illinois; Hartford Insurance Company of the Midwest; Hartford Insurance Company of the Southeast; Hartford Integrated Technologies, Inc.; Hartford International Life Reassurance Corporation; Hartford Funds Distributors, LLC; Hartford Investment Management Company; Hartford Life and Accident Insurance Company; Hartford Life and Annuity Insurance Company; Hartford Life Insurance Company; Hartford Life Private Placement, LLC; Hartford Lloyd’s Corporation; Hartford Lloyd’s Insurance Company; Hartford Mezzanine Investors I, LLC; Hartford Residual Market, L.C.C.; Hartford Retirement Services, LLC; Hartford Securities Distribution Company, Inc.; Hartford Series Fund, Inc.; Hartford Specialty Insurance Services of Texas, LLC; Hartford Strategic Investments, LLC; Hartford Underwriters Insurance Company; Hartford Technology Services Company, L.L.C.; Hartford of Texas General Agency, Inc.; Hartford Underwriters General Agency, Inc.; HARTRE Company, L.C.C.; HL Investment Advisors, LLC; HLA LLC; Horizon Management Group, LLC; HRA Brokerage Services, Inc.; Lanidex Class B, LLC; M-CAP Insurance Agency, LLC; New England Insurance Company; New England Reinsurance Corporation; Nutmeg Insurance Agency, Inc.; Nutmeg Insurance Company; Pacific Insurance Company, Limited; Planco, LLC: Property and Casualty Insurance Company of Hartford; Revere R, LLC; RVR R, LLC; Sentinel Insurance Company, Ltd.; Sunstone R, LLC; Symphony R, LLC; The Evergreen Group Incorporated; The Hartford Alternative Strategies Fund; The Hartford Mutual Funds, Inc.; The Hartford Mutual Funds II, Inc.; Trumbull Flood Management, L.L.C.; Trumbull Insurance Company; Twin City Fire Insurance Company; White River Life Reinsurance Company.
HPP Revised January 2014
HARTFORD HLS FUNDS
P.O. Box 14293
Lexington, KY 40512-4293
HARTFORDFUNDS
hartfordfunds.com
Hartford Series Fund, Inc. is underwritten and distributed by Hartford Funds Distributors, LLC.
Hartford Series Fund, Inc. inception dates range from 1977 to date. Hartford Series Fund, Inc. is not a subsidiary of The Hartford Financial Services Group, Inc. ("The Hartford") but is underwritten, distributed by and advised by subsidiaries of The Hartford. Investments in Hartford Series Fund, Inc. are not guaranteed by The Hartford or any other entity.
This report is submitted for the general information of the shareholders of the Funds. It is not authorized for distribution unless preceded or accompanied by a current prospectus for the Funds.
Investors should carefully consider the investment objectives, risks, charges, and expenses of Hartford Funds before investing. This and other information can be found in the prospectus, which can be obtained by calling 800-862-6668 (or 800-279-1541 for institutional investors). Investors should read them carefully before they invest.
HLSSAR-IO14 8-14 113546-3 Printed in U.S.A.
HARTFORDFUNDS
| | HARTFORD MIDCAP HLS FUND 2014 Semi Annual Report |
A MESSAGE FROM THE PRESIDENT
Dear Fellow Shareholders:
Thank you for investing in Hartford HLS Funds.
Market Review
U.S. equities (as represented by the S&P 500 Index) started 2014 on a shaky note after posting a strong 32.39% gain in 2013. However, stocks managed to maintain modest gains throughout the first quarter and returned to a generally steady climb in the second quarter. Through June 30, 2014, the S&P 500 Index advanced 7.14%. It appears that much of the market volatility during the year can be attributed to heightened international tensions. In particular, the Russian annexation of Ukraine’s Crimean Peninsula and increased tensions in Iraq were cause for concern.
On the domestic front, subdued economic and employment reports slowed stocks’ progress early in the new year, although much of the weakness seemed to dissipate as the year’s unusually harsh winter subsided. And despite initial reactions to the idea, when the U.S. Federal Reserve began tapering its quantitative-easing program in January by reducing its bond purchases by $10 billion a month, the markets took the policy change in stride.
Despite a rough start to the year for financial markets, the global economy seems to be settling into a slow-but-steady recovery. While first-quarter U.S. gross domestic product (GDP) growth was disappointing at -2.9%, U.S. consumer spending, which is a significant contributor toward economic growth, rose by 3% during the quarter. It appears that Europe is also maintaining its own recovery: The International Monetary Fund projects that Europe’s full-year GDP growth may breach positive territory for the first time since 2011.
The impact of international affairs on stocks so far this year is an important reminder to stay informed about both domestic and international economic developments, and any effects they may have on your individual investment goals. If you have not already had a mid-year review of your portfolio, it may be a good time to meet with your financial advisor to review your progress and make certain your investments are prepared for all market environments:
| • | Is your portfolio properly diversified with an appropriate mix of stocks and bonds? |
| • | Is your portfolio positioned to take advantage of the global economic recovery, with investments in both domestic and international holdings? |
| • | Are your investments still in line with your risk tolerance and investment time horizon? |
Your financial professional can help you choose options within our fund family to help you reach your investment goals with confidence.
Thank you again for investing with Hartford HLS Funds.
James Davey
President
Hartford HLS Funds
1 The S&P 500 Index is a market capitalization-weighted price index composed of 500 widely held common stocks.
2The Dow Jones Industrial Average is an unmanaged, price-weighted index of 30 of the largest, most widely held stocks traded on the New York Stock Exchange.
Hartford MidCap HLS Fund
Table of Contents
This report is prepared for the general information of contract owners and qualified retirement plan participants. It is not an offer of contracts or of qualified retirement plans. It should not be used in connection with any offer, except in conjunction with the appropriate product prospectus which contains all pertinent information including the applicable sales, administrative and other charges.
The views expressed in the Fund’s Manager Discussion under ‘‘Why did the Fund perform this way?’’ and ‘‘What is the outlook?’’ are views of the Fund’s sub-adviser and portfolio management team through the end of the period and are subject to change based on market and other conditions. The Fund’s Manager Discussion is for informational purposes only and does not represent an offer, recommendation or solicitation to buy, hold or sell any security. The specific securities identified and described, if any, do not represent all of the securities purchased or sold and you should not assume that investments in the securities identified and discussed will be profitable.
| Hartford MidCap HLS Fund inception 07/14/1997 |
| (sub-advised by Wellington Management Company, LLP) |
| |
| Investment objective – The Fund seeks long-term growth of capital. |
Performance Overview 6/30/04 - 6/30/14

The chart above represents the hypothetical growth of a $10,000 investment in Class IA. Growth results in classes other than Class IA will vary from what is seen above due to differences in the expenses charged to those share classes.
Average Annual Total Returns (as of 6/30/14)
| | 6 Month† | 1 Year | 5 Years | 10 Years |
| MidCap IA | 11.20 % | 32.63 % | 20.94 % | 11.68 % |
| MidCap IB | 11.06 % | 32.30 % | 20.64 % | 11.40 % |
| S&P MidCap 400 Index | 7.50 % | 25.24 % | 21.67 % | 10.50 % |
PERFORMANCE DATA QUOTED REPRESENTS PAST PERFORMANCE AND DOES NOT GUARANTEE FUTURE RESULTS. The investment return and principal value of the investment will fluctuate so that investors’ shares, when redeemed, may be worth more or less than their original cost. Current performance may be lower or higher than the performance data quoted. To obtain performance data current to the most recent month-end, please visit our website www.hartfordfunds.com.
Total returns presented above were calculated using the Fund’s net asset value available to shareholders for sale or redemption of Fund shares on June 30, 2014, which may exclude investment transactions as of this date. All share class returns assume the reinvestment of all distributions at net asset value and the deduction of all fund expenses.
S&P MidCap 400 Index is an unmanaged index of common stocks of companies chosen by S&P designed to represent price movements in the mid-cap U.S. equity market.
The index is unmanaged, and its results include reinvested dividends and/or distributions, but do not reflect the effect of sales charges, commissions, expenses or taxes.
You cannot invest directly in an index.
As shown in the Fund's current prospectus dated May 1, 2014, the total annual operating expense ratios for Class IA and Class IB were 0.71% and 0.96%, respectively. Actual expenses may be higher. Please see the accompanying Financial Highlights for expense ratios for the six-month period ended June 30, 2014.
The chart and table do not reflect the deductions of taxes, sales charges or other fees which may be applied at the variable life insurance, variable annuity or qualified retirement plan product level. Any such additional sales charges or other fees or expenses would lower the contract’s or plan’s performance.
All investments are subject to risk including the possible loss of principal. For a discussion of the Fund’s risks, please see the Main Risks section of this report. For more detailed information on the risks associated with an investment in the Fund, please see the prospectus.
| Hartford MidCap HLS Fund |
| Manager Discussion |
| June 30, 2014 (Unaudited) |
| Portfolio Managers | |
| Philip W. Ruedi, CFA | Mark A. Whitaker, CFA |
| Senior Vice President and Equity Portfolio Manager | Vice President and Equity Portfolio Manager |
| |
How did the Fund perform?
The Class IA shares of the Hartford MidCap HLS Fund returned 11.20% for the six-month period ended June 30, 2014, outperforming the Fund’s benchmark, the S&P MidCap 400 Index, which returned 7.50% for the same period. The Fund also outperformed the 6.50% average return of the Lipper Mid-Cap Core Funds peer group, a group of funds with investment strategies similar to those of the Fund.
Why did the Fund perform this way?
U.S. equities surged during the period, ending June near an all-time high. After finishing 2013 with their best year since 1997, U.S. stocks began 2014 with their worst month in nearly two years. Worries about a slowdown in China and general concern surrounding emerging markets overshadowed a fairly benign domestic environment. However, robust merger and acquisition activity and an uncontested increase in the debt ceiling from Congress helped stoke investors' risk appetites in February. Earnings season in April provided a varied yet encouraging picture, with companies generally reporting healthy earnings but more subdued revenues. The rally continued in May amid renewed signs of life in the housing market and the best payroll gains in more than two years. In June, strong manufacturing activity, coupled with continued positive momentum in housing and employment data, helped to offset a large negative revision to first quarter economic growth.
Overall equity market performance was positive for the period across all market capitalizations: mid cap (+8%), large cap (+7%), and small cap equities (+3%) all rose, as represented by the S&P MidCap 400, S&P 500, and Russell 2000 Indices, respectively. Within the S&P MidCap 400 Index, all ten sectors posted positive returns during the six-month period. The Consumer Staples (+22.9%), Telecommunication Services (+21.2%), and Utilities (+16.4%) sectors performed best, while the Consumer Discretionary (+2.8%), Information Technology (+4.1%) and Industrials (+5.8%) sectors lagged on a relative basis.
Outperformance versus the S&P MidCap 400 Index during the period was driven by strong security selection in the Healthcare, Information Technology, and Consumer Discretionary sectors. Weak stock selection in the Consumer Staples and Financials sectors slightly offset those gains. Sector allocation, which is a residual of our bottom-up stock selection process, modestly detracted from relative performance during the period. Primary drivers included an overweight allocation to Information Technology and underweight allocations to Utilities and Consumer Staples.
Top contributors to relative and absolute performance during the period were NXP Semiconductors (Information Technology), TripAdvisor (Consumer Discretionary), and Alkermes (Healthcare). Shares of NXP Semiconductors, a Netherlands-based semiconductor company, rose around speculation that NXP will provide the NFC technology (short-range communications between compatible devices) to Apple's iPhone 6 and iWatch. TripAdvisor, a leading internet-based travel business, saw shares rise as the company posted in line first quarter earnings and increased full-year revenue guidance due to strength in its click-based ad revenue. Alkermes is a U.S. biopharmaceutical company that focuses on treatments for central nervous system diseases and disorders. The stock rose as markets are responding favorably to the company’s new drug pipeline, which includes new treatments for schizophrenia and other long-acting injectibles.
Top detractors from relative performance during the period were DreamWorks Animation (Consumer Discretionary), Jacobs Engineering (Industrials), and Genpact (Information Technology). Dreamworks Animation is engaged in the development, production and exploitation of animated films and their associated characters in the worldwide theatrical, home entertainment, television, merchandising and licensing and other markets. Shares declined due to disappointment about new films such as How to Train Your Dragon 2. We continue to believe that Dreamworks has an attractive pipeline. Jacobs Engineering is a professional services firm that helps corporate and government customers design and build construction projects. Shares fell as sales growth in 2014 is expected to be slower than markets had expected due to slower than expected activity in the Australian mining industry and in Europe. Genpact, an India-based company engaged in business process management, outsourcing, shared services and information outsourcing, saw shares fall due to the slower than expected sales growth. We believe that current investments by Genpact will lead to accelerating sales growth. VeriSign (Information Technology) also detracted from absolute performance during the period.
Derivatives are not used in a significant manner in this Fund and did not have a material impact on performance during the period.
What is the outlook?
We believe that mid cap equities represent “the sweet spot” of the stock market, offering in our view, the stability and quality of market leading companies, an advantage over small caps, plus the opportunity for significant, dynamic growth in revenues and earnings that many large cap companies lack. Our F/V/E framework, which incorporates fundamentals, valuation, and expectations in our assessment of each company we consider, enables us to create
| Hartford MidCap HLS Fund |
| Manager Discussion – (continued) |
| June 30, 2014 (Unaudited) |
what we believe to be a balanced portfolio of quality businesses and broad diversification across market sectors, all while maintaining a purely mid cap equity investment approach.
At the end of the period, our largest overweights relative to the S&P MidCap 400 Index were in the Healthcare and Energy sectors. Our largest underweights were in the Financials and Materials sectors.
Diversification by Sector
as of June 30, 2014
| Sector | | Percentage of
Net Assets | |
| Equity Securities | | | | |
| Consumer Discretionary | | | 13.5 | % |
| Consumer Staples | | | 2.5 | |
| Energy | | | 11.5 | |
| Financials | | | 13.4 | |
| Health Care | | | 16.3 | |
| Industrials | | | 18.9 | |
| Information Technology | | | 20.3 | |
| Materials | | | 2.2 | |
| Utilities | | | 2.1 | |
| Total | | | 100.7 | % |
| Short-Term Investments | | | 0.2 | |
| Other Assets and Liabilities | | | (0.9 | ) |
| Total | | | 100.0 | % |
A sector may be comprised of several industries. For Fund compliance purposes, the Fund may not use the same classification system and these sector classifications are used for reporting ease.
| Hartford MidCap HLS Fund |
| Schedule of Investments |
| June 30, 2014 (Unaudited) |
| (000’s Omitted) |
| Shares or Principal Amount | | Market Value ╪ | |
Common Stocks - 100.7% |
| | | | | Automobiles and Components - 2.8% | | | | |
| | 696 | | | Allison Transmission Holdings, Inc. | | $ | 21,643 | |
| | 387 | | | Harley-Davidson, Inc. | | | 27,026 | |
| | | | | | | | 48,669 | |
| | | | | Banks - 3.7% | | | | |
| | 90 | | | Cullen/Frost Bankers, Inc. | | | 7,122 | |
| | 192 | | | East West Bancorp, Inc. | | | 6,729 | |
| | 337 | | | First Republic Bank | | | 18,506 | |
| | 256 | | | M&T Bank Corp. | | | 31,796 | |
| | | | | | | | 64,153 | |
| | | | | Capital Goods - 7.1% | | | | |
| | 248 | | | IDEX Corp. | | | 20,054 | |
| | 338 | | | Jacobs Engineering Group, Inc. ● | | | 18,035 | |
| | 287 | | | Lennox International, Inc. | | | 25,674 | |
| | 274 | | | MSC Industrial Direct Co., Inc. | | | 26,212 | |
| | 321 | | | PACCAR, Inc. | | | 20,191 | |
| | 165 | | | Pall Corp. | | | 14,116 | |
| | | | | | | | 124,282 | |
| | | | | Commercial and Professional Services - 8.7% | | | | |
| | 364 | | | Clean Harbors, Inc. ● | | | 23,392 | |
| | 510 | | | Equifax, Inc. ● | | | 36,985 | |
| | 343 | | | Manpowergroup, Inc. | | | 29,097 | |
| | 737 | | | Robert Half International, Inc. | | | 35,165 | |
| | 546 | | | Waste Connections, Inc. | | | 26,524 | |
| | | | | | | | 151,163 | |
| | | | | Consumer Durables and Apparel - 1.6% | | | | |
| | 25 | | | NVR, Inc. ● | | | 28,714 | |
| | | | | | | | | |
| | | | | Diversified Financials - 3.5% | | | | |
| | 277 | | | Invesco Ltd. | | | 10,462 | |
| | 186 | | | Moody's Corp. | | | 16,310 | |
| | 235 | | | MSCI, Inc. ● | | | 10,781 | |
| | 666 | | | SEI Investments Co. | | | 21,833 | |
| | 21 | | | T. Rowe Price Group, Inc. | | | 1,771 | |
| | | | | | | | 61,157 | |
| | | | | Energy - 11.5% | | | | |
| | 315 | | | Athlon Energy, Inc. ● | | | 15,009 | |
| | 373 | | | Cabot Oil & Gas Corp. | | | 12,748 | |
| | 774 | | | Cobalt International Energy, Inc. ● | | | 14,203 | |
| | 390 | | | Consol Energy, Inc. | | | 17,990 | |
| | 720 | | | Denbury Resources, Inc. | | | 13,293 | |
| | 235 | | | Energen Corp. | | | 20,869 | |
| | 175 | | | EQT Corp. | | | 18,717 | |
| | 491 | | | Laredo Petroleum, Inc. ● | | | 15,207 | |
| | 121 | | | Oceaneering International, Inc. | | | 9,429 | |
| | 612 | | | Patterson-UTI Energy, Inc. | | | 21,383 | |
| | 209 | | | Range Resources Corp. | | | 18,150 | |
| | 659 | | | Superior Energy Services, Inc. | | | 23,820 | |
| | | | | | | | 200,818 | |
| | | | | Food and Staples Retailing - 0.5% | | | | |
| | 90 | | | PriceSmart, Inc. | | | 7,849 | |
| | | | | | | | | |
| | | | | Food, Beverage and Tobacco - 2.0% | | | | |
| | 228 | | | Molson Coors Brewing Co. | | | 16,945 | |
| | 247 | | | Monster Beverage Corp. ● | | | 17,530 | |
| | | | | | | | 34,475 | |
| | | | | Health Care Equipment and Services - 6.5% | | | | |
| | 413 | | | Envision Healthcare Holdings ● | | | 14,834 | |
| | 492 | | | IMS Health Holdings, Inc. ● | | | 12,646 | |
| | 181 | | | MEDNAX, Inc. ● | | | 10,525 | |
| | 157 | | | Omnicare, Inc. | | | 10,464 | |
| | 351 | | | Patterson Cos., Inc. | | | 13,880 | |
| | 220 | | | Sirona Dental Systems, Inc. ● | | | 18,142 | |
| | 230 | | | Team Health Holdings ● | | | 11,483 | |
| | 232 | | | Universal Health Services, Inc. Class B | | | 22,220 | |
| | | | | | | | 114,194 | |
| | | | | Insurance - 5.6% | | | | |
| | 48 | | | Alleghany Corp. ● | | | 21,135 | |
| | 39 | | | Fairfax Financial Holdings Ltd. | | | 18,265 | |
| | 50 | | | Markel Corp. ● | | | 32,497 | |
| | 275 | | | W.R. Berkley Corp. | | | 12,713 | |
| | 22 | | | White Mountains Insurance Group Ltd. | | | 13,167 | |
| | | | | | | | 97,777 | |
| | | | | Materials - 2.2% | | | | |
| | 234 | | | Packaging Corp. of America | | | 16,743 | |
| | 51 | | | Sherwin-Williams Co. | | | 10,596 | |
| | 200 | | | Silgan Holdings, Inc. | | | 10,141 | |
| | | | | | | | 37,480 | |
| | | | | Media - 1.6% | | | | |
| | 475 | | | DreamWorks Animation SKG, Inc. ● | | | 11,049 | |
| | 573 | | | Pandora Media, Inc. ● | | | 16,908 | |
| | | | | | | | 27,957 | |
| | | | | Pharmaceuticals, Biotechnology and Life Sciences - 9.8% | | | | |
| | 842 | | | Alkermes plc ● | | | 42,380 | |
| | 161 | | | Alnylam Pharmaceuticals, Inc. ● | | | 10,163 | |
| | 282 | | | Cubist Pharmaceuticals, Inc. ● | | | 19,720 | |
| | 206 | | | Hospira, Inc. ● | | | 10,577 | |
| | 361 | | | Incyte Corp. ● | | | 20,387 | |
| | 762 | | | Ironwood Pharmaceuticals, Inc. ● | | | 11,679 | |
| | 224 | | | Medivation, Inc. ● | | | 17,229 | |
| | 193 | | | Salix Pharmaceuticals Ltd. ● | | | 23,788 | |
| | 147 | | | Waters Corp. ● | | | 15,344 | |
| | | | | | | | 171,267 | |
| | | | | Real Estate - 0.6% | | | | |
| | 77 | | | Zillow, Inc. ● | | | 10,958 | |
| | | | | | | | | |
| | | | | Retailing - 7.5% | | | | |
| | 294 | | | Advance Automotive Parts, Inc. | | | 39,663 | |
| | 518 | | | CarMax, Inc. ● | | | 26,936 | |
| | 554 | | | HomeAway, Inc. ● | | | 19,285 | |
| | 97 | | | Tiffany & Co. | | | 9,726 | |
| | 321 | | | TripAdvisor, Inc. ● | | | 34,845 | |
| | | | | | | | 130,455 | |
| | | | | Semiconductors and Semiconductor Equipment - 2.5% | | | | |
| | 514 | | | Maxim Integrated Products, Inc. | | | 17,376 | |
| | 391 | | | NXP Semiconductors N.V. ● | | | 25,894 | |
| | | | | | | | 43,270 | |
| | | | | Software and Services - 13.2% | | | | |
| | 460 | | | Akamai Technologies, Inc. ● | | | 28,114 | |
| | 375 | | | Autodesk, Inc. ● | | | 21,150 | |
| | 171 | | | Factset Research Systems, Inc. | | | 20,515 | |
| | 2,007 | | | Genpact Ltd. ● | | | 35,183 | |
| | 294 | | | Informatica Corp. ● | | | 10,468 | |
| | 247 | | | Micros Systems, Inc. ● | | | 16,747 | |
| | 216 | | | Solera Holdings, Inc. | | | 14,537 | |
| | 1,074 | | | Vantiv, Inc. ● | | | 36,104 | |
| | 252 | | | VeriSign, Inc. ● | | | 12,322 | |
| | 215 | | | WEX, Inc. ● | | | 22,560 | |
The accompanying notes are an integral part of these financial statements.
| Hartford MidCap HLS Fund |
| Schedule of Investments – (continued) |
| June 30, 2014 (Unaudited) |
| (000’s Omitted) |
| Shares or Principal Amount | | | | | | Market Value ╪ | |
Common Stocks - 100.7% - (continued) |
| | | | | Software and Services - 13.2% - (continued) | | | | | | | | |
| | 164 | | | Yelp, Inc. ● | | | | | | $ | 12,549 | |
| | | | | | | | | | | | 230,249 | |
| | | | | Technology Hardware and Equipment - 4.6% | | | | | | | | |
| | 179 | | | Amphenol Corp. Class A | | | | | | | 17,267 | |
| | 99 | | | FEI Co. | | | | | | | 8,995 | |
| | 770 | | | National Instruments Corp. | | | | | | | 24,948 | |
| | 793 | | | Trimble Navigation Ltd. ● | | | | | | | 29,299 | |
| | | | | | | | | | | | 80,509 | |
| | | | | Transportation - 3.1% | | | | | | | | |
| | 28 | | | AMERCO, Inc. | | | | | | | 8,019 | |
| | 360 | | | Expeditors International of Washington, Inc. | | | | | | | 15,901 | |
| | 169 | | | Genesee & Wyoming, Inc. Class A ● | | | | | | | 17,727 | |
| | 163 | | | J.B. Hunt Transport Services, Inc. | | | | | | | 12,051 | |
| | | | | | | | | | | | 53,698 | |
| | | | | Utilities - 2.1% | | | | | | | | |
| | 136 | | | Northeast Utilities | | | | | | | 6,430 | |
| | 447 | | | UGI Corp. | | | | | | | 22,591 | |
| | 169 | | | Wisconsin Energy Corp. | | | | | | | 7,913 | |
| | | | | | | | | | | | 36,934 | |
| | | | | Total Common Stocks | | | | | | | | |
| | | | | ( Cost $1,253,151) | | | | | | $ | 1,756,028 | |
| | | | | | | | | | | | | |
| | | | | Total Long-Term Investments | | | | | | | | |
| | | | | (Cost $1,253,151) | | | | | | $ | 1,756,028 | |
| | | | | | | | | | | | | |
| Short-Term Investments - 0.2% |
| Repurchase Agreements - 0.2% |
| | | | | Bank of America Merrill Lynch TriParty Repurchase
Agreement (maturing on 07/01/2014 in the
amount of $331, collateralized by FHLMC 2.23%
- 5.99%, 2030 - 2044, FNMA 2.31% - 6.34%,
2020 - 2042, value of $337) | | | | | | | | |
| 331 | | | 0.10%, 6/30/2014 | | | | | | | 331 | |
| | | | | Bank of Montreal TriParty Repurchase Agreement
(maturing on 07/01/2014 in the amount of $505,
collateralized by U.S. Treasury Bill 0.13%, 2015,
U.S. Treasury Bond 2.75% - 10.63%, 2015 -
2044, U.S. Treasury Note 0.13% - 4.50%, 2014 -
2024, value of $515) | | | | | | | | |
| | 505 | | | 0.09%, 6/30/2014 | | | | | | | 505 | |
| | | | | Bank of Montreal TriParty Repurchase Agreement
(maturing on 07/01/2014 in the amount of $215,
collateralized by FHLMC 2.00% - 5.50%, 2018 -
2041, FNMA 2.00% - 4.50%, 2026 - 2042,
GNMA 3.00% - 4.00%, 2042 - 2043, U.S.
Treasury Bill 0.05%, 2014, U.S. Treasury Note
0.75%, 2018, value of $220) | | | | | | | | |
| | 215 | | | 0.11%, 6/30/2014 | | | | | | | 215 | |
| | | | | Barclays Capital TriParty Repurchase Agreement
(maturing on 07/01/2014 in the amount of $199,
collateralized by U.S. Treasury Note 0.63% -
0.88%, 2018 - 2019, value of $203) | | | | | | | | |
| | 199 | | | 0.07%, 6/30/2014 | | | | | | | 199 | |
| | | | | Citigroup Global Markets, Inc. TriParty Repurchase
Agreement (maturing on 07/01/2014 in the
amount of $459, collateralized by U.S. Treasury
Bond 4.38% - 7.50%, 2016 - 2040, U.S.
Treasury Note 0.50% - 3.00%, 2014 - 2020,
value of $468) | | | | | | | | |
| 459 | | | 0.06%, 6/30/2014 | | | | | | | 459 | |
| | | | | RBS Securities Inc. TriParty Repurchase
Agreement (maturing on 07/01/2014 in the
amount of $703, collateralized by U.S. Treasury
Note 0.38% - 3.13%, 2015 - 2022, value of
$717) | | | | | | | | |
| | 703 | | | 0.08%, 6/30/2014 | | | | | | | 703 | |
| | | | | TD Securities TriParty Repurchase Agreement
(maturing on 07/01/2014 in the amount of
$1,464, collateralized by FHLMC 3.50% -
4.00%, 2026 - 2044, FNMA 2.50% - 5.00%,
2025 - 2043, value of $1,493) | | | | | | | | |
| | 1,464 | | | 0.11%, 6/30/2014 | | | | | | | 1,464 | |
| | | | | UBS Securities Repurchase Agreement (maturing
on 07/01/2014 in the amount of $6,
collateralized by U.S. Treasury Note 2.13%,
2020, value of $6) | | | | | | | | |
| | 6 | | | 0.05%, 6/30/2014 | | | | | | | 6 | |
| | | | | | | | | | | | 3,882 | |
| | | | | Total Short-Term Investments | | | | | | | | |
| | | | | (Cost $3,882) | | | | | | $ | 3,882 | |
| | | | | | | | | | | | | |
| | | | Total Investments | | | | | | | | |
| | | | | (Cost $1,257,033) ▲ | | | 100.9 | % | | $ | 1,759,910 | |
| | | | | Other Assets and Liabilities | | | (0.9 | )% | | | (15,337 | ) |
| | | | | Total Net Assets | | | 100.0 | % | | $ | 1,744,573 | |
The accompanying notes are an integral part of these financial statements.
| Hartford MidCap HLS Fund |
| Schedule of Investments – (continued) |
| June 30, 2014 (Unaudited) |
| (000’s Omitted) |
| Note: | Percentage of investments as shown is the ratio of the total market value to total net assets. |
| | |
| | Prices of foreign equities that are principally traded on certain foreign markets may be adjusted daily pursuant to a fair value pricing service approved by the Board of Directors in order to reflect an adjustment for factors occurring after the close of certain foreign markets but before the close of the New York Stock Exchange. |
| ▲ | At June 30, 2014, the cost of securities for federal income tax purposes was $1,262,022 and the aggregate gross unrealized appreciation and depreciation based on that cost were: |
| Unrealized Appreciation | | $ | 504,656 | |
| Unrealized Depreciation | | | (6,768 | ) |
| Net Unrealized Appreciation | | $ | 497,888 | |
| ╪ | See Significant Accounting Policies of accompanying Notes to Financial Statements regarding valuation of securities. |
| GLOSSARY: (abbreviations used in preceding Schedule of Investments) |
| |
| Other Abbreviations: |
| FHLMC | Federal Home Loan Mortgage Corp. |
| FNMA | Federal National Mortgage Association |
| GNMA | Government National Mortgage Association |
| |
The accompanying notes are an integral part of these financial statements.
| Hartford MidCap HLS Fund |
| Investment Valuation Hierarchy Level Summary |
| June 30, 2014 (Unaudited) |
| (000’s Omitted) |
| | | Total | | | Level 1 ♦ | | | Level 2 ♦ | | | Level 3 | |
| Assets: | | | | | | | | | | | | | | | | |
| Common Stocks ‡ | | $ | 1,756,028 | | | $ | 1,756,028 | | | $ | – | | | $ | – | |
| Short-Term Investments | | | 3,882 | | | | – | | | | 3,882 | | | | – | |
| Total | | $ | 1,759,910 | | | $ | 1,756,028 | | | $ | 3,882 | | | $ | – | |
| ♦ | For the six-month period ended June 30, 2014, there were no transfers between Level 1 and Level 2. |
| ‡ | The Fund has all or primarily all of the equity securities categorized in a particular level. Refer to the Schedule of Investments for further industry breakout. |
| Note: | For purposes of reporting transfers between different hierarchy levels, both transfers in and out of each level, as applicable, are shown as if they occurred at the beginning of the period. |
The accompanying notes are an integral part of these financial statements.
| Hartford MidCap HLS Fund |
| Statement of Assets and Liabilities |
| June 30, 2014 (Unaudited) |
| (000’s Omitted) |
| Assets: | | | | |
| Investments in securities, at market value (cost $1,257,033) | | $ | 1,759,910 | |
| Cash | | | 5 | |
| Receivables: | | | | |
| Investment securities sold | | | 6,038 | |
| Fund shares sold | | | 338 | |
| Dividends and interest | | | 428 | |
| Other assets | | | 4 | |
| Total assets | | | 1,766,723 | |
| Liabilities: | | | | |
| Payables: | | | | |
| Investment securities purchased | | | 4,076 | |
| Fund shares redeemed | | | 17,842 | |
| Investment management fees | | | 162 | |
| Distribution fees | | | 3 | |
| Accrued expenses | | | 67 | |
| Total liabilities | | | 22,150 | |
| Net assets | | $ | 1,744,573 | |
| Summary of Net Assets: | | | | |
| Capital stock and paid-in-capital | | $ | 924,993 | |
| Undistributed net investment income | | | 1,834 | |
| Accumulated net realized gain | | | 314,869 | |
| Unrealized appreciation of investments | | | 502,877 | |
| Net assets | | $ | 1,744,573 | |
| Shares authorized | | | 2,400,000 | |
| Par value | | $ | 0.001 | |
| Class IA: Net asset value per share | | $ | 42.11 | |
| Shares outstanding | | | 39,363 | |
| Net assets | | $ | 1,657,640 | |
| Class IB: Net asset value per share | | $ | 41.67 | |
| Shares outstanding | | | 2,086 | |
| Net assets | | $ | 86,933 | |
The accompanying notes are an integral part of these financial statements.
| Hartford MidCap HLS Fund |
| Statement of Operations |
| For the Six-Month Period Ended June 30, 2014 (Unaudited) |
| (000’s Omitted) |
| Investment Income: | | | | |
| Dividends | | $ | 6,110 | |
| Interest | | | 1 | |
| Less: Foreign tax withheld | | | (42 | ) |
| Total investment income, net | | | 6,069 | |
| | | | | |
| Expenses: | | | | |
| Investment management fees | | | 5,554 | |
| Transfer agent fees | | | 3 | |
| Distribution fees - Class IB | | | 103 | |
| Custodian fees | | | 4 | |
| Accounting services fees | | | 82 | |
| Board of Directors' fees | | | 19 | |
| Audit fees | | | 11 | |
| Other expenses | | | 77 | |
| Total expenses (before fees paid indirectly) | | | 5,853 | |
| Commission recapture | | | (9 | ) |
| Total fees paid indirectly | | | (9 | ) |
| Total expenses, net | | | 5,844 | |
| Net Investment Income | | | 225 | |
| | | | | |
| Net Realized Gain on Investments and Foreign Currency Transactions: | | | | |
| Net realized gain on investments | | | 133,227 | |
| Net realized gain on foreign currency contracts | | | 16 | |
| Net realized loss on other foreign currency transactions | | | (16 | ) |
| Net Realized Gain on Investments and Foreign Currency Transactions | | | 133,227 | |
| | | | | |
| Net Changes in Unrealized Appreciation of Investments: | | | | |
| Net unrealized appreciation of investments | | | 44,454 | |
| Net Changes in Unrealized Appreciation of Investments | | | 44,454 | |
| Net Gain on Investments and Foreign Currency Transactions | | | 177,681 | |
| Net Increase in Net Assets Resulting from Operations | | $ | 177,906 | |
The accompanying notes are an integral part of these financial statements.
| Hartford MidCap HLS Fund |
| Statement of Changes in Net Assets |
| |
| (000’s Omitted) |
| | | For the
Six-Month
Period Ended
June 30, 2014
(Unaudited) | | | For the
Year Ended
December 31,
2013 | |
| Operations: | | | | | | | | |
| Net investment income | | $ | 225 | | | $ | 3,040 | |
| Net realized gain on investments and foreign currency transactions | | | 133,227 | | | | 203,130 | |
| Net unrealized appreciation of investments | | | 44,454 | | | | 297,608 | |
| Net Increase in Net Assets Resulting from Operations | | | 177,906 | | | | 503,778 | |
| Distributions to Shareholders: | | | | | | | | |
| From net investment income | | | | | | | | |
| Class IA | | | — | | | | (1,638 | ) |
| Class IB | | | — | | | | (14 | ) |
| Total from net investment income | | | — | | | | (1,652 | ) |
| From net realized gain on investments | | | | | | | | |
| Class IA | | | — | | | | (53,879 | ) |
| Class IB | | | — | | | | (3,100 | ) |
| Total from net realized gain on investments | | | — | | | | (56,979 | ) |
| Total distributions | | | — | | | | (58,631 | ) |
| Capital Share Transactions: | | | | | | | | |
| Class IA | | | | | | | | |
| Sold | | | 180,959 | | | | 98,550 | |
| Issued on reinvestment of distributions | | | — | | | | 55,517 | |
| Redeemed | | | (176,068 | ) | | | (418,031 | ) |
| Total capital share transactions | | | 4,891 | | | | (263,964 | ) |
| Class IB | | | | | | | | |
| Sold | | | 2,950 | | | | 11,537 | |
| Issued on reinvestment of distributions | | | — | | | | 3,114 | |
| Redeemed | | | (7,283 | ) | | | (25,943 | ) |
| Total capital share transactions | | | (4,333 | ) | | | (11,292 | ) |
| Net increase (decrease) from capital share transactions | | | 558 | | | | (275,256 | ) |
| Net Increase in Net Assets | | | 178,464 | | | | 169,891 | |
| Net Assets: | | | | | | | | |
| Beginning of period | | | 1,566,109 | | | | 1,396,218 | |
| End of period | | $ | 1,744,573 | | | $ | 1,566,109 | |
| Undistributed (distribution in excess of) | | | | | | | | |
| net investment income | | $ | 1,834 | | | $ | 1,609 | |
| Shares: | | | | | | | | |
| Class IA | | | | | | | | |
| Sold | | | 4,650 | | | | 3,001 | |
| Issued on reinvestment of distributions | | | — | | | | 1,576 | |
| Redeemed | | | (4,466 | ) | | | (12,467 | ) |
| Total share activity | | | 184 | | | | (7,890 | ) |
| Class IB | | | | | | | | |
| Sold | | | 75 | | | | 353 | |
| Issued on reinvestment of distributions | | | — | | | | 90 | |
| Redeemed | | | (188 | ) | | | (784 | ) |
| Total share activity | | | (113 | ) | | | (341 | ) |
The accompanying notes are an integral part of these financial statements.
| Hartford MidCap HLS Fund |
| Notes to Financial Statements |
| June 30, 2014 (Unaudited) |
| (000’s Omitted) |
Organization:
Hartford MidCap HLS Fund (the "Fund") serves as an underlying investment option for certain variable annuity and variable life insurance separate accounts of Hartford Life Insurance Company (“HLIC”) and its affiliates and certain qualified retirement plans. The Fund may also serve as an underlying investment option for certain variable annuity and variable life separate accounts of other insurance companies. Owners of variable annuity contracts and policyholders of variable life insurance contracts may choose the funds permitted in the variable insurance contract prospectus. In addition, participants in certain qualified retirement plans may choose the Fund if permitted by their plans.
Hartford Series Fund, Inc. (the “Company”) is an open-end registered management investment company comprised of twenty-eight portfolios. Financial statements for the Fund, a series of the Company, are included in this report.
The Company is organized under the laws of the State of Maryland and is registered with the Securities and Exchange Commission (“SEC”) under the Investment Company Act of 1940, as amended (“1940 Act”). The Fund is a diversified open-end management investment company.
The Fund is divided into Class IA, Class IB and Class IC shares. Each class is offered at the per share net asset value (“NAV”) without a sales charge and is subject to the same expenses, except that the Class IB shares are subject to distribution and service fees charged pursuant to a Distribution Plan adopted in accordance with Rule 12b-1 under the 1940 Act and Class IC shares are subject to distribution fees charged pursuant to a Distribution Plan adopted in accordance with Rule 12b-1 under the 1940 Act and are also subject to an administrative service fee. Class IC shares have not commenced operations and are not currently offered for sale as of the date of this report.
Significant Accounting Policies:
The following is a summary of significant accounting policies of the Fund in the preparation of its financial statements, which are in accordance with United States Generally Accepted Accounting Principles (“U.S. GAAP”). The preparation of financial statements in accordance with U.S. GAAP may require management to make estimates and assumptions that affect the reported amounts of assets and liabilities and disclosure of contingent assets and liabilities at the date of the financial statements and the reported amounts of increases and decreases in net assets from operations during the reporting period. Actual results could differ from those estimates.
Determination of Net Asset Value – The NAV of each class of the Fund's shares is determined as of the close of regular trading (normally 4:00 p.m. Eastern Time) (the “NYSE Close”) on each day that the New York Stock Exchange (the “Exchange”) is open (“Valuation Date”). Information that becomes known to the Fund after the NAV has been calculated on a particular day will not generally be used to retroactively adjust the NAV determined earlier that day.
Investment Valuation and Fair Value Measurements – For purposes of calculating the NAV, portfolio investments and other assets held by the Fund's portfolio for which market quotes are readily available are valued at market value. Market value is generally determined on the basis of last reported sales prices or official close price. If no sales are reported, market value is based on quotes obtained from a quotation reporting system, established market makers, or independent pricing services. If market prices are not readily available or are deemed unreliable, the Fund will use the fair value of the investment as determined in good faith under policies and procedures established by and under the supervision of the Company's Board of Directors. Market quotes are considered not readily available where there is an absence of current or reliable market-based data (e.g., trade information or indicative market quotes), including where events occur after the close of the relevant market, but prior to the NYSE Close, that materially affect the values of the Fund's portfolio investments or assets. In addition, market quotes are considered not readily available when, due to extraordinary circumstances, the exchanges or markets on which the investments trade do not open for trading for the entire day and no other market prices are available. In addition, prices of foreign equities that are principally traded on certain foreign markets may be adjusted daily pursuant to a fair value pricing service approved by the Board of Directors in order to reflect an adjustment for the factors occurring after the close of certain foreign markets but before the NYSE Close. Investments that are primarily traded on foreign markets may trade on days that are not business days of the Fund. The value of the foreign investments in which the Fund invests may change on days when a shareholder will not be able to purchase or redeem shares of the Fund. Fair value pricing is subjective in nature and the use of fair value pricing by the Fund may cause the NAV of its shares to differ significantly from the NAV
| Hartford MidCap HLS Fund |
| Notes to Financial Statements – (continued) |
| June 30, 2014 (Unaudited) |
| (000’s Omitted) |
that would have been calculated using market prices at the close of the exchange on which a portfolio investment is primarily traded. There can be no assurance that the Fund could obtain the fair market value assigned to an investment if the Fund were to sell the investment at approximately the time at which the Fund determines its NAV.
Investments valued in currencies other than U.S. dollars are converted to U.S. dollars using exchange rates obtained from independent pricing services for calculation of the NAV. As a result, the NAV of the Fund’s shares may be affected by changes in the value of currencies in relation to the U.S. dollar. The value of investments traded in markets outside the United States or denominated in currencies other than the U.S. dollar may be affected significantly on a day that the NYSE is closed and the market value may change on days when an investor is not able to purchase, redeem or exchange shares of the Fund.
Foreign currency contracts represent agreements to exchange currencies on specific future dates at predetermined rates. Foreign currency contracts are valued using foreign currency exchange rates and forward rates as provided by an independent pricing service on the Valuation Date.
Financial instruments for which prices are not available from an independent pricing service may be valued using market quotations obtained from one or more dealers that make markets in the respective financial instrument in accordance with procedures established by the Company's Board of Directors.
U.S. GAAP defines fair value as the price that the Fund would receive to sell an asset or pay to transfer a liability in an orderly transaction between market participants. The U.S. GAAP fair value measurement standards require disclosure of a fair value hierarchy for each major category of assets and liabilities. Various inputs are used in determining the fair value of the Fund’s investments. These inputs are summarized into three broad hierarchy levels. This hierarchy is based on whether the valuation inputs are observable or unobservable. These levels are:
Level 1 – Quoted prices in active markets for identical investments. Level 1 may include exchange traded instruments, such as domestic equities, some foreign equities, options, futures, mutual funds, exchange traded funds, rights and warrants.
Level 2 – Observable inputs other than Level 1 prices, such as quoted prices for similar investments; quoted prices in markets that are not active; or other inputs that are observable or can be corroborated by observable market data. Level 2 may include debt investments that are traded less frequently than exchange traded instruments and which are valued using independent pricing services; foreign equities, which are principally traded on certain foreign markets and are adjusted daily pursuant to a fair value pricing service in order to reflect an adjustment for the factors occurring after the close of certain foreign markets but before the NYSE Close; senior floating rate interests, which are valued using an aggregate of dealer bids; short-term investments, which are valued at amortized cost; and swaps, which are valued based upon the terms of each swap contract.
Level 3 – Significant unobservable inputs that are supported by limited or no market activity. Level 3 may include financial instruments whose values are determined using indicative market quotes or require significant management judgment or estimation. These unobservable valuation inputs may include estimates for current yields, maturity/duration, prepayment speed, and indicative market quotes for comparable investments along with other assumptions relating to credit quality, collateral value, complexity of the investment structure, general market conditions and liquidity. This category may include investments where trading has been halted or there are certain restrictions on trading. While these investments are priced using unobservable inputs, the valuation of these investments reflects the best available data and management believes the prices are a reasonable representation of exit price.
The Board of Directors of the Company generally reviews and approves the “Procedures for Valuation of Portfolio Securities” at least once a year. These procedures define how investments are to be valued, including the formation and activities of a Valuation Committee. The Valuation Committee is responsible for determining in good faith the fair value of investments when the value cannot be obtained from primary pricing services or alternative sources or if the valuation of an investment as provided by the primary pricing service or alternative source is believed not to reflect the investment’s fair value as of the Valuation Date. Voting members of the Valuation Committee include the Fund's Treasurer or designee and a Vice President of the investment manager or designee. An Assistant Vice President of the Fund with legal expertise or designee is also included on the Valuation Committee as a non-voting advisory member. In addition, the Fund’s Chief Compliance Officer shall designate a member of the
| Hartford MidCap HLS Fund |
| Notes to Financial Statements – (continued) |
| June 30, 2014 (Unaudited) |
| (000’s Omitted) |
compliance group to attend Valuation Committee meetings as a non-voting resource, to monitor for and provide guidance with respect to compliance with these procedures. Two members of the Valuation Committee or their designees, representing different departments, shall constitute a quorum for purposes of permitting the Valuation Committee to take action. The Valuation Committee will consider all relevant factors in determining an investment’s fair value, and may seek the advice of the Fund’s sub-adviser, knowledgeable brokers, and legal counsel in making such determination. The Valuation Committee reports to the Audit Committee of the Company's Board of Directors. The Audit Committee receives quarterly written reports which include details of all fair-valued investments, including the reason for the fair valuation, and an indication, when possible, of the accuracy of the valuation by disclosing the next available reliable public price quotation or the disposition price of such investments (the “look-back” test). The Board of Directors then must consider for ratification all of the fair value determinations made during the previous quarter.
Valuation levels are not necessarily indicative of the risk associated with investing in such investments. Individual investments within any of the above mentioned asset classes may be assigned a different hierarchical level than those presented above, as individual circumstances dictate.
For additional information, refer to the Investment Valuation Hierarchy Level Summary which follows the Schedule of Investments.
Investment Transactions and Investment Income – Investment transactions are recorded as of the trade date (the date the order to buy or sell is executed) for financial reporting purposes. Investments purchased or sold on a when-issued or delayed-delivery basis may be settled a month or more after the trade date. Realized gains and losses are determined on the basis of identified cost.
Dividend income from domestic securities is accrued on the ex-dividend date. In general, dividend income from foreign securities is recorded on the ex-date; however, dividend notifications in certain foreign jurisdictions may not be available in a timely manner and as a result, the Fund will record the dividend as soon as the relevant details (i.e., rate per share, payment date, shareholders of record, etc.) are publicly available. Interest income, including amortization of premium, accretion of discounts and additional principal received in-kind in lieu of cash, is accrued on a daily basis.
Foreign Currency Transactions – Assets and liabilities denominated in currencies other than U.S. dollars are translated into U.S. dollars at the exchange rates in effect on the valuation date. Purchases and sales of investments, income and expenses are translated into U.S. dollars at the exchange rates on the dates of such transactions.
The Fund does not isolate that portion of portfolio investment valuation resulting from fluctuations in the foreign currency exchange rates from the fluctuations arising from changes in the market prices of investments held. Exchange rate fluctuations are included with the net realized and unrealized gain or loss on investments in the accompanying financial statements.
Net realized foreign exchange gains or losses arise from sales of foreign currencies and the difference between asset and liability amounts initially stated in foreign currencies and the U.S. dollar value of the amounts actually received or paid. Net unrealized foreign exchange gains or losses arise from changes in the value of other assets and liabilities at the end of the reporting period, resulting from changes in the exchange rates.
Joint Trading Account – The Fund may invest cash balances into a joint trading account that may be invested in one or more repurchase agreements.
Fund Share Valuation and Dividend Distributions to Shareholders – Orders for the Fund’s shares are executed in accordance with the investment instructions of the contract holders and plan participants. The NAV of the Fund’s shares is determined as of the close of business on each business day of the Exchange. The NAV is determined separately for each class of shares of the Fund by dividing the Fund’s net assets attributable to that class by the number of shares of the class outstanding. Each class of shares offered by the Fund has equal rights as to assets and voting privileges (except that shareholders of a class have exclusive voting rights regarding any matter relating solely to that class of shares). Income and non-class specific expenses are allocated daily to each class on the basis of the relative net assets of the class. Realized and unrealized gains and losses are allocated daily based on the relative net assets of each class of shares of the Fund.
| Hartford MidCap HLS Fund |
| Notes to Financial Statements – (continued) |
| June 30, 2014 (Unaudited) |
| (000’s Omitted) |
Orders for the purchase of the Fund’s shares received prior to the close of the Exchange on any day the Exchange is open for business are priced at the NAV determined as of the close of the Exchange. Orders received after the close of the Exchange, or on a day on which the Exchange and/or the Fund is not open for business, are priced at the next determined NAV.
Dividends are declared pursuant to a policy adopted by the Company's Board of Directors based upon the investment performance of the Fund. The policy of the Fund is to pay dividends from net investment income and realized gains, if any, at least once a year.
Distributions from net investment income, net realized gains and capital are determined in accordance with federal income tax regulations, which may differ from U.S. GAAP with respect to character and timing. These differences may include, but are not limited to, losses deferred due to wash sale adjustments, foreign currency gains and losses, adjustments related to Passive Foreign Investment Companies ("PFICs"), Real Estate Investment Trusts ("REITs"), Regulated Investment Companies ("RICs"), certain derivatives and partnerships. Permanent book and federal income tax basis differences relating to shareholder distributions will result in reclassifications to certain of the Fund’s capital accounts (see Federal Income Taxes: Reclassification of Capital Accounts note).
Securities and Other Investments:
Repurchase Agreements – A repurchase agreement is an agreement by which a counterparty agrees to sell an investment and agrees to repurchase the investment sold from the buyer at a mutually agreed upon time and price. During the period of the repurchase agreement, the counterparty will deposit cash and or securities in a third party custodial account to serve as collateral. At the time the Fund enters into a repurchase agreement, the value of the underlying collateral, including accrued interest, will be equal to or exceed the value of the repurchase agreement. Repurchase agreements expose the Fund to counterparty risk - that is, the risk that the counterparty will not fulfill its obligations. To minimize counterparty risk, the investments that serve to collateralize the repurchase agreement are held by the Fund’s custodian in book entry or physical form in the custodial account of the Fund or in a third party custodial account. Repurchase agreements are valued at cost plus accrued interest, which approximates fair value. Repurchase agreements have master netting arrangements which allow the Fund to offset amounts owed to a counterparty with amounts owed by the counterparty, including any collateral. Upon an event of default under a master repurchase agreement, the non-defaulting party may close out all transactions traded under such agreement and net amounts owed under each transaction to one net amount payable by one party to the other. Absent an event of default, the master repurchase agreement does not result in an offset of reported amounts of assets and liabilities in the Statement of Assets and Liabilities across transactions between the Fund and the applicable counterparty. The Fund, as shown on the Schedule of Investments, had outstanding repurchase agreements and related collateral as of June 30, 2014.
Financial Derivative Instruments:
The following disclosures contain information on how and why the Fund uses derivative instruments, the credit-risk-related contingent features in certain derivative instruments, and how derivative instruments affect the Fund’s financial position and results of operations. The location and fair value amounts of these instruments on the Statement of Assets and Liabilities and the realized gains and losses and changes in unrealized gains and losses on the Statement of Operations, each categorized by type of derivative contract, are included in the following Additional Derivative Instrument Information footnote. The derivative instruments outstanding as of period-end are disclosed in the notes to or within the Schedule of Investments for purchased options, if applicable. The amounts of realized gains and losses and changes in unrealized gains and losses on derivative instruments during the period are disclosed in the Statement of Operations.
Foreign Currency Contracts – The Fund may enter into foreign currency contracts that obligate the Fund to purchase or sell currencies at specified future dates. Foreign currency contracts are used to hedge the currency exposure associated with some or all of the Fund’s investments and/or as part of an investment strategy. Foreign currency contracts are marked to market daily and the change in value is recorded by the Fund as an unrealized gain or loss. The Fund will record a realized gain or loss when the foreign currency contract is settled.
Foreign currency contracts involve elements of market risk in excess of the amounts reflected in the Statement of Assets and Liabilities. In addition, risks may arise upon entering into these contracts from the potential inability of the counterparties to meet the terms of the contracts and from unanticipated movements in the value of the foreign currencies relative to the U.S. dollar. The Fund had no outstanding foreign currency contracts as of June 30, 2014.
| Hartford MidCap HLS Fund |
| Notes to Financial Statements – (continued) |
| June 30, 2014 (Unaudited) |
| (000’s Omitted) |
Additional Derivative Instrument Information:
The volume of derivative activity was minimal during the six-month period ended June 30, 2014.
| The Effect of Derivative Instruments on the Statement of Operations for the six-month period ended June 30, 2014: |
| | | Risk Exposure Category | |
| | | Interest Rate
Contracts | | | Foreign
Exchange
Contracts | | | Credit
Contracts | | | Equity
Contracts | | | Commodity
Contracts | | | Other
Contracts | | | Total | |
| Realized Gain on Derivatives Recognized as a Result of Operations: |
| Net realized gain on foreign currency contracts | | $ | — | | | $ | 16 | | | $ | — | | | $ | — | | | $ | — | | | $ | — | | | $ | 16 | |
| Total | | $ | — | | | $ | 16 | | | $ | — | | | $ | — | | | $ | — | | | $ | — | | | $ | 16 | |
Principal Risks:
The Fund may be exposed to counterparty risk, or the risk that an institution or other entity with which the Fund has unsettled or open transactions will default.
If the Fund invests directly in foreign currencies or in securities that trade in, and receive revenues in, foreign currencies, or in derivatives that provide exposure to foreign currencies, it will be subject to the risk that those currencies will decline in value relative to the base currency (U.S. dollars) of the Fund, or, in the case of hedging positions, that the Fund’s base currency will decline in value relative to the currency being hedged. Currency rates in foreign countries may fluctuate significantly over short periods of time for a number of reasons, including changes in interest rates, intervention (or the failure to intervene) by U.S. or foreign governments, central banks or supranational entities, such as the International Monetary Fund, or by the imposition of currency controls or other political developments in the United States or abroad. As a result, the Fund’s investments in foreign currency denominated securities may reduce the returns of the Fund. The market values of equity securities, such as common stocks and preferred stocks, or equity related investments, such as futures and options, may decline due to general market conditions which are not specifically related to a particular company, such as real or perceived adverse economic conditions, changes in the general outlook for corporate earnings, changes in interest or currency rates or adverse investor sentiment generally. The market value of equity securities may also decline due to factors which affect a particular industry or industries, such as labor shortages or increased production costs and competitive conditions within an industry. Equity securities and equity related investments generally have greater market price volatility than fixed income securities.
Federal Income Taxes:
Federal Income Taxes – For federal income tax purposes, the Fund intends to continue to qualify as a RIC under Subchapter M of the Internal Revenue Code (“IRC”) by distributing substantially all of its taxable net investment income and net realized capital gains to its shareholders and otherwise complying with the requirements of the IRC. The Fund has distributed substantially all of its income and capital gains in prior years, if applicable, and intends to distribute substantially all of its income and capital gains prior to the next fiscal year-end. Accordingly, no provision for federal income or excise taxes has been made in the accompanying financial statements. Distributions from short-term capital gains are treated as ordinary income distributions for federal income tax purposes.
Net Investment Income (Loss), Net Realized Gains (Losses) and Distributions – Net investment income (loss) and net realized gains (losses) may differ for financial statement and tax purposes primarily because of losses deferred due to wash sale adjustments, foreign currency gains and losses, adjustments related to PFICs, REITs, RICs, certain derivatives and partnerships. The character of distributions made during the year from net investment income or net realized gains may differ from their ultimate characterization for federal income tax purposes. Also, due to the timing of dividend distributions, the fiscal year in which amounts are distributed may differ from the year that the income or realized gains (losses) were recorded by the Fund.
| Hartford MidCap HLS Fund |
| Notes to Financial Statements – (continued) |
| June 30, 2014 (Unaudited) |
| (000’s Omitted) |
Distributions and Components of Distributable Earnings – The tax character of distributions paid by the Fund for the periods indicated is as follows (as adjusted for dividends payable, if applicable):
| | | For the Year Ended
December 31, 2013 | | | For the Year Ended
December 31, 2012 | |
| Ordinary Income | | $ | 13,250 | | | $ | 11,152 | |
| Long-Term Capital Gains* | | | 45,381 | | | | — | |
| * | The Fund designates these distributions as long-term capital gain ividends pursuant to IRC Sec. 852(b)(3)(C). |
As of December 31, 2013, the Fund’s components of distributable earnings (deficit) on a tax basis are as follows:
| | | Amount | |
| Undistributed Ordinary Income | | $ | 14,012 | |
| Undistributed Long-Term Capital Gain | | | 174,228 | |
| Unrealized Appreciation* | | | 453,434 | |
| Total Accumulated Earnings | | $ | 641,674 | |
| * | Differences between book-basis and tax-basis unrealized appreciation (depreciation) may be attributable to the losses deferred due to wash sale adjustments, foreign currency gains and losses, adjustments related to PFICs, REITs, RICs, certain derivatives and partnerships. |
Reclassification of Capital Accounts – The Fund may record reclassifications in its capital accounts. These reclassifications have no impact on the total net assets of the Fund. The reclassifications are a result of permanent differences between U.S. GAAP and tax accounting for such items as foreign currency, PFICs, expiration or utilization of capital loss carryforwards or net operating losses. Adjustments are made to reflect the impact these items have on current and future distributions to shareholders. Therefore, the source of the Fund’s distributions may be shown in the accompanying Statement of Changes in Net Assets as from undistributed net investment income, from accumulated net realized gains on investments or from capital depending on the type of book and tax differences that exist. For the year ended December 31, 2013, the Fund recorded reclassifications to increase (decrease) the accounts listed below:
| | | Amount | |
| Undistributed Net Investment Income (Loss) | | $ | (39 | ) |
| Accumulated Net Realized Gain (Loss) | | | 39 | |
Capital Loss Carryforward – On December 22, 2010, the Regulated Investment Company Modernization Act of 2010 (the “Act”) was enacted, which made changes to the capital loss carryforward rules. The changes are effective for taxable years beginning after the date of enactment. Under the Act, funds are permitted to carry forward capital losses for an unlimited period. Additionally, capital loss carryforwards retain their character as either short-term or long-term capital losses rather than being considered all short-term as permitted under prior regulation.
The Fund had no capital loss carryforward for U.S. federal income tax purposes as of December 31, 2013.
Accounting for Uncertainty in Income Taxes – The Fund has adopted financial reporting rules that require the Fund to analyze all open tax years, as defined by the statute of limitations, for all major jurisdictions. Generally, tax authorities can examine all tax returns filed for the last three years. The Fund does not have an examination in progress.
The Fund has reviewed all open tax years and major jurisdictions and concluded that these financial reporting rules had no effect on the Fund’s financial position or results of operations. There is no tax liability resulting from unrecognized tax benefits relating to uncertain income tax positions taken or expected to be taken on the tax return for the fiscal year ended December 31, 2013. The Fund is also not aware of any tax positions for which it is reasonably possible that the total amounts of unrecognized tax benefits will significantly change in the next twelve months.
| Hartford MidCap HLS Fund |
| Notes to Financial Statements – (continued) |
| June 30, 2014 (Unaudited) |
| (000’s Omitted) |
Expenses:
Investment Management Agreement – Hartford Funds Management Company, LLC ("HFMC") serves as the Fund’s investment manager pursuant to an Investment Management Agreement with the Company. HFMC is an indirect wholly owned subsidiary of The Hartford Financial Services Group, Inc. ("The Hartford"). The investment manager has overall investment supervisory responsibility for the Fund. In addition, the investment manager provides administrative personnel, services, equipment, facilities and office space for proper operation of the Fund. HFMC has contracted with Wellington Management Company, LLP ("Wellington Management") under a sub-advisory agreement for the provision of day-to-day investment management services to the Fund in accordance with the Fund’s investment objective and policies. The Fund pays a fee to the investment manager, a portion of which may be used to compensate Wellington Management.
The schedule below reflects the rates of compensation paid to the investment manager for investment management services rendered as of June 30, 2014; the rates are accrued daily and paid monthly:
| Average Daily Net Assets | Annual Fee |
| On first $250 million | 0.7750% |
| On next $250 million | 0.7250% |
| On next $500 million | 0.6750% |
| On next $4 billion | 0.6250% |
| On next $5 billion | 0.6225% |
| Over $10 billion | 0.6200% |
Accounting Services Agreement – Pursuant to the Fund Accounting Agreement between HFMC and the Company, on behalf of the Fund, HFMC provides accounting services to the Fund and receives monthly compensation based on the Fund’s average daily net assets at the rates set forth below. The Fund’s accounting services fees are accrued daily and paid monthly.
| Average Daily Net Assets | Annual Fee |
| All Assets | 0.010% |
Operating Expenses – Allocable expenses incurred by the Company are allocated to each Fund and allocated to classes within a Fund in proportion to the average daily net assets of the Fund and each class, except where allocation of certain expenses is more fairly made directly to the Fund or to specific classes within a Fund.
Fees Paid Indirectly – The Company, on behalf of the Fund, has entered into agreements with State Street Global Markets, LLC and Russell Implementation Services, Inc. to partially recapture non-discounted trade commissions. Such rebates are used to pay a portion of the Fund's expenses. For the six-month period ended June 30, 2014, this amount, if any, is included in the Statement of Operations.
The ratio of expenses to average net assets in the accompanying financial highlights excludes the reduction in expenses related to fees paid indirectly. The annualized expense ratio after waivers for the period listed below reflecting the reduction for fees paid indirectly is as follows:
| | | Annualized Six-
Month Period Ended
June 30, 2014 | |
| Class IA | | | 0.70% | |
| Class IB | | | 0.95 | |
Distribution Plan for Class IB Shares – Hartford Funds Distributors, LLC (“HFD”), an indirect wholly owned subsidiary of The Hartford, is the principal underwriter and distributor of the Fund. The Company, on behalf of the Fund, has adopted a Distribution Plan pursuant to Rule 12b-1 of the 1940 Act for Class IB shares.
| Hartford MidCap HLS Fund |
| Notes to Financial Statements – (continued) |
| June 30, 2014 (Unaudited) |
| (000’s Omitted) |
The Distribution Plan provides that the Fund may pay annually up to 0.25% of the average daily net assets of the Fund attributable to its Class IB shares for activities primarily intended to result in the sale of Class IB shares. The Board has the authority to suspend or reduce these payments at any point in time. Under the terms of the Distribution Plan and the principal underwriting agreement, the Fund is authorized to make payments monthly to the distributor that may be used to pay or reimburse entities providing distribution and shareholder servicing with respect to the Class IB shares for such entities’ fees or expenses incurred or paid in that regard. The distribution fee paid during the period can be found on the Statement of Operations. These fees are accrued daily and paid monthly.
Other Related Party Transactions – Hartford Administrative Services Company (“HASCO”), an indirect wholly owned subsidiary of The Hartford, provides transfer agent services to the Fund. HASCO was compensated on a per account basis for providing such services. The amount paid to HASCO can be found in the Statement of Operations. These fees are accrued daily and paid monthly.
Payment from Affiliate – In July of 2007, The Hartford entered into a settlement with the Attorneys General of the states of New York, Connecticut and Illinois relating to market timing and the company's individual variable annuity contracts in which certain payments would be made directly to the variable annuity contract holders. The distribution plan provided that unclaimed money from the settlement would be distributed to certain HLS Funds that are investment options through a Hartford individual variable annuity contract. The unclaimed money was distributed to the Fund on September 18, 2009.
The total return in the accompanying financial highlights includes a payment from an affiliate. Had the payment from the affiliate been excluded, the impact and total return for the period listed below would have been as follows:
| | | For the Year Ended December 31, 2009 | |
| | | Class IA | | | Class IB | |
| Impact from Payment from Affiliate for Attorneys General Settlement | | | 0.03% | | | | 0.03% | |
| Total Return Excluding Payment from Affiliate | | | 30.92% | | | | 30.59% | |
Investment Transactions:
For the six-month period ended June 30, 2014, the cost of purchases and proceeds from sales of investment securities (excluding short-term investments) were as follows:
| | | Excluding U.S.
Government
Obligations | | | U.S.
Government
Obligations | | | Total | |
| Cost of Purchases | | $ | 345,975 | | | $ | — | | | $ | 345,975 | |
| Sales Proceeds | | | 330,530 | | | | — | | | | 330,530 | |
Line of Credit:
The Fund is one of several Hartford Funds that participate in a $500 million committed revolving line of credit facility. The facility is to be used for temporary or emergency purposes. Under the arrangement, the funds are required to own securities having a market value in excess of 300% of the total bank borrowings. The interest rate on borrowings varies depending on the nature of the loan. The facility also requires a fee to be paid based on the amount of the commitment. This commitment fee is allocated to all the funds participating in the line of credit based on the average net assets of the funds. During the six-month period ended June 30, 2014, the Fund did not have any borrowings under this facility.
| Hartford MidCap HLS Fund |
| Notes to Financial Statements – (continued) |
| June 30, 2014 (Unaudited) |
| (000’s Omitted) |
Industry Classifications:
Other than the industry classifications "Other Investment Pools and Funds" and "Exchange Traded Funds," equity industry classifications used in this report are the Global Industry Classification Standard, which was developed by and is the exclusive property and service mark of MSCI, Inc. and Standard & Poor's.
Indemnifications:
Under the Company's organizational documents, the Company shall indemnify its officers and directors to the full extent required or permitted under Maryland General Corporation Law and the federal securities laws. In addition, the Company, on behalf of the Fund, may enter into contracts that contain a variety of indemnifications. The Company's maximum exposure under these arrangements is unknown. However, as of the date of these financial statements, the Company has not had prior claims or losses pursuant to these contracts and expects the risk of loss to be remote.
Pending Legal Proceedings:
On February 25, 2011, Jennifer L. Kasilag, Louis Mellinger, Judith M. Menendez, Jacqueline M. Robinson, and Linda A. Russell filed a derivative lawsuit against Hartford Investment Financial Services, LLC (“HIFSCO”) (now known as Hartford Funds Distributors, LLC) on behalf of six Hartford retail mutual funds in the United States District Court for the District of New Jersey, alleging that HIFSCO received excessive advisory and distribution fees in violation of its statutory fiduciary duty under Section 36(b) of the 1940 Act when serving as investment manager and principal underwriter, respectively, to the Hartford retail mutual funds. Although this action was purportedly filed on behalf of certain of the Hartford Funds, none of the Hartford Funds is itself a defendant to the suit. HIFSCO moved to dismiss and, in September 2011, the motion was granted in part and denied in part, with leave to amend the complaint. In November 2011, plaintiffs filed an amended complaint on behalf of certain Hartford retail mutual funds, The Hartford Global Health Fund (now known as The Hartford Healthcare Fund), The Hartford Conservative Allocation Fund, The Hartford Growth Opportunities Fund, The Hartford Inflation Plus Fund, The Hartford Advisers Fund (now known as The Hartford Balanced Fund), and The Hartford Capital Appreciation Fund. Plaintiffs seek to rescind the investment management agreements and distribution plans between HIFSCO and these funds and to recover the total fees charged thereunder or, in the alternative, to recover any improper compensation HIFSCO received, in addition to lost earnings. HIFSCO filed a partial motion to dismiss the amended complaint and, in December 2012, the court dismissed without prejudice the claims regarding distribution fees and denied the motion with respect to the advisory fees claims. HIFSCO disputes the allegations and intends to defend vigorously.
In March 2014, the plaintiffs filed a new complaint that added as new plaintiffs The Hartford Floating Rate Fund and The Hartford Small Company Fund and named as a defendant Hartford Funds Management Company, LLC (the “Investment Manager”), which assumed the role as investment adviser to the funds as of January 2013. The Investment Manager and HIFSCO dispute the allegations and intend to defend vigorously.
This action concerns the activities of HIFSCO in its capacity as investment manager and principal underwriter to the Hartford retail mutual funds and does not concern HIFSCO’s activities in its capacity as principal underwriter to the HLS funds. For this reason, no accrual for litigation relating to this matter has been recorded in the financial statements of the Fund.
| Hartford MidCap HLS Fund |
| Financial Highlights |
| | | ─ Selected Per-Share Data(A) ─ | | | ─ Ratios and Supplemental Data ─ | |
Class | | Net Asset
Value at
Beginning
of Period | | | Net
Investment
Income
(Loss) | | | Net
Realized
and
Unrealized
Gain (Loss)
on
Investments | | | Total from
Investment
Operations | | | Dividends
from Net
Investment
Income | | | Distributions
from
Realized
Capital
Gains | | | Total
Dividends
and
Distributions | | | Net
Asset
Value at
End of
Period | | | Total
Return(B) | | | Net Assets
at End of
Period
(000s) | | | Ratio of
Expenses
to
Average
Net
Assets
Before
Adjust-
ments(C) | | | Ratio of
Expenses
to
Average
Net
Assets
After
Adjust-
ments(C) | | | Ratio of
Net
Investment
Income
(Loss) to
Average
Net Assets | |
| | | | | | | | | | | | | | | | | | | | | | | | | | | | | | | | | | | | | | | | |
| For the Six-Month Period Ended June 30, 2014 (Unaudited) |
| IA | | $ | 37.87 | | | $ | 0.01 | | | $ | 4.23 | | | $ | 4.24 | | | $ | – | | | $ | – | | | $ | – | | | $ | 42.11 | | | | 11.20 | %(D) | | $ | 1,657,640 | | | | 0.70 | %(E) | | | 0.70 | %(E) | | | 0.04 | %(E) |
| IB | | | 37.52 | | | | (0.04 | ) | | | 4.19 | | | | 4.15 | | | | – | | | | – | | | | – | | | | 41.67 | | | | 11.06 | (D) | | | 86,933 | | | | 0.95 | (E) | | | 0.95 | (E) | | | (0.21 | )(E) |
| | | | | | | | | | | | | | | | | | | | | | | | | | | | | | | | | | | | | | | | | | | | | | | | | | | | | |
| For the Year Ended December 31, 2013 |
| IA | | $ | 28.16 | | | $ | 0.07 | | | $ | 11.02 | | | $ | 11.09 | | | $ | (0.04 | ) | | $ | (1.34 | ) | | $ | (1.38 | ) | | $ | 37.87 | | | | 39.82 | % | | $ | 1,483,626 | | | | 0.71 | % | | | 0.71 | % | | | 0.21 | % |
| IB | | | 27.95 | | | | (0.02 | ) | | | 10.94 | | | | 10.92 | | | | (0.01 | ) | | | (1.34 | ) | | | (1.35 | ) | | | 37.52 | | | | 39.46 | | | | 82,483 | | | | 0.96 | | | | 0.96 | | | | (0.05 | ) |
| | | | | | | | | | | | | | | | | | | | | | | | | | | | | | | | | | | | | | | | | | | | | | | | | | | | | |
| For the Year Ended December 31, 2012 (F) |
| IA | | $ | 23.77 | | | $ | 0.24 | | | $ | 4.38 | | | $ | 4.62 | | | $ | (0.23 | ) | | $ | – | | | $ | (0.23 | ) | | $ | 28.16 | | | | 19.44 | % | | $ | 1,325,221 | | | | 0.71 | % | | | 0.71 | % | | | 0.84 | % |
| IB | | | 23.59 | | | | 0.17 | | | | 4.35 | | | | 4.52 | | | | (0.16 | ) | | | – | | | | (0.16 | ) | | | 27.95 | | | | 19.14 | | | | 70,997 | | | | 0.96 | | | | 0.96 | | | | 0.59 | |
| | | | | | | | | | | | | | | | | | | | | | | | | | | | | | | | | | | | | | | | | | | | | | | | | | | | | |
| For the Year Ended December 31, 2011 (F) |
| IA | | $ | 26.01 | | | $ | 0.15 | | | $ | (2.20 | ) | | $ | (2.05 | ) | | $ | (0.19 | ) | | $ | – | | | $ | (0.19 | ) | | $ | 23.77 | | | | (7.92 | )% | | $ | 1,212,257 | | | | 0.71 | % | | | 0.71 | % | | | 0.48 | % |
| IB | | | 25.74 | | | | 0.07 | | | | (2.17 | ) | | | (2.10 | ) | | | (0.05 | ) | | | – | | | | (0.05 | ) | | | 23.59 | | | | (8.16 | ) | | | 70,188 | | | | 0.96 | | | | 0.96 | | | | 0.18 | |
| | | | | | | | | | | | | | | | | | | | | | | | | | | | | | | | | | | | | | | | | | | | | | | | | | | | | |
| For the Year Ended December 31, 2010 (F) |
| IA | | $ | 21.12 | | | $ | 0.10 | | | $ | 4.85 | | | $ | 4.95 | | | $ | (0.06 | ) | | $ | – | | | $ | (0.06 | ) | | $ | 26.01 | | | | 23.45 | % | | $ | 1,722,182 | | | | 0.70 | % | | | 0.70 | % | | | 0.44 | % |
| IB | | | 20.92 | | | | 0.04 | | | | 4.79 | | | | 4.83 | | | | (0.01 | ) | | | – | | | | (0.01 | ) | | | 25.74 | | | | 23.15 | | | | 124,465 | | | | 0.95 | | | | 0.95 | | | | 0.12 | |
| | | | | | | | | | | | | | | | | | | | | | | | | | | | | | | | | | | | | | | | | | | | | | | | | | | | | |
| For the Year Ended December 31, 2009 (F) |
| IA | | $ | 16.21 | | | $ | 0.12 | (G) | | $ | 4.89 | | | $ | 5.01 | | | $ | (0.10 | ) | | $ | – | | | $ | (0.10 | ) | | $ | 21.12 | | | | 30.96 | %(H) | | $ | 1,490,852 | | | | 0.72 | % | | | 0.72 | % | | | 0.48 | % |
| IB | | | 16.06 | | | | 0.05 | (G) | | | 4.86 | | | | 4.91 | | | | (0.05 | ) | | | – | | | | (0.05 | ) | | | 20.92 | | | | 30.62 | (H) | | | 173,205 | | | | 0.97 | | | | 0.97 | | | | 0.23 | |
| (A) | Information presented relates to a share outstanding throughout the indicated period. Net investment income (loss) per share amounts are calculated based on average shares outstanding unless otherwise noted. |
| (B) | The figures do not include sales charges or other fees which may be applied at the variable life insurance, variable annuity or qualified retirement plan product level. Any such additional sales charges or other fees would lower the Fund's performance. |
| (C) | Adjustments include waivers and reimbursements, if applicable. Ratios do not include fees paid indirectly (see Expenses in the accompanying Notes to Financial Statements). |
| (F) | Net investment income (loss) per share amounts have been calculated using the SEC method. |
| (G) | The impact of Payment from Affiliate per share was $0.01. |
| (H) | Total return without the inclusion of the Payment from (to) Affiliate can be found in Expenses in the accompanying Notes to Financial Statements. |
| | | Portfolio Turnover
Rate for
All Share Classes | |
| For the Six-Month Period Ended June 30, 2014 (Unaudited) | | | 19% | |
| For the Year Ended December 31, 2013 | | | 34 | |
| For the Year Ended December 31, 2012 | | | 51 | |
| For the Year Ended December 31, 2011 | | | 69 | |
| For the Year Ended December 31, 2010 | | | 52 | |
| For the Year Ended December 31, 2009 | | | 82 | |
| Hartford MidCap HLS Fund |
| Directors and Officers (Unaudited) |
The Board of Directors of the Company (the "Directors") appoints officers who are responsible for the day-to-day operations of the Fund and who execute policies formulated by the Directors. Each Director serves until his or her death, resignation, or retirement or until the next annual meeting of shareholders is held or until his or her successor is elected and qualifies.
Directors and officers who are employed by or who have a financial interest in The Hartford are considered “interested” persons of the Fund pursuant to the 1940 Act. Each officer and two of the Company's Directors, as noted in the chart below, are “interested” persons of the Fund. Each Director serves as a director for The Hartford Mutual Funds, Inc., The Hartford Mutual Funds II, Inc., Hartford Series Fund, Inc., and Hartford HLS Series Fund II, Inc., and as a trustee for The Hartford Alternative Strategies Fund, which, as of June 30, 2014, collectively consist of 78 funds. Correspondence may be sent to Directors and officers c/o Hartford Funds, 5 Radnor Corporate Center, Suite 300, 100 Matsonford Road, Radnor, Pennsylvania 19087, except that correspondence to Mr. Annoni, Mr. Dressen and Ms. Quade may be sent to 500 Bielenberg Drive, Suite 500, Woodbury, Minnesota 55125.
The table below sets forth, for each Director and officer, his or her name, year of birth, current position with the Company and date first elected or appointed to Hartford Series Fund, Inc. ("HSF") and Hartford HLS Series Fund II, Inc. ("HSF2"), principal occupation, and, for Directors, other directorships held. The Fund’s Statement of Additional Information contains further information on the Directors and is available free of charge by calling 1-888-843-7824 or writing to: Hartford HLS Funds, c/o Hartford Life Insurance Company/Hartford Life and Annuity Insurance Company, P.O. Box 14293, Lexington, KY 40512-4293 for variable annuity and variable life insurance separate accounts of Hartford Life Insurance Company and its affiliates; Hartford Funds, P.O. Box 55022, Boston, MA 02205-5022 for all shareholders except variable annuity and variable life insurance separate accounts of Hartford Life Insurance Company and its affiliates.
Information on the aggregate remuneration paid to the directors of the Company can be found in the Statement of Operations herein. The Fund pays to The Hartford a portion of the Chief Compliance Officer’s compensation, but does not pay salaries or compensation to any of its other officers or Directors who are employed by The Hartford.
Non-Interested Directors
Lynn S. Birdsong (1946) Director since 2003, Co-Chairman of the Investment Committee since 2005
Mr. Birdsong is a private investor. Mr. Birdsong currently serves as a Director of the Sovereign High Yield Investment Company (April 2010 to current). Mr. Birdsong currently serves as an Independent Director of Nomura Partners Funds, Inc. (formerly, The Japan Fund) (April 2003 to current). From 2003 to March 2005, Mr. Birdsong was an Independent Director of the Atlantic Whitehall Funds. From 1979 to 2002, Mr. Birdsong was a Managing Director of Zurich Scudder Investments, an investment management firm. During his employment with Scudder, Mr. Birdsong was an Interested Director of The Japan Fund. From January 1981 through December 2013, Mr. Birdsong was a partner in Birdsong Company, an advertising specialty firm.
Robert M. Gavin, Jr. (1940) Director since 2002 (HSF) and 1986 (HSF2), Chairman of the Board since 2004
Dr. Gavin is an educational consultant. Prior to September 1, 2001, he was President of Cranbrook Education Community and prior to July 1996, he was President of Macalester College, St. Paul, Minnesota.
Duane E. Hill (1945) Director since 2001 (HSF) and 2002 (HSF2), Chairman of the Nominating Committee since 2003
Mr. Hill is a Partner of TSG Ventures L.P., a private equity investment company. Mr. Hill is a former partner of TSG Capital Group, a private equity investment firm that served as sponsor and lead investor in leveraged buyouts of middle market companies.
Sandra S. Jaffee (1941) Director since 2005
Ms. Jaffee is the founder and Chief Executive Officer of a private company, Homeworks Concierge, LLC, which provides residential property management services in Westchester County, New York (January 2012 to present). Ms. Jaffee served as Chairman (2008 to 2009) and Chief Executive Officer of Fortent (formerly Searchspace Group), a leading provider of compliance/regulatory technology to financial institutions from August 2005 to August 2009. From August 2004 to August 2005, Ms. Jaffee served as an Entrepreneur in Residence with Warburg Pincus, a private equity firm. Prior to joining Warburg Pincus, Ms. Jaffee served as Executive Vice President at Citigroup, from September 1995 to July 2004, where she was President and Chief Executive Officer of Citibank’s Global Securities Services (1995 to 2003). Ms. Jaffee currently serves as a member of the Board of Directors of Broadridge Financial Solutions as well as a Trustee of Muhlenberg College.
| Hartford MidCap HLS Fund |
| Directors and Officers (Unaudited) – (continued) |
William P. Johnston (1944) Director since 2005, Chairman of the Compliance Committee since 2005
In June 2006, Mr. Johnston was appointed as Senior Advisor to The Carlyle Group, a global private equity and other alternative asset investment firm and currently serves as an Operating Executive. In July 2006, Mr. Johnston was elected to the Board of Directors of MultiPlan, Inc. and served as a Director (July 2006 to August 2010). In August 2007, Mr. Johnston was elected to the Board of Directors of LifeCare Holdings, Inc. and served as a Director (August 2007 to June 2013). In February 2008, Mr. Johnston was elected to the Board of Directors of HCR-ManorCare, Inc. In May 2006, Mr. Johnston was elected to the Supervisory Board of Fresenius Medical Care AG & Co. KGaA, after its acquisition of Renal Care Group, Inc. in March 2006. Mr. Johnston joined Renal Care Group in November 2002 as a member of the Board of Directors and served as Chairman of the Board from March 2003 through March 2006. From 2002 through 2013, Mr. Johnston served as a Board member of the Georgia O’Keefe Museum. From September 1987 to December 2002, Mr. Johnston was with Equitable Securities Corporation (and its successors, SunTrust Equitable Securities and SunTrust Robinson Humphrey) serving in various investment banking and managerial positions, including Managing Director and Head of Investment Banking, Chief Executive Officer and Vice Chairman.
Phillip O. Peterson (1944) Director since 2002 (HSF) and 2000 (HSF2), Chairman of the Audit Committee since 2002
Mr. Peterson is a mutual fund industry consultant. He was a partner of KPMG LLP (an accounting firm) until July 1999. Mr. Peterson joined William Blair Funds in February 2007 as a member of the Board of Trustees. From February 2012 to February 2014, Mr. Peterson served as a Trustee of Symetra Variable Mutual Funds. From January 2004 to April 2005, Mr. Peterson served as Independent President of the Strong Mutual Funds.
Lemma W. Senbet (1946) Director since 2005
Dr. Senbet is the William E. Mayer Chair Professor of Finance and Founding Director, Center for Financial Policy, at the University of Maryland, Robert H. Smith School of Business. He was chair of the Finance Department of the University of Maryland, Robert H. Smith School of Business from 1998 to 2006. Since June 2013, he has been on leave from the University to serve as Executive Director of African Economic Research Consortium which focuses on economic policy research and training. Previously, he was a chaired professor of finance at the University of Wisconsin-Madison. Also, he was a Director of the Fortis Funds from March 2000 to July 2002. Dr. Senbet served as Director of the American Finance Association and President of the Western Finance Association. In 2006, Dr. Senbet was inducted Fellow of Financial Management Association International for his career-long distinguished scholarship and professional service.
Interested Directors and Officers
James E. Davey (1964) Director since 2012, President and Chief Executive Officer since 2010
Mr. Davey serves as Executive Vice President of Hartford Life Insurance Company (“HLIC”) and The Hartford Financial Services Group, Inc. Additionally, Mr. Davey serves as Chairman of the Board, Manager and Senior Managing Director of Hartford Funds Distributors, LLC (“HFD”). He also currently serves as Director, Chairman of the Board, President and Senior Managing Director of Hartford Administrative Services Company (“HASCO”). Mr. Davey also serves as Manager, Chairman of the Board and Senior Managing Director for Hartford Funds Management Company, LLC (“HFMC”) and Director, Chairman of the Board and Senior Managing Director for Hartford Funds Management Group, Inc. ("HFMG"). Mr. Davey has served in various positions within The Hartford and its subsidiaries in connection with the operation of the Hartford Funds. Mr. Davey joined The Hartford in 2002.
Lowndes A. Smith (1939) Director since 1996 (HSF) and 2002 (HSF2), Co-Chairman of the Investment Committee since 2005
Mr. Smith served as Vice Chairman of The Hartford from February 1997 to January 2002, as President and Chief Executive Officer of Hartford Life, Inc. from February 1997 to January 2002, and as President and Chief Operating Officer of The Hartford Life Insurance Companies from January 1989 to January 2002. Mr. Smith serves as a Director of White Mountains Insurance Group Ltd. (October 2003 to current); One Beacon Insurance (October 2006 to current); Symetra Financial (August 2007 to current) and is a Managing Director of Whittington Gray Associates (January 2007 to current).
Other Officers
Mark A. Annoni (1964) Vice President, Controller and Treasurer since 2012
Mr. Annoni currently serves as the Assistant Vice President of HLIC (February 2004 to present) and Senior Vice President of HFMG (December 2013 to present). Mr. Annoni has served in various positions within The Hartford and its subsidiaries in connection with the operation of the Hartford Funds. Mr. Annoni joined The Hartford in 2001.
| Hartford MidCap HLS Fund |
| Directors and Officers (Unaudited) – (continued) |
Michael R. Dressen (1963) AML Compliance Officer since 2011
Mr. Dressen currently serves as Assistant Vice President of HLIC. He also serves as Chief Compliance Officer and AML Compliance Officer of HASCO and as AML Officer of HFD. Mr. Dressen has served in various positions within The Hartford and its subsidiaries in connection with the operation of the Hartford Funds.
Edward P. Macdonald (1967) Vice President, Secretary and Chief Legal Officer since 2005
Mr. Macdonald currently serves as Assistant Secretary, Executive Vice President and Deputy General Counsel of HFD, HASCO, HFMC and HFMG. He also serves as Vice President of HLIC. Mr. Macdonald has served in various positions within The Hartford and its subsidiaries in connection with the operation of the Hartford Funds. Mr. Macdonald joined The Hartford in 2005.
Joseph G. Melcher (1973) Vice President and Chief Compliance Officer since 2013
Mr. Melcher currently serves as Executive Vice President of HFD, HFMG and HASCO. Mr. Melcher also currently serves as Executive Vice President and Chief Compliance Officer of HFMC. Mr. Melcher has served in various positions within The Hartford and its subsidiaries in connection with the operation of the Hartford Funds since joining The Hartford in 2012. Prior to joining The Hartford, Mr. Melcher worked at Touchstone Investments, a member of the Western & Southern Financial Group, where he held the position of Vice President and Chief Compliance Officer from 2010 through 2012 and Assistant Vice President, Compliance from 2005 to 2010.
Vernon J. Meyer (1964) Vice President since 2006
Mr. Meyer currently serves as Senior Vice President of HLIC. He also currently serves as Managing Director and Chief Investment Officer of HFMC and Managing Director of HFMG. Mr. Meyer has served in various positions within The Hartford and its subsidiaries in connection with the operation of the Hartford Funds. Mr. Meyer joined The Hartford in 2004.
Laura S. Quade (1969) Vice President since 2012
Ms. Quade currently serves as Vice President of HASCO, HFD and HFMG. She is the Head of Operations of HASCO and also serves as Director, Enterprise Operations of HLIC. Ms. Quade has served in various positions within The Hartford and its subsidiaries in connection with the operation of the Hartford Funds.
Martin A. Swanson (1962) Vice President since 2010
Mr. Swanson currently serves as Vice President of HLIC. Mr. Swanson also serves as Managing Director, Chief Marketing Officer and Principal of HFD and Managing Director of HFMG. Mr. Swanson has served in various positions within The Hartford and its subsidiaries in connection with the operation of the Hartford Funds.
HOW TO OBTAIN A COPY OF THE FUND’S PROXY VOTING POLICIES AND VOTING RECORDS (UNAUDITED)
A description of the policies and procedures that the Fund uses to determine how to vote proxies relating to portfolio securities and information about how the Fund voted proxies relating to portfolio securities during the most recent twelve-month period ended June 30 are available (1) without charge, upon request, by calling 888-843-7824 and (2) on the SEC’s website at http://www.sec.gov.
QUARTERLY PORTFOLIO HOLDINGS INFORMATION (UNAUDITED)
The Fund files a complete schedule of portfolio holdings with the SEC for the first and third quarters of each fiscal year on Form N-Q. The Fund’s Forms N-Q are available (1) without charge, upon request, by calling 888-843-7824 and (2) on the SEC’s website at http://www.sec.gov. The Form N-Q may be reviewed and copied at the SEC’s Public Reference Room in Washington, DC. Information on the operation of the Public Reference Room may be obtained by calling 1-800-SEC-0330.
| Hartford MidCap HLS Fund |
| Expense Example (Unaudited) |
Your Fund's Expenses
As a shareholder of the Fund, you incur two types of costs: (1) transaction costs and (2) ongoing costs, including investment management fees, distribution and/or service (12b-1) fees, if any, and other fund expenses. This example is intended to help you understand your ongoing costs (in dollars) of investing in the Fund and to compare these costs with the ongoing costs of investing in other mutual funds. The example is based on an investment of $1,000 invested at the beginning of the period and held for the entire period of December 31, 2013 through June 30, 2014.
Actual Expenses
The first set of columns of the table below provides information about actual account values and actual expenses. You may use the information in this column, together with the amount you invested, to estimate the expenses that you paid over the period. Simply divide your account value by $1,000 (for example, an $8,600 account value divided by $1,000 = 8.6), then multiply the result by the number in the line under the heading entitled “Expenses Paid During Period” to estimate the expenses you paid on your account during this period.
Hypothetical Example for Comparison Purposes
The second set of columns of the table below provides information about hypothetical account values and hypothetical expenses based on the Fund's actual expense ratio and an assumed rate of return of 5% per year before expenses, which is not the Fund's actual return. The hypothetical account values and expenses may not be used to estimate the actual ending account balance or expenses you paid for the period. You may use this information to compare the ongoing costs of investing in the Fund and other funds. To do so, compare this 5% hypothetical example with the 5% hypothetical examples that appear in the shareholder reports of the other funds.
Please note that the expenses shown in the table are meant to highlight your ongoing costs only and do not reflect any transactional costs, such as sales charges (loads) and CDSC. Therefore, the second set of columns of the table is useful in comparing ongoing costs only, and will not help you determine the relative total costs of owning different funds. In addition, if these transactional costs were included, your costs would be higher. Expenses are equal to the Fund's annualized expense ratios multiplied by average account value over the period, multiplied by 181/365 (to reflect the one-half year period).
| | | Actual return | | | Hypothetical (5% return before expenses) | | | | | | | | |
| | | Beginning
Account Value
December 31,
2013 | | | Ending Account
Value
June 30, 2014 | | | Expenses paid
during the period
December 31, 2013
through
June 30, 2014 | | | Beginning
Account Value
December 31,
2013 | | | Ending Account
Value
June 30, 2014 | | | Expenses paid
during the period
December 31,
2013
through
June 30, 2014 | | | Annualized
expense
ratio | | | Days
in the
current
1/2
year | | Days
in the
full
year |
| Class IA | | $ | 1,000.00 | | | $ | 1,112.00 | | | $ | 3.67 | | | $ | 1,000.00 | | | $ | 1,021.32 | | | $ | 3.51 | | | | 0.70 | % | | 181 | | 365 |
| Class IB | | $ | 1,000.00 | | | $ | 1,110.60 | | | $ | 4.97 | | | $ | 1,000.00 | | | $ | 1,020.08 | | | $ | 4.76 | | | | 0.95 | | | 181 | | 365 |
| Hartford MidCap HLS Fund |
| Main Risks (Unaudited) |
The main risks of investing in the Fund are described below.
Market, Selection and Strategy Risk: The Fund’s share price may fluctuate due to market risk and/or security selections that may underperform the market or relevant benchmarks. If the sub-adviser's investment strategy does not perform as expected, the Fund could underperform its peers or lose money. There is no guarantee the Fund will achieve its stated objective.
Mid-cap Stock Risk: Mid-cap stocks are generally more volatile and risky and may be less liquid than large-cap stocks because they may have limited operating histories, narrow product lines, and focus on niche markets.
Foreign Investment Risk: Investments in foreign securities may be riskier than investments in U.S. securities. Potential risks include the risks of illiquidity, increased price volatility, less government regulation, less extensive and less frequent accounting and other reporting requirements, unfavorable changes in currency exchange rates, and economic and political disruptions.
THIS PRIVACY POLICY IS NOT PART OF THIS REPORT
Privacy Policy and Practices of The Hartford Financial Services Group, Inc. and its Affiliates
(herein called “we, our and us”)
This Privacy Policy applies to our United States Operations
We value your trust. We are committed to the responsible: a) management; b) use; and c) protection; of Personal Information. This notice describes how we collect, disclose, and protect Personal Information. We collect Personal Information to: a) service your Transactions with us; and b) support our business functions. We may obtain Personal Information from: a) You; b) your Transactions with us; and c) third parties such as a consumer-reporting agency. Based on the type of product or service You apply for or get from us, Personal Information such as: a) your name; b) your address; c) your income; d) your payment; or e) your credit history; may be gathered from sources such as applications, Transactions, and consumer reports. To serve You and service our business, we may share certain Personal Information. We will share Personal Information, only as allowed by law, with affiliates such as: a) our insurance companies; b) our employee agents; c) our brokerage firms; and d) our administrators. As allowed by law, we may share Personal Financial Information with our affiliates to: a) market our products; or b) market our services; to You without providing You with an option to prevent these disclosures. | | | We may also share Personal Information, only as allowed by law, with unaffiliated third parties including: a) independent agents; b) brokerage firms; c) insurance companies; d) administrators; and e) service providers; who help us serve You and service our business. When allowed by law, we may share certain Personal Financial Information with other unaffiliated third parties who assist us by performing services or functions such as: a) taking surveys; b) marketing our products or services; or c) offering financial products or services under a joint agreement between us and one or more financial institutions. We, and third parties we partner with, may track some of the pages You visit through the use of: a) cookies; b) pixel tagging; or c) other technologies; and currently do not process or comply with any web browser’s “do not track” signal or similar mechanism that indicates a request to disable online tracking of individual users who visit our websites or use our services. We will not sell or share your Personal Financial Information with anyone for purposes unrelated to our business functions without offering You the opportunity to: a) “opt-out;” or b) “opt-in;” as required by law. We only disclose Personal Health Information with: a) your proper written authorization; or b) as otherwise allowed or required by law. Our employees have access to Personal Information in the course of doing their jobs, such as: a) underwriting policies; b) paying claims; c) developing new products; or d) advising customers of our products and services. |
We use manual and electronic security procedures to maintain: a) the confidentiality; and b) the integrity of; Personal Information that we have. We use these procedures to guard against unauthorized access. Some techniques we use to protect Personal Information include: a) secured files; b) user authentication; c) encryption; d) firewall technology; and e) the use of detection software. We are responsible for and must: a) identify information to be protected; b) provide an adequate level of protection for that data; c) grant access to protected data only to those people who must use it in the performance of their job-related duties. Employees who violate our Privacy Policy will be subject to discipline, which may include ending their employment with us. At the start of our business relationship, we will give You a copy of our current Privacy Policy. We will also give You a copy of our current Privacy Policy once a year if You maintain a continuing business relationship with us. We will continue to follow our Privacy Policy regarding Personal Information even when a business relationship no longer exists between us. | | | As used in this Privacy Notice: Application means your request for our product or service. Personal Financial Information means financial information such as: a) credit history; b) income; c) financial benefits; or d) policy or claim information. Personal Health Information means health information such as: a) your medical records; or b) information about your illness, disability or injury. Personal Information means information that identifies You personally and is not otherwise available to the public. It includes: a) Personal Financial Information; and b) Personal Health Information. Transaction means your business dealings with us, such as: a) your Application; b) your request for us to pay a claim; and c) your request for us to take an action on your account. You means an individual who has given us Personal Information in conjunction with: a) asking about; b) applying for; or c) obtaining; a financial product or service from us if the product or service is used mainly for personal, family, or household purposes. |
This Privacy Policy is being provided on behalf of the following affiliates of The Hartford Financial Services Group, Inc.:
1stAGChoice, Inc.; Access CoverageCorp, Inc.; Access CoverageCorp Technologies, Inc.; American Maturity Life Insurance Company; Archway 60 R, LLC; Business Management Group, Inc.; Champlain Life Reinsurance Company; DMS R, LLC; Eloy R, LLC; Ersatz Corporation; First State Insurance Company; Hartford Accident and Indemnity Company; Hartford Administrative Services Company; Hartford Casualty General Agency, Inc.; Hartford Casualty Insurance Company; Hartford-Comprehensive Employee Benefit Service Company; Hartford Equity Sales Company, Inc.; Hartford Fire General Agency, Inc.; Hartford Fire Insurance Company; Hartford Funds Management Company, LLC; Hartford Funds Management Group, Inc.; Hartford HLS Series Fund II, Inc.; Hartford Insurance Company of Illinois; Hartford Insurance Company of the Midwest; Hartford Insurance Company of the Southeast; Hartford Integrated Technologies, Inc.; Hartford International Life Reassurance Corporation; Hartford Funds Distributors, LLC; Hartford Investment Management Company; Hartford Life and Accident Insurance Company; Hartford Life and Annuity Insurance Company; Hartford Life Insurance Company; Hartford Life Private Placement, LLC; Hartford Lloyd’s Corporation; Hartford Lloyd’s Insurance Company; Hartford Mezzanine Investors I, LLC; Hartford Residual Market, L.C.C.; Hartford Retirement Services, LLC; Hartford Securities Distribution Company, Inc.; Hartford Series Fund, Inc.; Hartford Specialty Insurance Services of Texas, LLC; Hartford Strategic Investments, LLC; Hartford Underwriters Insurance Company; Hartford Technology Services Company, L.L.C.; Hartford of Texas General Agency, Inc.; Hartford Underwriters General Agency, Inc.; HARTRE Company, L.C.C.; HL Investment Advisors, LLC; HLA LLC; Horizon Management Group, LLC; HRA Brokerage Services, Inc.; Lanidex Class B, LLC; M-CAP Insurance Agency, LLC; New England Insurance Company; New England Reinsurance Corporation; Nutmeg Insurance Agency, Inc.; Nutmeg Insurance Company; Pacific Insurance Company, Limited; Planco, LLC: Property and Casualty Insurance Company of Hartford; Revere R, LLC; RVR R, LLC; Sentinel Insurance Company, Ltd.; Sunstone R, LLC; Symphony R, LLC; The Evergreen Group Incorporated; The Hartford Alternative Strategies Fund; The Hartford Mutual Funds, Inc.; The Hartford Mutual Funds II, Inc.; Trumbull Flood Management, L.L.C.; Trumbull Insurance Company; Twin City Fire Insurance Company; White River Life Reinsurance Company.
HPP Revised January 2014
HARTFORD HLS FUNDS
P.O. Box 14293
Lexington, KY 40512-4293
HARTFORDFUNDS
hartfordfunds.com
Hartford Series Fund, Inc. is underwritten and distributed by Hartford Funds Distributors, LLC.
Hartford Series Fund, Inc. inception dates range from 1977 to date. Hartford Series Fund, Inc. is not a subsidiary of The Hartford Financial Services Group, Inc. ("The Hartford") but is underwritten, distributed by and advised by subsidiaries of The Hartford. Investments in Hartford Series Fund, Inc. are not guaranteed by The Hartford or any other entity.
This report is submitted for the general information of the shareholders of the Funds. It is not authorized for distribution unless preceded or accompanied by a current prospectus for the Funds.
Investors should carefully consider the investment objectives, risks, charges, and expenses of Hartford Funds before investing. This and other information can be found in the prospectus, which can be obtained by calling 800-862-6668 (or 800-279-1541 for institutional investors). Investors should read them carefully before they invest.
HLSSAR-MC14 8-14 113547-3 Printed in U.S.A.
HARTFORDFUNDS
| | HARTFORD MIDCAP VALUE HLS FUND 2014 Semi Annual Report |
A MESSAGE FROM THE PRESIDENT
Dear Fellow Shareholders:
Thank you for investing in Hartford HLS Funds.
Market Review
U.S. equities (as represented by the S&P 500 Index) started 2014 on a shaky note after posting a strong 32.39% gain in 2013. However, stocks managed to maintain modest gains throughout the first quarter and returned to a generally steady climb in the second quarter. Through June 30, 2014, the S&P 500 Index advanced 7.14%. It appears that much of the market volatility during the year can be attributed to heightened international tensions. In particular, the Russian annexation of Ukraine’s Crimean Peninsula and increased tensions in Iraq were cause for concern.
On the domestic front, subdued economic and employment reports slowed stocks’ progress early in the new year, although much of the weakness seemed to dissipate as the year’s unusually harsh winter subsided. And despite initial reactions to the idea, when the U.S. Federal Reserve began tapering its quantitative-easing program in January by reducing its bond purchases by $10 billion a month, the markets took the policy change in stride.
Despite a rough start to the year for financial markets, the global economy seems to be settling into a slow-but-steady recovery. While first-quarter U.S. gross domestic product (GDP) growth was disappointing at -2.9%, U.S. consumer spending, which is a significant contributor toward economic growth, rose by 3% during the quarter. It appears that Europe is also maintaining its own recovery: The International Monetary Fund projects that Europe’s full-year GDP growth may breach positive territory for the first time since 2011.
The impact of international affairs on stocks so far this year is an important reminder to stay informed about both domestic and international economic developments, and any effects they may have on your individual investment goals. If you have not already had a mid-year review of your portfolio, it may be a good time to meet with your financial advisor to review your progress and make certain your investments are prepared for all market environments:
| • | Is your portfolio properly diversified with an appropriate mix of stocks and bonds? |
| • | Is your portfolio positioned to take advantage of the global economic recovery, with investments in both domestic and international holdings? |
| • | Are your investments still in line with your risk tolerance and investment time horizon? |
Your financial professional can help you choose options within our fund family to help you reach your investment goals with confidence.
Thank you again for investing with Hartford HLS Funds.
James Davey
President
Hartford HLS Funds
1 The S&P 500 Index is a market capitalization-weighted price index composed of 500 widely held common stocks.
2The Dow Jones Industrial Average is an unmanaged, price-weighted index of 30 of the largest, most widely held stocks traded on the New York Stock Exchange.
Hartford MidCap Value HLS Fund
Table of Contents
This report is prepared for the general information of contract owners and qualified retirement plan participants. It is not an offer of contracts or of qualified retirement plans. It should not be used in connection with any offer, except in conjunction with the appropriate product prospectus which contains all pertinent information including the applicable sales, administrative and other charges.
The views expressed in the Fund’s Manager Discussion under “Why did the Fund perform this way?” and “What is the outlook?” are views of the Fund’s sub-adviser and portfolio management team through the end of the period and are subject to change based on market and other conditions. The Fund’s Manager Discussion is for informational purposes only and does not represent an offer, recommendation or solicitation to buy, hold or sell any security. The specific securities identified and described, if any, do not represent all of the securities purchased or sold and you should not assume that investments in the securities identified and discussed will be profitable.
| Hartford MidCap Value HLS Fund inception 04/30/2001 |
| (sub-advised by Wellington Management Company, LLP) |
| |
| Investment objective – The Fund seeks long-term capital appreciation. |
Performance Overview 6/30/04 - 6/30/14
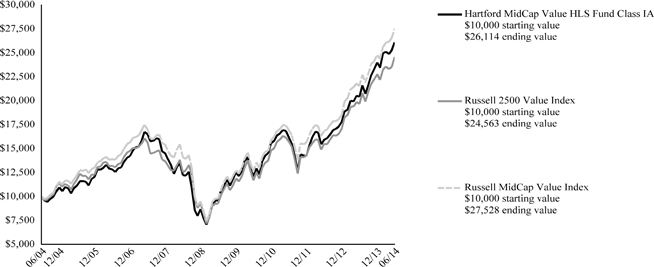
The chart above represents the hypothetical growth of a $10,000 investment in Class IA. Growth results in classes other than Class IA will vary from what is seen above due to differences in the expenses charged to those share classes.
Average Annual Total Returns (as of 6/30/14)
| | | 6 Month† | | 1 Year | | 5 Years | | 10 Years |
| MidCap Value IA | | | 8.83% | | | | 27.93% | | | | 22.14% | | | | 10.07% | |
| MidCap Value IB | | | 8.69% | | | | 27.59% | | | | 21.83% | | | | 9.81% | |
| Russell 2500 Value Index | | | 7.87% | | | | 24.94% | | | | 21.58% | | | | 9.40% | |
| Russell MidCap Value Index | | | 11.14% | | | | 27.76% | | | | 22.97% | | | | 10.66% | |
PERFORMANCE DATA QUOTED REPRESENTS PAST PERFORMANCE AND DOES NOT GUARANTEE FUTURE RESULTS. The investment return and principal value of the investment will fluctuate so that investors’ shares, when redeemed, may be worth more or less than their original cost. Current performance may be lower or higher than the performance data quoted. To obtain performance data current to the most recent month-end, please visit our website www.hartfordfunds.com.
Total returns presented above were calculated using the Fund’s net asset value available to shareholders for sale or redemption of Fund shares on June 30, 2014, which may exclude investment transactions as of this date. All share class returns assume the reinvestment of all distributions at net asset value and the deduction of all fund expenses.
Russell 2500 Value Index is an unmanaged index that measures the performance of those Russell 2500 Index companies with lower price-to-book ratios and lower forecasted growth values. The Russell 2500 Index is an unmanaged index that measures the performance of the 2,500 smallest U.S. companies based on total market capitalization.
Russell MidCap Value Index measures the performance of the mid-cap value segment of the U.S. equity universe. It includes those Russell MidCap Index companies with lower price-to-book ratios and lower forecasted growth values.
The index is unmanaged, and its results include reinvested dividends and/or distributions, but do not reflect the effect of sales charges, commissions, expenses or taxes.
You cannot invest directly in an index.
As shown in the Fund's current prospectus dated May 1, 2014, the total annual operating expense ratios for Class IA and Class IB were 0.84% and 1.09%, respectively. Actual expenses may be higher. Please see the accompanying Financial Highlights for expense ratios for the six-month period ended June 30, 2014.
The chart and table do not reflect the deductions of taxes, sales charges or other fees which may be applied at the variable life insurance, variable annuity or qualified retirement plan product level. Any such additional sales charges or other fees or expenses would lower the contract’s or plan’s performance.
All investments are subject to risk including the possible loss of principal. For a discussion of the Fund’s risks, please see the Main Risks section of this report. For more detailed information on the risks associated with an investment in the Fund, please see the prospectus.
| Hartford MidCap Value HLS Fund |
| Manager Discussion |
| June 30, 2014 (Unaudited) |
| Portfolio Manager | | |
| James N. Mordy | | |
| Senior Vice President and Equity Portfolio Manager | |
How did the Fund perform?
The Class IA shares of the Hartford MidCap Value HLS Fund returned 8.83% for the six-month period ended June 30, 2014, outperforming the Fund’s benchmark, the Russell 2500 Value Index, which returned 7.87% for the same period. The Fund also outperformed the 8.37% average return of the Lipper Mid-Cap Value Fund peer group, a group of funds with investment strategies similar to those of the Fund.
Why did the Fund perform this way?
U.S. equities surged during the period, ending June near an all-time high. After finishing 2013 with their best year since 1997, U.S. stocks began 2014 with their worst month in nearly two years. Worries about a slowdown in China and general concern surrounding emerging markets overshadowed a fairly benign domestic environment. However, robust merger and acquisition activity and an uncontested increase in the debt ceiling from Congress helped stoke investors' risk appetites in February. Earnings season in April provided a varied yet encouraging picture, with companies generally reporting healthy earnings but more subdued revenues. The rally continued in May amid renewed signs of life in the housing market and the best payroll gains in more than two years. In June, strong manufacturing activity, coupled with continued positive momentum in housing and employment data, helped to offset a large negative revision to first quarter economic growth.
Overall equity market performance was positive for the period across all market capitalizations: mid cap (+8%), large cap (+7%), and small cap equities (+3%) all rose, as represented by the S&P MidCap 400, S&P 500, and Russell 2000 Indices, respectively. All ten sectors in the Russell 2500 Value Index gained during the period, with Energy (+22%), Utilities (+18%), and Healthcare (+8%) performing the best. Materials (+1%), Industrials (+4%) and Consumer Discretionary (+6%) lagged on a relative basis.
The Fund’s relative outperformance versus the Russell 2500 Value Index was driven by security selection. Strong stock selection within Information Technology, Materials, and Energy sectors substantially outweighed weaker stock selection within Consumer Discretionary. Sector allocation, a result of the bottom-up security selection process detracted modestly from relative results. An underweight to Utilities and an overweight to Materials detracted while an underweight allocation to Financials contributed to outperformance relative to the Russell 2500 Value Index. A modest cash position in an upward trending market environment detracted from relative results.
The largest contributors to absolute and benchmark-relative performance included Skyworks Solutions (Information Technology), NXP Semiconductors (Information Technology), and Diamondback Energy (Energy). Shares of Skyworks Solutions, a leading supplier of mixed-signal analog semiconductors, outperformed as the company continued to gain share from a broadening customer base in the smartphone market as well as better-than-forecast growth from Skyworks' increasingly important integrated analog solution segment. NXP Semiconductors, a Netherlands-based semiconductor company, saw shares rise around speculation that NXP will provide NFC technology (short-range communications between compatible devices) to Apple's iPhone 6 and iWatch. Diamondback Energy is an oil and natural gas exploration and production (E&P) company with activities focused in the Permian Basin in West Texas. Shares rose as a result of reporting several new wells and growing production that should accelerate over time as well as the successful initial public offering of its subsidiary, Viper Energy Partners.
The largest detractors from returns relative to the Russell 2500 Value Index included GNC (Consumer Discretionary), Louisiana-Pacific (Materials), and Chicago Bridge & Iron (Industrials). Shares of nutritional supplement retailer GNC declined after the company reported disappointing earnings in the first quarter of 2014 and revised down their full year 2014 expectations. A combination of weaker industry trends and GNC-specific issues has led to a deceleration in same-store-sales trends. Shares of Louisiana-Pacific, a U.S.-based producer of oriented strand board, which is used in structural sheathing in new homes and room additions, declined during the period as investors became cautious over the near-term housing cycle in the U.S. Shares of Chicago Bridge & Iron, an energy infrastructure focused company and provider of government services, underperformed as the company was accused of inflating profitability and violating accounting standards. Express (Consumer Discretionary) also detracted from the Fund’s absolute performance.
Derivatives are not used in a significant manner in this Fund and did not have a material impact on performance during the period.
What is the outlook?
We believe the 1Q (-2.9% GDP) was aberrational and is behind us, and we look for the U.S. economy to grow in a 2.5-3.0 range over the next 12 to 18 months. The average gain in payrolls over the past three months has been a robust 272,000, and unemployment has fallen to 6.1%. Accelerating wage growth, industrial capacity utilization near 80% and rising energy and housing costs all appear to point to a modest tick up in inflation expectations. While the European recovery has been tepid, China appears to have stabilized and Japan seems to have weathered the consumption tax hike.
| Hartford MidCap Value HLS Fund |
| Manager Discussion – (continued) |
| June 30, 2014 (Unaudited) |
Absent an unexpectedly large gain in U.S. workforce participation, we expect the U.S. Federal Reserve to begin raising short term rates by mid-year 2015 as the unemployment rate approaches 5.5%. This could create a choppier period for equities.
The Russell 2500 Value Index was rebalanced at the end of the quarter with minor changes in sector weights. The new weightings are slightly less cyclical, due mostly to a drop in Financials and a slight increase to Consumer Staples.
While it has become more challenging to find new ideas that appear dramatically undervalued in an absolute sense, we continue to manage the portfolio to seek to provide good relative value.
As of the end of the period, we were most overweight the Information Technology, Materials, and Consumer Discretionary sectors and most underweight the Financials, Utilities, and Telecommunication Services sectors relative to the Russell 2500 Value Index.
| Diversification by Sector |
| as of June 30, 2014 |
| Sector | | Percentage of
Net Assets | |
| Equity Securities | | | | |
| Consumer Discretionary | | | 12.6 | % |
| Consumer Staples | | | 3.4 | |
| Energy | | | 7.0 | |
| Financials | | | 25.5 | |
| Health Care | | | 7.3 | |
| Industrials | | | 14.2 | |
| Information Technology | | | 14.7 | |
| Materials | | | 8.3 | |
| Utilities | | | 5.5 | |
| Total | | | 98.5 | % |
| Short-Term Investments | | | 1.2 | |
| Other Assets and Liabilities | | | 0.3 | |
| Total | | | 100.0 | % |
A sector may be comprised of several industries. For Fund compliance purposes, the Fund may not use the same classification system and these sector classifications are used for reporting ease.
| Hartford MidCap Value HLS Fund |
| Schedule of Investments |
| June 30, 2014 (Unaudited) |
| (000’s Omitted) |
| Shares or Principal Amount | | Market Value ╪ | |
| Common Stocks - 98.5% | | | | |
| | | | | Automobiles and Components - 1.1% | | | | |
| | 207 | | | Goodyear (The) Tire & Rubber Co. | | $ | 5,762 | |
| | | | | | | | | |
| | | | | Banks - 6.9% | | | | |
| | 187 | | | BankUnited, Inc. | | | 6,256 | |
| | 178 | | | Comerica, Inc. | | | 8,933 | |
| | 203 | | | EverBank Financial Corp. | | | 4,100 | |
| | 90 | | | Iberiabank Corp. | | | 6,227 | |
| | 319 | | | Zions Bancorporation | | | 9,404 | |
| | | | | | | | 34,920 | |
| | | | | Capital Goods - 14.2% | | | | |
| | 239 | | | Barnes Group, Inc. | | | 9,201 | |
| | 27 | | | Chicago Bridge & Iron Co. N.V. | | | 1,841 | |
| | 82 | | | Curtis-Wright Corp. | | | 5,389 | |
| | 82 | | | Esterline Technologies Corp. ● | | | 9,472 | |
| | 73 | | | Hubbell, Inc. Class B | | | 8,990 | |
| | 123 | | | Moog, Inc. Class A ● | | | 8,929 | |
| | 153 | | | Orbital Sciences Corp. ● | | | 4,530 | |
| | 237 | | | Rexel S.A. | | | 5,547 | |
| | 125 | | | Sensata Technologies Holding N.V. ● | | | 5,866 | |
| | 20 | | | Teledyne Technologies, Inc. ● | | | 1,905 | |
| | 119 | | | WESCO International, Inc. ● | | | 10,271 | |
| | | | | | | | 71,941 | |
| | | | | Consumer Durables and Apparel - 6.1% | | | | |
| | 162 | | | Lennar Corp. | | | 6,780 | |
| | 290 | | | Newell Rubbermaid, Inc. | | | 8,978 | |
| | 165 | | | Performance Sports Group, Ltd. ● | | | 2,830 | |
| | 1,657 | | | Samsonite International S.A. | | | 5,462 | |
| | 184 | | | Toll Brothers, Inc. ● | | | 6,778 | |
| | | | | | | | 30,828 | |
| | | | | Consumer Services - 1.4% | | | | |
| | 216 | | | Norwegian Cruise Line Holdings Ltd. ● | | | 6,847 | |
| | | | | | | | | |
| | | | | Diversified Financials - 1.3% | | | | |
| | 128 | | | LPL Financial Holdings, Inc. | | | 6,372 | |
| | 452 | | | Solar Cayman Ltd. ⌂■●† | | | 32 | |
| | | | | | | | 6,404 | |
| | | | | Energy - 7.0% | | | | |
| | 423 | | | Cobalt International Energy, Inc. ● | | | 7,770 | |
| | 97 | | | Diamondback Energy, Inc. ● | | | 8,578 | |
| | 78 | | | HollyFrontier Corp. | | | 3,386 | |
| | 16 | | | Memorial Resource Development Corp. ● | | | 387 | |
| | 47 | | | Newfield Exploration Co. ● | | | 2,091 | |
| | 154 | | | QEP Resources, Inc. | | | 5,299 | |
| | 476 | | | Trican Well Service Ltd. | | | 7,691 | |
| | | | | | | | 35,202 | |
| | | | | Food, Beverage and Tobacco - 3.4% | | | | |
| | 152 | | | Ebro Foods S.A. | | | 3,378 | |
| | 97 | | | Ingredion, Inc. | | | 7,301 | |
| | 1,393 | | | Treasury Wine Estates Ltd. | | | 6,576 | |
| | | | | | | | 17,255 | |
| | | | | Health Care Equipment and Services - 3.1% | | | | |
| | 249 | | | Brookdale Senior Living, Inc. ● | | | 8,285 | |
| | 99 | | | Wellcare Health Plans, Inc. ● | | | 7,369 | |
| | | | | | | | 15,654 | |
| | | | | Insurance - 8.9% | | | | |
| | 101 | | | Argo Group International Holdings Ltd. | | | 5,152 | |
| | 132 | | | Hanover Insurance Group, Inc. | | | 8,336 | |
| | 14 | | | Principal Financial Group, Inc. | | | 727 | |
| | 146 | | | Reinsurance Group of America, Inc. | | | 11,505 | |
| | 338 | | | Unum Group | | | 11,738 | |
| | 229 | | | XL Group plc | | | 7,498 | |
| | | | | | | | 44,956 | |
| | | | | Materials - 8.3% | | | | |
| | 132 | | | Cabot Corp. | | | 7,626 | |
| | 114 | | | Celanese Corp. | | | 7,354 | |
| | 353 | | | Louisiana-Pacific Corp. ● | | | 5,302 | |
| | 216 | | | Methanex Corp. ADR | | | 13,326 | |
| | 132 | | | Owens-Illinois, Inc. ● | | | 4,572 | |
| | 50 | | | Packaging Corp. of America | | | 3,596 | |
| | | | | | | | 41,776 | |
| | | | | Media - 2.5% | | | | |
| | 64 | | | AMC Entertainment Holdings | | | 1,584 | |
| | 330 | | | Interpublic Group of Cos., Inc. | | | 6,432 | |
| | 195 | | | Quebecor, Inc. | | | 4,726 | |
| | | | | | | | 12,742 | |
| | | | | Pharmaceuticals, Biotechnology and Life Sciences - 4.2% | | | | |
| | 647 | | | Almirall S.A. | | | 10,495 | |
| | 80 | | | Ono Pharmaceutical Co., Ltd. | | | 7,020 | |
| | 45 | | | UCB S.A. | | | 3,768 | |
| | | | | | | | 21,283 | |
| | | | | Real Estate - 8.4% | | | | |
| | 172 | | | American Assets Trust, Inc. REIT | | | 5,926 | |
| | 227 | | | Blackstone Mortgage Trust, Inc. REIT | | | 6,574 | |
| | 169 | | | Equity Lifestyle Properties, Inc. REIT | | | 7,472 | |
| | 135 | | | Extra Space Storage, Inc. REIT | | | 7,210 | |
| | 249 | | | Forest City Enterprises, Inc. REIT ● | | | 4,940 | |
| | 139 | | | Plum Creek Timber Co., Inc. REIT | | | 6,282 | |
| | 36 | | | SL Green Realty Corp. REIT | | | 3,906 | |
| | | | | | | | 42,310 | |
| | | | | Retailing - 1.5% | | | | |
| | 92 | | | DSW, Inc. | | | 2,559 | |
| | 145 | | | GNC Holdings, Inc. | | | 4,955 | |
| | | | | | | | 7,514 | |
| | | | | Semiconductors and Semiconductor Equipment - 8.0% | | | | |
| | 102 | | | Avago Technologies Ltd. | | | 7,351 | |
| | 192 | | | Maxim Integrated Products, Inc. | | | 6,499 | |
| | 304 | | | Microsemi Corp. ● | | | 8,135 | |
| | 185 | | | NXP Semiconductors N.V. ● | | | 12,217 | |
| | 133 | | | Skyworks Solutions, Inc. | | | 6,264 | |
| | | | | | | | 40,466 | |
| | | | | Software and Services - 4.3% | | | | |
| | 140 | | | Booz Allen Hamilton Holding Corp. | | | 2,982 | |
| | 75 | | | Check Point Software Technologies Ltd. ADR ● | | | 5,000 | |
| | 145 | | | Teradata Corp. ● | | | 5,841 | |
| | 162 | | | Verint Systems, Inc. ● | | | 7,922 | |
| | | | | | | | 21,745 | |
| | | | | Technology Hardware and Equipment - 2.4% | | | | |
| | 200 | | | Arrow Electronics, Inc. ● | | | 12,100 | |
| | | | | | | | | |
| | | | | Utilities - 5.5% | | | | |
| | 48 | | | Alliant Energy Corp. | | | 2,909 | |
| | 173 | | | Great Plains Energy, Inc. | | | 4,635 | |
| | 175 | | | Portland General Electric Co. | | | 6,067 | |
| | 175 | | | UGI Corp. | | | 8,858 | |
The accompanying notes are an integral part of these financial statements.
| Hartford MidCap Value HLS Fund |
| Schedule of Investments – (continued) |
| June 30, 2014 (Unaudited) |
| (000’s Omitted) |
| Shares or Principal Amount | | | | | | | Market Value ╪ | |
| Common Stocks - 98.5% - (continued) | | | | | | | | |
| | | | | Utilities - 5.5% - (continued) | | | | | | | | |
| | 135 | | | Westar Energy, Inc. | | | | | | $ | 5,152 | |
| | | | | | | | | | | | 27,621 | |
| | | | | Total Common Stocks | | | | | | | | |
| | | | | (Cost $361,494) | | | | | | $ | 497,326 | |
| | | | | | | | | | | | | |
| | | | | Total Long-Term Investments | | | | | | | | |
| | | | | (Cost $361,494) | | | | | | $ | 497,326 | |
| | | | | | | | | | | | | |
| Short-Term Investments - 1.2% | | | | | | | | |
| Repurchase Agreements - 1.2% | | | | | | | | |
| | | | | Bank of America Merrill Lynch TriParty Repurchase
Agreement (maturing on 07/01/2014 in the
amount of $526, collateralized by FHLMC 2.23%
- 5.99%, 2030 - 2044, FNMA 2.31% - 6.34%,
2020 - 2042, value of $537) | | | | | | | | |
| $ | 526 | | | 0.10%, 6/30/2014 | | | | | | $ | 526 | |
| | | | | Bank of Montreal TriParty Repurchase Agreement
(maturing on 07/01/2014 in the amount of $804,
collateralized by U.S. Treasury Bill 0.13%, 2015,
U.S. Treasury Bond 2.75% - 10.63%, 2015 -
2044, U.S. Treasury Note 0.13% - 4.50%, 2014 -
2024, value of $820) | | | | | | | | |
| | 804 | | | 0.09%, 6/30/2014 | | | | | | | 804 | |
| | | | | Bank of Montreal TriParty Repurchase Agreement
(maturing on 07/01/2014 in the amount of $343,
collateralized by FHLMC 2.00% - 5.50%, 2018 -
2041, FNMA 2.00% - 4.50%, 2026 - 2042,
GNMA 3.00% - 4.00%, 2042 - 2043, U.S.
Treasury Bill 0.05%, 2014, U.S. Treasury Note
0.75%, 2018, value of $350) | | | | | | | | |
| | 343 | | | 0.11%, 6/30/2014 | | | | | | | 343 | |
| | | | | Barclays Capital TriParty Repurchase Agreement
(maturing on 07/01/2014 in the amount of $317,
collateralized by U.S. Treasury Note 0.63% -
0.88%, 2018 - 2019, value of $323) | | | | | | | | |
| | 317 | | | 0.07%, 6/30/2014 | | | | | | | 317 | |
| | | | | Citigroup Global Markets, Inc. TriParty Repurchase
Agreement (maturing on 07/01/2014 in the
amount of $730, collateralized by U.S. Treasury
Bond 4.38% - 7.50%, 2016 - 2040, U.S.
Treasury Note 0.50% - 3.00%, 2014 - 2020,
value of $745) | | | | | | | | |
| | 730 | | | 0.06%, 6/30/2014 | | | | | | | 730 | |
| | | | | RBS Securities Inc. TriParty Repurchase
Agreement (maturing on 07/01/2014 in the
amount of $1,119, collateralized by U.S.
Treasury Note 0.38% - 3.13%, 2015 - 2022,
value of $1,142) | | | | | | | | |
| | 1,119 | | | 0.08%, 6/30/2014 | | | | | | | 1,119 | |
| | | | | TD Securities TriParty Repurchase Agreement
(maturing on 07/01/2014 in the amount of
$2,330, collateralized by FHLMC 3.50% - 4.00%,
2026 - 2044, FNMA 2.50% - 5.00%, 2025 -
2043, value of $2,376) | | | | | | | | |
| | 2,330 | | | 0.11%, 6/30/2014 | | | | | | | 2,330 | |
| | | | | UBS Securities Repurchase Agreement (maturing
on 07/01/2014 in the amount of $9, collateralized
by U.S. Treasury Note 2.13%, 2020, value of
$10) | | | | | | | | |
| | 9 | | | 0.05%, 6/30/2014 | | | | | | | 9 | |
| | | | | | | | | | | | 6,178 | |
| | | | | Total Short-Term Investments | | | | | | | | |
| | | | | (Cost $6,178) | | | | | | $ | 6,178 | |
| | | | | | | | | | | | | |
| | | | | Total Investments | | | | | | | | |
| | | | | (Cost $367,672) ▲ | | | 99.7 | % | | $ | 503,504 | |
| | | | | Other Assets and Liabilities | | | 0.3 | % | | | 1,435 | |
| | | | | Total Net Assets | | | 100.0 | % | | $ | 504,939 | |
The accompanying notes are an integral part of these financial statements.
| Hartford MidCap Value HLS Fund |
| Schedule of Investments – (continued) |
| June 30, 2014 (Unaudited) |
| (000’s Omitted) |
| Note: | Percentage of investments as shown is the ratio of the total market value to total net assets. |
Prices of foreign equities that are principally traded on certain foreign markets may be adjusted daily pursuant to a fair value pricing service approved by the Board of Directors in order to reflect an adjustment for factors occurring after the close of certain foreign markets but before the close of the New York Stock Exchange.
| ▲ | At June 30, 2014, the cost of securities for federal income tax purposes was $370,255 and the aggregate gross unrealized appreciation and depreciation based on that cost were: |
| Unrealized Appreciation | | $ | 138,343 | |
| Unrealized Depreciation | | | (5,094 | ) |
| Net Unrealized Appreciation | | $ | 133,249 | |
| † | These securities are valued in good faith at fair value as determined under policies and procedures established by and under the supervision of the Board of Directors. At June 30, 2014, the aggregate value of these securities was $32, which rounds to zero percent of total net assets. This amount excludes securities that are principally traded in certain foreign markets and whose prices are adjusted pursuant to a third party pricing service methodology approved by the Board of Directors. |
| ■ | Securities issued within terms of a private placement memorandum, exempt from registration under Rule 144A under the Securities Act of 1933, as amended, and may be sold only to qualified institutional buyers. Unless otherwise indicated, these holdings are determined to be liquid. At June 30, 2014, the aggregate value of these securities was $32, which rounds to zero percent of total net assets. |
| ⌂ | The following securities are considered illiquid. Illiquid securities are often purchased in private placement transactions, are often not registered under the Securities Act of 1933, as amended, and may have contractual restrictions on resale. A security may also be considered illiquid if the security lacks a readily available market or if its valuation has not changed for a certain period of time. |
| Period Acquired | | Shares/ Par | | | Security | | Cost Basis | |
| 03/2007 | | | 452 | | | Solar Cayman Ltd. - 144A | | $ | 132 | |
At June 30, 2014, the aggregate value of these securities was $32, which rounds to zero percent of total net assets.
| ╪ | See Significant Accounting Policies of accompanying Notes to Financial Statements regarding valuation of securities. |
| GLOSSARY: (abbreviations used in preceding Schedule of Investments) |
| |
| Other Abbreviations: |
| ADR | American Depositary Receipt |
| FHLMC | Federal Home Loan Mortgage Corp. |
| FNMA | Federal National Mortgage Association |
| GNMA | Government National Mortgage Association |
| REIT | Real Estate Investment Trust |
The accompanying notes are an integral part of these financial statements.
| Hartford MidCap Value HLS Fund |
| Investment Valuation Hierarchy Level Summary |
| June 30, 2014 (Unaudited) |
| (000’s Omitted) |
| | | Total | | | Level 1 ♦ | | | Level 2 ♦ | | | Level 3 | |
| Assets: | | | | | | | | | | | | | | | | |
| Common Stocks ‡ | | $ | 497,326 | | | $ | 460,595 | | | $ | 36,699 | | | $ | 32 | |
| Short-Term Investments | | | 6,178 | | | | – | | | | 6,178 | | | | – | |
| Total | | $ | 503,504 | | | $ | 460,595 | | | $ | 42,877 | | | $ | 32 | |
| ♦ | For the six-month period ended June 30, 2014, investments valued at $6,416 were transferred from Level 2 to Level 1, and there were no transfers from Level 1 to Level 2. Investments are transferred between Level 1 and Level 2 for a variety of reasons including, but not limited to: |
| 1) | Foreign equities for which a fair value price is more representative of exit value than the local market close (transfer into Level 2). Foreign equities for which the local market close is more representative of exit value (transfer into Level 1). |
| 2) | U.S. Treasury securities that no longer represent the most recent issue (transfer into Level 2). |
| 3) | Equity investments with no observable trading but a bid or mean price is used (transfer into Level 2). Equity investments using observable quoted prices in an active market (transfer into Level 1). |
| ‡ | The Fund has all or primarily all of the equity securities categorized in a particular level. Refer to the Schedule of Investments for further industry breakout. |
Following is a reconciliation of Level 3 assets for which significant unobservable inputs were used to determine fair value:
| | | Balance as
of
December
31, 2013 | | | Realized
Gain (Loss) | | | Change in
Unrealized
Appreciation
(Depreciation) | | | Net
Amortization | | | Purchases | | | Sales | | | Transfers
Into
Level 3 | | | Transfers
Out of
Level 3 | | | Balance
as of June 30,
2014 | |
| Assets: | | | | | | | | | | | | | | | | | | | | | | | | | | | | | | | | | | | | |
| Common Stocks | | $ | 32 | | | $ | — | | | $ | — | * | | $ | — | | | $ | — | | | $ | — | | | $ | — | | | $ | — | | | $ | 32 | |
| Total | | $ | 32 | | | $ | — | | | $ | — | | | $ | — | | | $ | — | | | $ | — | | | $ | — | | | $ | — | | | $ | 32 | |
| * | Change in unrealized appreciation (depreciation) in the current period relating to assets still held at June 30, 2014 was zero. |
| Note: | For purposes of reporting transfers between different hierarchy levels, both transfers in and out of each level, as applicable, are shown as if they occurred at the beginning of the period. |
The accompanying notes are an integral part of these financial statements.
| Hartford MidCap Value HLS Fund |
| Statement of Assets and Liabilities |
| June 30, 2014 (Unaudited) |
| (000’s Omitted) |
| Assets: | | | | |
| Investments in securities, at market value (cost $367,672) | | $ | 503,504 | |
| Cash | | | 1 | |
| Foreign currency on deposit with custodian (cost $54) | | | 54 | |
| Receivables: | | | | |
| Investment securities sold | | | 2,053 | |
| Fund shares sold | | | 1 | |
| Dividends and interest | | | 869 | |
| Other assets | | | 1 | |
| Total assets | | | 506,483 | |
| Liabilities: | | | | |
| Payables: | | | | |
| Investment securities purchased | | | 964 | |
| Fund shares redeemed | | | 454 | |
| Investment management fees | | | 55 | |
| Distribution fees | | | 4 | |
| Accrued expenses | | | 67 | |
| Total liabilities | | | 1,544 | |
| Net assets | | $ | 504,939 | |
| Summary of Net Assets: | | | | |
| Capital stock and paid-in-capital | | $ | 277,263 | |
| Undistributed net investment income | | | 3,193 | |
| Accumulated net realized gain | | | 88,649 | |
| Unrealized appreciation of investments and the translations of assets and liabilities denominated in foreign currency | | | 135,834 | |
| Net assets | | $ | 504,939 | |
| Shares authorized | | | 1,200,000 | |
| Par value | | $ | 0.001 | |
| Class IA: Net asset value per share | | $ | 16.88 | |
| Shares outstanding | | | 22,580 | |
| Net assets | | $ | 381,145 | |
| Class IB: Net asset value per share | | $ | 16.76 | |
| Shares outstanding | | | 7,386 | |
| Net assets | | $ | 123,794 | |
The accompanying notes are an integral part of these financial statements.
| Hartford MidCap Value HLS Fund |
| Statement of Operations |
| For the Six-Month Period Ended June 30, 2014 (Unaudited) |
| (000’s Omitted) |
| Investment Income: | | | | |
| Dividends | | $ | 3,850 | |
| Interest | | | 1 | |
| Less: Foreign tax withheld | | | (109 | ) |
| Total investment income, net | | | 3,742 | |
| | | | | |
| Expenses: | | | | |
| Investment management fees | | | 1,965 | |
| Transfer agent fees | | | 2 | |
| Distribution fees - Class IB | | | 151 | |
| Custodian fees | | | 5 | |
| Accounting services fees | | | 25 | |
| Board of Directors' fees | | | 6 | |
| Audit fees | | | 10 | |
| Other expenses | | | 57 | |
| Total expenses (before fees paid indirectly) | | | 2,221 | |
| Commission recapture | | | (5 | ) |
| Total fees paid indirectly | | | (5 | ) |
| Total expenses, net | | | 2,216 | |
| Net Investment Income | | | 1,526 | |
| | | | | |
| Net Realized Gain on Investments and Foreign Currency Transactions: | | | | |
| Net realized gain on investments | | | 30,458 | |
| Net realized loss on foreign currency contracts | | | (3 | ) |
| Net realized gain on other foreign currency transactions | | | 7 | |
| Net Realized Gain on Investments and Foreign Currency Transactions | | | 30,462 | |
| | | | | |
| Net Changes in Unrealized Appreciation of Investments and Foreign Currency Transactions: | | | | |
| Net unrealized appreciation of investments | | | 9,741 | |
| Net unrealized depreciation of foreign currency contracts | | | (2 | ) |
| Net unrealized appreciation on translation of other assets and liabilities in foreign currencies | | | 3 | |
| Net Changes in Unrealized Appreciation of Investments and Foreign Currency Transactions | | | 9,742 | |
| Net Gain on Investments and Foreign Currency Transactions | | | 40,204 | |
| Net Increase in Net Assets Resulting from Operations | | $ | 41,730 | |
The accompanying notes are an integral part of these financial statements.
| Hartford MidCap Value HLS Fund |
| Statement of Changes in Net Assets |
| |
| (000’s Omitted) |
| | | For the
Six-Month
Period Ended
June 30, 2014
(Unaudited) | | | For the
Year Ended
December 31,
2013 | |
| Operations: | | | | | | | | |
| Net investment income | | $ | 1,526 | | | $ | 2,371 | |
| Net realized gain on investments and foreign currency transactions | | | 30,462 | | | | 86,309 | |
| Net unrealized appreciation of investments and foreign currency transactions | | | 9,742 | | | | 51,787 | |
| Net Increase in Net Assets Resulting from Operations | | | 41,730 | | | | 140,467 | |
| Distributions to Shareholders: | | | | | | | | |
| From net investment income | | | | | | | | |
| Class IA | | | — | | | | (4,389 | ) |
| Class IB | | | — | | | | (1,173 | ) |
| Total distributions | | | — | | | | (5,562 | ) |
| Capital Share Transactions: | | | | | | | | |
| Class IA | | | | | | | | |
| Sold | | | 6,987 | | | | 35,081 | |
| Issued on reinvestment of distributions | | | — | | | | 4,389 | |
| Redeemed | | | (34,722 | ) | | | (87,130 | ) |
| Total capital share transactions | | | (27,735 | ) | | | (47,660 | ) |
| Class IB | | | | | | | | |
| Sold | | | 2,755 | | | | 13,985 | |
| Issued on reinvestment of distributions | | | — | | | | 1,173 | |
| Redeemed | | | (12,967 | ) | | | (38,177 | ) |
| Total capital share transactions | | | (10,212 | ) | | | (23,019 | ) |
| Net decrease from capital share transactions | | | (37,947 | ) | | | (70,679 | ) |
| Net Increase in Net Assets | | | 3,783 | | | | 64,226 | |
| Net Assets: | | | | | | | | |
| Beginning of period | | | 501,156 | | | | 436,930 | |
| End of period | | $ | 504,939 | | | $ | 501,156 | |
| Undistributed (distribution in excess of) net investment income | | $ | 3,193 | | | $ | 1,667 | |
| Shares: | | | | | | | | |
| Class IA | | | | | | | | |
| Sold | | | 432 | | | | 2,657 | |
| Issued on reinvestment of distributions | | | — | | | | 312 | |
| Redeemed | | | (2,178 | ) | | | (6,440 | ) |
| Total share activity | | | (1,746 | ) | | | (3,471 | ) |
| Class IB | | | | | | | | |
| Sold | | | 171 | | | | 1,052 | |
| Issued on reinvestment of distributions | | | — | | | | 84 | |
| Redeemed | | | (819 | ) | | | (2,853 | ) |
| Total share activity | | | (648 | ) | | | (1,717 | ) |
The accompanying notes are an integral part of these financial statements.
| Hartford MidCap Value HLS Fund |
| Notes to Financial Statements |
| June 30, 2014 (Unaudited) |
| (000’s Omitted) |
Organization:
Hartford MidCap Value HLS Fund (the "Fund") serves as an underlying investment option for certain variable annuity and variable life insurance separate accounts of Hartford Life Insurance Company (“HLIC”) and its affiliates and certain qualified retirement plans. The Fund may also serve as an underlying investment option for certain variable annuity and variable life separate accounts of other insurance companies. Owners of variable annuity contracts and policyholders of variable life insurance contracts may choose the funds permitted in the variable insurance contract prospectus. In addition, participants in certain qualified retirement plans may choose the Fund if permitted by their plans.
Hartford Series Fund, Inc. (the “Company”) is an open-end registered management investment company comprised of twenty-eight portfolios. Financial statements for the Fund, a series of the Company, are included in this report.
The Company is organized under the laws of the State of Maryland and is registered with the Securities and Exchange Commission (“SEC”) under the Investment Company Act of 1940, as amended (“1940 Act”). The Fund is a diversified open-end management investment company.
The Fund is divided into Class IA and Class IB shares. Each class is offered at the per share net asset value (“NAV”) without a sales charge and is subject to the same expenses, except that the Class IB shares are subject to distribution and service fees charged pursuant to a Distribution Plan adopted in accordance with Rule 12b-1 under the 1940 Act.
Significant Accounting Policies:
The following is a summary of significant accounting policies of the Fund in the preparation of its financial statements, which are in accordance with United States Generally Accepted Accounting Principles (“U.S. GAAP”). The preparation of financial statements in accordance with U.S. GAAP may require management to make estimates and assumptions that affect the reported amounts of assets and liabilities and disclosure of contingent assets and liabilities at the date of the financial statements and the reported amounts of increases and decreases in net assets from operations during the reporting period. Actual results could differ from those estimates.
Determination of Net Asset Value – The NAV of each class of the Fund's shares is determined as of the close of regular trading (normally 4:00 p.m. Eastern Time) (the “NYSE Close”) on each day that the New York Stock Exchange (the “Exchange”) is open (“Valuation Date”). Information that becomes known to the Fund after the NAV has been calculated on a particular day will not generally be used to retroactively adjust the NAV determined earlier that day.
Investment Valuation and Fair Value Measurements – For purposes of calculating the NAV, portfolio investments and other assets held by the Fund's portfolio for which market quotes are readily available are valued at market value. Market value is generally determined on the basis of last reported sales prices or official close price. If no sales are reported, market value is based on quotes obtained from a quotation reporting system, established market makers, or independent pricing services. If market prices are not readily available or are deemed unreliable, the Fund will use the fair value of the investment as determined in good faith under policies and procedures established by and under the supervision of the Company's Board of Directors. Market quotes are considered not readily available where there is an absence of current or reliable market-based data (e.g., trade information or indicative market quotes), including where events occur after the close of the relevant market, but prior to the NYSE Close, that materially affect the values of the Fund's portfolio investments or assets. In addition, market quotes are considered not readily available when, due to extraordinary circumstances, the exchanges or markets on which the investments trade do not open for trading for the entire day and no other market prices are available. In addition, prices of foreign equities that are principally traded on certain foreign markets may be adjusted daily pursuant to a fair value pricing service approved by the Board of Directors in order to reflect an adjustment for the factors occurring after the close of certain foreign markets but before the NYSE Close. Investments that are primarily traded on foreign markets may trade on days that are not business days of the Fund. The value of the foreign investments in which the Fund invests may change on days when a shareholder will not be able to purchase or redeem shares of the Fund. Fair value pricing is subjective in nature and the use of fair value pricing by the Fund may cause the NAV of its shares to differ significantly from the NAV that would have been calculated using market prices at the close of the exchange on which a portfolio investment is primarily traded. There can be no assurance that the Fund could obtain the fair market value assigned to an investment if the Fund were to sell the investment at approximately the time at which the Fund determines its NAV.
| Hartford MidCap Value HLS Fund |
| Notes to Financial Statements – (continued) |
| June 30, 2014 (Unaudited) |
| (000’s Omitted) |
Investments valued in currencies other than U.S. dollars are converted to U.S. dollars using exchange rates obtained from independent pricing services for calculation of the NAV. As a result, the NAV of the Fund’s shares may be affected by changes in the value of currencies in relation to the U.S. dollar. The value of investments traded in markets outside the United States or denominated in currencies other than the U.S. dollar may be affected significantly on a day that the NYSE is closed and the market value may change on days when an investor is not able to purchase, redeem or exchange shares of the Fund.
Foreign currency contracts represent agreements to exchange currencies on specific future dates at predetermined rates. Foreign currency contracts are valued using foreign currency exchange rates and forward rates as provided by an independent pricing service on the Valuation Date.
Financial instruments for which prices are not available from an independent pricing service may be valued using market quotations obtained from one or more dealers that make markets in the respective financial instrument in accordance with procedures established by the Company's Board of Directors.
U.S. GAAP defines fair value as the price that the Fund would receive to sell an asset or pay to transfer a liability in an orderly transaction between market participants. The U.S. GAAP fair value measurement standards require disclosure of a fair value hierarchy for each major category of assets and liabilities. Various inputs are used in determining the fair value of the Fund’s investments. These inputs are summarized into three broad hierarchy levels. This hierarchy is based on whether the valuation inputs are observable or unobservable. These levels are:
Level 1 – Quoted prices in active markets for identical investments. Level 1 may include exchange traded instruments, such as domestic equities, some foreign equities, options, futures, mutual funds, exchange traded funds, rights and warrants.
Level 2 – Observable inputs other than Level 1 prices, such as quoted prices for similar investments; quoted prices in markets that are not active; or other inputs that are observable or can be corroborated by observable market data. Level 2 may include debt investments that are traded less frequently than exchange traded instruments and which are valued using independent pricing services; foreign equities, which are principally traded on certain foreign markets and are adjusted daily pursuant to a fair value pricing service in order to reflect an adjustment for the factors occurring after the close of certain foreign markets but before the NYSE Close; senior floating rate interests, which are valued using an aggregate of dealer bids; short-term investments, which are valued at amortized cost; and swaps, which are valued based upon the terms of each swap contract.
Level 3 – Significant unobservable inputs that are supported by limited or no market activity. Level 3 may include financial instruments whose values are determined using indicative market quotes or require significant management judgment or estimation. These unobservable valuation inputs may include estimates for current yields, maturity/duration, prepayment speed, and indicative market quotes for comparable investments along with other assumptions relating to credit quality, collateral value, complexity of the investment structure, general market conditions and liquidity. This category may include investments where trading has been halted or there are certain restrictions on trading. While these investments are priced using unobservable inputs, the valuation of these investments reflects the best available data and management believes the prices are a reasonable representation of exit price.
The Board of Directors of the Company generally reviews and approves the “Procedures for Valuation of Portfolio Securities” at least once a year. These procedures define how investments are to be valued, including the formation and activities of a Valuation Committee. The Valuation Committee is responsible for determining in good faith the fair value of investments when the value cannot be obtained from primary pricing services or alternative sources or if the valuation of an investment as provided by the primary pricing service or alternative source is believed not to reflect the investment’s fair value as of the Valuation Date. Voting members of the Valuation Committee include the Fund's Treasurer or designee and a Vice President of the investment manager or designee. An Assistant Vice President of the Fund with legal expertise or designee is also included on the Valuation Committee as a non-voting advisory member. In addition, the Fund’s Chief Compliance Officer shall designate a member of the compliance group to attend Valuation Committee meetings as a non-voting resource, to monitor for and provide guidance with respect to compliance with these procedures. Two members of the Valuation Committee or their designees, representing different departments, shall constitute a quorum for purposes of permitting the Valuation Committee to take action. The Valuation Committee will consider all relevant factors in determining an investment’s fair value, and may seek the advice of the Fund’s sub-
| Hartford MidCap Value HLS Fund |
| Notes to Financial Statements – (continued) |
| June 30, 2014 (Unaudited) |
| (000’s Omitted) |
adviser, knowledgeable brokers, and legal counsel in making such determination. The Valuation Committee reports to the Audit Committee of the Company's Board of Directors. The Audit Committee receives quarterly written reports which include details of all fair-valued investments, including the reason for the fair valuation, and an indication, when possible, of the accuracy of the valuation by disclosing the next available reliable public price quotation or the disposition price of such investments (the “look-back” test). The Board of Directors then must consider for ratification all of the fair value determinations made during the previous quarter.
Valuation levels are not necessarily indicative of the risk associated with investing in such investments. Individual investments within any of the above mentioned asset classes may be assigned a different hierarchical level than those presented above, as individual circumstances dictate.
For additional information, refer to the Investment Valuation Hierarchy Level Summary and the Level 3 roll-forward reconciliation, if applicable, which follow the Schedule of Investments.
Investment Transactions and Investment Income – Investment transactions are recorded as of the trade date (the date the order to buy or sell is executed) for financial reporting purposes. Investments purchased or sold on a when-issued or delayed-delivery basis may be settled a month or more after the trade date. Realized gains and losses are determined on the basis of identified cost.
Dividend income from domestic securities is accrued on the ex-dividend date. In general, dividend income from foreign securities is recorded on the ex-date; however, dividend notifications in certain foreign jurisdictions may not be available in a timely manner and as a result, the Fund will record the dividend as soon as the relevant details (i.e., rate per share, payment date, shareholders of record, etc.) are publicly available. Interest income, including amortization of premium, accretion of discounts and additional principal received in-kind in lieu of cash, is accrued on a daily basis.
Foreign Currency Transactions – Assets and liabilities denominated in currencies other than U.S. dollars are translated into U.S. dollars at the exchange rates in effect on the valuation date. Purchases and sales of investments, income and expenses are translated into U.S. dollars at the exchange rates on the dates of such transactions.
The Fund does not isolate that portion of portfolio investment valuation resulting from fluctuations in the foreign currency exchange rates from the fluctuations arising from changes in the market prices of investments held. Exchange rate fluctuations are included with the net realized and unrealized gain or loss on investments in the accompanying financial statements.
Net realized foreign exchange gains or losses arise from sales of foreign currencies and the difference between asset and liability amounts initially stated in foreign currencies and the U.S. dollar value of the amounts actually received or paid. Net unrealized foreign exchange gains or losses arise from changes in the value of other assets and liabilities at the end of the reporting period, resulting from changes in the exchange rates.
Joint Trading Account – The Fund may invest cash balances into a joint trading account that may be invested in one or more repurchase agreements.
Fund Share Valuation and Dividend Distributions to Shareholders – Orders for the Fund’s shares are executed in accordance with the investment instructions of the contract holders and plan participants. The NAV of the Fund’s shares is determined as of the close of business on each business day of the Exchange. The NAV is determined separately for each class of shares of the Fund by dividing the Fund’s net assets attributable to that class by the number of shares of the class outstanding. Each class of shares offered by the Fund has equal rights as to assets and voting privileges (except that shareholders of a class have exclusive voting rights regarding any matter relating solely to that class of shares). Income and non-class specific expenses are allocated daily to each class on the basis of the relative net assets of the class. Realized and unrealized gains and losses are allocated daily based on the relative net assets of each class of shares of the Fund.
Orders for the purchase of the Fund’s shares received prior to the close of the Exchange on any day the Exchange is open for business are priced at the NAV determined as of the close of the Exchange. Orders received after the close of the Exchange, or on a day on which the Exchange and/or the Fund is not open for business, are priced at the next determined NAV.
| Hartford MidCap Value HLS Fund |
| Notes to Financial Statements – (continued) |
| June 30, 2014 (Unaudited) |
| (000’s Omitted) |
Dividends are declared pursuant to a policy adopted by the Company's Board of Directors based upon the investment performance of the Fund. The policy of the Fund is to pay dividends from net investment income and realized gains, if any, at least once a year.
Distributions from net investment income, net realized gains and capital are determined in accordance with federal income tax regulations, which may differ from U.S. GAAP with respect to character and timing. These differences may include, but are not limited to, losses deferred due to wash sale adjustments, foreign currency gains and losses, adjustments related to Passive Foreign Investment Companies ("PFICs"), Real Estate Investment Trusts ("REITs"), Regulated Investment Companies ("RICs"), certain derivatives and partnerships. Permanent book and federal income tax basis differences relating to shareholder distributions will result in reclassifications to certain of the Fund’s capital accounts (see Federal Income Taxes: Reclassification of Capital Accounts note).
Securities and Other Investments:
Repurchase Agreements – A repurchase agreement is an agreement by which a counterparty agrees to sell an investment and agrees to repurchase the investment sold from the buyer at a mutually agreed upon time and price. During the period of the repurchase agreement, the counterparty will deposit cash and or securities in a third party custodial account to serve as collateral. At the time the Fund enters into a repurchase agreement, the value of the underlying collateral, including accrued interest, will be equal to or exceed the value of the repurchase agreement. Repurchase agreements expose the Fund to counterparty risk - that is, the risk that the counterparty will not fulfill its obligations. To minimize counterparty risk, the investments that serve to collateralize the repurchase agreement are held by the Fund’s custodian in book entry or physical form in the custodial account of the Fund or in a third party custodial account. Repurchase agreements are valued at cost plus accrued interest, which approximates fair value. Repurchase agreements have master netting arrangements which allow the Fund to offset amounts owed to a counterparty with amounts owed by the counterparty, including any collateral. Upon an event of default under a master repurchase agreement, the non-defaulting party may close out all transactions traded under such agreement and net amounts owed under each transaction to one net amount payable by one party to the other. Absent an event of default, the master repurchase agreement does not result in an offset of reported amounts of assets and liabilities in the Statement of Assets and Liabilities across transactions between the Fund and the applicable counterparty. The Fund, as shown on the Schedule of Investments, had outstanding repurchase agreements and related collateral as of June 30, 2014.
Illiquid and Restricted Investments – The Fund is permitted to invest up to 15% of its net assets in illiquid investments. Illiquid investments are those that may not be sold or disposed of in the ordinary course of business within seven days, at approximately the price used to determine the Fund’s NAV. The Fund may not be able to sell illiquid investments when its sub-adviser considers it desirable to do so or may have to sell such investments at a price that is lower than the price that could be obtained if the investments were more liquid. A sale of illiquid investments may require more time and may result in higher dealer discounts and other selling expenses than does the sale of those that are liquid. Illiquid investments also may be more difficult to value due to the unavailability of reliable market quotations for such investments, and an investment in them may have an adverse impact on the Fund’s NAV. The Fund may also purchase certain restricted investments that can only be resold to certain qualified investors and may be determined to be liquid pursuant to policies and guidelines established by the Company's Board of Directors. The Fund, as shown on the Schedule of Investments, had illiquid or restricted investments as of June 30, 2014.
Investments Purchased on a When-Issued or Delayed-Delivery Basis – Delivery and payment for investments that have been purchased by the Fund on a forward commitment, or when-issued or delayed-delivery basis, take place beyond the customary settlement period. The Fund may dispose of or renegotiate a delayed-delivery transaction after it is entered into, and may sell delayed-delivery investments before they are delivered, which may result in a realized gain or loss. During this period, such investments are subject to market fluctuations, and the Fund identifies investments segregated in its records with a value at least equal to the amount of the commitment. The Fund had no when-issued or delayed-delivery investments as of June 30, 2014.
Financial Derivative Instruments:
The following disclosures contain information on how and why the Fund uses derivative instruments, the credit-risk-related contingent features in certain derivative instruments, and how derivative instruments affect the Fund’s financial position and results of operations. The location and fair value amounts of these instruments on the Statement of Assets and Liabilities and the realized gains and losses and changes in unrealized gains and losses on the Statement of Operations, each categorized by type of derivative contract, are included in
| Hartford MidCap Value HLS Fund |
| Notes to Financial Statements – (continued) |
| June 30, 2014 (Unaudited) |
| (000’s Omitted) |
the following Additional Derivative Instrument Information footnote. The derivative instruments outstanding as of period-end are disclosed in the notes to or within the Schedule of Investments for purchased options, if applicable. The amounts of realized gains and losses and changes in unrealized gains and losses on derivative instruments during the period are disclosed in the Statement of Operations.
Foreign Currency Contracts – The Fund may enter into foreign currency contracts that obligate the Fund to purchase or sell currencies at specified future dates. Foreign currency contracts are used to hedge the currency exposure associated with some or all of the Fund’s investments and/or as part of an investment strategy. Foreign currency contracts are marked to market daily and the change in value is recorded by the Fund as an unrealized gain or loss. The Fund will record a realized gain or loss when the foreign currency contract is settled.
Foreign currency contracts involve elements of market risk in excess of the amounts reflected in the Statement of Assets and Liabilities. In addition, risks may arise upon entering into these contracts from the potential inability of the counterparties to meet the terms of the contracts and from unanticipated movements in the value of the foreign currencies relative to the U.S. dollar. The Fund had no outstanding foreign currency contracts as of June 30, 2014.
Additional Derivative Instrument Information:
The volume of derivative activity was minimal during the six-month period ended June 30, 2014.
The Effect of Derivative Instruments on the Statement of Operations for the six-month period ended June 30, 2014:
| | | Risk Exposure Category | |
| | | Interest Rate
Contracts | | | Foreign
Exchange
Contracts | | | Credit
Contracts | | | Equity
Contracts | | | Commodity
Contracts | | | Other
Contracts | | | Total | |
| Realized Loss on Derivatives Recognized as a Result of Operations: |
| Net realized loss on foreign currency contracts | | $ | — | | | $ | (3 | ) | | $ | — | | | $ | — | | | $ | — | | | $ | — | | | $ | (3 | ) |
| Total | | $ | — | | | $ | (3 | ) | | $ | — | | | $ | — | | | $ | — | | | $ | — | | | $ | (3 | ) |
| | | | | | | | | | | | | | | | | | | | | | | | | | | | | |
| Net Change in Unrealized Appreciation (Depreciation) on Derivatives Recognized as a Result of Operations: |
| Net change in unrealized depreciation of foreign currency contracts | | $ | — | | | $ | (2 | ) | | $ | — | | | $ | — | | | $ | — | | | $ | — | | | $ | (2 | ) |
| Total | | $ | — | | | $ | (2 | ) | | $ | — | | | $ | — | | | $ | — | | | $ | — | | | $ | (2 | ) |
Principal Risks:
The Fund may be exposed to counterparty risk, or the risk that an institution or other entity with which the Fund has unsettled or open transactions will default.
If the Fund invests directly in foreign currencies or in securities that trade in, and receive revenues in, foreign currencies, or in derivatives that provide exposure to foreign currencies, it will be subject to the risk that those currencies will decline in value relative to the base currency (U.S. dollars) of the Fund, or, in the case of hedging positions, that the Fund’s base currency will decline in value relative to the currency being hedged. Currency rates in foreign countries may fluctuate significantly over short periods of time for a number of reasons, including changes in interest rates, intervention (or the failure to intervene) by U.S. or foreign governments, central banks or supranational entities, such as the International Monetary Fund, or by the imposition of currency controls or other political developments in the United States or abroad. As a result, the Fund’s investments in foreign currency denominated securities may reduce the returns of the Fund. The market values of equity securities, such as common stocks and preferred stocks, or equity related investments, such as futures and options, may decline due to general market conditions which are not specifically related to a particular company, such as real or perceived adverse economic conditions, changes in the general outlook for corporate earnings, changes in interest or currency rates or adverse investor sentiment generally. The market value of equity securities may also decline due to factors which affect a particular industry or industries, such as labor shortages or increased production costs and competitive conditions within an industry. Equity securities and equity related investments generally have greater market price volatility than fixed income securities.
| Hartford MidCap Value HLS Fund |
| Notes to Financial Statements – (continued) |
| June 30, 2014 (Unaudited) |
| (000’s Omitted) |
Federal Income Taxes:
Federal Income Taxes – For federal income tax purposes, the Fund intends to continue to qualify as a RIC under Subchapter M of the Internal Revenue Code (“IRC”) by distributing substantially all of its taxable net investment income and net realized capital gains to its shareholders and otherwise complying with the requirements of the IRC. The Fund has distributed substantially all of its income and capital gains in prior years, if applicable, and intends to distribute substantially all of its income and capital gains prior to the next fiscal year-end. Accordingly, no provision for federal income or excise taxes has been made in the accompanying financial statements. Distributions from short-term capital gains are treated as ordinary income distributions for federal income tax purposes.
Net Investment Income (Loss), Net Realized Gains (Losses) and Distributions – Net investment income (loss) and net realized gains (losses) may differ for financial statement and tax purposes primarily because of losses deferred due to wash sale adjustments, foreign currency gains and losses, adjustments related to PFICs, REITs, RICs, certain derivatives and partnerships. The character of distributions made during the year from net investment income or net realized gains may differ from their ultimate characterization for federal income tax purposes. Also, due to the timing of dividend distributions, the fiscal year in which amounts are distributed may differ from the year that the income or realized gains (losses) were recorded by the Fund.
Distributions and Components of Distributable Earnings – The tax character of distributions paid by the Fund for the periods indicated is as follows (as adjusted for dividends payable, if applicable):
| | | For the Year Ended
December 31, 2013 | | | For the Year Ended
December 31, 2012 | |
| Ordinary Income | | $ | 5,562 | | | $ | 4,896 | |
As of December 31, 2013, the Fund’s components of distributable earnings (deficit) on a tax basis are as follows:
| | | Amount | |
| Undistributed Ordinary Income | | $ | 3,177 | |
| Undistributed Long-Term Capital Gain | | | 60,097 | |
| Accumulated Capital and Other Losses* | | | (837 | ) |
| Unrealized Appreciation† | | | 123,509 | |
| Total Accumulated Earnings | | $ | 185,946 | |
| * | The Fund has capital loss carryforwards that are identified in the Capital Loss Carryforward note that follows. |
| † | Differences between book-basis and tax-basis unrealized appreciation (depreciation) may be attributable to the losses deferred due to wash sale adjustments, foreign currency gains and losses, adjustments related to PFICs, REITs, RICs, certain derivatives and partnerships. |
Reclassification of Capital Accounts – The Fund may record reclassifications in its capital accounts. These reclassifications have no impact on the total net assets of the Fund. The reclassifications are a result of permanent differences between U.S. GAAP and tax accounting for such items as foreign currency, PFICs, expiration or utilization of capital loss carryforwards or net operating losses. Adjustments are made to reflect the impact these items have on current and future distributions to shareholders. Therefore, the source of the Fund’s distributions may be shown in the accompanying Statement of Changes in Net Assets as from undistributed net investment income, from accumulated net realized gains on investments or from capital depending on the type of book and tax differences that exist. For the year ended December 31, 2013, the Fund recorded reclassifications to increase (decrease) the accounts listed below:
| | | Amount | |
| Undistributed Net Investment Income (Loss) | | $ | 620 | |
| Accumulated Net Realized Gain (Loss) | | | (620 | ) |
| Hartford MidCap Value HLS Fund |
| Notes to Financial Statements – (continued) |
| June 30, 2014 (Unaudited) |
| (000’s Omitted) |
Capital Loss Carryforward – On December 22, 2010, the Regulated Investment Company Modernization Act of 2010 (the “Act”) was enacted, which made changes to the capital loss carryforward rules. The changes are effective for taxable years beginning after the date of enactment. Under the Act, funds are permitted to carry forward capital losses for an unlimited period. However, any losses incurred during those future taxable years will be required to be utilized prior to the losses incurred in pre-enactment taxable years, which carry an expiration date. As a result of this ordering rule, pre-enactment capital loss carryforwards may be more likely to expire unused. Additionally, post-enactment capital loss carryforwards retain their character as either short-term or long-term capital losses rather than being considered all short-term as permitted under prior regulation.
At December 31, 2013 (tax year end), the Fund had capital loss carryforwards for U.S. federal income tax purposes as follows:
| Year of Expiration | | Amount | |
| 2016 | | $ | 837 | |
| Total | | $ | 837 | |
As a result of mergers in the Fund, certain provisions in the IRC may limit the future utilization of capital losses. During the year ended December 31, 2013, the Fund utilized $22,439 of prior year capital loss carryforwards.
Accounting for Uncertainty in Income Taxes – The Fund has adopted financial reporting rules that require the Fund to analyze all open tax years, as defined by the statute of limitations, for all major jurisdictions. Generally, tax authorities can examine all tax returns filed for the last three years. The Fund does not have an examination in progress.
The Fund has reviewed all open tax years and major jurisdictions and concluded that these financial reporting rules had no effect on the Fund’s financial position or results of operations. There is no tax liability resulting from unrecognized tax benefits relating to uncertain income tax positions taken or expected to be taken on the tax return for the fiscal year ended December 31, 2013. The Fund is also not aware of any tax positions for which it is reasonably possible that the total amounts of unrecognized tax benefits will significantly change in the next twelve months.
Expenses:
Investment Management Agreement – Hartford Funds Management Company, LLC ("HFMC") serves as the Fund’s investment manager pursuant to an Investment Management Agreement with the Company. HFMC is an indirect wholly owned subsidiary of The Hartford Financial Services Group, Inc. ("The Hartford"). The investment manager has overall investment supervisory responsibility for the Fund. In addition, the investment manager provides administrative personnel, services, equipment, facilities and office space for proper operation of the Fund. HFMC has contracted with Wellington Management Company, LLP ("Wellington Management") under a sub-advisory agreement for the provision of day-to-day investment management services to the Fund in accordance with the Fund’s investment objective and policies. The Fund pays a fee to the investment manager, a portion of which may be used to compensate Wellington Management.
The schedule below reflects the rates of compensation paid to the investment manager for investment management services rendered as of June 30, 2014; the rates are accrued daily and paid monthly:
| Average Daily Net Assets | Annual Fee |
| On first $500 million | 0.8000% |
| On next $500 million | 0.7250% |
| On next $1.5 billion | 0.6750% |
| On next $2.5 billion | 0.6700% |
| On next $5 billion | 0.6650% |
| Over $10 billion | 0.6600% |
| Hartford MidCap Value HLS Fund |
| Notes to Financial Statements – (continued) |
| June 30, 2014 (Unaudited) |
| (000’s Omitted) |
Accounting Services Agreement – Pursuant to the Fund Accounting Agreement between HFMC and the Company, on behalf of the Fund, HFMC provides accounting services to the Fund and receives monthly compensation based on the Fund’s average daily net assets at the rates set forth below. The Fund’s accounting services fees are accrued daily and paid monthly.
| Average Daily Net Assets | Annual Fee |
| All Assets | 0.010% |
Operating Expenses – Allocable expenses incurred by the Company are allocated to each Fund and allocated to classes within a Fund in proportion to the average daily net assets of the Fund and each class, except where allocation of certain expenses is more fairly made directly to the Fund or to specific classes within a Fund.
Fees Paid Indirectly – The Company, on behalf of the Fund, has entered into agreements with State Street Global Markets, LLC and Russell Implementation Services, Inc. to partially recapture non-discounted trade commissions. Such rebates are used to pay a portion of the Fund's expenses. For the six-month period ended June 30, 2014, this amount, if any, is included in the Statement of Operations.
The ratio of expenses to average net assets in the accompanying financial highlights excludes the reduction in expenses related to fees paid indirectly. The annualized expense ratio after waivers for the period listed below reflecting the reduction for fees paid indirectly is as follows:
| | | Annualized Six-
Month Period Ended
June 30, 2014 | |
| Class IA | | | 0.84% | |
| Class IB | | | 1.09 | |
Distribution Plan for Class IB Shares – Hartford Funds Distributors, LLC (“HFD”), an indirect wholly owned subsidiary of The Hartford, is the principal underwriter and distributor of the Fund. The Company, on behalf of the Fund, has adopted a Distribution Plan pursuant to Rule 12b-1 of the 1940 Act for Class IB shares.
The Distribution Plan provides that the Fund may pay annually up to 0.25% of the average daily net assets of the Fund attributable to its Class IB shares for activities primarily intended to result in the sale of Class IB shares. The Board has the authority to suspend or reduce these payments at any point in time. Under the terms of the Distribution Plan and the principal underwriting agreement, the Fund is authorized to make payments monthly to the distributor that may be used to pay or reimburse entities providing distribution and shareholder servicing with respect to the Class IB shares for such entities’ fees or expenses incurred or paid in that regard. The distribution fee paid during the period can be found on the Statement of Operations. These fees are accrued daily and paid monthly.
Other Related Party Transactions – Hartford Administrative Services Company (“HASCO”), an indirect wholly owned subsidiary of The Hartford, provides transfer agent services to the Fund. HASCO was compensated on a per account basis for providing such services. The amount paid to HASCO can be found in the Statement of Operations. These fees are accrued daily and paid monthly.
Payment from Affiliate – In July of 2007, The Hartford entered into a settlement with the Attorneys General of the states of New York, Connecticut and Illinois relating to market timing and the company's individual variable annuity contracts in which certain payments would be made directly to the variable annuity contract holders. The distribution plan provided that unclaimed money from the settlement would be distributed to certain HLS Funds that are investment options through a Hartford individual variable annuity contract. The unclaimed money was distributed to the Fund on September 18, 2009.
| Hartford MidCap Value HLS Fund |
| Notes to Financial Statements – (continued) |
| June 30, 2014 (Unaudited) |
| (000’s Omitted) |
The total return in the accompanying financial highlights includes a payment from an affiliate. Had the payment from the affiliate been excluded, the impact and total return for the period listed below would have been as follows:
| | | For the Year Ended December 31, 2009 | |
| | | Class IA | | | Class IB | |
| Impact from Payment from Affiliate for Attorneys General Settlement | | | 0.01% | | | | 0.01% | |
| Total Return Excluding Payment from Affiliate | | | 44.18% | | | | 43.82% | |
Investment Transactions:
For the six-month period ended June 30, 2014, the cost of purchases and proceeds from sales of investment securities (excluding short-term investments) were as follows:
| | | Excluding U.S.
Government
Obligations | | | U.S.
Government
Obligations | | | Total | |
| Cost of Purchases | | $ | 71,860 | | | $ | — | | | $ | 71,860 | |
| Sales Proceeds | | | 110,955 | | | | — | | | | 110,955 | |
Line of Credit:
The Fund is one of several Hartford Funds that participate in a $500 million committed revolving line of credit facility. The facility is to be used for temporary or emergency purposes. Under the arrangement, the funds are required to own securities having a market value in excess of 300% of the total bank borrowings. The interest rate on borrowings varies depending on the nature of the loan. The facility also requires a fee to be paid based on the amount of the commitment. This commitment fee is allocated to all the funds participating in the line of credit based on the average net assets of the funds. During the six-month period ended June 30, 2014, the Fund did not have any borrowings under this facility.
Industry Classifications:
Other than the industry classifications "Other Investment Pools and Funds" and "Exchange Traded Funds," equity industry classifications used in this report are the Global Industry Classification Standard, which was developed by and is the exclusive property and service mark of MSCI, Inc. and Standard & Poor's.
Indemnifications:
Under the Company's organizational documents, the Company shall indemnify its officers and directors to the full extent required or permitted under Maryland General Corporation Law and the federal securities laws. In addition, the Company, on behalf of the Fund, may enter into contracts that contain a variety of indemnifications. The Company's maximum exposure under these arrangements is unknown. However, as of the date of these financial statements, the Company has not had prior claims or losses pursuant to these contracts and expects the risk of loss to be remote.
Pending Legal Proceedings:
On February 25, 2011, Jennifer L. Kasilag, Louis Mellinger, Judith M. Menendez, Jacqueline M. Robinson, and Linda A. Russell filed a derivative lawsuit against Hartford Investment Financial Services, LLC (“HIFSCO”) (now known as Hartford Funds Distributors, LLC) on behalf of six Hartford retail mutual funds in the United States District Court for the District of New Jersey, alleging that HIFSCO received excessive advisory and distribution fees in violation of its statutory fiduciary duty under Section 36(b) of the 1940 Act when serving as investment manager and principal underwriter, respectively, to the Hartford retail mutual funds. Although this action was purportedly filed on behalf of certain of the Hartford Funds, none of the Hartford Funds is itself a defendant to the suit. HIFSCO moved to dismiss and, in September 2011, the motion was granted in part and denied in part, with leave to amend the complaint. In November 2011, plaintiffs filed an amended complaint on behalf of certain Hartford retail mutual funds, The Hartford Global Health Fund (now known as The Hartford
| Hartford MidCap Value HLS Fund |
| Notes to Financial Statements – (continued) |
| June 30, 2014 (Unaudited) |
| (000’s Omitted) |
Healthcare Fund), The Hartford Conservative Allocation Fund, The Hartford Growth Opportunities Fund, The Hartford Inflation Plus Fund, The Hartford Advisers Fund (now known as The Hartford Balanced Fund), and The Hartford Capital Appreciation Fund. Plaintiffs seek to rescind the investment management agreements and distribution plans between HIFSCO and these funds and to recover the total fees charged thereunder or, in the alternative, to recover any improper compensation HIFSCO received, in addition to lost earnings. HIFSCO filed a partial motion to dismiss the amended complaint and, in December 2012, the court dismissed without prejudice the claims regarding distribution fees and denied the motion with respect to the advisory fees claims. HIFSCO disputes the allegations and intends to defend vigorously.
In March 2014, the plaintiffs filed a new complaint that added as new plaintiffs The Hartford Floating Rate Fund and The Hartford Small Company Fund and named as a defendant Hartford Funds Management Company, LLC (the “Investment Manager”), which assumed the role as investment adviser to the funds as of January 2013. The Investment Manager and HIFSCO dispute the allegations and intend to defend vigorously.
This action concerns the activities of HIFSCO in its capacity as investment manager and principal underwriter to the Hartford retail mutual funds and does not concern HIFSCO’s activities in its capacity as principal underwriter to the HLS funds. For this reason, no accrual for litigation relating to this matter has been recorded in the financial statements of the Fund.
| Hartford MidCap Value HLS Fund |
| Financial Highlights |
| | | ─ Selected Per-Share Data(A) ─ | | | ─ Ratios and Supplemental Data ─ | |
| Class | | Net Asset
Value at
Beginning
of Period | | | Net
Investment
Income
(Loss) | | | Net
Realized
and
Unrealized
Gain (Loss)
on
Investments | | | Total from
Investment
Operations | | | Dividends
from Net
Investment
Income | | | Distributions
from
Realized
Capital
Gains | | | Total
Dividends
and
Distributions | | | Net
Asset
Value at
End of
Period | | | Total
Return(B) | | | Net
Assets
at End of
Period
(000s) | | | Ratio of
Expenses
to
Average
Net
Assets
Before
Adjust-
ments(C) | | | Ratio of
Expenses
to
Average
Net
Assets
After
Adjust-
ments(C) | | | Ratio of
Net
Investment
Income
(Loss) to
Average
Net Assets | |
| | | | | | | | | | | | | | | | | | | | | | | | | | | | | | | | | | | | | | | | |
| For the Six-Month Period Ended June 30, 2014 (Unaudited) |
| IA | | $ | 15.51 | | | $ | 0.05 | | | $ | 1.32 | | | $ | 1.37 | | | $ | – | | | $ | – | | | $ | – | | | $ | 16.88 | | | | 8.83 | %(D) | | $ | 381,145 | | | | 0.84 | %(E) | | | 0.84 | %(E) | | | 0.68 | %(E) |
| IB | | | 15.42 | | | | 0.03 | | | | 1.31 | | | | 1.34 | | | | – | | | | – | | | | – | | | | 16.76 | | | | 8.69 | (D) | | | 123,794 | | | | 1.09 | (E) | | | 1.09 | (E) | | | 0.43 | (E) |
| | | | | | | | | | | | | | | | | | | | | | | | | | | | | | | | | | | | | | | | | | | | | | | | | | | | | |
| For the Year Ended December 31, 2013 |
| IA | | $ | 11.65 | | | $ | 0.08 | | | $ | 3.95 | | | $ | 4.03 | | | $ | (0.17 | ) | | $ | – | | | $ | (0.17 | ) | | $ | 15.51 | | | | 34.71 | % | | $ | 377,272 | | | | 0.84 | % | | | 0.84 | % | | | 0.56 | % |
| IB | | | 11.59 | | | | 0.04 | | | | 3.93 | | | | 3.97 | | | | (0.14 | ) | | | – | | | | (0.14 | ) | | | 15.42 | | | | 34.37 | | | | 123,884 | | | | 1.09 | | | | 1.09 | | | | 0.31 | |
| | | | | | | | | | | | | | | | | | | | | | | | | | | | | | | | | | | | | | | | | | | | | | | | | | | | | |
| For the Year Ended December 31, 2012 (F) |
| IA | | $ | 9.44 | | | $ | 0.14 | | | $ | 2.20 | | | $ | 2.34 | | | $ | (0.13 | ) | | $ | – | | | $ | (0.13 | ) | | $ | 11.65 | | | | 24.95 | % | | $ | 323,934 | | | | 0.85 | % | | | 0.85 | % | | | 1.03 | % |
| IB | | | 9.38 | | | | 0.10 | | | | 2.21 | | | | 2.31 | | | | (0.10 | ) | | | – | | | | (0.10 | ) | | | 11.59 | | | | 24.64 | | | | 112,996 | | | | 1.10 | | | | 1.10 | | | | 0.79 | |
| | | | | | | | | | | | | | | | | | | | | | | | | | | | | | | | | | | | | | | | | | | | | | | | | | | | | |
| For the Year Ended December 31, 2011 (F) |
| IA | | $ | 10.32 | | | $ | 0.07 | | | $ | (0.95 | ) | | $ | (0.88 | ) | | $ | – | | | $ | – | | | $ | – | | | $ | 9.44 | | | | (8.56 | )% | | $ | 341,583 | | | | 0.83 | % | | | 0.83 | % | | | 0.57 | % |
| IB | | | 10.29 | | | | 0.04 | | | | (0.95 | ) | | | (0.91 | ) | | | – | | | | – | | | | – | | | | 9.38 | | | | (8.79 | ) | | | 116,563 | | | | 1.08 | | | | 1.08 | | | | 0.32 | |
| | | | | | | | | | | | | | | | | | | | | | | | | | | | | | | | | | | | | | | | | | | | | | | | | | | | | |
| For the Year Ended December 31, 2010 |
| IA | | $ | 8.33 | | | $ | 0.05 | | | $ | 2.00 | | | $ | 2.05 | | | $ | (0.06 | ) | | $ | – | | | $ | (0.06 | ) | | $ | 10.32 | | | | 24.67 | % | | $ | 462,281 | | | | 0.85 | % | | | 0.85 | % | | | 0.57 | % |
| IB | | | 8.30 | | | | 0.03 | | | | 1.99 | | | | 2.02 | | | | (0.03 | ) | | | – | | | | (0.03 | ) | | | 10.29 | | | | 24.36 | | | | 163,498 | | | | 1.10 | | | | 1.10 | | | | 0.30 | |
| | | | | | | | | | | | | | | | | | | | | | | | | | | | | | | | | | | | | | | | | | | | | | | | | | | | | |
| For the Year Ended December 31, 2009 (F) |
| IA | | $ | 5.82 | | | $ | 0.07 | | | $ | 2.50 | | | $ | 2.57 | | | $ | (0.06 | ) | | $ | – | | | $ | (0.06 | ) | | $ | 8.33 | | | | 44.19 | %(G) | | $ | 348,742 | | | | 0.86 | % | | | 0.86 | % | | | 0.87 | % |
| IB | | | 5.80 | | | | 0.05 | | | | 2.49 | | | | 2.54 | | | | (0.04 | ) | | | – | | | | (0.04 | ) | | | 8.30 | | | | 43.83 | (G) | | | 145,920 | | | | 1.11 | | | | 1.11 | | | | 0.62 | |
| (A) | Information presented relates to a share outstanding throughout the indicated period. Net investment income (loss) per share amounts are calculated based on average shares outstanding unless otherwise noted. |
| (B) | The figures do not include sales charges or other fees which may be applied at the variable life insurance, variable annuity or qualified retirement plan product level. Any such additional sales charges or other fees would lower the Fund's performance. |
| (C) | Adjustments include waivers and reimbursements, if applicable. Ratios do not include fees paid indirectly (see Expenses in the accompanying Notes to Financial Statements). |
| (F) | Net investment income (loss) per share amounts have been calculated using the SEC method. |
| (G) | Total return without the inclusion of the Payment from (to) Affiliate can be found in Expenses in the accompanying Notes to Financial Statements. |
| | | Portfolio Turnover
Rate for
All Share Classes | |
| For the Six-Month Period Ended June 30, 2014 (Unaudited) | | | 15% | |
| For the Year Ended December 31, 2013 | | | 49 | |
| For the Year Ended December 31, 2012 | | | 45 | |
| For the Year Ended December 31, 2011 | | | 43 | |
| For the Year Ended December 31, 2010 | | | 57(A) | |
| For the Year Ended December 31, 2009 | | | 50 | |
| (A) | During the year ended December 31, 2010, the Fund incurred $89.7 million in purchases associated with the transition of assets from Hartford SmallCap Value HLS Fund, which merged into the Fund on July 30, 2010. These purchases were excluded from the portfolio turnover calculation. |
| Hartford MidCap Value HLS Fund |
| Directors and Officers (Unaudited) |
The Board of Directors of the Company (the "Directors") appoints officers who are responsible for the day-to-day operations of the Fund and who execute policies formulated by the Directors. Each Director serves until his or her death, resignation, or retirement or until the next annual meeting of shareholders is held or until his or her successor is elected and qualifies.
Directors and officers who are employed by or who have a financial interest in The Hartford are considered “interested” persons of the Fund pursuant to the 1940 Act. Each officer and two of the Company's Directors, as noted in the chart below, are “interested” persons of the Fund. Each Director serves as a director for The Hartford Mutual Funds, Inc., The Hartford Mutual Funds II, Inc., Hartford Series Fund, Inc., and Hartford HLS Series Fund II, Inc., and as a trustee for The Hartford Alternative Strategies Fund, which, as of June 30, 2014, collectively consist of 78 funds. Correspondence may be sent to Directors and officers c/o Hartford Funds, 5 Radnor Corporate Center, Suite 300, 100 Matsonford Road, Radnor, Pennsylvania 19087, except that correspondence to Mr. Annoni, Mr. Dressen and Ms. Quade may be sent to 500 Bielenberg Drive, Suite 500, Woodbury, Minnesota 55125.
The table below sets forth, for each Director and officer, his or her name, year of birth, current position with the Company and date first elected or appointed to Hartford Series Fund, Inc. ("HSF") and Hartford HLS Series Fund II, Inc. ("HSF2"), principal occupation, and, for Directors, other directorships held. The Fund’s Statement of Additional Information contains further information on the Directors and is available free of charge by calling 1-888-843-7824 or writing to: Hartford HLS Funds, c/o Hartford Life Insurance Company/Hartford Life and Annuity Insurance Company, P.O. Box 14293, Lexington, KY 40512-4293 for variable annuity and variable life insurance separate accounts of Hartford Life Insurance Company and its affiliates; Hartford Funds, P.O. Box 55022, Boston, MA 02205-5022 for all shareholders except variable annuity and variable life insurance separate accounts of Hartford Life Insurance Company and its affiliates.
Information on the aggregate remuneration paid to the directors of the Company can be found in the Statement of Operations herein. The Fund pays to The Hartford a portion of the Chief Compliance Officer’s compensation, but does not pay salaries or compensation to any of its other officers or Directors who are employed by The Hartford.
Non-Interested Directors
Lynn S. Birdsong (1946) Director since 2003, Co-Chairman of the Investment Committee since 2005
Mr. Birdsong is a private investor. Mr. Birdsong currently serves as a Director of the Sovereign High Yield Investment Company (April 2010 to current). Mr. Birdsong currently serves as an Independent Director of Nomura Partners Funds, Inc. (formerly, The Japan Fund) (April 2003 to current). From 2003 to March 2005, Mr. Birdsong was an Independent Director of the Atlantic Whitehall Funds. From 1979 to 2002, Mr. Birdsong was a Managing Director of Zurich Scudder Investments, an investment management firm. During his employment with Scudder, Mr. Birdsong was an Interested Director of The Japan Fund. From January 1981 through December 2013, Mr. Birdsong was a partner in Birdsong Company, an advertising specialty firm.
Robert M. Gavin, Jr. (1940) Director since 2002 (HSF) and 1986 (HSF2), Chairman of the Board since 2004
Dr. Gavin is an educational consultant. Prior to September 1, 2001, he was President of Cranbrook Education Community and prior to July 1996, he was President of Macalester College, St. Paul, Minnesota.
Duane E. Hill (1945) Director since 2001 (HSF) and 2002 (HSF2), Chairman of the Nominating Committee since 2003
Mr. Hill is a Partner of TSG Ventures L.P., a private equity investment company. Mr. Hill is a former partner of TSG Capital Group, a private equity investment firm that served as sponsor and lead investor in leveraged buyouts of middle market companies.
Sandra S. Jaffee (1941) Director since 2005
Ms. Jaffee is the founder and Chief Executive Officer of a private company, Homeworks Concierge, LLC, which provides residential property management services in Westchester County, New York (January 2012 to present). Ms. Jaffee served as Chairman (2008 to 2009) and Chief Executive Officer of Fortent (formerly Searchspace Group), a leading provider of compliance/regulatory technology to financial institutions from August 2005 to August 2009. From August 2004 to August 2005, Ms. Jaffee served as an Entrepreneur in Residence with Warburg Pincus, a private equity firm. Prior to joining Warburg Pincus, Ms. Jaffee served as Executive Vice President at Citigroup, from September 1995 to July 2004, where she was President and Chief Executive Officer of Citibank’s Global Securities Services (1995 to 2003). Ms. Jaffee currently serves as a member of the Board of Directors of Broadridge Financial Solutions as well as a Trustee of Muhlenberg College.
| Hartford MidCap Value HLS Fund |
| Directors and Officers (Unaudited) – (continued) |
William P. Johnston (1944) Director since 2005, Chairman of the Compliance Committee since 2005
In June 2006, Mr. Johnston was appointed as Senior Advisor to The Carlyle Group, a global private equity and other alternative asset investment firm and currently serves as an Operating Executive. In July 2006, Mr. Johnston was elected to the Board of Directors of MultiPlan, Inc. and served as a Director (July 2006 to August 2010). In August 2007, Mr. Johnston was elected to the Board of Directors of LifeCare Holdings, Inc. and served as a Director (August 2007 to June 2013). In February 2008, Mr. Johnston was elected to the Board of Directors of HCR-ManorCare, Inc. In May 2006, Mr. Johnston was elected to the Supervisory Board of Fresenius Medical Care AG & Co. KGaA, after its acquisition of Renal Care Group, Inc. in March 2006. Mr. Johnston joined Renal Care Group in November 2002 as a member of the Board of Directors and served as Chairman of the Board from March 2003 through March 2006. From 2002 through 2013, Mr. Johnston served as a Board member of the Georgia O’Keefe Museum. From September 1987 to December 2002, Mr. Johnston was with Equitable Securities Corporation (and its successors, SunTrust Equitable Securities and SunTrust Robinson Humphrey) serving in various investment banking and managerial positions, including Managing Director and Head of Investment Banking, Chief Executive Officer and Vice Chairman.
Phillip O. Peterson (1944) Director since 2002 (HSF) and 2000 (HSF2), Chairman of the Audit Committee since 2002
Mr. Peterson is a mutual fund industry consultant. He was a partner of KPMG LLP (an accounting firm) until July 1999. Mr. Peterson joined William Blair Funds in February 2007 as a member of the Board of Trustees. From February 2012 to February 2014, Mr. Peterson served as a Trustee of Symetra Variable Mutual Funds. From January 2004 to April 2005, Mr. Peterson served as Independent President of the Strong Mutual Funds.
Lemma W. Senbet (1946) Director since 2005
Dr. Senbet is the William E. Mayer Chair Professor of Finance and Founding Director, Center for Financial Policy, at the University of Maryland, Robert H. Smith School of Business. He was chair of the Finance Department of the University of Maryland, Robert H. Smith School of Business from 1998 to 2006. Since June 2013, he has been on leave from the University to serve as Executive Director of African Economic Research Consortium which focuses on economic policy research and training. Previously, he was a chaired professor of finance at the University of Wisconsin-Madison. Also, he was a Director of the Fortis Funds from March 2000 to July 2002. Dr. Senbet served as Director of the American Finance Association and President of the Western Finance Association. In 2006, Dr. Senbet was inducted Fellow of Financial Management Association International for his career-long distinguished scholarship and professional service.
Interested Directors and Officers
James E. Davey (1964) Director since 2012, President and Chief Executive Officer since 2010
Mr. Davey serves as Executive Vice President of Hartford Life Insurance Company (“HLIC”) and The Hartford Financial Services Group, Inc. Additionally, Mr. Davey serves as Chairman of the Board, Manager and Senior Managing Director of Hartford Funds Distributors, LLC (“HFD”). He also currently serves as Director, Chairman of the Board, President and Senior Managing Director of Hartford Administrative Services Company (“HASCO”). Mr. Davey also serves as Manager, Chairman of the Board and Senior Managing Director for Hartford Funds Management Company, LLC (“HFMC”) and Director, Chairman of the Board and Senior Managing Director for Hartford Funds Management Group, Inc. ("HFMG"). Mr. Davey has served in various positions within The Hartford and its subsidiaries in connection with the operation of the Hartford Funds. Mr. Davey joined The Hartford in 2002.
Lowndes A. Smith (1939) Director since 1996 (HSF) and 2002 (HSF2), Co-Chairman of the Investment Committee since 2005
Mr. Smith served as Vice Chairman of The Hartford from February 1997 to January 2002, as President and Chief Executive Officer of Hartford Life, Inc. from February 1997 to January 2002, and as President and Chief Operating Officer of The Hartford Life Insurance Companies from January 1989 to January 2002. Mr. Smith serves as a Director of White Mountains Insurance Group Ltd. (October 2003 to current); One Beacon Insurance (October 2006 to current); Symetra Financial (August 2007 to current) and is a Managing Director of Whittington Gray Associates (January 2007 to current).
Other Officers
Mark A. Annoni (1964) Vice President, Controller and Treasurer since 2012
Mr. Annoni currently serves as the Assistant Vice President of HLIC (February 2004 to present) and Senior Vice President of HFMG (December 2013 to present). Mr. Annoni has served in various positions within The Hartford and its subsidiaries in connection with the operation of the Hartford Funds. Mr. Annoni joined The Hartford in 2001.
| Hartford MidCap Value HLS Fund |
| Directors and Officers (Unaudited) – (continued) |
Michael R. Dressen (1963) AML Compliance Officer since 2011
Mr. Dressen currently serves as Assistant Vice President of HLIC. He also serves as Chief Compliance Officer and AML Compliance Officer of HASCO and as AML Officer of HFD. Mr. Dressen has served in various positions within The Hartford and its subsidiaries in connection with the operation of the Hartford Funds.
Edward P. Macdonald (1967) Vice President, Secretary and Chief Legal Officer since 2005
Mr. Macdonald currently serves as Assistant Secretary, Executive Vice President and Deputy General Counsel of HFD, HASCO, HFMC and HFMG. He also serves as Vice President of HLIC. Mr. Macdonald has served in various positions within The Hartford and its subsidiaries in connection with the operation of the Hartford Funds. Mr. Macdonald joined The Hartford in 2005.
Joseph G. Melcher (1973) Vice President and Chief Compliance Officer since 2013
Mr. Melcher currently serves as Executive Vice President of HFD, HFMG and HASCO. Mr. Melcher also currently serves as Executive Vice President and Chief Compliance Officer of HFMC. Mr. Melcher has served in various positions within The Hartford and its subsidiaries in connection with the operation of the Hartford Funds since joining The Hartford in 2012. Prior to joining The Hartford, Mr. Melcher worked at Touchstone Investments, a member of the Western & Southern Financial Group, where he held the position of Vice President and Chief Compliance Officer from 2010 through 2012 and Assistant Vice President, Compliance from 2005 to 2010.
Vernon J. Meyer (1964) Vice President since 2006
Mr. Meyer currently serves as Senior Vice President of HLIC. He also currently serves as Managing Director and Chief Investment Officer of HFMC and Managing Director of HFMG. Mr. Meyer has served in various positions within The Hartford and its subsidiaries in connection with the operation of the Hartford Funds. Mr. Meyer joined The Hartford in 2004.
Laura S. Quade (1969) Vice President since 2012
Ms. Quade currently serves as Vice President of HASCO, HFD and HFMG. She is the Head of Operations of HASCO and also serves as Director, Enterprise Operations of HLIC. Ms. Quade has served in various positions within The Hartford and its subsidiaries in connection with the operation of the Hartford Funds.
Martin A. Swanson (1962) Vice President since 2010
Mr. Swanson currently serves as Vice President of HLIC. Mr. Swanson also serves as Managing Director, Chief Marketing Officer and Principal of HFD and Managing Director of HFMG. Mr. Swanson has served in various positions within The Hartford and its subsidiaries in connection with the operation of the Hartford Funds.
HOW TO OBTAIN A COPY OF THE FUND’S PROXY VOTING POLICIES AND VOTING RECORDS (UNAUDITED)
A description of the policies and procedures that the Fund uses to determine how to vote proxies relating to portfolio securities and information about how the Fund voted proxies relating to portfolio securities during the most recent twelve-month period ended June 30 are available (1) without charge, upon request, by calling 888-843-7824 and (2) on the SEC’s website at http://www.sec.gov.
QUARTERLY PORTFOLIO HOLDINGS INFORMATION (UNAUDITED)
The Fund files a complete schedule of portfolio holdings with the SEC for the first and third quarters of each fiscal year on Form N-Q. The Fund’s Forms N-Q are available (1) without charge, upon request, by calling 888-843-7824 and (2) on the SEC’s website at http://www.sec.gov. The Form N-Q may be reviewed and copied at the SEC’s Public Reference Room in Washington, DC. Information on the operation of the Public Reference Room may be obtained by calling 1-800-SEC-0330.
| Hartford MidCap Value HLS Fund |
| Expense Example (Unaudited) |
Your Fund's Expenses
As a shareholder of the Fund, you incur two types of costs: (1) transaction costs and (2) ongoing costs, including investment management fees, distribution and/or service (12b-1) fees, if any, and other fund expenses. This example is intended to help you understand your ongoing costs (in dollars) of investing in the Fund and to compare these costs with the ongoing costs of investing in other mutual funds. The example is based on an investment of $1,000 invested at the beginning of the period and held for the entire period of December 31, 2013 through June 30, 2014.
Actual Expenses
The first set of columns of the table below provides information about actual account values and actual expenses. You may use the information in this column, together with the amount you invested, to estimate the expenses that you paid over the period. Simply divide your account value by $1,000 (for example, an $8,600 account value divided by $1,000 = 8.6), then multiply the result by the number in the line under the heading entitled “Expenses Paid During Period” to estimate the expenses you paid on your account during this period.
Hypothetical Example for Comparison Purposes
The second set of columns of the table below provides information about hypothetical account values and hypothetical expenses based on the Fund's actual expense ratio and an assumed rate of return of 5% per year before expenses, which is not the Fund's actual return. The hypothetical account values and expenses may not be used to estimate the actual ending account balance or expenses you paid for the period. You may use this information to compare the ongoing costs of investing in the Fund and other funds. To do so, compare this 5% hypothetical example with the 5% hypothetical examples that appear in the shareholder reports of the other funds.
Please note that the expenses shown in the table are meant to highlight your ongoing costs only and do not reflect any transactional costs, such as sales charges (loads) and CDSC. Therefore, the second set of columns of the table is useful in comparing ongoing costs only, and will not help you determine the relative total costs of owning different funds. In addition, if these transactional costs were included, your costs would be higher. Expenses are equal to the Fund's annualized expense ratios multiplied by average account value over the period, multiplied by 181/365 (to reflect the one-half year period).
| | | Actual return | | | Hypothetical (5% return before expenses) | | | | | | | | |
| | | Beginning
Account Value
December 31,
2013 | | | Ending Account
Value
June 30, 2014 | | | Expenses paid
during the period
December 31, 2013
through
June 30, 2014 | | | Beginning
Account Value
December 31,
2013 | | | Ending Account
Value
June 30, 2014 | | | Expenses paid
during the period
December 31,
2013
through
June 30, 2014 | | | Annualized
expense
ratio | | | Days
in the
current
1/2
year | | Days
in the
full
year |
| Class IA | | $ | 1,000.00 | | | $ | 1,088.30 | | | $ | 4.35 | | | $ | 1,000.00 | | | $ | 1,020.63 | | | $ | 4.21 | | | | 0.84 | % | | 181 | | 365 |
| Class IB | | $ | 1,000.00 | | | $ | 1,086.90 | | | $ | 5.64 | | | $ | 1,000.00 | | | $ | 1,019.39 | | | $ | 5.46 | | | | 1.09 | | | 181 | | 365 |
| Hartford MidCap Value HLS Fund |
| Main Risks (Unaudited) |
The main risks of investing in the Fund are described below.
Market, Selection and Strategy Risk: The Fund’s share price may fluctuate due to market risk and/or security selections that may underperform the market or relevant benchmarks. If the sub-adviser's investment strategy does not perform as expected, the Fund could underperform its peers or lose money. There is no guarantee the Fund will achieve its stated objective.
Mid-cap Stock Risk: Mid-cap stocks are generally more volatile and risky and may be less liquid than large-cap stocks because they may have limited operating histories, narrow product lines, and focus on niche markets.
Value Investing Risk: Value investments are considered to be undervalued, but they may never attain their potential value. Value-style investing falls in and out of favor, which may result in periods of underperformance.
Foreign Investment Risk: Investments in foreign securities may be riskier than investments in U.S. securities. Potential risks include the risks of illiquidity, increased price volatility, less government regulation, less extensive and less frequent accounting and other reporting requirements, unfavorable changes in currency exchange rates, and economic and political disruptions.
THIS PRIVACY POLICY IS NOT PART OF THIS REPORT
Privacy Policy and Practices of The Hartford Financial Services Group, Inc. and its Affiliates
(herein called “we, our and us”)
This Privacy Policy applies to our United States Operations
We value your trust. We are committed to the responsible: a) management; b) use; and c) protection; of Personal Information. This notice describes how we collect, disclose, and protect Personal Information. We collect Personal Information to: a) service your Transactions with us; and b) support our business functions. We may obtain Personal Information from: a) You; b) your Transactions with us; and c) third parties such as a consumer-reporting agency. Based on the type of product or service You apply for or get from us, Personal Information such as: a) your name; b) your address; c) your income; d) your payment; or e) your credit history; may be gathered from sources such as applications, Transactions, and consumer reports. To serve You and service our business, we may share certain Personal Information. We will share Personal Information, only as allowed by law, with affiliates such as: a) our insurance companies; b) our employee agents; c) our brokerage firms; and d) our administrators. As allowed by law, we may share Personal Financial Information with our affiliates to: a) market our products; or b) market our services; to You without providing You with an option to prevent these disclosures. | | | We may also share Personal Information, only as allowed by law, with unaffiliated third parties including: a) independent agents; b) brokerage firms; c) insurance companies; d) administrators; and e) service providers; who help us serve You and service our business. When allowed by law, we may share certain Personal Financial Information with other unaffiliated third parties who assist us by performing services or functions such as: a) taking surveys; b) marketing our products or services; or c) offering financial products or services under a joint agreement between us and one or more financial institutions. We, and third parties we partner with, may track some of the pages You visit through the use of: a) cookies; b) pixel tagging; or c) other technologies; and currently do not process or comply with any web browser’s “do not track” signal or similar mechanism that indicates a request to disable online tracking of individual users who visit our websites or use our services. We will not sell or share your Personal Financial Information with anyone for purposes unrelated to our business functions without offering You the opportunity to: a) “opt-out;” or b) “opt-in;” as required by law. We only disclose Personal Health Information with: a) your proper written authorization; or b) as otherwise allowed or required by law. Our employees have access to Personal Information in the course of doing their jobs, such as: a) underwriting policies; b) paying claims; c) developing new products; or d) advising customers of our products and services. |
We use manual and electronic security procedures to maintain: a) the confidentiality; and b) the integrity of; Personal Information that we have. We use these procedures to guard against unauthorized access. Some techniques we use to protect Personal Information include: a) secured files; b) user authentication; c) encryption; d) firewall technology; and e) the use of detection software. We are responsible for and must: a) identify information to be protected; b) provide an adequate level of protection for that data; c) grant access to protected data only to those people who must use it in the performance of their job-related duties. Employees who violate our Privacy Policy will be subject to discipline, which may include ending their employment with us. At the start of our business relationship, we will give You a copy of our current Privacy Policy. We will also give You a copy of our current Privacy Policy once a year if You maintain a continuing business relationship with us. We will continue to follow our Privacy Policy regarding Personal Information even when a business relationship no longer exists between us. | | | As used in this Privacy Notice: Application means your request for our product or service. Personal Financial Information means financial information such as: a) credit history; b) income; c) financial benefits; or d) policy or claim information. Personal Health Information means health information such as: a) your medical records; or b) information about your illness, disability or injury. Personal Information means information that identifies You personally and is not otherwise available to the public. It includes: a) Personal Financial Information; and b) Personal Health Information. Transaction means your business dealings with us, such as: a) your Application; b) your request for us to pay a claim; and c) your request for us to take an action on your account. You means an individual who has given us Personal Information in conjunction with: a) asking about; b) applying for; or c) obtaining; a financial product or service from us if the product or service is used mainly for personal, family, or household purposes. |
This Privacy Policy is being provided on behalf of the following affiliates of The Hartford Financial Services Group, Inc.:
1stAGChoice, Inc.; Access CoverageCorp, Inc.; Access CoverageCorp Technologies, Inc.; American Maturity Life Insurance Company; Archway 60 R, LLC; Business Management Group, Inc.; Champlain Life Reinsurance Company; DMS R, LLC; Eloy R, LLC; Ersatz Corporation; First State Insurance Company; Hartford Accident and Indemnity Company; Hartford Administrative Services Company; Hartford Casualty General Agency, Inc.; Hartford Casualty Insurance Company; Hartford-Comprehensive Employee Benefit Service Company; Hartford Equity Sales Company, Inc.; Hartford Fire General Agency, Inc.; Hartford Fire Insurance Company; Hartford Funds Management Company, LLC; Hartford Funds Management Group, Inc.; Hartford HLS Series Fund II, Inc.; Hartford Insurance Company of Illinois; Hartford Insurance Company of the Midwest; Hartford Insurance Company of the Southeast; Hartford Integrated Technologies, Inc.; Hartford International Life Reassurance Corporation; Hartford Funds Distributors, LLC; Hartford Investment Management Company; Hartford Life and Accident Insurance Company; Hartford Life and Annuity Insurance Company; Hartford Life Insurance Company; Hartford Life Private Placement, LLC; Hartford Lloyd’s Corporation; Hartford Lloyd’s Insurance Company; Hartford Mezzanine Investors I, LLC; Hartford Residual Market, L.C.C.; Hartford Retirement Services, LLC; Hartford Securities Distribution Company, Inc.; Hartford Series Fund, Inc.; Hartford Specialty Insurance Services of Texas, LLC; Hartford Strategic Investments, LLC; Hartford Underwriters Insurance Company; Hartford Technology Services Company, L.L.C.; Hartford of Texas General Agency, Inc.; Hartford Underwriters General Agency, Inc.; HARTRE Company, L.C.C.; HL Investment Advisors, LLC; HLA LLC; Horizon Management Group, LLC; HRA Brokerage Services, Inc.; Lanidex Class B, LLC; M-CAP Insurance Agency, LLC; New England Insurance Company; New England Reinsurance Corporation; Nutmeg Insurance Agency, Inc.; Nutmeg Insurance Company; Pacific Insurance Company, Limited; Planco, LLC: Property and Casualty Insurance Company of Hartford; Revere R, LLC; RVR R, LLC; Sentinel Insurance Company, Ltd.; Sunstone R, LLC; Symphony R, LLC; The Evergreen Group Incorporated; The Hartford Alternative Strategies Fund; The Hartford Mutual Funds, Inc.; The Hartford Mutual Funds II, Inc.; Trumbull Flood Management, L.L.C.; Trumbull Insurance Company; Twin City Fire Insurance Company; White River Life Reinsurance Company.
HPP Revised January 2014
HARTFORD HLS FUNDS
P.O. Box 14293
Lexington, KY 40512-4293
HARTFORDFUNDS
hartfordfunds.com
Hartford Series Fund, Inc. is underwritten and distributed by Hartford Funds Distributors, LLC.
Hartford Series Fund, Inc. inception dates range from 1977 to date. Hartford Series Fund, Inc. is not a subsidiary of The Hartford Financial Services Group, Inc. ("The Hartford") but is underwritten, distributed by and advised by subsidiaries of The Hartford. Investments in Hartford Series Fund, Inc. are not guaranteed by The Hartford or any other entity.
This report is submitted for the general information of the shareholders of the Funds. It is not authorized for distribution unless preceded or accompanied by a current prospectus for the Funds.
Investors should carefully consider the investment objectives, risks, charges, and expenses of Hartford Funds before investing. This and other information can be found in the prospectus, which can be obtained by calling 800-862-6668 (or 800-279-1541 for institutional investors). Investors should read them carefully before they invest.
HLSSAR-MCV14 8-14 113548-3 Printed in U.S.A.
HARTFORDFUNDS
| | HARTFORD PORTFOLIO DIVERSIFIER HLS FUND 2014 Semi Annual Report |
A MESSAGE FROM THE PRESIDENT
Dear Fellow Shareholders:
Thank you for investing in Hartford HLS Funds.
Market Review
U.S. equities (as represented by the S&P 500 Index) started 2014 on a shaky note after posting a strong 32.39% gain in 2013. However, stocks managed to maintain modest gains throughout the first quarter and returned to a generally steady climb in the second quarter. Through June 30, 2014, the S&P 500 Index advanced 7.14%. It appears that much of the market volatility during the year can be attributed to heightened international tensions. In particular, the Russian annexation of Ukraine’s Crimean Peninsula and increased tensions in Iraq were cause for concern.
On the domestic front, subdued economic and employment reports slowed stocks’ progress early in the new year, although much of the weakness seemed to dissipate as the year’s unusually harsh winter subsided. And despite initial reactions to the idea, when the U.S. Federal Reserve began tapering its quantitative-easing program in January by reducing its bond purchases by $10 billion a month, the markets took the policy change in stride.
Despite a rough start to the year for financial markets, the global economy seems to be settling into a slow-but-steady recovery. While first-quarter U.S. gross domestic product (GDP) growth was disappointing at -2.9%, U.S. consumer spending, which is a significant contributor toward economic growth, rose by 3% during the quarter. It appears that Europe is also maintaining its own recovery: The International Monetary Fund projects that Europe’s full-year GDP growth may breach positive territory for the first time since 2011.
The impact of international affairs on stocks so far this year is an important reminder to stay informed about both domestic and international economic developments, and any effects they may have on your individual investment goals. If you have not already had a mid-year review of your portfolio, it may be a good time to meet with your financial advisor to review your progress and make certain your investments are prepared for all market environments:
| • | Is your portfolio properly diversified with an appropriate mix of stocks and bonds? |
| • | Is your portfolio positioned to take advantage of the global economic recovery, with investments in both domestic and international holdings? |
| • | Are your investments still in line with your risk tolerance and investment time horizon? |
Your financial professional can help you choose options within our fund family to help you reach your investment goals with confidence.
Thank you again for investing with Hartford HLS Funds.
James Davey
President
Hartford HLS Funds
1 The S&P 500 Index is a market capitalization-weighted price index composed of 500 widely held common stocks.
2The Dow Jones Industrial Average is an unmanaged, price-weighted index of 30 of the largest, most widely held stocks traded on the New York Stock Exchange.
Hartford Portfolio Diversifier HLS Fund
Table of Contents
This report is prepared for the general information of contract owners. It is not an offer of contracts. It should not be used in connection with any offer, except in conjunction with the appropriate product prospectus which contains all pertinent information including the applicable sales, administrative and other charges.
The views expressed in the Fund’s Manager Discussion under ‘‘Why did the Fund perform this way?’’ and ‘‘What is the outlook?’’ are views of the Fund’s sub-adviser and portfolio management team through the end of the period and are subject to change based on market and other conditions. The Fund’s Manager Discussion is for informational purposes only and does not represent an offer, recommendation or solicitation to buy, hold or sell any security. The specific securities identified and described, if any, do not represent all of the securities purchased or sold and you should not assume that investments in the securities identified and discussed will be profitable.
| Hartford Portfolio Diversifier HLS Fund inception 06/06/2011 |
| (sub-advised by Hartford Investment Management Company) |
| Investment objective – The Fund seeks to produce investment performance that mitigates against significant declines in the aggregate value of investment allocations to equity mutual funds under certain variable annuity contracts, while also preserving the potential for modest appreciation in the Fund’s net asset value when markets are appreciating. |
Performance Overview 6/06/11 - 6/30/14
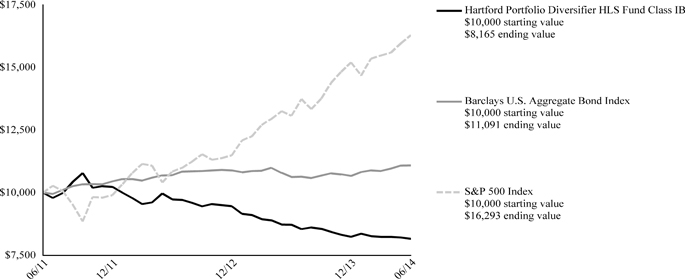
The chart above represents the hypothetical growth of a $10,000 investment in Class IB.
Average Annual Total Returns (as of 6/30/14)
| | 6 Month† | 1 Year | Since
Inception▲ |
| Portfolio Diversifier IB | -0.86% | -6.35% | -6.40% |
| Barclays U.S. Aggregate Bond Index | 3.93% | 4.37% | 3.44% |
| S&P 500 Index | 7.14% | 24.61% | 17.26% |
PERFORMANCE DATA QUOTED REPRESENTS PAST PERFORMANCE AND DOES NOT GUARANTEE FUTURE RESULTS. The investment return and principal value of the investment will fluctuate so that investors’ shares, when redeemed, may be worth more or less than their original cost. Current performance may be lower or higher than the performance data quoted.
Total returns presented above were calculated using the Fund’s net asset value available to shareholders for sale or redemption of Fund shares on June 30, 2014, which may exclude investment transactions as of this date. All share class returns assume the reinvestment of all distributions at net asset value and the deduction of all fund expenses.
Barclays U.S. Aggregate Bond Index is an unmanaged index and is composed of securities from the Barclays Government/Credit Bond Index, Mortgage-Backed Securities Index, Asset-Backed Securities Index and Commercial Mortgage-Backed Securities Index.
S&P 500 Index is a market capitalization-weighted price index composed of 500 widely held common stocks.
The index is unmanaged, and its results include reinvested dividends and/or distributions, but do not reflect the effect of sales charges, commissions, expenses or taxes.
You cannot invest directly in an index.
As shown in the Fund's current prospectus dated May 1, 2014, the net total annual operating expense ratio for Class IB shares was 0.85% and the gross total annual operating expense ratio for Class IB shares was 0.89%. Actual expenses may be higher. Please see the accompanying Financial Highlights for expense ratios for the six-month period ended June 30, 2014.
Gross expenses are the Fund's total annual operating expenses shown in the Fund's most recent prospectus. Net expenses are the Fund's total annual operating expenses shown in the Fund's most recent prospectus and reflect contractual expense reimbursements in instances when these reductions reduce the Fund's gross expenses. Contractual reimbursements remain in effect until April 30, 2015, and automatically renew for one-year terms unless terminated.
The chart and table do not reflect the deductions of taxes, sales charges or other fees which may be applied at the variable life insurance, variable annuity or qualified retirement plan product level. Any such additional sales charges or other fees or expenses would lower the contract’s or plan’s performance.
All investments are subject to risk including the possible loss of principal. For a discussion of the Fund’s risks, please see the Main Risks section of this report. For more detailed information on the risks associated with an investment in the Fund, please see the prospectus.
| Hartford Portfolio Diversifier HLS Fund |
| Manager Discussion |
| June 30, 2014 (Unaudited) |
| Portfolio Managers | |
| Paul Bukowski, CFA | James Ong, CFA* |
| Executive Vice President and Head of Quantitative Equities | Vice President |
| |
| * Effective April 4, 2014, Mr. Ong no longer serves as a Portfolio Manager to the Fund. |
How did the Fund perform?
The Class IB Shares of the Hartford Portfolio Diversifier HLS Fund returned -0.86% for the six-month period ended June 30, 2014, compared to the returns of the Barclays U.S. Aggregate Bond Index and the S&P 500 Index, which returned 3.93% and 7.14%, respectively, for the same period.
Why did the Fund perform this way?
The Fund performed in line with expectations for the period. The Fund generally invests in securities and other instruments which increase in value as the S&P 500 Index declines, and securities which are expected to approximate the performance of the Barclays U.S. Aggregate Bond and S&P 500 Indices.
Overall, the Fund decreased in value as it is designed to achieve performance generally “contra” to that of the S&P 500 Index which posted strong performance, appreciating more than 7% during the first half of the year. The Fund’s short S&P 500 futures and a modest short and long-term S&P 500 put position, declined in value providing a head wind (i.e. negative impact) to performance during the first half of the year. The fixed income sleeve provided a tailwind to fund performance as it increased nearly 4% for the year.
What is your outlook?
The S&P 500 Index returned more than 7% during the first half of 2014, with all sectors posting positive performance. The S&P 500 Index rallied from a quarter-low level of 1816 in mid-April to finish June at 1960. Allocation to higher-yielding sectors was evident as Utilities and Energy led the way with gains of 18% and 13%, respectively, while Consumer Discretionary lagged with a 1% return. Small caps have continued to underperform, with the Russell 2000 Index returning 3% year-to-date.
The underlying business and economic measures remain supportive and valuations are slightly above average, but we believe they can be supported by rising interest rates. Conversely, it is our view that technicals could provide a potential headwind as the market continues to march higher despite already exhibiting a significant amount of buying interest with little apparent concern for risk as volume and volatility have trended lower. As a result, we believe the second half of the year will be stagnant across the broader market.
Possible risks to our outlook include heightened geopolitical tensions, the potential for surprises regarding the U.S. Federal Reserve reducing its monthly purchases of mortgage bonds and U.S. Treasuries, and unexpected but continued weakness in economic indicators beyond the weather-impacted first quarter data.
Diversification by Security Type
as of June 30, 2014
| Category | | Percentage of Net
Assets | |
| Equity Securities |
| Common Stocks | | | 22.4 | % |
| Exchange Traded Funds | | | 0.2 | |
| Total | | | 22.6 | % |
| Fixed Income Securities |
| Asset & Commercial Mortgage Backed Securities | | | 0.7 | % |
| Corporate Bonds | | | 11.9 | |
| Foreign Government Obligations | | | 0.8 | |
| Municipal Bonds | | | 0.3 | |
| U.S. Government Agencies | | | 13.4 | |
| U.S. Government Securities | | | 15.4 | |
| Total | | | 42.5 | % |
| Short-Term Investments | | | 35.5 | |
| Purchased Options | | | 0.4 | |
| Other Assets and Liabilities | | | (1.0 | ) |
| Total | | | 100.0 | % |
Credit Exposure
as of June 30, 2014
| Credit Rating * | | Percentage of
Net Assets | |
| Aaa / AAA | | | 13.7 | |
| Aa / AA | | | 18.0 | |
| A | | | 4.8 | |
| Baa / BBB | | | 5.9 | |
| Ba / BB | | | 0.0 | |
| Not Rated | | | 0.1 | |
| Non-Debt Securities and Other Short-Term Instruments | | | 58.5 | |
| Other Assets and Liabilities | | | (1.0 | ) |
| Total | | | 100.0 | % |
| * | Credit exposure is the long-term credit ratings for the Fund's holdings, as of the date noted, as provided by Standard and Poor's (S&P) or Moody's Investors Service and typically range from AAA/Aaa (highest) to C/D (lowest). Presentation of S&P and Moody's credit ratings in this report have been selected for several reasons, including access to information and materials provided by S&P and Moody's, as well as the Fund's consideration of industry practice. If Moody's and S&P assign different ratings, the lower rating is used. Fixed income securities that are not rated by either agency are listed as "Not Rated." Ratings do not apply to the Fund itself or to Fund shares. Ratings may change. |
| Hartford Portfolio Diversifier HLS Fund |
| Schedule of Investments |
| June 30, 2014 (Unaudited) |
| (000’s Omitted) |
| Shares or Principal Amount | | Market Value ╪ | |
| Common Stocks - 22.4% |
| | | | | Automobiles and Components - 0.3% | | | | |
| | 1 | | | BorgWarner, Inc. | | $ | 84 | |
| | 2 | | | Delphi Automotive plc | | | 107 | |
| | 22 | | | Ford Motor Co. | | | 386 | |
| | 7 | | | General Motors Co. | | | 270 | |
| | 2 | | | Goodyear (The) Tire & Rubber Co. | | | 43 | |
| | 1 | | | Harley-Davidson, Inc. | | | 86 | |
| | 4 | | | Johnson Controls, Inc. | | | 188 | |
| | | | | | | | 1,164 | |
| | | | | Banks - 0.7% | | | | |
| | 4 | | | BB&T Corp. | | | 160 | |
| | 1 | | | Comerica, Inc. | | | 51 | |
| | 5 | | | Fifth Third Bancorp | | | 103 | |
| | 3 | | | Hudson City Bancorp, Inc. | | | 26 | |
| | 5 | | | Huntington Bancshares, Inc. | | | 45 | |
| | 5 | | | KeyCorp | | | 71 | |
| | 1 | | | M&T Bank Corp. | | | 92 | |
| | 2 | | | People's United Financial, Inc. | | | 27 | |
| | 3 | | | PNC Financial Services Group, Inc. | | | 269 | |
| | 8 | | | Regions Financial Corp. | | | 83 | |
| | 3 | | | SunTrust Banks, Inc. | | | 121 | |
| | 10 | | | US Bancorp | | | 445 | |
| | 27 | | | Wells Fargo & Co. | | | 1,425 | |
| | 1 | | | Zions Bancorporation | | | 31 | |
| | | | | | | | 2,949 | |
| | | | | Capital Goods - 1.7% | | | | |
| | 4 | | | 3M Co. | | | 503 | |
| | 1 | | | AMETEK, Inc. | | | 72 | |
| | 4 | | | Boeing Co. | | | 483 | |
| | 4 | | | Caterpillar, Inc. | | | 384 | |
| | 1 | | | Cummins, Inc. | | | 149 | |
| | 3 | | | Danaher Corp. | | | 268 | |
| | 2 | | | Deere & Co. | | | 186 | |
| | 1 | | | Dover Corp. | | | 86 | |
| | 3 | | | Eaton Corp. plc | | | 208 | |
| | 4 | | | Emerson Electric Co. | | | 263 | |
| | 2 | | | Fastenal Co. | | | 76 | |
| | 1 | | | Flowserve Corp. | | | 58 | |
| | 1 | | | Fluor Corp. | | | 69 | |
| | 2 | | | General Dynamics Corp. | | | 215 | |
| | 57 | | | General Electric Co. | | | 1,490 | |
| | 4 | | | Honeywell International, Inc. | | | 412 | |
| | 2 | | | Illinois Tool Works, Inc. | | | 188 | |
| | 1 | | | Ingersoll-Rand plc | | | 89 | |
| | 1 | | | Jacobs Engineering Group, Inc. ● | | | 40 | |
| | 1 | | | Joy Global, Inc. | | | 35 | |
| | — | | | L-3 Communications Holdings, Inc. | | | 59 | |
| | 2 | | | Lockheed Martin Corp. | | | 242 | |
| | 2 | | | Masco Corp. | | | 45 | |
| | 1 | | | Northrop Grumman Corp. | | | 145 | |
| | 2 | | | PACCAR, Inc. | | | 126 | |
| | 1 | | | Pall Corp. | | | 53 | |
| | 1 | | | Parker-Hannifin Corp. | | | 106 | |
| | 1 | | | Pentair plc | | | 79 | |
| | 1 | | | Precision Castparts Corp. | | | 207 | |
| | 1 | | | Quanta Services, Inc. ● | | | 43 | |
| | 2 | | | Raytheon Co. | | | 163 | |
| | 1 | | | Rockwell Automation, Inc. | | | 98 | |
| | 1 | | | Rockwell Collins, Inc. | | | 60 | |
| | 1 | | | Roper Industries, Inc. | | | 82 | |
| | — | | | Snap-On, Inc. | | | 39 | |
| | 1 | | | Stanley Black & Decker, Inc. | | | 77 | |
| | 2 | | | Textron, Inc. | | | 60 | |
| | 5 | | | United Technologies Corp. | | | 551 | |
| | — | | | W.W. Grainger, Inc. | | | 87 | |
| | 1 | | | Xylem, Inc. | | | 41 | |
| | | | | | | | 7,637 | |
| | | | | Commercial and Professional Services - 0.2% | | | | |
| | 1 | | | ADT (The) Corp. | | | 35 | |
| | 1 | | | Avery Dennison Corp. | | | 28 | |
| | 1 | | | Cintas Corp. | | | 36 | |
| | — | | | Dun & Bradstreet Corp. | | | 23 | |
| | 1 | | | Equifax, Inc. ● | | | 50 | |
| | 1 | | | Iron Mountain, Inc. | | | 34 | |
| | 2 | | | Nielsen N.V. | | | 83 | |
| | 1 | | | Pitney Bowes, Inc. | | | 32 | |
| | 2 | | | Republic Services, Inc. | | | 57 | |
| | 1 | | | Robert Half International, Inc. | | | 37 | |
| | — | | | Stericycle, Inc. ● | | | 57 | |
| | 3 | | | Tyco International Ltd. | | | 119 | |
| | 2 | | | Waste Management, Inc. | | | 109 | |
| | | | | | | | 700 | |
| | | | | Consumer Durables and Apparel - 0.3% | | | | |
| | 2 | | | Coach, Inc. | | | 53 | |
| | 2 | | | D.R. Horton, Inc. | | | 40 | |
| | — | | | Fossil Group, Inc. ● | | | 28 | |
| | 1 | | | Garmin Ltd. | | | 42 | |
| | — | | | Harman International Industries, Inc. | | | 41 | |
| | 1 | | | Hasbro, Inc. | | | 35 | |
| | 1 | | | Leggett & Platt, Inc. | | | 27 | |
| | 1 | | | Lennar Corp. | | | 42 | |
| | 2 | | | Mattel, Inc. | | | 75 | |
| | 1 | | | Michael Kors Holdings Ltd. ● | | | 90 | |
| | — | | | Mohawk Industries, Inc. ● | | | 48 | |
| | 2 | | | Newell Rubbermaid, Inc. | | | 49 | |
| | 4 | | | NIKE, Inc. Class B | | | 323 | |
| | 2 | | | Pulte Group, Inc. | | | 39 | |
| | — | | | PVH Corp. | | | 54 | |
| | — | | | Ralph Lauren Corp. | | | 53 | |
| | 1 | | | Under Armour, Inc. Class A ● | | | 54 | |
| | 2 | | | V.F. Corp. | | | 123 | |
| | — | | | Whirlpool Corp. | | | 61 | |
| | | | | | | | 1,277 | |
| | | | | Consumer Services - 0.4% | | | | |
| | 2 | | | Carnival Corp. | | | 93 | |
| | — | | | Chipotle Mexican Grill, Inc. ● | | | 104 | |
| | 1 | | | Darden Restaurants, Inc. | | | 34 | |
| | 2 | | | H & R Block, Inc. | | | 52 | |
| | 1 | | | Marriott International, Inc. Class A | | | 80 | |
| | 6 | | | McDonald's Corp. | | | 563 | |
| | 4 | | | Starbucks Corp. | | | 329 | |
| | 1 | | | Starwood Hotels & Resorts, Inc. | | | 88 | |
| | 1 | | | Wyndham Worldwide Corp. | | | 55 | |
| | — | | | Wynn Resorts Ltd. | | | 95 | |
| | 2 | | | Yum! Brands, Inc. | | | 203 | |
| | | | | | | | 1,696 | |
| | | | | Diversified Financials - 1.5% | | | | |
| | — | | | Affiliated Managers Group, Inc. ● | | | 65 | |
| | 5 | | | American Express Co. | | | 488 | |
| | 1 | | | Ameriprise Financial, Inc. | | | 129 | |
| | 59 | | | Bank of America Corp. | | | 914 | |
The accompanying notes are an integral part of these financial statements.
| Hartford Portfolio Diversifier HLS Fund |
| Schedule of Investments – (continued) |
| June 30, 2014 (Unaudited) |
| (000’s Omitted) |
| Shares or Principal Amount | | Market Value ╪ | |
| Common Stocks - 22.4% - (continued) |
| | | | | Diversified Financials - 1.5% - (continued) | | | | |
| | 6 | | | Bank of New York Mellon Corp. | | $ | 242 | |
| | 1 | | | BlackRock, Inc. | | | 226 | |
| | 3 | | | Capital One Financial Corp. | | | 267 | |
| | 7 | | | Charles Schwab Corp. | | | 178 | |
| | 17 | | | Citigroup, Inc. | | | 809 | |
| | 2 | | | CME Group, Inc. | | | 127 | |
| | 3 | | | Discover Financial Services | | | 163 | |
| | 2 | | | E*Trade Financial Corp. ● | | | 35 | |
| | 2 | | | Franklin Resources, Inc. | | | 131 | |
| | 2 | | | Goldman Sachs Group, Inc. | | | 394 | |
| | 1 | | | Intercontinental Exchange, Inc. | | | 123 | |
| | 2 | | | Invesco Ltd. | | | 92 | |
| | 21 | | | JP Morgan Chase & Co. | | | 1,233 | |
| | 1 | | | Legg Mason, Inc. | | | 30 | |
| | 2 | | | Leucadia National Corp. | | | 47 | |
| | 1 | | | Moody's Corp. | | | 93 | |
| | 8 | | | Morgan Stanley | | | 256 | |
| | 1 | | | Nasdaq OMX Group, Inc. | | | 26 | |
| | 2 | | | Navient Corp. | | | 42 | |
| | 1 | | | Northern Trust Corp. | | | 81 | |
| | 2 | | | State Street Corp. | | | 164 | |
| | 1 | | | T. Rowe Price Group, Inc. | | | 125 | |
| | | | | | | | 6,480 | |
| | | | | Energy - 2.4% | | | | |
| | 3 | | | Anadarko Petroleum Corp. | | | 313 | |
| | 2 | | | Apache Corp. | | | 219 | |
| | 2 | | | Baker Hughes, Inc. | | | 184 | |
| | 2 | | | Cabot Oil & Gas Corp. | | | 81 | |
| | 1 | | | Cameron International Corp. ● | | | 78 | |
| | 3 | | | Chesapeake Energy Corp. | | | 89 | |
| | 11 | | | Chevron Corp. | | | 1,405 | |
| | — | | | Cimarex Energy Co. | | | 71 | |
| | 7 | | | ConocoPhillips Holding Co. | | | 595 | |
| | 1 | | | Consol Energy, Inc. | | | 60 | |
| | 2 | | | Denbury Resources, Inc. | | | 37 | |
| | 2 | | | Devon Energy Corp. | | | 172 | |
| | — | | | Diamond Offshore Drilling, Inc. | | | 19 | |
| | 1 | | | Ensco plc | | | 73 | |
| | 3 | | | EOG Resources, Inc. | | | 361 | |
| | 1 | | | EQT Corp. | | | 92 | |
| | 24 | | | Exxon Mobil Corp. | | | 2,445 | |
| | 1 | | | FMC Technologies, Inc. ● | | | 81 | |
| | 5 | | | Halliburton Co. | | | 339 | |
| | 1 | | | Helmerich & Payne, Inc. | | | 71 | |
| | 1 | | | Hess Corp. | | | 148 | |
| | 4 | | | Kinder Morgan, Inc. | | | 137 | |
| | 4 | | | Marathon Oil Corp. | | | 153 | |
| | 2 | | | Marathon Petroleum Corp. | | | 127 | |
| | 1 | | | Murphy Oil Corp. | | | 63 | |
| | 1 | | | Nabors Industries Ltd. | | | 44 | |
| | 2 | | | National Oilwell Varco, Inc. | | | 200 | |
| | 1 | | | Newfield Exploration Co. ● | | | 34 | |
| | 1 | | | Noble Corp. plc | | | 48 | |
| | 2 | | | Noble Energy, Inc. | | | 157 | |
| | 4 | | | Occidental Petroleum Corp. | | | 456 | |
| | 2 | | | Peabody Energy Corp. | | | 25 | |
| | 3 | | | Phillips 66 | | | 257 | |
| | 1 | | | Pioneer Natural Resources Co. | | | 186 | |
| | 1 | | | QEP Resources, Inc. | | | 35 | |
| | 1 | | | Range Resources Corp. | | | 83 | |
| | 1 | | | Rowan Cos. plc Class A | | | 22 | |
| | 7 | | | Schlumberger Ltd. | | | 869 | |
| | 2 | | | Southwestern Energy Co. ● | | | 91 | |
| | 4 | | | Spectra Energy Corp. | | | 161 | |
| | 1 | | | Tesoro Corp. | | | 43 | |
| | 2 | | | Transocean, Inc. | | | 87 | |
| | 3 | | | Valero Energy Corp. | | | 151 | |
| | 4 | | | Williams Cos., Inc. | | | 243 | |
| | | | | | | | 10,605 | |
| | | | | Food and Staples Retailing - 0.5% | | | | |
| | 2 | | | Costco Wholesale Corp. | | | 285 | |
| | 7 | | | CVS Caremark Corp. | | | 498 | |
| | 3 | | | Kroger (The) Co. | | | 143 | |
| | 1 | | | Safeway, Inc. | | | 45 | |
| | 3 | | | Sysco Corp. | | | 124 | |
| | 5 | | | Walgreen Co. | | | 368 | |
| | 9 | | | Wal-Mart Stores, Inc. | | | 684 | |
| | 2 | | | Whole Foods Market, Inc. | | | 80 | |
| | | | | | | | 2,227 | |
| | | | | Food, Beverage and Tobacco - 1.2% | | | | |
| | 11 | | | Altria Group, Inc. | | | 471 | |
| | 4 | | | Archer-Daniels-Midland Co. | | | 163 | |
| | 1 | | | Brown-Forman Corp. | | | 86 | |
| | 1 | | | Campbell Soup Co. | | | 46 | |
| | 21 | | | Coca-Cola Co. | | | 905 | |
| | 1 | | | Coca-Cola Enterprises, Inc. | | | 63 | |
| | 2 | | | ConAgra Foods, Inc. | | | 71 | |
| | 1 | | | Constellation Brands, Inc. Class A ● | | | 84 | |
| | 1 | | | Dr. Pepper Snapple Group | | | 65 | |
| | 3 | | | General Mills, Inc. | | | 183 | |
| | 1 | | | Hershey Co. | | | 82 | |
| | 1 | | | Hormel Foods Corp. | | | 38 | |
| | 1 | | | J.M. Smucker Co. | | | 62 | |
| | 1 | | | Kellogg Co. | | | 95 | |
| | 1 | | | Keurig Green Mountain, Inc. | | | 90 | |
| | 3 | | | Kraft Foods Group, Inc. | | | 202 | |
| | 2 | | | Lorillard, Inc. | | | 125 | |
| | 1 | | | McCormick & Co., Inc. | | | 53 | |
| | 1 | | | Mead Johnson Nutrition Co. | | | 107 | |
| | 1 | | | Molson Coors Brewing Co. | | | 67 | |
| | 10 | | | Mondelez International, Inc. | | | 360 | |
| | 1 | | | Monster Beverage Corp. ● | | | 54 | |
| | 9 | | | PepsiCo, Inc. | | | 766 | |
| | 9 | | | Philip Morris International, Inc. | | | 750 | |
| | 2 | | | Reynolds American, Inc. | | | 106 | |
| | 2 | | | Tyson Foods, Inc. Class A | | | 58 | |
| | | | | | | | 5,152 | |
| | | | | Health Care Equipment and Services - 0.9% | | | | |
| | 8 | | | Abbott Laboratories | | | 347 | |
| | 2 | | | Aetna, Inc. | | | 164 | |
| | 1 | | | AmerisourceBergen Corp. | | | 93 | |
| | — | | | Bard (C.R.), Inc. | | | 62 | |
| | 3 | | | Baxter International, Inc. | | | 222 | |
| | 1 | | | Becton, Dickinson & Co. | | | 129 | |
| | 7 | | | Boston Scientific Corp. ● | | | 95 | |
| | 2 | | | Cardinal Health, Inc. | | | 132 | |
| | 1 | | | CareFusion Corp. ● | | | 52 | |
| | 2 | | | Cerner Corp. ● | | | 86 | |
| | 2 | | | CIGNA Corp. | | | 140 | |
| | 3 | | | Covidien plc | | | 230 | |
The accompanying notes are an integral part of these financial statements.
| Hartford Portfolio Diversifier HLS Fund |
| Schedule of Investments – (continued) |
| June 30, 2014 (Unaudited) |
| (000’s Omitted) |
| Shares or Principal Amount | | Market Value ╪ | |
| Common Stocks - 22.4% - (continued) |
| | | | | Health Care Equipment and Services - 0.9% - (continued) | | | | |
| | 1 | | | DaVita HealthCare Partners, Inc. ● | | $ | 73 | |
| | 1 | | | Dentsply International, Inc. | | | 38 | |
| | 1 | | | Edwards Lifesciences Corp. ● | | | 51 | |
| | 4 | | | Express Scripts Holding Co. ● | | | 303 | |
| | 1 | | | Humana, Inc. | | | 112 | |
| | — | | | Intuitive Surgical, Inc. ● | | | 89 | |
| | — | | | Laboratory Corp. of America Holdings ● | | | 49 | |
| | 1 | | | McKesson Corp. | | | 243 | |
| | 6 | | | Medtronic, Inc. | | | 360 | |
| | — | | | Patterson Cos., Inc. | | | 18 | |
| | 1 | | | Quest Diagnostics, Inc. | | | 48 | |
| | 2 | | | St. Jude Medical, Inc. | | | 111 | |
| | 2 | | | Stryker Corp. | | | 141 | |
| | 1 | | | Tenet Healthcare Corp. ● | | | 26 | |
| | 6 | | | UnitedHealth Group, Inc. | | | 453 | |
| | 1 | | | Varian Medical Systems, Inc. ● | | | 49 | |
| | 2 | | | Wellpoint, Inc. | | | 170 | |
| | 1 | | | Zimmer Holdings, Inc. | | | 99 | |
| | | | | | | | 4,185 | |
| | | | | Household and Personal Products - 0.4% | | | | |
| | 2 | | | Avon Products, Inc. | | | 36 | |
| | 1 | | | Clorox Co. | | | 66 | |
| | 5 | | | Colgate-Palmolive Co. | | | 335 | |
| | 1 | | | Estee Lauder Co., Inc. | | | 106 | |
| | 2 | | | Kimberly-Clark Corp. | | | 237 | |
| | 15 | | | Procter & Gamble Co. | | | 1,203 | |
| | | | | | | | 1,983 | |
| | | | | Insurance - 0.9% | | | | |
| | 2 | | | ACE Ltd. | | | 201 | |
| | 3 | | | Aflac, Inc. | | | 168 | |
| | 2 | | | Allstate (The) Corp. | | | 146 | |
| | 8 | | | American International Group, Inc. | | | 453 | |
| | 2 | | | Aon plc | | | 151 | |
| | — | | | Assurant, Inc. | | | 27 | |
| | 10 | | | Berkshire Hathaway, Inc. Class B ● | | | 1,308 | |
| | 1 | | | Chubb Corp. | | | 129 | |
| | 1 | | | Cincinnati Financial Corp. | | | 41 | |
| | 3 | | | Genworth Financial, Inc. ● | | | 50 | |
| | 2 | | | Lincoln National Corp. | | | 81 | |
| | 2 | | | Loews Corp. | | | 77 | |
| | 3 | | | Marsh & McLennan Cos., Inc. | | | 161 | |
| | 7 | | | MetLife, Inc. | | | 371 | |
| | 2 | | | Principal Financial Group, Inc. | | | 82 | |
| | 3 | | | Progressive Corp. | | | 79 | |
| | 3 | | | Prudential Financial, Inc. | | | 244 | |
| | 1 | | | Torchmark Corp. | | | 43 | |
| | 2 | | | Travelers Cos., Inc. | | | 188 | |
| | 2 | | | Unum Group | | | 53 | |
| | 2 | | | XL Group plc | | | 51 | |
| | | | | | | | 4,104 | |
| | | | | Materials - 0.8% | | | | |
| | 1 | | | Air Products & Chemicals, Inc. | | | 154 | |
| | — | | | Airgas, Inc. | | | 41 | |
| | 7 | | | Alcoa, Inc. | | | 99 | |
| | 1 | | | Allegheny Technologies, Inc. | | | 28 | |
| | 1 | | | Ball Corp. | | | 49 | |
| | 1 | | | Bemis Co., Inc. | | | 23 | |
| | — | | | CF Industries Holdings, Inc. | | | 71 | |
| | 7 | | | Dow Chemical Co. | | | 350 | |
| | 5 | | | E.I. DuPont de Nemours & Co. | | | 340 | |
| | 1 | | | Eastman Chemical Co. | | | 74 | |
| | 2 | | | Ecolab, Inc. | | | 170 | |
| | 1 | | | FMC Corp. | | | 54 | |
| | 6 | | | Freeport-McMoRan Copper & Gold, Inc. | | | 214 | |
| | — | | | International Flavors & Fragrances, Inc. | | | 48 | |
| | 2 | | | International Paper Co. | | | 124 | |
| | 2 | | | LyondellBasell Industries Class A | | | 230 | |
| | 1 | | | MeadWestvaco Corp. | | | 42 | |
| | 3 | | | Monsanto Co. | | | 370 | |
| | 2 | | | Mosaic Co. | | | 91 | |
| | 3 | | | Newmont Mining Corp. | | | 72 | |
| | 2 | | | Nucor Corp. | | | 89 | |
| | 1 | | | Owens-Illinois, Inc. ● | | | 32 | |
| | 1 | | | PPG Industries, Inc. | | | 164 | |
| | 2 | | | Praxair, Inc. | | | 220 | |
| | 1 | | | Sealed Air Corp. | | | 38 | |
| | — | | | Sherwin-Williams Co. | | | 99 | |
| | 1 | | | Sigma-Aldrich Corp. | | | 68 | |
| | 1 | | | United States Steel Corp. | | | 21 | |
| | 1 | | | Vulcan Materials Co. | | | 47 | |
| | | | | | | | 3,422 | |
| | | | | Media - 0.8% | | | | |
| | 1 | | | Cablevision Systems Corp. | | | 22 | |
| | 3 | | | CBS Corp. Class B | | | 186 | |
| | 15 | | | Comcast Corp. Class A | | | 789 | |
| | 3 | | | DirecTV ● | | | 225 | |
| | 1 | | | Discovery Communications, Inc. ● | | | 92 | |
| | 1 | | | Gannett Co., Inc. | | | 40 | |
| | — | | | Graham Holdings Co. | | | 18 | |
| | 2 | | | Interpublic Group of Cos., Inc. | | | 47 | |
| | 2 | | | McGraw Hill Financial, Inc. | | | 128 | |
| | 3 | | | News Corp. Class A ● | | | 50 | |
| | 1 | | | Omnicom Group, Inc. | | | 104 | |
| | 1 | | | Scripps Networks Interactive Class A | | | 49 | |
| | 2 | | | Time Warner Cable, Inc. | | | 232 | |
| | 5 | | | Time Warner, Inc. | | | 350 | |
| | 11 | | | Twenty-First Century Fox, Inc. | | | 381 | |
| | 2 | | | Viacom, Inc. Class B | | | 192 | |
| | 9 | | | Walt Disney Co. | | | 781 | |
| | | | | | | | 3,686 | |
| | | | | Pharmaceuticals, Biotechnology and Life Sciences - 2.0% | | | | |
| | 9 | | | AbbVie, Inc. | | | 508 | |
| | 1 | | | Actavis plc ● | | | 220 | |
| | 2 | | | Agilent Technologies, Inc. | | | 108 | |
| | 1 | | | Alexion Pharmaceuticals, Inc. ● | | | 175 | |
| | 2 | | | Allergan, Inc. | | | 285 | |
| | 4 | | | Amgen, Inc. | | | 507 | |
| | 1 | | | Biogen Idec, Inc. ● | | | 423 | |
| | 9 | | | Bristol-Myers Squibb Co. | | | 455 | |
| | 4 | | | Celgene Corp. ● | | | 383 | |
| | 6 | | | Eli Lilly & Co. | | | 346 | |
| | 1 | | | Forest Laboratories, Inc. ● | | | 134 | |
| | 9 | | | Gilead Sciences, Inc. ● | | | 720 | |
| | 1 | | | Hospira, Inc. ● | | | 49 | |
| | 16 | | | Johnson & Johnson | | | 1,674 | |
| | 17 | | | Merck & Co., Inc. | | | 956 | |
| | 2 | | | Mylan, Inc. ● | | | 109 | |
| | 1 | | | PerkinElmer, Inc. | | | 30 | |
| | 1 | | | Perrigo Co. plc | | | 110 | |
| | 36 | | | Pfizer, Inc. | | | 1,071 | |
The accompanying notes are an integral part of these financial statements.
| Hartford Portfolio Diversifier HLS Fund |
| Schedule of Investments – (continued) |
| June 30, 2014 (Unaudited) |
| (000’s Omitted) |
| Shares or Principal Amount | | Market Value ╪ | |
| Common Stocks - 22.4% - (continued) |
| | | | | Pharmaceuticals, Biotechnology and Life Sciences - 2.0% - (continued) | | | | |
| | — | | | Regeneron Pharmaceuticals, Inc. ● | | $ | 127 | |
| | 2 | | | Thermo Fisher Scientific, Inc. | | | 266 | |
| | 1 | | | Vertex Pharmaceuticals, Inc. ● | | | 126 | |
| | — | | | Waters Corp. ● | | | 50 | |
| | 3 | | | Zoetis, Inc. | | | 91 | |
| | | | | | | | 8,923 | |
| | | | | Real Estate - 0.5% | | | | |
| | 2 | | | American Tower Corp. REIT | | | 201 | |
| | 1 | | | Apartment Investment & Management Co. Class A REIT | | | 27 | |
| | 1 | | | AvalonBay Communities, Inc. REIT | | | 98 | |
| | 1 | | | Boston Properties, Inc. REIT | | | 102 | |
| | 2 | | | CBRE Group, Inc. ● | | | 51 | |
| | 2 | | | Equity Residential Properties Trust REIT | | | 120 | |
| | — | | | Essex Property Trust, Inc. REIT | | | 66 | |
| | 3 | | | General Growth Properties, Inc. REIT | | | 69 | |
| | 3 | | | HCP, Inc. REIT | | | 107 | |
| | 2 | | | Health Care REIT, Inc. | | | 108 | |
| | 4 | | | Host Hotels & Resorts, Inc. REIT | | | 94 | |
| | 2 | | | Kimco Realty Corp. REIT | | | 53 | |
| | 1 | | | Macerich Co. REIT | | | 53 | |
| | 1 | | | Plum Creek Timber Co., Inc. REIT | | | 45 | |
| | 3 | | | ProLogis L.P. REIT | | | 116 | |
| | 1 | | | Public Storage REIT | | | 141 | |
| | 2 | | | Simon Property Group, Inc. REIT | | | 292 | |
| | 2 | | | Ventas, Inc. REIT | | | 107 | |
| | 1 | | | Vornado Realty Trust REIT | | | 105 | |
| | 3 | | | Weyerhaeuser Co. REIT | | | 110 | |
| | | | | | | | 2,065 | |
| | | | | Retailing - 0.9% | | | | |
| | 2 | | | Amazon.com, Inc. ● | | | 685 | |
| | — | | | AutoNation, Inc. ● | | | 21 | |
| | — | | | AutoZone, Inc. ● | | | 101 | |
| | 1 | | | Bed Bath & Beyond, Inc. ● | | | 66 | |
| | 2 | | | Best Buy Co., Inc. | | | 48 | |
| | 1 | | | CarMax, Inc. ● | | | 65 | |
| | 2 | | | Dollar General Corp. ● | | | 98 | |
| | 1 | | | Dollar Tree, Inc. ● | | | 64 | |
| | 1 | | | Expedia, Inc. | | | 46 | |
| | 1 | | | Family Dollar Stores, Inc. | | | 36 | |
| | 1 | | | GameStop Corp. Class A | | | 26 | |
| | 1 | | | Gap, Inc. | | | 61 | |
| | 1 | | | Genuine Parts Co. | | | 76 | |
| | 8 | | | Home Depot, Inc. | | | 626 | |
| | 1 | | | Kohl's Corp. | | | 58 | |
| | 1 | | | L Brands, Inc. | | | 81 | |
| | 6 | | | Lowe's Cos., Inc. | | | 271 | |
| | 2 | | | Macy's, Inc. | | | 118 | |
| | — | | | Netflix, Inc. ● | | | 149 | |
| | 1 | | | Nordstrom, Inc. | | | 54 | |
| | 1 | | | O'Reilly Automotive, Inc. ● | | | 90 | |
| | 1 | | | PetSmart, Inc. | | | 34 | |
| | — | | | Priceline (The) Group, Inc. ● | | | 356 | |
| | 1 | | | Ross Stores, Inc. | | | 80 | |
| | 4 | | | Staples, Inc. | | | 40 | |
| | 4 | | | Target Corp. | | | 208 | |
| | 1 | | | Tiffany & Co. | | | 63 | |
| | 4 | | | TJX Cos., Inc. | | | 211 | |
| | 1 | | | Tractor Supply Co. | | | 47 | |
| | 1 | | | TripAdvisor, Inc. ● | | | 68 | |
| | 1 | | | Urban Outfitters, Inc. ● | | | 20 | |
| | | | | | | | 3,967 | |
| | | | | Semiconductors and Semiconductor Equipment - 0.5% | | | | |
| | 2 | | | Altera Corp. | | | 62 | |
| | 2 | | | Analog Devices, Inc. | | | 96 | |
| | 7 | | | Applied Materials, Inc. | | | 155 | |
| | 1 | | | Avago Technologies Ltd. | | | 102 | |
| | 3 | | | Broadcom Corp. Class A | | | 117 | |
| | — | | | First Solar, Inc. ● | | | 29 | |
| | 28 | | | Intel Corp. | | | 870 | |
| | 1 | | | KLA-Tencor Corp. | | | 68 | |
| | 1 | | | Lam Research Corp. | | | 62 | |
| | 1 | | | Linear Technology Corp. | | | 63 | |
| | 1 | | | Microchip Technology, Inc. | | | 55 | |
| | 6 | | | Micron Technology, Inc. ● | | | 199 | |
| | 3 | | | NVIDIA Corp. | | | 58 | |
| | 6 | | | Texas Instruments, Inc. | | | 292 | |
| | 2 | | | Xilinx, Inc. | | | 72 | |
| | | | | | | | 2,300 | |
| | | | | Software and Services - 2.2% | | | | |
| | 4 | | | Accenture plc | | | 289 | |
| | 3 | | | Adobe Systems, Inc. ● | | | 189 | |
| | 1 | | | Akamai Technologies, Inc. ● | | | 61 | |
| | — | | | Alliance Data Systems Corp. ● | | | 86 | |
| | 1 | | | Autodesk, Inc. ● | | | 73 | |
| | 3 | | | Automatic Data Processing, Inc. | | | 216 | |
| | 2 | | | CA, Inc. | | | 52 | |
| | 1 | | | Citrix Systems, Inc. ● | | | 58 | |
| | 3 | | | Cognizant Technology Solutions Corp. ● | | | 168 | |
| | 1 | | | Computer Sciences Corp. | | | 52 | |
| | 6 | | | eBay, Inc. ● | | | 323 | |
| | 2 | | | Electronic Arts, Inc. ● | | | 64 | |
| | 10 | | | Facebook, Inc. ● | | | 654 | |
| | 2 | | | Fidelity National Information Services, Inc. | | | 89 | |
| | 1 | | | Fiserv, Inc. ● | | | 85 | |
| | 2 | | | Google, Inc. Class A ● | | | 937 | |
| | 2 | | | Google, Inc. Class C ● | | | 922 | |
| | 5 | | | IBM Corp. | | | 975 | |
| | 2 | | | Intuit, Inc. | | | 129 | |
| | 6 | | | Mastercard, Inc. | | | 417 | |
| | 43 | | | Microsoft Corp. | | | 1,773 | |
| | 19 | | | Oracle Corp. | | | 787 | |
| | 2 | | | Paychex, Inc. | | | 76 | |
| | 1 | | | Red Hat, Inc. ● | | | 59 | |
| | 3 | | | Salesforce.com, Inc. ● | | | 186 | |
| | 4 | | | Symantec Corp. | | | 90 | |
| | 1 | | | Teradata Corp. ● | | | 36 | |
| | 1 | | | Total System Services, Inc. | | | 30 | |
| | 1 | | | VeriSign, Inc. ● | | | 34 | |
| | 3 | | | Visa, Inc. | | | 599 | |
| | 3 | | | Western Union Co. | | | 53 | |
| | 6 | | | Xerox Corp. | | | 77 | |
| | 5 | | | Yahoo!, Inc. ● | | | 186 | |
| | | | | | | | 9,825 | |
| | | | | Technology Hardware and Equipment - 1.5% | | | | |
| | 1 | | | Allegion plc | | | 29 | |
| | 1 | | | Amphenol Corp. Class A | | | 86 | |
| | 34 | | | Apple, Inc. | | | 3,169 | |
| | 29 | | | Cisco Systems, Inc. | | | 720 | |
The accompanying notes are an integral part of these financial statements.
| Hartford Portfolio Diversifier HLS Fund |
| Schedule of Investments – (continued) |
| June 30, 2014 (Unaudited) |
| (000’s Omitted) |
| Shares or Principal Amount | | Market Value ╪ | |
| Common Stocks - 22.4% - (continued) |
| | | | | Technology Hardware and Equipment - 1.5% - (continued) | | | | |
| | 7 | | | Corning, Inc. | | $ | 162 | |
| | 12 | | | EMC Corp. | | | 305 | |
| | — | | | F5 Networks, Inc. ● | | | 48 | |
| | 1 | | | FLIR Systems, Inc. | | | 28 | |
| | 1 | | | Harris Corp. | | | 46 | |
| | 11 | | | Hewlett-Packard Co. | | | 356 | |
| | 1 | | | Jabil Circuit, Inc. | | | 22 | |
| | 3 | | | Juniper Networks, Inc. ● | | | 66 | |
| | 1 | | | Motorola Solutions, Inc. | | | 85 | |
| | 2 | | | NetApp, Inc. | | | 68 | |
| | 10 | | | Qualcomm, Inc. | | | 756 | |
| | 1 | | | SanDisk Corp. | | | 133 | |
| | 2 | | | Seagate Technology plc | | | 105 | |
| | 2 | | | TE Connectivity Ltd. | | | 143 | |
| | 1 | | | Western Digital Corp. | | | 109 | |
| | | | | | | | 6,436 | |
| | | | | Telecommunication Services - 0.6% | | | | |
| | 29 | | | AT&T, Inc. | | | 1,038 | |
| | 3 | | | CenturyLink, Inc. | | | 117 | |
| | 2 | | | Crown Castle International Corp. | | | 140 | |
| | 6 | | | Frontier Communications Co. | | | 33 | |
| | 23 | | | Verizon Communications, Inc. | | | 1,146 | |
| | 3 | | | Windstream Holdings, Inc. | | | 34 | |
| | | | | | | | 2,508 | |
| | | | | Transportation - 0.5% | | | | |
| | 1 | | | C.H. Robinson Worldwide, Inc. | | | 54 | |
| | 6 | | | CSX Corp. | | | 175 | |
| | 5 | | | Delta Air Lines, Inc. | | | 186 | |
| | 1 | | | Expeditors International of Washington, Inc. | | | 49 | |
| | 2 | | | FedEx Corp. | | | 238 | |
| | 1 | | | Kansas City Southern | | | 67 | |
| | 2 | | | Norfolk Southern Corp. | | | 180 | |
| | — | | | Ryder System, Inc. | | | 26 | |
| | 4 | | | Southwest Airlines Co. | | | 105 | |
| | 5 | | | Union Pacific Corp. | | | 511 | |
| | 4 | | | United Parcel Service, Inc. Class B | | | 409 | |
| | | | | | | | 2,000 | |
| | | | | Utilities - 0.7% | | | | |
| | 4 | | | AES (The) Corp. | | | 58 | |
| | 1 | | | AGL Resources, Inc. | | | 37 | |
| | 1 | | | Ameren Corp. | | | 56 | |
| | 3 | | | American Electric Power Co., Inc. | | | 154 | |
| | 2 | | | CenterPoint Energy, Inc. | | | 62 | |
| | 2 | | | CMS Energy Corp. | | | 48 | |
| | 2 | | | Consolidated Edison, Inc. | | | 96 | |
| | 3 | | | Dominion Resources, Inc. | | | 235 | |
| | 1 | | | DTE Energy Co. | | | 78 | |
| | 4 | | | Duke Energy Corp. | | | 297 | |
| | 2 | | | Edison International | | | 107 | |
| | 1 | | | Entergy Corp. | | | 83 | |
| | 5 | | | Exelon Corp. | | | 177 | |
| | 2 | | | FirstEnergy Corp. | | | 82 | |
| | — | | | Integrys Energy Group, Inc. | | | 32 | |
| | 2 | | | NextEra Energy, Inc. | | | 253 | |
| | 2 | | | NiSource, Inc. | | | 70 | |
| | 2 | | | Northeast Utilities | | | 84 | |
| | 2 | | | NRG Energy, Inc. | | | 71 | |
| | 1 | | | Oneok, Inc. | | | 80 | |
| | 1 | | | Pepco Holdings, Inc. | | | 39 | |
| | 3 | | | PG&E Corp. | | | 126 | |
| | 1 | | | Pinnacle West Capital Corp. | | | 36 | |
| | 4 | | | PPL Corp. | | | 127 | |
| | 3 | | | Public Service Enterprise Group, Inc. | | | 117 | |
| | 1 | | | SCANA Corp. | | | 43 | |
| | 1 | | | Sempra Energy | | | 135 | |
| | 5 | | | Southern Co. | | | 229 | |
| | 1 | | | TECO Energy, Inc. | | | 21 | |
| | 1 | | | Wisconsin Energy Corp. | | | 60 | |
| | 3 | | | Xcel Energy, Inc. | | | 92 | |
| | | | | | | | 3,185 | |
| | | | | Total Common Stocks | | | | |
| | | | | ( Cost $74,972) | | $ | 98,476 | |
| | | | | | | | | |
| Exchange Traded Funds - 0.2% | | |
| | | | | Diversified Financials - 0.2% | | | | |
| | 4 | | | Vanguard S&P 500 ETF | | $ | 710 | |
| | | | | | | | | |
| | | | | Total Exchange Traded Funds | | | | |
| | | | | (Cost $705) | | $ | 710 | |
| | | | | | | | | |
| Asset and Commercial Mortgage Backed Securities - 0.7% | | | | |
| | | | | Finance and Insurance - 0.7% | | | | |
| | | | | Ally Automotive Receivables Trust | | | | |
| $ | 6 | | | 0.93%, 02/16/2016 | | $ | 6 | |
| | | | | Banc of America Commercial Mortgage, Inc. | | | | |
| | 25 | | | 5.41%, 09/10/2047 | | | 27 | |
| | 25 | | | 5.45%, 01/15/2049 | | | 27 | |
| | 20 | | | 5.49%, 02/10/2051 Δ | | | 22 | |
| | 30 | | | 5.59%, 06/10/2049 Δ | | | 33 | |
| | 60 | | | 5.68%, 07/10/2046 | | | 65 | |
| | 15 | | | 5.73%, 05/10/2045 Δ | | | 16 | |
| | 8 | | | 5.75%, 02/10/2051 Δ | | | 9 | |
| | 25 | | | 5.89%, 07/10/2044 Δ | | | 26 | |
| | | | | Bear Stearns Commercial Mortgage Securities, Inc. | | | | |
| | 60 | | | 5.20%, 12/11/2038 | | | 65 | |
| | 24 | | | 5.33%, 02/11/2044 | | | 26 | |
| | 60 | | | 5.41%, 12/11/2040 | | | 62 | |
| | 25 | | | 5.70%, 06/13/2050 | | | 28 | |
| | 60 | | | 5.71%, 06/11/2040 Δ | | | 67 | |
| | | | | Chase Issuance Trust | | | | |
| | 150 | | | 0.79%, 06/15/2017 | | | 151 | |
| | 100 | | | 1.30%, 02/18/2020 | | | 99 | |
| | | | | Citibank Credit Card Issuance Trust | | | | |
| | 110 | | | 4.85%, 03/10/2017 | | | 113 | |
| | 100 | | | 5.65%, 09/20/2019 | | | 114 | |
| | | | | Citigroup Commercial Mortgage Trust | | | | |
| | 35 | | | 5.71%, 12/10/2049 Δ | | | 39 | |
| | 20 | | | 6.14%, 12/10/2049 Δ | | | 22 | |
| | | | | Citigroup/Deutsche Bank Commercial Mortgage Trust | | | | |
| | 25 | | | 5.32%, 12/11/2049 | | | 27 | |
| | 34 | | | 5.40%, 07/15/2044 Δ | | | 35 | |
| | 24 | | | 5.62%, 10/15/2048 | | | 26 | |
| | 34 | | | 5.89%, 11/15/2044 | | | 38 | |
| | | | | Commercial Mortgage Pass-Through Certificates | | | | |
| | 30 | | | 3.15%, 08/15/2045 | | | 30 | |
| | 20 | | | 5.31%, 12/10/2046 | | | 22 | |
| | 24 | | | 5.75%, 06/10/2046 Δ | | | 25 | |
| | 15 | | | 5.79%, 12/10/2049 Δ | | | 17 | |
The accompanying notes are an integral part of these financial statements.
| Hartford Portfolio Diversifier HLS Fund |
| Schedule of Investments – (continued) |
| June 30, 2014 (Unaudited) |
| (000’s Omitted) |
| Shares or Principal Amount | | Market Value ╪ | |
| Asset and Commercial Mortgage Backed Securities - 0.7% - (continued) |
| | | | | Finance and Insurance - 0.7% - (continued) | | | | |
| | | | | Community or Commercial Mortgage Trust | | | | |
| $ | 15 | | | 2.94%, 01/10/2046 | | $ | 15 | |
| | | | | Credit Suisse Mortgage Capital Certificates | | | | |
| | 50 | | | 5.46%, 02/15/2039 Δ | | | 53 | |
| | 28 | | | 5.47%, 09/15/2039 | | | 30 | |
| | 24 | | | 5.68%, 06/15/2039 Δ | | | 26 | |
| | | | | CS First Boston Mortgage Securities Corp. | | | | |
| | 78 | | | 5.10%, 08/15/2038 | | | 81 | |
| | | | | CW Capital Cobalt Ltd. | | | | |
| | 38 | | | 5.22%, 08/15/2048 | | | 41 | |
| | 24 | | | 5.48%, 04/15/2047 | | | 26 | |
| | 23 | | | 5.77%, 05/15/2046 Δ | | | 25 | |
| | | | | Ford Credit Automotive Owner Trust | | | | |
| | 100 | | | 0.78%, 05/15/2018 | | | 100 | |
| | | | | GE Capital Commercial Mortgage Corp. | | | | |
| | 30 | | | 5.54%, 12/10/2049 | | | 33 | |
| | | | | Greenwich Capital Commercial Funding Corp. | | | | |
| | 40 | | | 5.22%, 04/10/2037 Δ | | | 41 | |
| | 35 | | | 5.44%, 03/10/2039 Δ | | | 38 | |
| | 25 | | | 5.74%, 12/10/2049 | | | 28 | |
| | 49 | | | 5.82%, 07/10/2038 Δ | | | 52 | |
| | | | | GS Mortgage Securities Trust | | | | |
| | 10 | | | 2.94%, 02/10/2046 | | | 10 | |
| | 40 | | | 3.14%, 06/10/2046 | | | 40 | |
| | 50 | | | 3.38%, 05/10/2045 | | | 52 | |
| | 20 | | | 3.48%, 01/10/2045 | | | 21 | |
| | 33 | | | 4.75%, 07/10/2039 | | | 34 | |
| | 25 | | | 5.56%, 11/10/2039 | | | 27 | |
| | 41 | | | 5.80%, 08/10/2045 Δ | | | 45 | |
| | | | | Honda Automotive Receivables Owner Trust | | | | |
| | 34 | | | 0.77%, 01/15/2016 | | | 34 | |
| | | | | JP Morgan Chase Commercial Mortgage Securities Corp. | | | | |
| | 10 | | | 4.17%, 08/15/2046 | | | 11 | |
| | 25 | | | 5.24%, 12/15/2044 Δ | | | 26 | |
| | 25 | | | 5.34%, 05/15/2047 | | | 27 | |
| | 19 | | | 5.42%, 01/15/2049 | | | 21 | |
| | 34 | | | 5.44%, 06/12/2047 Δ | | | 38 | |
| | 19 | | | 5.48%, 12/12/2044 Δ | | | 20 | |
| | 38 | | | 5.79%, 02/12/2051 Δ | | | 42 | |
| | 25 | | | 5.80%, 06/15/2049 Δ | | | 27 | |
| | 100 | | | 5.86%, 04/15/2045 Δ | | | 108 | |
| | | | | LB-UBS Commercial Mortgage Trust | | | | |
| | 25 | | | 5.37%, 09/15/2039 Δ | | | 27 | |
| | 59 | | | 5.42%, 02/15/2040 | | | 65 | |
| | 10 | | | 5.84%, 06/15/2038 Δ | | | 10 | |
| | 15 | | | 5.87%, 09/15/2045 | | | 17 | |
| | | | | Merrill Lynch/Countrywide Commercial Mortgage Trust | | | | |
| | 25 | | | 5.17%, 12/12/2049 Δ | | | 27 | |
| | 25 | | | 5.38%, 08/12/2048 | | | 27 | |
| | 40 | | | 5.70%, 09/12/2049 | | | 44 | |
| | 35 | | | 5.87%, 06/12/2046 Δ | | | 38 | |
| | | | | Morgan Stanley Capital I | | | | |
| | 80 | | | 4.99%, 08/13/2042 | | | 82 | |
| | 48 | | | 5.33%, 12/15/2043 | | | 52 | |
| | 34 | | | 5.65%, 10/15/2042 Δ | | | 36 | |
| | 25 | | | 5.69%, 04/15/2049 Δ | | | 28 | |
| | | | | Morgan Stanley Capital Investments | | | | |
| | 25 | | | 5.81%, 12/12/2049 | | | 28 | |
| | | | | Wachovia Bank Commercial Mortgage Trust | | | | |
| 25 | | | 5.28%, 12/15/2044 Δ | | | 26 | |
| | 25 | | | 5.31%, 11/15/2048 | | | 27 | |
| | 25 | | | 5.34%, 12/15/2043 | | | 27 | |
| | 21 | | | 5.42%, 01/15/2045 Δ | | | 22 | |
| | 25 | | | 5.51%, 04/15/2047 | | | 27 | |
| | 38 | | | 5.57%, 10/15/2048 | | | 40 | |
| | 25 | | | 5.68%, 05/15/2046 | | | 28 | |
| | 25 | | | 5.75%, 06/15/2049 Δ | | | 27 | |
| | | | | WF-RBS Commercial Mortgage Trust | | | | |
| | 40 | | | 2.88%, 12/15/2045 | | | 39 | |
| | | | | | | | 3,153 | |
| | | | | | | | | |
| | | | | Total Asset and Commercial Mortgage Backed Securities | | | | |
| | | | | (Cost $3,140) | | $ | 3,153 | |
| | | | | | | | | |
| Corporate Bonds - 11.9% |
| | | | | Administrative Waste Management and Remediation - 0.1% | | | | |
| | | | | Republic Services, Inc. | | | | |
| $ | 95 | | | 5.00%, 03/01/2020 | | $ | 107 | |
| | | | | Waste Management, Inc. | | | | |
| | 105 | | | 4.75%, 06/30/2020 | | | 117 | |
| | | | | | | | 224 | |
| | | | | Agriculture, Forestry, Fishing and Hunting - 0.0% | | | | |
| | | | | Weyerhaeuser Co. | | | | |
| | 40 | | | 7.38%, 03/15/2032 | | | 54 | |
| | | | | | | | | |
| | | | | Arts, Entertainment and Recreation - 0.5% | | | | |
| | | | | CBS Corp. | | | | |
| | 25 | | | 7.88%, 07/30/2030 | | | 34 | |
| | | | | Comcast Corp. | | | | |
| | 90 | | | 4.65%, 07/15/2042 | | | 93 | |
| | 305 | | | 5.15%, 03/01/2020 | | | 350 | |
| | 55 | | | 7.05%, 03/15/2033 | | | 74 | |
| | | | | DirecTV Holdings LLC | | | | |
| | 30 | | | 3.50%, 03/01/2016 | | | 31 | |
| | 145 | | | 5.00%, 03/01/2021 | | | 162 | |
| | 25 | | | 5.15%, 03/15/2042 | | | 26 | |
| | | | | Discovery Communications, Inc. | | | | |
| | 50 | | | 4.88%, 04/01/2043 | | | 50 | |
| | 85 | | | 5.05%, 06/01/2020 | | | 96 | |
| | | | | NBC Universal Media LLC | | | | |
| | 125 | | | 4.38%, 04/01/2021 | | | 138 | |
| | | | | News America, Inc. | | | | |
| | 155 | | | 4.50%, 02/15/2021 | | | 170 | |
| | 106 | | | 6.40%, 12/15/2035 | | | 132 | |
| | | | | Time Warner Cable, Inc. | | | | |
| | 345 | | | 4.00%, 09/01/2021 | | | 368 | |
| | 65 | | | 6.75%, 07/01/2018 | | | 77 | |
| | | | | Time Warner, Inc. | | | | |
| | 130 | | | 4.88%, 03/15/2020 | | | 145 | |
| | 160 | | | 6.50%, 11/15/2036 | | | 196 | |
| | | | | Viacom, Inc. | | | | |
| | 88 | | | 4.38%, 03/15/2043 | | | 82 | |
| | | | | Walt Disney Co. | | | | |
| | 35 | | | 4.13%, 12/01/2041 | | | 35 | |
| | 50 | | | 5.63%, 09/15/2016 | | | 55 | |
| | | | | | | | 2,314 | |
The accompanying notes are an integral part of these financial statements.
| Hartford Portfolio Diversifier HLS Fund |
| Schedule of Investments – (continued) |
| June 30, 2014 (Unaudited) |
| (000’s Omitted) |
| Shares or Principal Amount | | Market Value ╪ | |
| Corporate Bonds - 11.9% - (continued) |
| | | | | Beverage and Tobacco Product Manufacturing - 0.4% | | | | |
| | | | | Altria Group, Inc. | | | | |
| $ | 360 | | | 4.75%, 05/05/2021 | | $ | 397 | |
| | 6 | | | 9.70%, 11/10/2018 | | | 8 | |
| | | | | Anheuser-Busch InBev Worldwide, Inc. | | | | |
| | 95 | | | 3.75%, 07/15/2042 | | | 87 | |
| | 325 | | | 5.38%, 01/15/2020 | | | 375 | |
| | | | | Coca-Cola Co. | | | | |
| | 340 | | | 1.65%, 03/14/2018 | | | 344 | |
| | 30 | | | 3.15%, 11/15/2020 | | | 31 | |
| | | | | Diageo Capital plc | | | | |
| | 50 | | | 3.88%, 04/29/2043 | | | 46 | |
| | 75 | | | 5.50%, 09/30/2016 | | | 83 | |
| | | | | Dr. Pepper Snapple Group | | | | |
| | 40 | | | 2.90%, 01/15/2016 | | | 41 | |
| | | | | PepsiCo, Inc. | | | | |
| | 180 | | | 3.13%, 11/01/2020 | | | 188 | |
| | 30 | | | 5.50%, 01/15/2040 | | | 35 | |
| | | | | Philip Morris International, Inc. | | | | |
| | 215 | | | 4.50%, 03/26/2020 - 03/20/2042 | | | 235 | |
| | | | | | | | 1,870 | |
| | | | | Chemical Manufacturing - 0.2% | | | | |
| | | | | CF Industries Holdings, Inc. | | | | |
| | 50 | | | 4.95%, 06/01/2043 | | | 50 | |
| | | | | Dow Chemical Co. | | | | |
| | 200 | | | 4.13%, 11/15/2021 | | | 214 | |
| | 90 | | | 8.55%, 05/15/2019 | | | 116 | |
| | | | | E.I. DuPont de Nemours & Co. | | | | |
| | 160 | | | 3.63%, 01/15/2021 | | | 169 | |
| | 20 | | | 5.60%, 12/15/2036 | | | 24 | |
| | | | | Ecolab, Inc. | | | | |
| | 95 | | | 4.35%, 12/08/2021 | | | 104 | |
| | | | | Potash Corp. of Saskatchewan, Inc. | | | | |
| | 35 | | | 6.50%, 05/15/2019 | | | 42 | |
| | | | | PPG Industries, Inc. | | | | |
| | 20 | | | 3.60%, 11/15/2020 | | | 21 | |
| | | | | Praxair, Inc. | | | | |
| | 55 | | | 2.45%, 02/15/2022 | | | 53 | |
| | 25 | | | 5.38%, 11/01/2016 | | | 28 | |
| | | | | | | | 821 | |
| | | | | Computer and Electronic Product Manufacturing - 0.4% | | | | |
| | | | | Apple, Inc. | | | | |
| | 360 | | | 2.40%, 05/03/2023 | | | 340 | |
| | | | | Cingular Wireless LLC | | | | |
| | 25 | | | 7.13%, 12/15/2031 | | | 33 | |
| | | | | Cisco Systems, Inc. | | | | |
| | 320 | | | 4.45%, 01/15/2020 | | | 355 | |
| | 40 | | | 5.50%, 02/22/2016 | | | 43 | |
| | | | | EMC Corp. | | | | |
| | 110 | | | 2.65%, 06/01/2020 | | | 111 | |
| | | | | Hewlett-Packard Co. | | | | |
| | 45 | | | 4.30%, 06/01/2021 | | | 48 | |
| | 250 | | | 5.50%, 03/01/2018 | | | 283 | |
| | | | | Intel Corp. | | | | |
| | 90 | | | 2.70%, 12/15/2022 | | | 87 | |
| | 100 | | | 3.30%, 10/01/2021 | | | 104 | |
| | | | | Lockheed Martin Corp. | | | | |
| | 140 | | | 4.25%, 11/15/2019 | | | 155 | |
| | 15 | | | 4.85%, 09/15/2041 | | | 16 | |
| | | | | Raytheon Co. | | | | |
| | 95 | | | 3.13%, 10/15/2020 | | | 98 | |
| | | | | Texas Instruments, Inc. | | | | |
| 25 | | | 2.38%, 05/16/2016 | | | 26 | |
| | | | | Thermo Fisher Scientific, Inc. | | | | |
| | 155 | | | 2.25%, 08/15/2016 | | | 159 | |
| | 100 | | | 4.15%, 02/01/2024 | | | 104 | |
| | | | | | | | 1,962 | |
| | | | | Construction - 0.0% | | | | |
| | | | | CRH America, Inc. | | | | |
| | 125 | | | 6.00%, 09/30/2016 | | | 139 | |
| | | | | | | | | |
| | | | | Couriers and Messengers - 0.0% | | | | |
| | | | | United Parcel Service, Inc. | | | | |
| | 110 | | | 3.13%, 01/15/2021 | | | 115 | |
| | | | | | | | | |
| | | | | Educational Services - 0.0% | | | | |
| | | | | Princeton University | | | | |
| | 75 | | | 4.95%, 03/01/2019 | | | 85 | |
| | | | | | | | | |
| | | | | Electrical Equipment and Appliance Manufacturing - 0.1% | | | | |
| | | | | Emerson Electric Co. | | | | |
| | 70 | | | 4.88%, 10/15/2019 | | | 80 | |
| | | | | General Electric Co. | | | | |
| | 107 | | | 4.13%, 10/09/2042 | | | 106 | |
| | 120 | | | 5.25%, 12/06/2017 | | | 135 | |
| | | | | Koninklijke Philips Electronics N.V. | | | | |
| | 58 | | | 6.88%, 03/11/2038 | | | 78 | |
| | | | | | | | 399 | |
| | | | | Finance and Insurance - 4.6% | | | | |
| | | | | ACE INA Holdings, Inc. | | | | |
| | 115 | | | 2.70%, 03/13/2023 | | | 111 | |
| | | | | Aetna, Inc. | | | | |
| | 165 | | | 3.95%, 09/01/2020 | | | 179 | |
| | | | | Allstate (The) Corp. | | | | |
| | 75 | | | 5.55%, 05/09/2035 | | | 89 | |
| | | | | American Express Co. | | | | |
| | 153 | | | 2.65%, 12/02/2022 | | | 149 | |
| | | | | American Express Credit Corp. | | | | |
| | 195 | | | 2.75%, 09/15/2015 | | | 200 | |
| | | | | American International Group, Inc. | | | | |
| | 350 | | | 6.40%, 12/15/2020 | | | 423 | |
| | | | | Aon Corp. | | | | |
| | 20 | | | 5.00%, 09/30/2020 | | | 22 | |
| | | | | Asian Development Bank | | | | |
| | 100 | | | 1.75%, 09/11/2018 | | | 102 | |
| | 265 | | | 2.50%, 03/15/2016 | | | 274 | |
| | | | | Bank of America Corp. | | | | |
| | 160 | | | 3.30%, 01/11/2023 | | | 158 | |
| | 445 | | | 5.00%, 05/13/2021 | | | 497 | |
| | 560 | | | 5.65%, 05/01/2018 | | | 635 | |
| | 30 | | | 5.88%, 02/07/2042 | | | 35 | |
| | | | | Bank of Montreal | | | | |
| | 150 | | | 1.45%, 04/09/2018 | | | 149 | |
| | | | | Bank of New York Mellon Corp. | | | | |
| | 135 | | | 2.30%, 07/28/2016 | | | 139 | |
| | 50 | | | 3.55%, 09/23/2021 | | | 53 | |
| | | | | Bank of Nova Scotia | | | | |
| | 95 | | | 4.38%, 01/13/2021 | | | 105 | |
| | | | | Barclays Bank plc | | | | |
| | 250 | | | 5.00%, 09/22/2016 | | | 272 | |
The accompanying notes are an integral part of these financial statements.
| Hartford Portfolio Diversifier HLS Fund |
| Schedule of Investments – (continued) |
| June 30, 2014 (Unaudited) |
| (000’s Omitted) |
| Shares or Principal Amount | | Market Value ╪ | |
| Corporate Bonds - 11.9% - (continued) |
| | | | | Finance and Insurance - 4.6% - (continued) | | | | |
| | | | | BB&T Corp. | | | | |
| $ | 80 | | | 3.20%, 03/15/2016 | | $ | 83 | |
| | 130 | | | 5.25%, 11/01/2019 | | | 148 | |
| | | | | Berkshire Hathaway Finance Corp. | | | | |
| | 75 | | | 4.50%, 02/11/2043 | | | 77 | |
| | 225 | | | 5.40%, 05/15/2018 | | | 258 | |
| | | | | BlackRock, Inc. | | | | |
| | 105 | | | 5.00%, 12/10/2019 | | | 120 | |
| | | | | BP Capital Markets plc | | | | |
| | 160 | | | 2.25%, 11/01/2016 | | | 165 | |
| | 135 | | | 3.25%, 05/06/2022 | | | 137 | |
| | | | | Capital One Financial Corp. | | | | |
| | 140 | | | 4.75%, 07/15/2021 | | | 156 | |
| | 110 | | | 6.15%, 09/01/2016 | | | 121 | |
| | | | | Chubb Corp. | | | | |
| | 90 | | | 5.75%, 05/15/2018 | | | 103 | |
| | | | | CIGNA Corp. | | | | |
| | 100 | | | 4.00%, 02/15/2022 | | | 106 | |
| | 10 | | | 5.38%, 02/15/2042 | | | 12 | |
| | | | | Citigroup, Inc. | | | | |
| | 40 | | | 3.38%, 03/01/2023 | | | 40 | |
| | 100 | | | 4.45%, 01/10/2017 | | | 108 | |
| | 605 | | | 5.38%, 08/09/2020 | | | 693 | |
| | 105 | | | 6.63%, 06/15/2032 | | | 126 | |
| | | | | Credit Suisse New York | | | | |
| | 110 | | | 5.30%, 08/13/2019 | | | 126 | |
| | | | | Deutsche Bank AG London | | | | |
| | 110 | | | 3.25%, 01/11/2016 | | | 114 | |
| | 70 | | | 3.70%, 05/30/2024 | | | 70 | |
| | | | | European Bank for Reconstruction & Development | | | | |
| | 285 | | | 2.50%, 03/15/2016 | | | 295 | |
| | | | | European Investment Bank | | | | |
| | 695 | | | 1.25%, 10/14/2016 | | | 705 | |
| | 485 | | | 2.88%, 09/15/2020 | | | 506 | |
| | | | | Fifth Third Bancorp | | | | |
| | 100 | | | 3.50%, 03/15/2022 | | | 103 | |
| | 35 | | | 3.63%, 01/25/2016 | | | 37 | |
| | | | | Ford Motor Credit Co. LLC | | | | |
| | 270 | | | 6.63%, 08/15/2017 | | | 311 | |
| | | | | General Electric Capital Corp. | | | | |
| | 455 | | | 4.38%, 09/16/2020 | | | 503 | |
| | 525 | | | 5.30%, 02/11/2021 | | | 597 | |
| | | | | Goldman Sachs Group, Inc. | | | | |
| | 605 | | | 5.38%, 03/15/2020 | | | 685 | |
| | 169 | | | 6.25%, 02/01/2041 | | | 206 | |
| | | | | HCP, Inc. | | | | |
| | 160 | | | 6.70%, 01/30/2018 | | | 187 | |
| | | | | Health Care REIT, Inc. | | | | |
| | 40 | | | 3.75%, 03/15/2023 | | | 40 | |
| | 55 | | | 5.25%, 01/15/2022 | | | 62 | |
| | | | | HSBC Finance Corp. | | | | |
| | 160 | | | 6.68%, 01/15/2021 | | | 191 | |
| | | | | HSBC Holdings plc | | | | |
| | 570 | | | 5.10%, 04/05/2021 | | | 648 | |
| | | | | Inter-American Development Bank | | | | |
| | 145 | | | 2.25%, 07/15/2015 | | | 148 | |
| | 310 | | | 3.88%, 02/14/2020 | | | 342 | |
| | | | | John Deere Capital Corp. | | | | |
| | 105 | | | 1.85%, 09/15/2016 | | | 107 | |
| | 165 | | | 2.80%, 09/18/2017 | | | 173 | |
| | | | | JP Morgan Chase & Co. | | | | |
| 715 | | | 4.95%, 03/25/2020 | | | 805 | |
| | 80 | | | 6.00%, 01/15/2018 | | | 92 | |
| | 365 | | | 6.30%, 04/23/2019 | | | 431 | |
| | | | | KeyCorp | | | | |
| | 70 | | | 3.75%, 08/13/2015 | | | 72 | |
| | | | | Kreditanstalt fuer Wiederaufbau | | | | |
| | 450 | | | 1.25%, 10/26/2015 - 02/15/2017 | | | 456 | |
| | 185 | | | 2.63%, 01/25/2022 | | | 188 | |
| | 491 | | | 4.00%, 01/27/2020 | | | 545 | |
| | | | | Landwirtschaftliche Rentenbank | | | | |
| | 180 | | | 2.50%, 02/15/2016 | | | 186 | |
| | 100 | | | 3.13%, 07/15/2015 | | | 103 | |
| | | | | Lincoln National Corp. | | | | |
| | 60 | | | 4.00%, 09/01/2023 | | | 62 | |
| | 60 | | | 4.85%, 06/24/2021 | | | 67 | |
| | | | | LYB Internantional Finance B.V. | | | | |
| | 100 | | | 4.00%, 07/15/2023 | | | 105 | |
| | 30 | | | 4.88%, 03/15/2044 | | | 31 | |
| | | | | Marsh & McLennan Cos., Inc. | | | | |
| | 35 | | | 4.80%, 07/15/2021 | | | 39 | |
| | | | | MetLife, Inc. | | | | |
| | 90 | | | 5.70%, 06/15/2035 | | | 109 | |
| | 120 | | | 7.72%, 02/15/2019 | | | 149 | |
| | | | | Morgan Stanley | | | | |
| | 200 | | | 5.45%, 01/09/2017 | | | 220 | |
| | 505 | | | 5.50%, 07/28/2021 | | | 580 | |
| | | | | National Rural Utilities Cooperative Finance Corp. | | | | |
| | 110 | | | 3.05%, 02/15/2022 | | | 112 | |
| | 30 | | | 5.45%, 04/10/2017 | | | 33 | |
| | | | | Nomura Holdings, Inc. | | | | |
| | 130 | | | 4.13%, 01/19/2016 | | | 136 | |
| | | | | Nordic Investment Bank | | | | |
| | 100 | | | 2.50%, 07/15/2015 | | | 102 | |
| | | | | Oesterreichische Kontrollbank AG | | | | |
| | 95 | | | 4.88%, 02/16/2016 | | | 102 | |
| | | | | PNC Funding Corp. | | | | |
| | 70 | | | 2.70%, 09/19/2016 | | | 73 | |
| | 70 | | | 3.30%, 03/08/2022 | | | 71 | |
| | 150 | | | 5.13%, 02/08/2020 | | | 171 | |
| | | | | Principal Financial Group, Inc. | | | | |
| | 70 | | | 3.30%, 09/15/2022 | | | 70 | |
| | | | | Prudential Financial, Inc. | | | | |
| | 205 | | | 5.38%, 06/21/2020 | | | 235 | |
| | 25 | | | 5.80%, 11/16/2041 | | | 30 | |
| | | | | Rabobank Nederland | | | | |
| | 245 | | | 4.50%, 01/11/2021 | | | 269 | |
| | | | | Royal Bank of Canada | | | | |
| | 185 | | | 2.30%, 07/20/2016 | | | 191 | |
| | | | | Royal Bank of Scotland Group plc | | | | |
| | 35 | | | 6.13%, 01/11/2021 | | | 41 | |
| | | | | Simon Property Group L.P. | | | | |
| | 220 | | | 5.65%, 02/01/2020 | | | 257 | |
| | | | | State Street Corp. | | | | |
| | 80 | | | 4.38%, 03/07/2021 | | | 89 | |
| | | | | Toyota Motor Credit Corp. | | | | |
| | 70 | | | 2.00%, 10/24/2018 | | | 71 | |
| | 140 | | | 3.40%, 09/15/2021 | | | 146 | |
The accompanying notes are an integral part of these financial statements.
| Hartford Portfolio Diversifier HLS Fund |
| Schedule of Investments – (continued) |
| June 30, 2014 (Unaudited) |
| (000’s Omitted) |
| Shares or Principal Amount | | Market Value ╪ | |
| Corporate Bonds - 11.9% - (continued) |
| | | | | Finance and Insurance - 4.6% - (continued) | | | | |
| | | | | Travelers Cos., Inc. | | | | |
| $ | 140 | | | 3.90%, 11/01/2020 | | $ | 151 | |
| | 30 | | | 4.60%, 08/01/2043 | | | 32 | |
| | | | | U.S. Bancorp | | | | |
| | 110 | | | 2.45%, 07/27/2015 | | | 113 | |
| | 50 | | | 4.13%, 05/24/2021 | | | 54 | |
| | | | | UBS AG Stamford CT | | | | |
| | 100 | | | 5.88%, 07/15/2016 | | | 110 | |
| | | | | UnitedHealth Group, Inc. | | | | |
| | 125 | | | 6.88%, 02/15/2038 | | | 169 | |
| | | | | Wellpoint, Inc. | | | | |
| | 65 | | | 4.65%, 01/15/2043 | | | 66 | |
| | 135 | | | 5.25%, 01/15/2016 | | | 144 | |
| | | | | Wells Fargo & Co. | | | | |
| | 330 | | | 2.10%, 05/08/2017 | | | 338 | |
| | 70 | | | 3.50%, 03/08/2022 | | | 72 | |
| | 335 | | | 4.60%, 04/01/2021 | | | 373 | |
| | 45 | | | 5.61%, 01/15/2044 | | | 52 | |
| | | | | Westpac Banking Corp. | | | | |
| | 110 | | | 3.00%, 12/09/2015 | | | 114 | |
| | | | | | | | 20,428 | |
| | | | | Food Manufacturing - 0.2% | | | | |
| | | | | Archer-Daniels-Midland Co. | | | | |
| | 33 | | | 4.02%, 04/16/2043 | | | 32 | |
| | | | | ConAgra Foods, Inc. | | | | |
| | 20 | | | 4.65%, 01/25/2043 | | | 20 | |
| | 120 | | | 7.00%, 04/15/2019 | | | 144 | |
| | | | | General Mills, Inc. | | | | |
| | 80 | | | 5.65%, 02/15/2019 | | | 93 | |
| | | | | Kellogg Co. | | | | |
| | 45 | | | 4.00%, 12/15/2020 | | | 47 | |
| | | | | Kraft Foods Group, Inc. | | | | |
| | 50 | | | 5.00%, 06/04/2042 | | | 53 | |
| | 113 | | | 5.38%, 02/10/2020 | | | 129 | |
| | | | | Mondelez International, Inc. | | | | |
| | 200 | | | 4.00%, 02/01/2024 | | | 207 | |
| | | | | Unilever Capital Corp. | | | | |
| | 70 | | | 5.90%, 11/15/2032 | | | 91 | |
| | | | | | | | 816 | |
| | | | | Food Services - 0.0% | | | | |
| | | | | McDonald's Corp. | | | | |
| | 49 | | | 3.70%, 02/15/2042 | | | 45 | |
| | 80 | | | 5.35%, 03/01/2018 | | | 91 | |
| | | | | Yum! Brands, Inc. | | | | |
| | 7 | | | 6.88%, 11/15/2037 | | | 9 | |
| | | | | | | | 145 | |
| | | | | Health Care and Social Assistance - 0.8% | | | | |
| | | | | AbbVie, Inc. | | | | |
| | 265 | | | 2.90%, 11/06/2022 | | | 256 | |
| | | | | Amgen, Inc. | | | | |
| | 195 | | | 3.88%, 11/15/2021 | | | 206 | |
| | 87 | | | 5.75%, 03/15/2040 | | | 101 | |
| | | | | AstraZeneca plc | | | | |
| | 130 | | | 5.90%, 09/15/2017 | | | 149 | |
| | 35 | | | 6.45%, 09/15/2037 | | | 45 | |
| | | | | Baxter International, Inc. | | | | |
| | 130 | | | 2.40%, 08/15/2022 | | | 123 | |
| | 30 | | | 4.50%, 08/15/2019 | | | 33 | |
| | | | | Boston Scientific Corp. | | | | |
| | 70 | | | 6.00%, 01/15/2020 | | | 81 | |
| | | | | Bristol-Myers Squibb Co. | | | | |
| 25 | | | 3.25%, 08/01/2042 | | | 21 | |
| | | | | Celgene Corp. | | | | |
| | 30 | | | 3.25%, 08/15/2022 | | | 30 | |
| | | | | Covidien International Finance S.A. | | | | |
| | 45 | | | 3.20%, 06/15/2022 | | | 45 | |
| | 25 | | | 6.00%, 10/15/2017 | | | 29 | |
| | | | | CVS Caremark Corp. | | | | |
| | 110 | | | 6.13%, 09/15/2039 | | | 137 | |
| | | | | Eli Lilly & Co. | | | | |
| | 20 | | | 5.20%, 03/15/2017 | | | 22 | |
| | | | | Express Scripts Holding Co. | | | | |
| | 205 | | | 4.75%, 11/15/2021 | | | 227 | |
| | | | | Gilead Sciences, Inc. | | | | |
| | 110 | | | 3.70%, 04/01/2024 | | | 113 | |
| | 20 | | | 4.40%, 12/01/2021 | | | 22 | |
| | | | | GlaxoSmithKline Capital, Inc. | | | | |
| | 40 | | | 2.80%, 03/18/2023 | | | 39 | |
| | 180 | | | 5.65%, 05/15/2018 | | | 206 | |
| | 47 | | | 6.38%, 05/15/2038 | | | 61 | |
| | | | | Johnson & Johnson | | | | |
| | 75 | | | 2.15%, 05/15/2016 | | | 77 | |
| | 75 | | | 5.95%, 08/15/2037 | | | 98 | |
| | | | | McKesson Corp. | | | | |
| | 70 | | | 3.80%, 03/15/2024 | | | 71 | |
| | 50 | | | 4.75%, 03/01/2021 | | | 56 | |
| | | | | Medtronic, Inc. | | | | |
| | 15 | | | 4.00%, 04/01/2043 | | | 14 | |
| | 120 | | | 4.45%, 03/15/2020 | | | 133 | |
| | | | | Merck & Co., Inc. | | | | |
| | 65 | | | 3.60%, 09/15/2042 | | | 58 | |
| | 195 | | | 3.88%, 01/15/2021 | | | 211 | |
| | | | | Novartis Capital Corp. | | | | |
| | 140 | | | 2.40%, 09/21/2022 | | | 135 | |
| | | | | Novartis Securities Investment Ltd. | | | | |
| | 75 | | | 5.13%, 02/10/2019 | | | 85 | |
| | | | | Pfizer, Inc. | | | | |
| | 470 | | | 6.20%, 03/15/2019 | | | 558 | |
| | | | | Quest Diagnostics, Inc. | | | | |
| | 40 | | | 4.70%, 04/01/2021 | | | 43 | |
| | | | | Sanofi-Aventis S.A. | | | | |
| | 20 | | | 4.00%, 03/29/2021 | | | 22 | |
| | | | | Teva Pharmaceutical Finance IV B.V. | | | | |
| | 60 | | | 3.65%, 11/10/2021 | | | 62 | |
| | | | | Walgreen Co. | | | | |
| | 30 | | | 3.10%, 09/15/2022 | | | 29 | |
| | | | | | | | 3,598 | |
| | | | | Information - 0.8% | | | | |
| | | | | America Movil S.A.B. de C.V. | | | | |
| | 110 | | | 5.63%, 11/15/2017 | | | 124 | |
| | 95 | | | 6.13%, 11/15/2037 | | | 112 | |
| | | | | AT&T, Inc. | | | | |
| | 310 | | | 2.63%, 12/01/2022 | | | 297 | |
| | 84 | | | 4.35%, 06/15/2045 | | | 80 | |
| | 73 | | | 5.35%, 09/01/2040 | | | 79 | |
| | 200 | | | 5.80%, 02/15/2019 | | | 233 | |
| | | | | British Telecommunications plc | | | | |
| | 18 | | | 9.62%, 12/15/2030 Δ | | | 29 | |
| | | | | Deutsche Telekom International Finance B.V. | | | | |
| | 82 | | | 8.75%, 06/15/2030 | | | 120 | |
The accompanying notes are an integral part of these financial statements.
| Hartford Portfolio Diversifier HLS Fund |
| Schedule of Investments – (continued) |
| June 30, 2014 (Unaudited) |
| (000’s Omitted) |
| Shares or Principal Amount | | Market Value ╪ | |
| Corporate Bonds - 11.9% - (continued) |
| | | | | Information - 0.8% - (continued) | | | | |
| | | | | Google, Inc. | | | | |
| $ | 65 | | | 2.13%, 05/19/2016 | | $ | 67 | |
| | | | | Microsoft Corp. | | | | |
| | 150 | | | 1.63%, 09/25/2015 | | | 153 | |
| | 135 | | | 5.20%, 06/01/2039 | | | 153 | |
| | | | | Oracle Corp. | | | | |
| | 110 | | | 5.38%, 07/15/2040 | | | 125 | |
| | 120 | | | 5.75%, 04/15/2018 | | | 138 | |
| | | | | Orange S.A. | | | | |
| | 80 | | | 5.38%, 07/08/2019 | | | 91 | |
| | | | | Qwest Corp. | | | | |
| | 110 | | | 6.88%, 09/15/2033 | | | 111 | |
| | | | | Rogers Communications, Inc. | | | | |
| | 30 | | | 4.50%, 03/15/2043 | | | 29 | |
| | 50 | | | 6.80%, 08/15/2018 | | | 59 | |
| | | | | Telefonica Emisiones SAU | | | | |
| | 180 | | | 5.46%, 02/16/2021 | | | 204 | |
| | | | | Verizon Communications, Inc. | | | | |
| | 140 | | | 3.65%, 09/14/2018 | | | 150 | |
| | 310 | | | 5.15%, 09/15/2023 | | | 347 | |
| | 95 | | | 6.00%, 04/01/2041 | | | 111 | |
| | 300 | | | 6.35%, 04/01/2019 | | | 355 | |
| | 200 | | | 6.55%, 09/15/2043 | | | 251 | |
| | | | | Vodafone Group plc | | | | |
| | 195 | | | 5.45%, 06/10/2019 | | | 223 | |
| | 20 | | | 6.15%, 02/27/2037 | | | 24 | |
| | | | | | | | 3,665 | |
| | | | | Machinery Manufacturing - 0.1% | | | | |
| | | | | Baker Hughes, Inc. | | | | |
| | 46 | | | 5.13%, 09/15/2040 | | | 52 | |
| | | | | Caterpillar, Inc. | | | | |
| | 50 | | | 3.80%, 08/15/2042 | | | 46 | |
| | 185 | | | 3.90%, 05/27/2021 | | | 200 | |
| | | | | Deere & Co. | | | | |
| | 30 | | | 3.90%, 06/09/2042 | | | 29 | |
| | | | | Joy Global, Inc. | | | | |
| | 10 | | | 5.13%, 10/15/2021 | | | 11 | |
| | | | | Xerox Corp. | | | | |
| | 20 | | | 6.35%, 05/15/2018 | | | 23 | |
| | | | | | | | 361 | |
| | | | | Mining - 0.3% | | | | |
| | | | | Barrick Gold Corp. | | | | |
| | 25 | | | 5.25%, 04/01/2042 | | | 25 | |
| | 110 | | | 6.95%, 04/01/2019 | | | 131 | |
| | | | | BHP Billiton Finance USA Ltd. | | | | |
| | 80 | | | 3.85%, 09/30/2023 | | | 84 | |
| | 15 | | | 4.13%, 02/24/2042 | | | 15 | |
| | 110 | | | 6.50%, 04/01/2019 | | | 132 | |
| | | | | Freeport-McMoRan Copper & Gold, Inc. | | | | |
| | 220 | | | 3.88%, 03/15/2023 | | | 219 | |
| | | | | Newmont Mining Corp. | | | | |
| | 38 | | | 6.25%, 10/01/2039 | | | 40 | |
| | | | | Rio Tinto Finance USA Ltd. | | | | |
| | 145 | | | 3.75%, 09/20/2021 | | | 153 | |
| | 170 | | | 6.50%, 07/15/2018 | | | 200 | |
| | | | | Southern Copper Corp. | | | | |
| | 55 | | | 6.75%, 04/16/2040 | | | 60 | |
| | | | | Teck Resources Ltd. | | | | |
| | 40 | | | 4.50%, 01/15/2021 | | | 42 | |
| | 30 | | | 5.40%, 02/01/2043 | | | 30 | |
| | | | | Vale Overseas Ltd. | | | | |
| 190 | | | 6.25%, 01/23/2017 | | | 213 | |
| | 90 | | | 6.88%, 11/10/2039 | | | 100 | |
| | | | | | | | 1,444 | |
| | | | | Miscellaneous Manufacturing - 0.2% | | | | |
| | | | | 3M Co. | | | | |
| | 75 | | | 1.38%, 09/29/2016 | | | 76 | |
| | 25 | | | 5.70%, 03/15/2037 | | | 31 | |
| | | | | Boeing Co. | | | | |
| | 200 | | | 4.88%, 02/15/2020 | | | 228 | |
| | | | | Honeywell International, Inc. | | | | |
| | 100 | | | 4.25%, 03/01/2021 | | | 111 | |
| | | | | Northrop Grumman Corp. | | | | |
| | 60 | | | 4.75%, 06/01/2043 | | | 63 | |
| | 20 | | | 5.05%, 08/01/2019 | | | 22 | |
| | | | | United Technologies Corp. | | | | |
| | 150 | | | 4.50%, 04/15/2020 - 06/01/2042 | | | 162 | |
| | 195 | | | 6.13%, 02/01/2019 | | | 230 | |
| | | | | | | | 923 | |
| | | | | Motor Vehicle and Parts Manufacturing - 0.1% | | | | |
| | | | | DaimlerChrysler NA Holdings Corp. | | | | |
| | 18 | | | 8.50%, 01/18/2031 | | | 27 | |
| | | | | Ford Motor Co. | | | | |
| | 130 | | | 7.45%, 07/16/2031 | | | 174 | |
| | | | | Johnson Controls, Inc. | | | | |
| | 100 | | | 5.00%, 03/30/2020 | | | 111 | |
| | | | | | | | 312 | |
| | | | | Other Services - 0.0% | | | | |
| | | | | Illinois Tool Works, Inc. | | | | |
| | 15 | | | 3.90%, 09/01/2042 | | | 14 | |
| | | | | | | | | |
| | | | | Paper Manufacturing - 0.1% | | | | |
| | | | | International Paper Co. | | | | |
| | 110 | | | 7.50%, 08/15/2021 | | | 140 | |
| | | | | Kimberly-Clark Corp. | | | | |
| | 12 | | | 5.30%, 03/01/2041 | | | 14 | |
| | 90 | | | 6.13%, 08/01/2017 | | | 104 | |
| | | | | | | | 258 | |
| | | | | Petroleum and Coal Products Manufacturing - 1.1% | | | | |
| | | | | Anadarko Petroleum Corp. | | | | |
| | 40 | | | 5.95%, 09/15/2016 | | | 44 | |
| | 30 | | | 6.20%, 03/15/2040 | | | 38 | |
| | | | | Apache Corp. | | | | |
| | 100 | | | 5.10%, 09/01/2040 | | | 110 | |
| | | | | Atmos Energy Corp. | | | | |
| | 8 | | | 5.50%, 06/15/2041 | | | 10 | |
| | | | | Canadian Natural Resources Ltd. | | | | |
| | 60 | | | 5.70%, 05/15/2017 | | | 67 | |
| | 40 | | | 6.50%, 02/15/2037 | | | 51 | |
| | | | | Cenovus Energy, Inc. | | | | |
| | 15 | | | 4.45%, 09/15/2042 | | | 15 | |
| | 25 | | | 5.70%, 10/15/2019 | | | 29 | |
| | | | | Chevron Corp. | | | | |
| | 35 | | | 2.36%, 12/05/2022 | | | 34 | |
| | 150 | | | 2.43%, 06/24/2020 | | | 152 | |
| | | | | ConocoPhillips | | | | |
| | 128 | | | 6.50%, 02/01/2039 | | | 172 | |
| | | | | Continental Resources, Inc. | | | | |
| | 60 | | | 4.90%, 06/01/2044 ■ | | | 62 | |
The accompanying notes are an integral part of these financial statements.
| Hartford Portfolio Diversifier HLS Fund |
| Schedule of Investments – (continued) |
| June 30, 2014 (Unaudited) |
| (000’s Omitted) |
| Shares or Principal Amount | | Market Value ╪ | |
| Corporate Bonds - 11.9% - (continued) |
| | | | | Petroleum and Coal Products Manufacturing - 1.1% - (continued) | | | | |
| | | | | Devon Financing Corp. | | | | |
| $ | 65 | | | 7.88%, 09/30/2031 | | $ | 91 | |
| | | | | EnCana Corp. | | | | |
| | 50 | | | 6.50%, 02/01/2038 | | | 63 | |
| | | | | Ensco plc | | | | |
| | 50 | | | 4.70%, 03/15/2021 | | | 54 | |
| | | | | Hess Corp. | | | | |
| | 53 | | | 5.60%, 02/15/2041 | | | 62 | |
| | | | | Kerr-McGee Corp. | | | | |
| | 100 | | | 6.95%, 07/01/2024 | | | 128 | |
| | | | | Marathon Oil Corp. | | | | |
| | 15 | | | 6.60%, 10/01/2037 | | | 19 | |
| | | | | Marathon Petroleum Corp. | | | | |
| | 15 | | | 5.13%, 03/01/2021 | | | 17 | |
| | | | | National Oilwell Varco, Inc. | | | | |
| | 50 | | | 2.60%, 12/01/2022 | | | 48 | |
| | 15 | | | 3.95%, 12/01/2042 | | | 15 | |
| | | | | Nexen, Inc. | | | | |
| | 50 | | | 7.50%, 07/30/2039 | | | 68 | |
| | | | | Noble Corp. | | | | |
| | 45 | | | 3.95%, 03/15/2022 | | | 46 | |
| | | | | Noble Energy, Inc. | | | | |
| | 20 | | | 6.00%, 03/01/2041 | | | 24 | |
| | | | | Occidental Petroleum Corp. | | | | |
| | 40 | | | 4.10%, 02/01/2021 | | | 44 | |
| | | | | Pemex Project Funding Master Trust | | | | |
| | 185 | | | 5.75%, 03/01/2018 | | | 209 | |
| | | | | Petrobras International Finance Co. | | | | |
| | 525 | | | 5.38%, 01/27/2021 | | | 547 | |
| | | | | Petroleos Mexicanos | | | | |
| | 170 | | | 6.50%, 06/02/2041 | | | 198 | |
| | | | | Phillips 66 | | | | |
| | 85 | | | 4.30%, 04/01/2022 | | | 92 | |
| | | | | Sempra Energy | | | | |
| | 65 | | | 6.00%, 10/15/2039 | | | 80 | |
| | 35 | | | 6.50%, 06/01/2016 | | | 39 | |
| | | | | Shell International Finance B.V. | | | | |
| | 85 | | | 3.63%, 08/21/2042 | | | 77 | |
| | 170 | | | 4.30%, 09/22/2019 | | | 189 | |
| | | | | Southern Natural Gas Co. LLC | | | | |
| | 60 | | | 5.90%, 04/01/2017 ■ | | | 67 | |
| | | | | Statoilhydro ASA | | | | |
| | 335 | | | 5.25%, 04/15/2019 | | | 385 | |
| | | | | Suncor Energy, Inc. | | | | |
| | 100 | | | 6.50%, 06/15/2038 | | | 128 | |
| | | | | Talisman Energy, Inc. | | | | |
| | 25 | | | 7.75%, 06/01/2019 | | | 31 | |
| | | | | Total Capital International S.A. | | | | |
| | 145 | | | 1.50%, 02/17/2017 | | | 147 | |
| | | | | Total Capital S.A. | | | | |
| | 95 | | | 4.25%, 12/15/2021 | | | 105 | |
| | | | | Transocean, Inc. | | | | |
| | 185 | | | 6.50%, 11/15/2020 | | | 214 | |
| | | | | TXU Electric Delivery Co. | | | | |
| | 95 | | | 7.00%, 09/01/2022 | | | 121 | |
| | | | | Valero Energy Corp. | | | | |
| | 200 | | | 6.13%, 02/01/2020 | | | 236 | |
| | | | | Weatherford International Ltd. | | | | |
| | 110 | | | 5.13%, 09/15/2020 | | | 123 | |
| | 30 | | | 6.75%, 09/15/2040 | | | 37 | |
| | | | | Williams Partners L.P. | | | | |
| 125 | | | 5.25%, 03/15/2020 | | | 141 | |
| | | | | | | | 4,629 | |
| | | | | Pipeline Transportation - 0.3% | | | | |
| | | | | El Paso Pipeline Partners Operating Co. LLC | | | | |
| | 35 | | | 4.70%, 11/01/2042 | | | 33 | |
| | | | | Energy Transfer Equity L.P. | | | | |
| | 90 | | | 6.50%, 02/01/2042 | | | 107 | |
| | 64 | | | 9.00%, 04/15/2019 | | | 82 | |
| | | | | Enterprise Products Operating LLC | | | | |
| | 65 | | | 4.45%, 02/15/2043 | | | 64 | |
| | 20 | | | 4.85%, 03/15/2044 | | | 20 | |
| | 140 | | | 5.20%, 09/01/2020 | | | 160 | |
| | | | | Kinder Morgan Energy Partners L.P. | | | | |
| | 187 | | | 6.38%, 03/01/2041 | | | 219 | |
| | | | | Oneok Partners L.P. | | | | |
| | 65 | | | 6.65%, 10/01/2036 | | | 80 | |
| | | | | Plains All American Pipeline L.P. | | | | |
| | 65 | | | 6.65%, 01/15/2037 | | | 83 | |
| | | | | TransCanada Pipelines Ltd. | | | | |
| | 75 | | | 3.75%, 10/16/2023 | | | 77 | |
| | 105 | | | 3.80%, 10/01/2020 | | | 113 | |
| | 90 | | | 7.13%, 01/15/2019 | | | 110 | |
| | | | | Transcontinental Gas Pipe Corp. | | | | |
| | 20 | | | 4.45%, 08/01/2042 | | | 20 | |
| | | | | | | | 1,168 | |
| | | | | Professional, Scientific and Technical Services - 0.1% | | | | |
| | | | | IBM Corp. | | | | |
| | 115 | | | 5.60%, 11/30/2039 | | | 138 | |
| | 100 | | | 5.70%, 09/14/2017 | | | 114 | |
| | | | | Omnicom Group, Inc. | | | | |
| | 110 | | | 3.63%, 05/01/2022 | | | 113 | |
| | | | | | | | 365 | |
| | | | | Public Administration - 0.1% | | | | |
| | | | | International Bank for Reconstruction & Development | | | | |
| | 237 | | | 7.63%, 01/19/2023 | | | 330 | |
| | | | | | | | | |
| | | | | Rail Transportation - 0.2% | | | | |
| | | | | Burlington Northern Santa Fe Corp. | | | | |
| | 47 | | | 4.38%, 09/01/2042 | | | 47 | |
| | 20 | | | 4.45%, 03/15/2043 | | | 20 | |
| | 170 | | | 4.70%, 10/01/2019 | | | 192 | |
| | | | | Canadian National Railway Co. | | | | |
| | 40 | | | 2.85%, 12/15/2021 | | | 40 | |
| | | | | Canadian Pacific Railway Co. | | | | |
| | 60 | | | 4.45%, 03/15/2023 | | | 66 | |
| | 8 | | | 7.13%, 10/15/2031 | | | 10 | |
| | | | | CSX Corp. | | | | |
| | 85 | | | 3.70%, 10/30/2020 | | | 90 | |
| | 105 | | | 4.25%, 06/01/2021 | | | 115 | |
| | | | | Norfolk Southern Corp. | | | | |
| | 75 | | | 4.84%, 10/01/2041 | | | 80 | |
| | | | | Union Pacific Corp. | | | | |
| | 34 | | | 4.82%, 02/01/2044 | | | 37 | |
| | | | | | | | 697 | |
| | | | | Real Estate, Rental and Leasing - 0.0% | | | | |
| | | | | Boston Properties L.P. | | | | |
| | 100 | | | 5.88%, 10/15/2019 | | | 117 | |
The accompanying notes are an integral part of these financial statements.
| Hartford Portfolio Diversifier HLS Fund |
| Schedule of Investments – (continued) |
| June 30, 2014 (Unaudited) |
| (000’s Omitted) |
| Shares or Principal Amount | | Market Value ╪ | |
| Corporate Bonds - 11.9% - (continued) |
| | | | | Real Estate, Rental and Leasing - 0.0% - (continued) | | | | |
| | | | | ERP Operating L.P. | | | | |
| $ | 70 | | | 5.75%, 06/15/2017 | | $ | 79 | |
| | | | | | | | 196 | |
| | | | | Retail Trade - 0.4% | | | | |
| | | | | Eaton Corp. | | | | |
| | 165 | | | 2.75%, 11/02/2022 | | | 160 | |
| | | | | Federated Retail Holdings, Inc. | | | | |
| | 128 | | | 5.90%, 12/01/2016 | | | 143 | |
| | | | | Home Depot, Inc. | | | | |
| | 335 | | | 4.40%, 04/01/2021 | | | 375 | |
| | | | | Kroger (The) Co. | | | | |
| | 40 | | | 3.90%, 10/01/2015 | | | 41 | |
| | 70 | | | 6.80%, 12/15/2018 | | | 83 | |
| | 40 | | | 7.50%, 04/01/2031 | | | 53 | |
| | | | | Lowe's Cos., Inc. | | | | |
| | 70 | | | 6.65%, 09/15/2037 | | | 92 | |
| | | | | Macy's Retail Holdings, Inc. | | | | |
| | 60 | | | 3.88%, 01/15/2022 | | | 63 | |
| | | | | Target Corp. | | | | |
| | 270 | | | 3.88%, 07/15/2020 | | | 291 | |
| | | | | Wal-Mart Stores, Inc. | | | | |
| | 115 | | | 3.25%, 10/25/2020 | | | 120 | |
| | 150 | | | 4.25%, 04/15/2021 | | | 166 | |
| | 178 | | | 5.63%, 04/15/2041 | | | 215 | |
| | | | | | | | 1,802 | |
| | | | | Soap, Cleaning Compound and Toilet Manufacturing - 0.1% | | | | |
| | | | | Colgate-Palmolive Co. | | | | |
| | 80 | | | 2.30%, 05/03/2022 | | | 78 | |
| | | | | Procter & Gamble Co. | | | | |
| | 115 | | | 4.70%, 02/15/2019 | | | 130 | |
| | 20 | | | 5.55%, 03/05/2037 | | | 24 | |
| | | | | | | | 232 | |
| | | | | Transportation Equipment Manufacturing - 0.0% | | | | |
| | | | | General Dynamics Corp. | | | | |
| | 15 | | | 3.88%, 07/15/2021 | | | 16 | |
| | | | | | | | | |
| | | | | Utilities - 0.7% | | | | |
| | | | | Alabama Power Co. | | | | |
| | 20 | | | 6.00%, 03/01/2039 | | | 25 | |
| | | | | CenterPoint Energy Houston Electric LLC | | | | |
| | 15 | | | 3.55%, 08/01/2042 | | | 14 | |
| | | | | CMS Energy Corp. | | | | |
| | 60 | | | 5.05%, 03/15/2022 | | | 68 | |
| | | | | Consolidated Edison Co. of NY | | | | |
| | 55 | | | 3.95%, 03/01/2043 | | | 52 | |
| | 25 | | | 5.50%, 12/01/2039 | | | 30 | |
| | 40 | | | 6.65%, 04/01/2019 | | | 48 | |
| | | | | Dominion Gas Holdings LLC | | | | |
| | 100 | | | 3.55%, 11/01/2023 ■ | | | 102 | |
| | | | | Dominion Resources, Inc. | | | | |
| | 295 | | | 4.45%, 03/15/2021 | | | 324 | |
| | | | | Duke Energy Corp. | | | | |
| | 105 | | | 5.30%, 02/15/2040 | | | 124 | |
| | | | | Entergy Corp. | | | | |
| | 40 | | | 3.63%, 09/15/2015 | | | 41 | |
| | | | | Exelon Generation Co. LLC | | | | |
| | 145 | | | 4.00%, 10/01/2020 | | | 153 | |
| | 85 | | | 6.25%, 10/01/2039 | | | 100 | |
| | | | | Florida Power & Light Co. | | | | |
| | 105 | | | 5.69%, 03/01/2040 | | | 131 | |
| | | | | Georgia Power Co. | | | | |
| 100 | | | 2.85%, 05/15/2022 | | | 99 | |
| | 50 | | | 4.75%, 09/01/2040 | | | 54 | |
| | | | | Hydro-Quebec | | | | |
| | 150 | | | 1.38%, 06/19/2017 | | | 151 | |
| | 70 | | | 8.40%, 01/15/2022 | | | 93 | |
| | | | | Kentucky Utilities Co. | | | | |
| | 70 | | | 5.13%, 11/01/2040 | | | 81 | |
| | | | | MidAmerican Energy Holdings Co. | | | | |
| | 170 | | | 6.13%, 04/01/2036 | | | 211 | |
| | | | | Nevada Power Co. | | | | |
| | 55 | | | 6.75%, 07/01/2037 | | | 75 | |
| | | | | Northern States Power Co. | | | | |
| | 95 | | | 3.40%, 08/15/2042 | | | 84 | |
| | | | | Ohio Power Co. | | | | |
| | 155 | | | 5.38%, 10/01/2021 | | | 181 | |
| | | | | Pacific Gas & Electric Co. | | | | |
| | 165 | | | 6.05%, 03/01/2034 | | | 204 | |
| | | | | Progress Energy, Inc. | | | | |
| | 270 | | | 4.40%, 01/15/2021 | | | 296 | |
| | | | | PSEG Power LLC | | | | |
| | 25 | | | 5.13%, 04/15/2020 | | | 28 | |
| | | | | Public Service Electric & Gas Co. | | | | |
| | 50 | | | 3.95%, 05/01/2042 | | | 49 | |
| | | | | San Diego Gas & Electric Co. | | | | |
| | 32 | | | 4.50%, 08/15/2040 | | | 34 | |
| | | | | South Carolina Electric & Gas Co. | | | | |
| | 40 | | | 6.05%, 01/15/2038 | | | 51 | |
| | | | | Southern California Edison Co. | | | | |
| | 100 | | | 4.50%, 09/01/2040 | | | 106 | |
| | | | | Xcel Energy, Inc. | | | | |
| | 65 | | | 4.70%, 05/15/2020 | | | 73 | |
| | | | | | | | 3,082 | |
| | | | | Wholesale Trade - 0.0% | | | | |
| | | | | Georgia-Pacific LLC | | | | |
| | 40 | | | 7.75%, 11/15/2029 | | | 55 | |
| | | | | | | | | |
| | | | | Total Corporate Bonds | | | | |
| | | | | (Cost $51,525) | | $ | 52,519 | |
| | | | | | | | | |
| Foreign Government Obligations - 0.8% |
| | | | | Brazil - 0.1% | | | | |
| | | | | Brazil (Federative Republic of) | | | | |
| $ | 225 | | | 5.88%, 01/15/2019 | | $ | 257 | |
| | 187 | | | 7.13%, 01/20/2037 | | | 237 | |
| | | | | | | $ | 494 | |
| | | | | Canada - 0.3% | | | | |
| | | | | British Columbia (Province of) | | | | |
| | 60 | | | 2.10%, 05/18/2016 | | | 62 | |
| | 105 | | | 2.65%, 09/22/2021 | | | 107 | |
| | | | | Canada (Government of) | | | | |
| | 135 | | | 0.88%, 02/14/2017 | | | 135 | |
| | | | | Manitoba (Province of) | | | | |
| | 60 | | | 2.10%, 09/06/2022 | | | 57 | |
| | 75 | | | 2.63%, 07/15/2015 | | | 77 | |
| | | | | Nova Scotia (Province of) | | | | |
| | 35 | | | 5.13%, 01/26/2017 | | | 39 | |
| | | | | Ontario (Province of) | | | | |
| | 345 | | | 4.40%, 04/14/2020 | | | 387 | |
The accompanying notes are an integral part of these financial statements.
| Hartford Portfolio Diversifier HLS Fund |
| Schedule of Investments – (continued) |
| June 30, 2014 (Unaudited) |
| (000’s Omitted) |
| Shares or Principal Amount | | Market Value ╪ | |
| Foreign Government Obligations - 0.8% - (continued) |
| | | | | Canada - 0.3% - (continued) | | | | |
| | | | | Quebec (Province of) | | | | |
| $ | 140 | | | 3.50%, 07/29/2020 | | $ | 150 | |
| | 60 | | | 5.13%, 11/14/2016 | | | 66 | |
| | 50 | | | 7.50%, 09/15/2029 | | | 71 | |
| | | | | | | | 1,151 | |
| | | | | Colombia - 0.1% | | | | |
| | | | | Colombia (Republic of) | | | | |
| | 161 | | | 8.13%, 05/21/2024 | | | 217 | |
| | | | | | | | | |
| | | | | Italy - 0.0% | | | | |
| | | | | Italy (Republic of) | | | | |
| | 45 | | | 5.38%, 06/15/2033 | | | 53 | |
| | | | | | | | | |
| | | | | Mexico - 0.1% | | | | |
| | | | | Mexico (United Mexican States) | | | | |
| | 220 | | | 5.13%, 01/15/2020 | | | 249 | |
| | 232 | | | 6.05%, 01/11/2040 | | | 281 | |
| | | | | | | | 530 | |
| | | | | Panama - 0.0% | | | | |
| | | | | Panama (Republic of) | | | | |
| | 50 | | | 6.70%, 01/26/2036 | | | 62 | |
| | | | | | | | | |
| | | | | Peru - 0.0% | | | | |
| | | | | Peru (Republic of) | | | | |
| | 75 | | | 5.63%, 11/18/2050 | | | 84 | |
| | 30 | | | 7.13%, 03/30/2019 | | | 36 | |
| | | | | | | | 120 | |
| | | | | Philippines - 0.1% | | | | |
| | | | | Philippines (Republic of) | | | | |
| | 120 | | | 4.00%, 01/15/2021 | | | 127 | |
| | 100 | | | 6.38%, 10/23/2034 | | | 126 | |
| | | | | | | | 253 | |
| | | | | Poland - 0.0% | | | | |
| | | | | Poland (Republic of) | | | | |
| | 140 | | | 5.00%, 03/23/2022 | | | 156 | |
| | | | | | | | | |
| | | | | South Africa - 0.0% | | | | |
| | | | | South Africa (Republic of) | | | | |
| | 100 | | | 6.88%, 05/27/2019 | | | 116 | |
| | | | | | | | | |
| | | | | Turkey - 0.1% | | | | |
| | | | | Turkey (Republic of) | | | | |
| | 110 | | | 6.75%, 05/30/2040 | | | 128 | |
| | 190 | | | 7.38%, 02/05/2025 | | | 231 | |
| | | | | | | | 359 | |
| | | | | Total Foreign Government Obligations | | | | |
| | | | | (Cost $3,515) | | $ | 3,511 | |
| | | | | | | | | |
| Municipal Bonds - 0.3% |
| | | | | Airport Revenues - 0.0% | | | | |
| | | | | Clark County, NV, Airport Rev, | | | | |
| $ | 5 | | | 6.82%, 07/01/2045 | | $ | 7 | |
| | | | | | | | | |
| | | | | General Obligations - 0.2% | | | | |
| | | | | California State GO, | | | | |
| | 105 | | | 7.60%, 11/01/2040 | | | 159 | |
| | | | | California State GO, Taxable, | | | | |
| | 55 | | | 7.55%, 04/01/2039 | | | 83 | |
| | | | | Connecticut State GO, | | | | |
| 45 | | | 5.85%, 03/15/2032 | | | 54 | |
| | | | | Illionis State, GO, | | | | |
| | 195 | | | 5.10%, 06/01/2033 | | | 196 | |
| | | | | Massachusetts State GO, | | | | |
| | 15 | | | 5.46%, 12/01/2039 | | | 18 | |
| | | | | Mississippi State GO, | | | | |
| | 25 | | | 5.25%, 11/01/2034 | | | 29 | |
| | | | | New York, NY, GO, | | | | |
| | 15 | | | 5.85%, 06/01/2040 | | | 18 | |
| | | | | Texas State GO, | | | | |
| | 30 | | | 5.52%, 04/01/2039 | | | 37 | |
| | | | | | | | 594 | |
| | | | | Higher Education (Univ., Dorms, etc.) - 0.0% | | | | |
| | | | | University of California, Build America Bonds Rev, | | | | |
| | 50 | | | 5.77%, 05/15/2043 | | | 61 | |
| | | | | University of Texas, | | | | |
| | 25 | | | 4.79%, 08/15/2046 | | | 28 | |
| | | | | | | | 89 | |
| | | | | Miscellaneous - 0.0% | | | | |
| | | | | New Jersey State Econ DA Lease Rev, | | | | |
| | 15 | | | 7.43%, 02/15/2029 | | | 20 | |
| | | | | | | | | |
| | | | | Tax Allocation - 0.0% | | | | |
| | | | | New York, NY, Dormitory Auth Rev, | | | | |
| | 20 | | | 5.60%, 03/15/2040 | | | 24 | |
| | | | | | | | | |
| | | | | Transportation - 0.1% | | | | |
| | | | | Bay Area, CA, Toll Auth Bridge Rev, | | | | |
| | 30 | | | 6.26%, 04/01/2049 | | | 40 | |
| | | | | Metropolitan Transportation Auth, NY, Rev, | | | | |
| | 20 | | | 5.87%, 11/15/2039 | | | 24 | |
| | 25 | | | 6.55%, 11/15/2031 | | | 31 | |
| | 15 | | | 6.65%, 11/15/2039 | | | 20 | |
| | | | | New Jersey State Turnpike Auth, | | | | |
| | 45 | | | 7.10%, 01/01/2041 | | | 63 | |
| | | | | New Jersey State Turnpike Auth, Taxable, | | | | |
| | 15 | | | 7.41%, 01/01/2040 | | | 22 | |
| | | | | New York and New Jersey PA, | | | | |
| | 50 | | | 4.93%, 10/01/2051 | | | 56 | |
| | | | | | | | 256 | |
| | | | | Utilities - Electric - 0.0% | | | | |
| | | | | American Municipal Power Ohio, Inc. Rev, | | | | |
| | 45 | | | 6.05%, 02/15/2043 | | | 55 | |
| | | | | Municipal Elec Auth Georgia, | | | | |
| | 40 | | | 6.64%, 04/01/2057 | | | 49 | |
| | | | | | | | 104 | |
| | | | | Utilities - Water and Sewer - 0.0% | | | | |
| | | | | New York City, NY, Municipal Water FA, | | | | |
| | 45 | | | 5.88%, 06/15/2044 | | | 58 | |
| | | | | | | | | |
| | | | | Total Municipal Bonds | | | | |
| | | | | (Cost $1,098) | | $ | 1,152 | |
| | | | | | | | | |
| U.S. Government Agencies - 13.4% |
| | | | | FHLMC - 3.8% | | | | |
| $ | 270 | | | 2.38%, 01/13/2022 | | $ | 269 | |
| | 1,554 | | | 2.50%, 05/27/2016 - 12/01/2042 | | | 1,578 | |
| | 3,185 | | | 3.00%, 12/01/2025 - 05/01/2043 | | | 3,205 | |
The accompanying notes are an integral part of these financial statements.
| Hartford Portfolio Diversifier HLS Fund |
| Schedule of Investments – (continued) |
| June 30, 2014 (Unaudited) |
| (000’s Omitted) |
| Shares or Principal Amount | | Market Value ╪ | |
| U.S. Government Agencies - 13.4% - (continued) | | | | |
| | | | | FHLMC - 3.8% - (continued) | | | | |
| $ | 2,863 | | | 3.50%, 04/01/2026 - 12/01/2043 | | $ | 2,967 | |
| | 680 | | | 3.75%, 03/27/2019 | | | 747 | |
| | 2,166 | | | 4.00%, 06/01/2024 - 11/01/2043 ☼ | | | 2,302 | |
| | 1,889 | | | 4.50%, 03/01/2015 - 09/01/2041 | | | 2,047 | |
| | 1,586 | | | 5.00%, 05/01/2023 - 08/01/2041 | | | 1,767 | |
| | 360 | | | 5.13%, 10/18/2016 | | | 397 | |
| | 370 | | | 5.25%, 04/18/2016 | | | 402 | |
| | 645 | | | 5.50%, 05/01/2036 - 08/01/2038 | | | 721 | |
| | 128 | | | 6.00%, 06/01/2036 - 10/01/2037 | | | 144 | |
| | 10 | | | 6.25%, 07/15/2032 | | | 14 | |
| | | | | | | | 16,560 | |
| | | | | FNMA - 6.4% | | | | |
| | 690 | | | 0.88%, 08/28/2017 | | | 686 | |
| | 830 | | | 1.25%, 01/30/2017 | | | 840 | |
| | 1,310 | | | 1.63%, 10/26/2015 - 11/27/2018 | | | 1,329 | |
| | 1,760 | | | 2.50%, 03/01/2027 - 01/01/2043 | | | 1,778 | |
| | 5,434 | | | 3.00%, 12/01/2025 - 11/01/2043 | | | 5,468 | |
| | 4,944 | | | 3.50%, 09/01/2025 - 08/01/2043 | | | 5,136 | |
| | 4,970 | | | 4.00%, 05/01/2020 - 05/01/2044 ☼ | | | 5,285 | |
| | 3,161 | | | 4.50%, 05/01/2025 - 01/01/2044 ☼ | | | 3,426 | |
| | 2,075 | | | 5.00%, 02/01/2022 - 01/01/2041 | | | 2,306 | |
| | 1,166 | | | 5.50%, 10/01/2035 - 05/01/2040 | | | 1,306 | |
| | 130 | | | 5.63%, 07/15/2037 | | | 171 | |
| | 306 | | | 6.00%, 04/01/2036 - 07/01/2037 | | | 344 | |
| | 73 | | | 6.50%, 06/01/2039 | | | 82 | |
| | 53 | | | 6.63%, 11/15/2030 | | | 75 | |
| | | | | | | | 28,232 | |
| | | | | GNMA - 3.2% | | | | |
| | 147 | | | 2.50%, 10/15/2027 - 01/15/2043 | | | 145 | |
| | 3,062 | | | 3.00%, 04/15/2027 - 12/20/2043 | | | 3,106 | |
| | 3,197 | | | 3.50%, 09/15/2025 - 03/20/2044 | | | 3,336 | |
| | 3,135 | | | 4.00%, 08/15/2026 - 06/20/2044 ☼ | | | 3,358 | |
| | 2,365 | | | 4.50%, 05/15/2039 - 10/20/2043 | | | 2,587 | |
| | 1,166 | | | 5.00%, 11/20/2035 - 12/20/2041 | | | 1,292 | |
| | 241 | | | 5.50%, 05/20/2038 - 08/20/2041 | | | 270 | |
| | 172 | | | 6.00%, 02/15/2036 - 08/20/2041 | | | 193 | |
| | | | | | | | 14,287 | |
| | | | | Total U.S. Government Agencies | | | | |
| | | | | (Cost $58,816) | | $ | 59,079 | |
| | | | | | | | | |
| U.S. Government Securities - 15.4% | | | | |
| Other Direct Federal Obligations - 0.4% | | | | |
| | | | | FFCB - 0.0% | | | | |
| $ | 165 | | | 4.88%, 12/16/2015 - 01/17/2017 | | $ | 178 | |
| | | | | | | | | |
| | | | | FHLB - 0.3% | | | | |
| | 540 | | | 4.75%, 12/16/2016 | | | 593 | |
| | 470 | | | 5.00%, 11/17/2017 | | | 530 | |
| | 60 | | | 5.50%, 07/15/2036 | | | 77 | |
| | | | | | | | 1,200 | |
| | | | | Tennessee Valley Authority - 0.1% | | | | |
| | 213 | | | 6.75%, 11/01/2025 | | | 284 | |
| | | | | | | | | |
| | | | | | | | 1,662 | |
| | | | | | | | | |
| U.S. Treasury Securities - 15.0% | |
| | | | | U.S. Treasury Bonds - 2.4% | | | | |
| 5,986 | | | 3.13%, 11/15/2041 - 02/15/2043 Θ | | | 5,782 | |
| | 305 | | | 3.75%, 08/15/2041 | | | 331 | |
| | 728 | | | 4.25%, 11/15/2040 | | | 857 | |
| | 2,810 | | | 5.38%, 02/15/2031 | | | 3,690 | |
| | | | | | | | 10,660 | |
| | | | | U.S. Treasury Notes - 12.6% | | | | |
| | 1,500 | | | 0.25%, 11/30/2015 | | | 1,501 | |
| | 400 | | | 0.50%, 07/31/2017 | | | 395 | |
| | 11,270 | | | 0.63%, 05/31/2017 - 04/30/2018 | | | 11,105 | |
| | 1,485 | | | 0.88%, 11/30/2016 | | | 1,494 | |
| | 10,512 | | | 1.00%, 08/31/2016 | | | 10,620 | |
| | 11,420 | | | 1.25%, 08/31/2015 - 11/30/2018 | | | 11,540 | |
| | 2,400 | | | 1.63%, 06/30/2019 | | | 2,400 | |
| | 7,564 | | | 1.75%, 05/31/2016 - 05/15/2022 | | | 7,502 | |
| | 3,878 | | | 1.88%, 09/30/2017 ‡ | | | 3,985 | |
| | 345 | | | 2.13%, 08/15/2021 | | | 345 | |
| | 4,320 | | | 2.75%, 11/15/2023 - 02/15/2024 | | | 4,421 | |
| | 215 | | | 3.13%, 05/15/2021 | | | 230 | |
| | | | | | | | 55,538 | |
| | | | | | | | 66,198 | |
| | | | | Total U.S. Government Securities | | | | |
| | | | | (Cost $67,817) | | $ | 67,860 | |
| | | | | | | | | |
| | | | | Total Long-Term Investments Excluding Purchased Options | | | | |
| | | | | (Cost $261,588) | | $ | 286,460 | |
|
| Short-Term Investments - 35.5% |
| Other Direct Federal Obligations - 4.5% |
| | | | | FHLB | | | | |
| $ | 20,000 | | | 0.08%, 8/20/2014 - 10/3/2014 ○ | | $ | 19,998 | |
| | | | | | | | | |
| Other Investment Pools and Funds - 0.0% |
| | 1 | | | JP Morgan U.S. Government Money Market Fund | | $ | 1 | |
| | | | | | | | | |
| Repurchase Agreements - 3.6% |
| | | | | Deutsche Bank Securities TriParty Repurchase
Agreement (maturing on 07/01/2014 in the
amount of $3,600, collateralized by U.S.
Treasury Bond 6.25%, 2030, value of $3,672) | | | | |
| $ | 3,600 | | | 0.05%, 6/30/2014 | | $ | 3,600 | |
| | | | | RBS Greenwich TriParty Repurchase Agreement
(maturing on 07/01/2014 in the amount of
$5,587, collateralized by U.S. Treasury Note
2.00%, 2016, value of $5,706) | | | | |
| | 5,587 | | | 0.07%, 6/30/2014 | | | 5,587 | |
| | | | | UBS Warburg Securities, Inc. TriParty Repurchase
Agreement (maturing on 07/01/2014 in the
amount of $6,855, collateralized by U.S.
Treasury Note 0.88% - 2.25%, 2016 - 2021,
value of $6,992) | | | | |
| | 6,855 | | | 0.05%, 6/30/2014 | | | 6,855 | |
| | | | | | | | 16,042 | |
| U.S. Government Agencies - 15.8% |
| | | | | FHLMC | | | | |
| $ | 25,000 | | | 0.04%, 7/14/2014 ○ | | $ | 24,999 | |
| | 10,000 | | | 0.07%, 9/18/2014 ○ | | | 9,999 | |
The accompanying notes are an integral part of these financial statements.
| Hartford Portfolio Diversifier HLS Fund |
| Schedule of Investments – (continued) |
| June 30, 2014 (Unaudited) |
| (000’s Omitted) |
| Shares or Principal Amount | | | | | | | Market Value ╪ | |
| Short-Term Investments - 35.5% - (continued) | | | | | | | | |
| U.S. Government Agencies - 15.8% - (continued) | | | | | | | | |
| | | | | FNMA | | | | | | | | |
| $ | 5,500 | | | 0.05%, 8/18/2014 ○ | | | | | | $ | 5,500 | |
| | 19,000 | | | 0.09%, 8/27/2014 ○ | | | | | | | 18,999 | |
| | 10,000 | | | 0.11%, 7/1/2014 ○ | | | | | | | 10,000 | |
| | | | | | | | | | | | 69,497 | |
| | U.S. Treasury Bills - 11.6% | | | | | | | | |
| | 51,000 | | | 0.04%, 07/10/2014 □○ | | | | | | $ | 51,000 | |
| | | | | | | | | | | | | |
| | | | | Total Short-Term Investments | | | | | | | | |
| | | | | (Cost $156,533) | | | | | | $ | 156,538 | |
| | | | | | | | | | | | | |
| | | | | Total Investments Excluding Purchased Options | | | | | | | | |
| | | | | (Cost $418,121) | | | 100.6 | % | | $ | 442,998 | |
| | | | | Total Purchased Options | | | | | | | | |
| | | | | (Cost $22,592) | | | 0.4 | % | | | 1,865 | |
| | | | | Total Investments | | | | | | | | |
| | | | | (Cost $440,713) ▲ | | | 101.0 | % | | $ | 444,863 | |
| | | | | Other Assets and Liabilities | | | (1.0 | )% | | | (4,511 | ) |
| | | | | Total Net Assets | | | 100.0 | % | | $ | 440,352 | |
The accompanying notes are an integral part of these financial statements.
Hartford Portfolio Diversifier HLS Fund
Schedule of Investments – (continued)
June 30, 2014 (Unaudited)
(000’s Omitted)
| Note: | Percentage of investments as shown is the ratio of the total market value to total net assets. |
| ▲ | At June 30, 2014, the cost of securities for federal income tax purposes was $422,584 and the aggregate gross unrealized appreciation and depreciation based on that cost were: |
| Unrealized Appreciation | | $ | 26,371 | |
| Unrealized Depreciation | | | (4,092 | ) |
| Net Unrealized Appreciation | | $ | 22,279 | |
| Δ | Variable rate securities; the rate reported is the coupon rate in effect at June 30, 2014. |
| ○ | The interest rate disclosed for these securities represents the effective yield on the date of the acquisition. |
| ■ | Securities issued within terms of a private placement memorandum, exempt from registration under Rule 144A under the Securities Act of 1933, as amended, and may be sold only to qualified institutional buyers. Unless otherwise indicated, these holdings are determined to be liquid. At June 30, 2014, the aggregate value of these securities was $231, which represents 0.1% of total net assets. |
| ☼ | This security, or a portion of this security, was purchased on a when-issued, delayed-delivery or delayed-draw basis. The cost of these securities was $2,031 at June 30, 2014. |
| ‡ | This security, or a portion of this security, has been segregated to cover funding requirements on investment transactions settling in the future. |
| Θ | This security, or a portion of this security, is designated to cover open OTC options contracts at June 30, 2014. |
| □ | This security, or a portion of this security, is pledged as initial margin deposit and collateral for daily variation margin loss on open futures contracts held at June 30, 2014. |
| Futures Contracts Outstanding at June 30, 2014 |
| | | Number of | | | Expiration | | | Notional | | | Market | | | Unrealized
Appreciation/(Depreciation) | | | Variation Margin | |
| Description | | Contracts* | | | Date | | | Amount | | | Value ╪ | | | Asset | | | Liability | | | Asset | | | Liability | |
| Short position contracts: |
| S&P 500 (E-Mini) Future | | | 2,165 | | | | 09/19/2014 | | | $ | 209,637 | | | $ | 211,347 | | | $ | – | | | $ | (1,710 | ) | | $ | – | | | $ | (43 | ) |
* The number of contracts does not omit 000's.
The accompanying notes are an integral part of these financial statements.
Hartford Portfolio Diversifier HLS Fund
Schedule of Investments – (continued)
June 30, 2014 (Unaudited)
(000’s Omitted)
| OTC Option Contracts Outstanding at June 30, 2014 |
| |
| Description | | Counter -
party | | Risk
Exposure
Category | | Exercise Price/ FX Rate/
Rate | | | Expiration
Date | | | Number of
Contracts * | | | Market
Value ╪ | | | Premiums
Received/
Paid by
Fund Δ | | | Unrealized
Appreciation
(Depreciation) | |
| | | | | | | | | | | | | | | | | | | | | | | | | | |
| Purchased Option contracts: | | | | | | | | | | | | | | | | | | | | | | | | | | | | | | | | |
| Put option contracts | | | | | | | | | | | | | | | | | | | | | | | | | | | | | | | | |
| S&P 500 Index Option | | JPM | | EQ | | | 1,170.00 USD | | | | 06/06/16 | | | | USD | | | | 31,850 | | | $ | 611 | | | $ | 7,383 | | | $ | (6,772 | ) |
| S&P 500 Index Option | | BCLY | | EQ | | | 1,170.00 USD | | | | 06/06/16 | | | | USD | | | | 32,964 | | | | 632 | | | | 7,621 | | | | (6,989 | ) |
| S&P 500 Index Option | | BOA | | EQ | | | 1,170.00 USD | | | | 06/06/16 | | | | USD | | | | 20,282 | | | | 389 | | | | 4,391 | | | | (4,002 | ) |
| S&P 500 Index Option | | CSI | | EQ | | | 1,170.00 USD | | | | 06/06/16 | | | | USD | | | | 3,348 | | | | 64 | | | | 858 | | | | (794 | ) |
| S&P 500 Index Option | | UBS | | EQ | | | 1,170.00 USD | | | | 06/06/16 | | | | USD | | | | 8,811 | | | | 169 | | | | 2,339 | | | | (2,170 | ) |
| Total put option contracts | | | | | | | | | | | | | | | | | | | 97,255 | | | $ | 1,865 | | | $ | 22,592 | | | $ | (20,727 | ) |
| Total purchased option contracts | | | | | | | | | | | | | | | | | | | 97,255 | | | $ | 1,865 | | | $ | 22,592 | | | $ | (20,727 | ) |
| Written option contracts: | | | | | | | | | | | | | | | | | | | | | | | | | | | | | | | | |
| Put option contracts | | | | | | | | | | | | | | | | | | | | | | | | | | | | | | | | |
| S&P 500 Index Option | | BCLY | | EQ | | | 910.00 USD | | | | 06/06/16 | | | | USD | | | | 32,964 | | | $ | 225 | | | $ | 4,457 | | | $ | 4,232 | |
| S&P 500 Index Option | | JPM | | EQ | | | 910.00 USD | | | | 06/06/16 | | | | USD | | | | 31,850 | | | | 217 | | | | 4,299 | | | | 4,082 | |
| S&P 500 Index Option | | BOA | | EQ | | | 910.00 USD | | | | 06/06/16 | | | | USD | | | | 20,282 | | | | 138 | | | | 2,564 | | | | 2,426 | |
| S&P 500 Index Option | | CSI | | EQ | | | 910.00 USD | | | | 06/06/16 | | | | USD | | | | 3,348 | | | | 23 | | | | 509 | | | | 486 | |
| S&P 500 Index Option | | UBS | | EQ | | | 910.00 USD | | | | 06/06/16 | | | | USD | | | | 8,811 | | | | 60 | | | | 1,389 | | | | 1,329 | |
| Total put option contracts | | | | | | | | | | | | | | | | | | | 97,255 | | | $ | 663 | | | $ | 13,218 | | | $ | 12,555 | |
| Total written option contracts | | | | | | | | | | | | | | | | | | | 97,255 | | | $ | 663 | | | $ | 13,218 | | | $ | 12,555 | |
* The number of contracts does not omit 000's.
Δ For purchased options, premiums are paid by the Fund, for written options, premiums are received.
The broker deposited securities valued at $1,857 with the custodian to serve as collateral for the options purchased by the Fund. The collateral is maintained in a segregated account at the custodian on behalf of the Fund. Since the broker retains legal title to the securities, the securities are not considered assets of the Fund and are not included in the Statement of Assets and Liabilities.
The accompanying notes are an integral part of these financial statements.
Hartford Portfolio Diversifier HLS Fund
Schedule of Investments – (continued)
June 30, 2014 (Unaudited)
(000’s Omitted)
| GLOSSARY: (abbreviations used in preceding Schedule of Investments) |
| |
| Counterparty Abbreviations: |
| BCLY | Barclays |
| BOA | Banc of America Securities LLC |
| CSI | Credit Suisse International |
| JPM | JP Morgan Chase & Co. | |
| UBS | UBS AG |
| |
| Currency Abbreviations: |
| USD | U.S. Dollar | |
| |
| Index Abbreviations: |
| S&P | Standard & Poors |
| |
| Municipal Bond Abbreviations: |
| DA | Development Authority | |
| FA | Finance Authority | |
| GO | General Obligation | |
| PA | Port Authority | |
| Rev | Revenue | |
| | |
| Other Abbreviations: |
| EQ | Equity |
| ETF | Exchange Traded Fund |
| FFCB | Federal Farm Credit Bank |
| FHLB | Federal Home Loan Bank |
| FHLMC | Federal Home Loan Mortgage Corp. |
| FNMA | Federal National Mortgage Association |
| FX | Foreign Exchange |
| GNMA | Government National Mortgage Association |
| OTC | Over-the-Counter |
| REIT | Real Estate Investment Trust |
The accompanying notes are an integral part of these financial statements.
Hartford Portfolio Diversifier HLS Fund
Investment Valuation Hierarchy Level Summary
June 30, 2014 (Unaudited)
(000’s Omitted)
| | | Total | | | Level 1 ♦ | | | Level 2 ♦ | | | Level 3 | |
| Assets: | | | | | | | | | | | | | | | | |
| Common Stocks | | | | | | | | | | | | | | | | |
| Automobiles and Components | | $ | 1,164 | | | $ | 1,164 | | | $ | – | | | $ | – | |
| Banks | | | 2,949 | | | | 2,949 | | | | – | | | | – | |
| Capital Goods | | | 7,637 | | | | 7,637 | | | | – | | | | – | |
| Commercial and Professional Services | | | 700 | | | | 700 | | | | – | | | | – | |
| Consumer Durables and Apparel | | | 1,277 | | | | 1,277 | | | | – | | | | – | |
| Consumer Services | | | 1,696 | | | | 1,696 | | | | – | | | | – | |
| Diversified Financials | | | 6,480 | | | | 6,480 | | | | – | | | | – | |
| Energy | | | 10,605 | | | | 10,605 | | | | – | | | | – | |
| Food and Staples Retailing | | | 2,227 | | | | 2,227 | | | | – | | | | – | |
| Food, Beverage and Tobacco | | | 5,152 | | | | 5,152 | | | | – | | | | – | |
| Health Care Equipment and Services | | | 4,185 | | | | 4,185 | | | | – | | | | – | |
| Household and Personal Products | | | 1,983 | | | | 1,983 | | | | – | | | | – | |
| Insurance | | | 4,104 | | | | 4,104 | | | | – | | | | – | |
| Materials | | | 3,422 | | | | 3,422 | | | | – | | | | – | |
| Media | | | 3,686 | | | | 3,686 | | | | – | | | | – | |
| Pharmaceuticals, Biotechnology and Life Sciences | | | 8,923 | | | | 8,923 | | | | – | | | | – | |
| Real Estate | | | 2,065 | | | | 2,065 | | | | – | | | | – | |
| Retailing | | | 3,967 | | | | 3,967 | | | | – | | | | – | |
| Semiconductors and Semiconductor Equipment | | | 2,300 | | | | 2,300 | | | | – | | | | – | |
| Software and Services | | | 9,825 | | | | 9,825 | | | | – | | | | – | |
| Technology Hardware and Equipment | | | 6,436 | | | | 6,436 | | | | – | | | | – | |
| Telecommunication Services | | | 2,508 | | | | 2,508 | | | | – | | | | – | |
| Transportation | | | 2,000 | | | | 2,000 | | | | – | | | | – | |
| Utilities | | | 3,185 | | | | 3,185 | | | | – | | | | – | |
| Total | | | 98,476 | | | | 98,476 | | | | – | | | | – | |
| Asset and Commercial Mortgage Backed Securities | | | 3,153 | | | | – | | | | 3,153 | | | | – | |
| Corporate Bonds | | | 52,519 | | | | – | | | | 52,519 | | | | – | |
| Exchange Traded Funds | | | 710 | | | | 710 | | | | – | | | | – | |
| Foreign Government Obligations | | | 3,511 | | | | – | | | | 3,511 | | | | – | |
| Municipal Bonds | | | 1,152 | | | | – | | | | 1,152 | | | | – | |
| U.S. Government Agencies | | | 59,079 | | | | – | | | | 59,079 | | | | – | |
| U.S. Government Securities | | | 67,860 | | | | 2,400 | | | | 65,460 | | | | – | |
| Short-Term Investments | | | 156,538 | | | | 1 | | | | 156,537 | | | | – | |
| Purchased Options | | | 1,865 | | | | – | | | | 1,865 | | | | – | |
| Total | | $ | 444,863 | | | $ | 101,587 | | | $ | 343,276 | | | $ | – | |
| Liabilities: | | | | | | | | | | | | | | | | |
| Written Options | | | 663 | | | | – | | | | 663 | | | | – | |
| Total | | $ | 663 | | | $ | – | | | $ | 663 | | | $ | – | |
| Futures* | | $ | 1,710 | | | $ | 1,710 | | | $ | – | | | $ | – | |
| Total | | $ | 1,710 | | | $ | 1,710 | | | $ | – | | | $ | – | |
| ♦ | For the six-month period ended June 30, 2014, investments valued at $978 were transferred from Level 1 to Level 2, and there were no transfers from Level 2 to Level 1. Investments are transferred between Level 1 and Level 2 for a variety of reasons including, but not limited to: |
| 1) | Foreign equities for which a fair value price is more representative of exit value than the local market close (transfer into Level 2). Foreign equities for which the local market close is more representative of exit value (transfer into Level 1). |
| 2) | U.S. Treasury securities that no longer represent the most recent issue (transfer into Level 2). |
| 3) | Equity investments with no observable trading but a bid or mean price is used (transfer into Level 2). Equity investments using observable quoted prices in an active market (transfer into Level 1). |
| ‡ | The Fund has all or primarily all of the equity securities categorized in a particular level. Refer to the Schedule of Investments for further industry breakout. |
| * | Derivative instruments (excluding purchased and written options, if applicable) are valued at the unrealized appreciation/depreciation on the investments. |
| Note: | For purposes of reporting transfers between different hierarchy levels, both transfers in and out of each level, as applicable, are shown as if they occurred at the beginning of the period. |
The accompanying notes are an integral part of these financial statements.
Hartford Portfolio Diversifier HLS Fund
Statement of Assets and Liabilities
June 30, 2014 (Unaudited)
(000’s Omitted)
| Assets: | | | | |
| Investments in securities, at market value (cost $440,713) | | $ | 444,863 | |
| Receivables: | | | | |
| Investment securities sold | | | 1,697 | |
| Fund shares sold | | | 12 | |
| Dividends and interest | | | 1,290 | |
| Variation margin on financial derivative instruments | | | — | |
| Other assets | | | 5 | |
| Total assets | | | 447,867 | |
| Liabilities: | | | | |
| Bank overdraft | | | 6 | |
| Payables: | | | | |
| Investment securities purchased | | | 6,613 | |
| Fund shares redeemed | | | 86 | |
| Variation margin on financial derivative instruments | | | 43 | |
| Investment management fees | | | 36 | |
| Distribution fees | | | 15 | |
| Other liabilities | | | 21 | |
| Accrued expenses | | | 32 | |
| Written option contracts (proceeds $13,218) | | | 663 | |
| Total liabilities | | | 7,515 | |
| Net assets | | $ | 440,352 | |
| Summary of Net Assets: | | | | |
| Capital stock and paid-in-capital | | $ | 510,092 | |
| Undistributed net investment income | | | 1,207 | |
| Accumulated net realized loss | | | (85,942 | ) |
| Unrealized appreciation of investments | | | 14,995 | |
| Net assets | | $ | 440,352 | |
| Shares authorized | | | 1,000,000 | |
| Par value | | $ | 0.001 | |
| Class IB: Net asset value per share | | $ | 8.06 | |
| Shares outstanding | | | 54,653 | |
| Net assets | | $ | 440,352 | |
The accompanying notes are an integral part of these financial statements.
Hartford Portfolio Diversifier HLS Fund
Statement of Operations
For the Six-Month Period Ended June 30, 2014 (Unaudited)
(000’s Omitted)
| Investment Income: | | | | |
| Dividends | | $ | 986 | |
| Interest | | | 2,063 | |
| Less: Foreign tax withheld | | | — | |
| Total investment income, net | | | 3,049 | |
| | | | | |
| Expenses: | | | | |
| Investment management fees | | | 1,307 | |
| Transfer agent fees | | | 1 | |
| Distribution fees - Class IB | | | 545 | |
| Custodian fees | | | 5 | |
| Accounting services fees | | | 39 | |
| Board of Directors' fees | | | 5 | |
| Audit fees | | | 7 | |
| Other expenses | | | 28 | |
| Total expenses (before waivers) | | | 1,937 | |
| Expense waivers | | | (86 | ) |
| Total waivers | | | (86 | ) |
| Total expenses, net | | | 1,851 | |
| Net Investment Income | | | 1,198 | |
| | | | | |
| Net Realized Loss on Investments and Other Financial Instruments: | | | | |
| Net realized gain on investments | | | 2,812 | |
| Net realized loss on futures contracts | | | (21,192 | ) |
| Net Realized Loss on Investments and Other Financial Instruments | | | (18,380 | ) |
| | | | | |
| Net Changes in Unrealized Appreciation of Investments and Other Financial Instruments: | | | | |
| Net unrealized appreciation of investments | | | 8,121 | |
| Net unrealized depreciation of purchased option contracts | | | (1,875 | ) |
| Net unrealized appreciation of futures contracts | | | 6,003 | |
| Net unrealized appreciation of written option contracts | | | 812 | |
| Net Changes in Unrealized Appreciation of Investments and Other Financial Instruments | | | 13,061 | |
| Net Loss on Investments and Other Financial Instruments | | | (5,319 | ) |
| Net Decrease in Net Assets Resulting from Operations | | $ | (4,121 | ) |
The accompanying notes are an integral part of these financial statements.
Hartford Portfolio Diversifier HLS Fund
Statement of Changes in Net Assets
(000’s Omitted)
| | | For the
Six-Month
Period Ended
June 30, 2014
(Unaudited) | | | For the
Year Ended
December 31,
2013 | |
| Operations: | | | | | | | | |
| Net investment income | | $ | 1,198 | | | $ | 1,144 | |
| Net realized loss on investments and other financial instruments | | | (18,380 | ) | | | (50,545 | ) |
| Net unrealized appreciation (depreciation) of investments and other financial instruments | | | 13,061 | | | | (1,530 | ) |
| Net Decrease in Net Assets Resulting from Operations | | | (4,121 | ) | | | (50,931 | ) |
| Distributions to Shareholders: | | | | | | | | |
| From net investment income | | | | | | | | |
| Class IB | | | — | | | | (1,833 | ) |
| Total distributions | | | — | | | | (1,833 | ) |
| Capital Share Transactions: | | | | | | | | |
| Class IB | | | | | | | | |
| Sold | | | 26,717 | | | | 220,554 | |
| Issued on reinvestment of distributions | | | — | | | | 1,833 | |
| Redeemed | | | (25,365 | ) | | | (22,264 | ) |
| Total capital share transactions | | | 1,352 | | | | 200,123 | |
| Net increase from capital share transactions | | | 1,352 | | | | 200,123 | |
| Net Increase (Decrease) in Net Assets | | | (2,769 | ) | | | 147,359 | |
| Net Assets: | | | | | | | | |
| Beginning of period | | | 443,121 | | | | 295,762 | |
| End of period | | $ | 440,352 | | | $ | 443,121 | |
| Undistributed (distribution in excess of) | | | | | | | | |
| net investment income | | $ | 1,207 | | | $ | 9 | |
| Shares: | | | | | | | | |
| Class IB | | | | | | | | |
| Sold | | | 3,283 | | | | 25,310 | |
| Issued on reinvestment of distributions | | | — | | | | 224 | |
| Redeemed | | | (3,101 | ) | | | (2,594 | ) |
| Total share activity | | | 182 | | | | 22,940 | |
The accompanying notes are an integral part of these financial statements.
Hartford Portfolio Diversifier HLS Fund
Notes to Financial Statements
June 30, 2014 (Unaudited)
(000’s Omitted)
Organization:
Hartford Portfolio Diversifier HLS Fund (the “Fund”) serves as an underlying investment option for certain variable annuity separate accounts of Hartford Life Insurance Company (“HLIC”) and its affiliates and Forethought Life Insurance Company ("Forethought"). The Fund’s shares are available only to separate accounts of HLIC and its affiliates and Forethought who have elected a guaranteed benefit rider subject to an allocation requiring investment in the Fund.
Hartford Series Fund, Inc. (the “Company”) is an open-end registered management investment company comprised of twenty-eight portfolios. Financial statements for the Fund, a series of the Company, are included in this report.
The Company is organized under the laws of the State of Maryland and is registered with the Securities and Exchange Commission (“SEC”) under the Investment Company Act of 1940, as amended (“1940 Act”). The Fund is a diversified open-end management investment company.
Class IB shares of the Fund are offered at the per share net asset value (“NAV”) without a sales charge and are subject to distribution and service fees charged pursuant to a Distribution Plan adopted in accordance with Rule 12b-1 under the 1940 Act.
Significant Accounting Policies:
The following is a summary of significant accounting policies of the Fund in the preparation of its financial statements, which are in accordance with United States Generally Accepted Accounting Principles (“U.S. GAAP”). The preparation of financial statements in accordance with U.S. GAAP may require management to make estimates and assumptions that affect the reported amounts of assets and liabilities and disclosure of contingent assets and liabilities at the date of the financial statements and the reported amounts of increases and decreases in net assets from operations during the reporting period. Actual results could differ from those estimates.
Determination of Net Asset Value – The NAV of each class of the Fund's shares is determined as of the close of regular trading (normally 4:00 p.m. Eastern Time) (the “NYSE Close”) on each day that the New York Stock Exchange (the “Exchange”) is open (“Valuation Date”). Information that becomes known to the Fund after the NAV has been calculated on a particular day will not generally be used to retroactively adjust the NAV determined earlier that day.
Investment Valuation and Fair Value Measurements – For purposes of calculating the NAV, portfolio investments and other assets held by the Fund's portfolio for which market quotes are readily available are valued at market value. Market value is generally determined on the basis of last reported sales prices or official close price. If no sales are reported, market value is based on quotes obtained from a quotation reporting system, established market makers, or independent pricing services. If market prices are not readily available or are deemed unreliable, the Fund will use the fair value of the investment as determined in good faith under policies and procedures established by and under the supervision of the Company's Board of Directors. Market quotes are considered not readily available where there is an absence of current or reliable market-based data (e.g., trade information or indicative market quotes), including where events occur after the close of the relevant market, but prior to the NYSE Close, that materially affect the values of the Fund's portfolio investments or assets. In addition, market quotes are considered not readily available when, due to extraordinary circumstances, the exchanges or markets on which the investments trade do not open for trading for the entire day and no other market prices are available. There can be no assurance that the Fund could obtain the fair market value assigned to an investment if the Fund were to sell the investment at approximately the time at which the Fund determines its NAV.
Fixed income investments (other than short-term obligations), non-exchange traded derivatives and centrally cleared swaps held by the Fund are normally valued on the basis of quotes obtained from independent pricing services or brokers and dealers in accordance with procedures established by the Company's Board of Directors. Prices obtained from independent pricing services use information provided by market makers or estimates of market values through accepted market modeling, trading and pricing conventions. Inputs to the models may include, but are not limited to, prepayment speeds, pricing spread, yield, trade information, dealer quotes, market color, cash flow models and the investment’s terms and conditions. Generally, the Fund may use fair valuation in regard to fixed income investments when the Fund holds defaulted or distressed investments or investments in a company in which a reorganization is pending. Short-term investments maturing in 60 days or less are generally valued at amortized cost, if their original term to maturity was 60 days or less, or by amortizing their value on the 61st day prior to maturity, if the original term to maturity exceeded 60 days.
Hartford Portfolio Diversifier HLS Fund
Notes to Financial Statements – (continued)
June 30, 2014 (Unaudited)
(000’s Omitted)
Exchange traded options, futures and options on futures are valued at the settlement price or last trade price determined by the relevant exchange as of the NYSE Close. If the last trade price for exchange traded options does not fall between the bid and ask prices, the value will be the mean of the bid and ask prices as of the NYSE Close. If a last trade price is not available, the value will be the mean of the bid and ask prices as of the NYSE Close. If a mean of the bid and ask prices cannot be calculated for the day, the value will be the bid price as of the NYSE Close. In the case of over-the-counter ("OTC") options and such instruments that do not trade on an exchange, values may be supplied by a pricing service using a formula or other objective method that may take into consideration the style, direction, expiration, strike price, notional value and volatility or other special adjustments.
Investments in open-end mutual funds are valued at the respective NAV of each open-end mutual fund on the Valuation Date.
Financial instruments for which prices are not available from an independent pricing service may be valued using market quotations obtained from one or more dealers that make markets in the respective financial instrument in accordance with procedures established by the Company's Board of Directors.
U.S. GAAP defines fair value as the price that the Fund would receive to sell an asset or pay to transfer a liability in an orderly transaction between market participants. The U.S. GAAP fair value measurement standards require disclosure of a fair value hierarchy for each major category of assets and liabilities. Various inputs are used in determining the fair value of the Fund’s investments. These inputs are summarized into three broad hierarchy levels. This hierarchy is based on whether the valuation inputs are observable or unobservable. These levels are:
Level 1 – Quoted prices in active markets for identical investments. Level 1 may include exchange traded instruments, such as domestic equities, some foreign equities, options, futures, mutual funds, exchange traded funds, rights and warrants.
Level 2 – Observable inputs other than Level 1 prices, such as quoted prices for similar investments; quoted prices in markets that are not active; or other inputs that are observable or can be corroborated by observable market data. Level 2 may include debt investments that are traded less frequently than exchange traded instruments and which are valued using independent pricing services; foreign equities, which are principally traded on certain foreign markets and are adjusted daily pursuant to a fair value pricing service in order to reflect an adjustment for the factors occurring after the close of certain foreign markets but before the NYSE Close; senior floating rate interests, which are valued using an aggregate of dealer bids; short-term investments, which are valued at amortized cost; and swaps, which are valued based upon the terms of each swap contract.
Level 3 – Significant unobservable inputs that are supported by limited or no market activity. Level 3 may include financial instruments whose values are determined using indicative market quotes or require significant management judgment or estimation. These unobservable valuation inputs may include estimates for current yields, maturity/duration, prepayment speed, and indicative market quotes for comparable investments along with other assumptions relating to credit quality, collateral value, complexity of the investment structure, general market conditions and liquidity. This category may include investments where trading has been halted or there are certain restrictions on trading. While these investments are priced using unobservable inputs, the valuation of these investments reflects the best available data and management believes the prices are a reasonable representation of exit price.
The Board of Directors of the Company generally reviews and approves the “Procedures for Valuation of Portfolio Securities” at least once a year. These procedures define how investments are to be valued, including the formation and activities of a Valuation Committee. The Valuation Committee is responsible for determining in good faith the fair value of investments when the value cannot be obtained from primary pricing services or alternative sources or if the valuation of an investment as provided by the primary pricing service or alternative source is believed not to reflect the investment’s fair value as of the Valuation Date. Voting members of the Valuation Committee include the Fund's Treasurer or designee and a Vice President of the investment manager or designee. An Assistant Vice President of the Fund with legal expertise or designee is also included on the Valuation Committee as a non-voting advisory member. In addition, the Fund’s Chief Compliance Officer shall designate a member of the compliance group to attend Valuation Committee meetings as a non-voting resource, to monitor for and provide guidance with respect to compliance with these procedures. Two members of the Valuation Committee or their designees, representing different departments, shall constitute a quorum for purposes of permitting the Valuation Committee to take action. The Valuation Committee will consider all relevant factors in determining an investment’s fair value, and may seek the advice of the Fund’s sub-
Hartford Portfolio Diversifier HLS Fund
Notes to Financial Statements – (continued)
June 30, 2014 (Unaudited)
(000’s Omitted)
adviser, knowledgeable brokers, and legal counsel in making such determination. The Valuation Committee reports to the Audit Committee of the Company's Board of Directors. The Audit Committee receives quarterly written reports which include details of all fair-valued investments, including the reason for the fair valuation, and an indication, when possible, of the accuracy of the valuation by disclosing the next available reliable public price quotation or the disposition price of such investments (the “look-back” test). The Board of Directors then must consider for ratification all of the fair value determinations made during the previous quarter.
Valuation levels are not necessarily indicative of the risk associated with investing in such investments. Individual investments within any of the above mentioned asset classes may be assigned a different hierarchical level than those presented above, as individual circumstances dictate.
For additional information, refer to the Investment Valuation Hierarchy Level Summary which follows the Schedule of Investments.
Investment Transactions and Investment Income – Investment transactions are recorded as of the trade date (the date the order to buy or sell is executed) for financial reporting purposes. Investments purchased or sold on a when-issued or delayed-delivery basis may be settled a month or more after the trade date. Realized gains and losses are determined on the basis of identified cost.
Dividend income from domestic securities is accrued on the ex-dividend date. Interest income, including amortization of premium, accretion of discounts and additional principal received in-kind in lieu of cash, is accrued on a daily basis. Paydown gains and losses on mortgage related and other asset backed securities are included in interest income in the Statement of Operations, as applicable.
Joint Trading Account – The Fund may invest cash balances into a joint trading account that may be invested in one or more repurchase agreements.
Fund Share Valuation and Dividend Distributions to Shareholders – Orders for the Fund’s shares are executed in accordance with the investment instructions of the contract holders and plan participants. The NAV of the Fund’s shares is determined as of the close of business on each business day of the Exchange. The NAV is determined by dividing the Fund’s net assets by the number of shares outstanding.
Orders for the purchase of the Fund’s shares received prior to the close of the Exchange on any day the Exchange is open for business are priced at the NAV determined as of the close of the Exchange. Orders received after the close of the Exchange, or on a day on which the Exchange and/or the Fund is not open for business, are priced at the next determined NAV.
Dividends are declared pursuant to a policy adopted by the Company's Board of Directors based upon the investment performance of the Fund. The policy of the Fund is to pay dividends from net investment income and realized gains, if any, at least once a year.
Distributions from net investment income, net realized gains and capital are determined in accordance with federal income tax regulations, which may differ from U.S. GAAP with respect to character and timing. These differences may include, but are not limited to, losses deferred due to wash sale adjustments, foreign currency gains and losses, adjustments related to Passive Foreign Investment Companies ("PFICs"), Real Estate Investment Trusts ("REITs"), Regulated Investment Companies ("RICs"), certain derivatives and partnerships. Permanent book and federal income tax basis differences relating to shareholder distributions will result in reclassifications to certain of the Fund’s capital accounts (see Federal Income Taxes: Reclassification of Capital Accounts note).
Securities and Other Investments:
Repurchase Agreements – A repurchase agreement is an agreement by which a counterparty agrees to sell an investment and agrees to repurchase the investment sold from the buyer at a mutually agreed upon time and price. During the period of the repurchase agreement, the counterparty will deposit cash and or securities in a third party custodial account to serve as collateral. At the time the Fund enters into a repurchase agreement, the value of the underlying collateral, including accrued interest, will be equal to or exceed the value of the repurchase agreement. Repurchase agreements expose the Fund to counterparty risk - that is, the risk that the counterparty will not fulfill its obligations. To minimize counterparty risk, the investments that serve to collateralize the repurchase agreement are held by the Fund’s custodian in book entry or physical form in the custodial account of the Fund or in a
Hartford Portfolio Diversifier HLS Fund
Notes to Financial Statements – (continued)
June 30, 2014 (Unaudited)
(000’s Omitted)
third party custodial account. Repurchase agreements are valued at cost plus accrued interest, which approximates fair value. Repurchase agreements have master netting arrangements which allow the Fund to offset amounts owed to a counterparty with amounts owed by the counterparty, including any collateral. Upon an event of default under a master repurchase agreement, the non-defaulting party may close out all transactions traded under such agreement and net amounts owed under each transaction to one net amount payable by one party to the other. Absent an event of default, the master repurchase agreement does not result in an offset of reported amounts of assets and liabilities in the Statement of Assets and Liabilities across transactions between the Fund and the applicable counterparty. The Fund, as shown on the Schedule of Investments, had outstanding repurchase agreements and related collateral as of June 30, 2014.
Illiquid and Restricted Investments – The Fund is permitted to invest up to 15% of its net assets in illiquid investments. Illiquid investments are those that may not be sold or disposed of in the ordinary course of business within seven days, at approximately the price used to determine the Fund’s NAV. The Fund may not be able to sell illiquid investments when its sub-adviser considers it desirable to do so or may have to sell such investments at a price that is lower than the price that could be obtained if the investments were more liquid. A sale of illiquid investments may require more time and may result in higher dealer discounts and other selling expenses than does the sale of those that are liquid. Illiquid investments also may be more difficult to value due to the unavailability of reliable market quotations for such investments, and an investment in them may have an adverse impact on the Fund’s NAV. The Fund may also purchase certain restricted investments that can only be resold to certain qualified investors and may be determined to be liquid pursuant to policies and guidelines established by the Company's Board of Directors. The Fund, as shown on the Schedule of Investments, had illiquid or restricted investments as of June 30, 2014.
Investments Purchased on a When-Issued or Delayed-Delivery Basis – Delivery and payment for investments that have been purchased by the Fund on a forward commitment, or when-issued or delayed-delivery basis, take place beyond the customary settlement period. The Fund may dispose of or renegotiate a delayed-delivery transaction after it is entered into, and may sell delayed-delivery investments before they are delivered, which may result in a realized gain or loss. During this period, such investments are subject to market fluctuations, and the Fund identifies investments segregated in its records with a value at least equal to the amount of the commitment. The Fund, as shown on the Schedule of Investments, had when-issued or delayed-delivery investments as of June 30, 2014.
Mortgage Related and Other Asset Backed Securities – The Fund may invest in mortgage related and other asset backed securities. These securities include mortgage pass-through securities, collateralized mortgage obligations, commercial mortgage backed securities, stripped mortgage backed securities, asset backed securities, collateralized debt obligations and other securities that directly or indirectly represent a participation in, or are secured by and payable from, mortgage loans on real property. Mortgage related securities are created from pools of residential or commercial mortgage loans, including mortgage loans made by savings and loan institutions, mortgage bankers, commercial banks and others. Asset backed securities are created from many types of assets, including auto loans, credit card receivables, home equity loans, and student loans. These securities provide a monthly payment that consists of both interest and principal payments. Interest payments may be determined by fixed or adjustable rates. The rate of pre-payments on underlying mortgages will affect the price and volatility of a mortgage related security, and may have the effect of shortening or extending the effective duration of the security relative to what was anticipated at the time of purchase. The timely payment of principal and interest of certain mortgage related securities is guaranteed by the full faith and credit of the United States Government. Mortgage related and other asset backed securities created and guaranteed by non-governmental issuers, including government-sponsored corporations, may be supported by various forms of insurance or guarantees, but there can be no assurance that the private insurers or guarantors can meet their obligations under the insurance policies or guarantee arrangements. The Fund, as shown on the Schedule of Investments, had outstanding mortgage related and other asset backed securities as of June 30, 2014.
Financial Derivative Instruments:
The following disclosures contain information on how and why the Fund uses derivative instruments, the credit-risk-related contingent features in certain derivative instruments, and how derivative instruments affect the Fund’s financial position and results of operations. The location and fair value amounts of these instruments on the Statement of Assets and Liabilities and the realized gains and losses and changes in unrealized gains and losses on the Statement of Operations, each categorized by type of derivative contract, are included in the following Additional Derivative Instrument Information footnote. The derivative instruments outstanding as of period-end are disclosed
Hartford Portfolio Diversifier HLS Fund
Notes to Financial Statements – (continued)
June 30, 2014 (Unaudited)
(000’s Omitted)
in the notes to or within the Schedule of Investments for purchased options, if applicable. The amounts of realized gains and losses and changes in unrealized gains and losses on derivative instruments during the period are disclosed in the Statement of Operations.
Futures Contracts – The Fund may enter into futures contracts. A futures contract is an agreement between two parties to buy or sell an asset at a set price on a future date. The Fund uses futures contracts to manage or obtain exposure to the investment markets, commodities, or movements in interest rates and currency values. The primary risks associated with the use of futures contracts are the imperfect correlation between the change in market value of the investments held by the Fund and the prices of futures contracts and the possibility of an illiquid market. Upon entering into a futures contract, the Fund is required to deposit with a futures commission merchant (“FCM”) an amount of cash or U.S. Government or Agency Obligations in accordance with the initial margin requirements of the broker or exchange. Futures contracts are marked to market daily at the most recent settlement price reported by an exchange on which, over time, they are traded most extensively, and an appropriate payable or receivable for the change in value (“variation margin”) is recorded by the Fund. Gains or losses are recognized but not considered realized until the contracts expire or are closed. Futures contracts involve, to varying degrees, risk of loss in excess of the variation margin disclosed on the Statement of Assets and Liabilities; however, the Fund seeks to reduce this risk through the use of an FCM. The Fund, as shown on the Schedule of Investments, had outstanding futures contracts as of June 30, 2014.
Options Contracts – An option contract is a contract sold by one party to another party that offers the buyer the right, but not the obligation, to buy (call) or sell (put) an investment or other financial asset at an agreed-upon price during a specific period of time or on a specific date. The Fund may write (sell) covered call and put options on futures, swaps (“swaptions”), securities, commodities or currencies. “Covered” means that so long as the Fund is obligated as the writer of an option, it will own either the underlying investments or currency or an option to purchase the same underlying investments or currency having an expiration date of the covered option and an exercise price equal to or less than the exercise price of the covered option, or will pledge cash or other liquid investments having a value equal to or greater than the fluctuating market value of the option investment or currency. Writing put options increases the Fund’s exposure to the underlying instrument. Writing call options decreases the Fund’s exposure to the underlying instrument. Premiums received from writing options that expire are treated as realized gains. Premiums received from writing options that are exercised or closed are added to the proceeds or offset amounts paid on the underlying futures, swap, investment or currency transaction to determine the realized gain or loss. The Fund as a writer of an option has no control over whether the underlying instrument may be sold (call) or purchased (put) and as a result bears the market risk of an unfavorable change in the price of the instrument underlying the written option. There is the risk the Fund may not be able to enter into a closing transaction because of an illiquid market. The Fund may also purchase put and call options. Purchasing call options increases the Fund’s exposure to the underlying instrument. Purchasing put options decreases the Fund’s exposure to the underlying instrument. The Fund pays a premium, which is included on the Fund’s Statement of Assets and Liabilities as an investment and is subsequently marked to market to reflect the current value of the option. Premiums paid for purchasing options that expire are treated as realized losses. Certain options may be purchased with premiums to be determined on a future date. The premiums for these options are based upon implied volatility parameters at specified terms. The risk associated with purchasing put and call options is generally limited to the premium paid. Premiums paid for purchasing options that are exercised or closed are added to the amounts paid or offset against the proceeds on the underlying investment transaction to determine the realized gain or loss. Entering into over-the-counter options also exposes the Fund to counterparty risk. Counterparty risk is the possibility that the counterparty to the agreements may default on its obligation to perform or disagree as to the meaning of the contractual terms in the agreements.
The Fund, as shown on the Schedule of Investments, had outstanding purchased and written option contracts as of June 30, 2014. There were no transactions involving written option contracts during the six-month period ended June 30, 2014.
Hartford Portfolio Diversifier HLS Fund
Notes to Financial Statements – (continued)
June 30, 2014 (Unaudited)
(000’s Omitted)
Additional Derivative Instrument Information:
| Fair Value of Derivative Instruments on the Statement of Assets and Liabilities as of June 30, 2014: |
| |
| | | Risk Exposure Category | |
| | | Interest Rate
Contracts | | | Foreign
Exchange
Contracts | | | Credit
Contracts | | | Equity
Contracts | | | Commodity
Contracts | | | Other
Contracts | | | Total | |
| Assets: | | | | | | | | | | | | | | | | | | | | | | | | | | | | |
| Investments in securities, at value (purchased option contracts), market value | | $ | — | | | $ | — | | | $ | — | | | $ | 1,865 | | | $ | — | | | $ | — | | | $ | 1,865 | |
| Variation margin receivable * | | | — | | | | — | | | | — | | | | — | | | | — | | | | — | | | | — | |
| Total | | $ | — | | | $ | — | | | $ | — | | | $ | 1,865 | | | $ | — | | | $ | — | | | $ | 1,865 | |
| | | | | | | | | | | | | | | | | | | | | | | | | | | | | |
| Liabilities: | | | | | | | | | | | | | | | | | | | | | | | | | | | | |
| Variation margin payable * | | $ | — | | | $ | — | | | $ | — | | | $ | 43 | | | $ | — | | | $ | — | | | $ | 43 | |
| Written option contracts, market value | | | — | | | | — | | | | — | | | | 663 | | | | — | | | | — | | | | 663 | |
| Total | | $ | — | | | $ | — | | | $ | — | | | $ | 706 | | | $ | — | | | $ | — | | | $ | 706 | |
| * | Only current day's variation margin is reported within the Statement of Assets and Liabilities. The variation margin is included in the open futures cumulative depreciation of $(1,710) as reported in the Schedule of Investments. |
The volume of derivatives that is presented in the Schedule of Investments is consistent with the derivative activity during the six-month period ended June 30, 2014.
| The Effect of Derivative Instruments on the Statement of Operations for the six-month period ended June 30, 2014: |
| |
| | | Risk Exposure Category | |
| | | Interest Rate
Contracts | | | Foreign
Exchange
Contracts | | | Credit
Contracts | | | Equity
Contracts | | | Commodity
Contracts | | | Other
Contracts | | | Total | |
| Realized Loss on Derivatives Recognized as a Result of Operations: |
| Net realized loss on futures contracts | | $ | — | | | $ | — | | | $ | — | | | $ | (21,192 | ) | | $ | — | | | $ | — | | | $ | (21,192 | ) |
| Total | | $ | — | | | $ | — | | | $ | — | | | $ | (21,192 | ) | | $ | — | | | $ | — | | | $ | (21,192 | ) |
| | | | | | | | | | | | | | | | | | | | | | | | | | | | | |
| Net Change in Unrealized Appreciation (Depreciation) on Derivatives Recognized as a Result of Operations: |
| Net change in unrealized depreciation of investments in purchased option contracts | | $ | — | | | $ | — | | | $ | — | | | $ | (1,875 | ) | | $ | — | | | $ | — | | | $ | (1,875 | ) |
| Net change in unrealized appreciation of futures contracts | | | — | | | | — | | | | — | | | | 6,003 | | | | — | | | | — | | | | 6,003 | |
| Net change in unrealized appreciation of written option contracts | | | — | | | | — | | | | — | | | | 812 | | | | — | | | | — | | | | 812 | |
| Total | | $ | — | | | $ | — | | | $ | — | | | $ | 4,940 | | | $ | — | | | $ | — | | | $ | 4,940 | |
Balance Sheet Offsetting Information - Set forth below are tables which disclose both gross information and net information about instruments and transactions eligible for offset in the financial statements, and instruments and transactions that are subject to a master netting arrangement, as well as amounts related to margin, reflected as financial collateral (including cash collateral), held at clearing brokers, counterparties and the Fund’s custodian. The master netting arrangements allow the clearing brokers to net any collateral held in or on behalf of the Fund, or liabilities or payment obligations of the clearing brokers to the Fund, against any liabilities or payment obligations of the Fund to the clearing brokers. The Fund is required to deposit financial collateral (including cash collateral) at the Futures Commission Merchant's (FCM) custodian on behalf of clearing brokers and counterparties to continually meet the original and maintenance requirements established by the clearing brokers and counterparties. Such requirements are specific to the respective clearing broker or counterparty. Certain master netting arrangements may not be enforceable in a bankruptcy.
Hartford Portfolio Diversifier HLS Fund
Notes to Financial Statements – (continued)
June 30, 2014 (Unaudited)
(000’s Omitted)
| Offsetting of Financial Assets and Derivative Assets as of June 30, 2014: |
| | | | |
| | | Gross Amounts*
of Assets
Presented in
Statement of
Assets and
Liabilities | | | Financial
Instruments with
Allowable Netting | | | Non-cash
Collateral
Received | | | Cash Collateral
Received | | | Net Amount (not
less than $0) | |
| Description | | | | | | | | | | | | | | | | | | | | |
| Purchased option contracts at market value | | $ | 1,865 | | | $ | (663 | ) | | $ | (1,857 | ) | | $ | — | | | $ | — | |
| Total subject to a master netting or similar arrangement | | $ | 1,865 | | | $ | (663 | ) | | $ | (1,857 | ) | | $ | — | | | $ | — | |
* Gross amounts presented as no amounts are netted within the Statements of Assets and Liabilities.
| Offsetting of Financial Liabilities and Derivative Liabilities as of June 30, 2014: |
| | | | |
| | | Gross Amounts*
of Liabilities
Presented in
Statement of
Assets and
Liabilities | | | Financial
Instruments with
Allowable Netting | | | Non-cash
Collateral
Pledged | | | Cash Collateral
Pledged | | | Net Amount (not
less than $0) | |
| Description | | | | | | | | | | | | | | | | | | | | |
| Written option contracts at market value | | $ | 663 | | | $ | (663 | ) | | $ | — | | | $ | — | | | $ | — | |
| Total subject to a master netting or similar arrangement | | $ | 663 | | | $ | (663 | ) | | $ | — | | | $ | — | | | $ | — | |
* Gross amounts presented as no amounts are netted within the Statement of Assets and Liabilities.
Certain derivatives held by the Fund, as of June 30, 2014, are not subject to a master netting arrangement and are excluded from the table above.
Principal Risks:
Credit risk depends largely on the perceived financial health of bond issuers. In general, the credit rating is inversely related to the credit risk of the issuer. Higher rated bonds generally are deemed to have less credit risk, while lower or unrated bonds are deemed to have higher risk of default. The share price, yield and total return of a fund that holds securities with higher credit risk may be more volatile than those of a fund that holds bonds with lower credit risk. Similar to credit risk, the Fund may be exposed to counterparty risk, or the risk that an institution or other entity with which the Fund has unsettled or open transactions will default.
The Fund’s investments expose the Fund to various risks including, but not limited to, interest rate, prepayment, extension and equity risks. Interest rate risk is the risk that fixed income securities will decline in value because of changes in interest rates. As nominal interest rates rise, the values of certain fixed income securities held by the Fund are likely to decrease. A nominal interest rate can be described as the sum of a real interest rate and an expected inflation rate. Fixed income securities with longer durations tend to be more sensitive to changes in interest rates, usually making them more volatile than securities with shorter durations. Duration is useful primarily as a measure of the sensitivity of a fixed income security’s market price to interest rate (i.e., yield) movements. Rising interest rates may cause prepayments to occur at a slower than expected rate, thereby effectively lengthening the maturity of the security and making the security more sensitive to interest rate changes. Prepayment and extension risk are major risks of mortgage backed securities and certain asset backed securities. For certain asset backed securities, the actual maturity may be less than the stated maturity shown in the Schedule of Investments, if applicable. As a result, the timing of income recognition relating to these securities may vary based upon the actual maturity.
The market values of equity securities, such as common stocks and preferred stocks, or equity related investments, such as futures and options, may decline due to general market conditions which are not specifically related to a particular company, such as real or perceived adverse economic conditions, changes in the general outlook for corporate earnings, changes in interest or currency rates or adverse investor sentiment generally. The market value of equity securities may also decline due to factors which affect a particular
Hartford Portfolio Diversifier HLS Fund
Notes to Financial Statements – (continued)
June 30, 2014 (Unaudited)
(000’s Omitted)
industry or industries, such as labor shortages or increased production costs and competitive conditions within an industry. Equity securities and equity related investments generally have greater market price volatility than fixed income securities.
Federal Income Taxes:
Federal Income Taxes – For federal income tax purposes, the Fund intends to continue to qualify as a RIC under Subchapter M of the Internal Revenue Code (“IRC”) by distributing substantially all of its taxable net investment income and net realized capital gains to its shareholders and otherwise complying with the requirements of the IRC. The Fund has distributed substantially all of its income and capital gains in prior years, if applicable, and intends to distribute substantially all of its income and capital gains prior to the next fiscal year-end. Accordingly, no provision for federal income or excise taxes has been made in the accompanying financial statements. Distributions from short-term capital gains are treated as ordinary income distributions for federal income tax purposes.
Net Investment Income (Loss), Net Realized Gains (Losses) and Distributions – Net investment income (loss) and net realized gains (losses) may differ for financial statement and tax purposes primarily because of losses deferred due to wash sale adjustments, foreign currency gains and losses, adjustments related to PFICs, REITs, RICs, certain derivatives and partnerships. The character of distributions made during the year from net investment income or net realized gains may differ from their ultimate characterization for federal income tax purposes. Also, due to the timing of dividend distributions, the fiscal year in which amounts are distributed may differ from the year that the income or realized gains (losses) were recorded by the Fund.
Distributions and Components of Distributable Earnings – The tax character of distributions paid by the Fund for the periods indicated is as follows (as adjusted for dividends payable, if applicable):
| | | For the Year Ended
December 31, 2013 | | | For the Year Ended
December 31, 2012 | |
| Ordinary Income | | $ | 1,833 | | | $ | 1,025 | |
As of December 31, 2013, the Fund’s components of distributable earnings (deficit) on a tax basis are as follows:
| | | Amount | |
| Undistributed Ordinary Income | | $ | 9 | |
| Accumulated Capital and Other Losses | | | (81,661 | ) |
| Unrealized Appreciation* | | | 16,033 | |
| Total Accumulated Deficit | | $ | (65,619 | ) |
| * | Differences between book-basis and tax-basis unrealized appreciation (depreciation) may be attributable to the losses deferred due to wash sale adjustments, foreign currency gains and losses, adjustments related to PFICs, REITs, RICs, certain derivatives and partnerships. |
Reclassification of Capital Accounts – The Fund may record reclassifications in its capital accounts. These reclassifications have no impact on the total net assets of the Fund. The reclassifications are a result of permanent differences between U.S. GAAP and tax accounting for such items as foreign currency, PFICs, expiration or utilization of capital loss carryforwards or net operating losses. Adjustments are made to reflect the impact these items have on current and future distributions to shareholders. Therefore, the source of the Fund’s distributions may be shown in the accompanying Statement of Changes in Net Assets as from undistributed net investment income, from accumulated net realized gains on investments or from capital depending on the type of book and tax differences that exist. For the year ended December 31, 2013, the Fund recorded reclassifications to increase (decrease) the accounts listed below:
| | | Amount | |
| Undistributed Net Investment Income (Loss) | | $ | 698 | |
| Accumulated Net Realized Gain (Loss) | | | (690 | ) |
| Capital Stock and Paid-in-Capital | | | (8 | ) |
Hartford Portfolio Diversifier HLS Fund
Notes to Financial Statements – (continued)
June 30, 2014 (Unaudited)
(000’s Omitted)
Capital Loss Carryforward – On December 22, 2010, the Regulated Investment Company Modernization Act of 2010 (the “Act”) was enacted, which made changes to the capital loss carryforward rules. The changes are effective for taxable years beginning after the date of enactment. Under the Act, funds are permitted to carry forward capital losses for an unlimited period. Additionally, capital loss carryforwards retain their character as either short-term or long-term capital losses rather than being considered all short-term as permitted under prior regulation.
At December 31, 2013 (tax year end), the Fund had capital loss carryforwards for U.S. federal income tax purposes as follows:
| | | Amount | |
| Short-Term Capital Loss Carryforward | | $ | 36,057 | |
| Long-Term Capital Loss Carryforward | | | 45,604 | |
| Total | | $ | 81,661 | |
Accounting for Uncertainty in Income Taxes – The Fund has adopted financial reporting rules that require the Fund to analyze all open tax years, as defined by the statute of limitations, for all major jurisdictions. Generally, tax authorities can examine all tax returns filed for the last three years. The Fund does not have an examination in progress.
The Fund has reviewed all open tax years and major jurisdictions and concluded that these financial reporting rules had no effect on the Fund’s financial position or results of operations. There is no tax liability resulting from unrecognized tax benefits relating to uncertain income tax positions taken or expected to be taken on the tax return for the fiscal year ended December 31, 2013. The Fund is also not aware of any tax positions for which it is reasonably possible that the total amounts of unrecognized tax benefits will significantly change in the next twelve months.
Expenses:
Investment Management Agreement – Hartford Funds Management Company, LLC (“HFMC”) serves as the Fund’s investment manager pursuant to an Investment Management Agreement with the Company. HFMC is an indirect wholly owned subsidiary of The Hartford Financial Services Group, Inc. (“The Hartford”). The investment manager has overall investment supervisory responsibility for the Fund. In addition, the investment manager provides administrative personnel, services, equipment, facilities and office space for proper operation of the Fund. HFMC has contracted with Hartford Investment Management Company (“Hartford Investment Management”) under a sub-advisory agreement for the provision of day-to-day investment management services to the Fund in accordance with the Fund’s investment objective and policies. The Fund pays a fee to the investment manager, a portion of which may be used to compensate Hartford Investment Management.
The schedule below reflects the rates of compensation paid to the investment manager for investment management services rendered as of June 30, 2014; the rates are accrued daily and paid monthly:
| Average Daily Net Assets | | | Annual Fee |
| On first $500 million | | | 0.60% |
| On next $500 million | | | 0.55% |
| On next $4 billion | | | 0.50% |
| On next $5 billion | | | 0.48% |
| Over $10 billion | | | 0.47% |
Hartford Portfolio Diversifier HLS Fund
Notes to Financial Statements – (continued)
June 30, 2014 (Unaudited)
(000’s Omitted)
Accounting Services Agreement – Pursuant to the Fund Accounting Agreement between HFMC and the Company, on behalf of the Fund, HFMC provides accounting services to the Fund and receives monthly compensation based on the Fund’s average daily net assets at the rates set forth below. The Fund’s accounting services fees are accrued daily and paid monthly.
| Average Daily Net Assets | | | Annual Fee |
| On first $5 billion | | | 0.018% |
| On next $5 billion | | | 0.014% |
| Over $5 billion | | | 0.010% |
Operating Expenses – Allocable expenses incurred by the Company are allocated to each Fund in proportion to the average daily net assets of the Fund, except where allocation of certain expenses is more fairly made directly to the Fund. HFMC has contractually agreed to reimburse expenses (exclusive of taxes, interest expense, brokerage commissions, acquired fund fees and expenses and extraordinary expenses) to the extent necessary to maintain total annual operating expenses for the Class IB shares of the Fund at the annual rate of 0.85% of the Fund’s average daily net assets. This contractual arrangement will remain in effect until April 30, 2015, and shall renew automatically for one-year terms unless HFMC provides written notice of termination prior to the start date of the next term or upon approval of the Board of Directors of the Company.
Distribution Plan for Class IB Shares – Hartford Funds Distributors, LLC (“HFD”), an indirect wholly owned subsidiary of The Hartford, is the principal underwriter and distributor of the Fund. The Company, on behalf of the Fund, has adopted a Distribution Plan pursuant to Rule 12b-1 of the 1940 Act for Class IB shares.
The Distribution Plan provides that the Fund may pay annually up to 0.25% of the average daily net assets of the Fund attributable to its Class IB shares for activities primarily intended to result in the sale of Class IB shares. The Board has the authority to suspend or reduce these payments at any point in time. Under the terms of the Distribution Plan and the principal underwriting agreement, the Fund is authorized to make payments monthly to the distributor that may be used to pay or reimburse entities providing distribution and shareholder servicing with respect to the Class IB shares for such entities’ fees or expenses incurred or paid in that regard. The distribution fee paid during the period can be found on the Statement of Operations. These fees are accrued daily and paid monthly.
Other Related Party Transactions – Hartford Administrative Services Company (“HASCO”), an indirect wholly owned subsidiary of The Hartford, provides transfer agent services to the Fund. HASCO was compensated on a per account basis for providing such services. The amount paid to HASCO can be found in the Statement of Operations. These fees are accrued daily and paid monthly.
Affiliate Holdings:
As of June 30, 2014, affiliates of The Hartford had ownership of shares in the Fund as follows:
| | | Percentage of
Class | |
| Class IB | | | 10% | |
Investment Transactions:
For the six-month period ended June 30, 2014, the cost of purchases and proceeds from sales of investment securities (excluding short-term investments) were as follows:
| | | Excluding U.S.
Government
Obligations | | | U.S.
Government
Obligations | | | Total | |
| Cost of Purchases | | $ | 15,685 | | | $ | 24,011 | | | $ | 39,696 | |
| Sales Proceeds | | | 19,084 | | | | 29,808 | | | | 48,892 | |
Hartford Portfolio Diversifier HLS Fund
Notes to Financial Statements – (continued)
June 30, 2014 (Unaudited)
(000’s Omitted)
Industry Classifications:
Other than the industry classifications "Other Investment Pools and Funds" and "Exchange Traded Funds," equity industry classifications used in this report are the Global Industry Classification Standard, which was developed by and is the exclusive property and service mark of MSCI, Inc. and Standard & Poor's.
Indemnifications:
Under the Company's organizational documents, the Company shall indemnify its officers and directors to the full extent required or permitted under Maryland General Corporation Law and the federal securities laws. In addition, the Company, on behalf of the Fund, may enter into contracts that contain a variety of indemnifications. The Company's maximum exposure under these arrangements is unknown. However, as of the date of these financial statements, the Company has not had prior claims or losses pursuant to these contracts and expects the risk of loss to be remote.
Pending Legal Proceedings:
On February 25, 2011, Jennifer L. Kasilag, Louis Mellinger, Judith M. Menendez, Jacqueline M. Robinson, and Linda A. Russell filed a derivative lawsuit against Hartford Investment Financial Services, LLC (“HIFSCO”) (now known as Hartford Funds Distributors, LLC) on behalf of six Hartford retail mutual funds in the United States District Court for the District of New Jersey, alleging that HIFSCO received excessive advisory and distribution fees in violation of its statutory fiduciary duty under Section 36(b) of the 1940 Act when serving as investment manager and principal underwriter, respectively, to the Hartford retail mutual funds. Although this action was purportedly filed on behalf of certain of the Hartford Funds, none of the Hartford Funds is itself a defendant to the suit. HIFSCO moved to dismiss and, in September 2011, the motion was granted in part and denied in part, with leave to amend the complaint. In November 2011, plaintiffs filed an amended complaint on behalf of certain Hartford retail mutual funds, The Hartford Global Health Fund (now known as The Hartford Healthcare Fund), The Hartford Conservative Allocation Fund, The Hartford Growth Opportunities Fund, The Hartford Inflation Plus Fund, The Hartford Advisers Fund (now known as The Hartford Balanced Fund), and The Hartford Capital Appreciation Fund. Plaintiffs seek to rescind the investment management agreements and distribution plans between HIFSCO and these funds and to recover the total fees charged thereunder or, in the alternative, to recover any improper compensation HIFSCO received, in addition to lost earnings. HIFSCO filed a partial motion to dismiss the amended complaint and, in December 2012, the court dismissed without prejudice the claims regarding distribution fees and denied the motion with respect to the advisory fees claims. HIFSCO disputes the allegations and intends to defend vigorously.
In March 2014, the plaintiffs filed a new complaint that added as new plaintiffs The Hartford Floating Rate Fund and The Hartford Small Company Fund and named as a defendant Hartford Funds Management Company, LLC (the “Investment Manager”), which assumed the role as investment adviser to the funds as of January 2013. The Investment Manager and HIFSCO dispute the allegations and intend to defend vigorously.
This action concerns the activities of HIFSCO in its capacity as investment manager and principal underwriter to the Hartford retail mutual funds and does not concern HIFSCO’s activities in its capacity as principal underwriter to the HLS funds. For this reason, no accrual for litigation relating to this matter has been recorded in the financial statements of the Fund.
Subsequent Events:
At a meeting held on May 6, 2014, the Board of Directors of the Company approved on behalf of the Fund, the reorganization of the Fund with and into the HIMCO VIT Portfolio Diversifier Fund (the “HVIT Portfolio Diversifier Fund”) (the “Reorganization”). The HVIT Portfolio Diversifier Fund is a newly organized series of HIMCO Variable Insurance Trust.
The Board of Directors of the Company has called for a Special Meeting of Shareholders of the Fund to be held in September 2014, for the purpose of seeking approval of the Agreement and Plan of Reorganization by the shareholders of the Fund. If approved, the Reorganization is expected to occur in October 2014.
Hartford Portfolio Diversifier HLS Fund
Financial Highlights
| | | ─ Selected Per-Share Data(A) ─ | | | ─ Ratios and Supplemental Data ─ | |
| Class | | Net Asset
Value at
Beginning
of Period | | | Net
Investment
Income
(Loss) | | | Net
Realized
and
Unrealized
Gain (Loss)
on
Investments | | | Total from
Investment
Operations | | | Dividends
from Net
Investment
Income | | | Distributions
from
Realized
Capital
Gains | | | Total
Dividends
and
Distributions | | | Net
Asset
Value at
End of
Period | | | Total
Return(B) | | | Net
Assets
at End of
Period
(000s) | | | Ratio of
Expenses
to
Average
Net
Assets
Before
Adjust-
ments(C) | | | Ratio of
Expenses
to
Average
Net
Assets
After
Adjust-
ments(C) | | | Ratio of
Net
Investment
Income
(Loss) to
Average
Net Assets | |
| | | | | | | | | | | | | | | | | | | | | | | | | | | | | | | | | | | | | | | | |
| For the Six-Month Period Ended June 30, 2014 (Unaudited) |
| IB | | $ | 8.13 | | | $ | 0.02 | | | $ | (0.09 | ) | | $ | (0.07 | ) | | $ | – | | | $ | – | | | $ | – | | | $ | 8.06 | | | | (0.86 | )%(D) | | $ | 440,352 | | | | 0.89 | %(E) | | | 0.85 | %(E) | | | 0.55 | %(E) |
| | | | | | | | | | | | | | | | | | | | | | | | | | | | | | | | | | | | | | | | | | | | | | | | | | | | | |
| For the Year Ended December 31, 2013 |
| IB | | $ | 9.38 | | | $ | 0.03 | | | $ | (1.25 | ) | | $ | (1.22 | ) | | $ | (0.03 | ) | | $ | – | | | $ | (0.03 | ) | | $ | 8.13 | | | | (12.96 | )% | | $ | 443,121 | | | | 0.89 | % | | | 0.85 | % | | | 0.29 | % |
| | | | | | | | | | | | | | | | | | | | | | | | | | | | | | | | | | | | | | | | | | | | | | | | | | | | | |
| For the Year Ended December 31, 2012 (F) |
| IB | | $ | 10.18 | | | $ | 0.02 | | | $ | (0.79 | ) | | $ | (0.77 | ) | | $ | (0.03 | ) | | $ | – | | | $ | (0.03 | ) | | $ | 9.38 | | | | (7.58 | )% | | $ | 295,762 | | | | 0.91 | % | | | 0.85 | % | | | 0.27 | % |
| | | | | | | | | | | | | | | | | | | | | | | | | | | | | | | | | | | | | | | | | | | | | | | | | | | | | |
| From June 6, 2011 (commencement of operations) through December 31, 2011 |
| IB(G) | | $ | 10.00 | | | $ | 0.04 | | | $ | 0.19 | | | $ | 0.23 | | | $ | (0.03 | ) | | $ | (0.02 | ) | | $ | (0.05 | ) | | $ | 10.18 | | | | 2.38 | %(D) | | $ | 106,581 | | | | 0.93 | %(E) | | | 0.85 | %(E) | | | 0.58 | %(E) |
| (A) | Information presented relates to a share outstanding throughout the indicated period. Net investment income (loss) per share amounts are calculated based on average shares outstanding unless otherwise noted. |
| (B) | The figures do not include sales charges or other fees which may be applied at the variable annuity product level. Any such additional sales charges or other fees would lower the Fund's performance. |
| (C) | Adjustments include waivers and reimbursements, if applicable. |
| (F) | Net investment income (loss) per share amounts have been calculated using the SEC method. |
| (G) | Commenced operations on June 6, 2011. |
| | | Portfolio Turnover
Rate for
All Share Classes | |
| For the Six-Month Period Ended June 30, 2014 (Unaudited) | | | 14% | |
| For the Year Ended December 31, 2013 | | | 31 | |
| For the Year Ended December 31, 2012 | | | 61 | |
| From June 6, 2011 (commencement of operations) through December 31, 2011 | | | 43 | |
Hartford Portfolio Diversifier HLS Fund
Directors and Officers (Unaudited)
The Board of Directors of the Company (the "Directors") appoints officers who are responsible for the day-to-day operations of the Fund and who execute policies formulated by the Directors. Each Director serves until his or her death, resignation, or retirement or until the next annual meeting of shareholders is held or until his or her successor is elected and qualifies.
Directors and officers who are employed by or who have a financial interest in The Hartford are considered “interested” persons of the Fund pursuant to the 1940 Act. Each officer and two of the Company's Directors, as noted in the chart below, are “interested” persons of the Fund. Each Director serves as a director for The Hartford Mutual Funds, Inc., The Hartford Mutual Funds II, Inc., Hartford Series Fund, Inc., and Hartford HLS Series Fund II, Inc., and as a trustee for The Hartford Alternative Strategies Fund, which, as of June 30, 2014, collectively consist of 78 funds. Correspondence may be sent to Directors and officers c/o Hartford Funds, 5 Radnor Corporate Center, Suite 300, 100 Matsonford Road, Radnor, Pennsylvania 19087, except that correspondence to Mr. Annoni, Mr. Dressen and Ms. Quade may be sent to 500 Bielenberg Drive, Suite 500, Woodbury, Minnesota 55125.
The table below sets forth, for each Director and officer, his or her name, year of birth, current position with the Company and date first elected or appointed to Hartford Series Fund, Inc. ("HSF") and Hartford HLS Series Fund II, Inc. ("HSF2"), principal occupation, and, for Directors, other directorships held. The Fund’s Statement of Additional Information contains further information on the Directors and is available free of charge by calling 1-888-843-7824 or writing to: Hartford HLS Funds, c/o Hartford Life Insurance Company/Hartford Life and Annuity Insurance Company, P.O. Box 14293, Lexington, KY 40512-4293 for variable annuity and variable life insurance separate accounts of Hartford Life Insurance Company and its affiliates; Hartford Funds, P.O. Box 55022, Boston, MA 02205-5022 for all shareholders except variable annuity and variable life insurance separate accounts of Hartford Life Insurance Company and its affiliates.
Information on the aggregate remuneration paid to the directors of the Company can be found in the Statement of Operations herein. The Fund pays to The Hartford a portion of the Chief Compliance Officer’s compensation, but does not pay salaries or compensation to any of its other officers or Directors who are employed by The Hartford.
Non-Interested Directors
Lynn S. Birdsong (1946) Director since 2003, Co-Chairman of the Investment Committee since 2005
Mr. Birdsong is a private investor. Mr. Birdsong currently serves as a Director of the Sovereign High Yield Investment Company (April 2010 to current). Mr. Birdsong currently serves as an Independent Director of Nomura Partners Funds, Inc. (formerly, The Japan Fund) (April 2003 to current). From 2003 to March 2005, Mr. Birdsong was an Independent Director of the Atlantic Whitehall Funds. From 1979 to 2002, Mr. Birdsong was a Managing Director of Zurich Scudder Investments, an investment management firm. During his employment with Scudder, Mr. Birdsong was an Interested Director of The Japan Fund. From January 1981 through December 2013, Mr. Birdsong was a partner in Birdsong Company, an advertising specialty firm.
Robert M. Gavin, Jr. (1940) Director since 2002 (HSF) and 1986 (HSF2), Chairman of the Board since 2004
Dr. Gavin is an educational consultant. Prior to September 1, 2001, he was President of Cranbrook Education Community and prior to July 1996, he was President of Macalester College, St. Paul, Minnesota.
Duane E. Hill (1945) Director since 2001 (HSF) and 2002 (HSF2), Chairman of the Nominating Committee since 2003
Mr. Hill is a Partner of TSG Ventures L.P., a private equity investment company. Mr. Hill is a former partner of TSG Capital Group, a private equity investment firm that served as sponsor and lead investor in leveraged buyouts of middle market companies.
Sandra S. Jaffee (1941) Director since 2005
Ms. Jaffee is the founder and Chief Executive Officer of a private company, Homeworks Concierge, LLC, which provides residential property management services in Westchester County, New York (January 2012 to present). Ms. Jaffee served as Chairman (2008 to 2009) and Chief Executive Officer of Fortent (formerly Searchspace Group), a leading provider of compliance/regulatory technology to financial institutions from August 2005 to August 2009. From August 2004 to August 2005, Ms. Jaffee served as an Entrepreneur in Residence with Warburg Pincus, a private equity firm. Prior to joining Warburg Pincus, Ms. Jaffee served as Executive Vice President at Citigroup, from September 1995 to July 2004, where she was President and Chief Executive Officer of Citibank’s Global Securities Services (1995 to 2003). Ms. Jaffee currently serves as a member of the Board of Directors of Broadridge Financial Solutions as well as a Trustee of Muhlenberg College.
Hartford Portfolio Diversifier HLS Fund
Directors and Officers (Unaudited) – (continued)
William P. Johnston (1944) Director since 2005, Chairman of the Compliance Committee since 2005
In June 2006, Mr. Johnston was appointed as Senior Advisor to The Carlyle Group, a global private equity and other alternative asset investment firm and currently serves as an Operating Executive. In July 2006, Mr. Johnston was elected to the Board of Directors of MultiPlan, Inc. and served as a Director (July 2006 to August 2010). In August 2007, Mr. Johnston was elected to the Board of Directors of LifeCare Holdings, Inc. and served as a Director (August 2007 to June 2013). In February 2008, Mr. Johnston was elected to the Board of Directors of HCR-ManorCare, Inc. In May 2006, Mr. Johnston was elected to the Supervisory Board of Fresenius Medical Care AG & Co. KGaA, after its acquisition of Renal Care Group, Inc. in March 2006. Mr. Johnston joined Renal Care Group in November 2002 as a member of the Board of Directors and served as Chairman of the Board from March 2003 through March 2006. From 2002 through 2013, Mr. Johnston served as a Board member of the Georgia O’Keefe Museum. From September 1987 to December 2002, Mr. Johnston was with Equitable Securities Corporation (and its successors, SunTrust Equitable Securities and SunTrust Robinson Humphrey) serving in various investment banking and managerial positions, including Managing Director and Head of Investment Banking, Chief Executive Officer and Vice Chairman.
Phillip O. Peterson (1944) Director since 2002 (HSF) and 2000 (HSF2), Chairman of the Audit Committee since 2002
Mr. Peterson is a mutual fund industry consultant. He was a partner of KPMG LLP (an accounting firm) until July 1999. Mr. Peterson joined William Blair Funds in February 2007 as a member of the Board of Trustees. From February 2012 to February 2014, Mr. Peterson served as a Trustee of Symetra Variable Mutual Funds. From January 2004 to April 2005, Mr. Peterson served as Independent President of the Strong Mutual Funds.
Lemma W. Senbet (1946) Director since 2005
Dr. Senbet is the William E. Mayer Chair Professor of Finance and Founding Director, Center for Financial Policy, at the University of Maryland, Robert H. Smith School of Business. He was chair of the Finance Department of the University of Maryland, Robert H. Smith School of Business from 1998 to 2006. Since June 2013, he has been on leave from the University to serve as Executive Director of African Economic Research Consortium which focuses on economic policy research and training. Previously, he was a chaired professor of finance at the University of Wisconsin-Madison. Also, he was a Director of the Fortis Funds from March 2000 to July 2002. Dr. Senbet served as Director of the American Finance Association and President of the Western Finance Association. In 2006, Dr. Senbet was inducted Fellow of Financial Management Association International for his career-long distinguished scholarship and professional service.
Interested Directors and Officers
James E. Davey (1964) Director since 2012, President and Chief Executive Officer since 2010
Mr. Davey serves as Executive Vice President of Hartford Life Insurance Company (“HLIC”) and The Hartford Financial Services Group, Inc. Additionally, Mr. Davey serves as Chairman of the Board, Manager and Senior Managing Director of Hartford Funds Distributors, LLC (“HFD”). He also currently serves as Director, Chairman of the Board, President and Senior Managing Director of Hartford Administrative Services Company (“HASCO”). Mr. Davey also serves as Manager, Chairman of the Board and Senior Managing Director for Hartford Funds Management Company, LLC (“HFMC”) and Director, Chairman of the Board and Senior Managing Director for Hartford Funds Management Group, Inc. ("HFMG"). Mr. Davey has served in various positions within The Hartford and its subsidiaries in connection with the operation of the Hartford Funds. Mr. Davey joined The Hartford in 2002.
Lowndes A. Smith (1939) Director since 1996 (HSF) and 2002 (HSF2), Co-Chairman of the Investment Committee since 2005
Mr. Smith served as Vice Chairman of The Hartford from February 1997 to January 2002, as President and Chief Executive Officer of Hartford Life, Inc. from February 1997 to January 2002, and as President and Chief Operating Officer of The Hartford Life Insurance Companies from January 1989 to January 2002. Mr. Smith serves as a Director of White Mountains Insurance Group Ltd. (October 2003 to current); One Beacon Insurance (October 2006 to current); Symetra Financial (August 2007 to current) and is a Managing Director of Whittington Gray Associates (January 2007 to current).
Other Officers
Mark A. Annoni (1964) Vice President, Controller and Treasurer since 2012
Mr. Annoni currently serves as the Assistant Vice President of HLIC (February 2004 to present) and Senior Vice President of HFMG (December 2013 to present). Mr. Annoni has served in various positions within The Hartford and its subsidiaries in connection with the operation of the Hartford Funds. Mr. Annoni joined The Hartford in 2001.
Hartford Portfolio Diversifier HLS Fund
Directors and Officers (Unaudited) – (continued)
Michael R. Dressen (1963) AML Compliance Officer since 2011
Mr. Dressen currently serves as Assistant Vice President of HLIC. He also serves as Chief Compliance Officer and AML Compliance Officer of HASCO and as AML Officer of HFD. Mr. Dressen has served in various positions within The Hartford and its subsidiaries in connection with the operation of the Hartford Funds.
Edward P. Macdonald (1967) Vice President, Secretary and Chief Legal Officer since 2005
Mr. Macdonald currently serves as Assistant Secretary, Executive Vice President and Deputy General Counsel of HFD, HASCO, HFMC and HFMG. He also serves as Vice President of HLIC. Mr. Macdonald has served in various positions within The Hartford and its subsidiaries in connection with the operation of the Hartford Funds. Mr. Macdonald joined The Hartford in 2005.
Joseph G. Melcher (1973) Vice President and Chief Compliance Officer since 2013
Mr. Melcher currently serves as Executive Vice President of HFD, HFMG and HASCO. Mr. Melcher also currently serves as Executive Vice President and Chief Compliance Officer of HFMC. Mr. Melcher has served in various positions within The Hartford and its subsidiaries in connection with the operation of the Hartford Funds since joining The Hartford in 2012. Prior to joining The Hartford, Mr. Melcher worked at Touchstone Investments, a member of the Western & Southern Financial Group, where he held the position of Vice President and Chief Compliance Officer from 2010 through 2012 and Assistant Vice President, Compliance from 2005 to 2010.
Vernon J. Meyer (1964) Vice President since 2006
Mr. Meyer currently serves as Senior Vice President of HLIC. He also currently serves as Managing Director and Chief Investment Officer of HFMC and Managing Director of HFMG. Mr. Meyer has served in various positions within The Hartford and its subsidiaries in connection with the operation of the Hartford Funds. Mr. Meyer joined The Hartford in 2004.
Laura S. Quade (1969) Vice President since 2012
Ms. Quade currently serves as Vice President of HASCO, HFD and HFMG. She is the Head of Operations of HASCO and also serves as Director, Enterprise Operations of HLIC. Ms. Quade has served in various positions within The Hartford and its subsidiaries in connection with the operation of the Hartford Funds.
Martin A. Swanson (1962) Vice President since 2010
Mr. Swanson currently serves as Vice President of HLIC. Mr. Swanson also serves as Managing Director, Chief Marketing Officer and Principal of HFD and Managing Director of HFMG. Mr. Swanson has served in various positions within The Hartford and its subsidiaries in connection with the operation of the Hartford Funds.
HOW TO OBTAIN A COPY OF THE FUND’S PROXY VOTING POLICIES AND VOTING RECORDS (UNAUDITED)
A description of the policies and procedures that the Fund uses to determine how to vote proxies relating to portfolio securities and information about how the Fund voted proxies relating to portfolio securities during the most recent twelve-month period ended June 30 are available (1) without charge, upon request, by calling 888-843-7824 and (2) on the SEC’s website at http://www.sec.gov.
QUARTERLY PORTFOLIO HOLDINGS INFORMATION (UNAUDITED)
The Fund files a complete schedule of portfolio holdings with the SEC for the first and third quarters of each fiscal year on Form N-Q. The Fund’s Forms N-Q are available (1) without charge, upon request, by calling 888-843-7824 and (2) on the SEC’s website at http://www.sec.gov. The Form N-Q may be reviewed and copied at the SEC’s Public Reference Room in Washington, DC. Information on the operation of the Public Reference Room may be obtained by calling 1-800-SEC-0330.
Hartford Portfolio Diversifier HLS Fund
Expense Example (Unaudited)
Your Fund's Expenses
As a shareholder of the Fund, you incur two types of costs: (1) transaction costs and (2) ongoing costs, including investment management fees, distribution and/or service (12b-1) fees, if any, and other fund expenses. This example is intended to help you understand your ongoing costs (in dollars) of investing in the Fund and to compare these costs with the ongoing costs of investing in other mutual funds. The example is based on an investment of $1,000 invested at the beginning of the period and held for the entire period of December 31, 2013 through June 30, 2014.
Actual Expenses
The first set of columns of the table below provides information about actual account values and actual expenses. You may use the information in this column, together with the amount you invested, to estimate the expenses that you paid over the period. Simply divide your account value by $1,000 (for example, an $8,600 account value divided by $1,000 = 8.6), then multiply the result by the number in the line under the heading entitled “Expenses Paid During Period” to estimate the expenses you paid on your account during this period.
Hypothetical Example for Comparison Purposes
The second set of columns of the table below provides information about hypothetical account values and hypothetical expenses based on the Fund's actual expense ratio and an assumed rate of return of 5% per year before expenses, which is not the Fund's actual return. The hypothetical account values and expenses may not be used to estimate the actual ending account balance or expenses you paid for the period. You may use this information to compare the ongoing costs of investing in the Fund and other funds. To do so, compare this 5% hypothetical example with the 5% hypothetical examples that appear in the shareholder reports of the other funds.
Please note that the expenses shown in the table are meant to highlight your ongoing costs only and do not reflect any transactional costs, such as sales charges (loads) and CDSC. Therefore, the second set of columns of the table is useful in comparing ongoing costs only, and will not help you determine the relative total costs of owning different funds. In addition, if these transactional costs were included, your costs would be higher. Expenses are equal to the Fund's annualized expense ratios multiplied by average account value over the period, multiplied by 181/365 (to reflect the one-half year period).
| | | Actual return | | | Hypothetical (5% return before expenses) | | | | | | | | | | |
| | | Beginning
Account Value
December 31,
2013 | | | Ending Account
Value
June 30, 2014 | | | Expenses paid
during the period
December 31, 2013
through
June 30, 2014 | | | Beginning
Account Value
December
31, 2013 | | | Ending Account
Value
June 30, 2014 | | | Expenses paid
during the period
December 31,
2013
through
June 30, 2014 | | | Annualized
expense
ratio | | | Days
in the
current
1/2
year | | | Days
in the
full
year | |
| Class IB | | $ | 1,000.00 | | | $ | 991.40 | | | $ | 4.20 | | | $ | 1,000.00 | | | $ | 1,020.58 | | | $ | 4.26 | | | | 0.85 | % | | | 181 | | | | 365 | |
Hartford Portfolio Diversifier HLS Fund
Main Risks (Unaudited)
The main risks of investing in the Fund are described below.
Market and Selection Risk: The Fund’s share price may fluctuate due to market risk and/or security selections that may underperform compared to the market or relevant benchmarks.
Derivatives Risk: Investments in derivatives can be volatile. Potential risks include currency risk, leverage risk (the risk that small market movements may result in large changes in the value of an investment), liquidity risk, index risk, pricing risk, and counterparty risk (the risk that the counterparty may be unwilling or unable to honor its obligations).
Fixed Income Risk: The Fund is subject to interest rate risk (the risk that the value of an investment decreases when interest rates rise) and credit risk (the risk that the issuing company of a security is unable to pay interest and principal when due) and call risk (the risk that an investment may be redeemed early). These risks also apply to the Fund’s investments in U.S. government securities, which may not be guaranteed by the U.S. government.
Fund Strategy Risk: The Fund is available solely to holders of variable annuity contracts issued by Hartford Life and its affiliates and by Forethought Life Insurance Company (“Forethought”) who have elected a guaranteed benefit rider subject to an allocation requiring investment in the Fund (a “Rider”). The Fund is designed to replicate the Portfolio Diversifier Index (the “Index”), which is designed to produce investment performance that may mitigate against significant declines in the values of the equity mutual funds (the “Allocated Funds”) held by Rider holders. Hartford Life and its affiliates and Forethought have financial obligations to holders of the Riders arising from guarantee obligations under the Riders. To the extent that the Fund’s strategy is successful, Hartford Life and its affiliates and Forethought will benefit from a reduction of the risk arising from their guarantee obligations under the Riders, and they will have less risk to hedge under the Riders than would be the case if holders did not allocate to the Fund.
As a holder of a Rider, you also will have exposure to changes in the values of the Allocated Funds, although your particular exposure will differ from the aggregated exposure that the Index is designed to address, depending on your allocations and investment activity, among other factors. Although the Fund may have the effect of mitigating declines in your contract value under a Rider in the event of a significant decline in equity market valuations, the strategy followed by the Fund, if successful, will also generally result in your contract value increasing to a lesser degree than the equity markets, or decreasing, when the values of equity investments are stable or rising. This may deprive you of some or all of the benefit of increases in equity market values under your contract and could also result in a decrease in the value of your variable annuity contract. Depending on future market conditions, you might benefit more from selecting alternative allocations under a guaranteed benefit rider (if available) or alternate investments. In addition, there is no guarantee that the Fund’s strategy will have its intended effect, and it may not work as effectively as is intended. Depending on your particular allocation to the Allocated Funds under a Rider, the Fund’s strategy may be more or less effective in mitigating potential losses under your variable annuity contract than may be the case for others who elect a Rider and allocate contract value differently among the Allocated Funds. In particular, the Fund’s investment strategy is not as likely to be as effective with respect to allocations that have relatively lower anticipated correlation to the investment performance of the S&P 500 Index.
Hartford Life’s and Forethought’s financial interest in reducing the volatility of overall contract value invested under the Riders, in light of their obligations under the Riders, may be deemed to present a potential conflict of interest with respect to the interests of the holders of the Riders, in that Hartford Life’s and Forethought’s interest may at times conflict with the Fund’s goal of preserving the potential for modest appreciation in the Fund’s net asset value when markets are appreciating. HFMC and Hartford Series Fund, Inc., on behalf of the Fund have developed procedures designed to address this potential conflict by (i) specifying the processes for developing and communicating the data used to calculate the Index, calculating the Index and managing the Fund to replicate the performance of the Index and (ii) monitoring for compliance with the specified processes.
Index and Information Risk: The data used by HFMC to calculate the Index may not always be current. To the extent the data, and in particular the market-related data, is outdated or inaccurate, the sleeve consisting of (i) a basket of derivatives that generally will increase in value if the S&P 500 Index decreases significantly in value and will generally decrease in value when the S&P 500 Index remains level or increases in value; and (ii) holdings of Treasury securities and other cash investments (the "Derivative Sleeve") may fail to hedge or may hedge less effectively against equity market declines. In addition, when the values of investments are increasing, the Fund’s value could increase to a lesser extent, or decrease to a greater extent, than would be the case if the data used to calculate the Index were current.
In addition, the Index is intended to hedge against the aggregate allocations of holders of the Riders to the Allocated Funds and not the allocation of any individual contract owner. The Derivative Sleeve may not be successful in providing an effective hedge, and the hedge, even if effective, will benefit some Rider holders more than others, depending upon the allocations to funds selected by the holders. In particular, contract owners whose allocations have a relatively higher anticipated correlation to the investment performance of the S&P 500 Index will benefit to a greater extent from the hedge during periods of equity market declines.
THIS PRIVACY POLICY IS NOT PART OF THIS REPORT
Privacy Policy and Practices of The Hartford Financial Services Group, Inc. and its Affiliates
(herein called “we, our and us”)
This Privacy Policy applies to our United States Operations
We value your trust. We are committed to the responsible: a) management; b) use; and c) protection; of Personal Information. This notice describes how we collect, disclose, and protect Personal Information. We collect Personal Information to: a) service your Transactions with us; and b) support our business functions. We may obtain Personal Information from: a) You; b) your Transactions with us; and c) third parties such as a consumer-reporting agency. Based on the type of product or service You apply for or get from us, Personal Information such as: a) your name; b) your address; c) your income; d) your payment; or e) your credit history; may be gathered from sources such as applications, Transactions, and consumer reports. To serve You and service our business, we may share certain Personal Information. We will share Personal Information, only as allowed by law, with affiliates such as: a) our insurance companies; b) our employee agents; c) our brokerage firms; and d) our administrators. As allowed by law, we may share Personal Financial Information with our affiliates to: a) market our products; or b) market our services; to You without providing You with an option to prevent these disclosures. | | | We may also share Personal Information, only as allowed by law, with unaffiliated third parties including: a) independent agents; b) brokerage firms; c) insurance companies; d) administrators; and e) service providers; who help us serve You and service our business. When allowed by law, we may share certain Personal Financial Information with other unaffiliated third parties who assist us by performing services or functions such as: a) taking surveys; b) marketing our products or services; or c) offering financial products or services under a joint agreement between us and one or more financial institutions. We, and third parties we partner with, may track some of the pages You visit through the use of: a) cookies; b) pixel tagging; or c) other technologies; and currently do not process or comply with any web browser’s “do not track” signal or similar mechanism that indicates a request to disable online tracking of individual users who visit our websites or use our services. We will not sell or share your Personal Financial Information with anyone for purposes unrelated to our business functions without offering You the opportunity to: a) “opt-out;” or b) “opt-in;” as required by law. We only disclose Personal Health Information with: a) your proper written authorization; or b) as otherwise allowed or required by law. Our employees have access to Personal Information in the course of doing their jobs, such as: a) underwriting policies; b) paying claims; c) developing new products; or d) advising customers of our products and services. |
We use manual and electronic security procedures to maintain: a) the confidentiality; and b) the integrity of; Personal Information that we have. We use these procedures to guard against unauthorized access. Some techniques we use to protect Personal Information include: a) secured files; b) user authentication; c) encryption; d) firewall technology; and e) the use of detection software. We are responsible for and must: a) identify information to be protected; b) provide an adequate level of protection for that data; c) grant access to protected data only to those people who must use it in the performance of their job-related duties. Employees who violate our Privacy Policy will be subject to discipline, which may include ending their employment with us. At the start of our business relationship, we will give You a copy of our current Privacy Policy. We will also give You a copy of our current Privacy Policy once a year if You maintain a continuing business relationship with us. We will continue to follow our Privacy Policy regarding Personal Information even when a business relationship no longer exists between us. | | | As used in this Privacy Notice: Application means your request for our product or service. Personal Financial Information means financial information such as: a) credit history; b) income; c) financial benefits; or d) policy or claim information. Personal Health Information means health information such as: a) your medical records; or b) information about your illness, disability or injury. Personal Information means information that identifies You personally and is not otherwise available to the public. It includes: a) Personal Financial Information; and b) Personal Health Information. Transaction means your business dealings with us, such as: a) your Application; b) your request for us to pay a claim; and c) your request for us to take an action on your account. You means an individual who has given us Personal Information in conjunction with: a) asking about; b) applying for; or c) obtaining; a financial product or service from us if the product or service is used mainly for personal, family, or household purposes. |
This Privacy Policy is being provided on behalf of the following affiliates of The Hartford Financial Services Group, Inc.:
1stAGChoice, Inc.; Access CoverageCorp, Inc.; Access CoverageCorp Technologies, Inc.; American Maturity Life Insurance Company; Archway 60 R, LLC; Business Management Group, Inc.; Champlain Life Reinsurance Company; DMS R, LLC; Eloy R, LLC; Ersatz Corporation; First State Insurance Company; Hartford Accident and Indemnity Company; Hartford Administrative Services Company; Hartford Casualty General Agency, Inc.; Hartford Casualty Insurance Company; Hartford-Comprehensive Employee Benefit Service Company; Hartford Equity Sales Company, Inc.; Hartford Fire General Agency, Inc.; Hartford Fire Insurance Company; Hartford Funds Management Company, LLC; Hartford Funds Management Group, Inc.; Hartford HLS Series Fund II, Inc.; Hartford Insurance Company of Illinois; Hartford Insurance Company of the Midwest; Hartford Insurance Company of the Southeast; Hartford Integrated Technologies, Inc.; Hartford International Life Reassurance Corporation; Hartford Funds Distributors, LLC; Hartford Investment Management Company; Hartford Life and Accident Insurance Company; Hartford Life and Annuity Insurance Company; Hartford Life Insurance Company; Hartford Life Private Placement, LLC; Hartford Lloyd’s Corporation; Hartford Lloyd’s Insurance Company; Hartford Mezzanine Investors I, LLC; Hartford Residual Market, L.C.C.; Hartford Retirement Services, LLC; Hartford Securities Distribution Company, Inc.; Hartford Series Fund, Inc.; Hartford Specialty Insurance Services of Texas, LLC; Hartford Strategic Investments, LLC; Hartford Underwriters Insurance Company; Hartford Technology Services Company, L.L.C.; Hartford of Texas General Agency, Inc.; Hartford Underwriters General Agency, Inc.; HARTRE Company, L.C.C.; HL Investment Advisors, LLC; HLA LLC; Horizon Management Group, LLC; HRA Brokerage Services, Inc.; Lanidex Class B, LLC; M-CAP Insurance Agency, LLC; New England Insurance Company; New England Reinsurance Corporation; Nutmeg Insurance Agency, Inc.; Nutmeg Insurance Company; Pacific Insurance Company, Limited; Planco, LLC: Property and Casualty Insurance Company of Hartford; Revere R, LLC; RVR R, LLC; Sentinel Insurance Company, Ltd.; Sunstone R, LLC; Symphony R, LLC; The Evergreen Group Incorporated; The Hartford Alternative Strategies Fund; The Hartford Mutual Funds, Inc.; The Hartford Mutual Funds II, Inc.; Trumbull Flood Management, L.L.C.; Trumbull Insurance Company; Twin City Fire Insurance Company; White River Life Reinsurance Company.
HPP Revised January 2014
HARTFORD HLS FUNDS
P.O. Box 14293
Lexington, KY 40512-4293
HARTFORDFUNDS
hartfordfunds.com
Hartford Series Fund, Inc. is underwritten and distributed by Hartford Funds Distributors, LLC.
Hartford Series Fund, Inc. inception dates range from 1977 to date. Hartford Series Fund, Inc. is not a subsidiary of The Hartford Financial Services Group, Inc. ("The Hartford") but is underwritten, distributed by and advised by subsidiaries of The Hartford. Investments in Hartford Series Fund, Inc. are not guaranteed by The Hartford or any other entity.
This report is submitted for the general information of the shareholders of the Funds. It is not authorized for distribution unless preceded or accompanied by a current prospectus for the Funds.
Investors should carefully consider the investment objectives, risks, charges, and expenses of Hartford Funds before investing. This and other information can be found in the prospectus, which can be obtained by calling 800-862-6668 (or 800-279-1541 for institutional investors). Investors should read them carefully before they invest.
HLSSAR-PD14 8-14 113550-3 Printed in U.S.A.
HARTFORDFUNDS
| | HARTFORD SMALL COMPANY HLS FUND 2014 Semi Annual Report |
A MESSAGE FROM THE PRESIDENT
Dear Fellow Shareholders:
Thank you for investing in Hartford HLS Funds.
Market Review
U.S. equities (as represented by the S&P 500 Index) started 2014 on a shaky note after posting a strong 32.39% gain in 2013. However, stocks managed to maintain modest gains throughout the first quarter and returned to a generally steady climb in the second quarter. Through June 30, 2014, the S&P 500 Index advanced 7.14%. It appears that much of the market volatility during the year can be attributed to heightened international tensions. In particular, the Russian annexation of Ukraine’s Crimean Peninsula and increased tensions in Iraq were cause for concern.
On the domestic front, subdued economic and employment reports slowed stocks’ progress early in the new year, although much of the weakness seemed to dissipate as the year’s unusually harsh winter subsided. And despite initial reactions to the idea, when the U.S. Federal Reserve began tapering its quantitative-easing program in January by reducing its bond purchases by $10 billion a month, the markets took the policy change in stride.
Despite a rough start to the year for financial markets, the global economy seems to be settling into a slow-but-steady recovery. While first-quarter U.S. gross domestic product (GDP) growth was disappointing at -2.9%, U.S. consumer spending, which is a significant contributor toward economic growth, rose by 3% during the quarter. It appears that Europe is also maintaining its own recovery: The International Monetary Fund projects that Europe’s full-year GDP growth may breach positive territory for the first time since 2011.
The impact of international affairs on stocks so far this year is an important reminder to stay informed about both domestic and international economic developments, and any effects they may have on your individual investment goals. If you have not already had a mid-year review of your portfolio, it may be a good time to meet with your financial advisor to review your progress and make certain your investments are prepared for all market environments:
| • | Is your portfolio properly diversified with an appropriate mix of stocks and bonds? |
| • | Is your portfolio positioned to take advantage of the global economic recovery, with investments in both domestic and international holdings? |
| • | Are your investments still in line with your risk tolerance and investment time horizon? |
Your financial professional can help you choose options within our fund family to help you reach your investment goals with confidence.
Thank you again for investing with Hartford HLS Funds.
James Davey
President
Hartford HLS Funds
1 The S&P 500 Index is a market capitalization-weighted price index composed of 500 widely held common stocks.
2The Dow Jones Industrial Average is an unmanaged, price-weighted index of 30 of the largest, most widely held stocks traded on the New York Stock Exchange.
Hartford Small Company HLS Fund
Table of Contents
This report is prepared for the general information of contract owners and qualified retirement plan participants. It is not an offer of contracts or of qualified retirement plans. It should not be used in connection with any offer, except in conjunction with the appropriate product prospectus which contains all pertinent information including the applicable sales, administrative and other charges.
The views expressed in the Fund’s Manager Discussion under “Why did the Fund perform this way?” and “What is the outlook?” are views of the Fund’s sub-adviser and portfolio management team through the end of the period and are subject to change based on market and other conditions. The Fund’s Manager Discussion is for informational purposes only and does not represent an offer, recommendation or solicitation to buy, hold or sell any security. The specific securities identified and described, if any, do not represent all of the securities purchased or sold and you should not assume that investments in the securities identified and discussed will be profitable.
| Hartford Small Company HLS Fund inception 08/09/1996 |
| (sub-advised by Wellington Management Company, LLP) |
| |
| Investment objective – The Fund seeks growth of capital. |
Performance Overview 6/30/04 - 6/30/14
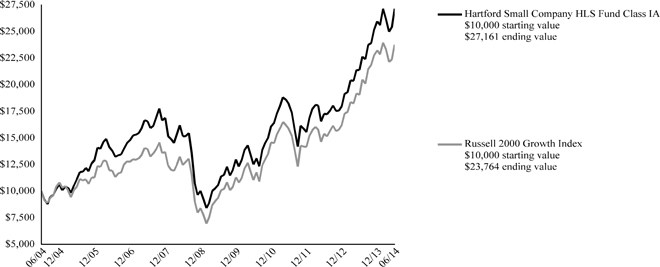
The chart above represents the hypothetical growth of a $10,000 investment in Class IA. Growth results in classes other than Class IA will vary from what is seen above due to differences in the expenses charged to those share classes.
| Average Annual Total Returns (as of 6/30/14) |
| | | 6 Month† | | 1 Year | | 5 Years | | 10 Years |
| Small Company IA | | | 4.58% | | | | 26.85% | | | | 20.81% | | | | 10.51% | |
| Small Company IB | | | 4.48% | | | | 26.53% | | | | 20.50% | | | | 10.24% | |
| Russell 2000 Growth Index | | | 2.22% | | | | 24.73% | | | | 20.50% | | | | 9.04% | |
PERFORMANCE DATA QUOTED REPRESENTS PAST PERFORMANCE AND DOES NOT GUARANTEE FUTURE RESULTS. The investment return and principal value of the investment will fluctuate so that investors’ shares, when redeemed, may be worth more or less than their original cost. Current performance may be lower or higher than the performance data quoted. To obtain performance data current to the most recent month-end, please visit our website www.hartfordfunds.com.
Total returns presented above were calculated using the Fund’s net asset value available to shareholders for sale or redemption of Fund shares on June 30, 2014, which may exclude investment transactions as of this date. All share class returns assume the reinvestment of all distributions at net asset value and the deduction of all fund expenses.
Russell 2000 Growth Index is an unmanaged index of those Russell 2000 Index growth companies with higher price-to-book ratios and higher forecasted growth values. The Russell 2000 Index is a broad-based unmanaged index comprised of 2,000 of the smallest U.S.-domiciled company common stocks (on the basis of capitalization) that are traded in the United States on the New York Stock Exchange, NYSE MKT LLC and Nasdaq.
The index is unmanaged, and its results include reinvested dividends and/or distributions, but do not reflect the effect of sales charges, commissions, expenses or taxes.
You cannot invest directly in an index.
As shown in the Fund's current prospectus dated May 1, 2014, the total annual operating expense ratios for Class IA and Class IB were 0.71% and 0.96%, respectively. Actual expenses may be higher. Please see the accompanying Financial Highlights for expense ratios for the six-month period ended June 30, 2014.
For additional information regarding the prior performance history of the Fund, please see the section entitled "Performance Notes" in the Fund's prospectus.
The chart and table do not reflect the deductions of taxes, sales charges or other fees which may be applied at the variable life insurance, variable annuity or qualified retirement plan product level. Any such additional sales charges or other fees or expenses would lower the contract’s or plan’s performance.
All investments are subject to risk including the possible loss of principal. For a discussion of the Fund’s risks, please see the Main Risks section of this report. For more detailed information on the risks associated with an investment in the Fund, please see the prospectus.
| Hartford Small Company HLS Fund |
| Manager Discussion |
June 30, 2014 (Unaudited) |
| Portfolio Managers | | |
| Steven C. Angeli, CFA | Stephen Mortimer | Mario E. Abularach, CFA |
| Senior Vice President and Equity Portfolio Manager | Senior Vice President and Equity Portfolio Manager | Senior Vice President and Equity Research Analyst |
| Mammen Chally, CFA | Jamie A. Rome, CFA | |
| Vice President and Equity Portfolio Manager | Senior Vice President and Equity Portfolio Manager | |
How did the Fund perform?
The Class IA shares of the Hartford Small Company HLS Fund returned 4.58% for the six-month period ended June 30, 2014, outperforming the Fund’s benchmark, the Russell 2000 Growth Index which returned 2.22% for the same period. The Fund also outperformed the 0.57% average return of the Lipper Small-Cap Growth Funds peer group, a group of funds with investment strategies similar to those of the Fund.
Why did the Fund perform this way?
U.S. equities surged during the period, ending June near an all-time high. After finishing 2013 with their best year since 1997, U.S. stocks began 2014 with their worst month in nearly two years. Worries about a slowdown in China and general concern surrounding emerging markets overshadowed a fairly benign domestic environment. However, robust merger and acquisition activity and an uncontested increase in the debt ceiling from Congress helped stoke investors' risk appetites in February. Earnings season in April provided a varied yet encouraging picture, with companies generally reporting healthy earnings but more subdued revenues. The rally continued in May amid renewed signs of life in the housing market and the best payroll gains in more than two years. In June, strong manufacturing activity, coupled with continued positive momentum in housing and employment data, helped to offset a large negative revision to first quarter economic growth.
Large cap stocks (+7%) stocks outperformed small cap stocks (+3%) during the period, as measured by the S&P 500 and Russell 2000 Indices, respectively. Value stocks (+8%) outperformed growth stocks (+6%) during the period, as measured by the Russell 3000 Value and Russell 3000 Growth Indices. Eight of the ten sectors in the Russell 2000 Growth Index had positive returns during the period. Energy (+22%), Utilities (+5%), and Healthcare (+5%) performed best, while Consumer Discretionary (-5%) and Telecommunication Services (-3%) lagged the broader index.
Stock selection was the main driver of relative outperformance versus the Russell 2000 Growth Index, primarily in the Industrials, Materials, and Consumer Discretionary sectors. This was partially offset by weaker selection in the Information Technology sector. Sector allocation, which is the result of bottom-up stock selection, detracted from relative returns, primarily due to underweights to the Energy and Materials sectors which more than offset the positive impacts of an underweight allocation to the Telecommunication Services sector. A modest cash position in an upward trending equity market environment detracted from relative returns in the period.
Top contributors to relative and absolute performance during the period included WhiteWave Foods (Consumer Staples), Diamondback Energy (Energy), and Athlon Energy (Energy). Shares of WhiteWave Foods, a leader in the organic foods and plant-based beverage industries, outperformed during the period. The firm is uniquely exposed to the strong secular trend in plant-based foods; we are seeing a change in consumer behaviors toward healthier foods and WhiteWave has dominant share in several products (e.g., Silk Milk) in this burgeoning space within Consumer Staples. As a result, the company has enjoyed solid trends in revenue and earnings growth, which we believe should continue as the health and wellness trends expand in the years to come. Shares of Diamondback Energy, an oil and gas company focused in the Permian Basin in West Texas, rose during the period as a result of the successful initial public offering of its subsidiary, Viper Energy Partners. Viper is now valued at approximately $2.6 billion and contains the royalty interests on acreage within the Permian Basin that Diamondback acquired last year for $440 million. Diamondback retains a 93% interest in Viper. Shares of Athlon Energy, an exploration and production company within the Permian Basin, rose during the period after the company announced it had acquired property in the northern Midland Basin (a component of the Permian Basin), a move viewed favorably by investors.
Top detractors from both absolute and relative returns during the period included FleetMatics Group (Information Technology), DigitalGlobe (Industrials), and Allstar CoInvest (Consumer Discretionary). Shares of FleetMatics Group, a provider of fleet management solutions delivered as software-as-a-service (SaaS), fell during the period after the company revised downward full year earnings guidance due to higher investment spending. Shares of DigitalGlobe, a digital imaging services provider, fell after the company missed revenue expectations and lowered earnings guidance due to poor performance in its non-government business, as well as in its Department of Defense business. Shares of Allstar CoInvest, a sporting goods retailer, lagged as retail conditions were tough in the first quarter given the harsh winter weather.
Derivatives are not used in a significant manner in this Fund and did not have a material impact on performance during the period.
| Hartford Small Company HLS Fund |
| Manager Discussion – (continued) |
June 30, 2014 (Unaudited) |
What is the outlook?
We believe the U.S. economy remains well positioned for continued moderate growth. Following the weak -2.9% first quarter GDP revision, which had a number of weather- and health-care related distortions, we believe the U.S. economy is poised for stronger activity in the second half. We believe the economy could accelerate to a fairly stable 2.5% to 3% GDP growth range over the next 12 to 18 months. We think the U.S. Federal Reserve (Fed) remains on track to end quantitative easing in the fourth quarter of this year and is likely to start raising policy rates by next Spring. As the labor market continues to tighten, we are closely watching the direction and course of wage gains, as this is something that could cause the Fed to act sooner than consensus expectations
As a result of our bottom-up, stock-by-stock investment decisions, the Fund ended the period most overweight the Industrials, Information Technology, and Consumer Discretionary sectors relative to the Russell 2000 Growth Index. The Fund ended the period most underweight the Healthcare, Materials, and Consumer Staples sectors relative to the Russell 2000 Growth Index.
| Diversification by Sector |
| as of June 30, 2014 |
| Sector | | Percentage of
Net Assets |
| Equity Securities | | | | |
| Consumer Discretionary | | | 16.7 | % |
| Consumer Staples | | | 2.4 | |
| Energy | | | 4.9 | |
| Financials | | | 9.2 | |
| Health Care | | | 17.4 | |
| Industrials | | | 20.3 | |
| Information Technology | | | 26.3 | |
| Materials | | | 1.9 | |
| Services | | | 0.2 | |
| Utilities | | | 0.1 | |
| Total | | | 99.4 | % |
| Short-Term Investments | | | 2.1 | |
| Other Assets and Liabilities | | | (1.5 | ) |
| Total | | | 100.0 | % |
A sector may be comprised of several industries. For Fund compliance purposes, the Fund may not use the same classification system and these sector classifications are used for reporting ease.
| Hartford Small Company HLS Fund |
| Schedule of Investments |
| June 30, 2014 (Unaudited) |
(000’s Omitted) |
| Shares or Principal Amount | | Market Value ╪ | |
| Common Stocks - 98.9% | |
| | | | | Automobiles and Components - 1.3% | | | | |
| | 55 | | | Dana Holding Corp. | | $ | 1,334 | |
| | 11 | | | Standard Motor Products, Inc. | | | 494 | |
| | 267 | | | Tenneco Automotive, Inc. ● | | | 17,523 | |
| | 1 | | | Tesla Motors, Inc. ● | | | 246 | |
| | | | | | | | 19,597 | |
| | | | | Banks - 1.6% | | | | |
| | 4 | | | Altisource Portfolio Solutions S.A. | | | 484 | |
| | 11 | | | Bank of Marin Bancorp | | | 504 | |
| | 38 | | | Clifton Bancorp, Inc. | | | 480 | |
| | 74 | | | EverBank Financial Corp. | | | 1,483 | |
| | 42 | | | First Merchants Corp. | | | 898 | |
| | 49 | | | Flushing Financial Corp. | | | 999 | |
| | 32 | | | Heritage Financial Corp. | | | 513 | |
| | 22 | | | Home Loan Servicing Solutions Ltd. | | | 494 | |
| | 347 | | | PacWest Bancorp | | | 14,972 | |
| | 10 | | | Trico Bancshares | | | 227 | |
| | 30 | | | Wintrust Financial Corp. | | | 1,378 | |
| | 7 | | | WSFS Financial Corp. | | | 507 | |
| | | | | | | | 22,939 | |
| | | | | Capital Goods - 12.7% | | | | |
| | 17 | | | A.O. Smith Corp. | | | 843 | |
| | 25 | | | AAON, Inc. | | | 845 | |
| | 124 | | | Acuity Brands, Inc. | | | 17,089 | |
| | 345 | | | AECOM Technology Corp. ● | | | 11,108 | |
| | 1 | | | Alamo Group, Inc. | | | 65 | |
| | 567 | | | Altra Industrial Motion Corp. | | | 20,634 | |
| | 354 | | | Applied Industrial Technologies, Inc. | | | 17,976 | |
| | 280 | | | Armstrong World Industries, Inc. ● | | | 16,098 | |
| | 26 | | | Astronics Corp. ● | | | 1,489 | |
| | 1 | | | Astronics Corp. Class B ● | | | 65 | |
| | 20 | | | AZZ, Inc. | | | 931 | |
| | 23 | | | CAI International, Inc. ● | | | 500 | |
| | 4 | | | Carlisle Cos., Inc. | | | 341 | |
| | 18 | | | Chart Industries, Inc. ● | | | 1,522 | |
| | 5 | | | Crane Co. | | | 348 | |
| | 459 | | | DigitalGlobe, Inc. ● | | | 12,755 | |
| | 11 | | | EMCOR Group, Inc. | | | 490 | |
| | 7 | | | Esterline Technologies Corp. ● | | | 860 | |
| | 221 | | | Generac Holdings, Inc. ● | | | 10,765 | |
| | 44 | | | GrafTech International Ltd. ● | | | 456 | |
| | 14 | | | H & E Equipment Services, Inc. ● | | | 519 | |
| | 418 | | | HD Supply Holdings, Inc. ● | | | 11,880 | |
| | 17 | | | Heico Corp. | | | 883 | |
| | 27 | | | Insteel Industries, Inc. | | | 524 | |
| | 14 | | | Lennox International, Inc. | | | 1,251 | |
| | 29 | | | Luxfer Holdings plc | | | 542 | |
| | 19 | | | Lydall, Inc. ● | | | 520 | |
| | 186 | | | Moog, Inc. Class A ● | | | 13,586 | |
| | 337 | | | Orbital Sciences Corp. ● | | | 9,966 | |
| | 8 | | | Polypore International, Inc. ● | | | 397 | |
| | 18 | | | Sun Hydraulics Corp. | | | 722 | |
| | 145 | | | Teledyne Technologies, Inc. ● | | | 14,133 | |
| | 12 | | | Textainer Group Holdings Ltd. | | | 470 | |
| | 36 | | | Titan International, Inc. | | | 600 | |
| | 15 | | | Toro Co. | | | 932 | |
| | 16 | | | Watts Water Technologies, Inc. | | | 977 | |
| | 162 | | | WESCO International, Inc. ● | | | 13,965 | |
| | | | | | | | 187,047 | |
| | | | | Commercial and Professional Services - 3.1% | | | | |
| | 294 | | | Clean Harbors, Inc. ● | | | 18,862 | |
| | 26 | | | Deluxe Corp. | | | 1,531 | |
| | 16 | | | Exponent, Inc. | | | 1,153 | |
| | 16 | | | Gategroup Holding AG | | | 430 | |
| | 32 | | | GP Strategies Corp. ● | | | 816 | |
| | 31 | | | On Assignment, Inc. ● | | | 1,101 | |
| | 474 | | | TrueBlue, Inc. ● | | | 13,073 | |
| | 168 | | | Wageworks, Inc. ● | | | 8,123 | |
| | | | | | | | 45,089 | |
| | | | | Consumer Durables and Apparel - 5.2% | | | | |
| | 24 | | | Arctic Cat, Inc. | | | 952 | |
| | 170 | | | Cloudera, Inc. ⌂●† | | | 2,227 | |
| | 41 | | | Kate Spade & Co. ● | | | 1,552 | |
| | 31 | | | LGI Homes, Inc. ● | | | 564 | |
| | 22 | | | M/I Schottenstein Homes, Inc. ● | | | 525 | |
| | 39 | | | New Home Co. LLC ● | | | 549 | |
| | 3,363 | | | Samsonite International S.A. | | | 11,087 | |
| | 242 | | | Skechers USA, Inc. Class A ● | | | 11,082 | |
| | 1,555 | | | Standard-Pacific Corp. ● | | | 13,373 | |
| | 232 | | | Steven Madden Ltd. ● | | | 7,943 | |
| | 520 | | | Taylor Morrison Home Corp. ● | | | 11,663 | |
| | 392 | | | Vince Holding Corp. ●☼ | | | 14,353 | |
| | | | | | | | 75,870 | |
| | | | | Consumer Services - 4.7% | | | | |
| | 834 | | | Bloomin' Brands, Inc. ● | | | 18,717 | |
| | 24 | | | Brinker International, Inc. | | | 1,174 | |
| | 109 | | | Buffalo Wild Wings, Inc. ● | | | 18,031 | |
| | 51 | | | Del Frisco's Restaurant Group, Inc. ● | | | 1,394 | |
| | 77 | | | Ignite Restaurant Group, Inc. ● | | | 1,126 | |
| | 24 | | | Marriott Vacations Worldwide Corp. ● | | | 1,415 | |
| | 74 | | | Panera Bread Co. Class A ● | | | 11,079 | |
| | 205 | | | Red Robin Gourmet Burgers, Inc. ● | | | 14,629 | |
| | 24 | | | Sotheby's Holdings | | | 1,013 | |
| | | | | | | | 68,578 | |
| | | | | Diversified Financials - 4.4% | | | | |
| | 19 | | | Alaris Royalty Corp. | | | 508 | |
| | 14 | | | Evercore Partners, Inc. | | | 830 | |
| | 191 | | | Financial Engines, Inc. | | | 8,646 | |
| | 389 | | | HFF, Inc. | | | 14,468 | |
| | 18 | | | Marcus & Millichap, Inc. ● | | | 461 | |
| | 2 | | | Marlin Business Services Corp. | | | 28 | |
| | 10 | | | Platform Specialty Products Corp. ● | | | 278 | |
| | 591 | | | Platform Specialty Products Corp. PIPE ● | | | 16,571 | |
| | 8 | | | Portfolio Recovery Associates, Inc. ● | | | 449 | |
| | 31 | | | Regional Management Corp. ● | | | 480 | |
| | 55 | | | Virtus Investment Partners, Inc. ● | | | 11,573 | |
| | 530 | | | Wisdomtree Investment, Inc. ● | | | 6,550 | |
| | 387 | | | WL Ross Holding Corp. ● | | | 3,986 | |
| | | | | | | | 64,828 | |
| | | | | Energy - 4.9% | | | | |
| | 357 | | | Athlon Energy, Inc. ● | | | 17,009 | |
| | 225 | | | BPZ Resources, Inc. ● | | | 694 | |
| | 15 | | | C&J Energy Services, Inc. ● | | | 504 | |
| | 156 | | | Diamondback Energy, Inc. ● | | | 13,888 | |
| | 61 | | | Energy XXI (Bermuda) Ltd. | | | 1,431 | |
| | 23 | | | Forum Energy Technologies, Inc. ● | | | 840 | |
| | 139 | | | Hornbeck Offshore Services, Inc. ● | | | 6,509 | |
| | 37 | | | Jones Energy, Inc. ● | | | 766 | |
| | 83 | | | Karoon Gas Australia Ltd. ● | | | 240 | |
| | 449 | | | Laredo Petroleum, Inc. ● | | | 13,911 | |
| | 10 | | | Parsley Energy, Inc. ● | | | 252 | |
The accompanying notes are an integral part of these financial statements.
| Hartford Small Company HLS Fund |
| Schedule of Investments – (continued) |
| June 30, 2014 (Unaudited) |
(000’s Omitted) |
| Shares or Principal Amount | | Market Value ╪ | |
| Common Stocks - 98.9% - (continued) | |
| | | | | Energy - 4.9% - (continued) | | | | |
| | 29 | | | PBF Energy, Inc. | | $ | 766 | |
| | 20 | | | Rosetta Resources, Inc. ● | | | 1,109 | |
| | 402 | | | RSP Permian, Inc. ● | | | 13,038 | |
| | 68 | | | Superior Drilling Products I ● | | | 440 | |
| | 41 | | | Synergy Resources Corp. ● | | | 548 | |
| | | | | | | | 71,945 | |
| | | | | Food and Staples Retailing - 0.7% | | | | |
| | 22 | | | Casey's General Stores, Inc. | | | 1,576 | |
| | 32 | | | Natural Grocers by Vitamin Cottage, Inc. ● | | | 689 | |
| | 8 | | | PriceSmart, Inc. | | | 709 | |
| | 218 | | | Sprouts Farmers Markets, Inc. ● | | | 7,127 | |
| | | | | | | | 10,101 | |
| | | | | Food, Beverage and Tobacco - 0.8% | | | | |
| | 28 | | | Alliance Grain Traders, Inc. | | | 562 | |
| | 20 | | | Darling Ingredients, Inc. ● | | | 428 | |
| | 18 | | | TreeHouse Foods, Inc. ● | | | 1,411 | |
| | 317 | | | WhiteWave Foods Co. Class A ● | | | 10,245 | |
| | | | | | | | 12,646 | |
| | | | | Health Care Equipment and Services - 8.7% | | | | |
| | 333 | | | Acadia Healthcare Co., Inc. ●‡ | | | 15,134 | |
| | 7 | | | AmSurg Corp. ● | | | 307 | |
| | 3 | | | Atrion Corp. | | | 856 | |
| | 23 | | | CareTrust REIT, Inc. ● | | | 449 | |
| | 23 | | | Corvel Corp. ● | | | 1,053 | |
| | 16 | | | Cyberonics, Inc. ● | | | 1,002 | |
| | 429 | | | Dexcom, Inc. ● | | | 17,023 | |
| | 18 | | | Ensign Group, Inc. | | | 551 | |
| | 333 | | | Envision Healthcare Holdings ● | | | 11,953 | |
| | 394 | | | Examworks Group, Inc. ● | | | 12,494 | |
| | 81 | | | Globus Medical, Inc. ● | | | 1,946 | |
| | 10 | | | Greatbatch, Inc. ● | | | 482 | |
| | 42 | | | HealthSouth Corp. | | | 1,522 | |
| | 182 | | | Heartware International, Inc. ● | | | 16,073 | |
| | 15 | | | ICU Medical, Inc. ● | | | 885 | |
| | 364 | | | Insulet Corp. ● | | | 14,422 | |
| | 6 | | | MEDNAX, Inc. ● | | | 374 | |
| | 19 | | | Natus Medical, Inc. ● | | | 469 | |
| | 31 | | | Omnicell, Inc. ● | | | 882 | |
| | 353 | | | Team Health Holdings ● | | | 17,644 | |
| | 32 | | | U.S. Physical Therapy, Inc. | | | 1,085 | |
| | 51 | | | Vascular Solutions, Inc. ● | | | 1,136 | |
| | 356 | | | Veeva Systems, Inc. ● | | | 9,067 | |
| | 15 | | | Wellcare Health Plans, Inc. ● | | | 1,088 | |
| | | | | | | | 127,897 | |
| | | | | Household and Personal Products - 0.9% | | | | |
| | 37 | | | Prestige Brands Holdings, Inc. ● | | | 1,271 | |
| | 134 | | | Spectrum Brands Holdings, Inc. | | | 11,538 | |
| | | | | | | | 12,809 | |
| | | | | Insurance - 0.8% | | | | |
| | 26 | | | Amerisafe, Inc. | | | 1,049 | |
| | 397 | | | Assured Guaranty Ltd. | | | 9,725 | |
| | 11 | | | Phoenix Cos., Inc. ● | | | 530 | |
| | 12 | | | Protective Life Corp. | | | 825 | |
| | | | | | | | 12,129 | |
| | | | | Materials - 1.9% | | | | |
| | 22 | | | Advanced Emissions Solutions, Inc. ● | | | 496 | |
| | 17 | | | Cabot Corp. | | | 1,009 | |
| | 129 | | | Graphic Packaging Holding Co. ● | | | 1,512 | |
| | 647 | | | Headwaters, Inc. ● | | | 8,985 | |
| | 11 | | | Innospec, Inc. | | | 483 | |
| | 314 | | | KapStone Paper & Packaging Corp. ● | | | 10,412 | |
| | 10 | | | LSB Industries, Inc. ● | | | 436 | |
| | 25 | | | Myers Industries, Inc. | | | 503 | |
| | 52 | | | New Gold, Inc. ● | | | 329 | |
| | 92 | | | Omnova Solutions, Inc. ● | | | 833 | |
| | 24 | | | Philbro Animal Health Corp.-A ● | | | 522 | |
| | 46 | | | PolyOne Corp. | | | 1,946 | |
| | 19 | | | Silgan Holdings, Inc. | | | 979 | |
| | | | | | | | 28,445 | |
| | | | | Media - 2.4% | | | | |
| | 361 | | | DreamWorks Animation SKG, Inc. ● | | | 8,398 | |
| | 465 | | | Imax Corp. ● | | | 13,252 | |
| | 163 | | | Shutterstock, Inc. ● | | | 13,491 | |
| | 142 | | | Speed Commerce, Inc. ● | | | 533 | |
| | | | | | | | 35,674 | |
| | | | | Pharmaceuticals, Biotechnology and Life Sciences - 8.7% | | | | |
| | 23 | | | Acorda Therapeutics, Inc. ● | | | 760 | |
| | 93 | | | Aerie Pharmaceuticals, Inc. ● | | | 2,303 | |
| | 25 | | | Agios Pharmaceuticals, Inc. ● | | | 1,129 | |
| | 26 | | | Albany Molecular Research, Inc. ● | | | 527 | |
| | 27 | | | Alkermes plc ● | | | 1,375 | |
| | 123 | | | Alnylam Pharmaceuticals, Inc. ● | | | 7,765 | |
| | 85 | | | Arena Pharmaceuticals, Inc. ● | | | 500 | |
| | 177 | | | BioCryst Pharmaceuticals, Inc. ● | | | 2,259 | |
| | 52 | | | Bruker Corp. ● | | | 1,263 | |
| | 24 | | | Cara Therapeutics Inc ● | | | 410 | |
| | 157 | | | Covance, Inc. ● | | | 13,445 | |
| | 159 | | | Cubist Pharmaceuticals, Inc. ● | | | 11,111 | |
| | 40 | | | Durata Therapeutics, Inc. ● | | | 684 | |
| | 246 | | | Exelixis, Inc. ● | | | 835 | |
| | 28 | | | Fiveprime Theapeutics, Inc ● | | | 434 | |
| | 29 | | | Glycomimetics, Inc. ● | | | 247 | |
| | 243 | | | Hyperion Therapeutics, Inc. ● | | | 6,336 | |
| | 46 | | | Immunogen, Inc. ● | | | 549 | |
| | 442 | | | Ironwood Pharmaceuticals, Inc. ● | | | 6,779 | |
| | 269 | | | Medicines Co. ● | | | 7,818 | |
| | 288 | | | NPS Pharmaceuticals, Inc. ● | | | 9,514 | |
| | 110 | | | Pacira Pharmaceuticals, Inc. ● | | | 10,087 | |
| | 24 | | | PAREXEL International Corp. ● | | | 1,290 | |
| | 345 | | | Portola Pharmaceuticals, Inc. ● | | | 10,071 | |
| | 7 | | | Puma Biotechnology, Inc. ● | | | 476 | |
| | 89 | | | Salix Pharmaceuticals Ltd. ● | | | 10,958 | |
| | 92 | | | Sancilio & Co., Inc. ⌂●† | | | 314 | |
| | 209 | | | Seattle Genetics, Inc. ● | | | 7,983 | |
| | 314 | | | Tesaro, Inc. ● | | | 9,782 | |
| | 163 | | | Xenoport, Inc. ● | | | 786 | |
| | 13 | | | Zafgen, Inc. ● | | | 257 | |
| | | | | | | | 128,047 | |
| | | | | Real Estate - 2.4% | | | | |
| | 19 | | | Altisource Residential Corp. | | | 505 | |
| | 54 | | | Arbor Realty Trust | | | 374 | |
| | 41 | | | Armada Hoffler Properties, Inc. | | | 396 | |
| | 23 | | | Coresite Realty Corp. REIT | | | 762 | |
| | 289 | | | Douglas Emmett, Inc. REIT | | | 8,145 | |
| | 559 | | | Kennedy-Wilson Holdings, Inc. | | | 14,980 | |
| | 37 | | | Medical Properties Trust, Inc. REIT | | | 485 | |
| | 186 | | | Pebblebrook Hotel Trust REIT | | | 6,888 | |
| | 34 | | | Ramco-Gershenson Properties Trust REIT | | | 569 | |
| | 20 | | | Stag Industrial, Inc. REIT | | | 476 | |
| | 45 | | | Summit Hotel Properties, Inc. REIT | | | 477 | |
The accompanying notes are an integral part of these financial statements.
| Hartford Small Company HLS Fund |
| Schedule of Investments – (continued) |
| June 30, 2014 (Unaudited) |
(000’s Omitted) |
| Shares or Principal Amount | | Market Value ╪ | |
| Common Stocks - 98.9% - (continued) | |
| | | | | Real Estate - 2.4% - (continued) | | | | |
| | 70 | | | Sunstone Hotel Investors, Inc. REIT | | $ | 1,048 | |
| | | | | | | | 35,105 | |
| | | | | Retailing - 3.1% | | | | |
| | 5,016 | | | Allstar Co. ⌂●† | | | 5,423 | |
| | 29 | | | Core-Mark Holding Co., Inc. | | | 1,340 | |
| | 24 | | | Destination Maternity Corp. | | | 542 | |
| | 35 | | | DSW, Inc. | | | 973 | |
| | 32 | | �� | Express, Inc. ● | | | 552 | |
| | 18 | | | Finish Line (The), Inc. | | | 550 | |
| | 23 | | | Five Below, Inc. ● | | | 920 | |
| | 7 | | | Group 1 Automotive, Inc. | | | 598 | |
| | 301 | | | HSN, Inc. | | | 17,818 | |
| | 71 | | | Pier 1 Imports, Inc. | | | 1,096 | |
| | 26 | | | Shoe Carnival, Inc. | | | 529 | |
| | 105 | | | Tory Burch LLC ⌂●† | | | 7,104 | |
| | 467 | | | Tuesday Morning Corp. ● | | | 8,319 | |
| | | | | | | | 45,764 | |
| | | | | Semiconductors and Semiconductor Equipment - 3.9% | | | | |
| | 46 | | | Exar Corp. ● | | | 522 | |
| | 465 | | | Freescale Semiconductor Holdings Ltd. ● | | | 10,925 | |
| | 59 | | | GT Advanced Technologies, Inc. ● | | | 1,096 | |
| | 31 | | | Inphi Corp. ● | | | 448 | |
| | 32 | | | Integrated Silicon Solution, Inc. ● | | | 473 | |
| | 1,185 | | | Lattice Semiconductor Corp. ● | | | 9,774 | |
| | 40 | | | Nanometrics, Inc. ● | | | 734 | |
| | 33 | | | PLX Technology, Inc. ● | | | 212 | |
| | 151 | | | Power Integrations, Inc. | | | 8,685 | |
| | 253 | | | Silicon Laboratories, Inc. ● | | | 12,439 | |
| | 16 | | | SunEdison Semiconductor Ltd. ● | | | 276 | |
| | 416 | | | SunEdison, Inc. ● | | | 9,391 | |
| | 31 | | | SunPower Corp. ● | | | 1,277 | |
| | 29 | | | Ultratech Stepper, Inc. ● | | | 639 | |
| | | | | | | | 56,891 | |
| | | | | Software and Services - 19.3% | | | | |
| | 284 | | | Acxiom Corp. ● | | | 6,166 | |
| | 256 | | | Angie's List, Inc. ● | | | 3,057 | |
| | 1,394 | | | Apigee Corp. ⌂●† | | | 3,651 | |
| | 33 | | | Aspen Technology, Inc. ● | | | 1,518 | |
| | 883 | | | Bankrate, Inc. ● | | | 15,495 | |
| | 12 | | | CACI International, Inc. Class A ● | | | 867 | |
| | 74 | | | Carbonite, Inc. ● | | | 887 | |
| | 22 | | | Cass Information Systems, Inc. | | | 1,066 | |
| | 107 | | | Concur Technologies, Inc. ● | | | 10,002 | |
| | 456 | | | Constant Contact, Inc. ● | | | 14,650 | |
| | 69 | | | CoStar Group, Inc. ● | | | 10,848 | |
| | 20 | | | CSG Systems International, Inc. | | | 511 | |
| | 12 | | | Cvent, Inc. ● | | | 360 | |
| | 269 | | | DealerTrack Technologies, Inc. ● | | | 12,212 | |
| | 107 | | | Demandware, Inc. ● | | | 7,420 | |
| | 8 | | | Digimarc Corp. | | | 272 | |
| | 33 | | | Digital River, Inc. ● | | | 503 | |
| | 57 | | | Ellie Mae, Inc. ● | | | 1,788 | |
| | 170 | | | Envestnet, Inc. ● | | | 8,325 | |
| | 23 | | | ePlus, Inc. ● | | | 1,334 | |
| | 50 | | | Exlservice Holdings, Inc. ● | | | 1,471 | |
| | 20 | | | Fair Isaac, Inc. | | | 1,291 | |
| | 74 | | | Five9, Inc. ● | | | 533 | |
| | 536 | | | Fleetmatics Group Ltd. ● | | | 17,327 | |
| | 49 | | | Global Cash Access, Inc. ● | | | 433 | |
| | 366 | | | Heartland Payment Systems, Inc. | | | 15,094 | |
| | 36 | | | j2 Global, Inc. | | | 1,850 | |
| | 49 | | | Kofax, Ltd. ● | | | 425 | |
| | 45 | | | Manhattan Associates, Inc. ● | | | 1,543 | |
| | 18 | | | Marketo, Inc. ● | | | 509 | |
| | 197 | | | MAXIMUS, Inc. | | | 8,467 | |
| | 19 | | | Mitek Systems, Inc. ● | | | 62 | |
| | 50 | | | Model N, Inc. ● | | | 554 | |
| | 26 | | | Netscout Systems, Inc. ● | | | 1,157 | |
| | 24 | | | Nuance Communications, Inc. ● | | | 459 | |
| | 18 | | | OpenTable, Inc. ● | | | 1,852 | |
| | 314 | | | PTC, Inc. ● | | | 12,173 | |
| | 21 | | | Qualys, Inc. ● | | | 527 | |
| | 79 | | | Sapient Corp. ● | | | 1,282 | |
| | 38 | | | SeaChange International, Inc. ● | | | 303 | |
| | 144 | | | Solera Holdings, Inc. | | | 9,667 | |
| | 97 | | | Tableau Software, Inc. ● | | | 6,928 | |
| | 25 | | | Textura Corp. ● | | | 599 | |
| | 171 | | | Tyler Corp. ● | | | 15,615 | |
| | 297 | | | Verint Systems, Inc. ● | | | 14,581 | |
| | 380 | | | Virtusa Corp. ● | | | 13,620 | |
| | 670 | | | Web.com Group, Inc. ● | | | 19,341 | |
| | 20 | | | WebMD Health Corp. ● | | | 972 | |
| | 146 | | | WEX, Inc. ● | | | 15,298 | |
| | 546 | | | WNS Holdings Ltd. ADR ● | | | 10,463 | |
| | 295 | | | Xoom Corp. ● | | | 7,767 | |
| | | | | | | | 283,095 | |
| | | | | Technology Hardware and Equipment - 3.1% | | | | |
| | 9 | | | Arris Group, Inc. ● | | | 296 | |
| | 38 | | | Aruba Networks, Inc. ● | | | 661 | |
| | 30 | | | Calix, Inc. ● | | | 247 | |
| | 29 | | | CDW Corp. of Delaware | | | 919 | |
| | 361 | | | Cognex Corp. ● | | | 13,872 | |
| | 6 | | | Coherent, Inc. ● | | | 389 | |
| | 14 | | | FEI Co. | | | 1,260 | |
| | 55 | | | Mitel Networks Corp. ● | | | 581 | |
| | 151 | | | Mobileye N.V. ⌂●† | | | 7,430 | |
| | 95 | | | Palo Alto Networks, Inc. ● | | | 8,005 | |
| | 62 | | | ParkerVision, Inc. ● | | | 91 | |
| | 197 | | | Pure Storage, Inc. ⌂●† | | | 2,788 | |
| | 206 | | | Ubiquiti Networks, Inc. ● | | | 9,317 | |
| | | | | | | | 45,856 | |
| | | | | Telecommunication Services - 0.2% | | | | |
| | 133 | | | DocuSign, Inc. ⌂●† | | | 2,727 | |
| | | | | | | | 2,727 | |
| | | | | Transportation - 4.0% | | | | |
| | 53 | | | Celadon Group, Inc. | | | 1,140 | |
| | 94 | | | Con-way, Inc. | | | 4,722 | |
| | 194 | | | Landstar System, Inc. | | | 12,397 | |
| | 27 | | | Marten Transport Ltd. | | | 595 | |
| | 168 | | | Old Dominion Freight Line, Inc. ● | | | 10,696 | |
| | 9 | | | Park-Ohio Holdings Corp. | | | 539 | |
| | 185 | | | Spirit Airlines, Inc. ● | | | 11,678 | |
| | 655 | | | Swift Transportation Co. ● | | | 16,533 | |
| | 1,069 | | | Telogis, Inc. ⌂●† | | | 866 | |
| | | | | | | | 59,166 | |
| | | | | Utilities - 0.1% | | | | |
| | 10 | | | ALLETE, Inc. | | | 490 | |
The accompanying notes are an integral part of these financial statements.
| Hartford Small Company HLS Fund |
| Schedule of Investments – (continued) |
| June 30, 2014 (Unaudited) |
(000’s Omitted) |
| Shares or Principal Amount | | Market Value ╪ | |
| Common Stocks - 98.9% - (continued) | |
| | | | | Utilities - 0.1% - (continued) | | | | |
| | 15 | | | Pattern Energy Group, Inc. | | $ | 506 | |
| | | | | | | | 996 | |
| | | | | Total Common Stocks | | | | |
| | | | | ( Cost $1,189,437) | | $ | 1,453,241 | |
| | | | | | | | | |
Preferred Stocks - 0.5% | | | | |
| | | | | Transportation - 0.5% | | | | |
| | 1,456 | | | Telogis, Inc. ⌂●† | | $ | 6,219 | |
| | | | | | | | | |
| | | | | Total Preferred Stocks | | | | |
| | | | | (Cost $3,206) | | $ | 6,219 | |
| | | | | | | | | |
| | | | | Total Long-Term Investments | | | | |
| | | | | (Cost $1,192,643) | | $ | 1,459,460 | |
| | | | | | | | | |
| Short-Term Investments - 2.1% | | | | |
| Repurchase Agreements - 2.1% | | | | |
| | | | | Bank of America Merrill Lynch TriParty Repurchase
Agreement (maturing on 07/01/2014 in the
amount of $2,659, collateralized by FHLMC
2.23% - 5.99%, 2030 - 2044, FNMA 2.31% -
6.34%, 2020 - 2042, value of $2,712) | | | | |
| $ | 2,659 | | | 0.10%, 6/30/2014 | | $ | 2,659 | |
| | | | | Bank of Montreal TriParty Repurchase Agreement
(maturing on 07/01/2014 in the amount of
$4,062, collateralized by U.S. Treasury Bill
0.13%, 2015, U.S. Treasury Bond 2.75% -
10.63%, 2015 - 2044, U.S. Treasury Note 0.13%
- 4.50%, 2014 - 2024, value of $4,144) | | | | |
| | 4,062 | | | 0.09%, 6/30/2014 | | | 4,062 | |
| | | | | Bank of Montreal TriParty Repurchase Agreement
(maturing on 07/01/2014 in the amount of
$1,732, collateralized by FHLMC 2.00% -
5.50%, 2018 - 2041, FNMA 2.00% - 4.50%,
2026 - 2042, GNMA 3.00% - 4.00%, 2042 -
2043, U.S. Treasury Bill 0.05%, 2014, U.S.
Treasury Note 0.75%, 2018, value of $1,767) | | | | |
| | 1,732 | | | 0.11%, 6/30/2014 | | | 1,732 | |
| | | | | Barclays Capital TriParty Repurchase Agreement
(maturing on 07/01/2014 in the amount of
$1,603, collateralized by U.S. Treasury Note
0.63% - 0.88%, 2018 - 2019, value of $1,634) | | | | |
| | 1,603 | | | 0.07%, 6/30/2014 | | | 1,603 | |
| | | | | Citigroup Global Markets, Inc. TriParty Repurchase
Agreement (maturing on 07/01/2014 in the
amount of $3,692, collateralized by U.S.
Treasury Bond 4.38% - 7.50%, 2016 - 2040,
U.S. Treasury Note 0.50% - 3.00%, 2014 -
2020, value of $3,765) | | | | |
| | 3,692 | | | 0.06%, 6/30/2014 | | | 3,692 | |
| | | | | RBS Securities Inc. TriParty Repurchase
Agreement (maturing on 07/01/2014 in the
amount of $5,658, collateralized by U.S.
Treasury Note 0.38% - 3.13%, 2015 - 2022,
value of $5,771) | | | | |
| | 5,658 | | | 0.08%, 6/30/2014 | | | 5,658 | |
| | | | | TD Securities TriParty Repurchase Agreement
(maturing on 07/01/2014 in the amount of
$11,776, collateralized by FHLMC 3.50% -
4.00%, 2026 - 2044, FNMA 2.50% - 5.00%,
2025 - 2043, value of $12,012) | | | | |
| 11,776 | | | 0.11%, 6/30/2014 | | | 11,776 | |
| | | | | UBS Securities Repurchase Agreement (maturing
on 07/01/2014 in the amount of $48,
collateralized by U.S. Treasury Note 2.13%,
2020, value of $49) | | | | |
| | 48 | | | 0.05%, 6/30/2014 | | | 48 | |
| | | | | | | | 31,230 | |
| | | | | Total Short-Term Investments | | | | |
| | | | | (Cost $31,230) | | $ | 31,230 | |
| | | | | | | | | |
| | | | | Total Investments | | | | |
| | | | | (Cost $1,223,873) ▲ | | | 101.5 | % | | $ | 1,490,690 | |
| | | | | Other Assets and Liabilities | | | (1.5 | )% | | | (21,416 | ) |
| | | | | Total Net Assets | | | 100.0 | % | | $ | 1,469,274 | |
The accompanying notes are an integral part of these financial statements.
| Hartford Small Company HLS Fund |
| Schedule of Investments – (continued) |
| June 30, 2014 (Unaudited) |
(000’s Omitted) |
| Note: | Percentage of investments as shown is the ratio of the total market value to total net assets. |
| | |
| | Prices of foreign equities that are principally traded on certain foreign markets may be adjusted daily pursuant to a fair value pricing service approved by the Board of Directors in order to reflect an adjustment for factors occurring after the close of certain foreign markets but before the close of the New York Stock Exchange. |
| ▲ | At June 30, 2014, the cost of securities for federal income tax purposes was $1,227,435 and the aggregate gross unrealized appreciation and depreciation based on that cost were: |
| Unrealized Appreciation | | $ | 284,700 | |
| Unrealized Depreciation | | | (21,445 | ) |
| Net Unrealized Appreciation | | $ | 263,255 | |
| † | These securities were valued in good faith at fair value as determined under policies and procedures established by and under the supervision of the Board of Directors. At June 30, 2014, the aggregate value of these securities was $38,749, which represents 2.6% of total net assets. This amount excludes securities that are principally traded in certain foreign markets and whose prices are adjusted pursuant to a third party pricing service methodology approved by the Board of Directors. |
| ⌂ | The following securities are considered illiquid. Illiquid securities are often purchased in private placement transactions, are often not registered under the Securities Act of 1933, as amended, and may have contractual restrictions on resale. A security may also be considered illiquid if the security lacks a readily available market or if its valuation has not changed for a certain period of time. |
| Period Acquired | | Shares/ Par | | | Security | | Cost Basis | |
| 08/2011 | | | 5,016 | | | Allstar Co. | | $ | 2,182 | |
| 04/2014 | | | 1,394 | | | Apigee Corp. | | | 4,056 | |
| 02/2014 | | | 170 | | | Cloudera, Inc. | | | 2,475 | |
| 02/2014 | | | 133 | | | DocuSign, Inc. | | | 1,753 | |
| 08/2013 | | | 151 | | | Mobileye N.V. | | | 5,273 | |
| 04/2014 | | | 197 | | | Pure Storage, Inc. | | | 3,098 | |
| 05/2014 | | | 92 | | | Sancilio & Co., Inc. | | | 349 | |
| 09/2013 | | | 1,069 | | | Telogis, Inc. | | | 2,119 | |
| 09/2013 | | | 1,456 | | | Telogis, Inc. Preferred | | | 3,206 | |
| 11/2013 | | | 105 | | | Tory Burch LLC | | | 8,228 | |
At June 30, 2014, the aggregate value of these securities was $38,749, which represents 2.6% of total net assets.
| ☼ | This security, or a portion of this security, was purchased on a when-issued, delayed-delivery or delayed-draw basis. The cost of these securities was $2,726 at June 30, 2014. |
| ‡ | This security, or a portion of this security, has been segregated to cover funding requirements on investment transactions settling in the future. |
Cash pledged and received as collateral in connection with derivatives at June 30, 2014.
| | | Pledged | | | Received | |
| Futures contracts | | $ | 117 | | | $ | – | |
| Total | | $ | 117 | | | $ | – | |
| Foreign Currency Contracts Outstanding at June 30, 2014 |
| |
| | | | | | | | | | | | | | | Unrealized Appreciation/(Depreciation) | |
| Currency | | Buy / Sell | | Delivery Date | | Counterparty | | Contract Amount | | | Market Value ╪ | | | Asset | | | Liability | |
| CHF | | Buy | | 07/01/2014 | | CSFB | | $ | 14 | | | $ | 14 | | | $ | – | | | $ | – | |
The accompanying notes are an integral part of these financial statements.
| Hartford Small Company HLS Fund |
| Schedule of Investments – (continued) |
| June 30, 2014 (Unaudited) |
(000’s Omitted) |
Futures Contracts Outstanding at June 30, 2014
| | | Number of | | | Expiration | | Notional | | | Market | | | Unrealized
Appreciation/(Depreciation) | | | Variation Margin | |
| Description | | Contracts* | | | Date | | Amount | | | Value ╪ | | | Asset | | | Liability | | | Asset | | | Liability | |
| Long position contracts: | | | | | | | | | | | | | | | | | | | | | | | | | | | | | | |
| Russell 2000 Mini Index Future | | | 23 | | | 09/19/2014 | | $ | 2,695 | | | $ | 2,738 | | | $ | 43 | | | $ | – | | | $ | 19 | | | $ | – | |
* The number of contracts does not omit 000's.
| ╪ | See Significant Accounting Policies of accompanying Notes to Financial Statements regarding valuation of securities. |
The accompanying notes are an integral part of these financial statements.
| Hartford Small Company HLS Fund |
| Schedule of Investments – (continued) |
| June 30, 2014 (Unaudited) |
(000’s Omitted) |
| GLOSSARY: (abbreviations used in preceding Schedule of Investments) |
| |
| Counterparty Abbreviations: |
| CSFB | Credit Suisse First Boston Corp. |
| |
| Currency Abbreviations: |
| CHF | Swiss Franc | |
| |
| Other Abbreviations: |
| ADR | American Depositary Receipt |
| FHLMC | Federal Home Loan Mortgage Corp. |
| FNMA | Federal National Mortgage Association |
| GNMA | Government National Mortgage Association |
| PIPE | Private Investment in Public Equity |
| REIT | Real Estate Investment Trust |
The accompanying notes are an integral part of these financial statements.
| Hartford Small Company HLS Fund |
| Investment Valuation Hierarchy Level Summary |
| June 30, 2014 (Unaudited) |
(000’s Omitted) |
| | | Total | | | Level 1 ♦ | | | Level 2 ♦ | | | Level 3 | |
| Assets: | | | | | | | | | | | | | | | | |
| Common Stocks ‡ | | $ | 1,453,241 | | | $ | 1,408,954 | | | $ | 11,757 | | | $ | 32,530 | |
| Preferred Stocks | | | 6,219 | | | | – | | | | – | | | | 6,219 | |
| Short-Term Investments | | | 31,230 | | | | – | | | | 31,230 | | | | – | |
| Total | | $ | 1,490,690 | | | $ | 1,408,954 | | | $ | 42,987 | | | $ | 38,749 | |
| Foreign Currency Contracts * | | $ | – | | | $ | – | | | $ | – | | | $ | – | |
| Futures * | | | 43 | | | | 43 | | | | – | | | | – | |
| Total | | $ | 43 | | | $ | 43 | | | $ | – | | | $ | – | |
| ♦ | For the six-month period ended June 30, 2014, investments valued at $475 were transferred from Level 1 to Level 2, and investments valued at $208 were transferred from Level 2 to Level 1. Investments are transferred between Level 1 and Level 2 for a variety of reasons including, but not limited to: |
| 1) | Foreign equities for which a fair value price is more representative of exit value than the local market close (transfer into Level |
| 2) | Foreign equities for which the local market close is more representative of exit value (transfer into Level 1). 2) U.S. Treasury securities that no longer represent the most recent issue (transfer into Level 2). |
| 3) | Equity investments with no observable trading but a bid or mean price is used (transfer into Level 2). Equity investments using observable quoted prices in an active market (transfer into Level 1). |
| ‡ | The Fund has all or primarily all of the equity securities categorized in a particular level. Refer to the Schedule of Investments for further industry breakout. |
| * | Derivative instruments (excluding purchased and written options, if applicable) are valued at the unrealized appreciation/depreciation on the investments. |
Following is a reconciliation of Level 3 assets for which significant unobservable inputs were used to determine fair value:
| | | Balance as
of
December
31, 2013 | | | Realized
Gain
(Loss) | | | Change in
Unrealized
Appreciation
(Depreciation) | | | Net
Amortization | | | Purchases | | | Sales | | | Transfers
Into
Level 3 * | | | Transfers
Out of
Level 3 * | | | Balance as
of June 30,
2014 | |
| Assets: | | | | | | | | | | | | | | | | | | | | | | | | | | | | | | | | | | | | |
| Common Stocks | | $ | 26,780 | | | $ | 767 | | | $ | (5,347 | )† | | $ | — | | | $ | 11,731 | | | $ | (2,535 | ) | | $ | 1,134 | | | $ | — | | | $ | 32,530 | |
| Preferred Stocks | | | 2,885 | | | | — | | | | 3,334 | ‡ | | | — | | | | — | | | | — | | | | — | | | | — | | | | 6,219 | |
| Total | | $ | 29,665 | | | $ | 767 | | | $ | (2,013 | ) | | $ | — | | | $ | 11,731 | | | $ | (2,535 | ) | | $ | 1,134 | | | $ | — | | | $ | 38,749 | |
| * | Investments are transferred into and out of Level 3 for a variety of reasons including, but not limited to: |
| 1) | Investments where trading has been halted (transfer into Level 3) or investments where trading has resumed (transfer out of Level 3). |
| 2) | Broker quoted investments (transfer into Level 3) or quoted prices in active markets (transfer out of Level 3). |
| 3) | Investments that have certain restrictions on trading (transfer into Level 3) or investments where trading restrictions have expired (transfer out of Level 3). |
| † | Change in unrealized appreciation (depreciation) in the current period relating to assets still held at June 30, 2014 was $(5,200). |
| ‡ | Change in unrealized appreciation (depreciation) in the current period relating to assets still held at June 30, 2014 was $3,334. |
| Note: | For purposes of reporting transfers between different hierarchy levels, both transfers in and out of each level, as applicable, are shown as if they occurred at the beginning of the period. |
The accompanying notes are an integral part of these financial statements.
| Hartford Small Company HLS Fund |
| Statement of Assets and Liabilities |
| June 30, 2014 (Unaudited) |
(000’s Omitted) |
| Assets: | | | | |
| Investments in securities, at market value (cost $1,223,873) | | $ | 1,490,690 | |
| Cash | | | 459 | * |
| Foreign currency on deposit with custodian (cost $—) | | | — | |
| Unrealized appreciation on foreign currency contracts | | | — | |
| Receivables: | | | | |
| Investment securities sold | | | 18,262 | |
| Fund shares sold | | | 1,077 | |
| Dividends and interest | | | 459 | |
| Variation margin on financial derivative instruments | | | 19 | |
| Other assets | | | 5 | |
| Total assets | | | 1,510,971 | |
| Liabilities: | | | | |
| Payables: | | | | |
| Investment securities purchased | | | 31,809 | |
| Fund shares redeemed | | | 9,656 | |
| Investment management fees | | | 136 | |
| Distribution fees | | | 5 | |
| Accrued expenses | | | 91 | |
| Total liabilities | | | 41,697 | |
| Net assets | | $ | 1,469,274 | |
| Summary of Net Assets: | | | | |
| Capital stock and paid-in-capital | | $ | 805,948 | |
| Distributions in excess of net investment income | | | (2,676 | ) |
| Accumulated net realized gain | | | 399,142 | |
| Unrealized appreciation of investments and the translations of assets and liabilities denominated in foreign currency | | | 266,860 | |
| Net assets | | $ | 1,469,274 | |
| Shares authorized | | | 1,500,000 | |
| Par value | | $ | 0.001 | |
| Class IA: Net asset value per share | | $ | 27.64 | |
| Shares outstanding | | | 48,211 | |
| Net assets | | $ | 1,332,430 | |
| Class IB: Net asset value per share | | $ | 26.60 | |
| Shares outstanding | | | 5,144 | |
| Net assets | | $ | 136,844 | |
* Cash of $117 was pledged as initial margin deposit and collateral for daily variation margin loss on open financial derivative instruments at June 30, 2014.
The accompanying notes are an integral part of these financial statements.
| Hartford Small Company HLS Fund |
| Statement of Operations |
For the Six-Month Period Ended June 30, 2014 (Unaudited) |
(000’s Omitted) |
| Investment Income: | | | | |
| Dividends | | $ | 2,791 | |
| Interest | | | 4 | |
| Less: Foreign tax withheld | | | (43 | ) |
| Total investment income, net | | | 2,752 | |
| | | | | |
| Expenses: | | | | |
| Investment management fees | | | 4,948 | |
| Transfer agent fees | | | 3 | |
| Distribution fees - Class IB | | | 171 | |
| Custodian fees | | | 4 | |
| Accounting services fees | | | 88 | |
| Board of Directors' fees | | | 17 | |
| Audit fees | | | 11 | |
| Other expenses | | | 88 | |
| Total expenses (before fees paid indirectly) | | | 5,330 | |
| Commission recapture | | | (36 | ) |
| Total fees paid indirectly | | | (36 | ) |
| Total expenses, net | | | 5,294 | |
| Net Investment Loss | | | (2,542 | ) |
| | | | | |
| Net Realized Gain on Investments, Other Financial Instruments and Foreign Currency Transactions: | | | | |
| Net realized gain on investments | | | 152,250 | |
| Net realized loss on futures contracts | | | (13 | ) |
| Net realized gain on foreign currency contracts | | | 39 | |
| Net realized loss on other foreign currency transactions | | | (35 | ) |
| Net Realized Gain on Investments, Other Financial Instruments and Foreign Currency Transactions | | | 152,241 | |
| | | | | |
| Net Changes in Unrealized Depreciation of Investments, Other Financial Instruments and Foreign Currency Transactions: | | | | |
| Net unrealized depreciation of investments | | | (86,930 | ) |
| Net unrealized appreciation of futures contracts | | | 43 | |
| Net unrealized depreciation of foreign currency contracts | | | (1 | ) |
| Net unrealized appreciation on translation of other assets and liabilities in foreign currencies | | | 1 | |
| Net Changes in Unrealized Depreciation of Investments, Other Financial Instruments and Foreign Currency Transactions | | | (86,887 | ) |
| Net Gain on Investments, Other Financial Instruments and Foreign Currency Transactions | | | 65,354 | |
| Net Increase in Net Assets Resulting from Operations | | $ | 62,812 | |
The accompanying notes are an integral part of these financial statements.
| Hartford Small Company HLS Fund |
| Statement of Changes in Net Assets |
| |
(000’s Omitted) |
| | | For the
Six-Month
Period Ended
June 30, 2014
(Unaudited) | | | For the
Year Ended
December 31,
2013 | |
| Operations: | | | | | | | | |
| Net investment loss | | $ | (2,542 | ) | | $ | (4,239 | ) |
| Net realized gain on investments, other financial instruments and foreign currency transactions | | | 152,241 | | | | 258,213 | |
| Net unrealized appreciation (depreciation) of investments, other financial instruments and foreign currency transactions | | | (86,887 | ) | | | 244,341 | |
| Net Increase in Net Assets Resulting from Operations | | | 62,812 | | | | 498,315 | |
| Distributions to Shareholders: | | | | | | | | |
| From net investment income | | | | | | | | |
| Class IA | | | — | | | | (1,038 | ) |
| Total from net investment income | | | — | | | | (1,038 | ) |
| From net realized gain on investments | | | | | | | | |
| Class IA | | | — | | | | (89,056 | ) |
| Class IB | | | — | | | | (9,991 | ) |
| Total from net realized gain on investments | | | — | | | | (99,047 | ) |
| Total distributions | | | — | | | | (100,085 | ) |
| Capital Share Transactions: | | | | | | | | |
| Class IA | | | | | | | | |
| Sold | | | 83,055 | | | | 161,148 | |
| Issued on reinvestment of distributions | | | — | | | | 90,094 | |
| Redeemed | | | (162,554 | ) | | | (383,841 | ) |
| Total capital share transactions | | | (79,499 | ) | | | (132,599 | ) |
| Class IB | | | | | | | | |
| Sold | | | 9,182 | | | | 27,421 | |
| Issued on reinvestment of distributions | | | — | | | | 9,991 | |
| Redeemed | | | (19,833 | ) | | | (49,914 | ) |
| Total capital share transactions | | | (10,651 | ) | | | (12,502 | ) |
| Net decrease from capital share transactions | | | (90,150 | ) | | | (145,101 | ) |
| Net Increase (Decrease) in Net Assets | | | (27,338 | ) | | | 253,129 | |
| Net Assets: | | | | | | | | |
| Beginning of period | | | 1,496,612 | | | | 1,243,483 | |
| End of period | | $ | 1,469,274 | | | $ | 1,496,612 | |
| Undistributed (distribution in excess of) net investment income | | $ | (2,676 | ) | | $ | (134 | ) |
| Shares: | | | | | | | | |
| Class IA | | | | | | | | |
| Sold | | | 3,114 | | | | 6,827 | |
| Issued on reinvestment of distributions | | | — | | | | 3,820 | |
| Redeemed | | | (6,170 | ) | | | (16,433 | ) |
| Total share activity | | | (3,056 | ) | | | (5,786 | ) |
| Class IB | | | | | | | | |
| Sold | | | 357 | | | | 1,220 | |
| Issued on reinvestment of distributions | | | — | | | | 439 | |
| Redeemed | | | (781 | ) | | | (2,236 | ) |
| Total share activity | | | (424 | ) | | | (577 | ) |
The accompanying notes are an integral part of these financial statements.
| Hartford Small Company HLS Fund |
| Notes to Financial Statements |
| June 30, 2014 (Unaudited) |
| (000’s Omitted) |
Organization:
Hartford Small Company HLS Fund (the "Fund") serves as an underlying investment option for certain variable annuity and variable life insurance separate accounts of Hartford Life Insurance Company (“HLIC”) and its affiliates and certain qualified retirement plans. The Fund may also serve as an underlying investment option for certain variable annuity and variable life separate accounts of other insurance companies. Owners of variable annuity contracts and policyholders of variable life insurance contracts may choose the funds permitted in the variable insurance contract prospectus. In addition, participants in certain qualified retirement plans may choose the Fund if permitted by their plans.
Hartford Series Fund, Inc. (the “Company”) is an open-end registered management investment company comprised of twenty-eight portfolios. Financial statements for the Fund, a series of the Company, are included in this report.
The Company is organized under the laws of the State of Maryland and is registered with the Securities and Exchange Commission (“SEC”) under the Investment Company Act of 1940, as amended (“1940 Act”). The Fund's portfolio managers are Steven C. Angeli (87%), Mammen Chally (10%) and Jamie A. Rome (3%). The portfolio management team also includes Mario E. Abularach and Stephen Mortimer. The Fund is a diversified open-end management investment company.
The Fund is divided into Class IA and Class IB shares. Each class is offered at the per share net asset value (“NAV”) without a sales charge and is subject to the same expenses, except that the Class IB shares are subject to distribution and service fees charged pursuant to a Distribution Plan adopted in accordance with Rule 12b-1 under the 1940 Act.
Significant Accounting Policies:
The following is a summary of significant accounting policies of the Fund in the preparation of its financial statements, which are in accordance with United States Generally Accepted Accounting Principles (“U.S. GAAP”). The preparation of financial statements in accordance with U.S. GAAP may require management to make estimates and assumptions that affect the reported amounts of assets and liabilities and disclosure of contingent assets and liabilities at the date of the financial statements and the reported amounts of increases and decreases in net assets from operations during the reporting period. Actual results could differ from those estimates.
Determination of Net Asset Value – The NAV of each class of the Fund's shares is determined as of the close of regular trading (normally 4:00 p.m. Eastern Time) (the “NYSE Close”) on each day that the New York Stock Exchange (the “Exchange”) is open (“Valuation Date”). Information that becomes known to the Fund after the NAV has been calculated on a particular day will not generally be used to retroactively adjust the NAV determined earlier that day.
Investment Valuation and Fair Value Measurements – For purposes of calculating the NAV, portfolio investments and other assets held by the Fund's portfolio for which market quotes are readily available are valued at market value. Market value is generally determined on the basis of last reported sales prices or official close price. If no sales are reported, market value is based on quotes obtained from a quotation reporting system, established market makers, or independent pricing services. If market prices are not readily available or are deemed unreliable, the Fund will use the fair value of the investment as determined in good faith under policies and procedures established by and under the supervision of the Company's Board of Directors. Market quotes are considered not readily available where there is an absence of current or reliable market-based data (e.g., trade information or indicative market quotes), including where events occur after the close of the relevant market, but prior to the NYSE Close, that materially affect the values of the Fund's portfolio investments or assets. In addition, market quotes are considered not readily available when, due to extraordinary circumstances, the exchanges or markets on which the investments trade do not open for trading for the entire day and no other market prices are available. In addition, prices of foreign equities that are principally traded on certain foreign markets may be adjusted daily pursuant to a fair value pricing service approved by the Board of Directors in order to reflect an adjustment for the factors occurring after the close of certain foreign markets but before the NYSE Close. Investments that are primarily traded on foreign markets may trade on days that are not business days of the Fund. The value of the foreign investments in which the Fund invests may change on days when a shareholder will not be able to purchase or redeem shares of the Fund. Fair value pricing is subjective in nature and the use of fair value pricing by the Fund may cause the NAV of its shares to differ significantly from the NAV that would have been calculated using market prices at the close of the exchange on which a portfolio investment is primarily
| Hartford Small Company HLS Fund |
| Notes to Financial Statements – (continued) |
| June 30, 2014 (Unaudited) |
| (000’s Omitted) |
traded. There can be no assurance that the Fund could obtain the fair market value assigned to an investment if the Fund were to sell the investment at approximately the time at which the Fund determines its NAV.
Exchange traded options, futures and options on futures are valued at the settlement price or last trade price determined by the relevant exchange as of the NYSE Close. If the last trade price for exchange traded options does not fall between the bid and ask prices, the value will be the mean of the bid and ask prices as of the NYSE Close. If a last trade price is not available, the value will be the mean of the bid and ask prices as of the NYSE Close. If a mean of the bid and ask prices cannot be calculated for the day, the value will be the bid price as of the NYSE Close. In the case of over-the-counter ("OTC") options and such instruments that do not trade on an exchange, values may be supplied by a pricing service using a formula or other objective method that may take into consideration the style, direction, expiration, strike price, notional value and volatility or other special adjustments.
Investments valued in currencies other than U.S. dollars are converted to U.S. dollars using exchange rates obtained from independent pricing services for calculation of the NAV. As a result, the NAV of the Fund’s shares may be affected by changes in the value of currencies in relation to the U.S. dollar. The value of investments traded in markets outside the United States or denominated in currencies other than the U.S. dollar may be affected significantly on a day that the NYSE is closed and the market value may change on days when an investor is not able to purchase, redeem or exchange shares of the Fund.
Foreign currency contracts represent agreements to exchange currencies on specific future dates at predetermined rates. Foreign currency contracts are valued using foreign currency exchange rates and forward rates as provided by an independent pricing service on the Valuation Date.
Financial instruments for which prices are not available from an independent pricing service may be valued using market quotations obtained from one or more dealers that make markets in the respective financial instrument in accordance with procedures established by the Company's Board of Directors.
U.S. GAAP defines fair value as the price that the Fund would receive to sell an asset or pay to transfer a liability in an orderly transaction between market participants. The U.S. GAAP fair value measurement standards require disclosure of a fair value hierarchy for each major category of assets and liabilities. Various inputs are used in determining the fair value of the Fund’s investments. These inputs are summarized into three broad hierarchy levels. This hierarchy is based on whether the valuation inputs are observable or unobservable. These levels are:
Level 1 – Quoted prices in active markets for identical investments. Level 1 may include exchange traded instruments, such as domestic equities, some foreign equities, options, futures, mutual funds, exchange traded funds, rights and warrants.
Level 2 – Observable inputs other than Level 1 prices, such as quoted prices for similar investments; quoted prices in markets that are not active; or other inputs that are observable or can be corroborated by observable market data. Level 2 may include debt investments that are traded less frequently than exchange traded instruments and which are valued using independent pricing services; foreign equities, which are principally traded on certain foreign markets and are adjusted daily pursuant to a fair value pricing service in order to reflect an adjustment for the factors occurring after the close of certain foreign markets but before the NYSE Close; senior floating rate interests, which are valued using an aggregate of dealer bids; short-term investments, which are valued at amortized cost; and swaps, which are valued based upon the terms of each swap contract.
Level 3 – Significant unobservable inputs that are supported by limited or no market activity. Level 3 may include financial instruments whose values are determined using indicative market quotes or require significant management judgment or estimation. These unobservable valuation inputs may include estimates for current yields, maturity/duration, prepayment speed, and indicative market quotes for comparable investments along with other assumptions relating to credit quality, collateral value, complexity of the investment structure, general market conditions and liquidity. This category may include investments where trading has been halted or there are certain restrictions on trading. While these investments are priced using unobservable inputs, the valuation of these investments reflects the best available data and management believes the prices are a reasonable representation of exit price. For more information on specific valuation techniques and unobservable inputs, please see table below titled "Quantitative Information about Level 3 Fair Value Measurements."
| Hartford Small Company HLS Fund |
| Notes to Financial Statements – (continued) |
| June 30, 2014 (Unaudited) |
| (000’s Omitted) |
The Board of Directors of the Company generally reviews and approves the “Procedures for Valuation of Portfolio Securities” at least once a year. These procedures define how investments are to be valued, including the formation and activities of a Valuation Committee. The Valuation Committee is responsible for determining in good faith the fair value of investments when the value cannot be obtained from primary pricing services or alternative sources or if the valuation of an investment as provided by the primary pricing service or alternative source is believed not to reflect the investment’s fair value as of the Valuation Date. Voting members of the Valuation Committee include the Fund’s Treasurer or designee and a Vice President of the investment manager or designee. An Assistant Vice President of the Fund with legal expertise or designee is also included on the Valuation Committee as a non-voting advisory member. In addition, the Fund’s Chief Compliance Officer shall designate a member of the compliance group to attend Valuation Committee meetings as a non-voting resource, to monitor for and provide guidance with respect to compliance with these procedures. Two members of the Valuation Committee or their designees, representing different departments, shall constitute a quorum for purposes of permitting the Valuation Committee to take action. The Valuation Committee will consider all relevant factors in determining an investment’s fair value, and may seek the advice of the Fund’s sub-adviser, knowledgeable brokers, and legal counsel in making such determination. The Valuation Committee reports to the Audit Committee of the Company’s Board of Directors. The Audit Committee receives quarterly written reports which include details of all fair-valued investments, including the reason for the fair valuation, and an indication, when possible, of the accuracy of the valuation by disclosing the next available reliable public price quotation or the disposition price of such investments (the “look-back” test). The Board of Directors then must consider for ratification all of the fair value determinations made during the previous quarter.
Valuation levels are not necessarily indicative of the risk associated with investing in such investments. Individual investments within any of the above mentioned asset classes may be assigned a different hierarchical level than those presented above, as individual circumstances dictate.
For additional information, refer to the Investment Valuation Hierarchy Level Summary and the Level 3 roll-forward reconciliation, if applicable, which follow the Schedule of Investments.
Quantitative Information about Level 3 Fair Value Measurements:
| Security Type/Valuation Technique | | Unobservable Input * | | Input Value(s) Range (Weighted Average) ‡ | | Fair Value at
June 30, 2014 | |
| Assets: | | | | | | | | |
| Common Stocks: | | | | | | | | |
| Cost Δ | | Recent trade price | | $2.62 - $14.15 ($8.83) | | | 8,980 | |
| | | Date | | 2/5/2014 - 5/20/2014 | | | | |
| Model Δ | | Enterprise Value/Last Twelve Months EBITDA | | 5.40x to 9.73x | | | 5,423 | |
| Model Δ | | Enterprise Value/2014 EBITDA | | 12.39x to 19.65x | | | 7,104 | |
| Model Δ | | Enterprise Value/2015 EBITDA ◄ | | 5.67x to 13.81x | | | 2,727 | |
| Model Δ | | Enterprise Value/2015 EBITDA | | 9.23x to 20.17x | | | 7,430 | |
| Model Δ | | Enterprise Value/2014 Revenue ♠ | | 1.90x to 4.90x | | | 866 | |
| Preferred Stocks: | | | | | | | | |
| Model Δ | | Enterprise Value/2014 Revenue ♠ | | 1.90x to 4.90x | | | 6,219 | |
| Total | | | | | | $ | 38,749 | |
| | * | Significant changes to any unobservable inputs may result in a significant change to the fair value. |
| | ‡ | Unless otherwise noted, inputs were weighted based on the fair value of the investments included in the range. |
| | Δ | Includes illiquidity discount of 10%. |
| | ◄ | The Option Pricing Method ("OPM") is used to allocate enterprise value between multiple tiers of equity. Inputs for the OPM include: |
| | | Volatility - 40% |
| | | Term to Liquidity Event - 1.5 years |
| | | Risk-free rate - 0.10% |
| | ♠ | The OPM is used to allocate enterprise values between multiple tiers of equity. Inputs for the OPM include: |
| | | Volatility - 50.0% |
| | | Term to Liquidity Event - 1.0 years |
| | | Risk-free rate - 0.10% |
| Hartford Small Company HLS Fund |
| Notes to Financial Statements – (continued) |
| June 30, 2014 (Unaudited) |
| (000’s Omitted) |
Investment Transactions and Investment Income – Investment transactions are recorded as of the trade date (the date the order to buy or sell is executed) for financial reporting purposes. Investments purchased or sold on a when-issued or delayed-delivery basis may be settled a month or more after the trade date. Realized gains and losses are determined on the basis of identified cost.
Dividend income from domestic securities is accrued on the ex-dividend date. In general, dividend income from foreign securities is recorded on the ex-date; however, dividend notifications in certain foreign jurisdictions may not be available in a timely manner and as a result, the Fund will record the dividend as soon as the relevant details (i.e., rate per share, payment date, shareholders of record, etc.) are publicly available. Interest income, including amortization of premium, accretion of discounts and additional principal received in-kind in lieu of cash, is accrued on a daily basis.
Foreign Currency Transactions – Assets and liabilities denominated in currencies other than U.S. dollars are translated into U.S. dollars at the exchange rates in effect on the valuation date. Purchases and sales of investments, income and expenses are translated into U.S. dollars at the exchange rates on the dates of such transactions.
The Fund does not isolate that portion of portfolio investment valuation resulting from fluctuations in the foreign currency exchange rates from the fluctuations arising from changes in the market prices of investments held. Exchange rate fluctuations are included with the net realized and unrealized gain or loss on investments in the accompanying financial statements.
Net realized foreign exchange gains or losses arise from sales of foreign currencies and the difference between asset and liability amounts initially stated in foreign currencies and the U.S. dollar value of the amounts actually received or paid. Net unrealized foreign exchange gains or losses arise from changes in the value of other assets and liabilities at the end of the reporting period, resulting from changes in the exchange rates.
Joint Trading Account – The Fund may invest cash balances into a joint trading account that may be invested in one or more repurchase agreements.
Fund Share Valuation and Dividend Distributions to Shareholders – Orders for the Fund’s shares are executed in accordance with the investment instructions of the contract holders and plan participants. The NAV of the Fund’s shares is determined as of the close of business on each business day of the Exchange. The NAV is determined separately for each class of shares of the Fund by dividing the Fund’s net assets attributable to that class by the number of shares of the class outstanding. Each class of shares offered by the Fund has equal rights as to assets and voting privileges (except that shareholders of a class have exclusive voting rights regarding any matter relating solely to that class of shares). Income and non-class specific expenses are allocated daily to each class on the basis of the relative net assets of the class. Realized and unrealized gains and losses are allocated daily based on the relative net assets of each class of shares of the Fund.
Orders for the purchase of the Fund’s shares received prior to the close of the Exchange on any day the Exchange is open for business are priced at the NAV determined as of the close of the Exchange. Orders received after the close of the Exchange, or on a day on which the Exchange and/or the Fund is not open for business, are priced at the next determined NAV.
Dividends are declared pursuant to a policy adopted by the Company's Board of Directors based upon the investment performance of the Fund. The policy of the Fund is to pay dividends from net investment income and realized gains, if any, at least once a year.
Distributions from net investment income, net realized gains and capital are determined in accordance with federal income tax regulations, which may differ from U.S. GAAP with respect to character and timing. These differences may include, but are not limited to, losses deferred due to wash sale adjustments, foreign currency gains and losses, adjustments related to Passive Foreign Investment Companies ("PFICs"), Real Estate Investment Trusts ("REITs"), Regulated Investment Companies ("RICs"), certain derivatives and partnerships. Permanent book and federal income tax basis differences relating to shareholder distributions will result in reclassifications to certain of the Fund’s capital accounts (see Federal Income Taxes: Reclassification of Capital Accounts note).
Securities and Other Investments:
Repurchase Agreements – A repurchase agreement is an agreement by which a counterparty agrees to sell an investment and agrees to repurchase the investment sold from the buyer at a mutually agreed upon time and price. During the period of the
| Hartford Small Company HLS Fund |
| Notes to Financial Statements – (continued) |
| June 30, 2014 (Unaudited) |
| (000’s Omitted) |
repurchase agreement, the counterparty will deposit cash and or securities in a third party custodial account to serve as collateral. At the time the Fund enters into a repurchase agreement, the value of the underlying collateral, including accrued interest, will be equal to or exceed the value of the repurchase agreement. Repurchase agreements expose the Fund to counterparty risk - that is, the risk that the counterparty will not fulfill its obligations. To minimize counterparty risk, the investments that serve to collateralize the repurchase agreement are held by the Fund’s custodian in book entry or physical form in the custodial account of the Fund or in a third party custodial account. Repurchase agreements are valued at cost plus accrued interest, which approximates fair value. Repurchase agreements have master netting arrangements which allow the Fund to offset amounts owed to a counterparty with amounts owed by the counterparty, including any collateral. Upon an event of default under a master repurchase agreement, the non-defaulting party may close out all transactions traded under such agreement and net amounts owed under each transaction to one net amount payable by one party to the other. Absent an event of default, the master repurchase agreement does not result in an offset of reported amounts of assets and liabilities in the Statement of Assets and Liabilities across transactions between the Fund and the applicable counterparty. The Fund, as shown on the Schedule of Investments, had outstanding repurchase agreements and related collateral as of June 30, 2014.
Illiquid and Restricted Investments – The Fund is permitted to invest up to 15% of its net assets in illiquid investments. Illiquid investments are those that may not be sold or disposed of in the ordinary course of business within seven days, at approximately the price used to determine the Fund’s NAV. The Fund may not be able to sell illiquid investments when its sub-adviser considers it desirable to do so or may have to sell such investments at a price that is lower than the price that could be obtained if the investments were more liquid. A sale of illiquid investments may require more time and may result in higher dealer discounts and other selling expenses than does the sale of those that are liquid. Illiquid investments also may be more difficult to value due to the unavailability of reliable market quotations for such investments, and an investment in them may have an adverse impact on the Fund’s NAV. The Fund may also purchase certain restricted investments that can only be resold to certain qualified investors and may be determined to be liquid pursuant to policies and guidelines established by the Company's Board of Directors. The Fund, as shown on the Schedule of Investments, had illiquid or restricted investments as of June 30, 2014.
Investments Purchased on a When-Issued or Delayed-Delivery Basis – Delivery and payment for investments that have been purchased by the Fund on a forward commitment, or when-issued or delayed-delivery basis, take place beyond the customary settlement period. The Fund may dispose of or renegotiate a delayed-delivery transaction after it is entered into, and may sell delayed-delivery investments before they are delivered, which may result in a realized gain or loss. During this period, such investments are subject to market fluctuations, and the Fund identifies investments segregated in its records with a value at least equal to the amount of the commitment. The Fund, as shown on the Schedule of Investments, had when-issued or delayed-delivery investments as of June 30, 2014.
Financial Derivative Instruments:
The following disclosures contain information on how and why the Fund uses derivative instruments, the credit-risk-related contingent features in certain derivative instruments, and how derivative instruments affect the Fund’s financial position and results of operations. The location and fair value amounts of these instruments on the Statement of Assets and Liabilities and the realized gains and losses and changes in unrealized gains and losses on the Statement of Operations, each categorized by type of derivative contract, are included in the following Additional Derivative Instrument Information footnote. The derivative instruments outstanding as of period-end are disclosed in the notes to or within the Schedule of Investments for purchased options, if applicable. The amounts of realized gains and losses and changes in unrealized gains and losses on derivative instruments during the period are disclosed in the Statement of Operations.
Foreign Currency Contracts – The Fund may enter into foreign currency contracts that obligate the Fund to purchase or sell currencies at specified future dates. Foreign currency contracts are used to hedge the currency exposure associated with some or all of the Fund’s investments and/or as part of an investment strategy. Foreign currency contracts are marked to market daily and the change in value is recorded by the Fund as an unrealized gain or loss. The Fund will record a realized gain or loss when the foreign currency contract is settled.
Foreign currency contracts involve elements of market risk in excess of the amounts reflected in the Statement of Assets and Liabilities. In addition, risks may arise upon entering into these contracts from the potential inability of the counterparties to meet the
| Hartford Small Company HLS Fund |
| Notes to Financial Statements – (continued) |
| June 30, 2014 (Unaudited) |
| (000’s Omitted) |
terms of the contracts and from unanticipated movements in the value of the foreign currencies relative to the U.S. dollar. The Fund, as shown on the Schedule of Investments, had outstanding foreign currency contracts as of June 30, 2014.
Futures Contracts – The Fund may enter into futures contracts. A futures contract is an agreement between two parties to buy or sell an asset at a set price on a future date. The Fund uses futures contracts to manage or obtain exposure to the investment markets, commodities, or movements in interest rates and currency values. The primary risks associated with the use of futures contracts are the imperfect correlation between the change in market value of the investments held by the Fund and the prices of futures contracts and the possibility of an illiquid market. Upon entering into a futures contract, the Fund is required to deposit with a futures commission merchant (“FCM”) an amount of cash or U.S. Government or Agency Obligations in accordance with the initial margin requirements of the broker or exchange. Futures contracts are marked to market daily at the most recent settlement price reported by an exchange on which, over time, they are traded most extensively, and an appropriate payable or receivable for the change in value (“variation margin”) is recorded by the Fund. Gains or losses are recognized but not considered realized until the contracts expire or are closed. Futures contracts involve, to varying degrees, risk of loss in excess of the variation margin disclosed on the Statement of Assets and Liabilities; however, the Fund seeks to reduce this risk through the use of an FCM. The Fund, as shown on the Schedule of Investments, had outstanding futures contracts as of June 30, 2014.
Additional Derivative Instrument Information:
| Fair Value of Derivative Instruments on the Statement of Assets and Liabilities as of June 30, 2014: |
| |
| | | Risk Exposure Category | |
| | | Interest Rate
Contracts | | | Foreign
Exchange
Contracts | | | Credit
Contracts | | | Equity
Contracts | | | Commodity
Contracts | | | Other
Contracts | | | Total | |
| Assets: | | | | | | | | | | | | | | | | | | | | | | | | | | | | |
| Unrealized appreciation on foreign currency contracts | | $ | — | | | $ | — | | | $ | — | | | $ | — | | | $ | — | | | $ | — | | | $ | — | |
| Variation margin receivable * | | | — | | | | — | | | | — | | | | 19 | | | | — | | | | — | | | | 19 | |
| Total | | $ | — | | | $ | — | | | $ | — | | | $ | 19 | | | $ | — | | | $ | — | | | $ | 19 | |
* Only current day's variation margin is reported within the Statement of Assets and Liabilities. The variation margin is included in the open futures cumulative appreciation of $43 as reported in the Schedule of Investments.
The volume of derivatives that is presented in the Schedule of Investments is consistent with the derivative activity during the six-month period ended June 30, 2014.
| The Effect of Derivative Instruments on the Statement of Operations for the six-month period ended June 30, 2014: |
| |
| | | Risk Exposure Category | |
| | | Interest Rate
Contracts | | | Foreign
Exchange
Contracts | | | Credit
Contracts | | | Equity
Contracts | | | Commodity
Contracts | | | Other
Contracts | | | Total | |
| Realized Gain (Loss) on Derivatives Recognized as a Result of Operations: |
| Net realized loss on futures contracts | | $ | — | | | $ | — | | | $ | — | | | $ | (13 | ) | | $ | — | | | $ | — | | | $ | (13 | ) |
| Net realized gain on foreign currency contracts | | | — | | | | 39 | | | | — | | | | — | | | | — | | | | — | | | | 39 | |
| Total | | $ | — | | | $ | 39 | | | $ | — | | | $ | (13 | ) | | $ | — | | | $ | — | | | $ | 26 | |
| | | | | | | | | | | | | | | | | | | | | | | | | | | | | |
| Net Change in Unrealized Appreciation (Depreciation) on Derivatives Recognized as a Result of Operations: |
| Net change in unrealized appreciation of futures contracts | | $ | — | | | $ | — | | | $ | — | | | $ | 43 | | | $ | — | | | $ | — | | | $ | 43 | |
| Net change in unrealized depreciation of foreign currency contracts | | | — | | | | (1 | ) | | | — | | | | — | | | | — | | | | — | | | | (1 | ) |
| Total | | $ | — | | | $ | (1 | ) | | $ | — | | | $ | 43 | | | $ | — | | | $ | — | | | $ | 42 | |
Balance Sheet Offsetting Information - Set forth below are tables which disclose both gross information and net information about instruments and transactions eligible for offset in the financial statements, and instruments and transactions that are subject to a master netting arrangement, as well as amounts related to margin, reflected as financial collateral (including cash collateral), held at
| Hartford Small Company HLS Fund |
| Notes to Financial Statements – (continued) |
| June 30, 2014 (Unaudited) |
| (000’s Omitted) |
clearing brokers, counterparties and the Fund’s custodian. The master netting arrangements allow the clearing brokers to net any collateral held in or on behalf of the Fund, or liabilities or payment obligations of the clearing brokers to the Fund, against any liabilities or payment obligations of the Fund to the clearing brokers. The Fund is required to deposit financial collateral (including cash collateral) at the Futures Commission Merchant's ("FCM") custodian on behalf of clearing brokers and counterparties to continually meet the original and maintenance requirements established by the clearing brokers and counterparties. Such requirements are specific to the respective clearing broker or counterparty. Certain master netting arrangements may not be enforceable in a bankruptcy.
| Offsetting of Financial Assets and Derivative Assets as of June 30, 2014: |
| | | | |
| | | Gross Amounts*
of Assets
Presented in
Statement of
Assets and
Liabilities | | | Financial
Instruments with
Allowable Netting | | | Non-cash
Collateral
Received | | | Cash Collateral
Received | | | Net Amount (not
less than $0) | |
| Description | | | | | | | | | | | | | | | | | | | | |
| Futures contracts - Variation margin receivable | | $ | 19 | | | $ | — | | | $ | — | | | $ | — | | | $ | 19 | |
| Unrealized appreciation on foreign currency contracts | | | — | | | | — | | | | — | | | | — | | | | — | |
| Total subject to a master netting or similar arrangement | | $ | 19 | | | $ | — | | | $ | — | | | $ | — | | | $ | 19 | |
| * | Gross amounts presented as no amounts are netted within the Statements of Assets and Liabilities. |
| Offsetting of Financial Liabilities and Derivative Liabilities as of June 30, 2014: |
| | | | |
| | | Gross Amounts*
of Liabilities
Presented in
Statement of
Assets and
Liabilities | | | Financial
Instruments with
Allowable Netting | | | Non-cash
Collateral
Pledged | | | Cash Collateral
Pledged | | | Net Amount (not
less than $0) | |
| Description | | | | | | | | | | | | | | | | | | | | |
| Futures contracts - Variation margin payable | | $ | — | | | $ | — | | | $ | — | | | $ | (117 | )† | | $ | — | |
| Total subject to a master netting or similar arrangement | | $ | — | | | $ | — | | | $ | — | | | $ | (117 | ) | | $ | — | |
| * | Gross amounts presented as no amounts are netted within the Statement of Assets and Liabilities. |
| † | Pledged as initial margin deposit and collateral for daily variation margin loss on open financial derivative contracts held at June 30, 2014. |
Certain derivatives held by the Fund, as of June 30, 2014, are not subject to a master netting arrangement and are excluded from the table above.
Principal Risks:
The Fund may be exposed to counterparty risk, or the risk that an institution or other entity with which the Fund has unsettled or open transactions will default.
If the Fund invests directly in foreign currencies or in securities that trade in, and receive revenues in, foreign currencies, or in derivatives that provide exposure to foreign currencies, it will be subject to the risk that those currencies will decline in value relative to the base currency (U.S. dollars) of the Fund, or, in the case of hedging positions, that the Fund’s base currency will decline in value relative to the currency being hedged. Currency rates in foreign countries may fluctuate significantly over short periods of time for a number of reasons, including changes in interest rates, intervention (or the failure to intervene) by U.S. or foreign governments, central banks or supranational entities, such as the International Monetary Fund, or by the imposition of currency controls or other political developments in the United States or abroad. As a result, the Fund’s investments in foreign currency denominated securities may reduce the returns of the Fund. The market values of equity securities, such as common stocks and preferred stocks, or equity related investments, such as futures and options, may decline due to general market conditions which are not specifically related to a particular company, such as real or perceived adverse economic conditions, changes in the general outlook for corporate earnings,
| Hartford Small Company HLS Fund |
| Notes to Financial Statements – (continued) |
| June 30, 2014 (Unaudited) |
| (000’s Omitted) |
changes in interest or currency rates or adverse investor sentiment generally. The market value of equity securities may also decline due to factors which affect a particular industry or industries, such as labor shortages or increased production costs and competitive conditions within an industry. Equity securities and equity related investments generally have greater market price volatility than fixed income securities.
Federal Income Taxes:
Federal Income Taxes – For federal income tax purposes, the Fund intends to continue to qualify as a RIC under Subchapter M of the Internal Revenue Code (“IRC”) by distributing substantially all of its taxable net investment income and net realized capital gains to its shareholders and otherwise complying with the requirements of the IRC. The Fund has distributed substantially all of its income and capital gains in prior years, if applicable, and intends to distribute substantially all of its income and capital gains prior to the next fiscal year-end. Accordingly, no provision for federal income or excise taxes has been made in the accompanying financial statements. Distributions from short-term capital gains are treated as ordinary income distributions for federal income tax purposes.
Net Investment Income (Loss), Net Realized Gains (Losses) and Distributions – Net investment income (loss) and net realized gains (losses) may differ for financial statement and tax purposes primarily because of losses deferred due to wash sale adjustments, foreign currency gains and losses, adjustments related to PFICs, REITs, RICs, certain derivatives and partnerships. The character of distributions made during the year from net investment income or net realized gains may differ from their ultimate characterization for federal income tax purposes. Also, due to the timing of dividend distributions, the fiscal year in which amounts are distributed may differ from the year that the income or realized gains (losses) were recorded by the Fund.
Distributions and Components of Distributable Earnings – The tax character of distributions paid by the Fund for the periods indicated is as follows (as adjusted for dividends payable, if applicable):
| | | For the Year Ended
December 31, 2013 | | | For the Year Ended
December 31, 2012 | |
| Ordinary Income | | $ | 1,351 | | | $ | — | |
| Long-Term Capital Gains* | | | 98,734 | | | | 80 | |
| * | The Fund designates these distributions as long-term capital gain dividends pursuant to IRC Sec. 852(b)(3)(C) |
As of December 31, 2013, the Fund’s components of distributable earnings (deficit) on a tax basis are as follows:
| | | Amount | |
| Undistributed Ordinary Income | | $ | 93,037 | |
| Undistributed Long-Term Capital Gain | | | 157,292 | |
| Unrealized Appreciation* | | | 350,185 | |
| Total Accumulated Earnings | | $ | 600,514 | |
| * | Differences between book-basis and tax-basis unrealized appreciation (depreciation) may be attributable to the losses deferred due to wash sale adjustments, foreign currency gains and losses, adjustments related to PFICs, REITs, RICs, certain derivatives and partnerships. |
| Hartford Small Company HLS Fund |
| Notes to Financial Statements – (continued) |
| June 30, 2014 (Unaudited) |
| (000’s Omitted) |
Reclassification of Capital Accounts – The Fund may record reclassifications in its capital accounts. These reclassifications have no impact on the total net assets of the Fund. The reclassifications are a result of permanent differences between U.S. GAAP and tax accounting for such items as foreign currency, PFICs, expiration or utilization of capital loss carryforwards or net operating losses. Adjustments are made to reflect the impact these items have on current and future distributions to shareholders. Therefore, the source of the Fund’s distributions may be shown in the accompanying Statement of Changes in Net Assets as from undistributed net investment income, from accumulated net realized gains on investments or from capital depending on the type of book and tax differences that exist. For the year ended December 31, 2013, the Fund recorded reclassifications to increase (decrease) the accounts listed below:
| | | Amount | |
| Undistributed Net Investment Income (Loss) | | $ | 3,731 | |
| Accumulated Net Realized Gain (Loss) | | | (3,731 | ) |
Capital Loss Carryforward – On December 22, 2010, the Regulated Investment Company Modernization Act of 2010 (the “Act”) was enacted, which made changes to the capital loss carryforward rules. The changes are effective for taxable years beginning after the date of enactment. Under the Act, funds are permitted to carry forward capital losses for an unlimited period. Additionally, capital loss carryforwards retain their character as either short-term or long-term capital losses rather than being considered all short-term as permitted under prior regulation.
The Fund had no capital loss carryforward for U.S. federal income tax purposes as of December 31, 2013.
Accounting for Uncertainty in Income Taxes – The Fund has adopted financial reporting rules that require the Fund to analyze all open tax years, as defined by the statute of limitations, for all major jurisdictions. Generally, tax authorities can examine all tax returns filed for the last three years. The Fund does not have an examination in progress.
The Fund has reviewed all open tax years and major jurisdictions and concluded that these financial reporting rules had no effect on the Fund’s financial position or results of operations. There is no tax liability resulting from unrecognized tax benefits relating to uncertain income tax positions taken or expected to be taken on the tax return for the fiscal year ended December 31, 2013. The Fund is also not aware of any tax positions for which it is reasonably possible that the total amounts of unrecognized tax benefits will significantly change in the next twelve months.
Expenses:
Investment Management Agreement – Hartford Funds Management Company, LLC ("HFMC") serves as the Fund’s investment manager pursuant to an Investment Management Agreement with the Company. HFMC is an indirect wholly owned subsidiary of The Hartford Financial Services Group, Inc. ("The Hartford"). The investment manager has overall investment supervisory responsibility for the Fund. In addition, the investment manager provides administrative personnel, services, equipment, facilities and office space for proper operation of the Fund. HFMC has contracted with Wellington Management Company, LLP ("Wellington Management") under a sub-advisory agreement for the provision of day-to-day investment management services to the Fund in accordance with the Fund’s investment objective and policies. The Fund pays a fee to the investment manager, a portion of which may be used to compensate Wellington Management.
| Hartford Small Company HLS Fund |
| Notes to Financial Statements – (continued) |
| June 30, 2014 (Unaudited) |
| (000’s Omitted) |
The schedule below reflects the rates of compensation paid to the investment manager for investment management services rendered as of June 30, 2014; the rates are accrued daily and paid monthly:
| Average Daily Net Assets | Annual Fee |
| On first $250 million | 0.7750% |
| On next $250 million | 0.7250% |
| On next $500 million | 0.6750% |
| On next $500 million | 0.6000% |
| On next $3.5 billion | 0.5500% |
| On next $5 billion | 0.5300% |
| Over $10 billion | 0.5200% |
Accounting Services Agreement – Pursuant to the Fund Accounting Agreement between HFMC and the Company, on behalf of the Fund, HFMC provides accounting services to the Fund and receives monthly compensation based on the Fund’s average daily net assets at the rates set forth below. The Fund’s accounting services fees are accrued daily and paid monthly.
| Average Daily Net Assets | Annual Fee |
| On first $5 billion | 0.012% |
| Over $5 billion | 0.010% |
Operating Expenses – Allocable expenses incurred by the Company are allocated to each Fund and allocated to classes within a Fund in proportion to the average daily net assets of the Fund and each class, except where allocation of certain expenses is more fairly made directly to the Fund or to specific classes within a Fund.
Fees Paid Indirectly – The Company, on behalf of the Fund, has entered into agreements with State Street Global Markets, LLC and Russell Implementation Services, Inc. to partially recapture non-discounted trade commissions. Such rebates are used to pay a portion of the Fund's expenses. For the six-month period ended June 30, 2014, this amount, if any, is included in the Statement of Operations.
The ratio of expenses to average net assets in the accompanying financial highlights excludes the reduction in expenses related to fees paid indirectly. The annualized expense ratio after waivers for the period listed below reflecting the reduction for fees paid indirectly is as follows:
| | | Annualized Six-
Month Period Ended
June 30, 2014 | |
| Class IA | | | 0.70% | |
| Class IB | | | 0.95 | |
Distribution Plan for Class IB Shares – Hartford Funds Distributors, LLC (“HFD”), an indirect wholly owned subsidiary of The Hartford, is the principal underwriter and distributor of the Fund. The Company, on behalf of the Fund, has adopted a Distribution Plan pursuant to Rule 12b-1 of the 1940 Act for Class IB shares.
The Distribution Plan provides that the Fund may pay annually up to 0.25% of the average daily net assets of the Fund attributable to its Class IB shares for activities primarily intended to result in the sale of Class IB shares. The Board has the authority to suspend or reduce these payments at any point in time. Under the terms of the Distribution Plan and the principal underwriting agreement, the Fund is authorized to make payments monthly to the distributor that may be used to pay or reimburse entities providing distribution and shareholder servicing with respect to the Class IB shares for such entities’ fees or expenses incurred or paid in that regard. The distribution fee paid during the period can be found on the Statement of Operations. These fees are accrued daily and paid monthly.
| Hartford Small Company HLS Fund |
| Notes to Financial Statements – (continued) |
| June 30, 2014 (Unaudited) |
| (000’s Omitted) |
Other Related Party Transactions – Hartford Administrative Services Company (“HASCO”), an indirect wholly owned subsidiary of The Hartford, provides transfer agent services to the Fund. HASCO was compensated on a per account basis for providing such services. The amount paid to HASCO can be found in the Statement of Operations. These fees are accrued daily and paid monthly.
Payment from Affiliate – In July of 2007, The Hartford entered into a settlement with the Attorneys General of the states of New York, Connecticut and Illinois relating to market timing and the company's individual variable annuity contracts in which certain payments would be made directly to the variable annuity contract holders. The distribution plan provided that unclaimed money from the settlement would be distributed to certain HLS Funds that are investment options through a Hartford individual variable annuity contract. The unclaimed money was distributed to the Fund on September 18, 2009.
The total return in the accompanying financial highlights includes a payment from an affiliate. Had the payment from the affiliate been excluded, the impact and total return for the period listed below would have been as follows:
| | | For the Year Ended December 31, 2009 | |
| | | Class IA | | | Class IB | |
| Impact from Payment from Affiliate for Attorneys General Settlement | | | 0.08% | | | | 0.09% | |
| Total Return Excluding Payment from Affiliate | | | 29.18% | | | | 28.90% | |
Investment Transactions:
For the six-month period ended June 30, 2014, the cost of purchases and proceeds from sales of investment securities (excluding short-term investments) were as follows:
| | | Excluding U.S.
Government
Obligations | | | U.S.
Government
Obligations | | | Total | |
| Cost of Purchases | | $ | 652,422 | | | $ | — | | | $ | 652,422 | |
| Sales Proceeds | | | 742,099 | | | | — | | | | 742,099 | |
Line of Credit:
The Fund is one of several Hartford Funds that participate in a $500 million committed revolving line of credit facility. The facility is to be used for temporary or emergency purposes. Under the arrangement, the funds are required to own securities having a market value in excess of 300% of the total bank borrowings. The interest rate on borrowings varies depending on the nature of the loan. The facility also requires a fee to be paid based on the amount of the commitment. This commitment fee is allocated to all the funds participating in the line of credit based on the average net assets of the funds. During the six-month period ended June 30, 2014, the Fund did not have any borrowings under this facility.
Industry Classifications:
Other than the industry classifications "Other Investment Pools and Funds" and "Exchange Traded Funds," equity industry classifications used in this report are the Global Industry Classification Standard, which was developed by and is the exclusive property and service mark of MSCI, Inc. and Standard & Poor's.
Indemnifications:
Under the Company's organizational documents, the Company shall indemnify its officers and directors to the full extent required or permitted under Maryland General Corporation Law and the federal securities laws. In addition, the Company, on behalf of the Fund, may enter into contracts that contain a variety of indemnifications. The Company's maximum exposure under these arrangements is unknown. However, as of the date of these financial statements, the Company has not had prior claims or losses pursuant to these contracts and expects the risk of loss to be remote.
| Hartford Small Company HLS Fund |
| Notes to Financial Statements – (continued) |
| June 30, 2014 (Unaudited) |
| (000’s Omitted) |
Pending Legal Proceedings:
On February 25, 2011, Jennifer L. Kasilag, Louis Mellinger, Judith M. Menendez, Jacqueline M. Robinson, and Linda A. Russell filed a derivative lawsuit against Hartford Investment Financial Services, LLC (“HIFSCO”) (now known as Hartford Funds Distributors, LLC) on behalf of six Hartford retail mutual funds in the United States District Court for the District of New Jersey, alleging that HIFSCO received excessive advisory and distribution fees in violation of its statutory fiduciary duty under Section 36(b) of the 1940 Act when serving as investment manager and principal underwriter, respectively, to the Hartford retail mutual funds. Although this action was purportedly filed on behalf of certain of the Hartford Funds, none of the Hartford Funds is itself a defendant to the suit. HIFSCO moved to dismiss and, in September 2011, the motion was granted in part and denied in part, with leave to amend the complaint. In November 2011, plaintiffs filed an amended complaint on behalf of certain Hartford retail mutual funds, The Hartford Global Health Fund (now known as The Hartford Healthcare Fund), The Hartford Conservative Allocation Fund, The Hartford Growth Opportunities Fund, The Hartford Inflation Plus Fund, The Hartford Advisers Fund (now known as The Hartford Balanced Fund), and The Hartford Capital Appreciation Fund. Plaintiffs seek to rescind the investment management agreements and distribution plans between HIFSCO and these funds and to recover the total fees charged thereunder or, in the alternative, to recover any improper compensation HIFSCO received, in addition to lost earnings. HIFSCO filed a partial motion to dismiss the amended complaint and, in December 2012, the court dismissed without prejudice the claims regarding distribution fees and denied the motion with respect to the advisory fees claims. HIFSCO disputes the allegations and intends to defend vigorously.
In March 2014, the plaintiffs filed a new complaint that added as new plaintiffs The Hartford Floating Rate Fund and The Hartford Small Company Fund and named as a defendant Hartford Funds Management Company, LLC (the “Investment Manager”), which assumed the role as investment adviser to the funds as of January 2013. The Investment Manager and HIFSCO dispute the allegations and intend to defend vigorously.
This action concerns the activities of HIFSCO in its capacity as investment manager and principal underwriter to the Hartford retail mutual funds and does not concern HIFSCO’s activities in its capacity as principal underwriter to the HLS funds. For this reason, no accrual for litigation relating to this matter has been recorded in the financial statements of the Fund.
| Hartford Small Company HLS Fund |
| Financial Highlights |
| | | ─Selected Per-Share Data(A) ─ | | | ─Ratios and Supplemental Data ─ | |
Class | | Net Asset
Value at
Beginning
of Period | | | Net
Investment
Income
(Loss) | | | Net
Realized
and
Unrealized
Gain (Loss)
on
Investments | | | Total from
Investment
Operations | | | Dividends
from Net
Investment
Income | | | Distributions
from
Realized
Capital
Gains | | | Total
Dividends
and
Distributions | | | Net
Asset
Value at
End of
Period | | | Total
Return(B) | | | Net Assets
at End of
Period
(000s) | | | Ratio of
Expenses
to
Average
Net
Assets
Before
Adjust-
ments(C) | | | Ratio of
Expenses
to
Average
Net
Assets
After
Adjust-
ments(C) | | | Ratio of Net
Investment
Income
(Loss) to
Average
Net Assets | |
| | | | | | | | | | | | | | | | | | | | | | | | | | | | | | | | | | | | | | | | |
| For the Six-Month Period Ended June 30, 2014 (Unaudited) |
| IA | | $ | 26.43 | | | $ | (0.04 | ) | | $ | 1.25 | | | $ | 1.21 | | | $ | – | | | $ | – | | | $ | – | | | $ | 27.64 | | | | 4.58 | %(D) | | $ | 1,332,430 | | | | 0.70 | %(E) | | | 0.70 | %(E) | | | (0.32 | )%(E) |
| IB | | | 25.46 | | | | (0.07 | ) | | | 1.21 | | | | 1.14 | | | | – | | | | – | | | | – | | | | 26.60 | | | | 4.48 | (D) | | | 136,844 | | | | 0.95 | (E) | | | 0.95 | (E) | | | (0.57 | )(E) |
| | | | | | | | | | | | | | | | | | | | | | | | | | | | | | | | | | | | | | | | | | | | | | | | | | | | | |
| For the Year Ended December 31, 2013 |
| IA | | $ | 19.74 | | | $ | (0.07 | ) | | $ | 8.60 | | | $ | 8.53 | | | $ | (0.02 | ) | | $ | (1.82 | ) | | $ | (1.84 | ) | | $ | 26.43 | | | | 44.38 | % | | $ | 1,354,821 | | | | 0.71 | % | | | 0.71 | % | | | (0.29 | )% |
| IB | | | 19.06 | | | | (0.12 | ) | | | 8.34 | | | | 8.22 | | | | – | | | | (1.82 | ) | | | (1.82 | ) | | | 25.46 | | | | 44.28 | | | | 141,791 | | | | 0.96 | | | | 0.96 | | | | (0.54 | ) |
| | | | | | | | | | | | | | | | | | | | | | | | | | | | | | | | | | | | | | | | | | | | | | | | | | | | | |
| For the Year Ended December 31, 2012 (F) |
| IA | | $ | 17.07 | | | $ | 0.03 | | | $ | 2.64 | | | $ | 2.67 | | | $ | – | | | $ | – | | | $ | – | | | $ | 19.74 | | | | 15.64 | % | | $ | 1,126,350 | | | | 0.72 | % | | | 0.72 | % | | | 0.16 | % |
| IB | | | 16.56 | | | | (0.03 | ) | | | 2.53 | | | | 2.50 | | | | – | | | | – | | | | – | | | | 19.06 | | | | 15.10 | | | | 117,133 | | | | 0.97 | | | | 0.97 | | | | (0.13 | ) |
| | | | | | | | | | | | | | | | | | | | | | | | | | | | | | | | | | | | | | | | | | | | | | | | | | | | | |
| For the Year Ended December 31, 2011 (F) |
| IA | | $ | 17.66 | | | $ | (0.02 | ) | | $ | (0.57 | ) | | $ | (0.59 | ) | | $ | – | | | $ | – | | | $ | – | | | $ | 17.07 | | | | (3.36 | )% | | $ | 1,090,883 | | | | 0.71 | % | | | 0.71 | % | | | (0.13 | )% |
| IB | | | 17.18 | | | | (0.09 | ) | | | (0.53 | ) | | | (0.62 | ) | | | – | | | | – | | | | – | | | | 16.56 | | | | (3.62 | ) | | | 155,970 | | | | 0.96 | | | | 0.96 | | | | (0.38 | ) |
| | | | | | | | | | | | | | | | | | | | | | | | | | | | | | | | | | | | | | | | | | | | | | | | | | | | | |
| For the Year Ended December 31, 2010 (F) |
| IA | | $ | 14.23 | | | $ | (0.01 | ) | | $ | 3.44 | | | $ | 3.43 | | | $ | – | | | $ | – | | | $ | – | | | $ | 17.66 | | | | 24.13 | % | | $ | 1,180,045 | | | | 0.73 | % | | | 0.73 | % | | | (0.08 | )% |
| IB | | | 13.88 | | | | (0.06 | ) | | | 3.36 | | | | 3.30 | | | | – | | | | – | | | | – | | | | 17.18 | | | | 23.83 | | | | 212,281 | | | | 0.98 | | | | 0.98 | | | | (0.33 | ) |
| | | | | | | | | | | | | | | | | | | | | | | | | | | | | | | | | | | | | | | | | | | | | | | | | | | | | |
| For the Year Ended December 31, 2009 (F) |
| IA | | $ | 11.01 | | | $ | – | (G) | | $ | 3.22 | | | $ | 3.22 | | | $ | – | | | $ | – | | | $ | – | | | $ | 14.23 | | | | 29.29 | %(H) | | $ | 1,026,150 | | | | 0.75 | % | | | 0.75 | % | | | (0.07 | )% |
| IB | | | 10.76 | | | | (0.03 | )(G) | | | 3.15 | | | | 3.12 | | | | – | | | | – | | | | – | | | | 13.88 | | | | 29.01 | (H) | | | 208,358 | | | | 1.00 | | | | 1.00 | | | | (0.32 | ) |
| (A) | Information presented relates to a share outstanding throughout the indicated period. Net investment income (loss) per share amounts are calculated based on average shares outstanding unless otherwise noted. |
| (B) | The figures do not include sales charges or other fees which may be applied at the variable life insurance, variable annuity or qualified retirement plan product level. Any such additional sales charges or other fees would lower the Fund's performance. |
| (C) | Adjustments include waivers and reimbursements, if applicable. Ratios do not include fees paid indirectly (see Expenses in the accompanying Notes to Financial Statements). |
| (F) | Net investment income (loss) per share amounts have been calculated using the SEC method. |
| (G) | The impact of Payment from Affiliate per share was $0.01. |
| (H) | Total return without the inclusion of the Payment from (to) Affiliate can be found in Expenses in the accompanying Notes to Financial Statements. |
| | | Portfolio Turnover
Rate for
All Share Classes | |
| For the Six-Month Period Ended June 30, 2014 (Unaudited) | | | 45% | |
| For the Year Ended December 31, 2013 | | | 96 | |
| For the Year Ended December 31, 2012 | | | 110 | |
| For the Year Ended December 31, 2011 | | | 99 | |
| For the Year Ended December 31, 2010 | | | 171 | |
| For the Year Ended December 31, 2009 | | | 184 | |
| Hartford Small Company HLS Fund |
| Directors and Officers (Unaudited) |
The Board of Directors of the Company (the "Directors") appoints officers who are responsible for the day-to-day operations of the Fund and who execute policies formulated by the Directors. Each Director serves until his or her death, resignation, or retirement or until the next annual meeting of shareholders is held or until his or her successor is elected and qualifies.
Directors and officers who are employed by or who have a financial interest in The Hartford are considered “interested” persons of the Fund pursuant to the 1940 Act. Each officer and two of the Company's Directors, as noted in the chart below, are “interested” persons of the Fund. Each Director serves as a director for The Hartford Mutual Funds, Inc., The Hartford Mutual Funds II, Inc., Hartford Series Fund, Inc., and Hartford HLS Series Fund II, Inc., and as a trustee for The Hartford Alternative Strategies Fund, which, as of June 30, 2014, collectively consist of 78 funds. Correspondence may be sent to Directors and officers c/o Hartford Funds, 5 Radnor Corporate Center, Suite 300, 100 Matsonford Road, Radnor, Pennsylvania 19087, except that correspondence to Mr. Annoni, Mr. Dressen and Ms. Quade may be sent to 500 Bielenberg Drive, Suite 500, Woodbury, Minnesota 55125.
The table below sets forth, for each Director and officer, his or her name, year of birth, current position with the Company and date first elected or appointed to Hartford Series Fund, Inc. ("HSF") and Hartford HLS Series Fund II, Inc. ("HSF2"), principal occupation, and, for Directors, other directorships held. The Fund’s Statement of Additional Information contains further information on the Directors and is available free of charge by calling 1-888-843-7824 or writing to: Hartford HLS Funds, c/o Hartford Life Insurance Company/Hartford Life and Annuity Insurance Company, P.O. Box 14293, Lexington, KY 40512-4293 for variable annuity and variable life insurance separate accounts of Hartford Life Insurance Company and its affiliates; Hartford Funds, P.O. Box 55022, Boston, MA 02205-5022 for all shareholders except variable annuity and variable life insurance separate accounts of Hartford Life Insurance Company and its affiliates.
Information on the aggregate remuneration paid to the directors of the Company can be found in the Statement of Operations herein. The Fund pays to The Hartford a portion of the Chief Compliance Officer’s compensation, but does not pay salaries or compensation to any of its other officers or Directors who are employed by The Hartford.
Non-Interested Directors
Lynn S. Birdsong (1946) Director since 2003, Co-Chairman of the Investment Committee since 2005
Mr. Birdsong is a private investor. Mr. Birdsong currently serves as a Director of the Sovereign High Yield Investment Company (April 2010 to current). Mr. Birdsong currently serves as an Independent Director of Nomura Partners Funds, Inc. (formerly, The Japan Fund) (April 2003 to current). From 2003 to March 2005, Mr. Birdsong was an Independent Director of the Atlantic Whitehall Funds. From 1979 to 2002, Mr. Birdsong was a Managing Director of Zurich Scudder Investments, an investment management firm. During his employment with Scudder, Mr. Birdsong was an Interested Director of The Japan Fund. From January 1981 through December 2013, Mr. Birdsong was a partner in Birdsong Company, an advertising specialty firm.
Robert M. Gavin, Jr. (1940) Director since 2002 (HSF) and 1986 (HSF2), Chairman of the Board since 2004
Dr. Gavin is an educational consultant. Prior to September 1, 2001, he was President of Cranbrook Education Community and prior to July 1996, he was President of Macalester College, St. Paul, Minnesota.
Duane E. Hill (1945) Director since 2001 (HSF) and 2002 (HSF2), Chairman of the Nominating Committee since 2003
Mr. Hill is a Partner of TSG Ventures L.P., a private equity investment company. Mr. Hill is a former partner of TSG Capital Group, a private equity investment firm that served as sponsor and lead investor in leveraged buyouts of middle market companies.
Sandra S. Jaffee (1941) Director since 2005
Ms. Jaffee is the founder and Chief Executive Officer of a private company, Homeworks Concierge, LLC, which provides residential property management services in Westchester County, New York (January 2012 to present). Ms. Jaffee served as Chairman (2008 to 2009) and Chief Executive Officer of Fortent (formerly Searchspace Group), a leading provider of compliance/regulatory technology to financial institutions from August 2005 to August 2009. From August 2004 to August 2005, Ms. Jaffee served as an Entrepreneur in Residence with Warburg Pincus, a private equity firm. Prior to joining Warburg Pincus, Ms. Jaffee served as Executive Vice President at Citigroup, from September 1995 to July 2004, where she was President and Chief Executive Officer of Citibank’s Global Securities Services (1995 to 2003). Ms. Jaffee currently serves as a member of the Board of Directors of Broadridge Financial Solutions as well as a Trustee of Muhlenberg College.
| Hartford Small Company HLS Fund |
| Directors and Officers (Unaudited) – (continued) |
William P. Johnston (1944) Director since 2005, Chairman of the Compliance Committee since 2005
In June 2006, Mr. Johnston was appointed as Senior Advisor to The Carlyle Group, a global private equity and other alternative asset investment firm and currently serves as an Operating Executive. In July 2006, Mr. Johnston was elected to the Board of Directors of MultiPlan, Inc. and served as a Director (July 2006 to August 2010). In August 2007, Mr. Johnston was elected to the Board of Directors of LifeCare Holdings, Inc. and served as a Director (August 2007 to June 2013). In February 2008, Mr. Johnston was elected to the Board of Directors of HCR-ManorCare, Inc. In May 2006, Mr. Johnston was elected to the Supervisory Board of Fresenius Medical Care AG & Co. KGaA, after its acquisition of Renal Care Group, Inc. in March 2006. Mr. Johnston joined Renal Care Group in November 2002 as a member of the Board of Directors and served as Chairman of the Board from March 2003 through March 2006. From 2002 through 2013, Mr. Johnston served as a Board member of the Georgia O’Keefe Museum. From September 1987 to December 2002, Mr. Johnston was with Equitable Securities Corporation (and its successors, SunTrust Equitable Securities and SunTrust Robinson Humphrey) serving in various investment banking and managerial positions, including Managing Director and Head of Investment Banking, Chief Executive Officer and Vice Chairman.
Phillip O. Peterson (1944) Director since 2002 (HSF) and 2000 (HSF2), Chairman of the Audit Committee since 2002
Mr. Peterson is a mutual fund industry consultant. He was a partner of KPMG LLP (an accounting firm) until July 1999. Mr. Peterson joined William Blair Funds in February 2007 as a member of the Board of Trustees. From February 2012 to February 2014, Mr. Peterson served as a Trustee of Symetra Variable Mutual Funds. From January 2004 to April 2005, Mr. Peterson served as Independent President of the Strong Mutual Funds.
Lemma W. Senbet (1946) Director since 2005
Dr. Senbet is the William E. Mayer Chair Professor of Finance and Founding Director, Center for Financial Policy, at the University of Maryland, Robert H. Smith School of Business. He was chair of the Finance Department of the University of Maryland, Robert H. Smith School of Business from 1998 to 2006. Since June 2013, he has been on leave from the University to serve as Executive Director of African Economic Research Consortium which focuses on economic policy research and training. Previously, he was a chaired professor of finance at the University of Wisconsin-Madison. Also, he was a Director of the Fortis Funds from March 2000 to July 2002. Dr. Senbet served as Director of the American Finance Association and President of the Western Finance Association. In 2006, Dr. Senbet was inducted Fellow of Financial Management Association International for his career-long distinguished scholarship and professional service.
Interested Directors and Officers
James E. Davey (1964) Director since 2012, President and Chief Executive Officer since 2010
Mr. Davey serves as Executive Vice President of Hartford Life Insurance Company (“HLIC”) and The Hartford Financial Services Group, Inc. Additionally, Mr. Davey serves as Chairman of the Board, Manager and Senior Managing Director of Hartford Funds Distributors, LLC (“HFD”). He also currently serves as Director, Chairman of the Board, President and Senior Managing Director of Hartford Administrative Services Company (“HASCO”). Mr. Davey also serves as Manager, Chairman of the Board and Senior Managing Director for Hartford Funds Management Company, LLC (“HFMC”) and Director, Chairman of the Board and Senior Managing Director for Hartford Funds Management Group, Inc. ("HFMG"). Mr. Davey has served in various positions within The Hartford and its subsidiaries in connection with the operation of the Hartford Funds. Mr. Davey joined The Hartford in 2002.
Lowndes A. Smith (1939) Director since 1996 (HSF) and 2002 (HSF2), Co-Chairman of the Investment Committee since 2005
Mr. Smith served as Vice Chairman of The Hartford from February 1997 to January 2002, as President and Chief Executive Officer of Hartford Life, Inc. from February 1997 to January 2002, and as President and Chief Operating Officer of The Hartford Life Insurance Companies from January 1989 to January 2002. Mr. Smith serves as a Director of White Mountains Insurance Group Ltd. (October 2003 to current); One Beacon Insurance (October 2006 to current); Symetra Financial (August 2007 to current) and is a Managing Director of Whittington Gray Associates (January 2007 to current).
Other Officers
Mark A. Annoni (1964) Vice President, Controller and Treasurer since 2012
Mr. Annoni currently serves as the Assistant Vice President of HLIC (February 2004 to present) and Senior Vice President of HFMG (December 2013 to present). Mr. Annoni has served in various positions within The Hartford and its subsidiaries in connection with the operation of the Hartford Funds. Mr. Annoni joined The Hartford in 2001.
| Hartford Small Company HLS Fund |
| Directors and Officers (Unaudited) – (continued) |
Michael R. Dressen (1963) AML Compliance Officer since 2011
Mr. Dressen currently serves as Assistant Vice President of HLIC. He also serves as Chief Compliance Officer and AML Compliance Officer of HASCO and as AML Officer of HFD. Mr. Dressen has served in various positions within The Hartford and its subsidiaries in connection with the operation of the Hartford Funds.
Edward P. Macdonald (1967) Vice President, Secretary and Chief Legal Officer since 2005
Mr. Macdonald currently serves as Assistant Secretary, Executive Vice President and Deputy General Counsel of HFD, HASCO, HFMC and HFMG. He also serves as Vice President of HLIC. Mr. Macdonald has served in various positions within The Hartford and its subsidiaries in connection with the operation of the Hartford Funds. Mr. Macdonald joined The Hartford in 2005.
Joseph G. Melcher (1973) Vice President and Chief Compliance Officer since 2013
Mr. Melcher currently serves as Executive Vice President of HFD, HFMG and HASCO. Mr. Melcher also currently serves as Executive Vice President and Chief Compliance Officer of HFMC. Mr. Melcher has served in various positions within The Hartford and its subsidiaries in connection with the operation of the Hartford Funds since joining The Hartford in 2012. Prior to joining The Hartford, Mr. Melcher worked at Touchstone Investments, a member of the Western & Southern Financial Group, where he held the position of Vice President and Chief Compliance Officer from 2010 through 2012 and Assistant Vice President, Compliance from 2005 to 2010.
Vernon J. Meyer (1964) Vice President since 2006
Mr. Meyer currently serves as Senior Vice President of HLIC. He also currently serves as Managing Director and Chief Investment Officer of HFMC and Managing Director of HFMG. Mr. Meyer has served in various positions within The Hartford and its subsidiaries in connection with the operation of the Hartford Funds. Mr. Meyer joined The Hartford in 2004.
Laura S. Quade (1969) Vice President since 2012
Ms. Quade currently serves as Vice President of HASCO, HFD and HFMG. She is the Head of Operations of HASCO and also serves as Director, Enterprise Operations of HLIC. Ms. Quade has served in various positions within The Hartford and its subsidiaries in connection with the operation of the Hartford Funds.
Martin A. Swanson (1962) Vice President since 2010
Mr. Swanson currently serves as Vice President of HLIC. Mr. Swanson also serves as Managing Director, Chief Marketing Officer and Principal of HFD and Managing Director of HFMG. Mr. Swanson has served in various positions within The Hartford and its subsidiaries in connection with the operation of the Hartford Funds.
HOW TO OBTAIN A COPY OF THE FUND’S PROXY VOTING POLICIES AND VOTING RECORDS (UNAUDITED)
A description of the policies and procedures that the Fund uses to determine how to vote proxies relating to portfolio securities and information about how the Fund voted proxies relating to portfolio securities during the most recent twelve-month period ended June 30 are available (1) without charge, upon request, by calling 888-843-7824 and (2) on the SEC’s website at http://www.sec.gov.
QUARTERLY PORTFOLIO HOLDINGS INFORMATION (UNAUDITED)
The Fund files a complete schedule of portfolio holdings with the SEC for the first and third quarters of each fiscal year on Form N-Q. The Fund’s Forms N-Q are available (1) without charge, upon request, by calling 888-843-7824 and (2) on the SEC’s website at http://www.sec.gov. The Form N-Q may be reviewed and copied at the SEC’s Public Reference Room in Washington, DC. Information on the operation of the Public Reference Room may be obtained by calling 1-800-SEC-0330.
| Hartford Small Company HLS Fund |
| Expense Example (Unaudited) |
Your Fund's Expenses
As a shareholder of the Fund, you incur two types of costs: (1) transaction costs and (2) ongoing costs, including investment management fees, distribution and/or service (12b-1) fees, if any, and other fund expenses. This example is intended to help you understand your ongoing costs (in dollars) of investing in the Fund and to compare these costs with the ongoing costs of investing in other mutual funds. The example is based on an investment of $1,000 invested at the beginning of the period and held for the entire period of December 31, 2013 through June 30, 2014.
Actual Expenses
The first set of columns of the table below provides information about actual account values and actual expenses. You may use the information in this column, together with the amount you invested, to estimate the expenses that you paid over the period. Simply divide your account value by $1,000 (for example, an $8,600 account value divided by $1,000 = 8.6), then multiply the result by the number in the line under the heading entitled “Expenses Paid During Period” to estimate the expenses you paid on your account during this period.
Hypothetical Example for Comparison Purposes
The second set of columns of the table below provides information about hypothetical account values and hypothetical expenses based on the Fund's actual expense ratio and an assumed rate of return of 5% per year before expenses, which is not the Fund's actual return. The hypothetical account values and expenses may not be used to estimate the actual ending account balance or expenses you paid for the period. You may use this information to compare the ongoing costs of investing in the Fund and other funds. To do so, compare this 5% hypothetical example with the 5% hypothetical examples that appear in the shareholder reports of the other funds.
Please note that the expenses shown in the table are meant to highlight your ongoing costs only and do not reflect any transactional costs, such as sales charges (loads) and CDSC. Therefore, the second set of columns of the table is useful in comparing ongoing costs only, and will not help you determine the relative total costs of owning different funds. In addition, if these transactional costs were included, your costs would be higher. Expenses are equal to the Fund's annualized expense ratios multiplied by average account value over the period, multiplied by 181/365 (to reflect the one-half year period).
| | | Actual return | | | Hypothetical (5% return before expenses) | | | | | | | | |
| | | Beginning
Account Value
December 31,
2013 | | | Ending Account
Value
June 30, 2014 | | | Expenses paid
during the period
December 31, 2013
through
June 30, 2014 | | | Beginning
Account Value
December 31,
2013 | | | Ending Account
Value
June 30, 2014 | | | Expenses paid
during the period
December 31,
2013
through
June 30, 2014 | | | Annualized
expense
ratio | | | Days
in the
current
1/2
year | | Days
in the
full
year |
| Class IA | | $ | 1,000.00 | | | $ | 1,045.80 | | | $ | 3.55 | | | $ | 1,000.00 | | | $ | 1,021.32 | | | $ | 3.51 | | | | 0.70 | % | | 181 | | 365 |
| Class IB | | $ | 1,000.00 | | | $ | 1,044.80 | | | $ | 4.82 | | | $ | 1,000.00 | | | $ | 1,020.08 | | | $ | 4.76 | | | | 0.95 | | | 181 | | 365 |
| Hartford Small Company HLS Fund |
| Main Risks (Unaudited) |
The main risks of investing in the Fund are described below.
Market, Selection and Strategy Risk: The Fund’s share price may fluctuate due to market risk and/or security selections that may underperform the market or relevant benchmarks. If the sub-adviser's investment strategy does not perform as expected, the Fund could underperform its peers or lose money. There is no guarantee the Fund will achieve its stated objective.
Small-cap Stock Risk: Small-cap stocks are generally more volatile and risky and may be less liquid than large-cap stocks because they may have limited operating histories, narrow product lines, and focus on niche markets.
Foreign Investment Risk: Investments in foreign securities may be riskier than investments in U.S. securities. Potential risks include the risks of illiquidity, increased price volatility, less government regulation, less extensive and less frequent accounting and other reporting requirements, unfavorable changes in currency exchange rates, and economic and political disruptions.
Active Trading Risk: Actively trading investments may result in higher costs (thus affecting performance).
THIS PRIVACY POLICY IS NOT PART OF THIS REPORT
Privacy Policy and Practices of The Hartford Financial Services Group, Inc. and its Affiliates
(herein called “we, our and us”)
This Privacy Policy applies to our United States Operations
We value your trust. We are committed to the responsible: a) management; b) use; and c) protection; of Personal Information. This notice describes how we collect, disclose, and protect Personal Information. We collect Personal Information to: a) service your Transactions with us; and b) support our business functions. We may obtain Personal Information from: a) You; b) your Transactions with us; and c) third parties such as a consumer-reporting agency. Based on the type of product or service You apply for or get from us, Personal Information such as: a) your name; b) your address; c) your income; d) your payment; or e) your credit history; may be gathered from sources such as applications, Transactions, and consumer reports. To serve You and service our business, we may share certain Personal Information. We will share Personal Information, only as allowed by law, with affiliates such as: a) our insurance companies; b) our employee agents; c) our brokerage firms; and d) our administrators. As allowed by law, we may share Personal Financial Information with our affiliates to: a) market our products; or b) market our services; to You without providing You with an option to prevent these disclosures. | | | We may also share Personal Information, only as allowed by law, with unaffiliated third parties including: a) independent agents; b) brokerage firms; c) insurance companies; d) administrators; and e) service providers; who help us serve You and service our business. When allowed by law, we may share certain Personal Financial Information with other unaffiliated third parties who assist us by performing services or functions such as: a) taking surveys; b) marketing our products or services; or c) offering financial products or services under a joint agreement between us and one or more financial institutions. We, and third parties we partner with, may track some of the pages You visit through the use of: a) cookies; b) pixel tagging; or c) other technologies; and currently do not process or comply with any web browser’s “do not track” signal or similar mechanism that indicates a request to disable online tracking of individual users who visit our websites or use our services. We will not sell or share your Personal Financial Information with anyone for purposes unrelated to our business functions without offering You the opportunity to: a) “opt-out;” or b) “opt-in;” as required by law. We only disclose Personal Health Information with: a) your proper written authorization; or b) as otherwise allowed or required by law. Our employees have access to Personal Information in the course of doing their jobs, such as: a) underwriting policies; b) paying claims; c) developing new products; or d) advising customers of our products and services. |
We use manual and electronic security procedures to maintain: a) the confidentiality; and b) the integrity of; Personal Information that we have. We use these procedures to guard against unauthorized access. Some techniques we use to protect Personal Information include: a) secured files; b) user authentication; c) encryption; d) firewall technology; and e) the use of detection software. We are responsible for and must: a) identify information to be protected; b) provide an adequate level of protection for that data; c) grant access to protected data only to those people who must use it in the performance of their job-related duties. Employees who violate our Privacy Policy will be subject to discipline, which may include ending their employment with us. At the start of our business relationship, we will give You a copy of our current Privacy Policy. We will also give You a copy of our current Privacy Policy once a year if You maintain a continuing business relationship with us. We will continue to follow our Privacy Policy regarding Personal Information even when a business relationship no longer exists between us. | | | As used in this Privacy Notice: Application means your request for our product or service. Personal Financial Information means financial information such as: a) credit history; b) income; c) financial benefits; or d) policy or claim information. Personal Health Information means health information such as: a) your medical records; or b) information about your illness, disability or injury. Personal Information means information that identifies You personally and is not otherwise available to the public. It includes: a) Personal Financial Information; and b) Personal Health Information. Transaction means your business dealings with us, such as: a) your Application; b) your request for us to pay a claim; and c) your request for us to take an action on your account. You means an individual who has given us Personal Information in conjunction with: a) asking about; b) applying for; or c) obtaining; a financial product or service from us if the product or service is used mainly for personal, family, or household purposes. |
This Privacy Policy is being provided on behalf of the following affiliates of The Hartford Financial Services Group, Inc.:
1stAGChoice, Inc.; Access CoverageCorp, Inc.; Access CoverageCorp Technologies, Inc.; American Maturity Life Insurance Company; Archway 60 R, LLC; Business Management Group, Inc.; Champlain Life Reinsurance Company; DMS R, LLC; Eloy R, LLC; Ersatz Corporation; First State Insurance Company; Hartford Accident and Indemnity Company; Hartford Administrative Services Company; Hartford Casualty General Agency, Inc.; Hartford Casualty Insurance Company; Hartford-Comprehensive Employee Benefit Service Company; Hartford Equity Sales Company, Inc.; Hartford Fire General Agency, Inc.; Hartford Fire Insurance Company; Hartford Funds Management Company, LLC; Hartford Funds Management Group, Inc.; Hartford HLS Series Fund II, Inc.; Hartford Insurance Company of Illinois; Hartford Insurance Company of the Midwest; Hartford Insurance Company of the Southeast; Hartford Integrated Technologies, Inc.; Hartford International Life Reassurance Corporation; Hartford Funds Distributors, LLC; Hartford Investment Management Company; Hartford Life and Accident Insurance Company; Hartford Life and Annuity Insurance Company; Hartford Life Insurance Company; Hartford Life Private Placement, LLC; Hartford Lloyd’s Corporation; Hartford Lloyd’s Insurance Company; Hartford Mezzanine Investors I, LLC; Hartford Residual Market, L.C.C.; Hartford Retirement Services, LLC; Hartford Securities Distribution Company, Inc.; Hartford Series Fund, Inc.; Hartford Specialty Insurance Services of Texas, LLC; Hartford Strategic Investments, LLC; Hartford Underwriters Insurance Company; Hartford Technology Services Company, L.L.C.; Hartford of Texas General Agency, Inc.; Hartford Underwriters General Agency, Inc.; HARTRE Company, L.C.C.; HL Investment Advisors, LLC; HLA LLC; Horizon Management Group, LLC; HRA Brokerage Services, Inc.; Lanidex Class B, LLC; M-CAP Insurance Agency, LLC; New England Insurance Company; New England Reinsurance Corporation; Nutmeg Insurance Agency, Inc.; Nutmeg Insurance Company; Pacific Insurance Company, Limited; Planco, LLC: Property and Casualty Insurance Company of Hartford; Revere R, LLC; RVR R, LLC; Sentinel Insurance Company, Ltd.; Sunstone R, LLC; Symphony R, LLC; The Evergreen Group Incorporated; The Hartford Alternative Strategies Fund; The Hartford Mutual Funds, Inc.; The Hartford Mutual Funds II, Inc.; Trumbull Flood Management, L.L.C.; Trumbull Insurance Company; Twin City Fire Insurance Company; White River Life Reinsurance Company.
HPP Revised January 2014
HARTFORD HLS FUNDS
P.O. Box 14293
Lexington, KY 40512-4293
HARTFORDFUNDS
hartfordfunds.com
Hartford Series Fund, Inc. is underwritten and distributed by Hartford Funds Distributors, LLC.
Hartford Series Fund, Inc. inception dates range from 1977 to date. Hartford Series Fund, Inc. is not a subsidiary of The Hartford Financial Services Group, Inc. ("The Hartford") but is underwritten, distributed by and advised by subsidiaries of The Hartford. Investments in Hartford Series Fund, Inc. are not guaranteed by The Hartford or any other entity.
This report is submitted for the general information of the shareholders of the Funds. It is not authorized for distribution unless preceded or accompanied by a current prospectus for the Funds.
Investors should carefully consider the investment objectives, risks, charges, and expenses of Hartford Funds before investing. This and other information can be found in the prospectus, which can be obtained by calling 800-862-6668 (or 800-279-1541 for institutional investors). Investors should read them carefully before they invest.
HLSSAR-SC14 8-14 113551-3 Printed in U.S.A.
HARTFORDFUNDS
| | HARTFORD STOCK HLS FUND 2014 Semi Annual Report |
A MESSAGE FROM THE PRESIDENT
Dear Fellow Shareholders:
Thank you for investing in Hartford HLS Funds.
Market Review
U.S. equities (as represented by the S&P 500 Index) started 2014 on a shaky note after posting a strong 32.39% gain in 2013. However, stocks managed to maintain modest gains throughout the first quarter and returned to a generally steady climb in the second quarter. Through June 30, 2014, the S&P 500 Index advanced 7.14%. It appears that much of the market volatility during the year can be attributed to heightened international tensions. In particular, the Russian annexation of Ukraine’s Crimean Peninsula and increased tensions in Iraq were cause for concern.
On the domestic front, subdued economic and employment reports slowed stocks’ progress early in the new year, although much of the weakness seemed to dissipate as the year’s unusually harsh winter subsided. And despite initial reactions to the idea, when the U.S. Federal Reserve began tapering its quantitative-easing program in January by reducing its bond purchases by $10 billion a month, the markets took the policy change in stride.
Despite a rough start to the year for financial markets, the global economy seems to be settling into a slow-but-steady recovery. While first-quarter U.S. gross domestic product (GDP) growth was disappointing at -2.9%, U.S. consumer spending, which is a significant contributor toward economic growth, rose by 3% during the quarter. It appears that Europe is also maintaining its own recovery: The International Monetary Fund projects that Europe’s full-year GDP growth may breach positive territory for the first time since 2011.
The impact of international affairs on stocks so far this year is an important reminder to stay informed about both domestic and international economic developments, and any effects they may have on your individual investment goals. If you have not already had a mid-year review of your portfolio, it may be a good time to meet with your financial advisor to review your progress and make certain your investments are prepared for all market environments:
| • | Is your portfolio properly diversified with an appropriate mix of stocks and bonds? |
| • | Is your portfolio positioned to take advantage of the global economic recovery, with investments in both domestic and international holdings? |
| • | Are your investments still in line with your risk tolerance and investment time horizon? |
Your financial professional can help you choose options within our fund family to help you reach your investment goals with confidence.
Thank you again for investing with Hartford HLS Funds.
James Davey
President
Hartford HLS Funds
1 The S&P 500 Index is a market capitalization-weighted price index composed of 500 widely held common stocks.
2The Dow Jones Industrial Average is an unmanaged, price-weighted index of 30 of the largest, most widely held stocks traded on the New York Stock Exchange.
Hartford Stock HLS Fund
Table of Contents
This report is prepared for the general information of contract owners and qualified retirement plan participants. It is not an offer of contracts or of qualified retirement plans. It should not be used in connection with any offer, except in conjunction with the appropriate product prospectus which contains all pertinent information including the applicable sales, administrative and other charges.
The views expressed in the Fund’s Manager Discussion under “Why did the Fund perform this way?” and “What is the outlook?” are views of the Fund’s sub-adviser and portfolio management team through the end of the period and are subject to change based on market and other conditions. The Fund’s Manager Discussion is for informational purposes only and does not represent an offer, recommendation or solicitation to buy, hold or sell any security. The specific securities identified and described, if any, do not represent all of the securities purchased or sold and you should not assume that investments in the securities identified and discussed will be profitable.
Hartford Stock HLS Fund inception 08/31/1977
(sub-advised by Wellington Management Company, LLP)
Investment objective – The Fund seeks long-term growth of capital.
Performance Overview 6/30/04 - 6/30/14

The chart above represents the hypothetical growth of a $10,000 investment in Class IA. Growth results in classes other than Class IA will vary from what is seen above due to differences in the expenses charged to those share classes.
Average Annual Total Returns (as of 6/30/14) (1) (2)
| | | 6 Month† | | 1 Year | | 5 Years | | 10 Years |
| Stock IA | | | 4.01% | | | | 18.84% | | | | 17.67% | | | | 6.96% | |
| Stock IB | | | 3.88% | | | | 18.54% | | | | 17.37% | | | | 6.70% | |
| Russell 1000 Index | | | 7.27% | | | | 25.35% | | | | 19.25% | | | | 8.19% | |
PERFORMANCE DATA QUOTED REPRESENTS PAST PERFORMANCE AND DOES NOT GUARANTEE FUTURE RESULTS. The investment return and principal value of the investment will fluctuate so that investors’ shares, when redeemed, may be worth more or less than their original cost. Current performance may be lower or higher than the performance data quoted. To obtain performance data current to the most recent month-end, please visit our website www.hartfordfunds.com.
Total returns presented above were calculated using the Fund’s net asset value available to shareholders for sale or redemption of Fund shares on June 30, 2014, which may exclude investment transactions as of this date. All share class returns assume the reinvestment of all distributions at net asset value and the deduction of all fund expenses.
Russell 1000 Index is an unmanaged index that measures the performance of the 1,000 largest companies in the Russell 3000 Index, which measures the performance of the 3,000 largest U.S. companies, based on total market capitalizations.
The index is unmanaged, and its results include reinvested dividends and/or distributions, but do not reflect the effect of sales charges, commissions, expenses or taxes.
You cannot invest directly in an index.
As shown in the Fund's current prospectus dated May 1, 2014, the total annual operating expense ratios for Class IA and Class IB were 0.51% and 0.76%, respectively. Actual expenses may be higher. Please see the accompanying Financial Highlights for expense ratios for the six-month period ended June 30, 2014.
The chart and table do not reflect the deductions of taxes, sales charges or other fees which may be applied at the variable life insurance, variable annuity or qualified retirement plan product level. Any such additional sales charges or other fees or expenses would lower the contract’s or plan’s performance.
All investments are subject to risk including the possible loss of principal. For a discussion of the Fund’s risks, please see the Main Risks section of this report. For more detailed information on the risks associated with an investment in the Fund, please see the prospectus.
Hartford Stock HLS Fund
Manager Discussion
June 30, 2014 (Unaudited)
| Portfolio Manager | |
| Donald J. Kilbride | |
| Senior Vice President and Equity Portfolio Manager | |
How did the Fund perform?
The Class IA shares of the Hartford Stock HLS Fund returned 4.01% for the six-month period ended June 30, 2014, underperforming the Russell 1000 Index, which returned 7.27% for the same period. The Fund also underperformed the 6.54% average return of the Lipper Large-Cap Core Funds peer group, a group of funds with investment strategies similar to those of the Fund.
Why did the Fund perform this way?
U.S. equities surged during the period, ending June near an all-time high. After finishing 2013 with their best year since 1997, U.S. stocks began 2014 with their worst month in nearly two years. Worries about a slowdown in China and general concern surrounding emerging markets overshadowed a fairly benign domestic environment. However, robust merger and acquisition activity and an uncontested increase in the debt ceiling from Congress helped stoke investors' risk appetites in February. Earnings season in April provided a varied yet encouraging picture, with companies generally reporting healthy earnings but more subdued revenues. The rally continued in May amid renewed signs of life in the housing market and the best payroll gains in more than two years. In June, strong manufacturing activity, coupled with continued positive momentum in housing and employment data, helped to offset a large negative revision to first quarter economic growth.
Overall equity market performance was positive for the period across all market capitalizations: mid cap (+8%), large cap (+7%), and small cap equities (+3%) all rose, as represented by the S&P 400 MidCap, Russell 1000, and Russell 2000 Indices, respectively. During the six-month period all ten sectors rose within the Russell 1000 Index, led by Utilities (+18%), Energy (+14%), and Healthcare (+11%). Consumer Discretionary (+1%) and Industrials (+4%) lagged on a relative basis.
The Fund’s underperformance versus the Russell 1000 Index was primarily driven by weak security selection within Consumer Discretionary, Energy, and Consumer Staples, which more than offset stronger selection within Industrials and Financials. Sector allocation, a residual of the bottom-up stock selection process, also detracted from relative returns due primarily to overweight allocations to the Consumer Discretionary and Industrials sectors and an underweight allocation to the Utilities sector. A modest cash position also detracted from performance in an upward trending market environment.
Stocks that detracted the most from both absolute and Russell 100 Index-relative returns during the period were Allstar CoInvest (Consumer Discretionary), TJX Companies (Consumer Discretionary), and Mattel (Consumer Discretionary). Shares of Allstar CoInvest, a sporting goods retailer, lagged as retail conditions were tough in the first quarter given the harsh winter weather. Shares of TJX Companies, an off-price apparel retailer, fell during the period after the company posted disappointing first quarter earnings, in part due to colder-than-average winter temperatures that had a material impact on sales and store traffic. Shares of Mattel, a worldwide leader in the design, manufacture, and marketing of toys and family products, underperformed during the period after the company reported fourth quarter earnings that were well below consensus expectations, leading to a decline in the stock price.
Top contributors to relative performance during the period included General Dynamics (Industrials), Amazon.com (Consumer Discretionary), and General Electric (Industrials). Shares of General Dynamics, a U.S.-based aerospace and defense contractor, rose during the period as the company has continued to deliver consistent operating results despite recent fears from investors that government military funding would crimp revenue growth. Shares of Amazon.com, a U.S.-based, global e-commerce retailer, underperformed during the period as investors became concerned with slightly slowing revenue growth and the impact of a price increase for its Amazon Prime service. Not owning this weak performing constituent of the Russell 1000 Index contributed positively to relative returns during the period. Shares of General Electric (GE), a U.S.-based capital goods producer, fell during the period after the company posted lackluster fourth quarter earnings. Weak results in the Industrial division, decelerating orders, and soft order pricing weighed on results. Not owning this weak performing Russell 1000 Index constituent contributed positively to relative returns. Merck (Healthcare) also contributed positively to performance on an absolute basis.
Derivatives are not used in a significant manner in this Fund and did not have a material impact on performance during the period.
What is the outlook?
We generally seek to identify companies that we believe will steadily and reliably grow their dividend payments. We strive to carefully build the portfolio one stock at a time, giving central consideration to each company’s dividend growth prospects. Our industry and sector weightings are an output of this process.
Caution continues to be the backdrop for portfolio positioning. We believe that the balance sheets of the major central banks across the
Hartford Stock HLS Fund
Manager Discussion – (continued)
June 30, 2014 (Unaudited)
globe remain bloated. As we have said before, we are concerned that the buoyant effect that central bank liquidity has had on global markets will not be replaced by meaningfully better economic and business conditions in the near-term; and market valuation, therefore, seems disconnected from fundamentals. We are also concerned about the “tightness” in spreads and what that implies for the current price of risk. Said another way, we believe that the extremely low level of volatility and what appears to be a relatively high level of complacency in the face of mediocre global conditions are notable.
At the end of the period, our bottom-up investment approach resulted in overweight exposures in Healthcare, Industrials, and Consumer Staples as we continued to find what we consider to be attractive investment opportunities in these sectors. The Fund’s largest underweights relative to the Russell 1000 Index were in Information Technology, Financials, and Telecommunication Services.
Diversification by Sector
as of June 30, 2014
| Sector | | Percentage of
Net Assets | |
| Equity Securities | | | | |
| Consumer Discretionary | | | 14.0 | % |
| Consumer Staples | | | 13.3 | |
| Energy | | | 10.6 | |
| Financials | | | 11.1 | |
| Health Care | | | 18.4 | |
| Industrials | | | 15.9 | |
| Information Technology | | | 10.1 | |
| Materials | | | 4.3 | |
| Utilities | | | 1.0 | |
| Total | | | 98.7 | % |
| Short-Term Investments | | | 1.2 | |
| Other Assets and Liabilities | | | 0.1 | |
| Total | | | 100.0 | % |
A sector may be comprised of several industries. For Fund compliance purposes, the Fund may not use the same classification system and these sector classifications are used for reporting ease.
Hartford Stock HLS Fund
Schedule of Investments
June 30, 2014 (Unaudited)
(000’s Omitted)
| Shares or Principal Amount | | Market Value ╪ | |
| Common Stocks - 98.7% | |
| | | | | Banks - 3.0% | | | | |
| | 300 | | | PNC Financial Services Group, Inc. | | $ | 26,750 | |
| | 516 | | | Wells Fargo & Co. | | | 27,122 | |
| | | | | | | | 53,872 | |
| | | | | Capital Goods - 10.8% | | | | |
| | 318 | | | Emerson Electric Co. | | | 21,088 | |
| | 186 | | | General Dynamics Corp. | | | 21,634 | |
| | 349 | | | Honeywell International, Inc. | | | 32,407 | |
| | 295 | | | Lockheed Martin Corp. | | | 47,402 | |
| | 260 | | | Northrop Grumman Corp. | | | 31,083 | |
| | 334 | | | United Technologies Corp. | | | 38,608 | |
| | | | | | | | 192,222 | |
| | | | | Consumer Durables and Apparel - 4.1% | | | | |
| | 821 | | | Mattel, Inc. | | | 31,986 | |
| | 523 | | | NIKE, Inc. Class B | | | 40,592 | |
| | | | | | | | 72,578 | |
| | | | | Consumer Services - 2.2% | | | | |
| | 390 | | | McDonald's Corp. | | | 39,286 | |
| | | | | | | | | |
| | | | | Diversified Financials - 1.8% | | | | |
| | 101 | | | BlackRock, Inc. | | | 32,332 | |
| | | | | | | | | |
| | | | | Energy - 10.6% | | | | |
| | 2,315 | | | BG Group plc | | | 48,848 | |
| | 343 | | | Chevron Corp. | | | 44,800 | |
| | 647 | | | Enbridge, Inc. | | | 30,693 | |
| | 343 | | | Exxon Mobil Corp. | | | 34,535 | |
| | 254 | | | Schlumberger Ltd. | | | 29,943 | |
| | | | | | | | 188,819 | |
| | | | | Food and Staples Retailing - 4.4% | | | | |
| | 396 | | | CVS Caremark Corp. | | | 29,831 | |
| | 630 | | | Wal-Mart Stores, Inc. | | | 47,299 | |
| | | | | | | | 77,130 | |
| | | | | Food, Beverage and Tobacco - 5.4% | | | | |
| | 290 | | | Anheuser-Busch InBev N.V. | | | 33,365 | |
| | 752 | | | Coca-Cola Co. | | | 31,871 | |
| | 958 | | | Diageo Capital plc | | | 30,508 | |
| | | | | | | | 95,744 | |
| | | | | Health Care Equipment and Services - 7.8% | | | | |
| | 610 | | | Cardinal Health, Inc. | | | 41,834 | |
| | 711 | | | Medtronic, Inc. | | | 45,357 | |
| | 618 | | | UnitedHealth Group, Inc. | | | 50,545 | |
| | | | | | | | 137,736 | |
| | | | | Household and Personal Products - 3.5% | | | | |
| | 400 | | | Colgate-Palmolive Co. | | | 27,290 | |
| | 440 | | | Procter & Gamble Co. | | | 34,600 | |
| | | | | | | | 61,890 | |
| | | | | Insurance - 5.1% | | | | |
| | 347 | | | ACE Ltd. | | | 35,979 | |
| | 292 | | | Chubb Corp. | | | 26,958 | |
| | 521 | | | Marsh & McLennan Cos., Inc. | | | 27,003 | |
| | | | | | | | 89,940 | |
| | | | | Materials - 4.3% | | | | |
| | 286 | | | Ecolab, Inc. | | | 31,850 | |
| | 336 | | | Praxair, Inc. | | | 44,642 | |
| | | | | | | | 76,492 | |
| | | | | Media - 2.4% | | | | |
| | 253 | | | Omnicom Group, Inc. | | | 18,027 | |
| | 293 | | | Walt Disney Co. | | | 25,151 | |
| | | | | | | | 43,178 | |
| | | | | Pharmaceuticals, Biotechnology and Life Sciences - 10.6% | | | | |
| | 267 | | | Amgen, Inc. | | | 31,557 | |
| | 429 | | | Johnson & Johnson | | | 44,866 | |
| | 768 | | | Merck & Co., Inc. | | | 44,442 | |
| | 870 | | | Pfizer, Inc. | | | 25,831 | |
| | 142 | | | Roche Holding AG | | | 42,168 | |
| | | | | | | | 188,864 | |
| | | | | Real Estate - 1.2% | | | | |
| | 127 | | | Public Storage REIT | | | 21,834 | |
| | | | | | | | | |
| | | | | Retailing - 5.3% | | | | |
| | 9,440 | | | Allstar Co. ⌂●† | | | 10,204 | |
| | 775 | | | Lowe's Cos., Inc. | | | 37,173 | |
| | 883 | | | TJX Cos., Inc. | | | 46,920 | |
| | | | | | | | 94,297 | |
| | | | | Software and Services - 10.1% | | | | |
| | 504 | | | Accenture plc | | | 40,783 | |
| | 536 | | | Automatic Data Processing, Inc. | | | 42,488 | |
| | 94 | | | IBM Corp. | | | 16,965 | |
| | 1,061 | | | Microsoft Corp. | | | 44,224 | |
| | 841 | | | Oracle Corp. | | | 34,075 | |
| | | | | | | | 178,535 | |
| | | | | Transportation - 5.1% | | | | |
| | 554 | | | Canadian National Railway Co. | | | 36,025 | |
| | 523 | | | United Parcel Service, Inc. Class B | | | 53,656 | |
| | | | | | | | 89,681 | |
| | | | | Utilities - 1.0% | | | | |
| | 252 | | | Dominion Resources, Inc. | | | 18,012 | |
| | | | | | | | | |
| | | | | Total Common Stocks | | | | |
| | | | | ( Cost $1,347,064) | | $ | 1,752,442 | |
| | | | | | | | | |
| | | | | Total Long-Term Investments | | | | |
| | | | | (Cost $1,347,064) | | $ | 1,752,442 | |
| | | | | | | | | |
| Short-Term Investments - 1.2% | | |
| Repurchase Agreements - 1.2% | | | |
| | | | | Bank of America Merrill Lynch TriParty Repurchase
Agreement (maturing on 07/01/2014 in the
amount of $1,797, collateralized by FHLMC
2.23% - 5.99%, 2030 - 2044, FNMA 2.31% -
6.34%, 2020 - 2042, value of $1,832) | | | | |
| $ | 1,797 | | | 0.10%, 6/30/2014 | | $ | 1,797 | |
| | | | | Bank of Montreal TriParty Repurchase Agreement
(maturing on 07/01/2014 in the amount of
$2,744, collateralized by U.S. Treasury Bill
0.13%, 2015, U.S. Treasury Bond 2.75% -
10.63%, 2015 - 2044, U.S. Treasury Note 0.13%
- 4.50%, 2014 - 2024, value of $2,799) | | | | |
| | 2,744 | | | 0.09%, 6/30/2014 | | | 2,744 | |
| | | | | Bank of Montreal TriParty Repurchase Agreement
(maturing on 07/01/2014 in the amount of
$1,170, collateralized by FHLMC 2.00% -
5.50%, 2018 - 2041, FNMA 2.00% - 4.50%,
2026 - 2042, GNMA 3.00% - 4.00%, 2042 -
2043, U.S. Treasury Bill 0.05%, 2014, U.S.
Treasury Note 0.75%, 2018, value of $1,194) | | | | |
| | 1,170 | | | 0.11%, 6/30/2014 | | | 1,170 | |
The accompanying notes are an integral part of these financial statements.
Hartford Stock HLS Fund
Schedule of Investments – (continued)
June 30, 2014 (Unaudited)
(000’s Omitted)
| Shares or Principal Amount | | | Market Value ╪ | |
| Short-Term Investments - 1.2% - (continued) | | | | | | | |
| Repurchase Agreements - 1.2% - (continued) | | | | | | | |
| | | | | Barclays Capital TriParty Repurchase Agreement
(maturing on 07/01/2014 in the amount of
$1,083, collateralized by U.S. Treasury Note
0.63% - 0.88%, 2018 - 2019, value of $1,104) | | | | | | | |
| $ | 1,083 | | | 0.07%, 6/30/2014 | | | | | $ | 1,083 | |
| | | | | Citigroup Global Markets, Inc. TriParty Repurchase
Agreement (maturing on 07/01/2014 in the
amount of $2,494, collateralized by U.S.
Treasury Bond 4.38% - 7.50%, 2016 - 2040,
U.S. Treasury Note 0.50% - 3.00%, 2014 -
2020, value of $2,544) | | | | | | | |
| | 2,494 | | | 0.06%, 6/30/2014 | | | | | | 2,494 | |
| | | | | RBS Securities Inc. TriParty Repurchase
Agreement (maturing on 07/01/2014 in the
amount of $3,822, collateralized by U.S.
Treasury Note 0.38% - 3.13%, 2015 - 2022,
value of $3,899) | | | | | | | |
| | 3,822 | | | 0.08%, 6/30/2014 | | | | | | 3,822 | |
| | | | | TD Securities TriParty Repurchase Agreement
(maturing on 07/01/2014 in the amount of
$7,956, collateralized by FHLMC 3.50% -
4.00%, 2026 - 2044, FNMA 2.50% - 5.00%,
2025 - 2043, value of $8,115) | | | | | | | |
| | 7,956 | | | 0.11%, 6/30/2014 | | | | | | 7,956 | |
| | | | | UBS Securities Repurchase Agreement (maturing
on 07/01/2014 in the amount of $33,
collateralized by U.S. Treasury Note 2.13%,
2020, value of $33) | | | | | | | |
| | 33 | | | 0.05%, 6/30/2014 | | | | | | 33 | |
| | | | | | | | | | | 21,099 | |
| | | | | Total Short-Term Investments | | | | | | | |
| | | | | (Cost $21,099) | | | | | $ | 21,099 | |
| | | | | | | | | | | | |
| | | | | Total Investments | | | | | | | |
| | | | | (Cost $1,368,163) ▲ | | | 99.9 | % | $ | 1,773,541 | |
| | | | | Other Assets and Liabilities | | | 0.1 | % | | 2,071 | |
| | | | | Total Net Assets | | | 100.0 | % | $ | 1,775,612 | |
The accompanying notes are an integral part of these financial statements.
Hartford Stock HLS Fund
Schedule of Investments – (continued)
June 30, 2014 (Unaudited)
(000’s Omitted)
| Note: | Percentage of investments as shown is the ratio of the total market value to total net assets. |
| | |
| | Prices of foreign equities that are principally traded on certain foreign markets may be adjusted daily pursuant to a fair value pricing service approved by the Board of Directors in order to reflect an adjustment for factors occurring after the close of certain foreign markets but before the close of the New York Stock Exchange. |
| ▲ | At June 30, 2014, the cost of securities for federal income tax purposes was $1,370,645 and the aggregate gross unrealized appreciation and depreciation based on that cost were: |
| Unrealized Appreciation | | $ | 408,454 | |
| Unrealized Depreciation | | | (5,558 | ) |
| Net Unrealized Appreciation | | $ | 402,896 | |
| † | These securities are valued in good faith at fair value as determined under policies and procedures established by and under the supervision of the Board of Directors. At June 30, 2014, the aggregate value of these securities was $10,204, which represents 0.6% of total net assets. This amount excludes securities that are principally traded in certain foreign markets and whose prices are adjusted pursuant to a third party pricing service methodology approved by the Board of Directors. |
| | |
| ● | Non-income producing. |
| ⌂ | The following securities are considered illiquid. Illiquid securities are often purchased in private placement transactions, are often not registered under the Securities Act of 1933, as amended, and may have contractual restrictions on resale. A security may also be considered illiquid if the security lacks a readily available market or if its valuation has not changed for a certain period of time. |
| Period Acquired | | Shares/ Par | | | Security | | Cost Basis | |
| 08/2011 | | | 9,440 | | | Allstar Co. | | $ | 4,107 | |
At June 30, 2014, the aggregate value of these securities was $10,204, which represents 0.6% of total net assets.
| ╪ | See Significant Accounting Policies of accompanying Notes to Financial Statements regarding valuation of securities. |
| GLOSSARY: (abbreviations used in preceding Schedule of Investments) |
| |
| Other Abbreviations: |
| FHLMC | Federal Home Loan Mortgage Corp. |
| FNMA | Federal National Mortgage Association |
| GNMA | Government National Mortgage Association |
| REIT | Real Estate Investment Trust |
The accompanying notes are an integral part of these financial statements.
Hartford Stock HLS Fund
Investment Valuation Hierarchy Level Summary
June 30, 2014 (Unaudited)
(000’s Omitted)
| | | Total | | | Level 1 ♦ | | | Level 2 ♦ | | | Level 3 | |
| Assets: | | | | | | | | | | | | | | | | |
| Common Stocks ‡ | | $ | 1,752,442 | | | $ | 1,587,349 | | | $ | 154,889 | | | $ | 10,204 | |
| Short-Term Investments | | | 21,099 | | | | – | | | | 21,099 | | | | – | |
| Total | | $ | 1,773,541 | | | $ | 1,587,349 | | | $ | 175,988 | | | $ | 10,204 | |
| ♦ | For the six-month period ended June 30, 2014, there were no transfers between Level 1 and Level 2. |
| ‡ | The Fund has all or primarily all of the equity securities categorized in a particular level. Refer to the Schedule of Investments for further industry breakout. |
Following is a reconciliation of Level 3 assets for which significant unobservable inputs were used to determine fair value:
| | | Balance as
of
December
31, 2013 | | | Realized
Gain
(Loss) | | | Change in
Unrealized
Appreciation
(Depreciation) | | | Net
Amortization | | | Purchases | | | Sales | | | Transfers
Into
Level 3 | | | Transfers
Out of
Level 3 | | | Balance as
of June 30,
2014 | |
| Assets: | | | | | | | | | | | | | | | | | | | | | | | | | | | | | | | | | | | | |
| Common Stocks | | $ | 20,482 | | | $ | — | | | $ | (8,806 | )* | | $ | — | | | $ | — | | | $ | (1,472 | ) | | $ | — | | | $ | — | | | $ | 10,204 | |
| Total | | $ | 20,482 | | | $ | — | | | $ | (8,806 | ) | | $ | — | | | $ | — | | | $ | (1,472 | ) | | $ | — | | | $ | — | | | $ | 10,204 | |
| * | Change in unrealized appreciation (depreciation) in the current period relating to assets still held at June 30, 2014 was $(8,806). |
| Note: | For purposes of reporting transfers between different hierarchy levels, both transfers in and out of each level, as applicable, are shown as if they occurred at the beginning of the period. |
The accompanying notes are an integral part of these financial statements.
Hartford Stock HLS Fund
Statement of Assets and Liabilities
June 30, 2014 (Unaudited)
(000’s Omitted)
| Assets: | | | | |
| Investments in securities, at market value (cost $1,368,163) | | $ | 1,773,541 | |
| Cash | | | 3 | |
| Foreign currency on deposit with custodian (cost $—) | | | — | |
| Receivables: | | | | |
| Fund shares sold | | | 1,111 | |
| Dividends and interest | | | 2,311 | |
| Other assets | | | 2 | |
| Total assets | | | 1,776,968 | |
| Liabilities: | | | | |
| Payables: | | | | |
| Fund shares redeemed | | | 1,049 | |
| Investment management fees | | | 116 | |
| Distribution fees | | | 6 | |
| Accrued expenses | | | 185 | |
| Total liabilities | | | 1,356 | |
| Net assets | | $ | 1,775,612 | |
| Summary of Net Assets: | | | | |
| Capital stock and paid-in-capital | | $ | 1,845,816 | |
| Undistributed net investment income | | | 17,109 | |
| Accumulated net realized loss | | | (492,712 | ) |
| Unrealized appreciation of investments and the translations of assets and liabilities denominated in foreign currency | | | 405,399 | |
| Net assets | | $ | 1,775,612 | |
| Shares authorized | | | 4,000,000 | |
| Par value | | $ | 0.001 | |
| Class IA: Net asset value per share | | $ | 60.40 | |
| Shares outstanding | | | 26,248 | |
| Net assets | | $ | 1,585,330 | |
| Class IB: Net asset value per share | | $ | 60.29 | |
| Shares outstanding | | | 3,156 | |
| Net assets | | $ | 190,282 | |
The accompanying notes are an integral part of these financial statements.
Hartford Stock HLS Fund
Statement of Operations
For the Six-Month Period Ended June 30, 2014 (Unaudited)
(000’s Omitted)
| Investment Income: | | | | |
| Dividends | | $ | 21,371 | |
| Interest | | | 6 | |
| Less: Foreign tax withheld | | | (473 | ) |
| Total investment income, net | | | 20,904 | |
| | | | | |
| Expenses: | | | | |
| Investment management fees | | | 4,215 | |
| Transfer agent fees | | | 3 | |
| Distribution fees - Class IB | | | 240 | |
| Custodian fees | | | 8 | |
| Accounting services fees | | | 89 | |
| Board of Directors' fees | | | 23 | |
| Audit fees | | | 15 | |
| Other expenses | | | 132 | |
| Total expenses (before fees paid indirectly) | | | 4,725 | |
| Commission recapture | | | (3 | ) |
| Total fees paid indirectly | | | (3 | ) |
| Total expenses, net | | | 4,722 | |
| Net Investment Income | | | 16,182 | |
| | | | | |
| Net Realized Gain on Investments and Foreign Currency Transactions: | | | 71485000 | |
| Net realized gain on investments | | | 71,492 | |
| Net realized gain on foreign currency contracts | | | 32 | |
| Net realized loss on other foreign currency transactions | | | (39 | ) |
| Net Realized Gain on Investments and Foreign Currency Transactions | | | 71,485 | |
| | | | | |
| Net Changes in Unrealized Depreciation of Investments and Foreign Currency Transactions: | | | | |
| Net unrealized depreciation of investments | | | (19,061 | ) |
| Net unrealized depreciation on translation of other assets and liabilities in foreign currencies | | | (1 | ) |
| Net Changes in Unrealized Depreciation of Investments and Foreign Currency Transactions | | | (19,062 | ) |
| Net Gain on Investments and Foreign Currency Transactions | | | 52,423 | |
| Net Increase in Net Assets Resulting from Operations | | $ | 68,605 | |
The accompanying notes are an integral part of these financial statements.
Hartford Stock HLS Fund
Statement of Changes in Net Assets
(000’s Omitted)
| | | For the
Six-Month
Period Ended
June 30, 2014
(Unaudited) | | | For the
Year Ended
December 31,
2013 | |
| Operations: | | | | | | | | |
| Net investment income | | $ | 16,182 | | | $ | 33,934 | |
| Net realized gain on investments and foreign currency transactions | | | 71,485 | | | | 160,508 | |
| Net unrealized appreciation (depreciation) of investments and foreign currency transactions | | | (19,062 | ) | | | 313,072 | |
| Net Increase in Net Assets Resulting from Operations | | | 68,605 | | | | 507,514 | |
| Distributions to Shareholders: | | | | | | | | |
| From net investment income | | | | | | | | |
| Class IA | | | — | | | | (30,025 | ) |
| Class IB | | | — | | | | (3,209 | ) |
| Total distributions | | | — | | | | (33,234 | ) |
| Capital Share Transactions: | | | | | | | | |
| Class IA | | | | | | | | |
| Sold | | | 6,536 | | | | 30,364 | |
| Issued on reinvestment of distributions | | | — | | | | 30,025 | |
| Redeemed | | | (149,934 | ) | | | (345,934 | ) |
| Total capital share transactions | | | (143,398 | ) | | | (285,545 | ) |
| Class IB | | | | | | | | |
| Sold | | | 224 | | | | 11,893 | |
| Issued on reinvestment of distributions | | | — | | | | 3,209 | |
| Redeemed | | | (21,534 | ) | | | (64,391 | ) |
| Total capital share transactions | | | (21,310 | ) | | | (49,289 | ) |
| Net decrease from capital share transactions | | | (164,708 | ) | | | (334,834 | ) |
| Net Increase (Decrease) in Net Assets | | | (96,103 | ) | | | 139,446 | |
| Net Assets: | | | | | | | | |
| Beginning of period | | | 1,871,715 | | | | 1,732,269 | |
| End of period | | $ | 1,775,612 | | | $ | 1,871,715 | |
| Undistributed (distribution in excess of) net investment income | | $ | 17,109 | | | $ | 927 | |
| Shares: | | | | | | | | |
| Class IA | | | | | | | | |
| Sold | | | 112 | | | | 588 | |
| Issued on reinvestment of distributions | | | — | | | | 528 | |
| Redeemed | | | (2,573 | ) | | | (6,660 | ) |
| Total share activity | | | (2,461 | ) | | | (5,544 | ) |
| Class IB | | | | | | | | |
| Sold | | | 4 | | | | 231 | |
| Issued on reinvestment of distributions | | | — | | | | 56 | |
| Redeemed | | | (370 | ) | | | (1,242 | ) |
| Total share activity | | | (366 | ) | | | (955 | ) |
The accompanying notes are an integral part of these financial statements.
Hartford Stock HLS Fund
Notes to Financial Statements
June 30, 2014 (Unaudited)
(000’s Omitted)
Organization:
Hartford Stock HLS Fund (the "Fund") serves as an underlying investment option for certain variable annuity and variable life insurance separate accounts of Hartford Life Insurance Company (“HLIC”) and its affiliates and certain qualified retirement plans. The Fund may also serve as an underlying investment option for certain variable annuity and variable life separate accounts of other insurance companies. Owners of variable annuity contracts and policyholders of variable life insurance contracts may choose the funds permitted in the variable insurance contract prospectus. In addition, participants in certain qualified retirement plans may choose the Fund if permitted by their plans.
Hartford Series Fund, Inc. (the “Company”) is an open-end registered management investment company comprised of twenty-eight portfolios. Financial statements for the Fund, a series of the Company, are included in this report.
The Company is organized under the laws of the State of Maryland and is registered with the Securities and Exchange Commission (“SEC”) under the Investment Company Act of 1940, as amended (“1940 Act”). The Fund is a diversified open-end management investment company.
The Fund is divided into Class IA, Class IB and Class IC shares. Each class is offered at the per share net asset value (“NAV”) without a sales charge and is subject to the same expenses, except that the Class IB shares are subject to distribution and service fees charged pursuant to a Distribution Plan adopted in accordance with Rule 12b-1 under the 1940 Act and Class IC shares are subject to distribution fees charged pursuant to a Distribution Plan adopted in accordance with Rule 12b-1 under the 1940 Act and are also subject to an administrative service fee. Class IC shares have not commenced operations and are not currently offered for sale as of the date of this report.
Significant Accounting Policies:
The following is a summary of significant accounting policies of the Fund in the preparation of its financial statements, which are in accordance with United States Generally Accepted Accounting Principles (“U.S. GAAP”). The preparation of financial statements in accordance with U.S. GAAP may require management to make estimates and assumptions that affect the reported amounts of assets and liabilities and disclosure of contingent assets and liabilities at the date of the financial statements and the reported amounts of increases and decreases in net assets from operations during the reporting period. Actual results could differ from those estimates.
Determination of Net Asset Value – The NAV of each class of the Fund's shares is determined as of the close of regular trading (normally 4:00 p.m. Eastern Time) (the “NYSE Close”) on each day that the New York Stock Exchange (the “Exchange”) is open (“Valuation Date”). Information that becomes known to the Fund after the NAV has been calculated on a particular day will not generally be used to retroactively adjust the NAV determined earlier that day.
Investment Valuation and Fair Value Measurements – For purposes of calculating the NAV, portfolio investments and other assets held by the Fund's portfolio for which market quotes are readily available are valued at market value. Market value is generally determined on the basis of last reported sales prices or official close price. If no sales are reported, market value is based on quotes obtained from a quotation reporting system, established market makers, or independent pricing services. If market prices are not readily available or are deemed unreliable, the Fund will use the fair value of the investment as determined in good faith under policies and procedures established by and under the supervision of the Company's Board of Directors. Market quotes are considered not readily available where there is an absence of current or reliable market-based data (e.g., trade information or indicative market quotes), including where events occur after the close of the relevant market, but prior to the NYSE Close, that materially affect the values of the Fund's portfolio investments or assets. In addition, market quotes are considered not readily available when, due to extraordinary circumstances, the exchanges or markets on which the investments trade do not open for trading for the entire day and no other market prices are available. In addition, prices of foreign equities that are principally traded on certain foreign markets may be adjusted daily pursuant to a fair value pricing service approved by the Board of Directors in order to reflect an adjustment for the factors occurring after the close of certain foreign markets but before the NYSE Close. Investments that are primarily traded on foreign markets may trade on days that are not business days of the Fund. The value of the foreign investments in which the Fund invests may change on days when a shareholder will not be able to purchase or redeem shares of the Fund. Fair value pricing is subjective in nature and the use of fair value pricing by the Fund may cause the NAV of its shares to differ significantly from the NAV
Hartford Stock HLS Fund
Notes to Financial Statements – (continued)
June 30, 2014 (Unaudited)
(000’s Omitted)
that would have been calculated using market prices at the close of the exchange on which a portfolio investment is primarily traded. There can be no assurance that the Fund could obtain the fair market value assigned to an investment if the Fund were to sell the investment at approximately the time at which the Fund determines its NAV.
Investments valued in currencies other than U.S. dollars are converted to U.S. dollars using exchange rates obtained from independent pricing services for calculation of the NAV. As a result, the NAV of the Fund’s shares may be affected by changes in the value of currencies in relation to the U.S. dollar. The value of investments traded in markets outside the United States or denominated in currencies other than the U.S. dollar may be affected significantly on a day that the NYSE is closed and the market value may change on days when an investor is not able to purchase, redeem or exchange shares of the Fund.
Foreign currency contracts represent agreements to exchange currencies on specific future dates at predetermined rates. Foreign currency contracts are valued using foreign currency exchange rates and forward rates as provided by an independent pricing service on the Valuation Date.
Financial instruments for which prices are not available from an independent pricing service may be valued using market quotations obtained from one or more dealers that make markets in the respective financial instrument in accordance with procedures established by the Company's Board of Directors.
U.S. GAAP defines fair value as the price that the Fund would receive to sell an asset or pay to transfer a liability in an orderly transaction between market participants. The U.S. GAAP fair value measurement standards require disclosure of a fair value hierarchy for each major category of assets and liabilities. Various inputs are used in determining the fair value of the Fund’s investments. These inputs are summarized into three broad hierarchy levels. This hierarchy is based on whether the valuation inputs are observable or unobservable. These levels are:
Level 1 – Quoted prices in active markets for identical investments. Level 1 may include exchange traded instruments, such as domestic equities, some foreign equities, options, futures, mutual funds, exchange traded funds, rights and warrants.
Level 2 – Observable inputs other than Level 1 prices, such as quoted prices for similar investments; quoted prices in markets that are not active; or other inputs that are observable or can be corroborated by observable market data. Level 2 may include debt investments that are traded less frequently than exchange traded instruments and which are valued using independent pricing services; foreign equities, which are principally traded on certain foreign markets and are adjusted daily pursuant to a fair value pricing service in order to reflect an adjustment for the factors occurring after the close of certain foreign markets but before the NYSE Close; senior floating rate interests, which are valued using an aggregate of dealer bids; short-term investments, which are valued at amortized cost; and swaps, which are valued based upon the terms of each swap contract.
Level 3 – Significant unobservable inputs that are supported by limited or no market activity. Level 3 may include financial instruments whose values are determined using indicative market quotes or require significant management judgment or estimation. These unobservable valuation inputs may include estimates for current yields, maturity/duration, prepayment speed, and indicative market quotes for comparable investments along with other assumptions relating to credit quality, collateral value, complexity of the investment structure, general market conditions and liquidity. This category may include investments where trading has been halted or there are certain restrictions on trading. While these investments are priced using unobservable inputs, the valuation of these investments reflects the best available data and management believes the prices are a reasonable representation of exit price.
The Board of Directors of the Company generally reviews and approves the “Procedures for Valuation of Portfolio Securities” at least once a year. These procedures define how investments are to be valued, including the formation and activities of a Valuation Committee. The Valuation Committee is responsible for determining in good faith the fair value of investments when the value cannot be obtained from primary pricing services or alternative sources or if the valuation of an investment as provided by the primary pricing service or alternative source is believed not to reflect the investment’s fair value as of the Valuation Date. Voting members of the Valuation Committee include the Fund's Treasurer or designee and a Vice President of the investment manager or designee. An Assistant Vice President of the Fund with legal expertise or designee is also included on the Valuation Committee as a non-voting advisory member. In addition, the Fund’s Chief Compliance Officer shall designate a member of the
Hartford Stock HLS Fund
Notes to Financial Statements – (continued)
June 30, 2014 (Unaudited)
(000’s Omitted)
compliance group to attend Valuation Committee meetings as a non-voting resource, to monitor for and provide guidance with respect to compliance with these procedures. Two members of the Valuation Committee or their designees, representing different departments, shall constitute a quorum for purposes of permitting the Valuation Committee to take action. The Valuation Committee will consider all relevant factors in determining an investment’s fair value, and may seek the advice of the Fund’s sub-adviser, knowledgeable brokers, and legal counsel in making such determination. The Valuation Committee reports to the Audit Committee of the Company's Board of Directors. The Audit Committee receives quarterly written reports which include details of all fair-valued investments, including the reason for the fair valuation, and an indication, when possible, of the accuracy of the valuation by disclosing the next available reliable public price quotation or the disposition price of such investments (the “look-back” test). The Board of Directors then must consider for ratification all of the fair value determinations made during the previous quarter.
Valuation levels are not necessarily indicative of the risk associated with investing in such investments. Individual investments within any of the above mentioned asset classes may be assigned a different hierarchical level than those presented above, as individual circumstances dictate.
For additional information, refer to the Investment Valuation Hierarchy Level Summary and the Level 3 roll-forward reconciliation, if applicable, which follow the Schedule of Investments.
Investment Transactions and Investment Income – Investment transactions are recorded as of the trade date (the date the order to buy or sell is executed) for financial reporting purposes. Investments purchased or sold on a when-issued or delayed-delivery basis may be settled a month or more after the trade date. Realized gains and losses are determined on the basis of identified cost.
Dividend income from domestic securities is accrued on the ex-dividend date. In general, dividend income from foreign securities is recorded on the ex-date; however, dividend notifications in certain foreign jurisdictions may not be available in a timely manner and as a result, the Fund will record the dividend as soon as the relevant details (i.e., rate per share, payment date, shareholders of record, etc.) are publicly available. Interest income, including amortization of premium, accretion of discounts and additional principal received in-kind in lieu of cash, is accrued on a daily basis.
Foreign Currency Transactions – Assets and liabilities denominated in currencies other than U.S. dollars are translated into U.S. dollars at the exchange rates in effect on the valuation date. Purchases and sales of investments, income and expenses are translated into U.S. dollars at the exchange rates on the dates of such transactions.
The Fund does not isolate that portion of portfolio investment valuation resulting from fluctuations in the foreign currency exchange rates from the fluctuations arising from changes in the market prices of investments held. Exchange rate fluctuations are included with the net realized and unrealized gain or loss on investments in the accompanying financial statements.
Net realized foreign exchange gains or losses arise from sales of foreign currencies and the difference between asset and liability amounts initially stated in foreign currencies and the U.S. dollar value of the amounts actually received or paid. Net unrealized foreign exchange gains or losses arise from changes in the value of other assets and liabilities at the end of the reporting period, resulting from changes in the exchange rates.
Joint Trading Account – The Fund may invest cash balances into a joint trading account that may be invested in one or more repurchase agreements.
Fund Share Valuation and Dividend Distributions to Shareholders – Orders for the Fund’s shares are executed in accordance with the investment instructions of the contract holders and plan participants. The NAV of the Fund’s shares is determined as of the close of business on each business day of the Exchange. The NAV is determined separately for each class of shares of the Fund by dividing the Fund’s net assets attributable to that class by the number of shares of the class outstanding. Each class of shares offered by the Fund has equal rights as to assets and voting privileges (except that shareholders of a class have exclusive voting rights regarding any matter relating solely to that class of shares). Income and non-class specific expenses are allocated daily to each class on the basis of the relative net assets of the class. Realized and unrealized gains and losses are allocated daily based on the relative net assets of each class of shares of the Fund.
Hartford Stock HLS Fund
Notes to Financial Statements – (continued)
June 30, 2014 (Unaudited)
(000’s Omitted)
Orders for the purchase of the Fund’s shares received prior to the close of the Exchange on any day the Exchange is open for business are priced at the NAV determined as of the close of the Exchange. Orders received after the close of the Exchange, or on a day on which the Exchange and/or the Fund is not open for business, are priced at the next determined NAV.
Dividends are declared pursuant to a policy adopted by the Company's Board of Directors based upon the investment performance of the Fund. The policy of the Fund is to pay dividends from net investment income and realized gains, if any, at least once a year.
Distributions from net investment income, net realized gains and capital are determined in accordance with federal income tax regulations, which may differ from U.S. GAAP with respect to character and timing. These differences may include, but are not limited to, losses deferred due to wash sale adjustments, foreign currency gains and losses, adjustments related to Passive Foreign Investment Companies ("PFICs"), Real Estate Investment Trusts ("REITs"), Regulated Investment Companies ("RICs"), certain derivatives and partnerships. Permanent book and federal income tax basis differences relating to shareholder distributions will result in reclassifications to certain of the Fund’s capital accounts (see Federal Income Taxes: Reclassification of Capital Accounts note).
Securities and Other Investments:
Repurchase Agreements – A repurchase agreement is an agreement by which a counterparty agrees to sell an investment and agrees to repurchase the investment sold from the buyer at a mutually agreed upon time and price. During the period of the repurchase agreement, the counterparty will deposit cash and or securities in a third party custodial account to serve as collateral. At the time the Fund enters into a repurchase agreement, the value of the underlying collateral, including accrued interest, will be equal to or exceed the value of the repurchase agreement. Repurchase agreements expose the Fund to counterparty risk - that is, the risk that the counterparty will not fulfill its obligations. To minimize counterparty risk, the investments that serve to collateralize the repurchase agreement are held by the Fund’s custodian in book entry or physical form in the custodial account of the Fund or in a third party custodial account. Repurchase agreements are valued at cost plus accrued interest, which approximates fair value. Repurchase agreements have master netting arrangements which allow the Fund to offset amounts owed to a counterparty with amounts owed by the counterparty, including any collateral. Upon an event of default under a master repurchase agreement, the non-defaulting party may close out all transactions traded under such agreement and net amounts owed under each transaction to one net amount payable by one party to the other. Absent an event of default, the master repurchase agreement does not result in an offset of reported amounts of assets and liabilities in the Statement of Assets and Liabilities across transactions between the Fund and the applicable counterparty. The Fund, as shown on the Schedule of Investments, had outstanding repurchase agreements and related collateral as of June 30, 2014.
Illiquid and Restricted Investments – The Fund is permitted to invest up to 15% of its net assets in illiquid investments. Illiquid investments are those that may not be sold or disposed of in the ordinary course of business within seven days, at approximately the price used to determine the Fund’s NAV. The Fund may not be able to sell illiquid investments when its sub-adviser considers it desirable to do so or may have to sell such investments at a price that is lower than the price that could be obtained if the investments were more liquid. A sale of illiquid investments may require more time and may result in higher dealer discounts and other selling expenses than does the sale of those that are liquid. Illiquid investments also may be more difficult to value due to the unavailability of reliable market quotations for such investments, and an investment in them may have an adverse impact on the Fund’s NAV. The Fund may also purchase certain restricted investments that can only be resold to certain qualified investors and may be determined to be liquid pursuant to policies and guidelines established by the Company's Board of Directors. The Fund, as shown on the Schedule of Investments, had illiquid or restricted investments as of June 30, 2014.
Investments Purchased on a When-Issued or Delayed-Delivery Basis – Delivery and payment for investments that have been purchased by the Fund on a forward commitment, or when-issued or delayed-delivery basis, take place beyond the customary settlement period. The Fund may dispose of or renegotiate a delayed-delivery transaction after it is entered into, and may sell delayed-delivery investments before they are delivered, which may result in a realized gain or loss. During this period, such investments are subject to market fluctuations, and the Fund identifies investments segregated in its records with a value at least equal to the amount of the commitment. The Fund had no when-issued or delayed-delivery investments as of June 30, 2014.
Hartford Stock HLS Fund
Notes to Financial Statements – (continued)
June 30, 2014 (Unaudited)
(000’s Omitted)
Financial Derivative Instruments:
The following disclosures contain information on how and why the Fund uses derivative instruments, the credit-risk-related contingent features in certain derivative instruments, and how derivative instruments affect the Fund’s financial position and results of operations. The location and fair value amounts of these instruments on the Statement of Assets and Liabilities and the realized gains and losses and changes in unrealized gains and losses on the Statement of Operations, each categorized by type of derivative contract, are included in the following Additional Derivative Instrument Information footnote. The derivative instruments outstanding as of period-end are disclosed in the notes to or within the Schedule of Investments for purchased options, if applicable. The amounts of realized gains and losses and changes in unrealized gains and losses on derivative instruments during the period are disclosed in the Statement of Operations.
Foreign Currency Contracts – The Fund may enter into foreign currency contracts that obligate the Fund to purchase or sell currencies at specified future dates. Foreign currency contracts are used to hedge the currency exposure associated with some or all of the Fund’s investments and/or as part of an investment strategy. Foreign currency contracts are marked to market daily and the change in value is recorded by the Fund as an unrealized gain or loss. The Fund will record a realized gain or loss when the foreign currency contract is settled.
Foreign currency contracts involve elements of market risk in excess of the amounts reflected in the Statement of Assets and Liabilities. In addition, risks may arise upon entering into these contracts from the potential inability of the counterparties to meet the terms of the contracts and from unanticipated movements in the value of the foreign currencies relative to the U.S. dollar. The Fund had no outstanding foreign currency contracts as of June 30, 2014.
Additional Derivative Instrument Information:
The volume of derivative activity was minimal during the six-month period ended June 30, 2014.
The Effect of Derivative Instruments on the Statement of Operations for the six-month period ended June 30, 2014:
| | | Risk Exposure Category | |
| | | Interest Rate
Contracts | | | Foreign
Exchange
Contracts | | | Credit
Contracts | | | Equity
Contracts | | | Commodity
Contracts | | | Other
Contracts | | | Total | |
| Realized Gain on Derivatives Recognized as a Result of Operations: | | | | | | | | | | | | | | | | | | |
| Net realized gain on foreign currency contracts | | $ | — | | | $ | 32 | | | $ | — | | | $ | — | | | $ | — | | | $ | — | | | $ | 32 | |
| Total | | $ | — | | | $ | 32 | | | $ | — | | | $ | — | | | $ | — | | | $ | — | | | $ | 32 | |
Principal Risks:
The Fund may be exposed to counterparty risk, or the risk that an institution or other entity with which the Fund has unsettled or open transactions will default.
If the Fund invests directly in foreign currencies or in securities that trade in, and receive revenues in, foreign currencies, or in derivatives that provide exposure to foreign currencies, it will be subject to the risk that those currencies will decline in value relative to the base currency (U.S. dollars) of the Fund, or, in the case of hedging positions, that the Fund’s base currency will decline in value relative to the currency being hedged. Currency rates in foreign countries may fluctuate significantly over short periods of time for a number of reasons, including changes in interest rates, intervention (or the failure to intervene) by U.S. or foreign governments, central banks or supranational entities, such as the International Monetary Fund, or by the imposition of currency controls or other political developments in the United States or abroad. As a result, the Fund’s investments in foreign currency denominated securities may reduce the returns of the Fund. The market values of equity securities, such as common stocks and preferred stocks, or equity related investments, such as futures and options, may decline due to general market conditions which are not specifically related to a particular company, such as real or perceived adverse economic conditions, changes in the general outlook for corporate earnings, changes in interest or currency rates or adverse investor sentiment generally. The market value of equity securities may also decline due to factors which affect a particular industry or industries, such as labor shortages or increased production costs and competitive conditions within an industry. Equity securities and equity related investments generally have greater market price volatility than fixed income securities.
Hartford Stock HLS Fund
Notes to Financial Statements – (continued)
June 30, 2014 (Unaudited)
(000’s Omitted)
Federal Income Taxes:
Federal Income Taxes – For federal income tax purposes, the Fund intends to continue to qualify as a RIC under Subchapter M of the Internal Revenue Code (“IRC”) by distributing substantially all of its taxable net investment income and net realized capital gains to its shareholders and otherwise complying with the requirements of the IRC. The Fund has distributed substantially all of its income and capital gains in prior years, if applicable, and intends to distribute substantially all of its income and capital gains prior to the next fiscal year-end. Accordingly, no provision for federal income or excise taxes has been made in the accompanying financial statements. Distributions from short-term capital gains are treated as ordinary income distributions for federal income tax purposes.
Net Investment Income (Loss), Net Realized Gains (Losses) and Distributions – Net investment income (loss) and net realized gains (losses) may differ for financial statement and tax purposes primarily because of losses deferred due to wash sale adjustments, foreign currency gains and losses, adjustments related to PFICs, REITs, RICs, certain derivatives and partnerships. The character of distributions made during the year from net investment income or net realized gains may differ from their ultimate characterization for federal income tax purposes. Also, due to the timing of dividend distributions, the fiscal year in which amounts are distributed may differ from the year that the income or realized gains (losses) were recorded by the Fund.
Distributions and Components of Distributable Earnings – The tax character of distributions paid by the Fund for the periods indicated is as follows (as adjusted for dividends payable, if applicable):
| | | For the Year Ended
December 31, 2013 | | | For the Year Ended
December 31, 2012 | |
| Ordinary Income | | $ | 33,234 | | | $ | 36,297 | |
As of December 31, 2013, the Fund’s components of distributable earnings (deficit) on a tax basis are as follows:
| | | Amount | |
| Undistributed Ordinary Income | | $ | 927 | |
| Accumulated Capital and Other Losses* | | | (561,715 | ) |
| Unrealized Appreciation† | | | 421,979 | |
| Total Accumulated Deficit | | $ | (138,809 | ) |
| * | The Fund has capital loss carryforwards that are identified in the Capital Loss Carryforward note that follows. |
| † | Differences between book-basis and tax-basis unrealized appreciation (depreciation) may be attributable to the losses deferred due to wash sale adjustments, foreign currency gains and losses, adjustments related to PFICs, REITs, RICs, certain derivatives and partnerships. |
Reclassification of Capital Accounts – The Fund may record reclassifications in its capital accounts. These reclassifications have no impact on the total net assets of the Fund. The reclassifications are a result of permanent differences between U.S. GAAP and tax accounting for such items as foreign currency, PFICs, expiration or utilization of capital loss carryforwards or net operating losses. Adjustments are made to reflect the impact these items have on current and future distributions to shareholders. Therefore, the source of the Fund’s distributions may be shown in the accompanying Statement of Changes in Net Assets as from undistributed net investment income, from accumulated net realized gains on investments or from capital depending on the type of book and tax differences that exist. For the year ended December 31, 2013, the Fund recorded reclassifications to increase (decrease) the accounts listed below:
| | | Amount | |
| Undistributed Net Investment Income (Loss) | | $ | 23 | |
| Accumulated Net Realized Gain (Loss) | | | (23 | ) |
Capital Loss Carryforward – On December 22, 2010, the Regulated Investment Company Modernization Act of 2010 (the “Act”) was enacted, which made changes to the capital loss carryforward rules. The changes are effective for taxable years beginning after the date of enactment. Under the Act, funds are permitted to carry forward capital losses for an unlimited period. However, any losses
Hartford Stock HLS Fund
Notes to Financial Statements – (continued)
June 30, 2014 (Unaudited)
(000’s Omitted)
incurred during those future taxable years will be required to be utilized prior to the losses incurred in pre-enactment taxable years, which carry an expiration date. As a result of this ordering rule, pre-enactment capital loss carryforwards may be more likely to expire unused. Additionally, post-enactment capital loss carryforwards retain their character as either short-term or long-term capital losses rather than being considered all short-term as permitted under prior regulation.
At December 31, 2013 (tax year end), the Fund had capital loss carryforwards for U.S. federal income tax purposes as follows:
| Year of Expiration | | Amount | |
| 2017 | | $ | 561,715 | |
| Total | | $ | 561,715 | |
During the year ended December 31, 2013, the Fund utilized $156,817 of prior year capital loss carryforwards.
Accounting for Uncertainty in Income Taxes – The Fund has adopted financial reporting rules that require the Fund to analyze all open tax years, as defined by the statute of limitations, for all major jurisdictions. Generally, tax authorities can examine all tax returns filed for the last three years. The Fund does not have an examination in progress.
The Fund has reviewed all open tax years and major jurisdictions and concluded that these financial reporting rules had no effect on the Fund’s financial position or results of operations. There is no tax liability resulting from unrecognized tax benefits relating to uncertain income tax positions taken or expected to be taken on the tax return for the fiscal year ended December 31, 2013. The Fund is also not aware of any tax positions for which it is reasonably possible that the total amounts of unrecognized tax benefits will significantly change in the next twelve months.
Expenses:
Investment Management Agreement – Hartford Funds Management Company, LLC ("HFMC") serves as the Fund’s investment manager pursuant to an Investment Management Agreement with the Company. HFMC is an indirect wholly owned subsidiary of The Hartford Financial Services Group, Inc. ("The Hartford"). The investment manager has overall investment supervisory responsibility for the Fund. In addition, the investment manager provides administrative personnel, services, equipment, facilities and office space for proper operation of the Fund. HFMC has contracted with Wellington Management Company, LLP ("Wellington Management") under a sub-advisory agreement for the provision of day-to-day investment management services to the Fund in accordance with the Fund’s investment objective and policies. The Fund pays a fee to the investment manager, a portion of which may be used to compensate Wellington Management.
The schedule below reflects the rates of compensation paid to the investment manager for investment management services rendered as of June 30, 2014; the rates are accrued daily and paid monthly:
| Average Daily Net Assets | | Annual Fee |
| On first $250 million | | 0.5250% |
| On next $250 million | | 0.5000% |
| On next $500 million | | 0.4750% |
| On next $4 billion | | 0.4500% |
| On next $5 billion | | 0.4475% |
| Over $10 billion | | 0.4450% |
Accounting Services Agreement – Pursuant to the Fund Accounting Agreement between HFMC and the Company, on behalf of the Fund, HFMC provides accounting services to the Fund and receives monthly compensation based on the Fund’s average daily net assets at the rates set forth below. The Fund’s accounting services fees are accrued daily and paid monthly.
| Average Daily Net Assets | | Annual Fee |
| All Assets | | 0.010% |
Hartford Stock HLS Fund
Notes to Financial Statements – (continued)
June 30, 2014 (Unaudited)
(000’s Omitted)
Operating Expenses – Allocable expenses incurred by the Company are allocated to each Fund and allocated to classes within a Fund in proportion to the average daily net assets of the Fund and each class, except where allocation of certain expenses is more fairly made directly to the Fund or to specific classes within a Fund.
Fees Paid Indirectly – The Company, on behalf of the Fund, has entered into agreements with State Street Global Markets, LLC and Russell Implementation Services, Inc. to partially recapture non-discounted trade commissions. Such rebates are used to pay a portion of the Fund's expenses. For the six-month period ended June 30, 2014, this amount, if any, is included in the Statement of Operations.
The ratio of expenses to average net assets in the accompanying financial highlights excludes the reduction in expenses related to fees paid indirectly. The annualized expense ratio after waivers for the period listed below reflecting the reduction for fees paid indirectly is as follows:
| | | Annualized Six-
Month Period Ended
June 30, 2014 | |
| Class IA | | | 0.50% | |
| Class IB | | | 0.75 | |
Distribution Plan for Class IB Shares – Hartford Funds Distributors, LLC (“HFD”), an indirect wholly owned subsidiary of The Hartford, is the principal underwriter and distributor of the Fund. The Company, on behalf of the Fund, has adopted a Distribution Plan pursuant to Rule 12b-1 of the 1940 Act for Class IB shares.
The Distribution Plan provides that the Fund may pay annually up to 0.25% of the average daily net assets of the Fund attributable to its Class IB shares for activities primarily intended to result in the sale of Class IB shares. The Board has the authority to suspend or reduce these payments at any point in time. Under the terms of the Distribution Plan and the principal underwriting agreement, the Fund is authorized to make payments monthly to the distributor that may be used to pay or reimburse entities providing distribution and shareholder servicing with respect to the Class IB shares for such entities’ fees or expenses incurred or paid in that regard. The distribution fee paid during the period can be found on the Statement of Operations. These fees are accrued daily and paid monthly.
Other Related Party Transactions – Hartford Administrative Services Company (“HASCO”), an indirect wholly owned subsidiary of The Hartford, provides transfer agent services to the Fund. HASCO was compensated on a per account basis for providing such services. The amount paid to HASCO can be found in the Statement of Operations. These fees are accrued daily and paid monthly.
Payment from Affiliate – In July of 2007, The Hartford entered into a settlement with the Attorneys General of the states of New York, Connecticut and Illinois relating to market timing and the company's individual variable annuity contracts in which certain payments would be made directly to the variable annuity contract holders. The distribution plan provided that unclaimed money from the settlement would be distributed to certain HLS Funds that are investment options through a Hartford individual variable annuity contract. The unclaimed money was distributed to the Fund on September 18, 2009.
The total return in the accompanying financial highlights includes a payment from an affiliate. Had the payment from the affiliate been excluded, the impact and total return for the period listed below would have been as follows:
| | | For the Year Ended December 31, 2009 | |
| | | Class IA | | | Class IB | |
| Impact from Payment from Affiliate for Attorneys General Settlement | | | —% | | | | —% | |
| Total Return Excluding Payment from Affiliate | | | 41.53% | | | | 41.18% | |
Hartford Stock HLS Fund
Notes to Financial Statements – (continued)
June 30, 2014 (Unaudited)
(000’s Omitted)
Investment Transactions:
For the six-month period ended June 30, 2014, the cost of purchases and proceeds from sales of investment securities (excluding short-term investments) were as follows:
| | | Excluding U.S.
Government
Obligations | | | U.S.
Government
Obligations | | | Total | |
| Cost of Purchases | | $ | 240,845 | | | $ | — | | | $ | 240,845 | |
| Sales Proceeds | | | 368,807 | | | | — | | | | 368,807 | |
Line of Credit:
The Fund is one of several Hartford Funds that participate in a $500 million committed revolving line of credit facility. The facility is to be used for temporary or emergency purposes. Under the arrangement, the funds are required to own securities having a market value in excess of 300% of the total bank borrowings. The interest rate on borrowings varies depending on the nature of the loan. The facility also requires a fee to be paid based on the amount of the commitment. This commitment fee is allocated to all the funds participating in the line of credit based on the average net assets of the funds. During the six-month period ended June 30, 2014, the Fund did not have any borrowings under this facility.
Industry Classifications:
Other than the industry classifications "Other Investment Pools and Funds" and "Exchange Traded Funds," equity industry classifications used in this report are the Global Industry Classification Standard, which was developed by and is the exclusive property and service mark of MSCI, Inc. and Standard & Poor's.
Indemnifications:
Under the Company's organizational documents, the Company shall indemnify its officers and directors to the full extent required or permitted under Maryland General Corporation Law and the federal securities laws. In addition, the Company, on behalf of the Fund, may enter into contracts that contain a variety of indemnifications. The Company's maximum exposure under these arrangements is unknown. However, as of the date of these financial statements, the Company has not had prior claims or losses pursuant to these contracts and expects the risk of loss to be remote.
Pending Legal Proceedings:
On February 25, 2011, Jennifer L. Kasilag, Louis Mellinger, Judith M. Menendez, Jacqueline M. Robinson, and Linda A. Russell filed a derivative lawsuit against Hartford Investment Financial Services, LLC (“HIFSCO”) (now known as Hartford Funds Distributors, LLC) on behalf of six Hartford retail mutual funds in the United States District Court for the District of New Jersey, alleging that HIFSCO received excessive advisory and distribution fees in violation of its statutory fiduciary duty under Section 36(b) of the 1940 Act when serving as investment manager and principal underwriter, respectively, to the Hartford retail mutual funds. Although this action was purportedly filed on behalf of certain of the Hartford Funds, none of the Hartford Funds is itself a defendant to the suit. HIFSCO moved to dismiss and, in September 2011, the motion was granted in part and denied in part, with leave to amend the complaint. In November 2011, plaintiffs filed an amended complaint on behalf of certain Hartford retail mutual funds, The Hartford Global Health Fund (now known as The Hartford Healthcare Fund), The Hartford Conservative Allocation Fund, The Hartford Growth Opportunities Fund, The Hartford Inflation Plus Fund, The Hartford Advisers Fund (now known as The Hartford Balanced Fund), and The Hartford Capital Appreciation Fund. Plaintiffs seek to rescind the investment management agreements and distribution plans between HIFSCO and these funds and to recover the total fees charged thereunder or, in the alternative, to recover any improper compensation HIFSCO received, in addition to lost earnings. HIFSCO filed a partial motion to dismiss the amended complaint and, in December 2012, the court dismissed without prejudice the claims regarding distribution fees and denied the motion with respect to the advisory fees claims. HIFSCO disputes the allegations and intends to defend vigorously.
Hartford Stock HLS Fund
Notes to Financial Statements – (continued)
June 30, 2014 (Unaudited)
(000’s Omitted)
In March 2014, the plaintiffs filed a new complaint that added as new plaintiffs The Hartford Floating Rate Fund and The Hartford Small Company Fund and named as a defendant Hartford Funds Management Company, LLC (the “Investment Manager”), which assumed the role as investment adviser to the funds as of January 2013. The Investment Manager and HIFSCO dispute the allegations and intend to defend vigorously.
This action concerns the activities of HIFSCO in its capacity as investment manager and principal underwriter to the Hartford retail mutual funds and does not concern HIFSCO’s activities in its capacity as principal underwriter to the HLS funds. For this reason, no accrual for litigation relating to this matter has been recorded in the financial statements of the Fund.
Hartford Stock HLS Fund
Financial Highlights
| | | ─ Selected Per-Share Data(A) ─ | | | ─ Ratios and Supplemental Data ─ | |
Class | | Net Asset
Value at
Beginning
of Period | | | Net
Investment
Income
(Loss) | | | Net
Realized
and
Unrealized
Gain (Loss)
on
Investments | | | Total from
Investment
Operations | | | Dividends
from Net
Investment
Income | | | Distributions
from
Realized
Capital
Gains | | | Total
Dividends
and
Distributions | | | Net
Asset
Value at
End of
Period | | | Total
Return(B) | | | Net Assets
at End of
Period
(000s) | | | Ratio of
Expenses
to
Average
Net
Assets
Before
Adjust-
ments(C) | | | Ratio of
Expenses
to
Average
Net
Assets
After
Adjust-
ments(C) | | | Ratio of
Net
Investment
Income
(Loss) to
Average
Net Assets | |
| |
| For the Six-Month Period Ended June 30, 2014 (Unaudited) |
| IA | | $ | 58.07 | | | $ | 0.53 | | | $ | 1.80 | | | $ | 2.33 | | | $ | – | | | $ | – | | | $ | – | | | $ | 60.40 | | | | 4.01 | %(D) | | $ | 1,585,330 | | | | 0.51 | %(E) | | | 0.51 | %(E) | | | 1.85 | %(E) |
| IB | | | 58.04 | | | | 0.46 | | | | 1.79 | | | | 2.25 | | | | – | | | | – | | | | – | | | | 60.29 | | | | 3.88 | (D) | | | 190,282 | | | | 0.76 | (E) | | | 0.76 | (E) | | | 1.60 | (E) |
| | | | | | | | | | | | | | | | | | | | | | | | | | | | | | | | | | | | | | | | | | | | | | | | | | | | | |
| For the Year Ended December 31, 2013 |
| IA | | $ | 44.73 | | | $ | 0.99 | | | $ | 13.41 | | | $ | 14.40 | | | $ | (1.06 | ) | | $ | – | | | $ | (1.06 | ) | | $ | 58.07 | | | | 32.25 | % | | $ | 1,667,278 | | | | 0.51 | % | | | 0.51 | % | | | 1.89 | % |
| IB | | | 44.71 | | | | 0.85 | | | | 13.40 | | | | 14.25 | | | | (0.92 | ) | | | – | | | | (0.92 | ) | | | 58.04 | | | | 31.92 | | | | 204,437 | | | | 0.76 | | | | 0.76 | | | | 1.64 | |
| | | | | | | | | | | | | | | | | | | | | | | | | | | | | | | | | | | | | | | | | | | | | | | | | | | | | |
| For the Year Ended December 31, 2012 (F) |
| IA | | $ | 39.95 | | | $ | 0.91 | | | $ | 4.83 | | | $ | 5.74 | | | $ | (0.96 | ) | | $ | – | | | $ | (0.96 | ) | | $ | 44.73 | | | | 14.38 | % | | $ | 1,532,116 | | | | 0.51 | % | | | 0.51 | % | | | 1.86 | % |
| IB | | | 39.92 | | | | 0.82 | | | | 4.81 | | | | 5.63 | | | | (0.84 | ) | | | – | | | | (0.84 | ) | | | 44.71 | | | | 14.10 | | | | 200,153 | | | | 0.76 | | | | 0.76 | | | | 1.61 | |
| | | | | | | | | | | | | | | | | | | | | | | | | | | | | | | | | | | | | | | | | | | | | | | | | | | | | |
| For the Year Ended December 31, 2011 (F) |
| IA | | $ | 40.98 | | | $ | 0.62 | | | $ | (1.07 | ) | | $ | (0.45 | ) | | $ | (0.58 | ) | | $ | – | | | $ | (0.58 | ) | | $ | 39.95 | | | | (1.09 | )% | | $ | 1,614,788 | | | | 0.50 | % | | | 0.50 | % | | | 1.37 | % |
| IB | | | 40.94 | | | | 0.51 | | | | (1.06 | ) | | | (0.55 | ) | | | (0.47 | ) | | | – | | | | (0.47 | ) | | | 39.92 | | | | (1.34 | ) | | | 231,377 | | | | 0.75 | | | | 0.75 | | | | 1.11 | |
| | | | | | | | | | | | | | | | | | | | | | | | | | | | | | | | | | | | | | | | | | | | | | | | | | | | | |
| For the Year Ended December 31, 2010 (F) |
| IA | | $ | 36.10 | | | $ | 0.44 | | | $ | 4.89 | | | $ | 5.33 | | | $ | (0.45 | ) | | $ | – | | | $ | (0.45 | ) | | $ | 40.98 | | | | 14.80 | % | | $ | 1,980,502 | | | | 0.50 | % | | | 0.50 | % | | | 1.09 | % |
| IB | | | 36.06 | | | | 0.35 | | | | 4.88 | | | | 5.23 | | | | (0.35 | ) | | | – | | | | (0.35 | ) | | | 40.94 | | | | 14.51 | | | | 300,279 | | | | 0.75 | | | | 0.75 | | | | 0.84 | |
| | | | | | | | | | | | | | | | | | | | | | | | | | | | | | | | | | | | | | | | | | | | | | | | | | | | | |
| For the Year Ended December 31, 2009 (F) |
| IA | | $ | 25.86 | | | $ | 0.48 | | | $ | 10.25 | | | $ | 10.73 | | | $ | (0.49 | ) | | $ | – | | | $ | (0.49 | ) | | $ | 36.10 | | | | 41.54 | %(G) | | $ | 2,055,227 | | | | 0.51 | % | | | 0.51 | % | | | 1.43 | % |
| IB | | | 25.84 | | | | 0.39 | | | | 10.24 | | | | 10.63 | | | | (0.41 | ) | | | – | | | | (0.41 | ) | | | 36.06 | | | | 41.18 | (G) | | | 328,275 | | | | 0.76 | | | | 0.76 | | | | 1.19 | |
| (A) | Information presented relates to a share outstanding throughout the indicated period. Net investment income (loss) per share amounts are calculated based on average shares outstanding unless otherwise noted. |
| (B) | The figures do not include sales charges or other fees which may be applied at the variable life insurance, variable annuity or qualified retirement plan product level. Any such additional sales charges or other fees would lower the Fund's performance. |
| (C) | Adjustments include waivers and reimbursements, if applicable. Ratios do not include fees paid indirectly (see Expenses in the accompanying Notes to Financial Statements). |
| (F) | Net investment income (loss) per share amounts have been calculated using the SEC method. |
| (G) | Total return without the inclusion of the Payment from (to) Affiliate can be found in Expenses in the accompanying Notes to Financial Statements. |
| | | Portfolio Turnover
Rate for
All Share Classes | |
| For the Six-Month Period Ended June 30, 2014 (Unaudited) | | | 14% | |
| For the Year Ended December 31, 2013 | | | 27 | |
| For the Year Ended December 31, 2012 | | | 82 | |
| For the Year Ended December 31, 2011 | | | 43 | |
| For the Year Ended December 31, 2010 | | | 77 | |
| For the Year Ended December 31, 2009 | | | 84 | |
Hartford Stock HLS Fund
Directors and Officers (Unaudited)
The Board of Directors of the Company (the "Directors") appoints officers who are responsible for the day-to-day operations of the Fund and who execute policies formulated by the Directors. Each Director serves until his or her death, resignation, or retirement or until the next annual meeting of shareholders is held or until his or her successor is elected and qualifies.
Directors and officers who are employed by or who have a financial interest in The Hartford are considered “interested” persons of the Fund pursuant to the 1940 Act. Each officer and two of the Company's Directors, as noted in the chart below, are “interested” persons of the Fund. Each Director serves as a director for The Hartford Mutual Funds, Inc., The Hartford Mutual Funds II, Inc., Hartford Series Fund, Inc., and Hartford HLS Series Fund II, Inc., and as a trustee for The Hartford Alternative Strategies Fund, which, as of June 30, 2014, collectively consist of 78 funds. Correspondence may be sent to Directors and officers c/o Hartford Funds, 5 Radnor Corporate Center, Suite 300, 100 Matsonford Road, Radnor, Pennsylvania 19087, except that correspondence to Mr. Annoni, Mr. Dressen and Ms. Quade may be sent to 500 Bielenberg Drive, Suite 500, Woodbury, Minnesota 55125.
The table below sets forth, for each Director and officer, his or her name, year of birth, current position with the Company and date first elected or appointed to Hartford Series Fund, Inc. ("HSF") and Hartford HLS Series Fund II, Inc. ("HSF2"), principal occupation, and, for Directors, other directorships held. The Fund’s Statement of Additional Information contains further information on the Directors and is available free of charge by calling 1-888-843-7824 or writing to: Hartford HLS Funds, c/o Hartford Life Insurance Company/Hartford Life and Annuity Insurance Company, P.O. Box 14293, Lexington, KY 40512-4293 for variable annuity and variable life insurance separate accounts of Hartford Life Insurance Company and its affiliates; Hartford Funds, P.O. Box 55022, Boston, MA 02205-5022 for all shareholders except variable annuity and variable life insurance separate accounts of Hartford Life Insurance Company and its affiliates.
Information on the aggregate remuneration paid to the directors of the Company can be found in the Statement of Operations herein. The Fund pays to The Hartford a portion of the Chief Compliance Officer’s compensation, but does not pay salaries or compensation to any of its other officers or Directors who are employed by The Hartford.
Non-Interested Directors
Lynn S. Birdsong (1946) Director since 2003, Co-Chairman of the Investment Committee since 2005
Mr. Birdsong is a private investor. Mr. Birdsong currently serves as a Director of the Sovereign High Yield Investment Company (April 2010 to current). Mr. Birdsong currently serves as an Independent Director of Nomura Partners Funds, Inc. (formerly, The Japan Fund) (April 2003 to current). From 2003 to March 2005, Mr. Birdsong was an Independent Director of the Atlantic Whitehall Funds. From 1979 to 2002, Mr. Birdsong was a Managing Director of Zurich Scudder Investments, an investment management firm. During his employment with Scudder, Mr. Birdsong was an Interested Director of The Japan Fund. From January 1981 through December 2013, Mr. Birdsong was a partner in Birdsong Company, an advertising specialty firm.
Robert M. Gavin, Jr. (1940) Director since 2002 (HSF) and 1986 (HSF2), Chairman of the Board since 2004
Dr. Gavin is an educational consultant. Prior to September 1, 2001, he was President of Cranbrook Education Community and prior to July 1996, he was President of Macalester College, St. Paul, Minnesota.
Duane E. Hill (1945) Director since 2001 (HSF) and 2002 (HSF2), Chairman of the Nominating Committee since 2003
Mr. Hill is a Partner of TSG Ventures L.P., a private equity investment company. Mr. Hill is a former partner of TSG Capital Group, a private equity investment firm that served as sponsor and lead investor in leveraged buyouts of middle market companies.
Sandra S. Jaffee (1941) Director since 2005
Ms. Jaffee is the founder and Chief Executive Officer of a private company, Homeworks Concierge, LLC, which provides residential property management services in Westchester County, New York (January 2012 to present). Ms. Jaffee served as Chairman (2008 to 2009) and Chief Executive Officer of Fortent (formerly Searchspace Group), a leading provider of compliance/regulatory technology to financial institutions from August 2005 to August 2009. From August 2004 to August 2005, Ms. Jaffee served as an Entrepreneur in Residence with Warburg Pincus, a private equity firm. Prior to joining Warburg Pincus, Ms. Jaffee served as Executive Vice President at Citigroup, from September 1995 to July 2004, where she was President and Chief Executive Officer of Citibank’s Global Securities Services (1995 to 2003). Ms. Jaffee currently serves as a member of the Board of Directors of Broadridge Financial Solutions as well as a Trustee of Muhlenberg College.
Hartford Stock HLS Fund
Directors and Officers (Unaudited) – (continued)
William P. Johnston (1944) Director since 2005, Chairman of the Compliance Committee since 2005
In June 2006, Mr. Johnston was appointed as Senior Advisor to The Carlyle Group, a global private equity and other alternative asset investment firm and currently serves as an Operating Executive. In July 2006, Mr. Johnston was elected to the Board of Directors of MultiPlan, Inc. and served as a Director (July 2006 to August 2010). In August 2007, Mr. Johnston was elected to the Board of Directors of LifeCare Holdings, Inc. and served as a Director (August 2007 to June 2013). In February 2008, Mr. Johnston was elected to the Board of Directors of HCR-ManorCare, Inc. In May 2006, Mr. Johnston was elected to the Supervisory Board of Fresenius Medical Care AG & Co. KGaA, after its acquisition of Renal Care Group, Inc. in March 2006. Mr. Johnston joined Renal Care Group in November 2002 as a member of the Board of Directors and served as Chairman of the Board from March 2003 through March 2006. From 2002 through 2013, Mr. Johnston served as a Board member of the Georgia O’Keefe Museum. From September 1987 to December 2002, Mr. Johnston was with Equitable Securities Corporation (and its successors, SunTrust Equitable Securities and SunTrust Robinson Humphrey) serving in various investment banking and managerial positions, including Managing Director and Head of Investment Banking, Chief Executive Officer and Vice Chairman.
Phillip O. Peterson (1944) Director since 2002 (HSF) and 2000 (HSF2), Chairman of the Audit Committee since 2002
Mr. Peterson is a mutual fund industry consultant. He was a partner of KPMG LLP (an accounting firm) until July 1999. Mr. Peterson joined William Blair Funds in February 2007 as a member of the Board of Trustees. From February 2012 to February 2014, Mr. Peterson served as a Trustee of Symetra Variable Mutual Funds. From January 2004 to April 2005, Mr. Peterson served as Independent President of the Strong Mutual Funds.
Lemma W. Senbet (1946) Director since 2005
Dr. Senbet is the William E. Mayer Chair Professor of Finance and Founding Director, Center for Financial Policy, at the University of Maryland, Robert H. Smith School of Business. He was chair of the Finance Department of the University of Maryland, Robert H. Smith School of Business from 1998 to 2006. Since June 2013, he has been on leave from the University to serve as Executive Director of African Economic Research Consortium which focuses on economic policy research and training. Previously, he was a chaired professor of finance at the University of Wisconsin-Madison. Also, he was a Director of the Fortis Funds from March 2000 to July 2002. Dr. Senbet served as Director of the American Finance Association and President of the Western Finance Association. In 2006, Dr. Senbet was inducted Fellow of Financial Management Association International for his career-long distinguished scholarship and professional service.
Interested Directors and Officers
James E. Davey (1964) Director since 2012, President and Chief Executive Officer since 2010
Mr. Davey serves as Executive Vice President of Hartford Life Insurance Company (“HLIC”) and The Hartford Financial Services Group, Inc. Additionally, Mr. Davey serves as Chairman of the Board, Manager and Senior Managing Director of Hartford Funds Distributors, LLC (“HFD”). He also currently serves as Director, Chairman of the Board, President and Senior Managing Director of Hartford Administrative Services Company (“HASCO”). Mr. Davey also serves as Manager, Chairman of the Board and Senior Managing Director for Hartford Funds Management Company, LLC (“HFMC”) and Director, Chairman of the Board and Senior Managing Director for Hartford Funds Management Group, Inc. ("HFMG"). Mr. Davey has served in various positions within The Hartford and its subsidiaries in connection with the operation of the Hartford Funds. Mr. Davey joined The Hartford in 2002.
Lowndes A. Smith (1939) Director since 1996 (HSF) and 2002 (HSF2), Co-Chairman of the Investment Committee since 2005
Mr. Smith served as Vice Chairman of The Hartford from February 1997 to January 2002, as President and Chief Executive Officer of Hartford Life, Inc. from February 1997 to January 2002, and as President and Chief Operating Officer of The Hartford Life Insurance Companies from January 1989 to January 2002. Mr. Smith serves as a Director of White Mountains Insurance Group Ltd. (October 2003 to current); One Beacon Insurance (October 2006 to current); Symetra Financial (August 2007 to current) and is a Managing Director of Whittington Gray Associates (January 2007 to current).
Other Officers
Mark A. Annoni (1964) Vice President, Controller and Treasurer since 2012
Mr. Annoni currently serves as the Assistant Vice President of HLIC (February 2004 to present) and Senior Vice President of HFMG (December 2013 to present). Mr. Annoni has served in various positions within The Hartford and its subsidiaries in connection with the operation of the Hartford Funds. Mr. Annoni joined The Hartford in 2001.
Hartford Stock HLS Fund
Directors and Officers (Unaudited) – (continued)
Michael R. Dressen (1963) AML Compliance Officer since 2011
Mr. Dressen currently serves as Assistant Vice President of HLIC. He also serves as Chief Compliance Officer and AML Compliance Officer of HASCO and as AML Officer of HFD. Mr. Dressen has served in various positions within The Hartford and its subsidiaries in connection with the operation of the Hartford Funds.
Edward P. Macdonald (1967) Vice President, Secretary and Chief Legal Officer since 2005
Mr. Macdonald currently serves as Assistant Secretary, Executive Vice President and Deputy General Counsel of HFD, HASCO, HFMC and HFMG. He also serves as Vice President of HLIC. Mr. Macdonald has served in various positions within The Hartford and its subsidiaries in connection with the operation of the Hartford Funds. Mr. Macdonald joined The Hartford in 2005.
Joseph G. Melcher (1973) Vice President and Chief Compliance Officer since 2013
Mr. Melcher currently serves as Executive Vice President of HFD, HFMG and HASCO. Mr. Melcher also currently serves as Executive Vice President and Chief Compliance Officer of HFMC. Mr. Melcher has served in various positions within The Hartford and its subsidiaries in connection with the operation of the Hartford Funds since joining The Hartford in 2012. Prior to joining The Hartford, Mr. Melcher worked at Touchstone Investments, a member of the Western & Southern Financial Group, where he held the position of Vice President and Chief Compliance Officer from 2010 through 2012 and Assistant Vice President, Compliance from 2005 to 2010.
Vernon J. Meyer (1964) Vice President since 2006
Mr. Meyer currently serves as Senior Vice President of HLIC. He also currently serves as Managing Director and Chief Investment Officer of HFMC and Managing Director of HFMG. Mr. Meyer has served in various positions within The Hartford and its subsidiaries in connection with the operation of the Hartford Funds. Mr. Meyer joined The Hartford in 2004.
Laura S. Quade (1969) Vice President since 2012
Ms. Quade currently serves as Vice President of HASCO, HFD and HFMG. She is the Head of Operations of HASCO and also serves as Director, Enterprise Operations of HLIC. Ms. Quade has served in various positions within The Hartford and its subsidiaries in connection with the operation of the Hartford Funds.
Martin A. Swanson (1962) Vice President since 2010
Mr. Swanson currently serves as Vice President of HLIC. Mr. Swanson also serves as Managing Director, Chief Marketing Officer and Principal of HFD and Managing Director of HFMG. Mr. Swanson has served in various positions within The Hartford and its subsidiaries in connection with the operation of the Hartford Funds.
HOW TO OBTAIN A COPY OF THE FUND’S PROXY VOTING POLICIES AND VOTING RECORDS (UNAUDITED)
A description of the policies and procedures that the Fund uses to determine how to vote proxies relating to portfolio securities and information about how the Fund voted proxies relating to portfolio securities during the most recent twelve-month period ended June 30 are available (1) without charge, upon request, by calling 888-843-7824 and (2) on the SEC’s website at http://www.sec.gov.
QUARTERLY PORTFOLIO HOLDINGS INFORMATION (UNAUDITED)
The Fund files a complete schedule of portfolio holdings with the SEC for the first and third quarters of each fiscal year on Form N-Q. The Fund’s Forms N-Q are available (1) without charge, upon request, by calling 888-843-7824 and (2) on the SEC’s website at http://www.sec.gov. The Form N-Q may be reviewed and copied at the SEC’s Public Reference Room in Washington, DC. Information on the operation of the Public Reference Room may be obtained by calling 1-800-SEC-0330.
Hartford Stock HLS Fund
Expense Example (Unaudited)
Your Fund's Expenses
As a shareholder of the Fund, you incur two types of costs: (1) transaction costs and (2) ongoing costs, including investment management fees, distribution and/or service (12b-1) fees, if any, and other fund expenses. This example is intended to help you understand your ongoing costs (in dollars) of investing in the Fund and to compare these costs with the ongoing costs of investing in other mutual funds. The example is based on an investment of $1,000 invested at the beginning of the period and held for the entire period of December 31, 2013 through June 30, 2014.
Actual Expenses
The first set of columns of the table below provides information about actual account values and actual expenses. You may use the information in this column, together with the amount you invested, to estimate the expenses that you paid over the period. Simply divide your account value by $1,000 (for example, an $8,600 account value divided by $1,000 = 8.6), then multiply the result by the number in the line under the heading entitled “Expenses Paid During Period” to estimate the expenses you paid on your account during this period.
Hypothetical Example for Comparison Purposes
The second set of columns of the table below provides information about hypothetical account values and hypothetical expenses based on the Fund's actual expense ratio and an assumed rate of return of 5% per year before expenses, which is not the Fund's actual return. The hypothetical account values and expenses may not be used to estimate the actual ending account balance or expenses you paid for the period. You may use this information to compare the ongoing costs of investing in the Fund and other funds. To do so, compare this 5% hypothetical example with the 5% hypothetical examples that appear in the shareholder reports of the other funds.
Please note that the expenses shown in the table are meant to highlight your ongoing costs only and do not reflect any transactional costs, such as sales charges (loads) and CDSC. Therefore, the second set of columns of the table is useful in comparing ongoing costs only, and will not help you determine the relative total costs of owning different funds. In addition, if these transactional costs were included, your costs would be higher. Expenses are equal to the Fund's annualized expense ratios multiplied by average account value over the period, multiplied by 181/365 (to reflect the one-half year period).
| | | Actual return | | | Hypothetical (5% return before expenses) | | | | | | | | | | |
| | | Beginning
Account Value
December 31,
2013 | | | Ending Account
Value
June 30, 2014 | | | Expenses paid
during the period
December 31, 2013
through
June 30, 2014 | | | Beginning
Account Value
December 31,
2013 | | | Ending Account
Value
June 30, 2014 | | | Expenses paid
during the period
December 31,
2013
through
June 30, 2014 | | | Annualized
expense
ratio | | | Days
in the
current
1/2
year | | | Days
in the
full
year | |
| Class IA | | $ | 1,000.00 | | | $ | 1,040.10 | | | $ | 2.58 | | | $ | 1,000.00 | | | $ | 1,022.27 | | | $ | 2.56 | | | | 0.51 | % | | | 181 | | | | 365 | |
| Class IB | | $ | 1,000.00 | | | $ | 1,038.80 | | | $ | 3.84 | | | $ | 1,000.00 | | | $ | 1,021.03 | | | $ | 3.81 | | | | 0.76 | | | | 181 | | | | 365 | |
Hartford Stock HLS Fund
Main Risks (Unaudited)
The main risks of investing in the Fund are described below.
Market, Selection and Strategy Risk: The Fund’s share price may fluctuate due to market risk and/or security selections that may underperform the market or relevant benchmarks. If the sub-adviser's investment strategy does not perform as expected, the Fund could underperform its peers or lose money. There is no guarantee the Fund will achieve its stated objective.
Foreign Investment Risk: Investments in foreign securities may be riskier than investments in U.S. securities. Potential risks include the risks of illiquidity, increased price volatility, less government regulation, less extensive and less frequent accounting and other reporting requirements, unfavorable changes in currency exchange rates, and economic and political disruptions.
THIS PRIVACY POLICY IS NOT PART OF THIS REPORT
Privacy Policy and Practices of The Hartford Financial Services Group, Inc. and its Affiliates
(herein called “we, our and us”)
This Privacy Policy applies to our United States Operations
We value your trust. We are committed to the responsible: a) management; b) use; and c) protection; of Personal Information. This notice describes how we collect, disclose, and protect Personal Information. We collect Personal Information to: a) service your Transactions with us; and b) support our business functions. We may obtain Personal Information from: a) You; b) your Transactions with us; and c) third parties such as a consumer-reporting agency. Based on the type of product or service You apply for or get from us, Personal Information such as: a) your name; b) your address; c) your income; d) your payment; or e) your credit history; may be gathered from sources such as applications, Transactions, and consumer reports. To serve You and service our business, we may share certain Personal Information. We will share Personal Information, only as allowed by law, with affiliates such as: a) our insurance companies; b) our employee agents; c) our brokerage firms; and d) our administrators. As allowed by law, we may share Personal Financial Information with our affiliates to: a) market our products; or b) market our services; to You without providing You with an option to prevent these disclosures. | | | We may also share Personal Information, only as allowed by law, with unaffiliated third parties including: a) independent agents; b) brokerage firms; c) insurance companies; d) administrators; and e) service providers; who help us serve You and service our business. When allowed by law, we may share certain Personal Financial Information with other unaffiliated third parties who assist us by performing services or functions such as: a) taking surveys; b) marketing our products or services; or c) offering financial products or services under a joint agreement between us and one or more financial institutions. We, and third parties we partner with, may track some of the pages You visit through the use of: a) cookies; b) pixel tagging; or c) other technologies; and currently do not process or comply with any web browser’s “do not track” signal or similar mechanism that indicates a request to disable online tracking of individual users who visit our websites or use our services. We will not sell or share your Personal Financial Information with anyone for purposes unrelated to our business functions without offering You the opportunity to: a) “opt-out;” or b) “opt-in;” as required by law. We only disclose Personal Health Information with: a) your proper written authorization; or b) as otherwise allowed or required by law. Our employees have access to Personal Information in the course of doing their jobs, such as: a) underwriting policies; b) paying claims; c) developing new products; or d) advising customers of our products and services. |
We use manual and electronic security procedures to maintain: a) the confidentiality; and b) the integrity of; Personal Information that we have. We use these procedures to guard against unauthorized access. Some techniques we use to protect Personal Information include: a) secured files; b) user authentication; c) encryption; d) firewall technology; and e) the use of detection software. We are responsible for and must: a) identify information to be protected; b) provide an adequate level of protection for that data; c) grant access to protected data only to those people who must use it in the performance of their job-related duties. Employees who violate our Privacy Policy will be subject to discipline, which may include ending their employment with us. At the start of our business relationship, we will give You a copy of our current Privacy Policy. We will also give You a copy of our current Privacy Policy once a year if You maintain a continuing business relationship with us. We will continue to follow our Privacy Policy regarding Personal Information even when a business relationship no longer exists between us. | | | As used in this Privacy Notice: Application means your request for our product or service. Personal Financial Information means financial information such as: a) credit history; b) income; c) financial benefits; or d) policy or claim information. Personal Health Information means health information such as: a) your medical records; or b) information about your illness, disability or injury. Personal Information means information that identifies You personally and is not otherwise available to the public. It includes: a) Personal Financial Information; and b) Personal Health Information. Transaction means your business dealings with us, such as: a) your Application; b) your request for us to pay a claim; and c) your request for us to take an action on your account. You means an individual who has given us Personal Information in conjunction with: a) asking about; b) applying for; or c) obtaining; a financial product or service from us if the product or service is used mainly for personal, family, or household purposes. |
This Privacy Policy is being provided on behalf of the following affiliates of The Hartford Financial Services Group, Inc.:
1stAGChoice, Inc.; Access CoverageCorp, Inc.; Access CoverageCorp Technologies, Inc.; American Maturity Life Insurance Company; Archway 60 R, LLC; Business Management Group, Inc.; Champlain Life Reinsurance Company; DMS R, LLC; Eloy R, LLC; Ersatz Corporation; First State Insurance Company; Hartford Accident and Indemnity Company; Hartford Administrative Services Company; Hartford Casualty General Agency, Inc.; Hartford Casualty Insurance Company; Hartford-Comprehensive Employee Benefit Service Company; Hartford Equity Sales Company, Inc.; Hartford Fire General Agency, Inc.; Hartford Fire Insurance Company; Hartford Funds Management Company, LLC; Hartford Funds Management Group, Inc.; Hartford HLS Series Fund II, Inc.; Hartford Insurance Company of Illinois; Hartford Insurance Company of the Midwest; Hartford Insurance Company of the Southeast; Hartford Integrated Technologies, Inc.; Hartford International Life Reassurance Corporation; Hartford Funds Distributors, LLC; Hartford Investment Management Company; Hartford Life and Accident Insurance Company; Hartford Life and Annuity Insurance Company; Hartford Life Insurance Company; Hartford Life Private Placement, LLC; Hartford Lloyd’s Corporation; Hartford Lloyd’s Insurance Company; Hartford Mezzanine Investors I, LLC; Hartford Residual Market, L.C.C.; Hartford Retirement Services, LLC; Hartford Securities Distribution Company, Inc.; Hartford Series Fund, Inc.; Hartford Specialty Insurance Services of Texas, LLC; Hartford Strategic Investments, LLC; Hartford Underwriters Insurance Company; Hartford Technology Services Company, L.L.C.; Hartford of Texas General Agency, Inc.; Hartford Underwriters General Agency, Inc.; HARTRE Company, L.C.C.; HL Investment Advisors, LLC; HLA LLC; Horizon Management Group, LLC; HRA Brokerage Services, Inc.; Lanidex Class B, LLC; M-CAP Insurance Agency, LLC; New England Insurance Company; New England Reinsurance Corporation; Nutmeg Insurance Agency, Inc.; Nutmeg Insurance Company; Pacific Insurance Company, Limited; Planco, LLC: Property and Casualty Insurance Company of Hartford; Revere R, LLC; RVR R, LLC; Sentinel Insurance Company, Ltd.; Sunstone R, LLC; Symphony R, LLC; The Evergreen Group Incorporated; The Hartford Alternative Strategies Fund; The Hartford Mutual Funds, Inc.; The Hartford Mutual Funds II, Inc.; Trumbull Flood Management, L.L.C.; Trumbull Insurance Company; Twin City Fire Insurance Company; White River Life Reinsurance Company.
HPP Revised January 2014
HARTFORD HLS FUNDS
P.O. Box 14293
Lexington, KY 40512-4293
HARTFORDFUNDS
hartfordfunds.com
Hartford Series Fund, Inc. is underwritten and distributed by Hartford Funds Distributors, LLC.
Hartford Series Fund, Inc. inception dates range from 1977 to date. Hartford Series Fund, Inc. is not a subsidiary of The Hartford Financial Services Group, Inc. ("The Hartford") but is underwritten, distributed by and advised by subsidiaries of The Hartford. Investments in Hartford Series Fund, Inc. are not guaranteed by The Hartford or any other entity.
This report is submitted for the general information of the shareholders of the Funds. It is not authorized for distribution unless preceded or accompanied by a current prospectus for the Funds.
Investors should carefully consider the investment objectives, risks, charges, and expenses of Hartford Funds before investing. This and other information can be found in the prospectus, which can be obtained by calling 800-862-6668 (or 800-279-1541 for institutional investors). Investors should read them carefully before they invest.
HLSSAR-S14 8-14 113554-3 Printed in U.S.A.
HARTFORDFUNDS
| | HARTFORD TOTAL RETURN BOND HLS FUND 2014 Semi Annual Report |
A MESSAGE FROM THE PRESIDENT
Dear Fellow Shareholders:
Thank you for investing in Hartford HLS Funds.
Market Review
U.S. equities (as represented by the S&P 500 Index) started 2014 on a shaky note after posting a strong 32.39% gain in 2013. However, stocks managed to maintain modest gains throughout the first quarter and returned to a generally steady climb in the second quarter. Through June 30, 2014, the S&P 500 Index advanced 7.14%. It appears that much of the market volatility during the year can be attributed to heightened international tensions. In particular, the Russian annexation of Ukraine’s Crimean Peninsula and increased tensions in Iraq were cause for concern.
On the domestic front, subdued economic and employment reports slowed stocks’ progress early in the new year, although much of the weakness seemed to dissipate as the year’s unusually harsh winter subsided. And despite initial reactions to the idea, when the U.S. Federal Reserve began tapering its quantitative-easing program in January by reducing its bond purchases by $10 billion a month, the markets took the policy change in stride.
Despite a rough start to the year for financial markets, the global economy seems to be settling into a slow-but-steady recovery. While first-quarter U.S. gross domestic product (GDP) growth was disappointing at -2.9%, U.S. consumer spending, which is a significant contributor toward economic growth, rose by 3% during the quarter. It appears that Europe is also maintaining its own recovery: The International Monetary Fund projects that Europe’s full-year GDP growth may breach positive territory for the first time since 2011.
The impact of international affairs on stocks so far this year is an important reminder to stay informed about both domestic and international economic developments, and any effects they may have on your individual investment goals. If you have not already had a mid-year review of your portfolio, it may be a good time to meet with your financial advisor to review your progress and make certain your investments are prepared for all market environments:
| • | Is your portfolio properly diversified with an appropriate mix of stocks and bonds? |
| • | Is your portfolio positioned to take advantage of the global economic recovery, with investments in both domestic and international holdings? |
| • | Are your investments still in line with your risk tolerance and investment time horizon? |
Your financial professional can help you choose options within our fund family to help you reach your investment goals with confidence.
Thank you again for investing with Hartford HLS Funds.
James Davey
President
Hartford HLS Funds
1 The S&P 500 Index is a market capitalization-weighted price index composed of 500 widely held common stocks.
2The Dow Jones Industrial Average is an unmanaged, price-weighted index of 30 of the largest, most widely held stocks traded on the New York Stock Exchange.
Hartford Total Return Bond HLS Fund
Table of Contents
This report is prepared for the general information of contract owners and qualified retirement plan participants. It is not an offer of contracts or of qualified retirement plans. It should not be used in connection with any offer, except in conjunction with the appropriate product prospectus which contains all pertinent information including the applicable sales, administrative and other charges.
The views expressed in the Fund’s Manager Discussion under “Why did the Fund perform this way?” and “What is the outlook?” are views of the Fund’s sub-adviser and portfolio management team through the end of the period and are subject to change based on market and other conditions. The Fund’s Manager Discussion is for informational purposes only and does not represent an offer, recommendation or solicitation to buy, hold or sell any security. The specific securities identified and described, if any, do not represent all of the securities purchased or sold and you should not assume that investments in the securities identified and discussed will be profitable.
Hartford Total Return Bond HLS Fund inception 08/31/1977
(sub-advised by Wellington Management Company, LLP)
Investment objective – The Fund seeks a competitive total return, with income as a secondary objective.
Performance Overview 6/30/04 - 6/30/14

The chart above represents the hypothetical growth of a $10,000 investment in Class IA. Growth results in classes other than Class IA will vary from what is seen above due to differences in the expenses charged to those share classes.
| Average Annual Total Returns (as of 6/30/14) (1) (2) |
| | | 6 Month† | | | 1 Year | | | 5 Years | | | 10 Years | |
| Total Return Bond IA | | | 4.85% | | | | 6.60% | | | | 6.57% | | | | 4.80% | |
| Total Return Bond IB | | | 4.79% | | | | 6.35% | | | | 6.31% | | | | 4.54% | |
| Barclays U.S. Aggregate Bond Index | | | 3.93% | | | | 4.37% | | | | 4.85% | | | | 4.93% | |
PERFORMANCE DATA QUOTED REPRESENTS PAST PERFORMANCE AND DOES NOT GUARANTEE FUTURE RESULTS. The investment return and principal value of the investment will fluctuate so that investors’ shares, when redeemed, may be worth more or less than their original cost. Current performance may be lower or higher than the performance data quoted. To obtain performance data current to the most recent month-end, please visit our website www.hartfordfunds.com.
Total returns presented above were calculated using the Fund’s net asset value available to shareholders for sale or redemption of Fund shares on June 30, 2014, which may exclude investment transactions as of this date. All share class returns assume the reinvestment of all distributions at net asset value and the deduction of all fund expenses.
Performance information includes performance under the Fund’s previous sub-adviser, Hartford Investment Management Company. As of March 5, 2012, Hartford Investment Management Company no longer served as the sub-adviser to the Fund.
Barclays U.S. Aggregate Bond Index is an unmanaged index and is composed of securities from the Barclays Government/Credit Bond Index, Mortgage-Backed Securities Index, Asset-Backed Securities Index and Commercial Mortgage-Backed Securities Index.
The index is unmanaged, and its results include reinvested dividends and/or distributions, but do not reflect the effect of sales charges, commissions, expenses or taxes.
You cannot invest directly in an index.
As shown in the Fund's current prospectus dated May 1, 2014, the total annual operating expense ratios for Class IA and Class IB were 0.50% and 0.75%, respectively. Actual expenses may be higher. Please see the accompanying Financial Highlights for expense ratios for the six-month period ended June 30, 2014.
The chart and table do not reflect the deductions of taxes, sales charges or other fees which may be applied at the variable life insurance, variable annuity or qualified retirement plan product level. Any such additional sales charges or other fees or expenses would lower the contract’s or plan’s performance.
All investments are subject to risk including the possible loss of principal. For a discussion of the Fund’s risks, please see the Main Risks section of this report. For more detailed information on the risks associated with an investment in the Fund, please see the prospectus.
| Hartford Total Return Bond HLS Fund |
| Manager Discussion |
| June 30, 2014 (Unaudited) |
| Portfolio Managers | | |
| Joseph F. Marvan, CFA | Lucius T. Hill III | Campe Goodman, CFA |
Senior Vice President and Fixed Income Portfolio Manager | Senior Vice President and Fixed Income Portfolio Manager | Senior Vice President and Fixed Income Portfolio Manager |
|
How did the Fund perform?
The Class IA shares of the Hartford Total Return Bond HLS Fund returned 4.85% for the six-month period ended June 30, 2014, outperforming the Fund’s benchmark, the Barclays U.S. Aggregate Bond Index, which returned 3.93% for the same period. The Fund also outperformed the 4.05% average return of the Lipper Intermediate Investment Grade Debt Funds peer group, a group of funds with investment strategies similar to those of the Fund.
Why did the Fund perform this way?
Global fixed income markets gained during the period as expectations of prolonged easy monetary policy by major central banks and an improving, albeit below-trend, macroeconomic environment suppressed volatility. Early in the period, emerging markets dominated headlines as economic and political developments sparked risk aversion across global markets, pushing bond prices higher and yields lower amid a flight to quality. Meanwhile, central bank policies diverged. The U.S. Federal Reserve began to wind down its quantitative easing program and the Bank of England started to prepare for interest rate rises. In contrast, the European Central Bank (ECB) announced a host of stimulus measures and the Bank of Japan maintained its easy monetary policy framework. European government bond yields fell sharply as the ECB loosened monetary policy further. In the U.S. and U.K., the Treasury curve flattened as markets braced themselves for the end of quantitative easing in these economies.
Globally, credit spread sectors posted positive absolute returns and outperformed duration-equivalent government bonds as credit spreads tightened. Most currencies appreciated versus the U.S. dollar with the notable exception of European currencies, which declined following the ECB’s easing measures.
The primary drivers of the Fund’s outperformance stemmed from its out-of-benchmark allocation to non-agency Mortgage Backed Securities (MBS), positioning within agency MBS, and an overweight to Commercial Mortgage Backed Securities (CMBS). The Fund’s security selection within investment grade corporates, particularly an overweight to Financials, also contributed significantly to outperformance during the period. In addition, exposure to bank loans and U.S. TIPS was favorable for relative results. The Fund’s allocation to non-dollar denominated debt, via currency forwards, futures, and options, contributed positively to performance during the period. On the other hand, the Fund’s high yield positioning detracted from relative performance; positive results from an allocation to BB rated high yield bonds were more than offset by the negative impact of high yield credit default swap index positions, which were used as a source of liquidity and to manage overall portfolio risk. Duration and yield curve positioning also detracted slightly from relative performance. Derivatives are also used to manage the duration positioning of the Fund.
What is the outlook?
We maintain a moderately procyclical risk posture as we see positive economic momentum in the U.S. heading into the second half of 2014.
We expect moderately stronger U.S. growth in the second half of 2014, underpinned by easing fiscal policy restraints and recovery in investment spending. We believe corporate and personal balance sheets are as strong as they have been in years. Although valuations in many fixed income sectors have risen closer to what we view as fair value, we believe easy monetary policy and positive economic growth will bode well for credit spreads.
We ended the period continuing to favor most credit sectors. This view is expressed mainly through allocations to BB rated high yield bonds and bank loans and an overweight to U.S. financials within investment-grade credit. Non-agency residential MBS still appear attractive to us against the backdrop of what appears to be an improving housing market. We ended the period with a neutral view on agency MBS as we believe they are slightly overvalued. Additionally, we continue to have an overweight to CMBS, and we favor high quality collateralized loan obligations (CLOs) due to what we view as compelling valuations.
After the first quarter set-back, we expect economic growth to pick up for the remainder of 2014. We also believe that inflation will rise from current levels. Therefore, we ended the period with a short duration bias.
| Hartford Total Return Bond HLS Fund |
| Manager Discussion – (continued) |
| June 30, 2014 (Unaudited) |
| Diversification by Security Type |
| as of June 30, 2014 |
| Category | | Percentage of
Net Assets | |
| Equity Securities |
| Preferred Stocks | | | 0.1 | % |
| Total | | | 0.1 | % |
| Fixed Income Securities |
| Asset & Commercial Mortgage Backed Securities | | | 28.5 | % |
| Corporate Bonds | | | 29.3 | |
| Foreign Government Obligations | | | 2.7 | |
| Municipal Bonds | | | 1.3 | |
| Senior Floating Rate Interests | | | 6.2 | |
| U.S. Government Agencies | | | 40.5 | |
| U.S. Government Securities | | | 19.4 | |
| Total | | | 127.9 | % |
| Short-Term Investments | | | 2.2 | % |
| Purchased Options | | | 0.4 | |
| Other Assets and Liabilities | | | (30.6 | ) |
| Total | | | 100.0 | % |
|
| Credit Exposure |
| as of June 30, 2014 |
| Credit Rating * | | Percentage of
Net Assets | |
| Aaa / AAA | | | 55.7 | |
| Aa / AA | | | 25.3 | |
| A | | | 6.8 | |
| Baa / BBB | | | 20.9 | |
| Ba / BB | | | 7.5 | |
| B | | | 4.3 | |
| Caa / CCC or Lower | | | 6.4 | |
| Not Rated | | | 1.0 | |
| Non-Debt Securities and Other Short-Term Instruments | | | 2.7 | |
| Other Assets and Liabilities | | | (30.6 | ) |
| Total | | | 100.0 | % |
| * | Credit exposure is the long-term credit ratings for the Fund's holdings, as of the date noted, as provided by Standard and Poor's (S&P) or Moody's Investors Service and typically range from AAA/Aaa (highest) to C/D (lowest). Presentation of S&P and Moody's credit ratings in this report have been selected for several reasons, including access to information and materials provided by S&P and Moody's, as well as the Fund's consideration of industry practice. If Moody's and S&P assign different ratings, the lower rating is used. Fixed income securities that are not rated by either agency are listed as "Not Rated." Ratings do not apply to the Fund itself or to Fund shares. Ratings may change. |
| Hartford Total Return Bond HLS Fund |
| Schedule of Investments |
| June 30, 2014 (Unaudited) |
| (000’s Omitted) |
| Shares or Principal Amount ╬ | | Market Value ╪ | |
Asset and Commercial Mortgage Backed Securities - 28.5% | | | |
| Finance and Insurance - 28.5% | | | | |
| | | | | Captive Auto Finance - 1.2% | | | | |
| | | | | Ally Automotive Receivables Trust | | | | |
| $ | 5,675 | | | 3.38%, 09/15/2017 ■ | | $ | 5,759 | |
| | | | | CPS Automotive Trust | | | | |
| | 2,871 | | | 1.54%, 07/16/2018 ■ | | | 2,885 | |
| | 1,865 | | | 1.82%, 12/16/2019 ■ | | | 1,881 | |
| | 347 | | | 5.01%, 06/17/2019 ■ | | | 358 | |
| | | | | Credit Acceptance Automotive Loan Trust | | | | |
| | 5,325 | | | 1.21%, 10/15/2020 ■ | | | 5,338 | |
| | 4,845 | | | 1.55%, 10/15/2021 ■ | | | 4,863 | |
| | 1,860 | | | 2.21%, 09/15/2020 ■ | | | 1,885 | |
| | 5,115 | | | 3.12%, 03/16/2020 ■ | | | 5,208 | |
| | | | | Ford Credit Automotive Owner Trust | | | | |
| | 3,680 | | | 3.21%, 07/15/2017 | | | 3,770 | |
| | | | | Ford Credit Floorplan Master Owner Trust | | | | |
| | 1,620 | | | 1.40%, 02/15/2019 | | | 1,619 | |
| | | | | Prestige Automotive Receivables Trust | | | | |
| | 3,855 | | | 2.49%, 04/16/2018 ■ | | | 3,930 | |
| | | | | Santander Drive Automotive Receivables Trust | | | | |
| | 3,456 | | | 3.89%, 07/17/2017 | | | 3,484 | |
| | | | | | | | 40,980 | |
| | | | | Captive Retail Finance - 0.3% | | | | |
| | | | | CNH Equipment Trust | | | | |
| | 3,075 | | | 2.97%, 05/15/2017 | | | 3,159 | |
| | | | | Springleaf Funding Trust | | | | |
| | 8,435 | | | 2.41%, 12/15/2022 ■ | | | 8,450 | |
| | | | | | | | 11,609 | |
| | | | | Consumer Lending - 0.1% | | | | |
| | | | | Atlas Senior Loan Fund Ltd. | | | | |
| | 4,200 | | | 1.81%, 07/16/2026 ■Δ | | | 4,200 | |
| | | | | | | | | |
| | | | | Other Financial Investment Activities - 2.8% | | | | |
| | | | | American Money Management Corp | | | | |
| | 9,180 | | | 1.70%, 07/27/2026 ■○☼ | | | 9,161 | |
| | | | | Apidos CLO | | | | |
| | 6,015 | | | 1.68%, 01/19/2025 ■Δ | | | 6,010 | |
| | 10,915 | | | 1.71%, 04/17/2026 ■‡Δ | | | 10,904 | |
| | | | | Avalon IV Capital Ltd. | | | | |
| | 3,980 | | | 2.08%, 04/17/2023 ■Δ | | | 4,005 | |
| | | | | ING Investment Management CLO Ltd. | | | | |
| | 5,215 | | | 1.43%, 03/14/2022 ■Δ | | | 5,179 | |
| | 10,895 | | | 1.74%, 04/18/2026 ■Δ | | | 10,869 | |
| | 2,335 | | | 2.08%, 03/14/2022 ■Δ | | | 2,330 | |
| | | | | Magnetite CLO Ltd. | | | | |
| | 8,310 | | | 1.71%, 07/25/2026 ■○☼ | | | 8,306 | |
| | 6,540 | | | 1.71%, 04/15/2026 ■Δ | | | 6,533 | |
| | 6,695 | | | 2.23%, 07/25/2026 ■○☼ | | | 6,695 | |
| | | | | Neuberger Berman CLO XIV Ltd. | | | | |
| | 8,335 | | | 1.74%, 03/01/2026 ■‡Δ | | | 8,335 | |
| | | | | Neuberger Berman CLO XVI Ltd. | | | | |
| | 8,265 | | | 1.70%, 08/04/2025 ■○☼ | | | 8,265 | |
| | | | | Seneca Park CLO Ltd. | | | | |
| | 7,360 | | | 1.70%, 07/17/2026 ■Δ | | | 7,356 | |
| | | | | Voya CLO Ltd. | | | | |
| | 2,915 | | | 1.68%, 07/17/2026 ■Δ | | | 2,908 | |
| | | | | | | | 96,856 | |
| | | | | Real Estate Credit (Mortgage Banking) - 23.5% | | | | |
| | | | | American Home Mortgage Assets Trust | | | | |
| | 2,415 | | | 1.06%, 10/25/2046 Δ | | | 1,777 | |
| | | | | Ares CLO Ltd. | | | | |
| 9,030 | | | 1.08%, 04/20/2023 ■Δ | | | 8,952 | |
| | 10,350 | | | 1.73%, 04/17/2026 ■Δ | | | 10,350 | |
| | | | | Aventura Mall Trust | | | | |
| | 4,465 | | | 3.74%, 12/05/2032 ■‡Δ | | | 4,736 | |
| | | | | Avery Point CLO Ltd. | | | | |
| | 10,050 | | | 1.75%, 04/25/2026 ■Δ | | | 10,050 | |
| | | | | Babson CLO Ltd. | | | | |
| | 2,330 | | | 1.72%, 07/12/2025 ■Δ | | | 2,329 | |
| | | | | Banc of America Commercial Mortgage, Inc. | | | | |
| | 4,790 | | | 5.18%, 09/10/2047 Δ | | | 5,007 | |
| | 11,725 | | | 5.27%, 11/10/2042 Δ | | | 11,937 | |
| | | | | Banc of America Funding Corp. | | | | |
| | 853 | | | 0.38%, 02/20/2047 Δ | | | 733 | |
| | 6,811 | | | 0.45%, 05/20/2047 ‡Δ | | | 5,668 | |
| | 8,585 | | | 5.77%, 05/25/2037 | | | 7,302 | |
| | 378 | | | 5.85%, 01/25/2037 | | | 305 | |
| | | | | BB-UBS Trust | | | | |
| | 2,790 | | | 3.43%, 11/05/2036 ■ | | | 2,766 | |
| | | | | BCAP LLC Trust | | | | |
| | 1,392 | | | 0.32%, 01/25/2037 Δ | | | 1,050 | |
| | 3,687 | | | 0.33%, 03/25/2037 Δ | | | 3,006 | |
| | | | | Bear Stearns Adjustable Rate Mortgage Trust | | | | |
| | 5,255 | | | 2.26%, 08/25/2035 ‡Δ | | | 5,332 | |
| | 8,299 | | | 2.41%, 10/25/2035 ‡Δ | | | 8,224 | |
| | | | | Bear Stearns Alt-A Trust | | | | |
| | 776 | | | 0.53%, 05/25/2036 Δ | | | 566 | |
| | | | | Bear Stearns Commercial Mortgage Securities, Inc. | | | | |
| | 1,105 | | | 5.29%, 10/12/2042 Δ | | | 1,092 | |
| | 5,790 | | | 5.41%, 12/11/2040 | | | 6,023 | |
| | 2,010 | | | 5.47%, 01/12/2045 | | | 2,214 | |
| | 3,018 | | | 5.69%, 06/11/2050 | | | 3,359 | |
| | | | | Cal Funding II Ltd. | | | | |
| | 1,704 | | | 3.47%, 10/25/2027 ■ | | | 1,724 | |
| | | | | Cent CLO L.P. | | | | |
| | 15,650 | | | 1.72%, 01/25/2026 - 07/27/2026 ■‡Δ | | | 15,636 | |
| | | | | CICF Funding Ltd. | | | | |
| | 11,095 | | | 1.66%, 04/18/2025 ■Δ | | | 11,067 | |
| | | | | Citigroup Commercial Mortgage Trust | | | | |
| | 3,480 | | | 3.09%, 04/10/2046 Δ | | | 3,462 | |
| | 6,380 | | | 3.86%, 05/10/2047 | | | 6,657 | |
| | 7,405 | | | 4.02%, 03/10/2047 | | | 7,833 | |
| | 8,595 | | | 4.13%, 11/10/2046 | | | 9,189 | |
| | 6,460 | | | 6.14%, 12/10/2049 ‡Δ | | | 7,233 | |
| | | | | Citigroup/Deutsche Bank Commercial Mortgage Trust | | | | |
| | 4,720 | | | 5.30%, 01/15/2046 Δ | | | 4,982 | |
| | 9,210 | | | 5.32%, 12/11/2049 | | | 10,020 | |
| | | | | Commercial Mortgage Loan Trust | | | | |
| | 7,660 | | | 6.01%, 12/10/2049 Δ | | | 8,439 | |
| | | | | Commercial Mortgage Pass-Through Certificates | | | | |
| | 27,149 | | | 2.42%, 07/10/2046 ■► | | | 1,390 | |
| | 650 | | | 2.85%, 10/15/2045 | | | 640 | |
| | 11,395 | | | 3.96%, 02/10/2047 - 03/10/2047 | | | 12,012 | |
| | 6,865 | | | 3.98%, 05/10/2047 | | | 7,238 | |
| | 3,555 | | | 4.02%, 07/10/2045 | | | 3,785 | |
| | 13,855 | | | 4.05%, 10/10/2046 - 04/10/2047 | | | 14,715 | |
| | 870 | | | 4.26%, 07/10/2045 ■Δ | | | 803 | |
The accompanying notes are an integral part of these financial statements.
| Hartford Total Return Bond HLS Fund |
| Schedule of Investments – (continued) |
| June 30, 2014 (Unaudited) |
| (000’s Omitted) |
| Shares or Principal Amount ╬ | | Market Value ╪ | |
Asset and Commercial Mortgage Backed Securities - 28.5% - (continued) | | | | |
| Finance and Insurance - 28.5% - (continued) | | | | |
| | | | | Real Estate Credit (Mortgage Banking) - 23.5% - (continued) | | | | |
| | | | | Commercial Mortgage Pass-Through Certificates - (continued) | | | | |
| $ | 7,693 | | | 5.75%, 06/10/2046 Δ | | $ | 8,246 | |
| | | | | Commercial Mortgage Trust | | | | |
| | 9,845 | | | 3.42%, 03/10/2031 ■ | | | 10,000 | |
| | 1,705 | | | 4.26%, 07/10/2045 ■Δ | | | 1,361 | |
| | | | | Community or Commercial Mortgage Trust | | | | |
| | 4,660 | | | 3.21%, 03/10/2046 ‡ | | | 4,685 | |
| | 6,910 | | | 4.01%, 04/10/2047 | | | 7,303 | |
| | 7,050 | | | 4.24%, 07/10/2045 Δ | | | 7,654 | |
| | 685 | | | 4.35%, 08/10/2030 ■ | | | 741 | |
| | 2,435 | | | 4.36%, 03/10/2046 ■Δ | | | 1,592 | |
| | | | | Countrywide Alternative Loan Trust | | | | |
| | 392 | | | 0.42%, 01/25/2036 Δ | | | 348 | |
| | 3,542 | | | 0.47%, 11/25/2035 Δ | | | 2,876 | |
| | 7,590 | | | 5.75%, 05/25/2036 | | | 6,377 | |
| | | | | Countrywide Home Loans, Inc. | | | | |
| | 6,472 | | | 2.67%, 09/25/2047 Δ | | | 5,770 | |
| | 1,169 | | | 2.73%, 04/20/2036 Δ | | | 820 | |
| | 3,668 | | | 4.92%, 11/20/2035 Δ | | | 3,373 | |
| | 5,732 | | | 5.75%, 08/25/2037 | | | 5,453 | |
| | | | | Credit Suisse Mortgage Capital Certificates | | | | |
| | 6,686 | | | 5.47%, 09/15/2039 ‡ | | | 7,203 | |
| | | | | CS First Boston Mortgage Securities Corp. | | | | |
| | 2,915 | | | 4.77%, 07/15/2037 | | | 2,991 | |
| | 6,530 | | | 4.88%, 04/15/2037 ‡ | | | 6,621 | |
| | 4,636 | | | 5.50%, 06/25/2035 ‡ | | | 4,472 | |
| | | | | CW Capital Cobalt Ltd. | | | | |
| | 7,630 | | | 5.22%, 08/15/2048 | | | 8,146 | |
| | | | | DBUBS Mortgage Trust | | | | |
| | 25,908 | | | 1.38%, 01/01/2021 ■► | | | 779 | |
| | | | | Downey S & L Assoc Mortgage Loan Trust | | | | |
| | 2,746 | | | 1.04%, 03/19/2046 Δ | | | 2,117 | |
| | | | | Fieldstone Mortgage Investment Corp. | | | | |
| | 3,611 | | | 0.42%, 05/25/2036 Δ | | | 2,318 | |
| | | | | First Franklin Mortgage Loan Trust | | | | |
| | 3,267 | | | 0.39%, 04/25/2036 Δ | | | 2,109 | |
| | | | | First Horizon Alternative Mortgage Securities | | | | |
| | 12,337 | | | 2.21%, 04/25/2036 ‡Δ | | | 10,170 | |
| | 13,549 | | | 2.24%, 09/25/2035 ‡Δ | | | 11,963 | |
| | | | | First Investors Automotive Owner Trust | | | | |
| | 2,665 | | | 1.49%, 01/15/2020 ■ | | | 2,673 | |
| | 1,295 | | | 1.81%, 10/15/2018 ■ | | | 1,304 | |
| | | | | Flagship Credit Automotive Trust | | | | |
| | 2,774 | | | 1.21%, 04/15/2019 ■ | | | 2,774 | |
| | | | | GE Business Loan Trust | | | | |
| | 4,944 | | | 1.15%, 05/15/2034 ■Δ | | | 3,839 | |
| | | | | GE Capital Commercial Mortgage Corp. | | | | |
| | 2,220 | | | 5.31%, 11/10/2045 Δ | | | 2,325 | |
| | | | | GMAC Commercial Mortgage Securities, Inc. | | | | |
| | 3,146 | | | 5.24%, 11/10/2045 Δ | | | 3,272 | |
| | | | | GMAC Mortgage Corp. Loan Trust | | | | |
| | 89 | | | 2.91%, 04/19/2036 Δ | | | 80 | |
| | 5,498 | | | 3.12%, 09/19/2035 Δ | | | 5,164 | |
| | | | | Grace Mortgage Trust | | | | |
| | 6,495 | | | 3.37%, 06/10/2028 ■ | | | 6,705 | |
| | | | | Greenwich Capital Commercial Funding Corp. | | | | |
| | 5,940 | | | 5.74%, 12/10/2049 | | | 6,604 | |
| | | | | GS Mortgage Securities Trust | | | | |
| | 10,982 | | | 1.87%, 08/10/2044 ■► | | | 721 | |
| | 7,665 | | | 2.95%, 11/05/2034 ■ | | | 7,565 | |
| | 805 | | | 3.38%, 05/10/2045 | | | 832 | |
| | 7,300 | | | 3.55%, 04/10/2034 ■ | | | 7,563 | |
| | 1,580 | | | 3.67%, 04/10/2047 ■Δ | | | 1,055 | |
| | 4,510 | | | 3.68%, 04/12/2047 Δ | | | 4,704 | |
| | 6,920 | | | 3.86%, 06/10/2047 | | | 7,220 | |
| | 8,180 | | | 4.00%, 04/10/2047 Δ | | | 8,646 | |
| | 3,750 | | | 4.24%, 08/10/2046 | | | 4,048 | |
| | 2,960 | | | 5.03%, 04/10/2047 ■Δ | | | 2,795 | |
| | | | | GSAA Home Equity Trust | | | | |
| | 14,777 | | | 0.23%, 02/25/2037 Δ | | | 7,984 | |
| | 11,410 | | | 0.25%, 03/25/2037 Δ | | | 6,063 | |
| | 2,486 | | | 0.31%, 07/25/2036 Δ | | | 1,303 | |
| | 182 | | | 0.39%, 11/25/2036 Δ | | | 108 | |
| | 4,336 | | | 5.98%, 06/25/2036 | | | 2,680 | |
| | | | | GSAMP Trust | | | | |
| | 4,825 | | | 0.24%, 01/25/2037 Δ | | | 2,818 | |
| | | | | GSR Mortgage Loan Trust | | | | |
| | 6,268 | | | 2.66%, 01/25/2036 Δ | | | 5,810 | |
| | | | | Harborview Mortgage Loan Trust | | | | |
| | 5,220 | | | 0.34%, 01/19/2038 ‡Δ | | | 4,500 | |
| | 7,843 | | | 0.38%, 05/19/2047 Δ | | | 3,167 | |
| | 18,187 | | | 0.39%, 12/19/2036 ‡Δ | | | 12,096 | |
| | 4,471 | | | 0.48%, 09/19/2035 Δ | | | 3,424 | |
| | | | | Hilton USA Trust | | | | |
| | 10,985 | | | 2.66%, 11/05/2030 ■‡ | | | 11,125 | |
| | 1,200 | | | 2.90%, 11/05/2030 ■Δ | | | 1,205 | |
| | | | | IndyMac Index Mortgage Loan Trust | | | | |
| | 4,276 | | | 0.43%, 07/25/2035 Δ | | | 3,695 | |
| | 693 | | | 0.44%, 01/25/2036 Δ | | | 469 | |
| | 9,635 | | | 0.55%, 07/25/2046 ‡Δ | | | 5,121 | |
| | 1,682 | | | 2.45%, 08/25/2035 Δ | | | 1,321 | |
| | 10,646 | | | 2.52%, 03/25/2036 Δ | | | 8,422 | |
| | 2,646 | | | 2.53%, 01/25/2036 Δ | | | 2,486 | |
| | 1,539 | | | 2.62%, 12/25/2036 Δ | | | 1,354 | |
| | | | | JP Morgan Chase Commercial Mortgage Securities Corp. | | | | |
| | 8,868 | | | 1.65%, 02/12/2051 ‡Δ | | | 8,545 | |
| | 2,070 | | | 2.75%, 10/15/2045 ■ | | | 1,573 | |
| | 1,365 | | | 2.83%, 10/15/2045 | | | 1,347 | |
| | 1,455 | | | 3.91%, 05/05/2030 ■Δ | | | 1,517 | |
| | 1,676 | | | 4.43%, 12/15/2047 ■Δ | | | 1,452 | |
| | 700 | | | 4.67%, 10/15/2045 ■Δ | | | 694 | |
| | 16,181 | | | 5.24%, 01/12/2043 - 12/15/2044 ‡Δ | | | 16,940 | |
| | 6,282 | | | 5.70%, 02/12/2049 Δ | | | 6,929 | |
| | 3,425 | | | 5.72%, 02/15/2051 | | | 3,772 | |
| | | | | JP Morgan Mortgage Trust | | | | |
| | 738 | | | 2.60%, 04/25/2037 Δ | | | 638 | |
| | 4,640 | | | 2.61%, 05/25/2036 Δ | | | 4,280 | |
| | 3,256 | | | 2.76%, 09/25/2035 Δ | | | 3,125 | |
| | | | | JPMBB Commercial Mortgage Securities Trust | | | | |
| | 6,970 | | | 4.00%, 04/15/2047 | | | 7,362 | |
| | 2,560 | | | 4.20%, 01/15/2047 | | | 2,753 | |
| | | | | LB-UBS Commercial Mortgage Trust | | | | |
| | 2,856 | | | 5.84%, 06/15/2038 Δ | | | 3,083 | |
| | 10,852 | | | 5.86%, 07/15/2040 ‡ | | | 11,628 | |
| | 1,085 | | | 6.15%, 04/15/2041 Δ | | | 1,234 | |
The accompanying notes are an integral part of these financial statements.
| Hartford Total Return Bond HLS Fund |
| Schedule of Investments – (continued) |
| June 30, 2014 (Unaudited) |
| (000’s Omitted) |
| Shares or Principal Amount ╬ | | Market Value ╪ | |
Asset and Commercial Mortgage Backed Securities - 28.5% - (continued) | | | | |
| Finance and Insurance - 28.5% - (continued) | | | | |
| | | | | Real Estate Credit (Mortgage Banking) - 23.5% - (continued) | | | | |
| | | | | LCM Ltd. | | | | |
| $ | 1,345 | | | 2.13%, 04/15/2022 ■Δ | | $ | 1,330 | |
| | | | | Lehman Brothers Small Balance Commercial | | | | |
| | 1,095 | | | 5.52%, 09/25/2030 ■Δ | | | 1,102 | |
| | | | | Lehman XS Trust | | | | |
| | 2,793 | | | 0.36%, 07/25/2046 Δ | | | 2,182 | |
| | | | | Limerock CLO | | | | |
| | 11,335 | | | 1.73%, 04/18/2026 ■Δ | | | 11,335 | |
| | | | | Luminent Mortgage Trust | | | | |
| | 3,957 | | | 0.35%, 02/25/2046 Δ | | | 2,985 | |
| | 2,560 | | | 0.41%, 11/25/2035 Δ | | | 2,306 | |
| | | | | Madison Park Funding Ltd. | | | | |
| | 6,520 | | | 1.68%, 01/19/2025 ■Δ | | | 6,504 | |
| | 9,860 | | | 1.72%, 07/20/2026 ■Δ | | | 9,860 | |
| | | | | Merrill Lynch Mortgage Investors Trust | | | | |
| | 157 | | | 2.57%, 12/25/2035 Δ | | | 150 | |
| | 1,659 | | | 2.58%, 07/25/2035 Δ | | | 1,431 | |
| | 2,125 | | | 2.78%, 03/25/2036 Δ | | | 1,476 | |
| | | | | Merrill Lynch/Countrywide Commercial Mortgage Trust | | | | |
| | 6,183 | | | 5.38%, 08/12/2048 ‡ | | | 6,671 | |
| | 2,285 | | | 5.42%, 08/12/2048 | | | 2,451 | |
| | 4,830 | | | 5.70%, 09/12/2049 | | | 5,366 | |
| | 6,505 | | | 5.74%, 06/12/2050 Δ | | | 7,181 | |
| | | | | Morgan Stanley ABS Capital I | | | | |
| | 5,137 | | | 0.30%, 06/25/2036 Δ | | | 3,887 | |
| | | | | Morgan Stanley BAML Trust | | | | |
| | 1,530 | | | 4.06%, 02/15/2047 | | | 1,623 | |
| | | | | Morgan Stanley Capital I | | | | |
| | 99,432 | | | 0.92%, 09/15/2047 ■► | | | 2,003 | |
| | 1,545 | | | 4.99%, 08/13/2042 | | | 1,587 | |
| | 1,659 | | | 5.20%, 11/14/2042 Δ | | | 1,720 | |
| | 920 | | | 5.40%, 10/12/2052 ■Δ | | | 936 | |
| | 756 | | | 5.65%, 10/15/2042 Δ | | | 797 | |
| | 10,889 | | | 5.69%, 04/15/2049 ‡Δ | | | 12,007 | |
| | | | | Morgan Stanley Capital Investments | | | | |
| | 4,866 | | | 5.81%, 12/12/2049 | | | 5,419 | |
| | | | | Morgan Stanley Mortgage Loan Trust | | | | |
| | 2,492 | | | 0.32%, 05/25/2036 - 11/25/2036 Δ | | | 1,134 | |
| | | | | Morgan Stanley Re-Remic Trust | | | | |
| | 6,617 | | | 5.80%, 08/12/2045 - 08/15/2045 ■‡Δ | | | 7,306 | |
| | | | | National Credit Union Administration | | | | |
| | 1,672 | | | 1.84%, 10/07/2020 Δ | | | 1,687 | |
| | | | | NYLIM Flatiron CLO Ltd. | | | | |
| | 2,210 | | | 2.13%, 07/17/2026 ■○☼ | | | 2,210 | |
| | | | | OHA Credit Partners Ltd. | | | | |
| | 3,030 | | | 1.62%, 07/20/2026 ■Δ | | | 3,030 | |
| | | | | OZLM Funding Ltd. | | | | |
| | 10,530 | | | 1.73%, 04/17/2026 ■Δ | | | 10,529 | |
| | | | | RBSGC Mortage Pass Through Certificates | | | | |
| | 6,577 | | | 6.25%, 01/25/2037 | | | 6,170 | |
| | | | | Residential Accredit Loans, Inc. | | | | |
| | 448 | | | 0.37%, 02/25/2046 Δ | | | 219 | |
| | 999 | | | 0.92%, 09/25/2046 Δ | | | 685 | |
| | 9,121 | | | 1.42%, 11/25/2037 ‡Δ | | | 5,714 | |
| | | | | Residential Asset Securitization Trust | | | | |
| | 3,407 | | | 0.60%, 03/25/2035 Δ | | | 2,704 | |
| | 1,725 | | | 6.25%, 11/25/2036 | | | 1,321 | |
| | | | | Residential Funding Mortgage Securities | | | | |
| | 585 | | | 3.04%, 04/25/2037 Δ | | | 513 | |
| | | | | Securitized Asset Backed Receivables LLC | | | | |
| | 574 | | | 0.24%, 07/25/2036 Δ | | | 273 | |
| | | | | Sequoia Mortgage Trust | | | | |
| | 957 | | | 2.55%, 07/20/2037 Δ | | | 793 | |
| | | | | Shackleton CLO Ltd. | | | | |
| | 7,325 | | | 0.05%, 07/17/2026 ■○☼ | | | 7,280 | |
| | | | | Soundview Home Equity Loan Trust, Inc. | | | | |
| | 3,225 | | | 0.33%, 07/25/2037 Δ | | | 1,980 | |
| | 6,645 | | | 0.40%, 06/25/2036 ‡Δ | | | 5,344 | |
| | | | | Springleaf Mortgage Loan Trust | | | | |
| | 6,285 | | | 3.52%, 12/25/2065 ■ | | | 6,419 | |
| | | | | Structured Adjustable Rate Mortgage Loan Trust | | | | |
| | 1,642 | | | 0.45%, 09/25/2034 Δ | | | 1,457 | |
| | | | | Structured Asset Mortgage Investments, Inc. | | | | |
| | 3,340 | | | 0.37%, 05/25/2046 Δ | | | 1,968 | |
| | | | | Symphony CLO Ltd. | | | | |
| | 8,660 | | | 1.48%, 07/14/2026 ■Δ | | | 8,660 | |
| | | | | UBS-Barclays Commercial Mortgage Trust | | | | |
| | 9,150 | | | 3.18%, 03/10/2046 Δ | | | 9,151 | |
| | 2,090 | | | 4.09%, 03/10/2046 ■Δ | | | 1,911 | |
| | | | | Wachovia Bank Commercial Mortgage Trust | | | | |
| | 2,130 | | | 5.59%, 03/15/2042 ■Δ | | | 2,126 | |
| | | | | Wells Fargo Alternative Loan Trust | | | | |
| | 5,953 | | | 6.25%, 11/25/2037 | | | 5,629 | |
| | | | | Wells Fargo Commercial Mortgage Trust | | | | |
| | 6,965 | | | 2.92%, 10/15/2045 ‡ | | | 6,902 | |
| | 6,980 | | | 3.82%, 08/15/2050 | | | 7,253 | |
| | | | | Wells Fargo Mortgage Backed Securities Trust | | | | |
| | 1,980 | | | 5.19%, 10/25/2035 Δ | | | 1,984 | |
| | | | | WF-RBS Commercial Mortgage Trust | | | | |
| | 175 | | | 3.44%, 04/15/2045 | | | 181 | |
| | 120 | | | 3.88%, 08/15/2046 | | | 127 | |
| | 11,685 | | | 4.00%, 05/15/2047 | | | 12,311 | |
| | 8,639 | | | 4.10%, 03/15/2047 | | | 9,184 | |
| | 550 | | | 4.90%, 06/15/2044 ■ | | | 620 | |
| | 2,780 | | | 5.00%, 06/15/2044 ■ | | | 2,610 | |
| | 1,045 | | | 5.56%, 04/15/2045 ■Δ | | | 1,102 | |
| | | | | | | | 827,799 | |
| | | | | Whole Loan Residential - 0.6% | | | | |
| | | | | Dryden Senior Loan Fund | | | | |
| | 10,915 | | | 1.59%, 04/18/2026 ■Δ | | | 10,838 | |
| | 10,870 | | | 1.71%, 07/15/2026 ■Δ | | | 10,859 | |
| | | | | | | | 21,697 | |
| | | | | | | | 1,003,141 | |
| | | | | Total Asset and Commercial Mortgage Backed Securities | | | | |
| | | | | (Cost $978,239) | | $ | 1,003,141 | |
| | | | | | | | | |
| Corporate Bonds - 29.3% | |
| Administrative Waste Management and Remediation - 0.1% | | | |
| | | | | Investigation and Security Services - 0.1% | | | | |
| | | | | ADT (The) Corp. | | | | |
| $ | 2,045 | | | 6.25%, 10/15/2021 | | $ | 2,168 | |
The accompanying notes are an integral part of these financial statements.
| Hartford Total Return Bond HLS Fund |
| Schedule of Investments – (continued) |
| June 30, 2014 (Unaudited) |
| (000’s Omitted) |
| Shares or Principal Amount ╬ | | Market Value ╪ | |
| Corporate Bonds - 29.3% - (continued) | | | | |
| Administrative Waste Management and Remediation - 0.1% - (continued) | | | | |
| | | | | Waste Treatment and Disposal - 0.0% | | | | |
| | | | | Clean Harbors, Inc. | | | | |
| $ | 345 | | | 5.13%, 06/01/2021 | | $ | 353 | |
| | 1,385 | | | 5.25%, 08/01/2020 | | | 1,428 | |
| | | | | | | | 1,781 | |
| | | | | | | | 3,949 | |
| Agriculture, Forestry, Fishing and Hunting - 0.0% | | | |
| | | | | Timber Tract Operations - 0.0% | | | | |
| | | | | Weyerhaeuser Co. | | | | |
| | 200 | | | 7.38%, 10/01/2019 | | | 246 | |
| | | | | | | | | |
| Air Transportation - 0.1% | | | |
| | | | | Scheduled Air Transportation - 0.1% | | | | |
| | | | | Continental Airlines, Inc. | | | | |
| | 4,440 | | | 4.00%, 10/29/2024 ‡ | | | 4,529 | |
| | | | | | | | | |
| Arts, Entertainment and Recreation - 2.0% | | | |
| | | | | Cable and Other Subscription Programming - 1.4% | | | | |
| | | | | CCO Holdings LLC | | | | |
| | 80 | | | 5.13%, 02/15/2023 | | | 80 | |
| | 65 | | | 5.25%, 09/30/2022 | | | 66 | |
| | 385 | | | 5.75%, 09/01/2023 | | | 399 | |
| | | | | Comcast Corp. | | | | |
| | 1,720 | | | 4.75%, 03/01/2044 | | | 1,819 | |
| | 425 | | | 5.70%, 07/01/2019 | | | 498 | |
| | | | | DirecTV Holdings LLC | | | | |
| | 2,550 | | | 1.75%, 01/15/2018 | | | 2,554 | |
| | 2,275 | | | 2.40%, 03/15/2017 | | | 2,343 | |
| | 4,000 | | | 5.00%, 03/01/2021 ‡ | | | 4,465 | |
| | | | | Numericable Group S.A. | | | | |
| | 645 | | | 4.88%, 05/15/2019 ■ | | | 662 | |
| | | | | Time Warner Entertainment Co., L.P. | | | | |
| | 8,255 | | | 8.38%, 03/15/2023 - 07/15/2033 ‡ | | | 12,102 | |
| | | | | Time Warner, Inc. | | | | |
| | 4,835 | | | 2.10%, 06/01/2019 | | | 4,810 | |
| | 2,540 | | | 3.40%, 06/15/2022 | | | 2,574 | |
| | 2,550 | | | 4.75%, 03/29/2021 | | | 2,828 | |
| | 3,800 | | | 6.10%, 07/15/2040 ‡ | | | 4,461 | |
| | 2,700 | | | 6.50%, 11/15/2036 | | | 3,304 | |
| | | | | Viacom, Inc. | | | | |
| | 7,000 | | | 5.63%, 09/15/2019 ‡ | | | 8,072 | |
| | | | | | | | 51,037 | |
| | | | | Gambling Industries - 0.0% | | | | |
| | | | | GLP Capital L.P./Financing II, Inc. | | | | |
| | 250 | | | 4.88%, 11/01/2020 ■ | | | 257 | |
| | | | | | | | | |
| | | | | Newspaper, Periodical, Book and Database Publisher - 0.4% | | | | |
| | | | | Gannett Co., Inc. | | | | |
| | 4,570 | | | 5.13%, 10/15/2019 - 07/15/2020 ■‡ | | | 4,725 | |
| | | | | News America, Inc. | | | | |
| | 5,500 | | | 6.15%, 03/01/2037 ‡ | | | 6,613 | |
| | 1,675 | | | 6.20%, 12/15/2034 | | | 2,051 | |
| | | | | | | | 13,389 | |
| | | | | Radio and Television Broadcasting - 0.2% | | | | |
| | | | | Grupo Televisa SAB | | | | |
| | 1,260 | | | 5.00%, 05/13/2045 | | | 1,262 | |
| | | | | NBC Universal Media LLC | | | | |
| 4,390 | | | 5.95%, 04/01/2041 | | | 5,390 | |
| | | | | | | | 6,652 | |
| | | | | | | | 71,335 | |
| Beverage and Tobacco Product Manufacturing - 0.1% | | | | |
| | | | | Beverage Manufacturing - 0.0% | | | | |
| | | | | Molson Coors Brewing Co. | | | | |
| | 1,825 | | | 3.50%, 05/01/2022 | | | 1,845 | |
| | | | | | | | | |
| | | | | Tobacco Manufacturing - 0.1% | | | | |
| | | | | Altria Group, Inc. | | | | |
| | 1,203 | | | 10.20%, 02/06/2039 | | | 2,042 | |
| | | | | | | | | |
| | | | | | | | 3,887 | |
| Chemical Manufacturing - 0.6% | | | |
| | | | | Agricultural Chemical Manufacturing - 0.4% | | | | |
| | | | | CF Industries Holdings, Inc. | | | | |
| | 7,270 | | | 5.15%, 03/15/2034 | | | 7,745 | |
| | | | | Monsanto Co. | | | | |
| | 5,000 | | | 2.13%, 07/15/2019 | | | 5,012 | |
| | 180 | | | 2.75%, 07/15/2021 | | | 180 | |
| | | | | | | | 12,937 | |
| | | | | Basic Chemical Manufacturing - 0.2% | | | | |
| | | | | Dow Chemical Co. | | | | |
| | 5,300 | | | 8.55%, 05/15/2019 ‡ | | | 6,812 | |
| | | | | | | | | |
| | | | | | | | 19,749 | |
| Computer and Electronic Product Manufacturing - 0.5% | | | |
| Computer and Peripheral Equipment Manufacturing - 0.5% | | | | |
| | | | | Apple, Inc. | | | | |
| | 5,225 | | | 2.85%, 05/06/2021 | | | 5,270 | |
| | | | | SBA Tower Trust | | | | |
| | 5,620 | | | 2.93%, 12/15/2017 ■‡ | | | 5,727 | |
| | 7,645 | | | 3.60%, 04/15/2043 ■‡ | | | 7,690 | |
| | | | | | | | 18,687 | |
| Construction - 0.1% | | | |
| | | | | Residential Building Construction - 0.1% | | | | |
| | | | | Lennar Corp. | | | | |
| | 1,805 | | | 4.50%, 06/15/2019 | | | 1,848 | |
| | | | | | | | | |
| Finance and Insurance - 14.6% | | | |
| | | | | Agencies, Brokerages and Other Insurance - 0.1% | | | | |
| | | | | Marsh & McLennan Cos., Inc. | | | | |
| | 3,040 | | | 2.55%, 10/15/2018 | | | 3,107 | |
| | | | | | | | | |
| | | | | Commercial Banking - 1.7% | | | | |
| | | | | Barclays Bank plc | | | | |
| | 16,740 | | | 6.05%, 12/04/2017 ■‡ | | | 18,990 | |
| | | | | BNP Paribas | | | | |
| | 7,005 | | | 2.38%, 09/14/2017 ‡ | | | 7,173 | |
| | | | | Credit Suisse Group AG | | | | |
| | 5,492 | | | 6.25%, 12/18/2024 ■♠Δ | | | 5,527 | |
| | | | | Credit Suisse New York | | | | |
| | 10,355 | | | 1.38%, 05/26/2017 | | | 10,388 | |
| | | | | State Street Corp. | | | | |
| | 8,035 | | | 4.96%, 03/15/2018 | | | 8,815 | |
The accompanying notes are an integral part of these financial statements.
| Hartford Total Return Bond HLS Fund |
| Schedule of Investments – (continued) |
| June 30, 2014 (Unaudited) |
| (000’s Omitted) |
| Shares or Principal Amount ╬ | | | Market Value ╪ | |
Corporate Bonds - 29.3% - (continued) | | | |
| Finance and Insurance - 14.6% - (continued) | | | | |
| | | | | Commercial Banking - 1.7% - (continued) | | | | |
| | | | | Sumitomo Mitsui Financial Group, Inc. | | | | |
| $ | 9,125 | | | 4.44%, 04/02/2024 ■ | | $ | 9,536 | |
| | | | | | | | 60,429 | |
| | | | | Consumer Lending - 0.1% | | | | |
| | | | | Minerva Luxembourg S.A. | | | | |
| | 1,645 | | | 7.75%, 01/31/2023 ■ | | | 1,760 | |
| | | | | | | | | |
| | | | | Depository Credit Banking - 2.8% | | | | |
| | | | | Aquarius Invest. plc Swiss Reinsurance Co., Ltd. | | | | |
| | 425 | | | 6.38%, 09/01/2024 § | | | 455 | |
| | | | | Bank of America Corp. | | | | |
| | 7,005 | | | 4.00%, 04/01/2024 | | | 7,149 | |
| | 450 | | | 4.88%, 04/01/2044 | | | 464 | |
| | 535 | | | 5.13%, 06/17/2019 ♠ | | | 533 | |
| | 3,330 | | | 5.88%, 01/05/2021 ‡ | | | 3,896 | |
| | | | | Citigroup, Inc. | | | | |
| | 2,175 | | | 1.30%, 04/01/2016 | | | 2,188 | |
| | 1,850 | | | 1.70%, 07/25/2016 | | | 1,874 | |
| | 2,200 | | | 2.50%, 09/26/2018 | | | 2,236 | |
| | 4,150 | | | 4.59%, 12/15/2015 ‡ | | | 4,375 | |
| | 1,427 | | | 4.88%, 05/07/2015 | | | 1,478 | |
| | 205 | | | 5.30%, 05/06/2044 | | | 214 | |
| | 3,570 | | | 5.50%, 09/13/2025 ‡ | | | 3,982 | |
| | 10,205 | | | 6.68%, 09/13/2043 ‡ | | | 12,704 | |
| | 2,699 | | | 8.50%, 05/22/2019 | | | 3,450 | |
| | | | | Fifth Third Bancorp | | | | |
| | 375 | | | 4.90%, 09/30/2019 ♠ | | | 373 | |
| | | | | HSBC Holdings plc | | | | |
| | 2,965 | | | 4.25%, 03/14/2024 | | | 3,051 | |
| | 1,800 | | | 5.25%, 03/14/2044 | | | 1,928 | |
| | 1,765 | | | 6.50%, 09/15/2037 | | | 2,176 | |
| | 8,500 | | | 6.80%, 06/01/2038 ‡ | | | 10,845 | |
| | | | | PNC Bank NA | | | | |
| | 2,235 | | | 6.00%, 12/07/2017 | | | 2,560 | |
| | 1,874 | | | 6.88%, 04/01/2018 | | | 2,210 | |
| | | | | PNC Financial Services Group, Inc. | | | | |
| | 6,000 | | | 3.90%, 04/29/2024 | | | 6,114 | |
| | | | | PNC Funding Corp. | | | | |
| | 705 | | | 5.25%, 11/15/2015 | | | 748 | |
| | | | | UNIQA Insurance Group AG | | | | |
| EUR | 300 | | | 6.88%, 07/31/2043 § | | | 476 | |
| | | | | Wells Fargo & Co. | | | | |
| | 2,750 | | | 2.13%, 04/22/2019 | | | 2,760 | |
| | 4,165 | | | 3.45%, 02/13/2023 ‡ | | | 4,145 | |
| | 3,240 | | | 4.10%, 06/03/2026 | | | 3,281 | |
| | 9,570 | | | 4.13%, 08/15/2023 ‡ | | | 9,941 | |
| | 4,250 | | | 5.38%, 11/02/2043 ‡ | | | 4,675 | |
| | | | | | | | 100,281 | |
| | | | | Insurance and Employee Benefit Funds - 0.0% | | | | |
| | | | | NN Group N.V. | | | | |
| EUR | 250 | | | 4.63%, 04/08/2044 § | | | 357 | |
| | | | | | | | | |
| | | | | Insurance Carriers - 1.3% | | | | |
| | | | | Aetna, Inc. | | | | |
| | 3,500 | | | 2.20%, 03/15/2019 | | | 3,509 | |
| | | | | American International Group, Inc. | | | | |
| | 375 | | | 8.18%, 05/15/2058 | | | 517 | |
| | | | | AXA S.A. | | | | |
| | 220 | | | 6.46%, 12/14/2018 §♠ | | | 236 | |
| | | | | Mapfre S.A. | | | | |
| | 250 | | | 5.92%, 07/24/2037 | | | 365 | |
| | | | | Massachusetts Mutual Life Insurance Co. | | | | |
| $ | 2,818 | | | 8.88%, 06/01/2039 ■‡ | | | 4,488 | |
| | | | | MetLife Global Funding I | | | | |
| | 5,240 | | | 2.30%, 04/10/2019 ■ | | | 5,294 | |
| | | | | MetLife, Inc. | | | | |
| | 2,675 | | | 4.37%, 09/15/2023 | | | 2,870 | |
| | | | | Nationwide Mutual Insurance Co. | | | | |
| | 5,925 | | | 9.38%, 08/15/2039 ■‡ | | | 9,221 | |
| | | | | Pacific Life Insurance Co. | | | | |
| | 325 | | | 9.25%, 06/15/2039 ■ | | | 500 | |
| | | | | Prudential Financial, Inc. | | | | |
| | 650 | | | 4.60%, 05/15/2044 | | | 655 | |
| | | | | Teachers Insurance & Annuity Association of America | | | | |
| | 5,748 | | | 6.85%, 12/16/2039 ■‡ | | | 7,666 | |
| | | | | Wellpoint, Inc. | | | | |
| | 2,920 | | | 1.88%, 01/15/2018 | | | 2,940 | |
| | 2,670 | | | 2.30%, 07/15/2018 | | | 2,720 | |
| | 3,350 | | | 5.10%, 01/15/2044 | | | 3,648 | |
| | | | | | | | 44,629 | |
| | | | | International Trade Financing (Foreign Banks) - 1.7% | | | | |
| | | | | BPCE S.A. | | | | |
| | 250 | | | 0.83%, 06/23/2017 Δ | | | 250 | |
| | 5,715 | | | 2.50%, 12/10/2018 ‡ | | | 5,793 | |
| EUR | 400 | | | 4.63%, 07/18/2023 § | | | 617 | |
| | 6,235 | | | 5.15%, 07/21/2024 ■ | | | 6,582 | |
| | 5,730 | | | 5.70%, 10/22/2023 ■‡ | | | 6,309 | |
| | | | | Royal Bank of Scotland Group plc | | | | |
| | 7,875 | | | 2.55%, 09/18/2015 ‡ | | | 8,037 | |
| | 10,850 | | | 5.13%, 05/28/2024 | | | 11,017 | |
| | 4,590 | | | 6.13%, 12/15/2022 ‡ | | | 5,020 | |
| | 850 | | | 9.50%, 03/16/2022 § | | | 997 | |
| | | | | Santander U.S. Debt S.A. | | | | |
| | 8,000 | | | 3.72%, 01/20/2015 ■‡ | | | 8,119 | |
| | | | | Societe Generale | | | | |
| | 2,620 | | | 6.00%, 01/27/2020 ■♠ | | | 2,581 | |
| | 475 | | | 7.88%, 12/18/2023 ■♠ | | | 506 | |
| | 1,250 | | | 8.25%, 11/29/2018 §♠ | | | 1,360 | |
| | | | | Standard Chartered plc | | | | |
| | 975 | | | 4.00%, 07/12/2022 § | | | 1,008 | |
| | | | | TSMC Global Ltd. | | | | |
| | 1,665 | | | 1.63%, 04/03/2018 ■ | | | 1,641 | |
| | | | | | | | 59,837 | |
| | | | | Nondepository Credit Banking - 1.5% | | | | |
| | | | | Capital One Financial Corp. | | | | |
| | 260 | | | 2.45%, 04/24/2019 | | | 262 | |
| | 4,000 | | | 6.15%, 09/01/2016 ‡ | | | 4,427 | |
| | | | | CIT Group, Inc. | | | | |
| | 630 | | | 5.00%, 05/15/2017 - 08/01/2023 | | | 647 | |
| | 3,108 | | | 5.50%, 02/15/2019 ■ | | | 3,368 | |
| | 1,175 | | | 6.63%, 04/01/2018 ■ | | | 1,319 | |
| | | | | Discover Financial Services | | | | |
| | 5,970 | | | 5.20%, 04/27/2022 ‡ | | | 6,626 | |
| | | | | Ford Motor Credit Co. LLC | | | | |
| | 2,245 | | | 5.00%, 05/15/2018 | | | 2,497 | |
| | 4,785 | | | 5.88%, 08/02/2021 ‡ | | | 5,618 | |
| | 475 | | | 6.63%, 08/15/2017 | | | 547 | |
The accompanying notes are an integral part of these financial statements.
| Hartford Total Return Bond HLS Fund |
| Schedule of Investments – (continued) |
| June 30, 2014 (Unaudited) |
| (000’s Omitted) |
| Shares or Principal Amount ╬ | Market Value ╪ | |
Corporate Bonds - 29.3% - (continued) | | | | |
| Finance and Insurance - 14.6% - (continued) | | | | |
| | | | | Nondepository Credit Banking - 1.5% - (continued) | | | | |
| | | | | General Electric Capital Corp. | | | | |
| $ | 550 | | | 4.63%, 01/07/2021 | | $ | 613 | |
| | 4,475 | | | 4.65%, 10/17/2021 | | | 4,976 | |
| | 9,925 | | | 5.30%, 02/11/2021 ‡ | | | 11,286 | |
| | 3,900 | | | 6.25%, 12/15/2022 ‡♠ | | | 4,339 | |
| | | | | SLM Corp. | | | | |
| | 1,590 | | | 5.50%, 01/15/2019 | | | 1,689 | |
| | 1,915 | | | 7.25%, 01/25/2022 | | | 2,118 | |
| | 2,830 | | | 8.45%, 06/15/2018 | | | 3,347 | |
| | | | | | | | 53,679 | |
| | | | | Other Financial Investment Activities - 0.0% | | | | |
| | | | | CNH Industrial Capital LLC | | | | |
| | 375 | | | 3.38%, 07/15/2019 ■ | | | 372 | |
| | | | | | | | | |
| | | | | Real Estate Investment Trust (REIT) - 1.7% | | | | |
| | | | | Brandywine Operating Partnership L.P. | | | | |
| | 6,200 | | | 3.95%, 02/15/2023 ‡ | | | 6,241 | |
| | | | | HCP, Inc. | | | | |
| | 3,810 | | | 4.25%, 11/15/2023 ‡ | | | 3,960 | |
| | 4,825 | | | 6.00%, 01/30/2017 | | | 5,401 | |
| | | | | Health Care REIT, Inc. | | | | |
| | 2,260 | | | 4.13%, 04/01/2019 | | | 2,431 | |
| | 8,600 | | | 4.50%, 01/15/2024 ‡ | | | 9,062 | |
| | | | | Kimco Realty Corp. | | | | |
| | 8,525 | | | 3.13%, 06/01/2023 ‡ | | | 8,202 | |
| | 1,390 | | | 4.30%, 02/01/2018 | | | 1,507 | |
| | | | | Liberty Property L.P. | | | | |
| | 2,165 | | | 3.38%, 06/15/2023 | | | 2,101 | |
| | 1,930 | | | 4.13%, 06/15/2022 | | | 2,009 | |
| | | | | Realty Income Corp. | | | | |
| | 3,966 | | | 3.25%, 10/15/2022 ‡ | | | 3,882 | |
| | 3,605 | | | 4.65%, 08/01/2023 | | | 3,871 | |
| | | | | UDR, Inc. | | | | |
| | 1,845 | | | 3.70%, 10/01/2020 | | | 1,935 | |
| | | | | Ventas Realty L.P. | | | | |
| | 3,425 | | | 2.70%, 04/01/2020 | | | 3,409 | |
| | 6,400 | | | 3.25%, 08/15/2022 ‡ | | | 6,327 | |
| | | | | | | | 60,338 | |
| | | | | Securities and Commodity Contracts and Brokerage - 3.7% | | | | |
| | | | | Bear Stearns & Co., Inc. | | | | |
| | 4,392 | | | 5.55%, 01/22/2017 ‡ | | | 4,841 | |
| | | | | Goldman Sachs Group, Inc. | | | | |
| | 100 | | | 3.85%, 07/08/2024 ☼ | | | 100 | |
| | 1,675 | | | 4.00%, 03/03/2024 | | | 1,705 | |
| | 1,635 | | | 4.80%, 07/08/2044 ☼ | | | 1,627 | |
| | 5,805 | | | 5.75%, 01/24/2022 ‡ | | | 6,718 | |
| | 6,637 | | | 6.00%, 06/15/2020 ‡ | | | 7,736 | |
| | 4,400 | | | 6.45%, 05/01/2036 ‡ | | | 5,138 | |
| | 6,350 | | | 6.75%, 10/01/2037 ‡ | | | 7,639 | |
| | | | | JP Morgan Chase & Co. | | | | |
| | 3,945 | | | 3.38%, 05/01/2023 ‡ | | | 3,872 | |
| | 6,120 | | | 4.35%, 08/15/2021 ‡ | | | 6,627 | |
| | 520 | | | 5.00%, 07/01/2019 ♠ | | | 518 | |
| | 9,885 | | | 5.63%, 08/16/2043 ‡ | | | 11,174 | |
| | 6,375 | | | 6.00%, 01/15/2018 ‡ | | | 7,300 | |
| | | | | Merrill Lynch & Co., Inc. | | | | |
| | 3,006 | | | 5.70%, 05/02/2017 | | | 3,336 | |
| | 19,825 | | | 6.05%, 05/16/2016 ‡ | | | 21,563 | |
| | 5,580 | | | 7.75%, 05/14/2038 ‡ | | | 7,665 | |
| | | | | Morgan Stanley | | | | |
| 4,425 | | | 2.13%, 04/25/2018 ‡ | | | 4,474 | |
| | 3,685 | | | 4.88%, 11/01/2022 ‡ | | | 3,956 | |
| | 250 | | | 5.45%, 07/15/2019 ♠ | | | 255 | |
| | 2,750 | | | 5.75%, 01/25/2021 | | | 3,194 | |
| | 13,675 | | | 6.25%, 08/28/2017 ‡ | | | 15,585 | |
| | 1,600 | | | 7.30%, 05/13/2019 | | | 1,956 | |
| | | | | UBS AG Stamford CT | | | | |
| | 1,600 | | | 7.63%, 08/17/2022 | | | 1,927 | |
| | | | | | | | 128,906 | |
| | | | | | | | 513,695 | |
| Food Manufacturing - 0.1% | | | | |
| | | | | Bakeries and Tortilla Manufacturing - 0.1% | | | | |
| | | | | Grupo Bimbo S.A.B. de C.V. | | | | |
| | 4,485 | | | 4.88%, 06/27/2044 ■ | | | 4,383 | |
| | | | | | | | | |
| Health Care and Social Assistance - 1.0% | | | | |
| | | | | Drugs and Druggists' Sundries Merchant Wholesalers - 0.1% | | | | |
| | | | | McKesson Corp. | | | | |
| | 1,845 | | | 3.80%, 03/15/2024 | | | 1,886 | |
| | | | | | | | | |
| | | | | General Medical and Surgical Hospitals - 0.4% | | | | |
| | | | | Community Health Systems, Inc. | | | | |
| | 805 | | | 5.13%, 08/01/2021 ■ | | | 825 | |
| | | | | HCA, Inc. | | | | |
| | 4,160 | | | 6.50%, 02/15/2020 ‡ | | | 4,680 | |
| | | | | Memorial Sloan-Kettering Cancer Center | | | | |
| | 4,710 | | | 5.00%, 07/01/2042 ‡ | | | 5,139 | |
| | | | | Tenet Healthcare Corp. | | | | |
| | 3,695 | | | 6.00%, 10/01/2020 | | | 4,009 | |
| | | | | | | | 14,653 | |
| | | | | Health and Personal Care Stores - 0.3% | | | | |
| | | | | CVS Caremark Corp. | | | | |
| | 7,798 | | | 8.35%, 07/10/2031 ■‡ | | | 10,275 | |
| | | | | | | | | |
| | | | | Individual and Family Services - 0.0% | | | | |
| | | | | Wellcare Health Plans, Inc. | | | | |
| | 720 | | | 5.75%, 11/15/2020 | | | 767 | |
| | | | | | | | | |
| | | | | Pharmaceutical and Medicine Manufacturing - 0.2% | | | | |
| | | | | Amgen, Inc. | | | | |
| | 520 | | | 0.83%, 05/22/2019 Δ | | | 521 | |
| | | | | Gilead Sciences, Inc. | | | | |
| | 4,295 | | | 3.70%, 04/01/2024 ‡ | | | 4,407 | |
| | | | | Mylan, Inc. | | | | |
| | 490 | | | 6.00%, 11/15/2018 ■ | | | 513 | |
| | | | | Warner Chilcott plc | | | | |
| | 475 | | | 7.75%, 09/15/2018 | | | 499 | |
| | | | | | | | 5,940 | |
| | | | | | | | 33,521 | |
| Information - 2.5% | | |
| | | | | Cable and Other Program Distribution - 0.4% | | | | |
| | | | | Cox Communications, Inc. | | | | |
| | 10,095 | | | 2.95%, 06/30/2023 ■‡ | | | 9,583 | |
| | | | | DISH DBS Corp. | | | | |
| | 2,785 | | | 7.88%, 09/01/2019 | | | 3,307 | |
| | | | | | | | 12,890 | |
The accompanying notes are an integral part of these financial statements.
| Hartford Total Return Bond HLS Fund |
| Schedule of Investments – (continued) |
| June 30, 2014 (Unaudited) |
| (000’s Omitted) |
| Shares or Principal Amount ╬ | Market Value ╪ | |
| Corporate Bonds - 29.3% - (continued) | | | | |
| Information - 2.5% - (continued) | | | | |
| | | | | Data Processing Services - 0.1% | | | | |
| | | | | Audatex North America, Inc. | | | | |
| $ | 1,850 | | | 6.00%, 06/15/2021 ■ | | $ | 1,975 | |
| | | | | First Data Corp. | | | | |
| | 250 | | | 6.75%, 11/01/2020 ■ | | | 271 | |
| | 400 | | | 12.63%, 01/15/2021 | | | 492 | |
| | | | | | | | 2,738 | |
| | | | | Satellite Telecommunications - 0.0% | | | | |
| | | | | Inmarsat Finance plc | | | | |
| | 890 | | | 4.88%, 05/15/2022 ■ | | | 899 | |
| | | | | | | | | |
| | | | | Software Publishers - 0.1% | | | | |
| | | | | Activision Blizzard, Inc. | | | | |
| | 4,365 | | | 5.63%, 09/15/2021 ■ | | | 4,703 | |
| | | | | | | | | |
| | | | | Telecommunications - Other - 0.3% | | | | |
| | | | | Sprint Communications, Inc. | | | | |
| | 2,370 | | | 7.00%, 03/01/2020 ■ | | | 2,725 | |
| | 1,706 | | | 9.00%, 11/15/2018 ■ | | | 2,069 | |
| | | | | Telefonica Emisiones SAU | | | | |
| | 1,775 | | | 3.99%, 02/16/2016 | | | 1,858 | |
| | | | | Wind Acquisition Finance S.A. | | | | |
| | 1,240 | | | 4.75%, 07/15/2020 ■☼ | | | 1,249 | |
| | 2,275 | | | 7.25%, 02/15/2018 ■ | | | 2,404 | |
| | | | | | | | 10,305 | |
| | | | | Telecommunications - Wired Carriers - 0.3% | | | | |
| | | | | AT&T, Inc. | | | | |
| | 7,200 | | | 4.80%, 06/15/2044 | | | 7,350 | |
| | | | | Unitymedia Hessen GmbH & Co. | | | | |
| | 1,650 | | | 5.50%, 01/15/2023 ■ | | | 1,708 | |
| | 1,814 | | | 7.50%, 03/15/2019 ■ | | | 1,936 | |
| | | | | | | | 10,994 | |
| | | | | Telecommunications - Wireless Carriers - 0.2% | | | | |
| | | | | T-Mobile USA, Inc. | | | | |
| | 1,315 | | | 5.25%, 09/01/2018 | | | 1,381 | |
| | 1,995 | | | 6.46%, 04/28/2019 | | | 2,100 | |
| | 860 | | | 6.63%, 04/28/2021 | | | 931 | |
| | | | | Vimpelcom Holdings | | | | |
| | 3,915 | | | 5.95%, 02/13/2023 ■ | | | 3,861 | |
| | | | | | | | 8,273 | |
| | | | | Wireless Communications Services - 1.1% | | | | |
| | | | | Verizon Communications, Inc. | | | | |
| | 5,620 | | | 3.65%, 09/14/2018 ‡ | | | 6,010 | |
| | 9,770 | | | 5.15%, 09/15/2023 ‡ | | | 10,934 | |
| | 5,020 | | | 6.40%, 02/15/2038 ‡ | | | 6,131 | |
| | 12,485 | | | 6.55%, 09/15/2043 ‡ | | | 15,712 | |
| | | | | | | | 38,787 | |
| | | | | | | | 89,589 | |
| Machinery Manufacturing - 0.4% | | | | |
| | | | | Agriculture, Construction, Mining and Machinery - 0.1% | | | | |
| | | | | Case New Holland Industrial, Inc. | | | | |
| | 2,301 | | | 7.88%, 12/01/2017 | | | 2,680 | |
| | | | | | | | | |
| | | | | Other General Purpose Machinery Manufacturing - 0.3% | | | | |
| | | | | Hutchison Whampoa International Ltd. | | | | |
| | 10,000 | | | 2.00%, 11/08/2017 ■‡ | | | 10,090 | |
| | | | | | | | | |
| | | | | | | | 12,770 | |
| Mining - 0.2% | | | | |
| | | | | Coal Mining - 0.1% | | | | |
| | | | | Peabody Energy Corp. | | | | |
| 2,385 | | | 6.50%, 09/15/2020 | | | 2,403 | |
| | | | | | | | | |
| | | | | Metal Ore Mining - 0.1% | | | | |
| | | | | Barrick North America Finance LLC | | | | |
| | 250 | | | 4.40%, 05/30/2021 | | | 261 | |
| | | | | Glencore Funding LLC | | | | |
| | 4,580 | | | 1.70%, 05/27/2016 ■‡ | | | 4,622 | |
| | | | | | | | 4,883 | |
| | | | | Nonmetallic Mineral Mining and Quarrying - 0.0% | | | | |
| | | | | FMG Resources Aug 2006 | | | | |
| | 1,020 | | | 6.88%, 04/01/2022 ■ | | | 1,094 | |
| | | | | | | | | |
| | | | | | | | 8,380 | |
| Miscellaneous Manufacturing - 0.0% | | | | |
| | | | | Aerospace Product and Parts Manufacturing - 0.0% | | | | |
| | | | | Triumph Group, Inc. | | | | |
| | 1,115 | | | 5.25%, 06/01/2022 ■ | | | 1,118 | |
| | | | | | | | | |
| Motor Vehicle and Parts Manufacturing - 0.4% | | | | |
| | | | | Motor Vehicle Manufacturing - 0.4% | | | | |
| | | | | Chrysler Group LLC | | | | |
| | 900 | | | 8.00%, 06/15/2019 | | | 977 | |
| | | | | General Motors Financial Co., Inc. | | | | |
| | 8,360 | | | 4.75%, 08/15/2017 ‡ | | | 8,893 | |
| | 1,720 | | | 6.25%, 10/02/2043 ■ | | | 1,974 | |
| | | | | General Motors, Inc. | | | | |
| | 500 | | | 3.50%, 10/02/2018 ■ | | | 511 | |
| | | | | | | | 12,355 | |
| | | | | Motor Vehicle Parts Manufacturing - 0.0% | | | | |
| | | | | TRW Automotive, Inc. | | | | |
| | 450 | | | 7.25%, 03/15/2017 ■ | | | 512 | |
| | | | | | | | | |
| | | | | | | | 12,867 | |
| Petroleum and Coal Products Manufacturing - 2.3% | | | | |
| | | | | Natural Gas Distribution - 0.3% | | | | |
| | | | | Williams Partners L.P. | | | | |
| | 6,085 | | | 3.90%, 01/15/2025 | | | 6,113 | |
| | 5,085 | | | 4.30%, 03/04/2024 ‡ | | | 5,303 | |
| | | | | | | | 11,416 | |
| | | | | Oil and Gas Extraction - 1.6% | | | | |
| | | | | Anadarko Petroleum Corp. | | | | |
| | 3,315 | | | 6.38%, 09/15/2017 | | | 3,817 | |
| | | | | Cenovus Energy, Inc. | | | | |
| | 9,000 | | | 5.20%, 09/15/2043 ‡ | | | 9,909 | |
| | | | | Cimarex Energy Co. | | | | |
| | 815 | | | 4.38%, 06/01/2024 | | | 830 | |
| | | | | CNPC General Capital | | | | |
| | 9,060 | | | 1.45%, 04/16/2016 ■‡ | | | 9,072 | |
| | | | | Denbury Resources, Inc. | | | | |
| | 810 | | | 5.50%, 05/01/2022 | | | 828 | |
| | | | | EDC Finance Ltd. | | | | |
| | 3,135 | | | 4.88%, 04/17/2020 ■ | | | 3,064 | |
| | | | | Enable Midstream Partners L.P. | | | | |
| | 80 | | | 5.00%, 05/15/2044 ■ | | | 81 | |
| | | | | Harvest Operations Corp. | | | | |
| | 1,695 | | | 6.88%, 10/01/2017 | | | 1,839 | |
The accompanying notes are an integral part of these financial statements.
| Hartford Total Return Bond HLS Fund |
| Schedule of Investments – (continued) |
| June 30, 2014 (Unaudited) |
| (000’s Omitted) |
| Shares or Principal Amount ╬ | Market Value ╪ | |
| Corporate Bonds - 29.3% - (continued) | | | | |
| Petroleum and Coal Products Manufacturing - 2.3% - (continued) | | | | |
| | | | | Oil and Gas Extraction - 1.6% - (continued) | | | | |
| | | | | Lukoil International Finance B.V. | | | | |
| $ | 8,525 | | | 3.42%, 04/24/2018 ■‡ | | $ | 8,461 | |
| | 475 | | | 6.13%, 11/09/2020 § | | | 514 | |
| | | | | Nexen, Inc. | | | | |
| | 1,185 | | | 7.50%, 07/30/2039 | | | 1,604 | |
| | | | | Pemex Project Funding Master Trust | | | | |
| | 5,805 | | | 6.63%, 06/15/2035 ‡ | | | 6,835 | |
| | | | | Petrobras Global Finance Co. | | | | |
| | 3,810 | | | 3.00%, 01/15/2019 | | | 3,740 | |
| | | | | Petrobras International Finance Co. | | | | |
| | 850 | | | 5.38%, 01/27/2021 | | | 886 | |
| | | | | Pioneer Natural Resources Co. | | | | |
| | 660 | | | 6.65%, 03/15/2017 | | | 751 | |
| | 2,090 | | | 7.50%, 01/15/2020 | | | 2,579 | |
| | | | | Plains Exploration & Production Co. | | | | |
| | 1,375 | | | 6.63%, 05/01/2021 | | | 1,538 | |
| | 450 | | | 6.88%, 02/15/2023 | | | 527 | |
| | | | | | | | 56,875 | |
| | | | | Petroleum and Coal Products Manufacturing - 0.3% | | | | |
| | | | | Hess Corp. | | | | |
| | 3,575 | | | 1.30%, 06/15/2017 | | | 3,581 | |
| | | | | Tesoro Corp. | | | | |
| | 250 | | | 5.13%, 04/01/2024 | | | 253 | |
| | | | | Valero Energy Corp. | | | | |
| | 4,391 | | | 9.38%, 03/15/2019 ‡ | | | 5,764 | |
| | | | | | | | 9,598 | |
| | | | | Support Activities For Mining - 0.1% | | | | |
| | | | | Transocean, Inc. | | | | |
| | 1,850 | | | 6.38%, 12/15/2021 | | | 2,140 | |
| | 250 | | | 6.80%, 03/15/2038 | | | 285 | |
| | | | | | | | 2,425 | |
| | | | | | | | 80,314 | |
| Pipeline Transportation - 1.1% | | | | |
| | | | | Pipeline Transportation of Natural Gas - 1.1% | | | | |
| | | | | El Paso Corp. | | | | |
| | 2,075 | | | 7.00%, 06/15/2017 | | | 2,342 | |
| | | | | Energy Transfer Equity L.P. | | | | |
| | 3,965 | | | 3.60%, 02/01/2023 ‡ | | | 3,929 | |
| | 9,305 | | | 5.95%, 10/01/2043 ‡ | | | 10,537 | |
| | 6,110 | | | 6.50%, 02/01/2042 ‡ | | | 7,297 | |
| | 3,137 | | | 7.50%, 10/15/2020 | | | 3,623 | |
| | | | | Kinder Morgan Energy Partners L.P. | | | | |
| | 8,115 | | | 5.50%, 03/01/2044 ‡ | | | 8,566 | |
| | | | | Kinder Morgan Finance Co. | | | | |
| | 1,305 | | | 6.00%, 01/15/2018 ■ | | | 1,426 | |
| | | | | Southern Star Central Corp. | | | | |
| | 160 | | | 5.13%, 07/15/2022 ■ | | | 161 | |
| | | | | | | | 37,881 | |
| Plastics and Rubber Products Manufacturing - 0.0% | | |
| | | | | Rubber Product Manufacturing - 0.0% | | | | |
| | | | | Continental Rubber of America Corp. | | | | |
| | 475 | | | 4.50%, 09/15/2019 ■ | | | 503 | |
| | | | | | | | | |
| Primary Metal Manufacturing - 0.1% | | | |
| | | | | Iron and Steel Mills and Ferroalloy Manufacturing - 0.1% | | | | |
| | | | | ArcelorMittal | | | | |
| | 2,975 | | | 9.50%, 02/15/2015 | | | 3,120 | |
| | | | | United States Steel Corp. | | | | |
| 1,265 | | | 7.38%, 04/01/2020 | | | 1,395 | |
| | | | | | | | 4,515 | |
| Rail Transportation - 0.1% | | | |
| | | | | Rail Transportation - 0.1% | | | | |
| | | | | Canadian Pacific Railway Co. | | | | |
| | 1,780 | | | 9.45%, 08/01/2021 | | | 2,461 | |
| | | | | | | | | |
| Real Estate, Rental and Leasing - 1.2% | | | |
| | | | | Activities Related To Real Estate - 0.1% | | | | |
| | | | | Duke Realty L.P. | | | | |
| | 4,000 | | | 3.63%, 04/15/2023 ‡ | | | 3,967 | |
| | | | | | | | | |
| | | | | Automotive Equipment Rental and Leasing - 0.1% | | | | |
| | | | | Ryder System, Inc. | | | | |
| | 2,560 | | | 2.55%, 06/01/2019 | | | 2,591 | |
| | | | | | | | | |
| | | | | General Rental Centers - 0.2% | | | | |
| | | | | ERAC USA Finance Co. | | | | |
| | 2,735 | | | 2.35%, 10/15/2019 ■ | | | 2,731 | |
| | 4,295 | | | 6.38%, 10/15/2017 ■ | | | 4,940 | |
| | | | | | | | 7,671 | |
| | | | | Industrial Machinery and Equipment Rental and Leasing - 0.3% | | | | |
| | | | | GATX Corp. | | | | |
| | 400 | | | 2.50%, 07/30/2019 | | | 402 | |
| | 475 | | | 3.50%, 07/15/2016 | | | 498 | |
| | | | | International Lease Finance Corp. | | | | |
| | 6,640 | | | 5.88%, 04/01/2019 ‡ | | | 7,304 | |
| | 2,500 | | | 6.75%, 09/01/2016 ■ | | | 2,769 | |
| | | | | | | | 10,973 | |
| | | | | Lessors of Real Estate - 0.5% | | | | |
| | | | | American Tower Corp. | | | | |
| | 950 | | | 5.00%, 02/15/2024 | | | 1,032 | |
| | | | | ProLogis L.P. | | | | |
| | 16,575 | | | 3.35%, 02/01/2021 ‡ | | | 16,817 | |
| | | | | | | | 17,849 | |
| | | | | | | | 43,051 | |
| Retail Trade - 0.6% | | |
| | | | | Automobile Dealers - 0.0% | | | | |
| | | | | Jaguar Land Rover plc | | | | |
| | 875 | | | 8.13%, 05/15/2021 ■ | | | 984 | |
| | | | | | | | | |
| | | | | Automotive Parts, Accessories and Tire Stores - 0.2% | | | | |
| | | | | AutoZone, Inc. | | | | |
| | 5,900 | | | 3.70%, 04/15/2022 ‡ | | | 6,072 | |
| | | | | O'Reilly Automotive, Inc. | | | | |
| | 50 | | | 3.85%, 06/15/2023 | | | 51 | |
| | | | | | | | 6,123 | |
| | | | | Building Material and Supplies Dealers - 0.1% | | | | |
| | | | | Building Materials Corp. | | | | |
| | 219 | | | 6.75%, 05/01/2021 ■ | | | 236 | |
| | 1,962 | | | 7.50%, 03/15/2020 ■ | | | 2,090 | |
| | | | | Home Depot, Inc. | | | | |
| | 265 | | | 4.20%, 04/01/2043 | | | 259 | |
| | | | | | | | 2,585 | |
The accompanying notes are an integral part of these financial statements.
| Hartford Total Return Bond HLS Fund |
| Schedule of Investments – (continued) |
| June 30, 2014 (Unaudited) |
| (000’s Omitted) |
| Shares or Principal Amount ╬ | | Market Value ╪ | |
| Corporate Bonds - 29.3% - (continued) | | | | |
| Retail Trade - 0.6% - (continued) | | | | |
| | | | | Clothing Stores - 0.1% | | | | |
| | | | | Carter's, Inc. | | | | |
| $ | 2,645 | | | 5.25%, 08/15/2021 ■ | | $ | 2,758 | |
| | | | | | | | | |
| | | | | Electronics and Appliance Stores - 0.1% | | | | |
| | | | | Arcelik AS | | | | |
| | 2,810 | | | 5.00%, 04/03/2023 ■ | | | 2,701 | |
| | | | | | | | | |
| | | | | Other General Merchandise Stores - 0.1% | | | | |
| | | | | Wal-Mart Stores, Inc. | | | | |
| | 4,235 | | | 4.30%, 04/22/2044 | | | 4,277 | |
| | | | | | | | | |
| | | | | Other Miscellaneous Store Retailers - 0.0% | | | | |
| | | | | Sotheby's | | | | |
| | 2,390 | | | 5.25%, 10/01/2022 ■ | | | 2,324 | |
| | | | | | | | | |
| | | | | | | | 21,752 | |
| Truck Transportation - 0.2% | | | | |
| | | | | Specialized Freight Trucking - 0.2% | | | | |
| | | | | Penske Truck Leasing Co. | | | | |
| | 1,770 | | | 2.50%, 06/15/2019 ■ | | | 1,773 | |
| | 3,575 | | | 2.88%, 07/17/2018 ■ | | | 3,660 | |
| | 2,762 | | | 4.88%, 07/11/2022 ■ | | | 3,022 | |
| | | | | | | | 8,455 | |
| Utilities - 1.0% | | | |
| | | | | Electric Generation, Transmission and Distribution - 1.0% | | | | |
| | | | | AES (The) Corp. | | | | |
| | 460 | | | 5.50%, 03/15/2024 | | | 470 | |
| | 890 | | | 9.75%, 04/15/2016 | | | 1,008 | |
| | | | | Appalachian Power Co. | | | | |
| | 95 | | | 4.40%, 05/15/2044 | | | 95 | |
| | | | | Calpine Corp. | | | | |
| | 3,203 | | | 7.50%, 02/15/2021 ■ | | | 3,475 | |
| | | | | CenterPoint Energy, Inc. | | | | |
| | 4,175 | | | 6.85%, 06/01/2015 ‡ | | | 4,406 | |
| | | | | Dolphin Subsidiary II, Inc. | | | | |
| | 2,925 | | | 7.25%, 10/15/2021 | | | 3,218 | |
| | | | | EDP Finance B.V. | | | | |
| | 830 | | | 5.25%, 01/14/2021 ■ | | | 880 | |
| | | | | MidAmerican Energy Holdings Co. | | | | |
| | 7,665 | | | 8.48%, 09/15/2028 ‡ | | | 11,182 | |
| | | | | Pacific Gas & Electric Co. | | | | |
| | 1,665 | | | 3.75%, 02/15/2024 | | | 1,721 | |
| | 3,700 | | | 8.25%, 10/15/2018 ‡ | | | 4,623 | |
| | | | | Xcel Energy, Inc. | | | | |
| | 3,100 | | | 6.50%, 07/01/2036 | | | 4,048 | |
| | | | | | | | 35,126 | |
| | | | | Total Corporate Bonds | | | | |
| | | | | (Cost $976,375) | | $ | 1,034,611 | |
| | | | | | | | | |
| Foreign Government Obligations - 2.7% | | | |
| | | | | Brazil - 0.6% | | | | |
| | | | | Brazil (Federative Republic of) | | | | |
| $ | 5,525 | | | 4.88%, 01/22/2021 ‡ | | $ | 6,022 | |
| BRL | 26,601 | | | 6.00%, 05/15/2045 ◄ | | | 11,814 | |
| BRL | 9,119 | | | 10.00%, 01/01/2017 | | | 3,989 | |
| | | | | | | | 21,825 | |
| | | | | | | | | |
| | | | | Colombia - 0.2% | | | | |
| | | | | Colombia (Republic of) | | | | |
| COP | 6,791,244 | | | 3.50%, 04/17/2019 ◄ | | | 3,698 | |
| COP | 7,311,300 | | | 7.00%, 05/04/2022 | | | 3,996 | |
| | | | | | | | 7,694 | |
| | | | | Japan - 1.1% | | | | |
| | | | | Japan (Government of) | | | | |
| JPY | 3,674,471 | | | 0.10%, 09/10/2023 ◄ | | | 39,353 | |
| | | | | | | | | |
| | | | | Latvia - 0.0% | | | | |
| | | | | Latvia (Republic of) | | | | |
| $ | 400 | | | 2.75%, 01/12/2020 § | | | 395 | |
| | | | | | | | | |
| | | | | Mexico - 0.4% | | | | |
| | | | | Mexico (United Mexican States) | | | | |
| MXN | 48,349 | | | 2.00%, 06/09/2022 ◄ | | | 3,713 | |
| | 5,934 | | | 4.75%, 03/08/2044 | | | 6,053 | |
| MXN | 43,449 | | | 8.00%, 12/07/2023 | | | 3,912 | |
| | | | | | | | 13,678 | |
| | | | | Peru - 0.2% | | | | |
| | | | | Peru (Republic of) | | | | |
| PEN | 17,775 | | | 8.20%, 08/12/2026 | | | 7,758 | |
| | | | | | | | | |
| | | | | Russia - 0.2% | | | | |
| | | | | Russia (Federation of) | | | | |
| $ | 1,000 | | | 3.63%, 04/29/2015 § | | | 1,017 | |
| RUB | 133,475 | | | 8.15%, 02/03/2027 Δ | | | 3,865 | |
| | | | | | | | 4,882 | |
| | | | | Total Foreign Government Obligations | | | | |
| | | | | (Cost $89,369) | | $ | 95,585 | |
| | | | | | | | | |
| Municipal Bonds - 1.3% | | | | |
| | | | | General Obligations - 0.5% | | | | |
| | | | | California State GO | | | | |
| $ | 3,180 | | | 7.50%, 04/01/2034 ‡ | | $ | 4,527 | |
| | | | | California State GO, Taxable | | | | |
| | 7,345 | | | 7.55%, 04/01/2039 ‡ | | | 11,042 | |
| | | | | Illinois State GO | | | | |
| | 230 | | | 5.88%, 03/01/2019 | | | 259 | |
| | | | | | | | 15,828 | |
| | | | | Higher Education (Univ., Dorms, etc.) - 0.4% | | | | |
| | | | | Massachusetts State Development Fin Agency Rev | | | | |
| | 130 | | | 5.35%, 12/01/2028 | | | 143 | |
| | | | | University of California | | | | |
| | 5,580 | | | 4.60%, 05/15/2031 ‡ | | | 6,064 | |
| | 7,140 | | | 5.00%, 05/15/2038 ‡ | | | 7,996 | |
| | | | | | | | 14,203 | |
| | | | | Miscellaneous - 0.1% | | | | |
| | | | | Puerto Rico Government Employees Retirement System | | | | |
| | 7,965 | | | 6.30%, 07/01/2043 ‡ | | | 4,650 | |
| | | | | | | | | |
| | | | | Tax Allocation - 0.2% | | | | |
| | | | | Industry, CA, Urban Development Agency | | | | |
| | 275 | | | 6.10%, 05/01/2024 | | | 284 | |
| | | | | New York City, NY, Transitional FA Rev | | | | |
| | 7,280 | | | 5.00%, 11/01/2038 - 05/01/2042 ‡ | | | 8,084 | |
| | | | | | | | 8,368 | |
The accompanying notes are an integral part of these financial statements.
| Hartford Total Return Bond HLS Fund |
| Schedule of Investments – (continued) |
| June 30, 2014 (Unaudited) |
| (000’s Omitted) |
| Shares or Principal Amount ╬ | | Market Value ╪ | |
| Municipal Bonds - 1.3% - (continued) | | | |
| | | | | Utilities - Electric - 0.1% | | | | |
| | | | | Municipal Elec Auth Georgia | | | | |
| $ | 3,185 | | | 6.64%, 04/01/2057 ‡ | | $ | 3,898 | |
| | | | | | | | | |
| | | | | Total Municipal Bonds | | | | |
| | | | | (Cost $42,880) | | $ | 46,947 | |
| | | | | | | | | |
| Senior Floating Rate Interests ♦ - 6.2% | | | |
| Administrative Waste Management and Remediation - 0.1% | | |
| | | | | Business Support Services - 0.0% | | | | |
| | | | | Audio Visual Services Group, Inc. | | | | |
| $ | 1,242 | | | 0.45%, 01/25/2021 | | $ | 1,244 | |
| | | | | | | | | |
| | | | | Services to Buildings and Dwellings - 0.1% | | | | |
| | | | | ServiceMaster (The) Co. | | | | |
| | 997 | | | 0.43%, 06/25/2021 ☼ | | | 996 | |
| | 997 | | | 0.44%, 01/31/2017 | | | 997 | |
| | | | | | | | 1,993 | |
| | | | | | | | 3,237 | |
| Agriculture, Construction, Mining and Machinery - 0.0% | | |
| | | | | Other General Purpose Machinery Manufacturing - 0.0% | | | | |
| | | | | Signode Industrial Group US, Inc. | | | | |
| | 1,685 | | | 0.40%, 05/01/2021 | | | 1,679 | |
| | | | | | | | | |
| Air Transportation - 0.0% | | | |
| | | | | Scheduled Air Transportation - 0.0% | | | | |
| | | | | Delta Air Lines, Inc. | | | | |
| | 958 | | | 0.35%, 10/18/2018 | | | 956 | |
| | | | | | | | | |
| Apparel Manufacturing - 0.0% | | | | |
| | | | | Apparel Knitting Mills - 0.0% | | | | |
| | | | | Bauer Performance Sports Ltd. | | | | |
| | 389 | | | 0.45%, 04/15/2021 | | | 389 | |
| | | | | Kate Spade & Co. | | | | |
| | 1,465 | | | 0.40%, 04/09/2021 | | | 1,464 | |
| | | | | | | | 1,853 | |
| Arts, Entertainment and Recreation - 0.4% | | | | |
| | | | | Cable and Other Subscription Programming - 0.0% | | | | |
| | | | | CSC Holdings, Inc. | | | | |
| | 2 | | | 0.26%, 04/17/2020 | | | 2 | |
| | | | | Numericable | | | | |
| | 1,040 | | | 0.45%, 05/21/2020 | | | 1,046 | |
| | | | | | | | 1,048 | |
| | | | | Gambling Industries - 0.3% | | | | |
| | | | | Caesars Entertainment Operating Co., Inc. | | | | |
| | 2,599 | | | 0.45%, 01/28/2018 | | | 2,398 | |
| | 2,648 | | | 0.55%, 01/28/2018 | | | 2,469 | |
| | | | | Caesars Growth Property Holdings LLC | | | | |
| | 795 | | | 0.63%, 05/08/2021 | | | 795 | |
| | | | | MGM Resorts International | | | | |
| | 1,364 | | | 0.35%, 12/20/2019 | | | 1,360 | |
| | | | | Seminole (The) Tribe of Florida, Inc. | | | | |
| | 1,369 | | | 0.30%, 04/29/2020 | | | 1,366 | |
| | | | | Station Casinos LLC | | | | |
| | 385 | | | 0.43%, 03/02/2020 | | | 386 | |
| | | | | | | | 8,774 | |
| | | | | Newspaper, Periodical, Book and Database Publisher - 0.1% | | | | |
| | | | | Tribune Co. | | | | |
| | 1,269 | | | 0.40%, 12/27/2020 | | | 1,271 | |
| | | | | | | | | |
| | | | | Other Amusement and Recreation Industries - 0.0% | | | | |
| | | | | 24 Hour Fitness Worldwide, Inc. | | | | |
| 1,075 | | | 0.48%, 05/28/2021 | | | 1,080 | |
| | | | | | | | | |
| | | | | Radio and Television Broadcasting - 0.0% | | | | |
| | | | | XO Communications LLC | | | | |
| | 589 | | | 0.43%, 03/20/2021 | | | 591 | |
| | | | | | | | | |
| | | | | | | | 12,764 | |
| Beverage and Tobacco Product Manufacturing - 0.1% | | | | |
| | | | | Beverage Manufacturing - 0.1% | | | | |
| | | | | Constellation Brands, Inc. | | | | |
| | 2,376 | | | 0.28%, 06/05/2020 | | | 2,381 | |
| | | | | | | | | |
| Chemical Manufacturing - 0.3% | | | | |
| | | | | Basic Chemical Manufacturing - 0.1% | | | | |
| | | | | Huntsman International LLC, Extended Term Loan B | | | | |
| | 792 | | | 0.27%, 04/19/2017 | | | 789 | |
| | | | | Minerals Technologies, Inc. | | | | |
| | 1,020 | | | 0.40%, 05/07/2021 | | | 1,024 | |
| | | | | Momentive Performance Materials, Inc. | | | | |
| | 1,055 | | | 0.40%, 04/15/2015 | | | 1,057 | |
| | | | | Pinnacle Operating Corp. | | | | |
| | 884 | | | 0.48%, 11/15/2018 | | | 888 | |
| | | | | PQ Corp. | | | | |
| | 1,330 | | | 0.40%, 08/07/2017 | | | 1,333 | |
| | | | | W.R. Grace & Co. | | | | |
| | 3 | | | 0.30%, 02/03/2021 | | | 3 | |
| | | | | | | | 5,094 | |
| | | | | Other Chemical and Preparations Manufacturing - 0.2% | | | | |
| | | | | Axil Coating Systems | | | | |
| | 292 | | | 0.40%, 02/01/2020 | | | 292 | |
| | | | | Cytec Industries, Inc. | | | | |
| | 247 | | | 0.45%, 10/03/2019 | | | 248 | |
| | | | | Ineos US Finance LLC | | | | |
| | 4,204 | | | 0.38%, 05/04/2018 | | | 4,192 | |
| | | | | Monarch, Inc. | | | | |
| | 476 | | | 0.45%, 10/03/2019 | | | 477 | |
| | | | | Univar, Inc. | | | | |
| | 373 | | | 0.50%, 06/30/2017 | | | 374 | |
| | | | | | | | 5,583 | |
| | | | | | | | 10,677 | |
| Computer and Electronic Product Manufacturing - 0.3% | | | | |
| | | | | Computer and Peripheral - 0.1% | | | | |
| | | | | CDW LLC | | | | |
| | 2,854 | | | 0.33%, 04/29/2020 | | | 2,821 | |
| | | | | Vantiv LLC | | | | |
| | 585 | | | 0.38%, 06/13/2021 | | | 588 | |
| | | | | Verint Systems, Inc. | | | | |
| | 1,676 | | | 0.35%, 09/06/2019 | | | 1,674 | |
| | | | | | | | 5,083 | |
| | | | | Semiconductor, Electronic Components - 0.2% | | | | |
| | | | | Avago Technologies Ltd. | | | | |
| | 1,500 | | | 0.38%, 05/06/2021 | | | 1,504 | |
| | | | | Freescale Semiconductor, Inc. | | | | |
| | 731 | | | 0.43%, 02/28/2020 | | | 731 | |
| | 1,393 | | | 0.50%, 01/15/2021 | | | 1,398 | |
The accompanying notes are an integral part of these financial statements.
| Hartford Total Return Bond HLS Fund |
| Schedule of Investments – (continued) |
| June 30, 2014 (Unaudited) |
| (000’s Omitted) |
| Shares or Principal Amount ╬ | Market Value ╪ | |
| Senior Floating Rate Interests ♦ - 6.2% - (continued) | | | | |
| Computer and Electronic Product Manufacturing - 0.3% - (continued) | | | | |
| | | | | Semiconductor, Electronic Components - 0.2% - (continued) | | | | |
| | | | | NXP Semiconductors Netherlands B.V. | | | | |
| $ | 1,561 | | | 0.33%, 01/11/2020 | | $ | 1,551 | |
| | | | | | | | 5,184 | |
| | | | | | | | 10,267 | |
| Finance and Insurance - 0.9% | | | | |
| | | | | Activities Related To Credit Banking - 0.1% | | | | |
| | | | | Evertec LLC | | | | |
| | 4,687 | | | 0.35%, 04/17/2020 | | | 4,610 | |
| | | | | | | | | |
| | | | | Agencies, Brokerages and Other Insurance - 0.2% | | | | |
| | | | | Cooper Gay Swett & Crawford Ltd. | | | | |
| | 807 | | | 0.50%, 04/16/2020 | | | 790 | |
| | | | | Sedgwick CMS Holdings, Inc. | | | | |
| | 5,247 | | | 0.38%, 03/01/2021 | | | 5,162 | |
| | 1,250 | | | 0.68%, 02/28/2022 | | | 1,246 | |
| | | | | USI Insurance Services LLC | | | | |
| | 1,091 | | | 0.43%, 12/27/2019 | | | 1,092 | |
| | | | | | | | 8,290 | |
| | | | | Captive Auto Finance - 0.2% | | | | |
| | | | | Chrysler Group LLC | | | | |
| | 2,545 | | | 0.33%, 12/31/2018 | | | 2,536 | |
| | 4,276 | | | 0.35%, 05/24/2017 | | | 4,289 | |
| | | | | | | | 6,825 | |
| | | | | Insurance Carriers - 0.1% | | | | |
| | | | | Asurion LLC | | | | |
| | 622 | | | 0.43%, 07/08/2020 | | | 621 | |
| | 1,231 | | | 0.50%, 05/24/2019 | | | 1,238 | |
| | 1,615 | | | 0.85%, 03/03/2021 | | | 1,674 | |
| | | | | National Financial Partners Corp. | | | | |
| | 368 | | | 0.53%, 07/01/2020 | | | 370 | |
| | | | | | | | 3,903 | |
| | | | | Other Financial Investment Activities - 0.2% | | | | |
| | | | | Harland Clarke Holdings Corp. | | | | |
| | 459 | | | 0.60%, 08/04/2019 | | | 467 | |
| | | | | Nuveen Investments, Inc. | | | | |
| | 5,975 | | | 0.41%, 05/13/2017 | | | 5,982 | |
| | | | | Ocwen Financial Corp. | | | | |
| | 415 | | | 0.50%, 02/15/2018 | | | 417 | |
| | | | | | | | 6,866 | |
| | | | | Real Estate Investment Trust (REIT) - 0.1% | | | | |
| | | | | Walter Investment Management Corp. | | | | |
| | 1,739 | | | 0.48%, 12/18/2020 | | | 1,717 | |
| | | | | | | | | |
| | | | | Securities, Commodities and Brokerage - 0.0% | | | | |
| | | | | Interactive Data Corp. | | | | |
| | 845 | | | 0.48%, 05/02/2021 | | | 852 | |
| | | | | | | | | |
| | | | | | | | 33,063 | |
| Food Manufacturing - 0.2% | | | | |
| | | | | Other Food Manufacturing - 0.2% | | | | |
| | | | | H.J. Heinz Co. | | | | |
| | 4,560 | | | 0.35%, 06/05/2020 | | | 4,592 | |
| | | | | Hearthside Food Solutions | | | | |
| | 600 | | | 0.45%, 06/02/2021 | | | 603 | |
| | | | | Hostess Brands, Inc. | | | | |
| | 364 | | | 0.68%, 04/09/2020 | | | 377 | |
| | | | | Roundy's Supermarkets, Inc. | | | | |
| | 643 | | | 0.58%, 03/03/2021 | | | 645 | |
| | | | | U.S. Foodservice, Inc. | | | | |
| | 1,141 | | | 0.45%, 03/31/2019 | | | 1,143 | |
| | | | | | | | 7,360 | |
| Food Services - 0.1% | | | | |
| | | | | Full-Service Restaurants - 0.1% | | | | |
| | | | | ARAMARK Corp. | | | | |
| | 2,015 | | | 0.33%, 02/24/2021 | | | 2,000 | |
| | | | | | | | | |
| Furniture and Related Product Manufacturing - 0.0% | | | | |
| | | | | Household, Institution Furniture, Kitchen Cabinet - 0.0% | | | | |
| | | | | Tempur-Pedic International, Inc. | | | | |
| | 990 | | | 0.35%, 03/18/2020 | | | 987 | |
| | | | | | | | | |
| | | | | Other Furniture Related Product Manufacturing - 0.0% | | | | |
| | | | | Wilsonart International Holding LLC | | | | |
| | 847 | | | 0.40%, 10/31/2019 | | | 842 | |
| | | | | | | | | |
| | | | | | | | 1,829 | |
| Health Care and Social Assistance - 0.5% | | | | |
| | | | | General Medical and Surgical Hospitals - 0.2% | | | | |
| | | | | Community Health Systems, Inc. | | | | |
| | 1,413 | | | 0.43%, 01/27/2021 | | | 1,420 | |
| | | | | DaVita HealthCare Partners, Inc. | | | | |
| | 1,845 | | | 06/24/2021 ◊☼ | | | 1,853 | |
| | | | | HCA, Inc. | | | | |
| | 1,265 | | | 0.29%, 03/31/2017 | | | 1,268 | |
| | 2,169 | | | 0.30%, 05/01/2018 | | | 2,171 | |
| | | | | | | | 6,712 | |
| | | | | Medical and Diagnostic Laboratories - 0.1% | | | | |
| | | | | American Renal Holdings, Inc. | | | | |
| | 1,219 | | | 0.45%, 08/20/2019 | | | 1,218 | |
| | | | | | | | | |
| | | | | Offices of Physicians - 0.0% | | | | |
| | | | | One Call Medical, Inc. | | | | |
| | 663 | | | 0.50%, 11/27/2020 | | | 664 | |
| | | | | | | | | |
| | | | | Outpatient Care Centers - 0.0% | | | | |
| | | | | Healogics, Inc. | | | | |
| | 375 | | | 0.53%, 06/09/2021 ☼ | | | 375 | |
| | | | | | | | | |
| | | | | Pharmaceutical and Medicine Manufacturing - 0.1% | | | | |
| | | | | Catalent Pharma Solutions, Inc. | | | | |
| | 205 | | | 0.45%, 05/20/2021 | | | 206 | |
| | | | | Ikaria Acquisition, Inc. | | | | |
| | 575 | | | 0.50%, 02/12/2021 | | | 578 | |
| | 215 | | | 0.88%, 02/14/2022 | | | 219 | |
| | | | | Mallinckrodt International Finance S.A. | | | | |
| | 1,521 | | | 0.35%, 03/19/2021 | | | 1,521 | |
| | | | | Ortho-Clinical Diagnostics, Inc. | | | | |
| | 1,610 | | | 0.48%, 06/30/2021 ☼ | | | 1,622 | |
| | | | | | | | 4,146 | |
| | | | | Scientific Research and Development Services - 0.1% | | | | |
| | | | | Grifols Worldwide Operations USA, Inc. | | | | |
| | 1,007 | | | 0.31%, 02/27/2021 | | | 1,006 | |
| | | | | IMS Health, Inc. | | | | |
| | 1,024 | | | 0.35%, 03/17/2021 | | | 1,018 | |
The accompanying notes are an integral part of these financial statements.
| Hartford Total Return Bond HLS Fund |
| Schedule of Investments – (continued) |
| June 30, 2014 (Unaudited) |
| (000’s Omitted) |
| Shares or Principal Amount ╬ | | Market Value ╪ | |
| Senior Floating Rate Interests ♦ - 6.2% - (continued) | | | | |
| Health Care and Social Assistance - 0.5% - (continued) | | | | |
| | | | | Scientific Research and Development Services - 0.1% - (continued) | | | | |
| | | | | Jazz Pharmaceuticals, Inc. | | | | |
| $ | 995 | | | 0.33%, 06/12/2018 | | $ | 994 | |
| | | | | | | | 3,018 | |
| | | | | | | | 16,133 | |
| Information - 1.1% | | | | |
| | | | | Cable and Other Program Distribution - 0.3% | | | | |
| | | | | Charter Communications Operating LLC | | | | |
| | 4,138 | | | 0.30%, 07/01/2020 - 01/03/2021 | | | 4,072 | |
| | | | | UPC Financing Partnership | | | | |
| | 1,165 | | | 0.33%, 06/30/2021 | | | 1,156 | |
| | | | | Virgin Media Finance plc | | | | |
| | 4,400 | | | 0.35%, 06/07/2020 | | | 4,385 | |
| | | | | | | | 9,613 | |
| | | | | Data Processing Services - 0.3% | | | | |
| | | | | Emdeon, Inc. | | | | |
| | 1,429 | | | 0.38%, 11/02/2018 | | | 1,432 | |
| | | | | First Data Corp. | | | | |
| | 1,820 | | | 0.42%, 09/24/2018 - 03/24/2021 | | | 1,822 | |
| | | | | First Data Corp., Extended 1st Lien Term Loan | | | | |
| | 5,740 | | | 0.42%, 03/23/2018 | | | 5,747 | |
| | | | | La Quinta Intermediate Holdings | | | | |
| | 1,376 | | | 0.40%, 04/14/2021 | | | 1,376 | |
| | | | | | | | 10,377 | |
| | | | | Software Publishers - 0.2% | | | | |
| | | | | Eagle Parent, Inc. | | | | |
| | 431 | | | 0.40%, 05/16/2018 | | | 431 | |
| | | | | Hyland Software, Inc. | | | | |
| | 369 | | | 0.48%, 02/19/2021 | | | 370 | |
| | | | | Kronos, Inc. | | | | |
| | 2,732 | | | 0.45%, 10/30/2019 | | | 2,751 | |
| | 594 | | | 0.98%, 04/30/2020 | | | 616 | |
| | | | | Lawson Software, Inc. | | | | |
| | 2,304 | | | 0.38%, 06/03/2020 | | | 2,287 | |
| | | | | Web.com Group, Inc. | | | | |
| | 775 | | | 0.45%, 10/27/2017 | | | 775 | |
| | | | | | | | 7,230 | |
| | | | | Telecommunications - Other - 0.1% | | | | |
| | | | | Zayo Group LLC | | | | |
| | 395 | | | 0.40%, 07/02/2019 | | | 395 | |
| | | | | Ziggo B.V. | | | | |
| | 1,832 | | | 01/15/2022 ◊☼ | | | 1,810 | |
| | 2,843 | | | 0.33%, 01/15/2022 ☼ | | | 2,808 | |
| | | | | | | | 5,013 | |
| | | | | Telecommunications - Wireless Carriers - 0.2% | | | | |
| | | | | Alcatel-Lucent USA, Inc. | | | | |
| | 4,184 | | | 0.45%, 01/30/2019 | | | 4,185 | |
| | | | | Light Tower Fiber LLC | | | | |
| | 535 | | | 0.40%, 04/13/2020 | | | 533 | |
| | | | | Syniverse Holdings, Inc. | | | | |
| | 1,008 | | | 0.40%, 04/23/2019 | | | 1,007 | |
| | | | | | | | 5,725 | |
| | | | | | | | 37,958 | |
| Mining - 0.2% | | | | |
| | | | | Metal Ore Mining - 0.1% | | | | |
| | | | | American Rock Salt Holdings LLC | | | | |
| | 1,445 | | | 0.48%, 05/20/2021 | | | 1,443 | |
| | | | | Fortescue Metals Group Ltd. | | | | |
| | 2,604 | | | 0.38%, 06/28/2019 | | | 2,605 | |
| | | | | | | | 4,048 | |
| | | | | Mining and Quarrying Nonmetallic Mineral - 0.1% | | | | |
| | | | | Arch Coal, Inc. | | | | |
| | 4,273 | | | 0.63%, 05/16/2018 | | | 4,195 | |
| | | | | | | | | |
| | | | | | | | 8,243 | |
| Miscellaneous Manufacturing - 0.1% | | | | |
| | | | | Aerospace Product and Parts Manufacturing - 0.1% | | | | |
| | | | | DigitalGlobe, Inc. | | | | |
| | 800 | | | 0.38%, 01/31/2020 | | | 800 | |
| | | | | Hamilton Sundstrand Corp. | | | | |
| | 934 | | | 0.40%, 12/13/2019 | | | 931 | |
| | | | | TransDigm Group, Inc. | | | | |
| | 785 | | | 0.38%, 06/04/2021 | | | 781 | |
| | | | | | | | 2,512 | |
| | | | | Miscellaneous Manufacturing - 0.0% | | | | |
| | | | | Reynolds Group Holdings, Inc. | | | | |
| | 1,724 | | | 0.40%, 11/30/2018 | | | 1,725 | |
| | | | | | | | | |
| | | | | | | | 4,237 | |
| Motor Vehicle and Parts Manufacturing - 0.1% | | | | |
| | | | | Motor Vehicle Parts Manufacturing - 0.1% | | | | |
| | | | | Tower Automotive Holdings USA LLC | | | | |
| | 2,522 | | | 0.40%, 04/23/2020 | | | 2,511 | |
| | | | | | | | | |
| Nonmetallic Mineral Product Manufacturing - 0.0% | | | | |
| | | | | Glass and Glass Product Manufacturing - 0.0% | | | | |
| | | | | Ardagh Holdings USA, Inc. | | | | |
| | 470 | | | 0.40%, 12/17/2019 | | | 470 | |
| | | | | | | | | |
| Other Services - 0.1% | | | | |
| | | | | Commercial/Industrial Machine and Equipment - 0.1% | | | | |
| | | | | Apex Tool Group LLC | | | | |
| | 447 | | | 0.45%, 01/31/2020 | | | 441 | |
| | | | | Husky International Ltd. | | | | |
| | 220 | | | 0.45%, 06/25/2021 ☼ | | | 221 | |
| | | | | Rexnord LLC | | | | |
| | 2,010 | | | 0.40%, 08/21/2020 | | | 2,007 | |
| | | | | | | | 2,669 | |
| Petroleum and Coal Products Manufacturing - 0.1% | | | | |
| | | | | Oil and Gas Extraction - 0.1% | | | | |
| | | | | Chief Exploration & Development | | | | |
| | 625 | | | 0.75%, 05/16/2021 | | | 638 | |
| | | | | Endeavour International Corp. | | | | |
| | 541 | | | 0.83%, 11/30/2017 | | | 530 | |
| | | | | Fieldwood Energy LLC | | | | |
| | 1,537 | | | 0.39%, 09/28/2018 | | | 1,542 | |
| | | | | Seadrill Ltd. | | | | |
| | 2,162 | | | 0.40%, 02/21/2021 ☼ | | | 2,147 | |
| | | | | | | | 4,857 | |
| Pipeline Transportation - 0.1% | | | | |
| | | | | Pipeline Transportation of Crude Oil - 0.0% | | | | |
| | | | | Philadelphia Energy Solutions LLC | | | | |
| | 820 | | | 0.63%, 04/04/2018 | | | 758 | |
The accompanying notes are an integral part of these financial statements.
| Hartford Total Return Bond HLS Fund |
| Schedule of Investments – (continued) |
| June 30, 2014 (Unaudited) |
| (000’s Omitted) |
| Shares or Principal Amount ╬ | | Market Value ╪ | |
| Senior Floating Rate Interests ♦ - 6.2% - (continued) | | | | |
| Pipeline Transportation - 0.1% - (continued) | | | | |
| | | | | Pipeline Transportation of Natural Gas - 0.1% | | | | |
| | | | | EP Energy LLC | | | | |
| $ | 1,404 | | | 0.45%, 04/30/2019 | | $ | 1,412 | |
| | | | | | | | | |
| | | | | | | | 2,170 | |
| Plastics and Rubber Products Manufacturing - 0.2% | | | | |
| | | | | Plastics Product Manufacturing - 0.2% | | | | |
| | | | | Berry Plastics Group, Inc. | | | | |
| | 3,333 | | | 0.35%, 02/08/2020 | | | 3,303 | |
| | | | | Consolidated Container Co. | | | | |
| | 1,179 | | | 0.50%, 07/03/2019 | | | 1,181 | |
| | | | | Entegros, Inc. | | | | |
| | 1,110 | | | 0.35%, 04/30/2021 | | | 1,101 | |
| | | | | | | | 5,585 | |
| Primary Metal Manufacturing - 0.1% | | | | |
| | | | | Alumina and Aluminum Production and Processing - 0.1% | | | | |
| | | | | Novelis, Inc. | | | | |
| | 5,197 | | | 0.38%, 03/10/2017 | | | 5,200 | |
| | | | | | | | | |
| Professional, Scientific and Technical Services - 0.1% | | | | |
| | | | | Advertising and Related Services - 0.0% | | | | |
| | | | | CBS Outdoor Americas Capital | | | | |
| | 1,060 | | | 0.30%, 01/31/2021 | | | 1,056 | |
| | | | | | | | | |
| | | | | Professional Services - Computer Sys Design and Related - 0.1% | | | | |
| | | | | MoneyGram International, Inc. | | | | |
| | 2,257 | | | 0.43%, 03/27/2020 | | | 2,224 | |
| | | | | Paradigm Ltd., Term Loan B2 | | | | |
| | 710 | | | 1.05%, 07/30/2020 | | | 718 | |
| | | | | | | | 2,942 | |
| | | | | | | | 3,998 | |
| Real Estate, Rental and Leasing - 0.2% | | | | |
| | | | | Activities Related To Real Estate - 0.1% | | | | |
| | | | | SBA Senior Finance II LLC | | | | |
| | 4,360 | | | 0.33%, 03/24/2021 | | | 4,330 | |
| | | | | | | | | |
| | | | | Industrial Machinery and Equipment Rental and Leasing - 0.1% | | | | |
| | | | | International Lease Finance Corp. | | | | |
| | 765 | | | 0.35%, 03/06/2021 | | | 765 | |
| | | | | Neff Corp. | | | | |
| | 730 | | | 0.73%, 06/09/2021 | | | 726 | |
| | | | | | | | 1,491 | |
| | | | | | | | 5,821 | |
| Retail Trade - 0.5% | | | | |
| | | | | Automobile Dealers - 0.0% | | | | |
| | | | | TI Automotive Ltd. | | | | |
| | 913 | | | 0.55%, 03/28/2019 | | | 913 | |
| | | | | | | | | |
| | | | | Automotive Parts, Accessories and Tire Stores - 0.1% | | | | |
| | | | | Affinia Group, Inc. | | | | |
| | 601 | | | 0.48%, 04/25/2020 | | | 607 | |
| | | | | Cooper-Standard Automotive, Inc. | | | | |
| | 780 | | | 0.40%, 04/04/2021 | | | 779 | |
| | | | | | | | 1,386 | |
| | | | | Building Material and Supplies Dealers - 0.1% | | | | |
| | | | | American Builders & Contractors Supply Co., Inc. | | | | |
| | 933 | | | 0.35%, 04/16/2020 | | | 930 | |
| | | | | Mauser-Werke GmbH | | | | |
| | 405 | | | 0.45%, 06/25/2021 ☼ | | | 405 | |
| | | | | Southwire Co. | | | | |
| | 2,665 | | | 0.33%, 02/10/2021 | | | 2,659 | |
| | | | | | | | 3,994 | |
| | | | | Clothing Stores - 0.0% | | | | |
| | | | | Lands' End, Inc. | | | | |
| | 795 | | | 0.43%, 04/04/2021 | | | 794 | |
| | | | | | | | | |
| | | | | Department Stores - 0.1% | | | | |
| | | | | Neiman Marcus (The) Group, Inc. | | | | |
| | 1,579 | | | 0.43%, 10/25/2020 | | | 1,575 | |
| | | | | | | | | |
| | | | | Grocery Stores - 0.0% | | | | |
| | | | | Sprouts Farmers Markets Holdings LLC | | | | |
| | 483 | | | 0.40%, 04/23/2020 | | | 484 | |
| | | | | | | | | |
| | | | | Other Miscellaneous Store Retailers - 0.0% | | | | |
| | | | | Rite Aid Corp. | | | | |
| | 703 | | | 0.35%, 02/21/2020 | | | 702 | |
| | 250 | | | 0.58%, 08/21/2020 | | | 255 | |
| | | | | | | | 957 | |
| | | | | Specialty Food Stores - 0.1% | | | | |
| | | | | Weight Watchers International, Inc. | | | | |
| | 5,890 | | | 0.40%, 04/02/2020 | | | 4,664 | |
| | | | | | | | | |
| | | | | Sporting Goods, Hobby and Musical Instrument Store - 0.1% | | | | |
| | | | | Michaels Stores, Inc. | | | | |
| | 1,015 | | | 0.38%, 01/28/2020 | | | 1,011 | |
| | 1,155 | | | 0.40%, 01/28/2020 ☼ | | | 1,155 | |
| | | | | | | | 2,166 | |
| | | | | | | | 16,933 | |
| Truck Transportation - 0.0% | | | | |
| | | | | Freight Trucking - General - 0.0% | | | | |
| | | | | Nexeo Solutions LLC | | | | |
| | 644 | | | 0.50%, 09/09/2017 | | | 644 | |
| | | | | | | | | |
| Utilities - 0.3% | | | | |
| | | | | Electric Generation, Transmission and Distribution - 0.3% | | | | |
| | | | | Calpine Corp. | | | | |
| | 2,388 | | | 0.33%, 01/31/2022 | | | 2,363 | |
| | | | | Dynegy, Inc. | | | | |
| | 545 | | | 0.40%, 04/23/2020 | | | 546 | |
| | | | | Energy Future Holdings | | | | |
| | 600 | | | 0.43%, 06/19/2016 | | | 604 | |
| | | | | Star West Generation LLC | | | | |
| | 2,915 | | | 0.43%, 03/13/2020 | | | 2,920 | |
| | | | | Texas Competitive Electric Holdings Co. LLC | | | | |
| | 751 | | | 0.15%, 05/05/2016 ☼Б | | | 755 | |
| | 1,862 | | | 0.38%, 05/05/2016 | | | 1,872 | |
| | 800 | | | 0.00%, 10/10/2017 Ω | | | 654 | |
| | | | | | | | 9,714 | |
The accompanying notes are an integral part of these financial statements.
| Hartford Total Return Bond HLS Fund |
| Schedule of Investments – (continued) |
| June 30, 2014 (Unaudited) |
| (000’s Omitted) |
| Shares or Principal Amount ╬ | | Market Value ╪ | |
| Senior Floating Rate Interests ♦ - 6.2% - (continued) | | | |
| Wholesale Trade - 0.1% | | | | |
| | | | | Miscellaneous Durable Goods Wholesalers - 0.1% | | | | |
| | | | | Gates Global LLC | | | | |
| $ | 1,900 | | | 0.43%, 06/11/2021 ☼ | | | 1,893 | |
| | | | | | | | | |
| | | | | Total Senior Floating Rate Interests | | | | |
| | | | | (Cost $218,069) | | $ | 217,102 | |
| | | | | | | | | |
| U.S. Government Agencies - 40.5% | | |
| | | | | FHLMC - 7.9% | | | | |
| $ | 70,548 | | | 0.37%, 10/25/2020 ► | | $ | 1,111 | |
| | 33,161 | | | 2.00%, 08/25/2018 ► | | | 2,357 | |
| | 34,700 | | | 3.00%, 07/15/2027 - 07/15/2044 ☼ | | | 35,052 | |
| | 34,500 | | | 3.50%, 07/15/2044 ☼ | | | 35,462 | |
| | 55,322 | | | 4.00%, 08/01/2025 - 07/15/2044 | | | 58,772 | |
| | 60,900 | | | 4.50%, 07/15/2044 ☼ | | | 65,911 | |
| | 22,800 | | | 5.00%, 07/15/2044 ☼ | | | 25,237 | |
| | 35,628 | | | 5.50%, 10/01/2018 - 06/01/2041 | | | 39,742 | |
| | 12,738 | | | 6.00%, 04/01/2017 - 11/01/2037 | | | 14,378 | |
| | 522 | | | 6.50%, 07/01/2031 - 12/01/2037 | | | 588 | |
| | 4 | | | 7.50%, 09/01/2029 - 11/01/2031 | | | 5 | |
| | | | | | | | 278,615 | |
| | | | | FNMA - 24.8% | | | | |
| | 7,583 | | | 2.14%, 11/01/2022 | | | 7,327 | |
| | 10,579 | | | 2.15%, 10/01/2022 | | | 10,282 | |
| | 5,083 | | | 2.20%, 12/01/2022 | | | 4,931 | |
| | 2,957 | | | 2.28%, 11/01/2022 | | | 2,880 | |
| | 131 | | | 2.29%, 10/01/2022 | | | 128 | |
| | 2,510 | | | 2.34%, 11/01/2022 | | | 2,453 | |
| | 2,306 | | | 2.40%, 10/01/2022 | | | 2,266 | |
| | 3,005 | | | 2.42%, 10/01/2022 - 11/01/2022 | | | 2,957 | |
| | 135 | | | 2.44%, 01/01/2023 | | | 133 | |
| | 116 | | | 2.45%, 08/01/2022 | | | 114 | |
| | 2,029 | | | 2.47%, 11/01/2022 | | | 2,002 | |
| | 22,337 | | | 2.50%, 01/01/2043 - 07/15/2044 ☼ | | | 21,199 | |
| | 131 | | | 2.66%, 09/01/2022 | | | 132 | |
| | 1,150 | | | 2.76%, 05/01/2021 | | | 1,171 | |
| | 183 | | | 2.78%, 04/01/2022 | | | 186 | |
| | 182 | | | 2.98%, 01/01/2022 | | | 188 | |
| | 115,120 | | | 3.00%, 07/15/2029 - 07/15/2044 ☼ | | | 114,719 | |
| | 141 | | | 3.20%, 04/01/2022 | | | 147 | |
| | 1,055 | | | 3.21%, 05/01/2023 | | | 1,092 | |
| | 1,488 | | | 3.26%, 05/01/2024 | | | 1,542 | |
| | 575 | | | 3.34%, 04/01/2024 | | | 597 | |
| | 220 | | | 3.45%, 01/01/2024 | | | 230 | |
| | 234 | | | 3.47%, 01/01/2024 | | | 245 | |
| | 166,100 | | | 3.50%, 07/15/2029 - 07/15/2044 ☼ | | | 171,324 | |
| | 584 | | | 3.67%, 08/01/2023 | | | 623 | |
| | 155 | | | 3.70%, 10/01/2023 | | | 165 | |
| | 2,099 | | | 3.74%, 06/01/2026 | | | 2,208 | |
| | 210 | | | 3.76%, 03/01/2024 | | | 222 | |
| | 480 | | | 3.86%, 11/01/2023 - 12/01/2025 | | | 516 | |
| | 555 | | | 3.87%, 10/01/2025 | | | 588 | |
| | 705 | | | 3.89%, 05/01/2030 | | | 736 | |
| | 730 | | | 3.93%, 10/01/2023 | | | 789 | |
| | 310 | | | 3.96%, 05/01/2034 | | | 321 | |
| | 195 | | | 3.97%, 05/01/2029 | | | 206 | |
| | 182,691 | | | 4.00%, 06/01/2025 - 07/15/2044 ☼ | | | 193,972 | |
| | 2,916 | | | 4.02%, 11/01/2028 | | | 3,098 | |
| | 469 | | | 4.06%, 10/01/2028 | | | 501 | |
| | 213,821 | | | 4.50%, 04/01/2025 - 07/15/2044 ☼ | | | 231,619 | |
| | 37,756 | | | 5.00%, 02/01/2018 - 07/15/2044 ☼ | | | 41,543 | |
| | 32,119 | | | 5.50%, 01/01/2017 - 01/01/2037 | | | 35,980 | |
| | 7,550 | | | 5.50%, 06/25/2042 ► | | | 1,709 | |
| | 7,844 | | | 6.00%, 04/01/2016 - 02/01/2037 | | | 8,855 | |
| | 12 | | | 6.50%, 11/01/2014 - 07/01/2032 | | | 13 | |
| | 235 | | | 7.00%, 02/01/2016 - 10/01/2037 | | | 265 | |
| | 247 | | | 7.50%, 11/01/2015 - 05/01/2032 | | | 282 | |
| | 2 | | | 8.00%, 04/01/2032 | | | 2 | |
| | | | | | | | 872,458 | |
| | | | | GNMA - 7.8% | | | | |
| | 9,700 | | | 3.00%, 07/15/2044 ☼ | | | 9,773 | |
| | 67,921 | | | 3.50%, 11/15/2042 - 07/15/2044 ☼ | | | 70,696 | |
| | 64,295 | | | 4.00%, 07/20/2040 - 12/20/2040 | | | 68,915 | |
| | 70,007 | | | 4.50%, 11/15/2039 - 07/15/2044 ☼ | | | 76,520 | |
| | 7,481 | | | 5.00%, 05/20/2040 - 07/15/2044 ☼ | | | 8,245 | |
| | 7,668 | | | 5.50%, 03/15/2033 - 10/20/2034 | | | 8,656 | |
| | 23,976 | | | 6.00%, 12/15/2023 - 07/15/2044 ☼ | | | 27,067 | |
| | 5,187 | | | 6.50%, 06/15/2028 - 09/15/2032 | | | 5,926 | |
| | 20 | | | 7.00%, 06/20/2030 - 08/15/2031 | | | 22 | |
| | 1 | | | 8.50%, 11/15/2024 | | | 1 | |
| | | | | | | | 275,821 | |
| | | | | Total U.S. Government Agencies | | | | |
| | | | | (Cost $1,407,207) | | $ | 1,426,894 | |
| | | | | | | | | |
| U.S. Government Securities - 19.4% | | | | |
| U.S. Treasury Securities - 19.4% | | | | |
| | | | | U.S. Treasury Bonds - 6.0% | | | | |
| $ | 20,425 | | | 1.38%, 02/15/2044 ◄╦ | | $ | 22,851 | |
| | 23,750 | | | 3.38%, 05/15/2044 | | | 23,910 | |
| | 49,380 | | | 3.63%, 02/15/2044 | | | 52,111 | |
| | 105,965 | | | 3.75%, 11/15/2043 ╦ | | | 114,442 | |
| | 3 | | | 4.75%, 02/15/2041 | | | 4 | |
| | | | | | | | 213,318 | |
| | | | | U.S. Treasury Notes - 13.4% | | | | |
| | 225,495 | | | 0.13%, 04/15/2018 - 04/15/2019 ◄‡ | | | 237,108 | |
| | 36,110 | | | 0.25%, 07/31/2015 □Є | | | 36,148 | |
| | 75,085 | | | 0.63%, 01/15/2024 ◄‡ | | | 79,054 | |
| | 105,375 | | | 0.88%, 04/30/2017 □Є | | | 105,564 | |
| | 9,319 | | | 1.00%, 10/31/2016 □Є | | | 9,406 | |
| | 2,475 | | | 1.63%, 04/30/2019 | | | 2,480 | |
| | 1,820 | | | 2.50%, 05/15/2024 | | | 1,818 | |
| | 5 | | | 2.75%, 02/15/2024 | | | 5 | |
| | | | | | | | 471,583 | |
| | | | | | | | 684,901 | |
| | | | | Total U.S. Government Securities | | | | |
| | | | | (Cost $669,306) | | $ | 684,901 | |
| | | | | | | | | |
| Preferred Stocks - 0.1% | | | |
| | | | | Consumer Finance - 0.0% | | | | |
| | 12 | | | Discover Financial Services | | $ | 311 | |
| | | | | | | | | |
| | | | | Diversified Banks - 0.0% | | | | |
| | 2 | | | U.S. Bancorp | | | 1,865 | |
| | | | | | | | | |
| | | | | Other Diversified Financial Services - 0.1% | | | | |
| | 68 | | | Citigroup Capital XIII | | | 1,891 | |
The accompanying notes are an integral part of these financial statements.
| Hartford Total Return Bond HLS Fund |
| Schedule of Investments – (continued) |
| June 30, 2014 (Unaudited) |
| (000’s Omitted) |
| Shares or Principal Amount ╬ | | | | | Market Value ╪ | |
| Preferred Stocks - 0.1% - (continued) | | | | | | | | |
| | | | | Property and Casualty Insurance - 0.0% | | | | | | | | |
| | 11 | | | Allstate (The) Corp. | | | | | | $ | 277 | |
| | | | | | | | | | | | | |
| | | | | Total Preferred Stocks | | | | | | | | |
| | | | | (Cost $4,074) | | | | | | $ | 4,344 | |
| | | | | | | | | | | | | |
| | | | | Total Long-Term Investments Excluding Purchased Options | | | | | | | | |
| | | | | (Cost $4,385,519) | | | | | | $ | 4,513,525 | |
| | | | | | | | | | | | | |
| Short-Term Investments - 2.2% | | | | | | | | |
| Repurchase Agreements - 2.2% | | | | | | | | |
| | | | | Bank of America Merrill Lynch TriParty
Repurchase Agreement (maturing on
07/01/2014 in the amount of $6,597,
collateralized by FHLMC 2.23% - 5.99%, 2030
- 2044, FNMA 2.31% - 6.34%, 2020 - 2042,
value of $6,729) | | | | | | | | |
| $ | 6,597 | | | 0.10%, 6/30/2014 | | | | | | $ | 6,597 | |
| | | | | Bank of Montreal TriParty Repurchase
Agreement (maturing on 07/01/2014 in the
amount of $10,079, collateralized by U.S.
Treasury Bill 0.13%, 2015, U.S. Treasury Bond
2.75% - 10.63%, 2015 - 2044, U.S. Treasury
Note 0.13% - 4.50%, 2014 - 2024, value of
$10,280) | | | | | | | | |
| | 10,079 | | | 0.09%, 6/30/2014 | | | | | | | 10,079 | |
| | | | | Bank of Montreal TriParty Repurchase Agreement
(maturing on 07/01/2014 in the amount of
$4,298, collateralized by FHLMC 2.00% -
5.50%, 2018 - 2041, FNMA 2.00% - 4.50%,
2026 - 2042, GNMA 3.00% - 4.00%, 2042 -
2043, U.S. Treasury Bill 0.05%, 2014, U.S.
Treasury Note 0.75%, 2018, value of $4,384) | | | | | | | | |
| | 4,298 | | | 0.11%, 6/30/2014 | | | | | | | 4,298 | |
| | | | | Barclays Capital TriParty Repurchase Agreement
(maturing on 07/01/2014 in the amount of
$3,976, collateralized by U.S. Treasury Note
0.63% - 0.88%, 2018 - 2019, value of $4,055) | | | | | | | | |
| | 3,976 | | | 0.07%, 6/30/2014 | | | | | | | 3,976 | |
| | | | | Citigroup Global Markets, Inc. TriParty
Repurchase Agreement (maturing on
07/01/2014 in the amount of $9,159,
collateralized by U.S. Treasury Bond 4.38% -
7.50%, 2016 - 2040, U.S. Treasury Note 0.50%
- 3.00%, 2014 - 2020, value of $9,342) | | | | | | | | |
| | 9,159 | | | 0.06%, 6/30/2014 | | | | | | | 9,159 | |
| | | | | RBS Securities Inc. TriParty Repurchase
Agreement (maturing on 07/01/2014 in the
amount of $14,037, collateralized by U.S.
Treasury Note 0.38% - 3.13%, 2015 - 2022,
value of $14,318) | | | | | | | | |
| | 14,037 | | | 0.08%, 6/30/2014 | | | | | | | 14,037 | |
| | | | | TD Securities TriParty Repurchase Agreement
(maturing on 07/01/2014 in the amount of
$29,218, collateralized by FHLMC 3.50% -
4.00%, 2026 - 2044, FNMA 2.50% - 5.00%,
2025 - 2043, value of $29,802) | | | | | | | | |
| | 29,217 | | | 0.11%, 6/30/2014 | | | | | | | 29,217 | |
| | | | | UBS Securities Repurchase Agreement (maturing
on 07/01/2014 in the amount of $120,
collateralized by U.S. Treasury Note 2.13%,
2020, value of $123) | | | | | | | | |
| 120 | | | 0.05%, 6/30/2014 | | | | | | | 120 | |
| | | | | | | | | | | | 77,483 | |
| | | | | Total Short-Term Investments | | | | | | | | |
| | | | | (Cost $77,483) | | | | | | $ | 77,483 | |
| | | | | | | | | | | | | |
| | | | | Total Investments Excluding Purchased Options | | | | | | | | |
| | | | | (Cost $4,463,002) | | | 130.2 | % | | $ | 4,591,008 | |
| | | | | Total Purchased Options | | | | | | | | |
| | | | | (Cost $13,486) | | | 0.4 | % | | | 13,958 | |
| | | | | Total Investments | | | | | | | | |
| | | | | (Cost $4,476,488) ▲ | | | 130.6 | % | | $ | 4,604,966 | |
| | | | | Other Assets and Liabilities | | | (30.6 | )% | | | (1,077,958 | ) |
| | | | | Total Net Assets | | | 100.0 | % | | $ | 3,527,008 | |
The accompanying notes are an integral part of these financial statements.
| Hartford Total Return Bond HLS Fund |
| Schedule of Investments – (continued) |
| June 30, 2014 (Unaudited) |
| (000’s Omitted) |
Note: Percentage of investments as shown is the ratio of the total market value to total net assets.
| ▲ | At June 30, 2014, the cost of securities for federal income tax purposes was $4,477,354 and the aggregate gross unrealized appreciation and depreciation based on that cost were: |
| Unrealized Appreciation | | $ | 142,808 | |
| Unrealized Depreciation | | | (15,196 | ) |
| Net Unrealized Appreciation | | $ | 127,612 | |
| ╬ | All principal or contracts amounts are in U.S. dollars unless otherwise indicated. |
| Ω | Debt security in default due to bankruptcy. |
| Δ | Variable rate securities; the rate reported is the coupon rate in effect at June 30, 2014. |
| ○ | The interest rate disclosed for these securities represents the effective yield on the date of the acquisition. |
| ► | Securities disclosed are interest-only strips. |
| ◄ | The principal amount for this security is adjusted for inflation and the interest payments equal a fixed percentage of the inflation-adjusted principal amount. |
| ◊ | All or a portion of this position represents an unsettled loan commitment. The coupon rate will be determined at time of settlement. |
| ♦ | Senior floating rate interests generally pay interest rates which are periodically adjusted by reference to a base short-term, floating lending rate plus a premium. The base lending rates are primarily the LIBOR, and secondarily the prime rate offered by one or more major United States banks (the "Prime Rate") and the certificate of deposit rate or other base lending rates used by commercial lenders. Senior floating rate interests often require prepayments from excess cash flows or permit the borrower to repay at its election. The rate at which the borrower repays cannot be predicted with accuracy. As a result, the actual remaining maturity may be substantially less than the stated maturities shown. Unless otherwise noted, the interest rate disclosed for these securities represents the average coupon as of June 30, 2014. |
| Б | This security, or a portion of this security, has unfunded loan commitments. As of June 30, 2014, the aggregate value of the unfunded commitment was $751, which rounds to zero percent of total net assets. |
| ■ | Securities issued within terms of a private placement memorandum, exempt from registration under Rule 144A under the Securities Act of 1933, as amended, and may be sold only to qualified institutional buyers. Unless otherwise indicated, these holdings are determined to be liquid. At June 30, 2014, the aggregate value of these securities was $628,270, which represents 17.8% of total net assets. |
| § | These securities were sold to the Fund under Regulation S, rules governing offers and sales made outside the United States without registration under the Securities Act of 1933, as amended. The Fund may only be able to resell these securities in the United States if an exemption from registration under the federal and state securities laws is available, or the Fund may only be able to sell these securities outside of the United States (such as on a foreign exchange) to a non-U.S. person. Unless otherwise indicated, these holdings are determined to be liquid. At June 30, 2014, the aggregate value of these securities was $7,432, which represents 0.2% of total net assets. |
| ♠ | Perpetual maturity security. Maturity date shown is the next call date or final legal maturity date, whichever comes first. |
| ☼ | This security, or a portion of this security, was purchased on a when-issued, delayed-delivery or delayed-draw basis. The cost of these securities was $1,010,318 at June 30, 2014. |
| ‡ | This security, or a portion of this security, has been segregated to cover funding requirements on investment transactions settling in the future. |
| ╦ | This security, or a portion of this security, has been pledged as collateral in connection with OTC swap contracts. Securities valued at $6,620, held on behalf of the Fund at the custody bank, were designated by broker(s) as collateral in connection with OTC swap contracts. Since the broker retains legal title to the securities, the securities are not considered an asset of the Fund. |
| Є | This security, or a portion of this security, has been pledged as collateral in connection with centrally cleared swap contracts. |
| □ | This security, or a portion of this security, is pledged as initial margin deposit and collateral for daily variation margin loss on open futures contracts held at June 30, 2014. |
Cash pledged and received as collateral in connection with derivatives at June 30, 2014.
| | | Pledged | | | Received | |
| OTC swaps contracts | | $ | – | | | $ | 26,732 | |
| Total | | $ | – | | | $ | 26,732 | |
The accompanying notes are an integral part of these financial statements.
| Hartford Total Return Bond HLS Fund |
| Schedule of Investments – (continued) |
| June 30, 2014 (Unaudited) |
| (000’s Omitted) |
OTC Swaption Contracts Outstanding at June 30, 2014
| Description | | Counter -
party | | Risk
Exposure
Category | | Exercise Price/ FX Rate/
Rate | | | Expiration
Date | | Number of
Contracts * | | | Market
Value ╪ | | | Premiums
Paid by
Fund | | | Unrealized
Appreciation
(Depreciation) | |
| Purchased swaption contracts: |
| Call swaption contracts |
| Interest Rate Swaption | | | DEUT | | IR | | | 4.42 | % | | 11/27/23 | | USD | 9,785,000 | | | $ | 1,605 | | | $ | 1,033 | | | $ | 572 | |
| Interest Rate Swaption | | | DEUT | | IR | | | 3.94 | % | | 04/15/24 | | USD | 16,700,000 | | | | 2,032 | | | | 1,865 | | | | 167 | |
| Interest Rate Swaption | | | BOA | | IR | | | 0.73 | % | | 08/28/14 | | USD | 153,850,000 | | | | 281 | | | | 434 | | | | (153 | ) |
| Interest Rate Swaption | | | BOA | | IR | | | 0.75 | % | | 09/05/14 | | USD | 65,590,000 | | | | 130 | | | | 193 | | | | (63 | ) |
| Interest Rate Swaption | | | BOA | | IR | | | 4.42 | % | | 11/27/23 | | USD | 9,785,000 | | | | 1,608 | | | | 1,037 | | | | 571 | |
| Interest Rate Swaption | | | JPM | | IR | | | 0.71 | % | | 08/28/14 | | USD | 119,990,000 | | | | 192 | | | | 336 | | | | (144 | ) |
| Interest Rate Swaption | | | JPM | | IR | | | 4.51 | % | | 01/08/24 | | USD | 10,345,000 | | | | 1,786 | | | | 1,033 | | | | 753 | |
| Interest Rate Swaption | | | JPM | | IR | | | 4.49 | % | | 01/09/24 | | USD | 8,455,000 | | | | 1,441 | | | | 846 | | | | 595 | |
| Total call swaption contracts | | | | | | | | | | | | | 394,500,000 | | | $ | 9,075 | | | $ | 6,777 | | | $ | 2,298 | |
| Put swaption contracts |
| Interest Rate Swaption | | | DEUT | | IR | | | 4.42 | % | | 11/27/23 | | USD | 9,785,000 | | | $ | 736 | | | $ | 1,033 | | | $ | (297 | ) |
| Interest Rate Swaption | | | DEUT | | IR | | | 3.94 | % | | 04/15/24 | | USD | 16,700,000 | | | | 1,702 | | | | 1,865 | | | | (163 | ) |
| Interest Rate Swaption | | | BOA | | IR | | | 4.42 | % | | 11/27/23 | | USD | 9,785,000 | | | | 735 | | | | 1,037 | | | | (302 | ) |
| Interest Rate Swaption | | | JPM | | IR | | | 3.50 | % | | 04/29/15 | | USD | 50,860,000 | | | | 365 | | | | 895 | | | | (530 | ) |
| Interest Rate Swaption | | | JPM | | IR | | | 4.51 | % | | 01/08/24 | | USD | 10,345,000 | | | | 735 | | | | 1,032 | | | | (297 | ) |
| Interest Rate Swaption | | | JPM | | IR | | | 4.49 | % | | 01/09/24 | | USD | 8,455,000 | | | | 610 | | | | 847 | | | | (237 | ) |
| Total put swaption contracts | | | | | | | | | | | | | 105,930,000 | | | $ | 4,883 | | | $ | 6,709 | | | $ | (1,826 | ) |
| Total purchased swaption contracts | | | | | | | | | | | | | 500,430,000 | | | $ | 13,958 | | | $ | 13,486 | | | $ | 472 | |
* The number of contracts does not omit 000's.
Futures Contracts Outstanding at June 30, 2014
| | | Number of | | | Expiration | | | Notional | | | Market | | | Unrealized
Appreciation/(Depreciation) | | | Variation Margin | |
| Description | | Contracts* | | | Date | | | Amount | | | Value ╪ | | | Asset | | | Liability | | | Asset | | | Liability | |
| Long position contracts: |
| U.S. Treasury 2-Year Note Future | | | 351 | | | | 09/30/2014 | | | $ | 77,122 | | | $ | 77,077 | | | $ | – | | | $ | (45 | ) | | $ | 11 | | | $ | – | |
| U.S. Treasury 30-Year Bond Future | | | 1,111 | | | | 09/19/2014 | | | | 153,126 | | | | 152,415 | | | | – | | | | (711 | ) | | | 312 | | | | – | |
| U.S. Treasury 5-Year Note Future | | | 3,185 | | | | 09/30/2014 | | | | 379,777 | | | | 380,483 | | | | 706 | | | | – | | | | 224 | | | | – | |
| Total | | | | | | | | | | | | | | | | | | $ | 706 | | | $ | (756 | ) | | $ | 547 | | | $ | – | |
| Short position contracts: |
| 90-Day Eurodollar Future | | | 1,075 | | | | 12/19/2016 | | | $ | 263,199 | | | $ | 263,442 | | | $ | – | | | $ | (243 | ) | | $ | – | | | $ | (54 | ) |
| Euro-BUND Future | | | 7 | | | | 09/08/2014 | | | | 1,396 | | | | 1,409 | | | | – | | | | (13 | ) | | | – | | | | – | |
| U.S. Treasury 10-Year Note Future | | | 6,474 | | | | 09/19/2014 | | | | 809,599 | | | | 810,363 | | | | – | | | | (764 | ) | | | – | | | | (506 | ) |
| U.S. Treasury CME Ultra Long Term Bond Future | | | 1,210 | | | | 09/19/2014 | | | | 180,150 | | | | 181,424 | | | | – | | | | (1,274 | ) | | | – | | | | (794 | ) |
| Total | | | | | | | | | | | | | | | | | | $ | – | | | $ | (2,294 | ) | | $ | – | | | $ | (1,354 | ) |
| Total futures contracts | | | | | | | | | | | | | | | | | | $ | 706 | | | $ | (3,050 | ) | | $ | 547 | | | $ | (1,354 | ) |
* The number of contracts does not omit 000's.
The accompanying notes are an integral part of these financial statements.
| Hartford Total Return Bond HLS Fund |
| Schedule of Investments – (continued) |
| June 30, 2014 (Unaudited) |
| (000’s Omitted) |
OTC Credit Default Swap Contracts Outstanding at June 30, 2014
| | | Counter- | | Notional | | | (Pay)/ Receive Fixed
Rate/ Implied | | | Expiration | | Upfront
Premiums | | | Upfront
Premiums | | | Market | | | Unrealized Appreciation/
(Depreciation) | |
| Reference Entity | | party | | Amount (a) | | | Credit Spread (b) | | | Date | | Paid | | | Received | | | Value ╪ | | | Asset | | | Liability | |
| Credit default swaps on indices: |
| Buy protection: |
| ABX.HE.AA.6 | | BCLY | | USD | 3,910 | | | | (0.32)% | | | 07/25/45 | | $ | 1,461 | | | $ | – | | | $ | 844 | | | $ | – | | | $ | (617 | ) |
| ABX.HE.AAA.6 | | BCLY | | USD | 9,924 | | | | (0.18)% | | | 07/25/45 | | | 1,038 | | | | – | | | | 258 | | | | – | | | | (780 | ) |
| ABX.HE.AAA.6 | | BCLY | | USD | 388 | | | | (0.11)% | | | 05/25/46 | | | 78 | | | | – | | | | 77 | | | | – | | | | (1 | ) |
| ABX.HE.AAA.6 | | BOA | | USD | 4,976 | | | | (0.18)% | | | 07/25/45 | | | 270 | | | | – | | | | 129 | | | | – | | | | (141 | ) |
| ABX.HE.AAA.6 | | BOA | | USD | 4,852 | | | | (0.11)% | | | 05/25/46 | | | 1,029 | | | | – | | | | 964 | | | | – | | | | (65 | ) |
| ABX.HE.AAA.6 | | CSI | | USD | 2,426 | | | | (0.11)% | | | 05/25/46 | | | 581 | | | | – | | | | 482 | | | | – | | | | (99 | ) |
| ABX.HE.AAA.6 | | DEUT | | USD | 1,815 | | | | (0.11)% | | | 05/25/46 | | | 430 | | | | – | | | | 361 | | | | – | | | | (69 | ) |
| ABX.HE.AAA.6 | | GSC | | USD | 2,815 | | | | (0.18)% | | | 07/25/45 | | | 230 | | | | – | | | | 73 | | | | – | | | | (157 | ) |
| ABX.HE.AAA.6 | | JPM | | USD | 4,204 | | | | (0.18)% | | | 07/25/45 | | | 105 | | | | – | | | | 109 | | | | 4 | | | | – | |
| ABX.HE.AAA.6 | | JPM | | USD | 3,074 | | | | (0.18)% | | | 07/25/45 | | | 116 | | | | – | | | | 80 | | | | – | | | | (36 | ) |
| ABX.HE.AAA.6 | | JPM | | USD | 1,523 | | | | (0.11)% | | | 05/25/46 | | | 312 | | | | – | | | | 303 | | | | – | | | | (9 | ) |
| ABX.HE.AAA.6 | | MSC | | USD | 4,565 | | | | (0.18)% | | | 07/25/45 | | | 335 | | | | – | | | | 119 | | | | – | | | | (216 | ) |
| ABX.HE.AAA.7 | | CSI | | USD | 4,672 | | | | (0.09)% | | | 08/25/37 | | | 1,383 | | | | – | | | | 1,400 | | | | 17 | | | | – | |
| ABX.HE.AAA.7 | | JPM | | USD | 154 | | | | (0.09)% | | | 08/25/37 | | | 45 | | | | – | | | | 46 | | | | 1 | | | | – | |
| ABX.HE.PENAAA.6 | | BCLY | | USD | 876 | | | | (0.11)% | | | 05/25/46 | | | 144 | | | | – | | | | 123 | | | | – | | | | (21 | ) |
| ABX.HE.PENAAA.6 | | BOA | | USD | 2,286 | | | | (0.11)% | | | 05/25/46 | | | 520 | | | | – | | | | 320 | | | | – | | | | (200 | ) |
| ABX.HE.PENAAA.6 | | GSC | | USD | 2,152 | | | | (0.11)% | | | 05/25/46 | | | 538 | | | | – | | | | 301 | | | | – | | | | (237 | ) |
| ABX.HE.PENAAA.6 | | JPM | | USD | 3,884 | | | | (0.11)% | | | 05/25/46 | | | 947 | | | | – | | | | 543 | | | | – | | | | (404 | ) |
| ABX.HE.PENAAA.6 | | JPM | | USD | 1,359 | | | | (0.11)% | | | 05/25/46 | | | 189 | | | | – | | | | 190 | | | | 1 | | | | – | |
| ABX.HE.PENAAA.6 | | MSC | | USD | 2,711 | | | | (0.11)% | | | 05/25/46 | | | 657 | | | | – | | | | 379 | | | | – | | | | (278 | ) |
| ABX.HE.PENAAA.7 | | JPM | | USD | 3,188 | | | | (0.09)% | | | 08/25/37 | | | 1,311 | | | | – | | | | 735 | | | | – | | | | (576 | ) |
| CDX.EM.21 | | GSC | | USD | 26,920 | | | | (5.00)% | | | 06/20/19 | | | – | | | | (2,771 | ) | | | (3,214 | ) | | | – | | | | (443 | ) |
| CMBX.NA.A.6 | | CSI | | USD | 2,750 | | | | (2.00)% | | | 05/11/63 | | | – | | | | (21 | ) | | | (57 | ) | | | – | | | | (36 | ) |
| CMBX.NA.AA.1 | | UBS | | USD | 11,825 | | | | (0.25)% | | | 10/12/52 | | | 2,552 | | | | – | | | | 1,593 | | | | – | | | | (959 | ) |
| CMBX.NA.AA.2 | | BOA | | USD | 9,023 | | | | (0.15)% | | | 03/15/49 | | | 3,429 | | | | – | | | | 2,569 | | | | – | | | | (860 | ) |
| CMBX.NA.AA.2 | | CSI | | USD | 5,212 | | | | (0.15)% | | | 03/15/49 | | | 1,691 | | | | – | | | | 1,484 | | | | – | | | | (207 | ) |
| CMBX.NA.AA.2 | | DEUT | | USD | 702 | | | | (0.15)% | | | 03/15/49 | | | 251 | | | | – | | | | 200 | | | | – | | | | (51 | ) |
| CMBX.NA.AA.2 | | GSC | | USD | 2,140 | | | | (0.15)% | | | 03/15/49 | | | 780 | | | | – | | | | 610 | | | | – | | | | (170 | ) |
| CMBX.NA.AA.2 | | JPM | | USD | 979 | | | | (0.15)% | | | 03/15/49 | | | 369 | | | | – | | | | 279 | | | | – | | | | (90 | ) |
| CMBX.NA.AA.2 | | MSC | | USD | 2,341 | | | | (0.15)% | | | 03/15/49 | | | 867 | | | | – | | | | 667 | | | | – | | | | (200 | ) |
| CMBX.NA.AA.7 | | BOA | | USD | 765 | | | | (1.50)% | | | 01/17/47 | | | – | | | | (9 | ) | | | (9 | ) | | | – | | | | – | |
| CMBX.NA.AA.7 | | CSI | | USD | 4,330 | | | | (1.50)% | | | 01/17/47 | | | – | | | | (43 | ) | | | (49 | ) | | | – | | | | (6 | ) |
| CMBX.NA.AA.7 | | CSI | | USD | 2,725 | | | | (1.50)% | | | 01/17/47 | | | 11 | | | | – | | | | (31 | ) | | | – | | | | (42 | ) |
| CMBX.NA.AA.7 | | MSC | | USD | 1,745 | | | | (1.50)% | | | 01/17/47 | | | – | | | | (15 | ) | | | (20 | ) | | | – | | | | (5 | ) |
| CMBX.NA.AA.7 | | MSC | | USD | 1,655 | | | | (1.50)% | | | 01/17/47 | | | – | | | | (20 | ) | | | (19 | ) | | | 1 | | | | – | |
| CMBX.NA.AJ.1 | | DEUT | | USD | 45 | | | | (0.84)% | | | 10/12/52 | | | 1 | | | | – | | | | 1 | | | | – | | | | – | |
| CMBX.NA.AJ.1 | | DEUT | | USD | 1,430 | | | | (0.84)% | | | 10/12/52 | | | 100 | | | | – | | | | 34 | | | | – | | | | (66 | ) |
| CMBX.NA.AJ.1 | | JPM | | USD | 915 | | | | (0.84)% | | | 10/12/52 | | | 55 | | | | – | | | | 22 | | | | – | | | | (33 | ) |
| CMBX.NA.AJ.1 | | MSC | | USD | 2,550 | | | | (0.84)% | | | 10/12/52 | | | 178 | | | | – | | | | 60 | | | | – | | | | (118 | ) |
| CMBX.NA.AJ.2 | | DEUT | | USD | 4,607 | | | | (1.09)% | | | 03/15/49 | | | 421 | | | | – | | | | 353 | | | | – | | | | (68 | ) |
| CMBX.NA.AJ.2 | | GSC | | USD | 6,374 | | | | (1.09)% | | | 03/15/49 | | | 486 | | | | – | | | | 489 | | | | 3 | | | | – | |
| CMBX.NA.AJ.4 | | CBK | | USD | 2,376 | | | | (0.96)% | | | 02/17/51 | | | 455 | | | | – | | | | 426 | | | | – | | | | (29 | ) |
| CMBX.NA.AJ.4 | | CSI | | USD | 1,669 | | | | (0.96)% | | | 02/17/51 | | | 299 | | | | – | | | | 299 | | | | – | | | | – | |
| CMBX.NA.AJ.4 | | DEUT | | USD | 2,964 | | | | (0.96)% | | | 02/17/51 | | | 584 | | | | – | | | | 531 | | | | – | | | | (53 | ) |
| CMBX.NA.AJ.4 | | GSC | | USD | 1,569 | | | | (0.96)% | | | 02/17/51 | | | 297 | | | | – | | | | 281 | | | | – | | | | (16 | ) |
| CMBX.NA.AJ.4 | | JPM | | USD | 483 | | | | (0.96)% | | | 02/17/51 | | | 115 | | | | – | | | | 87 | | | | – | | | | (28 | ) |
| CMBX.NA.AJ.4 | | MSC | | USD | 4,195 | | | | (0.96)% | | | 02/17/51 | | | 1,640 | | | | – | | | | 752 | | | | – | | | | (888 | ) |
| CMBX.NA.AJ.4 | | MSC | | USD | 2,287 | | | | (0.96)% | | | 02/17/51 | | | 406 | | | | – | | | | 410 | | | | 4 | | | | – | |
| CMBX.NA.AM.2 | | CSI | | USD | 7,960 | | | | (0.50)% | | | 03/15/49 | | | 487 | | | | – | | | | 100 | | | | – | | | | (387 | ) |
| CMBX.NA.AM.2 | | DEUT | | USD | 7,960 | | | | (0.50)% | | | 03/15/49 | | | 457 | | | | – | | | | 100 | | | | – | | | | (357 | ) |
| CMBX.NA.AM.2 | | JPM | | USD | 1,795 | | | | (0.50)% | | | 03/15/49 | | | 56 | | | | – | | | | 22 | | | | – | | | | (34 | ) |
| CMBX.NA.AM.2 | | MSC | | USD | 2,050 | | | | (0.50)% | | | 03/15/49 | | | 101 | | | | – | | | | 26 | | | | – | | | | (75 | ) |
| CMBX.NA.AM.4 | | BOA | | USD | 1,910 | | | | (0.50)% | | | 02/17/51 | | | 229 | | | | – | | | | 85 | | | | – | | | | (144 | ) |
| CMBX.NA.AM.4 | | CSI | | USD | 1,230 | | | | (0.50)% | | | 02/17/51 | | | 142 | | | | – | | | | 55 | | | | – | | | | (87 | ) |
| CMBX.NA.AM.4 | | GSC | | USD | 1,125 | | | | (0.50)% | | | 02/17/51 | | | 140 | | | | – | | | | 50 | | | | – | | | | (90 | ) |
| CMBX.NA.AM.4 | | JPM | | USD | 245 | | | | (0.50)% | | | 02/17/51 | | | 20 | | | | – | | | | 11 | | | | – | | | | (9 | ) |
| CMBX.NA.AM.4 | | JPM | | USD | 25 | | | | (0.50)% | | | 02/17/51 | | | 1 | | | | – | | | | 1 | | | | – | | | | – | |
| CMBX.NA.AM.4 | | MSC | | USD | 4,750 | | | | (0.50)% | | | 02/17/51 | | | 811 | | | | – | | | | 213 | | | | – | | | | (598 | ) |
The accompanying notes are an integral part of these financial statements.
| Hartford Total Return Bond HLS Fund |
| Schedule of Investments – (continued) |
| June 30, 2014 (Unaudited) |
| (000’s Omitted) |
OTC Credit Default Swap Contracts Outstanding at June 30, 2014 - (continued)
| | | Counter- | | Notional | | | (Pay)/ Receive Fixed
Rate/ Implied | | | Expiration | | Upfront
Premiums | | | Upfront
Premiums | | | Market | | | Unrealized Appreciation/
(Depreciation) | |
| Reference Entity | | party | | Amount (a) | | | Credit Spread (b) | | | Date | | Paid | | | Received | | | Value ╪ | | | Asset | | | Liability | |
| Credit default swaps on indices: - (continued) | | | | | | | | | | | | | | | | | | |
| Buy protection: - (continued) | | | | | | | | | | | | | | | | | | | | | | | | |
| CMBX.NA.AS.6 | | CSI | | USD | 7,430 | | | | (1.00)% | | | 05/11/63 | | | 99 | | | | – | | | | (6 | ) | | | – | | | | (105 | ) |
| CMBX.NA.AS.7 | | CBK | | USD | 3,310 | | | | (1.00)% | | | 01/17/47 | | | 78 | | | | – | | | | 6 | | | | – | | | | (72 | ) |
| CMBX.NA.AS.7 | | CSI | | USD | 3,685 | | | | (1.00)% | | | 01/17/47 | | | 87 | | | | – | | | | 7 | | | | – | | | | (80 | ) |
| Total | | | | | | | | | | | | | | $ | 29,414 | | | $ | (2,879 | ) | | $ | 16,254 | | | $ | 31 | | | $ | (10,312 | ) |
| Sell protection: | | | | | | | | | | | | | | | | | | | | | | | | | | | | |
| CMBX.NA.AAA.6 | | CSI | | USD | 24,980 | | | | 0.50% | | | 05/11/63 | | $ | – | | | $ | (615 | ) | | $ | (371 | ) | | $ | 244 | | | $ | – | |
| CMBX.NA.AAA.6 | | DEUT | | USD | 12,145 | | | | 0.50% | | | 05/11/63 | | | – | | | | (296 | ) | | | (181 | ) | | | 115 | | | | – | |
| CMBX.NA.AAA.6 | | GSC | | USD | 2,610 | | | | 0.50% | | | 05/11/63 | | | – | | | | (57 | ) | | | (39 | ) | | | 18 | | | | – | |
| CMBX.NA.AAA.6 | | UBS | | USD | 23,365 | | | | 0.50% | | | 05/11/63 | | | – | | | | (597 | ) | | | (348 | ) | | | 249 | | | | – | |
| CMBX.NA.BB.6 | | BOA | | USD | 4,270 | | | | 5.00% | | | 05/11/63 | | | – | | | | (42 | ) | | | 102 | | | | 144 | | | | – | |
| CMBX.NA.BB.6 | | CBK | | USD | 3,325 | | | | 5.00% | | | 05/11/63 | | | – | | | | (25 | ) | | | 80 | | | | 105 | | | | – | |
| CMBX.NA.BB.6 | | CSI | | USD | 5,425 | | | | 5.00% | | | 05/11/63 | | | 94 | | | | – | | | | 130 | | | | 36 | | | | – | |
| CMBX.NA.BB.6 | | CSI | | USD | 3,873 | | | | 5.00% | | | 05/11/63 | | | – | | | | (144 | ) | | | 93 | | | | 237 | | | | – | |
| CMBX.NA.BB.6 | | GSC | | USD | 2,185 | | | | 5.00% | | | 05/11/63 | | | 14 | | | | – | | | | 52 | | | | 38 | | | | – | |
| CMBX.NA.BB.6 | | MSC | | USD | 2,335 | | | | 5.00% | | | 05/11/63 | | | – | | | | (149 | ) | | | 56 | | | | 205 | | | | – | |
| CMBX.NA.BB.6 | | UBS | | USD | 1,990 | | | | 5.00% | | | 05/11/63 | | | 52 | | | | – | | | | 48 | | | | – | | | | (4 | ) |
| CMBX.NA.BB.7 | | BOA | | USD | 795 | | | | 5.00% | | | 01/17/47 | | | – | | | | (38 | ) | | | 5 | | | | 43 | | | | – | |
| CMBX.NA.BB.7 | | CSI | | USD | 6,540 | | | | 5.00% | | | 01/17/47 | | | – | | | | (309 | ) | | | 42 | | | | 351 | | | | – | |
| CMBX.NA.BB.7 | | DEUT | | USD | 2,535 | | | | 5.00% | | | 01/17/47 | | | – | | | | (64 | ) | | | 16 | | | | 80 | | | | – | |
| CMBX.NA.BB.7 | | MSC | | USD | 1,580 | | | | 5.00% | | | 01/17/47 | | | – | | | | (21 | ) | | | 10 | | | | 31 | | | | – | |
| CMBX.NA.BBB-.6 | | BCLY | | USD | 2,885 | | | | 3.00% | | | 05/11/63 | | | 54 | | | | – | | | | 54 | | | | – | | | | – | |
| CMBX.NA.BBB-.6 | | CSI | | USD | 3,425 | | | | 3.00% | | | 05/11/63 | | | 6 | | | | – | | | | 64 | | | | 58 | | | | – | |
| CMBX.NA.BBB-.7 | | CSI | | USD | 6,130 | | | | 3.00% | | | 01/17/47 | | | – | | | | (383 | ) | | | 6 | | | | 389 | | | | – | |
| CMBX.NA.BBB-.7 | | UBS | | USD | 260 | | | | 3.00% | | | 01/17/47 | | | – | | | | (15 | ) | | | – | | | | 15 | | | | – | |
| PrimeX.ARM.2 | | JPM | | USD | 310 | | | | 4.58% | | | 12/25/37 | | | 9 | | | | – | | | | 10 | | | | 1 | | | | – | |
| PrimeX.ARM.2 | | JPM | | USD | 61 | | | | 4.58% | | | 12/25/37 | | | 2 | | | | – | | | | 2 | | | | – | | | | – | |
| PrimeX.ARM.2 | | MSC | | USD | 6,091 | | | | 4.58% | | | 06/25/36 | | | – | | | | (447 | ) | | | 194 | | | | 641 | | | | – | |
| PrimeX.ARM.2 | | MSC | | USD | 391 | | | | 4.58% | | | 12/25/37 | | | 13 | | | | – | | | | 12 | | | | – | | | | (1 | ) |
| PrimeX.FRM.1 | | JPM | | USD | 821 | | | | 4.42% | | | 07/25/36 | | | 84 | | | | – | | | | 84 | | | | – | | | | – | |
| PrimeX.FRM.1 | | JPM | | USD | 81 | | | | 4.42% | | | 07/25/36 | | | 9 | | | | – | | | | 9 | | | | – | | | | – | |
| Total | | | | | | | | | | | | | | $ | 337 | | | $ | (3,202 | ) | | $ | 130 | | | $ | 3,000 | | | $ | (5 | ) |
| Total traded indices | | | | | | | | | | | | | | $ | 29,751 | | | $ | (6,081 | ) | | $ | 16,384 | | | $ | 3,031 | | | $ | (10,317 | ) |
| Credit default swaps on single-name issues: | | | | | | | | | | | | | | | | | | | | |
| Buy protection: | | | | | | | | | | | | | | | | | | | | | | | | | | | | | | | | |
| ConAgra Foods, Inc. | | DEUT | | USD | 450 | | | | (1.00)% / (0.71)% | | | 09/20/19 | | $ | – | | | $ | (9 | ) | | $ | (7 | ) | | $ | 2 | | | $ | – | |
| ConAgra Foods, Inc. | | GSC | | USD | 825 | | | | (1.00)% / (0.71)% | | | 09/20/19 | | | – | | | | (17 | ) | | | (12 | ) | | | 5 | | | | – | |
| Total | | | | | | | | | | | | | | $ | – | | | $ | (26 | ) | | $ | (19 | ) | | $ | 7 | | | $ | – | |
| Sell protection: | | | | | | | | | | | | | | | | | | | | | | | | | | | | | | | | |
| 1st Data Corp. | | BCLY | | USD | 475 | | | | 5.00% / 1.18% | | | 09/20/16 | | $ | 33 | | | $ | – | | | $ | 40 | | | $ | 7 | | | $ | – | |
| Illinois ST GO | | GSC | | USD | 1,050 | | | | 1.00% / 0.95% | | | 06/20/17 | | | 5 | | | | – | | | | 2 | | | | – | | | | (3 | ) |
| Total | | | | | | | | | | | | | | $ | 38 | | | $ | – | | | $ | 42 | | | $ | 7 | | | $ | (3 | ) |
| Total single-name issues | | | | | | | | | | | | | | $ | 38 | | | $ | (26 | ) | | $ | 23 | | | $ | 14 | | | $ | (3 | ) |
| | | | | | | | | | | | | | | $ | 29,789 | | | $ | (6,107 | ) | | $ | 16,407 | | | $ | 3,045 | | | $ | (10,320 | ) |
| (a) | The maximum potential amount the Fund could be required to pay as a seller of credit protection or receive as a buyer of credit protection if a credit event occurs as defined under the terms of that particular swap agreement. |
| (b) | Implied credit spreads, utilized in determining the market value of credit default swap agreements on corporate issues, U.S. municipal issues or sovereign government issues as of period end serve as an indicator of the current status of the payment/performance risk and represent the likelihood of risk of default for the credit derivative. The implied credit spread of a particular entity reflects the cost of buying/selling protection and may include upfront payments required to be made to enter into the agreement. Wider credit spreads represent a deterioration of the reference entity's credit soundness and a greater likelihood or risk of default or other credit event occurring as defined under the terms of the agreement. The percentage shown is the implied credit spread on June 30, 2014. For credit default swap agreements on indices, the quoted market prices and resulting values serve as the indicator of the current status of the payment/performance risk. |
The accompanying notes are an integral part of these financial statements.
| Hartford Total Return Bond HLS Fund |
| Schedule of Investments – (continued) |
| June 30, 2014 (Unaudited) |
| (000’s Omitted) |
Centrally Cleared Credit Default Swap Contracts Outstanding at June 30, 2014
| | | Clearing | | Notional | | | (Pay)/ Receive
Fixed | | | Expiration | | | | | Market | | | Unrealized
Appreciation/
(Depreciation) | | | Variation Margin | |
| Reference Entity | | House (a) | | Amount (b) | | | Rate | | | Date | | Cost Basis | | | Value ╪ | | | Asset | | | Liability | | | Asset | | | Liability | |
| Credit default swaps on indices: |
| Buy protection: |
| CDX.NA.HY.22 | | CME | | USD | 7,153 | | | | (5.00)% | | | 06/20/19 | | $ | (621 | ) | | $ | (622 | ) | | $ | – | | | $ | (1 | ) | | $ | 11 | | | $ | – | |
| CDX.NA.IG.22 | | CME | | USD | 50,575 | | | | (1.00)% | | | 06/20/19 | | | (980 | ) | | | (1,003 | ) | | | – | | | | (23 | ) | | | 27 | | | | (1 | ) |
| ITRX.EUR.21 | | ICE | | EUR | 43,170 | | | | (1.00)% | | | 06/20/19 | | | (1,123 | ) | | | (1,086 | ) | | | 37 | | | | – | | | | 45 | | | | – | |
| ITRX.XOV.21 | | ICE | | EUR | 25,440 | | | | (5.00)% | | | 06/20/19 | | | (3,731 | ) | | | (3,996 | ) | | | – | | | | (265 | ) | | | 120 | | | | – | |
| Total | | | | | | | | | | | | | | $ | (6,455 | ) | | $ | (6,707 | ) | | $ | 37 | | | $ | (289 | ) | | $ | 203 | | | $ | (1 | ) |
| (a) | The FCM to the contracts is GSC. |
| (b) | The maximum potential amount the Fund could be required to pay as a seller of credit protection or receive as a buyer of credit protection if a credit event occurs as defined under the terms of that particular swap agreement. |
Centrally Cleared Interest Rate Swap Contracts Outstanding at June 30, 2014
| Clearing | | Payments made | | Payments received | | Notional | | | Expiration | | Upfront
Premiums Paid | | | Market | | | Unrealized
Appreciation/
(Depreciation) | | | Variation Margin | |
| House (a) | | by Fund | | by Fund | | Amount | | | Date | | (Received) | | | Value ╪ | | | Asset | | | Liability | | | Asset | | | Liability | |
| LCH | | 0.43% Fixed | | 6M EURIBOR | | EUR | 250 | | | 09/17/17 | | $ | – | | | $ | – | | | $ | – | | | $ | – | | | $ | – | | | $ | – | |
| (a) | The FCM to the contracts is GSC. |
Securities Sold Short Outstanding at June 30, 2014
| Description | | Principal
Amount | | | Maturity Date | | Market Value ╪ | | | Unrealized
Appreciation/
Depreciation | |
| FHLMC, 3.00% | | $ | 49,000 | | | 07/15/2044 | | $ | 48,338 | | | $ | (337 | ) |
| FHLMC, 4.00% | | | 52,800 | | | 07/15/2044 | | | 55,935 | | | | (338 | ) |
| FHLMC, 5.50% | | | 40,900 | | | 07/15/2044 | | | 45,642 | | | | (243 | ) |
| FNMA, 2.50% | | | 3,860 | | | 07/15/2029 | | | 3,921 | | | | (26 | ) |
| FNMA, 3.50% | | | 3,900 | | | 07/15/2029 | | | 4,133 | | | | (20 | ) |
| FNMA, 4.00% | | | 6,800 | | | 07/15/2029 | | | 7,219 | | | | 11 | |
| FNMA, 5.50% | | | 16,000 | | | 07/15/2044 | | | 17,913 | | | | (96 | ) |
| FNMA, 6.00% | | | 3,700 | | | 07/15/2044 | | | 4,168 | | | | (15 | ) |
| GNMA, 3.00% | | | 34,100 | | | 07/15/2044 | | | 34,420 | | | | (400 | ) |
| GNMA, 3.50% | | | 21,300 | | | 07/15/2044 | | | 22,187 | | | | (72 | ) |
| GNMA, 4.00% | | | 47,100 | | | 07/15/2044 | | | 50,404 | | | | (388 | ) |
| GNMA, 4.50% | | | 24,900 | | | 07/15/2044 | | | 27,115 | | | | (126 | ) |
| Total | | | | | | | | $ | 321,395 | | | $ | (2,050 | ) |
At June 30, 2014, the aggregate market value of these securities represents 9.1% of total net assets.
The accompanying notes are an integral part of these financial statements.
| Hartford Total Return Bond HLS Fund |
| Schedule of Investments – (continued) |
| June 30, 2014 (Unaudited) |
| (000’s Omitted) |
Foreign Currency Contracts Outstanding at June 30, 2014
| | | | | | | | | | | | | | | Unrealized Appreciation/(Depreciation) | |
| Currency | | Buy / Sell | | Delivery Date | | Counterparty | | Contract Amount | | | Market Value ╪ | | | Asset | | | Liability | |
| BRL | | Buy | | 07/02/2014 | | UBS | | $ | 1,985 | | | $ | 1,982 | | | $ | – | | | $ | (3 | ) |
| BRL | | Sell | | 07/02/2014 | | UBS | | | 1,938 | | | | 1,982 | | | | – | | | | (44 | ) |
| BRL | | Sell | | 08/04/2014 | | UBS | | | 1,967 | | | | 1,961 | | | | 6 | | | | – | |
| EUR | | Buy | | 07/03/2014 | | HSBC | | | 361 | | | | 361 | | | | – | | | | – | |
| EUR | | Sell | | 07/31/2014 | | BOA | | | 1,022 | | | | 1,030 | | | | – | | | | (8 | ) |
| EUR | | Sell | | 09/17/2014 | | CBK | | | 480 | | | | 486 | | | | – | | | | (6 | ) |
| EUR | | Sell | | 09/17/2014 | | HSBC | | | 362 | | | | 362 | | | | – | | | | – | |
| JPY | | Buy | | 09/17/2014 | | BCLY | | | 13,995 | | | | 14,151 | | | | 156 | | | | – | |
| JPY | | Sell | | 09/17/2014 | | BNP | | | 24,956 | | | | 25,118 | | | | – | | | | (162 | ) |
| JPY | | Sell | | 09/17/2014 | | BOA | | | 24,956 | | | | 25,118 | | | | – | | | | (162 | ) |
| PEN | | Sell | | 09/17/2014 | | BNP | | | 678 | | | | 677 | | | | 1 | | | | – | |
| PEN | | Sell | | 09/17/2014 | | CBK | | | 2,963 | | | | 2,964 | | | | – | | | | (1 | ) |
| RUB | | Sell | | 09/17/2014 | | BOA | | | 3,798 | | | | 3,853 | | | | – | | | | (55 | ) |
| Total | | | | | | | | | | | | | | | | $ | 163 | | | $ | (441 | ) |
| ╪ | See Significant Accounting Policies of accompanying Notes to Financial Statements regarding valuation of securities. |
The accompanying notes are an integral part of these financial statements.
| Hartford Total Return Bond HLS Fund |
| Schedule of Investments – (continued) |
| June 30, 2014 (Unaudited) |
| (000’s Omitted) |
| GLOSSARY: (abbreviations used in preceding Schedule of Investments) |
| |
| Counterparty Abbreviations: |
| BCLY | Barclays |
| BNP | BNP Paribas Securities Services |
| BOA | Banc of America Securities LLC |
| CBK | Citibank NA |
| CME | Chicago Mercantile Exchange |
| CSI | Credit Suisse International |
| DEUT | Deutsche Bank Securities, Inc. |
| FCM | Futures Commission Merchant |
| GSC | Goldman Sachs & Co. |
| HSBC | HSBC Bank USA |
| ICE | Intercontinental Exchange |
| JPM | JP Morgan Chase & Co. | |
| LCH | LCH Clearnet |
| MSC | Morgan Stanley |
| UBS | UBS AG |
| |
| Currency Abbreviations: |
| BRL | Brazilian Real |
| COP | Colombian Peso |
| EUR | EURO |
| JPY | Japanese Yen |
| MXN | Mexican New Peso |
| PEN | Peruvian New Sol |
| RUB | Russian New Ruble |
| USD | U.S. Dollar |
| |
| Index Abbreviations: |
| ABX.HE | Markit Asset Backed Security Home Equity |
| ABX.HE.PEN | Markit Asset Backed Security Home Equity Penultimate |
| CDX.EM | Credit Derivatives Emerging Markets |
| CDX.NA.HY | Credit Derivatives North American High Yield |
| CDX.NA.IG | Credit Derivatives North American Investment Grade |
| CMBX.NA | Markit Commercial Mortgage Backed North American |
| ITRX.EUR | Markit iTraxx - Europe |
| ITRX.XOV | Markit iTraxx Index - Europe Crossover |
| PrimeX.ARM | Markit PrimeX Adjustable Rate Mortgage Backed Security |
| PrimeX.FRM | Markit PrimeX Fixed Rate Mortgage Backed Security |
| |
| Municipal Bond Abbreviations: |
| FA | Finance Authority |
| GO | General Obligation |
| Rev | Revenue |
| | |
| Other Abbreviations: |
| EURIBOR | Euro Interbank Offered Rate |
| FHLMC | Federal Home Loan Mortgage Corp. |
| FNMA | Federal National Mortgage Association |
| FX | Foreign Exchange |
| GNMA | Government National Mortgage Association |
| IR | Interest Rate |
| LIBOR | London Interbank Offered Rate |
| OTC | Over-the-Counter |
| REIT | Real Estate Investment Trust |
The accompanying notes are an integral part of these financial statements.
| Hartford Total Return Bond HLS Fund |
| Investment Valuation Hierarchy Level Summary |
| June 30, 2014 (Unaudited) |
| (000’s Omitted) |
| | | Total | | | Level 1 ♦ | | | Level 2 ♦ | | | Level 3 | |
| Assets: | | | | | | | | | | | | | | | | |
| Asset and Commercial Mortgage Backed Securities | | $ | 1,003,141 | | | $ | – | | | $ | 866,535 | | | $ | 136,606 | |
| Corporate Bonds | | | 1,034,611 | | | | – | | | | 1,030,082 | | | | 4,529 | |
| Foreign Government Obligations | | | 95,585 | | | | – | | | | 95,585 | | | | – | |
| Municipal Bonds | | | 46,947 | | | | – | | | | 46,947 | | | | – | |
| Preferred Stocks | | | 4,344 | | | | 2,479 | | | | 1,865 | | | | – | |
| Senior Floating Rate Interests | | | 217,102 | | | | – | | | | 217,102 | | | | – | |
| U.S. Government Agencies | | | 1,426,894 | | | | – | | | | 1,426,894 | | | | – | |
| U.S. Government Securities | | | 684,901 | | | | 232,869 | | | | 452,032 | | | | – | |
| Short-Term Investments | | | 77,483 | | | | – | | | | 77,483 | | | | – | |
| Purchased Options | | | 13,958 | | | | – | | | | 13,958 | | | | – | |
| Total | | $ | 4,604,966 | | | $ | 235,348 | | | $ | 4,228,483 | | | $ | 141,135 | |
| Foreign Currency Contracts * | | $ | 163 | | | $ | – | | | $ | 163 | | | $ | – | |
| Futures * | | | 706 | | | | 706 | | | | – | | | | – | |
| Swaps - Credit Default * | | | 3,082 | | | | – | | | | 3,082 | | | | – | |
| Total | | $ | 3,951 | | | $ | 706 | | | $ | 3,245 | | | $ | – | |
| Liabilities: | | | | | | | | | | | | | | | | |
| Securities Sold Short | | $ | 321,395 | | | $ | – | | | $ | 321,395 | | | $ | – | |
| Total | | $ | 321,395 | | | $ | – | | | $ | 321,395 | | | $ | – | |
| Foreign Currency Contracts * | | $ | 441 | | | $ | – | | | $ | 441 | | | $ | – | |
| Futures * | | | 3,050 | | | | 3,050 | | | | – | | | | – | |
| Swaps - Credit Default * | | | 10,609 | | | | – | | | | 10,609 | | | | – | |
| Swaps - Interest Rate * | | | – | | | | – | | | | – | | | | – | |
| Total | | $ | 14,100 | | | $ | 3,050 | | | $ | 11,050 | | | $ | – | |
| ♦ | For the six-month period ended June 30, 2014, investments valued at $305,412 were transferred from Level 1 to Level 2, and there were no transfers from Level 2 to Level 1. Investments are transferred between Level 1 and Level 2 for a variety of reasons including, but not limited to: |
| 1) | Foreign equities for which a fair value price is more representative of exit value than the local market close (transfer into Level 2). Foreign equities for which the local market close is more representative of exit value (transfer into Level 1). |
| 2) | U.S. Treasury securities that no longer represent the most recent issue (transfer into Level 2). |
| 3) | Equity investments with no observable trading but a bid or mean price is used (transfer into Level 2). Equity investments using observable quoted prices in an active market (transfer into Level 1). |
| * | Derivative instruments (excluding purchased and written options, if applicable) are valued at the unrealized appreciation/depreciation on the investments. |
Following is a reconciliation of Level 3 assets for which significant unobservable inputs were used to determine fair value:
| | | Balance as
of
December
31, 2013 | | | Realized
Gain
(Loss) | | | Change in
Unrealized
Appreciation
(Depreciation) | | | Net
Amortization | | | Purchases | | | Sales | | | Transfers
Into
Level 3 * | | | Transfers
Out of
Level 3 * | | | Balance as
of June 30,
2014 | |
| Assets: | | | | | | | | | | | | | | | | | | | | | | | | | | | | | | | | | | | | |
| Asset & Commercial Mortgage Backed Securities | | $ | 100,975 | | | $ | 1,338 | | | $ | 2,866 | † | | $ | 2,983 | | | $ | 73,664 | | | $ | (33,490 | ) | | $ | — | | | $ | (11,730 | ) | | $ | 136,606 | |
| Corporate Bonds | | | 4,547 | | | | — | | | | 112 | ‡ | | | — | | | | — | | | | (130 | ) | | | — | | | | — | | | | 4,529 | |
| Total | | $ | 105,522 | | | $ | 1,338 | | | $ | 2,978 | | | $ | 2,983 | | | $ | 73,664 | | | $ | (33,620 | ) | | $ | — | | | $ | (11,730 | ) | | $ | 141,135 | |
| Swaps§ | | $ | 294 | | | $ | — | | | $ | — | | | $ | — | | | $ | — | | | $ | — | | | $ | — | | | $ | (294 | ) | | $ | — | |
| Total | | $ | 294 | | | $ | — | | | $ | — | | | $ | — | | | $ | — | | | $ | — | | | $ | — | | | $ | (294 | ) | | $ | — | |
| * | Investments are transferred into and out of Level 3 for a variety of reasons including, but not limited to: |
| 1) | Investments where trading has been halted (transfer into Level 3) or investments where trading has resumed (transfer out of Level 3). |
| 2) | Broker quoted investments (transfer into Level 3) or quoted prices in active markets (transfer out of Level 3). |
| 3) | Investments that have certain restrictions on trading (transfer into Level 3) or investments where trading restrictions have expired (transfer out of Level 3). |
| † | Change in unrealized appreciation (depreciation) in the current period relating to assets still held at June 30, 2014 was $2,746. |
| ‡ | Change in unrealized appreciation (depreciation) in the current period relating to assets still held at June 30, 2014 was $112. |
| § | Derivative instruments not reflected in the Schedule of Investments are valued at the unrealized appreciation/ depreciation on the investment. |
| Note: | For purposes of reporting transfers between different hierarchy levels, both transfers in and out of each level, as applicable, are shown as if they occurred at the beginning of the period. |
The accompanying notes are an integral part of these financial statements.
| Hartford Total Return Bond HLS Fund |
| Statement of Assets and Liabilities |
| June 30, 2014 (Unaudited) |
| (000’s Omitted) |
| Assets: | | | | |
| Investments in securities, at market value (cost $4,476,488) | | $ | 4,604,966 | |
| Cash | | | 265 | |
| Foreign currency on deposit with custodian (cost $—) | | | — | |
| Unrealized appreciation on foreign currency contracts | | | 163 | |
| Unrealized appreciation on OTC swap contracts | | | 3,045 | |
| Receivables: | | | | |
| Investment securities sold | | | 574,964 | |
| Fund shares sold | | | 171 | |
| Dividends and interest | | | 20,352 | |
| Variation margin on financial derivative instruments | | | 750 | |
| OTC swap premiums paid | | | 29,789 | |
| Other assets | | | 2 | |
| Total assets | | | 5,234,467 | |
| Liabilities: | | | | |
| Unrealized depreciation on foreign currency contracts | | | 441 | |
| Unrealized depreciation on OTC swap contracts | | | 10,320 | |
| Securities sold short, at market value (proceeds $319,345) | | | 321,395 | |
| Payables: | | | | |
| Investment securities purchased | | | 1,332,345 | |
| Fund shares redeemed | | | 8,063 | |
| Collateral received from broker | | | 26,732 | |
| Variation margin on financial derivative instruments | | | 1,355 | |
| Investment management fees | | | 223 | |
| Distribution fees | | | 13 | |
| Other liabilities | | | 29 | |
| Accrued expenses | | | 436 | |
| OTC swap premiums received | | | 6,107 | |
| Total liabilities | | | 1,707,459 | |
| Net assets | | $ | 3,527,008 | |
| Summary of Net Assets: | | | | |
| Capital stock and paid-in-capital | | $ | 3,255,948 | |
| Undistributed net investment income | | | 160,157 | |
| Accumulated net realized loss | | | (5,399 | ) |
| Unrealized appreciation of investments and the translations of assets and liabilities denominated in foreign currency | | | 116,302 | |
| Net assets | | $ | 3,527,008 | |
| Shares authorized | | | 5,000,000 | |
| Par value | | $ | 0.001 | |
| Class IA: Net asset value per share | | $ | 11.90 | |
| Shares outstanding | | | 263,428 | |
| Net assets | | $ | 3,134,360 | |
| Class IB: Net asset value per share | | $ | 11.81 | |
| Shares outstanding | | | 33,260 | |
| Net assets | | $ | 392,648 | |
The accompanying notes are an integral part of these financial statements.
| Hartford Total Return Bond HLS Fund |
| Statement of Operations |
| For the Six-Month Period Ended June 30, 2014 (Unaudited) |
| (000’s Omitted) |
| Investment Income: | | | | |
| Dividends | | $ | 309 | |
| Interest | | | 62,058 | |
| Less: Foreign tax withheld | | | (21 | ) |
| Total investment income, net | | | 62,346 | |
| | | | | |
| Expenses: | | | | |
| Investment management fees | | | 8,338 | |
| Transfer agent fees | | | 3 | |
| Distribution fees - Class IB | | | 504 | |
| Custodian fees | | | 25 | |
| Accounting services fees | | | 362 | |
| Board of Directors' fees | | | 49 | |
| Audit fees | | | 19 | |
| Other expenses | | | 331 | |
| Total expenses (before fees paid indirectly) | | | 9,631 | |
| Custodian fee offset | | | — | |
| Total fees paid indirectly | | | — | |
| Total expenses, net | | | 9,631 | |
| Net Investment Income | | | 52,715 | |
| | | | | |
| Net Realized Gain on Investments, Other Financial Instruments and Foreign Currency Transactions: | | | | |
| Net realized gain on investments | | | 68,566 | |
| Net realized loss on purchased option contracts | | | (1,099 | ) |
| Net realized loss on securities sold short | | | (11,206 | ) |
| Net realized loss on futures contracts | | | (11,566 | ) |
| Net realized gain on written option contracts | | | 37 | |
| Net realized loss on swap contracts | | | (7,364 | ) |
| Net realized loss on foreign currency contracts | | | (1,979 | ) |
| Net realized loss on other foreign currency transactions | | | (250 | ) |
| Net Realized Gain on Investments, Other Financial Instruments and Foreign Currency Transactions | | | 35,139 | |
| | | | | |
| Net Changes in Unrealized Appreciation of Investments, Other Financial Instruments and Foreign Currency Transactions: | | | | |
| Net unrealized appreciation of investments | | | 98,596 | |
| Net unrealized appreciation of purchased option contracts | | | 614 | |
| Net unrealized depreciation of securities sold short | | | (2,713 | ) |
| Net unrealized depreciation of futures contracts | | | (7,973 | ) |
| Net unrealized depreciation of swap contracts | | | (4,256 | ) |
| Net unrealized depreciation of foreign currency contracts | | | (278 | ) |
| Net unrealized appreciation on translation of other assets and liabilities in foreign currencies | | | 19 | |
| Net Changes in Unrealized Appreciation of Investments, Other Financial Instruments and Foreign Currency Transactions | | | 84,009 | |
| Net Gain on Investments, Other Financial Instruments and Foreign Currency Transactions | | | 119,148 | |
| Net Increase in Net Assets Resulting from Operations | | $ | 171,863 | |
The accompanying notes are an integral part of these financial statements.
| Hartford Total Return Bond HLS Fund |
| Statement of Changes in Net Assets |
| |
| (000’s Omitted) |
| | | For the
Six-Month
Period Ended
June 30, 2014
(Unaudited) | | | For the
Year Ended
December 31,
2013 | |
| Operations: | | | | | | | | |
| Net investment income | | $ | 52,715 | | | $ | 105,303 | |
| Net realized gain on investments, other financial instruments and foreign currency transactions | | | 35,139 | | | | 2,282 | |
| Net unrealized appreciation (depreciation) of investments, other financial instruments and foreign currency transactions | | | 84,009 | | | | (157,806 | ) |
| Net Increase (Decrease) in Net Assets Resulting from Operations | | | 171,863 | | | | (50,221 | ) |
| Distributions to Shareholders: | | | | | | | | |
| From net investment income | | | | | | | | |
| Class IA | | | — | | | | (133,325 | ) |
| Class IB | | | — | | | | (17,335 | ) |
| Total distributions | | | — | | | | (150,660 | ) |
| Capital Share Transactions: | | | | | | | | |
| Class IA | | | | | | | | |
| Sold | | | 64,527 | | | | 655,332 | |
| Issued on reinvestment of distributions | | | — | | | | 133,325 | |
| Redeemed | | | (373,935 | ) | | | (895,940 | ) |
| Total capital share transactions | | | (309,408 | ) | | | (107,283 | ) |
| Class IB | | | | | | | | |
| Sold | | | 5,343 | | | | 52,736 | |
| Issued on reinvestment of distributions | | | — | | | | 17,335 | |
| Redeemed | | | (46,322 | ) | | | (195,160 | ) |
| Total capital share transactions | | | (40,979 | ) | | | (125,089 | ) |
| Net decrease from capital share transactions | | | (350,387 | ) | | | (232,372 | ) |
| Net Decrease in Net Assets | | | (178,524 | ) | | | (433,253 | ) |
| Net Assets: | | | | | | | | |
| Beginning of period | | | 3,705,532 | | | | 4,138,785 | |
| End of period | | $ | 3,527,008 | | | $ | 3,705,532 | |
| Undistributed (distribution in excess of) net investment income | | $ | 160,157 | | | $ | 107,442 | |
| Shares: | | | | | | | | |
| Class IA | | | | | | | | |
| Sold | | | 5,589 | | | | 56,799 | |
| Issued on reinvestment of distributions | | | — | | | | 11,960 | |
| Redeemed | | | (32,100 | ) | | | (76,678 | ) |
| Total share activity | | | (26,511 | ) | | | (7,919 | ) |
| Class IB | | | | | | | | |
| Sold | | | 468 | | | | 4,520 | |
| Issued on reinvestment of distributions | | | — | | | | 1,564 | |
| Redeemed | | | (4,008 | ) | | | (16,836 | ) |
| Total share activity | | | (3,540 | ) | | | (10,752 | ) |
The accompanying notes are an integral part of these financial statements.
| Hartford Total Return Bond HLS Fund |
| Notes to Financial Statements |
| June 30, 2014 (Unaudited) |
| (000’s Omitted) |
Organization:
Hartford Total Return Bond HLS Fund (the "Fund") serves as an underlying investment option for certain variable annuity and variable life insurance separate accounts of Hartford Life Insurance Company (“HLIC”) and its affiliates and certain qualified retirement plans. The Fund may also serve as an underlying investment option for certain variable annuity and variable life separate accounts of other insurance companies. Owners of variable annuity contracts and policyholders of variable life insurance contracts may choose the funds permitted in the variable insurance contract prospectus. In addition, participants in certain qualified retirement plans may choose the Fund if permitted by their plans.
Hartford Series Fund, Inc. (the “Company”) is an open-end registered management investment company comprised of twenty-eight portfolios. Financial statements for the Fund, a series of the Company, are included in this report.
The Company is organized under the laws of the State of Maryland and is registered with the Securities and Exchange Commission (“SEC”) under the Investment Company Act of 1940, as amended (“1940 Act”). The Fund is a diversified open-end management investment company.
The Fund is divided into Class IA and Class IB shares. Each class is offered at the per share net asset value (“NAV”) without a sales charge and is subject to the same expenses, except that the Class IB shares are subject to distribution and service fees charged pursuant to a Distribution Plan adopted in accordance with Rule 12b-1 under the 1940 Act.
Significant Accounting Policies:
The following is a summary of significant accounting policies of the Fund in the preparation of its financial statements, which are in accordance with United States Generally Accepted Accounting Principles (“U.S. GAAP”). The preparation of financial statements in accordance with U.S. GAAP may require management to make estimates and assumptions that affect the reported amounts of assets and liabilities and disclosure of contingent assets and liabilities at the date of the financial statements and the reported amounts of increases and decreases in net assets from operations during the reporting period. Actual results could differ from those estimates.
Determination of Net Asset Value – The NAV of each class of the Fund's shares is determined as of the close of regular trading (normally 4:00 p.m. Eastern Time) (the “NYSE Close”) on each day that the New York Stock Exchange (the “Exchange”) is open (“Valuation Date”). Information that becomes known to the Fund after the NAV has been calculated on a particular day will not generally be used to retroactively adjust the NAV determined earlier that day.
Investment Valuation and Fair Value Measurements – For purposes of calculating the NAV, portfolio investments and other assets held by the Fund's portfolio for which market quotes are readily available are valued at market value. Market value is generally determined on the basis of last reported sales prices or official close price. If no sales are reported, market value is based on quotes obtained from a quotation reporting system, established market makers, or independent pricing services. If market prices are not readily available or are deemed unreliable, the Fund will use the fair value of the investment as determined in good faith under policies and procedures established by and under the supervision of the Company's Board of Directors. Market quotes are considered not readily available where there is an absence of current or reliable market-based data (e.g., trade information or indicative market quotes), including where events occur after the close of the relevant market, but prior to the NYSE Close, that materially affect the values of the Fund's portfolio investments or assets. In addition, market quotes are considered not readily available when, due to extraordinary circumstances, the exchanges or markets on which the investments trade do not open for trading for the entire day and no other market prices are available. There can be no assurance that the Fund could obtain the fair market value assigned to an investment if the Fund were to sell the investment at approximately the time at which the Fund determines its NAV.
Fixed income investments (other than short-term obligations), non-exchange traded derivatives and centrally cleared swaps held by the Fund are normally valued on the basis of quotes obtained from independent pricing services or brokers and dealers in accordance with procedures established by the Company's Board of Directors. Prices obtained from independent pricing services use information provided by market makers or estimates of market values through accepted market modeling, trading and pricing conventions. Inputs to the models may include, but are not limited to, prepayment speeds, pricing spread, yield, trade information, dealer quotes, market color, cash flow models and the investment’s terms and conditions. Generally, the Fund may use fair valuation in regard to fixed
| Hartford Total Return Bond HLS Fund |
| Notes to Financial Statements – (continued) |
| June 30, 2014 (Unaudited) |
| (000’s Omitted) |
income investments when the Fund holds defaulted or distressed investments or investments in a company in which a reorganization is pending. Senior floating rate interests generally trade in over-the-counter (“OTC”) markets and are priced through an independent pricing service utilizing independent market quotations from loan dealers or financial institutions. A composite bid price is used, which is an average of the dealer marks and dealer runs.Short-term investments maturing in 60 days or less are generally valued at amortized cost, if their original term to maturity was 60 days or less, or by amortizing their value on the 61st day prior to maturity, if the original term to maturity exceeded 60 days.
Exchange traded options, futures and options on futures are valued at the settlement price or last trade price determined by the relevant exchange as of the NYSE Close. If the last trade price for exchange traded options does not fall between the bid and ask prices, the value will be the mean of the bid and ask prices as of the NYSE Close. If a last trade price is not available, the value will be the mean of the bid and ask prices as of the NYSE Close. If a mean of the bid and ask prices cannot be calculated for the day, the value will be the bid price as of the NYSE Close. In the case of OTC options and such instruments that do not trade on an exchange, values may be supplied by a pricing service using a formula or other objective method that may take into consideration the style, direction, expiration, strike price, notional value and volatility or other special adjustments.
Investments valued in currencies other than U.S. dollars are converted to U.S. dollars using exchange rates obtained from independent pricing services for calculation of the NAV. As a result, the NAV of the Fund’s shares may be affected by changes in the value of currencies in relation to the U.S. dollar. The value of investments traded in markets outside the United States or denominated in currencies other than the U.S. dollar may be affected significantly on a day that the NYSE is closed and the market value may change on days when an investor is not able to purchase, redeem or exchange shares of the Fund.
Foreign currency contracts represent agreements to exchange currencies on specific future dates at predetermined rates. Foreign currency contracts are valued using foreign currency exchange rates and forward rates as provided by an independent pricing service on the Valuation Date.
Investments in open-end mutual funds are valued at the respective NAV of each open-end mutual fund on the Valuation Date.
Financial instruments for which prices are not available from an independent pricing service may be valued using market quotations obtained from one or more dealers that make markets in the respective financial instrument in accordance with procedures established by the Company's Board of Directors.
U.S. GAAP defines fair value as the price that the Fund would receive to sell an asset or pay to transfer a liability in an orderly transaction between market participants. The U.S. GAAP fair value measurement standards require disclosure of a fair value hierarchy for each major category of assets and liabilities. Various inputs are used in determining the fair value of the Fund’s investments. These inputs are summarized into three broad hierarchy levels. This hierarchy is based on whether the valuation inputs are observable or unobservable. These levels are:
Level 1 – Quoted prices in active markets for identical investments. Level 1 may include exchange traded instruments, such as domestic equities, some foreign equities, options, futures, mutual funds, exchange traded funds, rights and warrants.
Level 2 – Observable inputs other than Level 1 prices, such as quoted prices for similar investments; quoted prices in markets that are not active; or other inputs that are observable or can be corroborated by observable market data. Level 2 may include debt investments that are traded less frequently than exchange traded instruments and which are valued using independent pricing services; foreign equities, which are principally traded on certain foreign markets and are adjusted daily pursuant to a fair value pricing service in order to reflect an adjustment for the factors occurring after the close of certain foreign markets but before the NYSE Close; senior floating rate interests, which are valued using an aggregate of dealer bids; short-term investments, which are valued at amortized cost; and swaps, which are valued based upon the terms of each swap contract.
Level 3 – Significant unobservable inputs that are supported by limited or no market activity. Level 3 may include financial instruments whose values are determined using indicative market quotes or require significant management judgment or estimation. These unobservable valuation inputs may include estimates for current yields, maturity/duration, prepayment speed, and indicative market quotes for comparable investments along with other assumptions relating to credit quality, collateral value,
| Hartford Total Return Bond HLS Fund |
| Notes to Financial Statements – (continued) |
| June 30, 2014 (Unaudited) |
| (000’s Omitted) |
complexity of the investment structure, general market conditions and liquidity. This category may include investments where trading has been halted or there are certain restrictions on trading. While these investments are priced using unobservable inputs, the valuation of these investments reflects the best available data and management believes the prices are a reasonable representation of exit price. For more information on specific valuation techniques and unobservable inputs, please see table below titled "Quantitative Information about Level 3 Fair Value Measurements."
The Board of Directors of the Company generally reviews and approves the “Procedures for Valuation of Portfolio Securities” at least once a year. These procedures define how investments are to be valued, including the formation and activities of a Valuation Committee. The Valuation Committee is responsible for determining in good faith the fair value of investments when the value cannot be obtained from primary pricing services or alternative sources or if the valuation of an investment as provided by the primary pricing service or alternative source is believed not to reflect the investment’s fair value as of the Valuation Date. Voting members of the Valuation Committee include the Fund’s Treasurer or designee and a Vice President of the investment manager or designee. An Assistant Vice President of the Fund with legal expertise or designee is also included on the Valuation Committee as a non-voting advisory member. In addition, the Fund’s Chief Compliance Officer shall designate a member of the compliance group to attend Valuation Committee meetings as a non-voting resource, to monitor for and provide guidance with respect to compliance with these procedures. Two members of the Valuation Committee or their designees, representing different departments, shall constitute a quorum for purposes of permitting the Valuation Committee to take action. The Valuation Committee will consider all relevant factors in determining an investment’s fair value, and may seek the advice of the Fund’s sub-adviser, knowledgeable brokers, and legal counsel in making such determination. The Valuation Committee reports to the Audit Committee of the Company’s Board of Directors. The Audit Committee receives quarterly written reports which include details of all fair-valued investments, including the reason for the fair valuation, and an indication, when possible, of the accuracy of the valuation by disclosing the next available reliable public price quotation or the disposition price of such investments (the “look-back” test). The Board of Directors then must consider for ratification all of the fair value determinations made during the previous quarter.
Valuation levels are not necessarily indicative of the risk associated with investing in such investments. Individual investments within any of the above mentioned asset classes may be assigned a different hierarchical level than those presented above, as individual circumstances dictate.
For additional information, refer to the Investment Valuation Hierarchy Level Summary and the Level 3 roll-forward reconciliation, if applicable, which follow the Schedule of Investments.
Quantitative Information about Level 3 Fair Value Measurements:
| Security Type/Valuation Technique | | Unobservable Input * | | Input Value(s) Range (Weighted
Average) ‡ | | | Fair Value at June 30,
2014 | |
| Assets: |
| Asset and Commercial Mortgage Backed Securities: |
| Cost | | Recent trade price | | | $99.39 - $100.00 ($99.85) | | | $ | 44,947 | |
| | | Date | | | 6/3/2014 - 6/19/2014 | | | | | |
| Discounted cash flow | | Internal rate of return | | | 3.0% - 6.7% (4.5%) | | | | 72,956 | |
| | | Life expectancy (in months) | | | 67 - 313 (161) | | | | | |
| Independent pricing service | | Prior day valuation | | | $65.38 - $100.64 ($76.14) | | | | 3,749 | |
| Indicative market quotations | | Broker Quote † | | | $99.76 - $100.18 ($100.00) | | | | 14,954 | |
| Corporate Bonds: |
| Indicative market quotations | | Broker Quote † | | | $102.00 | | | | 4,529 | |
| Total | | | | | | | | $ | 141,135 | |
| * | Significant changes to any unobservable inputs may result in a significant change to the fair value. |
| ‡ | Unless otherwise noted, inputs were weighted based on the fair value of the investments included in the range. |
| † | The broker quote represents the best available estimate of fair value per share as of June 30, 2014. |
| Hartford Total Return Bond HLS Fund |
| Notes to Financial Statements – (continued) |
| June 30, 2014 (Unaudited) |
| (000’s Omitted) |
Investment Transactions and Investment Income – Investment transactions are recorded as of the trade date (the date the order to buy or sell is executed) for financial reporting purposes. Investments purchased or sold on a when-issued or delayed-delivery basis may be settled a month or more after the trade date. Realized gains and losses are determined on the basis of identified cost.
Trade date for senior floating rate interests purchased in the primary loan market is considered the date on which the loan allocations are determined. Trade date for senior floating rate interests purchased in the secondary loan market is the date on which the transaction is entered into.
Dividend income from domestic securities is accrued on the ex-dividend date. Interest income, including amortization of premium, accretion of discounts and additional principal received in-kind in lieu of cash, is accrued on a daily basis. Paydown gains and losses on mortgage related and other asset backed securities are included in interest income in the Statement of Operations, as applicable.
Foreign Currency Transactions – Assets and liabilities denominated in currencies other than U.S. dollars are translated into U.S. dollars at the exchange rates in effect on the valuation date. Purchases and sales of investments, income and expenses are translated into U.S. dollars at the exchange rates on the dates of such transactions.
The Fund does not isolate that portion of portfolio investment valuation resulting from fluctuations in the foreign currency exchange rates from the fluctuations arising from changes in the market prices of investments held. Exchange rate fluctuations are included with the net realized and unrealized gain or loss on investments in the accompanying financial statements.
Net realized foreign exchange gains or losses arise from sales of foreign currencies and the difference between asset and liability amounts initially stated in foreign currencies and the U.S. dollar value of the amounts actually received or paid. Net unrealized foreign exchange gains or losses arise from changes in the value of other assets and liabilities at the end of the reporting period, resulting from changes in the exchange rates.
Joint Trading Account – The Fund may invest cash balances into a joint trading account that may be invested in one or more repurchase agreements.
Fund Share Valuation and Dividend Distributions to Shareholders – Orders for the Fund’s shares are executed in accordance with the investment instructions of the contract holders and plan participants. The NAV of the Fund’s shares is determined as of the close of business on each business day of the Exchange. The NAV is determined separately for each class of shares of the Fund by dividing the Fund’s net assets attributable to that class by the number of shares of the class outstanding. Each class of shares offered by the Fund has equal rights as to assets and voting privileges (except that shareholders of a class have exclusive voting rights regarding any matter relating solely to that class of shares). Income and non-class specific expenses are allocated daily to each class on the basis of the relative net assets of the class. Realized and unrealized gains and losses are allocated daily based on the relative net assets of each class of shares of the Fund.
Orders for the purchase of the Fund’s shares received prior to the close of the Exchange on any day the Exchange is open for business are priced at the NAV determined as of the close of the Exchange. Orders received after the close of the Exchange, or on a day on which the Exchange and/or the Fund is not open for business, are priced at the next determined NAV.
Dividends are declared pursuant to a policy adopted by the Company's Board of Directors based upon the investment performance of the Fund. The policy of the Fund is to pay dividends from net investment income and realized gains, if any, at least once a year.
Distributions from net investment income, net realized gains and capital are determined in accordance with federal income tax regulations, which may differ from U.S. GAAP with respect to character and timing. These differences may include, but are not limited to, losses deferred due to wash sale adjustments, foreign currency gains and losses, adjustments related to Passive Foreign Investment Companies ("PFICs"), Real Estate Investment Trusts ("REITs"), Regulated Investment Companies ("RICs"), certain derivatives and partnerships. Permanent book and federal income tax basis differences relating to shareholder distributions will result in reclassifications to certain of the Fund’s capital accounts (see Federal Income Taxes: Reclassification of Capital Accounts note).
| Hartford Total Return Bond HLS Fund |
| Notes to Financial Statements – (continued) |
| June 30, 2014 (Unaudited) |
| (000’s Omitted) |
Securities and Other Investments:
Repurchase Agreements – A repurchase agreement is an agreement by which a counterparty agrees to sell an investment and agrees to repurchase the investment sold from the buyer at a mutually agreed upon time and price. During the period of the repurchase agreement, the counterparty will deposit cash and or securities in a third party custodial account to serve as collateral. At the time the Fund enters into a repurchase agreement, the value of the underlying collateral, including accrued interest, will be equal to or exceed the value of the repurchase agreement. Repurchase agreements expose the Fund to counterparty risk - that is, the risk that the counterparty will not fulfill its obligations. To minimize counterparty risk, the investments that serve to collateralize the repurchase agreement are held by the Fund’s custodian in book entry or physical form in the custodial account of the Fund or in a third party custodial account. Repurchase agreements are valued at cost plus accrued interest, which approximates fair value. Repurchase agreements have master netting arrangements which allow the Fund to offset amounts owed to a counterparty with amounts owed by the counterparty, including any collateral. Upon an event of default under a master repurchase agreement, the non-defaulting party may close out all transactions traded under such agreement and net amounts owed under each transaction to one net amount payable by one party to the other. Absent an event of default, the master repurchase agreement does not result in an offset of reported amounts of assets and liabilities in the Statement of Assets and Liabilities across transactions between the Fund and the applicable counterparty. The Fund, as shown on the Schedule of Investments, had outstanding repurchase agreements and related collateral as of June 30, 2014.
Illiquid and Restricted Investments – The Fund is permitted to invest up to 15% of its net assets in illiquid investments. Illiquid investments are those that may not be sold or disposed of in the ordinary course of business within seven days, at approximately the price used to determine the Fund’s NAV. The Fund may not be able to sell illiquid investments when its sub-adviser considers it desirable to do so or may have to sell such investments at a price that is lower than the price that could be obtained if the investments were more liquid. A sale of illiquid investments may require more time and may result in higher dealer discounts and other selling expenses than does the sale of those that are liquid. Illiquid investments also may be more difficult to value due to the unavailability of reliable market quotations for such investments, and an investment in them may have an adverse impact on the Fund’s NAV. The Fund may also purchase certain restricted investments that can only be resold to certain qualified investors and may be determined to be liquid pursuant to policies and guidelines established by the Company's Board of Directors. The Fund, as shown on the Schedule of Investments, had illiquid or restricted investments as of June 30, 2014.
Investments Purchased on a When-Issued or Delayed-Delivery Basis – Delivery and payment for investments that have been purchased by the Fund on a forward commitment, or when-issued or delayed-delivery basis, take place beyond the customary settlement period. The Fund may dispose of or renegotiate a delayed-delivery transaction after it is entered into, and may sell delayed-delivery investments before they are delivered, which may result in a realized gain or loss. During this period, such investments are subject to market fluctuations, and the Fund identifies investments segregated in its records with a value at least equal to the amount of the commitment. The Fund, as shown on the Schedule of Investments, had when-issued or delayed-delivery investments as of June 30, 2014.
In connection with the Fund’s ability to purchase investments on a when-issued or forward commitment basis, the Fund may enter into to-be announced (“TBA”) commitments. TBA commitments are forward agreements for the purchase or sale of mortgage backed securities for a fixed price, with payment and delivery on an agreed-upon future settlement date. The specific securities to be delivered are not identified at the trade date; however, delivered securities must meet specified terms, including issuer, rate and mortgage terms. Although the Fund may enter into TBA commitments with the intention of acquiring or delivering securities for its portfolio, the Fund can extend the settlement date, roll the transaction, or dispose of a commitment prior to settlement if deemed appropriate to do so. If the TBA commitment is closed through the acquisition of an offsetting TBA commitment, the Fund realizes a gain or loss. In a TBA roll transaction, the Fund generally purchases or sells the initial TBA commitment prior to the agreed upon settlement date and enters into a new TBA commitment for future delivery or receipt of the mortgage backed securities. TBA commitments involve a risk of loss if the value of the security to be purchased or sold declines or increases, respectively, prior to settlement date.
The Fund may enter into “dollar rolls” in which the Fund sells securities and contracts with the same counterparty to repurchase substantially similar securities (for example, same issuer, coupon and maturity) on a specified future date at an agreed upon price. The Fund gives up the right to receive interest paid on the investments sold. The Fund would benefit to the extent of any differences
| Hartford Total Return Bond HLS Fund |
| Notes to Financial Statements – (continued) |
| June 30, 2014 (Unaudited) |
| (000’s Omitted) |
between the price received for the security and the lower forward price for the future purchase. Dollar rolls involve the risk that the market value of the securities that the Fund is required to purchase may decline below the agreed upon repurchase price of those securities. The Fund records dollar roll transactions as purchases and sales and realizes gains and losses on these transactions. These transactions are excluded from the Fund’s portfolio turnover rate. The Fund , as shown on the Schedule of Investments, had open dollar roll transactions as of June 30, 2014.
Senior Floating Rate Interests – The Fund may invest in senior floating rate interests. Senior floating rate interests hold the most senior position in the capital structure of a business entity (the “Borrower”), are typically secured by specific collateral and have a claim on the assets and/or stock of the Borrower that is senior to that held by subordinated debtholders and stockholders of the Borrower. Senior floating rate interests are typically structured and administered by a financial institution that acts as the agent of the lenders participating in the senior floating rate interest. The Fund may invest in multiple series or tranches of a senior floating rate interest, which may have varying terms and carry different associated risks. The Fund may also enter into unfunded loan commitments, which are contractual obligations for future funding. Unfunded loan commitments may include revolving credit facilities, which may obligate the Fund to supply additional cash to the borrower on demand. Unfunded loan commitments represent a future obligation in full. The Fund may receive a commitment fee based on the undrawn portion of the underlying line of credit portion of a senior floating rate interest. In certain circumstances, the Fund may receive various fees upon the restructure of a senior floating rate interest by a borrower. Fees earned/paid may be recorded as a component of income or realized gain/loss in the Statement of Operations.
Senior floating rate interests are typically rated below-investment-grade, which suggests they are more likely to default and generally pay higher interest rates than investment-grade loans. A default could lead to non-payment of income, which would result in a reduction of income to the Fund, and there can be no assurance that the liquidation of any collateral would satisfy the Borrower’s obligation in the event of non-payment of scheduled interest or principal payments, or that such collateral could be readily liquidated. The Fund, as shown on the Schedule of Investments, had senior floating rate interests as of June 30, 2014.
Mortgage Related and Other Asset Backed Securities – The Fund may invest in mortgage related and other asset backed securities. These securities include mortgage pass-through securities, collateralized mortgage obligations, commercial mortgage backed securities, stripped mortgage backed securities, asset backed securities, collateralized debt obligations and other securities that directly or indirectly represent a participation in, or are secured by and payable from, mortgage loans on real property. Mortgage related securities are created from pools of residential or commercial mortgage loans, including mortgage loans made by savings and loan institutions, mortgage bankers, commercial banks and others. Asset backed securities are created from many types of assets, including auto loans, credit card receivables, home equity loans, and student loans. These securities provide a monthly payment that consists of both interest and principal payments. Interest payments may be determined by fixed or adjustable rates. The rate of pre-payments on underlying mortgages will affect the price and volatility of a mortgage related security, and may have the effect of shortening or extending the effective duration of the security relative to what was anticipated at the time of purchase. The timely payment of principal and interest of certain mortgage related securities is guaranteed by the full faith and credit of the United States Government. Mortgage related and other asset backed securities created and guaranteed by non-governmental issuers, including government-sponsored corporations, may be supported by various forms of insurance or guarantees, but there can be no assurance that the private insurers or guarantors can meet their obligations under the insurance policies or guarantee arrangements. The Fund, as shown on the Schedule of Investments, had outstanding mortgage related and other asset backed securities as of June 30, 2014.
Financial Derivative Instruments:
The following disclosures contain information on how and why the Fund uses derivative instruments, the credit-risk-related contingent features in certain derivative instruments, and how derivative instruments affect the Fund’s financial position and results of operations. The location and fair value amounts of these instruments on the Statement of Assets and Liabilities and the realized gains and losses and changes in unrealized gains and losses on the Statement of Operations, each categorized by type of derivative contract, are included in the following Additional Derivative Instrument Information footnote. The derivative instruments outstanding as of period-end are disclosed in the notes to or within the Schedule of Investments for purchased options, if applicable. The amounts of realized gains and losses and changes in unrealized gains and losses on derivative instruments during the period are disclosed in the Statement of Operations.
| Hartford Total Return Bond HLS Fund |
| Notes to Financial Statements – (continued) |
| June 30, 2014 (Unaudited) |
| (000’s Omitted) |
Foreign Currency Contracts – The Fund may enter into foreign currency contracts that obligate the Fund to purchase or sell currencies at specified future dates. Foreign currency contracts are used to hedge the currency exposure associated with some or all of the Fund’s investments and/or as part of an investment strategy. Foreign currency contracts are marked to market daily and the change in value is recorded by the Fund as an unrealized gain or loss. The Fund will record a realized gain or loss when the foreign currency contract is settled.
Foreign currency contracts involve elements of market risk in excess of the amounts reflected in the Statement of Assets and Liabilities. In addition, risks may arise upon entering into these contracts from the potential inability of the counterparties to meet the terms of the contracts and from unanticipated movements in the value of the foreign currencies relative to the U.S. dollar. The Fund, as shown on the Schedule of Investments, had outstanding foreign currency contracts as of June 30, 2014.
Futures Contracts – The Fund may enter into futures contracts. A futures contract is an agreement between two parties to buy or sell an asset at a set price on a future date. The Fund uses futures contracts to manage or obtain exposure to the investment markets, commodities, or movements in interest rates and currency values. The primary risks associated with the use of futures contracts are the imperfect correlation between the change in market value of the investments held by the Fund and the prices of futures contracts and the possibility of an illiquid market. Upon entering into a futures contract, the Fund is required to deposit with a futures commission merchant (“FCM”) an amount of cash or U.S. Government or Agency Obligations in accordance with the initial margin requirements of the broker or exchange. Futures contracts are marked to market daily at the most recent settlement price reported by an exchange on which, over time, they are traded most extensively, and an appropriate payable or receivable for the change in value (“variation margin”) is recorded by the Fund. Gains or losses are recognized but not considered realized until the contracts expire or are closed. Futures contracts involve, to varying degrees, risk of loss in excess of the variation margin disclosed on the Statement of Assets and Liabilities; however, the Fund seeks to reduce this risk through the use of an FCM. The Fund, as shown on the Schedule of Investments, had outstanding futures contracts as of June 30, 2014.
Options Contracts – An option contract is a contract sold by one party to another party that offers the buyer the right, but not the obligation, to buy (call) or sell (put) an investment or other financial asset at an agreed-upon price during a specific period of time or on a specific date. The Fund may write (sell) covered call and put options on futures, swaps (“swaptions”), securities, commodities or currencies. “Covered” means that so long as the Fund is obligated as the writer of an option, it will own either the underlying investments or currency or an option to purchase the same underlying investments or currency having an expiration date of the covered option and an exercise price equal to or less than the exercise price of the covered option, or will pledge cash or other liquid investments having a value equal to or greater than the fluctuating market value of the option investment or currency. Writing put options increases the Fund’s exposure to the underlying instrument. Writing call options decreases the Fund’s exposure to the underlying instrument. Premiums received from writing options that expire are treated as realized gains. Premiums received from writing options that are exercised or closed are added to the proceeds or offset amounts paid on the underlying futures, swap, investment or currency transaction to determine the realized gain or loss. The Fund as a writer of an option has no control over whether the underlying instrument may be sold (call) or purchased (put) and as a result bears the market risk of an unfavorable change in the price of the instrument underlying the written option. There is the risk the Fund may not be able to enter into a closing transaction because of an illiquid market. The Fund may also purchase put and call options. Purchasing call options increases the Fund’s exposure to the underlying instrument. Purchasing put options decreases the Fund’s exposure to the underlying instrument. The Fund pays a premium, which is included on the Fund’s Statement of Assets and Liabilities as an investment and is subsequently marked to market to reflect the current value of the option. Premiums paid for purchasing options that expire are treated as realized losses. Certain options may be purchased with premiums to be determined on a future date. The premiums for these options are based upon implied volatility parameters at specified terms. The risk associated with purchasing put and call options is generally limited to the premium paid. Premiums paid for purchasing options that are exercised or closed are added to the amounts paid or offset against the proceeds on the underlying investment transaction to determine the realized gain or loss. Entering into over-the-counter options also exposes the Fund to counterparty risk. Counterparty risk is the possibility that the counterparty to the agreements may default on its obligation to perform or disagree as to the meaning of the contractual terms in the agreements.
The Fund, as shown on the Schedule of Investments, had outstanding purchased option contracts as of June 30, 2014. The Fund had no outstanding written option contracts as of June 30, 2014. Transactions involving written option contracts during the six-month period June 30, 2014, are summarized below:
| Hartford Total Return Bond HLS Fund |
| Notes to Financial Statements – (continued) |
| June 30, 2014 (Unaudited) |
| (000’s Omitted) |
| | | Options Contract Activity During the
Six-month Period Ended June 30, 2014 | |
| Call Options Written During the Period | | Number of Contracts* | | | Premium Amounts | |
| Beginning of the period | | | — | | | $ | — | |
| Written | | | 224 | | | | 279 | |
| Expired | | | — | | | | — | |
| Closed | | | (224 | ) | | | (279 | ) |
| Exercised | | | — | | | | — | |
| End of period | | | — | | | $ | — | |
| Put Options Written During the Period | | Number of Contracts* | | | Premium Amounts | |
| Beginning of the period | | | — | | | $ | — | |
| Written | | | 224 | | | | 252 | |
| Expired | | | — | | | | — | |
| Closed | | | (224 | ) | | | (252 | ) |
| Exercised | | | — | | | | — | |
| End of period | | | — | | | $ | — | |
* The number of contracts does not omit 000's.
Swap Contracts – The Fund may invest in swap contracts. Swap contracts are agreements to exchange or swap investment cash flows, assets, foreign currencies or market-linked returns at specified, future intervals. Swap contracts are either privately negotiated in the over-the-counter market (“OTC swaps”) or executed in a multilateral or other trade facility platform, such as a registered exchange (“centrally cleared swaps”). The Fund may enter into credit default, total return, cross-currency, interest rate, inflation and other forms of swap contracts to manage its exposure to credit, currency, interest rate, commodity and inflation risk. Swap contracts are also used to gain exposure to certain markets. In connection with these contracts, investments or cash may be identified as collateral or margin in accordance with the terms of the respective swap contracts and/or master netting arrangement to provide assets of value and recourse in the event of default or bankruptcy/insolvency.
Swaps are valued based on custom valuations furnished by an independent pricing service. Swaps for which prices are not available from an independent pricing service are valued in accordance with procedures established by the Company's Board of Directors. Changes in market value, if any, are reflected as a component of net changes in unrealized appreciation or depreciation on the Statement of Operations. Daily changes in valuation of centrally cleared swaps, if any, are recorded as a receivable or payable for the change in value as appropriate (“variation margin”) on the Statement of Assets and Liabilities. Realized gains or losses on centrally cleared swaps are recorded upon the termination of the swap. OTC swap payments received or made at the beginning of the measurement period are reflected as such on the Statement of Assets and Liabilities and represent premiums paid or received upon entering into the swap contract to compensate for differences between the stated terms of the swap contract and prevailing market conditions (credit spreads, currency exchange rates, interest rates and other relevant factors). These upfront premiums are recorded as realized gains or losses on the Statement of Operations upon termination or maturity of the swap. A liquidation payment received or made at the termination or maturity of the swap is recorded as a realized gain or loss on the Statement of Operations. Net periodic payments received or paid by the Fund are included as part of realized gains or losses on the Statement of Operations.
Entering into these contracts involves, to varying degrees, elements of liquidation, counterparty, credit and market risk in excess of the amounts recognized on the Statement of Assets and Liabilities. Such risks involve the possibility that there will be no liquid market for these contracts, that the counterparty to the contracts may default on its obligation to perform or disagree as to the meaning of contractual terms in the contracts, and that there may be unfavorable changes in market conditions (credit spreads, currency exchange rates, interest rates and other relevant factors).
The Fund’s maximum risk of loss from credit risk for OTC swaps is the net value of the discounted cash flows to be received from the counterparty over the contract’s remaining life, and current market value, to the extent that amount is positive. The risk is mitigated by having a master netting arrangement between the Fund and the counterparty, which allows for the netting of payments made or received (although such amounts are presented on a gross basis within the Statement of Assets and Liabilities, as applicable) as well as the posting of collateral to the Fund to cover the Fund’s exposure to the counterparty. In a centrally cleared swap, while the Fund enters into an agreement with a clearing broker to execute contracts with a counterparty, the performance of the swap is guaranteed by the central clearinghouse, which reduces the Fund’s exposure to credit risk. The Fund is still exposed to the credit risk of the
| Hartford Total Return Bond HLS Fund |
| Notes to Financial Statements – (continued) |
| June 30, 2014 (Unaudited) |
| (000’s Omitted) |
clearing broker and clearinghouse. The clearinghouse attempts to minimize this risk to all of its participants through the use of mandatory margin requirements, daily cash settlements, and other procedures designed to protect counterparties utilizing the clearinghouse. Likewise, the clearing broker reduces its risk through margin requirements and required segregation of customer balances.
Credit Default Swap Contracts – The credit default swap market allows the Fund to manage its exposure to the market or certain sectors of the market, to reduce its risk exposure to defaults of corporate and sovereign issuers, or to create exposure to corporate or sovereign issuers to which it is not otherwise exposed. Certain credit default swaps involve the exchange of a fixed rate premium for protection against the loss in value of an underlying investment or index in the event of a credit event, such as payment default or bankruptcy.
Under a credit default swap contract, one party acts as guarantor by receiving the fixed periodic payment in exchange for the commitment to purchase the underlying investment at par if the defined credit event occurs. Upon the occurrence of a defined credit event, the difference between the value of the reference obligation and the swap’s notional amount is recorded as realized gain or loss on swap transactions in the Statement of Operations. A “buyer” of credit protection agrees to pay a counterparty to assume the credit risk of an issuer upon the occurrence of certain events. The “seller” of the protection receives periodic payments and agrees to assume the credit risk of an issuer upon the occurrence of certain events. Although specified events are contract specific, credit events are generally defined as bankruptcy, failure to pay, restructuring, obligation acceleration, obligation default or repudiation/moratorium. A “seller’s” exposure is limited to the total notional amount of the credit default swap contract. These potential amounts would be partially offset by any recovery values of the respective referenced obligations or upfront payments received upon entering into the contract.
Implied credit spreads, represented in absolute terms, utilized in determining the market value of credit default swap contracts on corporate issues, sovereign government issues or U.S. municipal issues as of six-month period-end are disclosed in the notes to the Schedule of Investments, as applicable, and serve as an indicator of the current status of the payment/performance risk and represent the likelihood or risk of default for the credit derivative. The implied credit spread of a particular referenced entity reflects the cost of buying/selling protection and may include upfront payments required to be made to enter into the contract. Wider credit spreads represent a deterioration of the referenced entity’s credit soundness and a greater likelihood or risk of default or other credit event occurring as defined under the terms of the contract. For credit default swap contracts on asset backed securities and credit indices, the quoted market prices and resulting values serve as the indicator of the current status of the payment/performance risk. Increasing market values, in absolute terms when compared to the notional amount of the swap, represent a deterioration of the referenced equity’s credit soundness and a greater likelihood or risk of default or other credit event occurring as defined under the terms of the contract. The Fund, as shown on the Schedule of Investments, had outstanding credit default swap contracts as of June 30, 2014.
Interest Rate Swap Contracts – The Fund is subject to interest rate risk exposure in the normal course of pursuing its investment objectives. Because the Fund holds fixed rate bonds, the value of these bonds may decrease if interest rates rise. To help hedge against this risk and to maintain its ability to generate income at prevailing market rates, the Fund may enter into interest rate swap contracts. In a typical interest rate swap, one party agrees to make regular payments equal to a floating interest rate, based on a specified interest rate or inflation benchmark (e.g. London Interbank Offered Rate (“LIBOR”)), multiplied by a “notional principal amount”, in return for payments equal to a fixed rate multiplied by the same amount, for a specific period of time. The net interest received or paid on interest rate swap contracts is recorded as a realized gain or loss. Interest rate swaps are marked to market daily and the change, if any, is recorded as an unrealized gain or loss in the Statement of Operations. When the interest rate swap contract is terminated early, the Fund records a realized gain or loss equal to the difference between the current realized value and the expected cash flows.
If an interest rate swap contract provides for payments in different currencies, the parties might agree to exchange the notional principal amount as well. Interest rate swaps may also depend on other prices or rates, such as the value of an index or mortgage prepayment rates. The risks of interest rate swaps include changes in market conditions which will affect the value of the contract or the cash flows and the possible inability of the counterparty to fulfill its obligations under the contract. The Fund’s maximum risk of loss from counterparty credit risk is the discounted net value of the cash flows to be received from the counterparty over the contract’s remaining life, to the extent that amount is positive. The Fund, as shown on the Schedule of Investments, had outstanding interest rate swap contracts as of June 30, 2014.
| Hartford Total Return Bond HLS Fund |
| Notes to Financial Statements – (continued) |
| June 30, 2014 (Unaudited) |
| (000’s Omitted) |
Spreadlock Swap Contracts – The Fund may invest in spreadlock swap contracts. These contracts involve commitments to pay or receive a settlement amount calculated as the difference between the swap spread and a fixed spread at a specific forward date. Settlement amounts paid or received are recorded as a realized gain or loss on the Statement of Operations at the determination date. The Fund had no outstanding spreadlock swap contracts as of June 30, 2014.
Additional Derivative Instrument Information:
Fair Value of Derivative Instruments on the Statement of Assets and Liabilities as of June 30, 2014:
| | | Risk Exposure Category | |
| | | Interest Rate
Contracts | | | Foreign
Exchange
Contracts | | | Credit
Contracts | | | Equity
Contracts | | | Commodity
Contracts | | | Other
Contracts | | | Total | |
| Assets: | | | | | | | | | | | | | | | | | | | | | | | | | | | | |
| Investments in securities, at value (purchased option contracts), market value | | $ | 13,958 | | | $ | — | | | $ | — | | | $ | — | | | $ | — | | | $ | — | | | $ | 13,958 | |
| Unrealized appreciation on foreign currency contracts | | | — | | | | 163 | | | | — | | | | — | | | | — | | | | — | | | | 163 | |
| Unrealized appreciation on OTC swap contracts | | | — | | | | — | | | | 3,045 | | | | — | | | | — | | | | — | | | | 3,045 | |
| Variation margin receivable * | | | 547 | | | | — | | | | 203 | | | | — | | | | — | | | | — | | | | 750 | |
| Total | | $ | 14,505 | | | $ | 163 | | | $ | 3,248 | | | $ | — | | | $ | — | | | $ | — | | | $ | 17,916 | |
| | | | | | | | | | | | | | | | | | | | | | | | | | | | | |
| Liabilities: | | | | | | | | | | | | | | | | | | | | | | | | | | | | |
| Unrealized depreciation on foreign currency contracts | | $ | — | | | $ | 441 | | | $ | — | | | $ | — | | | $ | — | | | $ | — | | | $ | 441 | |
| Unrealized depreciation on OTC swap contracts | | | — | | | | — | | | | 10,320 | | | | — | | | | — | | | | — | | | | 10,320 | |
| Variation margin payable * | | | 1,354 | | | | — | | | | 1 | | | | — | | | | — | | | | — | | | | 1,355 | |
| Total | | $ | 1,354 | | | $ | 441 | | | $ | 10,321 | | | $ | — | | | $ | — | | | $ | — | | | $ | 12,116 | |
* Only current day's variation margin is reported within the Statement of Assets and Liabilities. The variation margin is included in the open futures cumulative depreciation of $(2,344) and open centrally cleared swaps cumulative depreciation of $(252) as reported in the Schedule of Investments.
The ratio of futures contracts market value to net assets at June 30, 2014 was 34.62%, compared to the six-month period ended June 30, 2013 average ratio of futures contracts to net assets of 25.27%. The volume of other derivatives that are presented in the Schedule of Investments is consistent with the derivative activity during the six-month period ended June 30, 2014.
The Effect of Derivative Instruments on the Statement of Operations for the six-month period ended June 30, 2014:
| | | Risk Exposure Category | |
| | | Interest Rate
Contracts | | | Foreign
Exchange
Contracts | | | Credit
Contracts | | | Equity
Contracts | | | Commodity
Contracts | | | Other
Contracts | | | Total | |
| Realized Gain (Loss) on Derivatives Recognized as a Result of Operations: |
| Net realized loss on purchased option contracts | | $ | (1,099 | ) | | $ | — | | | $ | — | | | $ | — | | | $ | — | | | $ | — | | | $ | (1,099 | ) |
| Net realized loss on futures contracts | | | (11,566 | ) | | | — | | | | — | | | | — | | | | — | | | | — | | | | (11,566 | ) |
| Net realized gain on written option contracts | | | 37 | | | | — | | | | — | | | | — | | | | — | | | | — | | | | 37 | |
| Net realized gain (loss) on swap contracts | | | 870 | | | | — | | | | (8,234 | ) | | | — | | | | — | | | | — | | | | (7,364 | ) |
| Net realized loss on foreign currency contracts | | | — | | | | (1,979 | ) | | | — | | | | — | | | | — | | | | — | | | | (1,979 | ) |
| Total | | $ | (11,758 | ) | | $ | (1,979 | ) | | $ | (8,234 | ) | | $ | — | | | $ | — | | | $ | — | | | $ | (21,971 | ) |
| | | | | | | | | | | | | | | | | | | | | | | | | | | | | |
| Net Change in Unrealized Appreciation (Depreciation) on Derivatives Recognized as a Result of Operations: |
| Net change in unrealized appreciation of investments in purchased option contracts | | $ | 614 | | | $ | — | | | $ | — | | | $ | — | | | $ | — | | | $ | — | | | $ | 614 | |
| Net change in unrealized depreciation of futures contracts | | | (7,973 | ) | | | — | | | | — | | | | — | | | | — | | | | — | | | | (7,973 | ) |
| Net change in unrealized depreciation of swap contracts | | | (294 | ) | | | — | | | | (3,962 | ) | | | — | | | | — | | | | — | | | | (4,256 | ) |
| Net change in unrealized depreciation of foreign currency contracts | | | — | | | | (278 | ) | | | — | | | | — | | | | — | | | | — | | | | (278 | ) |
| Total | | $ | (7,653 | ) | | $ | (278 | ) | | $ | (3,962 | ) | | $ | — | | | $ | — | | | $ | — | | | $ | (11,893 | ) |
| Hartford Total Return Bond HLS Fund |
| Notes to Financial Statements – (continued) |
| June 30, 2014 (Unaudited) |
| (000’s Omitted) |
Balance Sheet Offsetting Information - Set forth below are tables which disclose both gross information and net information about instruments and transactions eligible for offset in the financial statements, and instruments and transactions that are subject to a master netting arrangement, as well as amounts related to margin, reflected as financial collateral (including cash collateral), held at clearing brokers, counterparties and the Fund’s custodian. The master netting arrangements allow the clearing brokers to net any collateral held in or on behalf of the Fund, or liabilities or payment obligations of the clearing brokers to the Fund, against any liabilities or payment obligations of the Fund to the clearing brokers. The Fund is required to deposit financial collateral (including cash collateral) at the Futures Commission Merchant's ("FCM") custodian on behalf of clearing brokers and counterparties to continually meet the original and maintenance requirements established by the clearing brokers and counterparties. Such requirements are specific to the respective clearing broker or counterparty. Certain master netting arrangements may not be enforceable in a bankruptcy.
Offsetting of Financial Assets and Derivative Assets as of June 30, 2014:
| | | Gross Amounts*
of Assets
Presented in
Statement of
Assets and
Liabilities | | | Financial
Instruments with
Allowable Netting | | | Non-cash
Collateral
Received | | | Cash Collateral
Received | | | Net Amount (not
less than $0) | |
| Description | | | | | | | | | | | | | | | | | | | | |
| Purchased option contracts at market value | | $ | 13,958 | | | $ | — | | | $ | — | | | $ | — | | | $ | 13,958 | |
| Futures contracts - Variation margin receivable | | | 547 | | | | (547 | ) | | | — | | | | — | | | | — | |
| OTC swap contracts at market value | | | 20,770 | | | | (2,956 | ) | | | (6,620 | ) | | | (26,732 | ) | | | — | |
| Swap contracts - Variation margin receivable | | | 203 | | | | (1 | ) | | | — | | | | — | | | | 202 | |
| Unrealized appreciation on foreign currency contracts | | | 163 | | | | (7 | ) | | | — | | | | — | | | | 156 | |
| Total subject to a master netting or similar arrangement | | $ | 35,641 | | | $ | (3,511 | ) | | $ | (6,620 | ) | | $ | (26,732 | ) | | $ | 14,316 | |
* Gross amounts presented as no amounts are netted within the Statements of Assets and Liabilities.
Offsetting of Financial Liabilities and Derivative Liabilities as of June 30, 2014:
| | | Gross Amounts*
of Liabilities
Presented in
Statement of
Assets and
Liabilities | | | Financial
Instruments with
Allowable Netting | | | Non-cash
Collateral
Pledged | | | Cash Collateral
Pledged | | | Net Amount (not
less than $0) | |
| Description | | | | | | | | | | | | | | | | | | | | |
| Futures contracts - Variation margin payable | | $ | 1,354 | | | $ | (547 | ) | | $ | (14,438 | )† | | $ | — | | | $ | — | |
| OTC swap contracts at market value | | | 4,363 | | | | (2,956 | ) | | | — | | | | — | | | | 1,407 | |
| Swaps contracts - Variation margin payable | | | 1 | | | | (1 | ) | | | (2,311 | )† | | | — | | | | — | |
| Unrealized depreciation on foreign currency contracts | | | 441 | | | | (7 | ) | | | — | | | | — | | | | 434 | |
| Total subject to a master netting or similar arrangement | | $ | 6,159 | | | $ | (3,511 | ) | | $ | (16,749 | ) | | $ | — | | | $ | 1,841 | |
* Gross amounts presented as no amounts are netted within the Statement of Assets and Liabilities.
† Pledged as initial margin deposit and collateral for daily variation margin loss on open financial derivative contracts held at June 30, 2014.
Certain derivatives held by the Fund, as of June 30, 2014, are not subject to a master netting arrangement and are excluded from the table above.
Principal Risks:
Credit risk depends largely on the perceived financial health of bond issuers. In general, the credit rating is inversely related to the credit risk of the issuer. Higher rated bonds generally are deemed to have less credit risk, while lower or unrated bonds are deemed to have higher risk of default. The share price, yield and total return of a fund that holds securities with higher credit risk may be more volatile than those of a fund that holds bonds with lower credit risk. Similar to credit risk, the Fund may be exposed to counterparty risk, or the risk that an institution or other entity with which the Fund has unsettled or open transactions will default.
| Hartford Total Return Bond HLS Fund |
| Notes to Financial Statements – (continued) |
| June 30, 2014 (Unaudited) |
| (000’s Omitted) |
The Fund’s investments expose the Fund to various risks including, but not limited to, interest rate, prepayment, extension, foreign currency and equity risks. Interest rate risk is the risk that fixed income securities will decline in value because of changes in interest rates. As nominal interest rates rise, the values of certain fixed income securities held by the Fund are likely to decrease. A nominal interest rate can be described as the sum of a real interest rate and an expected inflation rate. Fixed income securities with longer durations tend to be more sensitive to changes in interest rates, usually making them more volatile than securities with shorter durations. Duration is useful primarily as a measure of the sensitivity of a fixed income security’s market price to interest rate (i.e., yield) movements. Senior floating rate interests and securities subject to prepayment and extension risk generally offer less potential for gains when interest rates decline. Rising interest rates may cause prepayments to occur at a slower than expected rate, thereby effectively lengthening the maturity of the security and making the security more sensitive to interest rate changes. Prepayment and extension risk are major risks of mortgage backed securities, senior floating rate interests and certain asset backed securities. For certain asset backed securities, the actual maturity may be less than the stated maturity shown in the Schedule of Investments, if applicable. As a result, the timing of income recognition relating to these securities may vary based upon the actual maturity.
If the Fund invests directly in foreign currencies or in securities that trade in, and receive revenues in, foreign currencies, or in derivatives that provide exposure to foreign currencies, it will be subject to the risk that those currencies will decline in value relative to the base currency (U.S. dollars) of the Fund, or, in the case of hedging positions, that the Fund’s base currency will decline in value relative to the currency being hedged. Currency rates in foreign countries may fluctuate significantly over short periods of time for a number of reasons, including changes in interest rates, intervention (or the failure to intervene) by U.S. or foreign governments, central banks or supranational entities, such as the International Monetary Fund, or by the imposition of currency controls or other political developments in the United States or abroad. As a result, the Fund’s investments in foreign currency denominated securities may reduce the returns of the Fund. The market values of equity securities, such as common stocks and preferred stocks, or equity related investments, such as futures and options, may decline due to general market conditions which are not specifically related to a particular company, such as real or perceived adverse economic conditions, changes in the general outlook for corporate earnings, changes in interest or currency rates or adverse investor sentiment generally. The market value of equity securities may also decline due to factors which affect a particular industry or industries, such as labor shortages or increased production costs and competitive conditions within an industry. Equity securities and equity related investments generally have greater market price volatility than fixed income securities.
Federal Income Taxes:
Federal Income Taxes – For federal income tax purposes, the Fund intends to continue to qualify as a RIC under Subchapter M of the Internal Revenue Code (“IRC”) by distributing substantially all of its taxable net investment income and net realized capital gains to its shareholders and otherwise complying with the requirements of the IRC. The Fund has distributed substantially all of its income and capital gains in prior years, if applicable, and intends to distribute substantially all of its income and capital gains prior to the next fiscal year-end. Accordingly, no provision for federal income or excise taxes has been made in the accompanying financial statements. Distributions from short-term capital gains are treated as ordinary income distributions for federal income tax purposes.
Net Investment Income (Loss), Net Realized Gains (Losses) and Distributions – Net investment income (loss) and net realized gains (losses) may differ for financial statement and tax purposes primarily because of losses deferred due to wash sale adjustments, foreign currency gains and losses, adjustments related to PFICs, REITs, RICs, certain derivatives and partnerships. The character of distributions made during the year from net investment income or net realized gains may differ from their ultimate characterization for federal income tax purposes. Also, due to the timing of dividend distributions, the fiscal year in which amounts are distributed may differ from the year that the income or realized gains (losses) were recorded by the Fund.
| Hartford Total Return Bond HLS Fund |
| Notes to Financial Statements – (continued) |
| June 30, 2014 (Unaudited) |
| (000’s Omitted) |
Distributions and Components of Distributable Earnings – The tax character of distributions paid by the Fund for the periods indicated is as follows (as adjusted for dividends payable, if applicable):
| | | For the Year Ended
December 31, 2013 | | | For the Year Ended
December 31, 2012 | |
| Ordinary Income | | $ | 150,660 | | | $ | 172,217 | |
As of December 31, 2013, the Fund’s components of distributable earnings (deficit) on a tax basis are as follows:
| | | Amount | |
| Undistributed Ordinary Income | | $ | 108,767 | |
| Accumulated Capital and Other Losses* | | | (34,392 | ) |
| Unrealized Appreciation† | | | 26,147 | |
| Total Accumulated Earnings | | $ | 100,522 | |
| * | The Fund has capital loss carryforwards that are identified in the Capital Loss Carryforward note that follows. |
| † | Differences between book-basis and tax-basis unrealized appreciation (depreciation) may be attributable to the losses deferred due to wash sale adjustments, foreign currency gains and losses, adjustments related to PFICs, REITs, RICs, certain derivatives and partnerships. |
Reclassification of Capital Accounts – The Fund may record reclassifications in its capital accounts. These reclassifications have no impact on the total net assets of the Fund. The reclassifications are a result of permanent differences between U.S. GAAP and tax accounting for such items as foreign currency, PFICs, expiration or utilization of capital loss carryforwards or net operating losses. Adjustments are made to reflect the impact these items have on current and future distributions to shareholders. Therefore, the source of the Fund’s distributions may be shown in the accompanying Statement of Changes in Net Assets as from undistributed net investment income, from accumulated net realized gains on investments or from capital depending on the type of book and tax differences that exist. For the year ended December 31, 2013, the Fund recorded reclassifications to increase (decrease) the accounts listed below:
| | | Amount | |
| Undistributed Net Investment Income (Loss) | | $ | 2,140 | |
| Accumulated Net Realized Gain (Loss) | | | (2,140 | ) |
Capital Loss Carryforward – On December 22, 2010, the Regulated Investment Company Modernization Act of 2010 (the “Act”) was enacted, which made changes to the capital loss carryforward rules. The changes are effective for taxable years beginning after the date of enactment. Under the Act, funds are permitted to carry forward capital losses for an unlimited period. However, any losses incurred during those future taxable years will be required to be utilized prior to the losses incurred in pre-enactment taxable years, which carry an expiration date. As a result of this ordering rule, pre-enactment capital loss carryforwards may be more likely to expire unused. Additionally, post-enactment capital loss carryforwards retain their character as either short-term or long-term capital losses rather than being considered all short-term as permitted under prior regulation.
At December 31, 2013 (tax year end), the Fund had capital loss carryforwards for U.S. federal income tax purposes as follows:
| Year of Expiration | | Amount | |
| 2017 | | $ | 28,282 | |
| Total | | $ | 28,282 | |
Capital loss carryforwards with no expiration:
| | | Amount | |
| Short-Term Capital Loss Carryforward | | $ | 6,110 | |
| Total | | $ | 6,110 | |
| Hartford Total Return Bond HLS Fund |
| Notes to Financial Statements – (continued) |
| June 30, 2014 (Unaudited) |
| (000’s Omitted) |
Accounting for Uncertainty in Income Taxes – The Fund has adopted financial reporting rules that require the Fund to analyze all open tax years, as defined by the statute of limitations, for all major jurisdictions. Generally, tax authorities can examine all tax returns filed for the last three years. The Fund does not have an examination in progress.
The Fund has reviewed all open tax years and major jurisdictions and concluded that these financial reporting rules had no effect on the Fund’s financial position or results of operations. There is no tax liability resulting from unrecognized tax benefits relating to uncertain income tax positions taken or expected to be taken on the tax return for the fiscal year ended December 31, 2013. The Fund is also not aware of any tax positions for which it is reasonably possible that the total amounts of unrecognized tax benefits will significantly change in the next twelve months.
Expenses:
Investment Management Agreement – Hartford Funds Management Company, LLC ("HFMC") serves as the Fund’s investment manager pursuant to an Investment Management Agreement with the Company. HFMC is an indirect wholly owned subsidiary of The Hartford Financial Services Group, Inc. ("The Hartford"). The investment manager has overall investment supervisory responsibility for the Fund. In addition, the investment manager provides administrative personnel, services, equipment, facilities and office space for proper operation of the Fund. HFMC has contracted with Wellington Management Company, LLP ("Wellington Management") under a sub-advisory agreement for the provision of day-to-day investment management services to the Fund in accordance with the Fund’s investment objective and policies. The Fund pays a fee to the investment manager, a portion of which may be used to compensate Wellington Management.
The schedule below reflects the rates of compensation paid to the investment manager for investment management services rendered as of June 30, 2014; the rates are accrued daily and paid monthly:
| Average Daily Net Assets | | Annual Fee | |
| On first $250 million | | | 0.5250% | |
| On next $250 million | | | 0.5000% | |
| On next $500 million | | | 0.4750% | |
| On next $1.5 billion | | | 0.4500% | |
| On next $2.5 billion | | | 0.4450% | |
| On next $5 billion | | | 0.4300% | |
| Over $10 billion | | | 0.4200% | |
Accounting Services Agreement – Pursuant to the Fund Accounting Agreement between HFMC and the Company, on behalf of the Fund, HFMC provides accounting services to the Fund and receives monthly compensation based on the Fund’s average daily net assets at the rates set forth below. The Fund’s accounting services fees are accrued daily and paid monthly.
| Average Daily Net Assets | | Annual Fee | |
| On first $5 billion | | | 0.020% | |
| On next $5 billion | | | 0.015% | |
| Over $10 billion | | | 0.010% | |
Operating Expenses – Allocable expenses incurred by the Company are allocated to each Fund and allocated to classes within a Fund in proportion to the average daily net assets of the Fund and each class, except where allocation of certain expenses is more fairly made directly to the Fund or to specific classes within a Fund.
Fees Paid Indirectly – The Fund's custodian bank has agreed to reduce its fees when the Fund maintains cash on deposit in a non-interest-bearing custody account. For the six-month period ended June 30, 2014, this amount, if any, is included in the Statement of Operations.
| Hartford Total Return Bond HLS Fund |
| Notes to Financial Statements – (continued) |
| June 30, 2014 (Unaudited) |
| (000’s Omitted) |
The ratio of expenses to average net assets in the accompanying financial highlights excludes the reduction in expenses related to fees paid indirectly. The annualized expense ratio after waivers for the period listed below reflecting the reduction for fees paid indirectly is as follows:
| | | Annualized Six-
Month Period Ended
June 30, 2014 | |
| Class IA | | | 0.50% | |
| Class IB | | | 0.75 | |
Distribution Plan for Class IB Shares – Hartford Funds Distributors, LLC (“HFD”), an indirect wholly owned subsidiary of The Hartford, is the principal underwriter and distributor of the Fund. The Company, on behalf of the Fund, has adopted a Distribution Plan pursuant to Rule 12b-1 of the 1940 Act for Class IB shares.
The Distribution Plan provides that the Fund may pay annually up to 0.25% of the average daily net assets of the Fund attributable to its Class IB shares for activities primarily intended to result in the sale of Class IB shares. The Board has the authority to suspend or reduce these payments at any point in time. Under the terms of the Distribution Plan and the principal underwriting agreement, the Fund is authorized to make payments monthly to the distributor that may be used to pay or reimburse entities providing distribution and shareholder servicing with respect to the Class IB shares for such entities’ fees or expenses incurred or paid in that regard. The distribution fee paid during the period can be found on the Statement of Operations. These fees are accrued daily and paid monthly.
Other Related Party Transactions – Hartford Administrative Services Company (“HASCO”), an indirect wholly owned subsidiary of The Hartford, provides transfer agent services to the Fund. HASCO was compensated on a per account basis for providing such services. The amount paid to HASCO can be found in the Statement of Operations. These fees are accrued daily and paid monthly.
Investment Transactions:
For the six-month period ended June 30, 2014, the cost of purchases and proceeds from sales of investment securities (excluding short-term investments) were as follows:
| | | Excluding U.S.
Government
Obligations | | | U.S.
Government
Obligations | | | Total | |
| Cost of Purchases | | $ | 13,894,405 | | | $ | 607,562 | | | $ | 14,501,967 | |
| Sales Proceeds | | | 13,451,602 | | | | 705,904 | | | | 14,157,506 | |
Line of Credit:
The Fund is one of several Hartford Funds that participate in a $500 million committed revolving line of credit facility. The facility is to be used for temporary or emergency purposes. Under the arrangement, the funds are required to own securities having a market value in excess of 300% of the total bank borrowings. The interest rate on borrowings varies depending on the nature of the loan. The facility also requires a fee to be paid based on the amount of the commitment. This commitment fee is allocated to all the funds participating in the line of credit based on the average net assets of the funds. During the six-month period ended June 30, 2014, the Fund did not have any borrowings under this facility.
Industry Classifications:
Other than the industry classifications "Other Investment Pools and Funds" and "Exchange Traded Funds," equity industry classifications used in this report are the Global Industry Classification Standard, which was developed by and is the exclusive property and service mark of MSCI, Inc. and Standard & Poor's.
| Hartford Total Return Bond HLS Fund |
| Notes to Financial Statements – (continued) |
| June 30, 2014 (Unaudited) |
| (000’s Omitted) |
Indemnifications:
Under the Company's organizational documents, the Company shall indemnify its officers and directors to the full extent required or permitted under Maryland General Corporation Law and the federal securities laws. In addition, the Company, on behalf of the Fund, may enter into contracts that contain a variety of indemnifications. The Company's maximum exposure under these arrangements is unknown. However, as of the date of these financial statements, the Company has not had prior claims or losses pursuant to these contracts and expects the risk of loss to be remote.
Pending Legal Proceedings:
On February 25, 2011, Jennifer L. Kasilag, Louis Mellinger, Judith M. Menendez, Jacqueline M. Robinson, and Linda A. Russell filed a derivative lawsuit against Hartford Investment Financial Services, LLC (“HIFSCO”) (now known as Hartford Funds Distributors, LLC) on behalf of six Hartford retail mutual funds in the United States District Court for the District of New Jersey, alleging that HIFSCO received excessive advisory and distribution fees in violation of its statutory fiduciary duty under Section 36(b) of the 1940 Act when serving as investment manager and principal underwriter, respectively, to the Hartford retail mutual funds. Although this action was purportedly filed on behalf of certain of the Hartford Funds, none of the Hartford Funds is itself a defendant to the suit. HIFSCO moved to dismiss and, in September 2011, the motion was granted in part and denied in part, with leave to amend the complaint. In November 2011, plaintiffs filed an amended complaint on behalf of certain Hartford retail mutual funds, The Hartford Global Health Fund (now known as The Hartford Healthcare Fund), The Hartford Conservative Allocation Fund, The Hartford Growth Opportunities Fund, The Hartford Inflation Plus Fund, The Hartford Advisers Fund (now known as The Hartford Balanced Fund), and The Hartford Capital Appreciation Fund. Plaintiffs seek to rescind the investment management agreements and distribution plans between HIFSCO and these funds and to recover the total fees charged thereunder or, in the alternative, to recover any improper compensation HIFSCO received, in addition to lost earnings. HIFSCO filed a partial motion to dismiss the amended complaint and, in December 2012, the court dismissed without prejudice the claims regarding distribution fees and denied the motion with respect to the advisory fees claims. HIFSCO disputes the allegations and intends to defend vigorously.
In March 2014, the plaintiffs filed a new complaint that added as new plaintiffs The Hartford Floating Rate Fund and The Hartford Small Company Fund and named as a defendant Hartford Funds Management Company, LLC (the “Investment Manager”), which assumed the role as investment adviser to the funds as of January 2013. The Investment Manager and HIFSCO dispute the allegations and intend to defend vigorously.
This action concerns the activities of HIFSCO in its capacity as investment manager and principal underwriter to the Hartford retail mutual funds and does not concern HIFSCO’s activities in its capacity as principal underwriter to the HLS funds. For this reason, no accrual for litigation relating to this matter has been recorded in the financial statements of the Fund.
| Hartford Total Return Bond HLS Fund |
| Financial Highlights |
| | | | ─ Selected Per-Share Data(A) ─ | | | ─ Ratios and Supplemental Data ─ | |
| Class | | | Net Asset
Value at
Beginning
of Period | | | Net
Investment
Income
(Loss) | | | Net
Realized
and
Unrealized
Gain (Loss)
on
Investments | | | Total from
Investment
Operations | | | Dividends
from Net
Investment
Income | | | Distributions
from
Realized
Capital
Gains | | | Total
Dividends
and
Distributions | | | Net
Asset
Value at
End of
Period | | | Total
Return(B) | | | Net Assets
at End of
Period
(000s) | | | Ratio of
Expenses
to
Average
Net
Assets
Before
Adjust-
ments(C) | | | Ratio of
Expenses
to
Average
Net
Assets
After
Adjust-
ments(C) | | | Ratio of
Net
Investment
Income
(Loss) to
Average
Net Assets | |
| | | | | | | | | | | | | | | | | | | | | | | | | | | | | | | | | | | | | | | | | |
| For the Six-Month Period Ended June 30, 2014 (Unaudited) | | | | | | | | | | | | | | | | | | | | | | | | | | | | | | | | | | |
| IA | | | $ | 11.35 | | | $ | 0.17 | | | $ | 0.38 | | | $ | 0.55 | | | $ | – | | | $ | – | | | $ | – | | | $ | 11.90 | | | | 4.85 | %(D) | | $ | 3,134,360 | | | | 0.50 | %(E) | | | 0.50 | %(E) | | | 2.94 | %(E) |
| IB | | | | 11.27 | | | | 0.15 | | | | 0.39 | | | | 0.54 | | | | – | | | | – | | | | – | | | | 11.81 | | | | 4.79 | (D) | | | 392,648 | | | | 0.75 | (E) | | | 0.75 | (E) | | | 2.69 | (E) |
| | | | | | | | | | | | | | | | | | | | | | | | | | | | | | | | | | | | | | | | | | | | | | | | | | | | | | | |
| For the Year Ended December 31, 2013 | | | | | | | | | | | | | | | | | | | | | | | | | | | | | | | | | |
| IA | | $ | 11.99 | | | $ | 0.32 | | | $ | (0.49 | ) | | $ | (0.17 | ) | | $ | (0.47 | ) | | $ | – | | | $ | (0.47 | ) | | $ | 11.35 | | | | (1.36 | )% | | $ | 3,290,622 | | | | 0.50 | % | | | 0.50 | % | | | 2.76 | % |
| IB | | | | 11.91 | | | | 0.29 | | | | (0.50 | ) | | | (0.21 | ) | | | (0.43 | ) | | | – | | | | (0.43 | ) | | | 11.27 | | | | (1.66 | ) | | | 414,910 | | | | 0.75 | | | | 0.75 | | | | 2.51 | |
| | | | | | | | | | | | | | | | | | | | | | | | | | | | | | | | | | | | | | | | | | | | | | | | | | | | | | | |
| For the Year Ended December 31, 2012 (F) | | | | | | | | | | | | | | | | | | | | | | | | | | | | | | | | | | |
| IA | | | $ | 11.63 | | | $ | 0.41 | | | $ | 0.45 | | | $ | 0.86 | | | $ | (0.50 | ) | | $ | – | | | $ | (0.50 | ) | | $ | 11.99 | | | | 7.54 | % | | $ | 3,572,511 | | | | 0.50 | % | | | 0.50 | % | | | 3.01 | % |
| IB | | | | 11.55 | | | | 0.40 | | | | 0.43 | | | | 0.83 | | | | (0.47 | ) | | | – | | | | (0.47 | ) | | | 11.91 | | | | 7.27 | | | | 566,274 | | | | 0.75 | | | | 0.75 | | | | 2.76 | |
| | | | | | | | | | | | | | | | | | | | | | | | | | | | | | | | | | | | | | | | | | | | | | | | | | | | | | | |
| For the Year Ended December 31, 2011 (F) | | | | | | | | | | | | | | | | | | | | | | | | | | | | | | | | | | |
| IA | | | $ | 10.90 | | | $ | 0.44 | | | $ | 0.31 | | | $ | 0.75 | | | $ | (0.02 | ) | | $ | – | | | $ | (0.02 | ) | | $ | 11.63 | | | | 6.99 | % | | $ | 3,718,609 | | | | 0.49 | % | | | 0.49 | % | | | 3.60 | % |
| IB | | | | 10.84 | | | | 0.42 | | | | 0.31 | | | | 0.73 | | | | (0.02 | ) | | | – | | | | (0.02 | ) | | | 11.55 | | | | 6.72 | | | | 632,685 | | | | 0.74 | | | | 0.74 | | | | 3.35 | |
| | | | | | | | | | | | | | | | | | | | | | | | | | | | | | | | | | | | | | | | | | | | | | | | | | | | | | | |
| For the Year Ended December 31, 2010 (F) | | | | | | | | | | | | | | | | | | | | | | | | | | | | | | | | | | |
| IA | | | $ | 10.58 | | | $ | 0.45 | | | $ | 0.34 | | | $ | 0.79 | | | $ | (0.47 | ) | | $ | – | | | $ | (0.47 | ) | | $ | 10.90 | | | | 7.51 | % | | $ | 4,026,583 | | | | 0.50 | % | | | 0.50 | % | | | 3.90 | % |
| IB | | | | 10.53 | | | | 0.44 | | | | 0.31 | | | | 0.75 | | | | (0.44 | ) | | | – | | | | (0.44 | ) | | | 10.84 | | | | 7.25 | | | | 722,317 | | | | 0.75 | | | | 0.75 | | | | 3.65 | |
| | | | | | | | | | | | | | | | | | | | | | | | | | | | | | | | | | | | | | | | | | | | | | | | | | | | | | | |
| For the Year Ended December 31, 2009 (F) | | | | | | | | | | | | | | | | | | | | | | | | | | | | | | | | | | |
| IA | | | $ | 9.54 | | | $ | 0.46 | | | $ | 0.98 | | | $ | 1.44 | | | $ | (0.40 | ) | | $ | – | | | $ | (0.40 | ) | | $ | 10.58 | | | | 15.01 | % | | $ | 3,902,957 | | | | 0.51 | % | | | 0.51 | % | | | 4.67 | % |
| IB | | | | 9.50 | | | | 0.46 | | | | 0.95 | | | | 1.41 | | | | (0.38 | ) | | | – | | | | (0.38 | ) | | | 10.53 | | | | 14.72 | | | | 789,541 | | | | 0.76 | | | | 0.76 | | | | 4.42 | |
| (A) | Information presented relates to a share outstanding throughout the indicated period. Net investment income (loss) per share amounts are calculated based on average shares outstanding unless otherwise noted. |
| (B) | The figures do not include sales charges or other fees which may be applied at the variable life insurance, variable annuity or qualified retirement plan product level. Any such additional sales charges or other fees would lower the Fund's performance. |
| (C) | Adjustments include waivers and reimbursements, if applicable. Ratios do not include fees paid indirectly (see Expenses in the accompanying Notes to Financial Statements). |
| (F) | Net investment income (loss) per share amounts have been calculated using the SEC method. |
| | | Portfolio Turnover
Rate for
All Share Classes | |
| For the Six-Month Period Ended June 30, 2014 (Unaudited) | | | 117% | |
| For the Year Ended December 31, 2013 | | | 81 | |
| For the Year Ended December 31, 2012 | | | 88 | |
| For the Year Ended December 31, 2011 | | | 107 | |
| For the Year Ended December 31, 2010 | | | 188 | |
| For the Year Ended December 31, 2009 | | | 215 | |
| Hartford Total Return Bond HLS Fund |
| Directors and Officers (Unaudited) |
The Board of Directors of the Company (the "Directors") appoints officers who are responsible for the day-to-day operations of the Fund and who execute policies formulated by the Directors. Each Director serves until his or her death, resignation, or retirement or until the next annual meeting of shareholders is held or until his or her successor is elected and qualifies.
Directors and officers who are employed by or who have a financial interest in The Hartford are considered “interested” persons of the Fund pursuant to the 1940 Act. Each officer and two of the Company's Directors, as noted in the chart below, are “interested” persons of the Fund. Each Director serves as a director for The Hartford Mutual Funds, Inc., The Hartford Mutual Funds II, Inc., Hartford Series Fund, Inc., and Hartford HLS Series Fund II, Inc., and as a trustee for The Hartford Alternative Strategies Fund, which, as of June 30, 2014, collectively consist of 78 funds. Correspondence may be sent to Directors and officers c/o Hartford Funds, 5 Radnor Corporate Center, Suite 300, 100 Matsonford Road, Radnor, Pennsylvania 19087, except that correspondence to Mr. Annoni, Mr. Dressen and Ms. Quade may be sent to 500 Bielenberg Drive, Suite 500, Woodbury, Minnesota 55125.
The table below sets forth, for each Director and officer, his or her name, year of birth, current position with the Company and date first elected or appointed to Hartford Series Fund, Inc. ("HSF") and Hartford HLS Series Fund II, Inc. ("HSF2"), principal occupation, and, for Directors, other directorships held. The Fund’s Statement of Additional Information contains further information on the Directors and is available free of charge by calling 1-888-843-7824 or writing to: Hartford HLS Funds, c/o Hartford Life Insurance Company/Hartford Life and Annuity Insurance Company, P.O. Box 14293, Lexington, KY 40512-4293 for variable annuity and variable life insurance separate accounts of Hartford Life Insurance Company and its affiliates; Hartford Funds, P.O. Box 55022, Boston, MA 02205-5022 for all shareholders except variable annuity and variable life insurance separate accounts of Hartford Life Insurance Company and its affiliates.
Information on the aggregate remuneration paid to the directors of the Company can be found in the Statement of Operations herein. The Fund pays to The Hartford a portion of the Chief Compliance Officer’s compensation, but does not pay salaries or compensation to any of its other officers or Directors who are employed by The Hartford.
Non-Interested Directors
Lynn S. Birdsong (1946) Director since 2003, Co-Chairman of the Investment Committee since 2005
Mr. Birdsong is a private investor. Mr. Birdsong currently serves as a Director of the Sovereign High Yield Investment Company (April 2010 to current). Mr. Birdsong currently serves as an Independent Director of Nomura Partners Funds, Inc. (formerly, The Japan Fund) (April 2003 to current). From 2003 to March 2005, Mr. Birdsong was an Independent Director of the Atlantic Whitehall Funds. From 1979 to 2002, Mr. Birdsong was a Managing Director of Zurich Scudder Investments, an investment management firm. During his employment with Scudder, Mr. Birdsong was an Interested Director of The Japan Fund. From January 1981 through December 2013, Mr. Birdsong was a partner in Birdsong Company, an advertising specialty firm.
Robert M. Gavin, Jr. (1940) Director since 2002 (HSF) and 1986 (HSF2), Chairman of the Board since 2004
Dr. Gavin is an educational consultant. Prior to September 1, 2001, he was President of Cranbrook Education Community and prior to July 1996, he was President of Macalester College, St. Paul, Minnesota.
Duane E. Hill (1945) Director since 2001 (HSF) and 2002 (HSF2), Chairman of the Nominating Committee since 2003
Mr. Hill is a Partner of TSG Ventures L.P., a private equity investment company. Mr. Hill is a former partner of TSG Capital Group, a private equity investment firm that served as sponsor and lead investor in leveraged buyouts of middle market companies.
Sandra S. Jaffee (1941) Director since 2005
Ms. Jaffee is the founder and Chief Executive Officer of a private company, Homeworks Concierge, LLC, which provides residential property management services in Westchester County, New York (January 2012 to present). Ms. Jaffee served as Chairman (2008 to 2009) and Chief Executive Officer of Fortent (formerly Searchspace Group), a leading provider of compliance/regulatory technology to financial institutions from August 2005 to August 2009. From August 2004 to August 2005, Ms. Jaffee served as an Entrepreneur in Residence with Warburg Pincus, a private equity firm. Prior to joining Warburg Pincus, Ms. Jaffee served as Executive Vice President at Citigroup, from September 1995 to July 2004, where she was President and Chief Executive Officer of Citibank’s Global Securities Services (1995 to 2003). Ms. Jaffee currently serves as a member of the Board of Directors of Broadridge Financial Solutions as well as a Trustee of Muhlenberg College.
| Hartford Total Return Bond HLS Fund |
| Directors and Officers (Unaudited) – (continued) |
William P. Johnston (1944) Director since 2005, Chairman of the Compliance Committee since 2005
In June 2006, Mr. Johnston was appointed as Senior Advisor to The Carlyle Group, a global private equity and other alternative asset investment firm and currently serves as an Operating Executive. In July 2006, Mr. Johnston was elected to the Board of Directors of MultiPlan, Inc. and served as a Director (July 2006 to August 2010). In August 2007, Mr. Johnston was elected to the Board of Directors of LifeCare Holdings, Inc. and served as a Director (August 2007 to June 2013). In February 2008, Mr. Johnston was elected to the Board of Directors of HCR-ManorCare, Inc. In May 2006, Mr. Johnston was elected to the Supervisory Board of Fresenius Medical Care AG & Co. KGaA, after its acquisition of Renal Care Group, Inc. in March 2006. Mr. Johnston joined Renal Care Group in November 2002 as a member of the Board of Directors and served as Chairman of the Board from March 2003 through March 2006. From 2002 through 2013, Mr. Johnston served as a Board member of the Georgia O’Keefe Museum. From September 1987 to December 2002, Mr. Johnston was with Equitable Securities Corporation (and its successors, SunTrust Equitable Securities and SunTrust Robinson Humphrey) serving in various investment banking and managerial positions, including Managing Director and Head of Investment Banking, Chief Executive Officer and Vice Chairman.
Phillip O. Peterson (1944) Director since 2002 (HSF) and 2000 (HSF2), Chairman of the Audit Committee since 2002
Mr. Peterson is a mutual fund industry consultant. He was a partner of KPMG LLP (an accounting firm) until July 1999. Mr. Peterson joined William Blair Funds in February 2007 as a member of the Board of Trustees. From February 2012 to February 2014, Mr. Peterson served as a Trustee of Symetra Variable Mutual Funds. From January 2004 to April 2005, Mr. Peterson served as Independent President of the Strong Mutual Funds.
Lemma W. Senbet (1946) Director since 2005
Dr. Senbet is the William E. Mayer Chair Professor of Finance and Founding Director, Center for Financial Policy, at the University of Maryland, Robert H. Smith School of Business. He was chair of the Finance Department of the University of Maryland, Robert H. Smith School of Business from 1998 to 2006. Since June 2013, he has been on leave from the University to serve as Executive Director of African Economic Research Consortium which focuses on economic policy research and training. Previously, he was a chaired professor of finance at the University of Wisconsin-Madison. Also, he was a Director of the Fortis Funds from March 2000 to July 2002. Dr. Senbet served as Director of the American Finance Association and President of the Western Finance Association. In 2006, Dr. Senbet was inducted Fellow of Financial Management Association International for his career-long distinguished scholarship and professional service.
Interested Directors and Officers
James E. Davey (1964) Director since 2012, President and Chief Executive Officer since 2010
Mr. Davey serves as Executive Vice President of Hartford Life Insurance Company (“HLIC”) and The Hartford Financial Services Group, Inc. Additionally, Mr. Davey serves as Chairman of the Board, Manager and Senior Managing Director of Hartford Funds Distributors, LLC (“HFD”). He also currently serves as Director, Chairman of the Board, President and Senior Managing Director of Hartford Administrative Services Company (“HASCO”). Mr. Davey also serves as Manager, Chairman of the Board and Senior Managing Director for Hartford Funds Management Company, LLC (“HFMC”) and Director, Chairman of the Board and Senior Managing Director for Hartford Funds Management Group, Inc. ("HFMG"). Mr. Davey has served in various positions within The Hartford and its subsidiaries in connection with the operation of the Hartford Funds. Mr. Davey joined The Hartford in 2002.
Lowndes A. Smith (1939) Director since 1996 (HSF) and 2002 (HSF2), Co-Chairman of the Investment Committee since 2005
Mr. Smith served as Vice Chairman of The Hartford from February 1997 to January 2002, as President and Chief Executive Officer of Hartford Life, Inc. from February 1997 to January 2002, and as President and Chief Operating Officer of The Hartford Life Insurance Companies from January 1989 to January 2002. Mr. Smith serves as a Director of White Mountains Insurance Group Ltd. (October 2003 to current); One Beacon Insurance (October 2006 to current); Symetra Financial (August 2007 to current) and is a Managing Director of Whittington Gray Associates (January 2007 to current).
Other Officers
Mark A. Annoni (1964) Vice President, Controller and Treasurer since 2012
Mr. Annoni currently serves as the Assistant Vice President of HLIC (February 2004 to present) and Senior Vice President of HFMG (December 2013 to present). Mr. Annoni has served in various positions within The Hartford and its subsidiaries in connection with the operation of the Hartford Funds. Mr. Annoni joined The Hartford in 2001.
| Hartford Total Return Bond HLS Fund |
| Directors and Officers (Unaudited) – (continued) |
Michael R. Dressen (1963) AML Compliance Officer since 2011
Mr. Dressen currently serves as Assistant Vice President of HLIC. He also serves as Chief Compliance Officer and AML Compliance Officer of HASCO and as AML Officer of HFD. Mr. Dressen has served in various positions within The Hartford and its subsidiaries in connection with the operation of the Hartford Funds.
Edward P. Macdonald (1967) Vice President, Secretary and Chief Legal Officer since 2005
Mr. Macdonald currently serves as Assistant Secretary, Executive Vice President and Deputy General Counsel of HFD, HASCO, HFMC and HFMG. He also serves as Vice President of HLIC. Mr. Macdonald has served in various positions within The Hartford and its subsidiaries in connection with the operation of the Hartford Funds. Mr. Macdonald joined The Hartford in 2005.
Joseph G. Melcher (1973) Vice President and Chief Compliance Officer since 2013
Mr. Melcher currently serves as Executive Vice President of HFD, HFMG and HASCO. Mr. Melcher also currently serves as Executive Vice President and Chief Compliance Officer of HFMC. Mr. Melcher has served in various positions within The Hartford and its subsidiaries in connection with the operation of the Hartford Funds since joining The Hartford in 2012. Prior to joining The Hartford, Mr. Melcher worked at Touchstone Investments, a member of the Western & Southern Financial Group, where he held the position of Vice President and Chief Compliance Officer from 2010 through 2012 and Assistant Vice President, Compliance from 2005 to 2010.
Vernon J. Meyer (1964) Vice President since 2006
Mr. Meyer currently serves as Senior Vice President of HLIC. He also currently serves as Managing Director and Chief Investment Officer of HFMC and Managing Director of HFMG. Mr. Meyer has served in various positions within The Hartford and its subsidiaries in connection with the operation of the Hartford Funds. Mr. Meyer joined The Hartford in 2004.
Laura S. Quade (1969) Vice President since 2012
Ms. Quade currently serves as Vice President of HASCO, HFD and HFMG. She is the Head of Operations of HASCO and also serves as Director, Enterprise Operations of HLIC. Ms. Quade has served in various positions within The Hartford and its subsidiaries in connection with the operation of the Hartford Funds.
Martin A. Swanson (1962) Vice President since 2010
Mr. Swanson currently serves as Vice President of HLIC. Mr. Swanson also serves as Managing Director, Chief Marketing Officer and Principal of HFD and Managing Director of HFMG. Mr. Swanson has served in various positions within The Hartford and its subsidiaries in connection with the operation of the Hartford Funds.
HOW TO OBTAIN A COPY OF THE FUND’S PROXY VOTING POLICIES AND VOTING RECORDS (UNAUDITED)
A description of the policies and procedures that the Fund uses to determine how to vote proxies relating to portfolio securities and information about how the Fund voted proxies relating to portfolio securities during the most recent twelve-month period ended June 30 are available (1) without charge, upon request, by calling 888-843-7824 and (2) on the SEC’s website at http://www.sec.gov.
QUARTERLY PORTFOLIO HOLDINGS INFORMATION (UNAUDITED)
The Fund files a complete schedule of portfolio holdings with the SEC for the first and third quarters of each fiscal year on Form N-Q. The Fund’s Forms N-Q are available (1) without charge, upon request, by calling 888-843-7824 and (2) on the SEC’s website at http://www.sec.gov. The Form N-Q may be reviewed and copied at the SEC’s Public Reference Room in Washington, DC. Information on the operation of the Public Reference Room may be obtained by calling 1-800-SEC-0330.
| Hartford Total Return Bond HLS Fund |
| Expense Example (Unaudited) |
Your Fund's Expenses
As a shareholder of the Fund, you incur two types of costs: (1) transaction costs and (2) ongoing costs, including investment management fees, distribution and/or service (12b-1) fees, if any, and other fund expenses. This example is intended to help you understand your ongoing costs (in dollars) of investing in the Fund and to compare these costs with the ongoing costs of investing in other mutual funds. The example is based on an investment of $1,000 invested at the beginning of the period and held for the entire period of December 31, 2013 through June 30, 2014.
Actual Expenses
The first set of columns of the table below provides information about actual account values and actual expenses. You may use the information in this column, together with the amount you invested, to estimate the expenses that you paid over the period. Simply divide your account value by $1,000 (for example, an $8,600 account value divided by $1,000 = 8.6), then multiply the result by the number in the line under the heading entitled “Expenses Paid During Period” to estimate the expenses you paid on your account during this period.
Hypothetical Example for Comparison Purposes
The second set of columns of the table below provides information about hypothetical account values and hypothetical expenses based on the Fund's actual expense ratio and an assumed rate of return of 5% per year before expenses, which is not the Fund's actual return. The hypothetical account values and expenses may not be used to estimate the actual ending account balance or expenses you paid for the period. You may use this information to compare the ongoing costs of investing in the Fund and other funds. To do so, compare this 5% hypothetical example with the 5% hypothetical examples that appear in the shareholder reports of the other funds.
Please note that the expenses shown in the table are meant to highlight your ongoing costs only and do not reflect any transactional costs, such as sales charges (loads) and CDSC. Therefore, the second set of columns of the table is useful in comparing ongoing costs only, and will not help you determine the relative total costs of owning different funds. In addition, if these transactional costs were included, your costs would be higher. Expenses are equal to the Fund's annualized expense ratios multiplied by average account value over the period, multiplied by 181/365 (to reflect the one-half year period).
| | | Actual return | | | Hypothetical (5% return before expenses) | | | | | | | | | | |
| | | Beginning
Account Value
December 31,
2013 | | | Ending Account
Value
June 30, 2014 | | | Expenses paid
during the period
December 31, 2013
through
June 30, 2014 | | | Beginning
Account Value
December 31,
2013 | | | Ending Account
Value
June 30, 2014 | | | Expenses paid
during the period
December 31,
2013
through
June 30, 2014 | | | Annualized
expense
ratio | | | Days
in the
current
1/2
year | | | Days
in the
full
year | |
| Class IA | | $ | 1,000.00 | | | $ | 1,048.50 | | | $ | 2.54 | | | $ | 1,000.00 | | | $ | 1,022.32 | | | $ | 2.51 | | | | 0.50 | % | | | 181 | | | | 365 | |
| Class IB | | $ | 1,000.00 | | | $ | 1,047.90 | | | $ | 3.81 | | | $ | 1,000.00 | | | $ | 1,021.08 | | | $ | 3.76 | | | | 0.75 | | | | 181 | | | | 365 | |
| Hartford Total Return Bond HLS Fund |
| Main Risks (Unaudited) |
The main risks of investing in the Fund are described below.
Market, Selection and Strategy Risk: The Fund’s share price may fluctuate due to market risk and/or security selections that may underperform the market or relevant benchmarks. If the sub-adviser's investment strategy does not perform as expected, the Fund could underperform its peers or lose money. There is no guarantee the Fund will achieve its stated objective.
Fixed Income Risk: The Fund is subject to interest rate risk (the risk that the value of an investment decreases when interest rates rise) and credit risk (the risk that the issuing company of a security is unable to pay interest and principal when due) and call risk (the risk that an investment may be redeemed early).
Mortgage-Backed Securities Risk: Mortgage-backed securities are subject to interest rate risk, credit risk, prepayment risk, extension risk, and the risk that an investment’s value may be reduced or become worthless if it receives interest or income payments only after other investments in the same pool. The Fund may purchase mortgage-backed securities in the "to be announced" (TBA) market. This subjects the Fund to counterparty risk and the risk that the security the Fund buys will lose value prior to its delivery.
Foreign Investment and Emerging Markets Risk: Investments in foreign securities may be riskier than investments in U.S. securities. Potential risks include the risks of illiquidity, increased price volatility, less government regulation, less extensive and less frequent accounting and other reporting requirements, unfavorable changes in currency exchange rates, and economic and political disruptions. These risks are generally greater for investments in emerging markets.
Derivatives Risk: Investments in derivatives can be volatile. Potential risks include currency risk, leverage risk (the risk that small market movements may result in large changes in the value of an investment), liquidity risk, index risk, pricing risk, and counterparty risk (the risk that the counterparty may be unwilling or unable to honor its obligations).
Active Trading Risk: Actively trading investments may result in higher costs (thus affecting performance).
THIS PRIVACY POLICY IS NOT PART OF THIS REPORT
Privacy Policy and Practices of The Hartford Financial Services Group, Inc. and its Affiliates
(herein called “we, our and us”)
This Privacy Policy applies to our United States Operations
We value your trust. We are committed to the responsible: a) management; b) use; and c) protection; of Personal Information. This notice describes how we collect, disclose, and protect Personal Information. We collect Personal Information to: a) service your Transactions with us; and b) support our business functions. We may obtain Personal Information from: a) You; b) your Transactions with us; and c) third parties such as a consumer-reporting agency. Based on the type of product or service You apply for or get from us, Personal Information such as: a) your name; b) your address; c) your income; d) your payment; or e) your credit history; may be gathered from sources such as applications, Transactions, and consumer reports. To serve You and service our business, we may share certain Personal Information. We will share Personal Information, only as allowed by law, with affiliates such as: a) our insurance companies; b) our employee agents; c) our brokerage firms; and d) our administrators. As allowed by law, we may share Personal Financial Information with our affiliates to: a) market our products; or b) market our services; to You without providing You with an option to prevent these disclosures. | | | We may also share Personal Information, only as allowed by law, with unaffiliated third parties including: a) independent agents; b) brokerage firms; c) insurance companies; d) administrators; and e) service providers; who help us serve You and service our business. When allowed by law, we may share certain Personal Financial Information with other unaffiliated third parties who assist us by performing services or functions such as: a) taking surveys; b) marketing our products or services; or c) offering financial products or services under a joint agreement between us and one or more financial institutions. We, and third parties we partner with, may track some of the pages You visit through the use of: a) cookies; b) pixel tagging; or c) other technologies; and currently do not process or comply with any web browser’s “do not track” signal or similar mechanism that indicates a request to disable online tracking of individual users who visit our websites or use our services. We will not sell or share your Personal Financial Information with anyone for purposes unrelated to our business functions without offering You the opportunity to: a) “opt-out;” or b) “opt-in;” as required by law. We only disclose Personal Health Information with: a) your proper written authorization; or b) as otherwise allowed or required by law. Our employees have access to Personal Information in the course of doing their jobs, such as: a) underwriting policies; b) paying claims; c) developing new products; or d) advising customers of our products and services. |
We use manual and electronic security procedures to maintain: a) the confidentiality; and b) the integrity of; Personal Information that we have. We use these procedures to guard against unauthorized access. Some techniques we use to protect Personal Information include: a) secured files; b) user authentication; c) encryption; d) firewall technology; and e) the use of detection software. We are responsible for and must: a) identify information to be protected; b) provide an adequate level of protection for that data; c) grant access to protected data only to those people who must use it in the performance of their job-related duties. Employees who violate our Privacy Policy will be subject to discipline, which may include ending their employment with us. At the start of our business relationship, we will give You a copy of our current Privacy Policy. We will also give You a copy of our current Privacy Policy once a year if You maintain a continuing business relationship with us. We will continue to follow our Privacy Policy regarding Personal Information even when a business relationship no longer exists between us. | | | As used in this Privacy Notice: Application means your request for our product or service. Personal Financial Information means financial information such as: a) credit history; b) income; c) financial benefits; or d) policy or claim information. Personal Health Information means health information such as: a) your medical records; or b) information about your illness, disability or injury. Personal Information means information that identifies You personally and is not otherwise available to the public. It includes: a) Personal Financial Information; and b) Personal Health Information. Transaction means your business dealings with us, such as: a) your Application; b) your request for us to pay a claim; and c) your request for us to take an action on your account. You means an individual who has given us Personal Information in conjunction with: a) asking about; b) applying for; or c) obtaining; a financial product or service from us if the product or service is used mainly for personal, family, or household purposes. |
This Privacy Policy is being provided on behalf of the following affiliates of The Hartford Financial Services Group, Inc.:
1stAGChoice, Inc.; Access CoverageCorp, Inc.; Access CoverageCorp Technologies, Inc.; American Maturity Life Insurance Company; Archway 60 R, LLC; Business Management Group, Inc.; Champlain Life Reinsurance Company; DMS R, LLC; Eloy R, LLC; Ersatz Corporation; First State Insurance Company; Hartford Accident and Indemnity Company; Hartford Administrative Services Company; Hartford Casualty General Agency, Inc.; Hartford Casualty Insurance Company; Hartford-Comprehensive Employee Benefit Service Company; Hartford Equity Sales Company, Inc.; Hartford Fire General Agency, Inc.; Hartford Fire Insurance Company; Hartford Funds Management Company, LLC; Hartford Funds Management Group, Inc.; Hartford HLS Series Fund II, Inc.; Hartford Insurance Company of Illinois; Hartford Insurance Company of the Midwest; Hartford Insurance Company of the Southeast; Hartford Integrated Technologies, Inc.; Hartford International Life Reassurance Corporation; Hartford Funds Distributors, LLC; Hartford Investment Management Company; Hartford Life and Accident Insurance Company; Hartford Life and Annuity Insurance Company; Hartford Life Insurance Company; Hartford Life Private Placement, LLC; Hartford Lloyd’s Corporation; Hartford Lloyd’s Insurance Company; Hartford Mezzanine Investors I, LLC; Hartford Residual Market, L.C.C.; Hartford Retirement Services, LLC; Hartford Securities Distribution Company, Inc.; Hartford Series Fund, Inc.; Hartford Specialty Insurance Services of Texas, LLC; Hartford Strategic Investments, LLC; Hartford Underwriters Insurance Company; Hartford Technology Services Company, L.L.C.; Hartford of Texas General Agency, Inc.; Hartford Underwriters General Agency, Inc.; HARTRE Company, L.C.C.; HL Investment Advisors, LLC; HLA LLC; Horizon Management Group, LLC; HRA Brokerage Services, Inc.; Lanidex Class B, LLC; M-CAP Insurance Agency, LLC; New England Insurance Company; New England Reinsurance Corporation; Nutmeg Insurance Agency, Inc.; Nutmeg Insurance Company; Pacific Insurance Company, Limited; Planco, LLC: Property and Casualty Insurance Company of Hartford; Revere R, LLC; RVR R, LLC; Sentinel Insurance Company, Ltd.; Sunstone R, LLC; Symphony R, LLC; The Evergreen Group Incorporated; The Hartford Alternative Strategies Fund; The Hartford Mutual Funds, Inc.; The Hartford Mutual Funds II, Inc.; Trumbull Flood Management, L.L.C.; Trumbull Insurance Company; Twin City Fire Insurance Company; White River Life Reinsurance Company.
HPP Revised January 2014
HARTFORD HLS FUNDS
P.O. Box 14293
Lexington, KY 40512-4293
HARTFORDFUNDS
hartfordfunds.com
Hartford Series Fund, Inc. is underwritten and distributed by Hartford Funds Distributors, LLC.
Hartford Series Fund, Inc. inception dates range from 1977 to date. Hartford Series Fund, Inc. is not a subsidiary of The Hartford Financial Services Group, Inc. ("The Hartford") but is underwritten, distributed by and advised by subsidiaries of The Hartford. Investments in Hartford Series Fund, Inc. are not guaranteed by The Hartford or any other entity.
This report is submitted for the general information of the shareholders of the Funds. It is not authorized for distribution unless preceded or accompanied by a current prospectus for the Funds.
Investors should carefully consider the investment objectives, risks, charges, and expenses of Hartford Funds before investing. This and other information can be found in the prospectus, which can be obtained by calling 800-862-6668 (or 800-279-1541 for institutional investors). Investors should read them carefully before they invest.
HLSSAR-TRB14 8-14 113555-3 Printed in U.S.A.
HARTFORDFUNDS
| | HARTFORD ULTRASHORT BOND HLS FUND* 2014 Semi Annual Report *Prior to October 21, 2013, Hartford Ultrashort Bond HLS Fund
was known as Hartford Money Market HLS Fund |
A MESSAGE FROM THE PRESIDENT
Dear Fellow Shareholders:
Thank you for investing in Hartford HLS Funds.
Market Review
U.S. equities (as represented by the S&P 500 Index) started 2014 on a shaky note after posting a strong 32.39% gain in 2013. However, stocks managed to maintain modest gains throughout the first quarter and returned to a generally steady climb in the second quarter. Through June 30, 2014, the S&P 500 Index advanced 7.14%. It appears that much of the market volatility during the year can be attributed to heightened international tensions. In particular, the Russian annexation of Ukraine’s Crimean Peninsula and increased tensions in Iraq were cause for concern.
On the domestic front, subdued economic and employment reports slowed stocks’ progress early in the new year, although much of the weakness seemed to dissipate as the year’s unusually harsh winter subsided. And despite initial reactions to the idea, when the U.S. Federal Reserve began tapering its quantitative-easing program in January by reducing its bond purchases by $10 billion a month, the markets took the policy change in stride.
Despite a rough start to the year for financial markets, the global economy seems to be settling into a slow-but-steady recovery. While first-quarter U.S. gross domestic product (GDP) growth was disappointing at -2.9%, U.S. consumer spending, which is a significant contributor toward economic growth, rose by 3% during the quarter. It appears that Europe is also maintaining its own recovery: The International Monetary Fund projects that Europe’s full-year GDP growth may breach positive territory for the first time since 2011.
The impact of international affairs on stocks so far this year is an important reminder to stay informed about both domestic and international economic developments, and any effects they may have on your individual investment goals. If you have not already had a mid-year review of your portfolio, it may be a good time to meet with your financial advisor to review your progress and make certain your investments are prepared for all market environments:
| • | Is your portfolio properly diversified with an appropriate mix of stocks and bonds? |
| • | Is your portfolio positioned to take advantage of the global economic recovery, with investments in both domestic and international holdings? |
| • | Are your investments still in line with your risk tolerance and investment time horizon? |
Your financial professional can help you choose options within our fund family to help you reach your investment goals with confidence.
Thank you again for investing with Hartford HLS Funds.
James Davey
President
Hartford HLS Funds
1 The S&P 500 Index is a market capitalization-weighted price index composed of 500 widely held common stocks.
2The Dow Jones Industrial Average is an unmanaged, price-weighted index of 30 of the largest, most widely held stocks traded on the New York Stock Exchange.
Hartford Ultrashort Bond HLS Fund
Table of Contents
This report is prepared for the general information of contract owners and qualified retirement plan participants. It is not an offer of contracts or of qualified retirement plans. It should not be used in connection with any offer, except in conjunction with the appropriate product prospectus which contains all pertinent information including the applicable sales, administrative and other charges.
The views expressed in the Fund’s Manager Discussion under “Why did the Fund perform this way?” and “What is the outlook?” are views of the Fund’s sub-adviser and portfolio management team through the end of the period and are subject to change based on market and other conditions. The Fund’s Manager Discussion is for informational purposes only and does not represent an offer, recommendation or solicitation to buy, hold or sell any security. The specific securities identified and described, if any, do not represent all of the securities purchased or sold and you should not assume that investments in the securities identified and discussed will be profitable.
| Hartford Ultrashort Bond HLS Fund inception 08/31/1977 |
| (sub-advised by Wellington Management Company, LLP) |
| |
| Investment objective – The Fund seeks total return and income consistent with preserving capital and maintaining liquidity. |
Performance Overview 10/21/13 - 6/30/14
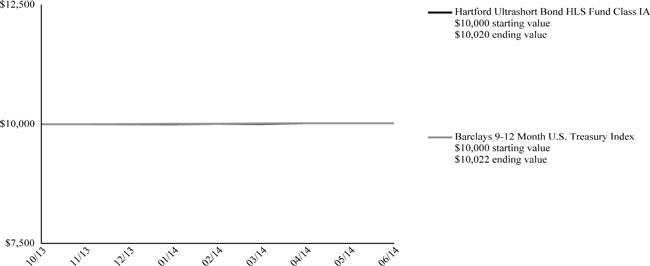
The chart above represents the hypothetical growth of a $10,000 investment in Class IA. Growth results in classes other than Class IA will vary from what is seen above due to differences in the expenses charged to those share classes.
Average Annual Total Returns (as of 6/30/14)
| | | 6 Months† | | | Since
Inception* | |
| Ultrashort Bond IA | | | 0.20% | | | | 0.20% | |
| Ultrashort Bond IB | | | 0.20% | | | | 0.10% | |
| Barclays 9-12 Month U.S. Treasury Index | | | 0.18% | | | | 0.22% | |
| * | On October 21, 2013, the Fund converted from a money market fund to an ultrashort bond fund. Total returns shown are from conversion date (October 21, 2013) to June 30, 2014. |
PERFORMANCE DATA QUOTED REPRESENTS PAST PERFORMANCE AND DOES NOT GUARANTEE FUTURE RESULTS. The investment return and principal value of the investment will fluctuate so that investors’ shares, when redeemed, may be worth more or less than their original cost. Current performance may be lower or higher than the performance data quoted. To obtain performance data current to the most recent month-end, please visit our website www.hartfordfunds.com.
Total returns presented above were calculated using the Fund’s net asset value available to shareholders for sale or redemption of Fund shares on June 30, 2014, which may exclude investment transactions as of this date. All share class returns assume the reinvestment of all distributions at net asset value and the deduction of all fund expenses.
Prior to October 21, 2013, the Fund was managed as a money market fund. Accordingly, performance of the Fund prior to October 21, 2013 is not shown. Past performance information for when the Fund was managed as a money market fund is available upon request by calling 1-800-862-6668.
Barclays 9-12 Month U.S. Treasury Index measures the performance of U.S. Treasury securities that have a remaining maturity between one and twelve months.
The index is unmanaged, and its results include reinvested dividends and/or distributions, but do not reflect the effect of sales charges, commissions, expenses or taxes.
You cannot invest directly in an index.
As shown in the Fund's current prospectus dated May 1, 2014, the total annual operating expense ratios for Class IA and Class IB were 0.45% and 0.70%, respectively. Actual expenses may be higher. Please see the accompanying Financial Highlights for expense ratios for the six-month period ended June 30, 2014.
The chart and table do not reflect the deductions of taxes, sales charges or other fees which may be applied at the variable life insurance, variable annuity or qualified retirement plan product level. Any such additional sales charges or other fees or expenses would lower the contract’s or plan’s performance.
All investments are subject to risk including the possible loss of principal. For a discussion of the Fund’s risks, please see the Main Risks section of this report. For more detailed information on the risks associated with an investment in the Fund, please see the prospectus.
| Hartford Ultrashort Bond HLS Fund |
| Manager Discussion |
| June 30, 2014 (Unaudited) |
| Portfolio Manager |
| Timothy E. Smith |
| Senior Vice President and Fixed Income Portfolio Manager |
How did the Fund perform?
The Class IA shares of the Hartford Ultrashort Bond HLS Fund returned 0.20% for the six-month period ended June 30, 2014, outperforming the Fund’s benchmark, the Barclays 9-12 Month U.S. Treasury Index, which returned 0.18% for the same period. The Fund outperformed the average return of the Lipper Short-Intermediate Investment Grade Debt Funds peer group (0.01%), a group of funds that invests primarily in investment grade issues with dollar-weighted average maturities of one to five years.
Why did the Fund perform this way?
Global fixed income markets gained during the period as expectations of prolonged easy monetary policy by major central banks and an improving, albeit below-trend, macroeconomic environment suppressed volatility. Early in the period, emerging markets dominated headlines as economic and political developments sparked risk aversion across global markets, pushing bond prices higher and yields lower amid a flight to quality. Meanwhile, central bank policies diverged. The U.S. Federal Reserve (Fed) began to wind down its quantitative easing program and the Bank of England started to prepare for interest rate rises. In contrast, the European Central Bank (ECB) announced a host of stimulus measures and the Bank of Japan maintained its easy monetary policy framework. European government bond yields fell sharply as the ECB loosened monetary policy further. In the U.S. and U.K., the Treasury curve continued to flatten as markets braced themselves for the end of quantitative easing in these economies.
Globally, credit spread sectors posted positive absolute returns and outperformed duration-equivalent government bonds as credit spreads tightened. Most currencies appreciated versus the U.S. dollar with the notable exception of European currencies, which declined following the ECB’s easing measures.
Out-of-benchmark allocations to investment grade credit, particularly financial institutions and industrials contributed to relative performance during the period. Our out-of-benchmark allocation to Asset Backed Securities was also additive across the auto, credit card, and equipment sectors. We use Treasury futures and interest rate swaps to manage duration and yield curve exposure. Yield curve and duration positioning did not have a material impact on returns.
What is the outlook?
We expect moderately stronger U.S. growth in the second half of 2014, underpinned by easing fiscal policy restraints and recovery in investment spending. Although home price appreciation is slowing from the fast pace of last year, we believe that housing demand and construction activities will continue, as the housing market returns to a more normal state. Interest rates are rising to more normal levels and home prices are approaching long term fair value. We also expect to see improvements in wages and employment in the second half of 2014, which also bodes well for housing.
Meanwhile, the market has become more accepting of the Fed’s forward guidance and potential for a lower terminal rate, which has allowed short rates and volatility to remain low. The market is currently pricing in the first rate hike around the second quarter of 2015, although we acknowledge the risk that faster economic growth and stronger inflation could cause the Fed to hike rates sooner than the market expects. That said, we expect Treasury yields to rise in the second half of 2014 as economic growth picks up.
At the end of the period, our duration positioning was short relative to the Barclays 9-12 Month U.S. Treasury Index. We continued to be positioned with out-of-benchmark allocations to investment grade corporates and Asset Backed Securities. Within investment grade corporates, we favor U.S. financials, as financial companies have de-levered significantly, and we have been looking to the new issue market to add exposure in fixed and floating rate issues. Within ABS, we favor auto, credit card and equipment issuers, as consumer fundamentals are supported by improving labor markets.
| Hartford Ultrashort Bond HLS Fund |
| Manager Discussion – (continued) |
| June 30, 2014 (Unaudited) |
Diversification by Security Type
as of June 30, 2014
| Category | | Percentage of
Net Assets | |
| Fixed Income Securities |
| Asset & Commercial Mortgage Backed Securities | | | 28.8 | % |
| Certificates of Deposit | | | 0.4 | |
| Corporate Bonds | | | 45.7 | |
| Municipal Bonds | | | 0.3 | |
| U.S. Government Agencies | | | 21.1 | |
| U.S. Government Securities | | | 2.8 | |
| Total | | | 99.1 | % |
| Short-Term Investments | | | 1.4 | |
| Other Assets and Liabilities | | | (0.5 | ) |
| Total | | | 100.0 | % |
| Credit Exposure |
| as of June 30, 2014 |
| Credit Rating * | | Percentage of
Net Assets | |
| Aaa / AAA | | | 28.8 | |
| Aa / AA | | | 32.8 | |
| A | | | 21.9 | |
| Baa / BBB | | | 14.0 | |
| Not Rated | | | 1.6 | |
| Non-Debt Securities and Other Short-Term Instruments | | | 1.4 | |
| Other Assets and Liabilities | | | (0.5 | ) |
| Total | | | 100.0 | % |
| * | Credit exposure is the long-term credit ratings for the Fund's holdings, as of the date noted, as provided by Standard and Poor's (S&P) or Moody's Investors Service and typically range from AAA/Aaa (highest) to C/D (lowest). Presentation of S&P and Moody's credit ratings in this report have been selected for several reasons, including access to information and materials provided by S&P and Moody's, as well as the Fund's consideration of industry practice. If Moody's and S&P assign different ratings, the lower rating is used. Fixed income securities that are not rated by either agency are listed as "Not Rated." Ratings do not apply to the Fund itself or to Fund shares. Ratings may change. |
| Hartford Ultrashort Bond HLS Fund |
| Schedule of Investments |
| June 30, 2014 (Unaudited) |
| (000’s Omitted) |
| Shares or Principal Amount | | Market Value ╪ | |
Asset and Commercial Mortgage Backed Securities - 28.8% | | | | |
| Finance and Insurance - 27.3% | | | | |
| | | | | Captive Auto Finance - 12.0% | | | | |
| | | | | Ally Automotive Receivables Trust | | | | |
| $ | 1,004 | | | 0.52%, 05/20/2015 | | $ | 1,004 | |
| | 4,395 | | | 0.63%, 05/15/2017 | | | 4,403 | |
| | 6,000 | | | 0.70%, 12/21/2015 | | | 6,004 | |
| | 1,885 | | | 0.75%, 02/21/2017 | | | 1,885 | |
| | | | | Ally Master Owner Trust | | | | |
| | 4,410 | | | 0.52%, 01/16/2018 Δ | | | 4,410 | |
| | 4,380 | | | 0.62%, 01/15/2019 Δ | | | 4,386 | |
| | 7,995 | | | 1.54%, 09/15/2016 ‡ | | | 8,014 | |
| | | | | AmeriCredit Automobile Receivables Trust | | | | |
| | 1,733 | | | 0.53%, 03/08/2017 Δ | | | 1,734 | |
| | | | | BMW Vehicle Owner Trust | | | | |
| | 2,098 | | | 0.41%, 02/25/2016 | | | 2,099 | |
| | | | | Capital Automotive Receivables Asset Trust | | | | |
| | 3,910 | | | 0.53%, 03/21/2016 Δ | | | 3,914 | |
| | 3,265 | | | 0.68%, 05/20/2016 | | | 3,269 | |
| | | | | CarMax Automotive Owner Trust | | | | |
| | 4,291 | | | 0.52%, 11/15/2016 | | | 4,295 | |
| | | | | Credit Acceptance Automotive Loan Trust | | | | |
| | 1,985 | | | 1.50%, 04/15/2021 ■ | | | 1,999 | |
| | | | | Ford Credit Automotive Owner Trust | | | | |
| | 3,417 | | | 0.48%, 11/15/2016 | | | 3,418 | |
| | 1,575 | | | 0.76%, 09/15/2016 | | | 1,579 | |
| | | | | Ford Credit Floorplan Master Owner Trust | | | | |
| | 2,105 | | | 0.55%, 02/15/2019 Δ | | | 2,106 | |
| | 2,450 | | | 0.85%, 01/15/2018 | | | 2,458 | |
| | | | | Huntington Automotive Trust | | | | |
| | 4,225 | | | 0.81%, 09/15/2016 | | | 4,233 | |
| | | | | Hyundai Automotive Lease Securitization Trust | | | | |
| | 3,983 | | | 0.92%, 08/17/2015 ■ | | | 3,986 | |
| | | | | M&T Bank Automotive Receivables Trust | | | | |
| | 6,535 | | | 1.06%, 11/15/2017 ■ | | | 6,577 | |
| | | | | Mercedes-Benz Automotive Lease Trust | | | | |
| | 6,635 | | | 0.59%, 02/15/2016 | | | 6,640 | |
| | 3,980 | | | 0.61%, 12/17/2018 | | | 3,981 | |
| | 3,445 | | | 0.62%, 07/15/2016 | | | 3,450 | |
| | | | | Nissan Automotive Lease Trust | | | | |
| | 1,338 | | | 0.42%, 01/15/2016 Δ | | | 1,340 | |
| | 2,890 | | | 0.61%, 09/15/2015 | | | 2,896 | |
| | 925 | | | 0.75%, 06/15/2016 | | | 928 | |
| | | | | Nissan Automotive Receivables Owner Trust | | | | |
| | 2,450 | | | 0.40%, 06/15/2016 | | | 2,450 | |
| | | | | Porsche Innovative Lease Owner Trust | | | | |
| | 2,817 | | | 0.54%, 01/22/2016 ■ | | | 2,819 | |
| | | | | Prestige Automotive Receivables Trust | | | | |
| | 2,210 | | | 0.97%, 03/15/2018 ■ | | | 2,210 | |
| | | | | Santander Drive Automotive Receivables Trust | | | | |
| | 2,397 | | | 0.53%, 04/17/2017 Δ | | | 2,399 | |
| | 1,125 | | | 0.66%, 07/17/2017 | | | 1,126 | |
| | 2,677 | | | 1.04%, 08/15/2016 | | | 2,679 | |
| | 5,633 | | | 2.39%, 06/15/2017 ■ | | | 5,638 | |
| | | | | Volvo Financial Equipment LLC | | | | |
| | 2,230 | | | 0.82%, 04/16/2018 ■ | | | 2,232 | |
| | 323 | | | 0.91%, 08/17/2015 ■ | | | 323 | |
| | | | | Wheels SPV LLC | | | | |
| | 675 | | | 0.84%, 03/20/2023 ■ | | | 675 | |
| | | | | World Omni Automotive Receivables Trust | | | | |
| | 5,906 | | | 0.48%, 11/15/2016 | | | 5,909 | |
| | | | | | | | 119,468 | |
| | | | | Captive Retail Finance - 0.3% | | | | |
| | | | | CNH Equipment Trust | | | | |
| | 3,170 | | | 0.49%, 07/15/2015 | | | 3,171 | |
| | | | | | | | | |
| | | | | Credit Card Issuing - 7.2% | | | | |
| | | | | American Express Credit Account Master Trust | | | | |
| | 1,520 | | | 0.98%, 05/15/2019 | | | 1,522 | |
| | 1,485 | | | 1.26%, 01/15/2020 ☼ | | | 1,485 | |
| | | | | Bank of America Credit Card Trust | | | | |
| | 2,995 | | | 0.53%, 06/15/2021 Δ | | | 2,995 | |
| | | | | Cabela's Master Credit Card Trust | | | | |
| | 1,085 | | | 0.50%, 03/16/2020 Δ | | | 1,086 | |
| | | | | Capital One Multi-Asset Execution Trust | | | | |
| | 6,000 | | | 0.33%, 02/15/2019 Δ | | | 6,000 | |
| | 3,605 | | | 0.96%, 09/16/2019 | | | 3,605 | |
| | | | | Chase Issuance Trust | | | | |
| | 6,000 | | | 0.57%, 11/16/2020 Δ | | | 6,013 | |
| | 6,850 | | | 0.59%, 08/15/2017 | | | 6,860 | |
| | 6,905 | | | 0.79%, 06/15/2017 | | | 6,931 | |
| | | | | Citibank Credit Card Issuance Trust | | | | |
| | 3,660 | | | 0.47%, 11/07/2018 Δ | | | 3,660 | |
| | 2,045 | | | 1.02%, 02/22/2019 | | | 2,044 | |
| | 4,965 | | | 1.32%, 09/07/2018 | | | 5,013 | |
| | | | | Citibank Omni Master Trust | | | | |
| | 6,567 | | | 4.90%, 11/15/2018 ■Δ | | | 6,676 | |
| | | | | Discover Card Master Trust | | | | |
| | 7,480 | | | 0.86%, 11/15/2017 | | | 7,511 | |
| | | | | Golden Credit Card Trust | | | | |
| | 4,465 | | | 0.40%, 02/15/2018 ■Δ | | | 4,466 | |
| | 3,125 | | | 0.48%, 03/15/2019 ■Δ | | | 3,126 | |
| | 3,275 | | | 0.79%, 09/15/2017 ■ | | | 3,285 | |
| | | | | | | | 72,278 | |
| | | | | Real Estate Credit (Mortgage Banking) - 7.8% | | | | |
| | | | | Banc of America Commercial Mortgage, Inc. | | | | |
| | 1,996 | | | 5.18%, 09/10/2047 Δ | | | 2,086 | |
| | | | | Bear Stearns Commercial Mortgage Securities, Inc. | | | | |
| | 3,000 | | | 5.29%, 10/12/2042 Δ | | | 3,133 | |
| | | | | Chesapeake Funding LLC | | | | |
| | 1,955 | | | 0.57%, 03/07/2026 ■Δ | | | 1,957 | |
| | | | | Citigroup/Deutsche Bank Commercial Mortgage Trust | | | | |
| | 1,730 | | | 5.30%, 01/15/2046 Δ | | | 1,826 | |
| | 4,808 | | | 5.40%, 07/15/2044 Δ | | | 4,999 | |
| | | | | CNH Equipment Trust | | | | |
| | 5,597 | | | 0.63%, 01/17/2017 | | | 5,602 | |
| | 2,802 | | | 0.86%, 09/15/2017 | | | 2,809 | |
| | 1,566 | | | 1.19%, 12/15/2016 | | | 1,570 | |
| | | | | Community or Commercial Mortgage Trust | | | | |
| | 1,130 | | | 0.95%, 03/15/2029 ■Δ | | | 1,132 | |
| | | | | Credit Suisse Mortgage Capital Certificates | | | | |
| | 872 | | | 5.47%, 09/15/2039 | | | 939 | |
| | | | | DT Automotive Owner Trust | | | | |
| | 1,707 | | | 0.66%, 07/17/2017 ■ | | | 1,707 | |
| | | | | First Investors Automotive Owner Trust | | | | |
| | 1,927 | | | 0.89%, 09/15/2017 ■ | | | 1,930 | |
| | | | | Ford Credit Automotive Owner Trust | | | | |
| | 3,000 | | | 0.57%, 06/15/2016 | | | 3,004 | |
| | | | | GE Capital Credit Card Master Note Trust | | | | |
| | 6,735 | | | 1.03%, 01/15/2018 | | | 6,755 | |
The accompanying notes are an integral part of these financial statements.
| Hartford Ultrashort Bond HLS Fund |
| Schedule of Investments – (continued) |
| June 30, 2014 (Unaudited) |
| (000’s Omitted) |
| Shares or Principal Amount | | Market Value ╪ | |
| Asset and Commercial Mortgage Backed Securities - 28.8% - (continued) | | | | |
| Finance and Insurance - 27.3% - (continued) | | | | |
| | | | | Real Estate Credit (Mortgage Banking) - 7.8% - (continued) | | | | |
| | | | | GE Dealer Floorplan Master Note Trust | | | | |
| $ | 6,500 | | | 0.59%, 10/20/2017 Δ | | $ | 6,515 | |
| | 8,345 | | | 0.64%, 06/20/2017 Δ | | | 8,366 | |
| | | | | Hilton USA Trust | | | | |
| | 1,885 | | | 1.15%, 11/05/2030 ■Δ | | | 1,887 | |
| | | | | John Deere Owner Trust | | | | |
| | 6,000 | | | 0.69%, 01/15/2019 | | | 6,006 | |
| | 6,000 | | | 0.87%, 08/15/2017 | | | 6,021 | |
| | | | | JP Morgan Chase Commercial Mortgage Securities Corp. | | | | |
| | 1,134 | | | 3.85%, 06/15/2043 ■ | | | 1,158 | |
| | 2,396 | | | 4.92%, 10/15/2042 | | | 2,487 | |
| | 1,085 | | | 5.86%, 04/15/2045 Δ | | | 1,167 | |
| | | | | Morgan Stanley Capital I | | | | |
| | 495 | | | 4.99%, 08/13/2042 | | | 508 | |
| | 1,214 | | | 5.20%, 11/14/2042 Δ | | | 1,258 | |
| | | | | Westlake Automobile Receivables Trust | | | | |
| | 2,550 | | | 0.70%, 05/15/2017 ■ | | | 2,550 | |
| | | | | | | | 77,372 | |
| | | | | | | | 272,289 | |
| Machinery Manufacturing - 0.1% | | | | |
| | | | | Other General Purpose Machinery Manufacturing - 0.1% | | | | |
| | | | | Kubota Credit Owner Trust | | | | |
| | 1,025 | | | 0.58%, 02/15/2017 ■ | | | 1,025 | |
| | | | | | | | | |
| Real Estate, Rental and Leasing - 0.8% | | | | |
| | | | | Automotive Equipment Rental and Leasing - 0.8% | | | | |
| | | | | Enterprise Fleet Financing LLC | | | | |
| | 4,563 | | | 0.68%, 09/20/2018 ■ | | | 4,563 | |
| | 1,190 | | | 0.87%, 09/20/2019 ■ | | | 1,190 | |
| | 2,495 | | | 1.06%, 03/20/2019 ■ | | | 2,506 | |
| | | | | | | | 8,259 | |
| Transportation Equipment Manufacturing - 0.6% | | | | |
| | | | | Railroad Rolling Stock Manufacturing - 0.6% | | | | |
| | | | | GE Equipment Transportation LLC | | | | |
| | 2,410 | | | 0.61%, 06/24/2016 | | | 2,412 | |
| | 3,000 | | | 0.92%, 09/25/2017 | | | 3,011 | |
| | | | | | | | 5,423 | |
| | | | | Total Asset and Commercial Mortgage Backed Securities | | | | |
| | | | | (Cost $287,074) | | $ | 286,996 | |
| | | | | | | | | |
| Certificates of Deposit - 0.4% | | | | |
| Finance and Insurance - 0.4% | | | | |
| | | | | Commercial Banking - 0.4% | | | | |
| | | | | Credit Suisse New York, | | | | |
| $ | 4,500 | | | 0.64%, 12/7/2015 Δ | | $ | 4,504 | |
| | | | | | | | | |
| | | | | Total Certificates of Deposit | | | | |
| | | | | (Cost $4,500) | | $ | 4,504 | |
| | | | | | | | | |
| Corporate Bonds - 45.7% | | | | |
| Arts, Entertainment and Recreation - 0.7% | | | | |
| | | | | Cable and Other Subscription Programming - 0.3% | | | | |
| | | | | Comcast Corp. | | | | |
| $ | 3,000 | | | 5.85%, 11/15/2015 | | $ | 3,219 | |
| | | | | Data Processing, Hosting and Related Services - 0.1% | | | | |
| | | | | Fidelity National Information Services, Inc. | | | | |
| | 405 | | | 1.45%, 06/05/2017 | | | 405 | |
| | | | | | | | | |
| | | | | Radio and Television Broadcasting - 0.3% | | | | |
| | | | | NBC Universal Enterprise | | | | |
| | 3,000 | | | 0.91%, 04/15/2018 ■Δ | | | 3,033 | |
| | | | | | | | 6,657 | |
| Beverage and Tobacco Product Manufacturing - 1.8% | | | | |
| | | | | Beverage Manufacturing - 1.0% | | | | |
| | | | | Anheuser-Busch InBev Worldwide, Inc. | | | | |
| | 5,000 | | | 0.62%, 02/01/2019 Δ | | | 5,002 | |
| | | | | Coca-Cola Enterprises, Inc. | | | | |
| | 5,000 | | | 2.13%, 09/15/2015 | | | 5,092 | |
| | | | | | | | 10,094 | |
| | | | | Tobacco Manufacturing - 0.8% | | | | |
| | | | | BAT International Finance plc | | | | |
| | 2,105 | | | 1.40%, 06/05/2015 ■ | | | 2,123 | |
| | | | | Philip Morris International, Inc. | | | | |
| | 6,000 | | | 2.50%, 05/16/2016 | | | 6,213 | |
| | | | | | | | 8,336 | |
| | | | | | | | 18,430 | |
| Chemical Manufacturing - 0.2% | | | | |
| | | | | Agricultural Chemical Manufacturing - 0.2% | | | | |
| | | | | Monsanto Co. | | | | |
| | 2,000 | | | 1.15%, 06/30/2017 | | | 2,001 | |
| | | | | Yara International ASA | | | | |
| | 200 | | | 5.25%, 12/15/2014 ■ | | | 204 | |
| | | | | | | | 2,205 | |
| Computer and Electronic Product Manufacturing - 0.5% | | | | |
| | | | | Computer and Peripheral Equipment Manufacturing - 0.3% | | | | |
| | | | | Hewlett-Packard Co. | | | | |
| | 3,000 | | | 1.17%, 01/14/2019 Δ | | | 3,024 | |
| | | | | | | | | |
| | | | | Navigational, Measuring, and Control Instruments - 0.2% | | | | |
| | | | | Thermo Fisher Scientific, Inc. | | | | |
| | 1,450 | | | 1.30%, 02/01/2017 | | | 1,452 | |
| | | | | | | | 4,476 | |
| Electrical Equipment, Appliance Manufacturing - 0.3% | | | | |
| | | | | Household Appliance Manufacturing - 0.3% | | | | |
| | | | | Whirlpool Corp. | | | | |
| | 2,645 | | | 1.35%, 03/01/2017 | | | 2,647 | |
| | | | | | | | | |
| Finance and Insurance - 33.2% | | | | |
| | | | | Captive Auto Finance - 1.4% | | | | |
| | | | | American Honda Finance Corp. | | | | |
| | 6,000 | | | 0.73%, 10/07/2016 Δ | | | 6,046 | |
| | | | | Harley-Davidson Financial Services, Inc. | | | | |
| | 2,600 | | | 3.88%, 03/15/2016 ■ | | | 2,728 | |
| | | | | Nissan Motor Acceptance Corp. | | | | |
| | 1,375 | | | 0.78%, 03/03/2017 ■Δ | | | 1,379 | |
| | 3,975 | | | 0.93%, 09/26/2016 ■Δ | | | 4,001 | |
| | | | | | | | 14,154 | |
| | | | | Commercial Banking - 4.9% | | | | |
| | | | | Barclays Bank plc | | | | |
| | 2,815 | | | 0.81%, 02/17/2017 Δ | | | 2,824 | |
The accompanying notes are an integral part of these financial statements.
| Hartford Ultrashort Bond HLS Fund |
| Schedule of Investments – (continued) |
| June 30, 2014 (Unaudited) |
| (000’s Omitted) |
| Shares or Principal Amount | | Market Value ╪ | |
Corporate Bonds - 45.7% - (continued) | | | | |
| Finance and Insurance - 33.2% - (continued) | | | | |
| | | | | Commercial Banking - 4.9% - (continued) | | | | |
| | | | | BNP Paribas | | | | |
| $ | 5,000 | | | 0.82%, 12/12/2016 Δ | | $ | 5,016 | |
| | | | | Branch Banking & Trust Co. | | | | |
| | 2,500 | | | 0.66%, 12/01/2016 Δ | | | 2,508 | |
| | | | | Commonwealth Bank of Australia | | | | |
| | 2,000 | | | 0.73%, 09/20/2016 ■Δ | | | 2,012 | |
| | | | | Credit Suisse New York | | | | |
| | 1,700 | | | 1.38%, 05/26/2017 | | | 1,705 | |
| | | | | HSBC Bank plc | | | | |
| | 3,000 | | | 0.86%, 05/15/2018 ■Δ | | | 3,028 | |
| | | | | Huntington National Bank | | | | |
| | 3,000 | | | 0.65%, 04/24/2017 Δ | | | 3,002 | |
| | | | | ING Bank N.V. | | | | |
| | 6,000 | | | 1.87%, 09/25/2015 ■Δ | | | 6,101 | |
| | | | | Manufacturers & Traders Trust Co. | | | | |
| | 5,000 | | | 0.60%, 01/30/2017 Δ | | | 5,004 | |
| | | | | Nordea Bank AB | | | | |
| | 3,000 | | | 0.59%, 04/04/2017 ■Δ | | | 3,004 | |
| | 3,000 | | | 0.68%, 05/13/2016 ■Δ | | | 3,015 | |
| | | | | Rabobank Nederland | | | | |
| | 6,000 | | | 0.71%, 03/18/2016 Δ | | | 6,034 | |
| | | | | Svenska Handelsbanken AB | | | | |
| | 6,000 | | | 0.70%, 09/23/2016 Δ | | | 6,035 | |
| | | | | | | | 49,288 | |
| | | | | Depository Credit Banking - 6.8% | | | | |
| | | | | Bank of America Corp. | | | | |
| | 4,000 | | | 1.05%, 03/22/2016 Δ | | | 4,030 | |
| | 2,000 | | | 1.27%, 01/15/2019 Δ | | | 2,025 | |
| | 2,000 | | | 1.30%, 03/22/2018 Δ | | | 2,026 | |
| | | | | Bank of Montreal | | | | |
| | 6,000 | | | 0.75%, 07/15/2016 Δ | | | 6,039 | |
| | | | | Bank of New York Mellon Corp. | | | | |
| | 6,000 | | | 0.46%, 03/04/2016 Δ | | | 6,006 | |
| | | | | Bank of Nova Scotia | | | | |
| | 6,000 | | | 0.75%, 07/15/2016 Δ | | | 6,033 | |
| | | | | BB&T Corp. | | | | |
| | 2,500 | | | 0.89%, 02/01/2019 Δ | | | 2,517 | |
| | | | | Citigroup, Inc. | | | | |
| | 6,500 | | | 0.90%, 11/15/2016 Δ | | | 6,533 | |
| | 4,000 | | | 1.00%, 04/08/2019 Δ | | | 4,006 | |
| | | | | Fifth Third Bancorp | | | | |
| | 2,500 | | | 0.77%, 11/18/2016 Δ | | | 2,510 | |
| | 2,500 | | | 1.35%, 06/01/2017 | | | 2,506 | |
| | | | | PNC Bank NA | | | | |
| | 7,500 | | | 1.15%, 11/01/2016 | | | 7,539 | |
| | | | | SunTrust Banks, Inc. | | | | |
| | 3,000 | | | 0.66%, 02/15/2017 Δ | | | 2,999 | |
| | | | | Toronto-Dominion Bank | | | | |
| | 3,000 | | | 0.46%, 05/02/2017 Δ | | | 2,998 | |
| | 3,000 | | | 0.69%, 09/09/2016 Δ | | | 3,017 | |
| | | | | U.S. Bancorp | | | | |
| | 875 | | | 0.71%, 11/15/2018 Δ | | | 879 | |
| | | | | Wells Fargo & Co. | | | | |
| | 2,000 | | | 1.15%, 06/02/2017 | | | 1,997 | |
| | 2,500 | | | 1.50%, 07/01/2015 | | | 2,528 | |
| | | | | Wells Fargo Bank NA | | | | |
| | 1,450 | | | 0.38%, 06/02/2016 Δ | | | 1,450 | |
| | | | | | | | 67,638 | |
| | | | | Insurance Carriers - 2.4% | | | | |
| | | | | MetLife Global Funding I | | | | |
| | 9,500 | | | 0.46%, 08/08/2014 ■Δ | | | 9,502 | |
| | | | | New York Life Global Funding | | | | |
| | 3,500 | | | 1.13%, 03/01/2017 ■ | | | 3,506 | |
| | | | | Pricoa Global Funding I | | | | |
| | 3,500 | | | 1.15%, 11/25/2016 ■ | | | 3,504 | |
| | | | | Principal Life Global Funding II | | | | |
| | 2,000 | | | 1.13%, 02/24/2017 ■ | | | 1,995 | |
| | 1,450 | | | 1.20%, 05/19/2017 ■ | | | 1,451 | |
| | | | | Prudential Financial, Inc. | | | | |
| | 4,000 | | | 1.00%, 08/15/2018 Δ | | | 4,005 | |
| | | | | | | | 23,963 | |
| | | | | International Trade Financing (Foreign Banks) - 3.6% | | | | |
| | | | | Australia & New Zealand Banking Group Ltd. | | | | |
| | 3,000 | | | 0.42%, 05/07/2015 ■Δ | | | 3,005 | |
| | 3,000 | | | 0.61%, 01/10/2017 ■Δ | | | 3,008 | |
| | | | | BPCE S.A. | | | | |
| | 6,000 | | | 1.07%, 02/10/2017 Δ | | | 6,051 | |
| | | | | Canadian Imperial Bank of Commerce | | | | |
| | 6,000 | | | 0.75%, 07/18/2016 Δ | | | 6,035 | |
| | | | | Credit Agricole S.A. | | | | |
| | 6,000 | | | 1.08%, 10/03/2016 ■Δ | | | 6,033 | |
| | | | | Royal Bank of Canada | | | | |
| | 3,000 | | | 0.56%, 01/23/2017 Δ | | | 3,008 | |
| | 3,000 | | | 0.60%, 03/08/2016 Δ | | | 3,010 | |
| | | | | Societe Generale | | | | |
| | 3,000 | | | 1.31%, 10/01/2018 Δ | | | 3,009 | |
| | | | | Sumitomo Mitsui Banking Corp. | | | | |
| | 3,000 | | | 0.66%, 01/10/2017 Δ | | | 3,007 | |
| | | | | | | | 36,166 | |
| | | | | Monetary Authorities - Central Bank - 0.9% | | | | |
| | | | | ABN Amro Bank N.V. | | | | |
| | 2,150 | | | 0.64%, 06/06/2016 ■Δ | | | 2,146 | |
| | | | | Deutsche Bank AG London | | | | |
| | 2,000 | | | 0.83%, 02/13/2017 Δ | | | 2,009 | |
| | 2,000 | | | 1.35%, 05/30/2017 | | | 2,000 | |
| | | | | Lloyds Banking Group plc | | | | |
| | 2,595 | | | 4.38%, 01/12/2015 ■ | | | 2,645 | |
| | | | | | | | 8,800 | |
| | | | | Nondepository Credit Banking - 7.0% | | | | |
| | | | | American Express Credit Corp. | | | | |
| | 1,500 | | | 0.74%, 07/29/2016 Δ | | | 1,510 | |
| | 2,500 | | | 0.78%, 03/18/2019 Δ | | | 2,514 | |
| | 1,500 | | | 1.13%, 06/05/2017 | | | 1,498 | |
| | | | | Capital One Bank | | | | |
| | 2,500 | | | 1.15%, 11/21/2016 | | | 2,510 | |
| | 1,500 | | | 1.30%, 06/05/2017 | | | 1,499 | |
| | | | | Caterpillar Financial Services Corp. | | | | |
| | 2,175 | | | 0.46%, 03/03/2017 Δ | | | 2,177 | |
| | 6,000 | | | 0.47%, 02/26/2016 Δ | | | 6,012 | |
| | | | | Ford Motor Credit Co. LLC | | | | |
| | 2,150 | | | 1.01%, 01/17/2017 Δ | | | 2,165 | |
| | 2,500 | | | 1.06%, 03/12/2019 Δ | | | 2,514 | |
| | 2,000 | | | 1.72%, 12/06/2017 | | | 2,001 | |
| | | | | General Electric Capital Corp. | | | | |
| | 2,000 | | | 0.50%, 05/15/2017 Δ | | | 2,002 | |
| | 3,000 | | | 0.94%, 04/02/2018 Δ | | | 3,040 | |
The accompanying notes are an integral part of these financial statements.
| Hartford Ultrashort Bond HLS Fund |
| Schedule of Investments – (continued) |
| June 30, 2014 (Unaudited) |
| (000’s Omitted) |
| Shares or Principal Amount | | Market Value ╪ | |
| Corporate Bonds - 45.7% - (continued) | | | | |
| Finance and Insurance - 33.2% - (continued) | | | | |
| | | | | Nondepository Credit Banking - 7.0% - (continued) | | | | |
| | | | | John Deere Capital Corp. | | | | |
| $ | 3,000 | | | 0.35%, 06/15/2015 Δ | | $ | 3,003 | |
| | 3,000 | | | 1.05%, 12/15/2016 | | | 3,011 | |
| | | | | National Rural Utilities Cooperative Finance Corp. | | | | |
| | 4,000 | | | 0.53%, 11/23/2016 Δ | | | 4,011 | |
| | | | | Private Export Funding Corp. | | | | |
| | 23,370 | | | 4.55%, 05/15/2015 | | | 24,248 | |
| | | | | Toyota Motor Credit Corp. | | | | |
| | 4,000 | | | 0.52%, 05/17/2016 Δ | | | 4,013 | |
| | 2,000 | | | 1.13%, 05/16/2017 | | | 2,003 | |
| | | | | | | | 69,731 | |
| | | | | Other Financial Investment Activities - 0.7% | | | | |
| | | | | BP Capital Markets plc | | | | |
| | 3,000 | | | 0.64%, 11/07/2016 Δ | | | 3,014 | |
| | 4,000 | | | 0.86%, 09/26/2018 Δ | | | 4,037 | |
| | | | | | | | 7,051 | |
| | | | | Real Estate Credit (Mortgage Banking) - 0.3% | | | | |
| | | | | Abbey National Treasury Services plc | | | | |
| | 3,000 | | | 0.74%, 03/13/2017 Δ | | | 3,005 | |
| | | | | | | | | |
| | | | | Real Estate Investment Trust (REIT) - 0.5% | | | | |
| | | | | Ventas Realty L.P. | | | | |
| | 570 | | | 1.25%, 04/17/2017 | | | 570 | |
| | 4,000 | | | 1.55%, 09/26/2016 | | | 4,041 | |
| | | | | | | | 4,611 | |
| | | | | Securities and Commodity Contracts and Brokerage - 4.7% | | | | |
| | | | | Goldman Sachs Group, Inc. | | | | |
| | 2,000 | | | 1.32%, 11/15/2018 Δ | | | 2,027 | |
| | 3,000 | | | 1.42%, 04/30/2018 Δ | | | 3,048 | |
| | 2,000 | | | 1.60%, 11/23/2015 | | | 2,021 | |
| | | | | JP Morgan Chase & Co. | | | | |
| | 15,500 | | | 0.35%, 12/05/2014 Δ | | | 15,499 | |
| | 3,000 | | | 0.85%, 02/26/2016 Δ | | | 3,017 | |
| | 3,000 | | | 0.86%, 01/28/2019 Δ | | | 3,013 | |
| | | | | Macquarie Bank Ltd. | | | | |
| | 3,750 | | | 1.22%, 01/31/2017 ■Δ | | | 3,755 | |
| | | | | Morgan Stanley | | | | |
| | 3,000 | | | 1.08%, 01/24/2019 Δ | | | 3,020 | |
| | 1,525 | | | 1.48%, 02/25/2016 Δ | | | 1,546 | |
| | 1,275 | | | 5.95%, 12/28/2017 | | | 1,452 | |
| | | | | UBS AG Stamford CT | | | | |
| | 7,360 | | | 5.88%, 07/15/2016 - 12/20/2017 | | | 8,173 | |
| | | | | | | | 46,571 | |
| | | | | | | | 330,978 | |
| Health Care and Social Assistance - 1.2% | | | | |
| | | | | Drugs and Druggists' Sundries Merchant Wholesalers - 0.3% | | | | |
| | | | | McKesson Corp. | | | | |
| | 3,300 | | | 1.29%, 03/10/2017 | | | 3,308 | |
| | | | | | | | | |
| | | | | Health and Personal Care Stores - 0.6% | | | | |
| | | | | CVS Caremark Corp. | | | | |
| | 2,585 | | | 1.20%, 12/05/2016 | | | 2,601 | |
| | | | | Express Scripts, Inc. | | | | |
| | 1,500 | | | 1.25%, 06/02/2017 | | | 1,497 | |
| | 1,500 | | | 3.13%, 05/15/2016 | | | 1,563 | |
| | | | | | | | 5,661 | |
| | | | | Pharmaceutical and Medicine Manufacturing - 0.3% | | | | |
| | | | | Actavis Funding SCS | | | | |
| | 2,000 | | | 1.30%, 06/15/2017 ■ | | | 1,996 | |
| | | | | Perrigo Co., Ltd. | | | | |
| | 935 | | | 1.30%, 11/08/2016 ■ | | | 934 | |
| | | | | | | | 2,930 | |
| | | | | | | | 11,899 | |
| Information - 2.0% | | | | |
| | | | | Software Publishers - 0.4% | | | | |
| | | | | Thomson Reuters Corp. | | | | |
| | 700 | | | 0.88%, 05/23/2016 | | | 699 | |
| | 3,000 | | | 1.30%, 02/23/2017 | | | 3,004 | |
| | | | | | | | 3,703 | |
| | | | | Telecommunications - Wired Carriers - 1.0% | | | | |
| | | | | AT&T, Inc. | | | | |
| | 6,000 | | | 0.61%, 02/12/2016 Δ | | | 6,017 | |
| | | | | British Telecommunications plc | | | | |
| | 1,190 | | | 1.25%, 02/14/2017 | | | 1,191 | |
| | 3,135 | | | 1.63%, 06/28/2016 | | | 3,179 | |
| | | | | | | | 10,387 | |
| | | | | Wireless Communications Services - 0.6% | | | | |
| | | | | Verizon Communications, Inc. | | | | |
| | 6,000 | | | 1.98%, 09/14/2018 Δ | | | 6,330 | |
| | | | | | | | 20,420 | |
| Miscellaneous Manufacturing - 0.5% | | | | |
| | | | | Aerospace Product and Parts Manufacturing - 0.5% | | | | |
| | | | | Rockwell Collins, Inc. | | | | |
| | 2,300 | | | 0.58%, 12/15/2016 Δ | | | 2,306 | |
| | | | | United Technologies Corp. | | | | |
| | 3,000 | | | 0.73%, 06/01/2015 Δ | | | 3,013 | |
| | | | | | | | 5,319 | |
| Motor Vehicle and Parts Manufacturing - 0.2% | | | | |
| | | | | Motor Vehicle Manufacturing - 0.2% | | | | |
| | | | | Daimler Finance NA LLC | | | | |
| | 2,200 | | | 0.58%, 03/10/2017 ■Δ | | | 2,202 | |
| | | | | | | | | |
| Petroleum and Coal Products Manufacturing - 1.4% | | | | |
| | | | | Natural Gas Distribution - 0.4% | | | | |
| | | | | Enbridge, Inc. | | | | |
| | 1,800 | | | 0.68%, 06/02/2017 Δ | | | 1,804 | |
| | 2,000 | | | 0.88%, 10/01/2016 Δ | | | 2,011 | |
| | | | | | | | 3,815 | |
| | | | | Oil and Gas Extraction - 1.0% | | | | |
| | | | | Devon Energy Corp. | | | | |
| | 4,250 | | | 0.77%, 12/15/2016 Δ | | | 4,270 | |
| | | | | Petrobras Global Finance Co. | | | | |
| | 3,000 | | | 1.85%, 05/20/2016 Δ | | | 3,004 | |
| | | | | Statoil ASA | | | | |
| | 3,000 | | | 0.68%, 11/08/2018 Δ | | | 3,020 | |
| | | | | | | | 10,294 | |
| | | | | | | | 14,109 | |
| Pipeline Transportation - 0.5% | | | | |
| | | | | Pipeline Transportation of Natural Gas - 0.5% | | | | |
| | | | | Enterprise Products Operating LLC | | | | |
| | 5,000 | | | 1.25%, 08/13/2015 | | | 5,035 | |
The accompanying notes are an integral part of these financial statements.
| Hartford Ultrashort Bond HLS Fund |
| Schedule of Investments – (continued) |
| June 30, 2014 (Unaudited) |
| (000’s Omitted) |
| Shares or Principal Amount | | Market Value ╪ | |
| Corporate Bonds - 45.7% - (continued) | | | | |
| Rail Transportation - 0.4% | | | | |
| | | | | Rail Transportation - 0.4% | | | | |
| | | | | Canadian National Railway Co. | | | | |
| $ | 3,860 | | | 0.42%, 11/06/2015 Δ | | $ | 3,861 | |
| | | | | | | | | |
| Real Estate, Rental and Leasing - 0.4% | | | | |
| | | | | Automotive Equipment Rental and Leasing - 0.3% | | | | |
| | | | | PACCAR Financial Services Corp. | | | | |
| | 1,500 | | | 0.83%, 12/06/2018 Δ | | | 1,514 | |
| | 975 | | | 1.10%, 06/06/2017 | | | 974 | |
| | | | | | | | 2,488 | |
| | | | | Industrial Machinery and Equipment Rental and Leasing - 0.1% | | | | |
| | | | | GATX Corp. | | | | |
| | 1,145 | | | 1.25%, 03/04/2017 | | | 1,141 | |
| | | | | | | | 3,629 | |
| Retail Trade - 0.5% | | | | |
| | | | | Grocery Stores - 0.5% | | | | |
| | | | | Kroger (The) Co. | | | | |
| | 4,500 | | | 0.76%, 10/17/2016 Δ | | | 4,510 | |
| | | | | | | | | |
| Utilities - 1.3% | | | | |
| | | | | Electric Generation, Transmission and Distribution - 1.3% | | | | |
| | | | | Dominion Resources, Inc. | | | | |
| | 4,000 | | | 1.05%, 11/01/2016 ■ | | | 3,985 | |
| | | | | Duke Energy Indiana, Inc. | | | | |
| | 6,000 | | | 0.58%, 07/11/2016 Δ | | | 6,022 | |
| | | | | Nstar Electric Co. | | | | |
| | 3,165 | | | 0.47%, 05/17/2016 Δ | | | 3,161 | |
| | | | | | | | 13,168 | |
| Wholesale Trade - 0.6% | | | | |
| | | | | Beer, Wine, Distilled Alcoholic Beverage Wholesalers - 0.6% | | | | |
| | | | | SABMiller Holdings, Inc. | | | | |
| | 6,000 | | | 0.92%, 08/01/2018 ■Δ | | | 6,034 | |
| | | | | | | | | |
| | | | | Total Corporate Bonds | | | | |
| | | | | (Cost $454,407) | | $ | 455,579 | |
| | | | | | | | | |
| Municipal Bonds - 0.3% | | | | |
| | | | | Industrial - 0.2% | | | | |
| | | | | New Jersey State Econ DA | | | | |
| $ | 2,000 | | | 1.10%, 06/15/2016 | | $ | 1,996 | |
| | | | | | | | | |
| | | | | Tax Allocation - 0.1% | | | | |
| | | | | New York State Dormitory Auth Rev | | | | |
| | 1,000 | | | 4.81%, 12/15/2014 | | | 1,020 | |
| | | | | | | | | |
| | | | | Total Municipal Bonds | | | | |
| | | | | (Cost $3,020) | | $ | 3,016 | |
| | | | | | | | | |
| U.S. Government Agencies - 21.1% | | | | |
| | | | | FHLMC - 3.5% | | | | |
| $ | 9,595 | | | 0.35%, 03/18/2015 | | $ | 9,610 | |
| | 25,000 | | | 0.63%, 12/29/2014 | | | 25,062 | |
| | | | | | | | 34,672 | |
| | | | | FNMA - 17.6% | | | | |
| | 75,000 | | | 0.50%, 07/02/2015 | | | 75,243 | |
| | 100,000 | | | 0.75%, 12/19/2014 | | | 100,296 | |
| | | | | | | | 175,539 | |
| | | | | Total U.S. Government Agencies | | | | |
| | | | | (Cost $210,077) | | $ | 210,211 | |
| | | | | | | | | |
| U.S. Government Securities - 2.8% | | | | |
| Other Direct Federal Obligations - 2.8% | | | | |
| | | | | FHLB - 2.8% | | | | |
| $ | 23,000 | | | 0.16%, 11/21/2014 | | $ | 23,003 | |
| | 4,600 | | | 1.63%, 09/28/2015 | | | 4,676 | |
| | | | | | | | 27,679 | |
| | | | | Total U.S. Government Securities | | | | |
| | | | | (Cost $27,670) | | $ | 27,679 | |
| | | | | | | | | |
| | | | | Total Long-Term Investments | | | | |
| | | | | (Cost $986,748) | | $ | 987,985 | |
| | | | | | | | | |
| Short-Term Investments - 1.4% | | | | |
| Commercial Paper - 1.0% | | | | |
| | | | | Finance and Insurance - 1.0% | | | | |
| | | | | MetLife Global Funding I | | | | |
| $ | 10,000 | | | 0.46%, 4/10/2015■Δ | | $ | 10,002 | |
| | | | | | | | | |
| Repurchase Agreements - 0.4% | | | | |
| | | | | Bank of America Merrill Lynch TriParty
Repurchase Agreement (maturing on
07/01/2014 in the amount of $380,
collateralized by FHLMC 2.23% - 5.99%, 2030 -
2044, FNMA 2.31% - 6.34%, 2020 - 2042, value
of $388) | | | | |
| $ | 380 | | | 0.10%, 6/30/2014 | | $ | 380 | |
| | | | | Bank of Montreal TriParty Repurchase Agreement
(maturing on 07/01/2014 in the amount of $580,
collateralized by U.S. Treasury Bill 0.13%,
2015, U.S. Treasury Bond 2.75% - 10.63%,
2015 - 2044, U.S. Treasury Note 0.13% -
4.50%, 2014 - 2024, value of $592) | | | | |
| | 580 | | | 0.09%, 6/30/2014 | | | 580 | |
| | | | | Bank of Montreal TriParty Repurchase Agreement
(maturing on 07/01/2014 in the amount of $248,
collateralized by FHLMC 2.00% - 5.50%, 2018 -
2041, FNMA 2.00% - 4.50%, 2026 - 2042,
GNMA 3.00% - 4.00%, 2042 - 2043, U.S.
Treasury Bill 0.05%, 2014, U.S. Treasury Note
0.75%, 2018, value of $252) | | | | |
| | 248 | | | 0.11%, 6/30/2014 | | | 248 | |
| | | | | Barclays Capital TriParty Repurchase Agreement
(maturing on 07/01/2014 in the amount of $229,
collateralized by U.S. Treasury Note 0.63% -
0.88%, 2018 - 2019, value of $234) | | | | |
| | 229 | | | 0.07%, 6/30/2014 | | | 229 | |
The accompanying notes are an integral part of these financial statements.
| Hartford Ultrashort Bond HLS Fund |
| Schedule of Investments – (continued) |
| June 30, 2014 (Unaudited) |
| (000’s Omitted) |
| Shares or Principal Amount | | | | | Market Value ╪ | |
| Short-Term Investments - 1.4% - (continued) | | | | | | | | |
| Repurchase Agreements - 0.4% - (continued) | | | | | | | | |
| | | | | Citigroup Global Markets, Inc. TriParty Repurchase
Agreement (maturing on 07/01/2014 in the
amount of $527, collateralized by U.S. Treasury
Bond 4.38% - 7.50%, 2016 - 2040, U.S.
Treasury Note 0.50% - 3.00%, 2014 - 2020,
value of $538) | | | | | | | | |
| $ | 527 | | | 0.06%, 6/30/2014 | | | | | | $ | 527 | |
| | | | | RBS Securities Inc. TriParty Repurchase
Agreement (maturing on 07/01/2014 in the
amount of $808, collateralized by U.S. Treasury
Note 0.38% - 3.13%, 2015 - 2022, value of
$825) | | | | | | | | |
| | 808 | | | 0.08%, 6/30/2014 | | | | | | | 808 | |
| | | | | TD Securities TriParty Repurchase Agreement
(maturing on 07/01/2014 in the amount of
$1,683, collateralized by FHLMC 3.50% -
4.00%, 2026 - 2044, FNMA 2.50% - 5.00%,
2025 - 2043, value of $1,716) | | | | | | | | |
| | 1,683 | | | 0.11%, 6/30/2014 | | | | | | | 1,683 | |
| | | | | UBS Securities Repurchase Agreement (maturing
on 07/01/2014 in the amount of $7,
collateralized by U.S. Treasury Note 2.13%,
2020, value of $7) | | | | | | | | |
| | 7 | | | 0.05%, 6/30/2014 | | | | | | | 7 | |
| | | | | | | | | | | | 4,462 | |
| | | | | Total Short-Term Investments | | | | | | | | |
| | | | | (Cost $14,462) | | | | | | $ | 14,464 | |
| | | | | | | | | | | | | |
| | | | | Total Investments | | | | | | | | |
| | | | | (Cost $1,001,210) ▲ | | | 100.5 | % | | $ | 1,002,449 | |
| | | | | Other Assets and Liabilities | | | (0.5 | )% | | | (5,465 | ) |
| | | | | Total Net Assets | | | 100.0 | % | | $ | 996,984 | |
The accompanying notes are an integral part of these financial statements.
| Hartford Ultrashort Bond HLS Fund |
| Schedule of Investments – (continued) |
| June 30, 2014 (Unaudited) |
| (000’s Omitted) |
| Note: | Percentage of investments as shown is the ratio of the total market value to total net assets. |
| ▲ | At June 30, 2014, the cost of securities for federal income tax purposes was $1,001,210 and the aggregate gross unrealized appreciation and depreciation based on that cost were: |
| Unrealized Appreciation | | $ | 1,639 | |
| Unrealized Depreciation | | | (400 | ) |
| Net Unrealized Appreciation | | $ | 1,239 | |
| Δ | Variable rate securities; the rate reported is the coupon rate in effect at June 30, 2014. |
| ■ | Securities issued within terms of a private placement memorandum, exempt from registration under Rule 144A under the Securities Act of 1933, as amended, and may be sold only to qualified institutional buyers. Unless otherwise indicated, these holdings are determined to be liquid. At June 30, 2014, the aggregate value of these securities was $161,948, which represents 16.2% of total net assets. |
| ☼ | This security, or a portion of this security, was purchased on a when-issued, delayed-delivery or delayed-draw basis. The cost of these securities was $1,485 at June 30, 2014. |
| ‡ | This security, or a portion of this security, has been segregated to cover funding requirements on investment transactions settling in the future. |
| ╪ | See Significant Accounting Policies of accompanying Notes to Financial Statements regarding valuation of securities. |
| GLOSSARY: (abbreviations used in preceding Schedule of Investments) |
| |
| Municipal Bond Abbreviations: |
| DA | Development Authority |
| Rev | Revenue |
| |
| Other Abbreviations: |
| FHLB | Federal Home Loan Bank |
| FHLMC | Federal Home Loan Mortgage Corp. |
| FNMA | Federal National Mortgage Association |
| GNMA | Government National Mortgage Association |
The accompanying notes are an integral part of these financial statements.
| Hartford Ultrashort Bond HLS Fund |
| Investment Valuation Hierarchy Level Summary |
| June 30, 2014 (Unaudited) |
| (000’s Omitted) |
| | | Total | | | Level 1 ♦ | | | Level 2 ♦ | | | Level 3 | |
| Assets: | | | | | | | | | | | | | | | | |
| Asset and Commercial Mortgage Backed Securities | | $ | 286,996 | | | $ | – | | | $ | 280,428 | | | $ | 6,568 | |
| Certificates of Deposit | | | 4,504 | | | | – | | | | 4,504 | | | | – | |
| Corporate Bonds | | | 455,579 | | | | – | | | | 455,579 | | | | – | |
| Municipal Bonds | | | 3,016 | | | | – | | | | 3,016 | | | | – | |
| U.S. Government Agencies | | | 210,211 | | | | – | | | | 210,211 | | | | – | |
| U.S. Government Securities | | | 27,679 | | | | – | | | | 27,679 | | | | – | |
| Short-Term Investments | | | 14,464 | | | | – | | | | 14,464 | | | | – | |
| Total | | $ | 1,002,449 | | | $ | – | | | $ | 995,881 | | | $ | 6,568 | |
| ♦ | For the six-month period ended June 30, 2014, there were no transfers between Level 1 and Level 2. |
Following is a reconciliation of Level 3 assets for which significant unobservable inputs were used to determine fair value:
| | | Balance as
of
December
31, 2013 | | | Realized
Gain (Loss) | | | Change in
Unrealized
Appreciation
(Depreciation) | | | Net
Amortization | | | Purchases | | | Sales | | | Transfers
Into
Level 3 * | | | Transfers
Out of
Level 3 * | | | Balance as
of June 30,
2014 | |
| Assets: | | | | | | | | | | | | | | | | | | | | | | | | | | | | | | | | | | | | |
| Asset & Commercial Mortgage Backed Securities | | $ | 7,186 | | | $ | — | | | $ | 3 | † | | $ | — | | | $ | 6,565 | | | $ | — | | | $ | — | | | $ | (7,186 | ) | | $ | 6,568 | |
| Total | | $ | 7,186 | | | $ | — | | | $ | 3 | | | $ | — | | | $ | 6,565 | | | $ | — | | | $ | — | | | $ | (7,186 | ) | | $ | 6,568 | |
| * | Investments are transferred into and out of Level 3 for a variety of reasons including, but not limited to: |
1) Investments where trading has been halted (transfer into Level 3) or investments where trading has resumed (transfer out of Level 3).
2) Broker quoted investments (transfer into Level 3) or quoted prices in active markets (transfer out of Level 3).
3) Investments that have certain restrictions on trading (transfer into Level 3) or investments where trading restrictions have expired (transfer out of Level 3).
| † | Change in unrealized appreciation (depreciation) in the current period relating to assets still held at June 30, 2014 was $3. |
| Note: | For purposes of reporting transfers between different hierarchy levels, both transfers in and out of each level, as applicable, are shown as if they occurred at the beginning of the period. |
The accompanying notes are an integral part of these financial statements.
| Hartford Ultrashort Bond HLS Fund |
| Statement of Assets and Liabilities |
| June 30, 2014 (Unaudited) |
| (000’s Omitted) |
| Assets: | | | | |
| Investments in securities, at market value (cost $1,001,210) | | $ | 1,002,449 | |
| Cash | | | 1 | |
| Receivables: | | | | |
| Fund shares sold | | | 57 | |
| Dividends and interest | | | 1,464 | |
| Other assets | | | 3 | |
| Total assets | | | 1,003,974 | |
| Liabilities: | | | | |
| Payables: | | | | |
| Investment securities purchased | | | 3,548 | |
| Fund shares redeemed | | | 3,241 | |
| Investment management fees | | | 55 | |
| Distribution fees | | | 4 | |
| Other liabilities | | | — | |
| Accrued expenses | | | 142 | |
| Total liabilities | | | 6,990 | |
| Net assets | | $ | 996,984 | |
| Summary of Net Assets: | | | | |
| Capital stock and paid-in-capital | | $ | 994,462 | |
| Undistributed net investment income | | | 974 | |
| Accumulated net realized gain | | | 309 | |
| Unrealized appreciation of investments | | | 1,239 | |
| Net assets | | $ | 996,984 | |
| Shares authorized | | | 14,000,000 | |
| Par value | | $ | 0.01 | |
| Class IA: Net asset value per share | | $ | 10.02 | |
| Shares outstanding | | | 85,946 | |
| Net assets | | $ | 861,405 | |
| Class IB: Net asset value per share | | $ | 10.01 | |
| Shares outstanding | | | 13,551 | |
| Net assets | | $ | 135,579 | |
The accompanying notes are an integral part of these financial statements.
| Hartford Ultrashort Bond HLS Fund |
| Statement of Operations |
| For the Six-Month Period Ended June 30, 2014 (Unaudited) |
| (000’s Omitted) |
| Investment Income: | | | | |
| Interest | | | 3,461 | |
| Total investment income, net | | | 3,461 | |
| | | | | |
| Expenses: | | | | |
| Investment management fees | | | 2,137 | |
| Transfer agent fees | | | 3 | |
| Distribution fees - Class IB | | | 181 | |
| Custodian fees | | | 3 | |
| Accounting services fees | | | 53 | |
| Board of Directors' fees | | | 15 | |
| Audit fees | | | 10 | |
| Other expenses | | | 85 | |
| Total expenses (before fees paid indirectly) | | | 2,487 | |
| Custodian fee offset | | | — | |
| Total fees paid indirectly | | | — | |
| Total expenses, net | | | 2,487 | |
| Net Investment Income | | | 974 | |
| Net Realized Gain on Investments: | | | | |
| Net realized gain on investments | | | 313 | |
| Net Realized Gain on Investments | | | 313 | |
| | | | | |
| Net Changes in Unrealized Appreciation of Investments: | | | | |
| Net unrealized appreciation of investments | | | 1,437 | |
| Net Changes in Unrealized Appreciation of Investments | | | 1,437 | |
| Net Increase in Net Assets Resulting from Operations | | $ | 2,724 | |
The accompanying notes are an integral part of these financial statements.
| Hartford Ultrashort Bond HLS Fund |
| Statement of Changes in Net Assets |
| |
| (000’s Omitted) |
| | | For the
Six-Month
Period Ended
June 30, 2014
(Unaudited) | | | For the
Year Ended
December 31,
2013 | |
| Operations: | | | | | | | | |
| Net investment income (loss) | | $ | 974 | | | $ | (369 | ) |
| Net realized gain on investments | | | 313 | | | | 2 | |
| Net unrealized appreciation (depreciation) of investments | | | 1,437 | | | | (198 | ) |
| Net Increase (Decrease) in Net Assets Resulting from Operations | | | 2,724 | | | | (565 | ) |
| Capital Share Transactions: | | | | | | | | |
| Class IA | | | | | | | | |
| Sold | | | 24,281 | | | | 1,019,371 | |
| Redeemed | | | (178,499 | ) | | | (1,609,509 | ) |
| Total capital share transactions | | | (154,218 | ) | | | (590,138 | ) |
| Class IB | | | | | | | | |
| Sold | | | 5,280 | | | | 142,018 | |
| Redeemed | | | (32,970 | ) | | | (251,269 | ) |
| Total capital share transactions | | | (27,690 | ) | | | (109,251 | ) |
| Net decrease from capital share transactions | | | (181,908 | ) | | | (699,389 | ) |
| Net Decrease in Net Assets | | | (179,184 | ) | | | (699,954 | ) |
| Net Assets: | | | | | | | | |
| Beginning of period | | | 1,176,168 | | | | 1,876,122 | |
| End of period | | $ | 996,984 | | | $ | 1,176,168 | |
| Undistributed (distribution in excess of) net investment income | | $ | 974 | | | $ | — | |
| Shares*: | | | | | | | | |
| Class IA | | | | | | | | |
| Sold | | | 2,424 | | | | 1,011,310 | |
| Redeemed | | | (17,828 | ) | | | (2,513,617 | )† |
| Total share activity | | | (15,404 | ) | | | (1,502,307 | ) |
| Class IB | | | | | | | | |
| Sold | | | 528 | | | | 138,053 | |
| Redeemed | | | (3,297 | ) | | | (394,198 | )† |
| Total share activity | | | (2,769 | ) | | | (256,145 | ) |
| * | Please see Reverse Stock Split note in the Notes to Financial Statements for more information. The share amounts reflect actual activity during the year ended December 31, 2013 and does not reflect the impact of the reverse stock split. |
| † | Amount includes adjustments made for reverse stock split of $1,080,670 and $182,596 for Class IA and Class IB, respectively. |
The accompanying notes are an integral part of these financial statements.
| Hartford Ultrashort Bond HLS Fund |
| Notes to Financial Statements |
| June 30, 2014 (Unaudited) |
| (000’s Omitted) |
Organization:
Hartford Ultrashort Bond HLS Fund (the "Fund") serves as an underlying investment option for certain variable annuity and variable life insurance separate accounts of Hartford Life Insurance Company (“HLIC”) and its affiliates and certain qualified retirement plans. The Fund may also serve as an underlying investment option for certain variable annuity and variable life separate accounts of other insurance companies. Owners of variable annuity contracts and policyholders of variable life insurance contracts may choose the funds permitted in the variable insurance contract prospectus. In addition, participants in certain qualified retirement plans may choose the Fund if permitted by their plans.
Hartford Series Fund, Inc. (the “Company”) is an open-end registered management investment company comprised of twenty-eight portfolios. Financial statements for the Fund, a series of the Company, are included in this report.
The Company is organized under the laws of the State of Maryland and is registered with the Securities and Exchange Commission (“SEC”) under the Investment Company Act of 1940, as amended (“1940 Act”). The Fund is a diversified open-end management investment company.
The Fund is divided into Class IA and Class IB shares. Each class is offered at the per share net asset value (“NAV”) without a sales charge and is subject to the same expenses, except that the Class IB shares are subject to distribution and service fees charged pursuant to a Distribution Plan adopted in accordance with Rule 12b-1 under the 1940 Act.
Significant Accounting Policies:
The following is a summary of significant accounting policies of the Fund in the preparation of its financial statements, which are in accordance with United States Generally Accepted Accounting Principles (“U.S. GAAP”). The preparation of financial statements in accordance with U.S. GAAP may require management to make estimates and assumptions that affect the reported amounts of assets and liabilities and disclosure of contingent assets and liabilities at the date of the financial statements and the reported amounts of increases and decreases in net assets from operations during the reporting period. Actual results could differ from those estimates.
Determination of Net Asset Value – The NAV of each class of the Fund's shares is determined as of the close of regular trading (normally 4:00 p.m. Eastern Time) (the “NYSE Close”) on each day that the New York Stock Exchange (the “Exchange”) is open (“Valuation Date”). Information that becomes known to the Fund after the NAV has been calculated on a particular day will not generally be used to retroactively adjust the NAV determined earlier that day.
Investment Valuation and Fair Value Measurements – For purposes of calculating the NAV, portfolio investments and other assets held by the Fund's portfolio for which market quotes are readily available are valued at market value. Market value is generally determined on the basis of last reported sales prices or official close price. If no sales are reported, market value is based on quotes obtained from a quotation reporting system, established market makers, or independent pricing services. If market prices are not readily available or are deemed unreliable, the Fund will use the fair value of the investment as determined in good faith under policies and procedures established by and under the supervision of the Company's Board of Directors. Market quotes are considered not readily available where there is an absence of current or reliable market-based data (e.g., trade information or indicative market quotes), including where events occur after the close of the relevant market, but prior to the NYSE Close, that materially affect the values of the Fund's portfolio investments or assets. In addition, market quotes are considered not readily available when, due to extraordinary circumstances, the exchanges or markets on which the investments trade do not open for trading for the entire day and no other market prices are available. There can be no assurance that the Fund could obtain the fair market value assigned to an investment if the Fund were to sell the investment at approximately the time at which the Fund determines its NAV.
Fixed income investments (other than short-term obligations), non-exchange traded derivatives and centrally cleared swaps held by the Fund are normally valued on the basis of quotes obtained from independent pricing services or brokers and dealers in accordance with procedures established by the Company's Board of Directors. Prices obtained from independent pricing services use information provided by market makers or estimates of market values through accepted market modeling, trading and pricing conventions. Inputs to the models may include, but are not limited to, prepayment speeds, pricing spread, yield, trade information, dealer quotes, market color, cash flow models and the investment’s terms and conditions. Generally, the Fund may use fair valuation in regard to fixed
| Hartford Ultrashort Bond HLS Fund |
| Notes to Financial Statements – (continued) |
| June 30, 2014 (Unaudited) |
| (000’s Omitted) |
income investments when the Fund holds defaulted or distressed investments or investments in a company in which a reorganization is pending. Short-term investments maturing in 60 days or less are generally valued at amortized cost, if their original term to maturity was 60 days or less, or by amortizing their value on the 61st day prior to maturity, if the original term to maturity exceeded 60 days.
Financial instruments for which prices are not available from an independent pricing service may be valued using market quotations obtained from one or more dealers that make markets in the respective financial instrument in accordance with procedures established by the Company's Board of Directors.
U.S. GAAP defines fair value as the price that the Fund would receive to sell an asset or pay to transfer a liability in an orderly transaction between market participants. The U.S. GAAP fair value measurement standards require disclosure of a fair value hierarchy for each major category of assets and liabilities. Various inputs are used in determining the fair value of the Fund’s investments. These inputs are summarized into three broad hierarchy levels. This hierarchy is based on whether the valuation inputs are observable or unobservable. These levels are:
Level 1 – Quoted prices in active markets for identical investments. Level 1 may include exchange traded instruments, such as domestic equities, some foreign equities, options, futures, mutual funds, exchange traded funds, rights and warrants.
Level 2 – Observable inputs other than Level 1 prices, such as quoted prices for similar investments; quoted prices in markets that are not active; or other inputs that are observable or can be corroborated by observable market data. Level 2 may include debt investments that are traded less frequently than exchange traded instruments and which are valued using independent pricing services; foreign equities, which are principally traded on certain foreign markets and are adjusted daily pursuant to a fair value pricing service in order to reflect an adjustment for the factors occurring after the close of certain foreign markets but before the NYSE Close; senior floating rate interests, which are valued using an aggregate of dealer bids; short-term investments, which are valued at amortized cost; and swaps, which are valued based upon the terms of each swap contract.
Level 3 – Significant unobservable inputs that are supported by limited or no market activity. Level 3 may include financial instruments whose values are determined using indicative market quotes or require significant management judgment or estimation. These unobservable valuation inputs may include estimates for current yields, maturity/duration, prepayment speed, and indicative market quotes for comparable investments along with other assumptions relating to credit quality, collateral value, complexity of the investment structure, general market conditions and liquidity. This category may include investments where trading has been halted or there are certain restrictions on trading. While these investments are priced using unobservable inputs, the valuation of these investments reflects the best available data and management believes the prices are a reasonable representation of exit price.
The Board of Directors of the Company generally reviews and approves the “Procedures for Valuation of Portfolio Securities” at least once a year. These procedures define how investments are to be valued, including the formation and activities of a Valuation Committee. The Valuation Committee is responsible for determining in good faith the fair value of investments when the value cannot be obtained from primary pricing services or alternative sources or if the valuation of an investment as provided by the primary pricing service or alternative source is believed not to reflect the investment’s fair value as of the Valuation Date. Voting members of the Valuation Committee include the Fund's Treasurer or designee and a Vice President of the investment manager or designee. An Assistant Vice President of the Fund with legal expertise or designee is also included on the Valuation Committee as a non-voting advisory member. In addition, the Fund’s Chief Compliance Officer shall designate a member of the compliance group to attend Valuation Committee meetings as a non-voting resource, to monitor for and provide guidance with respect to compliance with these procedures. Two members of the Valuation Committee or their designees, representing different departments, shall constitute a quorum for purposes of permitting the Valuation Committee to take action. The Valuation Committee will consider all relevant factors in determining an investment’s fair value, and may seek the advice of the Fund’s sub-adviser, knowledgeable brokers, and legal counsel in making such determination. The Valuation Committee reports to the Audit Committee of the Company's Board of Directors. The Audit Committee receives quarterly written reports which include details of all fair-valued investments, including the reason for the fair valuation, and an indication, when possible, of the accuracy of the valuation by disclosing the next available reliable public price quotation or the disposition price of such investments (the “look-back” test). The Board of Directors then must consider for ratification all of the fair value determinations made during the previous quarter.
| Hartford Ultrashort Bond HLS Fund |
| Notes to Financial Statements – (continued) |
| June 30, 2014 (Unaudited) |
| (000’s Omitted) |
Valuation levels are not necessarily indicative of the risk associated with investing in such investments. Individual investments within any of the above mentioned asset classes may be assigned a different hierarchical level than those presented above, as individual circumstances dictate.
For additional information, refer to the Investment Valuation Hierarchy Level Summary and the Level 3 roll-forward reconciliation, if applicable, which follow the Schedule of Investments.
Investment Transactions and Investment Income – Investment transactions are recorded as of the trade date (the date the order to buy or sell is executed) for financial reporting purposes. Investments purchased or sold on a when-issued or delayed-delivery basis may be settled a month or more after the trade date. Realized gains and losses are determined on the basis of identified cost.
Interest income, including amortization of premium, accretion of discounts and additional principal received in-kind in lieu of cash, is accrued on a daily basis. Paydown gains and losses on mortgage related and other asset backed securities are included in interest income in the Statement of Operations.
Joint Trading Account – The Fund may invest cash balances into a joint trading account that may be invested in one or more repurchase agreements.
Fund Share Valuation and Dividend Distributions to Shareholders – Orders for the Fund’s shares are executed in accordance with the investment instructions of the contract holders and plan participants. The NAV of the Fund’s shares is determined as of the close of business on each business day of the Exchange. The NAV is determined separately for each class of shares of the Fund by dividing the Fund’s net assets attributable to that class by the number of shares of the class outstanding. Each class of shares offered by the Fund has equal rights as to assets and voting privileges (except that shareholders of a class have exclusive voting rights regarding any matter relating solely to that class of shares). Income and non-class specific expenses are allocated daily to each class on the basis of the relative net assets of the class. Realized and unrealized gains and losses are allocated daily based on the relative net assets of each class of shares of the Fund.
Orders for the purchase of the Fund’s shares received prior to the close of the Exchange on any day the Exchange is open for business are priced at the NAV determined as of the close of the Exchange. Orders received after the close of the Exchange, or on a day on which the Exchange and/or the Fund is not open for business, are priced at the next determined NAV.
Dividends are declared pursuant to a policy adopted by the Company's Board of Directors based upon the investment performance of the Fund. The policy of the Fund is to pay dividends from net investment income and realized gains, if any, at least once a year.
Distributions from net investment income, net realized gains and capital are determined in accordance with federal income tax regulations, which may differ from U.S. GAAP with respect to character and timing. These differences may include, but are not limited to, losses deferred due to wash sale adjustments, foreign currency gains and losses, adjustments related to Passive Foreign Investment Companies ("PFICs"), Real Estate Investment Trusts ("REITs"), Regulated Investment Companies ("RICs"), certain derivatives and partnerships. Permanent book and federal income tax basis differences relating to shareholder distributions will result in reclassifications to certain of the Fund’s capital accounts (see Federal Income Taxes: Reclassification of Capital Accounts note).
Securities and Other Investments:
Repurchase Agreements – A repurchase agreement is an agreement by which a counterparty agrees to sell an investment and agrees to repurchase the investment sold from the buyer at a mutually agreed upon time and price. During the period of the repurchase agreement, the counterparty will deposit cash and or securities in a third party custodial account to serve as collateral. At the time the Fund enters into a repurchase agreement, the value of the underlying collateral, including accrued interest, will be equal to or exceed the value of the repurchase agreement. Repurchase agreements expose the Fund to counterparty risk - that is, the risk that the counterparty will not fulfill its obligations. To minimize counterparty risk, the investments that serve to collateralize the repurchase agreement are held by the Fund’s custodian in book entry or physical form in the custodial account of the Fund or in a third party custodial account. Repurchase agreements are valued at cost plus accrued interest, which approximates fair value.
| Hartford Ultrashort Bond HLS Fund |
| Notes to Financial Statements – (continued) |
| June 30, 2014 (Unaudited) |
| (000’s Omitted) |
Repurchase agreements have master netting arrangements which allow the Fund to offset amounts owed to a counterparty with amounts owed by the counterparty, including any collateral. Upon an event of default under a master repurchase agreement, the non-defaulting party may close out all transactions traded under such agreement and net amounts owed under each transaction to one net amount payable by one party to the other. Absent an event of default, the master repurchase agreement does not result in an offset of reported amounts of assets and liabilities in the Statement of Assets and Liabilities across transactions between the Fund and the applicable counterparty. The Fund, as shown on the Schedule of Investments, had outstanding repurchase agreements and related collateral as of June 30, 2014.
Illiquid and Restricted Investments – The Fund is permitted to invest up to 15% of its net assets in illiquid investments. Illiquid investments are those that may not be sold or disposed of in the ordinary course of business within seven days, at approximately the price used to determine the Fund’s NAV. The Fund may not be able to sell illiquid investments when its sub-adviser considers it desirable to do so or may have to sell such investments at a price that is lower than the price that could be obtained if the investments were more liquid. A sale of illiquid investments may require more time and may result in higher dealer discounts and other selling expenses than does the sale of those that are liquid. Illiquid investments also may be more difficult to value due to the unavailability of reliable market quotations for such investments, and an investment in them may have an adverse impact on the Fund’s NAV. The Fund may also purchase certain restricted investments that can only be resold to certain qualified investors and may be determined to be liquid pursuant to policies and guidelines established by the Company's Board of Directors. The Fund, as shown on the Schedule of Investments, had illiquid or restricted investments as of June 30, 2014.
Investments Purchased on a When-Issued or Delayed-Delivery Basis – Delivery and payment for investments that have been purchased by the Fund on a forward commitment, or when-issued or delayed-delivery basis, take place beyond the customary settlement period. The Fund may dispose of or renegotiate a delayed-delivery transaction after it is entered into, and may sell delayed-delivery investments before they are delivered, which may result in a realized gain or loss. During this period, such investments are subject to market fluctuations, and the Fund identifies investments segregated in its records with a value at least equal to the amount of the commitment. The Fund, as shown on the Schedule of Investments, had when-issued or delayed-delivery investments as of June 30, 2014.
Mortgage Related and Other Asset Backed Securities – The Fund may invest in mortgage related and other asset backed securities. These securities include mortgage pass-through securities, collateralized mortgage obligations, commercial mortgage backed securities, stripped mortgage backed securities, asset backed securities, collateralized debt obligations and other securities that directly or indirectly represent a participation in, or are secured by and payable from, mortgage loans on real property. Mortgage related securities are created from pools of residential or commercial mortgage loans, including mortgage loans made by savings and loan institutions, mortgage bankers, commercial banks and others. Asset backed securities are created from many types of assets, including auto loans, credit card receivables, home equity loans, and student loans. These securities provide a monthly payment that consists of both interest and principal payments. Interest payments may be determined by fixed or adjustable rates. The rate of pre-payments on underlying mortgages will affect the price and volatility of a mortgage related security, and may have the effect of shortening or extending the effective duration of the security relative to what was anticipated at the time of purchase. The timely payment of principal and interest of certain mortgage related securities is guaranteed by the full faith and credit of the United States Government. Mortgage related and other asset backed securities created and guaranteed by non-governmental issuers, including government-sponsored corporations, may be supported by various forms of insurance or guarantees, but there can be no assurance that the private insurers or guarantors can meet their obligations under the insurance policies or guarantee arrangements. The Fund, as shown on the Schedule of Investments, had outstanding mortgage related and other asset backed securities as of June 30, 2014.
Principal Risks:
Credit risk depends largely on the perceived financial health of bond issuers. In general, the credit rating is inversely related to the credit risk of the issuer. Higher rated bonds generally are deemed to have less credit risk, while lower or unrated bonds are deemed to have higher risk of default. The share price, yield and total return of a fund that holds securities with higher credit risk may be more volatile than those of a fund that holds bonds with lower credit risk. Similar to credit risk, the Fund may be exposed to counterparty risk, or the risk that an institution or other entity with which the Fund has unsettled or open transactions will default.
| Hartford Ultrashort Bond HLS Fund |
| Notes to Financial Statements – (continued) |
| June 30, 2014 (Unaudited) |
| (000’s Omitted) |
The Fund’s investments expose the Fund to various risks including, but not limited to, interest rate, prepayment, extension and equity risks. Interest rate risk is the risk that fixed income securities will decline in value because of changes in interest rates. As nominal interest rates rise, the values of certain fixed income securities held by the Fund are likely to decrease. A nominal interest rate can be described as the sum of a real interest rate and an expected inflation rate. Fixed income securities with longer durations tend to be more sensitive to changes in interest rates, usually making them more volatile than securities with shorter durations. Duration is useful primarily as a measure of the sensitivity of a fixed income security’s market price to interest rate (i.e., yield) movements. Rising interest rates may cause prepayments to occur at a slower than expected rate, thereby effectively lengthening the maturity of the security and making the security more sensitive to interest rate changes. Prepayment and extension risk are major risks of mortgage backed securities and certain asset backed securities. For certain asset backed securities, the actual maturity may be less than the stated maturity shown in the Schedule of Investments, if applicable. As a result, the timing of income recognition relating to these securities may vary based upon the actual maturity.
Federal Income Taxes:
Federal Income Taxes – For federal income tax purposes, the Fund intends to continue to qualify as a RIC under Subchapter M of the Internal Revenue Code (“IRC”) by distributing substantially all of its taxable net investment income and net realized capital gains to its shareholders and otherwise complying with the requirements of the IRC. The Fund has distributed substantially all of its income and capital gains in prior years, if applicable, and intends to distribute substantially all of its income and capital gains prior to the next fiscal year-end. Accordingly, no provision for federal income or excise taxes has been made in the accompanying financial statements. Distributions from short-term capital gains are treated as ordinary income distributions for federal income tax purposes.
Net Investment Income (Loss), Net Realized Gains (Losses) and Distributions – Net investment income (loss) and net realized gains (losses) may differ for financial statement and tax purposes primarily because of losses deferred due to wash sale adjustments, foreign currency gains and losses, adjustments related to PFICs, REITs, RICs, certain derivatives and partnerships. The character of distributions made during the year from net investment income or net realized gains may differ from their ultimate characterization for federal income tax purposes. Also, due to the timing of dividend distributions, the fiscal year in which amounts are distributed may differ from the year that the income or realized gains (losses) were recorded by the Fund.
Components of Distributable Earnings – The Fund’s components of distributable earnings (deficit) on a tax basis at December 31, 2013, are as follows:
| | | Amount | |
| Accumulated Capital Losses | | $ | (4 | ) |
| Unrealized Depreciation* | | | (198 | ) |
| Total Accumulated Deficit | | $ | (202 | ) |
| * | Differences between book-basis and tax-basis unrealized appreciation (depreciation) may be attributable to the losses deferred due to wash sale adjustments, foreign currency gains and losses, adjustments related to PFICs, REITs, RICs, certain derivatives and partnerships. |
| Hartford Ultrashort Bond HLS Fund |
| Notes to Financial Statements – (continued) |
| June 30, 2014 (Unaudited) |
| (000’s Omitted) |
Reclassification of Capital Accounts – The Fund may record reclassifications in its capital accounts. These reclassifications have no impact on the total net assets of the Fund. The reclassifications are a result of permanent differences between U.S. GAAP and tax accounting for such items as foreign currency, PFICs, expiration or utilization of capital loss carryforwards or net operating losses. Adjustments are made to reflect the impact these items have on current and future distributions to shareholders. Therefore, the source of the Fund’s distributions may be shown in the accompanying Statement of Changes in Net Assets as from undistributed net investment income, from accumulated net realized gains on investments or from capital depending on the type of book and tax differences that exist. For the year ended December 31, 2013, the Fund recorded reclassifications to increase (decrease) the accounts listed below:
| | | Amount | |
| Undistributed Net Investment Income (Loss) | | $ | 369 | |
| Accumulated Net Realized Gain (Loss) | | | (6 | ) |
| Capital Stock and Paid-in-Capital | | | (363 | ) |
Capital Loss Carryforward – On December 22, 2010, the Regulated Investment Company Modernization Act of 2010 (the “Act”) was enacted, which made changes to the capital loss carryforward rules. The changes are effective for taxable years beginning after the date of enactment. Under the Act, funds are permitted to carry forward capital losses for an unlimited period. Additionally, capital loss carryforwards retain their character as either short-term or long-term capital losses rather than being considered all short-term as permitted under prior regulation.
At December 31, 2013 (tax year end), the Fund had capital loss carryforwards for U.S. federal income tax purposes as follows:
Capital loss carryforwards with no expiration:
| | | Amount | |
| Short-Term Capital Loss Carryforward | | $ | 4 | |
| Total | | $ | 4 | |
Accounting for Uncertainty in Income Taxes – The Fund has adopted financial reporting rules that require the Fund to analyze all open tax years, as defined by the statute of limitations, for all major jurisdictions. Generally, tax authorities can examine all tax returns filed for the last three years. The Fund does not have an examination in progress.
The Fund has reviewed all open tax years and major jurisdictions and concluded that these financial reporting rules had no effect on the Fund’s financial position or results of operations. There is no tax liability resulting from unrecognized tax benefits relating to uncertain income tax positions taken or expected to be taken on the tax return for the fiscal year ended December 31, 2013. The Fund is also not aware of any tax positions for which it is reasonably possible that the total amounts of unrecognized tax benefits will significantly change in the next twelve months.
Expenses:
Investment Management Agreement – Hartford Funds Management Company, LLC ("HFMC") serves as the Fund’s investment manager pursuant to an Investment Management Agreement with the Company. HFMC is an indirect wholly owned subsidiary of The Hartford Financial Services Group, Inc. ("The Hartford"). The investment manager has overall investment supervisory responsibility for the Fund. In addition, the investment manager provides administrative personnel, services, equipment, facilities and office space for proper operation of the Fund. HFMC has contracted with Wellington Management Company, LLP ("Wellington Management") under a sub-advisory agreement for the provision of day-to-day investment management services to the Fund in accordance with the Fund’s investment objective and policies. The Fund pays a fee to the investment manager, a portion of which may be used to compensate Wellington Management.
| Hartford Ultrashort Bond HLS Fund |
| Notes to Financial Statements – (continued) |
| June 30, 2014 (Unaudited) |
| (000’s Omitted) |
The schedule below reflects the rates of compensation paid to the investment manager for investment management services rendered as of June 30, 2014; the rates are accrued daily and paid monthly:
| Average Daily Net Assets | | Annual Fee | |
| On first $5 billion | | | 0.4000% | |
| On next $5 billion | | | 0.3800% | |
| Over $10 billion | | | 0.3700% | |
Accounting Services Agreement – Pursuant to the Fund Accounting Agreement between HFMC and the Company, on behalf of the Fund, HFMC provides accounting services to the Fund and receives monthly compensation based on the Fund’s average daily net assets at the rates set forth below. The Fund’s accounting services fees are accrued daily and paid monthly.
| Average Daily Net Assets | | Annual Fee | |
| All Assets | | | 0.010% | |
Operating Expenses – Allocable expenses incurred by the Company are allocated to each Fund and allocated to classes within a Fund in proportion to the average daily net assets of the Fund and each class, except where allocation of certain expenses is more fairly made directly to the Fund or to specific classes within a Fund.
Fees Paid Indirectly – The Fund's custodian bank has agreed to reduce its fees when the Fund maintains cash on deposit in a non-interest-bearing custody account. For the six-month period ended June 30, 2014, this amount, if any, is included in the Statement of Operations.
The ratio of expenses to average net assets in the accompanying financial highlights excludes the reduction in expenses related to fees paid indirectly. The annualized expense ratio after waivers for the period listed below reflecting the reduction for fees paid indirectly is as follows:
| | | Annualized Six-
Month Period Ended
June 30, 2014 | |
| Class IA | | | 0.43% | |
| Class IB | | | 0.68 | |
Distribution Plan for Class IB Shares – Hartford Funds Distributors, LLC (“HFD”), an indirect wholly owned subsidiary of The Hartford, is the principal underwriter and distributor of the Fund. The Company, on behalf of the Fund, has adopted a Distribution Plan pursuant to Rule 12b-1 of the 1940 Act for Class IB shares.
The Distribution Plan provides that the Fund may pay annually up to 0.25% of the average daily net assets of the Fund attributable to its Class IB shares for activities primarily intended to result in the sale of Class IB shares. The Board has the authority to suspend or reduce these payments at any point in time. Under the terms of the Distribution Plan and the principal underwriting agreement, the Fund is authorized to make payments monthly to the distributor that may be used to pay or reimburse entities providing distribution and shareholder servicing with respect to the Class IB shares for such entities’ fees or expenses incurred or paid in that regard. The distribution fee paid during the period can be found on the Statement of Operations. These fees are accrued daily and paid monthly.
Other Related Party Transactions – Hartford Administrative Services Company (“HASCO”), an indirect wholly owned subsidiary of The Hartford, provides transfer agent services to the Fund. HASCO was compensated on a per account basis for providing such services. The amount paid to HASCO can be found in the Statement of Operations. These fees are accrued daily and paid monthly.
| Hartford Ultrashort Bond HLS Fund |
| Notes to Financial Statements – (continued) |
| June 30, 2014 (Unaudited) |
| (000’s Omitted) |
Investment Transactions:
For the six-month period ended June 30, 2014, the cost of purchases and proceeds from sales of investment securities (excluding short-term investments) were as follows:
| | | Excluding U.S.
Government
Obligations | | | U.S.
Government
Obligations | | | Total | |
| Cost of Purchases | | $ | 242,340 | | | $ | — | | | $ | 242,340 | |
| Sales Proceeds | | | 295,257 | | | | — | | | | 295,257 | |
Line of Credit:
The Fund is one of several Hartford Funds that participate in a $500 million committed revolving line of credit facility. The facility is to be used for temporary or emergency purposes. Under the arrangement, the funds are required to own securities having a market value in excess of 300% of the total bank borrowings. The interest rate on borrowings varies depending on the nature of the loan. The facility also requires a fee to be paid based on the amount of the commitment. This commitment fee is allocated to all the funds participating in the line of credit based on the average net assets of the funds. During the six-month period ended June 30, 2014, the Fund did not have any borrowings under this facility.
Industry Classifications:
Other than the industry classifications "Other Investment Pools and Funds" and "Exchange Traded Funds," equity industry classifications used in this report are the Global Industry Classification Standard, which was developed by and is the exclusive property and service mark of MSCI, Inc. and Standard & Poor's.
Indemnifications:
Under the Company's organizational documents, the Company shall indemnify its officers and directors to the full extent required or permitted under Maryland General Corporation Law and the federal securities laws. In addition, the Company, on behalf of the Fund, may enter into contracts that contain a variety of indemnifications. The Company's maximum exposure under these arrangements is unknown. However, as of the date of these financial statements, the Company has not had prior claims or losses pursuant to these contracts and expects the risk of loss to be remote.
Pending Legal Proceedings:
On February 25, 2011, Jennifer L. Kasilag, Louis Mellinger, Judith M. Menendez, Jacqueline M. Robinson, and Linda A. Russell filed a derivative lawsuit against Hartford Investment Financial Services, LLC (“HIFSCO”) (now known as Hartford Funds Distributors, LLC) on behalf of six Hartford retail mutual funds in the United States District Court for the District of New Jersey, alleging that HIFSCO received excessive advisory and distribution fees in violation of its statutory fiduciary duty under Section 36(b) of the 1940 Act when serving as investment manager and principal underwriter, respectively, to the Hartford retail mutual funds. Although this action was purportedly filed on behalf of certain of the Hartford Funds, none of the Hartford Funds is itself a defendant to the suit. HIFSCO moved to dismiss and, in September 2011, the motion was granted in part and denied in part, with leave to amend the complaint. In November 2011, plaintiffs filed an amended complaint on behalf of certain Hartford retail mutual funds, The Hartford Global Health Fund (now known as The Hartford Healthcare Fund), The Hartford Conservative Allocation Fund, The Hartford Growth Opportunities Fund, The Hartford Inflation Plus Fund, The Hartford Advisers Fund (now known as The Hartford Balanced Fund), and The Hartford Capital Appreciation Fund. Plaintiffs seek to rescind the investment management agreements and distribution plans between HIFSCO and these funds and to recover the total fees charged thereunder or, in the alternative, to recover any improper compensation HIFSCO received, in addition to lost earnings. HIFSCO filed a partial motion to dismiss the amended complaint and, in December 2012, the court dismissed without prejudice the claims regarding distribution fees and denied the motion with respect to the advisory fees claims. HIFSCO disputes the allegations and intends to defend vigorously.
| Hartford Ultrashort Bond HLS Fund |
| Notes to Financial Statements – (continued) |
| June 30, 2014 (Unaudited) |
| (000’s Omitted) |
In March 2014, the plaintiffs filed a new complaint that added as new plaintiffs The Hartford Floating Rate Fund and The Hartford Small Company Fund and named as a defendant Hartford Funds Management Company, LLC (the “Investment Manager”), which assumed the role as investment adviser to the funds as of January 2013. The Investment Manager and HIFSCO dispute the allegations and intend to defend vigorously.
This action concerns the activities of HIFSCO in its capacity as investment manager and principal underwriter to the Hartford retail mutual funds and does not concern HIFSCO’s activities in its capacity as principal underwriter to the HLS funds. For this reason, no accrual for litigation relating to this matter has been recorded in the financial statements of the Fund.
Reverse Stock Split:
On October 21, 2013, a reverse stock split was declared for the Class IA and Class IB shares at a ten to one ratio. The effect of the reverse stock split was to divide the number of outstanding shares by the reverse split factor, with a corresponding increase in the net asset value per share. The split was executed at the closing rounded NAV as of the prior business day. This transaction did not change the net assets of the Fund and the total value of a shareholder’s investment in the Fund did not change as a result of the reverse stock split. Prior year values represented in the Statement of Changes in Net Assets have not been adjusted. Data presented in the Financial Highlights has been adjusted retroactively to account for the reverse stock split.
| Hartford Ultrashort Bond HLS Fund |
| Financial Highlights |
| | | ─ Selected Per-Share Data(A) ─ | | | ─ Ratios and Supplemental Data ─ | |
| Class | | Net Asset
Value at
Beginning
of Period | | | Net
Investment
Income
(Loss) | | | Net
Realized
and
Unrealized
Gain (Loss)
on
Investments | | | Total from
Investment
Operations | | | Dividends
from Net
Investment
Income | | | Distributions
from
Realized
Capital
Gains | | | Total
Dividends
and
Distributions | | | Net
Asset
Value at
End of
Period | | | Total
Return(B) | | | Net Assets
at End of
Period
(000s) | | | Ratio of
Expenses
to
Average
Net
Assets
Before
Adjust-
ments(C) | | | Ratio of
Expenses
to
Average
Net
Assets
After
Adjust-
ments(C) | | | Ratio of
Net
Investment
Income
(Loss) to
Average
Net Assets | |
| | | | | | | | | | | | | | | | | | | | | | | | | | | | | | | | | | | | | | | | |
| For the Six-Month Period Ended June 30, 2014 (Unaudited) |
| IA | | $ | 10.00 | | | $ | 0.01 | | | $ | 0.01 | | | $ | 0.02 | | | $ | – | | | $ | – | | | $ | – | | | $ | 10.02 | | | | 0.20 | %(D) | | $ | 861,405 | | | | 0.43 | %(E) | | | 0.43 | %(E) | | | 0.22 | %(E) |
| IB | | | 9.99 | | | | – | | | | 0.02 | | | | 0.02 | | | | – | | | | – | | | | – | | | | 10.01 | | | | 0.20 | (D) | | | 135,579 | | | | 0.68 | (E) | | | 0.68 | (E) | | | (0.03) | (E) |
| | | | | | | | | | | | | | | | | | | | | | | | | | | | | | | | | | | | | | | | | | | | | | | | | | | | | |
| For the Year Ended December 31, 2013 (F),(G) |
| IA | | $ | 10.00 | | | $ | – | | | $ | – | | | $ | – | | | $ | – | | | $ | – | | | $ | – | | | $ | 10.00 | | | | – | % | | $ | 1,013,110 | | | | 0.45 | % | | | 0.21 | % | | | (0.02) | % |
| IB | | | 10.00 | | | | (0.01) | | | | – | | | | (0.01) | | | | – | | | | – | | | | – | | | | 9.99 | | | | (0.10) | | | | 163,058 | | | | 0.49 | | | | 0.25 | | | | (0.06) | |
| | | | | | | | | | | | | | | | | | | | | | | | | | | | | | | | | | | | | | | | | | | | | | | | | | | | | |
| For the Year Ended December 31, 2012 (F),(G) |
| IA | | $ | 10.00 | | | $ | – | | | $ | – | | | $ | – | | | $ | – | | | $ | – | | | $ | – | | | $ | 10.00 | | | | – | % | | $ | 1,603,657 | | | | 0.42 | % | | | 0.18 | % | | | – | % |
| IB | | | 10.00 | | | | – | | | | – | | | | – | | | | – | | | | – | | | | – | | | | 10.00 | | | | – | | | | 272,464 | | | | 0.42 | | | | 0.18 | | | | – | |
| | | | | | | | | | | | | | | | | | | | | | | | | | | | | | | | | | | | | | | | | | | | | | | | | | | | | |
| For the Year Ended December 31, 2011 (F),(G) |
| IA | | $ | 10.00 | | | $ | – | | | $ | – | | | $ | – | | | $ | – | | | $ | – | | | $ | – | | | $ | 10.00 | | | | – | % | | $ | 1,970,312 | | | | 0.42 | % | | | 0.16 | % | | | – | % |
| IB | | | 10.00 | | | | – | | | | – | | | | – | | | | – | | | | – | | | | – | | | | 10.00 | | | | – | | | | 376,648 | | | | 0.42 | | | | 0.16 | | | | – | |
| | | | | | | | | | | | | | | | | | | | | | | | | | | | | | | | | | | | | | | | | | | | | | | | | | | | | |
| For the Year Ended December 31, 2010 (F),(G) |
| IA | | $ | 10.00 | | | $ | – | | | $ | – | | | $ | – | | | $ | – | | | $ | – | | | $ | – | | | $ | 10.00 | | | | – | % | | $ | 2,086,014 | | | | 0.43 | % | | | 0.22 | % | | | – | % |
| IB | | | 10.00 | | | | – | | | | – | | | | – | | | | – | | | | – | | | | – | | | | 10.00 | | | | – | | | | 419,519 | | | | 0.43 | | | | 0.22 | | | | – | |
| | | | | | | | | | | | | | | | | | | | | | | | | | | | | | | | | | | | | | | | | | | | | | | | | | | | | |
| For the Year Ended December 31, 2009 (F),(G) |
| IA | | $ | 10.00 | | | $ | – | | | $ | – | | | $ | – | | | $ | – | | | $ | – | | | $ | – | | | $ | 10.00 | | | | 0.06 | % | | $ | 2,820,121 | | | | 0.48 | % | | | 0.32 | % | | | 0.02 | % |
| IB | | | 10.00 | | | | – | | | | – | | | | – | | | | – | | | | – | | | | – | | | | 10.00 | | | | 0.05 | | | | 548,134 | | | | 0.53 | | | | 0.34 | | | | 0.00 | |
| (A) | Information presented relates to a share outstanding throughout the indicated period. Net investment income (loss) per share amounts are calculated based on average shares outstanding unless otherwise noted. |
| (B) | The figures do not include sales charges or other fees which may be applied at the variable life insurance, variable annuity or qualified retirement plan product level. Any such additional sales charges or other fees would lower the Fund's performance. |
| (C) | Adjustments include waivers and reimbursements, if applicable. Ratios do not include fees paid indirectly (see Expenses in the accompanying Notes to Financial Statements). |
| (F) | Net investment income (loss) per share amounts have been calculated using the SEC method. |
| (G) | Per share amounts have been restated to reflect a reverse stock split effective October 21, 2013. Please see Notes to Financial Statements. |
| | | Portfolio Turnover
Rate for
All Share Classes | |
| For the Six-Month Period Ended June 30, 2014 (Unaudited) | | | 24% | |
| For the Year Ended December 31, 2013 | | | 6(A) | |
| For the Year Ended December 31, 2012 | | | N/A(B) | |
| For the Year Ended December 31, 2011 | | | N/A(B) | |
| For the Year Ended December 31, 2010 | | | N/A(B) | |
| For the Year Ended December 31, 2009 | | | N/A(B) | |
(A) Portfolio turnover shown is from October 21, 2013 (conversion date) through December 31, 2013.
(B) The Fund was managed as a money market fund and portfolio turnover was not calculated.
| Hartford Ultrashort Bond HLS Fund |
| Directors and Officers (Unaudited) |
The Board of Directors of the Company (the "Directors") appoints officers who are responsible for the day-to-day operations of the Fund and who execute policies formulated by the Directors. Each Director serves until his or her death, resignation, or retirement or until the next annual meeting of shareholders is held or until his or her successor is elected and qualifies.
Directors and officers who are employed by or who have a financial interest in The Hartford are considered “interested” persons of the Fund pursuant to the 1940 Act. Each officer and two of the Company's Directors, as noted in the chart below, are “interested” persons of the Fund. Each Director serves as a director for The Hartford Mutual Funds, Inc., The Hartford Mutual Funds II, Inc., Hartford Series Fund, Inc., and Hartford HLS Series Fund II, Inc., and as a trustee for The Hartford Alternative Strategies Fund, which, as of June 30, 2014, collectively consist of 78 funds. Correspondence may be sent to Directors and officers c/o Hartford Funds, 5 Radnor Corporate Center, Suite 300, 100 Matsonford Road, Radnor, Pennsylvania 19087, except that correspondence to Mr. Annoni, Mr. Dressen and Ms. Quade may be sent to 500 Bielenberg Drive, Suite 500, Woodbury, Minnesota 55125.
The table below sets forth, for each Director and officer, his or her name, year of birth, current position with the Company and date first elected or appointed to Hartford Series Fund, Inc. ("HSF") and Hartford HLS Series Fund II, Inc. ("HSF2"), principal occupation, and, for Directors, other directorships held. The Fund’s Statement of Additional Information contains further information on the Directors and is available free of charge by calling 1-888-843-7824 or writing to: Hartford HLS Funds, c/o Hartford Life Insurance Company/Hartford Life and Annuity Insurance Company, P.O. Box 14293, Lexington, KY 40512-4293 for variable annuity and variable life insurance separate accounts of Hartford Life Insurance Company and its affiliates; Hartford Funds, P.O. Box 55022, Boston, MA 02205-5022 for all shareholders except variable annuity and variable life insurance separate accounts of Hartford Life Insurance Company and its affiliates.
Information on the aggregate remuneration paid to the directors of the Company can be found in the Statement of Operations herein. The Fund pays to The Hartford a portion of the Chief Compliance Officer’s compensation, but does not pay salaries or compensation to any of its other officers or Directors who are employed by The Hartford.
Non-Interested Directors
Lynn S. Birdsong (1946) Director since 2003, Co-Chairman of the Investment Committee since 2005
Mr. Birdsong is a private investor. Mr. Birdsong currently serves as a Director of the Sovereign High Yield Investment Company (April 2010 to current). Mr. Birdsong currently serves as an Independent Director of Nomura Partners Funds, Inc. (formerly, The Japan Fund) (April 2003 to current). From 2003 to March 2005, Mr. Birdsong was an Independent Director of the Atlantic Whitehall Funds. From 1979 to 2002, Mr. Birdsong was a Managing Director of Zurich Scudder Investments, an investment management firm. During his employment with Scudder, Mr. Birdsong was an Interested Director of The Japan Fund. From January 1981 through December 2013, Mr. Birdsong was a partner in Birdsong Company, an advertising specialty firm.
Robert M. Gavin, Jr. (1940) Director since 2002 (HSF) and 1986 (HSF2), Chairman of the Board since 2004
Dr. Gavin is an educational consultant. Prior to September 1, 2001, he was President of Cranbrook Education Community and prior to July 1996, he was President of Macalester College, St. Paul, Minnesota.
Duane E. Hill (1945) Director since 2001 (HSF) and 2002 (HSF2), Chairman of the Nominating Committee since 2003
Mr. Hill is a Partner of TSG Ventures L.P., a private equity investment company. Mr. Hill is a former partner of TSG Capital Group, a private equity investment firm that served as sponsor and lead investor in leveraged buyouts of middle market companies.
Sandra S. Jaffee (1941) Director since 2005
Ms. Jaffee is the founder and Chief Executive Officer of a private company, Homeworks Concierge, LLC, which provides residential property management services in Westchester County, New York (January 2012 to present). Ms. Jaffee served as Chairman (2008 to 2009) and Chief Executive Officer of Fortent (formerly Searchspace Group), a leading provider of compliance/regulatory technology to financial institutions from August 2005 to August 2009. From August 2004 to August 2005, Ms. Jaffee served as an Entrepreneur in Residence with Warburg Pincus, a private equity firm. Prior to joining Warburg Pincus, Ms. Jaffee served as Executive Vice President at Citigroup, from September 1995 to July 2004, where she was President and Chief Executive Officer of Citibank’s Global Securities Services (1995 to 2003). Ms. Jaffee currently serves as a member of the Board of Directors of Broadridge Financial Solutions as well as a Trustee of Muhlenberg College.
| Hartford Ultrashort Bond HLS Fund |
| Directors and Officers (Unaudited) – (continued) |
William P. Johnston (1944) Director since 2005, Chairman of the Compliance Committee since 2005
In June 2006, Mr. Johnston was appointed as Senior Advisor to The Carlyle Group, a global private equity and other alternative asset investment firm and currently serves as an Operating Executive. In July 2006, Mr. Johnston was elected to the Board of Directors of MultiPlan, Inc. and served as a Director (July 2006 to August 2010). In August 2007, Mr. Johnston was elected to the Board of Directors of LifeCare Holdings, Inc. and served as a Director (August 2007 to June 2013). In February 2008, Mr. Johnston was elected to the Board of Directors of HCR-ManorCare, Inc. In May 2006, Mr. Johnston was elected to the Supervisory Board of Fresenius Medical Care AG & Co. KGaA, after its acquisition of Renal Care Group, Inc. in March 2006. Mr. Johnston joined Renal Care Group in November 2002 as a member of the Board of Directors and served as Chairman of the Board from March 2003 through March 2006. From 2002 through 2013, Mr. Johnston served as a Board member of the Georgia O’Keefe Museum. From September 1987 to December 2002, Mr. Johnston was with Equitable Securities Corporation (and its successors, SunTrust Equitable Securities and SunTrust Robinson Humphrey) serving in various investment banking and managerial positions, including Managing Director and Head of Investment Banking, Chief Executive Officer and Vice Chairman.
Phillip O. Peterson (1944) Director since 2002 (HSF) and 2000 (HSF2), Chairman of the Audit Committee since 2002
Mr. Peterson is a mutual fund industry consultant. He was a partner of KPMG LLP (an accounting firm) until July 1999. Mr. Peterson joined William Blair Funds in February 2007 as a member of the Board of Trustees. From February 2012 to February 2014, Mr. Peterson served as a Trustee of Symetra Variable Mutual Funds. From January 2004 to April 2005, Mr. Peterson served as Independent President of the Strong Mutual Funds.
Lemma W. Senbet (1946) Director since 2005
Dr. Senbet is the William E. Mayer Chair Professor of Finance and Founding Director, Center for Financial Policy, at the University of Maryland, Robert H. Smith School of Business. He was chair of the Finance Department of the University of Maryland, Robert H. Smith School of Business from 1998 to 2006. Since June 2013, he has been on leave from the University to serve as Executive Director of African Economic Research Consortium which focuses on economic policy research and training. Previously, he was a chaired professor of finance at the University of Wisconsin-Madison. Also, he was a Director of the Fortis Funds from March 2000 to July 2002. Dr. Senbet served as Director of the American Finance Association and President of the Western Finance Association. In 2006, Dr. Senbet was inducted Fellow of Financial Management Association International for his career-long distinguished scholarship and professional service.
Interested Directors and Officers
James E. Davey (1964) Director since 2012, President and Chief Executive Officer since 2010
Mr. Davey serves as Executive Vice President of Hartford Life Insurance Company (“HLIC”) and The Hartford Financial Services Group, Inc. Additionally, Mr. Davey serves as Chairman of the Board, Manager and Senior Managing Director of Hartford Funds Distributors, LLC (“HFD”). He also currently serves as Director, Chairman of the Board, President and Senior Managing Director of Hartford Administrative Services Company (“HASCO”). Mr. Davey also serves as Manager, Chairman of the Board and Senior Managing Director for Hartford Funds Management Company, LLC (“HFMC”) and Director, Chairman of the Board and Senior Managing Director for Hartford Funds Management Group, Inc. ("HFMG"). Mr. Davey has served in various positions within The Hartford and its subsidiaries in connection with the operation of the Hartford Funds. Mr. Davey joined The Hartford in 2002.
Lowndes A. Smith (1939) Director since 1996 (HSF) and 2002 (HSF2), Co-Chairman of the Investment Committee since 2005
Mr. Smith served as Vice Chairman of The Hartford from February 1997 to January 2002, as President and Chief Executive Officer of Hartford Life, Inc. from February 1997 to January 2002, and as President and Chief Operating Officer of The Hartford Life Insurance Companies from January 1989 to January 2002. Mr. Smith serves as a Director of White Mountains Insurance Group Ltd. (October 2003 to current); One Beacon Insurance (October 2006 to current); Symetra Financial (August 2007 to current) and is a Managing Director of Whittington Gray Associates (January 2007 to current).
Other Officers
Mark A. Annoni (1964) Vice President, Controller and Treasurer since 2012
Mr. Annoni currently serves as the Assistant Vice President of HLIC (February 2004 to present) and Senior Vice President of HFMG (December 2013 to present). Mr. Annoni has served in various positions within The Hartford and its subsidiaries in connection with the operation of the Hartford Funds. Mr. Annoni joined The Hartford in 2001.
| Hartford Ultrashort Bond HLS Fund |
| Directors and Officers (Unaudited) – (continued) |
Michael R. Dressen (1963) AML Compliance Officer since 2011
Mr. Dressen currently serves as Assistant Vice President of HLIC. He also serves as Chief Compliance Officer and AML Compliance Officer of HASCO and as AML Officer of HFD. Mr. Dressen has served in various positions within The Hartford and its subsidiaries in connection with the operation of the Hartford Funds.
Edward P. Macdonald (1967) Vice President, Secretary and Chief Legal Officer since 2005
Mr. Macdonald currently serves as Assistant Secretary, Executive Vice President and Deputy General Counsel of HFD, HASCO, HFMC and HFMG. He also serves as Vice President of HLIC. Mr. Macdonald has served in various positions within The Hartford and its subsidiaries in connection with the operation of the Hartford Funds. Mr. Macdonald joined The Hartford in 2005.
Joseph G. Melcher (1973) Vice President and Chief Compliance Officer since 2013
Mr. Melcher currently serves as Executive Vice President of HFD, HFMG and HASCO. Mr. Melcher also currently serves as Executive Vice President and Chief Compliance Officer of HFMC. Mr. Melcher has served in various positions within The Hartford and its subsidiaries in connection with the operation of the Hartford Funds since joining The Hartford in 2012. Prior to joining The Hartford, Mr. Melcher worked at Touchstone Investments, a member of the Western & Southern Financial Group, where he held the position of Vice President and Chief Compliance Officer from 2010 through 2012 and Assistant Vice President, Compliance from 2005 to 2010.
Vernon J. Meyer (1964) Vice President since 2006
Mr. Meyer currently serves as Senior Vice President of HLIC. He also currently serves as Managing Director and Chief Investment Officer of HFMC and Managing Director of HFMG. Mr. Meyer has served in various positions within The Hartford and its subsidiaries in connection with the operation of the Hartford Funds. Mr. Meyer joined The Hartford in 2004.
Laura S. Quade (1969) Vice President since 2012
Ms. Quade currently serves as Vice President of HASCO, HFD and HFMG. She is the Head of Operations of HASCO and also serves as Director, Enterprise Operations of HLIC. Ms. Quade has served in various positions within The Hartford and its subsidiaries in connection with the operation of the Hartford Funds.
Martin A. Swanson (1962) Vice President since 2010
Mr. Swanson currently serves as Vice President of HLIC. Mr. Swanson also serves as Managing Director, Chief Marketing Officer and Principal of HFD and Managing Director of HFMG. Mr. Swanson has served in various positions within The Hartford and its subsidiaries in connection with the operation of the Hartford Funds.
HOW TO OBTAIN A COPY OF THE FUND’S PROXY VOTING POLICIES AND VOTING RECORDS (UNAUDITED)
A description of the policies and procedures that the Fund uses to determine how to vote proxies relating to portfolio securities and information about how the Fund voted proxies relating to portfolio securities during the most recent twelve-month period ended June 30 are available (1) without charge, upon request, by calling 888-843-7824 and (2) on the SEC’s website at http://www.sec.gov.
QUARTERLY PORTFOLIO HOLDINGS INFORMATION (UNAUDITED)
The Fund files a complete schedule of portfolio holdings with the SEC for the first and third quarters of each fiscal year on Form N-Q. The Fund’s Forms N-Q are available (1) without charge, upon request, by calling 888-843-7824 and (2) on the SEC’s website at http://www.sec.gov. The Form N-Q may be reviewed and copied at the SEC’s Public Reference Room in Washington, DC. Information on the operation of the Public Reference Room may be obtained by calling 1-800-SEC-0330.
| Hartford Ultrashort Bond HLS Fund |
| Expense Example (Unaudited) |
Your Fund's Expenses
As a shareholder of the Fund, you incur two types of costs: (1) transaction costs and (2) ongoing costs, including investment management fees, distribution and/or service (12b-1) fees, if any, and other fund expenses. This example is intended to help you understand your ongoing costs (in dollars) of investing in the Fund and to compare these costs with the ongoing costs of investing in other mutual funds. The example is based on an investment of $1,000 invested at the beginning of the period and held for the entire period of December 31, 2013 through June 30, 2014.
Actual Expenses
The first set of columns of the table below provides information about actual account values and actual expenses. You may use the information in this column, together with the amount you invested, to estimate the expenses that you paid over the period. Simply divide your account value by $1,000 (for example, an $8,600 account value divided by $1,000 = 8.6), then multiply the result by the number in the line under the heading entitled “Expenses Paid During Period” to estimate the expenses you paid on your account during this period.
Hypothetical Example for Comparison Purposes
The second set of columns of the table below provides information about hypothetical account values and hypothetical expenses based on the Fund's actual expense ratio and an assumed rate of return of 5% per year before expenses, which is not the Fund's actual return. The hypothetical account values and expenses may not be used to estimate the actual ending account balance or expenses you paid for the period. You may use this information to compare the ongoing costs of investing in the Fund and other funds. To do so, compare this 5% hypothetical example with the 5% hypothetical examples that appear in the shareholder reports of the other funds.
Please note that the expenses shown in the table are meant to highlight your ongoing costs only and do not reflect any transactional costs, such as sales charges (loads) and CDSC. Therefore, the second set of columns of the table is useful in comparing ongoing costs only, and will not help you determine the relative total costs of owning different funds. In addition, if these transactional costs were included, your costs would be higher. Expenses are equal to the Fund's annualized expense ratios multiplied by average account value over the period, multiplied by 181/365 (to reflect the one-half year period).
| | | Actual return | | | Hypothetical (5% return before expenses) | | | | | | | | | |
| | | Beginning
Account Value
December 31,
2013 | | | Ending Account
Value
June 30, 2014 | | | Expenses paid
during the period
December 31, 2013
through
June 30, 2014 | | | Beginning
Account Value
December 31,
2013 | | | Ending Account
Value
June 30, 2014 | | | Expenses paid
during the period
December 31,
2013
through
June 30, 2014 | | | Annualized
expense
ratio | | Days
in the
current
1/2
year | | | Days
in the
full
year | |
| Class IA | | $ | 1,000.00 | | | $ | 1,002.00 | | | $ | 2.13 | | | $ | 1,000.00 | | | $ | 1,022.66 | | | $ | 2.16 | | | 0.43 | % | | 181 | | | | 365 | |
| Class IB | | $ | 1,000.00 | | | $ | 1,002.00 | | | $ | 3.38 | | | $ | 1,000.00 | | | $ | 1,021.42 | | | $ | 3.41 | | | 0.68 | | | 181 | | | | 365 | |
| Hartford Ultrashort Bond HLS Fund |
| Main Risks (Unaudited) |
The main risks of investing in the Fund are described below.
Market, Selection and Strategy Risk: The Fund’s share price may fluctuate due to market risk and/or security selections that may underperform the market or relevant benchmarks. If the sub-adviser's investment strategy does not perform as expected, the Fund could underperform its peers or lose money. There is no guarantee the Fund will achieve its stated objective.
Fixed Income Risk: The Fund is subject to interest rate risk (the risk that the value of an investment decreases when interest rates rise) and credit risk (the risk that the issuing company of a security is unable to pay interest and principal when due) and call risk (the risk that an investment may be redeemed early). These risks also apply to the Fund’s investments in U.S. government securities, which may not be guaranteed by the U.S. government.
Mortgage-Backed Securities Risk: Mortgage-backed securities are subject to interest rate risk, credit risk, prepayment risk, extension risk, and the risk that an investment’s value may be reduced or become worthless if it receives interest or income payments only after other investments in the same pool.
Derivatives Risk: Investments in derivatives can be volatile. Potential risks include currency risk, leverage risk (the risk that small market movements may result in large changes in the value of an investment), liquidity risk, index risk, pricing risk, and counterparty risk (the risk that the counterparty may be unwilling or unable to honor its obligations).
Reverse Repurchase Agreements and Dollar Rolls Risk: Reverse repurchase agreements and dollar rolls involve the risk that the market value of the securities that the Fund is committed to buy may decline below the repurchase price. These investments may also subject the Fund to the risk that the counterparty will not fulfill its obligations.
THIS PRIVACY POLICY IS NOT PART OF THIS REPORT
Privacy Policy and Practices of The Hartford Financial Services Group, Inc. and its Affiliates
(herein called “we, our and us”)
This Privacy Policy applies to our United States Operations
We value your trust. We are committed to the responsible: a) management; b) use; and c) protection; of Personal Information. This notice describes how we collect, disclose, and protect Personal Information. We collect Personal Information to: a) service your Transactions with us; and b) support our business functions. We may obtain Personal Information from: a) You; b) your Transactions with us; and c) third parties such as a consumer-reporting agency. Based on the type of product or service You apply for or get from us, Personal Information such as: a) your name; b) your address; c) your income; d) your payment; or e) your credit history; may be gathered from sources such as applications, Transactions, and consumer reports. To serve You and service our business, we may share certain Personal Information. We will share Personal Information, only as allowed by law, with affiliates such as: a) our insurance companies; b) our employee agents; c) our brokerage firms; and d) our administrators. As allowed by law, we may share Personal Financial Information with our affiliates to: a) market our products; or b) market our services; to You without providing You with an option to prevent these disclosures. | | | We may also share Personal Information, only as allowed by law, with unaffiliated third parties including: a) independent agents; b) brokerage firms; c) insurance companies; d) administrators; and e) service providers; who help us serve You and service our business. When allowed by law, we may share certain Personal Financial Information with other unaffiliated third parties who assist us by performing services or functions such as: a) taking surveys; b) marketing our products or services; or c) offering financial products or services under a joint agreement between us and one or more financial institutions. We, and third parties we partner with, may track some of the pages You visit through the use of: a) cookies; b) pixel tagging; or c) other technologies; and currently do not process or comply with any web browser’s “do not track” signal or similar mechanism that indicates a request to disable online tracking of individual users who visit our websites or use our services. We will not sell or share your Personal Financial Information with anyone for purposes unrelated to our business functions without offering You the opportunity to: a) “opt-out;” or b) “opt-in;” as required by law. We only disclose Personal Health Information with: a) your proper written authorization; or b) as otherwise allowed or required by law. Our employees have access to Personal Information in the course of doing their jobs, such as: a) underwriting policies; b) paying claims; c) developing new products; or d) advising customers of our products and services. |
We use manual and electronic security procedures to maintain: a) the confidentiality; and b) the integrity of; Personal Information that we have. We use these procedures to guard against unauthorized access. Some techniques we use to protect Personal Information include: a) secured files; b) user authentication; c) encryption; d) firewall technology; and e) the use of detection software. We are responsible for and must: a) identify information to be protected; b) provide an adequate level of protection for that data; c) grant access to protected data only to those people who must use it in the performance of their job-related duties. Employees who violate our Privacy Policy will be subject to discipline, which may include ending their employment with us. At the start of our business relationship, we will give You a copy of our current Privacy Policy. We will also give You a copy of our current Privacy Policy once a year if You maintain a continuing business relationship with us. We will continue to follow our Privacy Policy regarding Personal Information even when a business relationship no longer exists between us. | | | As used in this Privacy Notice: Application means your request for our product or service. Personal Financial Information means financial information such as: a) credit history; b) income; c) financial benefits; or d) policy or claim information. Personal Health Information means health information such as: a) your medical records; or b) information about your illness, disability or injury. Personal Information means information that identifies You personally and is not otherwise available to the public. It includes: a) Personal Financial Information; and b) Personal Health Information. Transaction means your business dealings with us, such as: a) your Application; b) your request for us to pay a claim; and c) your request for us to take an action on your account. You means an individual who has given us Personal Information in conjunction with: a) asking about; b) applying for; or c) obtaining; a financial product or service from us if the product or service is used mainly for personal, family, or household purposes. |
This Privacy Policy is being provided on behalf of the following affiliates of The Hartford Financial Services Group, Inc.:
1stAGChoice, Inc.; Access CoverageCorp, Inc.; Access CoverageCorp Technologies, Inc.; American Maturity Life Insurance Company; Archway 60 R, LLC; Business Management Group, Inc.; Champlain Life Reinsurance Company; DMS R, LLC; Eloy R, LLC; Ersatz Corporation; First State Insurance Company; Hartford Accident and Indemnity Company; Hartford Administrative Services Company; Hartford Casualty General Agency, Inc.; Hartford Casualty Insurance Company; Hartford-Comprehensive Employee Benefit Service Company; Hartford Equity Sales Company, Inc.; Hartford Fire General Agency, Inc.; Hartford Fire Insurance Company; Hartford Funds Management Company, LLC; Hartford Funds Management Group, Inc.; Hartford HLS Series Fund II, Inc.; Hartford Insurance Company of Illinois; Hartford Insurance Company of the Midwest; Hartford Insurance Company of the Southeast; Hartford Integrated Technologies, Inc.; Hartford International Life Reassurance Corporation; Hartford Funds Distributors, LLC; Hartford Investment Management Company; Hartford Life and Accident Insurance Company; Hartford Life and Annuity Insurance Company; Hartford Life Insurance Company; Hartford Life Private Placement, LLC; Hartford Lloyd’s Corporation; Hartford Lloyd’s Insurance Company; Hartford Mezzanine Investors I, LLC; Hartford Residual Market, L.C.C.; Hartford Retirement Services, LLC; Hartford Securities Distribution Company, Inc.; Hartford Series Fund, Inc.; Hartford Specialty Insurance Services of Texas, LLC; Hartford Strategic Investments, LLC; Hartford Underwriters Insurance Company; Hartford Technology Services Company, L.L.C.; Hartford of Texas General Agency, Inc.; Hartford Underwriters General Agency, Inc.; HARTRE Company, L.C.C.; HL Investment Advisors, LLC; HLA LLC; Horizon Management Group, LLC; HRA Brokerage Services, Inc.; Lanidex Class B, LLC; M-CAP Insurance Agency, LLC; New England Insurance Company; New England Reinsurance Corporation; Nutmeg Insurance Agency, Inc.; Nutmeg Insurance Company; Pacific Insurance Company, Limited; Planco, LLC: Property and Casualty Insurance Company of Hartford; Revere R, LLC; RVR R, LLC; Sentinel Insurance Company, Ltd.; Sunstone R, LLC; Symphony R, LLC; The Evergreen Group Incorporated; The Hartford Alternative Strategies Fund; The Hartford Mutual Funds, Inc.; The Hartford Mutual Funds II, Inc.; Trumbull Flood Management, L.L.C.; Trumbull Insurance Company; Twin City Fire Insurance Company; White River Life Reinsurance Company.
HPP Revised January 2014
HARTFORD HLS FUNDS
P.O. Box 14293
Lexington, KY 40512-4293
HARTFORDFUNDS
hartfordfunds.com
Hartford Series Fund, Inc. is underwritten and distributed by Hartford Funds Distributors, LLC.
Hartford Series Fund, Inc. inception dates range from 1977 to date. Hartford Series Fund, Inc. is not a subsidiary of The Hartford Financial Services Group, Inc. ("The Hartford") but is underwritten, distributed by and advised by subsidiaries of The Hartford. Investments in Hartford Series Fund, Inc. are not guaranteed by The Hartford or any other entity.
This report is submitted for the general information of the shareholders of the Funds. It is not authorized for distribution unless preceded or accompanied by a current prospectus for the Funds.
Investors should carefully consider the investment objectives, risks, charges, and expenses of Hartford Funds before investing. This and other information can be found in the prospectus, which can be obtained by calling 800-862-6668 (or 800-279-1541 for institutional investors). Investors should read them carefully before they invest.
HLSSAR-USB14 8-14 113549-3 Printed in U.S.A.
HARTFORDFUNDS
| | HARTFORD VALUE HLS FUND 2014 Semi Annual Report |
A MESSAGE FROM THE PRESIDENT
Dear Fellow Shareholders:
Thank you for investing in Hartford HLS Funds.
Market Review
U.S. equities (as represented by the S&P 500 Index) started 2014 on a shaky note after posting a strong 32.39% gain in 2013. However, stocks managed to maintain modest gains throughout the first quarter and returned to a generally steady climb in the second quarter. Through June 30, 2014, the S&P 500 Index advanced 7.14%. It appears that much of the market volatility during the year can be attributed to heightened international tensions. In particular, the Russian annexation of Ukraine’s Crimean Peninsula and increased tensions in Iraq were cause for concern.
On the domestic front, subdued economic and employment reports slowed stocks’ progress early in the new year, although much of the weakness seemed to dissipate as the year’s unusually harsh winter subsided. And despite initial reactions to the idea, when the U.S. Federal Reserve began tapering its quantitative-easing program in January by reducing its bond purchases by $10 billion a month, the markets took the policy change in stride.
Despite a rough start to the year for financial markets, the global economy seems to be settling into a slow-but-steady recovery. While first-quarter U.S. gross domestic product (GDP) growth was disappointing at -2.9%, U.S. consumer spending, which is a significant contributor toward economic growth, rose by 3% during the quarter. It appears that Europe is also maintaining its own recovery: The International Monetary Fund projects that Europe’s full-year GDP growth may breach positive territory for the first time since 2011.
The impact of international affairs on stocks so far this year is an important reminder to stay informed about both domestic and international economic developments, and any effects they may have on your individual investment goals. If you have not already had a mid-year review of your portfolio, it may be a good time to meet with your financial advisor to review your progress and make certain your investments are prepared for all market environments:
| • | Is your portfolio properly diversified with an appropriate mix of stocks and bonds? |
| • | Is your portfolio positioned to take advantage of the global economic recovery, with investments in both domestic and international holdings? |
| • | Are your investments still in line with your risk tolerance and investment time horizon? |
Your financial professional can help you choose options within our fund family to help you reach your investment goals with confidence.
Thank you again for investing with Hartford HLS Funds.
James Davey
President
Hartford HLS Funds
1 The S&P 500 Index is a market capitalization-weighted price index composed of 500 widely held common stocks.
2The Dow Jones Industrial Average is an unmanaged, price-weighted index of 30 of the largest, most widely held stocks traded on the New York Stock Exchange.
Hartford Value HLS Fund
Table of Contents
This report is prepared for the general information of contract owners and qualified retirement plan participants. It is not an offer of contracts or of qualified retirement plans. It should not be used in connection with any offer, except in conjunction with the appropriate product prospectus which contains all pertinent information including the applicable sales, administrative and other charges.
The views expressed in the Fund’s Manager Discussion under “Why did the Fund perform this way?” and “What is the outlook?” are views of the Fund’s sub-adviser and portfolio management team through the end of the period and are subject to change based on market and other conditions. The Fund’s Manager Discussion is for informational purposes only and does not represent an offer, recommendation or solicitation to buy, hold or sell any security. The specific securities identified and described, if any, do not represent all of the securities purchased or sold and you should not assume that investments in the securities identified and discussed will be profitable.
| Hartford Value HLS Fund inception 04/30/2001 |
| (sub-advised by Wellington Management Company, LLP) | |
| | |
| Investment objective – The Fund seeks long-term total return. |
Performance Overview 6/30/04 - 6/30/14
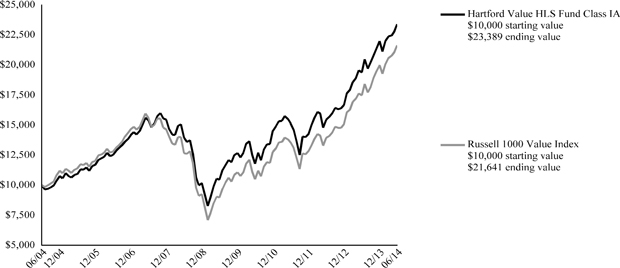
The chart above represents the hypothetical growth of a $10,000 investment in Class IA. Growth results in classes other than Class IA will vary from what is seen above due to differences in the expenses charged to those share classes.
Average Annual Total Returns (as of 6/30/14)
| | 6 Month† | 1 Year | 5 Years | 10 Years |
| Value IA | 6.37% | 20.63% | 17.46% | 8.87% |
| Value IB | 6.24% | 20.37% | 17.17% | 8.60% |
| Russell 1000 Value Index | 8.28% | 23.81% | 19.23% | 8.03% |
PERFORMANCE DATA QUOTED REPRESENTS PAST PERFORMANCE AND DOES NOT GUARANTEE FUTURE RESULTS. The investment return and principal value of the investment will fluctuate so that investors’ shares, when redeemed, may be worth more or less than their original cost. Current performance may be lower or higher than the performance data quoted. To obtain performance data current to the most recent month-end, please visit our website www.hartfordfunds.com.
Total returns presented above were calculated using the Fund’s net asset value available to shareholders for sale or redemption of Fund shares on June 30, 2014, which may exclude investment transactions as of this date. All share class returns assume the reinvestment of all distributions at net asset value and the deduction of all fund expenses.
Russell 1000 Value Index is an unmanaged index that measures the performance of those Russell 1000 Index companies with lower price-to-book ratios and lower forecasted growth values. The Russell 1000 Index is an unmanaged index that measures the performance of the 1,000 largest companies in the Russell 3000 Index, which measures the performance of the 3,000 largest U.S. companies, based on total market capitalizations.
The index is unmanaged, and its results include reinvested dividends and/or distributions, but do not reflect the effect of sales charges, commissions, expenses or taxes.
You cannot invest directly in an index.
As shown in the Fund's current prospectus dated May 1, 2014, the total annual operating expense ratios for Class IA and Class IB were 0.76% and 1.01%, respectively. Actual expenses may be higher. Please see the accompanying Financial Highlights for expense ratios for the six-month period ended June 30, 2014.
The chart and table do not reflect the deductions of taxes, sales charges or other fees which may be applied at the variable life insurance, variable annuity or qualified retirement plan product level. Any such additional sales charges or other fees or expenses would lower the contract’s or plan’s performance.
All investments are subject to risk including the possible loss of principal. For a discussion of the Fund’s risks, please see the Main Risks section of this report. For more detailed information on the risks associated with an investment in the Fund, please see the prospectus.
| Hartford Value HLS Fund |
| Manager Discussion |
| June 30, 2014 (Unaudited) |
| Portfolio Managers | | |
| Karen H. Grimes, CFA | W. Michael Reckmeyer, III, CFA | Ian R. Link, CFA |
| Senior Vice President and Equity Portfolio Manager | Senior Vice President and Equity Portfolio Manager | Director and Equity Portfolio Manager |
| |
How did the Fund perform?
The Class IA shares of the Hartford Value HLS Fund returned 6.37% for the six-month period ended June 30, 2014, underperforming the Fund’s benchmark, the Russell 1000 Value Index, which returned 8.28% for the same period. The Fund also underperformed the 6.97% average return of the Lipper Large Cap Value Funds peer group, a group of funds with investment strategies similar to those of the Fund.
Why did the Fund perform this way?
U.S. equities surged during the period, ending June near an all-time high. After finishing 2013 with their best year since 1997, U.S. stocks began 2014 with their worst month in nearly two years. Worries about a slowdown in China and general concern surrounding emerging markets overshadowed a fairly benign domestic environment. However, robust merger and acquisition activity and an uncontested increase in the debt ceiling from Congress helped stoke investors' risk appetites in February. Earnings season in April provided a varied yet encouraging picture, with companies generally reporting healthy earnings but more subdued revenues. The rally continued in May amid renewed signs of life in the housing market and the best payroll gains in more than two years. In June, strong manufacturing activity, coupled with continued positive momentum in housing and employment data, helped to offset a large negative revision to first quarter economic growth.
In this environment, all ten sectors within the Russell 1000 Value Index posted positive returns during the period. Utilities (+18%), Information Technology (+14%), and Healthcare (+12%) gained the most, while Consumer Staples (+4%), Consumer Discretionary (+4%), and Industrials (+4%) lagged on a relative basis.
The Fund’s underperformance versus the Russell 1000 Value Index was primarily driven by weak stock selection within Financials, Information Technology, and Consumer Discretionary. This was partially offset by strong security selection within Energy and Healthcare. Sector allocation, a residual of the bottom up stock selection process, also detracted from performance largely due to an underweight allocation to the utilities sector and an overweight allocation to the Consumer Discretionary sector which more than offset the positive impact of an overweight to Information Technology. A modest cash position detracted from results in an upward trending market environment.
Among the top detractors from returns relative to the Russell 1000 Value Index were Intercontinental Exchange (Financials), PVH (Consumer Discretionary), and Marvell Technology Group (Information Technology). Shares of Intercontinental Exchange, a U.S.-based global network of exchanges and clearing houses for financial and commodity markets, fell during the period as investors became concerned that exchanges would see lower volumes amid controversy over the U.S. market exchange structure during the first quarter. Shares of PVH, a leading global apparel company with brands such as Calvin Klein and Tommy Hilfiger, fell towards the end of the period after the company issued earning per share guidance below analyst expectations. Marvell Technology Group, a supplier of mixed signal and analog semiconductor products to a number of storage, computing, and communication applications, fell during the period as some investors were skeptical about the potential success of the company’s increased focus on the Chinese market and new 4G chips. Citigroup (Financials) also detracted on an absolute basis.
The largest contributors to returns relative to the Russell 1000 Value Index were Halliburton (Energy), EOG Resources (Energy), and Covidien (Healthcare). Shares of Halliburton, a U.S.-based global oilfield services company, rose during the period as the growth outlook for U.S. onshore activity in the energy sector continues to strengthen as new equity capital supports increased budgets for capital expenditures by exploration and production companies. EOG Resources, an exploration and production company focused primarily in North America, reported another very impressive quarter with an earnings that beat consensus estimates driven by U.S. oil production once again being above the high-end of guidance. Shares of Covidien, a medical products, manufacturing, and distribution company, rose after it was announced that Medtronic had offered to buy Covidien for $42.9 billion, a move which investors viewed favorably. Top absolute contributors during the period included Merck (Healthcare).
Derivatives are not used in a significant manner in this Fund and did not have a material impact on performance during the period.
What is the outlook?
We believe the U.S. economy remains poised for continued moderate growth. Following the weak -2.9% first quarter GDP revision, which had a number of weather- and health-care related distortions, we believe the U.S. economy is poised for stronger activity in the second half. The economy could accelerate to a fairly stable 2.5% to 3% GDP growth range over the next 12 to 18 months. We believe that an easing fiscal drag, an end to inventory adjustments, and fading impact of higher interest rates should all help. Housing has been weaker than we expected, but recent data points have shown signs of reacceleration. Housing prices are still
| Hartford Value HLS Fund |
| Manager Discussion – (continued) |
June 30, 2014 (Unaudited) |
up double digits year over year and we believe remodeling activity should continue to do well. We believe the U.S. Federal Reserve (Fed) remains on track to end quantitative easing in the fourth quarter of this year and is likely to start raising interest rates by next Spring. As the labor market continues to tighten, we are closely watching the direction and course of wage gains, as this is something that could cause the Fed to act sooner than consensus expectations.
Globally, we believe that the risks are higher than what we saw at the beginning of the year, but that the overall environment is still supportive for global growth. The stabilization of the European economy appears to be intact and we continue to see signs that it is slowly improving. The ECB has signaled that it is going to keep rates low and do what it takes to keep the recovery on track. The Bank of England, on the other hand, appears poised to be the first major central bank to hike rates in its efforts to fight inflation. Japan appears to be rebounding from the negative reaction to the value-added tax (VAT) that began in April. Prime Minister Shinzo Abe recently unveiled a package of reform measures aimed at boosting Japan’s long-term economic growth, including lowering the corporate tax rate. We believe that China remains one of the largest risks in the global economy. Growth has been slowing, and we are beginning to see signs of stress in their banking system. So far the slowdown has been moderate and manageable, but we will be watching the situation closely
Based on individual stock decisions, the Fund ended the period most overweight the Consumer Discretionary, Information Technology, and Materials sectors, and most underweight the Utilities, Consumer Staples, and Financials sectors relative to the Russell 1000 Value Index.
Diversification by Sector
as of June 30, 2014
| Sector | | Percentage of
Net Assets | |
| Equity Securities | | | | |
| Consumer Discretionary | | | 11.0 | % |
| Consumer Staples | | | 4.7 | |
| Energy | | | 13.1 | |
| Financials | | | 26.4 | |
| Health Care | | | 12.9 | |
| Industrials | | | 9.4 | |
| Information Technology | | | 12.6 | |
| Materials | | | 3.9 | |
| Services | | | 1.6 | |
| Utilities | | | 2.5 | |
| Total | | | 98.1 | % |
| Short-Term Investments | | | 0.5 | |
| Other Assets and Liabilities | | | 1.4 | |
| Total | | | 100.0 | % |
A sector may be comprised of several industries. For Fund compliance purposes, the Fund may not use the same classification system and these sector classifications are used for reporting ease.
| Hartford Value HLS Fund |
| Schedule of Investments |
| June 30, 2014 (Unaudited) |
| (000’s Omitted) |
| Shares or Principal Amount | | Market Value ╪ | |
| Common Stocks - 98.1% | |
| | | | | Banks - 7.7% | | | | |
| | 199 | | | BB&T Corp. | | $ | 7,848 | |
| | 172 | | | PNC Financial Services Group, Inc. | | | 15,340 | |
| | 526 | | | Wells Fargo & Co. | | | 27,642 | |
| | | | | | | | 50,830 | |
| | | | | Capital Goods - 9.4% | | | | |
| | 45 | | | 3M Co. | | | 6,514 | |
| | 120 | | | Eaton Corp. plc | | | 9,271 | |
| | 79 | | | Fortune Brands Home & Security, Inc. | | | 3,142 | |
| | 436 | | | General Electric Co. | | | 11,453 | |
| | 63 | | | Illinois Tool Works, Inc. | | | 5,530 | |
| | 98 | | | Ingersoll-Rand plc | | | 6,126 | |
| | 72 | | | PACCAR, Inc. | | | 4,541 | |
| | 211 | | | Spirit Aerosystems Holdings, Inc. ● | | | 7,094 | |
| | 71 | | | United Technologies Corp. | | | 8,203 | |
| | | | | | | | 61,874 | |
| | | | | Consumer Durables and Apparel - 2.9% | | | | |
| | 192 | | | Newell Rubbermaid, Inc. | | | 5,945 | |
| | 316 | | | Pulte Group, Inc. | | | 6,371 | |
| | 59 | | | PVH Corp. | | | 6,880 | |
| | | | | | | | 19,196 | |
| | | | | Diversified Financials - 10.8% | | | | |
| | 70 | | | Ameriprise Financial, Inc. | | | 8,438 | |
| | 30 | | | BlackRock, Inc. | | | 9,670 | |
| | 264 | | | Citigroup, Inc. | | | 12,413 | |
| | 51 | | | Goldman Sachs Group, Inc. | | | 8,583 | |
| | 38 | | | Intercontinental Exchange, Inc. | | | 7,247 | |
| | 386 | | | JP Morgan Chase & Co. | | | 22,215 | |
| | 136 | | | Santander Consumer USA Holdings, Inc. | | | 2,637 | |
| | 230 | | | Solar Cayman Ltd. ⌂■●† | | | 16 | |
| | | | | | | | 71,219 | |
| | | | | Energy - 13.1% | | | | |
| | 67 | | | Anadarko Petroleum Corp. | | | 7,362 | |
| | 172 | | | Chevron Corp. | | | 22,444 | |
| | 68 | | | EOG Resources, Inc. | | | 7,963 | |
| | 123 | | | Exxon Mobil Corp. | | | 12,388 | |
| | 175 | | | Halliburton Co. | | | 12,393 | |
| | 197 | | | Marathon Oil Corp. | | | 7,847 | |
| | 84 | | | Occidental Petroleum Corp. | | | 8,665 | |
| | 148 | | | Southwestern Energy Co. ● | | | 6,725 | |
| | | | | | | | 85,787 | |
| | | | | Food and Staples Retailing - 1.1% | | | | |
| | 100 | | | CVS Caremark Corp. | | | 7,527 | |
| | | | | | | | | |
| | | | | Food, Beverage and Tobacco - 3.6% | | | | |
| | 68 | | | Anheuser-Busch InBev N.V. ADR | | | 7,871 | |
| | 50 | | | Diageo plc ADR | | | 6,400 | |
| | 70 | | | Kraft Foods Group, Inc. | | | 4,193 | |
| | 59 | | | Philip Morris International, Inc. | | | 4,994 | |
| | | | | | | | 23,458 | |
| | | | | Health Care Equipment and Services - 4.5% | | | | |
| | 83 | | | Baxter International, Inc. | | | 5,993 | |
| | 121 | | | Covidien plc | | | 10,879 | |
| | 155 | | | UnitedHealth Group, Inc. | | | 12,654 | |
| | | | | | | | 29,526 | |
| | | | | Insurance - 6.8% | | | | |
| | 100 | | | ACE Ltd. | | | 10,414 | |
| | 115 | | | American International Group, Inc. | | | 6,296 | |
| | 188 | | | Marsh & McLennan Cos., Inc. | | | 9,750 | |
| | 141 | | | MetLife, Inc. | | | 7,812 | |
| | 101 | | | Principal Financial Group, Inc. | | | 5,091 | |
| | 143 | | | Unum Group | | | 4,987 | |
| | | | | | | | 44,350 | |
| | | | | Materials - 3.9% | | | | |
| | 160 | | | Dow Chemical Co. | | | 8,250 | |
| | 60 | | | E.I. DuPont de Nemours & Co. | | | 3,917 | |
| | 117 | | | International Paper Co. | | | 5,881 | |
| | 67 | | | Nucor Corp. | | | 3,320 | |
| | 239 | | | Steel Dynamics, Inc. | | | 4,291 | |
| | | | | | | | 25,659 | |
| | | | | Media - 4.2% | | | | |
| | 81 | | | CBS Corp. Class B | | | 5,019 | |
| | 162 | | | Comcast Corp. Class A | | | 8,711 | |
| | 39 | | | DirecTV ● | | | 3,335 | |
| | 252 | | | Interpublic Group of Cos., Inc. | | | 4,920 | |
| | 154 | | | Thomson Reuters Corp. | | | 5,588 | |
| | | | | | | | 27,573 | |
| | | | | Pharmaceuticals, Biotechnology and Life Sciences - 8.4% | | | | |
| | 61 | | | Amgen, Inc. | | | 7,172 | |
| | 106 | | | AstraZeneca plc ADR | | | 7,893 | |
| | 65 | | | Johnson & Johnson | | | 6,780 | |
| | 294 | | | Merck & Co., Inc. | | | 16,987 | |
| | 165 | | | Pfizer, Inc. | | | 4,886 | |
| | 31 | | | Roche Holding AG | | | 9,272 | |
| | 76 | | | Zoetis, Inc. | | | 2,465 | |
| | | | | | | | 55,455 | |
| | | | | Real Estate - 1.1% | | | | |
| | 317 | | | Host Hotels & Resorts, Inc. REIT | | | 6,981 | |
| | | | | | | | | |
| | | | | Retailing - 3.9% | | | | |
| | 14 | | | AutoZone, Inc. ● | | | 7,561 | |
| | 75 | | | Home Depot, Inc. | | | 6,070 | |
| | 154 | | | Lowe's Cos., Inc. | | | 7,398 | |
| | 71 | | | Nordstrom, Inc. | | | 4,803 | |
| | | | | | | | 25,832 | |
| | | | | Semiconductors and Semiconductor Equipment - 5.6% | | | | |
| | 123 | | | Analog Devices, Inc. | | | 6,647 | |
| | 402 | | | Intel Corp. | | | 12,423 | |
| | 518 | | | Marvell Technology Group Ltd. | | | 7,418 | |
| | 296 | | | Maxim Integrated Products, Inc. | | | 10,016 | |
| | | | | | | | 36,504 | |
| | | | | Software and Services - 2.6% | | | | |
| | 202 | | | Microsoft Corp. | | | 8,437 | |
| | 363 | | | Symantec Corp. | | | 8,318 | |
| | | | | | | | 16,755 | |
| | | | | Technology Hardware and Equipment - 4.4% | | | | |
| | 722 | | | Cisco Systems, Inc. | | | 17,942 | |
| | 417 | | | EMC Corp. | | | 10,978 | |
| | | | | | | | 28,920 | |
| | | | | Telecommunication Services - 1.6% | | | | |
| | 211 | | | Verizon Communications, Inc. | | | 10,318 | |
| | | | | | | | | |
| | | | | Utilities - 2.5% | | | | |
| | 95 | | | Edison International | | | 5,548 | |
| | 35 | | | NextEra Energy, Inc. | | | 3,590 | |
The accompanying notes are an integral part of these financial statements.
| Hartford Value HLS Fund |
| Schedule of Investments – (continued) |
| June 30, 2014 (Unaudited) |
| (000’s Omitted) |
| Shares or Principal Amount | | Market Value ╪ | |
| Common Stocks - 98.1% - (continued) | |
| | | | | Utilities - 2.5% - (continued) | | | | |
| | 160 | | | Northeast Utilities | | $ | 7,557 | |
| | | | | | | | 16,695 | |
| | | | | Total Common Stocks | | | | |
| | | | | ( Cost $438,855) | | $ | 644,459 | |
| | | | | | | | | |
| | | | | Total Long-Term Investments | | | | |
| | | | | (Cost $438,855) | | $ | 644,459 | |
| | | | | | | | | |
| Short-Term Investments - 0.5% | | | | |
| Repurchase Agreements - 0.5% | | | |
| | | | | Bank of America Merrill Lynch TriParty Repurchase
Agreement (maturing on 07/01/2014 in the
amount of $270, collateralized by FHLMC 2.23%
- 5.99%, 2030 - 2044, FNMA 2.31% - 6.34%,
2020 - 2042, value of $275) | | | | |
| $ | 270 | | | 0.10%, 6/30/2014 | | $ | 270 | |
| | | | | Bank of Montreal TriParty Repurchase Agreement
(maturing on 07/01/2014 in the amount of $412,
collateralized by U.S. Treasury Bill 0.13%, 2015,
U.S. Treasury Bond 2.75% - 10.63%, 2015 -
2044, U.S. Treasury Note 0.13% - 4.50%, 2014 -
2024, value of $420) | | | | |
| | 412 | | | 0.09%, 6/30/2014 | | | 412 | |
| | | | | Bank of Montreal TriParty Repurchase Agreement
(maturing on 07/01/2014 in the amount of $176,
collateralized by FHLMC 2.00% - 5.50%, 2018 -
2041, FNMA 2.00% - 4.50%, 2026 - 2042,
GNMA 3.00% - 4.00%, 2042 - 2043, U.S.
Treasury Bill 0.05%, 2014, U.S. Treasury Note
0.75%, 2018, value of $179) | | | | |
| | 176 | | | 0.11%, 6/30/2014 | | | 176 | |
| | | | | Barclays Capital TriParty Repurchase Agreement
(maturing on 07/01/2014 in the amount of $162,
collateralized by U.S. Treasury Note 0.63% -
0.88%, 2018 - 2019, value of $166) | | | | |
| | 162 | | | 0.07%, 6/30/2014 | | | 162 | |
| | | | | Citigroup Global Markets, Inc. TriParty Repurchase
Agreement (maturing on 07/01/2014 in the
amount of $374, collateralized by U.S. Treasury
Bond 4.38% - 7.50%, 2016 - 2040, U.S.
Treasury Note 0.50% - 3.00%, 2014 - 2020,
value of $382) | | | | |
| | 374 | | | 0.06%, 6/30/2014 | | | 374 | |
| | | | | RBS Securities Inc. TriParty Repurchase
Agreement (maturing on 07/01/2014 in the
amount of $574, collateralized by U.S. Treasury
Note 0.38% - 3.13%, 2015 - 2022, value of
$585) | | | | |
| | 574 | | | 0.08%, 6/30/2014 | | | 574 | |
| | | | | TD Securities TriParty Repurchase Agreement
(maturing on 07/01/2014 in the amount of
$1,194, collateralized by FHLMC 3.50% - 4.00%,
2026 - 2044, FNMA 2.50% - 5.00%, 2025 -
2043, value of $1,218) | | | | |
| | 1,194 | | | 0.11%, 6/30/2014 | | | 1,194 | |
| | | | | UBS Securities Repurchase Agreement (maturing
on 07/01/2014 in the amount of $5, collateralized
by U.S. Treasury Note 2.13%, 2020, value of $5) | | | | | | | | |
| | 5 | | | 0.05%, 6/30/2014 | | | | | | | 5 | |
| | | | | | | | | | | | 3,167 | |
| | | | | Total Short-Term Investments | | | | | | | | |
| | | | | (Cost $3,167) | | | | | | $ | 3,167 | |
| | | | | | | | | | | | | |
| | | | | Total Investments | | | | | | | | |
| | | | | (Cost $442,022) ▲ | | | 98.6 | % | | $ | 647,626 | |
| | | | | Other Assets and Liabilities | | | 1.4 | % | | | 9,501 | |
| | | | | Total Net Assets | | | 100.0 | % | | $ | 657,127 | |
The accompanying notes are an integral part of these financial statements.
| Hartford Value HLS Fund |
| Schedule of Investments – (continued) |
| June 30, 2014 (Unaudited) |
(000’s Omitted) |
| Note: | Percentage of investments as shown is the ratio of the total market value to total net assets. |
| | |
| | Prices of foreign equities that are principally traded on certain foreign markets may be adjusted daily pursuant to a fair value pricing service approved by the Board of Directors in order to reflect an adjustment for factors occurring after the close of certain foreign markets but before the close of the New York Stock Exchange. |
| ▲ | At June 30, 2014, the cost of securities for federal income tax purposes was $446,533 and the aggregate gross unrealized appreciation and depreciation based on that cost were: |
| Unrealized Appreciation | | $ | 207,682 | |
| Unrealized Depreciation | | | (6,589 | ) |
| Net Unrealized Appreciation | | $ | 201,093 | |
| † | These securities are valued in good faith at fair value as determined under policies and procedures established by and under the supervision of the Board of Directors. At June 30, 2014, the aggregate value of these securities was $16, which rounds to zero percent of total net assets. This amount excludes securities that are principally traded in certain foreign markets and whose prices are adjusted pursuant to a third party pricing service methodology approved by the Board of Directors. |
| ■ | Securities issued within terms of a private placement memorandum, exempt from registration under Rule 144A under the Securities Act of 1933, as amended, and may be sold only to qualified institutional buyers. Unless otherwise indicated, these holdings are determined to be liquid. At June 30, 2014, the aggregate value of these securities was $16, which rounds to zero percent of total net assets. |
| ⌂ | The following securities are considered illiquid. Illiquid securities are often purchased in private placement transactions, are often not registered under the Securities Act of 1933, as amended, and may have contractual restrictions on resale. A security may also be considered illiquid if the security lacks a readily available market or if its valuation has not changed for a certain period of time. |
| Period Acquired | | Shares/ Par | | Security | | Cost Basis | |
| 03/2007 | | 230 | | Solar Cayman Ltd. - 144A | | $ | 67 | |
At June 30, 2014, the aggregate value of these securities was $16, which rounds to zero percent of total net assets.
| ╪ | See Significant Accounting Policies of accompanying Notes to Financial Statements regarding valuation of securities. |
| GLOSSARY: (abbreviations used in preceding Schedule of Investments) |
| |
| Other Abbreviations: |
| ADR | American Depositary Receipt |
| FHLMC | Federal Home Loan Mortgage Corp. |
| FNMA | Federal National Mortgage Association |
| GNMA | Government National Mortgage Association |
| REIT | Real Estate Investment Trust |
The accompanying notes are an integral part of these financial statements.
| Hartford Value HLS Fund |
| Investment Valuation Hierarchy Level Summary |
| June 30, 2014 (Unaudited) |
(000’s Omitted) |
| | | Total | | | Level 1 ♦ | | | Level 2 ♦ | | | Level 3 | |
| Assets: | | | | | | | | | | | | | | | | |
| Common Stocks ‡ | | $ | 644,459 | | | $ | 635,171 | | | $ | 9,272 | | | $ | 16 | |
| Short-Term Investments | | | 3,167 | | | | – | | | | 3,167 | | | | – | |
| Total | | $ | 647,626 | | | $ | 635,171 | | | $ | 12,439 | | | $ | 16 | |
| ♦ | For the six-month period ended June 30, 2014, there were no transfers between Level 1 and Level 2. |
| ‡ | The Fund has all or primarily all of the equity securities categorized in a particular level. Refer to the Schedule of Investments for further industry breakout. |
Following is a reconciliation of Level 3 assets for which significant unobservable inputs were used to determine fair value:
| | | Balance as
of
December
31, 2013 | | | Realized
Gain (Loss) | | | Change in
Unrealized
Appreciation
(Depreciation) | | | Net
Amortization | | | Purchases | | | Sales | | | Transfers
Into
Level 3 | | | Transfers
Out of
Level 3 | | | Balance as
of June 30,
2014 | |
| Assets: | | | | | | | | | | | | | | | | | | | | | | | | | | | | | | | | | | | | |
| Common Stocks | | $ | 16 | | | $ | — | | | $ | — | * | | $ | — | | | $ | — | | | $ | — | | | $ | — | | | $ | — | | | $ | 16 | |
| Total | | $ | 16 | | | $ | — | | | $ | — | | | $ | — | | | $ | — | | | $ | — | | | $ | — | | | $ | — | | | $ | 16 | |
| * | Change in unrealized appreciation (depreciation) in the current period relating to assets still held at June 30, 2014 was zero. |
| Note: | For purposes of reporting transfers between different hierarchy levels, both transfers in and out of each level, as applicable, are shown as if they occurred at the beginning of the period. |
The accompanying notes are an integral part of these financial statements.
| Hartford Value HLS Fund |
| Statement of Assets and Liabilities |
| June 30, 2014 (Unaudited) |
(000’s Omitted) |
| Assets: | | | | |
| Investments in securities, at market value (cost $442,022) | | $ | 647,626 | |
| Cash | | | 1 | |
| Receivables: | | | | |
| Investment securities sold | | | 9,861 | |
| Fund shares sold | | | 24 | |
| Dividends and interest | | | 902 | |
| Other assets | | | — | |
| Total assets | | | 658,414 | |
| Liabilities: | | | | |
| Payables: | | | | |
| Fund shares redeemed | | | 1,139 | |
| Investment management fees | | | 66 | |
| Distribution fees | | | 3 | |
| Accrued expenses | | | 79 | |
| Total liabilities | | | 1,287 | |
| Net assets | | $ | 657,127 | |
| Summary of Net Assets: | | | | |
| Capital stock and paid-in-capital | | $ | 467,015 | |
| Undistributed net investment income | | | 5,289 | |
| Accumulated net realized loss | | | (20,785 | ) |
| Unrealized appreciation of investments and the translations of assets and liabilities denominated in foreign currency | | | 205,608 | |
| Net assets | | $ | 657,127 | |
| Shares authorized | | | 800,000 | |
| Par value | | $ | 0.001 | |
| Class IA: Net asset value per share | | $ | 16.37 | |
| Shares outstanding | | | 33,828 | |
| Net assets | | $ | 553,874 | |
| Class IB: Net asset value per share | | $ | 16.34 | |
| Shares outstanding | | | 6,319 | |
| Net assets | | $ | 103,253 | |
The accompanying notes are an integral part of these financial statements.
| Hartford Value HLS Fund |
| Statement of Operations |
| For the Six-Month Period Ended June 30, 2014 (Unaudited) |
(000’s Omitted) |
| Investment Income: | | | | |
| Dividends | | $ | 7,615 | |
| Interest | | | 1 | |
| Less: Foreign tax withheld | | | (93 | ) |
| Total investment income, net | | | 7,523 | |
| | | | | |
| Expenses: | | | | |
| Investment management fees | | | 2,339 | |
| Transfer agent fees | | | 3 | |
| Distribution fees - Class IB | | | 129 | |
| Custodian fees | | | 2 | |
| Accounting services fees | | | 32 | |
| Board of Directors' fees | | | 9 | |
| Audit fees | | | 10 | |
| Other expenses | | | 52 | |
| Total expenses (before fees paid indirectly) | | | 2,576 | |
| Commission recapture | | | (1 | ) |
| Total fees paid indirectly | | | (1 | ) |
| Total expenses, net | | | 2,575 | |
| Net Investment Income | | | 4,948 | |
| | | | | |
| Net Realized Gain on Investments and Foreign Currency Transactions: | | | | |
| Net realized gain on investments | | | 34,515 | |
| Net realized loss on foreign currency contracts | | | (3 | ) |
| Net realized gain on other foreign currency transactions | | | 5 | |
| Net Realized Gain on Investments and Foreign Currency Transactions | | | 34,517 | |
| | | | | |
| Net Changes in Unrealized Depreciation of Investments and Foreign Currency Transactions: | | | | |
| Net unrealized depreciation of investments | | | (264 | ) |
| Net unrealized appreciation on translation of other assets and liabilities in foreign currencies | | | — | |
| Net Changes in Unrealized Depreciation of Investments and Foreign Currency Transactions | | | (264 | ) |
| Net Gain on Investments and Foreign Currency Transactions | | | 34,253 | |
| Net Increase in Net Assets Resulting from Operations | | $ | 39,201 | |
The accompanying notes are an integral part of these financial statements.
| Hartford Value HLS Fund |
| Statement of Changes in Net Assets |
| |
| (000’s Omitted) |
| | | For the
Six-Month
Period Ended
June 30, 2014
(Unaudited) | | | For the
Year Ended
December 31,
2013 | |
| Operations: | | | | | | | | |
| Net investment income | | $ | 4,948 | | | $ | 11,050 | |
| Net realized gain on investments and foreign currency transactions | | | 34,517 | | | | 76,579 | |
| Net unrealized appreciation (depreciation) of investments | | | (264 | ) | | | 100,302 | |
| Net Increase in Net Assets Resulting from Operations | | | 39,201 | | | | 187,931 | |
| Distributions to Shareholders: | | | | | | | | |
| From net investment income | | | | | | | | |
| Class IA | | | — | | | | (9,100 | ) |
| Class IB | | | — | | | | (1,489 | ) |
| Total distributions | | | — | | | | (10,589 | ) |
| Capital Share Transactions: | | | | | | | | |
| Class IA | | | | | | | | |
| Sold | | | 28,559 | | | | 40,796 | |
| Issued on reinvestment of distributions | | | — | | | | 9,100 | |
| Redeemed | | | (59,078 | ) | | | (196,892 | ) |
| Total capital share transactions | | | (30,519 | ) | | | (146,996 | ) |
| Class IB | | | | | | | | |
| Sold | | | 876 | | | | 13,072 | |
| Issued on reinvestment of distributions | | | — | | | | 1,489 | |
| Redeemed | | | (12,862 | ) | | | (37,142 | ) |
| Total capital share transactions | | | (11,986 | ) | | | (22,581 | ) |
| Net decrease from capital share transactions | | | (42,505 | ) | | | (169,577 | ) |
| Net Increase (Decrease) in Net Assets | | | (3,304 | ) | | | 7,765 | |
| Net Assets: | | | | | | | | |
| Beginning of period | | | 660,431 | | | | 652,666 | |
| End of period | | $ | 657,127 | | | $ | 660,431 | |
| Undistributed (distribution in excess of) net investment income | | $ | 5,289 | | | $ | 341 | |
| Shares: | | | | | | | | |
| Class IA | | | | | | | | |
| Sold | | | 1,817 | | | | 2,970 | |
| Issued on reinvestment of distributions | | | — | | | | 602 | |
| Redeemed | | | (3,811 | ) | | | (14,071 | ) |
| Total share activity | | | (1,994 | ) | | | (10,499 | ) |
| Class IB | | | | | | | | |
| Sold | | | 56 | | | | 945 | |
| Issued on reinvestment of distributions | | | — | | | | 99 | |
| Redeemed | | | (830 | ) | | | (2,682 | ) |
| Total share activity | | | (774 | ) | | | (1,638 | ) |
The accompanying notes are an integral part of these financial statements.
| Hartford Value HLS Fund |
| Notes to Financial Statements |
| June 30, 2014 (Unaudited) |
(000’s Omitted) |
Organization:
Hartford Value HLS Fund (the "Fund") serves as an underlying investment option for certain variable annuity and variable life insurance separate accounts of Hartford Life Insurance Company (“HLIC”) and its affiliates and certain qualified retirement plans. The Fund may also serve as an underlying investment option for certain variable annuity and variable life separate accounts of other insurance companies. Owners of variable annuity contracts and policyholders of variable life insurance contracts may choose the funds permitted in the variable insurance contract prospectus. In addition, participants in certain qualified retirement plans may choose the Fund if permitted by their plans.
Hartford Series Fund, Inc. (the “Company”) is an open-end registered management investment company comprised of twenty-eight portfolios. Financial statements for the Fund, a series of the Company, are included in this report.
The Company is organized under the laws of the State of Maryland and is registered with the Securities and Exchange Commission (“SEC”) under the Investment Company Act of 1940, as amended (“1940 Act”). The Fund is a diversified open-end management investment company.
The Fund is divided into Class IA and Class IB shares. Each class is offered at the per share net asset value (“NAV”) without a sales charge and is subject to the same expenses, except that the Class IB shares are subject to distribution and service fees charged pursuant to a Distribution Plan adopted in accordance with Rule 12b-1 under the 1940 Act.
Significant Accounting Policies:
The following is a summary of significant accounting policies of the Fund in the preparation of its financial statements, which are in accordance with United States Generally Accepted Accounting Principles (“U.S. GAAP”). The preparation of financial statements in accordance with U.S. GAAP may require management to make estimates and assumptions that affect the reported amounts of assets and liabilities and disclosure of contingent assets and liabilities at the date of the financial statements and the reported amounts of increases and decreases in net assets from operations during the reporting period. Actual results could differ from those estimates.
Determination of Net Asset Value – The NAV of each class of the Fund's shares is determined as of the close of regular trading (normally 4:00 p.m. Eastern Time) (the “NYSE Close”) on each day that the New York Stock Exchange (the “Exchange”) is open (“Valuation Date”). Information that becomes known to the Fund after the NAV has been calculated on a particular day will not generally be used to retroactively adjust the NAV determined earlier that day.
Investment Valuation and Fair Value Measurements – For purposes of calculating the NAV, portfolio investments and other assets held by the Fund's portfolio for which market quotes are readily available are valued at market value. Market value is generally determined on the basis of last reported sales prices or official close price. If no sales are reported, market value is based on quotes obtained from a quotation reporting system, established market makers, or independent pricing services. If market prices are not readily available or are deemed unreliable, the Fund will use the fair value of the investment as determined in good faith under policies and procedures established by and under the supervision of the Company's Board of Directors. Market quotes are considered not readily available where there is an absence of current or reliable market-based data (e.g., trade information or indicative market quotes), including where events occur after the close of the relevant market, but prior to the NYSE Close, that materially affect the values of the Fund's portfolio investments or assets. In addition, market quotes are considered not readily available when, due to extraordinary circumstances, the exchanges or markets on which the investments trade do not open for trading for the entire day and no other market prices are available. In addition, prices of foreign equities that are principally traded on certain foreign markets may be adjusted daily pursuant to a fair value pricing service approved by the Board of Directors in order to reflect an adjustment for the factors occurring after the close of certain foreign markets but before the NYSE Close. Investments that are primarily traded on foreign markets may trade on days that are not business days of the Fund. The value of the foreign investments in which the Fund invests may change on days when a shareholder will not be able to purchase or redeem shares of the Fund. Fair value pricing is subjective in nature and the use of fair value pricing by the Fund may cause the NAV of its shares to differ significantly from the NAV that would have been calculated using market prices at the close of the exchange on which a portfolio investment is primarily traded. There can be no assurance that the Fund could obtain the fair market value assigned to an investment if the Fund were to sell the investment at approximately the time at which the Fund determines its NAV.
| Hartford Value HLS Fund |
| Notes to Financial Statements – (continued) |
| June 30, 2014 (Unaudited) |
| (000’s Omitted) |
Investments valued in currencies other than U.S. dollars are converted to U.S. dollars using exchange rates obtained from independent pricing services for calculation of the NAV. As a result, the NAV of the Fund’s shares may be affected by changes in the value of currencies in relation to the U.S. dollar. The value of investments traded in markets outside the United States or denominated in currencies other than the U.S. dollar may be affected significantly on a day that the NYSE is closed and the market value may change on days when an investor is not able to purchase, redeem or exchange shares of the Fund.
Foreign currency contracts represent agreements to exchange currencies on specific future dates at predetermined rates. Foreign currency contracts are valued using foreign currency exchange rates and forward rates as provided by an independent pricing service on the Valuation Date.
Financial instruments for which prices are not available from an independent pricing service may be valued using market quotations obtained from one or more dealers that make markets in the respective financial instrument in accordance with procedures established by the Company's Board of Directors.
U.S. GAAP defines fair value as the price that the Fund would receive to sell an asset or pay to transfer a liability in an orderly transaction between market participants. The U.S. GAAP fair value measurement standards require disclosure of a fair value hierarchy for each major category of assets and liabilities. Various inputs are used in determining the fair value of the Fund’s investments. These inputs are summarized into three broad hierarchy levels. This hierarchy is based on whether the valuation inputs are observable or unobservable. These levels are:
Level 1 – Quoted prices in active markets for identical investments. Level 1 may include exchange traded instruments, such as domestic equities, some foreign equities, options, futures, mutual funds, exchange traded funds, rights and warrants.
Level 2 – Observable inputs other than Level 1 prices, such as quoted prices for similar investments; quoted prices in markets that are not active; or other inputs that are observable or can be corroborated by observable market data. Level 2 may include debt investments that are traded less frequently than exchange traded instruments and which are valued using independent pricing services; foreign equities, which are principally traded on certain foreign markets and are adjusted daily pursuant to a fair value pricing service in order to reflect an adjustment for the factors occurring after the close of certain foreign markets but before the NYSE Close; senior floating rate interests, which are valued using an aggregate of dealer bids; short-term investments, which are valued at amortized cost; and swaps, which are valued based upon the terms of each swap contract.
Level 3 – Significant unobservable inputs that are supported by limited or no market activity. Level 3 may include financial instruments whose values are determined using indicative market quotes or require significant management judgment or estimation. These unobservable valuation inputs may include estimates for current yields, maturity/duration, prepayment speed, and indicative market quotes for comparable investments along with other assumptions relating to credit quality, collateral value, complexity of the investment structure, general market conditions and liquidity. This category may include investments where trading has been halted or there are certain restrictions on trading. While these investments are priced using unobservable inputs, the valuation of these investments reflects the best available data and management believes the prices are a reasonable representation of exit price.
The Board of Directors of the Company generally reviews and approves the “Procedures for Valuation of Portfolio Securities” at least once a year. These procedures define how investments are to be valued, including the formation and activities of a Valuation Committee. The Valuation Committee is responsible for determining in good faith the fair value of investments when the value cannot be obtained from primary pricing services or alternative sources or if the valuation of an investment as provided by the primary pricing service or alternative source is believed not to reflect the investment’s fair value as of the Valuation Date. Voting members of the Valuation Committee include the Fund's Treasurer or designee and a Vice President of the investment manager or designee. An Assistant Vice President of the Fund with legal expertise or designee is also included on the Valuation Committee as a non-voting advisory member. In addition, the Fund’s Chief Compliance Officer shall designate a member of the compliance group to attend Valuation Committee meetings as a non-voting resource, to monitor for and provide guidance with respect to compliance with these procedures. Two members of the Valuation Committee or their designees, representing different departments, shall constitute a quorum for purposes of permitting the Valuation Committee to take action. The Valuation Committee will consider all relevant factors in determining an investment’s fair value, and may seek the advice of the Fund’s sub-
| Hartford Value HLS Fund |
| Notes to Financial Statements – (continued) |
| June 30, 2014 (Unaudited) |
| (000’s Omitted) |
adviser, knowledgeable brokers, and legal counsel in making such determination. The Valuation Committee reports to the Audit Committee of the Company's Board of Directors. The Audit Committee receives quarterly written reports which include details of all fair-valued investments, including the reason for the fair valuation, and an indication, when possible, of the accuracy of the valuation by disclosing the next available reliable public price quotation or the disposition price of such investments (the “look-back” test). The Board of Directors then must consider for ratification all of the fair value determinations made during the previous quarter.
Valuation levels are not necessarily indicative of the risk associated with investing in such investments. Individual investments within any of the above mentioned asset classes may be assigned a different hierarchical level than those presented above, as individual circumstances dictate.
For additional information, refer to the Investment Valuation Hierarchy Level Summary and the Level 3 roll-forward reconciliation, if applicable, which follow the Schedule of Investments.
Investment Transactions and Investment Income – Investment transactions are recorded as of the trade date (the date the order to buy or sell is executed) for financial reporting purposes. Investments purchased or sold on a when-issued or delayed-delivery basis may be settled a month or more after the trade date. Realized gains and losses are determined on the basis of identified cost.
Dividend income from domestic securities is accrued on the ex-dividend date. In general, dividend income from foreign securities is recorded on the ex-date; however, dividend notifications in certain foreign jurisdictions may not be available in a timely manner and as a result, the Fund will record the dividend as soon as the relevant details (i.e., rate per share, payment date, shareholders of record, etc.) are publicly available. Interest income, including amortization of premium, accretion of discounts and additional principal received in-kind in lieu of cash, is accrued on a daily basis.
Foreign Currency Transactions – Assets and liabilities denominated in currencies other than U.S. dollars are translated into U.S. dollars at the exchange rates in effect on the valuation date. Purchases and sales of investments, income and expenses are translated into U.S. dollars at the exchange rates on the dates of such transactions.
The Fund does not isolate that portion of portfolio investment valuation resulting from fluctuations in the foreign currency exchange rates from the fluctuations arising from changes in the market prices of investments held. Exchange rate fluctuations are included with the net realized and unrealized gain or loss on investments in the accompanying financial statements.
Net realized foreign exchange gains or losses arise from sales of foreign currencies and the difference between asset and liability amounts initially stated in foreign currencies and the U.S. dollar value of the amounts actually received or paid. Net unrealized foreign exchange gains or losses arise from changes in the value of other assets and liabilities at the end of the reporting period, resulting from changes in the exchange rates.
Joint Trading Account – The Fund may invest cash balances into a joint trading account that may be invested in one or more repurchase agreements.
Fund Share Valuation and Dividend Distributions to Shareholders – Orders for the Fund’s shares are executed in accordance with the investment instructions of the contract holders and plan participants. The NAV of the Fund’s shares is determined as of the close of business on each business day of the Exchange. The NAV is determined separately for each class of shares of the Fund by dividing the Fund’s net assets attributable to that class by the number of shares of the class outstanding. Each class of shares offered by the Fund has equal rights as to assets and voting privileges (except that shareholders of a class have exclusive voting rights regarding any matter relating solely to that class of shares). Income and non-class specific expenses are allocated daily to each class on the basis of the relative net assets of the class. Realized and unrealized gains and losses are allocated daily based on the relative net assets of each class of shares of the Fund.
Orders for the purchase of the Fund’s shares received prior to the close of the Exchange on any day the Exchange is open for business are priced at the NAV determined as of the close of the Exchange. Orders received after the close of the Exchange, or on a day on which the Exchange and/or the Fund is not open for business, are priced at the next determined NAV.
| Hartford Value HLS Fund |
| Notes to Financial Statements – (continued) |
| June 30, 2014 (Unaudited) |
| (000’s Omitted) |
Dividends are declared pursuant to a policy adopted by the Company's Board of Directors based upon the investment performance of the Fund. The policy of the Fund is to pay dividends from net investment income and realized gains, if any, at least once a year.
Distributions from net investment income, net realized gains and capital are determined in accordance with federal income tax regulations, which may differ from U.S. GAAP with respect to character and timing. These differences may include, but are not limited to, losses deferred due to wash sale adjustments, foreign currency gains and losses, adjustments related to Passive Foreign Investment Companies ("PFICs"), Real Estate Investment Trusts ("REITs"), Regulated Investment Companies ("RICs"), certain derivatives and partnerships. Permanent book and federal income tax basis differences relating to shareholder distributions will result in reclassifications to certain of the Fund’s capital accounts (see Federal Income Taxes: Reclassification of Capital Accounts note).
Securities and Other Investments:
Repurchase Agreements – A repurchase agreement is an agreement by which a counterparty agrees to sell an investment and agrees to repurchase the investment sold from the buyer at a mutually agreed upon time and price. During the period of the repurchase agreement, the counterparty will deposit cash and or securities in a third party custodial account to serve as collateral. At the time the Fund enters into a repurchase agreement, the value of the underlying collateral, including accrued interest, will be equal to or exceed the value of the repurchase agreement. Repurchase agreements expose the Fund to counterparty risk - that is, the risk that the counterparty will not fulfill its obligations. To minimize counterparty risk, the investments that serve to collateralize the repurchase agreement are held by the Fund’s custodian in book entry or physical form in the custodial account of the Fund or in a third party custodial account. Repurchase agreements are valued at cost plus accrued interest, which approximates fair value. Repurchase agreements have master netting arrangements which allow the Fund to offset amounts owed to a counterparty with amounts owed by the counterparty, including any collateral. Upon an event of default under a master repurchase agreement, the non-defaulting party may close out all transactions traded under such agreement and net amounts owed under each transaction to one net amount payable by one party to the other. Absent an event of default, the master repurchase agreement does not result in an offset of reported amounts of assets and liabilities in the Statement of Assets and Liabilities across transactions between the Fund and the applicable counterparty. The Fund, as shown on the Schedule of Investments, had outstanding repurchase agreements and related collateral as of June 30, 2014.
Illiquid and Restricted Investments – The Fund is permitted to invest up to 15% of its net assets in illiquid investments. Illiquid investments are those that may not be sold or disposed of in the ordinary course of business within seven days, at approximately the price used to determine the Fund’s NAV. The Fund may not be able to sell illiquid investments when its sub-adviser considers it desirable to do so or may have to sell such investments at a price that is lower than the price that could be obtained if the investments were more liquid. A sale of illiquid investments may require more time and may result in higher dealer discounts and other selling expenses than does the sale of those that are liquid. Illiquid investments also may be more difficult to value due to the unavailability of reliable market quotations for such investments, and an investment in them may have an adverse impact on the Fund’s NAV. The Fund may also purchase certain restricted investments that can only be resold to certain qualified investors and may be determined to be liquid pursuant to policies and guidelines established by the Company's Board of Directors. The Fund, as shown on the Schedule of Investments, had illiquid or restricted investments as of June 30, 2014.
Investments Purchased on a When-Issued or Delayed-Delivery Basis – Delivery and payment for investments that have been purchased by the Fund on a forward commitment, or when-issued or delayed-delivery basis, take place beyond the customary settlement period. The Fund may dispose of or renegotiate a delayed-delivery transaction after it is entered into, and may sell delayed-delivery investments before they are delivered, which may result in a realized gain or loss. During this period, such investments are subject to market fluctuations, and the Fund identifies investments segregated in its records with a value at least equal to the amount of the commitment. The Fund had no when-issued or delayed-delivery investments as of June 30, 2014.
Financial Derivative Instruments:
The following disclosures contain information on how and why the Fund uses derivative instruments, the credit-risk-related contingent features in certain derivative instruments, and how derivative instruments affect the Fund’s financial position and results of operations. The location and fair value amounts of these instruments on the Statement of Assets and Liabilities and the realized gains and losses and changes in unrealized gains and losses on the Statement of Operations, each categorized by type of derivative contract, are included in
| Hartford Value HLS Fund |
| Notes to Financial Statements – (continued) |
| June 30, 2014 (Unaudited) |
| (000’s Omitted) |
the following Additional Derivative Instrument Information footnote. The derivative instruments outstanding as of period-end are disclosed in the notes to or within the Schedule of Investments for purchased options, if applicable. The amounts of realized gains and losses and changes in unrealized gains and losses on derivative instruments during the period are disclosed in the Statement of Operations.
Foreign Currency Contracts – The Fund may enter into foreign currency contracts that obligate the Fund to purchase or sell currencies at specified future dates. Foreign currency contracts are used to hedge the currency exposure associated with some or all of the Fund’s investments and/or as part of an investment strategy. Foreign currency contracts are marked to market daily and the change in value is recorded by the Fund as an unrealized gain or loss. The Fund will record a realized gain or loss when the foreign currency contract is settled.
Foreign currency contracts involve elements of market risk in excess of the amounts reflected in the Statement of Assets and Liabilities. In addition, risks may arise upon entering into these contracts from the potential inability of the counterparties to meet the terms of the contracts and from unanticipated movements in the value of the foreign currencies relative to the U.S. dollar. The Fund had no outstanding foreign currency contracts as of June 30, 2014.
Additional Derivative Instrument Information:
The volume of derivative activity was minimal during the six-month period ended June 30, 2014.
The Effect of Derivative Instruments on the Statement of Operations for the six-month period ended June 30, 2014:
| | | Risk Exposure Category | |
| | | Interest
Rate
Contracts | | | Foreign
Exchange
Contracts | | | Credit
Contracts | | | Equity
Contracts | | | Commodity
Contracts | | | Other
Contracts | | | Total | |
| Realized Loss on Derivatives Recognized as a Result of Operations: |
| Net realized loss on foreign currency contracts | | $ | — | | | $ | (3 | ) | | $ | — | | | $ | — | | | $ | — | | | $ | — | | | $ | (3 | ) |
| Total | | $ | — | | | $ | (3 | ) | | $ | — | | | $ | — | | | $ | — | | | $ | — | | | $ | (3 | ) |
Principal Risks:
The Fund may be exposed to counterparty risk, or the risk that an institution or other entity with which the Fund has unsettled or open transactions will default.
If the Fund invests directly in foreign currencies or in securities that trade in, and receive revenues in, foreign currencies, or in derivatives that provide exposure to foreign currencies, it will be subject to the risk that those currencies will decline in value relative to the base currency (U.S. dollars) of the Fund, or, in the case of hedging positions, that the Fund’s base currency will decline in value relative to the currency being hedged. Currency rates in foreign countries may fluctuate significantly over short periods of time for a number of reasons, including changes in interest rates, intervention (or the failure to intervene) by U.S. or foreign governments, central banks or supranational entities, such as the International Monetary Fund, or by the imposition of currency controls or other political developments in the United States or abroad. As a result, the Fund’s investments in foreign currency denominated securities may reduce the returns of the Fund. The market values of equity securities, such as common stocks and preferred stocks, or equity related investments, such as futures and options, may decline due to general market conditions which are not specifically related to a particular company, such as real or perceived adverse economic conditions, changes in the general outlook for corporate earnings, changes in interest or currency rates or adverse investor sentiment generally. The market value of equity securities may also decline due to factors which affect a particular industry or industries, such as labor shortages or increased production costs and competitive conditions within an industry. Equity securities and equity related investments generally have greater market price volatility than fixed income securities.
Federal Income Taxes:
Federal Income Taxes – For federal income tax purposes, the Fund intends to continue to qualify as a RIC under Subchapter M of the Internal Revenue Code (“IRC”) by distributing substantially all of its taxable net investment income and net realized capital gains to its shareholders and otherwise complying with the requirements of the IRC. The Fund has distributed substantially all of its income
| Hartford Value HLS Fund |
| Notes to Financial Statements – (continued) |
| June 30, 2014 (Unaudited) |
| (000’s Omitted) |
and capital gains in prior years, if applicable, and intends to distribute substantially all of its income and capital gains prior to the next fiscal year-end. Accordingly, no provision for federal income or excise taxes has been made in the accompanying financial statements. Distributions from short-term capital gains are treated as ordinary income distributions for federal income tax purposes.
Net Investment Income (Loss), Net Realized Gains (Losses) and Distributions – Net investment income (loss) and net realized gains (losses) may differ for financial statement and tax purposes primarily because of losses deferred due to wash sale adjustments, foreign currency gains and losses, adjustments related to PFICs, REITs, RICs, certain derivatives and partnerships. The character of distributions made during the year from net investment income or net realized gains may differ from their ultimate characterization for federal income tax purposes. Also, due to the timing of dividend distributions, the fiscal year in which amounts are distributed may differ from the year that the income or realized gains (losses) were recorded by the Fund.
Distributions and Components of Distributable Earnings – The tax character of distributions paid by the Fund for the periods indicated is as follows (as adjusted for dividends payable, if applicable):
| | | For the Year Ended
December 31, 2013 | | | For the Year Ended
December 31, 2012 | |
| Ordinary Income | | $ | 10,589 | | | $ | 14,517 | |
As of December 31, 2013, the Fund’s components of distributable earnings (deficit) on a tax basis are as follows:
| | | Amount | |
| Undistributed Ordinary Income | | $ | 341 | |
| Accumulated Capital and Other Losses* | | | (50,791 | ) |
| Unrealized Appreciation† | | | 201,361 | |
| Total Accumulated Earnings | | $ | 150,911 | |
| * | The Fund has capital loss carryforwards that are identified in the Capital Loss Carryforward note that follows. |
| † | Differences between book-basis and tax-basis unrealized appreciation (depreciation) may be attributable to the losses deferred due to wash sale adjustments, foreign currency gains and losses, adjustments related to PFICs, REITs, RICs, certain derivatives and partnerships. |
Reclassification of Capital Accounts – The Fund may record reclassifications in its capital accounts. These reclassifications have no impact on the total net assets of the Fund. The reclassifications are a result of permanent differences between U.S. GAAP and tax accounting for such items as foreign currency, PFICs, expiration or utilization of capital loss carryforwards or net operating losses. Adjustments are made to reflect the impact these items have on current and future distributions to shareholders. Therefore, the source of the Fund’s distributions may be shown in the accompanying Statement of Changes in Net Assets as from undistributed net investment income, from accumulated net realized gains on investments or from capital depending on the type of book and tax differences that exist. For the year ended December 31, 2013, the Fund recorded reclassifications to increase (decrease) the accounts listed below:
| | | Amount | |
| Undistributed Net Investment Income (Loss) | | $ | (120 | ) |
| Accumulated Net Realized Gain (Loss) | | | 129 | |
| Capital Stock and Paid-in-Capital | | | (9 | ) |
Capital Loss Carryforward – On December 22, 2010, the Regulated Investment Company Modernization Act of 2010 (the “Act”) was enacted, which made changes to the capital loss carryforward rules. The changes are effective for taxable years beginning after the date of enactment. Under the Act, funds are permitted to carry forward capital losses for an unlimited period. However, any losses incurred during those future taxable years will be required to be utilized prior to the losses incurred in pre-enactment taxable years, which carry an expiration date. As a result of this ordering rule, pre-enactment capital loss carryforwards may be more likely to expire unused. Additionally, post-enactment capital loss carryforwards retain their character as either short-term or long-term capital losses rather than being considered all short-term as permitted under prior regulation.
| Hartford Value HLS Fund |
| Notes to Financial Statements – (continued) |
| June 30, 2014 (Unaudited) |
| (000’s Omitted) |
At December 31, 2013 (tax year end), the Fund had capital loss carryforwards for U.S. federal income tax purposes as follows:
| Year of Expiration | | Amount | |
| 2016 | | $ | 6,782 | |
| 2017 | | | 44,009 | |
| Total | | $ | 50,791 | |
During the year ended December 31, 2013, the Fund utilized $75,456 of prior year capital loss carryforwards.
Accounting for Uncertainty in Income Taxes – The Fund has adopted financial reporting rules that require the Fund to analyze all open tax years, as defined by the statute of limitations, for all major jurisdictions. Generally, tax authorities can examine all tax returns filed for the last three years. The Fund does not have an examination in progress.
The Fund has reviewed all open tax years and major jurisdictions and concluded that these financial reporting rules had no effect on the Fund’s financial position or results of operations. There is no tax liability resulting from unrecognized tax benefits relating to uncertain income tax positions taken or expected to be taken on the tax return for the fiscal year ended December 31, 2013. The Fund is also not aware of any tax positions for which it is reasonably possible that the total amounts of unrecognized tax benefits will significantly change in the next twelve months.
Expenses:
Investment Management Agreement – Hartford Funds Management Company, LLC ("HFMC") serves as the Fund’s investment manager pursuant to an Investment Management Agreement with the Company. HFMC is an indirect wholly owned subsidiary of The Hartford Financial Services Group, Inc. ("The Hartford"). The investment manager has overall investment supervisory responsibility for the Fund. In addition, the investment manager provides administrative personnel, services, equipment, facilities and office space for proper operation of the Fund. HFMC has contracted with Wellington Management Company, LLP ("Wellington Management") under a sub-advisory agreement for the provision of day-to-day investment management services to the Fund in accordance with the Fund’s investment objective and policies. The Fund pays a fee to the investment manager, a portion of which may be used to compensate Wellington Management.
The schedule below reflects the rates of compensation paid to the investment manager for investment management services rendered as of June 30, 2014; the rates are accrued daily and paid monthly:
| Average Daily Net Assets | | Annual Fee | |
| On first $250 million | | | 0.7750% | |
| On next $250 million | | | 0.7250% | |
| On next $500 million | | | 0.6750% | |
| On next $1.5 billion | | | 0.6250% | |
| On next $2.5 billion | | | 0.6200% | |
| On next $5 billion | | | 0.6150% | |
| Over $10 billion | | | 0.6100% | |
Accounting Services Agreement – Pursuant to the Fund Accounting Agreement between HFMC and the Company, on behalf of the Fund, HFMC provides accounting services to the Fund and receives monthly compensation based on the Fund’s average daily net assets at the rates set forth below. The Fund’s accounting services fees are accrued daily and paid monthly.
| Average Daily Net Assets | | Annual Fee | |
| All Assets | | | 0.010% | |
| Hartford Value HLS Fund |
| Notes to Financial Statements – (continued) |
| June 30, 2014 (Unaudited) |
| (000’s Omitted) |
Operating Expenses – Allocable expenses incurred by the Company are allocated to each Fund and allocated to classes within a Fund in proportion to the average daily net assets of the Fund and each class, except where allocation of certain expenses is more fairly made directly to the Fund or to specific classes within a Fund.
Fees Paid Indirectly – The Company, on behalf of the Fund, has entered into agreements with State Street Global Markets, LLC and Russell Implementation Services, Inc. to partially recapture non-discounted trade commissions. Such rebates are used to pay a portion of the Fund's expenses. For the six-month period ended June 30, 2014, this amount, if any, is included in the Statement of Operations.
The ratio of expenses to average net assets in the accompanying financial highlights excludes the reduction in expenses related to fees paid indirectly. The annualized expense ratio after waivers for the period listed below reflecting the reduction for fees paid indirectly is as follows:
| | | Annualized Six-
Month Period Ended
June 30, 2014 | |
| Class IA | | | 0.77% | |
| Class IB | | | 1.02 | |
Distribution Plan for Class IB Shares – Hartford Funds Distributors, LLC (“HFD”), an indirect wholly owned subsidiary of The Hartford, is the principal underwriter and distributor of the Fund. The Company, on behalf of the Fund, has adopted a Distribution Plan pursuant to Rule 12b-1 of the 1940 Act for Class IB shares.
The Distribution Plan provides that the Fund may pay annually up to 0.25% of the average daily net assets of the Fund attributable to its Class IB shares for activities primarily intended to result in the sale of Class IB shares. The Board has the authority to suspend or reduce these payments at any point in time. Under the terms of the Distribution Plan and the principal underwriting agreement, the Fund is authorized to make payments monthly to the distributor that may be used to pay or reimburse entities providing distribution and shareholder servicing with respect to the Class IB shares for such entities’ fees or expenses incurred or paid in that regard. The distribution fee paid during the period can be found on the Statement of Operations. These fees are accrued daily and paid monthly.
Other Related Party Transactions – Hartford Administrative Services Company (“HASCO”), an indirect wholly owned subsidiary of The Hartford, provides transfer agent services to the Fund. HASCO was compensated on a per account basis for providing such services. The amount paid to HASCO can be found in the Statement of Operations. These fees are accrued daily and paid monthly.
Payment from Affiliate – In July of 2007, The Hartford entered into a settlement with the Attorneys General of the states of New York, Connecticut and Illinois relating to market timing and the company's individual variable annuity contracts in which certain payments would be made directly to the variable annuity contract holders. The distribution plan provided that unclaimed money from the settlement would be distributed to certain HLS Funds that are investment options through a Hartford individual variable annuity contract. The unclaimed money was distributed to the Fund on September 18, 2009.
The total return in the accompanying financial highlights includes a payment from an affiliate. Had the payment from the affiliate been excluded, the impact and total return for the period listed below would have been as follows:
| | | For the Year Ended December 31, 2009 | |
| | | Class IA | | | Class IB | |
| Impact from Payment from Affiliate for Attorneys General Settlement | | | —% | | | | —% | |
| Total Return Excluding Payment from Affiliate | | | 24.37% | | | | 24.05% | |
| Hartford Value HLS Fund |
| Notes to Financial Statements – (continued) |
| June 30, 2014 (Unaudited) |
| (000’s Omitted) |
Investment Transactions:
For the six-month period ended June 30, 2014, the cost of purchases and proceeds from sales of investment securities (excluding short-term investments) were as follows:
| | | Excluding U.S.
Government
Obligations | | | U.S.
Government
Obligations | | | Total | |
| Cost of Purchases | | $ | 64,769 | | | $ | — | | | $ | 64,769 | |
| Sales Proceeds | | | 111,449 | | | | — | | | | 111,449 | |
Line of Credit:
The Fund is one of several Hartford Funds that participate in a $500 million committed revolving line of credit facility. The facility is to be used for temporary or emergency purposes. Under the arrangement, the funds are required to own securities having a market value in excess of 300% of the total bank borrowings. The interest rate on borrowings varies depending on the nature of the loan. The facility also requires a fee to be paid based on the amount of the commitment. This commitment fee is allocated to all the funds participating in the line of credit based on the average net assets of the funds. During the six-month period ended June 30, 2014, the Fund did not have any borrowings under this facility.
Industry Classifications:
Other than the industry classifications "Other Investment Pools and Funds" and "Exchange Traded Funds," equity industry classifications used in this report are the Global Industry Classification Standard, which was developed by and is the exclusive property and service mark of MSCI, Inc. and Standard & Poor's.
Indemnifications:
Under the Company's organizational documents, the Company shall indemnify its officers and directors to the full extent required or permitted under Maryland General Corporation Law and the federal securities laws. In addition, the Company, on behalf of the Fund, may enter into contracts that contain a variety of indemnifications. The Company's maximum exposure under these arrangements is unknown. However, as of the date of these financial statements, the Company has not had prior claims or losses pursuant to these contracts and expects the risk of loss to be remote.
Pending Legal Proceedings:
On February 25, 2011, Jennifer L. Kasilag, Louis Mellinger, Judith M. Menendez, Jacqueline M. Robinson, and Linda A. Russell filed a derivative lawsuit against Hartford Investment Financial Services, LLC (“HIFSCO”) (now known as Hartford Funds Distributors, LLC) on behalf of six Hartford retail mutual funds in the United States District Court for the District of New Jersey, alleging that HIFSCO received excessive advisory and distribution fees in violation of its statutory fiduciary duty under Section 36(b) of the 1940 Act when serving as investment manager and principal underwriter, respectively, to the Hartford retail mutual funds. Although this action was purportedly filed on behalf of certain of the Hartford Funds, none of the Hartford Funds is itself a defendant to the suit. HIFSCO moved to dismiss and, in September 2011, the motion was granted in part and denied in part, with leave to amend the complaint. In November 2011, plaintiffs filed an amended complaint on behalf of certain Hartford retail mutual funds, The Hartford Global Health Fund (now known as The Hartford Healthcare Fund), The Hartford Conservative Allocation Fund, The Hartford Growth Opportunities Fund, The Hartford Inflation Plus Fund, The Hartford Advisers Fund (now known as The Hartford Balanced Fund), and The Hartford Capital Appreciation Fund. Plaintiffs seek to rescind the investment management agreements and distribution plans between HIFSCO and these funds and to recover the total fees charged thereunder or, in the alternative, to recover any improper compensation HIFSCO received, in addition to lost earnings. HIFSCO filed a partial motion to dismiss the amended complaint and, in December 2012, the court dismissed without prejudice the claims regarding distribution fees and denied the motion with respect to the advisory fees claims. HIFSCO disputes the allegations and intends to defend vigorously.
| Hartford Value HLS Fund |
| Notes to Financial Statements – (continued) |
| June 30, 2014 (Unaudited) |
| (000’s Omitted) |
In March 2014, the plaintiffs filed a new complaint that added as new plaintiffs The Hartford Floating Rate Fund and The Hartford Small Company Fund and named as a defendant Hartford Funds Management Company, LLC (the “Investment Manager”), which assumed the role as investment adviser to the funds as of January 2013. The Investment Manager and HIFSCO dispute the allegations and intend to defend vigorously.
This action concerns the activities of HIFSCO in its capacity as investment manager and principal underwriter to the Hartford retail mutual funds and does not concern HIFSCO’s activities in its capacity as principal underwriter to the HLS funds. For this reason, no accrual for litigation relating to this matter has been recorded in the financial statements of the Fund.
| Hartford Value HLS Fund |
Financial Highlights |
| | | ─ Selected Per-Share Data(A) ─ | | | ─ Ratios and Supplemental Data ─ | |
Class | | Net Asset
Value at
Beginning
of Period | | | Net
Investment
Income
(Loss) | | | Net
Realized
and
Unrealized
Gain (Loss)
on
Investments | | | Total from
Investment
Operations | | | Dividends
from Net
Investment
Income | | | Distributions
from
Realized
Capital
Gains | | | Total
Dividends
and
Distributions | | | Net
Asset
Value at
End of
Period | | | Total
Return(B) | | | Net
Assets
at End of
Period
(000s) | | | Ratio of
Expenses
to
Average
Net
Assets
Before
Adjust-
ments(C) | | | Ratio of
Expenses
to
Average
Net
Assets
After
Adjust-
ments(C) | | | Ratio of
Net
Investment
Income
(Loss) to
Average
Net Assets | |
| For the Six-Month Period Ended June 30, 2014 (Unaudited) |
| IA | | $ | 15.39 | | | $ | 0.12 | | | $ | 0.86 | | | $ | 0.98 | | | $ | – | | | $ | – | | | $ | – | | | $ | 16.37 | | | | 6.37 | %(D) | | $ | 553,874 | | | | 0.77 | %(E) | | | 0.77 | %(E) | | | 1.59 | %(E) |
| IB | | | 15.38 | | | | 0.10 | | | | 0.86 | | | | 0.96 | | | | – | | | | – | | | | – | | | | 16.34 | | | | 6.24 | (D) | | | 103,253 | | | | 1.02 | (E) | | | 1.02 | (E) | | | 1.35 | (E) |
| | | | | | | | | | | | | | | | | | | | | | | | | | | | | | | | | | | | | | | | | | | | | | | | | | | | | |
| For the Year Ended December 31, 2013 |
| IA | | $ | 11.86 | | | $ | 0.23 | | | $ | 3.55 | | | $ | 3.78 | | | $ | (0.25 | ) | | $ | – | | | $ | (0.25 | ) | | $ | 15.39 | | | | 31.94 | % | | $ | 551,350 | | | | 0.76 | % | | | 0.76 | % | | | 1.66 | % |
| IB | | | 11.85 | | | | 0.20 | | | | 3.54 | | | | 3.74 | | | | (0.21 | ) | | | – | | | | (0.21 | ) | | | 15.38 | | | | 31.65 | | | | 109,081 | | | | 1.01 | | | | 1.01 | | | | 1.41 | |
| | | | | | | | | | | | | | | | | | | | | | | | | | | | | | | | | | | | | | | | | | | | | | | | | | | | | |
| For the Year Ended December 31, 2012 (F) |
| IA | | $ | 10.37 | | | $ | 0.26 | | | $ | 1.50 | | | $ | 1.76 | | | $ | (0.27 | ) | | $ | – | | | $ | (0.27 | ) | | $ | 11.86 | | | | 16.99 | % | | $ | 549,228 | | | | 0.76 | % | | | 0.76 | % | | | 2.02 | % |
| IB | | | 10.36 | | | | 0.23 | | | | 1.50 | | | | 1.73 | | | | (0.24 | ) | | | – | | | | (0.24 | ) | | | 11.85 | | | | 16.69 | | | | 103,438 | | | | 1.01 | | | | 1.01 | | | | 1.77 | |
| | | | | | | | | | | | | | | | | | | | | | | | | | | | | | | | | | | | | | | | | | | | | | | | | | | | | |
| For the Year Ended December 31, 2011 (F) |
| IA | | $ | 10.77 | | | $ | 0.20 | | | $ | (0.41 | ) | | $ | (0.21 | ) | | $ | (0.19 | ) | | $ | – | | | $ | (0.19 | ) | | $ | 10.37 | | | | (1.96 | )% | | $ | 591,278 | | | | 0.75 | % | | | 0.75 | % | | | 1.65 | % |
| IB | | | 10.76 | | | | 0.17 | | | | (0.41 | ) | | | (0.24 | ) | | | (0.16 | ) | | | – | | | | (0.16 | ) | | | 10.36 | | | | (2.20 | ) | | | 111,486 | | | | 1.00 | | | | 1.00 | | | | 1.40 | |
| | | | | | | | | | | | | | | | | | | | | | | | | | | | | | | | | | | | | | | | | | | | | | | | | | | | | |
| For the Year Ended December 31, 2010 |
| IA | | $ | 9.50 | | | $ | 0.13 | | | $ | 1.26 | | | $ | 1.39 | | | $ | (0.12 | ) | | $ | – | | | $ | (0.12 | ) | | $ | 10.77 | | | | 14.67 | % | | $ | 741,230 | | | | 0.78 | % | | | 0.78 | % | | | 1.36 | % |
| IB | | | 9.50 | | | | 0.11 | | | | 1.25 | | | | 1.36 | | | | (0.10 | ) | | | – | | | | (0.10 | ) | | | 10.76 | | | | 14.38 | | | | 154,731 | | | | 1.03 | | | | 1.03 | | | | 1.11 | |
| | | | | | | | | | | | | | | | | | | | | | | | | | | | | | | | | | | | | | | | | | | | | | | | | | | | | |
| For the Year Ended December 31, 2009 (F) |
| IA | | $ | 7.77 | | | $ | 0.14 | | | $ | 1.75 | | | $ | 1.89 | | | $ | (0.16 | ) | | $ | – | | | $ | (0.16 | ) | | $ | 9.50 | | | | 24.37 | %(G) | | $ | 244,909 | | | | 0.87 | % | | | 0.87 | % | | | 1.65 | % |
| IB | | | 7.77 | | | | 0.13 | | | | 1.74 | | | | 1.87 | | | | (0.14 | ) | | | – | | | | (0.14 | ) | | | 9.50 | | | | 24.06 | (G) | | | 63,003 | | | | 1.12 | | | | 1.12 | | | | 1.40 | |
| (A) | Information presented relates to a share outstanding throughout the indicated period. Net investment income (loss) per share amounts are calculated based on average shares outstanding unless otherwise noted. |
| (B) | The figures do not include sales charges or other fees which may be applied at the variable life insurance, variable annuity or qualified retirement plan product level. Any such additional sales charges or other fees would lower the Fund's performance. |
| (C) | Adjustments include waivers and reimbursements, if applicable. Ratios do not include fees paid indirectly (see Expenses in the accompanying Notes to Financial Statements). |
| (F) | Net investment income (loss) per share amounts have been calculated using the SEC method. |
| (G) | Total return without the inclusion of the Payment from (to) Affiliate can be found in Expenses in the accompanying Notes to Financial Statements. |
| | | Portfolio Turnover
Rate for
All Share Classes | |
| For the Six-Month Period Ended June 30, 2014 (Unaudited) | | | 7% | |
| For the Year Ended December 31, 2013 | | | 19 | |
| For the Year Ended December 31, 2012 | | | 22 | |
| For the Year Ended December 31, 2011 | | | 16 | |
| For the Year Ended December 31, 2010 | | | 47(A) | |
| For the Year Ended December 31, 2009 | | | 50 | |
| (A) | During the year ended December 31, 2010, the Fund incurred $269.8 million in sales associated with the transition of assets from Hartford Equity Income HLS Fund and Hartford Value Opportunities HLS Fund, which merged into the Fund on March 19, 2010. These sales were excluded from the portfolio turnover calculation. |
| Hartford Value HLS Fund |
Directors and Officers (Unaudited) |
The Board of Directors of the Company (the "Directors") appoints officers who are responsible for the day-to-day operations of the Fund and who execute policies formulated by the Directors. Each Director serves until his or her death, resignation, or retirement or until the next annual meeting of shareholders is held or until his or her successor is elected and qualifies.
Directors and officers who are employed by or who have a financial interest in The Hartford are considered “interested” persons of the Fund pursuant to the 1940 Act. Each officer and two of the Company's Directors, as noted in the chart below, are “interested” persons of the Fund. Each Director serves as a director for The Hartford Mutual Funds, Inc., The Hartford Mutual Funds II, Inc., Hartford Series Fund, Inc., and Hartford HLS Series Fund II, Inc., and as a trustee for The Hartford Alternative Strategies Fund, which, as of June 30, 2014, collectively consist of 78 funds. Correspondence may be sent to Directors and officers c/o Hartford Funds, 5 Radnor Corporate Center, Suite 300, 100 Matsonford Road, Radnor, Pennsylvania 19087, except that correspondence to Mr. Annoni, Mr. Dressen and Ms. Quade may be sent to 500 Bielenberg Drive, Suite 500, Woodbury, Minnesota 55125.
The table below sets forth, for each Director and officer, his or her name, year of birth, current position with the Company and date first elected or appointed to Hartford Series Fund, Inc. ("HSF") and Hartford HLS Series Fund II, Inc. ("HSF2"), principal occupation, and, for Directors, other directorships held. The Fund’s Statement of Additional Information contains further information on the Directors and is available free of charge by calling 1-888-843-7824 or writing to: Hartford HLS Funds, c/o Hartford Life Insurance Company/Hartford Life and Annuity Insurance Company, P.O. Box 14293, Lexington, KY 40512-4293 for variable annuity and variable life insurance separate accounts of Hartford Life Insurance Company and its affiliates; Hartford Funds, P.O. Box 55022, Boston, MA 02205-5022 for all shareholders except variable annuity and variable life insurance separate accounts of Hartford Life Insurance Company and its affiliates.
Information on the aggregate remuneration paid to the directors of the Company can be found in the Statement of Operations herein. The Fund pays to The Hartford a portion of the Chief Compliance Officer’s compensation, but does not pay salaries or compensation to any of its other officers or Directors who are employed by The Hartford.
Non-Interested Directors
Lynn S. Birdsong (1946) Director since 2003, Co-Chairman of the Investment Committee since 2005
Mr. Birdsong is a private investor. Mr. Birdsong currently serves as a Director of the Sovereign High Yield Investment Company (April 2010 to current). Mr. Birdsong currently serves as an Independent Director of Nomura Partners Funds, Inc. (formerly, The Japan Fund) (April 2003 to current). From 2003 to March 2005, Mr. Birdsong was an Independent Director of the Atlantic Whitehall Funds. From 1979 to 2002, Mr. Birdsong was a Managing Director of Zurich Scudder Investments, an investment management firm. During his employment with Scudder, Mr. Birdsong was an Interested Director of The Japan Fund. From January 1981 through December 2013, Mr. Birdsong was a partner in Birdsong Company, an advertising specialty firm.
Robert M. Gavin, Jr. (1940) Director since 2002 (HSF) and 1986 (HSF2), Chairman of the Board since 2004
Dr. Gavin is an educational consultant. Prior to September 1, 2001, he was President of Cranbrook Education Community and prior to July 1996, he was President of Macalester College, St. Paul, Minnesota.
Duane E. Hill (1945) Director since 2001 (HSF) and 2002 (HSF2), Chairman of the Nominating Committee since 2003
Mr. Hill is a Partner of TSG Ventures L.P., a private equity investment company. Mr. Hill is a former partner of TSG Capital Group, a private equity investment firm that served as sponsor and lead investor in leveraged buyouts of middle market companies.
Sandra S. Jaffee (1941) Director since 2005
Ms. Jaffee is the founder and Chief Executive Officer of a private company, Homeworks Concierge, LLC, which provides residential property management services in Westchester County, New York (January 2012 to present). Ms. Jaffee served as Chairman (2008 to 2009) and Chief Executive Officer of Fortent (formerly Searchspace Group), a leading provider of compliance/regulatory technology to financial institutions from August 2005 to August 2009. From August 2004 to August 2005, Ms. Jaffee served as an Entrepreneur in Residence with Warburg Pincus, a private equity firm. Prior to joining Warburg Pincus, Ms. Jaffee served as Executive Vice President at Citigroup, from September 1995 to July 2004, where she was President and Chief Executive Officer of Citibank’s Global Securities Services (1995 to 2003). Ms. Jaffee currently serves as a member of the Board of Directors of Broadridge Financial Solutions as well as a Trustee of Muhlenberg College.
| Hartford Value HLS Fund |
Directors and Officers (Unaudited) – (continued) |
William P. Johnston (1944) Director since 2005, Chairman of the Compliance Committee since 2005
In June 2006, Mr. Johnston was appointed as Senior Advisor to The Carlyle Group, a global private equity and other alternative asset investment firm and currently serves as an Operating Executive. In July 2006, Mr. Johnston was elected to the Board of Directors of MultiPlan, Inc. and served as a Director (July 2006 to August 2010). In August 2007, Mr. Johnston was elected to the Board of Directors of LifeCare Holdings, Inc. and served as a Director (August 2007 to June 2013). In February 2008, Mr. Johnston was elected to the Board of Directors of HCR-ManorCare, Inc. In May 2006, Mr. Johnston was elected to the Supervisory Board of Fresenius Medical Care AG & Co. KGaA, after its acquisition of Renal Care Group, Inc. in March 2006. Mr. Johnston joined Renal Care Group in November 2002 as a member of the Board of Directors and served as Chairman of the Board from March 2003 through March 2006. From 2002 through 2013, Mr. Johnston served as a Board member of the Georgia O’Keefe Museum. From September 1987 to December 2002, Mr. Johnston was with Equitable Securities Corporation (and its successors, SunTrust Equitable Securities and SunTrust Robinson Humphrey) serving in various investment banking and managerial positions, including Managing Director and Head of Investment Banking, Chief Executive Officer and Vice Chairman.
Phillip O. Peterson (1944) Director since 2002 (HSF) and 2000 (HSF2), Chairman of the Audit Committee since 2002
Mr. Peterson is a mutual fund industry consultant. He was a partner of KPMG LLP (an accounting firm) until July 1999. Mr. Peterson joined William Blair Funds in February 2007 as a member of the Board of Trustees. From February 2012 to February 2014, Mr. Peterson served as a Trustee of Symetra Variable Mutual Funds. From January 2004 to April 2005, Mr. Peterson served as Independent President of the Strong Mutual Funds.
Lemma W. Senbet (1946) Director since 2005
Dr. Senbet is the William E. Mayer Chair Professor of Finance and Founding Director, Center for Financial Policy, at the University of Maryland, Robert H. Smith School of Business. He was chair of the Finance Department of the University of Maryland, Robert H. Smith School of Business from 1998 to 2006. Since June 2013, he has been on leave from the University to serve as Executive Director of African Economic Research Consortium which focuses on economic policy research and training. Previously, he was a chaired professor of finance at the University of Wisconsin-Madison. Also, he was a Director of the Fortis Funds from March 2000 to July 2002. Dr. Senbet served as Director of the American Finance Association and President of the Western Finance Association. In 2006, Dr. Senbet was inducted Fellow of Financial Management Association International for his career-long distinguished scholarship and professional service.
Interested Directors and Officers
James E. Davey (1964) Director since 2012, President and Chief Executive Officer since 2010
Mr. Davey serves as Executive Vice President of Hartford Life Insurance Company (“HLIC”) and The Hartford Financial Services Group, Inc. Additionally, Mr. Davey serves as Chairman of the Board, Manager and Senior Managing Director of Hartford Funds Distributors, LLC (“HFD”). He also currently serves as Director, Chairman of the Board, President and Senior Managing Director of Hartford Administrative Services Company (“HASCO”). Mr. Davey also serves as Manager, Chairman of the Board and Senior Managing Director for Hartford Funds Management Company, LLC (“HFMC”) and Director, Chairman of the Board and Senior Managing Director for Hartford Funds Management Group, Inc. ("HFMG"). Mr. Davey has served in various positions within The Hartford and its subsidiaries in connection with the operation of the Hartford Funds. Mr. Davey joined The Hartford in 2002.
Lowndes A. Smith (1939) Director since 1996 (HSF) and 2002 (HSF2), Co-Chairman of the Investment Committee since 2005
Mr. Smith served as Vice Chairman of The Hartford from February 1997 to January 2002, as President and Chief Executive Officer of Hartford Life, Inc. from February 1997 to January 2002, and as President and Chief Operating Officer of The Hartford Life Insurance Companies from January 1989 to January 2002. Mr. Smith serves as a Director of White Mountains Insurance Group Ltd. (October 2003 to current); One Beacon Insurance (October 2006 to current); Symetra Financial (August 2007 to current) and is a Managing Director of Whittington Gray Associates (January 2007 to current).
Other Officers
Mark A. Annoni (1964) Vice President, Controller and Treasurer since 2012
Mr. Annoni currently serves as the Assistant Vice President of HLIC (February 2004 to present) and Senior Vice President of HFMG (December 2013 to present). Mr. Annoni has served in various positions within The Hartford and its subsidiaries in connection with the operation of the Hartford Funds. Mr. Annoni joined The Hartford in 2001.
| Hartford Value HLS Fund |
Directors and Officers (Unaudited) – (continued) |
Michael R. Dressen (1963) AML Compliance Officer since 2011
Mr. Dressen currently serves as Assistant Vice President of HLIC. He also serves as Chief Compliance Officer and AML Compliance Officer of HASCO and as AML Officer of HFD. Mr. Dressen has served in various positions within The Hartford and its subsidiaries in connection with the operation of the Hartford Funds.
Edward P. Macdonald (1967) Vice President, Secretary and Chief Legal Officer since 2005
Mr. Macdonald currently serves as Assistant Secretary, Executive Vice President and Deputy General Counsel of HFD, HASCO, HFMC and HFMG. He also serves as Vice President of HLIC. Mr. Macdonald has served in various positions within The Hartford and its subsidiaries in connection with the operation of the Hartford Funds. Mr. Macdonald joined The Hartford in 2005.
Joseph G. Melcher (1973) Vice President and Chief Compliance Officer since 2013
Mr. Melcher currently serves as Executive Vice President of HFD, HFMG and HASCO. Mr. Melcher also currently serves as Executive Vice President and Chief Compliance Officer of HFMC. Mr. Melcher has served in various positions within The Hartford and its subsidiaries in connection with the operation of the Hartford Funds since joining The Hartford in 2012. Prior to joining The Hartford, Mr. Melcher worked at Touchstone Investments, a member of the Western & Southern Financial Group, where he held the position of Vice President and Chief Compliance Officer from 2010 through 2012 and Assistant Vice President, Compliance from 2005 to 2010.
Vernon J. Meyer (1964) Vice President since 2006
Mr. Meyer currently serves as Senior Vice President of HLIC. He also currently serves as Managing Director and Chief Investment Officer of HFMC and Managing Director of HFMG. Mr. Meyer has served in various positions within The Hartford and its subsidiaries in connection with the operation of the Hartford Funds. Mr. Meyer joined The Hartford in 2004.
Laura S. Quade (1969) Vice President since 2012
Ms. Quade currently serves as Vice President of HASCO, HFD and HFMG. She is the Head of Operations of HASCO and also serves as Director, Enterprise Operations of HLIC. Ms. Quade has served in various positions within The Hartford and its subsidiaries in connection with the operation of the Hartford Funds.
Martin A. Swanson (1962) Vice President since 2010
Mr. Swanson currently serves as Vice President of HLIC. Mr. Swanson also serves as Managing Director, Chief Marketing Officer and Principal of HFD and Managing Director of HFMG. Mr. Swanson has served in various positions within The Hartford and its subsidiaries in connection with the operation of the Hartford Funds.
HOW TO OBTAIN A COPY OF THE FUND’S PROXY VOTING POLICIES AND VOTING RECORDS (UNAUDITED)
A description of the policies and procedures that the Fund uses to determine how to vote proxies relating to portfolio securities and information about how the Fund voted proxies relating to portfolio securities during the most recent twelve-month period ended June 30 are available (1) without charge, upon request, by calling 888-843-7824 and (2) on the SEC’s website at http://www.sec.gov.
QUARTERLY PORTFOLIO HOLDINGS INFORMATION (UNAUDITED)
The Fund files a complete schedule of portfolio holdings with the SEC for the first and third quarters of each fiscal year on Form N-Q. The Fund’s Forms N-Q are available (1) without charge, upon request, by calling 888-843-7824 and (2) on the SEC’s website at http://www.sec.gov. The Form N-Q may be reviewed and copied at the SEC’s Public Reference Room in Washington, DC. Information on the operation of the Public Reference Room may be obtained by calling 1-800-SEC-0330.
| Hartford Value HLS Fund |
Expense Example (Unaudited) |
Your Fund's Expenses
As a shareholder of the Fund, you incur two types of costs: (1) transaction costs and (2) ongoing costs, including investment management fees, distribution and/or service (12b-1) fees, if any, and other fund expenses. This example is intended to help you understand your ongoing costs (in dollars) of investing in the Fund and to compare these costs with the ongoing costs of investing in other mutual funds. The example is based on an investment of $1,000 invested at the beginning of the period and held for the entire period of December 31, 2013 through June 30, 2014.
Actual Expenses
The first set of columns of the table below provides information about actual account values and actual expenses. You may use the information in this column, together with the amount you invested, to estimate the expenses that you paid over the period. Simply divide your account value by $1,000 (for example, an $8,600 account value divided by $1,000 = 8.6), then multiply the result by the number in the line under the heading entitled “Expenses Paid During Period” to estimate the expenses you paid on your account during this period.
Hypothetical Example for Comparison Purposes
The second set of columns of the table below provides information about hypothetical account values and hypothetical expenses based on the Fund's actual expense ratio and an assumed rate of return of 5% per year before expenses, which is not the Fund's actual return. The hypothetical account values and expenses may not be used to estimate the actual ending account balance or expenses you paid for the period. You may use this information to compare the ongoing costs of investing in the Fund and other funds. To do so, compare this 5% hypothetical example with the 5% hypothetical examples that appear in the shareholder reports of the other funds.
Please note that the expenses shown in the table are meant to highlight your ongoing costs only and do not reflect any transactional costs, such as sales charges (loads) and CDSC. Therefore, the second set of columns of the table is useful in comparing ongoing costs only, and will not help you determine the relative total costs of owning different funds. In addition, if these transactional costs were included, your costs would be higher. Expenses are equal to the Fund's annualized expense ratios multiplied by average account value over the period, multiplied by 181/365 (to reflect the one-half year period).
| | | Actual return | | | Hypothetical (5% return before expenses) | | | | | | | | | | |
| | | Beginning
Account Value
December 31,
2013 | | | Ending Account
Value
June 30, 2014 | | | Expenses paid
during the period
December 31, 2013
through
June 30, 2014 | | | Beginning
Account Value
December 31,
2013 | | | Ending Account
Value
June 30, 2014 | | | Expenses paid
during the period
December 31,
2013
through
June 30, 2014 | | | Annualized
expense
ratio | | | Days
in the
current
1/2
year | | | Days
in the
full
year | |
| Class IA | | $ | 1,000.00 | | | $ | 1,063.70 | | | $ | 3.94 | | | $ | 1,000.00 | | | $ | 1,020.98 | | | $ | 3.86 | | | | 0.77 | % | | | 181 | | | | 365 | |
| Class IB | | $ | 1,000.00 | | | $ | 1,062.40 | | | $ | 5.22 | | | $ | 1,000.00 | | | $ | 1,019.74 | | | $ | 5.11 | | | | 1.02 | | | | 181 | | | | 365 | |
| Hartford Value HLS Fund |
| Main Risks (Unaudited) |
The main risks of investing in the Fund are described below.
Market, Selection and Strategy Risk: The Fund’s share price may fluctuate due to market risk and/or security selections that may underperform the market or relevant benchmarks. If the sub-adviser's investment strategy does not perform as expected, the Fund could underperform its peers or lose money. There is no guarantee the Fund will achieve its stated objective.
Value Investing Risk: Value investments are considered to be undervalued, but they may never attain their potential value. Value-style investing falls in and out of favor, which may result in periods of underperformance.
Foreign Investment Risk: Investments in foreign securities may be riskier than investments in U.S. securities. Potential risks include the risks of illiquidity, increased price volatility, less government regulation, less extensive and less frequent accounting and other reporting requirements, unfavorable changes in currency exchange rates, and economic and political disruptions.
THIS PRIVACY POLICY IS NOT PART OF THIS REPORT
Privacy Policy and Practices of The Hartford Financial Services Group, Inc. and its Affiliates
(herein called “we, our and us”)
This Privacy Policy applies to our United States Operations
We value your trust. We are committed to the responsible: a) management; b) use; and c) protection; of Personal Information. This notice describes how we collect, disclose, and protect Personal Information. We collect Personal Information to: a) service your Transactions with us; and b) support our business functions. We may obtain Personal Information from: a) You; b) your Transactions with us; and c) third parties such as a consumer-reporting agency. Based on the type of product or service You apply for or get from us, Personal Information such as: a) your name; b) your address; c) your income; d) your payment; or e) your credit history; may be gathered from sources such as applications, Transactions, and consumer reports. To serve You and service our business, we may share certain Personal Information. We will share Personal Information, only as allowed by law, with affiliates such as: a) our insurance companies; b) our employee agents; c) our brokerage firms; and d) our administrators. As allowed by law, we may share Personal Financial Information with our affiliates to: a) market our products; or b) market our services; to You without providing You with an option to prevent these disclosures. | | | We may also share Personal Information, only as allowed by law, with unaffiliated third parties including: a) independent agents; b) brokerage firms; c) insurance companies; d) administrators; and e) service providers; who help us serve You and service our business. When allowed by law, we may share certain Personal Financial Information with other unaffiliated third parties who assist us by performing services or functions such as: a) taking surveys; b) marketing our products or services; or c) offering financial products or services under a joint agreement between us and one or more financial institutions. We, and third parties we partner with, may track some of the pages You visit through the use of: a) cookies; b) pixel tagging; or c) other technologies; and currently do not process or comply with any web browser’s “do not track” signal or similar mechanism that indicates a request to disable online tracking of individual users who visit our websites or use our services. We will not sell or share your Personal Financial Information with anyone for purposes unrelated to our business functions without offering You the opportunity to: a) “opt-out;” or b) “opt-in;” as required by law. We only disclose Personal Health Information with: a) your proper written authorization; or b) as otherwise allowed or required by law. Our employees have access to Personal Information in the course of doing their jobs, such as: a) underwriting policies; b) paying claims; c) developing new products; or d) advising customers of our products and services. |
We use manual and electronic security procedures to maintain: a) the confidentiality; and b) the integrity of; Personal Information that we have. We use these procedures to guard against unauthorized access. Some techniques we use to protect Personal Information include: a) secured files; b) user authentication; c) encryption; d) firewall technology; and e) the use of detection software. We are responsible for and must: a) identify information to be protected; b) provide an adequate level of protection for that data; c) grant access to protected data only to those people who must use it in the performance of their job-related duties. Employees who violate our Privacy Policy will be subject to discipline, which may include ending their employment with us. At the start of our business relationship, we will give You a copy of our current Privacy Policy. We will also give You a copy of our current Privacy Policy once a year if You maintain a continuing business relationship with us. We will continue to follow our Privacy Policy regarding Personal Information even when a business relationship no longer exists between us. | | | As used in this Privacy Notice: Application means your request for our product or service. Personal Financial Information means financial information such as: a) credit history; b) income; c) financial benefits; or d) policy or claim information. Personal Health Information means health information such as: a) your medical records; or b) information about your illness, disability or injury. Personal Information means information that identifies You personally and is not otherwise available to the public. It includes: a) Personal Financial Information; and b) Personal Health Information. Transaction means your business dealings with us, such as: a) your Application; b) your request for us to pay a claim; and c) your request for us to take an action on your account. You means an individual who has given us Personal Information in conjunction with: a) asking about; b) applying for; or c) obtaining; a financial product or service from us if the product or service is used mainly for personal, family, or household purposes. |
This Privacy Policy is being provided on behalf of the following affiliates of The Hartford Financial Services Group, Inc.:
1stAGChoice, Inc.; Access CoverageCorp, Inc.; Access CoverageCorp Technologies, Inc.; American Maturity Life Insurance Company; Archway 60 R, LLC; Business Management Group, Inc.; Champlain Life Reinsurance Company; DMS R, LLC; Eloy R, LLC; Ersatz Corporation; First State Insurance Company; Hartford Accident and Indemnity Company; Hartford Administrative Services Company; Hartford Casualty General Agency, Inc.; Hartford Casualty Insurance Company; Hartford-Comprehensive Employee Benefit Service Company; Hartford Equity Sales Company, Inc.; Hartford Fire General Agency, Inc.; Hartford Fire Insurance Company; Hartford Funds Management Company, LLC; Hartford Funds Management Group, Inc.; Hartford HLS Series Fund II, Inc.; Hartford Insurance Company of Illinois; Hartford Insurance Company of the Midwest; Hartford Insurance Company of the Southeast; Hartford Integrated Technologies, Inc.; Hartford International Life Reassurance Corporation; Hartford Funds Distributors, LLC; Hartford Investment Management Company; Hartford Life and Accident Insurance Company; Hartford Life and Annuity Insurance Company; Hartford Life Insurance Company; Hartford Life Private Placement, LLC; Hartford Lloyd’s Corporation; Hartford Lloyd’s Insurance Company; Hartford Mezzanine Investors I, LLC; Hartford Residual Market, L.C.C.; Hartford Retirement Services, LLC; Hartford Securities Distribution Company, Inc.; Hartford Series Fund, Inc.; Hartford Specialty Insurance Services of Texas, LLC; Hartford Strategic Investments, LLC; Hartford Underwriters Insurance Company; Hartford Technology Services Company, L.L.C.; Hartford of Texas General Agency, Inc.; Hartford Underwriters General Agency, Inc.; HARTRE Company, L.C.C.; HL Investment Advisors, LLC; HLA LLC; Horizon Management Group, LLC; HRA Brokerage Services, Inc.; Lanidex Class B, LLC; M-CAP Insurance Agency, LLC; New England Insurance Company; New England Reinsurance Corporation; Nutmeg Insurance Agency, Inc.; Nutmeg Insurance Company; Pacific Insurance Company, Limited; Planco, LLC: Property and Casualty Insurance Company of Hartford; Revere R, LLC; RVR R, LLC; Sentinel Insurance Company, Ltd.; Sunstone R, LLC; Symphony R, LLC; The Evergreen Group Incorporated; The Hartford Alternative Strategies Fund; The Hartford Mutual Funds, Inc.; The Hartford Mutual Funds II, Inc.; Trumbull Flood Management, L.L.C.; Trumbull Insurance Company; Twin City Fire Insurance Company; White River Life Reinsurance Company.
HPP Revised January 2014
HARTFORD HLS FUNDS
P.O. Box 14293
Lexington, KY 40512-4293
HARTFORDFUNDS
hartfordfunds.com
Hartford Series Fund, Inc. is underwritten and distributed by Hartford Funds Distributors, LLC.
Hartford Series Fund, Inc. inception dates range from 1977 to date. Hartford Series Fund, Inc. is not a subsidiary of The Hartford Financial Services Group, Inc. ("The Hartford") but is underwritten, distributed by and advised by subsidiaries of The Hartford. Investments in Hartford Series Fund, Inc. are not guaranteed by The Hartford or any other entity.
This report is submitted for the general information of the shareholders of the Funds. It is not authorized for distribution unless preceded or accompanied by a current prospectus for the Funds.
Investors should carefully consider the investment objectives, risks, charges, and expenses of Hartford Funds before investing. This and other information can be found in the prospectus, which can be obtained by calling 800-862-6668 (or 800-279-1541 for institutional investors). Investors should read them carefully before they invest.
HLSSAR-V14 8-14 113557-3 Printed in U.S.A.
Item 2. Code of Ethics.
Not applicable to this semi-annual filing
Item 3. Audit Committee Financial Expert.
Not applicable to this semi-annual filing
Item 4. Principal Accountant Fees and Services.
Not applicable to this semi-annual filing
Item 5. Audit Committee of Listed Registrants.
Not applicable.
Item 6. Investments.
| (a) | The Schedule of Investments in securities of unaffiliated issuers as of the close of the reporting period is included as part of the semi-annual report filed under Item 1 of this form. |
Item 7. Disclosure of Proxy Voting Policies and Procedures for Closed-End Management Investment Companies.
Not applicable.
Item 8. Portfolio Managers of Closed-End Management Investment Companies.
Not applicable.
Item 9. Purchases of Equity Securities by Closed-End Management Investment Company and Affiliated Purchasers.
Not applicable.
Item 10. Submission of Matters to a Vote of Security Holders
There have been no material changes to the procedures by which shareholders may recommend nominees to the registrant’s board of directors since registrant last provided disclosure in response to this requirement.
Item 11. Controls and Procedures.
| (a) | The registrant’s principal executive and principal financial officers, or persons performing similar functions, have concluded that the registrant’s disclosure controls and procedures (as defined in Rule 30a-3(c) under the Investment Company Act of 1940, as amended (the “1940 Act”) (17 CFR 270.30a-3(c))) are generally effective to provide reasonable assurance, as of a date within 90 days of the filing date of the report that includes the disclosure required by this paragraph, based on their evaluation of these controls and procedures required by Rule 30a-3(b) under the 1940 Act (17 CFR 270.30a-3(b)) and Rules 13a-15(b) or 15d-15(b) under the Securities Exchange Act of 1934, as amended (17 CFR 240.13a-15(b) or 240.15d-15(b)). |
| (b) | There were no changes in the registrant’s internal control over financial reporting (as defined in Rule 30a-3(d) under the 1940 Act (17 CFR 270.30a-3(d)) that occurred during the registrant’s second fiscal quarter of the period covered by this report that have materially affected, or is reasonably likely to materially affect, the registrant’s internal control over financial reporting. |
Item 12. Exhibits.
(a)(1) Not applicable
(a)(2) Separate certifications for each principal executive officer and principal financial officer of the registrant as required by Rule 30a-2(a) under the 1940 Act (17 CFR 270.30a-2(a)) and Section 302 of the Sarbanes-Oxley Act of 2002 are attached herewith.
(a)(3) Not applicable
(b) Certifications pursuant to Rule 30a-2(b) under the 1940 Act and Section 906 of the Sarbanes-Oxley Act of 2002 are attached hereto.
SIGNATURES
Pursuant to the requirements of the Securities Exchange Act of 1934 and the Investment Company Act of 1940, the registrant has duly caused this report to be signed on its behalf by the undersigned, thereunto duly authorized.
| | HARTFORD SERIES FUND, INC. |
| | | |
| | | |
| | | |
| Date: August 12, 2014 | By: | /s/ James E. Davey______ |
| | | James E. Davey, President and |
| | | Chief Executive Officer |
Pursuant to the requirements of the Securities Exchange Act of 1934 and the Investment Company Act of 1940, this report has been signed below by the following persons on behalf of the registrant and in the capacities and on the dates indicated.
| Date: August 12, 2014 | By: | /s/ James E. Davey________ |
| | | James E. Davey, President and |
| | | Chief Executive Officer |
| | | |
| | | |
| Date: August 12, 2014 | By: | /s/ Mark A. Annoni________ |
| | | Mark A. Annoni, Vice President, |
| | | Treasurer and Controller |