|
| OMB APPROVAL |
OMB Number: 3235-0570
Expires: Oct. 31, 2006
Estimated average burden hours per response: 19.3 |
UNITED STATES
SECURITIES AND EXCHANGE COMMISSION
Washington, D.C. 20549
FORM N-CSR
CERTIFIED SHAREHOLDER REPORT OF REGISTERED MANAGEMENT INVESTMENT
COMPANIES
Investment Company Act file number 811-08415
| | |
| Fixed Income Trust |
|
(Exact name of registrant as specified in charter)
|
| 200 Berkeley Street |
| Boston, Massachusetts 02116 |
|
| (Address of principal executive offices) | | (Zip code) |
Michael H. Koonce, Esq. |
| 200 Berkeley Street |
| Boston, Massachusetts 02116 |
|
| (Name and address of agent for service) |
Registrant's telephone number, including area code: (617) 210-3200
Date of fiscal year end: Registrant is making an semiannual filing for 5 of its series, Evergreen Diversified Bond Fund, High Yield Bond Fund, Strategic Income Fund and Institutional Mortgage Portfolio, U.S. Government Fund for the year ended October 31, 2004. These 5 series have an April 30 fiscal year end.
Date of reporting period: October 31, 2004
Item 1 - Reports to Stockholders.
Evergreen Diversified Bond Fund

| | |
| table of contents |
| 1 | | LETTER TO SHAREHOLDERS |
| 4 | | FUND AT A GLANCE |
| 6 | | ABOUT YOUR FUND'S EXPENSES |
| 7 | | FINANCIAL HIGHLIGHTS |
| 11 | | SCHEDULE OF INVESTMENTS |
| 20 | | STATEMENT OF ASSETS AND LIABILITIES |
| 21 | | STATEMENT OF OPERATIONS |
| 22 | | STATEMENTS OF CHANGES IN NET ASSETS |
| 23 | | NOTES TO FINANCIAL STATEMENTS |
| 32 | | TRUSTEES AND OFFICERS |
This semiannual report must be preceded or accompanied by a prospectus of the Evergreen fund contained herein. The prospectus contains more complete information, including fees and expenses, and should be read carefully before investing or sending money.
The fund will file its complete schedule of portfolio holdings with the SEC for the first and third quarters of each fiscal year on Form N-Q. The fund's Form N-Q will be available on the SEC's Web site at http://www.sec.gov. In addition, the fund's Form N-Q may be reviewed and copied at the SEC's Public Reference Room in Washington, D.C. Information on the operation of the Public Reference Room may be obtained by calling 800.SEC.0330.
A description of the fund's proxy voting policies and procedures is available without charge, upon request, by calling 800.343.2898, by visiting our Web site at EvergreenInvestments.com or by visiting the SEC's Web site at http://www.sec.gov.
Information relating to how the fund voted proxies relating to portfolio securities during the most recent 12-month period ended June 30 is available by visiting our Web site at EvergreenInvestments.com or by visiting the SEC's Web site at http://www.sec.gov.
| | | | |
| Mutual Funds: | | | | |
| NOT FDIC INSURED | | MAY LOSE VALUE | | NOT BANK GUARANTEED |
Evergreen InvestmentsSM is a service mark of Evergreen Investment Management Company, LLC. Copyright 2004.
Evergreen mutual funds are distributed by Evergreen Investment Services, Inc. 200 Berkeley Street, Boston, MA 02116
LETTER TO SHAREHOLDERS
December 2004

| | Dennis H. Ferro
President and Chief
Executive Officer
|
Dear Shareholder,
We are pleased to provide the semiannual report for the Evergreen Diversified Bond Fund, which covers the six-month period ended October 31, 2004.
Our fixed income portfolio teams entered the investment period with a major decision to make regarding the magnitude of potential changes in monetary policy. Since the Federal Reserve had kept its target for the benchmark federal funds rate at a 46-year low of 1% for more than nine months, most investors agreed that rates were headed higher. The key was by how much, and what impact that would have on the level of market interest rates. Considering that the federal funds rate was significantly below that of inflation, we determined that the Federal Reserve would be true to its word, and enact a "measured" removal of policy accommodation.
The period began with positive momentum on the economic front. First quarter Gross Domestic Product ("GDP") grew in excess of 4%, and supporting data pointed to a continuation of solid growth. Retail sales were strong and manufacturing had managed to put together several months of consistent growth. The solid contributions from business investment, meanwhile, had enabled the expansion to broaden, reinforcing the trend for sustainable economic growth. The next key for the recovery would come in the form of employment growth, which has historically lagged that of GDP growth. This recovery was no exception, and fears of a jobless recovery had persisted for months. Yet that too also improved, as the investment period began with consecutive monthly payroll gains in excess of 300,000 jobs.
1
LETTER TO SHAREHOLDERS continued
The bond market quickly sent investors a message: be careful what you wish for. After having fretted for months about a jobless recovery, the sudden large number of jobs being created and the threat of higher wage inflation sent market yields dramatically higher last spring. In addition to the improvement in employment, the Federal Reserve had been preparing Wall Street for higher interest rates. Monetary policymakers began the second quarter with a new "spin" on their message to the public, stating that they would remain "measured" in their removal of policy accommodation. Despite these attempts at improved clarity from the Federal Reserve, other factors emerged to drive yields higher during the first part of the investment period. Indeed, interest rate concerns were exacerbated by rising gasoline prices and the larger than forecast readings on consumer inflation during May and June.
As it turned out, the advent of the Federal Reserve's gradual tightening cycle proved to be the tonic that the markets needed. As with many issues confronting investors in recent years, clarity bested uncertainty, and the bond market responded favorably to the prospects of only slightly higher interest rates. Monetary policy officials were also making the rounds in speeches reiterating their intentions to remain "measured" in the removal of policy accommodation. In addition, economic data began to moderate. The pace of job growth slowed and the inflation fears of June had dissipated by September. Despite higher oil prices, inflation reports were becoming less threatening, suggesting that oil would ultimately prove a drag on growth, rather than ignite inflation.
Other factors served to reward a variety of fixed income categories in recent months. For example, the uncertain geopolitical environment and the weaker dollar resulted in higher domestic and international demand for the perceived safety of U.S. government bonds, and the yield on the 10-year Treasury hovered around 4% at the close of the third quarter, despite the likelihood of higher federal deficits. Mortgages also benefited from the reduced prepayment risk in their portfolios, and high yield bonds continued to attract attention given
2
LETTER TO SHAREHOLDERS continued
their income potential and the low default risk. Solid corporate balance sheets and earnings potential enabled many investment grade corporate bonds to also strengthen as the investment period progressed. Indeed, despite the rate hikes from the Federal Reserve, prices firmed for a variety of asset classes within the fixed income market during the latter half of the investment period.
In this environment, we continue to recommend diversified fixed income strategies for long-term investment portfolios.
Please visit our Web site, EvergreenInvestments.com, for more information about our funds and other investment products available to you. Thank you for your continued support of Evergreen Investments.
Sincerely,

| | Dennis H. Ferro
President and Chief Executive Officer
Evergreen Investment Company, Inc.
|
Special Notice to Shareholders:
Please visit our Web site at EvergreenInvestments.com for statements from President and Chief Executive Officer, Dennis Ferro, and Chairman of the Board of the Evergreen Funds, Michael S. Scofield, addressing recent SEC actions involving the Evergreen Funds.
3
FUND AT A GLANCE
as of October 31, 2004
MANAGEMENT TEAM

David K. Fowley, CFA
Customized Fixed Income Team Lead Manager
CURRENT INVESTMENT STYLE
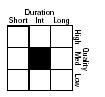
Source: Morningstar, Inc.
Morningstar's style box is based on a portfolio date as of 9/30/2004.
The fixed income style box placement is based on a fund's average effective maturity or duration and the average credit rating of the bond portfolio.
PERFORMANCE AND RETURNS
Portfolio inception date: 9/11/1935
| | | | | | | | |
| | | Class A | | Class B | | Class C | | Class I |
| Class inception date | | 1/20/1998 | | 9/11/1935 | | 4/7/1998 | | 2/11/1998 |
|
| Nasdaq symbol | | EKDLX | | EKDMX | | EKDCX | | EKDYX |
|
| 6-month return with sales charge | | -0.55% | | -0.93% | | 3.07% | | N/A |
|
| 6-month return w/o sales charge | | 4.43% | | 4.07% | | 4.07% | | 4.59% |
|
| Average annual return* | | | | | | | | |
|
| 1-year with sales charge | | 0.33% | | -0.39% | | 3.61% | | N/A |
|
| 1-year w/o sales charge | | 5.34% | | 4.61% | | 4.61% | | 5.66% |
|
| 5-year | | 5.65% | | 5.58% | | 5.90% | | 6.96% |
|
| 10-year | | 6.23% | | 6.22% | | 6.22% | | 6.86% |
|
* Adjusted for maximum applicable sales charge, unless noted.
Past performance is no guarantee of future results. The performance quoted represents past performance and current performance may be lower or higher. The investment return and principal value of an investment will fluctuate so that investors' shares, when redeemed, may be worth more or less than their original cost. To obtain performance information current to the most recent month-end for Classes A, B, C or I, please go to EvergreenInvestments.com/fundperformance. The performance of each class may vary based on differences in loads, fees and expenses paid by the shareholders investing in each class. The maximum applicable sales charge is 4.75% for Class A, 5.00% for Class B and 1.00% for Class C. Class I is not subject to a sales charge. Performance includes the reinvestment of income dividends and capital gain distributions. Performance shown does not reflect the deduction of taxes that a shareholder would pay on fund distributions or the redemption of fund shares.
Historical performance shown for Classes A, C and I prior to their inception is based on the performance of Class B, the original class offered. The historical returns for Classes A and I have not been adjusted to reflect the effect of each class' 12b-1 fee. These fees are 0.30% for Class A and 1.00% for Classes B and C. Class I does not pay a 12b-1 fee. If these fees had been reflected, returns for Classes A and I would have been higher.
The advisor is waiving a portion of its advisory fee. Had the fee not been waived, returns would have been lower. Returns reflect expense limits previously in effect for Class A, without which returns for Class A would have been lower.
4
FUND AT A GLANCE continued
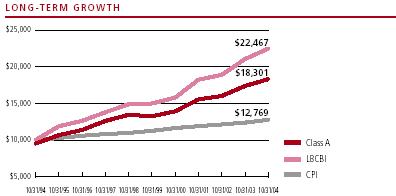
Comparison of a $10,000 investment in the Evergreen Diversified Bond Fund Class A shares, versus a similar investment in the the Lehman Brothers Corporate Bond Index (LBCBI) and the Consumer Price Index (CPI).
The LBCBI is an unmanaged market index and does not include transaction costs associated with buying and selling securities, any mutual fund expenses or any taxes. The CPI is a commonly used measure of inflation and does not represent an investment return. It is not possible to invest directly in an index.
Class I shares are only offered to investment advisory clients of an investment advisor of an Evergreen fund (or its advisory affiliates), through special arrangements entered into on behalf of Evergreen funds with certain financial services firms, certain institutional investors and persons who owned Class Y shares in registered name in an Evergreen fund on or before December 31, 1994. Class I shares are only available to institutional shareholders with a minimum $1 million investment.
The fund's investment objective is nonfundamental and may be changed without the vote of the fund's shareholders.
Funds that invest in high yield, lower-rated bonds may contain more risk due to the increased possibility of default.
Foreign investments may contain more risk due to the inherent risks associated with changing political climates, foreign market instability and foreign currency fluctuations.
U.S. government guarantees apply only to certain securities held in the fund's portfolio and not to the fund's shares.
The return of principal is not guaranteed due to fluctuation in the NAV of the fund caused by changes in the price of the individual bonds held by the fund and the buying and selling of bonds by the fund. Bond funds have the same inflation, interest rate and credit risks that are associated with the individual bonds held by the fund.
All data is as of October 31, 2004, and subject to change.
5
ABOUT YOUR FUND'S EXPENSES
The Example below is intended to describe the fees and expenses borne by shareholders and the impact of those costs on your investment.
Example
As a shareholder of the fund, you incur two types of costs: (1) transaction costs, including sales charges (loads), redemption fees and exchange fees; and (2) ongoing costs, including management fees, distribution (12b-1) fees and other fund expenses. This Example is intended to help you understand your ongoing costs (in dollars) of investing in the fund and to compare these costs with the ongoing costs of investing in other mutual funds. The Example is based on an investment of $1,000 invested at the beginning of the period and held for the entire period from May 1, 2004 to October 31, 2004.
The example illustrates your fund's costs in two ways:
• Actual expenses
The section in the table under the heading "Actual" provides information about actual account values and actual expenses. You may use the information in these columns, together with the amount you invested, to estimate the expenses that you paid over the period. Simply divide your account value by $1,000 (for example, an $8,600 account value divided by $1,000 = 8.6), then multiply the result by the number in the appropriate column for your share class, in the column entitled "Expenses Paid During Period" to estimate the expenses you paid on your account during this period.
• Hypothetical example for comparison purposes
The section in the table under the heading "Hypothetical (5% return before expenses)" provides information about hypothetical account values and hypothetical expenses based on the fund's actual expense ratio and an assumed rate of return of 5% per year before expenses, which is not the fund's actual return. The hypothetical account values and expenses may not be used to estimate the actual ending account balance or expenses you paid for the period. You may use this information to compare the ongoing costs of investing in the fund and other funds. To do so, compare this 5% hypothetical example with the 5% hypothetical examples that appear in the shareholder reports of the other funds.
Please note that the expenses shown in the table are meant to highlight your ongoing costs only and do not reflect any transactional costs, such as sales charges (loads), redemption fees or exchange fees. Therefore, the section in the table under the heading "Hypothetical (5% return before expenses)" is useful in comparing ongoing costs only, and will not help you determine the relative total costs of owning different funds. In addition, if these transactional costs were included, your costs would have been higher.
| | | | | | |
| | | Beginning | | Ending | | |
| | | Account | | Account | | Expenses |
| | | Value | | Value | | Paid During |
| | | 5/1/2004 | | 10/31/2004 | | Period* |
|
| Actual | | | | | | |
| Class A | | $ 1,000.00 | | $ 1,044.35 | | $ 5.05 |
| Class B | | $ 1,000.00 | | $ 1,040.70 | | $ 8.64 |
| Class C | | $ 1,000.00 | | $ 1,040.70 | | $ 8.64 |
| Class I | | $ 1,000.00 | | $ 1,045.92 | | $ 3.51 |
| Hypothetical | | | | | | |
| (5% return | | | | | | |
| before expenses) | | | | | | |
| Class A | | $ 1,000.00 | | $ 1,020.27 | | $ 4.99 |
| Class B | | $ 1,000.00 | | $ 1,016.74 | | $ 8.54 |
| Class C | | $ 1,000.00 | | $ 1,016.74 | | $ 8.54 |
| Class I | | $ 1,000.00 | | $ 1,021.78 | | $ 3.47 |
|
| * | For each class of the Fund, expenses are equal to the annualized expense ratio of each class (0.98% for Class A, 1.68% for Class B, 1.68% for Class C and 0.68% for Class I), multiplied by the average account value over the period, multiplied by 184 / 365 days. |
| |
6
FINANCIAL HIGHLIGHTS
(For a share outstanding throughout each period)
| | | | | | | | | | | | |
| | | Six Months Ended | | Year Ended April 30,
|
| | October 31, 2004 | |
| CLASS A | | (unaudited) 1 | | 2004 1 | | 2003 | | 2002 2 | | 2001 1 | | 2000 1 |
|
| Net asset value, beginning of period | | $ 14.77 | | $ 15.25 | | $ 14.63 | | $ 14.53 | | $ 14.28 | | $ 15.48 |
|
| Income from investment operations | | | | | | | | | | | | |
| Net investment income | | 0.33 | | 0.70 | | 0.82 | | 0.83 | | 0.97 | | 0.97 |
Net realized and unrealized gains
or losses on securities, foreign currency | | | | | | | | | | | | |
| related transactions and futures contracts | | 0.31 | | (0.42 ) | | 0.64 | | 0.13 | | 0.25 | | (1.14 ) |
| |
| |
| |
| |
| |
| |
|
| Total from investment operations | | 0.64 | | 0.28 | | 1.46 | | 0.96 | | 1.22 | | (0.17) |
|
| Distributions to shareholders from | | | | | | | | | | | | |
| Net investment income | | (0.36 ) | | (0.76 ) | | (0.84 ) | | (0.86 ) | | (0.97 ) | | (1.03 ) |
|
| Net asset value, end of period | | $ 15.05 | | $ 14.77 | | $ 15.25 | | $ 14.63 | | $ 14.53 | | $ 14.28 |
|
| Total return 3 | | 4.43% | | 1.82% | | 10.31 % | | 6.72% | | 8.81% | | (1.06%) |
|
| Ratios and supplemental data | | | | | | | | | | | | |
| Net assets, end of period (thousands) | | $264,231 | | $275,755 | | $322,963 | | $300,670 | | $314,274 | | $344,296 |
| Ratios to average net assets | | | | | | | | | | | | |
| Expenses 4 | | 0.98 % 5 | | 1.12 % | | 1.09 % | | 1.13 % | | 1.15 % | | 1.19 % |
| Net investment income | | 4.56% 5 | | 4.58% | | 5.51% | | 5.68% | | 6.73% | | 6.65% |
| Portfolio turnover rate | | 90% | | 157% | | 109% | | 116% | | 176% | | 175% |
|
| |
| 1 | Net investment income per share is based on average shares outsta nding during the period. |
| 2 | As required, effective May 1, 2001, the Fund adopted the pr ovisions of the AICPA Audit and Accounting Guide, Audits of Investment Companies, and began amortizing premium on its fixed-income |
| | securities. The effects of this change for the year ended April 30, 2002 was a decrease in net investment income per share of $0.02; an increase in net realized gains or losses per share of $0.02; and a |
| | decrease to the ratio of net investment income to average net assets of 0.16%. The above per share information, ratios and supp lemental data for the periods prior to May 1, 2001 have not been |
| | restated to reflect this change in presentation. |
| 3 | Excluding applicable sales charges |
| 4 | The ratio of expenses to average net assets excludes expense reductions but includes fee waivers and/or expense reimbursements. |
| 5 | Annualized |
See Notes to Financial Statements
7
FINANCIAL HIGHLIGHTS
(For a share outstanding throughout each period)
| | | | | | | | | | | | |
| | | Six Months Ended | | Year Ended April 30, |
| | October 31, 2004 | |
|
| CLASS B | | (unaudited) 1 | | 2004 1 | | 2003 1 | | 2002 1,2 | | 2001 1 | | 2000 1 |
|
| Net asset value, beginning of period | | $ 14.77 | | $ 15.25 | | $ 14.63 | | $ 14.53 | | $ 14.28 | | $ 15.48 |
| |
| |
| |
| |
| |
| |
|
| Income from investment operations | | | | | | | | | | | | |
| Net investment income | | 0.28 | | 0.59 | | 0.70 | | 0.72 | | 0.86 | | 0.84 |
Net realized and unrealized gains
or losses on securities, foreign currency | | | | | | | | | | | | |
| related transactions and futures contracts | | 0.31 | | (0.42 ) | | 0.65 | | 0.13 | | 0.25 | | (1.12 ) |
| |
| |
| |
| |
| |
| |
|
| Total from investment operations | | 0.59 | | 0.17 | | 1.35 | | 0.85 | | 1.11 | | (0.28) |
|
| Distributions to shareholders from | | | | | | | | | | | | |
| Net investment income | | (0.31 ) | | (0.65 ) | | (0.73 ) | | (0.75 ) | | (0.86 ) | | (0.92 ) |
|
| Net asset value, end of period | | $ 15.05 | | $ 14.77 | | $ 15.25 | | $ 14.63 | | $ 14.53 | | $ 14.28 |
|
| Total return 3 | | 4.07% | | 1.10% | | 9.50% | | 5.93% | | 8.00% | | (1.80%) |
|
| Ratios and supplemental data | | | | | | | | | | | | |
| Net assets, end of period (thousands) | | $24,666 | | $25,825 | | $27,252 | | $19,283 | | $23,392 | | $21,694 |
| Ratios to average net assets | | | | | | | | | | | | |
| Expenses 4 | | 1.68 % 5 | | 1.82 % | | 1.84 % | | 1.88 % | | 1.90 % | | 1.94 % |
| Net investment income | | 3.86% 5 | | 3.87% | | 4.75% | | 4.92% | | 5.97% | | 5.86% |
| Portfolio turnover rate | | 90% | | 157% | | 109% | | 116% | | 176% | | 175% |
|
| |
| 1 | Net investment income per share is based on average shares outsta nding during the period. |
| 2 | As required, effective May 1, 2001 the Fund adopted the pr ovisions of the AICPA Audit and Accounting Guide, Audits of Investment Companies, and began amortizing premium on its fixed-income |
| | securities. The effects of this change for the year ended April 30, 2002 was a decrease in net investment income per share of $0.03; an increase in net realized gains or losses per share of $0.03; and a |
| | decrease to the ratio of net investment income to average net assets of 0.16%. The above per share information, ratios and supp lemental data for the periods prior to May 1, 2001 have not been |
| | restated to reflect this change in presentation. |
| 3 | Excluding applicable sales charges |
| 4 | The ratio of expenses to average net assets excludes expense reductions but includes fee waivers and/or expense reimbursements. |
| 5 | Annualized |
See Notes to Financial Statements
8
FINANCIAL HIGHLIGHTS
(For a share outstanding throughout each period)
| | | | | | | | | | | | |
| | | Six Months Ended | | Year Ended April 30, |
| | October 31, 2004 | |
|
| CLASS C | | (unaudited) 1 | | 2004 1 | | 2003 1 | | 2002 2 | | 2001 1 | | 2000 1 |
|
| Net asset value, beginning of period | | $ 14.77 | | $ 15.25 | | $ 14.63 | | $14.53 | | $14.28 | | $15.48 |
|
| Income from investment operations | | | | | | | | | | | | |
| Net investment income | | 0.28 | | 0.59 | | 0.70 | | 0.74 | | 0.81 | | 0.88 |
Net realized and unrealized gains or losses
on securities, foreign currency related | | | | | | | | | | | | |
| transactions and futures contracts | | 0.31 | | (0.42 ) | | 0.65 | | 0.11 | | 0.30 | | (1.16 ) |
| |
| |
| |
| |
| |
| |
|
| Total from investment operations | | 0.59 | | 0.17 | | 1.35 | | 0.85 | | 1.11 | | (0.28) |
|
| Distributions to shareholders from | | | | | | | | | | | | |
| Net investment income | | (0.31 ) | | (0.65 ) | | (0.73 ) | | (0.75 ) | | (0.86 ) | | (0.92 ) |
|
| Net asset value, end of period | | $ 15.05 | | $ 14.77 | | $ 15.25 | | $14.63 | | $14.53 | | $14.28 |
|
| Total return 3 | | 4.07% | | 1.10% | | 9.50% | | 5.93% | | 8.00% | | (1.80%) |
|
| Ratios and supplemental data | | | | | | | | | | | | |
| Net assets, end of period (thousands) | | $34,692 | | $38,490 | | $47,506 | | $4,008 | | $3,077 | | $ 603 |
| Ratios to average net assets | | | | | | | | | | | | |
| Expenses 4 | | 1.68 % 5 | | 1.83 % | | 1.84 % | | 1.88 % | | 1.90 % | | 1.93 % |
| Net investment income | | 3.87% 5 | | 3.88% | | 4.78% | | 4.91% | | 5.82% | | 5.92% |
| Portfolio turnover rate | | 90% | | 157% | | 109% | | 116% | | 176% | | 175% |
|
| |
| 1 | Net investment income per share is based on average shares outsta nding during the period. |
| 2 | As required, effective May 1, 2001, the Fund adopted the pr ovisions of the AICPA Audit and Accounting Guide, Audits of Investment Companies, and began amortizing premium on its fixed-income |
| | securities. The effects of this change for the year ended April 30, 2002 was a decrease in net investment income per share of $0.02; an increase in net realized gains or losses per share of $0.02; and a |
| | decrease to the ratio of net investment income to average net assets of 0.16%. The above per share information, ratios and supp lemental data for the periods prior to May 1, 2001 have not been |
| | restated to reflect this change in presentation. |
| 3 | Excluding applicable sales charges |
| 4 | The ratio of expenses to average net assets excludes expense reductions but includes fee waivers and/or expense reimbursements. |
| 5 | Annualized |
See Notes to Financial Statements
9
FINANCIAL HIGHLIGHTS
(For a share outstanding throughout each period)
| | | | | | | | | | | | |
| | | Six Months Ended | | Year Ended April 30, |
| | October 31, 2004 | |
|
| CLASS I 1 | | (unaudited) 2 | | 2004 2 | | 2003 2 | | 2002 2,3 | | 2001 2 | | 20002 |
|
| Net asset value, beginning of period | | $14.77 | | $15.25 | | $14.63 | | $14.53 | | $14.28 | | $15.48 |
|
| Income from investment operations | | | | | | | | | | | | |
| Net investment income | | 0.36 | | 0.74 | | 0.85 | | 0.87 | | 1.01 | | 0.90 |
Net realized and unrealized gains or losses
on securities, foreign currency related | | | | | | | | | | | | |
| transactions and futures contracts | | 0.31 | | (0.42 ) | | 0.65 | | 0.12 | | 0.25 | | (1.04 ) |
| |
| |
| |
| |
| |
| |
|
| Total from investment operations | | 0.67 | | 0.32 | | 1.50 | | 0.99 | | 1.26 | | (0.14) |
|
| Distributions to shareholders from | | | | | | | | | | | | |
| Net investment income | | (0.39 ) | | (0.80 ) | | (0.88 ) | | (0.89 ) | | (1.01 ) | | (1.06 ) |
|
| Net asset value, end of period | | $15.05 | | $14.77 | | $15.25 | | $14.63 | | $14.53 | | $14.28 |
|
| Total return | | 4.59% | | 2.12% | | 10.59 % | | 6.99% | | 9.08% | | (0.81%) |
| Ratios and supplemental data | | | | | | | | | | | | |
| Net assets, end of period (thousands) | | $2,725 | | $2,311 | | $3,235 | | $ 299 | | $ 980 | | $ 885 |
| Ratios to average net assets | | | | | | | | | | | | |
| Expenses 4 | | 0.68 % 5 | | 0.82 % | | 0.87 % | | 0.88 % | | 0.90 % | | 0.95 % |
| Net investment income | | 4.83% 5 | | 4.87% | | 5.76% | | 5.91% | | 6.97% | | 6.89% |
| Portfolio turnover rate | | 90% | | 157% | | 109% | | 116% | | 176% | | 175% |
|
| |
| 1 | Effective at the close of business on May 11, 2001, Class Y sh ares were renamed as Institutional shares (Class I). |
| 2 | Net investment income per share is based on average shares outsta nding during the period. |
| 3 | As required, effective May 1, 2001, the Fund adopted the pr ovisions of the AICPA Audit and Accounting Guide, Audits of Investment Companies, and began amortizing premium on its fixed-income |
| | securities. The effects of this change for the year ended April 30, 2002 was a decrease in net investment income per share of $0.02; an increase in net realized gains or losses per share of $0.02; and a |
| | decrease to the ratio of net investment income to average net assets of 0.16%. The above per share information, ratios and supp lemental data for the periods prior to May 1, 2001 have not been |
| | restated to reflect this change in presentation. |
| 4 | The ratio of expenses to average net assets excludes expense reductions but includes fee waivers and/or expense reimbursements. |
| 5 | Annualized |
See Notes to Financial Statements
10
SCHEDULE OF INVESTMENTS
October 31, 2004 (unaudited)
| | | | | | | | |
| | | | | Principal | | | | |
| | | | | Amount | | | | Value |
|
| AGENCY MORTGAGE-BACKED PASS-THROUGH SECURITIES 1.0% | | | | | | |
| Floating Rate 1.0% | | | | | | |
| Banc America, Inc., Ser. 2001-7WTA, Class E, 2.66%, 01/27/2006144A (h) | | | | | | |
| (cost $3,500,000) | $ | 3,500,000 | | $ | | 3,299,038 |
| | | | | |
|
| ASSET-BACKED SECURITIES 3.4% | | | | | | |
| Credit Suisse First Boston Mtge. Securities Corp., Ser. 1996-2, | | | | | | |
| Class A-6, 7.18%, 02/25/2018 | | 452,155 | | | | 451,788 |
| GE Capital Mtge. Svcs., Inc., Ser. 1999-H, Class A-7, 6.27%, 04/25/2029 | | 1,034,633 | | | | 1,052,157 |
| Oakwood Mtge. Investors, Inc., Ser. 1996-C, Class A-5, 7.35%, 04/15/2027 | | 1,851,685 | | | | 1,943,649 |
| Preferred Term Securities, Ltd., 3.51%, 06/24/2034 144A (h) | | 2,000,000 | | | | 2,004,655 |
| Railcar Leasing LLC, Ser. 1, Class A-2, 7.125%, 01/15/2013 144A | | 2,500,000 | | | | 2,799,137 |
| Trapeza CDO LLC, Ser. 2004-7A, Class B1, 3.63%, 01/25/2035 144A (h) | | 3,000,000 | | | | 2,997,422 |
| | | | | |
|
| Total Asset-Backed Securities (cost $11,080,622) | | | | | | 11,248,808 |
| | | | | |
|
| COMMERCIAL MORTGAGE-BACKED SECURITIES 1.9% | | | | | | |
| Fixed Rate 1.9% | | | | | | |
| Greenwich Capital Acceptance, Inc., Ser. 2001-ZC1A, Class A, 6.36%, | | | | | | |
| 06/14/2006 144A (h) | | 2,874,386 | | | | 2,974,649 |
| Midland Realty Acceptance Corp., Ser. 1996-C1, Class E, 8.33%, 08/25/2028 | | 2,784,000 | | | | 3,116,038 |
| Morgan Stanley Capital I, Inc., Ser. 1997-ALIC, Class B, 6.71%, 01/15/2006 | | 89,856 | | | | 89,861 |
| | | | | |
|
| Total Commercial Mortgage-Backed Securities (cost $5,888,556) | | | | | | 6,180,548 |
| | | | | |
|
| CORPORATE BONDS 76.7% | | | | | | |
| CONSUMER DISCRETIONARY 13.8% | | | | | | |
| Auto Components 0.2% | | | | | | |
| Dana Corp., 9.00%, 08/15/2011 | | 200,000 | | | | 239,000 |
| Dura Operating Corp.: | | | | | | |
| 9.00%, 05/01/2009 | | 29,000 | | | | 27,913 |
| Ser. B, 8.625%, 04/15/2012 (p) | | 165,000 | | | | 170,981 |
| HLI Operating, Inc., 10.50%, 06/15/2010 (p) | | 130,000 | | | | 139,100 |
| Tenneco Automotive, Inc., Ser. B, 10.25%, 07/15/2013 | | 30,000 | | | | 35,100 |
| | | | | |
|
| | | | | | | | | 612,094 |
| | | | | | | |
|
| Automobiles 2.7% | | | | | | | | |
| Daimler Chrysler Holdings: | | | | | | | | |
| 2.71%, 08/08/2006 | | | | 2,000,000 | | | | 2,025,142 |
| 8.50%, 01/18/2031 | | | | 2,000,000 | | | | 2,480,702 |
| General Motors Corp., 8.25%, 07/15/2023 | | | | 4,000,000 | | | | 4,176,848 |
| | | | | | | |
|
| | | | | | | | | 8,682,692 |
| | | | | | | |
|
| Distributors 0.6% | | | | | | | | |
| Hughes Supply, Inc., 5.50%, 10/15/2014 144A | | | | 2,000,000 | | | | 1,999,152 |
| | | | | | | |
|
| Hotels, Restaurants & Leisure 0.3% | | | | | | | | |
| Chumash Casino & Resort Enterprise, 9.00%, 07/15/2010 144A | | | | 175,000 | | | | 196,437 |
| John Q. Hammons Hotels LP, Ser. B, 8.875%, 05/15/2012 | | | | 175,000 | | | | 202,125 |
| La Quinta Properties, Inc., 7.00%, 08/15/2012 144A | | | | 60,000 | | | | 64,725 |
| MTR Gaming Group, Inc., 9.75%, 04/01/2010 | | | | 200,000 | | | | 217,000 |
| Seneca Gaming Corp., 7.25%, 05/01/2012 | | | | 200,000 | | | | 212,000 |
| | | | | | | |
|
| | | | | | | | | 892,287 |
| | | | | | | |
|
See Notes to Financial Statements
11
SCHEDULE OF INVESTMENTS continued
October 31, 2004 (unaudited)
| | | | | | |
| | | Principal | | | | |
| | | Amount | | | | Value |
|
| |
| CORPORATE BONDS continued | | | | | | |
| CONSUMER DISCRETIONARY continued | | | | | | |
| Household Durables 0.2% | | | | | | |
| Meritage Corp., 9.75%, 06/01/2011 | $ | 175,000 | | $ | | 196,000 |
| Standard Pacific Corp., 7.75%, 03/15/2013 | | 175,000 | | | | 191,625 |
| WCI Communities, Inc., 9.125%, 05/01/2012 (p) | | 400,000 | | | | 446,000 |
| | | | | |
|
| | | | | | | 833,625 |
| | | | | |
|
| Internet & Catalog Retail 0.7% | | | | | | |
| InterActiveCorp., 7.00%, 01/15/2013 | | 2,000,000 | | | | 2,215,828 |
| | | | | |
|
| Media 7.4% | | | | | | |
| British Sky Broadcasting Group, 8.20%, 07/15/2009 | | 4,000,000 | | | | 4,691,448 |
| Clear Channel Communications, Inc., 5.50%, 09/15/2014 | | 4,000,000 | | | | 4,044,032 |
| Comcast Corp., 7.05%, 03/15/2033 | | 4,000,000 | | | | 4,532,896 |
| CSC Holdings, Inc., 7.625%, 04/01/2011 | | 200,000 | | | | 218,500 |
| Dex Media West LLC, 8.50%, 08/15/2010 | | 285,000 | | | | 326,325 |
| Emmis Communications Corp., 6.875%, 05/15/2012 | | 90,000 | | | | 94,950 |
| LIN TV Corp., 6.50%, 05/15/2013 | | 200,000 | | | | 207,000 |
| Mediacom Capital Corp., 9.50%, 01/15/2013 | | 135,000 | | | | 132,975 |
| Mediacom LLC, 7.875%, 02/15/2011 (p) | | 110,000 | | | | 107,250 |
| Medianews Group Inc., 6.375%, 04/01/2014 | | 175,000 | | | | 176,313 |
| News America Holdings, Inc., 7.75%, 01/20/2024 | | 4,261,000 | | | | 5,074,736 |
| R.H. Donnelley Finance Corp., 10.875%, 12/15/2012 | | 175,000 | | | | 214,812 |
| Time Warner, Inc., 6.625%, 05/15/2029 | | 4,000,000 | | | | 4,270,620 |
| | | | | |
|
| | | | | | | 24,091,857 |
| | | | | |
|
| Multi-line Retail 1.2% | | | | | | |
| May Department Stores Co., 4.80%, 07/15/2009 144A | | 4,000,000 | | | | 4,101,828 |
| | | | | |
|
| Specialty Retail 0.4% | | | | | | |
| Cole National Group, Inc., 8.875%, 05/15/2012 | | 155,000 | | | | 181,931 |
| CSK Auto, Inc., 7.00%, 01/15/2014 | | 175,000 | | | | 172,375 |
| Group 1 Automotive, Inc., 8.25%, 08/15/2013 | | 200,000 | | | | 212,500 |
| Michaels Stores, Inc., 9.25%, 07/01/2009 | | 200,000 | | | | 216,750 |
| Steinway Musical Instruments, Inc., 8.75%, 04/15/2011 | | 175,000 | | | | 191,188 |
| United Auto Group, Inc., 9.625%, 03/15/2012 | | 175,000 | | | | 195,562 |
| Warnaco Group, Inc., 8.875%, 06/15/2013 | | 200,000 | | | | 224,500 |
| | | | | |
|
| | | | | | | 1,394,806 |
| | | | | |
|
| Textiles, Apparel & Luxury Goods 0.1% | | | | | | |
| Oxford Industries, Inc., 8.875%, 06/01/2011 | | 250,000 | | | | 271,250 |
| | | | | |
|
| CONSUMER STAPLES 2.4% | | | | | | |
| Food & Staples Retailing 2.3% | | | | | | |
| Albertsons, Inc., 7.45%, 08/01/2029 | | 4,000,000 | | | | 4,619,472 |
| Couche-Tard LP, 7.50%, 12/15/2013 | | 40,000 | | | | 43,300 |
| Delhaize America, Inc., 8.125%, 04/15/2011 | | 2,000,000 | | | | 2,314,250 |
| Rite Aid Corp., 8.125%, 05/01/2010 | | 175,000 | | | | 187,688 |
| Roundy's, Inc., Ser. B, 8.875%, 06/15/2012 (p) | | 200,000 | | | | 218,500 |
| | | | | |
|
| | | | | | | 7,383,210 |
| | | | | |
|
See Notes to Financial Statements
12
SCHEDULE OF INVESTMENTS continued
October 31, 2004 (unaudited)
| | | | | | | | |
| | | | | Principal | | | | |
| | | | | Amount | | | | Value |
|
| CORPORATE BONDS continued | | | | | | | | |
| CONSUMER STAPLES continued | | | | | | | | |
| Food Products 0.1% | | | | | | | | |
| B & G Foods Holdings Corp., 8.00%, 10/01/2011 | | $ | | 10,000 | | $ | | 10,600 |
| Chiquita Brands International, Inc., 7.50%, 11/01/2014 144A | | | | 30,000 | | | | 30,900 |
| Del Monte Foods Co., 8.625%, 12/15/2012 | | | | 19,000 | | | | 21,518 |
| Dole Food Co., Inc., 7.25%, 06/15/2010 | | | | 175,000 | | | | 184,187 |
| | | | | | | |
|
| | | | | | | | | 247,205 |
| | | | | | | |
|
| Personal Products 0.0% | | | | | | | | |
| Alderwoods Group, Inc., 7.75%, 09/15/2012 144A | | | | 75,000 | | | | 81,375 |
| | | | | | | |
|
| ENERGY 5.1% | | | | | | | | |
| Energy Equipment & Services 0.1% | | | | | | | | |
| Dresser, Inc., 9.375%, 04/15/2011 | | | | 175,000 | | | | 195,125 |
| Parker Drilling Co., Ser. B, 10.125%, 11/15/2009 | | | | 100,000 | | | | 105,625 |
| | | | | | | |
|
| | | | | | | | | 300,750 |
| | | | | | | |
|
| Oil & Gas 5.0% | | | | | | | | |
| Amerada Hess Corp., 7.30%, 08/15/2031 | | | | 4,000,000 | | | | 4,516,620 |
| Chesapeake Energy Corp., 6.875%, 01/15/2016 | | | | 175,000 | | | | 188,125 |
| Duke Capital Corp., 4.37%, 03/01/2009 (p) | | | | 4,000,000 | | | | 4,059,888 |
| Evergreen Resources, Inc., 5.875%, 03/15/2012 (h) | | | | 15,000 | | | | 15,525 |
| Exco Resources, Inc., 7.25%, 01/15/2011 | | | | 30,000 | | | | 32,625 |
| Ferrellgas Escrow LLC, 6.75%, 05/01/2014 | | | | 160,000 | | | | 166,400 |
| Forest Oil Corp., 7.75%, 05/01/2014 | | | | 175,000 | | | | 192,500 |
| Frontier Oil Corp., 6.625%, 10/01/2011 144A | | | | 50,000 | | | | 52,000 |
| Husky Energy, Inc., 6.15%, 06/15/2019 | | | | 4,000,000 | | | | 4,319,680 |
| Magellan Midstream Partners LP, 6.45%, 06/01/2014 | | | | 2,500,000 | | | | 2,736,130 |
| Stone Energy Corp., 8.25%, 12/15/2011 | | | | 210,000 | | | | 228,900 |
| | | | | | | |
|
| | | | | | | | | 16,508,393 |
| | | | | | | |
|
| FINANCIALS 34.9% | | | | | | | | |
| Capital Markets 1.2% | | | | | | | | |
| Morgan Stanley Co., Inc., 4.75%, 04/01/2014 | | | | 4,000,000 | | | | 3,925,876 |
| | | | | | | |
|
| Commercial Banks 6.3% | | | | | | | | |
| FBOP Corp., 10.00%, 01/15/2009 144A | | | | 1,000,000 | | | | 1,110,000 |
| First Empire Capital Trust I, 8.23%, 02/01/2027 | | | | 3,600,000 | | | | 4,101,088 |
| Independence Community Bank Corp., FRN, 3.75%, 04/01/2014 | | | | 4,000,000 | | | | 3,903,708 |
| Keycorp, FRN, 2.30%, 07/23/2007 | | | | 4,000,000 | | | | 4,002,384 |
| Royal Bank of Scotland Group, 2.06%, 12/29/2049 | | | | 4,000,000 | | | | 3,491,148 |
| Standard Chartered plc, FRN, 2.375%, 07/29/2049 | | | | 5,000,000 | | | | 3,921,000 |
| | | | | | | |
|
| | | | | | | | | 20,529,328 |
| | | | | | | |
|
| Consumer Finance 7.0% | | | | | | | | |
| CIT Group, Inc., FRN, 1.91%, 02/15/2007 (p) | | | | 4,000,000 | | | | 4,002,084 |
| Ford Motor Credit Co., 6.50%, 01/25/2007 | | | | 5,000,000 | | | | 5,255,995 |
| HSBC Capital Funding LP, 4.61%, 12/29/2049 144A | | | | 4,000,000 | | | | 3,884,912 |
| Ohio National Financial Services, Inc., 6.35%, 04/01/2013 144A | | | | 5,000,000 | | | | 5,263,545 |
| Sprint Capital Corp., 6.875%, 11/15/2028 | | | | 4,000,000 | | | | 4,308,728 |
| | | | | | | |
|
| | | | | | | | | 22,715,264 |
| | | | | | | |
|
| See Notes to Financial Statements | | | | | | | | |
13
SCHEDULE OF INVESTMENTS continued
October 31, 2004 (unaudited)
| | | | | | |
| | | Principal | | | | |
| | | Amount | | | | Value |
|
| CORPORATE BONDS continued | | | | | | |
| FINANCIALS continued | | | | | | |
| Diversified Financial Services 4.7% | | | | | | |
| Arch Western Finance LLC, 6.75%, 07/01/2013 | $ | 200,000 | | $ | | 213,500 |
| Pemex Project Funding Master Trust, 8.625%, 02/01/2022 | | 4,000,000 | | | | 4,630,000 |
| Prudential Holdings LLC, Ser. C, 8.70%, 12/18/2023 144A | | 5,000,000 | | | | 6,455,710 |
| Textron Financial Corp., 3.35%, 04/24/2006 | | 4,000,000 | | | | 4,066,524 |
| | | | | |
|
| | | | | | | 15,365,734 |
| | | | | |
|
| Insurance 9.2% | | | | | | |
| Assurant, Inc., 6.75%, 02/15/2034 | | 4,000,000 | | | | 4,300,720 |
| Crum & Forster Holdings Corp., 10.375%, 06/15/2013 (p) | | 175,000 | | | | 188,125 |
| Fund American Companies, Inc., 5.875%, 05/15/2013 | | 4,000,000 | | | | 4,085,496 |
| Markel Corp., Ser. A, 6.80%, 02/15/2013 (p) | | 4,000,000 | | | | 4,326,888 |
| Montpelier Re Holdings, Ltd, 6.125%, 08/15/2013 | | 4,500,000 | | | | 4,698,171 |
| Monumental Global Funding, 3.90%, 06/15/2009 144A | | 4,000,000 | | | | 4,002,980 |
| RLI Corp., 5.95%, 01/15/2014 | | 4,500,000 | | | | 4,561,821 |
| XL Capital, Ltd., 5.25%, 09/15/2014 | | 4,000,000 | | | | 4,001,020 |
| | | | | |
|
| | | | | | | 30,165,221 |
| | | | | |
|
| Real Estate 5.3% | | | | | | |
| Arden Realty LP, 5.20%, 09/01/2011 | | 4,000,000 | | | | 4,076,632 |
| CB Richard Ellis Services, Inc., 9.75%, 05/15/2010 REIT | | 130,000 | | | | 148,850 |
| Crescent Real Estate Equities, 9.25%, 04/15/2009 REIT | | 185,000 | | | | 201,650 |
| FelCor Suites LP, 7.625%, 10/01/2007 REIT | | 175,000 | | | | 186,813 |
| Health Care Property Investors, Inc., 6.00%, 03/01/2015 REIT | | 4,000,000 | | | | 4,214,124 |
| Host Marriott LP, Ser. J, 7.125%, 11/01/2013 REIT | | 175,000 | | | | 189,875 |
| Kimco Realty Corp., FRN, 1.88%, 08/01/2006 | | 4,000,000 | | | | 4,004,036 |
| Omega Healthcare Investors, Inc., REIT, 7.00%, 04/01/2014 | | 35,000 | | | | 36,050 |
| OmLNR Property Corp., 7.625%, 07/15/2013 | | 175,000 | | | | 196,000 |
| Pan Pacific Retail Properties, Inc., 7.95%, 04/15/2011 REIT | | 3,250,000 | | | | 3,780,770 |
| Thornburg Mortgage, Inc., 8.00%, 05/15/2013 REIT | | 175,000 | | | | 184,625 |
| | | | | |
|
| | | | | | | 17,219,425 |
| | | | | |
|
| Thrifts & Mortgage Finance 1.2% | | | | | | |
| Countrywide Funding Corp., FRN, 2.18%, 04/12/2006 | | 4,000,000 | | | | 3,997,660 |
| | | | | |
|
| HEALTH CARE 3.0% | | | | | | |
| Health Care Equipment & Supplies 1.2% | | | | | | |
| NeighborCare, Inc., 6.875%, 11/15/2013 | | 45,000 | | | | 47,250 |
| Unitedhealth Group, Inc., 5.00%, 08/15/2014 | | 3,750,000 | | | | 3,806,280 |
| | | | | |
|
| | | | | | | 3,853,530 |
| | | | | |
|
| Health Care Providers & Services 1.8% | | | | | | |
| Extendicare Health Services, Inc., 6.875%, 05/01/2014 (p) | | 200,000 | | | | 206,500 |
| Manor Care, Inc., 6.25%, 05/01/2013 | | 5,000,000 | | | | 5,372,780 |
| Service Corporation International, 6.75%, 04/01/2016 | | 55,000 | | | | 56,925 |
| Triad Hospitals, Inc., 7.00%, 11/15/2013 | | 200,000 | | | | 206,000 |
| | | | | |
|
| | | | | | | 5,842,205 |
| | | | | |
|
See Notes to Financial Statements
14
SCHEDULE OF INVESTMENTS continued
October 31, 2004 (unaudited)
| | | | | | |
| | | Principal | | | | |
| | | Amount | | | | Value |
|
| |
| CORPORATE BONDS continued | | | | | | |
| INDUSTRIALS 7.0% | | | | | | |
| Aerospace & Defense 0.1% | | | | | | |
| Aviall, Inc., 7.625%, 07/01/2011 | $ | 155,000 | | $ | | 168,175 |
| DRS Technologies, Inc., 6.875%, 11/01/2013 | | 200,000 | | | | 211,000 |
| | | | | |
|
| | | | | | | 379,175 |
| | | | | |
|
| Airlines 1.0% | | | | | | |
| Southwest Airlines Co., 8.70%, 07/01/2011 | | 2,720,106 | | | | 3,225,868 |
| | | | | |
|
| Commercial Services & Supplies 1.7% | | | | | | |
| Adesa, Inc., 7.625%, 06/15/2012 | | 200,000 | | | | 210,000 |
| Allied Waste North America, Inc., 6.50%, 11/15/2010 (p) | | 200,000 | | | | 193,500 |
| Cenveo Corp., 7.875%, 12/01/2013 (p) | | 200,000 | | | | 194,000 |
| Geo Group, Inc., 8.25%, 07/15/2013 | | 200,000 | | | | 211,000 |
| Hines Nurseries, Inc., 10.25%, 10/01/2011 | | 190,000 | | | | 204,250 |
| Manitowoc Co., Inc., 7.125%, 11/01/2013 | | 200,000 | | | | 215,500 |
| NationsRent West, Inc., 9.50%, 10/15/2010 | | 175,000 | | | | 194,250 |
| Oakmont Asset Trust, 4.51%, 12/22/2008 144A | | 4,000,000 | | | | 4,011,624 |
| | | | | |
|
| | | | | | | 5,434,124 |
| | | | | |
|
| Construction & Engineering 2.6% | | | | | | |
| Centex Corp., Ser. E, FRN, 3.74%, 11/22/2004 | | 500,000 | | | | 500,330 |
| Lennar Corp., FRN, 2.66%, 03/19/2009 | | 4,000,000 | | | | 4,023,484 |
| Pulte Homes, Inc., 4.875%, 07/15/2009 | | 4,000,000 | | | | 4,097,084 |
| | | | | |
|
| | | | | | | 8,620,898 |
| | | | | |
|
| Industrial Conglomerates 1.3% | | | | | | |
| General Electric Co., 5.00%, 02/01/2013 | | 4,000,000 | | | | 4,153,304 |
| | | | | |
|
| Machinery 0.3% | | | | | | |
| Case New Holland, Inc., 9.25%, 08/01/2011 144A | | 400,000 | | | | 458,000 |
| Cummins, Inc., 9.50%, 12/01/2010 | | 20,000 | | | | 23,050 |
| Navistar International Corp., 7.50%, 06/15/2011 | | 95,000 | | | | 103,075 |
| Terex Corp., 7.375%, 01/15/2014 | | 190,000 | | | | 204,250 |
| Wolverine Tube, Inc., 7.375%, 08/01/2008 144A | | 200,000 | | | | 199,000 |
| | | | | |
|
| | | | | | | 987,375 |
| | | | | |
|
| Transportation Infrastructure 0.0% | | | | | | |
| Offshore Logistics, Inc., 6.125%, 06/15/2013 | | 200,000 | | | | 208,000 |
| | | | | |
|
| INFORMATION TECHNOLOGY 1.4% | | | | | | |
| IT Services 1.4% | | | | | | |
| First Data Corp., 3.90%, 10/01/2009 | | 4,000,000 | | | | 4,019,300 |
| Iron Mountain, Inc., 6.625%, 01/01/2016 | | 175,000 | | | | 175,000 |
| Stratus Technologies, Inc., 10.375%, 12/01/2008 | | 200,000 | | | | 171,000 |
| Unisys Corp., 6.875%, 03/15/2010 | | 200,000 | | | | 215,000 |
| | | | | |
|
| | | | | | | 4,580,300 |
| | | | | |
|
See Notes to Financial Statements
15
SCHEDULE OF INVESTMENTS continued
October 31, 2004 (unaudited)
| | | | | | |
| | | Principal | | | | |
| | | Amount | | | | Value |
|
| |
| CORPORATE BONDS continued | | | | | | |
| MATERIALS 2.5% | | | | | | |
| Chemicals 0.5% | | | | | | |
| Airgas, Inc., 9.125%, 10/01/2011 | $ | 175,000 | | $ | | 197,750 |
| Equistar Chemicals LP, 10.625%, 05/01/2011 | | 200,000 | | | | 232,000 |
| FMC Corp., 10.25%, 11/01/2009 | | 175,000 | | | | 203,875 |
| Huntsman Advanced Materials LLC: | | | | | | |
| 11.00%, 07/15/2010 144A | | 38,000 | | | | 44,080 |
| 11.625%, 10/15/2010 | | 175,000 | | | | 207,156 |
| Lyondell Chemical Co., 9.50%, 12/15/2008 | | 175,000 | | | | 191,625 |
| Millennium America, Inc., 9.25%, 06/15/2008 | | 200,000 | | | | 224,000 |
| Nalco Co., 7.75%, 11/15/2011 | | 165,000 | | | | 179,438 |
| Scotts Co., 6.625%, 11/15/2013 | | 200,000 | | | | 212,000 |
| | | | | |
|
| | | | | | | 1,691,924 |
| | | | | |
|
| Containers & Packaging 0.3% | | | | | | |
| Crown Cork & Seal Co., Inc., 7.375%, 12/15/2026 (p) | | 175,000 | | | | 161,000 |
| Graphic Packaging International, Inc., 8.50%, 08/15/2011 | | 175,000 | | | | 198,187 |
| Norampac, Inc., 6.75%, 06/01/2013 | | 200,000 | | | | 212,000 |
| Owens-Brockway Glass Container, Inc., 8.875%, 02/15/2009 | | 175,000 | | | | 192,938 |
| Stone Container Corp., 9.75%, 02/01/2011 | | 100,000 | | | | 112,000 |
| | | | | |
|
| | | | | | | 876,125 |
| | | | | |
|
| Metals & Mining 0.1% | | | | | | |
| Century Aluminum Co., 7.50%, 08/15/2014 144A | | 60,000 | | | | 63,900 |
| Foundation Pennsylvania Coal Co., 7.25%, 08/01/2014 144A | | 80,000 | | | | 85,900 |
| Peabody Energy Corp., 5.875%, 04/15/2016 | | 65,000 | | | | 66,625 |
| U.S. Steel LLC, 10.75%, 08/01/2008 | | 114,000 | | | | 135,660 |
| | | | | |
|
| | | | | | | 352,085 |
| | | | | |
|
| Paper & Forest Products 1.6% | | | | | | |
| Boise Cascade LLC, 7.125%, 10/15/2014 144A | | 25,000 | | | | 26,220 |
| Buckeye Technologies, Inc., 8.50%, 10/01/2013 | | 100,000 | | | | 111,000 |
| Georgia Pacific Corp., 8.125%, 05/15/2011 | | 200,000 | | | | 234,500 |
| Meadwestvaco Corp., 6.80%, 11/15/2032 | | 4,400,000 | | | | 4,708,647 |
| | | | | |
|
| | | | | | | 5,080,367 |
| | | | | |
|
| TELECOMMUNICATION SERVICES 2.5% | | | | | | |
| Diversified Telecommunication Services 2.4% | | | | | | |
| Bellsouth Telecommunications, 6.125%, 09/23/2008 | | 2,950,000 | | | | 3,191,605 |
| Insight Midwest LP, 10.50%, 11/01/2010 (p) | | 175,000 | | | | 194,687 |
| Qwest Corp., 7.875%, 09/01/2011 144A | | 90,000 | | | | 96,300 |
| Verizon, Inc., 7.375%, 04/01/2032 (p) | | 4,000,000 | | | | 4,546,084 |
| | | | | |
|
| | | | | | | 8,028,676 |
| | | | | |
|
| Wireless Telecommunication Services 0.1% | | | | | | |
| Nextel Communications, Inc., 5.95%, 03/15/2014 | | 200,000 | | | | 205,500 |
| Rural Cellular Corp., 8.25%, 03/15/2012 144A | | 15,000 | | | | 15,825 |
| | | | | |
|
| | | | | | | 221,325 |
| | | | | |
|
See Notes to Financial Statements
16
SCHEDULE OF INVESTMENTS continued
October 31, 2004 (unaudited)
| | | | | | |
| | | Principal | | | | |
| | | Amount | | | | Value |
|
| CORPORATE BONDS continued | | | | | | |
| UTILITIES 4.1% | | | | | | |
| Electric Utilities 1.4% | | | | | | |
| FirstEnergy Corp., Ser. B, 6.45%, 11/15/2011 | $ | 4,000,000 | | $ | | 4,388,948 |
| | | | | |
|
| Multi-Utilities & Unregulated Power 2.7% | | | | | | |
| Constellation Energy Group, Inc., 4.55%, 06/15/2015 | | 4,000,000 | | | | 3,829,376 |
| Dominion Resources, Inc., FRN, 2.01%, 05/15/2006 | | 2,010,000 | | | | 2,015,236 |
| NRG Energy, Inc., 8.00%, 12/15/2013 144A | | 75,000 | | | | 82,969 |
| Pacific Gas & Electric Corp., FRN, 2.72%, 04/03/2006 | | 2,750,000 | | | | 2,753,718 |
| Reliant Resources, Inc., 9.50%, 07/15/2013 | | 200,000 | | | | 226,000 |
| | | | | |
|
| | | | | | | 8,907,299 |
| | | | | |
|
| Total Corporate Bonds (cost $243,913,875) | | | | | | 250,366,388 |
| | | | | |
|
| U.S. GOVERNMENT & AGENCY OBLIGATIONS 0.1% | | | | | | |
| FHLMC: | | | | | | |
| 6.00%, 01/01/2032 | | 14,898 | | | | 15,450 |
| 7.50%, 09/01/2013-05/01/2015 | | 149,517 | | | | 158,852 |
| | | | | |
|
| Total U.S. Government & Agency Obligations (cost $171,018) | | | | | | 174,302 |
| | | | | |
|
| WHOLE LOAN SUBORDINATE COLLATERALIZED MORTGAGE | | | | | | |
| OBLIGATIONS 0.4% | | | | | | |
| Fixed Rate 0.4% | | | | | | |
| Financial Asset Securitization, Inc., Ser. 1997-NAM2, Class B-2, 7.88%, 07/25/2027 | | | | | | |
| (cost $1,176,871) | | 1,145,634 | | | | 1,145,045 |
| | | | | |
|
| YANKEE OBLIGATIONS-CORPORATE 11.1% | | | | | | |
| CONSUMER STAPLES 2.8% | | | | | | |
| Beverages 2.8% | | | | | | |
| CIA Brasileira de Bebidas, 8.75%, 09/15/2013 | | 4,000,000 | | | | 4,560,000 |
| SABMiller plc, 6.625%, 08/15/2033 144A | | 4,000,000 | | | | 4,516,824 |
| | | | | |
|
| | | | | | | 9,076,824 |
| | | | | |
|
| ENERGY 1.1% | | | | | | |
| Oil & Gas 1.1% | | | | | | |
| Encana Corp., 4.60%, 08/15/2009 | | 3,500,000 | | | | 3,608,094 |
| | | | | |
|
| HEALTH CARE 0.1% | | | | | | |
| Pharmaceuticals 0.1% | | | | | | |
| Jean Coutu Group, Inc., 8.50%, 08/01/2014 144A (p) | | 150,000 | | | | 153,750 |
| | | | | |
|
| INDUSTRIALS 1.3% | | | | | | |
| Industrial Conglomerates 1.3% | | | | | | |
| Tyco International Group SA, 6.00%, 11/15/2013 | | 4,000,000 | | | | 4,377,560 |
| | | | | |
|
| INFORMATION TECHNOLOGY 0.0% | | | | | | |
| Electronic Equipment & Instruments 0.0% | | | | | | |
| Celestica, Inc., 7.875%, 07/01/2011 | | 95,000 | | | | 102,125 |
| | | | | |
|
See Notes to Financial Statements
17
SCHEDULE OF INVESTMENTS continued
October 31, 2004 (unaudited)
| | | | | | | | |
| | | | | Principal | | | | |
| | | | | Amount | | | | Value |
|
| YANKEE OBLIGATIONS-CORPORATE continued | | | | | | | | |
| MATERIALS 0.7% | | | | | | | | |
| Paper & Forest Products 0.7% | | | | | | | | |
| Millar Western Forest Products, Ltd., 7.75%, 11/15/2013 144A | | $ | | 20,000 | | $ | | 21,450 |
| Nexfor, Inc., 7.25%, 07/01/2012 | | | | 2,000,000 | | | | 2,248,918 |
| | | | | | | |
|
| | | | | | | | | 2,270,368 |
| | | | | | | |
|
| TELECOMMUNICATION SERVICES 2.9% | | | | | | | | |
| Diversified Telecommunication Services 2.8% | | | | | | | | |
| Telecom Italia SpA, 4.00%, 01/15/2010 144A | | | | 5,000,000 | | | | 4,959,230 |
| Telefonos De Mexico SA, 4.50%, 11/19/2008 | | | | 4,000,000 | | | | 4,045,244 |
| | | | | | | |
|
| | | | | | | | | 9,004,474 |
| | | | | | | |
|
| Wireless Telecommunication Services 0.1% | | | | | | | | |
| Rogers Cantel, Inc., 9.75%, 06/01/2016 | | | | 200,000 | | | | 231,000 |
| Rogers Wireless, Inc., 6.375%, 03/01/2014 | | | | 175,000 | | | | 168,000 |
| | | | | | | |
|
| | | | | | | | | 399,000 |
| | | | | | | |
|
| UTILITIES 2.2% | | | | | | | | |
| Electric Utilities 1.3% | | | | | | | | |
| Transalta Corp, 5.75%, 12/15/2013 | | | | 4,000,000 | | | | 4,183,276 |
| | | | | | | |
|
| Oil & Gas 0.9% | | | | | | | | |
| Petrobras International Finance Co., 8.375%, 12/10/2018 (p) | | | | 3,000,000 | | | | 3,030,000 |
| | | | | | | |
|
| Total Yankee Obligations-Corporate (cost $35,089,914) | | | | | | | | 36,205,471 |
|
| | | | | Shares | | | | Value |
|
| PREFERRED STOCKS 1.2% | | | | | | | | |
| FINANCIALS 1.2% | | | | | | | | |
| Diversified Financial Services 1.2% | | | | | | | | |
| Zurich Regcaps Funding Trust V 144A (cost $3,762,908) | | | | 4,000 | | | | 3,800,000 |
| | | | | | | |
|
| MUTUAL FUND SHARES 1.2% | | | | | | | | |
| PIMCO High Income Fund (cost $3,831,373) | | | | 257,000 | | | | 3,862,710 |
|
| | | | | Principal | | | | |
| | | | | Amount | | | | Value |
|
| SHORT-TERM INVESTMENTS 6.1% | | | | | | | | |
| U.S. TREASURY OBLIGATION 0.3% | | | | | | | | |
| U.S. Treasury Bills, 1.97%, 11/12/2004 + ƒ | | $ | | 1,200,000 | | | | 1,199,483 |
| | | | | | | |
|
See Notes to Financial Statements
18
SCHEDULE OF INVESTMENTS continued
October 31, 2004 (unaudited)
| | | | | | |
| | | Shares | | | | Value |
|
| SHORT-TERM INVESTMENTS continued | | | | | | |
| MUTUAL FUND SHARES 5.8% | | | | | | |
| Evergreen Institutional Money Market Fund ø | | 5,790,147 | | $ | | 5,790,147 |
| Navigator Prime Portfoli (p) (p) | | 13,089,590 | | | | 13,089,590 |
| | | | | |
|
| | | | | | | 18,879,737 |
| | | | | |
|
| Total Short-Term Investments (cost $20,079,220) | | | | | | 20,079,220 |
| | | | | |
|
| Total Investments (cost $328,494,357) 103.1% | | | | | | 336,361,530 |
| Other Assets and Liabilities (3.1%) | | | | | | (10,047,638) |
| | | | | |
|
| Net Assets 100.0% | | | | $ | | 326,313,892 |
| | | | | |
|
| | |
| 144A | | Security that may be sold to qualified institutional buyers under Rule 144A of the Securities Act of 1933, as amended. |
| | | This security has been determined to be liquid under guidelines established by the Board of Trustees. |
| (h) | | No market quotation available. Valued at fair value as determined in good faith under procedures established by the |
| | | Board of Trustees. |
| (p) | | All or a portion of this security is on loan. |
| + | | Rate shown represents the yield to maturity at date of purchase. |
| ƒ | | All or a portion of the principal amount of this security was pledged to cover initial margin requirements for open |
| | | futures contracts. |
| ø | | Evergreen Investment Management Company, LLC is the investment advisor to both the Fund and the money market |
| | | fund. |
| (p)(p) | | Represents investment of cash collateral received from securities on loan. |
| |
| Summary of Abbreviations |
| FHLMC | Federal Home Loan Mortgage Corp. |
| FRN | Floating Rate Note |
| REIT | Real Estate Investment Trust |
The following table shows the percent of total bonds by credit quality based on Moody's and Standard & Poor's ratings as of October 31, 2004:
| | |
| AAA | | 3.5% |
| AA | | 2.3% |
| A | | 23.9% |
| BBB | | 57.1% |
| BB | | 4.1% |
| B | | 5.1% |
| NR | | 4.0% |
| |
|
| | | 100.0% |
| | |
|
The following table shows the percent of total bonds by maturity as of October 31, 2004:
| | |
| Less than 1 year | | 2.9% |
| 1 to 3 year(s) | | 11.3% |
| 3 to 5 years | | 15.0% |
| 5 to 10 years | | 39.7% |
| 10 to 20 years | | 12.6% |
| 20 to 30 years | | 17.6% |
| Greater than 30 years | | 0.9% |
| |
|
| | | 100.0% |
| | |
|
See Notes to Financial Statements
19
STATEMENT OF ASSETS AND LIABILITIES
October 31, 2004 (unaudited)
| | | | |
| Assets | | | | |
| Investments in securities, at value (cost $328,494,357) including | | | | |
| $12,870,076 of securities loaned | | $ | | 336,361,530 |
| Receivable for Fund shares sold | | | | 37,583 |
| Interest and dividends receivable | | | | 4,296,155 |
| Receivable for daily variation margin on open futures contracts | | | | 40,000 |
| Receivable for securities lending income | | | | 684 |
| Prepaid expenses and other assets | | | | 141,682 |
|
| Total assets | | | | 340,877,634 |
|
| Liabilities | | | | |
| Dividends payable | | | | 450,631 |
| Payable for securities purchased | | | | 11,952 |
| Payable for Fund shares redeemed | | | | 933,789 |
| Payable for securities on loan | | | | 13,089,590 |
| Advisory fee payable | | | | 7,081 |
| Distribution Plan expenses payable | | | | 11,393 |
| Due to other related parties | | | | 2,753 |
| Accrued expenses and other liabilities | | | | 56,553 |
|
| Total liabilities | | | | 14,563,742 |
|
| Net assets | | $ | | 326,313,892 |
|
| Net assets represented by | | | | |
| Paid-in capital | | $ | | 368,809,909 |
| Overdistributed net investment income | | | | (1,766,715) |
| Accumulated net realized losses on securities, foreign currency | | | | |
| related transactions and futures contracts | | | | (48,623,306) |
| Net unrealized gains on securities, foreign currency | | | | |
| related transactions and futures contracts | | | | 7,894,004 |
|
| Total net assets | | $ | | 326,313,892 |
|
| Net assets consists of | | | | |
| Class A | | $ | | 264,231,174 |
| Class B | | | | 24,665,791 |
| Class C | | | | 34,691,520 |
| Class I | | | | 2,725,407 |
|
| Total net assets | | $ | | 326,313,892 |
|
| Shares outstanding | | | | |
| Class A | | | | 17,556,015 |
| Class B | | | | 1,638,833 |
| Class C | | | | 2,304,988 |
| Class I | | | | 181,080 |
|
| Net asset value per share | | | | |
| Class A | | $ | | 15.05 |
| Class A - Offering price (based on sales charge of 4.75%) | | $ | | 15.80 |
| Class B | | $ | | 15.05 |
| Class C | | $ | | 15.05 |
| Class I | | $ | | 15.05 |
|
See Notes to Financial Statements
20
STATEMENT OF OPERATIONS
Six Months Ended October 31, 2004 (unaudited)
| | | | |
| Investment income | | | | |
| Interest | | $ | | 8,743,097 |
| Dividends | | | | 348,311 |
|
| Total investment income | | | | 9,091,408 |
|
| Expenses | | | | |
| Advisory fee | | | | 704,320 |
| Distribution Plan expenses | | | | |
| Class A | | | | 396,815 |
| Class B | | | | 124,875 |
| Class C | | | | 181,106 |
| Administrative services fee | | | | 164,084 |
| Transfer agent fees | | | | 340,514 |
| Trustees' fees and expenses | | | | 2,396 |
| Printing and postage expenses | | | | 20,885 |
| Custodian and accounting fees | | | | 45,945 |
| Registration and filing fees | | | | 17,969 |
| Professional fees | | | | 10,002 |
| Other | | | | 7,697 |
|
| Total expenses | | | | 2,016,608 |
| Less: Expense reductions | | | | (3,097) |
| Fee waivers | | | | (194,520) |
|
| Net expenses | | | | 1,818,991 |
|
| Net investment income | | | | 7,272,417 |
|
| Net realized and unrealized gains or losses on securities, foreign currency related | | | | |
| transactions and futures contracts | | | | |
| Net realized gains or losses on: | | | | |
| Securities | | | | (4,404,823) |
| Foreign currency related transactions | | | | 43,543 |
| Futures contracts | | | | (706,250) |
|
| Net realized losses on securities, foreign currency related transactions and futures contracts | | | | (5,067,530) |
| Net change in unrealized gains or losses on securities, foreign currency related transactions | | | | |
| and futures contracts | | | | 11,624,602 |
|
| Net realized and unrealized gains or losses on securities, foreign currency related transactions | | | | |
| and futures contracts | | | | 6,557,072 |
|
| Net increase in net assets resulting from operations | | $ | | 13,829,489 |
|
See Notes to Financial Statements
21
STATEMENTS OF CHANGES IN NET ASSETS
| | | | | | | | |
| | | Six MonthsEnded | | | | |
| | | October31, 2004 | | YearEnded |
| | | (unaudited) | | April 30,2004 |
|
| Operations | | | | | | | | |
| Net investment income | | | $ | 7,272,417 | | | $ | 16,856,806 |
| Net realized gains or losses on securities, | | | | | | | | |
| foreign currency related transactions | | | | | | | | |
| and futures contracts | | | | (5,067,530) | | | | 5,586,344 |
| Net change in unrealized gains or losses | | | | | | | | |
| on securities, foreign currency related | | | | | | | | |
| transactions and futures contracts | | | | 11,624,602 | | | | (15,614,330) |
|
| Net increase in net assets resulting from | | | | | | | | |
| operations | | | | 13,829,489 | | | | 6,828,820 |
|
| Distributions to shareholders from | | | | | | | | |
| Net investment income | | | | | | | | |
| Class A | | | | (6,484,963) | | | | (15,198,914) |
| Class B | | | | (524,893) | | | | (1,186,466) |
| Class C | | | | (762,510) | | | | (1,898,544) |
| Class I | | | | (64,436) | | | | (162,471) |
|
| Total distributions to shareholders | | | | (7,836,802) | | | | (18,446,395) |
|
| | | Shares | | | | Shares | | |
| Capital share transactions | | | | | | | | |
| Proceeds from shares sold | | | | | | | | |
| Class A | | 122,259 | | 1,802,296 | | 362,207 | | 5,511,500 |
| Class B | | 108,171 | | 1,582,362 | | 451,342 | | 6,871,941 |
| Class C | | 33,623 | | 490,322 | | 307,989 | | 4,687,644 |
| Class I | | 32,511 | | 474,813 | | 69,019 | | 1,049,350 |
|
| | | | | 4,349,793 | | | | 18,120,435 |
|
| Net asset value of shares issued in | | | | | | | | |
| reinvestment of distributions | | | | | | | | |
| Class A | | 277,245 | | 4,094,531 | | 611,529 | | 9,254,418 |
| Class B | | 20,331 | | 300,187 | | 44,009 | | 665,861 |
| Class C | | 34,006 | | 502,009 | | 81,748 | | 1,237,149 |
| Class I | | 1,092 | | 16,136 | | 1,518 | | 22,947 |
|
| | | | | 4,912,863 | | | | 11,180,375 |
|
| Automatic conversion of Class B shares | | | | | | | | |
| to Class A shares | | | | | | | | |
| Class A | | 8,792 | | 128,527 | | 27,179 | | 413,022 |
| Class B | | (8,792) | | (128,527) | | (27,179) | | (413,022) |
|
| | | | | 0 | | | | 0 |
|
| Payment for shares redeemed | | | | | | | | |
| Class A | | (1,523,111) | | (22,389,918) | | (3,504,087) | | (53,099,113) |
| Class B | | (229,405) | | (3,370,791) | | (506,299) | | (7,674,174) |
| Class C | | (368,758) | | (5,431,742) | | (898,190) | | (13,598,071) |
| Class I | | (8,996) | | (130,414) | | (126,148) | | (1,885,559) |
|
| | | | | (31,322,865) | | | | (76,256,917) |
|
| Net decrease in net assets resulting | | | | | | | | |
| from capital share transactions | | | | (22,060,209) | | | | (46,956,107) |
|
| Total decrease in net assets | | | | (16,067,522) | | | | (58,573,682) |
| Net assets | | | | | | | | |
| Beginning of period | | | | 342,381,414 | | | | 400,955,096 |
|
| End of period | | | $ | 326,313,892 | | | $ | 342,381,414 |
|
| Overdistributed net investment income | | | $ | (1,766,715) | | | $ | (483,222) |
|
See Notes to Financial Statements
22
NOTES TO FINANCIAL STATEMENTS (unaudited)
1. ORGANIZATION
Evergreen Diversified Bond Fund (the "Fund") is a diversified series of Evergreen Fixed Income Trust (the "Trust"), a Delaware statutory trust organized on September 18, 1997. The Trust is an open-end management investment company registered under the Investment Company Act of 1940, as amended (the "1940 Act").
The Fund offers Class A, Class B, Class C and Institutional ("Class I") shares. Class A shares are sold with a front-end sales charge. However, Class A share investments of $1 million or more are not subject to a front-end sales charge but will be subject to a contingent deferred sales charge of 1.00% upon redemption within one year. Class B shares are sold without a front-end sales charge but are subject to a contingent deferred sales charge that is payable upon redemption and decreases depending on how long the shares have been held. Effective February 2, 2004, Class C shares are no longer sold with a front-end sales charge but are still subject to a contingent deferred sales charge that is payable upon redemption within one year. Class I shares are sold without a front-end sales charge or contingent deferred sales charge. Each class of shares, except Class I shares, pays an ongoing distribution fee.
2. SIGNIFICANT ACCOUNTING POLICIES
The following is a summary of significant accounting policies consistently followed by the Fund in the preparation of its financial statements. The policies are in conformity with generally accepted accounting principles in the United States of America, which require management to make estimates and assumptions that affect amounts reported herein. Actual results could differ from these estimates.
a. Valuation of investments
Portfolio debt securities acquired with more than 60 days to maturity are valued at prices obtained from an independent pricing service which takes into consideration such factors as similar security prices, yields, maturities, liquidity and ratings. Securities for which valuations are not readily available from an independent pricing service may be valued by brokers which use prices provided by market makers or estimates of market value obtained from yield data relating to investments or securities with similar characteristics.
Listed equity securities are usually valued at the last sales price or official closing price on the national securities exchange where the securities are principally traded.
Short-term securities with remaining maturities of 60 days or less at the time of purchase are valued at amortized cost, which approximates market value.
Investments in other mutual funds are valued at net asset value. Securities for which market quotations are not readily available or not reflective of current market value are valued at fair value as determined in good faith, according to procedures approved by the Board of Trustees.
b. Foreign currency translation
All assets and liabilities denominated in foreign currencies are translated into U.S. dollar amounts at the date of valuation. Purchases and sales of portfolio securities and income items denominated
23
NOTES TO FINANCIAL STATEMENTS (unaudited) continued
in foreign currencies are translated into U.S. dollar amounts on the respective dates of such transactions. The Fund does not separately account for that portion of the results of operations resulting from changes in foreign exchange rates on investments and the fluctuations arising from changes in market prices of securities held. Such fluctuations are included with the net realized and unrealized gains or losses on securities.
c. Futures contracts
In order to gain exposure to or protect against changes in security values, the Fund may buy and sell futures contracts. The primary risks associated with the use of futures contracts are the imperfect correlation between changes in market values of securities held by the Fund and the prices of futures contracts, and the possibility of an illiquid market.
Futures contracts are valued based upon their quoted daily settlement prices. The aggregate principal amounts of the contracts are not recorded in the financial statements. Fluctuations in the value of the contracts are recorded in the Statement of Assets and Liabilities as an asset or liability and in the Statement of Operations as unrealized gains or losses until the contracts are closed, at which point they are recorded as net realized gains or losses on futures contracts.
d. When-issued and delayed delivery transactions
The Fund records when-issued or delayed delivery securities as of trade date and maintains security positions such that sufficient liquid assets will be available to make payment for the securities purchased. Securities purchased on a when-issued or delayed delivery basis are marked-to-market daily and begin earning interest on the settlement date. Losses may occur on these transactions due to changes in market conditions or the failure of counterparties to perform under the contract.
e. Securities lending
The Fund may lend its securities to certain qualified brokers in order to earn additional income. The Fund receives compensation in the form of fees or interest earned on the investment of any cash collateral received. The Fund also continues to receive interest and dividends on the securities loaned. The Fund receives collateral in the form of cash or securities with a market value at least equal to the market value of the securities on loan, including accrued interest. In the event of default or bankruptcy by the borrower, the Fund could experience delays and costs in recovering the loaned securities or in gaining access to the collateral. The Fund has the right under the lending agreement to recover the securities from the borrower on demand.
f. Security transactions and investment income
Security transactions are recorded on trade date. Realized gains and losses are computed using the specific cost of the security sold. Interest income is recorded on the accrual basis and includes accretion of discounts and amortization of premiums. Dividend income is recorded on the ex-dividend date or in the case of some foreign securities, on the date when the Fund is made aware of the dividend. Foreign income and capital gains realized on some securities may be subject to foreign taxes, which are accrued as applicable.
24
NOTES TO FINANCIAL STATEMENTS (unaudited) continued
g. Federal taxes
The Fund intends to continue to qualify as a regulated investment company and distribute all of its taxable income, including any net capital gains (which have already been offset by available capital loss carryovers). Accordingly, no provision for federal taxes is required.
h. Distributions
Distributions to shareholders from net investment income are accrued daily and paid monthly. Distributions from net realized gains, if any, are recorded on the ex-dividend date. Such distributions are determined in conformity with income tax regulations, which may differ from generally accepted accounting principles.
i. Class allocations
Income, common expenses and realized and unrealized gains and losses are allocated to the classes based on the relative net assets of each class. Distribution fees, if any, are calculated daily at the class level based on the appropriate net assets of each class and the specific expense rates applicable to each class.
3. ADVISORY FEE AND OTHER TRANSACTIONS WITH AFFILIATES
Evergreen Investment Management Company, LLC ("EIMC"), an indirect, wholly-owned subsidiary of Wachovia Corporation ("Wachovia"), is the investment advisor to the Fund and is paid a fee at an annual rate of 2% of the Fund's gross investment income plus an amount determined by applying percentage rates to the average daily net assets of the Fund, starting at 0.31% and declining to 0.16% as average daily net assets increase.
From time to time, EIMC may voluntarily or contractually waive its fee and/or reimburse expenses in order to limit operating expenses. For fee waivers and/or reimbursements made after January 1, 2003, EIMC may recoup certain amounts waived and/or reimbursed up to a period of three years following the end of the fiscal year in which the fee waivers and/or reimbursements were made. During the six months ended October 31, 2004, EIMC waived its fee in the amount of $194,520, which represents 0.12% of the Fund's average daily net assets (on an annualized basis). As of October 31, 2004 the Fund had $205,505 in advisory fee waivers subject to recoupment.
Evergreen Investment Services, Inc. ("EIS"), an indirect, wholly-owned subsidiary of Wachovia, is the administrator to the Fund. As administrator, EIS provides the Fund with facilities, equipment and personnel and is paid an annual rate determined by applying percentage rates to the aggregate average daily net assets of the Evergreen funds (excluding money market funds), starting at 0.10% and declining to 0.05% as the aggregate average daily net assets of the Evergreen funds (excluding money market funds) increase.
Evergreen Service Company, LLC ("ESC"), an indirect, wholly-owned subsidiary of Wachovia, is the transfer and dividend disbursing agent for the Fund. ESC receives account fees that vary based on the type of account held by the shareholders in the Fund. For the six months ended October 31, 2004, the transfer agent fees were equivalent to an annual rate of 0.21% of the Fund's average daily net assets.
25
NOTES TO FINANCIAL STATEMENTS (unaudited) continued
4. DISTRIBUTION PLANS
EIS also serves as distributor of the Fund's shares. The Fund has adopted Distribution Plans, as allowed by Rule 12b-1 of the 1940 Act, for each class of shares, except Class I. Under the Distribution Plans, distribution fees are paid at an annual rate of 0.30% of the average daily net assets for Class A shares, and 1.00% of the average daily net assets for each of Class B and Class C shares.
For the six months ended October 31, 2004, EIS received $2,814 from the sale of Class A shares and $58,685 and $4,739 in contingent deferred sales charges from redemptions of Class B and Class C shares, respectively.
5. SECURITIES TRANSACTIONS
Cost of purchases and proceeds from sales of investment securities (excluding short-term securities) were as follows for the six months ended October 31, 2004:
| | | | | | |
| Cost of Purchases | | Proceeds from Sales |
|
| U.S. | | Non-U.S. | | U.S. | | Non-U.S. |
| Government | | Government | | Government | | Government |
|
| $ 9,057,566 | | $ 280,354,218 | | $ 11,500,905 | | $ 302,578,688 |
|
At October 31, 2004, the Fund had open short futures contracts outstanding as follows:
| | | | | | | | |
| | | | | Initial Contract | | Value at | | Unrealized |
| Expiration | | Contracts | | Amount | | October 31, 2004 | | Loss |
|
| December 2004 | | 150 U.S. Treasury | | $ 16,834,406 | | $ 17,034,375 | | $ 199,969 |
| | | Notes Futures | | | | | | |
|
At October 31, 2004, the Fund had open long futures contracts outstanding as follows:
| | | | | | | | |
| | | | | Initial Contract | | Value at | | Unrealized |
| Expiration | | Contracts | | Amount | | October 31, 2004 | | Gain |
|
| December 2004 | | 140 U.S. Treasury | | $ 15,711,325 | | $ 15,938,125 | | $ 226,800 |
| | | Bonds Futures | | | | | | |
|
During the six months ended October 31, 2004, the Fund loaned securities to certain brokers. At October 31, 2004, the value of securities on loan and the value of collateral (including accrued interest) amounted to $12,870,076 and $13,089,590, respectively. During the six months ended October 31, 2004, the Fund earned $14,665 in income from securities lending which is included in interest income on the Statement of Operations.
On October 31, 2004, the aggregate cost of securities for federal income tax purposes was $328,578,095. The gross unrealized appreciation and depreciation on securities based on tax cost was $9,037,543 and $1,254,108, respectively, with a net unrealized appreciation of $7,783,435.
26
As of April 30, 2004, the Fund had $42,634,473 in capital loss carryovers for federal income tax purposes expiring as follows:
| | | | | | |
| Expiration |
|
| 2007 | | 2008 | | 2009 | | 2010 |
|
| $ 7,055,922 | | $19,652,642 | | $ 11,338,929 | | $ 4,586,980 |
|
6. INTERFUND LENDING
Pursuant to an Exemptive Order issued by the SEC, the Fund may participate in an interfund lending program with certain funds in the Evergreen fund family. This program allows the Fund to borrow from, or lend money to, other participating funds. During the six months ended October 31, 2004, the Fund did not participate in the interfund lending program.
7. EXPENSE REDUCTIONS
Through expense offset arrangements with ESC and the Fund's custodian, a portion of fund expenses has been reduced.
8. DEFERRED TRUSTEES' FEES
Each Trustee of the Fund may defer any or all compensation related to performance of their duties as Trustees. The Trustees' deferred balances are allocated to deferral accounts, which are included in the accrued expenses for the Fund. The investment performance of the deferral accounts are based on the investment performance of certain Evergreen funds. Any gains earned or losses incurred in the deferral accounts are reported in the Fund's Trustees' fees and expenses. At the election of the Trustees, the deferral account will be paid either in one lump sum or in quarterly installments for up to ten years.
9. FINANCING AGREEMENT
The Fund and certain other Evergreen funds share in a $150 million unsecured revolving credit commitment for temporary and emergency purposes, including the funding of redemptions, as permitted by each participating fund's borrowing restrictions. Borrowings under this facility bear interest at 0.50% per annum above the Federal Funds rate. All of the participating funds are charged an annual commitment fee of 0.09% of the unused balance, which is allocated pro rata. During the six months ended October 31, 2004, the Fund had no borrowings under this agreement.
10. LITIGATION
From time to time, the Fund and EIMC are involved in various legal actions in the normal course of business. In EIMC's opinion, based upon the opinions of counsel, the Fund is not involved in any legal action that will have a material effect on the Fund's financial position and results of operations.
11. REGULATORY MATTERS
Since September 2003, governmental and self-regulatory authorities have instituted numerous ongoing investigations of various practices in the mutual fund industry, including investigations
27
NOTES TO FINANCIAL STATEMENTS (unaudited) continued
relating to revenue sharing, market-timing, late trading and record retention, among other things. The investigations cover investment advisors, distributors and transfer agents to mutual funds, as well as other firms. EIMC, EIS and ESC (collectively, "Evergreen") have received subpoenas and other requests for documents and testimony relating to these investigations, are endeavoring to comply with those requests, and are cooperating with the investigations. Evergreen is continuing its own internal review of policies, practices, procedures and personnel, and is taking remedial action where appropriate.
In connection with one of these investigations, on July 28, 2004, the staff of the Securities and Exchange Commission ("SEC") informed Evergreen that the staff intends to recommend to the SEC that it institute an enforcement action against Evergreen. The SEC staff's proposed allegations relate to (i) an arrangement pursuant to which a broker at one of EIMC's affiliated broker-dealers had been authorized, apparently by an EIMC officer (no longer with EIMC), to engage in short-term trading, on behalf of a client, in Evergreen Mid Cap Growth Fund (formerly Evergreen Small Company Growth Fund and prior to that, known as Evergreen Emerging Growth Fund) during the period from December 2000 through April 2003, in excess of the limitations set forth in this fund's prospectus, (ii) short-term trading from September 2001 through January 2003, by a former Evergreen portfolio manager of Evergreen Precious Metals Fund, a fund he managed at the time, (iii) the sufficiency of systems for monitoring exchanges and enforcing exchange limitations as stated in each fund's prospectuses, and (iv) the adequacy of e-mail retention practices. In connection with the activity in Evergreen Mid Cap Growth Fund, EIMC reimbursed this fund $378,905, plus an additional $25,242, representing what EIMC calculated at that time to be the client's net gain and the fees earned by EIMC and the expenses incurred by this fund on the client's account. In connection with the activity in Evergreen Precious Metals Fund, EIMC reimbursed this fund $70,878, plus an additional $3,075, representing what EIMC calculated at that time to be the portfolio manager's net gain and the fees earned by EIMC and expenses incurred by this fund on the portfolio manager's account. Evergreen currently intends to make a written Wells submission explaining why it believes that no such enforcement action should be instituted, and Evergreen is engaging in discussions with the staff of the SEC concerning its recommendation.
Any resolution of these matters with regulatory authorities may include, but not be limited to, sanctions, penalties or injunctions regarding Evergreen, restitution to mutual fund shareholders and/or other financial penalties and structural changes in the governance or management of Evergreen's mutual fund business. Any penalties or restitution will be paid by Evergreen and not by the Evergreen funds.
Evergreen does not believe the foregoing investigations and action will have a material adverse impact on the Evergreen funds. There can be no assurance, however, that these matters and any publicity surrounding or resulting from them will not result in reduced sales or increased redemptions of fund shares, which could increase fund transaction costs or operating expenses, or have other adverse consequences on the Evergreen funds.
28
NOTES TO FINANCIAL STATEMENTS (unaudited) continued
12. SUBSEQUENT EVENT
The Board of Trustees for Vestaur Securities Fund (AMEX:VES) has approved a proposal brought to them by EIMC to reorganize Vestaur Securities Fund into Class I shares of the Fund.
The merger is subject to approval by the Board of Trustees of the Fund, which is expected to consider the proposal at a meeting being held January 13, 2005. EIMC will recommend the approval of this proposal to the Board of Trustees. If the Evergreen Board approves the merger, existing shareholders of Vestaur Securities Fund will be notified and given the opportunity to vote on the transaction.
29
This page left intentionally blank
30
This page left intentionally blank
31
TRUSTEES AND OFFICERS
TRUSTEES1
| | |
| Charles A. Austin III | | Principal occupations: Investment Counselor, Anchor Capital Advisors, Inc. (investment advice); |
| Trustee | | Director, The Andover Companies (insurance); Trustee, Arthritis Foundation of New England; |
| DOB: 10/23/1934 | | Director, The Francis Ouimet Society; Former Director, Health Development Corp. (fitness- |
| Term of office since: 1991 | | wellness centers); Former Director, Mentor Income Fund, Inc.; Former Trustee, Mentor Funds and |
| | | Cash Resource Trust; Former Investment Counselor, Appleton Partners, Inc. (investment advice); |
| Other directorships: None | | Former Director, Executive Vice President and Treasurer, State Street Research & Management |
| | | Company (investment advice) |
|
| |
| Shirley L. Fulton | | Principal occupations: Partner, Helms, Henderson & Fulton, P.A. (law firm); Retired Senior |
| Trustee | | Resident Superior Court Judge, 26th Judicial District, Charlotte, NC |
| DOB: 1/10/1952 | | |
| Term of office since: 2004 | | |
| Other directorships: None | | |
|
| |
| K. Dun Gifford | | Principal occupations: Chairman and President, Oldways Preservation and Exchange Trust |
| Trustee | | (education); Trustee, Treasurer and Chairman of the Finance Committee, Cambridge College; |
| DOB: 10/23/1938 | | Former Chairman of the Board, Director, and Executive Vice President, The London Harness |
| Term of office since: 1974 | | Company (leather goods purveyor); Former Director, Mentor Income Fund, Inc.; Former Trustee, |
| | | Mentor Funds and Cash Resource Trust |
| Other directorships: None | | |
|
| |
| Dr. Leroy Keith, Jr. | | Principal occupations: Partner, Stonington Partners, Inc. (private investment firm); Trustee of |
| Trustee | | Phoenix Series Fund, Phoenix Multi-Portfolio Fund, and The Phoenix Big Edge Series Fund; |
| DOB: 2/14/1939 | | Former Chairman of the Board and Chief Executive Officer, Carson Products Company |
| Term of office since: 1983 | | (manufacturing); Director, Obagi Medical Products Co.; Director, Lincoln Educational Services; |
| | | Director, Diversapack Co.; Former President, Morehouse College; Former Director, Mentor |
| Other directorships: Trustee, | | Income Fund, Inc.; Former Trustee, Mentor Funds and Cash Resource Trust |
| Phoenix Series Fund, Phoenix | | |
| Multi-Portfolio Fund, and The | | |
| Phoenix Big Edge Series Fund | | |
|
| |
| Gerald M. McDonnell | | Principal occupations: Manager of Commercial Operations, SMI STEEL Co. – South Carolina |
| Trustee | | (steel producer); Former Sales and Marketing Management, Nucor Steel Company; Former |
| DOB: 7/14/1939 | | Director, Mentor Income Fund, Inc.; Former Trustee, Mentor Funds and Cash Resource Trust |
| Term of office since: 1988 | | |
| Other directorships: None | | |
|
| |
| William Walt Pettit | | Principal occupations: Partner and Vice President, Kellam & Pettit, P.A. (law firm); Former |
| Trustee | | Director, Mentor Income Fund, Inc.; Former Trustee, Mentor Funds and Cash Resource Trust |
| DOB: 8/26/1955 | | |
| Term of office since: 1984 | | |
| Other directorships: None | | |
|
| |
| David M. Richardson | | Principal occupations: President, Richardson, Runden LLC (executive recruitment business |
| Trustee | | development/consulting company); Consultant, Kennedy Information, Inc. (executive |
| DOB: 9/19/1941 | | recruitment information and research company); Consultant, AESC (The Association of Retained |
| Term of office since: 1982 | | Executive Search Consultants); Trustee, NDI Technologies, LLP (communications); Director, J&M |
| | | Cumming Paper Co. (paper merchandising); Former Vice Chairman, DHR International, Inc. |
| Other directorships: None | | (executive recruitment); Former Director, Mentor Income Fund, Inc.; Former Trustee, Mentor |
| | | Funds and Cash Resource Trust |
|
| |
| Dr. Russell A. Salton III | | Principal occupations: President/CEO, AccessOne MedCard; Former Medical Director, Healthcare |
| Trustee | | Resource Associates, Inc.; Former Medical Director, U.S. Health Care/Aetna Health Services; |
| DOB: 6/2/1947 | | Former Director, Mentor Income Fund, Inc.; Former Trustee, Mentor Funds and Cash Resource |
| Term of office since: 1984 | | Trust |
| Other directorships: None | | |
|
32
TRUSTEES AND OFFICERS continued
| | |
| Michael S. Scofield | | Principal occupations: Attorney, Law Offices of Michael S. Scofield; Former Director, Mentor |
| Trustee | | Income Fund, Inc.; Former Trustee, Mentor Funds and Cash Resource Trust |
| DOB: 2/20/1943 | | |
| Term of office since: 1984 | | |
| Other directorships: None | | |
|
| |
| Richard J. Shima | | Principal occupations: Independent Consultant; Director, Trust Company of CT; Trustee, Saint |
| Trustee | | Joseph College (CT); Director, Hartford Hospital; Trustee, Greater Hartford YMCA; Former |
| DOB: 8/11/1939 | | Director, Enhance Financial Services, Inc.; Former Director, Old State House Association; Former |
| Term of office since: 1993 | | Director of CTG Resources, Inc. (natural gas); Former Director, Mentor Income Fund, Inc.; Former |
| | | Trustee, Mentor Funds and Cash Resource Trust |
| Other directorships: None | | |
|
| |
| Richard K. Wagoner, CFA 2 | | Principal occupations: Member and Former President, North Carolina Securities Traders |
| Trustee | | Association; Member, Financial Analysts Society; Former Consultant to the Boards of Trustees of |
| DOB: 12/12/1937 | | the Evergreen funds; Former Trustee, Mentor Funds and Cash Resource Trust |
| Term of office since: 1999 | | |
| Other directorships: None | | |
|
| |
| OFFICERS | | |
| |
| Dennis H. Ferro 3 | | Principal occupations: President and Chief Executive Officer, Evergreen Investment Company, |
| President | | Inc. and Executive Vice President, Wachovia Bank, N.A.; former Chief Investment Officer, |
| DOB: 6/20/1945 | | Evergreen Investment Company, Inc. |
| Term of office since: 2003 | | |
|
| |
| Carol Kosel 4 | | Principal occupations: Senior Vice President, Evergreen Investment Services, Inc. |
| Treasurer | | |
| DOB: 12/25/1963 | | |
| Term of office since: 1999 | | |
|
| |
| Michael H. Koonce 4 | | Principal occupations: Senior Vice President and General Counsel, Evergreen Investment |
| Secretary | | Services, Inc.; Senior Vice President and Assistant General Counsel, Wachovia Corporation |
| DOB: 4/20/1960 | | |
| Term of office since: 2000 | | |
|
| |
| James Angelos 4 | | Principal occupations: Chief Compliance Officer and Senior Vice President, Evergreen Funds; |
| Chief Compliance Officer | | Former Director of Compliance, Evergreen Investment Services, Inc. |
| DOB: 9/2/1947 | | |
| Term of office since: 2004 | | |
|
| |
| 1 | Each Trustee serves until a successor is duly elected or qualified or until his death, resignation, retirement or removal from office. Each |
| | Trustee oversees 93 Evergreen funds. Correspondence for each Trustee may be sent to Evergreen Board of Trustees, P.O. Box 20083, |
| | Charlotte, North Carolina 28202. |
| 2 | Mr. Wagoner is an "interested person" of the Fund because of his ownership of shares in Wachovia Corporation, the parent to the |
| | Fund's investment advisor. |
| 3 | The address of the Officer is 401 S. Tryon Street, 20th Floor, Charlotte, NC 28288. |
| 4 | The address of the Officer is 200 Berkeley Street, Boston, MA 02116. |
| | Additional information about the Fund's Board of Trustees and Officers can be found in the Statement of Additional Information (SAI) and |
| | is available upon request without charge by calling 800.343.2898. |
33
564353 rv2 12/2004
Evergreen High Yield Bond Fund

| | |
| table of contents |
| 1 | | LETTER TO SHAREHOLDERS |
| 4 | | FUND AT A GLANCE |
| 6 | | ABOUT YOUR FUND'S EXPENSES |
| 7 | | FINANCIAL HIGHLIGHTS |
| 11 | | SCHEDULE OF INVESTMENTS |
| 21 | | STATEMENT OF ASSETS AND LIABILITIES |
| 22 | | STATEMENT OF OPERATIONS |
| 23 | | STATEMENTS OF CHANGES IN NET ASSETS |
| 24 | | NOTES TO FINANCIAL STATEMENTS |
| 32 | | TRUSTEES AND OFFICERS |
This semiannual report must be preceded or accompanied by a prospectus of the Evergreen fund contained herein. The prospectus contains more complete information, including fees and expenses, and should be read carefully before investing or sending money.
The fund will file its complete schedule of portfolio holdings with the SEC for the first and third quarters of each fiscal year on Form N-Q. The fund's Form N-Q will be available on the SEC's Web site at http://www.sec.gov. In addition, the fund's Form N-Q may be reviewed and copied at the SEC's Public Reference Room in Washington, D.C. Information on the operation of the Public Reference Room may be obtained by calling 800.SEC.0330.
A description of the fund's proxy voting policies and procedures is available without charge, upon request, by calling 800.343.2898, by visiting our Web site at EvergreenInvestments.com or by visiting the SEC's Web site at http://www.sec.gov.
Information relating to how the fund voted proxies relating to portfolio securities during the most recent 12-month period ended June 30 is available by visiting our Web site at EvergreenInvestments.com or by visiting the SEC's Web site at http://www.sec.gov.
Mutual Funds:
| | | | |
| NOT FDIC INSURED | | MAY LOSE VALUE | | NOT BANK GUARANTEED |
Evergreen InvestmentsSM is a service mark of Evergreen Investment Management Company, LLC. Copyright 2004.
Evergreen mutual funds are distributed by Evergreen Investment Services, Inc. 200 Berkeley Street, Boston, MA 02116
LETTER TO SHAREHOLDERS
December 2004

Dennis H. Ferro
President and Chief
Executive Officer
|
Dear Shareholder,
We are pleased to provide the semiannual report for the Evergreen High Yield Bond Fund, which covers the six-month period ended October 31, 2004.
Our fixed income portfolio teams entered the investment period with a major decision to make regarding the magnitude of potential changes in monetary policy. Since the Federal Reserve had kept its target for the benchmark federal funds rate at a 46-year low of 1% for more than nine months, most investors agreed that rates were headed higher. The key was by how much, and what impact that would have on the level of market interest rates. Considering that the federal funds rate was significantly below that of inflation, we determined that the Federal Reserve would be true to its word, and enact a "measured" removal of policy accommodation.
The period began with positive momentum on the economic front. First quarter Gross Domestic Product ("GDP") grew in excess of 4%, and supporting data pointed to a continuation of solid growth. Retail sales were strong and manufacturing had managed to put together several months of consistent growth. The solid contributions from business investment, meanwhile, had enabled the expansion to broaden, reinforcing the trend for sustainable economic growth. The next key for the recovery would come in the form of employment growth, which has historically lagged that of GDP growth. This recovery was no exception, and fears of a jobless recovery had persisted for months. Yet that too also improved, as the investment period began with consecutive monthly payroll gains in excess of 300,000 jobs.
1
LETTER TO SHAREHOLDERS continued
The bond market quickly sent investors a message: be careful what you wish for. After having fretted for months about a jobless recovery, the sudden large number of jobs being created and the threat of higher wage inflation sent market yields dramatically higher last spring. In addition to the improvement in employment, the Federal Reserve had been preparing Wall Street for higher interest rates. Monetary policymakers began the second quarter with a new "spin" on their message to the public, stating that they would remain "measured" in their removal of policy accommodation. Despite these attempts at improved clarity from the Federal Reserve, other factors emerged to drive yields higher during the first part of the investment period. Indeed, interest rate concerns were exacerbated by rising gasoline prices and the larger than forecast readings on consumer inflation during May and June.
As it turned out, the advent of the Federal Reserve's gradual tightening cycle proved to be the tonic that the markets needed. As with many issues confronting investors in recent years, clarity bested uncertainty, and the bond market responded favorably to the prospects of only slightly higher interest rates. Monetary policy officials were also making the rounds in speeches reiterating their intentions to remain "measured" in the removal of policy accommodation. In addition, economic data began to moderate. The pace of job growth slowed and the inflation fears of June had dissipated by September. Despite higher oil prices, inflation reports were becoming less threatening, suggesting that oil would ultimately prove a drag on growth, rather than ignite inflation.
Other factors served to reward a variety of fixed income categories in recent months. For example, the uncertain geopolitical environment and the weaker dollar resulted in higher domestic and international demand for the perceived safety of U.S. government bonds, and the yield on the 10-year Treasury hovered around 4% at the close of the third quarter, despite the likelihood of higher federal deficits. Mortgages also benefited from the reduced prepayment risk in their portfolios, and high yield bonds continued to attract attention given
2
LETTER TO SHAREHOLDERS continued
their income potential and the low default risk. Solid corporate balance sheets and earnings potential enabled many investment grade corporate bonds to also strengthen as the investment period progressed. Indeed, despite the rate hikes from the Federal Reserve, prices firmed for a variety of asset classes within the fixed income market during the latter half of the investment period.
In this environment, we continue to recommend diversified fixed income strategies for long-term investment portfolios.
Please visit our Web site, EvergreenInvestments.com, for more information about our funds and other investment products available to you. Thank you for your continued support of Evergreen Investments.
Sincerely,

Dennis H. Ferro
President and Chief Executive Officer
Evergreen Investment Company, Inc.
|
Special Notice to Shareholders:
Please visit our Web site at EvergreenInvestments.com for statements from President and Chief Executive Officer, Dennis Ferro, and Chairman of the Board of the Evergreen Funds, Michael S. Scofield, addressing recent SEC actions involving the Evergreen Funds.
3
FUND AT A GLANCE
as of October 31, 2004
MANAGEMENT TEAM

Dana Erikson, CFA
High Yield Bond Team Lead Manager
CURRENT INVESTMENT STYLE

Source: Morningstar, Inc.
Morningstar's style box is based on a portfolio date as of 9/30/2004.
The fixed income style box placement is based on a fund's average effective maturity or duration and the average credit rating of the bond portfolio.
PERFORMANCE AND RETURNS
Portfolio inception date: 9/11/1935
| | | | | | | | |
| | | Class A | | Class B | | Class C | | Class I |
| Class inception date | | 1/20/1998 | | 9/11/1935 | | 1/21/1998 | | 4/14/1998 |
|
| Nasdaq symbol | | EKHAX | | EKHBX | | EKHCX | | EKHYX |
|
| 6-month return with sales charge | | 0.08% | | -0.33% | | 3.67% | | N/A |
|
| 6-month return w/o sales charge | | 5.04% | | 4.67% | | 4.67% | | 5.20% |
|
| Average annual return* | | | | | | | | |
|
| 1-year with sales charge | | 4.72% | | 4.20% | | 8.20% | | N/A |
|
| 1-year w/o sales charge | | 9.96% | | 9.20% | | 9.20% | | 10.29% |
|
| 5-year | | 5.81% | | 5.77% | | 6.06% | | 7.12% |
|
| 10-year | | 5.99% | | 5.97% | | 5.97% | | 6.66% |
|
* Adjusted for maximum applicable sales charge, unless noted.
Past performance is no guarantee of future results. The performance quoted represents past performance and current performance may be lower or higher. The investment return and principal value of an investment will fluctuate so that investors' shares, when redeemed, may be worth more or less than their original cost. To obtain performance information current to the most recent month-end for Classes A, B, C or I, please go to EvergreenInvestments.com/fundperformance. The performance of each class may vary based on differences in loads, fees and expenses paid by the shareholders investing in each class. The maximum applicable sales charge is 4.75% for Class A, 5.00% for Class B and 1.00% for Class C. Class I is not subject to a sales charge. Performance includes the reinvestment of income dividends and capital gain distributions. Performance shown does not reflect the deduction of taxes that a shareholder would pay on fund distributions or the redemption of fund shares.
Historical performance shown for Classes A, C and I prior to their inception is based on the performance of Class B, the original class offered. The historical returns for Classes A and I have not been adjusted to reflect the effect of each class' 12b-1 fee. These fees are 0.30% for Class A and 1.00% for Classes B and C. Class I does not pay a 12b-1 fee. If these fees had been reflected, returns for Classes A and I would have been higher.
Returns reflect expense limits previously in effect, without which returns would have been lower.
4
FUND AT A GLANCE continued

Comparison of a $10,000 investment in the Evergreen High Yield Bond Fund Class A shares, versus a similar investment in the Merrill Lynch High Yield Master Index1 (MLHYMI) and the Consumer Price Index (CPI).
The MLHYMI is an unmanaged market index and does not include transaction costs associated with buying and selling securities, any mutual fund expenses or any taxes. The CPI is a commonly used measure of inflation and does not represent an investment return. It is not possible to invest directly in an index.
1 Copyright 2004. Merrill Lynch, Pierce, Fenner & Smith Incorporated. All rights reserved.
Class I shares are only offered to investment advisory clients of an investment advisor of an Evergreen fund (or its advisory affiliates), through special arrangements entered into on behalf of Evergreen funds with certain financial services firms, certain institutional investors and persons who owned Class Y shares in registered name in an Evergreen fund on or before December 31, 1994. Class I shares are only available to institutional shareholders with a minimum $1 million investment.
The fund's investment objective is nonfundamental and may be changed without the vote of the fund's shareholders.
Funds that invest in high yield, lower-rated bonds may contain more risk due to the increased possibility of default.
Foreign investments may contain more risk due to the inherent risks associated with changing political climates, foreign market instability and foreign currency fluctuations.
The return of principal is not guaranteed due to fluctuation in the NAV of the fund caused by changes in the price of the individual bonds held by the fund and the buying and selling of bonds by the fund. Bond funds have the same inflation, interest rate and credit risks that are associated with the individual bonds held by the fund.
All data is as of October 31, 2004, and subject to change.
5
ABOUT YOUR FUND'S EXPENSES
The Example below is intended to describe the fees and expenses borne by shareholders and the impact of those costs on your investment.
Example
As a shareholder of the fund, you incur two types of costs: (1) transaction costs, including sales charges (loads), redemption fees and exchange fees; and (2) ongoing costs, including management fees, distribution (12b-1) fees and other fund expenses. This Example is intended to help you understand your ongoing costs (in dollars) of investing in the fund and to compare these costs with the ongoing costs of investing in other mutual funds. The Example is based on an investment of $1,000 invested at the beginning of the period and held for the entire period from May 1, 2004 to October 31, 2004.
The example illustrates your fund's costs in two ways:
• Actual expenses
The section in the table under the heading "Actual" provides information about actual account values and actual expenses. You may use the information in these columns, together with the amount you invested, to estimate the expenses that you paid over the period. Simply divide your account value by $1,000 (for example, an $8,600 account value divided by $1,000 = 8.6), then multiply the result by the number in the appropriate column for your share class, in the column entitled "Expenses Paid During Period" to estimate the expenses you paid on your account during this period.
• Hypothetical example for comparison purposes
The section in the table under the heading "Hypothetical (5% return before expenses)" provides information about hypothetical account values and hypothetical expenses based on the fund's actual expense ratio and an assumed rate of return of 5% per year before expenses, which is not the fund's actual return. The hypothetical account values and expenses may not be used to estimate the actual ending account balance or expenses you paid for the period. You may use this information to compare the ongoing costs of investing in the fund and other funds. To do so, compare this 5% hypothetical example with the 5% hypothetical examples that appear in the shareholder reports of the other funds.
Please note that the expenses shown in the table are meant to highlight your ongoing costs only and do not reflect any transactional costs, such as sales charges (loads), redemption fees or exchange fees. Therefore, the section in the table under the heading "Hypothetical (5% return before expenses)" is useful in comparing ongoing costs only, and will not help you determine the relative total costs of owning different funds. In addition, if these transactional costs were included, your costs would have been higher.
| | | | | | |
| | | Beginning | | Ending | | |
| | | Account | | Account | | Expenses |
| | | Value | | Value | | Paid During |
| | | 5/1/2004 | | 10/31/2004 | | Period* |
|
| Actual | | | | | | |
| Class A | | $ 1,000.00 | | $ 1,050.38 | | $ 5.27 |
| Class B | | $ 1,000.00 | | $ 1,046.71 | | $ 8.87 |
| Class C | | $ 1,000.00 | | $ 1,046.71 | | $ 8.87 |
| Class I | | $ 1,000.00 | | $ 1,051.95 | | $ 3.72 |
| Hypothetical | | | | | | |
| (5% return | | | | | | |
| before expenses) | | | | | | |
| Class A | | $ 1,000.00 | | $ 1,020.06 | | $ 5.19 |
| Class B | | $ 1,000.00 | | $ 1,016.53 | | $ 8.74 |
| Class C | | $ 1,000.00 | | $ 1,016.53 | | $ 8.74 |
| Class I | | $ 1,000.00 | | $ 1,021.58 | | $ 3.67 |
|
| * | For each class of the Fund, expenses are equal to the annualized expense ratio of each class (1.02% for Class A, 1.72% for Class B, 1.72% for Class C and 0.72% for Class I), multiplied by the average account value over the period, multiplied by 184 / 365 days. |
| |
6
FINANCIAL HIGHLIGHTS
(For a share outstanding throughout each period)
| | | | | | | | | | | | | | |
| | | | | | | | | | | | | |
| | | Six Months Ended | | Year Ended April 30, |
| | October 31, 2004 | |
|
| CLASS A | | (unaudited)1 | | 2004 | | 2003 1 | | 2002 2 | | 2001 | | 2000 |
|
| Net asset value, beginning of period | | | | $3.43 | | $ 3.30 | | $ 3.29 | | $ 3.39 | | $ 3.72 | | $ 4.06 |
|
| Income from investment operations | | | | | | | | | | | | | | |
| Net investment income | | | | 0.12 | | 0.25 | | 0.27 | | 0.27 | | 0.33 | | 0.34 |
Net realized and unrealized gains
or losses on securities and foreign | | | | | | | | | | | | | | |
| currency related transactions | | | | 0.05 | | 0.14 | | 0.01 | | (0.09 ) | | (0.33 ) | | (0.32 ) |
| | | |
| |
| |
| |
| |
| |
|
| Total from investment operations | | | | 0.17 | | 0.39 | | 0.28 | | 0.18 | | 0 | | 0.02 |
|
| Distributions to shareholders from | | | | | | | | | | | | | | |
| Net investment income | | | | (0.13 ) | | (0.26 ) | | (0.27 ) | | (0.28 ) | | (0.33 ) | | (0.33 ) |
| Tax basis return of capital | | | | 0 | | 0 | | 0 | | 0 | | 0 | | (0.03) |
| | | |
| |
| |
| |
| |
| |
|
| Total distributions to shareholders | | | | (0.13) | | (0.26) | | (0.27) | | (0.28) | | (0.33) | | (0.36) |
|
| Net asset value, end of period | | | | $3.47 | | $ 3.43 | | $ 3.30 | | $ 3.29 | | $ 3.39 | | $ 3.72 |
|
| Total return 3 | | | | 5.04% | | 12.25 % | | 9.42% | | 5.77% | | 0.15% | | 0.38% |
|
| Ratios and supplemental data | | | | | | | | | | | | | | |
| Net assets, end of period (thousands) | | $516,757 | | $530,526 | | $484,346 | | $321,830 | | $322,330 | | $291,575 |
| Ratios to average net assets | | | | | | | | | | | | | | |
| Expenses 4 | | | | 1.02% 5 | | 1.01% | | 1.11% | | 1.19% | | 1.25% | | 1.27% |
| Net investment income | | | | 7.26 % 5 | | 7.42 % | | 8.70 % | | 8.27 % | | 9.39 % | | 8.57 % |
| Portfolio turnover rate | | | | 27% | | 71% | | 80% | | 138% | | 140% | | 107% |
|
| 1 Net investment income per share is based on average shares outsta nding during the period. |
2 As required, effective May 1, 2001, the Fund adopted the pr ovisions of the AICPA Audit and Accounting Guide, Audits of Investment
Companies, and began amortizing prem ium on its fixed-income |
securities. The effects of this change for the year ended April 30, 2002 was a decrease in net investment income per share of $0.00;
an increase in net realized gains or losses per share of $0.00; and a |
| decrease to the ratio of net investment income to average net assets of 0.13%. |
| 3 Excluding applicable sales charges |
| 4 The ratio of expenses to average net assets excludes expense reductions but includes fee waivers and/or expense reimbursements. |
| 5 Annualized |
See Notes to Financial Statements
7
FINANCIAL HIGHLIGHTS
(For a share outstanding throughout each period)
| | | | | | | | | | | | | | |
| | | | | | | | | | | | | |
| | | Six Months Ended | | Year Ended April 30, |
| | October 31, 2004 | |
|
| CLASS B | | (unaudited) | | 2004 1 | | 2003 1 | | 2002 1,2 | | 2001 | | 2000 1 |
|
| Net asset value, beginning of period | | | | $3.43 | | $ 3.30 | | $ 3.29 | | $ 3.39 | | $ 3.72 | | $ 4.06 |
|
| Income from investment operations | | | | | | | | | | | | | | |
| Net investment income | | | | 0.11 | | 0.23 | | 0.25 | | 0.24 | | 0.34 | | 0.31 |
Net realized and unrealized gains
or losses on securities and foreign | | | | | | | | | | | | | | |
| currency related transactions | | | | 0.05 | | 0.14 | | 0.01 | | (0.08 ) | | (0.37 ) | | (0.32 ) |
| | | |
| |
| |
| |
| |
| |
|
| Total from investment operations | | | | 0.16 | | 0.37 | | 0.26 | | 0.16 | | (0.03) | | (0.01) |
|
| Distributions to shareholders from | | | | | | | | | | | | | | |
| Net investment income | | | | (0.12 ) | | (0.24 ) | | (0.25 ) | | (0.26 ) | | (0.30 ) | | (0.30 ) |
| Tax basis return of capital | | | | 0 | | 0 | | 0 | | 0 | | 0 | | (0.03) |
| | | |
| |
| |
| |
| |
| |
|
| Total distributions to shareholders | | | | (0.12) | | (0.24) | | (0.25) | | (0.26) | | (0.30) | | (0.33) |
|
| Net asset value, end of period | | | | $3.47 | | $ 3.43 | | $ 3.30 | | $ 3.29 | | $ 3.39 | | $ 3.72 |
|
| Total return 3 | | | | 4.67% | | 11.46 % | | 8.61% | | 4.98% | | (0.60%) | | (0.37%) |
|
| Ratios and supplemental data | | | | | | | | | | | | | | |
| Net assets, end of period (thousands) | | $238,634 | | $247,741 | | $173,002 | | $54,537 | | $33,844 | | $28,229 |
| Ratios to average net assets | | | | | | | | | | | | | | |
| Expenses 4 | | | | 1.72% 5 | | 1.72% | | 1.84% | | 1.92% | | 2.00% | | 2.02% |
| Net investment income | | | | 6.56 % 5 | | 6.71 % | | 7.99 % | | 7.49 % | | 8.61 % | | 7.79 % |
| Portfolio turnover rate | | | | 27% | | 71% | | 80% | | 138% | | 140% | | 107% |
|
| 1 Net investment income per share is based on average shares outsta nding during the period. |
2 As required, effective May 1, 2001, the Fund has adopted the provisions of the AICPA A udit and Accounting Guide, Audits of Investment Companies,
and began amortizing premium on its fixed-income |
securities. The effects of this change for the year ended April 30, 2002 was a decrease in net investment income per share of $0.01; an increase
in net realized gains or losses per share of $0.01; and a |
decrease to the ratio of net investment income to average net assets of 0.13%. The above per share information, ratios and supp lemental data for
the periods prior to May 1, 2001 have not been |
| restated to reflect this change in presentation. |
| 3 Excluding applicable sales charges. |
| 4 The ratio of expenses to average net assets excludes expense reductions but includes fee waivers and/or expense reimbursements. |
| 5 Annualized |
See Notes to Financial Statements
8
FINANCIAL HIGHLIGHTS
(For a share outstanding throughout each period)
| | | | | | | | | | | | | | |
| | | | | | | | | | | | | |
| | | Six Months Ended | | Year Ended April 30, |
| | October31, 2004 | |
|
| CLASS C | | (unaudited) | | 2004 | | 2003 1 | | 2002 2 | | 2001 | | 2000 |
|
| Net asset value, beginning of period | | | | $3.43 | | $ 3.30 | | $ 3.29 | | $ 3.39 | | $ 3.72 | | $ 4.06 |
|
| Income from investment operations | | | | | | | | | | | | | | |
| Net investment income | | | | 0.11 | | 0.23 | | 0.25 | | 0.26 | | 0.29 | | 0.32 |
Net realized and unrealized gains
or losses on securities and foreign | | | | | | | | | | | | | | |
| currency related transactions | | | | 0.05 | | 0.14 | | 0.01 | | (0.10 ) | | (0.32 ) | | (0.33 ) |
| | | |
| |
| |
| |
| |
| |
|
| Total from investment operations | | | | 0.16 | | 0.37 | | 0.26 | | 0.16 | | (0.03) | | (0.01) |
|
| Distributions to shareholders from | | | | | | | | | | | | | | |
| Net investment income | | | | (0.12 ) | | (0.24 ) | | (0.25 ) | | (0.26 ) | | (0.30 ) | | (0.30 ) |
| Tax basis return of capital | | | | 0 | | 0 | | 0 | | 0 | | 0 | | (0.03) |
| | | |
| |
| |
| |
| |
| |
|
| Total distributions to shareholders | | | | (0.12) | | (0.24) | | (0.25) | | (0.26) | | (0.30) | | (0.33) |
|
| Net asset value, end of period | | | | $3.47 | | $ 3.43 | | $ 3.30 | | $ 3.29 | | $ 3.39 | | $ 3.72 |
|
| Total return 3 | | | | 4.67% | | 11.46 % | | 8.61% | | 4.98% | | (0.60%) | | (0.37%) |
|
| Ratios and supplemental data | | | | | | | | | | | | | | |
| Net assets, end of period (thousands) | | $342,038 | | $381,525 | | $290,914 | | $105,753 | | $80,753 | | $3,172 |
| Ratios to average net assets | | | | | | | | | | | | | | |
| Expenses 4 | | | | 1.72% 5 | | 1.72% | | 1.85% | | 1.93% | | 2.00% | | 2.00% |
| Net investment income | | | | 6.57 % 5 | | 6.72 % | | 7.98 % | | 7.52 % | | 8.61 % | | 7.80 % |
| Portfolio turnover rate | | | | 27% | | 71% | | 80% | | 138% | | 140% | | 107% |
|
| 1 Net investment income per share is based on average shares outsta nding during the period. |
2 As required, effective May 1, 2001, the Fund has adopted the provisions of the AICPA A udit and Accounting Guide, Audits of Investment Companies,
and began amortizing premium on its fixed-income |
securities. The effects of this change for the year ended April 30, 2002 was a decrease in net investment income per share of $0.00; and increase
in net realized gains or losses per share of $0.00; and |
a decrease to the ratio of net investment income to average net assets of 0.13%. The above per share information, ra tios and supplemental data
for the periods prior to May 1, 2001 have not been |
| restated to reflect this change in presentation. |
| 3 Excluding applicable sales charges. |
| 4 The ratio of expenses to average net assets excludes expense reductions but includes fee waivers and/or expense reimbursements. |
| 5 Annualized |
See Notes to Financial Statements
9
FINANCIAL HIGHLIGHTS
(For a share outstanding throughout each period)
| | | | | | | | | | | | |
| | | | | | | | | | | | | |
| | | Six Months Ended | | Year Ended April 30, |
| | October 31, 2004 | |
|
| CLASS I 1 | | (unaudited) | | 2004 | | 2003 2 | | 2002 3 | | 2001 | | 2000 |
|
| Net asset value, beginning of period | | $ 3.43 | | $ 3.30 | | $ 3.29 | | $ 3.39 | | $ 3.72 | | $ 4.06 |
|
| Income from investment operations | | | | | | | | | | | | |
| Net investment income | | 0.13 | | 0.26 | | 0.28 | | 0.29 | | 0.34 | | 0.35 |
Net realized and unrealized gains
or losses on securities and foreign | | | | | | | | | | | | |
| currency related transactions | | 0.04 | | 0.14 | | 0.01 | | (0.10 ) | | (0.33 ) | | (0.32 ) |
| |
| |
| |
| |
| |
| |
|
| Total from investment operations | | 0.17 | | 0.40 | | 0.29 | | 0.19 | | 0.01 | | 0.03 |
|
| Distributions to shareholders from | | | | | | | | | | | | |
| Net investment income | | (0.13 ) | | (0.27 ) | | (0.28 ) | | (0.29 ) | | (0.34 ) | | (0.34 ) |
| Tax basis return of capital | | 0 | | 0 | | 0 | | 0 | | 0 | | (0.03) |
| |
| |
| |
| |
| |
| |
|
| Total distributions to shareholders | | (0.13) | | (0.27) | | (0.28) | | (0.29) | | (0.34) | | (0.37) |
|
| Net asset value, end of period | | $ 3.47 | | $ 3.43 | | $ 3.30 | | $ 3.29 | | $ 3.39 | | $ 3.72 |
|
| Total return | | 5.20% | | 12.58 % | | 9.69% | | 6.04% | | 0.40% | | 0.64% |
|
| Ratios and supplemental data | | | | | | | | | | | | |
| Net assets, end of period (thousands) | | $43,872 | | $37,894 | | $49,370 | | $10,011 | | $6,047 | | $6,153 |
| Ratios to average net assets | | | | | | | | | | | | |
| Expenses 4 | | 0.72% 5 | | 0.72% | | 0.84% | | 0.92% | | 1.00% | | 1.01% |
| Net investment income | | 7.55 % 5 | | 7.73 % | | 9.05 % | | 8.53 % | | 9.63 % | | 8.87 % |
| Portfolio turnover rate | | 27% | | 71% | | 80% | | 138% | | 140% | | 107% |
|
| 1 Effective at the close of business on May 11, 2001, Class Y sh ares were renamed as Institutional shares (Class I). |
| 2 Net investment income per share is based on average shares outsta nding during the period. |
3 As required, effective May 1, 2001, the Fund has adopted the provisions of the AICPA A udit and Accounting Guide,
Audits of Investment Companies, and began amortizing premium on its fixed-income |
securities. The effects of this change for the year ended April 30, 2002 was a decrease in net investment income
per share of $0.00; an increase in net realized gains or losses per share of $0.00; and a |
decrease to the ratio of net investment income to average net assets of 0.13%. The above per share information,
ratios and supp lemental data for the periods prior to May 1, 2001 have not been |
| restated to reflect this change in presentation. |
| 4 The ratio of expenses to average net assets excludes expense reductions but includes fee waivers and/or expense reimbursements. |
| 5 Annualized |
See Notes to Financial Statements
10
SCHEDULE OF INVESTMENTS
October 31, 2004 (unaudited)
| | | | | | |
| | | Principal | | | | |
| | | Amount | | | | Value |
|
| |
| CORPORATE BONDS 83.7% | | | | | | |
| CONSUMER DISCRETIONARY 26.4% | | | | | | |
| Auto Components 3.9% | | | | | | |
| ArvinMeritor, Inc., 6.80%, 02/15/2009 (p) | | $ 8,998,000 | | $ | | 9,222,950 |
| Collins & Aikman Products Co.: | | | | | | |
| 10.75%, 12/31/2011 (p) | | 3,715,000 | | | | 3,724,288 |
| 12.875%, 08/15/2012 144A (p) | | 4,900,000 | | | | 4,263,000 |
| Dura Operating Corp., Ser. B, 8.625%, 04/15/2012 (p) | | 6,000,000 | | | | 6,217,500 |
| RJ Tower Corp., 12.00%, 06/01/2013 (p) | | 8,200,000 | | | | 5,781,000 |
| Tenneco Automotive, Inc., Ser. B, 10.25%, 07/15/2013 (p) | | 6,540,000 | | | | 7,651,800 |
| TRW Automotive, Inc., 9.375%, 02/15/2013 | | 7,138,000 | | | | 8,244,390 |
| | | | | |
|
| | | | | | | 45,104,928 |
| | | | | |
|
| Hotels, Restaurants & Leisure 6.2% | | | | | | |
| Ameristar Casinos, Inc., 10.75%, 02/15/2009 | | 5,500,000 | | | | 6,297,500 |
| Inn of the Mountain Gods Resort & Casino, 12.00%, 11/15/2010 | | 13,000,000 | | | | 15,145,000 |
| John Q. Hammons Hotels LP, Ser. B, 8.875%, 05/15/2012 | | 6,995,000 | | | | 8,079,225 |
| La Quinta Corp., 8.875%, 03/15/2011 | | 2,990,000 | | | | 3,393,650 |
| Mandalay Resort Group, Ser. B, 10.25%, 08/01/2007 (p) | | 6,000,000 | | | | 6,870,000 |
| MTR Gaming Group, Inc., 9.75%, 04/01/2010 | | 9,430,000 | | | | 10,231,550 |
| Premier Entertainment Biloxi LLC, 10.75%, 02/01/2012 | | 6,000,000 | | | | 6,420,000 |
| Venetian Casino Resort LLC, 11.00%, 06/15/2010 | | 12,000,000 | | | | 13,845,000 |
| | | | | |
|
| | | | | | | 70,281,925 |
| | | | | |
|
| Household Durables 3.5% | | | | | | |
| Amscan Holdings, Inc., 8.75%, 05/01/2014 144A | | 5,515,000 | | | | 5,570,150 |
| Jarden Corp., 9.75%, 05/01/2012 | | 9,020,000 | | | | 9,831,800 |
| K. Hovnanian Enterprises, Inc.: | | | | | | |
| 6.375%, 12/15/2014 | | 3,000,000 | | | | 3,052,500 |
| 10.50%, 10/01/2007 | | 4,280,000 | | | | 4,986,200 |
| Meritage Corp., 9.75%, 06/01/2011 | | 5,400,000 | | | | 6,048,000 |
| Technical Olympic USA, Inc.: | | | | | | |
| 7.50%, 03/15/2011 | | 1,000,000 | | | | 1,022,500 |
| 10.375%, 07/01/2012 | | 1,200,000 | | | | 1,356,000 |
| WCI Communities, Inc., 9.125%, 05/01/2012 | | 6,800,000 | | | | 7,582,000 |
| | | | | |
|
| | | | | | | 39,449,150 |
| | | | | |
|
| Leisure Equipment & Products 1.5% | | | | | | |
| Affinity Group, Inc., 9.00%, 02/15/2012 | | 4,559,000 | | | | 4,900,925 |
| General Nutrition Centers, Inc., 8.50%, 12/01/2010 | | 7,000,000 | | | | 7,087,500 |
| Riddell Bell Holdings, Inc., 8.375%, 10/01/2012 144A | | 4,510,000 | | | | 4,679,125 |
| | | | | |
|
| | | | | | | 16,667,550 |
| | | | | |
|
| Media 6.8% | | | | | | |
| AMC Entertainment, Inc., Sr. Disc. Note, Step Bond, 0.00%, 08/15/2014 144A † | | 9,500,000 | | | | 5,890,000 |
| Cablevision Systems Corp., 8.00%, 04/15/2012 144A (p) | | 8,615,000 | | | | 9,304,200 |
| CCO Holdings LLC, 8.75%, 11/15/2013 (p) | | 6,000,000 | | | | 6,015,000 |
| Charter Communications Holdings LLC, 8.625%, 04/01/2009 (p) | | 6,750,000 | | | | 5,467,500 |
See Notes to Financial Statements
11
SCHEDULE OF INVESTMENTS continued
October 31, 2004 (unaudited)
| | | | | | |
| | | Principal | | | | |
| | | Amount | | | | Value |
|
| |
| CORPORATE BONDS continued | | | | | | |
| CONSUMER DISCRETIONARY continued | | | | | | |
| Media continued | | | | | | |
| Cinemark USA, Inc.: | | | | | | |
| 9.00%, 02/01/2013 | | $ 5,000,000 | | $ | | 5,675,000 |
| Sr. Disc. Note, Step Bond, 0.00%, 03/15/2014 † | | 5,860,000 | | | | 4,175,250 |
| CSC Holdings, Inc., 7.625%, 04/01/2011 (p) | | 6,530,000 | | | | 7,134,025 |
| Emmis Communications Corp., 6.875%, 05/15/2012 | | 5,835,000 | | | | 6,155,925 |
| Jostens IH Corp., 7.625%, 10/01/2012 144A | | 5,525,000 | | | | 5,746,000 |
| Loews Cineplex Entertainment Corp., 9.00%, 08/01/2014 144A | | 1,530,000 | | | | 1,610,325 |
| Mediacom Capital Corp., 9.50%, 01/15/2013 (p) | | 8,750,000 | | | | 8,618,750 |
| RCN Corp., 12.50%, 06/30/2008 (h)+ | | 12,106,098 | | | | 12,408,751 |
| | | | | |
|
| | | | | | | 78,200,726 |
| | | | | |
|
| Specialty Retail 4.1% | | | | | | |
| Cole National Group, Inc., 8.875%, 05/15/2012 | | 2,440,000 | | | | 2,863,950 |
| CSK Auto, Inc., 7.00%, 01/15/2014 (p) | | 8,500,000 | | | | 8,372,500 |
| FTD, Inc., 7.75%, 02/15/2014 | | 3,430,000 | | | | 3,455,725 |
| Group 1 Automotive, Inc., 8.25%, 08/15/2013 | | 2,700,000 | | | | 2,868,750 |
| Michaels Stores, Inc., 9.25%, 07/01/2009 (p) | | 578,000 | | | | 626,407 |
| Office Depot, Inc., 10.00%, 07/15/2008 | | 8,000,000 | | | | 9,440,000 |
| PETCO Animal Supplies, Inc., 10.75%, 11/01/2011 | | 5,730,000 | | | | 6,704,100 |
| Tempur-Pedic, Inc., 10.25%, 08/15/2010 | | 1,300,000 | | | | 1,511,250 |
| United Auto Group, Inc., 9.625%, 03/15/2012 (p) | | 7,000,000 | | | | 7,822,500 |
| Warnaco Group, Inc., 8.875%, 06/15/2013 | | 3,000,000 | | | | 3,367,500 |
| | | | | |
|
| | | | | | | 47,032,682 |
| | | | | |
|
| Textiles, Apparel & Luxury Goods 0.4% | | | | | | |
| Oxford Industries, Inc., 8.875%, 06/01/2011 | | 4,000,000 | | | | 4,340,000 |
| | | | | |
|
| CONSUMER STAPLES 5.2% | | | | | | |
| Food & Staples Retailing 0.7% | | | | | | |
| Duane Reade, Inc., 9.75%, 08/01/2011 144A (p) | | 3,750,000 | | | | 3,618,750 |
| Michael Foods, Inc., 8.00%, 11/15/2013 | | 2,500,000 | | | | 2,650,000 |
| Rite Aid Corp., 9.50%, 02/15/2011 | | 1,920,000 | | | | 2,136,000 |
| | | | | |
|
| | | | | | | 8,404,750 |
| | | | | |
|
| Food Products 1.6% | | | | | | |
| B&G Foods Holdings Corp., 8.00%, 10/01/2011 | | 430,000 | | | | 455,800 |
| Chiquita Brands International, Inc., 7.50%, 11/01/2014 144A | | 1,820,000 | | | | 1,874,600 |
| Del Monte Foods Co., 8.625%, 12/15/2012 (p) | | 4,547,000 | | | | 5,149,477 |
| Seminis Vegetable Seeds, Inc., 10.25%, 10/01/2013 | | 9,985,000 | | | | 11,233,125 |
| | | | | |
|
| | | | | | | 18,713,002 |
| | | | | |
|
| Personal Products 1.5% | | | | | | |
| Playtex Products, Inc.: | | | | | | |
| 8.00%, 03/01/2011 | | 8,000,000 | | | | 8,780,000 |
| 9.375%, 06/01/2011 (p) | | 8,000,000 | | | | 8,460,000 |
| | | | | |
|
| | | | | | | 17,240,000 |
| | | | | |
|
See Notes to Financial Statements
12
SCHEDULE OF INVESTMENTS continued
October 31, 2004 (unaudited)
| | | | | | |
| | | Principal | | | | |
| | | Amount | | | | Value |
|
| |
| CORPORATE BONDS continued | | | | | | |
| CONSUMER STAPLES continued | | | | | | |
| Tobacco 1.4% | | | | | | |
| Commonwealth Brands, Inc., 10.625%, 09/01/2008 144A | | $ 9,125,000 | | $ | | 9,626,875 |
| North Atlantic Trading, Inc., 9.25%, 03/01/2012 (p) | | 6,105,000 | | | | 5,952,375 |
| | | | | |
|
| | | | | | | 15,579,250 |
| | | | | |
|
| ENERGY 10.9% | | | | | | |
| Energy Equipment & Services 2.8% | | | | | | |
| Dresser Rand Group, Inc., 7.375%, 11/01/2014 144A | | 4,715,000 | | | | 4,962,537 |
| Dresser, Inc., 9.375%, 04/15/2011 | | 5,000,000 | | | | 5,575,000 |
| Gulfmark Offshore, Inc., 7.75%, 07/15/2014 144A | | 3,025,000 | | | | 3,191,375 |
| Newpark Resources, Inc., 8.625%, 12/15/2007 | | 3,500,000 | | | | 3,561,250 |
| Offshore Logistics, Inc., 6.125%, 06/15/2013 | | 1,000,000 | | | | 1,040,000 |
| Parker Drilling Co., Ser. B, 10.125%, 11/15/2009 (p) | | 8,300,000 | | | | 8,766,875 |
| SESI LLC, 8.875%, 05/15/2011 | | 4,150,000 | | | | 4,565,000 |
| | | | | |
|
| | | | | | | 31,662,037 |
| | | | | |
|
| Oil & Gas 8.1% | | | | | | |
| Chesapeake Energy Corp., 6.875%, 01/15/2016 | | 9,145,000 | | | | 9,830,875 |
| El Paso Energy Corp., 6.75%, 05/15/2009 (p) | | 12,000,000 | | | | 12,240,000 |
| El Paso Production Holding Co., 7.75%, 06/01/2013 | | 7,830,000 | | | | 8,201,925 |
| Encore Acquisition Co., 6.25%, 04/15/2014 | | 3,445,000 | | | | 3,548,350 |
| Evergreen Resources, Inc., 5.875%, 03/15/2012 | | 1,160,000 | | | | 1,200,600 |
| Exco Resources, Inc., 7.25%, 01/15/2011 | | 3,505,000 | | | | 3,811,688 |
| General Maritime Corp., 10.00%, 03/15/2013 (p) | | 5,990,000 | | | | 6,925,937 |
| Overseas Shipholding Group, Inc., 8.25%, 03/15/2013 | | 8,400,000 | | | | 9,460,500 |
| Petroleum Helicopters, Inc., 9.375%, 05/01/2009 | | 1,500,000 | | | | 1,629,375 |
| Plains Exploration & Production Co., 8.75%, 07/01/2012 | | 2,730,000 | | | | 3,098,550 |
| Premcor Refining Group, Inc.: | | | | | | |
| 6.75%, 05/01/2014 | | 8,000,000 | | | | 8,480,000 |
| 9.50%, 02/01/2013 | | 5,250,000 | | | | 6,221,250 |
| Stone Energy Corp., 8.25%, 12/15/2011 | | 4,200,000 | | | | 4,578,000 |
| Tesoro Petroleum Corp.: | | | | | | |
| 8.00%, 04/15/2008 | | 2,860,000 | | | | 3,124,550 |
| 9.625%, 04/01/2012 (p) | | 6,140,000 | | | | 7,199,150 |
| Tri-Union Development Corp.: | | | | | | |
| 12.50%, 06/01/2006 (h) • + | | 2,898,000 | | | | 2,463,300 |
| Ser. A1, 12.50%, 06/01/2006 (h) • + | | 214,062 | | | | 181,953 |
| | | | | |
|
| | | | | | | 92,196,003 |
| | | | | |
|
| FINANCIALS 6.3% | | | | | | |
| Diversified Financial Services 2.5% | | | | | | |
| Arch Western Finance LLC, 6.75%, 07/01/2013 (p) | | 5,500,000 | | | | 5,871,250 |
| Borden U.S. Finance Corp., 9.00%, 07/15/2014 144A | | 1,600,000 | | | | 1,758,000 |
| Nalco Finance Holdings LLC, Sr. Disc. Note, Step Bond, 0.00%, | | | | | | |
| 02/01/2014 144A † | | 10,130,000 | | | | 7,572,175 |
| Northern Telecom Capital Corp., 7.875%, 06/15/2026 | | 6,500,000 | | | | 6,402,500 |
| Qwest Capital Funding, Inc., 7.00%, 08/03/2009 | | 6,500,000 | | | | 6,223,750 |
| | | | | |
|
| | | | | | | 27,827,675 |
| | | | | |
|
See Notes to Financial Statements
13
SCHEDULE OF INVESTMENTS continued
October 31, 2004 (unaudited)
| | | | | | |
| | | Principal | | | | |
| | | Amount | | | | Value |
|
| |
| CORPORATE BONDS continued | | | | | | |
| FINANCIALS continued | | | | | | |
| Insurance 0.4% | | | | | | |
| Crum & Forster Holdings Corp., 10.375%, 06/15/2013 (p) | | $ 4,100,000 | | $ | | 4,407,500 |
| | | | | |
|
| Real Estate 3.4% | | | | | | |
| Choctaw Resort Development Enterprise, 9.25%, 04/01/2009 | | 6,250,000 | | | | 6,734,375 |
| Crescent Real Estate Equities, 9.25%, 04/15/2009 REIT | | 5,600,000 | | | | 6,104,000 |
| HMH Properties, Inc., Ser. B, 7.875%, 08/01/2008 REIT | | 2,034,000 | | | | 2,100,105 |
| Host Marriott LP, Ser. J, 7.125%, 11/01/2013 REIT (p) | | 7,000,000 | | | | 7,595,000 |
| LNR Property Corp., 7.625%, 07/15/2013 | | 7,800,000 | | | | 8,736,000 |
| Omega Healthcare Investors, Inc., 7.00%, 04/01/2014 REIT | | 1,200,000 | | | | 1,236,000 |
| Thornburg Mortgage, Inc., 8.00%, 05/15/2013 REIT | | 6,325,000 | | | | 6,672,875 |
| | | | | |
|
| | | | | | | 39,178,355 |
| | | | | |
|
| HEALTH CARE 3.9% | | | | | | |
| Health Care Equipment & Supplies 0.9% | | | | | | |
| Norcross Safety Products LLC, Ser. B, 9.875%, 08/15/2011 (p) | | 2,000,000 | | | | 2,190,000 |
| Rotech Healthcare, Inc., 9.50%, 04/01/2012 | | 2,000,000 | | | | 2,190,000 |
| Universal Hospital Services, Inc., 10.125%, 11/01/2011 | | 5,370,000 | | | | 5,504,250 |
| | | | | |
|
| | | | | | | 9,884,250 |
| | | | | |
|
| Health Care Providers & Services 2.9% | | | | | | |
| Extendicare Health Services, Inc., 9.50%, 07/01/2010 | | 5,000,000 | | | | 5,650,000 |
| IASIS Healthcare Corp., 8.75%, 06/15/2014 144A | | 3,845,000 | | | | 4,152,600 |
| PacifiCare Health Systems, Inc., 10.75%, 06/01/2009 | | 5,535,000 | | | | 6,406,763 |
| Service Corporation International, 6.75%, 04/01/2016 (p) | | 3,625,000 | | | | 3,751,875 |
| Team Health, Inc., 9.00%, 04/01/2012 144A (p) | | 6,800,000 | | | | 6,766,000 |
| Tenet Healthcare Corp., 9.875%, 07/01/2014 144A (p) | | 6,100,000 | | | | 6,420,250 |
| | | | | |
|
| | | | | | | 33,147,488 |
| | | | | |
|
| Pharmaceuticals 0.1% | | | | | | |
| Alpharma, Inc., 8.625%, 05/01/2011 144A | | 1,775,000 | | | | 1,854,875 |
| | | | | |
|
| INDUSTRIALS 7.3% | | | | | | |
| Aerospace & Defense 0.1% | | | | | | |
| Argo Tech Corp., 9.25%, 06/01/2011 144A | | 1,220,000 | | | | 1,335,900 |
| | | | | |
|
| Building Products 0.6% | | | | | | |
| Nortek, Inc., 8.50%, 09/01/2014 144A | | 6,160,000 | | | | 6,560,400 |
| | | | | |
|
| Commercial Services & Supplies 4.7% | | | | | | |
| Allied Waste North America, Inc., 6.50%, 11/15/2010 (p) | | 3,595,000 | | | | 3,478,162 |
| American Color Graphics, Inc., 10.00%, 06/15/2010 | | 7,500,000 | | | | 5,775,000 |
| Cenveo Corp., 7.875%, 12/01/2013 (p) | | 6,025,000 | | | | 5,844,250 |
| Clean Harbors, Inc., 11.25%, 07/15/2012 144A | | 3,700,000 | | | | 3,977,500 |
| Coinmach Corp., 9.00%, 02/01/2010 | | 5,000,000 | | | | 5,200,000 |
| Corrections Corporation of America, 7.50%, 05/01/2011 | | 3,000,000 | | | | 3,258,750 |
| Geo Group, Inc., 8.25%, 07/15/2013 (p) | | 3,350,000 | | | | 3,534,250 |
| Hines Nurseries, Inc., 10.25%, 10/01/2011 (p) | | 3,500,000 | | | | 3,762,500 |
See Notes to Financial Statements
14
SCHEDULE OF INVESTMENTS continued
October 31, 2004 (unaudited)
| | | | | | |
| | | Principal | | | | |
| | | Amount | | | | Value |
|
| |
| CORPORATE BONDS continued | | | | | | |
| INDUSTRIALS continued | | | | | | |
| Commercial Services & Supplies continued | | | | | | |
| JohnsonDiversey Holdings, Inc., Sr. Disc. Note, Step Bond, 0.00%, 05/15/2013 † | | $ 5,000,000 | | $ | | 4,300,000 |
| Mobile Mini, Inc., 9.50%, 07/01/2013 (p) | | 1,750,000 | | | | 2,003,750 |
| NationsRent West, Inc., 9.50%, 10/15/2010 | | 1,175,000 | | | | 1,304,250 |
| United Rentals North America, Inc., 7.75%, 11/15/2013 (p) | | 11,250,000 | | | | 10,940,625 |
| | | | | |
|
| | | | | | | 53,379,037 |
| | | | | |
|
| Machinery 1.7% | | | | | | |
| Case New Holland, Inc., 9.25%, 08/01/2011 144A | | 12,375,000 | | | | 14,169,375 |
| Terex Corp.: | | | | | | |
| 7.375%, 01/15/2014 (p) | | 1,920,000 | | | | 2,064,000 |
| 10.375%, 04/01/2011 (p) | | 3,500,000 | | | | 3,955,000 |
| | | | | |
|
| | | | | | | 20,188,375 |
| | | | | |
|
| Marine 0.2% | | | | | | |
| Horizon Lines LLC, 9.00%, 11/01/2012 144A | | 1,980,000 | | | | 2,150,775 |
| | | | | |
|
| INFORMATION TECHNOLOGY 0.6% | | | | | | |
| Communications Equipment 0.3% | | | | | | |
| Telex Communications, Inc., 11.50%, 10/15/2008 | | 3,250,000 | | | | 3,558,750 |
| | | | | |
|
| IT Services 0.3% | | | | | | |
| Stratus Technologies, Inc., 10.375%, 12/01/2008 | | 4,000,000 | | | | 3,420,000 |
| | | | | |
|
| MATERIALS 16.3% | | | | | | |
| Chemicals 7.5% | | | | | | |
| Acetex Corp., 10.875%, 08/01/2009 | | 5,000,000 | | | | 5,525,000 |
| Equistar Chemicals LP, 10.625%, 05/01/2011 (p) | | 6,000,000 | | | | 6,960,000 |
| Ethyl Corp., 8.875%, 05/01/2010 | | 2,200,000 | | | | 2,387,000 |
| FMC Corp., 10.25%, 11/01/2009 | | 5,000,000 | | | | 5,825,000 |
| HMP Equity Holdings Corp., 0.00%, 05/15/2008 (n)(p) | | 4,500,000 | | | | 2,925,000 |
| Huntsman Advanced Materials LLC, 11.00%, 07/15/2010 144A | | 5,000,000 | | | | 5,800,000 |
| Huntsman International LLC: | | | | | | |
| 9.875%, 03/01/2009 | | 4,280,000 | | | | 4,772,200 |
| 11.50%, 07/15/2012 144A (p) | | 9,250,000 | | | | 10,452,500 |
| Lyondell Chemical Co., 10.50%, 06/01/2013 (p) | | 10,000,000 | | | | 11,850,000 |
| Methanex Corp., 8.75%, 08/15/2012 (p) | | 4,795,000 | | | | 5,634,125 |
| Millennium America, Inc., 9.25%, 06/15/2008 (p) | | 2,000,000 | | | | 2,240,000 |
| Nalco Co., 8.875%, 11/15/2013 (p) | | 5,850,000 | | | | 6,442,312 |
| OM Group, Inc., 9.25%, 12/15/2011 | | 13,000,000 | | | | 13,666,250 |
| PolyOne Corp., 8.875%, 05/01/2012 | | 605,000 | | | | 648,863 |
| | | | | |
|
| | | | | | | 85,128,250 |
| | | | | |
|
| Containers & Packaging 4.0% | | | | | | |
| Graham Packaging Co., 9.875%, 10/15/2014 144A | | 2,750,000 | | | | 2,928,750 |
| Graphic Packaging International, Inc., 8.50%, 08/15/2011 | | 7,000,000 | | | | 7,927,500 |
| Jefferson Smurfit Group, 7.50%, 06/01/2013 (p) | | 10,105,000 | | | | 11,064,975 |
See Notes to Financial Statements
15
SCHEDULE OF INVESTMENTS continued
October 31, 2004 (unaudited)
| | | | | | |
| | | Principal | | | | |
| | | Amount | | | | Value |
|
| |
| CORPORATE BONDS continued | | | | | | |
| MATERIALS continued | | | | | | |
| Containers & Packaging continued | | | | | | |
| Owens-Brockway Glass Container, Inc.: | | | | | | |
| 8.25%, 05/15/2013 (p) | | $ 7,850,000 | | $ | | 8,674,250 |
| 8.75%, 11/15/2012 (p) | | 3,835,000 | | | | 4,343,137 |
| 8.875%, 02/15/2009 | | 5,000,000 | | | | 5,512,500 |
| Smurfit-Stone Container Corp., 9.75%, 02/01/2011 | | 5,000,000 | | | | 5,600,000 |
| | | | | |
|
| | | | | | | 46,051,112 |
| | | | | |
|
| Metals & Mining 3.4% | | | | | | |
| Alaska Steel Corp., 7.75%, 06/15/2012 (p) | | 2,900,000 | | | | 2,950,750 |
| Century Aluminum Co., 7.50%, 08/15/2014 144A | | 1,920,000 | | | | 2,044,800 |
| Foundation Pennsylvania Coal Co., 7.25%, 08/01/2014 144A | | 6,400,000 | | | | 6,872,000 |
| Freeport-McMoRan Copper & Gold, Inc.: | | | | | | |
| 7.20%, 11/15/2026 | | 4,350,000 | | | | 3,762,750 |
| 10.125%, 02/01/2010 | | 5,285,000 | | | | 5,958,838 |
| Oregon Steel Mills, Inc., 10.00%, 07/15/2009 (p) | | 7,625,000 | | | | 8,501,875 |
| Peabody Energy Corp.: | | | | | | |
| 5.875%, 04/15/2016 | | 4,275,000 | | | | 4,381,875 |
| 6.875%, 03/15/2013 | | 2,380,000 | | | | 2,623,950 |
| U.S. Steel LLC, 10.75%, 08/01/2008 (p) | | 1,501,000 | | | | 1,786,190 |
| | | | | |
|
| | | | | | | 38,883,028 |
| | | | | |
|
| Paper & Forest Products 1.4% | | | | | | |
| Boise Cascade LLC, 7.125%, 10/15/2014 144A | | 1,335,000 | | | | 1,400,159 |
| Georgia Pacific Corp.: | | | | | | |
| 8.00%, 01/15/2024 (p) | | 3,340,000 | | | | 3,882,750 |
| 8.125%, 05/15/2011 | | 9,000,000 | | | | 10,552,500 |
| | | | | |
|
| | | | | | | 15,835,409 |
| | | | | |
|
| TELECOMMUNICATION SERVICES 3.3% | | | | | | |
| Diversified Telecommunication Services 1.9% | | | | | | |
| Consolidated Communications, Inc., 9.75%, 04/01/2012 144A | | 7,045,000 | | | | 7,326,800 |
| FairPoint Communications, Inc.: | | | | | | |
| 11.875%, 03/01/2010 | | 2,000,000 | | | | 2,310,000 |
| 12.50%, 05/01/2010 | | 5,580,000 | | | | 5,998,500 |
| Qwest Corp., 7.875%, 09/01/2011 144A (p) | | 5,425,000 | | | | 5,804,750 |
| | | | | |
|
| | | | | | | 21,440,050 |
| | | | | |
|
| Wireless Telecommunication Services 1.4% | | | | | | |
| Centennial Communications Corp., 8.625%, 02/01/2014 144A | | 5,675,000 | | | | 5,760,125 |
| Nextel Communications, Inc., 7.375%, 08/01/2015 | | 8,000,000 | | | | 8,920,000 |
| Rural Cellular Corp., 8.25%, 03/15/2012 144A | | 1,170,000 | | | | 1,234,350 |
| | | | | |
|
| | | | | | | 15,914,475 |
| | | | | |
|
| UTILITIES 3.5% | | | | | | |
| Electric Utilities 0.2% | | | | | | |
| MSW Energy Holdings LLC, 8.50%, 09/01/2010 (h)(p) | | 2,250,000 | | | | 2,475,000 |
| | | | | |
|
See Notes to Financial Statements
16
SCHEDULE OF INVESTMENTS continued
October 31, 2004 (unaudited)
| | | | | | |
| | | Principal | | | | |
| | | Amount | | | | Value |
|
| CORPORATE BONDS continued | | | | | | |
| UTILITIES continued | | | | | | |
| Gas Utilities 0.8% | | | | | | |
| SEMCO Energy, Inc.: | | | | | | |
| 7.125%, 05/15/2008 (h) | | $ 3,500,000 | | $ | | 3,710,000 |
| 7.75%, 05/15/2013 (h) (p) | | 4,500,000 | | | | 4,871,250 |
| | | | | |
|
| | | | | | | 8,581,250 |
| | | | | |
|
| Multi-Utilities & Unregulated Power 2.5% | | | | | | |
| AES Corp., 9.50%, 06/01/2009 | | 5,740,000 | | | | 6,644,050 |
| NRG Energy, Inc., 8.00%, 12/15/2013 144A | | 4,160,000 | | | | 4,602,000 |
| Reliant Resources, Inc.: | | | | | | |
| 9.25%, 07/15/2010 (p) | | 4,000,000 | | | | 4,460,000 |
| 9.50%, 07/15/2013 | | 11,250,000 | | | | 12,712,500 |
| | | | | |
|
| | | | | | | 28,418,550 |
| | | | | |
|
| Total Corporate Bonds (cost $892,238,899) | | | | | | 954,492,507 |
| | | | | |
|
| YANKEE OBLIGATIONS - CORPORATE 6.8% | | | | | | |
| CONSUMER DISCRETIONARY 0.7% | | | | | | |
| Media 0.7% | | | | | | |
| IMAX Corp., 9.625%, 12/01/2010 144A (p) | | 8,000,000 | | | | 8,160,000 |
| | | | | |
|
| ENERGY 0.8% | | | | | | |
| Energy Equipment & Services 0.8% | | | | | | |
| Petroleum Geo Services, 10.00%, 11/05/2010 | | 8,050,000 | | | | 9,217,250 |
| | | | | |
|
| FINANCIALS 0.6% | | | | | | |
| Diversified Financial Services 0.6% | | | | | | |
| Ono Finance plc, 0.00%, 03/16/2011 144A (n)(h)+ | | 4,500 | | | | 0 |
| Ship Finance International, Ltd., 8.50%, 12/15/2013 | | 6,915,000 | | | | 7,053,300 |
| | | | | |
|
| | | | | | | 7,053,300 |
| | | | | |
|
| HEALTH CARE 1.0% | | | | | | |
| Pharmaceuticals 1.0% | | | | | | |
| Jean Coutu Group, Inc., 8.50%, 08/01/2014 144A (p) | | 11,000,000 | | | | 11,275,000 |
| | | | | |
|
| INDUSTRIALS 1.1% | | | | | | |
| Marine 0.9% | | | | | | |
| CP Ships, Ltd., 10.375%, 07/15/2012 (p) | | 6,690,000 | | | | 7,743,675 |
| Stena AB, 9.625%, 12/01/2012 | | 2,000,000 | | | | 2,262,500 |
| | | | | |
|
| | | | | | | 10,006,175 |
| | | | | |
|
| Transportation Infrastructure 0.2% | | | | | | |
| Sea Containers, Ltd., 10.50%, 05/15/2012 | | 2,940,000 | | | | 3,046,575 |
| | | | | |
|
| INFORMATION TECHNOLOGY 0.6% | | | | | | |
| Electronic Equipment & Instruments 0.6% | | | | | | |
| Celestica, Inc., 7.875%, 07/01/2011 (p) | | 5,885,000 | | | | 6,326,375 |
| | | | | |
|
See Notes to Financial Statements
17
SCHEDULE OF INVESTMENTS continued
October 31, 2004 (unaudited)
| | | | | | |
| | | Principal | | | | |
| | | Amount | | | | Value |
|
| YANKEE OBLIGATIONS - CORPORATE continued | | | | | | |
| MATERIALS 1.4% | | | | | | |
| Containers & Packaging 1.2% | | | | | | |
| Crown European Holdings SA: | | | | | | |
| 9.50%, 03/01/2011 | | $ 3,250,000 | | $ | | 3,721,250 |
| 10.875%, 03/01/2013 | | 7,000,000 | | | | 8,347,500 |
| Stone Container Finance Co., 7.375%, 07/15/2014 144A | | 1,225,000 | | | | 1,313,812 |
| | | | | |
|
| | | | | | | 13,382,562 |
| | | | | |
|
| Metals & Mining 0.1% | | | | | | |
| Gerdau Ameristeel Corp., 10.375%, 07/15/2011 (p) | | 912,000 | | | | 1,057,920 |
| | | | | |
|
| Paper & Forest Products 0.1% | | | | | | |
| Millar Western Forest Products, Ltd., 7.75%, 11/15/2013 | | 1,315,000 | | | | 1,410,338 |
| | | | | |
|
| TELECOMMUNICATION SERVICES 0.6% | | | | | | |
| Wireless Telecommunication Services 0.6% | | | | | | |
| Rogers Wireless, Inc.: | | | | | | |
| 6.375%, 03/01/2014 | | 2,790,000 | | | | 2,678,400 |
| 9.625%, 05/01/2011 | | 3,475,000 | | | | 3,961,500 |
| | | | | |
|
| | | | | | | 6,639,900 |
| | | | | |
|
| Total Yankee Obligations-Corporate (cost $73,165,366) | | | | | | 77,575,395 |
| | | | | |
|
| AGENCY MORTGAGE-BACKED COLLATERALIZED MORTGAGE | | | | | | |
| OBLIGATIONS 0.0% | | | | | | |
| FIXED RATE 0.0% | | | | | | |
| FNMA, 8.00%, 06/01/2030 (cost $119,184) | | 120,731 | | | | 131,317 |
| | | | | | | |
|
| | | Shares | | | | Value |
|
| |
| COMMON STOCKS 0.2% | | | | | | |
| CONSUMER DISCRETIONARY 0.2% | | | | | | |
| Media 0.2% | | | | | | |
| IMAX Corp. * (p) | | 372,332 | | | | 2,416,435 |
| | | | | |
|
| ENERGY 0.0% | | | | | | |
| Oil & Gas 0.0% | | | | | | |
| Tribo Petroleum Corp., Class A (h)* + | | 3,425 | | | | 0 |
| | | | | |
|
| INFORMATION TECHNOLOGY 0.0% | | | | | | |
| IT Services 0.0% | | | | | | |
| DecisionOne Corp. (h)* + | | 331,000 | | | | 0 |
| | | | | |
|
| Total Common Stocks (cost $3,970,692) | | | | | | 2,416,435 |
| | | | | |
|
| WARRANTS 0.2% | | | | | | |
| CONSUMER DISCRETIONARY 0.0% | | | | | | |
| Media 0.0% | | | | | | |
| Metricom, Inc., Expiring 02/15/2010 (h)* + | | 1,500 | | | | 0 |
| RCN Corp., Expiring 06/30/2013 (h)*+ | | 1,500,000 | | | | 0 |
| | | | | |
|
| | | | | | | 0 |
| | | | | |
|
See Notes to Financial Statements
18
SCHEDULE OF INVESTMENTS continued
October 31, 2004 (unaudited)
| | | | |
| | | Shares | | Value |
|
| WARRANTS continued | | | | |
| ENERGY 0.0% | | | | |
| Oil & Gas 0.0% | | | | |
| Tri-Union Development Corp., Expiring 06/01/2006 (h)* + | | 2,020 | | $ 0 |
| | | |
|
| FINANCIALS 0.0% | | | | |
| Diversified Financial Services 0.0% | | | | |
| Asat Finance LLC, Expiring 11/01/2006 144A (h)* + | | 4,000 | | 0 |
| Ono Finance plc, Expiring 05/31/2009 144A (h)* + | | 4,500 | | 0 |
| | | |
|
| | | | | 0 |
| | | |
|
| MATERIALS 0.1% | | | | |
| Chemicals 0.1% | | | | |
| HMP Equity Holdings Corp., Expiring 05/15/2011 144A * | | 4,500 | | 1,352,250 |
| | | |
|
| TELECOMMUNICATION SERVICES 0.1% | | | | |
| Wireless Telecommunication Services 0.1% | | | | |
| American Tower Escrow Corp., Expiring 08/01/2008 * | | 4,250 | | 894,625 |
| | | |
|
| Total Warrants (cost $1,463,877) | | | | 2,246,875 |
| | | |
|
| SHORT-TERM INVESTMENTS 25.1% | | | | |
| MUTUAL FUND SHARES 25.1% | | | | |
| Evergreen Institutional Money Market Fund ø | | 70,546,795 | | 70,546,795 |
| Navigator Prime Portfolio(p)(p) | | 216,073,926 | | 216,073,926 |
| | | |
|
| Total Short-Term Investments (cost $286,620,721) | | | | 286,620,721 |
| | | |
|
| Total Investments (cost $1,257,578,739) 116.0% | | | | 1,323,483,250 |
| Other Assets and Liabilities (16.0%) | | | | (182,182,637) |
| | | |
|
| Net Assets 100.0% | | | | $ 1,141,300,613 |
| | | |
|
| | |
| (p) | | All or a portion of this security is on loan. |
| 144A | | Security that may be sold to qualified institutional buyers under Rule 144A of the Securities Act of 1933, as amended. |
| | | This security has been determined to be liquid under the guidelines established by the Board of Trustees. |
| † | | Security initially issued in zero coupon form which converts to coupon form at a specified rate and date. An effective |
| | | interest rate is applied to recognize interest income daily for the bond. This rate is based on total expected interest to be |
| | | earned over the life of the bond which consists of the aggregate coupon-interest payments and discount at acquisition. |
| | | The rate shown is the stated rate at the current period end. |
| (h) | | No market quotation available. Valued at fair value as determined in good faith under procedures established by the |
| | | Board of Trustees. |
| + | | Security is deemed illiquid and is valued using market quotations where readily available. In the absence of market |
| | | quotations, the security is valued based on its fair value determined under procedures approved by the Board of |
| | | Trustees. |
| • | | Security which has defaulted on payment of interest and/or principal. The Fund has stopped accruing interest on this |
| | | security. |
| (n) | | Security issued in zero coupon form with no periodic interest payments but is acquired at a discount that results in a |
| | | current yield to maturity. An effective interest rate is applied to recognize interest income daily for the bond. This rate is |
| | | based on total expected income to be earned over the life of the bond from amortization of discount at acquisition. |
| * | | Non-income producing security |
| ø | | Evergreen Investment Management Company, LLC is the investment advisor to both the Fund and the money market |
| | | fund. |
| (p)(p) | | Represents investment of cash collateral received from securities on loan. |
See Notes to Financial Statements
19
SCHEDULE OF INVESTMENTS continued
October 31, 2004 (unaudited)
|
| Summary of Abbreviations |
| REIT Real Estate Investment Trust |
The following table shows the percent of total bonds by credit quality based on Moody's and Standard & Poor's ratings as of October 31, 2004:
| | |
| BBB | | 1.5% |
| BB | | 24.6% |
| B | | 67.0% |
| CCC | | 6.6% |
| Less than CCC | | 0.3% |
| |
|
| | | 100.0% |
| | |
|
The following table shows the percent of total bonds by maturity as of October 31, 2004:
| | |
| 1 to 3 year(s) | | 2.0% |
| 3 to 5 years | | 17.6% |
| 5 to 10 years | | 68.8% |
| 10 to 20 years | | 10.6% |
| 20 to 30 years | | 1.0% |
| |
|
| | | 100.0% |
| | |
|
See Notes to Financial Statements
20
STATEMENT OF ASSETS AND LIABILITIES
October 31, 2004 (unaudited)
| | | | |
|
| Assets | | | | |
| Investments in securities, at value (cost $1,257,578,739) including $199,318,975 of | | | | |
| securities loaned | | $ | | 1,323,483,250 |
| Receivable for securities sold | | | | 13,892,289 |
| Receivable for Fund shares sold | | | | 1,272,615 |
| Interest receivable | | | | 25,528,306 |
| Receivable for securities lending income | | | | 25,266 |
| Prepaid expenses and other assets | | | | 484,705 |
|
| Total assets | | | | 1,364,686,431 |
|
| Liabilities | | | | |
| Dividends payable | | | | 2,722,666 |
| Payable for securities purchased | | | | 2,044,912 |
| Payable for Fund shares redeemed | | | | 2,383,904 |
| Payable for securities on loan | | | | 216,073,926 |
| Advisory fee payable | | | | 31,482 |
| Distribution Plan expenses payable | | | | 60,108 |
| Due to other related parties | | | | 10,754 |
| Accrued expenses and other liabilities | | | | 58,066 |
|
| Total liabilities | | | | 223,385,818 |
|
| Net assets | | $ | | 1,141,300,613 |
|
| Net assets represented by | | | | |
| Paid-in capital | | $ | | 1,227,987,936 |
| Overdistributed net investment income | | | | (5,818,710) |
| Accumulated net realized losses on securities and foreign currency related transactions | | | | (146,773,124) |
| Net unrealized gains on securites | | | | 65,904,511 |
|
| Total net assets | | $ | | 1,141,300,613 |
|
| Net assets consists of | | | | |
| Class A | | $ | | 516,756,756 |
| Class B | | | | 238,634,195 |
| Class C | | | | 342,037,966 |
| Class I | | | | 43,871,696 |
|
| Total net assets | | $ | | 1,141,300,613 |
|
| Shares outstanding | | | | |
| Class A | | | | 148,914,855 |
| Class B | | | | 68,767,839 |
| Class C | | | | 98,563,094 |
| Class I | | | | 12,642,408 |
|
| Net asset value per share | | | | |
| Class A | | $ | | 3.47 |
| Class A - Offering price (based on sales charge of 4.75%) | | $ | | 3.64 |
| Class B | | $ | | 3.47 |
| Class C | | $ | | 3.47 |
| Class I | | $ | | 3.47 |
|
See Notes to Financial Statements
21
STATEMENT OF OPERATIONS
Six Months Ended October 31, 2004 (unaudited)
| | | | |
|
| Investment income | | | | |
| Interest | | $ | | 46,391,342 |
|
| Expenses | | | | |
| Advisory fee | | | | 2,226,303 |
| Distribution Plan expenses | | | | |
| Class A | | | | 751,475 |
| Class B | | | | 1,172,742 |
| Class C | | | | 1,719,714 |
| Administrative services fee | | | | 560,011 |
| Transfer agent fees | | | | 1,037,797 |
| Trustees' fees and expenses | | | | 7,977 |
| Printing and postage expenses | | | | 16,764 |
| Custodian and accounting fees | | | | 129,153 |
| Registration and filing fees | | | | 29,561 |
| Professional fees | | | | 16,019 |
| Interest expense | | | | 112 |
| Other | | | | 13,562 |
|
| Total expenses | | | | 7,681,190 |
| Less: Expense reductions | | | | (3,446) |
|
| Net expenses | | | | 7,677,744 |
|
| Net investment income | | | | 38,713,598 |
|
| Net realized and unrealized gains or losses on securities and foreign currency | | | | |
| related transactions | | | | |
| Net realized gains on: | | | | |
| Securities | | | | 9,480,466 |
| Foreign currency related transactions | | | | 8,512 |
|
| Net realized gains on securities and foreign currency related transactions | | | | 9,488,978 |
| Net change in unrealized gains or losses on securities and foreign currency related transactions | | | | 4,946,306 |
|
| Net realized and unrealized gains or losses on securities and foreign currency related | | | | |
| transactions | | | | 14,435,284 |
|
| Net increase in net assets resulting from operations | | $ | | 53,148,882 |
|
See Notes to Financial Statements
22
STATEMENTS OF CHANGES IN NET ASSETS
| | | | | | | | |
| | | Six Months Ended | | | | |
| | | October 31,2004 | | Year Ended |
| | | (unaudited) | | April 30, 2004 |
|
| Operations | | | | | | | | |
| Net investment income | | $ | | 38,713,598 | | $ | | 83,068,913 |
| Net realized gains on securities and | | | | | | | | |
| foreign currency related transactions | | | | 9,488,978 | | | | 29,132,515 |
| Net change in unrealized gains or | | | | | | | | |
| losses on securities and foreign | | | | | | | | |
| currency related transactions | | | | 4,946,306 | | | | 14,738,536 |
|
| Net increase in net assets resulting | | | | | | | | |
| from operations | | | | 53,148,882 | | | | 126,939,964 |
|
| Distributions to shareholders | | | | | | | | |
| from | | | | | | | | |
| Net investment income | | | | | | | | |
| Class A | | | | (18,784,661) | | | | (40,401,265) |
| Class B | | | | (7,970,265) | | | | (16,064,645) |
| Class C | | | | (11,697,455) | | | | (26,727,023) |
| Class I | | | | (1,580,501) | | | | (2,971,340) |
|
| Total distributions to shareholders | | | | (40,032,882) | | | | (86,164,273) |
|
| | | Shares | | | | Shares | | |
| Capital share transactions | | | | | | | | |
| Proceeds from shares sold | | | | | | | | |
| Class A | | 20,031,890 | | 67,907,270 | | 79,212,268 | | 266,807,488 |
| Class B | | 4,280,712 | | 14,558,356 | | 30,545,684 | | 102,845,146 |
| Class C | | 4,976,796 | | 16,973,146 | | 61,981,254 | | 209,018,829 |
| Class I | | 3,539,734 | | 12,010,681 | | 8,085,993 | | 27,386,680 |
|
| | | | | 111,449,453 | | | | 606,058,143 |
|
| Net asset value of shares issued in | | | | | | | | |
| reinvestment of distributions | | | | | | | | |
| Class A | | 3,684,073 | | 12,558,198 | | 7,196,311 | | 24,449,863 |
| Class B | | 1,139,668 | | 3,884,582 | | 2,210,574 | | 7,511,508 |
| Class C | | 1,891,912 | | 6,447,792 | | 4,041,046 | | 13,729,885 |
| Class I | | 161,790 | | 552,417 | | 159,741 | | 543,754 |
|
| | | | | 23,442,989 | | | | 46,235,010 |
|
| Automatic conversion of Class B | | | | | | | | |
| shares to Class A shares | | | | | | | | |
| Class A | | 308,436 | | 1,046,726 | | 509,358 | | 1,742,465 |
| Class B | | (308,436) | | (1,046,726) | | (509,358) | | (1,742,465) |
|
| | | | | 0 | | | | 0 |
|
| Payment for shares redeemed | | | | | | | | |
| Class A | | (29,988,707) | | (101,432,905) | | (78,644,025) | | (265,409,349) |
| Class B | | (8,666,642) | | (29,299,981) | | (12,288,949) | | (41,821,246) |
| Class C | | (19,683,017) | | (66,494,460) | | (42,704,221) | | (145,376,642) |
| Class I | | (2,120,513) | | (7,166,759) | | (12,128,118) | | (40,408,191) |
|
| | | | | (204,394,105) | | | | (493,015,428) |
| |
| |
| |
| |
|
| Net increase (decrease) in net assets | | | | | | | | |
| resulting from capital share | | | | | | | | |
| transactions | | | | (69,501,663) | | | | 159,277,725 |
|
| Total increase (decrease) in net assets | | | | (56,385,663) | | | | 200,053,416 |
| Net assets | | | | | | | | |
| Beginning of period | | | | 1,197,686,276 | | | | 997,632,860 |
|
| End of period | | $ | | 1,141,300,613 | | $ | | 1,197,686,276 |
|
| Overdistributed net investment income | | $ | | (5,818,710) | | $ | | (2,211,544) |
|
See Notes to Financial Statements
23
NOTES TO FINANCIAL STATEMENTS (unaudited)
1. ORGANIZATION
Evergreen High Yield Bond Fund (the "Fund") is a diversified series of Evergreen Fixed Income Trust (the "Trust"), a Delaware statutory trust organized on September 18, 1997. The Trust is an open-end management investment company registered under the Investment Company Act of 1940, as amended (the "1940 Act").
The Fund offers Class A, Class B, Class C and Institutional ("Class I") shares. Class A shares are sold with a front-end sales charge. However, Class A share investments of $1 million or more are not subject to a front-end sales charge but will be subject to a contingent deferred sales charge of 1.00% upon redemption within one year. Class B shares are sold without a front-end sales charge but are subject to a contingent deferred sales charge that is payable upon redemption and decreases depending on how long the shares have been held. Effective February 2, 2004, Class C shares are no longer sold with a front-end sales charge but are still subject to a contingent deferred sales charge that is payable upon redemption within one year. Class I shares are sold without a front-end sales charge or contingent deferred sales charge. Each class of shares, except Class I shares, pays an ongoing distribution fee.
2. SIGNIFICANT ACCOUNTING POLICIES
The following is a summary of significant accounting policies consistently followed by the Fund in the preparation of its financial statements. The policies are in conformity with generally accepted accounting principles in the United States of America, which require management to make estimates and assumptions that affect amounts reported herein. Actual results could differ from these estimates.
a. Valuation of investments
Portfolio debt securities acquired with more than 60 days to maturity are valued at prices obtained from an independent pricing service which takes into consideration such factors as similar security prices, yields, maturities, liquidity and ratings. Securities for which valuations are not readily available from an independent pricing service may be valued by brokers which use prices provided by market makers or estimates of market value obtained from yield data relating to investments or securities with similar characteristics.
Listed equity securities are usually valued at the last sales price or official closing price on the national securities exchange where the securities are principally traded.
Short-term securities with remaining maturities of 60 days or less at the time of purchase are valued at amortized cost, which approximates market value.
Investments in other mutual funds are valued at net asset value. Securities for which market quotations are not readily available or not reflective of current market value are valued at fair value as determined in good faith, according to procedures approved by the Board of Trustees.
b. Foreign currency translation
All assets and liabilities denominated in foreign currencies are translated into U.S. dollar amounts at the date of valuation. Purchases and sales of portfolio securities and income items denominated
24
NOTES TO FINANCIAL STATEMENTS (unaudited) continued
in foreign currencies are translated into U.S. dollar amounts on the respective dates of such transactions. The Fund does not separately account for that portion of the results of operations resulting from changes in foreign exchange rates on investments and the fluctuations arising from changes in market prices of securities held. Such fluctuations are included with the net realized and unrealized gains or losses on securities.
c. When-issued and delayed delivery transactions
The Fund records when-issued or delayed delivery securities as of trade date and maintains security positions such that sufficient liquid assets will be available to make payment for the securities purchased. Securities purchased on a when-issued or delayed delivery basis are marked-to-market daily and begin earning interest on the settlement date. Losses may occur on these transactions due to changes in market conditions or the failure of counterparties to perform under the contract.
d. Securities lending
The Fund may lend its securities to certain qualified brokers in order to earn additional income. The Fund receives compensation in the form of fees or interest earned on the investment of any cash collateral received. The Fund also continues to receive interest and dividends on the securities loaned. The Fund receives collateral in the form of cash or securities with a market value at least equal to the market value of the securities on loan, including accrued interest. In the event of default or bankruptcy by the borrower, the Fund could experience delays and costs in recovering the loaned securities or in gaining access to the collateral. The Fund has the right under the lending agreement to recover the securities from the borrower on demand.
e. Security transactions and investment income
Security transactions are recorded on trade date. Realized gains and losses are computed using the specific cost of the security sold. Interest income is recorded on the accrual basis and includes accretion of discounts and amortization of premiums. Dividend income is recorded on the ex-dividend date.
f. Federal taxes
The Fund intends to continue to qualify as a regulated investment company and distribute all of its taxable income, including any net capital gains (which have already been offset by available capital loss carryovers). Accordingly, no provision for federal taxes is required.
g. Distributions
Distributions to shareholders from net investment income are accrued daily and paid monthly. Distributions from net realized gains, if any, are recorded on the ex-dividend date. Such distributions are determined in conformity with income tax regulations, which may differ from generally accepted accounting principles.
h. Class allocations
Income, common expenses and realized and unrealized gains and losses are allocated to the classes based on the relative net assets of each class. Distribution fees, if any, are calculated daily at the
25
NOTES TO FINANCIAL STATEMENTS (unaudited) continued
class level based on the appropriate net assets of each class and the specific expense rates applicable to each class.
3. ADVISORY FEE AND OTHER TRANSACTIONS WITH AFFILIATES
Evergreen Investment Management Company, LLC ("EIMC"), an indirect, wholly-owned subsidiary of Wachovia Corporation ("Wachovia"), is the investment advisor to the Fund and is paid a fee at an annual rate of 2% of the Fund's gross investment income plus an amount determined by applying percentage rates to the average daily net assets of the Fund, starting at 0.31% and declining to 0.16% as average daily net assets increase.
From time to time, EIMC may voluntarily or contractually waive its fee and/or reimburse expenses in order to limit operating expenses. For fee waivers and/or reimbursements made after January 1, 2003, EIMC may recoup certain amounts waived and/or reimbursed up to a period of three years following the end of the fiscal year in which the fee waivers and/or reimbursements were made.
Evergreen Investment Services, Inc. ("EIS"), an indirect, wholly-owned subsidiary of Wachovia, is the administrator to the Fund. As administrator, EIS provides the Fund with facilities, equipment and personnel and is paid an annual rate determined by applying percentage rates to the aggregate average daily net assets of the Evergreen funds (excluding money market funds), starting at 0.10% and declining to 0.05% as the aggregate average daily net assets of the Evergreen funds (excluding money market funds) increase.
Evergreen Service Company, LLC ("ESC"), an indirect, wholly-owned subsidiary of Wachovia, is the transfer and dividend disbursing agent for the Fund. ESC receives account fees that vary based on the type of account held by the shareholders in the Fund. For the six months ended October 31, 2004, the transfer agent fees were equivalent to an annual rate of 0.19% of the Fund's average daily net assets
The Fund has placed a portion of its portfolio transactions with brokerage firms that are affiliates of Wachovia. During the six months ended October 31, 2004, the Fund paid brokerage commissions of $2,387 to Wachovia Securities, LLC.
4. DISTRIBUTION PLANS
EIS also serves as distributor of the Fund's shares. The Fund has adopted Distribution Plans, as allowed by Rule 12b-1 of the 1940 Act, for each class of shares, except Class I. Under the Distribution Plans, distribution fees are paid at an annual rate of 0.30% of the average daily net assets for Class A shares and 1.00% of the average daily net assets for each of Class B and Class C shares.
For the six months ended October 31, 2004, EIS received $42,363 from the sale of Class A shares and $1,107, $383,827 and $127,097 in contingent deferred sales charges from redemptions of Class A, Class B and Class C shares, respectively.
26
NOTES TO FINANCIAL STATEMENTS (unaudited) continued
5. SECURITIES TRANSACTIONS
Cost of purchases and proceeds from sales of investment securities (excluding short-term securities) were $286,413,012 and $369,492,642, respectively, for the six months ended October 31, 2004.
On October 31, 2004, the aggregate cost of securities for federal income tax purposes was $1,257,688,593. The gross unrealized appreciation and depreciation on securities based on tax cost was $74,079,134 and $8,284,477, respectively, with a net unrealized appreciation of $65,794,657.
During the six months ended October 31, 2004, the Fund loaned securities to certain brokers. At October 31, 2004, the value of securities on loan and the value of collateral amounted to $199,318,975 and $216,073,926, respectively. During the six months ended October 31, 2004, the Fund earned $27,354 in income from securities lending which is included in interest income on the Statement of Operations.
As of April 30, 2004, the Fund had $156,152,248 in capital loss carryovers for federal income tax purposes expiring as follows:
| | | | | | | | |
| Expiration |
|
| 2007 | | 2008 | | 2009 | | 2010 | | 2011 |
|
| $11,246,425 | | $33,005,032 | | $38,451,200 | | $57,513,490 | | $15,936,101 |
|
6. INTERFUND LENDING
Pursuant to an Exemptive Order issued by the SEC, the Fund may participate in an interfund lending program with certain funds in the Evergreen fund family. This program allows the Fund to borrow from, or lend money to, other participating funds. During the six months ended October 31, 2004, the Fund did not participate in the interfund lending program.
7. EXPENSE REDUCTIONS
Through expense offset arrangements with ESC and the Fund's custodian, a portion of fund expenses has been reduced.
8. DEFERRED TRUSTEES' FEES
Each Trustee of the Fund may defer any or all compensation related to performance of their duties as Trustees. The Trustees' deferred balances are allocated to deferral accounts, which are included in the accrued expenses for the Fund. The investment performance of the deferral accounts are based on the investment performance of certain Evergreen funds. Any gains earned or losses incurred in the deferral accounts are reported in the Fund's Trustees' fees and expenses. At the election of the Trustees, the deferral account will be paid either in one lump sum or in quarterly installments for up to ten years.
27
NOTES TO FINANCIAL STATEMENTS (unaudited) continued
9. FINANCING AGREEMENT
The Fund and certain other Evergreen funds share in a $150 million unsecured revolving credit commitment for temporary and emergency purposes, including the funding of redemptions, as permitted by each participating fund's borrowing restrictions. Borrowings under this facility bear interest at 0.50% per annum above the Federal Funds rate. All of the participating funds are charged an annual commitment fee of 0.09% of the unused balance, which is allocated pro rata. During the six months ended October 31, 2004, the Fund had average borrowings outstanding of $7,174 on an annualized basis at a rate of 1.56% and paid interest of $112.
10. CONCENTRATION RISK
The Fund may invest a substantial portion of its assets in an industry or sector and, therefore, may be more affected by changes in that industry or sector than would be a comparable mutual fund that is not heavily weighted in any industry or sector
11. LITIGATION
From time to time, the Fund and EIMC are involved in various legal actions in the normal course of business. In EIMC's opinion, based upon the opinions of counsel, the Fund is not involved in any legal action that will have a material effect on the Fund's financial position and results of operations.
12. REGULATORY MATTERS
Since September 2003, governmental and self-regulatory authorities have instituted numerous ongoing investigations of various practices in the mutual fund industry, including investigations relating to revenue sharing, market-timing, late trading and record retention, among other things. The investigations cover investment advisors, distributors and transfer agents to mutual funds, as well as other firms. EIMC, EIS and ESC (collectively, "Evergreen") have received subpoenas and other requests for documents and testimony relating to these investigations, are endeavoring to comply with those requests, and are cooperating with the investigations. Evergreen is continuing its own internal review of policies, practices, procedures and personnel, and is taking remedial action where appropriate.
In connection with one of these investigations, on July 28, 2004, the staff of the Securities and Exchange Commission ("SEC") informed Evergreen that the staff intends to recommend to the SEC that it institute an enforcement action against Evergreen. The SEC staff's proposed allegations relate to (i) an arrangement pursuant to which a broker at one of EIMC's affiliated broker-dealers had been authorized, apparently by an EIMC officer (no longer with EIMC), to engage in short-term trading, on behalf of a client, in Evergreen Mid Cap Growth Fund (formerly Evergreen Small Company Growth Fund and prior to that, known as Evergreen Emerging Growth Fund) during the period from December 2000 through April 2003, in excess of the limitations set forth in this fund's prospectus, (ii) short-term trading from September 2001 through January 2003, by a former Evergreen portfolio manager of Evergreen Precious Metals Fund, a fund he managed at the time, (iii) the sufficiency of systems for monitoring exchanges and enforcing exchange limitations as stated in each fund's prospectuses, and (iv) the adequacy of
NOTES TO FINANCIAL STATEMENTS (unaudited) continued
e-mail retention practices. In connection with the activity in Evergreen Mid Cap Growth Fund, EIMC reimbursed this fund $378,905, plus an additional $25,242, representing what EIMC calculated at that time to be the client's net gain and the fees earned by EIMC and the expenses incurred by this fund on the client's account. In connection with the activity in Evergreen Precious Metals Fund, EIMC reimbursed this fund $70,878, plus an additional $3,075, representing what EIMC calculated at that time to be the portfolio manager's net gain and the fees earned by EIMC and expenses incurred by this fund on the portfolio manager's account. Evergreen currently intends to make a written Wells submission explaining why it believes that no such enforcement action should be instituted, and Evergreen is engaging in discussions with the staff of the SEC concerning its recommendation.
Any resolution of these matters with regulatory authorities may include, but not be limited to, sanctions, penalties or injunctions regarding Evergreen, restitution to mutual fund shareholders and/or other financial penalties and structural changes in the governance or management of Evergreen's mutual fund business. Any penalties or restitution will be paid by Evergreen and not by the Evergreen funds.
Evergreen does not believe the foregoing investigations and action will have a material adverse impact on the Evergreen funds. There can be no assurance, however, that these matters and any publicity surrounding or resulting from them will not result in reduced sales or increased redemptions of fund shares, which could increase fund transaction costs or operating expenses, or have other adverse consequences on the Evergreen funds.
29
This page left intentionally blank
30
This page left intentionally blank
31
TRUSTEES AND OFFICERS
TRUSTEES1
| | |
| Charles A. Austin III | | Principal occupations: Investment Counselor, Anchor Capital Advisors, Inc. (investment advice); |
| Trustee | | Director, The Andover Companies (insurance); Trustee, Arthritis Foundation of New England; |
| DOB: 10/23/1934 | | Director, The Francis Ouimet Society; Former Director, Health Development Corp. (fitness- |
| Term of office since: 1991 | | wellness centers); Former Director, Mentor Income Fund, Inc.; Former Trustee, Mentor Funds and |
| | | Cash Resource Trust; Former Investment Counselor, Appleton Partners, Inc. (investment advice); |
| Other directorships: None | | Former Director, Executive Vice President and Treasurer, State Street Research & Management |
| | | Company (investment advice) |
|
| |
| Shirley L. Fulton | | Principal occupations: Partner, Helms, Henderson & Fulton, P.A. (law firm); Retired Senior |
| Trustee | | Resident Superior Court Judge, 26th Judicial District, Charlotte, NC |
| DOB: 1/10/1952 | | |
| Term of office since: 2004 | | |
| Other directorships: None | | |
|
| |
| K. Dun Gifford | | Principal occupations: Chairman and President, Oldways Preservation and Exchange Trust |
| Trustee | | (education); Trustee, Treasurer and Chairman of the Finance Committee, Cambridge College; |
| DOB: 10/23/1938 | | Former Chairman of the Board, Director, and Executive Vice President, The London Harness |
| Term of office since: 1974 | | Company (leather goods purveyor); Former Director, Mentor Income Fund, Inc.; Former Trustee, |
| | | Mentor Funds and Cash Resource Trust |
| Other directorships: None | | |
|
| |
| Dr. Leroy Keith, Jr. | | Principal occupations: Partner, Stonington Partners, Inc. (private investment firm); Trustee of |
| Trustee | | Phoenix Series Fund, Phoenix Multi-Portfolio Fund, and The Phoenix Big Edge Series Fund; |
| DOB: 2/14/1939 | | Former Chairman of the Board and Chief Executive Officer, Carson Products Company |
| Term of office since: 1983 | | (manufacturing); Director, Obagi Medical Products Co.; Director, Lincoln Educational Services; |
| | | Director, Diversapack Co.; Former President, Morehouse College; Former Director, Mentor |
| Other directorships: Trustee, | | Income Fund, Inc.; Former Trustee, Mentor Funds and Cash Resource Trust |
| Phoenix Series Fund, Phoenix | | |
| Multi-Portfolio Fund, and The | | |
| Phoenix Big Edge Series Fund | | |
|
| |
| Gerald M. McDonnell | | Principal occupations: Manager of Commercial Operations, SMI STEEL Co. – South Carolina |
| Trustee | | (steel producer); Former Sales and Marketing Management, Nucor Steel Company; Former |
| DOB: 7/14/1939 | | Director, Mentor Income Fund, Inc.; Former Trustee, Mentor Funds and Cash Resource Trust |
| Term of office since: 1988 | | |
| Other directorships: None | | |
|
| |
| William Walt Pettit | | Principal occupations: Partner and Vice President, Kellam & Pettit, P.A. (law firm); Former |
| Trustee | | Director, Mentor Income Fund, Inc.; Former Trustee, Mentor Funds and Cash Resource Trust |
| DOB: 8/26/1955 | | |
| Term of office since: 1984 | | |
| Other directorships: None | | |
|
| |
| David M. Richardson | | Principal occupations: President, Richardson, Runden LLC (executive recruitment business |
| Trustee | | development/consulting company); Consultant, Kennedy Information, Inc. (executive |
| DOB: 9/19/1941 | | recruitment information and research company); Consultant, AESC (The Association of Retained |
| Term of office since: 1982 | | Executive Search Consultants); Trustee, NDI Technologies, LLP (communications); Director, J&M |
| | | Cumming Paper Co. (paper merchandising); Former Vice Chairman, DHR International, Inc. |
| Other directorships: None | | (executive recruitment); Former Director, Mentor Income Fund, Inc.; Former Trustee, Mentor |
| | | Funds and Cash Resource Trust |
|
| |
| Dr. Russell A. Salton III | | Principal occupations: President/CEO, AccessOne MedCard; Former Medical Director, Healthcare |
| Trustee | | Resource Associates, Inc.; Former Medical Director, U.S. Health Care/Aetna Health Services; |
| DOB: 6/2/1947 | | Former Director, Mentor Income Fund, Inc.; Former Trustee, Mentor Funds and Cash Resource |
| Term of office since: 1984 | | Trust |
| Other directorships: None | | |
|
32
TRUSTEES AND OFFICERS continued
| | |
| Michael S. Scofield | | Principal occupations: Attorney, Law Offices of Michael S. Scofield; Former Director, Mentor |
| Trustee | | Income Fund, Inc.; Former Trustee, Mentor Funds and Cash Resource Trust |
| DOB: 2/20/1943 | | |
| Term of office since: 1984 | | |
| Other directorships: None | | |
|
| |
| Richard J. Shima | | Principal occupations: Independent Consultant; Director, Trust Company of CT; Trustee, Saint |
| Trustee | | Joseph College (CT); Director, Hartford Hospital; Trustee, Greater Hartford YMCA; Former |
| DOB: 8/11/1939 | | Director, Enhance Financial Services, Inc.; Former Director, Old State House Association; Former |
| Term of office since: 1993 | | Director of CTG Resources, Inc. (natural gas); Former Director, Mentor Income Fund, Inc.; Former |
| | | Trustee, Mentor Funds and Cash Resource Trust |
| Other directorships: None | | |
|
| |
| Richard K. Wagoner, CFA 2 | | Principal occupations: Member and Former President, North Carolina Securities Traders |
| Trustee | | Association; Member, Financial Analysts Society; Former Consultant to the Boards of Trustees of |
| DOB: 12/12/1937 | | the Evergreen funds; Former Trustee, Mentor Funds and Cash Resource Trust |
| Term of office since: 1999 | | |
| Other directorships: None | | |
|
| |
| |
| OFFICERS | | |
| |
| Dennis H. Ferro 3 | | Principal occupations: President and Chief Executive Officer, Evergreen Investment Company, |
| President | | Inc. and Executive Vice President, Wachovia Bank, N.A.; former Chief Investment Officer, |
| DOB: 6/20/1945 | | Evergreen Investment Company, Inc. |
| Term of office since: 2003 | | |
|
| |
| Carol Kosel4 | | Principal occupations: Senior Vice President, Evergreen Investment Services, Inc. |
| Treasurer | | |
| DOB: 12/25/1963 | | |
| Term of office since: 1999 | | |
|
| |
| Michael H. Koonce 4 | | Principal occupations: Senior Vice President and General Counsel, Evergreen Investment |
| Secretary | | Services, Inc.; Senior Vice President and Assistant General Counsel, Wachovia Corporation |
| DOB: 4/20/1960 | | |
| Term of office since: 2000 | | |
|
| |
| James Angelos4 | | Principal occupations: Chief Compliance Officer and Senior Vice President, Evergreen Funds; |
| Chief Compliance Officer | | Former Director of Compliance, Evergreen Investment Services, Inc. |
| DOB: 9/2/1947 | | |
| Term of office since: 2004 | | |
|
|
| 1 Each Trustee serves until a successor is duly elected or qualified or until his death, resignation, retirement or removal from office. Each |
| Trustee oversees 93 Evergreen funds. Correspondence for each Trustee may be sent to Evergreen Board of Trustees, P.O. Box 20083, |
| Charlotte, North Carolina 28202. |
| 2 Mr. Wagoner is an "interested person" of the Fund because of his ownership of shares in Wachovia Corporation, the parent to the |
| Fund's investment advisor. |
| 3 The address of the Officer is 401 S. Tryon Street, 20th Floor, Charlotte, NC 28288. |
| 4 The address of the Officer is 200 Berkeley Street, Boston, MA 02116. |
Additional information about the Fund's Board of Trustees and Officers can be found in the Statement of Additional Information (SAI) and is available upon request without charge by calling 800.343.2898.
33

564355 rv2 12/2004
Evergreen Strategic Income Fund

| | |
| table of contents |
| 1 | | LETTER TO SHAREHOLDERS |
| 4 | | FUND AT A GLANCE |
| 6 | | ABOUT YOUR FUND'S EXPENSES |
| 7 | | FINANCIAL HIGHLIGHTS |
| 11 | | SCHEDULE OF INVESTMENTS |
| 24 | | STATEMENT OF ASSETS AND LIABILITIES |
| 25 | | STATEMENT OF OPERATIONS |
| 26 | | STATEMENTS OF CHANGES IN NET ASSETS |
| 28 | | NOTES TO FINANCIAL STATEMENTS |
| 36 | | TRUSTEES AND OFFICERS |
This semiannual report must be preceded or accompanied by a prospectus of the Evergreen fund contained herein. The prospectus contains more complete information, including fees and expenses, and should be read carefully before investing or sending money.
The fund will file its complete schedule of portfolio holdings with the SEC for the first and third quarters of each fiscal year on Form N-Q. The fund's Form N-Q will be available on the SEC's Web site at http://www.sec.gov. In addition, the fund's Form N-Q may be reviewed and copied at the SEC's Public Reference Room in Washington, D.C. Information on the operation of the Public Reference Room may be obtained by calling 800.SEC.0330.
A description of the fund's proxy voting policies and procedures is available without charge, upon request, by calling 800.343.2898, by visiting our Web site at EvergreenInvestments.com or by visiting the SEC's Web site at http://www.sec.gov.
Information relating to how the fund voted proxies relating to portfolio securities during the most recent 12-month period ended June 30 is available by visiting our Web site at EvergreenInvestments.com or by visiting the SEC's Web site at http://www.sec.gov.
| | | | |
| Mutual Funds: | | | | |
| NOT FDIC INSURED | | MAY LOSE VALUE | | NOT BANK GUARANTEED |
Evergreen InvestmentsSM is a service mark of Evergreen Investment Management Company, LLC. Copyright 2004.
Evergreen mutual funds are distributed by Evergreen Investment Services, Inc. 200 Berkeley Street, Boston, MA 02116
LETTER TO SHAREHOLDERS
December 2004

Dennis H. Ferro
President and Chief
Executive Officer
Dear Shareholder,
We are pleased to provide the semiannual report for the Evergreen Strategic Income Fund, which covers the six-month period ended October 31, 2004.
Our fixed income portfolio teams entered the investment period with a major decision to make regarding the magnitude of potential changes in monetary policy. Since the Federal Reserve had kept its target for the benchmark federal funds rate at a 46-year low of 1% for more than nine months, most investors agreed that rates were headed higher. The key was by how much, and what impact that would have on the level of market interest rates. Considering that the federal funds rate was significantly below that of inflation, we determined that the Federal Reserve would be true to its word, and enact a "measured" removal of policy accommodation.
The period began with positive momentum on the economic front. First quarter Gross Domestic Product ("GDP") grew in excess of 4%, and supporting data pointed to a continuation of solid growth. Retail sales were strong and manufacturing had managed to put together several months of consistent growth. The solid contributions from business investment, meanwhile, had enabled the expansion to broaden, reinforcing the trend for sustainable economic growth. The next key for the recovery would come in the form of employment growth, which has historically lagged that of GDP growth. This recovery was no exception, and fears of a jobless recovery had persisted for months. Yet that too also improved, as the investment period began with consecutive monthly payroll gains in excess of 300,000 jobs.
1
LETTER TO SHAREHOLDERS continued
The bond market quickly sent investors a message: be careful what you wish for. After having fretted for months about a jobless recovery, the sudden large number of jobs being created and the threat of higher wage inflation sent market yields dramatically higher last spring. In addition to the improvement in employment, the Federal Reserve had been preparing Wall Street for higher interest rates. Monetary policymakers began the second quarter with a new "spin" on their message to the public, stating that they would remain "measured" in their removal of policy accommodation. Despite these attempts at improved clarity from the Federal Reserve, other factors emerged to drive yields higher during the first part of the investment period. Indeed, interest rate concerns were exacerbated by rising gasoline prices and the larger than forecast readings on consumer inflation during May and June.
As it turned out, the advent of the Federal Reserve's gradual tightening cycle proved to be the tonic that the markets needed. As with many issues confronting investors in recent years, clarity bested uncertainty, and the bond market responded favorably to the prospects of only slightly higher interest rates. Monetary policy officials were also making the rounds in speeches reiterating their intentions to remain "measured" in the removal of policy accommodation. In addition, economic data began to moderate. The pace of job growth slowed and the inflation fears of June had dissipated by September. Despite higher oil prices, inflation reports were becoming less threatening, suggesting that oil would ultimately prove a drag on growth, rather than ignite inflation.
Other factors served to reward a variety of fixed income categories in recent months. For example, the uncertain geopolitical environment and the weaker dollar resulted in higher domestic and international demand for the perceived safety of U.S. government bonds, and the yield on the 10-year Treasury hovered around 4% at the close of the third quarter, despite the likelihood of higher federal deficits. Mortgages also benefited from the reduced prepayment risk in their portfolios, and high yield bonds continued to attract attention given
2
LETTER TO SHAREHOLDERS continued
their income potential and the low default risk. Solid corporate balance sheets and earnings potential enabled many investment grade corporate bonds to also strengthen as the investment period progressed. Indeed, despite the rate hikes from the Federal Reserve, prices firmed for a variety of asset classes within the fixed income market during the latter half of the investment period.
In this environment, we continue to recommend diversified fixed income strategies for long-term investment portfolios.
Please visit our Web site, EvergreenInvestments.com, for more information about our funds and other investment products available to you. Thank you for your continued support of Evergreen Investments.
Sincerely,

Dennis H. Ferro
President and Chief Executive Officer
Evergreen Investment Company, Inc.
Special Notice to Shareholders:
Please visit our Web site at EvergreenInvestments.com for statements from President and Chief Executive Officer, Dennis Ferro, and Chairman of the Board of the Evergreen Funds, Michael S. Scofield, addressing recent SEC actions involving the Evergreen Funds.
3
FUND AT A GLANCE
as of October 31, 2004
MANAGEMENT TEAM

Dana Erikson, CFA
High Yield Bond Team
Lead Manager
CURRENT INVESTMENT STYLE

Source: Morningstar, Inc.
Morningstar's style box is based on a portfolio date as of 9/30/2004.
The fixed income style box placement is based on a fund's average effective maturity or duration and the average credit rating of the bond portfolio.
PERFORMANCE AND RETURNS
Portfolio inception date: 4/14/1987
| | | | | | | | |
| | | Class A | | Class B | | Class C | | Class I |
| Class inception date | | 4/14/1987 | | 2/1/1993 | | 2/1/1993 | | 1/13/1997 |
|
| Nasdaq symbol | | EKSAX | | EKSBX | | EKSCX | | EKSYX |
|
| 6-month return with sales charge | | 1.60% | | 1.32% | | 5.32% | | N/A |
|
| 6-month return w/o sales charge | | 6.70% | | 6.32% | | 6.32% | | 6.92% |
|
| Average annual return* | | | | | | | | |
|
| 1-year with sales charge | | 3.99% | | 3.45% | | 7.46% | | N/A |
|
| 1-year w/o sales charge | | 9.23% | | 8.45% | | 8.46% | | 9.61% |
|
| 5-year | | 7.49% | | 7.45% | | 7.75% | | 8.89% |
|
| 10-year | | 6.73% | | 6.45% | | 6.45% | | 7.30% |
|
| * Adjusted for maximum applicable salescharge, unless noted. |
Past performance is no guarantee of future results. The performance quoted represents past performance and current performance may be lower or higher. The investment return and principal value of an investment will fluctuate so that investors' shares, when redeemed, may be worth more or less than their original cost. To obtain performance information current to the most recent month-end for Classes A, B, C or I, please go to EvergreenInvestments.com/fundperformance. The performance of each class may vary based on differences in loads, fees and expenses paid by the shareholders investing in each class. The maximum applicable sales charge is 4.75% for Class A, 5.00% for Class B and 1.00% for Class C. Class I is not subject to a sales charge. Performance includes the reinvestment of income dividends and capital gain distributions. Performance shown does not reflect the deduction of taxes that a shareholder would pay on fund distributions or the redemption of fund shares.
Historical performance shown for Classes B, C and I prior to their inception is based on the performance of Class A, the original class offered. The historical returns for Classes B, C and I have not been adjusted to reflect the effect of each class' 12b-1 fee. These fees are 0.30% for Class A and 1.00% for Classes B and C. Class I does not pay a 12b-1 fee. If these fees had been reflected, returns for Classes B and C would have been lower while returns for Class I would have been higher.
Returns reflect expense limits previously in effect, without which returns would have been lower.
4
FUND AT A GLANCE continued
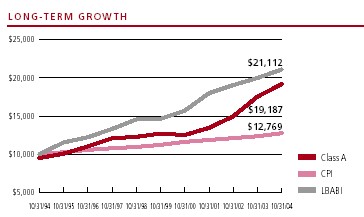
Comparison of a $10,000 investment in the Evergreen Strategic Income Fund Class A shares, versus a similar investment in the Lehman Brothers Aggregate Bond Index (LBABI) and the Consumer Price Index (CPI).
The LBABI is an unmanaged market index and does not include transaction costs associated with buying and selling securities, any mutual fund expenses or any taxes. The CPI is a commonly used measure of inflation and does not represent an investment return. It is not possible to invest directly in an index.
Class I shares are only offered to investment advisory clients of an investment advisor of an Evergreen fund (or its advisory affiliates), through special arrangements entered into on behalf of Evergreen funds with certain financial services firms, certain institutional investors and persons who owned Class Y shares in registered name in an Evergreen fund on or before December 31, 1994. Class I shares are only available to institutional shareholders with a minimum $1 million investment.
The fund's investment objective is nonfundamental and may be changed without the vote of the fund's shareholders.
Funds that invest in high yield, lower-rated bonds may contain more risk due to the increased possibility of default.
Foreign investments may contain more risk due to the inherent risks associated with changing political climates, foreign market instability and foreign currency fluctuations. Risks of international investing are magnified in emerging or developing markets.
U.S. government guarantees apply only to certain securities held in the fund's portfolio and not to the fund's shares.
The return of principal is not guaranteed due to fluctuation in the NAV of the fund caused by changes in the price of the individual bonds held by the fund and the buying and selling of bonds by the fund. Bond funds have the same inflation, interest rate and credit risks that are associated with the individual bonds held by the fund.
All data is as of October 31, 2004, and subject to change.
5
ABOUT YOUR FUND'S EXPENSES
The Example below is intended to describe the fees and expenses borne by shareholders and the impact of those costs on your investment.
Example
As a shareholder of the fund, you incur two types of costs: (1) transaction costs, including sales charges (loads), redemption fees and exchange fees; and (2) ongoing costs, including management fees, distribution (12b-1) fees and other fund expenses. This Example is intended to help you understand your ongoing costs (in dollars) of investing in the fund and to compare these costs with the ongoing costs of investing in other mutual funds. The Example is based on an investment of $1,000 invested at the beginning of the period and held for the entire period from May 1, 2004 to October 31, 2004.
The example illustrates your fund's costs in two ways:
• Actual expenses
The section in the table under the heading "Actual" provides information about actual account values and actual expenses. You may use the information in these columns, together with the amount you invested, to estimate the expenses that you paid over the period. Simply divide your account value by $1,000 (for example, an $8,600 account value divided by $1,000 = 8.6), then multiply the result by the number in the appropriate column for your share class, in the column entitled "Expenses Paid During Period" to estimate the expenses you paid on your account during this period.
• Hypothetical example for comparison purposes
The section in the table under the heading "Hypothetical (5% return before expenses)" provides information about hypothetical account values and hypothetical expenses based on the fund's actual expense ratio and an assumed rate of return of 5% per year before expenses, which is not the fund's actual return. The hypothetical account values and expenses may not be used to estimate the actual ending account balance or expenses you paid for the period. You may use this information to compare the ongoing costs of investing in the fund and other funds. To do so, compare this 5% hypothetical example with the 5% hypothetical examples that appear in the shareholder reports of the other funds.
Please note that the expenses shown in the table are meant to highlight your ongoing costs only and do not reflect any transactional costs, such as sales charges (loads), redemption fees or exchange fees. Therefore, the section in the table under the heading "Hypothetical (5% return before expenses)" is useful in comparing ongoing costs only, and will not help you determine the relative total costs of owning different funds. In addition, if these transactional costs were included, your costs would have been higher.
| | | | | | |
| | | Beginning | | Ending | | |
| | | Account | | Account | | Expenses |
| | | Value | | Value | | Paid During |
| | | 5/1/2004 | | 10/31/2004 | | Period* |
|
| Actual | | | | | | |
| Class A | | $ 1,000.00 | | $ 1,067.01 | | $ 5.94 |
| Class B | | $ 1,000.00 | | $ 1,063.17 | | $ 9.57 |
| Class C | | $ 1,000.00 | | $ 1,063.23 | | $ 9.57 |
| Class I | | $ 1,000.00 | | $ 1,069.22 | | $ 4.38 |
| Hypothetical | | | | | | |
| (5% return | | | | | | |
| before expenses) | | | | | | |
| Class A | | $ 1,000.00 | | $ 1,019.46 | | $ 5.80 |
| Class B | | $ 1,000.00 | | $ 1,015.93 | | $ 9.35 |
| Class C | | $ 1,000.00 | | $ 1,015.93 | | $ 9.35 |
| Class I | | $ 1,000.00 | | $ 1,020.97 | | $ 4.28 |
|
| * | For each class of the Fund, expenses are equal to the annualized expense ratio of each class (1.14% for Class A, 1.84% for Class B, 1.84% for Class C and 0.84% for Class I), multiplied by the average account value over the period, multiplied by 184 / 365 days. |
6
FINANCIAL HIGHLIGHTS
(For a share outstanding throughout each period)
| | | | | | | | | | | | | | | | | | | |
| | | Six Months Ended | | Year Ended April 30, |
| | October 31, 2004 | |
|
| CLASS A | | (unaudited) | | | 2004 1 | | | 2003 1 | | | 2002 2 | | | 2001 1 | | | 2000 |
|
| Net asset value, beginning of period | | | | $ 6.38 | | | $ 6.50 | | | $ 5.83 | | | $ 5.74 | | | $ 6.12 | | | $ 6.79 |
|
| Income from investment operations | | | | | | | | | | | | | | | | | | | |
| Net investment income | | | | 0.18 | | | 0.34 | | | 0.38 | | | 0.35 | | | 0.52 | | | 0.53 |
Net realized and unrealized gains
or losses on securities and foreign | | | | | | | | | | | | | | | | | | | |
| currency related transactions | | | | 0.24 | | | 0.07 | | | 0.68 | | | 0.16 | | | (0.40) | | | (0.63) |
| | | |
| | |
| | |
| | |
| | |
| | |
|
| Total from investment operations | | | | 0.42 | | | 0.41 | | | 1.06 | | | 0.51 | | | 0.12 | | | (0.10) |
|
| Distributions to shareholders from | | | | | | | | | | | | | | | | | | | |
| Net investment income | | | | (0.18) | | | (0.37) | | | (0.39) | | | (0.32) | | | (0.40) | | | (0.49) |
| Net realized gains | | | | 0 | | | (0.16) | | | 0 | | | 0 | | | 0 | | | 0 |
| Tax basis return of capital | | | | 0 | | | 0 | | | 0 | | | (0.10) | | | (0.10) | | | (0.08) |
| | | |
| | |
| | |
| | |
| | |
| | |
|
| Total distributions to shareholders | | | | (0.18) | | | (0.53) | | | (0.39) | | | (0.42) | | | (0.50) | | | (0.57) |
|
| Net asset value, end of period | | | | $ 6.62 | | | $ 6.38 | | | $ 6.50 | | | $ 5.83 | | | $ 5.74 | | | $ 6.12 |
|
| Total return 3 | | | | 6.70% | | | 6.24% | | | 18.79% | | | 9.37% | | | 2.09% | | | (1.58%) |
|
| Ratios and supplemental data | | | | | | | | | | | | | | | | | | | |
| Net assets, end of period (thousands) | | $206,811 | | | $202,017 | | | $173,842 | | | $130,934 | | | $122,223 | | | $129,885 |
| Ratios to average net assets | | | | | | | | | | | | | | | | | | | |
| Expenses 4 | | | | 1.14% 5 | | | 1.21% | | | 1.19% | | | 1.23% | | | 0.87% | | | 0.72% |
| Net investment income | | | | 5.14% 5 | | | 5.10% | | | 6.31% | | | 6.02% | | | 8.06% | | | 8.36% |
| Portfolio turnover rate | | | | 103% | | | 129% | | | 129% | | | 304% | | | 322% | | | 187% |
|
|
| 1 Net investment income per share is based on average shares outstanding during the period. |
| 2 As required, effective May 1, 2001 the Fund adopted the provisions of the AICPA Audit and Accounting Guide, Audits of Investment Companies, and began |
| amortizing premium on its fixed-income securities. The effects of this change for the year ended April 30, 2002 was a decrease in net investment income |
| per share of $0.02; an increase in net realized gains or losses per share of $0.02; and a decrease to the ratio of net investment income to average net assets of 0.45%. |
| The above per share information, ratios and supplemental data for the periods prior to May 1, 2001 have not been restated to reflect this change in presentation. |
| 3 Excluding applicable sales charges |
| 4 The ratio of expenses to average net assets excludes expense reductions but includes fee waivers and/or expense reimbursements. |
| 5 Annualized |
See Notes to Financial Statements
7
FINANCIAL HIGHLIGHTS
(For a share outstanding throughout each period)
| | | | | | | | | | | | | | | | | | | |
| | | Six Months Ended | | Year Ended April 30, |
| | October31, 2004 | |
|
| CLASS B | | (unaudited) 1 | | | 2004 1 | | | 2003 | | | 2002 2 | | | 2001 1 | | | 2000 |
|
| Net asset value, beginning of period | | | | $ 6.40 | | | $ 6.52 | | | $ 5.85 | | | $ 5.75 | | | $ 6.14 | | | $ 6.81 |
|
| Income from investment operations | | | | | | | | | | | | | | | | | | | |
| Net investment income | | | | 0.16 | | | 0.29 | | | 0.34 | | | 0.29 | | | 0.48 | | | 0.49 |
Net realized and unrealized gains
or losses on securities and foreign | | | | | | | | | | | | | | | | | | | |
| currency related transactions | | | | 0.24 | | | 0.07 | | | 0.67 | | | 0.19 | | | (0.41) | | | (0.64) |
| | | |
| | |
| | |
| | |
| | |
| | |
|
| Total from investment operations | | | | 0.40 | | | 0.36 | | | 1.01 | | | 0.48 | | | 0.07 | | | (0.15) |
|
| Distributions to shareholders from | | | | | | | | | | | | | | | | | | | |
| Net investment income | | | | (0.16) | | | (0.32) | | | (0.34) | | | (0.28) | | | (0.36) | | | (0.44) |
| Net realized gains | | | | 0 | | | (0.16) | | | 0 | | | 0 | | | 0 | | | 0 |
| Tax basis return of capital | | | | 0 | | | 0 | | | 0 | | | (0.10) | | | (0.10) | | | (0.08) |
| | | |
| | |
| | |
| | |
| | |
| | |
|
| Total distributions to shareholders | | | | (0.16) | | | (0.48) | | | (0.34) | | | (0.38) | | | (0.46) | | | (0.52) |
|
| Net asset value, end of period | | | | $ 6.64 | | | $ 6.40 | | | $ 6.52 | | | $ 5.85 | | | $ 5.75 | | | $ 6.14 |
|
| Total return 3 | | | | 6.32% | | | 5.49% | | | 17.87% | | | 8.74% | | | 1.18% | | | (2.29%) |
|
| Ratios and supplemental data | | | | | | | | | | | | | | | | | | | |
| Net assets, end of period (thousands) | | $104,799 | | | $113,115 | | | $107,968 | | | $77,471 | | | $83,347 | | | $104,110 |
| Ratios to average net assets | | | | | | | | | | | | | | | | | | | |
| Expenses 4 | | | | 1.84 % 5 | | | 1.91% | | | 1.94% | | | 1.98% | | | 1.61% | | | 1.47% |
| Net investment income | | | | 4.44% 5 | | | 4.40% | | | 5.54% | | | 5.27% | | | 7.34% | | | 7.60% |
| Portfolio turnover rate | | | | 103% | | | 129% | | | 129% | | | 304% | | | 322% | | | 187% |
|
|
| 1 Net investment income per share is based on average shares outstanding during the period. |
| 2 As required, effective May 1, 2001 the Fund adopted the provisions of the AICPA Audit and Accounting Guide, Audits of Investment Companies, and began |
| amortizing premium on its fixed-income securities. The effects of this change for the year ended April 30, 2002 was a decrease in net investment income |
| per share of $0.03; an increase in net realized gains or losses per share of $0.03; and a decrease to the ratio of net investment income to average net assets of 0.45%. |
| The above per share information, ratios and supp lemental data for the periods prior to May 1, 2001 have not been restated to reflect this change in presentation. |
| 3 Excluding applicable sales charges |
| 4 The ratio of expenses to average net assets excludes expense reductions but includes fee waivers and/or expense reimbursements. |
| 5 Annualized |
See Notes to Financial Statements
8
FINANCIAL HIGHLIGHTS
(For a share outstanding throughout each period)
| | | | | | | | | | | | | | | | | |
| | | Six Months Ended | | Year Ended April 30, |
| | October 31, 2004 | |
|
| CLASS C | | (unaudited) | | | 2004 1 | | | 2003 1 | | | 2002 2 | | | 2001 1 | | | 2000 |
|
| Net asset value, beginning of period | | $ 6.39 | | | $ 6.51 | | | $ 5.84 | | | $ 5.75 | | | $ 6.13 | | | $ 6.80 |
|
| Income from investment operations | | | | | | | | | | | | | | | | | |
| Net investment income | | 0.16 | | | 0.29 | | | 0.34 | | | 0.32 | | | 0.46 | | | 0.49 |
Net realized and unrealized gains
or losses on securities and foreign | | | | | | | | | | | | | | | | | |
| currency related transactions | | 0.24 | | | 0.07 | | | 0.67 | | | 0.15 | | | (0.38) | | | (0.64) |
| |
| | |
| | |
| | |
| | |
| | |
|
| Total from investment operations | | 0.40 | | | 0.36 | | | 1.01 | | | 0.47 | | | 0.08 | | | (0.15) |
|
| Distributions to shareholders from | | | | | | | | | | | | | | | | | |
| Net investment income | | (0.16) | | | (0.32) | | | (0.34) | | | (0.28) | | | (0.36) | | | (0.44) |
| Net realized gains | | 0 | | | (0.16) | | | 0 | | | 0 | | | 0 | | | 0 |
| Tax basis return of capital | | 0 | | | 0 | | | 0 | | | (0.10) | | | (0.10) | | | (0.08) |
| |
| | |
| | |
| | |
| | |
| | |
|
| Total distributions to shareholders | | (0.16) | | | (0.48) | | | (0.34) | | | (0.38) | | | (0.46) | | | (0.52) |
|
| Net asset value, end of period | | $ 6.63 | | | $ 6.39 | | | $ 6.51 | | | $ 5.84 | | | $ 5.75 | | | $ 6.13 |
|
| Total return 3 | | 6.32% | | | 5.49% | | | 17.89% | | | 8.56% | | | 1.35% | | | (2.30%) |
|
| Ratios and supplemental data | | | | | | | | | | | | | | | | | |
| Net assets, end of period (thousands) | | $82,430 | | | $89,236 | | | $68,207 | | | $22,554 | | | $16,746 | | | $14,655 |
| Ratios to average net assets | | | | | | | | | | | | | | | | | |
| Expenses 4 | | 1.84% 5 | | | 1.91% | | | 1.93% | | | 1.98% | | | 1.63% | | | 1.47% |
| Net investment income | | 4.44% 5 | | | 4.40% | | | 5.66% | | | 5.25% | | | 7.26% | | | 7.61% |
| Portfolio turnover rate | | 103% | | | 129% | | | 129% | | | 304% | | | 322% | | | 187% |
|
|
| 1 Net investment income per share is based on average shares outstanding during the period. |
| 2 As required, effective May 1, 2001 the Fund adopted the provisions of the AICPA Audit and Accounting Guide, Audits of Investment Companies, and began |
| amortizing premium on its fixed-income securities. The effects of this change for the year ended April 30, 2002 was a decrease in net investment income |
| per share of $0.02; an increase in net realized gains or losses per share of $0.02; and a decrease to the ratio of net investment income to average net assets of 0.45%. |
| The above per share information, ratios and supplemental data for the periods prior to May 1, 2001 have not been restated to reflect this change in presentation. |
| 3 Excluding applicable sales charges |
| 4 The ratio of expenses to average net assets excludes expense reductions but includes fee waivers and/or expense reimbursements. |
| 5 Annualized |
See Notes to Financial Statements
9
FINANCIAL HIGHLIGHTS
(For a share outstanding throughout each period)
| | | | | | | | | | | | | | | | | |
| | | Six Months Ended | | Year Ended April 30, |
| | October 31, 2004 | |
|
| CLASS I 1 | | (unaudited) 2 | | | 2004 2 | | | 2003 2 | | | 2002 3 | | | 2001 2 | | | 2000 |
|
| Net asset value, beginning of period | | $ 6.28 | | | $ 6.40 | | | $ 5.74 | | | $ 5.65 | | | $ 6.02 | | | $ 6.63 |
|
| Income from investment operations | | | | | | | | | | | | | | | | | |
| Net investment income | | 0.19 | | | 0.35 | | | 0.41 | | | 0.35 | | | 0.51 | | | 0.55 |
Net realized and unrealized gains
or losses on securities and foreign | | | | | | | | | | | | | | | | | |
| currency related transactions | | 0.24 | | | 0.07 | | | 0.64 | | | 0.17 | | | (0.37) | | | (0.59) |
| |
| | |
| | |
| | |
| | |
| | |
|
| Total from investment operations | | 0.43 | | | 0.42 | | | 1.05 | | | 0.52 | | | 0.14 | | | (0.04) |
|
| Distributions to shareholders from | | | | | | | | | | | | | | | | | |
| Net investment income | | (0.19) | | | (0.38) | | | (0.39) | | | (0.33) | | | (0.41) | | | (0.49) |
| Net realized gains | | 0 | | | (0.16) | | | 0 | | | 0 | | | 0 | | | 0 |
| Tax basis return of capital | | 0 | | | 0 | | | 0 | | | (0.10) | | | (0.10) | | | (0.08) |
| |
| | |
| | |
| | |
| | |
| | |
|
| Total distributions to shareholders | | (0.19) | | | (0.54) | | | (0.39) | | | (0.43) | | | (0.51) | | | (0.57) |
|
| Net asset value, end of period | | $ 6.52 | | | $ 6.28 | | | $ 6.40 | | | $ 5.74 | | | $ 5.65 | | | $ 6.02 |
|
| Total return | | 6.92% | | | 6.56% | | | 19.09% | | | 9.67% | | | 2.41% | | | (0.61%) |
|
| Ratios and supplemental data | | | | | | | | | | | | | | | | | |
| Net assets, end of period (thousands) | | $23,272 | | | $26,711 | | | $13,406 | | | $1,779 | | | $1,584 | | | $1,386 |
| Ratios to average net assets | | | | | | | | | | | | | | | | | |
| Expenses 4 | | 0.84% 5 | | | 0.91% | | | 0.94% | | | 0.98% | | | 0.62% | | | 0.47% |
| Net investment income | | 5.42% 5 | | | 5.42% | | | 6.75% | | | 6.27% | | | 8.30% | | | 8.63% |
| Portfolio turnover rate | | 103% | | | 129% | | | 129% | | | 304% | | | 322% | | | 187% |
|
|
| 1 Effective at the close of business on May 11, 2001, Class Y shares of the Fund were renamed as Institutional shares (Class I). |
| 2 Net investment income per share is based on average shares outsta nding during the period. |
| 3 As required, effective May 1, 2001 the Fund adopted the pr ovisions of the AICPA Audit and Accounting Guide, Audits of Investment Companies, and began |
| amortizing premium on its fixed-income securities. The effects of this change for the year ended April 30, 2002 was a decrease in net investment income |
| per share of $0.03; an increase in net realized gains or losses per share of $0.03; and a decrease to the ratio of net investment income to average net assets of 0.45%. |
| The above per share information, ratios and supplemental data for the periods prior to May 1, 2001 have not been restated to reflect this change in presentation. |
| 4 The ratio of expenses to average net assets excludes expense reductions but includes fee waivers and/or expense reimbursements. |
| 5 Annualized |
See Notes to Financial Statements
10
SCHEDULE OF INVESTMENTS
October 31, 2004 (unaudited)
| | | | | | | | |
| | | | | Principal | | | | |
| | | | | Amount | | | | Value |
|
| |
| AGENCY COMMERCIAL MORTGAGE-BACKEDSECURITIES 4.2% | | | | | | |
| Fixed Rate 4.2% | | | | | | |
| FNMA: | | | | | | |
| 4.44%, 04/01/2014 | | $ 2,696,129 | | $ | | 2,700,063 |
| 4.625%, 10/15/2014 | | 3,640,000 | | | | 3,676,043 |
| 4.91%, 07/25/2020 | | 3,000,000 | | | | 3,042,342 |
| 6.17%, 02/25/2016 | | 1,875,000 | | | | 2,055,397 |
| 6.21%, 09/01/2008 | | 1,829,029 | | | | 1,970,695 |
| Ser. 2001-M2, Class A, 6.22%, 01/25/2009 | | 601,413 | | | | 624,831 |
| Ser. 2004-54, Class ZN, 5.00%, 07/25/2019 | | 37,992 | | | | 37,959 |
| GNMA, 5.86%, 03/16/2024 | | 3,335,000 | | | | 3,577,181 |
| | | | | |
|
| Total Agency Commercial Mortgage-BackedSecurities | | | | | | |
| (cost $17,331,902) | | | | | | 17,684,511 |
| | | | | |
|
| AGENCY MORTGAGE-BACKED PASS-THROUGHSECURITIES 10.6% | | | | | | |
| Fixed Rate 10.3% | | | | | | |
| FHLMC: | | | | | | |
| 5.50%, TBA # | | 12,600,000 | | | | 12,938,381 |
| 6.00%, TBA # | | 11,840,000 | | | | 12,261,800 |
| FNMA: | | | | | | |
| 5.50%, TBA # | | 9,000,000 | | | | 9,165,942 |
| 6.00%, TBA # | | 8,000,000 | | | | 8,295,000 |
| GNMA: | | | | | | |
| 6.00%, 06/15/2031 | | 148,008 | | | | 154,384 |
| 7.50%, 12/15/2030 | | 120,773 | | | | 130,112 |
| 8.00%, 10/15/2030 | | 2,434 | | | | 2,655 |
| | | | | |
|
| | | | | | | | | 42,948,274 |
| | | | | | | |
|
| Floating Rate 0.3% | | | | | | |
| FNMA, 2.80%, 07/01/2044 (h) | | 1,285,110 | | | | 1,301,444 |
| | | | | |
|
| Total Agency Mortgage-Backed Pass-ThroughSecurities | | | | | | |
| (cost $44,015,657) | | | | | | 44,249,718 |
| | | | | |
|
| ASSET-BACKED SECURITIES 1.0% | | | | | | |
| C-Bass, Ltd., Ser. 11-A, Class C, 3.23%, 09/15/2039 (h) (cost $4,315,000) | | 4,315,000 | | | | 4,310,955 |
| | | | | |
|
| CORPORATE BONDS 37.5% | | | | | | |
| CONSUMER DISCRETIONARY 12.1% | | | | | | |
| Auto Components 1.8% | | | | | | |
| ArvinMeritor, Inc., 6.80%, 02/15/2009 | | 1,385,000 | | | | 1,419,625 |
| Collins & Aikman Products Co., 10.75%, 12/31/2011 | | 1,580,000 | | | | 1,583,950 |
| Dura Operating Corp., Ser. B, 8.625%, 04/15/2012 | | 1,000,000 | | | | 1,036,250 |
| RJ Tower Corp., 12.00%, 06/01/2013 | | 1,300,000 | | | | 916,500 |
| Tenneco Automotive, Inc., Ser. B, 10.25%, 07/15/2013 | | 1,095,000 | | | | 1,281,150 |
| TRW Automotive, Inc., 9.375%, 02/15/2013 | | 1,160,000 | | | | 1,339,800 |
| | | | | |
|
| | | | | | | | | 7,577,275 |
| | | | | | | |
|
| Automobiles 0.2% | | | | | | |
| General Motors Acceptance Corp., FRN, 2.97%, 01/16/2007 | | 700,000 | | | | 698,184 |
| | | | | |
|
See Notes to Financial Statements
11
SCHEDULE OF INVESTMENTS continued
October 31, 2004 (unaudited)
| | | | | | |
| | | Principal | | | | |
| | | Amount | | | | Value |
|
| |
| CORPORATE BONDS continued | | | | | | |
| CONSUMER DISCRETIONARY continued | | | | | | |
| Hotels, Restaurants & Leisure 2.4% | | | | | | |
| Equinox Holdings, Inc., 9.00%, 12/15/2009 | | $ 1,500,000 | | $ | | 1,597,500 |
| John Q. Hammons Hotels LP, Ser. B, 8.875%, 05/15/2012 | | 1,135,000 | | | | 1,310,925 |
| La Quinta Corp., 8.875%, 03/15/2011 | | 520,000 | | | | 590,200 |
| Mandalay Resort Group, Ser. B, 10.25%, 08/01/2007 | | 1,000,000 | | | | 1,145,000 |
| MTR Gaming Group, Inc., 9.75%, 04/01/2010 | | 1,200,000 | | | | 1,302,000 |
| Premier Entertainment Biloxi LLC, 10.75%, 02/01/2012 | | 1,750,000 | | | | 1,872,500 |
| Venetian Casino Resort LLC, 11.00%, 06/15/2010 | | 2,000,000 | | | | 2,307,500 |
| | | | | |
|
| | | | | | | 10,125,625 |
| | | | | |
|
| Household Durables 1.2% | | | | | | |
| Amscan Holdings, Inc., 8.75%, 05/01/2014 144A | | 1,000,000 | | | | 1,010,000 |
| Jarden Corp., 9.75%, 05/01/2012 | | 1,525,000 | | | | 1,662,250 |
| K. Hovnanian Enterprises, Inc., 6.375%, 12/15/2014 | | 465,000 | | | | 473,138 |
| Meritage Corp., 9.75%, 06/01/2011 | | 500,000 | | | | 560,000 |
| WCI Communities, Inc., 9.125%, 05/01/2012 | | 1,300,000 | | | | 1,449,500 |
| | | | | |
|
| | | | | | | 5,154,888 |
| | | | | |
|
| Leisure Equipment & Products 1.0% | | | | | | |
| Affinity Group, Inc., 9.00%, 02/15/2012 | | 1,620,000 | | | | 1,741,500 |
| General Nutrition Centers, Inc., 8.50%, 12/01/2010 | | 1,500,000 | | | | 1,518,750 |
| Riddell Bell Holdings, Inc., 8.375%, 10/01/2012 144A | | 760,000 | | | | 788,500 |
| | | | | |
|
| | | | | | | 4,048,750 |
| | | | | |
|
| Media 3.6% | | | | | | |
| AMC Entertainment, Inc.: | | | | | | |
| 9.875%, 02/01/2012 | | 1,100,000 | | | | 1,182,500 |
| Sr. Disc. Note, Step Bond, 0.00%, 08/15/2009 144A † | | 1,500,000 | | | | 930,000 |
| Cablevision Systems Corp., 8.00%, 04/15/2012 144A | | 1,400,000 | | | | 1,512,000 |
| CCO Holdings LLC, 8.75%, 11/15/2013 | | 2,000,000 | | | | 2,005,000 |
| Charter Communications Holdings LLC, 8.625%, 04/01/2009 | | 600,000 | | | | 486,000 |
| Cinemark USA, Inc.: | | | | | | |
| 9.00%, 02/01/2013 | | 150,000 | | | | 170,250 |
| Sr. Disc. Note, Step Bond, 0.00%, 03/15/2009 † | | 2,000,000 | | | | 1,425,000 |
| CSC Holdings, Inc., 7.625%, 04/01/2011 | | 835,000 | | | | 912,237 |
| Emmis Communications Corp., 6.875%, 05/15/2012 | | 2,125,000 | | | | 2,241,875 |
| Jostens IH Corp., 7.625%, 10/01/2012 144A | | 925,000 | | | | 962,000 |
| Loews Cineplex Entertainment Corp., 9.00%, 08/01/2014 144A | | 250,000 | | | | 263,125 |
| Mediacom Capital Corp., 9.50%, 01/15/2013 | | 1,425,000 | | | | 1,403,625 |
| RCN Corp., 12.50%, 06/30/2008 (h) + | | 1,412,377 | | | | 1,447,687 |
| | | | | |
|
| | | | | | | 14,941,299 |
| | | | | |
|
| Specialty Retail 1.8% | | | | | | |
| CSK Auto, Inc., 7.00%, 01/15/2014 | | 1,500,000 | | | | 1,477,500 |
| FTD, Inc., 7.75%, 02/15/2014 | | 2,000,000 | | | | 2,015,000 |
| Group 1 Automotive, Inc., 8.25%, 08/15/2013 | | 750,000 | | | | 796,875 |
| PETCO Animal Supplies, Inc., 10.75%, 11/01/2011 | | 1,100,000 | | | | 1,287,000 |
See Notes to Financial Statements
12
SCHEDULE OF INVESTMENTS continued
October 31, 2004 (unaudited)
| | | | | | |
| | | Principal | | | | |
| | | Amount | | | | Value |
|
| |
| CORPORATE BONDS continued | | | | | | |
| CONSUMER DISCRETIONARY continued | | | | | | |
| Specialty Retail continued | | | | | | |
| United Auto Group, Inc., 9.625%, 03/15/2012 | | $ 1,300,000 | | $ | | 1,452,750 |
| Warnaco Group, Inc., 8.875%, 06/15/2013 | | 385,000 | | | | 432,162 |
| | | | | |
|
| | | | | | | 7,461,287 |
| | | | | |
|
| Textiles, Apparel & Luxury Goods 0.1% | | | | | | |
| Oxford Industries, Inc., 8.875%, 06/01/2011 | | 400,000 | | | | 434,000 |
| | | | | |
|
| CONSUMER STAPLES 2.1% | | | | | | |
| Food & Staples Retailing 0.8% | | | | | | |
| Duane Reade, Inc., 9.75%, 08/01/2011 144A | | 625,000 | | | | 603,125 |
| Michael Foods, Inc., 8.00%, 11/15/2013 | | 900,000 | | | | 954,000 |
| NeighborCare, Inc., 6.875%, 11/15/2013 | | 1,125,000 | | | | 1,181,250 |
| Rite Aid Corp., 9.50%, 02/15/2011 | | 600,000 | | | | 667,500 |
| | | | | |
|
| | | | | | | 3,405,875 |
| | | | | |
|
| Food Products 0.3% | | | | | | |
| B&G Foods Holdings Corp., 8.00%, 10/01/2011 | | 75,000 | | | | 79,500 |
| Chiquita Brands International, Inc., 7.50%, 11/01/2014 144A | | 305,000 | | | | 314,150 |
| Del Monte Foods Co., 8.625%, 12/15/2012 | | 330,000 | | | | 373,725 |
| Seminis Vegetable Seeds, Inc., 10.25%, 10/01/2013 | | 285,000 | | | | 320,625 |
| | | | | |
|
| | | | | | | 1,088,000 |
| | | | | |
|
| Personal Products 0.6% | | | | | | |
| Playtex Products, Inc., 8.00%, 03/01/2011 | | 2,500,000 | | | | 2,743,750 |
| | | | | |
|
| Tobacco 0.4% | | | | | | |
| North Atlantic Trading, Inc., 9.25%, 03/01/2012 | | 1,735,000 | | | | 1,691,625 |
| | | | | |
|
| ENERGY 4.3% | | | | | | |
| Energy Equipment & Services 1.4% | | | | | | |
| Dresser Rand Group, Inc., 7.375%, 11/01/2014 144A | | 785,000 | | | | 826,212 |
| Dresser, Inc., 9.375%, 04/15/2011 | | 775,000 | | | | 864,125 |
| Grant Prideco, Inc., 9.625%, 12/01/2007 | | 750,000 | | | | 851,250 |
| Gulfmark Offshore, Inc., 7.75%, 07/15/2014 144A | | 525,000 | | | | 553,875 |
| Lone Star Technologies, Inc., 9.00%, 06/01/2011 | | 800,000 | | | | 860,000 |
| Parker Drilling Co., Ser. B, 10.125%, 11/15/2009 | | 2,000,000 | | | | 2,112,500 |
| | | | | |
|
| | | | | | | 6,067,962 |
| | | | | |
|
| Oil & Gas 2.9% | | | | | | |
| Chesapeake Energy Corp., 6.875%, 01/15/2016 | | 1,620,000 | | | | 1,741,500 |
| El Paso Production Holding Co., 7.75%, 06/01/2013 | | 1,300,000 | | | | 1,361,750 |
| Encore Acquisition Co., 6.25%, 04/15/2014 | | 535,000 | | | | 551,050 |
| Evergreen Resources, Inc., 5.875%, 03/15/2012 | | 420,000 | | | | 434,700 |
| Exco Resources, Inc., 7.25%, 01/15/2011 | | 225,000 | | | | 244,688 |
| General Maritime Corp., 10.00%, 03/15/2013 | | 1,115,000 | | | | 1,289,219 |
| Overseas Shipholding Group, Inc., 8.25%, 03/15/2013 | | 750,000 | | | | 844,687 |
| Plains Exploration & Production Co., 8.75%, 07/01/2012 | | 1,300,000 | | | | 1,475,500 |
| Premcor Refining Group, Inc., 6.75%, 05/01/2014 | | 1,500,000 | | | | 1,590,000 |
See Notes to Financial Statements
13
SCHEDULE OF INVESTMENTS continued
October 31, 2004 (unaudited)
| | | | | | | | |
| | | | | Principal | | | | |
| | | | | Amount | | | | Value |
|
| |
| CORPORATE BONDS continued | | | | | | | | |
| ENERGY continued | | | | | | | | |
| Oil & Gas continued | | | | | | | | |
| Tesoro Petroleum Corp.: | | | | | | | | |
| 8.00%, 04/15/2008 | | | | $ 475,000 | | $ | | 518,938 |
| 9.625%, 04/01/2012 | | | | 1,025,000 | | | | 1,201,812 |
| Tri-Union Development Corp., 12.50%, 06/01/2006 (h) + | | | | 908,500 | | | | 772,225 |
| | | | | | | |
|
| | | | | | | | | 12,026,069 |
| | | | | | | |
|
| FINANCIALS 2.3% | | | | | | |
| Diversified Financial Services 1.1% | | | | | | |
| Arch Western Finance LLC, 6.75%, 07/01/2013 | | 1,500,000 | | | | 1,601,250 |
| Borden U.S. Finance Corp., 9.00%, 07/15/2014 144A | | 250,000 | | | | 274,688 |
| Nalco Finance Holdings LLC, Sr. Disc. Note, Step Bond, 0.00%, | | | | | | |
| 02/01/2014 144A † | | 1,265,000 | | | | 945,587 |
| Qwest Capital Funding, Inc., 7.00%, 08/03/2009 | | 1,000,000 | | | | 957,500 |
| Trapeza LLC, Ser. 2004-7A, Class B1, 3.62%, 01/25/2035 FRN (h) 144A | | 875,000 | | | | 874,248 |
| | | | | |
|
| | | | | | | | | 4,653,273 |
| | | | | | | |
|
| Insurance 0.4% | | | | | | | | |
| Crum & Forster Holdings Corp., 10.375%, 06/15/2013 | | | | 1,300,000 | | | | 1,397,500 |
| | | | | | | |
|
| Real Estate 0.8% | | | | | | | | |
| Crescent Real Estate Equities, 9.25%, 04/15/2009 REIT | | | | 750,000 | | | | 817,500 |
| Host Marriott LP, Ser. J, 7.125%, 11/01/2013 REIT | | | | 1,500,000 | | | | 1,627,500 |
| LNR Property Corp., 7.625%, 07/15/2013 | | | | 920,000 | | | | 1,030,400 |
| | | | | | | |
|
| | | | | | | | | 3,475,400 |
| | | | | | | |
|
| HEALTH CARE 1.9% | | | | | | | | |
| Health Care Equipment & Supplies 0.4% | | | | | | | | |
| Norcross Safety Products LLC, Ser. B, 9.875%, 08/15/2011 | | | | 700,000 | | | | 766,500 |
| Universal Hospital Services, Inc., 10.125%, 11/01/2011 | | | | 1,050,000 | | | | 1,076,250 |
| | | | | | | |
|
| | | | | | | | | 1,842,750 |
| | | | | | | |
|
| Health Care Providers & Services 1.2% | | | | | | | | |
| IASIS Healthcare Corp., 8.75%, 06/15/2014 144A | | | | 590,000 | | | | 637,200 |
| PacifiCare Health Systems, Inc., 10.75%, 06/01/2009 | | | | 845,000 | | | | 978,088 |
| Select Medical Corp., 9.50%, 06/15/2009 | | | | 1,101,000 | | | | 1,197,337 |
| Service Corp. International, 6.75%, 04/01/2016 | | | | 1,000,000 | | | | 1,035,000 |
| Tenet Healthcare Corp., 9.875%, 07/01/2014 144A | | | | 950,000 | | | | 999,875 |
| | | | | | | |
|
| | | | | | | | | 4,847,500 |
| | | | | | | |
|
| Pharmaceuticals 0.3% | | | | | | | | |
| Alpharma, Inc., 8.625%, 05/01/2011 144A | | | | 1,050,000 | | | | 1,097,250 |
| | | | | | | |
|
| INDUSTRIALS 3.5% | | | | | | | | |
| Aerospace & Defense 0.1% | | | | | | | | |
| Argo Tech Corp., 9.25%, 06/01/2011 144A | | | | 190,000 | | | | 208,050 |
| | | | | | | |
|
| Commercial Services & Supplies 1.7% | | | | | | | | |
| Allied Waste North America, Inc., 6.50%, 11/15/2010 | | | | 450,000 | | | | 435,375 |
| American Color Graphics, Inc., 10.00%, 06/15/2010 | | | | 850,000 | | | | 654,500 |
See Notes to Financial Statements
14
SCHEDULE OF INVESTMENTS continued
October 31, 2004 (unaudited)
| | | | | | | | |
| | | | | Principal | | | | |
| | | | | Amount | | | | Value |
|
| |
| CORPORATE BONDS continued | | | | | | |
| INDUSTRIALS continued | | | | | | |
| Commercial Services & Supplies continued | | | | | | |
| Cenveo Corp., 7.875%, 12/01/2013 | | $ 1,025,000 | | $ | | 994,250 |
| Clean Harbors, Inc., 11.25%, 07/15/2012 144A | | 570,000 | | | | 612,750 |
| Coinmach Corp., 9.00%, 02/01/2010 | | 560,000 | | | | 582,400 |
| Geo Group, Inc., 8.25%, 07/15/2013 | | 390,000 | | | | 411,450 |
| JohnsonDiversey Holdings, Inc., Sr. Disc. Note, Step Bond, 0.00%,05/15/2007 † | | 1,815,000 | | | | 1,560,900 |
| United Rentals North America, Inc., 7.75%, 11/15/2013 | | 1,875,000 | | | | 1,823,437 |
| | | | | |
|
| | | | | | | | | 7,075,062 |
| | | | | | | |
|
| Machinery 1.4% | | | | | | | | |
| Case New Holland, Inc., 9.25%, 08/01/2011 144A | | | | 2,225,000 | | | | 2,547,625 |
| Terex Corp., 7.375%, 01/15/2014 | | | | 1,440,000 | | | | 1,548,000 |
| Wolverine Tube, Inc., 7.375%, 08/01/2008 144A | | | | 1,750,000 | | | | 1,741,250 |
| | | | | | | |
|
| | | | | | | | | 5,836,875 |
| | | | | | | |
|
| Marine 0.3% | | | | | | | | |
| Horizon Lines LLC, 9.00%, 11/01/2012 144A | | | | 300,000 | | | | 325,875 |
| Ocean Star plc, Ser. 2004-A, Class C, 3.36%, 11/12/2018 FRN (h) 144A | | 1,040,000 | | | | 1,039,513 |
| | | | | |
|
| | | | | | | | | 1,365,388 |
| | | | | | | |
|
| INFORMATION TECHNOLOGY 0.2% | | | | | | |
| IT Services 0.2% | | | | | | |
| Stratus Technologies, Inc., 10.375%, 12/01/2008 | | 1,000,000 | | | | 855,000 |
| | | | | |
|
| MATERIALS 8.3% | | | | | | |
| Chemicals 4.2% | | | | | | |
| Acetex Corp., 10.875%, 08/01/2009 | | 1,000,000 | | | | 1,105,000 |
| Equistar Chemicals LP, 10.625%, 05/01/2011 | | 1,645,000 | | | | 1,908,200 |
| Ethyl Corp., 8.875%, 05/01/2010 | | 250,000 | | | | 271,250 |
| FMC Corp., 10.25%, 11/01/2009 | | 920,000 | | | | 1,071,800 |
| HMP Equity Holdings Corp., 0.00%, 05/15/2008 (n) | | 1,000,000 | | | | 650,000 |
| Huntsman Advanced Materials LLC, 11.00%, 07/15/2010 144A | | 750,000 | | | | 870,000 |
| Huntsman International LLC: | | | | | | |
| 9.875%, 03/01/2009 | | 1,300,000 | | | | 1,449,500 |
| 11.50%, 07/15/2012 144A | | 1,400,000 | | | | 1,582,000 |
| Lyondell Chemical Co.: | | | | | | |
| 9.50%, 12/15/2008 | | 1,750,000 | | | | 1,916,250 |
| 10.50%, 06/01/2013 | | 800,000 | | | | 948,000 |
| Methanex Corp., 8.75%, 08/15/2012 | | 735,000 | | | | 863,625 |
| Nalco Co.: | | | | | | |
| 8.875%, 11/15/2013 | | 800,000 | | | | 881,000 |
| 9.00%, 11/15/2013 | | 3,000,000 | | | | 4,055,775 |
| PolyOne Corp., 8.875%, 05/01/2012 | | 95,000 | | | | 101,888 |
| | | | | |
|
| | | | | | | | | 17,674,288 |
| | | | | | | |
|
| Containers & Packaging 1.4% | | | | | | | | |
| Graham Packaging Co., 9.875%, 10/15/2014 144A | | | | 450,000 | | | | 479,250 |
| Graphic Packaging International, Inc., 9.50%, 08/15/2013 | | | | 1,000,000 | | | | 1,157,500 |
| Jefferson Smurfit Group, 7.50%, 06/01/2013 | | | | 1,300,000 | | | | 1,423,500 |
See Notes to Financial Statements
15
SCHEDULE OF INVESTMENTS continued
October 31, 2004 (unaudited)
| | | | | | |
| | | Principal | | | | |
| | | Amount | | | | Value |
|
| |
| CORPORATE BONDS continued | | | | | | |
| MATERIALS continued | | | | | | |
| Containers & Packaging continued | | | | | | |
| Owens-Brockway Glass Container, Inc.: | | | | | | |
| 8.25%, 05/15/2013 | | $ 1,335,000 | | $ | | 1,475,175 |
| 8.75%, 11/15/2012 | | 1,025,000 | | | | 1,160,812 |
| | | | | |
|
| | | | | | | 5,696,237 |
| | | | | |
|
| Metals & Mining 2.1% | | | | | | |
| Alaska Steel Corp., 7.75%, 06/15/2012 | | 500,000 | | | | 508,750 |
| Century Aluminum Co., 7.50%, 08/15/2014 144A | | 340,000 | | | | 362,100 |
| Foundation Pennsylvania Coal Co., 7.25%, 08/01/2014 144A | | 1,100,000 | | | | 1,181,125 |
| Freeport-McMoRan Copper & Gold, Inc.: | | | | | | |
| 6.875%, 02/01/2014 | | 820,000 | | | | 803,600 |
| 7.50%, 11/15/2006 | | 1,200,000 | | | | 1,248,000 |
| 10.125%, 02/01/2010 | | 1,680,000 | | | | 1,894,200 |
| Oregon Steel Mills, Inc., 10.00%, 07/15/2009 | | 1,300,000 | | | | 1,449,500 |
| Peabody Energy Corp.: | | | | | | |
| 5.875%, 04/15/2016 | | 500,000 | | | | 512,500 |
| 6.875%, 03/15/2013 | | 440,000 | | | | 485,100 |
| U.S. Steel LLC, 10.75%, 08/01/2008 | | 325,000 | | | | 386,750 |
| | | | | |
|
| | | | | | | 8,831,625 |
| | | | | |
|
| Paper & Forest Products 0.6% | | | | | | |
| Boise Cascade LLC, 7.125%, 10/15/2014 144A | | 215,000 | | | | 225,493 |
| Georgia Pacific Corp.: | | | | | | |
| 8.00%, 01/15/2024 | | 420,000 | | | | 488,250 |
| 8.125%, 05/15/2011 | | 1,600,000 | | | | 1,876,000 |
| | | | | |
|
| | | | | | | 2,589,743 |
| | | | | |
|
| TELECOMMUNICATION SERVICES 1.2% | | | | | | |
| Diversified Telecommunication Services 0.3% | | | | | | |
| FairPoint Communications, Inc., 12.50%, 05/01/2010 | | 1,040,000 | | | | 1,118,000 |
| | | | | |
|
| Wireless Telecommunication Services 0.9% | | | | | | |
| Centennial Communications Corp., 8.625%, 02/01/2005 144A | | 1,000,000 | | | | 1,015,000 |
| Nextel Communications, Inc., 7.375%, 08/01/2015 | | 2,000,000 | | | | 2,230,000 |
| Rural Cellular Corp., 8.25%, 03/15/2012 144A | | 450,000 | | | | 474,750 |
| | | | | |
|
| | | | | | | 3,719,750 |
| | | | | |
|
| UTILITIES 1.6% | | | | | | |
| Multi-Utilities & Unregulated Power 1.6% | | | | | | |
| AES Corp., 9.50%, 06/01/2009 | | 2,005,000 | | | | 2,320,787 |
| NRG Energy, Inc., 8.00%, 12/15/2013 144A | | 1,450,000 | | | | 1,604,063 |
| Reliant Resources, Inc.: | | | | | | |
| 9.25%, 07/15/2010 | | 1,300,000 | | | | 1,449,500 |
| 9.50%, 07/15/2013 | | 1,000,000 | | | | 1,130,000 |
| | | | | |
|
| | | | | | | 6,504,350 |
| | | | | |
|
| Total Corporate Bonds (cost $146,391,182) | | | | | | 156,252,630 |
| | | | | |
|
See Notes to Financial Statements
16
SCHEDULE OF INVESTMENTS continued
October 31, 2004 (unaudited)
| | | | | | |
| | | Principal | | | | |
| | | Amount | | | | Value |
|
| |
| FOREIGN BONDS - CORPORATE (PRINCIPAL AMOUNT DENOMINATED | | | | | | |
| IN CURRENCY INDICATED) 14.4% | | | | | | |
| CONSUMER DISCRETIONARY 1.1% | | | | | | |
| Automobiles 0.5% | | | | | | |
| Gie Psa Tresorerie, 5.875%, 09/27/2011, EUR | | 700,000 | | $ | | 992,527 |
| Renault SA, 6.125%, 06/26/2009, EUR | | 720,000 | | | | 1,016,158 |
| | | | | |
|
| | | | | | | 2,008,685 |
| | | | | |
|
| Hotels, Restaurants & Leisure 0.2% | | | | | | |
| Sodexho Alliance SA, 5.875%, 03/25/2009, EUR | | 720,000 | | | | 987,292 |
| | | | | |
|
| Internet & Catalog Retail 0.2% | | | | | | |
| Great University Stores, 6.375%, 07/16/2009, GBP | | 450,000 | | | | 856,281 |
| | | | | |
|
| Specialty Retail 0.2% | | | | | | |
| LVMH Moet Hennessy - Louis Vuitton, 6.125%, 06/25/2008, EUR | | 650,000 | | | | 909,327 |
| | | | | |
|
| CONSUMER STAPLES 0.5% | | | | | | |
| Food & Staples Retailing 0.5% | | | | | | |
| Casino Guichard Perrachon SA, 6.00%, 03/06/2008, EUR | | 700,000 | | | | 962,544 |
| Tesco plc, 4.75%, 04/13/2010, GBP | | 750,000 | | | | 1,009,115 |
| | | | | |
|
| | | | | | | 1,971,659 |
| | | | | |
|
| ENERGY 0.3% | | | | | | |
| Oil & Gas 0.3% | | | | | | |
| Transco plc, 7.00%, 12/15/2008, AUD | | 1,500,000 | | | | 1,163,979 |
| | | | | |
|
| FINANCIALS 10.9% | | | | | | |
| Capital Markets 1.3% | | | | | | |
| General Electric Capital Corp.: | | | | | | |
| 6.50%, 01/27/2009, NZD | | 2,700,000 | | | | 1,852,451 |
| FRN, 2.17%, 03/31/2008, EUR | | 1,000,000 | | | | 1,272,301 |
| Merrill Lynch & Co., Inc., FRN, 2.37%, 02/09/2006, EUR | | 1,000,000 | | | | 1,274,672 |
| Morgan Stanley, 4.375%, 03/01/2010, EUR | | 720,000 | | | | 950,623 |
| | | | | |
|
| | | | | | | 5,350,047 |
| | | | | |
|
| Commercial Banks 4.3% | | | | | | |
| Australia & New Zealand Bank, 4.875%, 12/22/2008, GBP | | 450,000 | | | | 817,933 |
| Banco Santander, 4.00%, 09/10/2010, EUR | | 2,200,000 | | | | 2,874,112 |
| BOS International Australia, Ltd., 3.50%, 01/22/2007, CAD | | 1,890,000 | | | | 1,545,625 |
| BSCH Issuances, Ltd., 5.125%, 07/06/2009, EUR | | 1,350,000 | | | | 1,841,534 |
| EUROFIMA, 6.50%, 08/22/2011, AUD | | 1,500,000 | | | | 1,166,744 |
| European Investment Bank: | | | | | | |
| 4.00%, 04/15/2009, SEK | | 5,000,000 | | | | 714,517 |
| 6.00%, 08/14/2013, AUD | | 1,530,000 | | | | 1,172,847 |
| HBOS Treasury Services plc, FRN, 2.25%, 03/14/2008, EUR | | 1,000,000 | | | | 1,275,692 |
| Kreditanst Fur Wie, 6.00%, 07/15/2009, NZD | | 4,650,000 | | | | 3,118,005 |
| Rabobank Nederland, 4.25%, 01/05/2009, CAD | | 2,000,000 | | | | 1,646,562 |
| Royal Bank of Canada, FRN, 4.48%, 04/08/2010, GBP | | 1,036,000 | | | | 1,902,482 |
| | | | | |
|
| | | | | | | 18,076,053 |
| | | | | |
|
See Notes to Financial Statements
17
SCHEDULE OF INVESTMENTS continued
October 31, 2004 (unaudited)
| | | | | | |
| | | Principal | | | | |
| | | Amount | | | | Value |
|
| |
| FOREIGN BONDS - CORPORATE (PRINCIPAL AMOUNT DENOMINATED | | | | | | |
| IN CURRENCY INDICATED) continued | | | | | | |
| FINANCIALS continued | | | | | | |
| Consumer Finance 0.9% | | | | | | |
| International Lease Finance Corp., 4.125%, 10/09/2008, EUR | | 1,440,000 | | $ | | 1,881,054 |
| Toyota Credit Canada, Inc., 4.75%, 12/30/2008, CAD | | 2,150,000 | | | | 1,804,058 |
| | | | | |
|
| | | | | | | 3,685,112 |
| | | | | |
|
| Diversified Financial Services 2.0% | | | | | | |
| BAT International Finance plc, 4.875%, 02/25/2009, EUR | | 720,000 | | | | 951,587 |
| Cédulas, 3.25%, 06/19/2010, EUR | | 2,600,000 | | | | 3,281,666 |
| Household Financial Corp., 5.125%, 06/24/2009, EUR | | 1,350,000 | | | | 1,843,427 |
| Nationwide Building Society, FRN, 2.20%, 11/01/2008, EUR | | 975,000 | | | | 1,241,687 |
| Network Rail Finance plc, FRN, 2.15%, 02/27/2007, EUR | | 800,000 | | | | 1,020,349 |
| | | | | |
|
| | | | | | | 8,338,716 |
| | | | | |
|
| Insurance 0.3% | | | | | | |
| AIG Sunamerica, 5.50%, 03/07/2011, EUR | | 750,000 | | | | 1,048,985 |
| | | | | |
|
| Thrifts & Mortgage Finance 2.1% | | | | | | |
| Nykredit: | | | | | | |
| 4.00%, 10/01/2020, DKK | | 36,454,810 | | | | 6,141,258 |
| 5.00%, 10/01/2022, DKK | | 10,629,776 | | | | 1,866,393 |
| 6.00%, 10/01/2022, DKK | | 4,931,209 | | | | 887,824 |
| | | | | |
|
| | | | | | | 8,895,475 |
| | | | | |
|
| HEALTH CARE 0.7% | | | | | | |
| Pharmaceuticals 0.7% | | | | | | |
| Aries Vermogensverwaltung Gmbh, 7.75%, 10/25/2009, EUR 144A | | 2,000,000 | | | | 2,778,808 |
| | | | | |
|
| INDUSTRIALS 0.5% | | | | | | |
| Construction & Engineering 0.3% | | | | | | |
| Deutsche Bahn Finance BV, 4.875%, 07/06/2009, EUR | | 750,000 | | | | 1,018,246 |
| | | | | |
|
| Industrial Conglomerates 0.2% | | | | | | |
| Tyco International Group, 5.50%, 11/19/2008, EUR | | 720,000 | | | | 985,135 |
| | | | | |
|
| TELECOMMUNICATION SERVICES 0.2% | | | | | | |
| Diversified Telecommunication Services 0.2% | | | | | | |
| Sogerim SA, 7.25%, 05/11/2005, EUR | | 700,000 | | | | 1,040,536 |
| | | | | |
|
| UTILITIES 0.2% | | | | | | |
| Electric Utilities 0.2% | | | | | | |
| International Endesa BV, 4.375%, 06/18/2009, EUR | | 700,000 | | | | 926,984 |
| | | | | |
|
| Total Foreign Bonds - Corporate (cost $56,435,600) | | | | | | 60,041,320 |
| | | | | |
|
| FOREIGN BONDS - GOVERNMENT (PRINCIPAL AMOUNT DENOMINATED | | | | | | |
| IN CURRENCY INDICATED) 12.2% | | | | | | |
| Australia: | | | | | | |
| 5.26%, 11/20/2004, AUD | | 3,740,000 | | | | 4,065,212 |
| 6.50%, 05/15/2013, AUD | | 1,250,000 | | | | 1,006,618 |
| Hungary, 8.50%, 10/12/2005, HUF | | 1,800,000,000 | | | | 9,190,563 |
See Notes to Financial Statements
18
SCHEDULE OF INVESTMENTS continued
October 31, 2004 (unaudited)
| | | | | | | | | | |
| | | | | | | Principal | | | | |
| | | | | | | Amount | | | | Value |
|
| |
| FOREIGN BONDS - GOVERNMENT (PRINCIPAL AMOUNT DENOMINATED | | | | | | |
| IN CURRENCY INDICATED) continued | | | | | | |
| Mexico: | | | | | | |
| 9.00%, 12/20/2012, MXN | | 12,500,000 | | $ | | 1,033,026 |
| 10.50%, 07/14/2011, MXN | | 25,000,000 | | | | 2,315,028 |
| New Zealand, 6.50%, 04/15/2013, NZD | | 1,400,000 | | | | 986,942 |
| Norway, 6.50%, 05/15/2013, NOK | | 33,000,000 | | | | 6,086,133 |
| Poland, 5.00%, 10/24/2013, PLN | | 27,000,000 | | | | 7,013,267 |
| Slovakia, 4.95%, 03/05/2008, SKK | | 140,000,000 | | | | 4,550,084 |
| South Africa, 7.00%, 04/10/2008, EUR | | 750,000 | | | | 1,063,709 |
| Sweden: | | | | | | |
| 3.50%, 12/01/2015, SEK | | 15,300,000 | | | | 2,675,695 |
| 5.25%, 03/15/2011, SEK | | 26,500,000 | | | | 4,016,046 |
| 6.75%, 05/05/2014, SEK | | 12,400,000 | | | | 2,089,754 |
| United Kingdom, 6.21%, 02/23/2005, GBP | | 1,000,000 | | | | 4,750,696 |
| | | | | |
|
| Total Foreign Bonds - Government (cost $47,298,826) | | | | | | 50,842,773 |
| | | | | |
|
| WHOLE LOAN MORTGAGE-BACKED COLLATERALIZED MORTGAGE | | | | | | |
| OBLIGATIONS 1.1% | | | | | | |
| Fixed Rate 0.7% | | | | | | |
| Structured Asset Securities Corp., Ser. 2004-20, Class 5A1, 6.25%,11/25/2034 | | $ 2,990,000 | | | | 3,094,183 |
| | | | | |
|
| Floating Rate 0.4% | | | | | | |
| Countrywide Home Loan, Inc., Ser. 2004-R1, Class 1AF, 2.24%,09/02/2034 (h) | | 800,000 | | | | 800,219 |
| William Street Funding Corp., Ser. 2004-3, Class A, FRN, 2.30%, | | | | | | |
| 09/23/2009 (h) 144A | | 750,000 | | | | 750,073 |
| | | | | |
|
| | | | | | | | | | | 1,550,292 |
| | | | | | | | | |
|
| Total Whole Loan Mortgage-Backed Collateralized Mortgage Obligations | | | | | | |
| (cost $4,642,281) | | | | | | 4,644,475 |
| | | | | |
|
| WHOLE LOAN SUBORDINATE COLLATERALIZED MORTGAGE | | | | | | |
| OBLIGATIONS 0.2% | | | | | | |
| Fixed Rate 0.2% | | | | | | |
| MASTR Resecuritization Trust, Ser. 2004-3, 5.00%, 03/25/2034 (h) 144A | | | | | | |
| (cost $863,101) | | 872,979 | | | | 859,339 |
| | | | | |
|
| U.S. TREASURY OBLIGATIONS 2.6% | | | | | | |
| U.S. Treasury Bonds, 5.375%, 02/15/2031 ## | | 9,315,000 | | | | 10,120,245 |
| U.S. Treasury Notes, 4.25%, 08/15/2014 ## | | 800,000 | | | | 814,375 |
| | | | | |
|
| Total U.S. Treasury Obligations (cost $10,260,750) | | | | | | 10,934,620 |
| | | | | |
|
| YANKEE OBLIGATIONS - CORPORATE 5.9% | | | | | | |
| CONSUMER DISCRETIONARY 0.3% | | | | | | |
| Media 0.3% | | | | | | |
| IMAX Corp., 9.625%, 12/01/2010 144A | | 1,300,000 | | | | 1,326,000 |
| | | | | |
|
| ENERGY 0.4% | | | | | | |
| Energy Equipment & Services 0.4% | | | | | | |
| Petroleum Geo Services, 10.00%, 11/05/2010 | | 1,425,000 | | | | 1,631,625 |
| | | | | |
|
See Notes to Financial Statements
19
SCHEDULE OF INVESTMENTS continued
October 31, 2004 (unaudited)
| | | | | | |
| | | Principal | | | | |
| | | Amount | | | | Value |
|
| |
| YANKEE OBLIGATIONS - CORPORATE continued | | | | | | |
| FINANCIALS 0.4% | | | | | | |
| Diversified Financial Services 0.4% | | | | | | |
| Preferred Term Securities, Ltd., FRN: | | | | | | |
| 3.51%, 06/24/2034 (h) 144A | | $ 220,000 | | $ | | 220,512 |
| 3.56%, 12/24/2033 (h) 144A | | 500,000 | | | | 501,120 |
| Ship Finance International Ltd., 8.50%, 12/15/2013 | | 865,000 | | | | 882,300 |
| | | | | |
|
| | | | | | | 1,603,932 |
| | | | | |
|
| HEALTH CARE 0.6% | | | | | | |
| Pharmaceuticals 0.6% | | | | | | |
| Jean Coutu Group, Inc., 8.50%, 08/01/2014 144A | | 2,350,000 | | | | 2,408,750 |
| | | | | |
|
| INDUSTRIALS 1.1% | | | | | | |
| Commercial Services & Supplies 0.5% | | | | | | |
| Stena AB, 7.50%, 11/01/2013 | | 2,000,000 | | | | 2,095,000 |
| | | | | |
|
| Marine 0.3% | | | | | | |
| CP Ships, Ltd., 10.375%, 07/15/2012 | | 1,090,000 | | | | 1,261,675 |
| | | | | |
|
| Transportation Infrastructure 0.3% | | | | | | |
| Sea Containers, Ltd., 10.50%, 05/15/2012 | | 1,070,000 | | | | 1,108,788 |
| | | | | |
|
| INFORMATION TECHNOLOGY 0.2% | | | | | | |
| Electronic Equipment & Instruments 0.2% | | | | | | |
| Celestica, Inc., 7.875%, 07/01/2011 | | 900,000 | | | | 967,500 |
| | | | | |
|
| MATERIALS 1.1% | | | | | | |
| Containers & Packaging 1.0% | | | | | | |
| Crown European Holdings SA: | | | | | | |
| 9.50%, 03/01/2011 | | 500,000 | | | | 572,500 |
| 10.875%, 03/01/2013 | | 1,500,000 | | | | 1,788,750 |
| Stone Container Finance Co., 7.375%, 07/15/2014 144A | | 1,750,000 | | | | 1,876,875 |
| | | | | |
|
| | | | | | | 4,238,125 |
| | | | | |
|
| Metals & Mining 0.0% | | | | | | |
| Gerdau Ameristeel Corp., 10.375%, 07/15/2011 | | 141,000 | | | | 163,560 |
| | | | | |
|
| Paper & Forest Products 0.1% | | | | | | |
| Millar Western Forest Products, Ltd., 7.75%, 11/15/2013 | | 165,000 | | | | 176,962 |
| | | | | |
|
| TELECOMMUNICATION SERVICES 0.3% | | | | | | |
| Wireless Telecommunication Services 0.3% | | | | | | |
| Rogers Wireless, Inc.: | | | | | | |
| 6.375%, 03/01/2014 | | 465,000 | | | | 446,400 |
| 9.625%, 05/01/2011 | | 745,000 | | | | 849,300 |
| | | | | |
|
| | | | | | | 1,295,700 |
| | | | | |
|
| UTILITIES 1.5% | | | | | | |
| Electric Utilities 0.4% | | | | | | |
| Enersis SA, 7.375%, 01/15/2014 | | 1,800,000 | | | | 1,888,605 |
| | | | | |
|
See Notes to Financial Statements
20
SCHEDULE OF INVESTMENTS continued
October 31, 2004 (unaudited)
| | | | | | | | |
| | | | | Principal | | | | |
| | | | | Amount | | | | Value |
|
| |
| YANKEE OBLIGATIONS - CORPORATE continued | | | | | | |
| UTILITIES continued | | | | | | |
| Gas Utilities 1.1% | | | | | | |
| Gazprom, 9.625%, 03/01/2013 144A | | $ 3,900,000 | | $ | | 4,504,500 |
| | | | | |
|
| Total Yankee Obligations - Corporate (cost $23,439,168) | | | | | | 24,670,722 |
| | | | | |
|
| YANKEE OBLIGATIONS - GOVERNMENT8.4% | | | | | | |
| Brazil: | | | | | | |
| 9.25%, 10/22/2010 | | 2,500,000 | | | | 2,691,250 |
| 10.00%, 01/16/2007 | | 1,000,000 | | | | 1,112,000 |
| Ser. L, 8.00%, 04/15/2014 | | 996,855 | | | | 990,973 |
| Colombia, 9.75%, 04/09/2011 | | 3,168,858 | | | | 3,675,876 |
| Indonesia, 6.75%, 03/10/2014 144A | | 2,250,000 | | | | 2,205,000 |
| Mexico: | | | | | | |
| 8.30%, 08/15/2031 | | 1,400,000 | | | | 1,621,900 |
| 8.375%, 01/14/2011 | | 2,985,000 | | | | 3,529,762 |
| Peru, 9.125%, 01/15/2008 | | 2,700,000 | | | | 3,051,000 |
| Philippines, 9.375%, 01/18/2017 | | 5,400,000 | | | | 5,595,750 |
| Russia: | | | | | | |
| Ser. V, 3.00%, 05/14/2008 | | 2,500,000 | | | | 2,316,235 |
| Sr. Disc. Note, Step Bond, 5.00%, 03/31/2007 † | | 2,100,000 | | | | 2,102,625 |
| Venezuela: | | | | | | |
| 8.50%, 10/08/2014 | | 250,000 | | | | 254,375 |
| 9.25%, 09/15/2027 | | 750,000 | | | | 769,125 |
| 10.75%, 09/19/2013 | | 3,650,000 | | | | 4,228,525 |
| FRN, 3.09%, 04/20/2011 | | 885,000 | | | | 769,938 |
| | | | | |
|
| Total Yankee Obligations - Government (cost $31,733,646) | | | | | | 34,914,334 |
| | | | | | |
|
| |
| | | | | Shares | | | | Value |
|
| |
| COMMON STOCKS 0.0% | | | | | | |
| CONSUMER DISCRETIONARY 0.0% | | | | | | |
| Media 0.0% | | | | | | |
| IMAX Corp. * | | 27,389 | | | | 177,755 |
| | | | | |
|
| ENERGY 0.0% | | | | | | |
| Oil & Gas 0.0% | | | | | | |
| Tribo Petroleum Corp., Class A (h) * + | | 1,000 | | | | 0 |
| | | | | |
|
| Total Common Stocks (cost $231,381) | | | | | | 177,755 |
| | | | | |
|
| WARRANTS 0.1% | | | | | | |
| CONSUMER DISCRETIONARY 0.0% | | | | | | |
| Media 0.0% | | | | | | |
| RCN Corp., Expiring 06/30/2013 (h) *+ | | 175,000 | | | | 0 |
| | | | | |
|
| ENERGY 0.0% | | | | | | |
| Oil & Gas 0.0% | | | | | | |
| Tri-Union Development Corp., Expiring 06/01/2006 (h) * + | | 590 | | | | 0 |
| | | | | |
|
See Notes to Financial Statements
21
SCHEDULE OF INVESTMENTS continued
October 31, 2004 (unaudited)
| | | | | | |
| | | Shares | | | | Value |
|
| WARRANTS continued | | | | | | |
| FINANCIALS 0.0% | | | | | | |
| Diversified Financial Services 0.0% | | | | | | |
| Ono Finance plc, Expiring 03/16/2011 144A * + | | 2,000 | | $ | | 20 |
| Ono Finance plc, Expiring 05/31/2009 144A (h) * + | | 2,000 | | | | 0 |
| | | | | |
|
| | | | | | | 20 |
| | | | | |
|
| MATERIALS 0.1% | | | | | | |
| Chemicals 0.1% | | | | | | |
| HMP Equity Holdings Corp., Expiring 05/15/2011 144A * | | 1,000 | | | | 300,500 |
| | | | | |
|
| Total Warrants (cost $382,867) | | | | | | 300,520 |
| | | | | | |
|
| |
| | | Principal | | | | |
| | | Amount | | | | Value |
|
| |
| SHORT-TERM INVESTMENTS 9.6% | | | | | | |
| COMMERCIAL PAPER 6.6% | | | | | | |
| Concord Capital Co., 1.82%, 11/15/2004 | | $ 6,160,000 | | | | 6,155,640 |
| Credit Suisse First Boston, Inc., 1.81%, 11/15/2004 | | 3,060,000 | | | | 3,057,846 |
| Giro Balanced Funding, 1.81%, 11/15/2004 | | 6,160,000 | | | | 6,155,664 |
| Rhineland Funding Capital, 1.82%, 11/15/2004 | | 6,140,000 | | | | 6,135,654 |
| Three Pillars Funding Corp., 1.82%, 11/15/2004 | | 6,160,000 | | | | 6,155,640 |
| | | | | |
|
| | | | | | | 27,660,444 |
| | | | | | |
|
| |
| | | Shares | | | | Value |
|
| |
| MUTUAL FUND SHARES 3.0% | | | | | | |
| Evergreen Institutional Money Market Fund ø ## | | 12,237,090 | | | | 12,237,090 |
| | | | | |
|
| Total Short-Term Investments (cost $39,897,535) | | | | | | 39,897,535 |
| | | | | |
|
| Total Investments (cost $427,238,896) 107.8% | | | | | | 449,781,207 |
| Other Assets and Liabilities (7.8%) | | | | | | (32,468,121) |
| | | | | |
|
| Net Assets 100.0% | | | | $ | | 417,313,086 |
| | | | | |
|
| | |
| (h) | No market quotation available. Valued at fair value as determined in good faith under procedures established by the |
| | Board of Trustees. |
| 144A | Security that may be sold to qualified institutional buyers under Rule 144A of the Securities Act of 1933, as amended. |
| | This security has been determined to be liquid under guidelines established by the Board of Trustees. |
| † | Security initially issued in zero coupon form which converts to coupon form at a specified rate and date. An effective |
| | interest rate is applied to recognize interest income daily for the bond. This rate is based on total expected interest to be |
| | earned over the life of the bond which consists of the aggregate coupon-interest payments and discount at acquisition. |
| | The rate shown is the stated rate at the current period end. |
| + | Security is deemed illiquid and is valued using market quotations where readily available. In the absence of market |
| | quotations, the security is valued based upon its fair value determined under procedures approved by the Board of |
| | Trustees. |
| (n) | Security issued in zero coupon form with no periodic interest payments but is acquired at a discount that results in a |
| | current yield to maturity. An effective interest rate is applied to recognize interest income daily for the bond. This rate is |
| | based on total expected income to be earned over the life of the bond from amortization of discount at acquisition. |
| # | When-issued or delayed delivery security |
See Notes to Financial Statements
22
SCHEDULE OF INVESTMENTS continued
October 31, 2004 (unaudited)
| | |
| * | Non-income producing security |
| ø | Evergreen Investment Management Company, LLC is the investment advisor to both the Fund and the money market fund. |
| ## | All or a portion of this security has been segregated for when-issued or delayed delivery securities. |
| | |
| Summary of Abbreviations |
| AUD | | Australian Dollar |
| CAD | | Canadian Dollar |
| DKK | | Danish Krone |
| EUR | | Euro |
| FHLMC | | Federal Home Loan Mortgage Corp. |
| FNMA | | Federal National Mortgage Association |
| FRN | | Floating Rate Note |
| GBP | | Pound Sterling |
| GNMA | | Government National Mortgage Association |
| HUF | | Hungarian Forint |
| MASTR | | Mortgage Asset Securitization Transactions, Inc. |
| MXN | | Mexican Peso |
| NOK | | Norwegian Krone |
| NZD | | New Zealand Dollar |
| PLN | | Polish Zloty |
| REIT | | Real Estate Investment Trust |
| SEK | | Swedish Krona |
| SKK | | Slovakia Koruny |
| TBA | | To Be Announced |
The following table shows the percent of total bonds by credit quality based on Moody's and Standard & Poor's ratings as of October 31, 2004:
| | |
| AAA | | 28.8% |
| AA | | 2.6% |
| A | | 9.7% |
| BBB | | 4.1% |
| BB | | 15.8% |
| B | | 31.7% |
| CCC | | 2.2% |
| Less than CCC | | 0.2% |
| NR | | 0.4% |
| NA | | 4.5% |
| |
|
| | | 100.0% |
| | |
|
The following table shows the percent of total bonds by maturity as of October 31, 2004:
| | |
| Less than 1 year | | 8.9% |
| 1 to 3 year(s) | | 2.5% |
| 3 to 5 years | | 16.0% |
| 5 to 10 years | | 49.5% |
| 10 to 20 years | | 7.0% |
| 20 to 30 years | | 3.7% |
| Greater than 30 years | | 12.4% |
| |
|
| | | 100.0% |
| | |
|
See Notes to Financial Statements
23
STATEMENT OF ASSETS AND LIABILITIES
October 31, 2004 (unaudited)
| | | | |
|
| Assets | | | | |
| Investments in securities, at value (cost $427,238,896) | | $ | | 449,781,207 |
| Foreign currency, at value (cost $1,284,375) | | | | 1,320,258 |
| Receivable for securities sold | | | | 3,361,952 |
| Receivable for Fund shares sold | | | | 270,307 |
| Interest receivable | | | | 7,159,074 |
| Receivable for closed forward foreign currency exchange contracts | | | | 640,882 |
| Prepaid expenses and other assets | | | | 39,687 |
|
| Total assets | | | | 462,573,367 |
|
| Liabilities | | | | |
| Dividends payable | | | | 697,724 |
| Payable for securities purchased | | | | 42,638,082 |
| Payable for Fund shares redeemed | | | | 1,650,100 |
| Payable for closed forward foreign currency exchange contracts | | | | 166,619 |
| Advisory fee payable | | | | 14,001 |
| Distribution Plan expenses payable | | | | 20,440 |
| Due to other related parties | | | | 3,474 |
| Accrued expenses and other liabilities | | | | 69,841 |
|
| Total liabilities | | | | 45,260,281 |
|
| Net assets | | $ | | 417,313,086 |
|
| Net assets represented by | | | | |
| Paid-in capital | | $ | | 445,032,384 |
| Undistributed net investment income | | | | 2,350,178 |
| Accumulated net realized losses on securities and foreign currency related transactions | | | | (52,379,566) |
| Net unrealized gains on securities and foreign currency related transactions | | | | 22,310,090 |
|
| Total net assets | | $ | | 417,313,086 |
|
| Net assets consists of | | | | |
| Class A | | $ | | 206,811,037 |
| Class B | | | | 104,799,303 |
| Class C | | | | 82,430,294 |
| Class I | | | | 23,272,452 |
|
| Total net assets | | $ | | 417,313,086 |
|
| Shares outstanding | | | | |
| Class A | | | | 31,241,408 |
| Class B | | | | 15,781,447 |
| Class C | | | | 12,432,663 |
| Class I | | | | 3,570,291 |
|
| Net asset value per share | | | | |
| Class A | | $ | | 6.62 |
| Class A - Offering price (based on sales charge of 4.75%) | | $ | | 6.95 |
| Class B | | $ | | 6.64 |
| Class C | | $ | | 6.63 |
| Class I | | $ | | 6.52 |
|
See Notes to Financial Statements
24
STATEMENT OF OPERATIONS
Six Months Ended October 31, 2004 (unaudited)
| | | | |
|
| Investment income | | | | |
| Interest (net of foreign withholding taxes of $5,450) | | $ | | 13,040,543 |
|
| Expenses | | | | |
| Advisory fee | | | | 916,439 |
| Distribution Plan expenses | | | | |
| Class A | | | | 299,677 |
| Class B | | | | 526,699 |
| Class C | | | | 410,096 |
| Administrative services fee | | | | 206,304 |
| Transfer agent fees | | | | 375,213 |
| Trustees' fees and expenses | | | | 5,796 |
| Printing and postage expenses | | | | 23,830 |
| Custodian and accounting fee | | | | 129,583 |
| Registration and filing fees | | | | 36,544 |
| Professional fees | | | | 13,855 |
| Other | | | | 30,915 |
|
| Total expenses | | | | 2,974,951 |
| Less: Expense reductions | | | | (817) |
|
| Net expenses | | | | 2,974,134 |
|
| Net investment income | | | | 10,066,409 |
|
| Net realized and unrealized gains or losses on securities and foreign currency | | | | |
| related transactions | | | | |
| Net realized gains or losses on: | | | | |
| Securities | | | | 4,988,580 |
| Foreign currency related transactions | | | | (1,875,374) |
|
| Net realized gains on securities and foreign currency related transactions | | | | 3,113,206 |
| Net change in unrealized gains or losses on securities and foreign currency related transactions | | | | 12,820,983 |
|
| Net realized and unrealized gains or losses on securities and foreign currency related | | | | |
| transactions | | | | 15,934,189 |
|
| Net increase in net assets resulting from operations | | $ | | 26,000,598 |
|
See Notes to Financial Statements
25
STATEMENTS OF CHANGES IN NET ASSETS
| | | | | | | | |
| | | Six Months Ended | | | | |
| | | October 31, 2004 | | Year Ended |
| | | (unaudited) | | April 30, 2004 |
|
| Operations | | | | | | | | |
| Net investment income | | | | $ 10,066,409 | | | | $ 20,436,680 |
| Net realized gains on securities | | | | | | | | |
| and foreign currency related transactions | | | | 3,113,206 | | | | 29,252,664 |
| Net change in unrealized gains or losses | | | | | | | | |
| on securities and foreign currency | | | | | | | | |
| related transactions | | | | 12,820,983 | | | | (27,295,321) |
|
| Net increase in net assets resulting from | | | | | | | | |
| operations | | | | 26,000,598 | | | | 22,394,023 |
|
Distributions to shareholders from | | | | | | | | |
| Net investment income | | | | | | | | |
| Class A | | | | (5,577,516) | | | | (10,999,622) |
| Class B | | | | (2,568,456) | | | | (5,696,610) |
| Class C | | | | (2,000,644) | | | | (4,247,112) |
| Class I | | | | (746,262) | | | | (1,546,157) |
| Net realized gains | | | | | | | | |
| Class A | | | | 0 | | | | (4,697,664) |
| Class B | | | | 0 | | | | (2,758,470) |
| Class C | | | | 0 | | | | (2,125,608) |
| Class I | | | | 0 | | | | (614,261) |
|
| Total distributions to shareholders | | | | (10,892,878) | | | | (32,685,504) |
|
| | | Shares | | | | Shares | | |
| Capital share transactions | | | | | | | | |
| Proceeds from shares sold | | | | | | | | |
| Class A | | 2,282,779 | | 14,607,918 | | 10,558,043 | | 69,375,473 |
| Class B | | 869,632 | | 5,594,750 | | 5,160,616 | | 33,950,532 |
| Class C | | 691,950 | | 4,431,830 | | 7,780,021 | | 51,216,021 |
| Class I | | 107,725 | | 694,444 | | 1,433,762 | | 9,306,633 |
|
| | | | | 25,328,942 | | | | 163,848,659 |
|
| Net asset value of shares issued in | | | | | | | | |
| reinvestment of distributions | | | | | | | | |
| Class A | | 588,346 | | 3,785,985 | | 1,604,686 | | 10,521,676 |
| Class B | | 224,015 | | 1,445,229 | | 788,248 | | 5,188,607 |
| Class C | | 166,868 | | 1,075,215 | | 537,515 | | 3,532,884 |
| Class I | | 55,009 | | 348,278 | | 145,931 | | 940,548 |
|
| | | | | 6,654,707 | | | | 20,183,715 |
|
| Automatic conversion of Class B shares | | | | | | | | |
| to Class A shares | | | | | | | | |
| Class A | | 384,192 | | 2,452,953 | | 680,069 | | 4,474,534 |
| Class B | | (382,992) | | (2,452,953) | | (677,862) | | (4,474,534) |
|
| | | | | 0 | | | | 0 |
|
| Payment for shares redeemed | | | | | | | | |
| Class A | | (3,686,623) | | (23,564,282) | | (7,929,281) | | (51,756,882) |
| Class B | | (2,608,240) | | (16,680,653) | | (4,162,066) | | (27,254,170) |
| Class C | | (2,395,577) | | (15,221,516) | | (4,832,223) | | (31,650,267) |
| Class I | | (846,508) | | (5,391,157) | | (4,929,827) | | (31,100,842) |
|
| | | | | (60,857,608) | | | | (141,762,161) |
|
| Net asset value of shares issued in | | | | | | | | |
| acquisition - Class I | | 0 | | 0 | | 5,508,003 | | 35,677,970 |
|
See Notes to Financial Statements
26
STATEMENTS OF CHANGES IN NET ASSETS continued
| | | | |
| | | Six Months Ended | | |
| | | October 31, 2004 | | Year Ended |
| | | (unaudited) | | April 30, 2004 |
|
| Capital share transactions continued | | | | |
| Net increase (decrease) in net assets | | | | |
| resulting from capital share | | | | |
| transactions | | $ (28,873,959) | | $ 77,948,183 |
|
| Total increase (decrease) in net assets | | (13,766,239) | | 67,656,702 |
| Net assets | | | | |
| Beginning of period | | 431,079,325 | | 363,422,623 |
|
| End of period | | $ 417,313,086 | | $ 431,079,325 |
|
| Undistributed net investment income | | $ 2,350,178 | | $ 4,013,098 |
|
See Notes to Financial Statements
27
NOTES TO FINANCIAL STATEMENTS (unaudited)
1. ORGANIZATION
Evergreen Strategic Income Fund (the "Fund") is a diversified series of Evergreen Fixed Income Trust (the "Trust"), a Delaware statutory trust organized on September 18, 1997. The Trust is an open-end management investment company registered under the Investment Company Act of 1940, as amended (the "1940 Act").
The Fund offers Class A, Class B, Class C and Institutional ("Class I") shares. Class A shares are sold with a front-end sales charge. However, Class A share investments of $1 million or more are not subject to a front-end sales charge but will be subject to a contingent deferred sales charge of 1.00% upon redemption within one year. Class B shares are sold without a front-end sales charge but are subject to a contingent deferred sales charge that is payable upon redemption and decreases depending on how long the shares have been held. Effective February 2, 2004, Class C shares are no longer sold with a front-end sales charge but are still subject to a contingent deferred sales charge that is payable upon redemption within one year. Class I shares are sold without a front-end sales charge or contingent deferred sales charge. Each class of shares, except Class I shares, pays an ongoing distribution fee.
2. SIGNIFICANT ACCOUNTING POLICIES
The following is a summary of significant accounting policies consistently followed by the Fund in the preparation of its financial statements. The policies are in conformity with generally accepted accounting principles in the United States of America, which require management to make estimates and assumptions that affect amounts reported herein. Actual results could differ from these estimates.
a. Valuation of investments
Portfolio debt securities acquired with more than 60 days to maturity are valued at prices obtained from an independent pricing service which takes into consideration such factors as similar security prices, yields, maturities, liquidity and ratings. Securities for which valuations are not readily available from an independent pricing service may be valued by brokers which use prices provided by market makers or estimates of market value obtained from yield data relating to investments or securities with similar characteristics.
Listed equity securities are usually valued at the last sales price or official closing price on the national securities exchange where the securities are principally traded.
Foreign securities traded on an established exchange are valued at the last sales price on the exchange where the security is primarily traded. If there has been no sale, the securities are valued at the mean between bid and asked prices. Foreign securities may be valued at fair value according to procedures approved by the Board of Trustees if the closing price is not reflective of current market prices due to trading or events occurring in the foreign markets between the close of the established exchange and the valuation time of the Fund. In addition, substantial changes in values in the U.S. markets subsequent to the close of a foreign market may also affect the values of securities traded in the foreign market. The value of foreign securities may be adjusted if such movements in the U.S. market exceed a specified threshold.
28
NOTES TO FINANCIAL STATEMENTS (unaudited) continued
Short-term securities with remaining maturities of 60 days or less at the time of purchase are valued at amortized cost, which approximates market value.
Investments in other mutual funds are valued at net asset value. Securities for which market quotations are not readily available or not reflective of current market value are valued at fair value as determined in good faith, according to procedures approved by the Board of Trustees.
b. Foreign currency translation
All assets and liabilities denominated in foreign currencies are translated into U.S. dollar amounts at the date of valuation. Purchases and sales of portfolio securities and income items denominated in foreign currencies are translated into U.S. dollar amounts on the respective dates of such transactions. The Fund does not separately account for that portion of the results of operations resulting from changes in foreign exchange rates on investments and the fluctuations arising from changes in market prices of securities held. Such fluctuations are included with the net realized and unrealized gains or losses on securities.
c. Forward foreign currency contracts
A forward foreign currency contract is an agreement between two parties to purchase or sell a specific currency for an agreed-upon price at a future date. The Fund enters into forward foreign currency contracts to facilitate transactions in foreign-denominated securities and to attempt to minimize the risk to the Fund from adverse changes in the relationship between currencies. Forward foreign currency contracts are recorded at the forward rate and marked-to-market daily. When the contracts are closed, realized gains and losses arising from such transactions are recorded as realized gains or losses on foreign currency related transactions. The Fund could be exposed to risks if the counterparties to the contracts are unable to meet the terms of their contracts or if the value of the foreign currency changes unfavorably.
d. When-issued and delayed delivery transactions
The Fund records when-issued or delayed delivery securities as of trade date and maintains security positions such that sufficient liquid assets will be available to make payment for the securities purchased. Securities purchased on a when-issued or delayed delivery basis are marked-to-market daily and begin earning interest on the settlement date. Losses may occur on these transactions due to changes in market conditions or the failure of counterparties to perform under the contract.
e. Securities lending
The Fund may lend its securities to certain qualified brokers in order to earn additional income. The Fund receives compensation in the form of fees or interest earned on the investment of any cash collateral received. The Fund also continues to receive interest and dividends on the securities loaned. The Fund receives collateral in the form of cash or securities with a market value at least equal to the market value of the securities on loan, including accrued interest. In the event of default or bankruptcy by the borrower, the Fund could experience delays and costs in recovering the loaned securities or in gaining access to the collateral. The Fund has the right under the lending agreement to recover the securities from the borrower on demand.
29
NOTES TO FINANCIAL STATEMENTS (unaudited) continued
f. Dollar roll transactions
The Fund may enter into dollar roll transactions with respect to mortgage-backed securities. In a dollar roll transaction, the Fund sells mortgage-backed securities to financial institutions and simultaneously agrees to accept substantially similar (same type, coupon and maturity) securities at a later date at an agreed upon price. The Fund will use the proceeds generated from the transactions to invest in short-term investments, which may enhance the Fund's current yield and total return. The Fund accounts for dollar roll transactions as purchases and sales.
g. Security transactions and investment income
Security transactions are recorded on trade date. Realized gains and losses are computed using the specific cost of the security sold. Interest income is recorded on the accrual basis and includes accretion of discounts and amortization of premiums. Foreign income and capital gains realized on some securities may be subject to foreign taxes, which are accrued as applicable.
h. Federal taxes
The Fund intends to continue to qualify as a regulated investment company and distribute all of its taxable income, including any net capital gains (which have already been offset by available capital loss carryovers). Accordingly, no provision for federal taxes is required.
i. Distributions
Distributions to shareholders from net investment income are accrued daily and paid monthly. Distributions from net realized gains, if any, are recorded on the ex-dividend date. Such distributions are determined in conformity with income tax regulations, which may differ from generally accepted accounting principles.
j. Class allocations
Income, common expenses and realized and unrealized gains and losses are allocated to the classes based on the relative net assets of each class. Distribution fees, if any, are calculated daily at the class level based on the appropriate net assets of each class and the specific expense rates applicable to each class.
3. ADVISORY FEE AND OTHER TRANSACTIONS WITH AFFILIATES
Evergreen Investment Management Company, LLC ("EIMC"), an indirect, wholly-owned subsidiary of Wachovia Corporation ("Wachovia"), is the investment advisor to the Fund and is paid a fee at an annual rate of 2% of the Fund's gross investment income plus an amount determined by applying percentage rates to the average daily net assets of the Fund, starting at 0.31% and declining to 0.16% as average daily net assets increase.
Effective May 10, 2004, Evergreen International Advisors, an indirect, wholly-owned subsidiary of Wachovia, became the investment sub-advisor for the international bond portion of the Fund and is paid by EIMC for its services to the Fund.
From time to time, EIMC may voluntarily or contractually waive its fee and/or reimburse expenses in order to limit operating expenses. For fee waivers and/or reimbursements made after
30
NOTES TO FINANCIAL STATEMENTS (unaudited) continued
January 1, 2003, EIMC may recoup certain amounts waived and/or reimbursed up to a period of three years following the end of the fiscal year in which the fee waivers and/or reimbursements were made.
Evergreen Investment Services, Inc. ("EIS"), an indirect, wholly-owned subsidiary of Wachovia, is the administrator to the Fund. As administrator, EIS provides the Fund with facilities, equipment and personnel and is paid an annual rate determined by applying percentage rates to the aggregate average daily net assets of the Evergreen funds (excluding money market funds), starting at 0.10% and declining to 0.05% as the aggregate average daily net assets of the Evergreen funds (excluding money market funds) increase.
Evergreen Service Company, LLC ("ESC"), an indirect, wholly-owned subsidiary of Wachovia, is the transfer and dividend disbursing agent for the Fund. ESC receives account fees that vary based on the type of account held by the shareholders in the Fund. For the six months ended October 31, 2004, the transfer agent fees were equivalent to an annual rate of 0.18% of the Fund's average daily net assets.
The Fund has placed a portion of its portfolio transactions with brokerage firms that are affiliates of Wachovia. During the six months ended October 31, 2004, the Fund paid brokerage commissions of $176 to Wachovia Securities, LLC.
4. DISTRIBUTION PLANS
EIS also serves as distributor of the Fund's shares. The Fund has adopted Distribution Plans, as allowed by Rule 12b-1 of the 1940 Act, for each class of shares, except Class I. Under the Distribution Plans, distribution fees are paid at an annual rate of 0.30% of the average daily net assets for Class A shares and 1.00% of the average daily net assets for each of Class B and Class C shares.
For the six months ended October 31, 2004, EIS received $11,456 from the sale of Class A shares and $184,408 and $22,754 in contingent deferred sales charges from redemptions of Class B and Class C shares, respectively.
5. ACQUISITION
Effective at the close of business on July 11, 2003, the Fund acquired the net assets of Evergreen Offit Emerging Markets Bond Fund in a tax-free exchange for Class I shares of the Fund. Shares were issued to Class I shares of Evergreen Offit Emerging Markets Bond Fund at an exchange ratio of 1.21 for Class I shares of the Fund. The acquired net assets consisted primarily of portfolio securities with unrealized appreciation of $4,059,467. The aggregate net assets of the Fund and Evergreen Offit Emerging Markets Bond Fund immediately prior to the acquisition were $404,982,531 and $35,677,970, respectively. The aggregate net assets of the Fund immediately after the acquisition were $440,660,501.
31
NOTES TO FINANCIAL STATEMENTS (unaudited) continued
6. SECURITIES TRANSACTIONS
Cost of purchases and proceeds from sales of investment securities (excluding short-term securities and mortgage dollar roll transactions) were as follows for the six months ended October 31, 2004:
| | | | | | |
| Cost of Purchases | | Proceeds from Sales |
|
| U.S. | | Non-U.S. | | U.S. | | Non-U.S. |
| Government | | Government | | Government | | Government |
|
| $196,684,362 | | $215,177,189 | | $187,794,198 | | $239,531,551 |
|
During the six months ended October 31, 2004, the Fund loaned securities to certain brokers. As of October 31, 2004, the Fund had no securities on loan. During the six months ended October 31, 2004, the Fund earned $273 in income from securities lending which is included in interest income on the Statement of Operations.
On October 31, 2004, the aggregate cost of securities for federal income tax purposes was $427,238,896. The gross unrealized appreciation and depreciation on securities based on tax cost was $23,799,181 and $1,256,870, respectively, with a net unrealized appreciation of $22,542,311.
As of April 30, 2004, the Fund had $55,492,772 in capital loss carryovers for federal income tax purposes expiring as follows:
| | | | | | | | | | |
| Expiration |
|
| 2005 | | 2006 | | 2007 | | 2008 | | 2009 | | 2010 |
|
| $2,862,156 | | $1,587,670 | | $1,587,670 | | $13,834,428 | | $16,346,913 | | $19,273,935 |
|
Pursuant to an Exemptive Order issued by the SEC, the Fund may participate in an interfund lending program with certain funds in the Evergreen fund family. This program allows the Fund to borrow from, or lend money to, other participating funds. During the six months ended October 31, 2004, the Fund did not participate in the interfund lending program.
8. EXPENSE REDUCTIONS
Through expense offset arrangements with ESC and the Fund's custodian, a portion of fund expenses has been reduced.
9. DEFERRED TRUSTEES' FEES
Each Trustee of the Fund may defer any or all compensation related to performance of their duties as Trustees. The Trustees' deferred balances are allocated to deferral accounts, which are included in the accrued expenses for the Fund. The investment performance of the deferral accounts are based on the investment performance of certain Evergreen funds. Any gains earned or losses incurred in the deferral accounts are reported in the Fund's Trustees' fees and expenses. At the election of the Trustees, the deferral account will be paid either in one lump sum or in quarterly installments for up to ten years.
32
NOTES TO FINANCIAL STATEMENTS (unaudited) continued
10. FINANCING AGREEMENT The Fund and certain other Evergreen funds share in a $150 million unsecured revolving credit commitment for temporary and emergency purposes, including the funding of redemptions, as permitted by each participating fund's borrowing restrictions. Borrowings under this facility bear interest at 0.50% per annum above the Federal Funds rate. All of the participating funds are charged an annual commitment fee of 0.09% of the unused balance, which is allocated pro rata. During the six months ended October 31, 2004, the Fund had no borrowings under this agreement.
11. LITIGATION
From time to time, the Fund and EIMC are involved in various legal actions in the normal course of business. In EIMC's opinion, based upon the opinions of counsel, the Fund is not involved in any legal action that will have a material effect on the Fund's financial position and results of operations.
12. REGULATORY MATTERS
Since September 2003, governmental and self-regulatory authorities have instituted numerous ongoing investigations of various practices in the mutual fund industry, including investigations relating to revenue sharing, market-timing, late trading and record retention, among other things. The investigations cover investment advisors, distributors and transfer agents to mutual funds, as well as other firms. EIMC, EIS and ESC (collectively, "Evergreen") have received subpoenas and other requests for documents and testimony relating to these investigations, are endeavoring to comply with those requests, and are cooperating with the investigations. Evergreen is continuing its own internal review of policies, practices, procedures and personnel, and is taking remedial action where appropriate.
In connection with one of these investigations, on July 28, 2004, the staff of the Securities and Exchange Commission ("SEC") informed Evergreen that the staff intends to recommend to the SEC that it institute an enforcement action against Evergreen. The SEC staff's proposed allegations relate to (i) an arrangement pursuant to which a broker at one of EIMC's affiliated broker-dealers had been authorized, apparently by an EIMC officer (no longer with EIMC), to engage in short-term trading, on behalf of a client, in Evergreen Mid Cap Growth Fund (formerly Evergreen Small Company Growth Fund and prior to that, known as Evergreen Emerging Growth Fund) during the period from December 2000 through April 2003, in excess of the limitations set forth in this fund's prospectus, (ii) short-term trading from September 2001 through January 2003, by a former Evergreen portfolio manager of Evergreen Precious Metals Fund, a fund he managed at the time, (iii) the sufficiency of systems for monitoring exchanges and enforcing exchange limitations as stated in each fund's prospectuses, and (iv) the adequacy of e-mail retention practices. In connection with the activity in Evergreen Mid Cap Growth Fund, EIMC reimbursed this fund $378,905, plus an additional $25,242, representing what EIMC calculated at that time to be the client's net gain and the fees earned by EIMC and the expenses incurred by this fund on the client's account. In connection with the activity in Evergreen Precious Metals Fund, EIMC reimbursed this fund $70,878, plus an additional $3,075, repre-
33
NOTES TO FINANCIAL STATEMENTS (unaudited) continued
senting what EIMC calculated at that time to be the portfolio manager's net gain and the fees earned by EIMC and expenses incurred by this fund on the portfolio manager's account. Evergreen currently intends to make a written Wells submission explaining why it believes that no such enforcement action should be instituted, and Evergreen is engaging in discussions with the staff of the SEC concerning its recommendation.
Any resolution of these matters with regulatory authorities may include, but not be limited to, sanctions, penalties or injunctions regarding Evergreen, restitution to mutual fund shareholders and/or other financial penalties and structural changes in the governance or management of Evergreen's mutual fund business. Any penalties or restitution will be paid by Evergreen and not by the Evergreen funds.
Evergreen does not believe the foregoing investigations and action will have a material adverse impact on the Evergreen funds. There can be no assurance, however, that these matters and any publicity surrounding or resulting from them will not result in reduced sales or increased redemptions of fund shares, which could increase fund transaction costs or operating expenses, or have other adverse consequences on the Evergreen funds.
34
This page left intentionally blank
35
TRUSTEES AND OFFICERS
| | |
| TRUSTEES 1 | | |
| Charles A. Austin III | | Principal occupations: Investment Counselor, Anchor Capital Advisors, Inc. (investment advice); |
| Trustee | | Director, The Andover Companies (insurance); Trustee, Arthritis Foundation of New England; |
| DOB: 10/23/1934 | | Director, The Francis Ouimet Society; Former Director, Health Development Corp. (fitness- |
| Term of office since: 1991 | | wellness centers); Former Director, Mentor Income Fund, Inc.; Former Trustee, Mentor Funds and |
| | | Cash Resource Trust; Former Investment Counselor, Appleton Partners, Inc. (investment advice); |
| Other directorships: None | | Former Director, Executive Vice President and Treasurer, State Street Research & Management |
| | | Company (investment advice) |
|
| |
| Shirley L. Fulton | | Principal occupations: Partner, Helms, Henderson & Fulton, P.A. (law firm); Retired Senior |
| Trustee | | Resident Superior Court Judge, 26th Judicial District, Charlotte, NC |
| DOB: 1/10/1952 | | |
| Term of office since: 2004 | | |
| Other directorships: None | | |
|
| |
| K. Dun Gifford | | Principal occupations: Chairman and President, Oldways Preservation and Exchange Trust |
| Trustee | | (education); Trustee, Treasurer and Chairman of the Finance Committee, Cambridge College; |
| DOB: 10/23/1938 | | Former Chairman of the Board, Director, and Executive Vice President, The London Harness |
| Term of office since: 1974 | | Company (leather goods purveyor); Former Director, Mentor Income Fund, Inc.; Former Trustee, |
| | | Mentor Funds and Cash Resource Trust |
| Other directorships: None | | |
|
| |
| Dr. Leroy Keith, Jr. | | Principal occupations: Partner, Stonington Partners, Inc. (private investment firm); Trustee of |
| Trustee | | Phoenix Series Fund, Phoenix Multi-Portfolio Fund, and The Phoenix Big Edge Series Fund; |
| DOB: 2/14/1939 | | Former Chairman of the Board and Chief Executive Officer, Carson Products Company |
| Term of office since: 1983 | | (manufacturing); Director, Obagi Medical Products Co.; Director, Lincoln Educational Services; |
| | | Director, Diversapack Co.; Former President, Morehouse College; Former Director, Mentor |
| Other directorships: Trustee, | | Income Fund, Inc.; Former Trustee, Mentor Funds and Cash Resource Trust |
| Phoenix Series Fund, Phoenix | | |
| Multi-Portfolio Fund, and The | | |
| Phoenix Big Edge Series Fund | | |
|
| |
| Gerald M. McDonnell | | Principal occupations: Manager of Commercial Operations, SMI STEEL Co. – South Carolina |
| Trustee | | (steel producer); Former Sales and Marketing Management, Nucor Steel Company; Former |
| DOB: 7/14/1939 | | Director, Mentor Income Fund, Inc.; Former Trustee, Mentor Funds and Cash Resource Trust |
| Term of office since: 1988 | | |
| Other directorships: None | | |
|
| |
| William Walt Pettit | | Principal occupations: Partner and Vice President, Kellam & Pettit, P.A. (law firm); Former |
| Trustee | | Director, Mentor Income Fund, Inc.; Former Trustee, Mentor Funds and Cash Resource Trust |
| DOB: 8/26/1955 | | |
| Term of office since: 1984 | | |
| Other directorships: None | | |
|
| |
| David M. Richardson | | Principal occupations: President, Richardson, Runden LLC (executive recruitment business |
| Trustee | | development/consulting company); Consultant, Kennedy Information, Inc. (executive |
| DOB: 9/19/1941 | | recruitment information and research company); Consultant, AESC (The Association of Retained |
| Term of office since: 1982 | | Executive Search Consultants); Trustee, NDI Technologies, LLP (communications); Director, J&M |
| | | Cumming Paper Co. (paper merchandising); Former Vice Chairman, DHR International, Inc. |
| Other directorships: None | | (executive recruitment); Former Director, Mentor Income Fund, Inc.; Former Trustee, Mentor |
| | | Funds and Cash Resource Trust |
|
| |
| Dr. Russell A. Salton III | | Principal occupations: President/CEO, AccessOne MedCard; Former Medical Director, Healthcare |
| Trustee | | Resource Associates, Inc.; Former Medical Director, U.S. Health Care/Aetna Health Services; |
| DOB: 6/2/1947 | | Former Director, Mentor Income Fund, Inc.; Former Trustee, Mentor Funds and Cash Resource |
| Term of office since: 1984 | | Trust |
| Other directorships: None | | |
|
36
TRUSTEES AND OFFICERS continued
| | |
| Michael S. Scofield | | Principal occupations: Attorney, Law Offices of Michael S. Scofield; Former Director, Mentor |
| Trustee | | Income Fund, Inc.; Former Trustee, Mentor Funds and Cash Resource Trust |
| DOB: 2/20/1943 | | |
| Term of office since: 1984 | | |
| Other directorships: None | | |
|
| |
| Richard J. Shima | | Principal occupations: Independent Consultant; Director, Trust Company of CT; Trustee, Saint |
| Trustee | | Joseph College (CT); Director, Hartford Hospital; Trustee, Greater Hartford YMCA; Former |
| DOB: 8/11/1939 | | Director, Enhance Financial Services, Inc.; Former Director, Old State House Association; Former |
| Term of office since: 1993 | | Director of CTG Resources, Inc. (natural gas); Former Director, Mentor Income Fund, Inc.; Former |
| | | Trustee, Mentor Funds and Cash Resource Trust |
| Other directorships: None | | |
|
| |
| Richard K. Wagoner, CFA 2 | | Principal occupations: Member and Former President, North Carolina Securities Traders |
| Trustee | | Association; Member, Financial Analysts Society; Former Consultant to the Boards of Trustees of |
| DOB: 12/12/1937 | | the Evergreen funds; Former Trustee, Mentor Funds and Cash Resource Trust |
| Term of office since: 1999 | | |
| Other directorships: None | | |
|
| |
| |
| OFFICERS | | |
| |
| Dennis H. Ferro 3 | | Principal occupations: President and Chief Executive Officer, Evergreen Investment Company, |
| President | | Inc. and Executive Vice President, Wachovia Bank, N.A.; former Chief Investment Officer, |
| DOB: 6/20/1945 | | Evergreen Investment Company, Inc. |
| Term of office since: 2003 | | |
|
| |
| Carol Kosel 4 | | Principal occupations: Senior Vice President, Evergreen Investment Services, Inc. |
| Treasurer | | |
| DOB: 12/25/1963 | | |
| Term of office since: 1999 | | |
|
| |
| Michael H. Koonce 4 | | Principal occupations: Senior Vice President and General Counsel, Evergreen Investment |
| Secretary | | Services, Inc.; Senior Vice President and Assistant General Counsel, Wachovia Corporation |
| DOB: 4/20/1960 | | |
| Term of office since: 2000 | | |
|
| |
| James Angelos 4 | | Principal occupations: Chief Compliance Officer and Senior Vice President, Evergreen Funds; |
| Chief Compliance Officer | | Former Director of Compliance, Evergreen Investment Services, Inc. |
| DOB: 9/2/1947 | | |
| Term of office since: 2004 | | |
|
|
| 1 Each Trustee serves until a successor is duly elected or qualified or until his death, resignation, retirement or removal from office. Each |
| Trustee oversees 93 Evergreen funds. Correspondence for each Trustee may be sent to Evergreen Board of Trustees, P.O. Box 20083, |
| Charlotte, North Carolina 28202. |
| 2 Mr. Wagoner is an "interested person" of the Fund because of his ownership of shares in Wachovia Corporation, the parent to the |
| Fund's investment advisor. |
| 3 The address of the Officer is 401 S. Tryon Street, 20th Floor, Charlotte, NC 28288. |
| 4 The address of the Officer is 200 Berkeley Street, Boston, MA 02116. |
| |
| Additional information about the Fund's Board of Trustees and Officers can be found in the Statement of Additional Information (SAI) and |
| is available upon request without charge by calling 800.343.2898. |
37

564358 rv2 12/2004
Evergreen Institutional Mortgage Portfolio

| | |
| table of contents |
| 1 | | L E T T E R T O S H A R E H O L D E R S |
| 4 | | F U N D AT A G L A N C E |
| 6 | | A B O U T Y O U R F U N D ' S E X P E N S E S |
| 7 | | F I N A N C I A L H I G H L I G H T S |
| 8 | | S C H E D U L E O F I N V E S T M E N T S |
| 12 | | S TAT E M E N T O F A S S E T S A N D L I A B I L I T I E S |
| 13 | | S TAT E M E N T O F O P E R AT I O N S |
| 14 | | S TAT E M E N T S O F C H A N G E S I N N E T A S S E T S |
| 15 | | N O T E S T O F I N A N C I A L S TAT E M E N T S |
| 20 | | T R U S T E E S A N D O F F I C E R S |
This semiannual report must be preceded or accompanied by a prospectus of the Evergreen fund contained herein. The prospectus contains more complete information, including fees and expenses, and should be read carefully before investing or sending money.
The fund will file its complete schedule of portfolio holdings with the SEC for the first and third quarters of each fiscal year on Form N-Q. The fund's Form N-Q will be available on the SEC's Web site at http://www.sec.gov. In addition, the fund's Form N-Q may be reviewed and copied at the SEC's Public Reference Room in Washington, D.C. Information on the operation of the Public Reference Room may be obtained by calling 800.SEC.0330.
A description of the fund's proxy voting policies and procedures is available without charge, upon request, by calling 800.343.2898, by visiting our Web site at EvergreenInvestments.com or by visiting the SEC's Web site at http://www.sec.gov.
Information relating to how the fund voted proxies relating to portfolio securities during the most recent 12-month period ended June 30 is available by visiting our Web site at EvergreenInvestments.com or by visiting the SEC's Web site at http://www.sec.gov.
| | | | |
| Mutual Funds: | | | | |
| NOT FDIC INSURED | | MAY LOSE VALUE | | NOT BANK GUARANTEED |
Evergreen InvestmentsSM is a service mark of Evergreen Investment Management Company, LLC. Copyright 2004.
Evergreen mutual funds are distributed by Evergreen Investment Services, Inc. 200 Berkeley Street, Boston, MA 02116
LETTER TO SHAREHOLDERS
December 2004
Dear Shareholder,
We are pleased to provide the semiannual report for the Evergreen Institutional Mortgage Portfolio, which covers the six-month period ended October 31, 2004.
The past twelve months have witnessed dramatic changes within the financial markets. New tax laws spurred increased risk appetites for businesses and consumers. Gross Domestic Product ("GDP") and corporate profits exceeded expectations, only to be followed by more moderate levels of growth. The Federal Reserve sounded the drums, and then eventually began to remove excess stimulus. International economies regained their footing, enabling many foreign bourses to strengthen. The weaker U.S. dollar presented opportunities, and challenges, for a variety of investors. Global commodity prices alternately surged, moderated, and then renewed their climb. A rancorous political season and the uncertain geopolitical environment accompanied these developments. Throughout this tumultuous period, our portfolio management teams endeavored to provide our diversified investors with sound fundamental

| | Dennis H. Ferro
President and Chief
Executive Officer
|
analysis and investment decision-making.
The investment period began on the heels of a dramatic turnaround in the equity markets. Clarity on the war in Iraq and the changes in the tax laws had previously moved the markets, and this upward momentum was likely susceptible to disappointment. In addition, after openly discussing their fears of deflation, the Federal Reserve Board was discussing the possibility of 4% GDP growth in 2004. The bond market had responded with a violent, 150 basis point swing in the yield of the 10-year Treasury during the summer of 2003, and interest rate volatility had begun to settle down at the onset of the investment period.
1
LETTER TO SHAREHOLDERS continued
At this juncture, our Investment Strategy Committee had to make two important determinations. First, were the fundamentals supportive of continued growth in equities? And second, would the Federal Reserve be able to deliver on its goal of a "measured" removal of policy accommodation? After careful thought and spirited debate, we decided that the fundamentals were capable of supporting more moderate levels of growth in the equity markets and that this moderation in growth would provide the Federal Reserve with the cover to gradually nudge up interest rates without crippling the expansion.
We believed this period of more moderate growth would be unlike that of the previous year, when the rising tide lifted many boats. In this range-bound market, specific stock selection and sector emphasis would likely rule the day, as active management would play a critical role in the expected period of rising rates. For example, the Utilities and Telecom sectors, despite the more aggressive Federal Reserve, managed to deliver solid returns given the reduction in dividend tax rates. Other sectors faced challenges, such as the political uncertainty and the potential impact to the Healthcare stocks. Double-digit profit gains were also not enough to support Technology, which struggled with valuation concerns after the previous year's gains. Given these developments, diversification strategies were critical for successful portfolio performance. Indeed, those investors exposed to other asset classes, such as municipal securities and commodities, managed to generate positive momentum for their overall portfolios through the time-tested practice of proper asset allocation.
International diversification would also prove important in this environment. With many international growth rates in GDP and profits at a premium to those in the U.S., along with P/E discounts to many domestic companies, the fundamentals supported growth for international equities. Higher interest rates abroad also enabled international bonds to generate solid returns, and the weaker dollar served
2
LETTER TO SHAREHOLDERS continued
to enhance the total return potential for foreign investments after adjusting for currency translation.
As always, we encourage our investors to maintain their long-term diversification strategies within their overall investment portfolios.
Please visit our Web site, EvergreenInvestments.com, for more information about our funds and other investment products available to you. From the Web site, you may also access a detailed Q & A interview with the portfolio manager(s) for your fund. You can easily reach these interviews by following the link, EvergreenInvestments.com/AnnualUpdates, from our Web site. Thank you for your continued support of Evergreen Investments.
Sincerely,

Dennis H. Ferro
President and Chief Executive Officer
Evergreen Investment Company, Inc.
|
Special Notice to Shareholders:
Please visit our Web site at EvergreenInvestments.com for statements from President and Chief Executive Officer, Dennis Ferro, and Chairman of the Board of the Evergreen Funds, Michael S. Scofield, addressing recent SEC actions involving the Evergreen Funds.
3
FUND AT A GLANCE
as of October 31, 2004
M A N A G E M E N T T E A M
Tattersall Advisory Group, Inc.
C U R R E N T I N V E S T M E N T S T Y L E

Source: Morningstar, Inc.
Morningstar's style box is based on a portfolio date as of 9/30/2004.
The fixed income style box placement is based on a fund's average effective maturity or duration and the average credit rating of the bond portfolio.
P E R F O R M A N C E A N D R E T U R N S
Portfolio inception date: 6/19/2002
| | |
| | | Class I |
| Class inception date | | 6/19/2002 |
|
| Nasdaq symbol | | EMSFX |
|
| 6-month return | | 3.66% |
|
| Average annual return | | |
|
| 1 year | | 5.17% |
|
| Since portfolio inception | | 4.96% |
|
Past performance is no guarantee of future results. The performance quoted represents past performance and current performance may be lower or higher. The investment return and principal value of an investment will fluctuate so that investors' shares, when redeemed, may be worth more or less than their original cost. To obtain performance information current to the most recent month-end, please go to EvergreenInvestments.com/fundperformance. Performance includes the reinvestment of income dividends and capital gain distributions. Performance shown does not reflect the deduction of taxes that a shareholder would pay on fund distributions or the redemption of fund shares.
The advisor is reimbursing the fund for a portion of other expenses. Had expenses not been reimbursed, returns would have been lower.
4
FUND AT A GLANCE continued
L O N G - T E R M G R O W T H
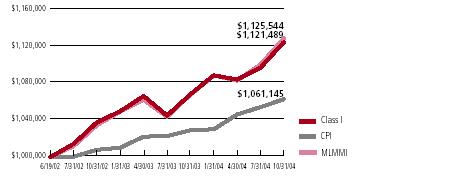
Comparison of a $1,000,000 investment in the Evergreen Institutional Mortgage Portfolio Class I shares, versus a similar investment in the Merrill Lynch Mortgage Master Index1 (MLMMI) and the Consumer Price Index (CPI).
The MLMMI is an unmanaged market index and does not include transaction costs associated with buying and selling securities, any mutual fund expenses or any taxes. The CPI is a commonly used measure of inflation and does not represent an investment return. It is not possible to invest directly in an index.
1 Copyright 2004. Merrill Lynch, Pierce, Fenner & Smith Incorporated. All rights reserved.
Class I shares are only offered to investment advisory clients of an investment advisor of an Evergreen fund (or its advisory affiliates) and through special arrangements entered into on behalf of Evergreen funds with certain financial services firms. Class I shares have a minimum initial investment of $1 million, which may be waived in certain situations.
The fund's investment objective is nonfundamental and may be changed without the vote of the fund's shareholders.
U.S. government guarantees apply only to certain securities held in the fund's portfolio and not to the fund's shares.
The return of principal is not guaranteed due to fluctuation in the NAV of the fund caused by changes in the price of the individual bonds held by the fund and the buying and selling of bonds by the fund. Bond funds have the same inflation, interest rate and credit risks that are associated with the individual bonds held by the fund.
All data is as of October 31, 2004, and subject to change.
5
ABOUT YOUR FUND'S EXPENSES
The Example below is intended to describe the fees and expenses borne by shareholders and the impact of those costs on your investment.
Example
As a shareholder of the fund, you incur two types of costs: (1) transaction costs, including sales charges (loads), redemption fees and exchange fees; and (2) ongoing costs, including management fees, distribution (12b-1) fees and other fund expenses. This Example is intended to help you understand your ongoing costs (in dollars) of investing in the fund and to compare these costs with the ongoing costs of investing in other mutual funds. The Example is based on an investment of $1,000 invested at the beginning of the period and held for the entire period from May 1, 2004 to October 31, 2004.
The example illustrates your fund's costs in two ways:
• Actual expenses
The section in the table under the heading "Actual" provides information about actual account values and actual expenses. You may use the information in these columns, together with the amount you invested, to estimate the expenses that you paid over the period. Simply divide your account value by $1,000 (for example, an $8,600 account value divided by $1,000 = 8.6), then multiply the result by the number in the appropriate column for your share class, in the column entitled "Expenses Paid During Period" to estimate the expenses you paid on your account during this period.
• Hypothetical example for comparison purposes
The section in the table under the heading "Hypothetical (5% return before expenses)" provides information about hypothetical account values and hypothetical expenses based on the fund's actual expense ratio and an assumed rate of return of 5% per year before expenses, which is not the fund's actual return. The hypothetical account values and expenses may not be used to estimate the actual ending account balance or expenses you paid for the period. You may use this information to compare the ongoing costs of investing in the fund and other funds. To do so, compare this 5% hypothetical example with the 5% hypothetical examples that appear in the shareholder reports of the other funds.
Please note that the expenses shown in the table are meant to highlight your ongoing costs only and do not reflect any transactional costs, such as sales charges (loads), redemption fees or exchange fees. Therefore, the section in the table under the heading "Hypothetical (5% return before expenses)" is useful in comparing ongoing costs only, and will not help you determine the relative total costs of owning different funds. In addition, if these transactional costs were included, your costs would have been higher.
| | | | | | |
| | | Beginning | | Ending | | |
| | | Account | | Account | | Expenses |
| | | Value | | Value | | Paid During |
| | | 5/1/2004 | | 10/31/2004 | | Period* |
|
| Actual | | | | | | |
| Class I | | $ 1,000.00 | | $ 1,036.63 | | $ 1.03 |
| Hypothetical | | | | | | |
| (5% return | | | | | | |
| before expenses) | | | | | | |
| Class I | | $ 1,000.00 | | $ 1,024.20 | | $ 1.02 |
|
| * | Expenses are equal to the Fund's annualized expense ratio (0.20% for Class I), multiplied by the average account value over the period, multiplied by 184 / 365 days. |
| |
6
FINANCIAL HIGHLIGHTS
(For a share outstanding throughout each period)
| | | | | | |
| | | Six Months Ended | | Year EndedApril 30, |
| | October 31, 2004 | |
|
| CLASS I | | (unaudited) | | 2004 | | 2003 1 |
|
| Net asset value, beginning of period | | $ 9.89 | | $ 10.18 | | $ 10.00 |
|
| Income from investment operations | | | | | | |
| Net investment income | | 0.16 | | 0.35 | | 0.40 |
| Net realized and unrealized gains or losses on securities | | 0.20 | | (0.18 ) | | 0.23 |
| |
| |
| |
|
| Total from investment operations | | 0.36 | | 0.17 | | 0.63 |
|
| Distributions to shareholders from | | | | | | |
| Net investment income | | (0.23 ) | | (0.45 ) | | (0.40 ) |
| Net realized gains | | 0 | | (0.01) | | (0.05) |
| |
| |
| |
|
| Total distributions to shareholders | | (0.23) | | (0.46) | | (0.45) |
|
| Net asset value, end of period | | $ 10.02 | | $ 9.89 | | $ 10.18 |
|
| Total return | | 3.66% | | 1.63% | | 6.45% |
|
| Ratios and supplemental data | | | | | | |
| Net assets, end of period (thousands) | | $44,865 | | $48,032 | | $28,423 |
| Ratios to average net assets | | | | | | |
| Expenses 2 | | 0.20% 3 | | 0.20% | | 0.12% 3 |
| Net investment income | | 3.20 % 3 | | 3.33 % | | 4.74 % 3 |
| Portfolio turnover rate | | 179% | | 327% | | 148% |
|
|
| 1 For the period from June 19, 2002 (commencement of operations), to April 30, 2003. |
| 2 The ratio of expenses to average net assets excludes expense reductions but includes fee waivers and/or expense reimbursements. |
| 3 Annualized |
See Notes to Financial Statements
7
SCHEDULE OF INVESTMENTS
October 31, 2004 (unaudited)
| | | | | | |
| | | Principal | | | | |
| | | Amount | | | | Value |
|
| AGENCY MORTGAGE-BACKED COLLATERALIZED MORTGAGE | | | | | | |
| OBLIGATIONS 13.4% | | | | | | |
| Fixed Rate 13.4% | | | | | | |
| FHLMC: | | | | | | |
| Ser. 2264, Class PL, 7.00%, 10/15/2030 | | $ 790,168 | | $ | | 813,460 |
| Ser. 2748, Class LE, 4.50%, 12/15/2017 | | 710,000 | | | | 709,255 |
| Ser. 2780, Class BD, 4.50%, 10/15/2017 | | 335,000 | | | | 341,393 |
| Ser. 2827, Class TC, 5.00%, 10/15/2017 | | 510,000 | | | | 524,611 |
| Ser. 2840, Class OD, 5.00%, 07/15/2029 | | 985,000 | | | | 1,002,801 |
| FNMA: | | | | | | |
| Ser. 2001-71, Class QE, 6.00%, 12/25/2016 | | 460,000 | | | | 484,256 |
| Ser. 2002-2, Class MG, 6.00%, 02/25/2017 | | 600,000 | | | | 627,890 |
| Ser. 2003-92, Class PD, 4.50%, 03/25/2017 | | 480,000 | | | | 484,257 |
| Ser. 2004-26, Class PA, 4.50%, 09/25/2025 | | 550,000 | | | | 564,718 |
| Ser. 2004-33, Class MW, 4.50%, 01/25/2030 | | 475,000 | | | | 467,235 |
| | | | | |
|
| Total Agency Mortgage-Backed Collateralized Mortgage Obligations | | | | | | |
| (cost $5,967,863) | | | | | | 6,019,876 |
| | | | | |
|
| AGENCY MORTGAGE-BACKED PASS-THROUGH SECURITIES 42.4% | | | | | | |
| Fixed Rate 42.4% | | | | | | |
| FHLMC: | | | | | | |
| 4.50%, TBA # | | 2,325,000 | | | | 2,256,703 |
| 5.00%, TBA # | | 1,410,000 | | | | 1,402,510 |
| 6.00%, 04/01/2014 | | 247,068 | | | | 259,850 |
| 6.90%, 12/01/2010(h) | | 545,000 | | | | 623,099 |
| 6.98%, 10/01/2010(h) | | 450,550 | | | | 512,230 |
| 7.20%, 10/01/2006(h) | | 644,846 | | | | 682,440 |
| FNMA: | | | | | | |
| 4.50%, TBA # | | 1,160,000 | | | | 1,163,262 |
| 4.83%, 03/01/2013 | | 686,300 | | | | 709,045 |
| 5.00%, TBA # | | 815,000 | | | | 812,198 |
| 5.12%, 04/01/2007 | | 339,531 | | | | 342,447 |
| 5.50%, 04/01/2034 | | 881,841 | | | | 899,391 |
| 5.63%, 11/01/2005 | | 668,042 | | | | 676,574 |
| 5.65%, 02/01/2009 | | 242,126 | | | | 251,196 |
| 6.00%, 02/01/2014 | | 1,516,804 | | | | 1,593,351 |
| 6.01%, 02/01/2012 | | 330,836 | | | | 364,405 |
| 6.09%, 05/01/2011 | | 240,211 | | | | 264,214 |
| 6.50%, 07/01/2032 | | 1,515,870 | | | | 1,597,053 |
| 6.65%, 12/01/2007 | | 229,549 | | | | 246,833 |
| 7.00%, 05/01/2032 | | 107,247 | | | | 113,967 |
| 7.02%, 07/01/2009 | | 95,084 | | | | 105,515 |
| 7.09%, 07/01/2009 | | 283,344 | | | | 317,769 |
| 7.14%, 07/01/2009 | | 285,646 | | | | 318,290 |
| 7.19%, 05/01/2007 | | 420,086 | | | | 448,724 |
| 7.32%, 12/01/2010 | | 477,314 | | | | 549,670 |
| 7.37%, 08/01/2006 | | 365,585 | | | | 384,873 |
| 7.44%, 07/01/2009 | | 300,000 | | | | 328,256 |
| 7.50%, 11/01/2029 | | 50,870 | | | | 54,607 |
See Notes to Financial Statements
8
SCHEDULE OF INVESTMENTS continued
October 31, 2004 (unaudited)
| | | | | | |
| | | Principal | | | | |
| | | Amount | | | | Value |
|
| AGENCY MORTGAGE-BACKED PASS-THROUGH SECURITIES continued | | | | | | |
| Fixed Rate continued | | | | | | |
| GNMA: | | | | | | |
| 4.00%, 07/20/2030 | | $ 456,767 | | $ | | 463,945 |
| 5.50%, 11/15/2033 | | 1,254,507 | | | | 1,286,121 |
| | | | | |
|
| Total Agency Mortgage-Backed Pass-Through Securities | | | | | | |
| (cost $19,105,131) | | | | | | 19,028,538 |
| | | | | |
|
| AGENCY REPERFORMING MORTGAGE-BACKED COLLATERALIZED | | | | | | |
| MORTGAGE OBLIGATIONS 4.7% | | | | | | |
| FNMA: | | | | | | |
| Ser. 2003-W14, Class 1A6, 5.82%, 09/25/2043 | | 345,000 | | | | 356,975 |
| Ser. 2003-W19, Class 1A5, 5.50%, 11/25/2033 | | 1,705,000 | | | | 1,761,976 |
| | | | | |
|
| Total Agency Reperforming Mortgage-Backed Collateralized Mortgage | | | | | | |
| Obligations (cost $2,134,254) | | | | | | 2,118,951 |
| | | | | |
|
| AGENCY REPERFORMING MORTGAGE-BACKED PASS-THROUGH | | | | | | |
| SECURITIES 15.1% | | | | | | |
| FHLMC, Ser. T-55, Class 1A2, 7.00%, 03/25/2043 | | 621,142 | | | | 659,691 |
| FNMA: | | | | | | |
| Ser. 2001-T10, Class A1, 7.00%, 12/25/2041 | | 178,788 | | | | 190,570 |
| Ser. 2002-26, Class A1, 7.00%, 01/25/2048 | | 930,115 | | | | 994,061 |
| Ser. 2002-T19, Class A1, 6.50%, 07/25/2042 | | 2,463,301 | | | | 2,597,243 |
| Ser. 2003-W2, Class 1A2, 7.00%, 07/25/2042 | | 283,886 | | | | 303,404 |
| Ser. 2003-W6, Class 3A, 6.50%, 09/25/2042 | | 401,034 | | | | 422,840 |
| Ser. 2004-W1, Class 2A2, 7.00%, 12/25/2033 | | 694,169 | | | | 731,802 |
| Ser. 2004-W2, Class 2A2, 7.00%, 02/25/2044 | | 407,084 | | | | 435,651 |
| Ser. 2004-W9, Class 2A1, 6.50%, 02/25/2044 | | 404,507 | | | | 426,502 |
| | | | | |
|
| Total Agency Reperforming Mortgage-Backed Pass-Through Securities | | | | | | |
| (cost $6,794,229) | | | | | | 6,761,764 |
| | | | | |
|
| ASSET-BACKED SECURITIES 0.8% | | | | | | |
| Bank One Issuance Trust, Ser. 2003-A1, Class A1, FRN, 1.99%, 09/15/2010 | | 175,000 | | | | 175,539 |
| Vanderbilt Mtge. & Fin., Inc., Ser. 2002-B, Class A3, 4.70%, 10/07/2018 | | 170,000 | | | | 172,163 |
| | | | | |
|
| Total Asset-Backed Securities (cost $344,336) | | | | | | 347,702 |
| | | | | |
|
| COMMERCIAL MORTGAGE-BACKED SECURITIES 8.6% | | | | | | |
| Fixed Rate 8.6% | | | | | | |
| Asset Securitization Corp., Ser. 1997-D4, Class A-1D, 7.49%, 04/14/2029 | | 425,180 | | | | 461,671 |
| Commercial Mtge. Pass-Through Cert., Ser. 2004-LB3A, Class A5, 5.44%, | | | | | | |
| 07/10/2037 | | 360,000 | | | | 380,076 |
| JPMorgan Chase Comml. Mtge. Securities Corp., Ser. 2004-PNC1, Class A4, | | | | | | |
| 5.38%, 06/12/2041 | | 345,000 | | | | 364,946 |
| LB-UBS Comml. Mtge. Trust, Ser. 2000-C4, Class A1, 7.18%, 09/15/2019 | | 360,723 | | | | 393,799 |
| Lehman Brothers Comml. Conduit Mtge. Trust, Ser. 1999-C1, Class A1, 6.41%, | | | | | | |
| 06/15/2031 | | 490,724 | | | | 512,821 |
See Notes to Financial Statements
9
SCHEDULE OF INVESTMENTS continued
October 31, 2004 (unaudited)
| | | | | | |
| | | Principal | | | | |
| | | Amount | | | | Value |
|
| COMMERCIAL MORTGAGE-BACKED SECURITIES continued | | | | | | |
| Fixed Rate continued | | | | | | |
| Morgan Stanley Dean Witter Capital I: | | | | | | |
| Ser. 1997-XL1, Class A1, 6.59%, 10/03/2030 | | $ 61,720 | | $ | | 61,761 |
| Ser. 1998-XL1, Class A2, 6.45%, 06/03/2030 | | 625,000 | | | | 637,451 |
| Ser. 2003-T11, Class A4, 5.15%, 06/13/2041 | | 670,000 | | | | 698,495 |
| Wachovia Bank Comml. Mtge. Trust, Ser. 2003-C8, Class A1, 3.44%, 11/15/2035 | | 334,663 | | | | 333,181 |
| | | | | |
|
| Total Commercial Mortgage-Backed Securities (cost $3,884,540) | | | | | | 3,844,201 |
| | | | | |
|
| U.S. TREASURY OBLIGATIONS 1.1% | | | | | | |
| U.S. Treasury Notes: | | | | | | |
| 2.75%, 07/31/2006 | | 205,000 | | | | 206,017 |
| 5.00%, 08/15/2011 | | 270,000 | | | | 291,674 |
| | | | | |
|
| Total U.S. Treasury Obligations (cost $497,288) | | | | | | 497,691 |
| | | | | |
|
| WHOLE LOAN MORTGAGE-BACKED COLLATERALIZED MORTGAGE | | | | | | |
| OBLIGATIONS 11.4% | | | | | | |
| Fixed Rate 11.4% | | | | | | |
| MASTR Adjustable Rate Mtge. Trust, Ser. 2004-13, Class 2A1, 3.82%, | | | | | | |
| 07/25/2034 (h) # | | 1,000,000 | | | | 994,700 |
| MASTR Alternative Loans Trust, Ser. 2004-6, Class 3A1, 4.75%, 07/25/2019 | | 372,711 | | | | 380,855 |
| Morgan Stanley Mtge. Loan Trust, Ser. 2004-8AR, Class 4A1, 5.47%, | | | | | | |
| 10/25/2034 | | 456,146 | | | | 467,665 |
| Structured Adjustable Rate Mtge. Loan Trust, Ser. 2004-8, Class 5A3, 4.74%, | | | | | | |
| 07/25/2034 | | 460,000 | | | | 463,127 |
| Washington Mutual: | | | | | | |
| Ser. 2004-AR4, Class A6, 3.81%, 06/25/2034 | | 915,000 | | | | 906,784 |
| Ser. 2004-AR7, Class A6, 3.96%, 07/25/2034 | | 1,460,000 | | | | 1,462,187 |
| Wells Fargo Mtge. Backed Securities Trust, Ser. 2004-S, Class A7, 3.54%, | | | | | | |
| 09/25/2034 | | 440,000 | | | | 429,177 |
| | | | | |
|
| Total Whole Loan Mortgage-Backed Collateralized Mortgage Obligations | | | | | | |
| (cost $5,004,534) | | | | | | 5,104,495 |
| | | | | |
|
| WHOLE LOAN MORTGAGE-BACKED PASS-THROUGH SECURITIES 0.5% | | | | | | |
| Floating Rate 0.5% | | | | | | |
| Indymac Index Mtge. Loan Trust, Ser. 2004-AR7, Class A2, 2.36%, 09/25/2034 | | | | | | |
| (cost $222,598) | | 223,719 | | | | 224,693 |
|
| | | Shares | | | | Value |
|
| SHORT-TERM INVESTMENTS 18.4% | | | | | | |
| MUTUAL FUND SHARES 18.4% | | | | | | |
| Evergreen Institutional Money Market Fund ø ## (cost $8,253,873) | | 8,253,873 | | | | 8,253,873 |
| | | | | |
|
| Total Investments (cost $52,208,646) 116.4% | | | | | | 52,201,784 |
| Other Assets and Liabilities (16.4%) | | | | | | (7,336,812) |
| | | | | |
|
| Net Assets 100.0% | | | | $ | | 44,864,972 |
| | | | | |
|
See Notes to Financial Statements
10
SCHEDULE OF INVESTMENTS continued
October 31, 2004 (unaudited)
| | |
| (h) | | No market quotation available. Valued at fair value as determined in good faith under procedures established by the |
| | | Board of Trustees. |
| # | | When-issued or delayed delivery security |
| ø | | Evergreen Investment Management Company, LLC is the investment advisor to both the Fund and the money market |
| | | fund. |
| ## | | All or a portion of the security has been segregated for when-issued or delayed delivery securities. |
| |
| Summary of Abbreviations |
| FHLMC | Federal Home Loan Mortgage Corp. |
| FNMA | Federal National Mortgage Association |
| FRN | Floating Rate Note |
| GNMA | Government National Mortgage Association |
| MASTR | Mortgage Asset Securitization Transactions, Inc. |
| TBA | To Be Announced |
The following table shows the percent of total bonds by credit quality based on Moody's and Standard & Poor's ratings as of October 31, 2004:
The following table shows the percent of total bonds by maturity as of October 31, 2004:
| | |
| Less than 1 year | | 1.6% |
| 1 to 3 year(s) | | 42.9% |
| 3 to 5 years | | 27.3% |
| 5 to 10 years | | 28.2% |
| |
|
| | | 100.0% |
| |
|
See Notes to Financial Statements
11
STATEMENT OF ASSETS AND LIABILITIES
October 31, 2004 (unaudited)
| | | | |
| Assets | | | | |
| Investments in securities, at value (cost $43,954,773) | | $ | | 43,947,911 |
| Investment in affiliate, at value (cost $8,253,873) | | | | 8,253,873 |
| Receivable for securities sold | | | | 2,295,280 |
| Interest receivable | | | | 190,007 |
| Receivable from investment advisor | | | | 147 |
| Prepaid expenses and other assets | | | | 3,383 |
|
| Total assets | | | | 54,690,601 |
|
| Liabilities | | | | |
| Dividends payable | | | | 101,116 |
| Payable for securities purchased | | | | 9,701,815 |
| Due to related parties | | | | 542 |
| Accrued expenses and other liabilities | | | | 22,156 |
|
| Total liabilities | | | | 9,825,629 |
|
| Net assets | | $ | | 44,864,972 |
|
| Net assets represented by | | | | |
| Paid-in capital | | $ | | 45,455,876 |
| Overdistributed net investment income | | | | (280,161) |
| Accumulated net realized losses on securities | | | | (303,881) |
| Net unrealized losses on securities | | | | (6,862) |
|
| Total net assets | | $ | | 44,864,972 |
|
| Shares outstanding Class I | | | | 4,478,660 |
|
| Net asset value per share Class I | | $ | | 10.02 |
|
See Notes to Financial Statements
12
STATEMENT OF OPERATIONS
Six Months Ended October 31, 2004 (unaudited)
| | | | |
| Investment income | | | | |
| Interest | | $ | | 715,892 |
| Income from affiliate | | | | 53,062 |
|
| Total investment income | | | | 768,954 |
|
| Expenses | | | | |
| Administrative services fee | | | | 22,579 |
| Transfer agent fees | | | | 809 |
| Trustees' fees and expenses | | | | 318 |
| Printing and postage expenses | | | | 11,800 |
| Custodian and accounting fees | | | | 6,201 |
| Registration and filing fees | | | | 3,696 |
| Professional fees | | | | 8,426 |
| Other | | | | 1,458 |
|
| Total expenses | | | | 55,287 |
| Less: Expense reductions | | | | (136) |
| Expense reimbursements | | | | (9,962) |
|
| Net expenses | | | | 45,189 |
|
| Net investment income | | | | 723,765 |
|
| Net realized and unrealized gains or losses on securities | | | | |
| Net realized gains on securities | | | | 209,329 |
| Net change in unrealized gains or losses on securities | | | | 646,888 |
|
| Net realized and unrealized gains or losses on securities | | | | 856,217 |
|
| Net increase in net assets resulting from operations | | $ | | 1,579,982 |
|
See Notes to Financial Statements
13
STATEMENTS OF CHANGES IN NET ASSETS
| | | | | | | | |
| | | Six Months Ended | | | | |
| | | October 31, 2004 | | Year Ended |
| | | (unaudited) | | April 30, 2004 |
|
| Operations | | | | | | | | |
| Net investment income | | | | $ 723,765 | | | | $ 1,415,351 |
| Net realized gains on securities | | | | 209,329 | | | | 39,480 |
| Net change in unrealized gains or losses | | | | | | | | |
| on securities | | | | 646,888 | | | | (831,977) |
|
| Net increase in net assets resulting from | | | | | | | | |
| operations | | | | 1,579,982 | | | | 622,854 |
|
| Distributions to shareholders from | | | | | | | | |
| Net investment income | | | | (1,031,839) | | | | (1,955,655) |
| Net realized gains | | | | 0 | | | | (29,097) |
|
| Total distributions to shareholders | | | | (1,031,839) | | | | (1,984,752) |
|
| | | Shares | | | | Shares | | |
| Capital share transactions | | | | | | | | |
| Proceeds from shares sold | | 748,823 | | 7,415,506 | | 4,337,076 | | 43,802,985 |
| Net asset value of shares issued in | | | | | | | | |
| reinvestment of distributions | | 41,675 | | 413,690 | | 77,764 | | 778,751 |
| Payment for shares redeemed | | (1,170,386) | | (11,544,756) | | (2,349,536) | | (23,610,741) |
|
| Net increase (decrease) in net assets | | | | | | | | |
| resulting from capital share transactions | | | | (3,715,560) | | | | 20,970,995 |
|
| Total increase (decrease) in net assets | | | | (3,167,417) | | | | 19,609,097 |
| Net assets | | | | | | | | |
| Beginning of period | | | | 48,032,389 | | | | 28,423,292 |
|
| End of period | | | | $ 44,864,972 | | | | $ 48,032,389 |
|
| Undistributed (overdistributed) net | | | | | | | | |
| investment income | | | | $ (280,161) | | | | $ 27,913 |
|
See Notes to Financial Statements
14
NOTES TO FINANCIAL STATEMENTS (unaudited)
1 . O R G A N I Z AT I O N
Evergreen Institutional Mortgage Portfolio is a diversified series of Evergreen Fixed Income Trust (the "Trust"), a Delaware statutory trust organized on September 18, 1997. The Trust is an open-end management investment company registered under the Investment Company Act of 1940, as amended.
The Fund offers Institutional ("Class I") shares. Class I shares are sold without a front-end sales charge or contingent deferred sales charge.
2 . S I G N I F I C A N T A C C O U N T I N G P O L I C I E S
The following is a summary of significant accounting policies consistently followed by the Fund in the preparation of its financial statements. The policies are in conformity with generally accepted accounting principles in the United States of America, which require management to make estimates and assumptions that affect amounts reported herein. Actual results could differ from these estimates.
a. Valuation of investments
Portfolio debt securities acquired with more than 60 days to maturity are valued at prices obtained from an independent pricing service which takes into consideration such factors as similar security prices, yields, maturities, liquidity and ratings. Securities for which valuations are not readily available from an independent pricing service may be valued by brokers which use prices provided by market makers or estimates of market value obtained from yield data relating to investments or securities with similar characteristics.
Short-term securities with remaining maturities of 60 days or less at the time of purchase are valued at amortized cost, which approximates market value.
Investments in other mutual funds are valued at net asset value. Securities for which market quotations are not readily available or not reflective of current market value are valued at fair value as determined in good faith, according to procedures approved by the Board of Trustees.
b. When-issued and delayed delivery transactions
The Fund records when-issued or delayed delivery securities as of trade date and maintains security positions such that sufficient liquid assets will be available to make payment for the securities purchased. Securities purchased on a when-issued or delayed delivery basis are marked-to-market daily and begin earning interest on the settlement date. Losses may occur on these transactions due to changes in market conditions or the failure of counterparties to perform under the contract.
c. Dollar roll transactions
The Fund may enter into dollar roll transactions with respect to mortgage-backed securities. In a dollar roll transaction, the Fund sells mortgage-backed securities to financial institutions and simultaneously agrees to accept substantially similar (same type, coupon and maturity) securities at a later date at an agreed upon price. The Fund will use the proceeds generated from the trans-
15
NOTES TO FINANCIAL STATEMENTS (unaudited) continued
actions to invest in short-term investments, which may enhance the Fund's current yield and total return. The Fund accounts for dollar roll transactions as purchases and sales.
d. Security transactions and investment income
Security transactions are recorded on trade date. Realized gains and losses are computed using the specific cost of the security sold. Interest income is recorded on the accrual basis and includes accretion of discounts and amortization of premiums.
e. Federal taxes
The Fund intends to continue to qualify as a regulated investment company and distribute all of its taxable income, including any net capital gains (which have already been offset by available capital loss carryovers). Accordingly, no provision for federal taxes is required.
f. Distributions
Distributions to shareholders from net investment income are accrued daily and paid monthly. Distributions from net realized gains, if any, are recorded on the ex-dividend date. Such distributions are determined in conformity with income tax regulations, which may differ from generally accepted accounting principles.
3 . A D V I S O RY F E E A N D O T H E R T R A N S A C T I O N S W I T H A F F I L I AT E S
Evergreen Investment Management Company, LLC ("EIMC"), an indirect, wholly-owned subsidiary of Wachovia Corporation ("Wachovia"), is the investment advisor to the Fund. The Fund does not pay a fee for the investment advisory service.
Tattersall Advisory Group, Inc., an indirect, wholly-owned subsidiary of Wachovia, is the investment sub-advisor to the Fund and is paid by EIMC for its services to the Fund.
From time to time, EIMC may voluntarily or contractually reimburse expenses in order to limit operating expenses. For reimbursements made after January 1, 2003, EIMC may recoup any amounts reimbursed up to a period of three years following the end of the fiscal year in which the reimbursements were made. During the six months ended October 31, 2004, EIMC reimbursed expenses in the amount of $9,962 which represents 0.04% of the Fund's average daily net assets on an annualized basis. As of October 31, 2004 the Fund had $65,409 in expense reimbursements subject to recoupment.
Evergreen Investment Services, Inc. ("EIS"), an indirect, wholly-owned subsidiary of Wachovia, is the administrator to the Fund. As administrator, EIS provides the Fund with facilities, equipment and personnel and is paid an annual rate determined by applying percentage rates to the aggregate average daily net assets of the Evergreen funds (excluding money market funds), starting at 0.10% and declining to 0.05% as the aggregate average daily net assets of the Evergreen funds (excluding money market funds) increase.
Evergreen Service Company, LLC ("ESC"), an indirect, wholly-owned subsidiary of Wachovia, is the transfer and dividend disbursing agent for the Fund. ESC receives account fees that vary based on the type of account held by the shareholders in the Fund.
16
NOTES TO FINANCIAL STATEMENTS (unaudited) continued
4 . S E C U R I T I E S T R A N S A C T I O N S
Cost of purchases and proceeds from sales of investment securities (excluding short-term securities) were as follows for the six months ended October 31, 2004:
| | | | | | |
| Costof Purchases | | Proceedsfrom Sales |
|
| U.S. | | Non-U.S. | | U.S. | | Non-U.S. |
| Government | | Government | | Government | | Government |
|
| $72,493,421 | | $8,411,561 | | $75,395,527 | | $3,768,371 |
|
On October 31, 2004, the aggregate cost of securities for federal income tax purposes was $52,215,907. The gross unrealized appreciation and depreciation on securities based on tax cost was $331,407 and $345,530, respectively, with a net unrealized depreciation of $14,123.
As of April 30, 2004, the Fund had $512,937 in capital loss carryovers for federal income tax purposes which expire in 2012.
5 . I N T E R F U N D L E N D I N G
Pursuant to an Exemptive Order issued by the SEC, the Fund may participate in an interfund lending program with certain funds in the Evergreen fund family. This program allows the Fund to borrow from, or lend money to, other participating funds. During the six months ended October 31, 2004, the Fund did not participate in the interfund lending program.
6 . E X P E N S E R E D U C T I O N S
Through expense offset arrangements with ESC and the Fund's custodian, a portion of fund expenses has been reduced.
7 . D E F E R R E D T R U S T E E S ' F E E S
Each Trustee of the Fund may defer any or all compensation related to performance of their duties as Trustees. The Trustees' deferred balances are allocated to deferral accounts, which are included in the accrued expenses for the Fund. The investment performance of the deferral accounts are based on the investment performance of certain Evergreen funds. Any gains earned or losses incurred in the deferral accounts are reported in the Fund's Trustees' fees and expenses. At the election of the Trustees, the deferral account will be paid either in one lump sum or in quarterly installments for up to ten years.
8 . F I N A N C I N G A G R E E M E N T
The Fund and certain other Evergreen funds share in a $150 million unsecured revolving credit commitment for temporary and emergency purposes, including the funding of redemptions, as permitted by each participating fund's borrowing restrictions. Borrowings under this facility bear interest at 0.50% per annum above the Federal Funds rate. All of the participating funds are charged an annual commitment fee of 0.09% of the unused balance, which is allocated pro rata. During the six months ended October 31, 2004, the Fund had no borrowings under this agreement.
17
NOTES TO FINANCIAL STATEMENTS (unaudited) continued
9 . L I T I G AT I O N
From time to time, the Fund and EIMC are involved in various legal actions in the normal course of business. In EIMC's opinion, based upon the opinions of counsel, the Fund is not involved in any legal action that will have a material effect on the Fund's financial position and results of operations.
1 0 . R E G U L AT O RY M AT T E R S
Since September 2003, governmental and self-regulatory authorities have instituted numerous ongoing investigations of various practices in the mutual fund industry, including investigations relating to revenue sharing, market-timing, late trading and record retention, among other things. The investigations cover investment advisors, distributors and transfer agents to mutual funds, as well as other firms. EIMC, EIS and ESC (collectively, "Evergreen") have received subpoenas and other requests for documents and testimony relating to these investigations, are endeavoring to comply with those requests, and are cooperating with the investigations. Evergreen is continuing its own internal review of policies, practices, procedures and personnel, and is taking remedial action where appropriate.
In connection with one of these investigations, on July 28, 2004, the staff of the Securities and Exchange Commission ("SEC") informed Evergreen that the staff intends to recommend to the SEC that it institute an enforcement action against Evergreen. The SEC staff's proposed allegations relate to (i) an arrangement pursuant to which a broker at one of EIMC's affiliated broker-dealers had been authorized, apparently by an EIMC officer (no longer with EIMC), to engage in short-term trading, on behalf of a client, in Evergreen Mid Cap Growth Fund (formerly Evergreen Small Company Growth Fund and prior to that, known as Evergreen Emerging Growth Fund) during the period from December 2000 through April 2003, in excess of the limitations set forth in this fund's prospectus, (ii) short-term trading from September 2001 through January 2003, by a former Evergreen portfolio manager of Evergreen Precious Metals Fund, a fund he managed at the time, (iii) the sufficiency of systems for monitoring exchanges and enforcing exchange limitations as stated in each fund's prospectuses, and (iv) the adequacy of e-mail retention practices. In connection with the activity in Evergreen Mid Cap Growth Fund, EIMC reimbursed this fund $378,905, plus an additional $25,242, representing what EIMC calculated at that time to be the client's net gain and the fees earned by EIMC and the expenses incurred by this fund on the client's account. In connection with the activity in Evergreen Precious Metals Fund, EIMC reimbursed this fund $70,878, plus an additional $3,075, representing what EIMC calculated at that time to be the portfolio manager's net gain and the fees earned by EIMC and expenses incurred by this fund on the portfolio manager's account. Evergreen currently intends to make a written Wells submission explaining why it believes that no such enforcement action should be instituted, and Evergreen is engaging in discussions with the staff of the SEC concerning its recommendation.
Any resolution of these matters with regulatory authorities may include, but not be limited to, sanctions, penalties or injunctions regarding Evergreen, restitution to mutual fund shareholders and/or other financial penalties and structural changes in the governance or management of
18
NOTES TO FINANCIAL STATEMENTS (unaudited) continued
Evergreen's mutual fund business. Any penalties or restitution will be paid by Evergreen and not by the Evergreen funds.
Evergreen does not believe the foregoing investigations and action will have a material adverse impact on the Evergreen funds. There can be no assurance, however, that these matters and any publicity surrounding or resulting from them will not result in reduced sales or increased redemptions of fund shares, which could increase fund transaction costs or operating expenses, or have other adverse consequences on the Evergreen funds.
19
TRUSTEES AND OFFICERS
TRUSTEES1
| | |
| Charles A. Austin III | | Principal occupations: Investment Counselor, Anchor Capital Advisors, Inc. (investment advice); |
| Trustee | | Director, The Andover Companies (insurance); Trustee, Arthritis Foundation of New England; |
| DOB: 10/23/1934 | | Director, The Francis Ouimet Society; Former Director, Health Development Corp. (fitness- |
| Term of office since: 1991 | | wellness centers); Former Director, Mentor Income Fund, Inc.; Former Trustee, Mentor Funds and |
| | | Cash Resource Trust; Former Investment Counselor, Appleton Partners, Inc. (investment advice); |
| Other directorships: None | | Former Director, Executive Vice President and Treasurer, State Street Research & Management |
| | | Company (investment advice) |
|
| |
| Shirley L. Fulton | | Principal occupations: Partner, Helms, Henderson & Fulton, P.A. (law firm); Retired Senior |
| Trustee | | Resident Superior Court Judge, 26th Judicial District, Charlotte, NC |
| DOB: 1/10/1952 | | |
| Term of office since: 2004 | | |
| Other directorships: None | | |
|
| |
| K. Dun Gifford | | Principal occupations: Chairman and President, Oldways Preservation and Exchange Trust |
| Trustee | | (education); Trustee, Treasurer and Chairman of the Finance Committee, Cambridge College; |
| DOB: 10/23/1938 | | Former Chairman of the Board, Director, and Executive Vice President, The London Harness |
| Term of office since: 1974 | | Company (leather goods purveyor); Former Director, Mentor Income Fund, Inc.; Former Trustee, |
| | | Mentor Funds and Cash Resource Trust |
| Other directorships: None | | |
|
| |
| Dr. Leroy Keith, Jr. | | Principal occupations: Partner, Stonington Partners, Inc. (private investment firm); Trustee of |
| Trustee | | Phoenix Series Fund, Phoenix Multi-Portfolio Fund, and The Phoenix Big Edge Series Fund; |
| DOB: 2/14/1939 | | Former Chairman of the Board and Chief Executive Officer, Carson Products Company |
| Term of office since: 1983 | | (manufacturing); Director, Obagi Medical Products Co.; Director, Lincoln Educational Services; |
| | | Director, Diversapack Co.; Former President, Morehouse College; Former Director, Mentor |
| Other directorships: Trustee, | | Income Fund, Inc.; Former Trustee, Mentor Funds and Cash Resource Trust |
| Phoenix Series Fund, Phoenix | | |
| Multi-Portfolio Fund, and The | | |
| Phoenix Big Edge Series Fund | | |
|
| |
| Gerald M. McDonnell | | Principal occupations: Manager of Commercial Operations, SMI STEEL Co. – South Carolina |
| Trustee | | (steel producer); Former Sales and Marketing Management, Nucor Steel Company; Former |
| DOB: 7/14/1939 | | Director, Mentor Income Fund, Inc.; Former Trustee, Mentor Funds and Cash Resource Trust |
| Term of office since: 1988 | | |
| Other directorships: None | | |
|
| |
| William Walt Pettit | | Principal occupations: Partner and Vice President, Kellam & Pettit, P.A. (law firm); Former |
| Trustee | | Director, Mentor Income Fund, Inc.; Former Trustee, Mentor Funds and Cash Resource Trust |
| DOB: 8/26/1955 | | |
| Term of office since: 1984 | | |
| Other directorships: None | | |
|
| |
| David M. Richardson | | Principal occupations: President, Richardson, Runden LLC (executive recruitment business |
| Trustee | | development/consulting company); Consultant, Kennedy Information, Inc. (executive |
| DOB: 9/19/1941 | | recruitment information and research company); Consultant, AESC (The Association of Retained |
| Term of office since: 1982 | | Executive Search Consultants); Trustee, NDI Technologies, LLP (communications); Director, J&M |
| | | Cumming Paper Co. (paper merchandising); Former Vice Chairman, DHR International, Inc. |
| Other directorships: None | | (executive recruitment); Former Director, Mentor Income Fund, Inc.; Former Trustee, Mentor |
| | | Funds and Cash Resource Trust |
|
| |
| Dr. Russell A. Salton III | | Principal occupations: President/CEO, AccessOne MedCard; Former Medical Director, Healthcare |
| Trustee | | Resource Associates, Inc.; Former Medical Director, U.S. Health Care/Aetna Health Services; |
| DOB: 6/2/1947 | | Former Director, Mentor Income Fund, Inc.; Former Trustee, Mentor Funds and Cash Resource |
| Term of office since: 1984 | | Trust |
| Other directorships: None | | |
|
20
TRUSTEES AND OFFICERS continued
| | |
| Michael S. Scofield | | Principal occupations: Attorney, Law Offices of Michael S. Scofield; Former Director, Mentor |
| Trustee | | Income Fund, Inc.; Former Trustee, Mentor Funds and Cash Resource Trust |
| DOB: 2/20/1943 | | |
| Term of office since: 1984 | | |
| Other directorships: None | | |
|
| |
| Richard J. Shima | | Principal occupations: Independent Consultant; Director, Trust Company of CT; Trustee, Saint |
| Trustee | | Joseph College (CT); Director, Hartford Hospital; Trustee, Greater Hartford YMCA; Former |
| DOB: 8/11/1939 | | Director, Enhance Financial Services, Inc.; Former Director, Old State House Association; Former |
| Term of office since: 1993 | | Director of CTG Resources, Inc. (natural gas); Former Director, Mentor Income Fund, Inc.; Former |
| | | Trustee, Mentor Funds and Cash Resource Trust |
| Other directorships: None | | |
|
| |
| Richard K. Wagoner, CFA 2 | | Principal occupations: Member and Former President, North Carolina Securities Traders |
| Trustee | | Association; Member, Financial Analysts Society; Former Consultant to the Boards of Trustees of |
| DOB: 12/12/1937 | | the Evergreen funds; Former Trustee, Mentor Funds and Cash Resource Trust |
| Term of office since: 1999 | | |
| Other directorships: None | | |
|
| |
| OFFICERS | | |
| |
| Dennis H. Ferro 3 | | Principal occupations: President and Chief Executive Officer, Evergreen Investment Company, |
| President | | Inc. and Executive Vice President, Wachovia Bank, N.A.; former Chief Investment Officer, |
| DOB: 6/20/1945 | | Evergreen Investment Company, Inc. |
| Term of office since: 2003 | | |
|
| |
| Carol Kosel 4 | | Principal occupations: Senior Vice President, Evergreen Investment Services, Inc. |
| Treasurer | | |
| DOB: 12/25/1963 | | |
| Term of office since: 1999 | | |
|
| |
| Michael H. Koonce 4 | | Principal occupations: Senior Vice President and General Counsel, Evergreen Investment |
| Secretary | | Services, Inc.; Senior Vice President and Assistant General Counsel, Wachovia Corporation |
| DOB: 4/20/1960 | | |
| Term of office since: 2000 | | |
|
| |
| James Angelos 4 | | Principal occupations: Chief Compliance Officer and Senior Vice President, Evergreen Funds; |
| Chief Compliance Officer | | Former Director of Compliance, Evergreen Investment Services, Inc. |
| DOB: 9/2/1947 | | |
| Term of office since: 2004 | | |
|
| |
| 1 | Each Trustee serves until a successor is duly elected or qualified or until his death, resignation, retirement or removal from office. Each |
| | Trustee oversees 93 Evergreen funds. Correspondence for each Trustee may be sent to Evergreen Board of Trustees, P.O. Box 20083, |
| | Charlotte, North Carolina 28202. |
| 2 | Mr. Wagoner is an "interested person" of the Fund because of his ownership of shares in Wachovia Corporation, the parent to the |
| | Fund's investment advisor. |
| 3 | The address of the Officer is 401 S. Tryon Street, 20th Floor, Charlotte, NC 28288. |
| 4 | The address of the Officer is 200 Berkeley Street, Boston, MA 02116. |
| Additional information about the Fund's Board of Trustees and Officers can be found in the Statement of Additional Information (SAI) and |
| is available upon request without charge by calling 800.343.2898. |
21

571812 12/2004
Evergreen US Government Fund

| | |
| table of contents |
| 1 | | LETTER TO SHAREHOLDERS |
| 4 | | FUND AT A GLANCE |
| 6 | | ABOUT YOUR FUND'S EXPENSES |
| 7 | | FINANCIAL HIGHLIGHTS |
| 11 | | SCHEDULE OF INVESTMENTS |
| 17 | | STATEMENT OF ASSETS AND LIABILITIES |
| 18 | | STATEMENT OF OPERATIONS |
| 19 | | STATEMENTS OF CHANGES IN NET ASSETS |
| 20 | | STATEMENT OF CASH FLOWS |
| 21 | | NOTES TO FINANCIAL STATEMENTS |
| 28 | | TRUSTEES AND OFFICERS |
This semiannual report must be preceded or accompanied by a prospectus of the Evergreen fund contained herein. The prospectus contains more complete information, including fees and expenses, and should be read carefully before investing or sending money.
The fund will file its complete schedule of portfolio holdings with the SEC for the first and third quarters of each fiscal year on Form N-Q. The fund's Form N-Q will be available on the SEC's Web site at http://www.sec.gov. In addition, the fund's Form N-Q may be reviewed and copied at the SEC's Public Reference Room in Washington, D.C. Information on the operation of the Public Reference Room may be obtained by calling 800.SEC.0330.
A description of the fund's proxy voting policies and procedures is available without charge, upon request, by calling 800.343.2898, by visiting our Web site at EvergreenInvestments.com or by visiting the SEC's Web site at http://www.sec.gov.
Information relating to how the fund voted proxies relating to portfolio securities during the most recent 12-month period ended June 30 is available by visiting our Web site at EvergreenInvestments.com or by visiting the SEC's Web site at http://www.sec.gov.
| | | | |
| Mutual Funds: | | | | |
| NOT FDIC INSURED | | MAY LOSE VALUE | | NOT BANK GUARANTEED |
Evergreen InvestmentsSM is a service mark of Evergreen Investment Management Company, LLC. Copyright 2004.
Evergreen mutual funds are distributed by Evergreen Investment Services, Inc. 200 Berkeley Street, Boston, MA 02116
LETTER TO SHAREHOLDERS
December 2004

Dennis H. Ferro
President and Chief Executive Officer
Dear Shareholder,
We are pleased to provide the semiannual report for the Evergreen US Government Fund, which covers the six-month period ended October 31, 2004.
Our fixed income portfolio teams entered the investment period with a major decision to make regarding the magnitude of potential changes in monetary policy. Since the Federal Reserve had kept its target for the benchmark federal funds rate at a 46-year low of 1% for more than nine months, most investors agreed that rates were headed higher. The key was by how much, and what impact that would have on the level of market interest rates. Considering that the federal funds rate was significantly below that of inflation, we determined that the Federal Reserve would be true to its word, and enact a "measured" removal of policy accommodation.
The period began with positive momentum on the economic front. First quarter Gross Domestic Product ("GDP") grew in excess of 4%, and supporting data pointed to a continuation of solid growth. Retail sales were strong and manufacturing had managed to put together several months of consistent growth. The solid contributions from business investment, meanwhile, had enabled the expansion to broaden, reinforcing the trend for sustainable economic growth. The next key for the recovery would come in the form of employment growth, which has historically lagged that of GDP growth. This recovery was no exception, and fears of a jobless recovery had persisted for months. Yet that too also improved, as the investment period began with consecutive monthly payroll gains in excess of 300,000 jobs.
1
LETTER TO SHAREHOLDERS continued
The bond market quickly sent investors a message: be careful what you wish for. After having fretted for months about a jobless recovery, the sudden large number of jobs being created and the threat of higher wage inflation sent market yields dramatically higher last spring. In addition to the improvement in employment, the Federal Reserve had been preparing Wall Street for higher interest rates. Monetary policymakers began the second quarter with a new "spin" on their message to the public, stating that they would remain "measured" in their removal of policy accommodation. Despite these attempts at improved clarity from the Federal Reserve, other factors emerged to drive yields higher during the first part of the investment period. Indeed, interest rate concerns were exacerbated by rising gasoline prices and the larger than forecast readings on consumer inflation during May and June.
As it turned out, the advent of the Federal Reserve's gradual tightening cycle proved to be the tonic that the markets needed. As with many issues confronting investors in recent years, clarity bested uncertainty, and the bond market responded favorably to the prospects of only slightly higher interest rates. Monetary policy officials were also making the rounds in speeches reiterating their intentions to remain "measured" in the removal of policy accommodation. In addition, economic data began to moderate. The pace of job growth slowed and the inflation fears of June had dissipated by September. Despite higher oil prices, inflation reports were becoming less threatening, suggesting that oil would ultimately prove a drag on growth, rather than ignite inflation.
Other factors served to reward a variety of fixed income categories in recent months. For example, the uncertain geopolitical environment and the weaker dollar resulted in higher domestic and international demand for the perceived safety of U.S. government bonds, and the yield on the 10-year Treasury hovered around 4% at the close of the third quarter, despite the likelihood of higher federal deficits. Mortgages also benefited from the reduced prepayment risk in their portfolios, and high yield bonds continued to attract attention given
2
LETTER TO SHAREHOLDERS continued
their income potential and the low default risk. Solid corporate balance sheets and earnings potential enabled many investment grade corporate bonds to also strengthen as the investment period progressed. Indeed, despite the rate hikes from the Federal Reserve, prices firmed for a variety of asset classes within the fixed income market during the latter half of the investment period.
In this environment, we continue to recommend diversified fixed income strategies for long-term investment portfolios.
Please visit our Web site, EvergreenInvestments.com, for more information about our funds and other investment products available to you. Thank you for your continued support of Evergreen Investments.
Sincerely,

Dennis H. Ferro
President and Chief Executive Officer
Evergreen Investment Company, Inc.
Special Notice to Shareholders:
Please visit our Web site at EvergreenInvestments.com for statements from President and Chief Executive Officer, Dennis Ferro, and Chairman of the Board of the Evergreen Funds, Michael S. Scofield, addressing recent SEC actions involving the Evergreen Funds.
3
FUND AT A GLANCE
as of October 31, 2004
MANAGEMENT TEAM

Lisa Brown Premo
Customized Fixed Income Team Lead Manager
CURRENT INVESTMENT STYLE

Source: Morningstar, Inc.
Morningstar's style box is based on a portfolio date as of 9/30/2004.
The fixed income style box placement is based on a fund's average effective maturity or duration and the average credit rating of the bond portfolio.
PERFORMANCE AND RETURNS
Portfolio inception date: 1/11/1993
| | | | | | | | |
| | | Class A | | Class B | | Class C | | Class I |
| Class inception date | | 1/11/1993 | | 1/11/1993 | | 9/2/1994 | | 9/2/1993 |
|
| Nasdaq symbol | | EUSAX | | EUSBX | | EUSCX | | EUSYX |
|
| 6-month return with sales charge | | -1.74% | | -2.17% | | 1.83% | | N/A |
|
| 6-month return w/o sales charge | | 3.19% | | 2.83% | | 2.83% | | 3.35% |
|
| Average annual return* | | | | | | | | |
|
| 1-year with sales charge | | -1.29% | | -2.10% | | 1.90% | | N/A |
|
| 1-year w/o sales charge | | 3.62% | | 2.90% | | 2.90% | | 3.93% |
|
| 5-year | | 5.20% | | 5.13% | | 5.45% | | 6.51% |
|
| 10-year | | 6.03% | | 5.77% | | 5.77% | | 6.83% |
|
* Adjusted for maximum applicable sales charge, unless noted.
Past performance is no guarantee of future results. The performance quoted represents past performance and current performance may be lower or higher. The investment return and principal value of an investment will fluctuate so that investors' shares, when redeemed, may be worth more or less than their original cost. To obtain performance information current to the most recent month-end for Classes A, B, C or I, please go to EvergreenInvestments.com/fundperformance. The performance of each class may vary based on differences in loads, fees and expenses paid by the shareholders investing in each class. The maximum applicable sales charge is 4.75% for Class A, 5.00% for Class B and 1.00% for Class C. Class I is not subject to a sales charge. Performance includes the reinvestment of income dividends and capital gain distributions. Performance shown does not reflect the deduction of taxes that a shareholder would pay on fund distributions or the redemption of fund shares.
Historical performance shown for Classes C and I prior to their inception is based on the performance of Class A, one of the original classes offered along with Class B. The historical returns for Classes C and I have not been adjusted to reflect the effect of each class' 12b-1 fee. These fees are 0.30% for Class A and 1.00% for Classes B and C. Class I does not pay a 12b-1 fee. If these fees had been reflected, returns for Class C would have been lower while returns for Class I would have been higher.
Returns reflect expense limits previously in effect, without which returns would have been lower.
4
FUND AT A GLANCE continued
LONG-TERM GROWTH

Comparison of a $10,000 investment in the Evergreen U.S. Government Fund Class A shares, versus a similar investment in the Lehman Brothers Intermediate Term Government Bond Index (LBITGBI) and the Consumer Price Index (CPI).
The LBITGBI is an unmanaged market index and does not include transaction costs associated with buying and selling securities, any mutual fund expenses or any taxes. The CPI is a commonly used measure of inflation and does not represent an investment return. It is not possible to invest directly in an index.
Class I shares are only offered to investment advisory clients of an investment advisor of an Evergreen fund (or its advisory affiliates), through special arrangements entered into on behalf of Evergreen funds with certain financial services firms, certain institutional investors and persons who owned Class Y shares in registered name in an Evergreen fund on or before December 31, 1994. Class I shares are only available to institutional shareholders with a minimum $1 million investment.
The fund's investment objective is nonfundamental and may be changed without the vote of the fund's shareholders.
U.S. government guarantees apply only to certain securities held in the fund's portfolio and not to the fund's shares.
The return of principal is not guaranteed due to fluctuation in the NAV of the fund caused by changes in the price of the individual bonds held by the fund and the buying and selling of bonds by the fund. Bond funds have the same inflation, interest rate and credit risks that are associated with the individual bonds held by the fund.
All data is as of October 31, 2004, and subject to change.
5
ABOUT YOUR FUND'S EXPENSES
The Example below is intended to describe the fees and expenses borne by shareholders and the impact of those costs on your investment.
Example
As a shareholder of the fund, you incur two types of costs: (1) transaction costs, including sales charges (loads), redemption fees and exchange fees; and (2) ongoing costs, including management fees, distribution (12b-1) fees and other fund expenses. This Example is intended to help you understand your ongoing costs (in dollars) of investing in the fund and to compare these costs with the ongoing costs of investing in other mutual funds. The Example is based on an investment of $1,000 invested at the beginning of the period and held for the entire period from May 1, 2004 to October 31, 2004.
The example illustrates your fund's costs in two ways:
• Actual expenses
The section in the table under the heading "Actual" provides information about actual account values and actual expenses. You may use the information in these columns, together with the amount you invested, to estimate the expenses that you paid over the period. Simply divide your account value by $1,000 (for example, an $8,600 account value divided by $1,000 = 8.6), then multiply the result by the number in the appropriate column for your share class, in the column entitled "Expenses Paid During Period" to estimate the expenses you paid on your account during this period.
• Hypothetical example for comparison purposes
The section in the table under the heading "Hypothetical (5% return before expenses)" provides information about hypothetical account values and hypothetical expenses based on the fund's actual expense ratio and an assumed rate of return of 5% per year before expenses, which is not the fund's actual return. The hypothetical account values and expenses may not be used to estimate the actual ending account balance or expenses you paid for the period. You may use this information to compare the ongoing costs of investing in the fund and other funds. To do so, compare this 5% hypothetical example with the 5% hypothetical examples that appear in the shareholder reports of the other funds.
Please note that the expenses shown in the table are meant to highlight your ongoing costs only and do not reflect any transactional costs, such as sales charges (loads), redemption fees or exchange fees. Therefore, the section in the table under the heading "Hypothetical (5% return before expenses)" is useful in comparing ongoing costs only, and will not help you determine the relative total costs of owning different funds. In addition, if these transactional costs were included, your costs would have been higher.
| | | | | | |
| | | Beginning | | Ending | | |
| | | Account | | Account | | Expenses |
| | | Value | | Value | | Paid During |
| | | 5/1/2004 | | 10/31/2004 | | Period* |
|
| Actual | | | | | | |
| Class A | | $1,000.00 | | $1,031.90 | | $5.12 |
| Class B | | $1,000.00 | | $1,028.28 | | $8.69 |
| Class C | | $1,000.00 | | $1,028.28 | | $8.69 |
| Class I | | $1,000.00 | | $1,033.45 | | $3.59 |
| Hypothetical | | | | | | |
| (5% return | | | | | | |
| before expenses) | | | | | | |
| Class A | | $1,000.00 | | $1,020.16 | | $5.09 |
| Class B | | $1,000.00 | | $1,016.64 | | $8.64 |
| Class C | | $1,000.00 | | $1,016.64 | | $8.64 |
| Class I | | $1,000.00 | | $1,021.68 | | $3.57 |
|
* For each class of the Fund, expenses are equal to the annualized expense ratio of each class (1.00% for Class A, 1.70% for Class B, 1.70% for Class C and 0.70% for Class I), multiplied by the average account value over the period, multiplied by 184 / 365 days.
6
FINANCIAL HIGHLIGHTS
(For a share outstanding throughout each period)
| | | | | | | | | | | | |
| | | | | | | | | | | | | |
| | | Six Months Ended | | Year Ended April 30, |
| | October 31, 2004 | |
|
| CLASS A | | (unaudited) 1 | | 2004 1 | | 2003 | | 2002 2 | | 2001 | | 2000 |
|
| Net asset value, beginning of period | | $ 9.96 | | $ 10.22 | | $ 9.75 | | $ 9.59 | | $ 9.15 | | $ 9.63 |
|
| Income from investment operations | | | | | | | | | | | | |
| Net investment income | | 0.12 | | 0.19 | | 0.39 | | 0.48 | | 0.54 | | 0.55 |
|
Net realized and unrealized gains
or losses on securities | | 0.20 | | (0.16 ) | | 0.43 | | 0.16 | | 0.44 | | (0.48 ) |
| |
| |
| |
| |
| |
| |
|
| Total from investment operations | | 0.32 | | 0.03 | | 0.82 | | 0.64 | | 0.98 | | 0.07 |
|
| Distributions to shareholders from | | | | | | | | | | | | |
| Net investment income | | (0.15 ) | | (0.29 ) | | (0.35 ) | | (0.48 ) | | (0.54 ) | | (0.55 ) |
|
| Net asset value, end of period | | $ 10.13 | | $ 9.96 | | $ 10.22 | | $ 9.75 | | $ 9.59 | | $ 9.15 |
|
| Total return 3 | | 3.19% | | 0.30% | | 8.50% | | 6.76% | | 10.98 % | | 0.79% |
|
| Ratios and supplemental data | | | | | | | | | | | | |
| Net assets, end of period (thousands) | | $100,168 | | $109,172 | | $146,427 | | $141,838 | | $108,073 | | $91,123 |
| Ratios to average net assets | | | | | | | | | | | | |
| Expenses 4 | | 1.00 % 5 | | 1.01 % | | 0.95 % | | 0.96 % | | 1.00 % | | 0.97 % |
| Net investment income | | 1.88% 5 | | 1.86% | | 3.81% | | 4.91% | | 5.71% | | 5.89% |
| Portfolio turnover rate | | 71% | | 55% | | 129% | | 121% | | 86% | | 58% |
|
|
1Net investment income per share is based on average shares outsta nding during the period.
|
2As required, effective May 1, 2001, the Fund adopted the pr ovisions of the AICPA Audit and Accounting Guide,
Audits of Investment Companies, and began amortizing premium on its fixed-income |
securities. The effects of this change for the year ended April 30, 2002 was a decrease in net investment income
per share of $0.02; an increase in net realized gains or losses per share of $0.02; and a |
decrease to the ratio of net investment income to average net assets of 0.22%. The above per share information,
ratios and supp lemental data for the periods prior to May 1, 2001 have not been |
restated to reflect this change in presentation.
|
3Excluding applicable sales charges
|
4The ratio of expenses to average net assets excludes expense reductions but includes fee waivers and/or expense reimbursements.
|
| 5Annualized |
See Notes to Financial Statements
7
FINANCIAL HIGHLIGHTS
(For a share outstanding throughout each period)
| | | | | | | | | | | | |
| | | | | | | | | | | | | |
| | | Six Months Ended | | Year Ended April 30, |
| | October 31, 2004 | |
|
| CLASS B | | (unaudited) 1 | | 2004 1 | | 2003 | | 2002 2 | | 2001 | | 2000 |
|
| Net asset value, beginning of period | | $ 9.96 | | $ 10.22 | | $ 9.75 | | $ 9.59 | | $ 9.15 | | $ 9.63 |
|
| Income from investment operations | | | | | | | | | | | | |
| Net investment income | | 0.08 | | 0.12 | | 0.31 | | 0.42 | | 0.47 | | 0.48 |
|
Net realized and unrealized gains
or losses on securities | | 0.20 | | (0.16 ) | | 0.43 | | 0.15 | | 0.44 | | (0.48 ) |
| |
| |
| |
| |
| |
| |
|
| Total from investment operations | | 0.28 | | (0.04) | | 0.74 | | 0.57 | | 0.91 | | 0 |
|
| Distributions to shareholders from | | | | | | | | | | | | |
| Net investment income | | (0.11 ) | | (0.22 ) | | (0.27 ) | | (0.41 ) | | (0.47 ) | | (0.48 ) |
|
| Net asset value, end of period | | $ 10.13 | | $ 9.96 | | $ 10.22 | | $ 9.75 | | $ 9.59 | | $ 9.15 |
|
| Total return 3 | | 2.83% | | (0.40%) | | 7.69% | | 5.97% | | 10.15 % | | 0.03% |
|
| Ratios and supplemental data | | | | | | | | | | | | |
| Net assets, end of period (thousands) | | $31,616 | | $37,270 | | $59,362 | | $47,016 | | $65,533 | | $82,665 |
| Ratios to average net assets | | | | | | | | | | | | |
| Expenses 4 | | 1.70 % 5 | | 1.71 % | | 1.70 % | | 1.71 % | | 1.75 % | | 1.71 % |
| Net investment income | | 1.17% 5 | | 1.16% | | 3.04% | | 4.18% | | 4.98% | | 5.11% |
| Portfolio turnover rate | | 71% | | 55% | | 129% | | 121% | | 86% | | 58% |
|
|
1Net investment income per share is based on average shares outsta nding during the period.
|
2As required, effective May 1, 2001, the Fund adopted the provisions of the AICPA Audit and Accounting Guide,
Audits of Investment Companies, and began amortizing premium on its fixed-income |
securities. The effects of this change for the year ended April 30, 2002 was a decrease in net investment income
per share of $0.02; an increase in net realized gains or losses per share of $0.02; and a |
decrease to the ratio of net investment income to average net assets of 0.22%. The above per share information,
ratios and supp lemental data for the periods prior to May 1, 2001 have not been |
restated to reflect this change in presentation.
|
3Excluding applicable sales charges
|
4The ratio of expenses to average net assets excludes expense reductions but includes fee waivers and/or expense reimbursements.
|
| 5Annualized |
See Notes to Financial Statements
8
FINANCIAL HIGHLIGHTS
(For a share outstanding throughout each period)
| | | | | | | | | | | | |
| | | | | | | | | | | | | |
| | | Six Months Ended | | Year Ended April 30, |
| | October 31, 2004 | |
|
| CLASS C | | (unaudited) 1 | | 2004 1 | | 2003 | | 2002 2 | | 2001 | | 2000 |
|
| Net asset value, beginning of period | | $ 9.96 | | $ 10.22 | | $ 9.75 | | $ 9.59 | | $ 9.15 | | $ 9.63 |
|
| Income from investment operations | | | | | | | | | | | | |
| Net investment income | | 0.08 | | 0.12 | | 0.31 | | 0.41 | | 0.47 | | 0.48 |
|
Net realized and unrealized gains
or losses on securities | | 0.20 | | (0.16 ) | | 0.43 | | 0.16 | | 0.44 | | (0.48 ) |
| |
| |
| |
| |
| |
| |
|
| Total from investment operations | | 0.28 | | (0.04) | | 0.74 | | 0.57 | | 0.91 | | 0 |
|
| Distributions to shareholders from | | | | | | | | | | | | |
| Net investment income | | (0.11 ) | | (0.22 ) | | (0.27 ) | | (0.41 ) | | (0.47 ) | | (0.48 ) |
|
| Net asset value, end of period | | $ 10.13 | | $ 9.96 | | $ 10.22 | | $ 9.75 | | $ 9.59 | | $ 9.15 |
|
| Total return 3 | | 2.83% | | (0.40%) | | 7.69% | | 5.97% | | 10.15 % | | 0.03% |
|
| Ratios and supplemental data | | | | | | | | | | | | |
| Net assets, end of period (thousands) | | $11,631 | | $14,207 | | $26,013 | | $14,212 | | $11,188 | | $4,740 |
| Ratios to average net assets | | | | | | | | | | | | |
| Expenses 4 | | 1.70 % 5 | | 1.71 % | | 1.70 % | | 1.71 % | | 1.74 % | | 1.71 % |
| Net investment income | | 1.17% 5 | | 1.17% | | 2.99% | | 4.15% | | 4.90% | | 5.12% |
| Portfolio turnover rate | | 71% | | 55% | | 129% | | 121% | | 86% | | 58% |
|
1 Net investment income per share is based on average shares outstanding during the period.
2 As required, effective May 1, 2001, the Fund adopted the provisions of the AICPA Audit and, Accounting Guide, Audits of Investment Companies and began amortizing premium on its fixed-income securities . The effects of this change for the year ended April 30, 2002 was a decrease in net investment income per share of $0.02; an increase in net realized gains or losses per share of $0.02; and a decrease to the ratio of net investment income to average net assets of 0.22%. The above per share information, ratios and supplemental data for the periods prior to May 1, 2001 have not been restated to reflect this change in presentation.
3 Excluding applicable sales charges
4 The ratio of expenses to average net assets excludes expense reductions but includes fee waivers and/or expense reimbursements.
5 Annualized
See Notes to Financial Statements
9
FINANCIAL HIGHLIGHTS
(For a share outstanding throughout each period)
| | | | | | | | | | | | |
| | | | | | | | | | | | | |
| | | Six Months Ended | | Year Ended April 30, |
| | October 31, 2004 | |
|
| CLASS I 1 | | (unaudited) 2 | | 2004 2 | | 2003 | | 2002 3 | | 2001 | | 2000 |
|
| Net asset value, beginning of period | | $ 9.96 | | $ 10.22 | | $ 9.75 | | $ 9.59 | | $ 9.15 | | $ 9.63 |
|
| Income from investment operations | | | | | | | | | | | | |
| Net investment income | | 0.13 | | 0.22 | | 0.41 | | 0.50 | | 0.56 | | 0.57 |
|
Net realized and unrealized gains
or losses on securities | | 0.20 | | (0.16 ) | | 0.43 | | 0.16 | | 0.44 | | (0.48 ) |
| |
| |
| |
| |
| |
| |
|
| Total from investment operations | | 0.33 | | 0.06 | | 0.84 | | 0.66 | | 1.00 | | 0.09 |
|
| Distributions to shareholders from | | | | | | | | | | | | |
| Net investment income | | (0.16 ) | | (0.32 ) | | (0.37 ) | | (0.50 ) | | (0.56 ) | | (0.57 ) |
|
| Net asset value, end of period | | $ 10.13 | | $ 9.96 | | $ 10.22 | | $ 9.75 | | $ 9.59 | | $ 9.15 |
|
| Total return | | 3.35% | | 0.60% | | 8.77% | | 7.02% | | 11.25 % | | 1.04% |
|
| Ratios and supplemental data | | | | | | | | | | | | |
| Net assets, end of period (thousands) | | $413,519 | | $427,356 | | $489,565 | | $327,753 | | $263,619 | | $231,417 |
| Ratios to average net assets | | | | | | | | | | | | |
| Expenses 4 | | 0.70 % 5 | | 0.71 % | | 0.70 % | | 0.71 % | | 0.75 % | | 0.71 % |
| Net investment income | | 2.18% 5 | | 2.15% | | 4.02% | | 5.16% | | 5.97% | | 6.12% |
| Portfolio turnover rate | | 71% | | 55% | | 129% | | 121% | | 86% | | 58% |
|
1 Effective at the close of business on May 11, 2001, Class Y sh ares were renamed as Institutional shares (Class I).
2 Net investment income per share is based on average shares outstanding during the period.
3 As required, effective May 1, 2001, the Fund adopted the provisions of the AICPA Audit and Accounting Guide, Audits of Investment Companies, and began amortizing premium on its fixed-income securities . The effects of this change for the year ended April 30, 2002 was a decrease in net investment income per share of $0.02; an increase in net realized gains or losses per share of $0.02; and a decrease to the ratio of net investment income to average net assets of 0.22%. The above per share information, ratios and supplemental data for the periods prior to May 1, 2001 have not been restated to reflect this change in presentation.
4 The ratio of expenses to average net assets excludes expense reductions but includes fee waivers and/or expense reimbursements.
5 Annualized
See Notes to Financial Statements
10
SCHEDULE OF INVESTMENTS
October 31, 2004 (unaudited)
| | | | | | |
| | | Principal | | | | |
| | | Amount | | | | Value |
|
| |
| AGENCY COMMERCIAL MORTGAGE-BACKED SECURITIES 3.1% | | | | | | |
| Fixed Rate 3.1% | | | | | | |
| FNMA: | | | | | | |
| 5.29%, 04/01/2007 | | $ 970,090 | | $ | | 978,418 |
| 6.22%, 08/01/2012 | | 4,156,703 | | | | 4,617,619 |
| 6.28%, 05/01/2011 (h) | | 7,708,627 | | | | 8,562,502 |
| 6.80%, 01/01/2011 | | 3,000,000 | | | | 3,360,671 |
| | | | | |
|
| Total Agency Commercial Mortgage-Backed Securities | | | | |
| (cost $17,645,229) | | | | 17,519,210 |
| | | |
|
| AGENCY MORTGAGE-BACKED COLLATERALIZED MORTGAGE OBLIGATIONS 16.6% |
| Fixed Rate 6.8% | | | | |
| FHLMC: | | | | |
| Ser. 2262, Class Z, 7.50%, 10/15/2030 | | 314,820 | | | | 325,632 |
| Ser. 2359, Class PC, 6.00%, 07/15/2015 | | 361,585 | | | | 364,990 |
| Ser. 2367, Class BC, 6.00%, 04/15/2016 | | 238,055 | | | | 242,437 |
| Ser. H012, Class A2, 2.50%, 11/15/2008 | | 5,716,572 | | | | 5,632,406 |
| Ser. SF1, Class A2, 2.38%, 11/15/2008 ## | | 11,000,000 | | | | 10,964,725 |
| FNMA, Ser. 2002-W5, Class A7, 6.25%, 08/25/2030 ## | | 19,480,000 | | | | 20,137,744 |
| | | | | |
|
| | | | | | | 37,667,934 |
| | | | | |
|
| Floating Rate 9.8% | | | | | | |
| FHLMC: | | | | | | |
| Ser. 1370, Class JA, 3.03%, 09/15/2022 | | 447,135 | | | | 454,357 |
| Ser. 1498, Class I, 3.03%, 04/15/2023 | | 373,057 | | | | 379,394 |
| Ser. 1533, Class FA, 2.98%, 06/15/2023 | | 100,554 | | | | 102,418 |
| Ser. 1616, Class FB, 2.78%, 11/15/2008 | | 2,430,919 | | | | 2,442,894 |
| Ser. 1671, Class TA, 2.375%, 02/15/2024 | | 1,842,871 | | | | 1,853,282 |
| Ser. 2030, Class F, 2.37%, 02/15/2028 (h) | | 1,899,952 | | | | 1,913,878 |
| Ser. 2181, Class PF, 2.27%, 05/15/2029 (h) | | 928,268 | | | | 932,934 |
| Ser. 2380, Class FL, 2.47%, 11/15/2031 ## | | 7,333,944 | | | | 7,447,291 |
| Ser. 2395, Class FD, 2.47%, 05/15/2029 | | 2,851,990 | | | | 2,884,221 |
| Ser. 2481, Class FE, 2.87%, 03/15/2032 (h) | | 4,928,290 | | | | 5,032,883 |
| Ser. 2691, Class FC, 2.57%, 10/15/2033 (h) | | 4,370,925 | | | | 4,396,424 |
| FNMA: | | | | | | |
| Ser. 1993-174, Class FD, 2.73%, 09/25/2008 | | 343,824 | | | | 343,260 |
| Ser. 1993-221, Class FH, 3.038%, 12/25/2008 | | 4,466,985 | | | | 4,543,590 |
| Ser. 1997-34, Class F, 2.49%, 10/25/2023 ## | | 6,056,717 | | | | 6,126,028 |
| Ser. 1997-49, Class F, 2.41%, 06/17/2027 (h) | | 1,181,054 | | | | 1,189,904 |
| Ser. 1999-49, Class F, 2.33%, 05/25/2018 | | 2,000,254 | | | | 2,010,473 |
| Ser. 2000-32, Class FM, 2.34%, 10/18/2030 | | 1,083,781 | | | | 1,091,228 |
| Ser. 2001-53, Class CF, 2.33%, 10/25/2031 | | 510,950 | | | | 512,312 |
| Ser. 2002-13, Class FE, 2.83%, 03/25/2032 | | 2,665,590 | | | | 2,709,323 |
| Ser. 2002-67, Class FA, 2.93%, 11/25/2032 ## | | 4,381,286 | | | | 4,469,729 |
| Ser. G93, Class FH, 3.09%, 04/25/2023 | | 316,833 | | | | 324,669 |
See Notes to Financial Statements
11
SCHEDULE OF INVESTMENTS continued
October 31, 2004 (unaudited)
| | | | | | |
| | | Principal | | | | |
| | | Amount | | | | Value |
|
| |
| AGENCY MORTGAGE-BACKED COLLATERALIZED MORTGAGE | | | | | | |
| OBLIGATIONS continued | | | | | | |
| Floating Rate continued | | | | | | |
| GNMA: | | | | | | |
| Ser. 1999-40, Class FL, 2.49%, 02/17/2029 | | $ 509,047 | | $ | | 513,705 |
| Ser. 2000-12, Class FQ, 2.54%, 06/16/2029 | | 1,973,823 | | | | 1,978,440 |
| Ser. 2000-36, Class FG, 2.41%, 11/20/2030 | | 1,203,308 | | | | 1,211,060 |
| | | | | |
|
| | | | | | | 54,863,697 |
| | | | | |
|
| Total Agency Mortgage-Backed Collateralized Mortgage Obligations | | | | | | |
| (cost $92,235,801) | | | | | | 92,531,631 |
| | | | | |
|
| AGENCY MORTGAGE-BACKED PASS-THROUGH SECURITIES 54.8% | | | | | | |
| Fixed Rate 46.0% | | | | | | |
| FNMA, 4.50%, TBA # | | 10,000,000 | | | | 10,028,120 |
| FHLMC: | | | | | | |
| 5.50%, TBA # | | 85,155,000 | | | | 87,331,050 |
| 6.00%, TBA # | | 99,590,000 | | | | 103,137,894 |
| 6.50%, 04/01/2011 ## | | 9,855,564 | | | | 10,437,638 |
| 7.50%, 05/01/2027 | | 1,706,173 | | | | 1,835,936 |
| 8.00%, 08/01/2023 | | 500,107 | | | | 546,785 |
| 9.00%, 01/01/2017 | | 181,383 | | | | 203,180 |
| 9.50%, 09/01/2020 | | 98,077 | | | | 110,489 |
| 10.50%, 12/01/2019 | | 276,396 | | | | 313,680 |
| FNMA: | | | | | | |
| 5.50%, TBA # | | 20,000,000 | | | | 20,368,760 |
| 6.00%, 02/01/2008 | | 978,751 | | | | 1,029,204 |
| 6.50%, 01/01/2024 | | 273,615 | | | | 289,472 |
| 7.00%, 11/01/2026 | | 474,655 | | | | 504,981 |
| 7.50%, 07/01/2023 | | 998,931 | | | | 1,076,521 |
| 8.00%, 10/01/2026 | | 654,497 | | | | 715,498 |
| 8.50%, 07/01/2029 | | 87,042 | | | | 95,152 |
| 9.50%, 06/01/2022 | | 119,717 | | | | 134,948 |
| 11.00%, 01/01/2016 | | 178,663 | | | | 200,888 |
| 11.25%, 02/01/2016 | | 178,026 | | | | 202,117 |
| GNMA: | | | | | | |
| 6.00%, 02/15/2009 ## | | 11,204,668 | | | | 11,638,898 |
| 6.50%, 12/15/2025 | | 1,556,418 | | | | 1,647,215 |
| 7.00%, 12/15/2022 | | 1,476,111 | | | | 1,579,425 |
| 7.34%, 10/20/2021 | | 936,668 | | | | 1,000,933 |
| 7.50%, 02/15/2022 | | 1,180,397 | | | | 1,275,135 |
| 8.00%, 09/15/2009 | | 18,610 | | | | 19,825 |
| 10.00%, 12/15/2018 | | 113,645 | | | | 128,353 |
| | | | | |
|
| | | | | | | 245,823,977 |
| | | | | |
|
See Notes to Financial Statements
12
SCHEDULE OF INVESTMENTS continued
October 31, 2004 (unaudited)
| | | | | | |
| | | Principal | | | | |
| | | Amount | | | | Value |
|
| |
| AGENCY MORTGAGE-BACKED PASS-THROUGH SECURITIES continued | | | | | | |
| Floating Rate 8.8% | | | | | | |
| FNMA: | | | | | | |
| 2.66%, 07/01/2044 (h) | | $24,713,647 | | $ | | 25,027,772 |
| 2.86%, 06/01/2040 ## | | 23,848,782 | | | | 24,058,539 |
| | | | | |
|
| | | | | | | 49,086,311 |
| | | | | |
|
| Total Agency Mortgage-Backed Pass-Through Securities | | | | |
| (cost $301,127,588) | | | | 304,938,408 |
| | | |
|
| AGENCY REPERFORMING MORTGAGE-BACKED PASS-THROUGH SECURITIES 5.6% | | | | |
| FNMA: | | | | |
| Ser. 2002-T16, Class A1, 6.50%, 07/25/2042 ## | | 8,174,905 | | | | 8,619,415 |
| Ser. 2002-W8, Class A4, 7.00%, 06/25/2017 | | 7,490,030 | | | | 8,004,970 |
| Ser. 2003-W1, Class 1A-1, 6.50%, 12/25/2042 | | 2,478,905 | | | | 2,616,040 |
| Ser. 2003-W6, Class 3A, 6.50%, 09/25/2042 ## | | 11,561,327 | | | | 12,189,974 |
| | | | | |
|
| Total Agency Reperforming Mortgage-Backed Pass-Through Securities | | | | | | |
| (cost $31,367,645) | | | | | | 31,430,399 |
| | | | | |
|
| ASSET-BACKED SECURITIES 3.1% | | | | | | |
| Pinstripe I CDO, Ltd., Ser. 1A, Class B1, 2.12%, 05/01/2036 144A | | 8,000,000 | | | | 7,995,625 |
| SLMA: | | | | | | |
| Ser. 1997-4, Class A2, FRN, 2.64%, 10/25/2010 | | 4,275,570 | | | | 4,330,377 |
| Ser. 1998-1, Class A2, FRN, 2.65%, 10/25/2011 | | 5,036,571 | | | | 5,092,613 |
| | | | | |
|
| Total Asset-Backed Securities (cost $17,295,972) | | | | | | 17,418,615 |
| | | | | |
|
| COMMERCIAL MORTGAGE-BACKED SECURITIES 2.7% | | | | | | |
| Fixed Rate 0.8% | | | | | | |
| Greenwich Capital Acceptance, Inc., Ser. 2001-ZC1A, Class A, 6.36%, | | | | | | |
| 06/14/2006 144A (h) | | 3,353,450 | | | | 3,470,423 |
| LB-UBS Commercial Mtge. Trust, Ser. 2000-C4, Class A1, 7.18%, | | | | | | |
| 09/15/2019 | | 437,240 | | | | 477,332 |
| Morgan Stanley Dean Witter Capital I, Inc., Ser. 1998-XL1, Class | | | | | | |
| A2, 6.45%, 06/03/2030 | | 800,000 | | | | 815,937 |
| | | | | |
|
| | | | | | | 4,763,692 |
| | | | | |
|
| Floating Rate 1.9% | | | | | | |
| Banc America Large Loan, Inc., Ser. 2001-7WTA, Class G, 3.34%, | | | | | | |
| 01/27/2006 144A (h) | | 8,000,000 | | | | 7,458,836 |
| Commerce 2003, Ser. 2003-FL9, Class E, 2.87%, 11/15/2015 144A | | 2,893,670 | | | | 2,911,666 |
| | | | | |
|
| | | | | | | 10,370,502 |
| | | | | |
|
| Total Commercial Mortgage-Backed Securities (cost $15,588,892) | | | | | | 15,134,194 |
| | | | | |
|
| CORPORATE BONDS 7.1% | | | | | | |
| FINANCIALS 5.8% | | | | | | |
| Capital Markets 2.0% | | | | | | |
| Goldman Sachs & Co., Inc., 6.125%, 02/15/2033 | | 5,000,000 | | | | 5,115,760 |
| Morgan Stanley Co., Inc., 7.25%, 04/01/2032 | | 5,000,000 | | | | 6,036,745 |
| | | | | |
|
| | | | | | | 11,152,505 |
| | | | | |
|
See Notes to Financial Statements
13
SCHEDULE OF INVESTMENTS continued
October 31, 2004 (unaudited)
| | | | | | |
| | | Principal | | | | |
| | | Amount | | | | Value |
|
| |
| CORPORATE BONDS continued | | | | | | |
| FINANCIALS continued | | | | | | |
| Commercial Banks 0.7% | | | | | | |
| Westpac Capital Trust IV, 5.26%, 12/29/2049 144A | | $ 4,000,000 | | $ | | 3,959,584 |
| | | | | |
|
| Diversified Financial Services 0.4% | | | | | | |
| Lehman Brothers Comml. Mtge. Trust, Ser. 2002-LLFA, Class J, 3.27%, | | | | | | |
| 06/14/2017 | | 2,000,000 | | | | 2,033,769 |
| | | | | |
|
| Insurance 0.9% | | | | | | |
| Berkshire Hathaway Finance Corp., 4.63%, 10/15/2013 144A | | 3,000,000 | | | | 3,017,502 |
| Xl Capital, Ltd., 5.25%, 09/15/2014 | | 2,000,000 | | | | 2,000,510 |
| | | | | |
|
| | | | | | | 5,018,012 |
| | | | | |
|
| Real Estate 1.0% | | | | | | |
| Weingarten Realty Investors, 5.25%, 03/02/2015 | | 5,600,000 | | | | 5,622,462 |
| | | | | |
|
| Thrifts & Mortgage Finance 0.8% | | | | | | |
| Meridian Capital Group LLC, 2.54%, 04/15/2009 144A | | 4,583,750 | | | | 4,587,160 |
| | | | | |
|
| TELECOMMUNICATION SERVICES 1.3% | | | | | | |
| Diversified Telecommunication Services 1.3% | | | | | | |
| Verizon Global Funding Corp., 7.75%, 12/01/2030 | | 6,000,000 | | | | 7,384,212 |
| | | | | |
|
| Total Corporate Bonds (cost $38,403,687) | | | | 39,757,704 |
| | | |
|
| REPERFORMING MORTGAGE-BACKED PASS-THROUGH SECURITIES 1.3% | | | | |
| FNMA: | | | | |
| Ser. 2002-T1, Class A3, 7.50%, 11/25/2031 ## | | 5,535,536 | | | | 6,006,057 |
| Ser. 2002-W3, Class A5, 7.50%, 01/25/2028 | | 1,047,528 | | | | 1,135,981 |
| | | | | |
|
| Total Reperforming Mortgage-Backed Pass-Through Securities | | | | | | |
| (cost $7,107,652) | | | | | | 7,142,038 |
| | | | | |
|
| U.S. GOVERNMENT & AGENCY OBLIGATIONS 19.0% | | | | | | |
| FHLB: | | | | | | |
| 3.625%, 11/14/2008 | | 10,000,000 | | | | 10,107,220 |
| 5.125%, 03/06/2006 ## | | 14,000,000 | | | | 14,483,812 |
| FHLMC: | | | | | | |
| 2.85%, 02/23/2007 ## | | 10,000,000 | | | | 9,955,160 |
| 2.875%, 09/15/2005 | | 5,500,000 | | | | 5,524,629 |
| 5.25%, 01/15/2006 | | 4,000,000 | | | | 4,130,360 |
| 5.50%, 07/15/2006 | | 15,000,000 | | | | 15,702,525 |
| 5.80%, 09/02/2008 | | 2,000,000 | | | | 2,173,364 |
| 6.00%, 06/15/2011 | | 4,000,000 | | | | 4,462,072 |
| FNMA: | | | | | | |
| 2.125%, 04/15/2006 (p) | | 15,000,000 | | | | 14,913,735 |
| 2.875%, 10/15/2005 | | 5,000,000 | | | | 5,026,690 |
| 5.125%, 01/02/2014 (p) | | 6,000,000 | | | | 6,175,956 |
| 6.08%, 01/01/2019 ## | | 12,391,181 | | | | 12,946,030 |
| | | | | |
|
| Total U.S. Government & Agency Obligations (cost $106,227,095) | | | | | | 105,601,553 |
| | | | | |
|
See Notes to Financial Statements
14
SCHEDULE OF INVESTMENTS continued
October 31, 2004 (unaudited)
| | | | | | |
| | | Principal | | | | |
| | | Amount | | | | Value |
|
| |
| U.S. TREASURY OBLIGATIONS 8.8% | | | | | | |
| U.S. Treasury Bonds, 5.375%, 02/15/2031 (p) | | $20,500,000 | | $ | | 22,272,143 |
| U.S. Treasury Notes: | | | | | | |
| 2.00%, 08/31/2005-07/15/2014 (p) | | 11,000,000 | | | | 11,347,191 |
| 3.50%, 11/15/2006 (p) | | 2,500,000 | | | | 2,546,777 |
| 3.875%, 05/15/2009 (p) | | 5,500,000 | | | | 5,656,409 |
| 4.375%, 05/15/2007 (p) | | 4,000,000 | | | | 4,164,532 |
| 4.625%, 05/15/2006 (p) | | 2,800,000 | | | | 2,895,049 |
| | | | | |
|
| Total U.S. Treasury Obligations (cost $47,516,760) | | | | 48,882,101 |
| | | |
|
| WHOLE LOAN SUBORDINATE COLLATERALIZED MORTGAGE OBLIGATIONS 2.2% | | | | |
| Fixed Rate 2.2% | | | | |
| Countrywide Alternative Loan Trust, Ser. 2004-2CB, Class M, 5.66%, | | | | |
| 03/25/2034 ## | | 11,847,907 | | | | 12,086,497 |
| Residential Funding Mtge. Securities, Ser. 1995-J4, Class 1, 6.53%, | | | | | | |
| 05/28/2025 (h) | | 316,999 | | | | 317,049 |
| | | | | |
|
| Total Whole Loan Subordinate Collateralized Mortgage Obligations | | | | |
| (cost $12,138,451) | | | | 12,403,546 |
| | | |
|
| WHOLE LOAN MORTGAGE-BACKED COLLATERALIZED MORTGAGE OBLIGATIONS 4.5% | | | | |
| Fixed Rate 1.3% | | | | |
| Countrywide Alternative Loan Trust, Ser. 2004-1T1, Class A6, 5.75%, | | | | |
| 02/25/2034 | | 5,000,000 | | | | 5,182,946 |
| PNC Mtge. Securities Corp., Ser. 1999-1, Class CB2, 6.80%, | | | | | | |
| 03/25/2029 | | 2,098,938 | | | | 2,097,432 |
| | | | | |
|
| | | | | | | 7,280,378 |
| | | | | |
|
| Floating Rate 3.2% | | | | | | |
| Countrywide Home Loan, Inc., Ser. 2004-R1, Class 1AF, 2.33%, | | | | | | |
| 11/25/2034 (h) | | 17,538,535 | | | | 17,543,339 |
| | | | | |
|
| Total Whole Loan Mortgage-Backed Collateralized Mortgage | | | | | | |
| Obligations (cost $24,829,688) | | | | | | 24,823,717 |
| | | | | |
|
| YANKEE OBLIGATIONS-CORPORATE 0.9% | | | | | | |
| FINANCIALS 0.9% | | | | | | |
| Insurance 0.9% | | | | | | |
| Aegon NV, 4.75%, 06/01/2013 (cost $5,116,100) | | 5,000,000 | | | | 5,001,560 |
| | | | | | | |
|
| | | Shares | | | | Value |
|
| |
| SHORT-TERM INVESTMENTS 21.2% | | | | | | |
| MUTUAL FUND SHARES 21.2% | | | | | | |
| Evergreen Institutional Money Market Fund ø ## | | 50,208,824 | | | | 50,208,824 |
| Navigator Prime Portfolio (pp) | | 67,611,456 | | | | 67,611,456 |
| | | | | |
|
| Total Short-Term Investments (cost $117,820,280) | | | | | | 117,820,280 |
| | | | | |
|
| Total Investments (cost $834,420,840) 150.9% | | | | | | 840,404,956 |
| Other Assets and Liabilities (50.9%) | | | | | | (283,471,022) |
| | | | | |
|
| Net Assets 100.0% | | | | $ | | 556,933,934 |
| | | | | |
|
See Notes to Financial Statements
15
SCHEDULE OF INVESTMENTS continued
October 31, 2004 (unaudited)
| | |
| 144A | | Security that may be sold to qualified institutional buyers under Rule 144A of the Securities Act of 1933, as amended. |
| | | This security has been determined to be liquid under the guidelines established by the Board of Trustees. |
| ## | | All or a portion of the security has been segregated for when-issued or delayed delivery securities. |
| (p) | | All or a portion of this security is on loan. |
| (h) | | No market quotation available. Valued at fair value as determined in good faith under procedures established by the |
| | | Board of Trustees. |
| # | | When-issued or delayed delivery security |
| ø | | Evergreen Investment Management Company, LLC is the investment advisor to both the Fund and the money market |
| | | fund. |
| (pp) | | Represents investment of cash collateral received from securities on loan. |
| |
| Summary of Abbreviations |
| FHLB | | Federal Home Loan Bank |
| FHLMC | | Federal Home Loan Mortgage Corp. |
| FNMA | | Federal National Mortgage Association |
| FRN | | Floating Rate Note |
| GNMA | | Government National Mortgage Association |
| SLMA | | Student Loan Marketing Association |
| TBA | | To Be Announced |
| | |
The following table shows the percent of total bonds
by credit quality based on Moody's and Standard & Poor's ratings as of |
| October 31, 2004: |
| |
| AAA | | 89.9% |
| AA | | 3.1% |
| A | | 5.7% |
| NR | | 1.3% |
| |
|
| | | 100.0% |
| | |
|
| |
The following table shows the percent of total bonds
by maturity as of October 31, 2004: |
| |
| Less than 1 year | | 1.6% |
| 1 to 3 year(s) | | 10.2% |
| 3 to 5 years | | 6.5% |
| 5 to 10 years | | 9.1% |
| 10 to 20 years | | 14.5% |
| 20 to 30 years | | 44.0% |
| Greater than 30 years | | 14.1% |
| |
|
| | | 100.0% |
| | |
|
See Notes to Financial Statements
16
STATEMENT OF ASSETS AND LIABILITIES
October 31, 2004 (unaudited)
| | | | |
| Assets | | | | |
| Investments in securities, at value (cost $834,420,840) including | | | | |
| $66,452,551 of securities loaned | | $ | | 840,404,956 |
| Principal paydown receivable | | | | 277,915 |
| Receivable for Fund shares sold | | | | 1,110,908 |
| Interest receivable | | | | 3,594,936 |
| Receivable for securities lending income | | | | 3,317 |
| Prepaid expenses and other assets | | | | 110,410 |
|
| Total assets | | | | 845,502,442 |
|
| Liabilities | | | | |
| Dividends payable | | | | 319,575 |
| Payable for securities purchased | | | | 220,354,093 |
| Payable for Fund shares redeemed | | | | 182,639 |
| Payable for securities on loan | | | | 67,611,456 |
| Advisory fee payable | | | | 18,488 |
| Distribution Plan expenses payable | | | | 6,013 |
| Due to other related parties | | | | 5,279 |
| Accrued expenses and other liabilities | | | | 70,965 |
|
| Total liabilities | | | | 288,568,508 |
|
| Net assets | | $ | | 556,933,934 |
|
| Net assets represented by | | | | |
| Paid-in capital | | $ | | 562,480,800 |
| Overdistributed net investment income | | | | (4,137,724) |
| Accumulated net realized losses on securities | | | | (7,393,258) |
| Net unrealized gains on securities | | | | 5,984,116 |
|
| Total net assets | | $ | | 556,933,934 |
|
| Net assets consists of | | | | |
| Class A | | $ | | 100,168,051 |
| Class B | | | | 31,616,413 |
| Class C | | | | 11,630,847 |
| Class I | | | | 413,518,623 |
|
| Total net assets | | $ | | 556,933,934 |
|
| Shares outstanding | | | | |
| Class A | | | | 9,886,815 |
| Class B | | | | 3,120,558 |
| Class C | | | | 1,147,988 |
| Class I | | | | 40,814,967 |
|
| Net asset value per share | | | | |
| Class A | | $ | | 10.13 |
| Class A - Offering price (based on sales charge of 4.75%) | | $ | | 10.64 |
| Class B | | $ | | 10.13 |
| Class C | | $ | | 10.13 |
| Class I | | $ | | 10.13 |
|
See Notes to Financial Statements
17
STATEMENT OF OPERATIONS
Six Months Ended October 31, 2004 (unaudited)
| | | | |
| Investment income | | | | |
| Interest | | $ | | 8,031,238 |
|
| Expenses | | | | |
| Advisory fee | | | | 1,134,885 |
| Distribution Plan expenses | | | | |
| Class A | | | | 154,825 |
| Class B | | | | 167,568 |
| Class C | | | | 63,548 |
| Administrative services fee | | | | 279,727 |
| Transfer agent fees | | | | 389,664 |
| Trustees' fees and expenses | | | | 8,495 |
| Printing and postage expenses | | | | 29,862 |
| Custodian and accounting fees | | | | 63,427 |
| Registration and filing fees | | | | 35,929 |
| Professional fees | | | | 11,349 |
| Other | | | | 6,572 |
|
| Total expenses | | | | 2,345,851 |
| Less: Expense reductions | | | | (1,501) |
|
| Net expenses | | | | 2,344,350 |
|
| Net investment income | | | | 5,686,888 |
|
| Net realized and unrealized gains or losses on securities | | | | |
| Net realized gains on securities | | | | 766,028 |
| Net change in unrealized gains or losses on securities | | | | 11,498,242 |
|
| Net realized and unrealized gains or losses on securities | | | | 12,264,270 |
|
| Net increase in net assets resulting from operations | | $ | | 17,951,158 |
|
See Notes to Financial Statements
18
STATEMENTS OF CHANGES IN NET ASSETS
| | | | | | | | |
| | | Six Months Ended | | | | |
| | | October 31, 2004 | | Year Ended |
| | | (unaudited) | | April 30, 2004 |
|
| Operations | | | | | | | | |
| Net investment income | | | | $ 5,686,888 | | | | $ 13,186,747 |
| Net realized gains on securities | | | | 766,028 | | | | 8,184,552 |
| Net change in unrealized gains or | | | | | | | | |
| losses on securities | | | | 11,498,242 | | | | (18,847,170) |
|
| Net increase in net assets resulting | | | | | | | | |
| from operations | | | | 17,951,158 | | | | 2,524,129 |
|
| Distributions to shareholders from | | | | | | | | |
| Net investment income | | | | | | | | |
| Class A | | | | (1,488,202) | | | | (3,670,702) |
| Class B | | | | (365,859) | | | | (1,062,558) |
| Class C | | | | (138,850) | | | | (424,188) |
| Class I | | | | (6,520,821) | | | | (14,804,338) |
|
| Total distributions to shareholders | | | | (8,513,732) | | | | (19,961,786) |
|
| | | Shares | | | | Shares | | |
| Capital share transactions | | | | | | | | |
| Proceeds from shares sold | | | | | | | | |
| Class A | | 338,964 | | 3,383,849 | | 2,075,217 | | 21,083,132 |
| Class B | | 120,208 | | 1,196,100 | | 556,807 | | 5,657,033 |
| Class C | | 39,933 | | 398,551 | | 296,648 | | 2,997,880 |
| Class I | | 2,966,938 | | 29,665,799 | | 11,828,100 | | 120,167,632 |
|
| | | | | 34,644,299 | | | | 149,905,677 |
|
| Net asset value of shares issued in | | | | | | | | |
| reinvestment of distributions | | | | | | | | |
| Class A | | 108,508 | | 1,086,252 | | 259,406 | | 2,625,029 |
| Class B | | 25,691 | | 257,153 | | 73,156 | | 740,430 |
| Class C | | 9,365 | | 93,747 | | 27,341 | | 276,766 |
| Class I | | 516,849 | | 5,174,686 | | 1,203,602 | | 12,176,796 |
|
| | | | | 6,611,838 | | | | 15,819,021 |
|
| Automatic conversion of Class B | | | | | | | | |
| shares to Class A shares | | | | | | | | |
| Class A | | 96,718 | | 964,205 | | 337,382 | | 3,420,150 |
| Class B | | (96,718) | | (964,205) | | (337,382) | | (3,420,150) |
|
| | | | | 0 | | | | 0 |
|
| Payment for shares redeemed | | | | | | | | |
| Class A | | (1,620,002) | | (16,164,223) | | (6,063,799) | | (61,384,951) |
| Class B | | (671,148) | | (6,675,984) | | (2,361,200) | | (23,869,116) |
| Class C | | (327,980) | | (3,271,825) | | (1,443,842) | | (14,577,107) |
| Class I | | (5,583,404) | | (55,652,500) | | (22,014,410) | | (222,776,501) |
|
| | | | | (81,764,532) | | | | (322,607,675) |
|
| Net asset value of shares issued in | | | | | | | | |
| acquisitions | | | | | | | | |
| Class A | | 0 | | 0 | | 20,363 | | 208,806 |
| Class I | | 0 | | 0 | | 3,973,896 | | 40,749,601 |
|
| | | | | 0 | | | | 40,958,407 |
|
| Net decrease in net assets resulting | | | | | | | | |
| from capital share transactions | | | | (40,508,395) | | | | (115,924,570) |
|
| Total decrease in net assets | | | | (31,070,969) | | | | (133,362,227) |
| Net assets | | | | | | | | |
| Beginning of period | | | | 588,004,903 | | | | 721,367,130 |
|
| End of period | | | | $ 556,933,934 | | | | $ 588,004,903 |
|
| Overdistributed net investment income | | | | $ (4,137,724) | | | | $ (400,663) |
|
See Notes to Financial Statements
19
STATEMENT OF CASH FLOWS
Six Months Ended October 31, 2004 (unaudited)
| | | | |
|
| Increase in Cash | | | | |
| Cash Flows from Operating Activities: | | | | |
| Net increase in net assets from operations | | $ | | 17,951,158 |
| Adjustments to reconcile net increase in net assets from | | | | |
| operations to net cash provided by operating activities: | | | | |
| Purchase of investment securities including amortization of premium | | | | |
| and accretion of discount on long-term securities | | | | (554,217,217) |
| Proceeds from disposition of investment securities including prinicipal paydowns | | | | 554,762,752 |
| Purchase of short-term investment securities, net | | | | 99,369,241 |
| Decrease in interest receivable | | | | 51,454 |
| Decrease in receivable for securities sold | | | | 7,887,047 |
| Increase in receivable for Fund shares sold | | | | (109,396) |
| Decrease in other assets | | | | 33,228 |
| Decrease in payable for securities purchased | | | | (65,438,453) |
| Decrease in payable for Fund shares redeemed | | | | (468,105) |
| Decrease in accrued expenses | | | | (29,429) |
| Unrealized appreciation on investments | | | | (11,498,242) |
| Net realized gain from investments | | | | 766,028 |
|
| Net cash provided by operating activities | | | | 49,060,066 |
|
| Cash Flows from Financing Activities: | | | | |
| Decrease in additional paid-in capital | | | | (47,120,233) |
| Cash distributions paid | | | | (1,939,833) |
|
| Net cash used in financing activities | | | | (49,060,066) |
|
| Net increase in cash | | $ | | 0 |
|
| Cash: | | | | |
| Beginning of year | | $ | | 0 |
|
| End of year | | $ | | 0 |
|
See Notes to Financial Statements
20
NOTES TO FINANCIAL STATEMENTS (unaudited)
1. ORGANIZATION
Evergreen U.S. Government Fund (the "Fund") is a diversified series of Evergreen Fixed Income Trust (the "Trust"), a Delaware statutory trust organized on September 18, 1997. The Trust is an open-end management investment company registered under the Investment Company Act of 1940, as amended (the "1940 Act").
The Fund offers Class A, Class B, Class C and ("Class I") shares. Class A shares are sold with a front-end sales charge. However, Class A share investments of $1 million or more are not subject to a front-end sales charge but will be subject to a contingent deferred sales charge of 1.00% upon redemption within one year. Class B shares are sold without a front-end sales charge but are subject to a contingent deferred sales charge that is payable upon redemption and decreases depending on how long the shares have been held. Effective February 2, 2004, Class C shares are no longer sold with a front-end sales charge but are still subject to a contingent deferred sales charge that is payable upon redemption within one year. Class I shares are sold without a front-end sales charge or contingent deferred sales charge. Each class of shares, except Class I shares, pays an ongoing distribution fee.
2. SIGNIFICANT ACCOUNTING POLICIES
The following is a summary of significant accounting policies consistently followed by the Fund in the preparation of its financial statements. The policies are in conformity with generally accepted accounting principles in the United States of America, which require management to make estimates and assumptions that affect amounts reported herein. Actual results could differ from these estimates.
a. Valuation of investments
Portfolio debt securities acquired with more than 60 days to maturity are valued at prices obtained from an independent pricing service which takes into consideration such factors as similar security prices, yields, maturities, liquidity and ratings. Securities for which valuations are not readily available from an independent pricing service may be valued by brokers which use prices provided by market makers or estimates of market value obtained from yield data relating to investments or securities with similar characteristics.
Short-term securities with remaining maturities of 60 days or less at the time of purchase are valued at amortized cost, which approximates market value.
Investments in other mutual funds are valued at net asset value. Securities for which market quotations are not readily available or not reflective of current market value are valued at fair value as determined in good faith, according to procedures approved by the Board of Trustees.
b. When-issued and delayed delivery transactions
The Fund records when-issued or delayed delivery securities as of trade date and maintains security positions such that sufficient liquid assets will be available to make payment for the securities purchased. Securities purchased on a when-issued or delayed delivery basis are marked-to-market daily and begin earning interest on the settlement date. Losses may occur on these transactions due to changes in market conditions or the failure of counterparties to perform under the contract.
21
NOTES TO FINANCIAL STATEMENTS (unaudited) continued
c. Securities lending
The Fund may lend its securities to certain qualified brokers in order to earn additional income. The Fund receives compensation in the form of fees or interest earned on the investment of any cash collateral received. The Fund also continues to receive interest and dividends on the securities loaned. The Fund receives collateral in the form of cash or securities with a market value at least equal to the market value of the securities on loan, including accrued. In the event of default or bankruptcy by the borrower, the Fund could experience delays and costs in recovering the loaned securities or in gaining access to the collateral. The Fund has the right under the lending agreement to recover the securities from the borrower on demand.
d. Dollar roll transactions
The Fund may enter into dollar roll transactions with respect to mortgage-backed securities. In a dollar roll transaction, the Fund sells mortgage-backed securities to financial institutions and simultaneously agrees to accept substantially similar (same type, coupon and maturity) securities at a later date at an agreed upon price. The Fund will use the proceeds generated from the transactions to invest in short-term investments, which may enhance the Fund's current yield and total return. The Fund accounts for dollar roll transactions as purchases and sales.
e. Security transactions and investment income
Security transactions are recorded on trade date. Realized gains and losses are computed using the specific cost of the security sold. Interest income is recorded on the accrual basis and includes accretion of discounts and amortization of premiums.
f. Federal taxes
The Fund intends to continue to qualify as a regulated investment company and distribute all of its taxable income, including any net capital gains (which have already been offset by available capital loss carryovers). Accordingly, no provision for federal taxes is required.
g. Distributions
Distributions to shareholders from net investment income are accrued daily and paid monthly. Distributions from net realized gains, if any, are recorded on the ex-dividend date. Such distributions are determined in conformity with income tax regulations, which may differ from generally accepted accounting principles.
h. Class allocations
Income, common expenses and realized and unrealized gains and losses are allocated to the classes based on the relative net assets of each class. Distribution fees, if any, are calculated daily at the class level based on the appropriate net assets of each class and the specific expense rates applicable to each class.
3. ADVISORY FEE AND OTHER TRANSACTIONS WITH AFFILIATES
Evergreen Investment Management Company, LLC ("EIMC"), an indirect, wholly-owned subsidiary of Wachovia Corporation ("Wachovia"), is the investment advisor to the Fund and is paid an annual fee starting at 0.42% and declining to 0.35% as average daily net assets increase.
22
NOTES TO FINANCIAL STATEMENTS (unaudited) continued
From time to time, EIMC may voluntarily or contractually waive its fee and/or reimburse expenses in order to limit operating expenses. For fee waivers and/or reimbursements made after January 1, 2003, EIMC may recoup certain amounts waived and/or reimbursed up to a period of three years following the end of the fiscal year in which the fee waivers and/or reimbursements were made.
Evergreen Investment Services, Inc. ("EIS"), an indirect, wholly-owned subsidiary of Wachovia, is the administrator to the Fund. As administrator, EIS provides the Fund with facilities, equipment and personnel and is paid an annual rate determined by applying percentage rates to the aggregate average daily net assets of the Evergreen funds (excluding money market funds), starting at 0.10% and declining to 0.05% as the aggregate average daily net assets of the Evergreen funds (excluding money market funds) increase.
Evergreen Service Company, LLC ("ESC"), an indirect, wholly-owned subsidiary of Wachovia, is the transfer and dividend disbursing agent for the Fund. ESC receives account fees that vary based on the type of account held by the shareholders in the Fund. For the six months ended October 31, 2004, the transfer agent fees were equivalent to an annual rate of 0.14% of the Fund's average daily net assets
4. DISTRIBUTION PLANS
EIS also serves as distributor of the Fund's shares. The Fund has adopted Distribution Plans, as allowed by Rule 12b-1 of the 1940 Act, for each class of shares, except Class I. Under the Distribution Plans, distribution fees are paid at an annual rate of 0.30% of the average daily net assets for Class A shares and 1.00% of the average daily net assets for each of Class B and Class C shares.
For the six months ended October 31, 2004, EIS received $2,194 from the sale of Class A shares and $65,211 and $3,992 in contingent deferred sales charges from redemptions of Class B and Class C shares, respectively.
5. ACQUISITIONS
Effective at the close of business on July 11, 2003, the Fund acquired the net assets of Evergreen Offit U.S. Government Securities Fund in a tax-free exchange for Class I shares of the Fund. Shares were issued to Class I shares of Evergreen Offit U.S. Government Securities Fund at an exchange ratio of 1.01 for Class I shares of the Fund. On the same date, the Fund also acquired the net assets of Evergreen Offit Mortgage Securities Fund in a tax-free exchange for Class A and Class I shares of the Fund. Shares were issued to Class A and Class I shares of Evergreen Offit Mortgage Securities Fund at an exchange ratio of 0.98 and 0.98 for Class A and Class I shares, respectively, of the Fund. The aggregate net assets of the Fund immediately prior to the acquisitions were $703,371,196.
23
NOTES TO FINANCIAL STATEMENTS (unaudited) continued
The value of net assets acquired, unrealized appreciation acquired and number of shares issued were as follows:
| | | | | | |
| | | Value of Net | | Unrealized | | Number of |
| Acquired Fund | | Assets Acquired | | Appreciation | | Shares Issued |
|
| Evergreen Offit | | $20,074,892 | | $316,122 | | 1,957,708 Class I |
| U.S. Government | | | | | | |
Securities Fund
| | | | | | |
| Evergreen Offit | | $20,883,515 | | $183,943 | | 20,363 Class A |
| Mortgage Securities | | | | | | 2,016,188 Class I |
| Fund | | | | | | |
|
The aggregate net assets of the Fund immediately after these acquisitions were $744,329,603.
6. SECURITIES TRANSACTIONS
Cost of purchases and proceeds from sales of investment securities (excluding short-term securities and mortgage dollar roll transactions) were as follows for the six months ended October 31, 2004:
| | | | | | |
| Costof Purchases | | Proceeds from Sales |
| |
|
| U.S. | | Non-U.S. | | U.S. | | Non-U.S. |
| Government | | Government | | Government | | Government |
|
| $481,129,797 | | $74,131,336 | | $438,670,928 | | $64,701,443 |
|
During the six months ended October 31, 2004, the Fund loaned securities to certain brokers. At October 31, 2004, the value of securities on loan and the value of collateral amounted to $66,452,551 and $67,611,456, respectively. During the six months ended October 31, 2004, the Fund earned $61,467 in income from securities lending which is included in interest income on the Statement of Operations.
On October 31, 2004 the aggregate cost of securities for federal income tax purposes was $835,157,247. The gross unrealized appreciation and depreciation on securities based on tax cost was $8,139,870 and $2,892,161, respectively, with a net unrealized appreciation of $5,247,709.
As of April 30, 2004, the Fund had $7,298,569 in capital loss carryovers for federal income tax purposes expiring as follows:
| | | | | | | | |
| Expiration |
|
| 2005 | | 2007 | | 2008 | | 2009 | | 2010 |
|
| $724,690 | | $1,281,377 | | $4,853,705 | | $437,595 | | $1,202 |
|
Certain portions of the capital loss carryovers of the Fund were assumed as a result of acquisitions.
24
NOTES TO FINANCIAL STATEMENTS (unaudited) continued
7. INTERFUND LENDING
Pursuant to an Exemptive Order issued by the SEC, the Fund may participate in an interfund lending program with certain funds in the Evergreen fund family. This program allows the Fund to borrow from, or lend money to, other participating funds. During the six months ended October 31, 2004, the Fund did not participate in the interfund lending program.
8. EXPENSE REDUCTIONS
Through expense offset arrangements with ESC and the Fund's custodian, a portion of fund expenses has been reduced.
9. DEFERRED TRUSTEES' FEES
Each Trustee of the Fund may defer any or all compensation related to performance of their duties as Trustees. The Trustees' deferred balances are allocated to deferral accounts, which are included in the accrued expenses for the Fund. The investment performance of the deferral accounts are based on the investment performance of certain Evergreen funds. Any gains earned or losses incurred in the deferral accounts are reported in the Fund's Trustees' fees and expenses. At the election of the Trustees, the deferral account will be paid either in one lump sum or in quarterly installments for up to ten years.
10. FINANCING AGREEMENT
The Fund and certain other Evergreen funds share in a $150 million unsecured revolving credit commitment for temporary and emergency purposes, including the funding of redemptions, as permitted by each participating fund's borrowing restrictions. Borrowings under this facility bear interest at 0.50% per annum above the Federal Funds rate. All of the participating funds are charged an annual commitment fee of 0.09% of the unused balance, which is allocated pro rata. During the six months ended October 31, 2004, the Fund had no borrowings under this agreement.
11. LITIGATION
From time to time, the Fund and EIMC are involved in various legal actions in the normal course of business. In EIMC's opinion, based upon the opinions of counsel, the Fund is not involved in any legal action that will have a material effect on the Fund's financial position and results of operations.
12. REGULATORY MATTERS
Since September 2003, governmental and self-regulatory authorities have instituted numerous ongoing investigations of various practices in the mutual fund industry, including investigations relating to revenue sharing, market-timing, late trading and record retention, among other things. The investigations cover investment advisors, distributors and transfer agents to mutual funds, as well as other firms. EIMC, EIS and ESC (collectively, "Evergreen") have received subpoenas and other requests for documents and testimony relating to these investigations, are endeavoring to comply with those requests, and are cooperating with the investigations. Evergreen is continuing its own internal review of policies, practices, procedures and personnel, and is taking remedial action where appropriate.
25
NOTES TO FINANCIAL STATEMENTS (unaudited) continued
In connection with one of these investigations, on July 28, 2004, the staff of the Securities and Exchange Commission ("SEC") informed Evergreen that the staff intends to recommend to the SEC that it institute an enforcement action against Evergreen. The SEC staff's proposed allegations relate to (i) an arrangement pursuant to which a broker at one of EIMC's affiliated broker-dealers had been authorized, apparently by an EIMC officer (no longer with EIMC), to engage in short-term trading, on behalf of a client, in Evergreen Mid Cap Growth Fund (formerly Evergreen Small Company Growth Fund and prior to that, known as Evergreen Emerging Growth Fund) during the period from December 2000 through April 2003, in excess of the limitations set forth in this fund's prospectus, (ii) short-term trading from September 2001 through January 2003, by a former Evergreen portfolio manager of Evergreen Precious Metals Fund, a fund he managed at the time, (iii) the sufficiency of systems for monitoring exchanges and enforcing exchange limitations as stated in each fund's prospectuses, and (iv) the adequacy of e-mail retention practices. In connection with the activity in Evergreen Mid Cap Growth Fund, EIMC reimbursed this fund $378,905, plus an additional $25,242, representing what EIMC calculated at that time to be the client's net gain and the fees earned by EIMC and the expenses incurred by this fund on the client's account. In connection with the activity in Evergreen Precious Metals Fund, EIMC reimbursed this fund $70,878, plus an additional $3,075, representing what EIMC calculated at that time to be the portfolio manager's net gain and the fees earned by EIMC and expenses incurred by this fund on the portfolio manager's account. Evergreen currently intends to make a written Wells submission explaining why it believes that no such enforcement action should be instituted, and Evergreen is engaging in discussions with the staff of the SEC concerning its recommendation.
Any resolution of these matters with regulatory authorities may include, but not be limited to, sanctions, penalties or injunctions regarding Evergreen, restitution to mutual fund shareholders and/or other financial penalties and structural changes in the governance or management of Evergreen's mutual fund business. Any penalties or restitution will be paid by Evergreen and not by the Evergreen funds.
Evergreen does not believe the foregoing investigations and action will have a material adverse impact on the Evergreen funds. There can be no assurance, however, that these matters and any publicity surrounding or resulting from them will not result in reduced sales or increased redemptions of fund shares, which could increase fund transaction costs or operating expenses, or have other adverse consequences on the Evergreen funds.
26
This page left intentionally blank
27
TRUSTEES AND OFFICERS
TRUSTEES1
| | |
| Charles A. Austin III | | Principal occupations: Investment Counselor, Anchor Capital Advisors, Inc. (investment advice); |
| Trustee | | Director, The Andover Companies (insurance); Trustee, Arthritis Foundation of New England; |
| DOB: 10/23/1934 | | Director, The Francis Ouimet Society; Former Director, Health Development Corp. (fitness- |
| Term of office since: 1991 | | wellness centers); Former Director, Mentor Income Fund, Inc.; Former Trustee, Mentor Funds and |
| | | Cash Resource Trust; Former Investment Counselor, Appleton Partners, Inc. (investment advice); |
| Other directorships: None | | Former Director, Executive Vice President and Treasurer, State Street Research & Management |
| | | Company (investment advice) |
|
| |
| Shirley L. Fulton | | Principal occupations: Partner, Helms, Henderson & Fulton, P.A. (law firm); Retired Senior |
| Trustee | | Resident Superior Court Judge, 26th Judicial District, Charlotte, NC |
| DOB: 1/10/1952 | | |
| Term of office since: 2004 | | |
| Other directorships: None | | |
|
| |
| K. Dun Gifford | | Principal occupations: Chairman and President, Oldways Preservation and Exchange Trust |
| Trustee | | (education); Trustee, Treasurer and Chairman of the Finance Committee, Cambridge College; |
| DOB: 10/23/1938 | | Former Chairman of the Board, Director, and Executive Vice President, The London Harness |
| Term of office since: 1974 | | Company (leather goods purveyor); Former Director, Mentor Income Fund, Inc.; Former Trustee, |
| | | Mentor Funds and Cash Resource Trust |
| Other directorships: None | | |
|
| |
| Dr. Leroy Keith, Jr. | | Principal occupations: Partner, Stonington Partners, Inc. (private investment firm); Trustee of |
| Trustee | | Phoenix Series Fund, Phoenix Multi-Portfolio Fund, and The Phoenix Big Edge Series Fund; |
| DOB: 2/14/1939 | | Former Chairman of the Board and Chief Executive Officer, Carson Products Company |
| Term of office since: 1983 | | (manufacturing); Director, Obagi Medical Products Co.; Director, Lincoln Educational Services; |
| | | Director, Diversapack Co.; Former President, Morehouse College; Former Director, Mentor |
| Other directorships: Trustee, | | Income Fund, Inc.; Former Trustee, Mentor Funds and Cash Resource Trust |
| Phoenix Series Fund, Phoenix | | |
| Multi-Portfolio Fund, and The | | |
| Phoenix Big Edge Series Fund | | |
|
| |
| Gerald M. McDonnell | | Principal occupations: Manager of Commercial Operations, SMI STEEL Co. – South Carolina |
| Trustee | | (steel producer); Former Sales and Marketing Management, Nucor Steel Company; Former |
| DOB: 7/14/1939 | | Director, Mentor Income Fund, Inc.; Former Trustee, Mentor Funds and Cash Resource Trust |
| Term of office since: 1988 | | |
| Other directorships: None | | |
|
| |
| William Walt Pettit | | Principal occupations: Partner and Vice President, Kellam & Pettit, P.A. (law firm); Former |
| Trustee | | Director, Mentor Income Fund, Inc.; Former Trustee, Mentor Funds and Cash Resource Trust |
| DOB: 8/26/1955 | | |
| Term of office since: 1984 | | |
| Other directorships: None | | |
|
| |
| David M. Richardson | | Principal occupations: President, Richardson, Runden LLC (executive recruitment business |
| Trustee | | development/consulting company); Consultant, Kennedy Information, Inc. (executive |
| DOB: 9/19/1941 | | recruitment information and research company); Consultant, AESC (The Association of Retained |
| Term of office since: 1982 | | Executive Search Consultants); Trustee, NDI Technologies, LLP (communications); Director, J&M |
| | | Cumming Paper Co. (paper merchandising); Former Vice Chairman, DHR International, Inc. |
| Other directorships: None | | (executive recruitment); Former Director, Mentor Income Fund, Inc.; Former Trustee, Mentor |
| | | Funds and Cash Resource Trust |
|
| |
| Dr. Russell A. Salton III | | Principal occupations: President/CEO, AccessOne MedCard; Former Medical Director, Healthcare |
| Trustee | | Resource Associates, Inc.; Former Medical Director, U.S. Health Care/Aetna Health Services; |
| DOB: 6/2/1947 | | Former Director, Mentor Income Fund, Inc.; Former Trustee, Mentor Funds and Cash Resource |
| Term of office since: 1984 | | Trust |
| Other directorships: None | | |
|
28
TRUSTEES AND OFFICERS continued
| | |
| Michael S. Scofield | | Principal occupations: Attorney, Law Offices of Michael S. Scofield; Former Director, Mentor |
| Trustee | | Income Fund, Inc.; Former Trustee, Mentor Funds and Cash Resource Trust |
| DOB: 2/20/1943 | | |
| Term of office since: 1984 | | |
| Other directorships: None | | |
|
| |
| Richard J. Shima | | Principal occupations: Independent Consultant; Director, Trust Company of CT; Trustee, Saint |
| Trustee | | Joseph College (CT); Director, Hartford Hospital; Trustee, Greater Hartford YMCA; Former |
| DOB: 8/11/1939 | | Director, Enhance Financial Services, Inc.; Former Director, Old State House Association; Former |
| Term of office since: 1993 | | Director of CTG Resources, Inc. (natural gas); Former Director, Mentor Income Fund, Inc.; Former |
| | | Trustee, Mentor Funds and Cash Resource Trust |
| Other directorships: None | | |
|
| |
| Richard K. Wagoner, CFA 2 | | Principal occupations: Member and Former President, North Carolina Securities Traders |
| Trustee | | Association; Member, Financial Analysts Society; Former Consultant to the Boards of Trustees of |
| DOB: 12/12/1937 | | the Evergreen funds; Former Trustee, Mentor Funds and Cash Resource Trust |
| Term of office since: 1999 | | |
| Other directorships: None | | |
|
| |
| |
| OFFICERS | | |
| |
| Dennis H. Ferro 3 | | Principal occupations: President and Chief Executive Officer, Evergreen Investment Company, |
| President | | Inc. and Executive Vice President, Wachovia Bank, N.A.; former Chief Investment Officer, |
| DOB: 6/20/1945 | | Evergreen Investment Company, Inc. |
| Term of office since: 2003 | | |
|
| |
| Carol Kosel4 | | Principal occupations: Senior Vice President, Evergreen Investment Services, Inc. |
| Treasurer | | |
| DOB: 12/25/1963 | | |
| Term of office since: 1999 | | |
|
| |
| Michael H. Koonce 4 | | Principal occupations: Senior Vice President and General Counsel, Evergreen Investment |
| Secretary | | Services, Inc.; Senior Vice President and Assistant General Counsel, Wachovia Corporation |
| DOB: 4/20/1960 | | |
| Term of office since: 2000 | | |
|
| |
| James Angelos4 | | Principal occupations: Chief Compliance Officer and Senior Vice President Evergreen Funds; |
| Chief Compliance Officer | | former Director of Compliance, Evergreen Investment Services, Inc. |
| DOB: 9/2/1947 | | |
| Term of office since: 2004 | | |
|
1 Each Trustee serves until a successor is duly elected or qualified or until his death, resignation, retirement or removal from office. Each Trustee oversees 93 Evergreen funds. Correspondence for each Trustee may be sent to Evergreen Board of Trustees, P.O. Box 20083, Charlotte, North Carolina 28202.
2 Mr. Wagoner is an "interested person" of the Fund because of his ownership of shares in Wachovia Corporation, the parent to the Fund's investment advisor.
3 The address of the Officer is 401 S. Tryon Street, 20th Floor, Charlotte, NC 28288.
4 The address of the Officer is 200 Berkeley Street, Boston, MA 02116.
Additional information about the Fund's Board of Trustees and Officers can be found in the Statement of Additional Information (SAI) and is available upon request without charge by calling 800.343.2898.
29
564359 rv2 12/2004
Item 2 - Code of Ethics
(a) The Registrant has adopted a code of ethics that applies to the Registrant's principal executive officer and principal financial officer.
(b) During the period covered by this report, there were no amendments to the provisions of the code of ethics adopted in 2.(a) above.
(c) During the period covered by this report, there were no implicit or explicit waivers to the provisions of the code of ethics adopted in 2.(a) above.
Item 3 - Audit Committee Financial Expert
Charles A. Austin III and K. Dun Gifford have been determined by the Registrant's Board of Trustees to be audit committee financial experts within the meaning of Section 407 of the Sarbanes-Oxley Act. These financial experts are independent of management.
Items 4 – Principal Accountant Fees and Services
Applicable for annual reports only.
Items 5 – Audit Committee of Listed Registrants
If applicable, not applicable at this time. Applicable for annual reports covering periods ending on or after the compliance date for the listing standards applicable to the particular issuer. Listed issuers must be in compliance with the new listing rules by the earlier of the registrant's first annual shareholders meeting after January 15, 2004 or October 31, 2004.
Item 6 – Schedule of Investments
Please see schedule of investments contained in the Report to Stockholders included under Item 1 of this Form N-CSR.
Item 7 – Disclosure of Proxy Voting Policies and Procedures for Closed-End Management Investment Companies.
If applicable, not applicable at this time. Applicable for annual reports filed on or after July 1, 2003.
Item 8 – Purchases of Equity Securities by Closed-End Management Investment Company and Affiliated Purchasers
Not applicable at this time. Applicable for closed-end funds only.
Item 9 – Submission of Matters to a Vote of Security Holders
If applicable, not applicable at this time.
Item 10 - Controls and Procedures
(a) The Registrant's Principal Executive Officer and Principal Financial Officer have evaluated the Registrant's disclosure controls and procedures within 90 days of this filing and have concluded that the Registrant's disclosure controls and procedures were effective, as of that date, in ensuring that information required to be disclosed by the Registrant in this Form N-CSR was recorded, processed, summarized, and reported timely.
(b) There were no significant changes in the Registrant's internal controls or other factors that could significantly affect these controls subsequent to the date of their evaluation, including any corrective actions with regard to significant deficiencies and material weaknesses.
Item 11 - Exhibits
File the exhibits listed below as part of this Form. Letter or number the exhibits in the sequence indicated.
(a) Any code of ethics, or amendment thereto, that is the subject of the disclosure required by Item 2, to the extent that the registrant intends to satisfy the Item 2 requirements through filing of an exhibit.
(b)(1) Separate certifications for the Registrant's principal executive officer and principal financial officer, as required by Section 302 of the Sarbanes-Oxley Act of 2002 and Rule 30a-2(a) under the Investment Company Act of 1940, are attached as EX99.CERT.
(b)(2) Separate certifications for the Registrant's principal executive officer and principal financial officer, as required by Section 1350 of Title 18 of United States Code, as adopted pursuant to Section 906 of the Sarbanes-Oxley Act of 2002, and Rule 30a-2(b) under the Investment Company Act of 1940, are attached as EX99.906CERT. The certifications furnished pursuant to this paragraph are not deemed to be "filed" for purposes of Section 18 of the Securities Exchange Act of 1934, or otherwise subject to the liability of that section. Such certifications are not deemed to be incorporated by reference into any filing under the Securities Act of 1933 or the Securities Exchange Act of 1934, except to the extent that the Registrant specifically incorporates them by reference.
Pursuant to the requirements of the Securities Exchange Act of 1934 and the Investment Company Act of 1940, the Registrant has duly caused this report to be signed on its behalf by the undersigned, thereunto duly authorized.
Evergreen Fixed Income Trust
By: _______________________
Dennis H. Ferro,
Principal Executive Officer
Date: 12/29/2004
Pursuant to the requirements of the Securities Exchange Act of 1934 and the Investment Company Act of 1940, this report has been signed below by the following persons on behalf of the Registrant and in the capacities and on the dates indicated.
By: _______________________
Dennis H. Ferro,
Principal Executive Officer
Date: 12/29/2004
By: ________________________
Carol A. Kosel
Principal Financial Officer
Date: 12/29/2004