| OMB APPROVAL |
OMB Number: 3235-0570 Expires: September 30, 2007 Estimated average burden hours per response: 19.4 |
UNITED STATES
SECURITIES AND EXCHANGE COMMISSION
Washington, D.C. 20549
FORM N-CSRS
CERTIFIED SHAREHOLDER REPORT OF REGISTERED MANAGEMENT INVESTMENT COMPANIES
Investment Company Act file number 811-08415
Evergreen Fixed Income Trust
_____________________________________________________________
(Exact name of registrant as specified in charter)
200 Berkeley Street Boston, Massachusetts 02116
_____________________________________________________________
(Address of principal executive offices) (Zip code)
Michael H. Koonce, Esq. 200 Berkeley Street Boston, Massachusetts 02116
____________________________________________________________
(Name and address of agent for service)
Registrant's telephone number, including area code: (617) 210-3200
Date of fiscal year end: Registrant is making a semi-annual filing for four of its series, Evergreen High Yield Bond Fund, Evergreen Institutional Mortgage Portfolio, Evergreen Strategic Income Fund, and Evergreen U.S. Government Fund, for the six months ended October 31, 2005. These four series have an April 30 fiscal year end.
Date of reporting period: October 31, 2005
Item 1 - Reports to Stockholders.
Evergreen High Yield Bond Fund

| table of contents |
| 1 | | LETTER TO SHAREHOLDERS |
| 4 | | FUND AT A GLANCE |
| 6 | | ABOUT YOUR FUND’S EXPENSES |
| 7 | | FINANCIAL HIGHLIGHTS |
| 11 | | SCHEDULE OF INVESTMENTS |
| 20 | | STATEMENT OF ASSETS AND LIABILITIES |
| 21 | | STATEMENT OF OPERATIONS |
| 22 | | STATEMENTS OF CHANGES IN NET ASSETS |
| 23 | | NOTES TO FINANCIAL STATEMENTS |
| 28 | | ADDITIONAL INFORMATION |
| 32 | | TRUSTEES AND OFFICERS |
This semiannual report must be preceded or accompanied by a prospectus of the Evergreen fund contained herein. The prospectus contains more complete information, including fees and expenses, and should be read carefully before investing or sending money.
The fund will file its complete schedule of portfolio holdings with the SEC for the first and third quarters of each fiscal year on Form N-Q. The fund’s Form N-Q will be available on the SEC’s Web site at http://www.sec.gov. In addition, the fund’s Form N-Q may be reviewed and copied at the SEC’s Public Reference Room in Washington, D.C. Information on the operation of the Public Reference Room may be obtained by calling 800.SEC.0330.
A description of the fund’s proxy voting policies and procedures, as well as information regarding how the fund voted proxies relating to portfolio securities during the most recent 12-month period ended June 30, is available by visiting our Web site at EvergreenInvestments.com or by visiting the SEC’s Web site at http://www.sec.gov. The fund’s proxy voting policies and procedures are also available without charge, upon request, by calling 800.343.2898.
| Mutual Funds: | | | | |
| NOT FDIC INSURED | | MAY LOSE VALUE | | NOT BANK GUARANTEED |
Evergreen InvestmentsSM is a service mark of Evergreen Investment Management Company, LLC.
Copyright 2005, Evergreen Investment Management Company, LLC.
Evergreen Investment Management Company, LLC is a subsidiary of Wachovia
Corporation and is an affiliate of Wachovia Corporation's other Broker Dealer subsidiaries.
Evergreen mutual funds are distributed by Evergreen Investment Services, Inc.
200 Berkeley Street, Boston, MA 02116
LETTER TO SHAREHOLDERS
December 2005

Dennis H. Ferro
President and Chief Executive Officer
Dear Shareholder,
We are pleased to provide the semiannual report for the Evergreen High Yield Bond Fund, which covers the six-month period ended October 31, 2005.
Fixed income investors had to endure a variety of challenges over the past six months. Moderating economic growth, surging energy prices and tighter monetary policy led the list of concerns, while the terrorist bombings in London and credit downgrades in the auto sector further pressured market sentiment. In addition, Hurricane Katrina devastated much of the gulf region and inflation fears grew with the prospect of more government spending. While the importance of asset allocation becomes increasingly evident during times of uncertainty, we believe it is crucial for long-term investors to extend the diversification process further, to include several strategies within an asset class, such as the bond fund offerings within Evergreen’s Fixed Income Trust and Select Fixed Income Trust.
The investment period began with a trend for slower growth in the U.S. economy. After experiencing the rapid pace of growth typical in economic recovery, Gross Domestic Product had moderated to a pace of growth normally associated with economic expansion. While the growth in overall output was still good, it was no longer considered great, and market interest rates initially declined on the perceived weakness. Yet energy prices continued to soar throughout the summer months amid rising levels for employment, housing and production. The post-Katrina federal spending plans exacerbated these pricing concerns and long-term interest rates began to crawl higher.
Having already anticipated a bout of inflation fears, the Federal Reserve (Fed) maintained its “measured removal of policy accommodation.”
1
LETTER TO SHAREHOLDERS continued
While the paradox of moderating economic growth and tighter monetary policy often rattled the fixed income markets, Evergreen’s Investment Strategy Committee concluded that since rates were low for such a lengthy period, the central bank was simply removing excess stimulus to prevent pricing from becoming a long-term problem. Although Chairman Greenspan had been very transparent in his public statements about the direction of monetary policy, market interest rates persisted lower into the summer months. This “flattening” of the yield curve caused many in the fixed income markets to debate its message. Did it signal the end of the expansion? Or was it just confidence in the Fed’s inflation-fighting capabilities? Considering our forecast for moderating global growth, mild wages, and solid productivity, we determined that long-term pricing pressures, despite energy, were insufficient to halt the expansion. In addition, we believed that a combination of excess global savings, an increased “flight to quality,” and growing demand for longer-duration investments by under-funded pensions accelerated this trend.
Throughout this timeframe, our fixed income teams attempted to capitalize on trends within the bond market. For example, Evergreen’s high yield teams emphasized exposure within media and telecom, while the lack of airline exposure benefited their portfolios. Our government bond teams needed to be very agile in their decision-making, for despite the Fed’s monetary policy stance, the yield curve continued to flatten. The mortgage market benefited from the mostly positive economic data, yet the combination of the hurricanes and rising energy costs pressured yields in September and October. Finally, some of our “core” strategies included going short on duration in anticipation of the rise in market yields. All told, it was a challenging environment to be tied to any one
2
LETTER TO SHAREHOLDERS continued
specific area within the bond market, and we believe those portfolios fully diversified within fixed income were best positioned for the long-term.
We continue to recommend that investors maintain their diversified, long-term strategies within their fixed income portfolios.
Please visit our Web site, EvergreenInvestments.com, for more information about our funds and other investment products available to you. Thank you for your continued support of Evergreen Investments.
Sincerely,

Dennis H. Ferro
President and Chief Executive Officer
Evergreen Investment Company, Inc.
Special Notice to Shareholders:
Please visit our Web site at EvergreenInvestments.com for a statement from President and Chief Executive Officer, Dennis Ferro, addressing NASD actions involving Evergreen Investment Services, Inc. (EIS), Evergreen’s mutual fund distributor or statements from Dennis Ferro and Chairman of the Board of the Evergreen Funds, Michael S. Scofield, addressing SEC actions involving the Evergreen Funds.
3
FUND AT A GLANCE
as of October 31, 2005
MANAGEMENT TEAM
Investment Advisor:
• Evergreen Investment Management Company, LLC
Portfolio Manager:
• Dana Erikson, CFA
CURRENT INVESTMENT STYLE

Source: Morningstar, Inc.
Morningstar’s style box is based on a portfolio date as of 9/30/2005.
The Fixed income style box placement is based on a fund’s average effective maturity or duration and the average credit rating of the bond portfolio.
PERFORMANCE AND RETURNS
Portfolio inception date: 9/11/1935
| | | Class A | | Class B | | Class C | | Class I |
| Class inception date | | 1/20/1998 | | 9/11/1935 | | 1/21/1998 | | 4/14/1998 |
|
| Nasdaq symbol | | EKHAX | | EKHBX | | EKHCX | | EKHYX |
|
| 6-month return with sales charge | | -2.08% | | -2.40% | | 1.58% | | N/A |
|
| 6-month return w/o sales charge | | 2.93% | | 2.57% | | 2.57% | | 3.09% |
|
| Average annual return* | | | | | | | | |
|
| 1-year with sales charge | | -2.71% | | -3.41% | | 0.39% | | N/A |
|
| 1-year w/o sales charge | | 2.05% | | 1.34% | | 1.34% | | 2.36% |
|
| 5-year | | 6.53% | | 6.49% | | 6.79% | | 7.86% |
|
| 10-year | | 5.40% | | 5.31% | | 5.31% | | 6.11% |
|
| Maximum sales charge | | 4.75% | | 5.00% | | 1.00% | | N/A |
| | | Front-end | | CDSC | | CDSC | | |
|
* Adjusted for maximum applicable sales charge, unless noted.
Past performance is no guarantee of future results. The performance quoted represents past performance and current performance may be lower or higher. The investment return and principal value of an investment will fluctuate so that investors’ shares, when redeemed, may be worth more or less than their original cost. To obtain performance information current to the most recent month-end for Classes A, B, C or I, please go to EvergreenInvestments.com/fundperformance. The performance of each class may vary based on differences in loads, fees and expenses paid by the shareholders investing in each class. Performance includes the reinvestment of income dividends and capital gain distributions. Performance shown does not reflect the deduction of taxes that a shareholder would pay on fund distributions or the redemption of fund shares.
Historical performance shown for Classes A, C and I prior to their inception is based on the performance of Class B, the original class offered. The historical returns for Classes A and I have not been adjusted to reflect the effect of each class’ 12b-1 fee. These fees are 0.30% for Class A and 1.00% for Classes B and C. Class I does not pay a 12b-1 fee. If these fees had been reflected, returns for Classes A and I would have been higher.
The advisor is reimbursing a portion of the 12b-1 fee for Class A. Had the fee not been reimbursed, returns for Class A would have been lower. Returns reflect expense limits previously in effect for all classes, without which returns would have been lower.
4
FUND AT A GLANCE continued
LONG-TERM GROWTH
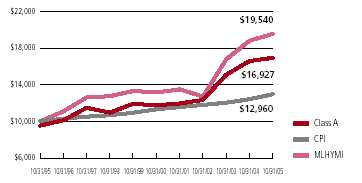
Comparison of a $10,000 investment in the Evergreen High Yield Bond Fund Class A shares, versus a similar investment in the Merrill Lynch High Yield Master Index† (MLHYMI) and the Consumer Price Index (CPI).
The MLHYMI is an unmanaged market index and does not include transaction costs associated with buying and selling securities, any mutual fund expenses or any taxes. The CPI is a commonly used measure of inflation and does not represent an investment return. It is not possible to invest directly in an index.
Class I shares are only offered in the following manner: (1) to investment advisory clients of Evergreen Investment Management Company, LLC (or its advisory affiliates) when purchased by such advisor(s) on behalf of its clients, (2) through arrangements entered into on behalf of the Evergreen funds with certain financial services firms, (3) to certain institutional investors and (4) to persons who owned Class Y shares in registered name in an Evergreen fund on or before December 31, 1994 or who owned shares of any SouthTrust fund in registered name as of March 18, 2005 or shares of Vestaur Securities Fund as of May 20, 2005.
Class I shares are only available to institutional shareholders with a minimum of $1 million investment, which may be waived in certain situations.
The fund’s investment objective is nonfundamental and may be changed without a vote of the fund’s shareholders.
High yield, lower-rated bonds may contain more risk due to the increased possibility of default.
The return of principal is not guaranteed due to fluctuation in the NAV of the fund caused by changes in the price of the individual bonds held by the fund and the buying and selling of bonds by the fund. Bond funds have the same inflation, interest rate and credit risks that are associated with the individual bonds held by the fund. Generally, the value of bond funds rise when prevailing interest rates fall and fall when interest rates rise.
Foreign investments may contain more risk due to the inherent risks associated with changing political climates, foreign market instability and foreign currency fluctuations.
† Copyright 2005. Merrill Lynch, Pierce, Fenner & Smith Incorporated. All rights reserved.
All data is as of October 31, 2005, and subject to change.
5
ABOUT YOUR FUND’S EXPENSES
The Example below is intended to describe the fees and expenses borne by shareholders and the impact of those costs on your investment.
Example
As a shareholder of the fund, you incur two types of costs: (1) transaction costs, including sales charges (loads), redemption fees and exchange fees; and (2) ongoing costs, including management fees, distribution (12b-1) fees and other fund expenses. This Example is intended to help you understand your ongoing costs (in dollars) of investing in the fund and to compare these costs with the ongoing costs of investing in other mutual funds. The Example is based on an investment of $1,000 invested at the beginning of the period and held for the entire period from May 1, 2005 to October 31, 2005.
The example illustrates your fund’s costs in two ways:
• Actual expenses
The section in the table under the heading “Actual” provides information about actual account values and actual expenses. You may use the information in these columns, together with the amount you invested, to estimate the expenses that you paid over the period. Simply divide your account value by $1,000 (for example, an $8,600 account value divided by $1,000 = 8.6), then multiply the result by the number in the appropriate column for your share class, in the column entitled “Expenses Paid During Period” to estimate the expenses you paid on your account during this period.
• Hypothetical example for comparison purposes
The section in the table under the heading “Hypothetical (5% return before expenses)” provides information about hypothetical account values and hypothetical expenses based on the fund’s actual expense ratio and an assumed rate of return of 5% per year before expenses, which is not the fund’s actual return. The hypothetical account values and expenses may not be used to estimate the actual ending account balance or expenses you paid for the period. You may use this information to compare the ongoing costs of investing in the fund and other funds. To do so, compare this 5% hypothetical example with the 5% hypothetical examples that appear in the shareholder reports of the other funds.
Please note that the expenses shown in the table are meant to highlight your ongoing costs only and do not reflect any transactional costs, such as sales charges (loads), redemption fees or exchange fees. Therefore, the section in the table under the heading “Hypothetical (5% return before expenses)” is useful in comparing ongoing costs only, and will not help you determine the relative total costs of owning different funds. In addition, if these transactional costs were included, your costs would have been higher.
| | | Beginning | | Ending | | |
| | | Account | | Account | | Expenses |
| | | Value | | Value | | Paid During |
| | | 5/1/2005 | | 10/31/2005 | | Period* |
|
| Actual | | | | | | |
| Class A | | $ 1,000.00 | | $ 1,029.34 | | $ 5.27 |
| Class B | | $ 1,000.00 | | $ 1,025.74 | | $ 8.83 |
| Class C | | $ 1,000.00 | | $ 1,025.74 | | $ 8.83 |
| Class I | | $ 1,000.00 | | $ 1,030.89 | | $ 3.74 |
| Hypothetical | | | | | | |
| (5% return | | | | | | |
| before expenses) | | | | | | |
| Class A | | $ 1,000.00 | | $ 1,020.01 | | $ 5.24 |
| Class B | | $ 1,000.00 | | $ 1,016.48 | | $ 8.79 |
| Class C | | $ 1,000.00 | | $ 1,016.48 | | $ 8.79 |
| Class I | | $ 1,000.00 | | $ 1,021.53 | | $ 3.72 |
|
* For each class of the Fund, expenses are equal to the annualized expense ratio of each class (1.03% for Class A, 1.73% for Class B, 1.73% for Class C and 0.73% for Class I), multiplied by the average account value over the period, multiplied by 184 / 365 days.
6
FINANCIAL HIGHLIGHTS
(For a share outstanding throughout each period)
| | | Six Months Ended | | Year Ended April 30, |
| | | October 31, 2005 |
|
| CLASS A | | (unaudited) | | 2005 | | 2004 | | | | 2003 | | 20021 | | 2001 |
|
| Net asset value, beginning of period | | | | $ 3.32 | | $ 3.43 | | $ 3.30 | | | | $ 3.29 | | $ 3.39 | | $ 3.72 |
|
| Income from investment operations | | | | | | | | | | | | | | | | |
| Net investment income (loss) | | | | 0.122 | | 0.24 | | 0.25 | | | | 0.272 | | 0.27 | | 0.33 |
Net realized and unrealized gains
or losses on investments | | | | (0.02) | | (0.10) | | 0.14 | | | | 0.01 | | (0.09) | | (0.33) |
| |
|
| Total from investment operations | | | | 0.10 | | 0.14 | | 0.39 | | | | 0.28 | | 0.18 | | 0 |
|
| Distributions to shareholders from | | | | | | | | | | | | | | | | |
| Net investment income | | | | (0.12) | | (0.25) | | (0.26) | | | | (0.27) | | (0.28) | | (0.33) |
|
| Net asset value, end of period | | | | $ 3.30 | | $ 3.32 | | $ 3.43 | | | | $ 3.30 | | $ 3.29 | | $ 3.39 |
|
| Total return3 | | | | 2.93% | | 4.14% | | 12.25% | | | | 9.42% | | 5.77% | | 0.15% |
|
| Ratios and supplemental data | | | | | | | | | | | | | | | | |
| Net assets, end of period (thousands) | | $429,140 | | $467,714 | | $530,526 | | $484,346 | | $321,830 | | $322,330 |
| |
|
| Ratios to average net assets | | | | | | | | | | | | | | | | |
| Expenses including waivers/reimbursements | | | | | | | | | | | | | | | | |
| but excluding expense reductions | | | | 1.03%4 | | 1.04% | | 1.01% | | | | 1.11% | | 1.19% | | 1.25% |
| Expenses excluding waivers/reimbursements | | | | | | | | | | | | | | | | |
| and expense reductions | | | | 1.03%4 | | 1.04% | | 1.01% | | | | 1.11% | | 1.21% | | 1.25% |
| Net investment income (loss) | | | | 6.82%4 | | 7.16% | | 7.42% | | | | 8.70% | | 8.27% | | 9.39% |
| Portfolio turnover rate | | | | 23% | | 65% | | 71% | | | | 80% | | 138% | | 140% |
|
1 As required, effective May 1, 2001, the Fund adopted the provisions of the AICPA Audit and Accounting Guide, Audits of Investment Companies, and began amortizing premium on its fixed-income securities . The effects of this change for the year ended April 30, 2002 were a decrease in net investment income per share of $0.00; an increase in net realized gains or losses per share of $0.00; and a decrease to the ratio of net investment income to average net assets of 0.13%. The above per share information, ratios and supplemental data for the periods prior to May 1, 2001 have not been restated to reflect this change in presentation.
2 Net investment income (loss) per share is based on average shares outstanding during the period.
3 Excluding applicable sales charges
4 Annualized
See Notes to Financial Statements
7
FINANCIAL HIGHLIGHTS
(For a share outstanding throughout each period)
| | | Six Months Ended | | Year Ended April 30, |
| | | October 31, 2005 | |
|
| CLASS B | | (unaudited) | | 2005 | | 2004 | | | | 2003 | | 20021 | | 2001 |
|
| Net asset value, beginning of period | | | | $ 3.32 | | $ 3.43 | | $ 3.30 | | | | $ 3.29 | | $ 3.39 | | $ 3.72 |
|
| Income from investment operations | | | | | | | | | | | | | | | | |
| Net investment income (loss) | | | | 0.102 | | 0.22 | | 0.232 | | | | 0.252 | | 0.242 | | 0.34 |
Net realized and unrealized gains
or losses on investments | | | | (0.01) | | (0.10) | | 0.14 | | | | 0.01 | | (0.08) | | (0.37) |
| |
|
| Total from investment operations | | | | 0.09 | | 0.12 | | 0.37 | | | | 0.26 | | 0.16 | | (0.03) |
|
| Distributions to shareholders from | | | | | | | | | | | | | | | | |
| Net investment income | | | | (0.11) | | (0.23) | | (0.24) | | | | (0.25) | | (0.26) | | (0.30) |
|
| Net asset value, end of period | | | | $ 3.30 | | $ 3.32 | | $ 3.43 | | | | $ 3.30 | | $ 3.29 | | $ 3.39 |
|
| Total return3 | | | | 2.57% | | 3.42% | | 11.46% | | | | 8.61% | | 4.98% | | (0.60%) |
|
| Ratios and supplemental data | | | | | | | | | | | | | | | | |
| Net assets, end of period (thousands) | | $195,220 | | $211,950 | | $247,741 | | $173,002 | | $54,537 | | $33,844 |
| Ratios to average net assets | | | | | | | | | | | | | | | | |
| Expenses including waivers/reimbursements | | | | | | | | | | | | | | | | |
| but excluding expense reductions | | | | 1.73%4 | | 1.74% | | 1.72% | | | | 1.84% | | 1.92% | | 2.00% |
| Expenses excluding waivers/reimbursements | | | | | | | | | | | | | | | | |
| and expense reductions | | | | 1.73%4 | | 1.74% | | 1.72% | | | | 1.84% | | 1.94% | | 2.00% |
| Net investment income (loss) | | | | 6.12%4 | | 6.46% | | 6.71% | | | | 7.99% | | 7.49% | | 8.61% |
| Portfolio turnover rate | | | | 23% | | 65% | | 71% | | | | 80% | | 138% | | 140% |
|
1 As required, effective May 1, 2001, the Fund adopted the provisions of the AICPA Audit and Accounting Guide, Audits of Investment Companies, and began amortizing premium on its fixed-income securities . The effects of this change for the year ended April 30, 2002 were a decrease in net investment income per share of $0.01; an increase in net realized gains or losses per share of $0.01; and a decrease to the ratio of net investment income to average net assets of 0.13%. The above per share information, ratios and supplemental data for the periods prior to May 1, 2001 have not been restated to reflect this change in presentation.
2 Net investment income (loss) per share is based on average shares outstanding during the period.
3 Excluding applicable sales charges
4 Annualized
See Notes to Financial Statements
8
FINANCIAL HIGHLIGHTS
(For a share outstanding throughout each period)
| | | Six Months Ended | | Year Ended April 30, |
| | | October 31, 2005 | |
|
| CLASS C | | (unaudited) | | 2005 | | 2004 | | | | 2003 | | 20021 | | 2001 |
|
| Net asset value, beginning of period | | | | $ 3.32 | | $ 3.43 | | $ 3.30 | | | | $ 3.29 | | $ 3.39 | | $ 3.72 |
|
| Income from investment operations | | | | | | | | | | | | | | | | |
| Net investment income (loss) | | | | 0.102 | | 0.22 | | 0.23 | | | | 0.252 | | 0.26 | | 0.29 |
Net realized and unrealized gains
or losses on investments | | | | (0.01) | | (0.10) | | 0.14 | | | | 0.01 | | (0.10) | | (0.32) |
| |
|
| Total from investment operations | | | | 0.09 | | 0.12 | | 0.37 | | | | 0.26 | | 0.16 | | (0.03) |
|
| Distributions to shareholders from | | | | | | | | | | | | | | | | |
| Net investment income | | | | (0.11) | | (0.23) | | (0.24) | | | | (0.25) | | (0.26) | | (0.30) |
|
| Net asset value, end of period | | | | $ 3.30 | | $ 3.32 | | $ 3.43 | | | | $ 3.30 | | $ 3.29 | | $ 3.39 |
|
| Total return3 | | | | 2.57% | | 3.42% | | 11.46% | | | | 8.61% | | 4.98% | | (0.60%) |
|
| Ratios and supplemental data | | | | | | | | | | | | | | | | |
| Net assets, end of period (thousands) | | $240,215 | | $281,810 | | $381,525 | | $290,914 | | $105,753 | | $80,753 |
| Ratios to average net assets | | | | | | | | | | | | | | | | |
| Expenses including waivers/reimbursements | | | | | | | | | | | | | | | | |
| but excluding expense reductions | | | | 1.73%4 | | 1.74% | | 1.72% | | | | 1.85% | | 1.93% | | 2.00% |
| Expenses excluding waivers/reimbursements | | | | | | | | | | | | | | | | |
| and expense reductions | | | | 1.73%4 | | 1.74% | | 1.72% | | | | 1.85% | | 1.95% | | 2.00% |
| Net investment income (loss) | | | | 6.12%4 | | 6.47% | | 6.72% | | | | 7.98% | | 7.52% | | 8.61% |
| Portfolio turnover rate | | | | 23% | | 65% | | 71% | | | | 80% | | 138% | | 140% |
|
1 As required, effective May 1, 2001, the Fund has adopted the provisions of the AICPA Audit and Accounting Guide, Audits of Investment Companies, and began amortizing premium on its fixed-income securities . The effects of this change for the year ended April 30, 2002 were a decrease in net investmen t income per share of $0.00; an increase in net realized gains or losses per share of $0.00; and a decrease to the ratio of net investment income to average net assets of 0.13%. The above per share information, ratios and supplemental data for the periods prior to May 1, 2001 have not been restated to reflect this change in presentation.
2 Net investment income (loss) per share is based on average shares outstanding during the period.
3 Excluding applicable sales charges
4 Annualized
See Notes to Financial Statements
9
FINANCIAL HIGHLIGHTS
(For a share outstanding throughout each period)
| | | Six Months Ended | | Year Ended April 30, |
| | | October 31, 2005 | |
|
| CLASS I1 | | (unaudited) | | 2005 | | 2004 | | | | 2003 | | 20022 | | 2001 |
|
| Net asset value, beginning of period | | | | $ 3.32 | | $ 3.43 | | $ 3.30 | | | | $ 3.29 | | $ 3.39 | | $ 3.72 |
|
| Income from investment operations | | | | | | | | | | | | | | | | |
| Net investment income (loss) | | | | 0.123 | | 0.26 | | 0.26 | | | | 0.283 | | 0.29 | | 0.34 |
Net realized and unrealized gains
or losses on investments | | | | (0.02) | | (0.11) | | 0.14 | | | | 0.01 | | (0.10) | | (0.33) |
| |
|
| Total from investment operations | | | | 0.10 | | 0.15 | | 0.40 | | | | 0.29 | | 0.19 | | 0.01 |
|
| Distributions to shareholders from | | | | | | | | | | | | | | | | |
| Net investment income | | | | (0.12) | | (0.26) | | (0.27) | | | | (0.28) | | (0.29) | | (0.34) |
|
| Net asset value, end of period | | | | $ 3.30 | | $ 3.32 | | $ 3.43 | | | | $ 3.30 | | $ 3.29 | | $ 3.39 |
|
| Total return | | | | 3.09% | | 4.45% | | 12.58% | | | | 9.69% | | 6.04% | | 0.40% |
|
| Ratios and supplemental data | | | | | | | | | | | | | | | | |
| Net assets, end of period (thousands) | | $60,216 | | $60,412 | | $37,894 | | $49,370 | | $10,011 | | $6,047 |
| Ratios to average net assets | | | | | | | | | | | | | | | | |
| Expenses including waivers/reimbursements | | | | | | | | | | | | | | | | |
| but excluding expense reductions | | | | 0.73%4 | | 0.74% | | 0.72% | | | | 0.84% | | 0.92% | | 1.00% |
| Expenses excluding waivers/reimbursements | | | | | | | | | | | | | | | | |
| and expense reductions | | | | 0.73%4 | | 0.74% | | 0.72% | | | | 0.84% | | 0.94% | | 1.00% |
| Net investment income (loss) | | | | 7.11%4 | | 7.46% | | 7.73% | | | | 9.05% | | 8.53% | | 9.63% |
| Portfolio turnover rate | | | | 23% | | 65% | | 71% | | | | 80% | | 138% | | 140% |
|
1 Effective at the close of business on May 11, 2001, Class Y sh ares were renamed as Institutional shares (Class I).
2 As required, effective May 1, 2001, the Fund has adopted the provisions of the AICPA Audit and Accounting Guide, Audits of Investment Companies, and began amortizing premium on its fixed-income securities . The effects of this change for the year ended April 30, 2002 were a decrease in net investmen t income per share of $0.00; an increase in net realized gains or losses per share of $0.00; and a decrease to the ratio of net investment income to average net assets of 0.13%. The above per share information, ratios and supplemental data for the periods prior to May 1, 2001 have not been restated to reflect this change in presentation.
3 Net investment income (loss) per share is based on average shares outstanding during the period.
4 Annualized
See Notes to Financial Statements
10
SCHEDULE OF INVESTMENTS
October 31, 2005 (unaudited)
| | | | | Principal | | | | |
| | | | | Amount | | | | Value |
|
| AGENCY MORTGAGE-BACKED COLLATERALIZED | | | | | | | | |
| MORTGAGE OBLIGATIONS 0.0% | | | | | | | | |
| FIXED-RATE 0.0% | | | | | | | | |
| FNMA, 8.00%, 06/01/2030 (cost $22,875) | | $ | | 23,172 | | $ | | 24,737 |
| |
|
| CORPORATE BONDS 84.1% | | | | | | | | |
| CONSUMER DISCRETIONARY 26.0% | | | | | | | | |
| Auto Components 1.6% | | | | | | | | |
| Dura Operating Corp., Ser. B, 8.625%, 04/15/2012 (p) | | | | 2,900,000 | | | | 2,472,250 |
| HLI Operating Co., Inc., 10.50%, 06/15/2010 (p) | | | | 2,900,000 | | | | 2,392,500 |
| Tenneco Automotive, Inc., 8.625%, 11/15/2014 (p) | | 10,650,000 | | | | 10,224,000 |
| |
|
| | | | | | | | | 15,088,750 |
| |
|
| Diversified Consumer Services 1.2% | | | | | | | | |
| Carriage Services, Inc., 7.875%, 01/15/2015 | | | | 4,345,000 | | | | 4,475,350 |
| Service Corporation International: | | | | | | | | |
| 6.75%, 04/01/2016 (p) | | | | 3,625,000 | | | | 3,579,688 |
| 7.00%, 06/15/2017 144A | | | | 3,250,000 | | | | 3,241,875 |
| |
|
| | | | | | | | | 11,296,913 |
| |
|
| Hotels, Restaurants & Leisure 7.3% | | | | | | | | |
| Ameristar Casinos, Inc., 10.75%, 02/15/2009 | | | | 5,500,000 | | | | 5,885,000 |
| Herbst Gaming, Inc., 7.00%, 11/15/2014 | | | | 5,450,000 | | | | 5,409,125 |
| Inn of The Mountain Gods Resort & Casino, 12.00%, 11/15/2010 | | 13,000,000 | | | | 13,975,000 |
| Isle of Capri Casinos, Inc., 7.00%, 03/01/2014 | | | | 5,500,000 | | | | 5,225,000 |
| La Quinta Corp., 8.875%, 03/15/2011 | | | | 2,990,000 | | | | 3,206,775 |
| Las Vegas Sands Corp., 6.375%, 02/15/2015 (p) | | | | 4,320,000 | | | | 4,114,800 |
| Mandalay Resort Group, Ser. B, 10.25%, 08/01/2007 | | | | 6,000,000 | | | | 6,420,000 |
| MGM MIRAGE, Inc., 5.875%, 02/27/2014 (p) | | | | 3,350,000 | | | | 3,149,000 |
| MTR Gaming Group, Inc., 9.75%, 04/01/2010 | | | | 9,430,000 | | | | 9,972,225 |
| Station Casinos, Inc.: | | | | | | | | |
| 6.50%, 02/01/2014 (p) | | | | 2,675,000 | | | | 2,681,688 |
| 6.875%, 03/01/2016 | | | | 7,025,000 | | | | 7,112,812 |
| |
|
| | | | | | | | | 67,151,425 |
| |
|
| Household Durables 1.9% | | | | | | | | |
| Amscan Holdings, Inc., 8.75%, 05/01/2014 | | | | 5,515,000 | | | | 4,439,575 |
| Jarden Corp., 9.75%, 05/01/2012 | | | | 9,020,000 | | | | 9,155,300 |
| Meritage Homes Corp., 6.25%, 03/15/2015 | | | | 3,000,000 | | | | 2,625,000 |
| Technical Olympic USA, Inc., 10.375%, 07/01/2012 | | | | 1,200,000 | | | | 1,212,000 |
| |
|
| | | | | | | | | 17,431,875 |
| |
|
| Leisure Equipment & Products 0.5% | | | | | | | | |
| Riddell Bell Holdings, Inc., 8.375%, 10/01/2012 | | | | 4,510,000 | | | | 4,329,600 |
| |
|
| Media 9.2% | | | | | | | | |
| AMC Entertainment, Inc., 9.875%, 02/01/2012 (p) | | | | 7,500,000 | | | | 7,200,000 |
| Cablevision Systems Corp., Ser. B, 8.00%, 04/15/2012 | | | | 8,615,000 | | | | 8,270,400 |
| CCO Holdings, LLC, 8.75%, 11/15/2013 (p) | | | | 6,000,000 | | | | 5,805,000 |
| Cinemark USA, Inc., 9.00%, 02/01/2013 | | | | 5,000,000 | | | | 5,187,500 |
| CSC Holdings, Inc., 7.625%, 04/01/2011 | | | | 6,530,000 | | | | 6,578,975 |
See Notes to Financial Statements
11
SCHEDULE OF INVESTMENTS continued
October 31, 2005 (unaudited)
| | | Principal | | | | |
| | | Amount | | | | Value |
|
| CORPORATE BONDS continued | | | | | | |
| CONSUMER DISCRETIONARY continued | | | | | | |
| Media continued | | | | | | |
| Dex Media East, LLC, 9.875%, 11/15/2009 | | $ 10,000,000 | | $ | | 10,925,000 |
| Emmis Communications Corp.: | | | | | | |
| 6.875%, 05/15/2012 (p) | | 5,835,000 | | | | 5,791,238 |
| FRN, 9.75%, 06/15/2012 | | 3,000,000 | | | | 3,022,500 |
| Houghton Mifflin Co., 8.25%, 02/01/2011 | | 5,000,000 | | | | 5,137,500 |
| Mediacom Communications Corp., 9.50%, 01/15/2013 (p) | | 11,250,000 | | | | 11,053,125 |
| PRIMEDIA, Inc., 8.875%, 05/15/2011 | | 3,785,000 | | | | 3,709,300 |
| Sinclair Broadcast Group, Inc., 8.00%, 03/15/2012 | | 5,250,000 | | | | 5,420,625 |
| Sirius Satellite Radio, Inc., 9.625%, 08/01/2013 (p) 144A | | 7,250,000 | | | | 6,896,562 |
| |
|
| | | | | | | 84,997,725 |
| |
|
| Specialty Retail 2.7% | | | | | | |
| CSK Auto, Inc., 7.00%, 01/15/2014 (p) | | 8,500,000 | | | | 7,990,000 |
| FTD, Inc., 7.75%, 02/15/2014 | | 3,749,000 | | | | 3,730,255 |
| PETCO Animal Supplies, Inc., 10.75%, 11/01/2011 | | 5,730,000 | | | | 6,238,537 |
| United Auto Group, Inc., 9.625%, 03/15/2012 | | 7,000,000 | | | | 7,306,250 |
| |
|
| | | | | | | 25,265,042 |
| |
|
| Textiles, Apparel & Luxury Goods 1.6% | | | | | | |
| Levi Strauss & Co., 9.75%, 01/15/2015 (p) | | 5,100,000 | | | | 5,176,500 |
| Norcross Safety Products, LLC, Ser. B, 9.875%, 08/15/2011 | | 2,000,000 | | | | 2,140,000 |
| Oxford Industries, Inc., 8.875%, 06/01/2011 | | 4,000,000 | | | | 4,120,000 |
| Warnaco Group, Inc., 8.875%, 06/15/2013 | | 3,000,000 | | | | 3,247,500 |
| |
|
| | | | | | | 14,684,000 |
| |
|
| CONSUMER STAPLES 2.1% | | | | | | |
| Food Products 0.9% | | | | | | |
| Del Monte Foods Co.: | | | | | | |
| 6.75%, 02/15/2015 144A | | 1,190,000 | | | | 1,161,737 |
| 8.625%, 12/15/2012 | | 4,550,000 | | | | 4,868,500 |
| Michael Foods, Inc., 8.00%, 11/15/2013 | | 2,500,000 | | | | 2,550,000 |
| |
|
| | | | | | | 8,580,237 |
| |
|
| Personal Products 0.9% | | | | | | |
| Playtex Products, Inc., 8.00%, 03/01/2011 | | 8,000,000 | | | | 8,390,000 |
| |
|
| Tobacco 0.3% | | | | | | |
| Commonwealth Brands, Inc., 10.625%, 09/01/2008 144A | | 2,625,000 | | | | 2,769,375 |
| |
|
| ENERGY 11.7% | | | | | | |
| Energy Equipment & Services 3.1% | | | | | | |
| Dresser, Inc., 9.375%, 04/15/2011 | | 5,000,000 | | | | 5,200,000 |
| GulfMark Offshore, Inc., 7.75%, 07/15/2014 (p) | | 3,025,000 | | | | 3,191,375 |
| Hornbeck Offshore Services, Inc.: | | | | | | |
| 6.125%, 12/01/2014 144A | | 3,875,000 | | | | 3,797,500 |
| Ser. B, 6.125%, 12/01/2014 | | 1,700,000 | | | | 1,666,000 |
See Notes to Financial Statements
12
SCHEDULE OF INVESTMENTS continued
October 31, 2005 (unaudited)
| | | | | | | Principal | | | | |
| | | | | | | Amount | | | | Value |
|
| CORPORATE BONDS continued | | | | | | | | |
| ENERGY continued | | | | | | | | | | |
| Energy Equipment & Services continued | | | | | | | | | | |
| Parker Drilling Co.: | | | | | | | | | | |
| 9.625%, 10/01/2013 (p) | | | | | | $ 2,830,000 | | $ | | 3,212,050 |
| 9.625%, 10/01/2013 144A | | | | | | 6,000,000 | | | | 6,810,000 |
| SESI, LLC, 8.875%, 05/15/2011 | | | | | | 4,150,000 | | | | 4,367,875 |
| |
|
| | | | | | | | | | | 28,244,800 |
| |
|
| Oil, Gas & Consumable Fuels 8.6% | | | | | | | | | | |
| Chesapeake Energy Corp.: | | | | | | | | | | |
| 6.375%, 06/15/2015 | | | | | | 3,750,000 | | | | 3,703,125 |
| 6.875%, 01/15/2016 (p) | | | | | | 9,145,000 | | | | 9,305,037 |
| Clayton Williams Energy, Inc., 7.75%, 08/01/2013 144A | | | | 5,450,000 | | | | 5,286,500 |
| El Paso Corp., 7.875%, 06/15/2012 (p) | | | | 10,000,000 | | | | 10,250,000 |
| El Paso Production Holding Co., 7.75%, 06/01/2013 | | | | 7,755,000 | | | | 8,026,425 |
| Encore Acquisition Co., 6.25%, 04/15/2014 (p) | | | | 3,445,000 | | | | 3,358,875 |
| Exco Resources, Inc., 7.25%, 01/15/2011 | | | | 3,505,000 | | | | 3,557,575 |
| Overseas Shipholding Group, Inc., 8.25%, 03/15/2013 | | | | 4,400,000 | | | | 4,724,500 |
| Peabody Energy Corp.: | | | | | | | | | | |
| 5.875%, 04/15/2016 (p) | | | | | | 4,275,000 | | | | 4,157,438 |
| 6.875%, 03/15/2013 | | | | | | 2,380,000 | | | | 2,469,250 |
| Petroleum Helicopters, Inc., 9.375%, 05/01/2009 | | | | 1,500,000 | | | | 1,578,750 |
| Plains Exploration & Production Co., 8.75%, 07/01/2012 | | | | 2,730,000 | | | | 2,927,925 |
| Premcor Refining Group, Inc., 9.50%, 02/01/2013 | | | | 5,250,000 | | | | 5,893,125 |
| Targa Resources, Inc., 8.50%, 11/01/2013 144A | | | | 1,500,000 | | | | 1,530,000 |
| Williams Cos.: | | | | | | | | | | |
| 7.50%, 01/15/2031 | | | | | | 5,000,000 | | | | 5,225,000 |
| 8.125%, 03/15/2012 | | | | | | 7,250,000 | | | | 7,866,250 |
| |
|
| | | | | | | | | | | 79,859,775 |
| |
|
| FINANCIALS 6.4% | | | | | | | | | | |
| Consumer Finance 2.8% | | | | | | | | | | |
| General Motors Acceptance Corp.: | | | | | | | | | | |
| 5.625%, 05/15/2009 | | | | | | 10,750,000 | | | | 10,172,596 |
| 6.125%, 09/15/2006 | | | | | | 5,000,000 | | | | 4,986,410 |
| Northern Telecom Capital Corp., 7.875%, 06/15/2026 (p) | | | | 6,500,000 | | | | 6,402,500 |
| Triad Financial Corp., 11.125%, 05/01/2013 144A | | | | 4,675,000 | | | | 4,721,750 |
| |
|
| | | | | | | | | | | 26,283,256 |
| |
|
| Diversified Financial Services 1.3% | | | | | | | | | | |
| Borden US Finance Corp., 9.00%, 07/15/2014 144A | | | | 1,600,000 | | | | 1,582,000 |
| Qwest Capital Funding, Inc., 7.00%, 08/03/2009 (p) | | | | 10,500,000 | | | | 10,342,500 |
| |
|
| | | | | | | | | | | 11,924,500 |
| |
|
| Insurance 0.5% | | | | | | | | | | |
| Crum & Forster Holdings Corp., 10.375%, 06/15/2013 | | | | 4,100,000 | | | | 4,407,500 |
| |
|
See Notes to Financial Statements
13
SCHEDULE OF INVESTMENTS continued
October 31, 2005 (unaudited)
| | | Principal | | | | |
| | | Amount | | | | Value |
|
| CORPORATE BONDS continued | | | | | | |
| FINANCIALS continued | | | | | | |
| Real Estate 1.8% | | | | | | |
| Crescent Real Estate Equities Co., REIT, 9.25%, 04/15/2009 | | $ 5,600,000 | | $ | | 5,936,000 |
| Omega Healthcare Investors, Inc., REIT: | | | | | | |
| 6.95%, 08/01/2007 | | 3,300,000 | | | | 3,333,000 |
| 7.00%, 04/01/2014 | | 1,200,000 | | | | 1,212,000 |
| Thornburg Mortgage, Inc., REIT, 8.00%, 05/15/2013 | | 6,325,000 | | | | 6,182,687 |
| |
|
| | | | | | | 16,663,687 |
| |
|
| HEALTH CARE 4.9% | | | | | | |
| Health Care Equipment & Supplies 0.6% | | | | | | |
| Universal Hospital Services, Inc., 10.125%, 11/01/2011 (p) | | 5,370,000 | | | | 5,410,275 |
| |
|
| Health Care Providers & Services 4.3% | | | | | | |
| Extendicare Health Services, Inc., 9.50%, 07/01/2010 | | 5,000,000 | | | | 5,350,000 |
| HCA, Inc., 6.375%, 01/15/2015 (p) | | 5,525,000 | | | | 5,448,987 |
| IASIS Healthcare Corp., 8.75%, 06/15/2014 | | 6,845,000 | | | | 7,050,350 |
| Select Medical Corp., 7.625%, 02/01/2015 | | 6,000,000 | | | | 5,595,000 |
| Team Health, Inc., 9.00%, 04/01/2012 (p) | | 6,800,000 | | | | 7,684,000 |
| Tenet Healthcare Corp., 9.875%, 07/01/2014 | | 9,410,000 | | | | 9,151,225 |
| |
|
| | | | | | | 40,279,562 |
| |
|
| INDUSTRIALS 7.3% | | | | | | |
| Aerospace & Defense 0.4% | | | | | | |
| Moog, Inc., 6.25%, 01/15/2015 | | 3,475,000 | | | | 3,475,000 |
| |
|
| Commercial Services & Supplies 1.8% | | | | | | |
| Allied Waste North America, Inc.: | | | | | | |
| 5.75%, 02/15/2011 (p) | | 5,175,000 | | | | 4,851,562 |
| 6.375%, 04/15/2011 (p) | | 725,000 | | | | 703,250 |
| American Color Graphics, Inc., 10.00%, 06/15/2010 (p) | | 7,500,000 | | | | 5,006,250 |
| NationsRent Companies, Inc., 9.50%, 10/15/2010 | | 1,175,000 | | | | 1,283,688 |
| TriMas Corp., 9.875%, 06/15/2012 | | 6,250,000 | | | | 5,093,750 |
| |
|
| | | | | | | 16,938,500 |
| |
|
| Machinery 3.2% | | | | | | |
| Case New Holland, Inc., 9.25%, 08/01/2011 | | 12,375,000 | | | | 13,086,562 |
| Commercial Vehicle Group, Inc., 8.00%, 07/01/2013 144A | | 3,200,000 | | | | 3,152,000 |
| Douglas Dynamics, LLC, 7.75%, 01/15/2012 144A | | 4,060,000 | | | | 3,938,200 |
| Dresser Rand Group, Inc., 7.375%, 11/01/2014 144A | | 4,154,000 | | | | 4,278,620 |
| Terex Corp., 7.375%, 01/15/2014 | | 5,420,000 | | | | 5,420,000 |
| |
|
| | | | | | | 29,875,382 |
| |
|
| Marine 1.1% | | | | | | |
| Horizon Lines, LLC, Sr. Disc. Note, Step Bond, 0.00%, 04/01/2013 † | | 12,775,000 | | | | 10,571,313 |
| |
|
| Trading Companies & Distributors 0.8% | | | | | | |
| United Rentals, Inc., 7.75%, 11/15/2013 (p) | | 7,250,000 | | | | 6,923,750 |
| |
|
See Notes to Financial Statements
14
SCHEDULE OF INVESTMENTS continued
October 31, 2005 (unaudited)
| | | | | Principal | | | | |
| | | | | Amount | | | | Value |
|
| CORPORATE BONDS continued | | | | | | |
| INFORMATION TECHNOLOGY 2.0% | | | | | | | | |
| Communications Equipment 0.4% | | | | | | | | |
| Telex Communications Holdings, Inc., 11.50%, 10/15/2008 | | $ 3,250,000 | | $ | | 3,477,500 |
| |
|
| IT Services 1.6% | | | | | | | | |
| Stratus Technologies, Inc., 10.375%, 12/01/2008 (p) | | 4,000,000 | | | | 4,060,000 |
| SunGard Data Systems, Inc.: | | | | | | | | |
| 9.125%, 08/15/2013 144A | | | | 7,400,000 | | | | 7,548,000 |
| 10.25%, 08/15/2015 144A | | | | 2,950,000 | | | | 2,938,938 |
| |
|
| | | | | | | | | 14,546,938 |
| |
|
| MATERIALS 11.8% | | | | | | | | |
| Chemicals 3.8% | | | | | | | | |
| Ethyl Corp., 8.875%, 05/01/2010 | | | | 2,200,000 | | | | 2,288,000 |
| Huntsman Advanced Materials, LLC, 11.00%, 07/15/2010 | | 5,000,000 | | | | 5,575,000 |
| Huntsman International, LLC, 11.50%, 07/15/2012 | | 6,105,000 | | | | 6,936,806 |
| Lyondell Chemical Co.: | | | | | | | | |
| 10.50%, 06/01/2013 (p) | | | | 11,600,000 | | | | 13,209,500 |
| 11.125%, 07/15/2012 | | | | 1,400,000 | | | | 1,568,000 |
| PQ Corp., 7.50%, 02/15/2013 144A | | 5,625,000 | | | | 5,203,125 |
| |
|
| | | | | | | | | 34,780,431 |
| |
|
| Containers & Packaging 1.7% | | | | | | |
| Graham Packaging Co., 9.875%, 10/15/2014 (p) | | 5,150,000 | | | | 4,841,000 |
| Graphic Packaging International, Inc., 8.50%, 08/15/2011 | | 3,000,000 | | | | 2,910,000 |
| Owens-Brockway Glass Containers, Inc., 8.25%, 05/15/2013 (p) | | 7,850,000 | | | | 8,046,250 |
| |
|
| | | | | | | | | 15,797,250 |
| |
|
| Metals & Mining 4.7% | | | | | | | | |
| Alaska Steel Corp., 7.75%, 06/15/2012 (p) | | 10,750,000 | | | | 9,728,750 |
| Foundation Pennsylvania Coal Co., 7.25%, 08/01/2014 | | 6,400,000 | | | | 6,576,000 |
| Freeport-McMoRan Copper & Gold, Inc.: | | | | | | |
| 6.875%, 02/01/2014 | | | | 8,000,000 | | | | 7,920,000 |
| 10.125%, 02/01/2010 | | | | 5,285,000 | | | | 5,839,925 |
| Oregon Steel Mills, Inc., 10.00%, 07/15/2009 (p) | | 7,625,000 | | | | 8,215,938 |
| United States Steel Corp., 10.75%, 08/01/2008 | | 4,526,000 | | | | 5,046,490 |
| |
|
| | | | | | | | | 43,327,103 |
| |
|
| Paper & Forest Products 1.6% | | | | | | |
| Boise Cascade, LLC: | | | | | | | | |
| 6.47%, 10/15/2012 | | | | 2,700,000 | | | | 2,619,000 |
| 7.125%, 10/15/2014 | | | | 2,500,000 | | | | 2,237,500 |
| Bowater, Inc., 6.50%, 06/15/2013 (p) | | 5,250,000 | | | | 4,646,250 |
| Georgia Pacific Corp., 8.125%, 05/15/2011 | | 5,000,000 | | | | 5,450,000 |
| |
|
| | | | | | | | | 14,952,750 |
| |
|
See Notes to Financial Statements
15
SCHEDULE OF INVESTMENTS continued
October 31, 2005 (unaudited)
| | | | | Principal | | | | |
| | | | | Amount | | | | Value |
|
| CORPORATE BONDS continued | | | | | | |
| TELECOMMUNICATION SERVICES 5.8% | | | | | | |
| Diversified Telecommunication Services 1.8% | | | | | | |
| Consolidated Communications, Inc., 9.75%, 04/01/2012 | | $ 4,755,000 | | $ | | 5,004,638 |
| Level 3 Communications Corp., 6.375%, 10/15/2015 144A | | 5,750,000 | | | | 5,706,875 |
| Qwest Communications International, Inc., 7.875%, 09/01/2011 | | 5,425,000 | | | | 5,709,812 |
| |
|
| | | | | | | | | 16,421,325 |
| |
|
| Wireless Telecommunication Services 4.0% | | | | | | |
| Alamosa Holdings, Inc., 8.50%, 01/31/2012 | | 2,750,000 | | | | 2,866,875 |
| Centennial Communications Corp., 8.125%, 02/01/2014 (p) | | 4,750,000 | | | | 4,940,000 |
| Dobson Communications Corp., 8.875%, 10/01/2013 (p) | | 5,150,000 | | | | 5,059,875 |
| Horizon PCS, Inc., 11.375%, 07/15/2012 | | 3,655,000 | | | | 4,130,150 |
| Sprint Nextel Corp., Ser. D, 7.375%, 08/01/2015 | | 3,190,000 | | | | 3,379,231 |
| Rural Cellular Corp.: | | | | | | | | |
| 8.25%, 03/15/2012 | | | | 1,170,000 | | | | 1,222,650 |
| 9.75%, 01/15/2010 (p) | | | | 10,250,000 | | | | 10,250,000 |
| UbiquiTel, Inc., 9.875%, 03/01/2011 | | 2,500,000 | | | | 2,743,750 |
| US Unwired, Inc., Ser. B, 10.00%, 06/15/2012 | | 2,500,000 | | | | 2,856,250 |
| |
|
| | | | | | | | | 37,448,781 |
| |
|
| UTILITIES 6.1% | | | | | | | | |
| Electric Utilities 1.6% | | | | | | | | |
| Edison Mission Energy, 10.00%, 08/15/2008 | | 4,250,000 | | | | 4,685,625 |
| Reliant Energy, Inc.: | | | | | | | | |
| 6.75%, 12/15/2014 | | | | 6,125,000 | | | | 5,726,875 |
| 9.25%, 07/15/2010 (p) | | | | 4,000,000 | | | | 4,220,000 |
| |
|
| | | | | | | | | 14,632,500 |
| |
|
| Gas Utilities 0.9% | | | | | | | | |
| SEMCO Energy, Inc.: | | | | | | | | |
| 7.125%, 05/15/2008 | | | | 3,500,000 | | | | 3,558,874 |
| 7.75%, 05/15/2013 | | | | 4,500,000 | | | | 4,661,932 |
| |
|
| | | | | | | | | 8,220,806 |
| |
|
| Independent Power Producers & Energy Traders 3.6% | | | | | | |
| AES Corp., 7.75%, 03/01/2014 (p) | | | | 8,460,000 | | | | 8,819,550 |
| Dynegy, Inc., 10.125%, 07/15/2013 144A | | 8,500,000 | | | | 9,392,500 |
| NRG Energy, Inc., 8.00%, 12/15/2013 | | 2,689,000 | | | | 2,944,455 |
| Tenaska, Inc., 7.00%, 06/30/2021 144A | | 2,142,782 | | | | 2,187,720 |
| Texas Genco, Inc., 6.875%, 12/15/2014 144A | | 9,500,000 | | | | 10,212,500 |
| |
|
| | | | | | | | | 33,556,725 |
| |
|
| Total Corporate Bonds (cost $778,515,453) | | | | | | 778,004,351 |
| |
|
| YANKEE OBLIGATIONS - CORPORATE 10.5% | | | | | | |
| CONSUMER DISCRETIONARY 1.5% | | | | | | | | |
| Hotels, Restaurants & Leisure 0.6% | | | | | | | | |
| Intrawest Corp., 7.50%, 10/15/2013 | | 5,250,000 | | | | 5,368,125 |
| |
|
| Media 0.9% | | | | | | | | |
| IMAX Corp., 9.625%, 12/01/2010 | | | | 8,000,000 | | | | 8,600,000 |
| |
|
See Notes to Financial Statements
16
SCHEDULE OF INVESTMENTS continued
October 31, 2005 (unaudited)
| | | | | Principal | | | | |
| | | | | Amount | | | | Value |
|
| YANKEE OBLIGATIONS - CORPORATE continued | | | | | | | | |
| CONSUMER STAPLES 1.3% | | | | | | | | |
| Food & Staples Retailing 1.3% | | | | | | | | |
| The Jean Coutu Group (PJC), Inc., 8.50%, 08/01/2014 (p) | | $ 12,850,000 | | $ | | 11,982,625 |
| |
|
| ENERGY 0.9% | | | | | | | | |
| Energy Equipment & Services 0.9% | | | | | | | | |
| Petroleum Geo-Services ASA, 10.00%, 11/05/2010 | | 8,050,000 | | | | 8,935,500 |
| |
|
| FINANCIALS 0.7% | | | | | | | | |
| Consumer Finance 0.2% | | | | | | | | |
| Calpine Canada Energy Finance, 8.50%, 05/01/2008 (p) | | 3,335,000 | | | | 1,817,575 |
| |
|
| Diversified Financial Services 0.5% | | | | | | | | |
| Ship Finance International, Ltd., 8.50%, 12/15/2013 | | 4,915,000 | | | | 4,712,256 |
| |
|
| INDUSTRIALS 1.1% | | | | | | | | |
| Marine 0.8% | | | | | | | | |
| CP Ships, Ltd., 10.375%, 07/15/2012 | | | | 6,690,000 | | | | 7,593,150 |
| |
|
| Transportation Infrastructure 0.3% | | | | | | | | |
| Sea Containers, Ltd., 10.50%, 05/15/2012 (p) | | 2,630,000 | | | | 2,610,275 |
| |
|
| INFORMATION TECHNOLOGY 1.0% | | | | | | | | |
| Electronic Equipment & Instruments 1.0% | | | | | | |
| Celestica, Inc.: | | | | | | | | |
| 7.625%, 07/01/2013 | | | | 7,625,000 | | | | 7,453,438 |
| 7.875%, 07/01/2011 | | | | 1,535,000 | | | | 1,527,325 |
| |
|
| | | | | | | | | 8,980,763 |
| |
|
| MATERIALS 2.9% | | | | | | | | |
| Chemicals 0.5% | | | | | | | | |
| Nova Chemicals Corp., 6.50%, 01/15/2012 (p) | | 4,875,000 | | | | 4,680,000 |
| |
|
| Containers & Packaging 1.3% | | | | | | | | |
| Crown European Holdings SA: | | | | | | | | |
| 9.50%, 03/01/2011 | | | | 3,250,000 | | | | 3,575,000 |
| 10.875%, 03/01/2013 | | | | 7,000,000 | | | | 8,242,500 |
| |
|
| | | | | | | | | 11,817,500 |
| |
|
| Metals & Mining 1.1% | | | | | | | | |
| Novelis, Inc., 7.25%, 02/15/2015 144A | | | | 10,940,000 | | | | 10,037,450 |
| |
|
| TELECOMMUNICATION SERVICES 1.1% | | | | | | |
| Wireless Telecommunication Services 1.1% | | | | | | | | |
| Rogers Wireless, Inc.: | | | | | | | | |
| 6.375%, 03/01/2014 | | | | 2,790,000 | | | | 2,796,975 |
| 7.50%, 03/15/2015 | | | | 3,250,000 | | | | 3,501,875 |
| 9.625%, 05/01/2011 (p) | | | | 3,475,000 | | | | 4,004,937 |
| |
|
| | | | | | | | | 10,303,787 |
| |
|
| Total Yankee Obligations-Corporate (cost $97,228,044) | | | | | | | | 97,439,006 |
| |
|
See Notes to Financial Statements
17
SCHEDULE OF INVESTMENTS continued
October 31, 2005 (unaudited)
| | | | | | | Principal | | | | |
| | | | | | | Amount | | | | Value |
|
| CONVERTIBLE DEBENTURES 0.6% | | | | | | | | | | |
| UTILITIES 0.6% | | | | | | | | | | |
| Independent Power Producers & Energy Traders 0.6% | | | | | | | | |
| Calpine Corp., 7.75%, 06/01/2015 (p) (cost $6,525,000) | | | | $ 6,525,000 | | $ | | 5,089,500 |
| |
|
|
| | | | | | | Shares | | | | Value |
|
| COMMON STOCKS 1.0% | | | | | | | | | | |
| CONSUMER DISCRETIONARY 0.6% | | | | | | | | | | |
| Hotels, Restaurants & Leisure 0.2% | | | | | | | | | | |
| Las Vegas Sands Corp. (p) * | | | | | | 65,000 | | | | 2,229,500 |
| |
|
| Media 0.4% | | | | | | | | | | |
| Charter Communications, Inc., Class A (p) * | | | | 425,000 | | | | 510,000 |
| IMAX Corp. (p) * | | | | | | 372,332 | | | | 3,377,052 |
| |
|
| | | | | | | | | | | 3,887,052 |
| |
|
| FINANCIALS 0.0% | | | | | | | | | | |
| Diversified Financial Services 0.0% | | | | | | | | | | |
| Ono Finance plc 144A * (h) + | | | | | | 4,500 | | | | 0 |
| |
|
| MATERIALS 0.3% | | | | | | | | | | |
| Chemicals 0.2% | | | | | | | | | | |
| Huntsman Corp. * | | | | | | 88,065 | | | | 1,750,732 |
| |
|
| Metals & Mining 0.1% | | | | | | | | | | |
| Freeport-McMoRan Copper & Gold, Inc., Class B | | | | 20,000 | | | | 988,400 |
| |
|
| TELECOMMUNICATION SERVICES 0.1% | | | | | | | | |
| Wireless Telecommunication Services 0.1% | | | | | | | | |
| Rural Celluar Corp. (p) * | | | | | | 50,000 | | | | 800,000 |
| |
|
| Total Common Stocks (cost $8,165,421) | | | | | | | | 9,655,684 |
| |
|
| WARRANTS 0.2% | | | | | | | | | | |
| CONSUMER DISCRETIONARY 0.0% | | | | | | | | | | |
| Media 0.0% | | | | | | | | | | |
| Metricom, Inc., Expiring 02/15/2010 * (h) + | | | | 1,500 | | | | 0 |
| |
|
| FINANCIALS 0.0% | | | | | | | | | | |
| Diversified Financial Services 0.0% | | | | | | | | | | |
| Asat Finance, LLC, Expiring 11/01/2006 144A * (h) + | | | | 4,000 | | | | 0 |
| Ono Finance plc, Expiring 05/31/2009 * (h) + | | | | 4,500 | | | | 0 |
| |
|
| | | | | | | | | | | 0 |
| |
|
| TELECOMMUNICATION SERVICES 0.2% | | | | | | | | |
| Wireless Telecommunication Services 0.2% | | | | | | | | |
| American Tower Escrow Corp., Expiring 08/01/2008 * | | | | 4,250 | | | | 1,434,454 |
| |
|
| Total Warrants (cost $842,945) | | | | | | | | 1,434,454 |
| |
|
See Notes to Financial Statements
18
SCHEDULE OF INVESTMENTS continued
October 31, 2005 (unaudited)
| | | | | Shares | | | | Value |
|
| SHORT-TERM INVESTMENTS 21.1% | | | | | | | | |
| MUTUAL FUND SHARES 21.1% | | | | | | | | |
| Evergreen Institutional Money Market Fund ø | | | | 15,527,409 | | $ | | 15,527,409 |
| Navigator Prime Portfolio (pp) | | | | 179,878,196 | | | | 179,878,196 |
| |
|
| Total Short-Term Investments (cost $195,405,605) | | | | | | 195,405,605 |
| |
|
| Total Investments (cost $1,086,705,343) 117.5% | | | | | | | | 1,087,053,337 |
| Other Assets and Liabilities (17.5%) | | | | | | | | (162,262,703) |
| |
|
| Net Assets 100.0% | | | | | | $ | | 924,790,634 |
| |
|
| (p) | | All or a portion of this security is on loan. |
| 144A | | Security that may be sold to qualified institutional buyers under Rule 144A of the Securities Act of 1933, as amended. |
| | | This security has been determined to be liquid under guidelines established by the Board of Trustees, unless otherwise |
| | | noted. |
| † | | Security initially issued in zero coupon form which converts to coupon form at a specified rate and date. An effective |
| | | interest rate is applied to recognize interest income daily for the bond. This rate is based on total expected interest to |
| | | be earned over the life of the bond which consists of the aggregate coupon-interest payments and discount at |
| | | acquisition. The rate shown is the stated rate at the current period end. |
| * | | Non-income producing security |
| (h) | | Security is valued at fair value as determined by the investment advisor in good faith, according to procedures approved |
| | | by the Board of Trustees. |
| + | | Security is deemed illiquid and is valued using market quotations when readily available. |
| ø | | Evergreen Investment Management Company, LLC is the investment advisor to both the Fund and the money market |
| | | fund. |
| (pp) | | Represents investment of cash collateral received from securities on loan. |
| Summary of Abbreviations |
| FNMA | | Federal National Mortgage Association |
| FRN | | Floating Rate Note |
| REIT | | Real Estate Investment Trust |
The following table shows the percent of total investments (excluding equity positions and collateral from securities on loan) by credit quality based on Moody’s and Standard & Poor’s ratings as of October 31, 2005:
| AAA | | 1.9% |
| A | | 0.4% |
| BBB | | 1.0% |
| BB | | 22.7% |
| B | | 65.0% |
| CCC | | 9.0% |
| |
|
| | | 100.0% |
| | |
|
The following table shows the percent of total investments (excluding equity positions and collateral from securities on loan) by maturity as of October 31, 2005:
| Less than 1 year | | 2.5% |
| 1 to 3 year(s) | | 3.5% |
| 3 to 5 years | | 12.2% |
| 5 to 10 years | | 77.2% |
| 10 to 20 years | | 3.3% |
| 20 to 30 years | | 1.3% |
| |
|
| | | 100.0% |
| | |
|
See Notes to Financial Statements
19
STATEMENT OF ASSETS AND LIABILITIES
October 31, 2005 (unaudited)
| Assets | | | | |
| Investments in securities, at value (cost $1,071,177,934) including $177,139,616 of | | | | |
| securities loaned | | $ | | 1,071,525,928 |
| Investments in affiliated money market fund, at value (cost $15,527,409) | | | | 15,527,409 |
|
| Total investments | | | | 1,087,053,337 |
| Receivable for securities sold | | | | 90,713 |
| Receivable for Fund shares sold | | | | 533,733 |
| Dividends and interest receivable | | | | 21,462,145 |
| Receivable for securities lending income | | | | 96,893 |
| Prepaid expenses and other assets | | | | 349,608 |
|
| Total assets | | | | 1,109,586,429 |
|
| Liabilities | | | | |
| Dividends payable | | | | 2,180,145 |
| Payable for Fund shares redeemed | | | | 2,592,338 |
| Payable for securities on loan | | | | 179,878,196 |
| Advisory fee payable | | | | 18,895 |
| Distribution Plan expenses payable | | | | 13,792 |
| Due to other related parties | | | | 1,979 |
| Accrued expenses and other liabilities | | | | 110,450 |
|
| Total liabilities | | | | 184,795,795 |
|
| Net assets | | $ | | 924,790,634 |
|
| Net assets represented by | | | | |
| Paid-in capital | | $ | | 1,061,613,910 |
| Overdistributed net investment income | | | | (5,323,157) |
| Accumulated net realized losses on investments | | | | (131,848,113) |
| Net unrealized gains on investments | | | | 347,994 |
|
| Total net assets | | $ | | 924,790,634 |
|
| Net assets consists of | | | | |
| Class A | | $ | | 429,140,496 |
| Class B | | | | 195,219,655 |
| Class C | | | | 240,214,527 |
| Class I | | | | 60,215,956 |
|
| Total net assets | | $ | | 924,790,634 |
|
| Shares outstanding (unlimited number of shares authorized) | | | | |
| Class A | | | | 130,009,473 |
| Class B | | | | 59,144,110 |
| Class C | | | | 72,775,031 |
| Class I | | | | 18,241,813 |
|
| Net asset value per share | | | | |
| Class A | | $ | | 3.30 |
| Class A — Offering price (based on sales charge of 4.75%) | | $ | | 3.46 |
| Class B | | $ | | 3.30 |
| Class C | | $ | | 3.30 |
| Class I | | $ | | 3.30 |
|
See Notes to Financial Statements
20
STATEMENT OF OPERATIONS
Six Months Ended October 31, 2005 (unaudited)
| Investment income | | | | |
| Interest income (net of foreign withholding taxes of $19,510) | | $ | | 38,701,925 |
| Securities lending | | | | 545,255 |
| Income from affiliate | | | | 492,862 |
| Dividends | | | | 14,169 |
|
| Total investment income | | | | 39,754,211 |
|
| Expenses | | | | |
| Advisory fee | | | | 2,012,653 |
| Distribution Plan expenses | | | | |
| Class A | | | | 712,032 |
| Class B | | | | 1,037,874 |
| Class C | | | | 1,324,191 |
| Administrative services fee | | | | 504,426 |
| Transfer agent fees | | | | 925,816 |
| Trustees’ fees and expenses | | | | 6,690 |
| Printing and postage expenses | | | | 36,522 |
| Custodian and accounting fees | | | | 146,139 |
| Registration and filing fees | | | | 39,787 |
| Professional fees | | | | 15,039 |
| Other | | | | 12,187 |
|
| Total expenses | | | | 6,773,356 |
| Less: Expense reductions | | | | (11,867) |
| Expense reimbursements | | | | (1,649) |
|
| Net expenses | | | | 6,759,840 |
|
| Net investment income | | | | 32,994,371 |
|
| Net realized and unrealized gains or losses on investments | | | | |
| Net realized losses on investments | | | | (694,348) |
| Net change in unrealized gains or losses on investments | | | | (2,241,263) |
|
| Net realized and unrealized gains or losses on investments | | | | (2,935,611) |
|
| Net increase in net assets resulting from operations | | $ | | 30,058,760 |
|
See Notes to Financial Statements
21
STATEMENTS OF CHANGES IN NET ASSETS
| | | Six Months Ended | | |
| | | October 31, 2005 | | Year Ended |
| | | (unaudited) | | April 30, 2005 |
|
| Operations | | | | | | | | |
| Net investment income | | | $ | 32,994,371 | | | $ | 76,221,565 |
| Net realized gains or losses on | | | | | | | | |
| investments | | | | (694,348) | | | | 25,834,013 |
| Net change in unrealized gains or | | | | | | | | |
| losses on investments | | | | (2,241,263) | | | | (58,429,108) |
|
| Net increase in net assets resulting | | | | | | | | |
| from operations | | | | 30,058,760 | | | | 43,626,470 |
|
| Distributions to shareholders | | | | | | | | |
| from | | | | | | | | |
| Net investment income | | | | | | | | |
| Class A | | | | (16,508,372) | | | | (37,029,733) |
| Class B | | | | (6,493,645) | | | | (15,487,174) |
| Class C | | | | (8,288,178) | | | | (22,203,970) |
| Class I | | | | (2,399,547) | | | | (3,329,864) |
|
| Total distributions to shareholders | | | | (33,689,742) | | | | (78,050,741) |
|
| | | Shares | | | | Shares | | |
| Capital share transactions | | | | | | | | |
| Proceeds from shares sold | | | | | | | | |
| Class A | | 18,054,483 | | 60,914,486 | | 35,421,081 | | 121,218,744 |
| Class B | | 2,509,214 | | 8,448,881 | | 7,948,374 | | 27,307,221 |
| Class C | | 2,357,886 | | 7,922,618 | | 10,841,400 | | 37,359,748 |
| Class I | | 7,936,940 | | 26,647,172 | | 12,543,483 | | 42,583,297 |
|
| | | | | 103,933,157 | | | | 228,469,010 |
|
| Net asset value of shares issued in | | | | | | | | |
| reinvestment of distributions | | | | | | | | |
| Class A | | 3,375,192 | | 11,379,183 | | 7,303,420 | | 25,011,324 |
| Class B | | 933,035 | | 3,144,261 | | 2,202,244 | | 7,541,103 |
| Class C | | 1,321,904 | | 4,455,275 | | 3,579,614 | | 12,258,383 |
| Class I | | 232,767 | | 784,375 | | 359,166 | | 1,232,162 |
|
| | | | | 19,763,094 | | | | 46,042,972 |
|
| Automatic conversion of Class B | | | | | | | | |
| shares to Class A shares | | | | | | | | |
| Class A | | 664,196 | | 2,238,523 | | 936,476 | | 3,224,666 |
| Class B | | (664,196) | | (2,238,523) | | (936,476) | | (3,224,666) |
|
| | | | | 0 | | | | 0 |
|
| Payment for shares redeemed | | | | | | | | |
| Class A | | (33,074,892) | | (111,304,381) | | (57,549,646) | | (196,416,528) |
| Class B | | (7,524,595) | | (25,306,136) | | (17,646,027) | | (60,266,215) |
| Class C | | (15,851,778) | | (53,156,776) | | (40,851,398) | | (139,522,820) |
| Class I | | (8,137,667) | | (27,392,829) | | (5,754,273) | | (19,682,937) |
|
| | | | | (217,160,122) | | | | (415,888,500) |
|
| Net decrease in net assets resulting | | | | | | | | |
| from capital share transactions | | | | (93,463,871) | | | | (141,376,518) |
|
| Total decrease in net assets | | | | (97,094,853) | | | | (175,800,789) |
| Net assets | | | | | | | | |
| Beginning of period | | | | 1,021,885,487 | | | | 1,197,686,276 |
|
| End of period | | | $ | 924,790,634 | | | $ | 1,021,885,487 |
|
| Overdistributed net investment income | | | $ | (5,323,157) | | | $ | (2,471,797) |
|
See Notes to Financial Statements
22
NOTES TO FINANCIAL STATEMENTS (unaudited)
1. ORGANIZATION
Evergreen High Yield Bond Fund (the “Fund”) is a diversified series of Evergreen Fixed Income Trust (the “Trust”), a Delaware statutory trust organized on September 18, 1997. The Trust is an open-end management investment company registered under the Investment Company Act of 1940, as amended (the “1940 Act”).
The Fund offers Class A, Class B, Class C and Institutional (“Class I”) shares. Class A shares are sold with a front-end sales charge. However, Class A share investments of $1 million or more are not subject to a front-end sales charge but will be subject to a contingent deferred sales charge of 1.00% upon redemption within one year. Class B shares are sold without a front-end sales charge but are subject to a contingent deferred sales charge that is payable upon redemption and decreases depending on how long the shares have been held. Class C shares are sold without a front-end sales charge but are subject to a contingent deferred sales charge that is payable upon redemption within one year. Class I shares are sold without a front-end sales charge or contingent deferred sales charge. Each class of shares, except Class I shares, pays an ongoing distribution fee.
2. SIGNIFICANT ACCOUNTING POLICIES
The following is a summary of significant accounting policies consistently followed by the Fund in the preparation of its financial statements. The policies are in conformity with generally accepted accounting principles in the United States of America, which require management to make estimates and assumptions that affect amounts reported herein. Actual results could differ from these estimates.
a. Valuation of investments
Portfolio debt securities acquired with more than 60 days to maturity are fair valued using matrix pricing methods determined by an independent pricing service which takes into consideration such factors as similar security prices, yields, maturities, liquidity and ratings. Securities for which valuations are not readily available from an independent pricing service may be valued by brokers which use prices provided by market makers or estimates of market value obtained from yield data relating to investments or securities with similar characteristics.
Listed equity securities are usually valued at the last sales price or official closing price on the national securities exchange where the securities are principally traded.
Foreign securities traded on an established exchange are valued at the last sales price on the exchange where the security is primarily traded. If there has been no sale, the securities are valued at the mean between bid and asked prices. Foreign securities may be valued at fair value according to procedures approved by the Board of Trustees if the closing price is not reflective of current market values due to trading or events occurring in the foreign markets between the close of the established exchange and the valuation time of the Fund. In addition, substantial changes in values in the U.S. markets subsequent to the close of a foreign market may also affect the values of securities traded in the foreign market. The value of foreign securities may be adjusted if such movements in the U.S. market exceed a specified threshold.
Short-term securities with remaining maturities of 60 days or less at the time of purchase are valued at amortized cost, which approximates market value.
Investments in other mutual funds are valued at net asset value. Securities for which market quotations are not readily available or not reflective of current market value are valued at fair value as determined by the investment advisor in good faith, according to procedures approved by the Board of Trustees.
23
NOTES TO FINANCIAL STATEMENTS (unaudited) continued
b. Foreign currency translation
All assets and liabilities denominated in foreign currencies are translated into U.S. dollar amounts at the date of valuation. Purchases and sales of portfolio securities and income items denominated in foreign currencies are translated into U.S. dollar amounts on the respective dates of such transactions. The Fund does not separately account for that portion of the results of operations resulting from changes in foreign exchange rates on investments and the fluctuations arising from changes in market prices of securities held. Such fluctuations are included with the net realized and unrealized gains or losses on investments.
c. When-issued and delayed delivery transactions
The Fund records when-issued or delayed delivery securities as of trade date and maintains security positions such that sufficient liquid assets will be available to make payment for the securities purchased. Securities purchased on a when-issued or delayed delivery basis are marked-to-market daily and begin earning interest on the settlement date. Losses may occur on these transactions due to changes in market conditions or the failure of counterparties to perform under the contract.
d. Securities lending
The Fund may lend its securities to certain qualified brokers in order to earn additional income. The Fund receives compensation in the form of fees or interest earned on the investment of any cash collateral received. The Fund also continues to receive interest and dividends on the securities loaned. The Fund receives collateral in the form of cash or securities with a market value at least equal to the market value of the securities on loan, including accrued interest. In the event of default or bankruptcy by the borrower, the Fund could experience delays and costs in recovering the loaned securities or in gaining access to the collateral. The Fund has the right under the lending agreement to recover the securities from the borrower on demand.
e. Security transactions and investment income
Security transactions are recorded on trade date. Realized gains and losses are computed using the specific cost of the security sold. Interest income is recorded on the accrual basis and includes accretion of discounts and amortization of premiums. Dividend income is recorded on the ex-dividend date. Foreign income and capital gains realized on some securities may be subject to foreign taxes, which are accrued as applicable.
f. Federal taxes
The Fund intends to continue to qualify as a regulated investment company and distribute all of its taxable income, including any net capital gains (which have already been offset by available capital loss carryovers). Accordingly, no provision for federal taxes is required.
g. Distributions
Distributions to shareholders from net investment income are accrued daily and paid monthly. Distributions from net realized gains, if any, are recorded on the ex-dividend date. Such distributions are determined in conformity with income tax regulations, which may differ from generally accepted accounting principles.
h. Class allocations
Income, common expenses and realized and unrealized gains and losses are allocated to the classes based on the relative net assets of each class. Distribution fees, if any, are calculated daily at the class level based on the appropriate net assets of each class and the specific expense rates applicable to each class.
24
NOTES TO FINANCIAL STATEMENTS (unaudited) continued
3. ADVISORY FEE AND OTHER TRANSACTIONS WITH AFFILIATES
Evergreen Investment Management Company, LLC (“EIMC”), an indirect, wholly-owned subsidiary of Wachovia Corporation (“Wachovia”), is the investment advisor to the Fund and is paid a fee at an annual rate of 2% of the Fund’s gross investment income plus an amount determined by applying percentage rates to the average daily net assets of the Fund, starting at 0.31% and declining to 0.16% as average daily net assets increase.
From time to time, EIMC may voluntarily or contractually waive its fee and/or reimburse expenses in order to limit operating expenses. During the six months ended October 31, 2005, EIMC reimbursed Distribution Plan expenses (see Note 4) relating to Class A shares in the amount of $1,649.
Evergreen Investment Services, Inc. (“EIS”), an indirect, wholly-owned subsidiary of Wachovia, is the administrator to the Fund. As administrator, EIS provides the Fund with facilities, equipment and personnel and is paid an annual rate determined by applying percentage rates to the aggregate average daily net assets of the Evergreen funds (excluding money market funds), starting at 0.10% and declining to 0.05% as the aggregate average daily net assets of the Evergreen funds (excluding money market funds) increase.
Evergreen Service Company, LLC (“ESC”), an indirect, wholly-owned subsidiary of Wachovia, is the transfer and dividend disbursing agent for the Fund. ESC receives account fees that vary based on the type of account held by the shareholders in the Fund. For the six months ended October 31, 2005, the transfer agent fees were equivalent to an annual rate of 0.18% of the Fund’s average daily net assets.
The Fund has placed a portion of its portfolio transactions with brokerage firms that are affiliates of Wachovia. During the six months ended October 31, 2005, the Fund paid brokerage commissions of $7,788 to Wachovia Securities, LLC.
4. DISTRIBUTION PLANS
EIS also serves as distributor of the Fund’s shares. The Fund has adopted Distribution Plans, as allowed by Rule 12b-1 of the 1940 Act, for each class of shares, except Class I. Under the Distribution Plans, distribution fees are paid at an annual rate of 0.30% of the average daily net assets for Class A shares, and 1.00% of the average daily net assets for each of Class B and Class C shares.
For the six months ended October 31, 2005, EIS received $20,969 from the sale of Class A shares and $304,726 and $8,966 in contingent deferred sales charges from redemptions of Class B and Class C shares, respectively.
5. SECURITIES TRANSACTIONS
Cost of purchases and proceeds from sales of investment securities (excluding short-term securities) were $225,108,519 and $306,258,720, respectively, for the six months ended October 31, 2005.
During the six months ended October 31, 2005, the Fund loaned securities to certain brokers. At October 31, 2005, the value of securities on loan and the value of collateral amounted to $177,139,616 and $179,878,196, respectively.
On October 31, 2005, the aggregate cost of securities for federal income tax purposes was $1,086,790,088. The gross unrealized appreciation and depreciation on securities based on tax cost was $24,978,859 and $24,715,610, respectively, with a net unrealized appreciation of $263,249.
25
NOTES TO FINANCIAL STATEMENTS (unaudited) continued
As of April 30, 2005, the Fund had $131,069,020 in capital loss carryovers for federal income tax purposes expiring as follows:
| Expiration |
|
| 2008 | | 2009 | | 2010 | | 2011 |
|
| $19,168,229 | | $ 38,451,200 | | $ 57,513,490 | | $ 15,936,101 |
|
6. INTERFUND LENDING
Pursuant to an Exemptive Order issued by the SEC, the Fund may participate in an interfund lending program with certain funds in the Evergreen fund family. This program allows the Fund to borrow from, or lend money to, other participating funds. During the six months ended October 31 2005, the Fund did not participate in the interfund lending program.
7. EXPENSE REDUCTIONS
Through expense offset arrangements with ESC and the Fund’s custodian, a portion of fund expenses has been reduced.
8. DEFERRED TRUSTEES’ FEES
Each Trustee of the Fund may defer any or all compensation related to performance of their duties as Trustees. The Trustees’ deferred balances are allocated to deferral accounts, which are included in the accrued expenses for the Fund. The investment performance of the deferral accounts is based on the investment performance of certain Evergreen funds. Any gains earned or losses incurred in the deferral accounts are reported in the Fund’s Trustees’ fees and expenses. At the election of the Trustees, the deferral account will be paid either in one lump sum or in quarterly installments for up to ten years.
9. FINANCING AGREEMENT
The Fund and certain other Evergreen funds share in a $150 million unsecured revolving credit commitment for temporary and emergency purposes, including the funding of redemptions, as permitted by each participating fund’s borrowing restrictions. Borrowings under this facility bear interest at 0.50% per annum above the Federal Funds rate. All of the participating funds are charged an annual commitment fee of 0.09% of the unused balance, which is allocated pro rata. During the six months ended October 31, 2005, the Fund had no borrowings under this agreement.
10. CONCENTRATION OF RISK
The Fund may invest a substantial portion of its assets in an industry or sector and, therefore, may be more affected by changes in that industry or sector than would be a comparable mutual fund that is not heavily weighted in any industry or sector.
11. REGULATORY MATTERS AND LEGAL PROCEEDINGS
Since September 2003, governmental and self-regulatory authorities have instituted numerous ongoing investigations of various practices in the mutual fund industry, including investigations relating to revenue sharing, market-timing, late trading and record retention, among other things. The investigations cover investment advisors, distributors and transfer agents to mutual funds, as well as other firms. EIMC, EIS and ESC (collectively, “Evergreen”) have received subpoenas and other requests for documents and testimony relating to these investigations, are endeavoring to comply with those requests, and are cooperating with the investigations. Evergreen is continuing its own internal review of policies, practices, procedures and personnel, and is taking remedial action where appropriate.
26
NOTES TO FINANCIAL STATEMENTS (unaudited) continued
In connection with one of these investigations, on July 28, 2004, the staff of the Securities and Exchange Commission (“SEC”) informed Evergreen that the staff intends to recommend to the SEC that it institute an enforcement action against Evergreen. The SEC staff’s proposed allegations relate to (i) an arrangement pursuant to which a broker at one of EIMC’s affiliated broker-dealers had been authorized, apparently by an EIMC officer (no longer with EIMC), to engage in short-term trading, on behalf of a client, in Evergreen Mid Cap Growth Fund (formerly Evergreen Emerging Growth Fund and prior to that, known as Evergreen Small Company Growth Fund) during the period from December 2000 through April 2003, in excess of the limitations set forth in the fund’s prospectus, (ii) short-term trading from September 2001 through January 2003, by a former Evergreen portfolio manager, of Evergreen Precious Metals Fund, a fund he managed at the time, (iii) the sufficiency of systems for monitoring exchanges and enforcing exchange limitations as stated in the fund’s prospectuses, and (iv) the adequacy of e-mail retention practices. In connection with the activity in Evergreen Mid Cap Growth Fund, EIMC reimbursed the fund $378,905, plus an additional $25,242, representing what EIMC calculated at that time to be the client’s net gain and the fees earned by EIMC and the expenses incurred by this fund on the client’s account. In connection with the activity in Evergreen Precious Metals Fund, EIMC reimbursed the fund $70,878, plus an additional $3,075, representing what EIMC calculated at that time to be the portfolio manager’s net gain and the fees earned by EIMC and expenses incurred by the fund on the portfolio manager’s account. Evergreen is currently engaged in discussions with the staff of the SEC concerning its recommendation.
The staff of the National Association of Securities Dealers (“NASD”) had notified EIS that it has made a preliminary determination to recommend that disciplinary action be brought against EIS for certain violations of the NASD’s rules. The recommendation relates principally to allegations that EIS (i) arranged for fund portfolio trades to be directed to broker-dealers (including Wachovia Securities, LLC, an affiliate of EIS) that sold Evergreen fund shares during the period of January 2001 to December 2003 and (ii) provided non-cash compensation by sponsoring offsite meetings attended by Wachovia Securities, LLC brokers during that period. EIS is cooperating with the NASD staff in its review of these matters.
Any resolution of these matters with regulatory authorities may include, but not be limited to, sanctions, penalties or injunctions regarding Evergreen, restitution to mutual fund shareholders and/or other financial penalties and structural changes in the governance or management of Evergreen’s mutual fund business. Any penalties or restitution will be paid by Evergreen and not by the Evergreen funds.
In addition, the Evergreen funds and EIMC and certain of its affiliates are involved in various legal actions, including private litigation and class action lawsuits. EIMC does not expect that any of such legal actions currently pending or threatened will have a material adverse impact on the financial position or operations of any of the Evergreen funds or on EIMC’s ability to provide services to the Evergreen funds.
Although Evergreen believes that neither the foregoing investigations nor any pending or threatened legal actions will have a material adverse impact on the Evergreen funds, there can be no assurance that these matters and any publicity surrounding or resulting from them will not result in reduced sales or increased redemptions of Evergreen fund shares, which could increase Evergreen fund transaction costs or operating expenses, or have other adverse consequences on the Evergreen funds.
27
ADDITIONAL INFORMATION (unaudited)
INFORMATION ABOUT THE REVIEW AND APPROVAL OF THE FUND’S INVESTMENT ADVISORY AGREEMENT
Each year, the Fund’s Board of Trustees is required to consider whether to continue in place the Fund’s investment advisory agreement. In September 2005, the Trustees, including a majority of the Trustees who are not interested persons (as that term is defined in the 1940 Act) of the Fund or of EIMC, approved the continuation of the Fund’s investment advisory agreement.
At the same time, the Trustees considered the continuation of the investment advisory agreements for all of the Evergreen funds, and the description below refers in many cases to the Trustees’ process and conclusions in connection with their consideration of this matter for all of the Evergreen funds. In all of its deliberations, the Board of Trustees and the disinterested Trustees were advised by independent counsel to the disinterested Trustees and counsel to the Funds.
The review process. The 1940 Act requires that the Board of Trustees request and evaluate, and that EIMC furnish, such information as may reasonably be necessary to evaluate the terms of the Fund’s advisory agreement. The review process began formally in spring 2005, when a committee of the Board (the “Committee”), working with EIMC management, determined generally the types of information the Board would review and set a timeline for the review process. In late spring, counsel to the disinterested Trustees sent to EIMC a formal request for information to be furnished to the Trustees. In addition, the independent data provider Lipper Inc. (“Lipper”) was engaged to provide Fund-specific and industry-wide data to the Board containing information of a nature and in a format generally prescribed by the Committee.
The Trustees reviewed EIMC’s responses to the request for information, with the assistance of counsel for the disinterested Trustees and for the Funds and an independent industry consultant retained by the disinterested Trustees, and requested and received additional information following that review. The Committee met in person with the representatives of EIMC in early September. At a meeting of the full Board of Trustees later in September, the Committee reported the results of its discussions with EIMC, and the full Board met with representatives of EIMC, engaged in further review of the materials provided to them, and approved the continuation of each of the advisory and sub-advisory agreements.
The disinterested Trustees discussed the continuation of the Fund’s advisory agreement with representatives of EIMC and in multiple private sessions with legal counsel at which no personnel of EIMC were present. In considering the continuation of the agreement, the Trustees did not identify any particular information or consideration that was all-important or controlling, and each Trustee attributed different weights to various factors. The Trustees evaluated information provided to them both in terms of the Evergreen mutual funds generally and in respect of the Fund specifically as they considered appropriate; although the Trustees considered the continuation of the agreement as part of the larger process of considering the continuation of the advisory contracts for all of the Evergreen funds, their determination to continue the advisory agreement for each of the funds was ultimately made on a fund-by-fund basis.
This summary describes the most important, but not necessarily all, of the factors considered by the Board and the disinterested Trustees.
Information reviewed. The Board of Trustees and committees of the Board of Trustees meet periodically during the course of the year. At those meetings, the Board receives a wide variety of information regarding the services performed by EIMC, the investment performance of the Fund
28
ADDITIONAL INFORMATION (unaudited) continued
and the other Evergreen funds, and other aspects of the business and operations of the funds. At those meetings, and in the process of considering the continuation of the agreements, the Trustees considered information regarding, for example, the Fund’s investment results; the portfolio management team for the Fund and the experience of the members of that team, and any recent changes in the membership of the team; portfolio trading practices; compliance by the Fund and EIMC with applicable laws and regulations and with the Fund’s and EIMC’s compliance policies and procedures; services provided by affiliates of EIMC to the Fund and shareholders of the Fund; and other information relating to the nature, extent, and quality of services provided by EIMC. The Trustees considered the rates at which the Fund pays investment advisory fees, the total expense ratio of the Fund, and the efforts generally by EIMC and its affiliates as sponsors of the Fund. The data provided by Lipper showed the fees paid by the Fund and the Fund’s total expense ratio in comparison to other similar mutual funds, in addition to data regarding the investment performance by the funds in comparison to other similar mutual funds. The Trustees were assisted by the independent industry consultant in reviewing the information presented to them.
The Board also considered that EIS serves as administrator to the Fund and receives a fee for its services as administrator. In their comparison of the advisory fee paid by the Fund with those paid by other mutual funds, the Board took into account administrative fees paid by the Fund and those other mutual funds. The Board considered that affiliates of EIMC serve as transfer agent and distributor to the Fund and receive fees from the Fund for those services, and received information regarding recent reductions in the transfer agency fees paid by the Fund. They considered other so-called “fall-out” benefits to EIMC and its affiliates due to their other relationships with the Evergreen funds, including, for example, soft-dollar services received by EIMC attributable to transactions entered into by EIMC for the benefit of the funds and brokerage commissions received by Wachovia Securities LLC, an affiliate of EIMC, from transactions effected by it for the funds.
Nature and quality of the services provided. The Trustees considered that EIMC and its affili-ates provide a comprehensive investment management service to the Fund. They noted that EIMC formulates and implements an investment program for the Fund. They noted that EIMC makes its personnel available to serve as officers of the Evergreen funds, and concluded that the reporting and management functions provided by EIMC with respect to the Fund and the Evergreen funds overall were generally satisfactory. The Trustees considered the investment philosophy of the Fund’s portfolio management team, and considered the in-house research capabilities of EIMC and its affiliates, as well as other resources available to EIMC, including research services available to it from third parties. The Board considered the managerial and financial resources available to EIMC, and the commitment that the Wachovia organization has made to the Fund and the Evergreen funds generally. On the basis of these factors, they determined that the nature and scope of the services provided by EIMC were consistent with their duties under the investment advisory agreements and appropriate and consistent with the investment programs and best interests of the Fund.
The Trustees noted the commitment and resources EIMC and its affiliates have committed to the regulatory, compliance, accounting, tax and tax reporting, and shareholder servicing functions, and the number and quality of staff committed to those functions, which they concluded were appropriate and generally in line with EIMC’s responsibilities to the Fund and to the Evergreen funds generally. They noted that EIMC had enhanced a number of these functions in recent periods and continued to do so, in light of regulatory developments in the investment management and mutual fund industries generally and in light of regulatory matters involving EIMC and
29
ADDITIONAL INFORMATION (unaudited) continued
its affiliates. They concluded that those enhancements appeared generally appropriate, but considered that the enhancement process is an on-going one and determined to continue to monitor developments in these functions in coming periods for appropriateness and consistency with regulatory and industry developments. The Board and the disinterested Trustees concluded, within the context of their overall conclusions regarding the Fund’s advisory agreement, that they were satisfied with the nature, extent, and quality of the services provided by EIMC, including services provided by EIS under its administrative services agreement with the Fund.
Investment performance. The Trustees considered the investment performance of each of the Evergreen funds, both by comparison to other comparable mutual funds and to broad market indices. The Trustees emphasized that the continuation of the investment advisory agreement for a fund should not be taken as any indication that the Trustees did not believe investment performance for any specific fund might not be improved, and they noted that they would continue to monitor closely the investment performance of the funds going forward. Specifically with respect to the Fund, the Trustees noted that the Class A shares of the Fund performed in the fifth quin-tile over recently completed one- and three-year periods and in the second quintile over the recently completed five-year period. The Trustees noted that the Fund’s assets are principally invested in lower-rated debt securities, and that EIMC generally maintains a relatively high-quality bias in that asset class. EIMC reported to the Trustees that, in recent periods, funds with a high-quality bias like the Fund’s had generally underperformed other investment products investing in lower-quality issuers, contributing substantially to the Fund’s relative underperfor-mance; EIMC said that it expected the Fund’s relative performance to improve as market conditions change to favor that bias.
Advisory and administrative fees. The Trustees recognized that EIMC does not seek to provide the lowest cost investment advisory service, but to provide a high quality, full-service investment management product at a reasonable price. They also noted that EIMC has generally attempted to make its investment advisory fees consistent with industry norms. The Trustees noted that, from the materials presented, it appeared that the combination of investment advisory and administrative fees paid by the Fund to EIMC and EIS with respect to Class A shares was below the median of fees paid by comparable funds.
The Trustees noted that EIMC does not provide services to other clients using the same investment strategy as it uses in managing the Fund.
Economies of scale. The Trustees noted that economies of scale would likely be achieved by EIMC in managing the Evergreen funds as the funds grow. The Trustees noted that the Fund had implemented breakpoints in its advisory fee structure. The Trustees undertook to continue to review the appropriate levels of breakpoints in the future, but concluded that the breakpoints as implemented appeared to be a reasonable step toward the realization of economies of scale by the funds.
Profitability. The Trustees considered information provided to them regarding the profitability to the EIMC organization of the investment advisory, administration, and transfer agency fees paid to EIMC and its affiliates by each of the funds. They considered that the information provided to them was necessarily estimated. They noted that the levels of profitability of the funds to EIMC varied widely, depending on among other things the size and type of Fund. They noted that all of the estimates provided to them were calculated on a pre-tax basis. They considered the profitability of the funds in light of such factors as, for example, the information they had received regarding the relation of the fees paid by the funds to those paid by other mutual funds, the investment performance of the funds, and the amount of revenues involved. In light of these
30
ADDITIONAL INFORMATION (unaudited) continued
factors, the Trustees did not consider that the profitability of any of the funds, individually or in the aggregate, was such as to prevent their approving the continuation of the agreements.
In connection with their review of the Fund’s investment advisory and administrative fees, the Trustees also considered the transfer agency fees paid by the funds to an affiliate of EIMC. They reviewed information presented to them showing generally that the transfer agency fees charged to the funds were generally consistent with industry norms, and that transfer agency fees for a number of funds had recently declined, or were expected to in the near future.
31
TRUSTEES AND OFFICERS
TRUSTEES1
| Charles A. Austin III | | Principal occupations: Investment Counselor, Anchor Capital Advisors, Inc. (investment advice); |
| Trustee | | Director, The Andover Companies (insurance); Trustee, Arthritis Foundation of New England; |
| DOB: 10/23/1934 | | Former Director, The Francis Ouimet Society; Former Director, Health Development Corp. |
| Term of office since: 1991 | | (fitness-wellness centers); Former Director, Mentor Income Fund, Inc.; Former Trustee, |
| Other directorships: None | | Mentor Funds and Cash Resource Trust; Former Investment Counselor, Appleton Partners, Inc. |
| | | (investment advice); Former Director, Executive Vice President and Treasurer, State Street |
| | | Research & Management Company (investment advice) |
|
| Shirley L. Fulton | | Principal occupations: Partner, Tin, Fulton, Greene & Owen, PLLC (law firm); Former Partner, |
| Trustee | | Helms, Henderson & Fulton, P.A. (law firm); Retired Senior Resident Superior Court Judge, |
| DOB: 1/10/1952 | | 26th Judicial District, Charlotte, NC |
| Term of office since: 2004 | | |
| Other directorships: None | | |
|
| K. Dun Gifford | | Principal occupations: Chairman and President, Oldways Preservation and Exchange Trust |
| Trustee | | (education); Trustee, Treasurer and Chairman of the Finance Committee, Cambridge College; |
| DOB: 10/23/1938 | | Former Chairman of the Board, Director, and Executive Vice President, The London Harness |
| Term of office since: 1974 | | Company (leather goods purveyor); Former Director, Mentor Income Fund, Inc.; Former Trustee, |
| Other directorships: None | | Mentor Funds and Cash Resource Trust |
|
| Dr. Leroy Keith, Jr. | | Principal occupations: Partner, Stonington Partners, Inc. (private equity firm); Trustee, |
| Trustee | | The Phoenix Group of Mutual Funds; Director, Obagi Medical Products Co.; Director, |
| DOB: 2/14/1939 | | Diversapack Co.; Former Director, Lincoln Educational Services; Former Chairman of the Board |
| Term of office since: 1983 | | and Chief Executive Officer, Carson Products Company (manufacturing); Former Director, |
| Other directorships: Trustee, The | | Mentor Income Fund, Inc.; Former Trustee, Mentor Funds and Cash Resource Trust |
| Phoenix Group of Mutual Funds | | |
|
| Gerald M. McDonnell | | Principal occupations: Manager of Commercial Operations, SMI Steel Co. – South Carolina |
| Trustee | | (steel producer); Former Sales and Marketing Manager, Nucor Steel Company; Former Director, |
| DOB: 7/14/1939 | | Mentor Income Fund, Inc.; Former Trustee, Mentor Funds and Cash Resource Trust |
| Term of office since: 1988 | | |
| Other directorships: None | | |
|
| William Walt Pettit | | Principal occupations: Vice President, Kellam & Pettit, P.A. (law firm); Director, Superior |
| Trustee | | Packaging Corp.; Director, National Kidney Foundation of North Carolina, Inc.; Former Director, |
| DOB: 8/26/1955 | | Mentor Income Fund, Inc.; Former Trustee, Mentor Funds and Cash Resource Trust |
| Term of office since: 1984 | | |
| Other directorships: None | | |
|
| David M. Richardson | | Principal occupations: President, Richardson, Runden LLC (executive recruitment business |
| Trustee | | development/consulting company); Consultant, Kennedy Information, Inc. (executive |
| DOB: 9/19/1941 | | recruitment information and research company); Consultant, AESC (The Association of |
| Term of office since: 1982 | | Executive Search Consultants); Director, J&M Cumming Paper Co. (paper merchandising); |
| Other directorships: None | | Former Trustee, NDI Technologies, LLP (communications); Former Vice Chairman, DHR |
| | | International, Inc. (executive recruitment); Former Director, Mentor Income Fund, Inc.; |
| | | Former Trustee, Mentor Funds and Cash Resource Trust |
|
| Dr. Russell A. Salton III | | Principal occupations: President/CEO, AccessOne MedCard; Former Medical Director, |
| Trustee | | Healthcare Resource Associates, Inc.; Former Medical Director, U.S. Health Care/Aetna Health |
| DOB: 6/2/1947 | | Services; Former Director, Mentor Income Fund, Inc.; Former Trustee, Mentor Funds and |
| Term of office since: 1984 | | Cash Resource Trust |
| Other directorships: None | | |
|
32
TRUSTEES AND OFFICERS continued
| Michael S. Scofield | | Principal occupations: Director and Chairman, Branded Media Corporation (multi-media |
| Trustee | | branding company); Attorney, Law Offices of Michael S. Scofield; Former Director, Mentor |
| DOB: 2/20/1943 | | Income Fund, Inc.; Former Trustee, Mentor Funds and Cash Resource Trust |
| Term of office since: 1984 | | |
| Other directorships: None | | |
|
| Richard J. Shima | | Principal occupations: Independent Consultant; Director, Trust Company of CT; Trustee, |
| Trustee | | Saint Joseph College (CT); Director, Hartford Hospital; Trustee, Greater Hartford YMCA; |
| DOB: 8/11/1939 | | Former Director, Enhance Financial Services, Inc.; Former Director, Old State House Association; |
| Term of office since: 1993 | | Former Director of CTG Resources, Inc. (natural gas); Former Director, Mentor Income Fund, Inc.; |
| Other directorships: None | | Former Trustee, Mentor Funds and Cash Resource Trust |
|
| Richard K. Wagoner, CFA2 | | Principal occupations: Member and Former President, North Carolina Securities Traders |
| Trustee | | Association; Member, Financial Analysts Society; Former Consultant to the Boards of Trustees |
| DOB: 12/12/1937 | | of the Evergreen funds; Former Trustee, Mentor Funds and Cash Resource Trust |
| Term of office since: 1999 | | |
| Other directorships: None | | |
|
| OFFICERS | | |
| Dennis H. Ferro3 | | Principal occupations: President and Chief Executive Officer, Evergreen Investment Company, |
| President | | Inc. and Executive Vice President, Wachovia Bank, N.A.; former Chief Investment Officer, |
| DOB: 6/20/1945 | | Evergreen Investment Company, Inc. |
| Term of office since: 2003 | | |
|
| Kasey Phillips4 | | Principal occupations: Senior Vice President, Evergreen Investment Services, Inc.; Former Vice |
| Treasurer | | President, Evergreen Investment Services, Inc.; Former Assistant Vice President, Evergreen |
| DOB: 12/12/1970 | | Investment Services, Inc. |
| Term of office since: 2005 | | |
|
| Michael H. Koonce4 | | Principal occupations: Senior Vice President and General Counsel, Evergreen Investment |
| Secretary | | Services, Inc.; Senior Vice President and Assistant General Counsel, Wachovia Corporation |
| DOB: 4/20/1960 | | |
| Term of office since: 2000 | | |
|
| James Angelos4 | | Principal occupations: Chief Compliance Officer and Senior Vice President, Evergreen Funds; |
| Chief Compliance Officer | | Former Director of Compliance, Evergreen Investment Services, Inc. |
| DOB: 9/2/1947 | | |
| Term of office since: 2004 | | |
|
1 Each Trustee serves until a successor is duly elected or qualified or until his/her death, resignation, retirement or removal from office. Each Trustee oversees 89 Evergreen funds. Correspondence for each Trustee may be sent to Evergreen Board of Trustees, P.O. Box 20083, Charlotte, NC 28202.
2 Mr. Wagoner is an “interested person” of the Fund because of his ownership of shares in Wachovia Corporation, the parent to the Fund’s investment advisor.
3 The address of the Officer is 401 S. Tryon Street, 20th Floor, Charlotte, NC 28288.
4 The address of the Officer is 200 Berkeley Street, Boston, MA 02116.
Additional information about the Fund’s Board of Trustees and Officers can be found in the Statement of Additional Information (SAI) and is available upon request without charge by calling 800.343.2898.
33
564355 rv3 12/2005
Evergreen Institutional Mortgage Portfolio

| table of contents |
| 1 | | LETTER TO SHAREHOLDERS |
| 4 | | FUND AT A GLANCE |
| 6 | | ABOUT YOUR FUND’S EXPENSES |
| 7 | | FINANCIAL HIGHLIGHTS |
| 8 | | SCHEDULE OF INVESTMENTS |
| 12 | | STATEMENT OF ASSETS AND LIABILITIES |
| 13 | | STATEMENT OF OPERATIONS |
| 14 | | STATEMENTS OF CHANGES IN NET ASSETS |
| 15 | | NOTES TO FINANCIAL STATEMENTS |
| 20 | | ADDITIONAL INFORMATION |
| 24 | | TRUSTEES AND OFFICERS |
This semiannual report must be preceded or accompanied by a prospectus of the Evergreen fund contained herein. The prospectus contains more complete information, including fees and expenses, and should be read carefully before investing or sending money.
The fund will file its complete schedule of portfolio holdings with the SEC for the first and third quarters of each fiscal year on Form N-Q. The fund’s Form N-Q will be available on the SEC’s Web site at http://www.sec.gov. In addition, the fund’s Form N-Q may be reviewed and copied at the SEC’s Public Reference Room in Washington, D.C. Information on the operation of the Public Reference Room may be obtained by calling 800.SEC.0330.
A description of the fund’s proxy voting policies and procedures, as well as information regarding how the fund voted proxies relating to portfolio securities during the most recent 12-month period ended June 30, is available by visiting our Web site at EvergreenInvestments.com or by visiting the SEC’s Web site at http://www.sec.gov. The fund’s proxy voting policies and procedures are also available without charge, upon request, by calling 800.343.2898.
| Mutual Funds: | | | | |
| NOT FDIC INSURED | MAY LOSE VALUE | NOT BANK GUARANTEED |
Evergreen InvestmentsSM is a service mark of Evergreen Investment Management Company, LLC.
Copyright 2005, Evergreen Investment Management Company, LLC.
Evergreen Investment Management Company, LLC is a subsidiary of Wachovia Corporation
and is an affiliate of Wachovia Corporation's other Broker Dealer subsidiaries.
Evergreen mutual funds are distributed by Evergreen Investment Services, Inc.
200 Berkeley Street, Boston, MA 02116
LETTER TO SHAREHOLDERS
December 2005

Dennis H. Ferro
President and Chief Executive Officer
Dear Shareholder,
We are pleased to provide the semiannual report for the Evergreen Institutional Mortgage Portfolio, which covers the six-month period ended October 31, 2005.
Fixed income investors had to endure a variety of challenges over the past six months. Moderating economic growth, surging energy prices and tighter monetary policy led the list of concerns, while the terrorist bombings in London and credit downgrades in the auto sector further pressured market sentiment. In addition, Hurricane Katrina devastated much of the gulf region and inflation fears grew with the prospect of more government spending. While the importance of asset allocation becomes increasingly evident during times of uncertainty, we believe it is crucial for long-term investors to extend the diversification process further, to include several strategies within an asset class, such as the bond fund offerings within Evergreen’s Fixed Income Trust and Select Fixed Income Trust.
The investment period began with a trend for slower growth in the U.S. economy. After experiencing the rapid pace of growth typical in economic recovery, Gross Domestic Product had moderated to a pace of growth normally associated with economic expansion. While the growth in overall output was still good, it was no longer considered great, and market interest rates initially declined on the perceived weakness. Yet energy prices continued to soar throughout the summer months amid rising levels for employment, housing and production. The post-Katrina federal spending plans exacerbated these pricing concerns and long-term interest rates began to crawl higher.
1
LETTER TO SHAREHOLDERS continued
Having already anticipated a bout of inflation fears, the Federal Reserve (Fed) maintained its “measured removal of policy accommodation.” While the paradox of moderating economic growth and tighter monetary policy often rattled the fixed income markets, Evergreen’s Investment Strategy Committee concluded that since rates were low for such a lengthy period, the central bank was simply removing excess stimulus to prevent pricing from becoming a long-term problem. Although Chairman Greenspan had been very transparent in his public statements about the direction of monetary policy, market interest rates persisted lower into the summer months. This “flattening” of the yield curve caused many in the fixed income markets to debate its message. Did it signal the end of the expansion? Or was it just confidence in the Fed’s inflation-fighting capabilities? Considering our forecast for moderating global growth, mild wages, and solid productivity, we determined that long-term pricing pressures, despite energy, were insufficient to halt the expansion. In addition, we believed that a combination of excess global savings, an increased “flight to quality,” and growing demand for longer-duration investments by under-funded pensions accelerated this trend.
Throughout this timeframe, our fixed income teams attempted to capitalize on trends within the bond market. For example, Evergreen’s high yield teams emphasized exposure within media and telecom, while the lack of airline exposure benefited their portfolios. Our government bond teams needed to be very agile in their decision-making, for despite the Fed’s monetary policy stance, the yield curve continued to flatten. The mortgage market benefited from the mostly positive economic data, yet the combination of the hurricanes and rising energy costs pressured
2
LETTER TO SHAREHOLDERS continued
yields in September and October. Finally, some of our “core” strategies included going short on duration in anticipation of the rise in market yields. All told, it was a challenging environment to be tied to any one specific area within the bond market, and we believe those portfolios fully diversified within fixed income were best positioned for the long-term.
We continue to recommend that investors maintain their diversified, long-term strategies within their fixed income portfolios.
Please visit our Web site, EvergreenInvestments.com, for more information about our funds and other investment products available to you. Thank you for your continued support of Evergreen Investments.
Sincerely,

Dennis H. Ferro
President and Chief Executive Officer
Evergreen Investment Company, Inc.
Special Notice to Shareholders:
Please visit our Web site at EvergreenInvestments.com for a statement from President and Chief Executive Officer, Dennis Ferro, addressing NASD actions involving Evergreen Investment Services, Inc. (EIS), Evergreen’s mutual fund distributor or statements from Dennis Ferro and Chairman of the Board of the Evergreen Funds, Michael S. Scofield, addressing SEC actions involving the Evergreen Funds.
3
FUND AT A GLANCE
as of October 31, 2005
MANAGEMENT TEAM
Investment Advisor:
• Evergreen Investment Management Company, LLC
Sub-Advisor:
• Tattersall Advisory Group, Inc.
Portfolio Managers:
• Robert Calhoun, CFA
• Mehmet Camurdan, CFA
• Todd C. Kuimjian, CFA
CURRENT INVESTMENT STYLE

Source: Morningstar, Inc.
Morningstar’s style box is based on a portfolio date as of 9/30/2005.
The Fixed income style box placement is based on a fund’s average effective maturity or duration and the average credit rating of the bond portfolio.
| PERFORMANCE AND RETURNS | | |
|
| Portfolio inception date: 6/19/2002 | | |
| | | Class I |
| Class inception date | | 6/19/2002 |
|
| Nasdaq symbol | | EMSFX |
|
| 6-month return | | 0.45% |
|
| Average annual return | | |
|
| 1-year | | 1.42% |
|
| Since portfolio inception | | 3.90% |
|
Past performance is no guarantee of future results. The performance quoted represents past performance and current performance may be lower or higher. The investment return and principal value of an investment will fluctuate so that investors’ shares, when redeemed, may be worth more or less than their original cost. To obtain performance information current to the most recent month-end, please go to EvergreenInvestments.com/fundperformance. Performance includes the reinvestment of income dividends and capital gain distributions. Performance shown does not reflect the deduction of taxes that a shareholder would pay on fund distributions or the redemption of fund shares.
The advisor is reimbursing the fund for a portion of other expenses. Had expenses not been reimbursed, returns would have been lower.
4
LONG-TERM GROWTH
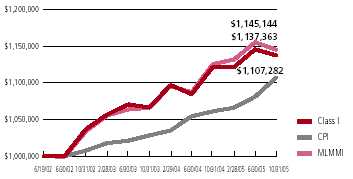
Comparison of a $1,000,000 investment in the Evergreen Institutional Mortgage Portfolio Class I shares, versus a similar investment in the Merrill Lynch Mortgage Master Index† (MLMMI) and the Consumer Price Index (CPI).
The MLMMI is an unmanaged market index and does not include transaction costs associated with buying and selling securities, any mutual fund expenses or any taxes. The CPI is a commonly used measure of inflation and does not represent an investment return. It is not possible to invest directly in an index.
Class I shares are only offered in the following manner: (1) to investment advisory clients of Evergreen Investment Management Company, LLC (or its advisory affiliates) when purchased by such advisor(s) on behalf of its clients, (2) through arrangements entered into on behalf of the Evergreen funds with certain financial services firms, (3) to certain institutional investors and (4) to persons who owned Class Y shares in registered name in an Evergreen fund on or before December 31, 1994 or who owned shares of any SouthTrust fund in registered name as of March 18, 2005 or shares of Vestaur Securities Fund as of May 20, 2005.
Class I shares are only available to institutional shareholders with a minimum of $1 million investment, which may be waived in certain situations.
The fund’s investment objective is nonfundamental and may be changed without a vote of the fund’s shareholders.
U.S. government guarantees apply only to certain securities held in the fund’s portfolio and not to the fund’s shares.
The return of principal is not guaranteed due to fluctuation in the NAV of the fund caused by changes in the price of the individual bonds held by the fund and the buying and selling of bonds by the fund. Bond funds have the same inflation, interest rate and credit risks that are associated with the individual bonds held by the fund. Generally, the value of bonds rise when prevailing interest rates fall and fall when interest rates rise.
† Copyright 2005. Merrill Lynch, Pierce, Fenner & Smith Incorporated. All rights reserved.
All data is as of October 31, 2005, and subject to change.
5
ABOUT YOUR FUND’S EXPENSES
The Example below is intended to describe the fees and expenses borne by shareholders and the impact of those costs on your investment.
Example
As a shareholder of the fund, you incur two types of costs: (1) transaction costs, including sales charges (loads), redemption fees and exchange fees; and (2) ongoing costs, including management fees, distribution (12b-1) fees and other fund expenses. This Example is intended to help you understand your ongoing costs (in dollars) of investing in the fund and to compare these costs with the ongoing costs of investing in other mutual funds. The Example is based on an investment of $1,000 invested at the beginning of the period and held for the entire period from May 1, 2005 to October 31, 2005.
The example illustrates your fund’s costs in two ways:
• Actual expenses
The section in the table under the heading “Actual” provides information about actual account values and actual expenses. You may use the information in these columns, together with the amount you invested, to estimate the expenses that you paid over the period. Simply divide your account value by $1,000 (for example, an $8,600 account value divided by $1,000 = 8.6), then multiply the result by the number in the appropriate column for your share class, in the column entitled “Expenses Paid During Period” to estimate the expenses you paid on your account during this period.
• Hypothetical example for comparison purposes
The section in the table under the heading “Hypothetical (5% return before expenses)” provides information about hypothetical account values and hypothetical expenses based on the fund’s actual expense ratio and an assumed rate of return of 5% per year before expenses, which is not the fund’s actual return. The hypothetical account values and expenses may not be used to estimate the actual ending account balance or expenses you paid for the period. You may use this information to compare the ongoing costs of investing in the fund and other funds. To do so, compare this 5% hypothetical example with the 5% hypothetical examples that appear in the shareholder reports of the other funds.
Please note that the expenses shown in the table are meant to highlight your ongoing costs only and do not reflect any transactional costs, such as sales charges (loads), redemption fees or exchange fees. Therefore, the section in the table under the heading “Hypothetical (5% return before expenses)” is useful in comparing ongoing costs only, and will not help you determine the relative total costs of owning different funds. In addition, if these transactional costs were included, your costs would have been higher.
| | | Beginning | | Ending | | |
| | | Account | | Account | | Expenses |
| | | Value | | Value | | Paid During |
| | | 5/1/2005 | | 10/31/2005 | | Period* |
|
| Actual | | | | | | |
| Class I | | $ 1,000.00 | | $ 1,004.49 | | $ 1.06 |
| Hypothetical | | | | | | |
| (5% return | | | | | | |
| before expenses) | | | | | | |
| Class I | | $ 1,000.00 | | $ 1,024.15 | | $ 1.07 |
|
* Expenses are equal to the Fund’s annualized expense ratio (0.21% for Class I), multiplied by the average account value over the period, multiplied by 184 / 365 days.
6
FINANCIAL HIGHLIGHTS
(For a share outstanding throughout each period)
| | | | | | | | | | | |
| | | Six Months Ended | | Year Ended April 30, |
| | | October 31, 2005 | |
|
| CLASS I | | (unaudited) | | 2005 | | 2004 | | 20031 |
|
| Net asset value, beginning of period | | $ 9.89 | | $ 9.89 | | $ 10.18 | | $ 10.00 |
|
| Income from investment operations | | | | | | | | |
| Net investment income (loss) | | 0.20 | | 0.35 | | 0.35 | | 0.40 |
Net realized and unrealized gains
or losses on investments | | (0.15) | | 0.10 | | (0.18) | | 0.23 |
| |
|
| Total from investment operations | | 0.05 | | 0.45 | | 0.17 | | 0.63 |
|
| Distributions to shareholders from | | | | | | | | |
| Net investment income | | (0.24) | | (0.45) | | (0.45) | | (0.40) |
| Net realized gains | | 0 | | 0 | | (0.01) | | (0.05) |
| |
|
| Total distributions to shareholders | | (0.24) | | (0.45) | | (0.46) | | (0.45) |
|
| Net asset value, end of period | | $ 9.70 | | $ 9.89 | | $ 9.89 | | $ 10.18 |
|
| Total return | | 0.45% | | 4.66% | | 1.63% | | 6.45% |
|
| Ratios and supplemental data | | | | | | | | |
| Net assets, end of period (thousands) | | $51,938 | | $45,997 | | $48,032 | | $28,423 |
| Ratios to average net assets | | | | | | | | |
Expenses including waivers/reimbursements
but excluding expense reductions | | 0.21%2 | | 0.20% | | 0.20% | | 0.12%2 |
Expenses excluding waivers/reimbursements
and expense reductions | | 0.24%2 | | 0.24% | | 0.28% | | 0.46%2 |
| Net investment income (loss) | | 4.00%2 | | 3.44% | | 3.33% | | 4.74%2 |
| Portfolio turnover rate | | 61% | | 177% | | 327% | | 148% |
|
1 For the period from June 19, 2002 (commencement of operations), to April 30, 2003.
2 Annualized
See Notes to Financial Statements
7
SCHEDULE OF INVESTMENTS
October 31, 2005 (unaudited)
| | | | | Principal | | | | |
| | | | | Amount | | | | Value |
|
| AGENCY COMMERCIAL MORTGAGE-BACKED SECURITIES 11.5% | | | | | | | | |
| FIXED-RATE 11.5% | | | | | | | | |
| FHLMC: | | | | | | | | |
| 6.90%, 12/01/2010 | | | | $ 545,000 | | $ | | 589,805 |
| 6.98%, 10/01/2020 | | | | 446,370 | | | | 482,428 |
| FNMA: | | | | | | | | |
| 4.06%, 06/01/2013 | | | | 250,000 | | | | 230,189 |
| 4.83%, 03/01/2013 | | | | 676,840 | | | | 666,882 |
| 5.65%, 02/01/2009 | | | | 239,052 | | | | 243,874 |
| 6.01%, 02/01/2012 | | | | 326,953 | | | | 341,333 |
| 6.09%, 05/01/2011 | | | | 379,023 | | | | 395,539 |
| 6.15%, 05/01/2011 | | | | 231,078 | | | | 241,395 |
| 6.65%, 12/01/2007 | | | | 225,608 | | | | 230,941 |
| 6.79%, 07/01/2009 | | | | 93,891 | | | | 98,438 |
| 6.91%, 07/01/2009 | | | | 282,148 | | | | 296,801 |
| 7.05%, 06/01/2007 | | | | 381,806 | | | | 385,981 |
| 7.09%, 07/01/2009 | | | | 279,342 | | | | 295,312 |
| 7.18%, 05/01/2007 | | | | 163,522 | | | | 166,347 |
| 7.27%, 02/01/2010 | | | | 489,395 | | | | 523,932 |
| 7.29%, 12/01/2010 | | | | 409,220 | | | | 445,520 |
| 7.37%, 08/01/2006 | | | | 359,506 | | | | 361,587 |
| |
|
| Total Agency Commercial Mortgage-Backed Securities (cost $6,324,162) | | | | | | 5,996,304 |
| |
|
| AGENCY MORTGAGE-BACKED COLLATERALIZED MORTGAGE | | | | | | |
| OBLIGATIONS 14.9% | | | | | | | | |
| FIXED-RATE 14.9% | | | | | | | | |
| FHLMC: | | | | | | | | |
| Ser. 2264, Class PL, 7.00%, 10/15/2030 | | | | 477,461 | | | | 483,238 |
| Ser. 2748, Class LE, 4.50%, 12/15/2017 | | | | 710,000 | | | | 685,330 |
| Ser. 2780, Class BD, 4.50%, 10/15/2017 | | | | 335,000 | | | | 331,696 |
| Ser. 2840, Class NC, 5.50%, 03/15/2028 | | | | 445,000 | | | | 446,812 |
| Ser. 2841, Class PC, 5.50%, 07/15/2030 | | | | 870,000 | | | | 868,292 |
| Ser. 2923, Class QC, 5.50%, 05/15/2028 | | | | 425,000 | | | | 426,372 |
| Ser. 2984, Class NC, 5.50%, 09/15/2031 | | | | 365,000 | | | | 363,182 |
| FNMA: | | | | | | | | |
| Ser. 2001-71, Class QE, 6.00%, 12/25/2016 | | | | 388,214 | | | | 395,883 |
| Ser. 2004-26, Class PA, 4.50%, 09/25/2025 | | | | 1,960,000 | | | | 1,936,483 |
| Ser. 2004-61, Class EQ, 5.50%, 01/25/2033 | | | | 905,000 | | | | 917,944 |
| Ser. 2005-25, Class PC, 5.50%, 07/25/2028 | | | | 415,000 | | | | 415,692 |
| Ser. 2005-40, Class AC, 4.50%, 02/25/2031 | | | | 480,773 | | | | 466,987 |
| |
|
| Total Agency Mortgage-Backed Collateralized Mortgage Obligations | | | | | | |
| (cost $7,875,903) | | | | | | | | 7,737,911 |
| |
|
| AGENCY MORTGAGE-BACKED PASS THROUGH SECURITIES 45.4% | | | | | | | | |
| FIXED-RATE 45.4% | | | | | | | | |
| FHLMC: | | | | | | | | |
| 4.50%, 04/01/2035 | | | | 1,290,266 | | | | 1,204,929 |
| 4.77%, 09/01/2035 | | | | 1,012,700 | | | | 991,617 |
See Notes to Financial Statements
8
SCHEDULE OF INVESTMENTS continued
October 31, 2005 (unaudited)
| | | Principal | | | | |
| | | Amount | | | | Value |
|
| AGENCY MORTGAGE-BACKED PASS THROUGH SECURITIES continued | | | | | | |
| FIXED-RATE continued | | | | | | |
| FHLMC: continued | | | | | | |
| 5.00%, TBA # | | $ 3,215,000 | | $ | | 3,093,434 |
| 6.50%, 09/01/2019 | | 704,668 | | | | 727,296 |
| FNMA: | | | | | | |
| 4.50%, 04/01/2019 - 04/01/2020 | | 646,573 | | | | 625,841 |
| 4.50%, TBA # | | 3,205,000 | | | | 3,099,838 |
| 5.00%, TBA # | | 3,300,000 | | | | 3,255,655 |
| 5.37%, 09/01/2035 | | 445,063 | | | | 443,625 |
| 5.50%, 04/01/2034 - 09/01/2035 | | 6,171,933 | | | | 6,096,281 |
| 5.50%, TBA # | | 2,590,000 | | | | 2,555,196 |
| 6.50%, 07/01/2032 - 08/01/2032 | | 989,709 | | | | 1,017,639 |
| 7.00%, 05/01/2032 | | 78,328 | | | | 81,941 |
| 7.50%, 11/01/2029 - 12/01/2029 | | 32,222 | | | | 34,059 |
| GNMA, 4.50%, 07/20/2030 | | 333,876 | | | | 335,110 |
| |
|
| Total Agency Mortgage-Backed Pass Through Securities | | | | | | |
| (cost $23,877,841) | | | | | | 23,562,461 |
| |
|
| AGENCY REPERFORMING MORTGAGE-BACKED COLLATERALIZED | | | | | | |
| MORTGAGE OBLIGATIONS 4.0% | | | | | | |
| FNMA: | | | | | | |
| Ser. 2003-W14, Class 1A6, 5.82%, 09/25/2043 | | 345,000 | | | | 347,219 |
| Ser. 2003-W19, Class 1A5, 5.50%, 11/25/2033 | | 1,705,000 | | | | 1,707,733 |
| |
|
| Total Agency Reperforming Mortgage-Backed Collateralized Mortgage | | | | | | |
| Obligations (cost $2,133,050) | | | | | | 2,054,952 |
| |
|
| AGENCY REPERFORMING MORTGAGE-BACKED PASS THROUGH | | | | | | |
| SECURITIES 1.1% | | | | | | |
| FNMA: | | | | | | |
| Ser. 2003-W6, Class 3A, 6.50%, 09/25/2042 | | 273,401 | | | | 281,428 |
| Ser. 2004-W9, Class 2A1, 6.50%, 02/25/2044 | | 284,509 | | | | 291,417 |
| |
|
| Total Agency Reperforming Mortgage-Backed Pass Through Securities | | | | | | |
| (cost $586,700) | | | | | | 572,845 |
| |
|
| ASSET-BACKED SECURITIES 0.8% | | | | | | |
| Asset-Backed Funding Cert., Ser. 2005-AQ1, Class A1B, 4.25%, 06/25/2035 | | 276,047 | | | | 275,029 |
| Vanderbilt Mtge. & Fin., Inc., Ser. 2002-B, Class A3, 4.70%, 10/17/2018 | | 170,000 | | | | 167,667 |
| |
|
| Total Asset-Backed Securities (cost $446,024) | | | | | | 442,696 |
| |
|
| COMMERCIAL MORTGAGE-BACKED SECURITIES 7.7% | | | | | | |
| FIXED-RATE 7.7% | | | | | | |
| Banc of America Comml. Mtge. Securities, Inc., Ser. 2004-1, Class A4, 4.76%, | | | | | | |
| 11/10/2039 | | 535,000 | | | | 515,847 |
| Bear Stearns Comml. Mtge. Securities, Inc., Ser. 2001-TOP2, Class A1, 6.08%, | | | | | | |
| 02/15/2035 | | 203,657 | | | | 206,934 |
| Commercial Mtge. Pass-Through Cert., Ser. 2004-LB3A, Class A5, 5.28%, | | | | | | |
| 11/25/2033 | | 620,000 | | | | 624,555 |
See Notes to Financial Statements
9
SCHEDULE OF INVESTMENTS continued
October 31, 2005 (unaudited)
| | | | | Principal | | | | |
| | | | | Amount | | | | Value |
|
| COMMERCIAL MORTGAGE-BACKED SECURITIES continued | | | | | | | | |
| FIXED-RATE continued | | | | | | | | |
| Goldman Sachs Mtge. Securities Corp. II, Ser. 2003-C1, Class A1, 2.90%, | | | | | | | | |
| 01/10/2040 | | | | $ 517,373 | | $ | | 502,245 |
| JPMorgan Chase & Co. Comml. Mtge. Securities Corp., Ser. 2004-PNC1, Class A4, | | | | | | |
| 5.375%, 06/12/2041 | | | | 605,000 | | | | 612,086 |
| LB-UBS Comml. Mtge. Trust, Ser. 2000-C4, Class A1, 7.18%, 09/15/2009 | | | | 159,394 | | | | 163,061 |
| Morgan Stanley Capital I, Inc.: | | | | | | | | |
| Ser. 1998-XL1, Class A2, 6.45%, 06/03/2030 | | | | 77,141 | | | | 77,161 |
| Ser. 2003-T11, Class A4, 5.15%, 06/13/2041 | | | | 670,000 | | | | 664,234 |
| Morgan Stanley Dean Witter, Ser. 2003-IQ5, Class A4, 5.01%, 04/15/2038 | | | | 340,000 | | | | 334,355 |
| Wachovia Bank Comml. Mtge. Trust, Ser. 2003-C8, Class A1, 3.44%, | | | | | | | | |
| 11/15/2035 | | | | 303,484 | | | | 293,395 |
| |
|
| Total Commercial Mortgage-Backed Securities (cost $4,123,462) | | | | | | | | 3,993,873 |
| |
|
| U.S. TREASURY OBLIGATIONS 0.5% | | | | | | | | |
| U.S. Treasury Notes, 2.75%, 08/15/2007 (cost $248,532) | | | | 255,000 | | | | 247,948 |
| |
|
| WHOLE LOAN MORTGAGE-BACKED COLLATERALIZED MORTGAGE | | | | | | | | |
| OBLIGATIONS 11.1% | | | | | | | | |
| FIXED-RATE 11.1% | | | | | | | | |
| Banc of America Mtge. Securities, Inc.: | | | | | | | | |
| Ser. 2005-D, Class 2A6, 4.80%, 05/25/2035 | | | | 230,000 | | | | 224,679 |
| Ser. 2005-E, Class 2A7, 4.63%, 06/25/2035 | | | | 620,000 | | | | 600,514 |
| GSR Mtge. Loan Trust: | | | | | | | | |
| Ser. 2004-12, Class 3A6, 4.49%, 12/25/2034 | | | | 465,000 | | | | 452,987 |
| Ser. 2005-AR6, Class 3A1, 4.56%, 09/25/2035 (h) | | | | 990,782 | | | | 972,254 |
| MASTR Adjustable Rate Mtge. Trust, Ser. 2004-13, Class 3A7, 3.79%, | | | | | | | | |
| 12/21/2034 | | | | 420,000 | | | | 400,437 |
| Washington Mutual, Inc.: | | | | | | | | |
| Ser. 2004-AR4, Class A6, 3.81%, 06/25/2034 | | | | 915,000 | | | | 877,091 |
| Ser. 2004-AR7, Class A6, 3.95%, 07/25/2034 | | | | 1,460,000 | | | | 1,409,502 |
| Ser. 2005-AR5, Class A5, 4.69%, 05/25/2035 | | | | 415,000 | | | | 403,170 |
| Wells Fargo Mtge. Backed Securities Trust, Ser. 2004-S, Class A7, 3.54%, | | | | | | | | |
| 09/25/2034 | | | | 440,000 | | | | 421,532 |
| |
|
| Total Whole Loan Mortgage-Backed Collateralized Mortgage Obligations | | | | | | |
| (cost $5,838,762) | | | | | | | | 5,762,166 |
| |
|
| WHOLE LOAN MORTGAGE-BACKED PASS THROUGH SECURITIES 2.2% | | | | | | | | |
| FIXED-RATE 1.3% | | | | | | | | |
| Wells Fargo Mtge. Backed Securities Trust, Ser. 2005-AR1, Class 1A1, 4.56%, | | | | | | |
| 02/25/2035 | | | | 722,971 | | | | 708,519 |
| |
|
| FLOATING-RATE 0.9% | | | | | | | | |
| IndyMac Index Mtge. Loan Trust: | | | | | | | | |
| Ser. 2004-AR5, Class 2A1A, 4.26%, 08/25/2034 | | | | 284,096 | | | | 284,188 |
| Ser. 2004-AR7, Class A2, 4.26%, 09/25/2034 | | | | 173,481 | | | | 173,932 |
| |
|
| | | | | | | | | 458,120 |
| |
|
| Total Whole Loan Mortgage-Backed Pass Through Securities | | | | | | | | |
| (cost $1,179,296) | | | | | | | | 1,166,639 |
| |
|
See Notes to Financial Statements
10
SCHEDULE OF INVESTMENTS continued
October 31, 2005 (unaudited)
| | | Shares | | | | Value |
|
| SHORT-TERM INVESTMENTS 24.0% | | | | | | |
| MUTUAL FUND SHARES 24.0% | | | | | | |
| Evergreen Institutional Money Market Fund ø ## (cost $12,445,170) | | 12,445,170 | | $ | | 12,445,170 |
| |
|
| Total Investments (cost $65,078,902) 123.2% | | | | | | 63,982,965 |
| Other Assets and Liabilities (23.2%) | | | | | | (12,044,595) |
| |
|
| Net Assets 100.0% | | | | $ | | 51,938,370 |
| |
|
| # | | When-issued or delayed delivery security |
| (h) | | Security is valued at fair value as determined by the investment advisor in good faith, according to procedures approved |
| | | by the Board of Trustees. |
| ø | | Evergreen Investment Management Company, LLC is the investment advisor to both the Fund and the money market |
| | | fund. |
| ## | | All or a portion of this security has been segregated for when-issued or delayed delivery securities. |
| Summary of Abbreviations |
| FHLMC | | Federal Home Loan Mortgage Corp. |
| FNMA | | Federal National Mortgage Association |
| GNMA | | Government National Mortgage Association |
| MASTR | | Mortgage Asset Securitization Transactions, Inc. |
| TBA | | To Be Announced |
The following table shows the percent of total investments, excluding segregated cash and cash equivalents, by credit quality based on Moody’s and Standard & Poor’s ratings as of October 31, 2005:
The following table shows the percent of total investments, excluding segregated cash and cash equivalents, by maturity as of October 31, 2005:
| Less than 1 year | | 4.0% |
| 1 to 3 year(s) | | 13.5% |
| 3 to 5 years | | 21.2% |
| 5 to 10 years | | 60.5% |
| 10 to 20 years | | 0.8% |
| |
|
| | | 100.0% |
| | |
|
See Notes to Financial Statements
11
STATEMENT OF ASSETS AND LIABILITIES
October 31, 2005 (unaudited)
| Assets | | | | |
| Investments in securities, at value (cost $52,633,732) | | $ | | 51,537,795 |
| Investments in affiliated money market fund, at value (cost $12,445,170) | | | | 12,445,170 |
|
| Total investments | | | | 63,982,965 |
| Receivable for securities sold | | | | 366,141 |
| Principal paydown receivable | | | | 2,300 |
| Interest receivable | | | | 234,744 |
| Prepaid expenses and other assets | | | | 1,024 |
|
| Total assets | | | | 64,587,174 |
|
| Liabilities | | | | |
| Dividends payable | | | | 130,883 |
| Payable for securities purchased | | | | 12,500,246 |
| Due to related parties | | | | 199 |
| Accrued expenses and other liabilities | | | | 17,476 |
|
| Total liabilities | | | | 12,648,804 |
|
| Net assets | | $ | | 51,938,370 |
|
| Net assets represented by | | | | |
| Paid-in capital | | $ | | 54,089,917 |
| Overdistributed net investment income | | | | (165,988) |
| Accumulated net realized losses on investments | | | | (889,622) |
| Net unrealized losses on investments | | | | (1,095,937) |
|
| Total net assets | | $ | | 51,938,370 |
|
| Shares outstanding (unlimited number of shares authorized) Class I | | | | 5,356,531 |
|
| Net asset value per share Class I | | $ | | 9.70 |
|
See Notes to Financial Statements
12
STATEMENT OF OPERATIONS
Six Months Ended October 31, 2005 (unaudited)
| Investment income | | | | |
| Interest | | $ | | 878,159 |
| Income from affiliate | | | | 135,153 |
|
| Total investment income | | | | 1,013,312 |
|
| Expenses | | | | |
| Administrative services fee | | | | 24,035 |
| Transfer agent fees | | | | 866 |
| Trustees’ fees and expenses | | | | 343 |
| Printing and postage expenses | | | | 11,505 |
| Custodian and accounting fees | | | | 7,887 |
| Registration and filing fees | | | | 3,925 |
| Professional fees | | | | 7,525 |
| Other | | | | 1,000 |
|
| Total expenses | | | | 57,086 |
| Less: Expense reductions | | | | (1,306) |
| Expense reimbursements | | | | (7,502) |
|
| Net expenses | | | | 48,278 |
|
| Net investment income | | | | 965,034 |
|
| Net realized and unrealized gains or losses on investments | | | | |
| Net realized losses on investments | | | | (133,739) |
| Net change in unrealized gains or losses on investments | | | | (728,279) |
|
| Net realized and unrealized gains or losses on investments | | | | (862,018) |
|
| Net increase in net assets resulting from operations | | $ | | 103,016 |
|
See Notes to Financial Statements
13
STATEMENTS OF CHANGES IN NET ASSETS
| | | Six Months Ended | | | | |
| | | October 31, 2005 | | Year Ended |
| | | (unaudited) | | April 30, 2005 |
|
| Operations | | | | | | | | |
| Net investment income | | $ | | 965,034 | | $ | | 1,511,838 |
| Net realized gains or losses on | | | | | | | | |
| investments | | | | (133,739) | | | | 238,855 |
| Net change in unrealized gains or | | | | | | | | |
| losses on investments | | | | (728,279) | | | | 286,092 |
|
| Net increase in net assets resulting | | | | | | | | |
| from operations | | | | 103,016 | | | | 2,036,785 |
|
| Distributions to shareholders from | | | | | | | | |
| net investment income | | | | (1,146,536) | | | | (2,005,765) |
|
| | | Shares | | | | Shares | | |
| Capital share transactions | | | | | | | | |
| Proceeds from shares sold | | 1,315,380 | | 12,969,440 | | 1,761,382 | | 17,425,251 |
| Net asset value of shares issued in | | | | | | | | |
| reinvestment of distributions | | 37,803 | | 371,818 | | 77,323 | | 766,452 |
| Payment for shares redeemed | | (645,807) | | (6,356,798) | | (2,048,098) | | (20,257,682) |
|
| Net increase (decrease) in net assets | | | | | | | | |
| resulting from capital share | | | | | | | | |
| transactions | | | | 6,984,460 | | | | (2,065,979) |
|
| Total increase (decrease) in net assets | | | | 5,940,940 | | | | (2,034,959) |
| Net assets | | | | | | | | |
| Beginning of period | | | | 45,997,430 | | | | 48,032,389 |
|
| End of period | | $ | | 51,938,370 | | $ | | 45,997,430 |
|
| Undistributed (overdistributed) | | | | | | | | |
| net investment income | | $ | | (165,988) | | $ | | 15,514 |
|
See Notes to Financial Statements
14
NOTES TO FINANCIAL STATEMENTS (unaudited)
1. ORGANIZATION
Evergreen Institutional Mortgage Portfolio (the “Fund”) is a diversified series of Evergreen Fixed Income Trust (the “Trust”), a Delaware statutory trust organized on September 18, 1997. The Trust is an open-end management investment company registered under the Investment Company Act of 1940, as amended (the “1940 Act”).
The Fund offers Institutional (“Class I”) shares. Class I shares are sold without a front-end sales charge or contingent deferred sales charge. Shares of the Fund are only offered to investment advisory clients of an investment advisor of an Evergreen fund (or its advisory affiliates) and through special arrangements entered into on behalf of the Evergreen funds with certain financial services firms.
2. SIGNIFICANT ACCOUNTING POLICIES
The following is a summary of significant accounting policies consistently followed by the Fund in the preparation of its financial statements. The policies are in conformity with generally accepted accounting principles in the United States of America, which require management to make estimates and assumptions that affect amounts reported herein. Actual results could differ from these estimates.
a. Valuation of investments
Portfolio debt securities acquired with more than 60 days to maturity are fair valued using matrix pricing methods determined by an independent pricing service which takes into consideration such factors as similar security prices, yields, maturities, liquidity and ratings. Securities for which valuations are not readily available from an independent pricing service may be valued by brokers which use prices provided by market makers or estimates of market value obtained from yield data relating to investments or securities with similar characteristics.
Short-term securities with remaining maturities of 60 days or less at the time of purchase are valued at amortized cost, which approximates market value.
Investments in other mutual funds are valued at net asset value. Securities for which market quotations are not readily available or not reflective of current market value are valued at fair value as determined by the investment advisor in good faith, according to procedures approved by the Board of Trustees.
b. When-issued and delayed delivery transactions
The Fund records when-issued or delayed delivery securities as of trade date and maintains security positions such that sufficient liquid assets will be available to make payment for the securities purchased. Securities purchased on a when-issued or delayed delivery basis are marked-to-market daily and begin earning interest on the settlement date. Losses may occur on these transactions due to changes in market conditions or the failure of counterparties to perform under the contract.
15
NOTES TO FINANCIAL STATEMENTS (unaudited) continued
c. Dollar roll transactions
The Fund may enter into dollar roll transactions with respect to mortgage-backed securities. In a dollar roll transaction, the Fund sells mortgage-backed securities to financial institutions and simultaneously agrees to accept substantially similar (same type, coupon and maturity) securities at a later date at an agreed upon price. The Fund will use the proceeds generated from the transactions to invest in short-term investments, which may enhance the Fund’s current yield and total return. The Fund accounts for dollar roll transactions as purchases and sales. The Fund could be exposed to risks if the counterparty defaults on its obligation to perform under the terms of the agreement, if the Fund receives inferior securities in comparison to what was sold to the counterparty at redelivery or if there are variances in paydown speed between the mortgage-related pools.
d. Security transactions and investment income
Security transactions are recorded on trade date. Realized gains and losses are computed using the specific cost of the security sold. Interest income is recorded on the accrual basis and includes accretion of discounts and amortization of premiums.
e. Federal taxes
The Fund intends to continue to qualify as a regulated investment company and distribute all of its taxable income, including any net capital gains (which have already been offset by available capital loss carryovers). Accordingly, no provision for federal taxes is required.
f. Distributions
Distributions to shareholders from net investment income are accrued daily and paid monthly. Distributions from net realized gains, if any, are recorded on the ex-dividend date. Such distributions are determined in conformity with income tax regulations, which may differ from generally accepted accounting principles.
3. ADVISORY FEE AND OTHER TRANSACTIONS WITH AFFILIATES
Evergreen Investment Management Company, LLC (“EIMC”), an indirect, wholly-owned subsidiary of Wachovia Corporation (“Wachovia”), is the investment advisor to the Fund. The Fund does not pay a fee for the investment advisory service.
Tattersall Advisory Group, Inc., an indirect, wholly-owned subsidiary of Wachovia, is the investment sub-advisor to the Fund and is paid by EIMC for its services to the Fund.
From time to time, EIMC may voluntarily or contractually reimburse other expenses in order to limit operating expenses. During the six months ended October 31, 2005, EIMC reimbursed other expenses in the amount of $7,502.
Evergreen Investment Services, Inc. (“EIS”), an indirect, wholly-owned subsidiary of Wachovia, is the administrator to the Fund. As administrator, EIS provides the Fund with facilities, equipment and personnel and is paid an annual rate determined by applying percentage rates to the aggregate average daily net assets of the Evergreen funds (excluding money market funds), starting
16
NOTES TO FINANCIAL STATEMENTS (unaudited) continued
at 0.10% and declining to 0.05% as the aggregate average daily net assets of the Evergreen funds (excluding money market funds) increase.
Evergreen Service Company, LLC (“ESC”), an indirect, wholly-owned subsidiary of Wachovia, is the transfer and dividend disbursing agent for the Fund. ESC receives account fees that vary based on the type of account held by the shareholders in the Fund.
4. SECURITIES TRANSACTIONS
Cost of purchases and proceeds from sales of investment securities (excluding short-term securities and mortgage dollar roll transactions) were as follows for the six months ended October 31, 2005:
| Cost of Purchases | | Proceeds from Sales |
| Non-U.S | | Non-U.S. |
|
| U.S. Government | | Government | | U.S. Government | | Government |
|
| $ 35,327,645 | | $ 6,625,033 | | $ 28,583,237 | | $6,391,587 |
|
On October 31, 2005, the aggregate cost of securities for federal income tax purposes was $65,083,856. The gross unrealized appreciation and depreciation on securities based on tax cost was $3,601 and $1,104,492, respectively, with a net unrealized depreciation of $1,100,891.
As of April 30, 2005, the Fund had $590,832 in capital loss carryovers for federal income tax purposes with $512,937 expiring in 2012 and $77,895 expiring in 2013.
For income tax purposes, capital losses incurred after October 31 within the Fund’s fiscal year are deemed to arise on the first business day of the following fiscal year. As of April 30, 2005, the Fund incurred and elected to defer post-October losses of $162,574.
5. INTERFUND LENDING
Pursuant to an Exemptive Order issued by the SEC, the Fund may participate in an interfund lending program with certain funds in the Evergreen fund family. This program allows the Fund to borrow from, or lend money to, other participating funds. During the six months ended October 31, 2005, the Fund did not participate in the interfund lending program.
6. EXPENSE REDUCTIONS
Through expense offset arrangements with ESC and the Fund’s custodian, a portion of fund expenses has been reduced.
7. DEFERRED TRUSTEES’ FEES
Each Trustee of the Fund may defer any or all compensation related to performance of their duties as Trustees. The Trustees’ deferred balances are allocated to deferral accounts, which are included in the accrued expenses for the Fund. The investment performance of the deferral accounts is based on the investment performance of certain Evergreen funds. Any gains earned or losses incurred in the deferral accounts are reported in the Fund’s Trustees’ fees and expenses. At the
17
NOTES TO FINANCIAL STATEMENTS (unaudited) continued
election of the Trustees, the deferral account will be paid either in one lump sum or in quarterly installments for up to ten years.
8. FINANCING AGREEMENT
The Fund and certain other Evergreen funds share in a $150 million unsecured revolving credit commitment for temporary and emergency purposes, including the funding of redemptions, as permitted by each participating fund’s borrowing restrictions. Borrowings under this facility bear interest at 0.50% per annum above the Federal Funds rate. All of the participating funds are charged an annual commitment fee of 0.09% of the unused balance, which is allocated pro rata. During the six months ended October 31, 2005, the Fund had no borrowings under this agreement.
9. REGULATORY MATTERS AND LEGAL PROCEEDINGS
Since September 2003, governmental and self-regulatory authorities have instituted numerous ongoing investigations of various practices in the mutual fund industry, including investigations relating to revenue sharing, market-timing, late trading and record retention, among other things. The investigations cover investment advisors, distributors and transfer agents to mutual funds, as well as other firms. EIMC, EIS and ESC (collectively, “Evergreen”) have received subpoenas and other requests for documents and testimony relating to these investigations, are endeavoring to comply with those requests, and are cooperating with the investigations. Evergreen is continuing its own internal review of policies, practices, procedures and personnel, and is taking remedial action where appropriate.
In connection with one of these investigations, on July 28, 2004, the staff of the Securities and Exchange Commission (“SEC”) informed Evergreen that the staff intends to recommend to the SEC that it institute an enforcement action against Evergreen. The SEC staff’s proposed allegations relate to (i) an arrangement pursuant to which a broker at one of EIMC’s affiliated broker-dealers had been authorized, apparently by an EIMC officer (no longer with EIMC), to engage in short-term trading, on behalf of a client, in Evergreen Mid Cap Growth Fund (formerly Evergreen Emerging Growth Fund and prior to that, known as Evergreen Small Company Growth Fund) during the period from December 2000 through April 2003, in excess of the limitations set forth in the fund’s prospectus, (ii) short-term trading from September 2001 through January 2003, by a former Evergreen portfolio manager, of Evergreen Precious Metals Fund, a fund he managed at the time, (iii) the sufficiency of systems for monitoring exchanges and enforcing exchange limitations as stated in the fund’s prospectuses, and (iv) the adequacy of e-mail retention practices. In connection with the activity in Evergreen Mid Cap Growth Fund, EIMC reimbursed the fund $378,905, plus an additional $25,242, representing what EIMC calculated at that time to be the client’s net gain and the fees earned by EIMC and the expenses incurred by this fund on the client’s account. In connection with the activity in Evergreen Precious Metals Fund, EIMC reimbursed the fund $70,878, plus an additional $3,075, representing what EIMC calculated at that time to be the portfolio manager’s net gain and the fees earned by EIMC and expenses incurred by the fund on the portfolio manager’s account.
18
NOTES TO FINANCIAL STATEMENTS (unaudited) continued
Evergreen is currently engaged in discussions with the staff of the SEC concerning its recommendation.
The staff of the National Association of Securities Dealers (“NASD”) had notified EIS that it has made a preliminary determination to recommend that disciplinary action be brought against EIS for certain violations of the NASD’s rules. The recommendation relates principally to allegations that EIS (i) arranged for fund portfolio trades to be directed to broker-dealers (including Wachovia Securities, LLC, an affiliate of EIS) that sold Evergreen fund shares during the period of January 2001 to December 2003 and (ii) provided non-cash compensation by sponsoring offsite meetings attended by Wachovia Securities, LLC brokers during that period. EIS is cooperating with the NASD staff in its review of these matters.
Any resolution of these matters with regulatory authorities may include, but not be limited to, sanctions, penalties or injunctions regarding Evergreen, restitution to mutual fund shareholders and/or other financial penalties and structural changes in the governance or management of Evergreen’s mutual fund business. Any penalties or restitution will be paid by Evergreen and not by the Evergreen funds.
In addition, the Evergreen funds and EIMC and certain of its affiliates are involved in various legal actions, including private litigation and class action lawsuits. EIMC does not expect that any of such legal actions currently pending or threatened will have a material adverse impact on the financial position or operations of any of the Evergreen funds or on EIMC’s ability to provide services to the Evergreen funds.
Although Evergreen believes that neither the foregoing investigations nor any pending or threatened legal actions will have a material adverse impact on the Evergreen funds, there can be no assurance that these matters and any publicity surrounding or resulting from them will not result in reduced sales or increased redemptions of Evergreen fund shares, which could increase Evergreen fund transaction costs or operating expenses, or have other adverse consequences on the Evergreen funds.
19
ADDITIONAL INFORMATION (unaudited)
INFORMATION ABOUT THE REVIEW AND APPROVAL OF THE FUND’S INVESTMENT
ADVISORY AGREEMENT
Each year, the Fund’s Board of Trustees is required to consider whether to continue in place the Fund’s investment advisory agreement with EIMC and its sub-advisory agreement with EIMC’s affiliate, Tattersall Advisory Group, Inc (“Tattersall”) (the investment advisory agreement and the sub-advisory agreement are sometimes referred to herein as the “Agreements”). In September 2005, the Trustees, including a majority of the Trustees who are not interested persons (as that term is defined in the 1940 Act) of the Fund or of EIMC, approved the continuation of the Agreements.
At the same time, the Trustees considered the continuation of the investment advisory agreements for all of the Evergreen funds, and the description below refers in many cases to the Trustees’ process and conclusions in connection with their consideration of this matter for all of the Evergreen funds. In all of its deliberations, the Board of Trustees and the disinterested Trustees were advised by independent counsel to the disinterested Trustees and counsel to the Funds.
The review process. The 1940 Act requires that the Board of Trustees request and evaluate, and that EIMC furnish, such information as may reasonably be necessary to evaluate the terms of the Agreements. The review process began formally in spring 2005, when a committee of the Board (the “Committee”), working with EIMC management, determined generally the types of information the Board would review and set a timeline for the review process. In late spring, counsel to the disinterested Trustees sent to EIMC a formal request for information to be furnished to the Trustees. In addition, the independent data provider Lipper Inc. (“Lipper”) was engaged to provide Fund-specific and industry-wide data to the Board containing information of a nature and in a format generally prescribed by the Committee.
The Trustees reviewed EIMC’s responses to the request for information, with the assistance of counsel for the disinterested Trustees and for the Funds and an independent industry consultant retained by the disinterested Trustees, and requested and received additional information following that review. The Committee met in person with the representatives of EIMC in early September. At a meeting of the full Board of Trustees later in September, the Committee reported the results of its discussions with EIMC, and the full Board met with representatives of EIMC, engaged in further review of the materials provided to them, and approved the continuation of each of the advisory and sub-advisory agreements.
The disinterested Trustees discussed the continuation of the Fund’s Agreements with representatives of EIMC and in multiple private sessions with legal counsel at which no personnel of EIMC were present. In considering the continuation of the Agreements, the Trustees did not identify any particular information or consideration that was all-important or controlling, and each Trustee attributed different weights to various factors. The Trustees evaluated information provided to them both in terms of the Evergreen mutual funds generally and in respect of the Fund specifically as they considered appropriate; although the Trustees considered the continuation of the agreement as part of the larger process of considering the continuation of the advisory contracts for all of the Evergreen funds, their determination to continue the advisory agreement for each of the funds was ultimately made on a fund-by-fund basis.
20
ADDITIONAL INFORMATION (unaudited) continued
This summary describes the most important, but not necessarily all, of the factors considered by the Board and the disinterested Trustees.
Information reviewed. The Board of Trustees and committees of the Board of Trustees meet periodically during the course of the year. At those meetings, the Board receives a wide variety of information regarding the services performed by EIMC, the investment performance of the Fund and the other Evergreen funds, and other aspects of the business and operations of the funds. At those meetings, and in the process of considering the continuation of the agreements, the Trustees considered information regarding, for example, the Fund’s investment results; the portfolio management team for the Fund and the experience of the members of that team, and any recent changes in the membership of the team; portfolio trading practices; compliance by the Fund and EIMC with applicable laws and regulations and with the Fund’s and EIMC’s compliance policies and procedures; services provided by affiliates of EIMC to the Fund and shareholders of the Fund; and other information relating to the nature, extent, and quality of services provided by EIMC. The Trustees considered the rates at which the Fund pays investment advisory fees, the total expense ratio of the Fund, and the efforts generally by EIMC and its affiliates as sponsors of the Fund and the fees paid by EIMC under the sub-advisory agreement with Tattersall. The data provided by Lipper showed the fees paid by the Fund and the Fund’s total expense ratio in comparison to other similar mutual funds, in addition to data regarding the investment performance by the funds in comparison to other similar mutual funds. The Trustees were assisted by the independent industry consultant in reviewing the information presented to them.
The Board also considered that EIS serves as administrator to the Fund and receives a fee for its services as administrator. In their comparison of the advisory fee paid by the Fund with those paid by other mutual funds, the Board took into account administrative fees paid by the Fund and those other mutual funds. The Board considered that affiliates of EIMC serve as transfer agent and distributor to the Fund and receive fees from the Fund for those services, and received information regarding recent reductions in the transfer agency fees paid by the Fund. They considered other so-called “fall-out” benefits to EIMC and its affiliates due to their other relationships with the Evergreen funds, including, for example, soft-dollar services received by EIMC attributable to transactions entered into by EIMC for the benefit of the funds and brokerage commissions received by Wachovia Securities LLC, an affiliate of EIMC, from transactions effected by it for the funds.
Nature and quality of the services provided. The Trustees considered that EIMC and its affili-ates provide a comprehensive investment management service to the Fund. They noted that EIMC and Tattersall formulate and implement an investment program for the Fund. They noted that EIMC makes its personnel available to serve as officers of the Evergreen funds, and concluded that the reporting and management functions provided by EIMC with respect to the Fund and the Evergreen funds overall were generally satisfactory. The Trustees considered the investment philosophy of the Fund’s portfolio management teams, and considered the in-house research capabilities of EIMC and its affiliates, as well as other resources available to EIMC and Tattersall, including research services available to it from third parties. The Board considered the managerial and financial resources available to EIMC, and the commitment that the Wachovia
21
ADDITIONAL INFORMATION (unaudited) continued
organization has made to the Fund and the Evergreen funds generally. On the basis of these factors, they determined that the nature and scope of the services provided by EIMC and Tattersall were consistent with their duties under the Agreements and appropriate and consistent with the investment programs and best interests of the Fund.
The Trustees noted the commitment and resources EIMC and its affiliates have committed to the regulatory, compliance, accounting, tax and tax reporting, and shareholder servicing functions, and the number and quality of staff committed to those functions, which they concluded were appropriate and generally in line with EIMC’s responsibilities to the Fund and to the Evergreen funds generally. They noted that EIMC had enhanced a number of these functions in recent periods and continued to do so, in light of regulatory developments in the investment management and mutual fund industries generally and in light of regulatory matters involving EIMC and its affiliates. They concluded that those enhancements appeared generally appropriate, but considered that the enhancement process is an on-going one and determined to continue to monitor developments in these functions in coming periods for appropriateness and consistency with regulatory and industry developments. The Board and the disinterested Trustees concluded, within the context of their overall conclusions regarding the Fund’s Agreements, that they were satisfied with the nature, extent, and quality of the services provided by EIMC and Tattersall, including services provided by EIS under its administrative services agreement with the Fund.
Investment performance. The Trustees considered the investment performance of each of the Evergreen funds, both by comparison to other comparable mutual funds and to broad market indices. The Trustees emphasized that the continuation of the investment advisory agreement for a fund should not be taken as any indication that the Trustees did not believe investment performance for any specific fund might not be improved, and they noted that they would continue to monitor closely the investment performance of the funds going forward. Specifically with respect to the Fund, the Trustees noted that the Class I shares of the Fund performed in the third quin-tile over the recently completed one-year period and performed in the second quintile over the recently completed three-year period.
Advisory and administrative fees. The Trustees noted that the Fund pays no investment advisory or administrative fees. In connection with their review of the Fund’s investment advisory and administrative fees, the Trustees also considered the transfer agency fees paid by the funds to an affiliate of EIMC. They reviewed information presented to them showing generally that the transfer agency fees charged to the funds were generally consistent with industry norms, and that transfer agency fees for a number of funds had recently declined, or were expected to in the near future.
The Trustees noted that EIMC does not provide services to other clients using the same investment strategy as it uses in managing the Fund.
Economies of scale. The Trustees noted that the Fund currently does not pay any advisory fees and no further economies of scale would likely be achieved.
22
This page left intentionally blank
23
TRUSTEES AND OFFICERS
| TRUSTEES1 | | |
| Charles A. Austin III | | Principal occupations: Investment Counselor, Anchor Capital Advisors, Inc. (investment advice); |
| Trustee | | Director, The Andover Companies (insurance); Trustee, Arthritis Foundation of New England; |
| DOB: 10/23/1934 | | Former Director, The Francis Ouimet Society; Former Director, Health Development Corp. |
| Term of office since: 1991 | | (fitness-wellness centers); Former Director, Mentor Income Fund, Inc.; Former Trustee, |
| Other directorships: None | | Mentor Funds and Cash Resource Trust; Former Investment Counselor, Appleton Partners, Inc. |
| | | (investment advice); Former Director, Executive Vice President and Treasurer, State Street |
| | | Research & Management Company (investment advice) |
|
| Shirley L. Fulton | | Principal occupations: Partner, Tin, Fulton, Greene & Owen, PLLC (law firm); Former Partner, |
| Trustee | | Helms, Henderson & Fulton, P.A. (law firm); Retired Senior Resident Superior Court Judge, |
| DOB: 1/10/1952 | | 26th Judicial District, Charlotte, NC |
| Term of office since: 2004 | | |
| Other directorships: None | | |
|
| K. Dun Gifford | | Principal occupations: Chairman and President, Oldways Preservation and Exchange Trust |
| Trustee | | (education); Trustee, Treasurer and Chairman of the Finance Committee, Cambridge College; |
| DOB: 10/23/1938 | | Former Chairman of the Board, Director, and Executive Vice President, The London Harness |
| Term of office since: 1974 | | Company (leather goods purveyor); Former Director, Mentor Income Fund, Inc.; Former Trustee, |
| Other directorships: None | | Mentor Funds and Cash Resource Trust |
|
| Dr. Leroy Keith, Jr. | | Principal occupations: Partner, Stonington Partners, Inc. (private equity firm); Trustee, |
| Trustee | | The Phoenix Group of Mutual Funds; Director, Obagi Medical Products Co.; Director, |
| DOB: 2/14/1939 | | Diversapack Co.; Former Director, Lincoln Educational Services; Former Chairman of the Board |
| Term of office since: 1983 | | and Chief Executive Officer, Carson Products Company (manufacturing); Former Director, |
| Other directorships: Trustee, The | | Mentor Income Fund, Inc.; Former Trustee, Mentor Funds and Cash Resource Trust |
| Phoenix Group of Mutual Funds | | |
|
| Gerald M. McDonnell | | Principal occupations: Manager of Commercial Operations, SMI Steel Co. – South Carolina |
| Trustee | | (steel producer); Former Sales and Marketing Manager, Nucor Steel Company; Former Director, |
| DOB: 7/14/1939 | | Mentor Income Fund, Inc.; Former Trustee, Mentor Funds and Cash Resource Trust |
| Term of office since: 1988 | | |
| Other directorships: None | | |
|
| William Walt Pettit | | Principal occupations: Vice President, Kellam & Pettit, P.A. (law firm); Director, Superior |
| Trustee | | Packaging Corp.; Director, National Kidney Foundation of North Carolina, Inc.; Former Director, |
| DOB: 8/26/1955 | | Mentor Income Fund, Inc.; Former Trustee, Mentor Funds and Cash Resource Trust |
| Term of office since: 1984 | | |
| Other directorships: None | | |
|
| David M. Richardson | | Principal occupations: President, Richardson, Runden LLC (executive recruitment business |
| Trustee | | development/consulting company); Consultant, Kennedy Information, Inc. (executive |
| DOB: 9/19/1941 | | recruitment information and research company); Consultant, AESC (The Association of |
| Term of office since: 1982 | | Executive Search Consultants); Director, J&M Cumming Paper Co. (paper merchandising); |
| Other directorships: None | | Former Trustee, NDI Technologies, LLP (communications); Former Vice Chairman, DHR |
| | | International, Inc. (executive recruitment); Former Director, Mentor Income Fund, Inc.; |
| | | Former Trustee, Mentor Funds and Cash Resource Trust |
|
| Dr. Russell A. Salton III | | Principal occupations: President/CEO, AccessOne MedCard; Former Medical Director, |
| Trustee | | Healthcare Resource Associates, Inc.; Former Medical Director, U.S. Health Care/Aetna Health |
| DOB: 6/2/1947 | | Services; Former Director, Mentor Income Fund, Inc.; Former Trustee, Mentor Funds and |
| Term of office since: 1984 | | Cash Resource Trust |
| Other directorships: None | | |
|
24
TRUSTEES AND OFFICERS continued
| Michael S. Scofield | | Principal occupations: Director and Chairman, Branded Media Corporation (multi-media |
| Trustee | | branding company); Attorney, Law Offices of Michael S. Scofield; Former Director, Mentor |
| DOB: 2/20/1943 | | Income Fund, Inc.; Former Trustee, Mentor Funds and Cash Resource Trust |
| Term of office since: 1984 | | |
| Other directorships: None | | |
|
| Richard J. Shima | | Principal occupations: Independent Consultant; Director, Trust Company of CT; Trustee, |
| Trustee | | Saint Joseph College (CT); Director, Hartford Hospital; Trustee, Greater Hartford YMCA; |
| DOB: 8/11/1939 | | Former Director, Enhance Financial Services, Inc.; Former Director, Old State House Association; |
| Term of office since: 1993 | | Former Director of CTG Resources, Inc. (natural gas); Former Director, Mentor Income Fund, Inc.; |
| Other directorships: None | | Former Trustee, Mentor Funds and Cash Resource Trust |
|
| Richard K. Wagoner, CFA2 | | Principal occupations: Member and Former President, North Carolina Securities Traders |
| Trustee | | Association; Member, Financial Analysts Society; Former Consultant to the Boards of Trustees |
| DOB: 12/12/1937 | | of the Evergreen funds; Former Trustee, Mentor Funds and Cash Resource Trust |
| Term of office since: 1999 | | |
| Other directorships: None | | |
|
| OFFICERS | | |
| Dennis H. Ferro3 | | Principal occupations: President and Chief Executive Officer, Evergreen Investment Company, |
| President | | Inc. and Executive Vice President, Wachovia Bank, N.A.; former Chief Investment Officer, |
| DOB: 6/20/1945 | | Evergreen Investment Company, Inc. |
| Term of office since: 2003 | | |
|
| Kasey Phillips4 | | Principal occupations: Senior Vice President, Evergreen Investment Services, Inc.; Former Vice |
| Treasurer | | President, Evergreen Investment Services, Inc.; Former Assistant Vice President, Evergreen |
| DOB: 12/12/1970 | | Investment Services, Inc. |
| Term of office since: 2005 | | |
|
| Michael H. Koonce4 | | Principal occupations: Senior Vice President and General Counsel, Evergreen Investment |
| Secretary | | Services, Inc.; Senior Vice President and Assistant General Counsel, Wachovia Corporation |
| DOB: 4/20/1960 | | |
| Term of office since: 2000 | | |
|
| James Angelos4 | | Principal occupations: Chief Compliance Officer and Senior Vice President, Evergreen Funds; |
| Chief Compliance Officer | | Former Director of Compliance, Evergreen Investment Services, Inc. |
| DOB: 9/2/1947 | | |
| Term of office since: 2004 | | |
|
1 Each Trustee serves until a successor is duly elected or qualified or until his/her death, resignation, retirement or removal from office. Each Trustee oversees 89 Evergreen funds. Correspondence for each Trustee may be sent to Evergreen Board of Trustees, P.O. Box 20083, Charlotte, NC 28202.
2 Mr. Wagoner is an “interested person” of the Fund because of his ownership of shares in Wachovia Corporation, the parent to the Fund’s investment advisor.
3 The address of the Officer is 401 S. Tryon Street, 20th Floor, Charlotte, NC 28288.
4 The address of the Officer is 200 Berkeley Street, Boston, MA 02116.
Additional information about the Fund’s Board of Trustees and Officers can be found in the Statement of Additional Information (SAI) and is available upon request without charge by calling 800.343.2898.
25
571812 rv1 12/2005
Evergreen Strategic Income Fund

| table of contents |
| 1 | | LETTER TO SHAREHOLDERS |
| 4 | | FUND AT A GLANCE |
| 6 | | ABOUT YOUR FUND’S EXPENSES |
| 7 | | FINANCIAL HIGHLIGHTS |
| 11 | | SCHEDULE OF INVESTMENTS |
| 26 | | STATEMENT OF ASSETS AND LIABILITIES |
| 27 | | STATEMENT OF OPERATIONS |
| 28 | | STATEMENTS OF CHANGES IN NET ASSETS |
| 29 | | NOTES TO FINANCIAL STATEMENTS |
| 36 | | ADDITIONAL INFORMATION |
| 40 | | TRUSTEES AND OFFICERS |
This semiannual report must be preceded or accompanied by a prospectus of the Evergreen fund contained herein. The prospectus contains more complete information, including fees and expenses, and should be read carefully before investing or sending money.
The fund will file its complete schedule of portfolio holdings with the SEC for the first and third quarters of each fiscal year on Form N-Q. The fund’s Form N-Q will be available on the SEC’s Web site at http://www.sec.gov. In addition, the fund’s Form N-Q may be reviewed and copied at the SEC’s Public Reference Room in Washington, D.C. Information on the operation of the Public Reference Room may be obtained by calling 800.SEC.0330.
A description of the fund’s proxy voting policies and procedures, as well as information regarding how the fund voted proxies relating to portfolio securities during the most recent 12-month period ended June 30, is available by visiting our Web site at EvergreenInvestments.com or by visiting the SEC’s Web site at http://www.sec.gov. The fund’s proxy voting policies and procedures are also available without charge, upon request, by calling 800.343.2898.
| Mutual Funds: | | | | |
| NOT FDIC INSURED | MAY LOSE VALUE | NOT BANK GUARANTEED |
Evergreen InvestmentsSM is a service mark of Evergreen Investment Management Company, LLC.
Copyright 2005, Evergreen Investment Management Company, LLC.
Evergreen Investment Management Company, LLC is a subsidiary of Wachovia
Corporation and is an affiliate of Wachovia Corporation's other Broker Dealer subsidiaries.
Evergreen mutual funds are distributed by Evergreen Investment Services, Inc.
200 Berkeley Street, Boston, MA 02116
LETTER TO SHAREHOLDERS
December 2005

Dennis H. Ferro
President and Chief Executive Officer
Dear Shareholder,
We are pleased to provide the semiannual report for the Evergreen Strategic Income Fund, which covers the six-month period ended October 31, 2005.
Fixed income investors had to endure a variety of challenges over the past six months. Moderating economic growth, surging energy prices and tighter monetary policy led the list of concerns, while the terrorist bombings in London and credit downgrades in the auto sector further pressured market sentiment. In addition, Hurricane Katrina devastated much of the gulf region and inflation fears grew with the prospect of more government spending. While the importance of asset allocation becomes increasingly evident during times of uncertainty, we believe it is crucial for long-term investors to extend the diversification process further, to include several strategies within an asset class, such as the bond fund offerings within Evergreen’s Fixed Income Trust and Select Fixed Income Trust.
The investment period began with a trend for slower growth in the U.S. economy. After experiencing the rapid pace of growth typical in economic recovery, Gross Domestic Product had moderated to a pace of growth normally associated with economic expansion. While the growth in overall output was still good, it was no longer considered great, and market interest rates initially declined on the perceived weakness. Yet energy prices continued to soar throughout the summer months amid rising levels for employment, housing and production. The post-Katrina federal spending plans exacerbated these pricing concerns and long-term interest rates began to crawl higher.
1
LETTER TO SHAREHOLDERS continued
Having already anticipated a bout of inflation fears, the Federal Reserve (Fed) maintained its “measured removal of policy accommodation.” While the paradox of moderating economic growth and tighter monetary policy often rattled the fixed income markets, Evergreen’s Investment Strategy Committee concluded that since rates were low for such a lengthy period, the central bank was simply removing excess stimulus to prevent pricing from becoming a long-term problem. Although Chairman Greenspan had been very transparent in his public statements about the direction of monetary policy, market interest rates persisted lower into the summer months. This “flattening” of the yield curve caused many in the fixed income markets to debate its message. Did it signal the end of the expansion? Or was it just confidence in the Fed’s inflation-fighting capabilities? Considering our forecast for moderating global growth, mild wages, and solid productivity, we determined that long-term pricing pressures, despite energy, were insufficient to halt the expansion. In addition, we believed that a combination of excess global savings, an increased “flight to quality,” and growing demand for longer-duration investments by under-funded pensions accelerated this trend.
Throughout this timeframe, our fixed income teams attempted to capitalize on trends within the bond market. For example, Evergreen’s high yield teams emphasized exposure within media and telecom, while the lack of airline exposure benefited their portfolios. Our government bond teams needed to be very agile in their decision-making, for despite the Fed’s monetary policy stance, the yield curve continued to flatten. The mortgage market benefited from the mostly positive economic data, yet the combination of the hurricanes and rising energy costs pressured
2
LETTER TO SHAREHOLDERS continued
yields in September and October. Finally, some of our “core” strategies included going short on duration in anticipation of the rise in market yields. All told, it was a challenging environment to be tied to any one specific area within the bond market, and we believe those portfolios fully diversified within fixed income were best positioned for the long-term.
We continue to recommend that investors maintain their diversified, long-term strategies within their fixed income portfolios.
Please visit our Web site, EvergreenInvestments.com, for more information about our funds and other investment products available to you. Thank you for your continued support of Evergreen Investments.
Sincerely,

Dennis H. Ferro
President and Chief Executive Officer
Evergreen Investment Company, Inc.
Special Notice to Shareholders:
Please visit our Web site at EvergreenInvestments.com for a statement from President and Chief Executive Officer, Dennis Ferro, addressing NASD actions involving Evergreen Investment Services, Inc. (EIS), Evergreen’s mutual fund distributor or statements from Dennis Ferro and Chairman of the Board of the Evergreen Funds, Michael S. Scofield, addressing SEC actions involving the Evergreen Funds.
3
FUND AT A GLANCE
as of October 31, 2005
MANAGEMENT TEAM
Investment Advisor:
• Evergreen Investment Management Company, LLC
Sub-Advisor:
• Evergreen International Advisors
Portfolio Managers:
Dana Erikson, CFA
Anthony Norris
Lisa Brown-Premo
Peter Wilson
CURRENT INVESTMENT STYLE

Source: Morningstar, Inc.
Morningstar’s style box is based on a portfolio date as of 9/30/2005.
The Fixed income style box placement is based on a fund’s average effective maturity or duration and the average credit rating of the bond portfolio.
PERFORMANCE AND RETURNS
Portfolio inception date: 4/14/1987
| | | Class A | | Class B | | Class C | | Class I |
| Class inception date | | 4/14/1987 | | 2/1/1993 | | 2/1/1993 | | 1/13/1997 |
|
| Nasdaq symbol | | EKSAX | | EKSBX | | EKSCX | | EKSYX |
|
| 6-month return with sales charge | | -5.20% | | -5.61% | | -1.72% | | N/A |
|
| 6-month return w/o sales charge | | -0.40% | | -0.75% | | -0.75% | | -0.30% |
|
| Average annual return* | | | | | | | | |
|
| 1-year with sales charge | | -3.78% | | -4.48% | | -0.65% | | N/A |
|
| 1-year w/o sales charge | | 1.01% | | 0.32% | | 0.31% | | 1.25% |
|
| 5-year | | 8.05% | | 8.03% | | 8.33% | | 9.42% |
|
| 10-year | | 6.23% | | 5.94% | | 5.93% | | 6.80% |
|
| Maximum sales charge | | 4.75% | | 5.00% | | 1.00% | | N/A |
| | | Front-end | | CDSC | | CDSC | | |
|
* Adjusted for maximum applicable sales charge, unless noted.
Past performance is no guarantee of future results. The performance quoted represents past performance and current performance may be lower or higher. The investment return and principal value of an investment will fluctuate so that investors’ shares, when redeemed, may be worth more or less than their original cost. To obtain performance information current to the most recent month-end for Classes A, B, C or I, please go to EvergreenInvestments.com/fundperformance. The performance of each class may vary based on differences in loads, fees and expenses paid by the shareholders investing in each class. Performance includes the reinvestment of income dividends and capital gain distributions. Performance shown does not reflect the deduction of taxes that a shareholder would pay on fund distributions or the redemption of fund shares.
Historical performance shown for Class I prior to its inception is based on the performance of Class A, the original class offered. These historical returns for Class I reflect the 0.25% 12b-1 fee in effect for Class A. Class I does not pay a 12b-1 fee. If this fee had not been reflected, returns for Class I would have been higher. The fund incurs 12b-1 fees of 0.30% for Class A and 1.00% for Classes B and C.
The advisor is reimbursing a portion of the 12b-1 fee for Class A. Had the fee not been reimbursed, returns for Class A would have been lower. Returns reflect expense limits previously in effect for all classes, without which returns would have been lower.
4
FUND AT A GLANCE continued
LONG-TERM GROWTH
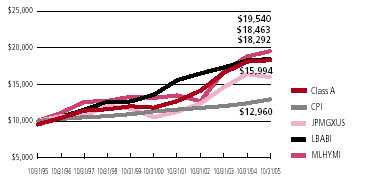
Comparison of a $10,000 investment in the Evergreen Strategic Income Fund Class A shares, versus a similar investment in the JPMorgan Global Government Bond Index excluding U.S. (JPMGXUS), the Lehman Brothers Aggregate Bond Index (LBABI), the Merrill Lynch High Yield Master Index† (MLHYMI) and the Consumer Price Index (CPI).
The JPMGXUS, the LBABI and the MLHYMI are unmanaged market indexes and do not include transaction costs associated with buying and selling securities, any mutual fund expenses or any taxes. The CPI is a commonly used measure of inflation and does not represent an investment return. It is not possible to invest directly in an index.
Class I shares are only offered in the following manner: (1) to investment advisory clients of Evergreen Investment Management Company, LLC (or its advisory affiliates) when purchased by such advisor(s) on behalf of its clients, (2) through arrangements entered into on behalf of the Evergreen funds with certain financial services firms, (3) to certain institutional investors and (4) to persons who owned Class Y shares in registered name in an Evergreen fund on or before December 31, 1994 or who owned shares of any SouthTrust fund in registered name as of March 18, 2005 or shares of Vestaur Securities Fund as of May 20, 2005.
Class I shares are only available to institutional shareholders with a minimum of $1 million investment, which may be waived in certain situations.
The fund’s investment objective is nonfundamental and may be changed without a vote of the fund’s shareholders.
Foreign investments may contain more risk due to the inherent risks associated with changing political climates, foreign market instability and foreign currency fluctuations. Risks of international investing are magnified in emerging or developing markets.
High yield, lower-rated bonds may contain more risk due to the increased possibility of default.
The return of principal is not guaranteed due to fluctuation in the NAV of the fund caused by changes in the price of the individual bonds held by the fund and the buying and selling of bonds by the fund. Bond funds have the same inflation, interest rate and credit risks that are associated with the individual bonds held by the fund. Generally, the value of bond funds rise when prevailing interest rates fall and fall when interest rates rise.
U.S. government guarantees apply only to certain securities held in the fund’s portfolio and not to the fund’s shares.
† Copyright 2005. Merrill Lynch, Pierce, Fenner & Smith Incorporated. All rights reserved.
All data is as of October 31, 2005, and subject to change.
5
ABOUT YOUR FUND’S EXPENSES
The Example below is intended to describe the fees and expenses borne by shareholders and the impact of those costs on your investment.
Example
As a shareholder of the fund, you incur two types of costs: (1) transaction costs, including sales charges (loads), redemption fees and exchange fees; and (2) ongoing costs, including management fees, distribution (12b-1) fees and other fund expenses. This Example is intended to help you understand your ongoing costs (in dollars) of investing in the fund and to compare these costs with the ongoing costs of investing in other mutual funds. The Example is based on an investment of $1,000 invested at the beginning of the period and held for the entire period from May 1, 2005 to October 31, 2005.
The example illustrates your fund’s costs in two ways:
• Actual expenses
The section in the table under the heading “Actual” provides information about actual account values and actual expenses. You may use the information in these columns, together with the amount you invested, to estimate the expenses that you paid over the period. Simply divide your account value by $1,000 (for example, an $8,600 account value divided by $1,000 = 8.6), then multiply the result by the number in the appropriate column for your share class, in the column entitled “Expenses Paid During Period” to estimate the expenses you paid on your account during this period.
• Hypothetical example for comparison purposes
The section in the table under the heading “Hypothetical (5% return before expenses)” provides information about hypothetical account values and hypothetical expenses based on the fund’s actual expense ratio and an assumed rate of return of 5% per year before expenses, which is not the fund’s actual return. The hypothetical account values and expenses may not be used to estimate the actual ending account balance or expenses you paid for the period. You may use this information to compare the ongoing costs of investing in the fund and other funds. To do so, compare this 5% hypothetical example with the 5% hypothetical examples that appear in the shareholder reports of the other funds.
Please note that the expenses shown in the table are meant to highlight your ongoing costs only and do not reflect any transactional costs, such as sales charges (loads), redemption fees or exchange fees. Therefore, the section in the table under the heading “Hypothetical (5% return before expenses)” is useful in comparing ongoing costs only, and will not help you determine the relative total costs of owning different funds. In addition, if these transactional costs were included, your costs would have been higher.
| | | Beginning | | Ending | | |
| | | Account | | Account | | Expenses |
| | | Value | | Value | | Paid During |
| | | 5/01/2005 | | 10/31/2005 | | Period* |
|
| Actual | | | | | | |
| Class A | | $ 1,000.00 | | $ 995.95 | | $ 5.84 |
| Class B | | $ 1,000.00 | | $ 992.53 | | $ 9.34 |
| Class C | | $ 1,000.00 | | $ 992.50 | | $ 9.34 |
| Class I | | $ 1,000.00 | | $ 997.02 | | $ 4.33 |
| Hypothetical | | | | | | |
| (5% return | | | | | | |
| before expenses) | | | | | | |
| Class A | | $ 1,000.00 | | $ 1,019.36 | | $ 5.90 |
| Class B | | $ 1,000.00 | | $ 1,015.83 | | $ 9.45 |
| Class C | | $ 1,000.00 | | $ 1,015.83 | | $ 9.45 |
| Class I | | $ 1,000.00 | | $ 1,020.87 | | $ 4.38 |
|
* For each class of the Fund, expenses are equal to the annualized expense ratio of each class (1.16% for Class A, 1.86% for Class B, 1.86% for Class C and 0.86% for Class I), multiplied by the average account value over the period, multiplied by 184 / 365 days.
6
FINANCIAL HIGHLIGHTS
(For a share outstanding throughout each period)
| | | Six Months Ended | | Year Ended April 30, |
| | | October 31, 2005 | |
|
| CLASS A | | (unaudited) | | 2005 | | 2004 | | 2003 | | 20021 | | 2001 |
|
| Net asset value, beginning of period | | $ 6.53 | | $ 6.38 | | $ 6.50 | | $ 5.83 | | $ 5.74 | | $ 6.12 |
|
| Income from investment operations | | | | | | | | | | | | | | | | |
| Net investment income (loss) | | 0.142 | | 0.33 | | 0.342 | | 0.382 | | 0.35 | | 0.522 |
Net realized and unrealized gains or losses
on investments | | (0.16) | | 0.19 | | 0.07 | | 0.68 | | 0.16 | | (0.40) |
| |
|
| Total from investment operations | | (0.02) | | 0.52 | | 0.41 | | 1.06 | | 0.51 | | 0.12 |
|
| Distributions to shareholders from | | | | | | | | | | | | | | | | |
| Net investment income | | (0.16) | | (0.35) | | (0.37) | | (0.39) | | (0.32) | | (0.40) |
| Net realized gains | | 0 | | (0.02) | | (0.16) | | 0 | | 0 | | 0 |
| Tax basis return of capital | | 0 | | 0 | | 0 | | 0 | | (0.10) | | (0.10) |
| |
|
| Total distributions to shareholders | | (0.16) | | (0.37) | | (0.53) | | (0.39) | | (0.42) | | (0.50) |
|
| Net asset value, end of period | | $ 6.35 | | $ 6.53 | | $ 6.38 | | $ 6.50 | | $ 5.83 | | $ 5.74 |
|
| Total return3 | | (0.40%) | | 8.22% | | 6.24% | | 18.79% | | 9.37% | | 2.09% |
|
| Ratios and supplemental data | | | | | | | | | | | | | | | | |
| Net assets, end of period (thousands) | | $214,556 | | $214,776 | | $202,017 | | $173,842 | | $130,934 | | $122,223 |
| Ratios to average net assets | | | | | | | | | | | | | | | | |
| Expenses including waivers/reimbursements | | | | | | | | | | | | | | | | |
| but excluding expense reductions | | 1.16%4 | | 1.12% | | 1.21% | | 1.19% | | 1.23% | | 0.87% |
| Expenses excluding waivers/reimbursements | | | | | | | | | | | | | | | | |
| and expense reductions | | 1.16%4 | | 1.12% | | 1.21% | | 1.19% | | 1.23% | | 1.24% |
| Net investment income (loss) | | 4.40%4 | | 5.03% | | 5.10% | | 6.31% | | 6.02% | | 8.06% |
| Portfolio turnover rate | | 69% | | 130% | | 129% | | 129% | | 304% | | 322% |
|
1 As required, effective May 1, 2001, the Fund has adopted the provisions of the AICPA Audit and Accounting Guide, Audits of Investment Companies, and began amortizing premium on its fixed-income securities. The effects of this change for the year ended April 30, 2002 were a decrease in net investment income per share of $0.02; an increase in net realized gains or losses pe r share of $0.02; and a decrease to the ratio of net investment income to average net assets of 0.45%. The above per share information, ratios and supplemental data for the periods prior to May 1, 2001 have not been restated to reflect this change in presentation.
2 Net investment income (loss) per share is based on average shares outstanding during the period.
3 Excluding applicable sales charges
4 Annualized
See Notes to Financial Statements
7
FINANCIAL HIGHLIGHTS
(For a share outstanding throughout each period)
| | | Six Months Ended | | Year Ended April 30, |
| | | October 31, 2005 | |
|
| CLASS B | | (unaudited) | | 2005 | | 2004 | | 2003 | | 20021 | | 2001 |
|
| Net asset value, beginning of period | | $ 6.55 | | $ 6.40 | | $ 6.52 | | $ 5.85 | | $ 5.75 | | $ 6.14 |
|
| Income from investment operations | | | | | | | | | | | | | | | | |
| Net investment income (loss) | | 0.122 | | 0.29 | | 0.292 | | | | 0.34 | | 0.29 | | 0.482 |
Net realized and unrealized gains or
losses on investments | | (0.17) | | 0.19 | | 0.07 | | | | 0.67 | | 0.19 | | (0.41) |
| |
|
| Total from investment operations | | (0.05) | | 0.48 | | 0.36 | | | | 1.01 | | 0.48 | | 0.07 |
|
| Distributions to shareholders from | | | | | | | | | | | | | | | | |
| Net investment income | | (0.13) | | (0.31) | | (0.32) | | | | (0.34) | | (0.28) | | (0.36) |
| Net realized gains | | 0 | | (0.02) | | (0.16) | | | | 0 | | 0 | | 0 |
| Tax basis return of capital | | 0 | | 0 | | 0 | | | | 0 | | (0.10) | | (0.10) |
| |
|
| Total distributions to shareholders | | (0.13) | | (0.33) | | (0.48) | | | | (0.34) | | (0.38) | | (0.46) |
|
| Net asset value, end of period | | $ 6.37 | | $ 6.55 | | $ 6.40 | | $ 6.52 | | $ 5.85 | | $ 5.75 |
|
| Total return3 | | | | (0.75%) | | 7.46% | | 5.49% | | | | 17.87% | | 8.74% | | 1.18%�� |
|
| Ratios and supplemental data | | | | | | | | | | | | | | | | |
| Net assets, end of period (thousands) | | $87,672 | | $98,852 | | $113,115 | | $107,968 | | $77,471 | | $83,347 |
| Ratios to average net assets | | | | | | | | | | | | | | | | |
| Expenses including waivers/reimbursements | | | | | | | | | | | | | | | | |
| but excluding expense reductions | | | | 1.86%4 | | 1.83% | | 1.91% | | 1.94% | | 1.98% | | 1.61% |
| Expenses excluding waivers/reimbursements | | | | | | | | | | | | | | | | |
| and expense reductions | | | | 1.86%4 | | 1.83% | | 1.91% | | 1.94% | | 1.98% | | 1.98% |
| Net investment income (loss) | | | | 3.70%4 | | 4.34% | | 4.40% | | 5.54% | | 5.27% | | 7.34% |
| Portfolio turnover rate | | | | 69% | | 130% | | 129% | | | | 129% | | 304% | | 322% |
|
1 As required, effective May 1, 2001, the Fund has adopted the provisions of the AICPA Audit and Accounting Guide, Audits of Investment Companies, and began amortizing premium on its fixed-income securities. The effects of this change for the year ended April 30, 2002 were a decrease in net investment income per share of $0.03; an increase in net realized gains or losses pe r share of $0.03; and a decrease to the ratio of net investment income to average net assets of 0.45%. The above per share information, ratios and supplemental data for the periods prior to May 1, 2001 have not been restated to reflect this change in presentation.
2 Net investment income (loss) per share is based on average shares outstanding during the period.
3 Excluding applicable sales charges
4 Annualized
See Notes to Financial Statements
8
FINANCIAL HIGHLIGHTS
(For a share outstanding throughout each period)
| | | Six Months Ended | | Year Ended April 30, |
| | | October 31, 2005 | |
|
| CLASS C | | (unaudited) | | 2005 | | 2004 | | 2003 | | 20021 | | 2001 |
|
| Net asset value, beginning of period | | $ 6.54 | | $ 6.39 | | $ 6.51 | | $ 5.84 | | $ 5.75 | | $ 6.13 |
|
| Income from investment operations | | | | | | | | | | | | | | | | |
| Net investment income (loss) | | | | 0.122 | | 0.29 | | 0.292 | | | | 0.342 | | 0.32 | | 0.462 |
Net realized and unrealized gains or losses
on investments | | | | (0.17) | | 0.19 | | 0.07 | | | | 0.67 | | 0.15 | | (0.38) |
| |
|
| Total from investment operations | | | | (0.05) | | 0.48 | | 0.36 | | | | 1.01 | | 0.47 | | 0.08 |
|
| Distributions to shareholders from | | | | | | | | | | | | | | | | |
| Net investment income | | | | (0.13) | | (0.31) | | (0.32) | | | | (0.34) | | (0.28) | | (0.36) |
| Net realized gains | | | | 0 | | (0.02) | | (0.16) | | | | 0 | | 0 | | 0 |
| Tax basis return of capital | | | | 0 | | 0 | | 0 | | | | 0 | | (0.10) | | (0.10) |
| Total distributions to shareholders | | | | (0.13) | | (0.33) | | (0.48) | | | | (0.34) | | (0.38) | | (0.46) |
|
| Net asset value, end of period | | $ 6.36 | | $ 6.54 | | $ 6.39 | | $ 6.51 | | $ 5.84 | | $ 5.75 |
|
| Total return3 | | | | (0.75%) | | 7.46% | | 5.49% | | | | 17.89% | | 8.56% | | 1.35% |
|
| Ratios and supplemental data | | | | | | | | | | | | | | | | |
| Net assets, end of period (thousands) | | $74,519 | | $79,539 | | $89,236 | | $68,207 | | $22,554 | | $16,746 |
| Ratios to average net assets | | | | | | | | | | | | | | | | |
| Expenses including waivers/reimbursements | | | | | | | | | | | | | | | | |
| but excluding expense reductions | | | | 1.86%4 | | 1.83% | | 1.91% | | | | 1.93% | | 1.98% | | 1.63% |
| Expenses excluding waivers/reimbursements | | | | | | | | | | | | | | | | |
| and expense reductions | | | | 1.86%4 | | 1.83% | | 1.91% | | | | 1.93% | | 1.98% | | 2.00% |
| Net investment income (loss) | | | | 3.70%4 | | 4.34% | | 4.40% | | | | 5.66% | | 5.25% | | 7.26% |
| Portfolio turnover rate | | | | 69% | | 130% | | 129% | | | | 129% | | 304% | | 322% |
|
1 As required, effective May 1, 2001, the Fund has adopted the provisions of the AICPA Audit and Accounting Guide, Audits of Investment Companies, and began amortizing premium on its fixed-income securities. The effects of this change for the year ended April 30, 2002 were a decrease in net investment income per share of $0.02; an increase in net realized gains or losses per share of $0.02; and a decrease to the ratio of net investment income to average net assets of 0.45%. The above per share information, ratios and supplemental data for the periods prior to May 1, 2001 have not been restated to reflect this change in presentation.
2 Net investment income (loss) per share is based on average shares outstanding during the period.
3 Excluding applicable sales charges
4 Annualized
See Notes to Financial Statements
9
FINANCIAL HIGHLIGHTS
(For a share outstanding throughout each period)
| | | | | | | | | | | | | | | |
| | | Six Months Ended | | Year Ended April 30, |
| | | October 31, 2005 | |
|
| CLASS I1 | | (unaudited) | | 2005 | | 2004 | | 2003 | | 20022 | | 2001 |
|
| Net asset value, beginning of period | | $ 6.43 | | $ 6.28 | | $ 6.40 | | $ 5.74 | | $ 5.65 | | $ 6.02 |
|
| Income from investment operations | | | | | | | | | | | | | | | | |
| Net investment income (loss) | | | | 0.153 | | 0.34 | | 0.353 | | | | 0.413 | | 0.35 | | 0.513 |
Net realized and unrealized gains
or losses on investments | | | | (0.17) | | 0.19 | | 0.07 | | | | 0.64 | | 0.17 | | (0.37) |
| |
|
| Total from investment operations | | | | (0.02) | | 0.53 | | 0.42 | | | | 1.05 | | 0.52 | | 0.14 |
|
| Distributions to shareholders from | | | | | | | | | | | | | | | | |
| Net investment income | | | | (0.16) | | (0.36) | | (0.38) | | | | (0.39) | | (0.33) | | (0.41) |
| Net realized gains | | | | 0 | | (0.02) | | (0.16) | | | | 0 | | 0 | | 0 |
| Tax basis return of capital | | | | 0 | �� | 0 | | 0 | | | | 0 | | (0.10) | | (0.10) |
| |
|
| Total distributions to shareholders | | | | (0.16) | | (0.38) | | (0.54) | | | | (0.39) | | (0.43) | | (0.51) |
|
| Net asset value, end of period | | $ 6.25 | | $ 6.43 | | $ 6.28 | | $ 6.40 | | $ 5.74 | | $ 5.65 |
|
| Total return | | | | (0.30%) | | 8.58% | | 6.56% | | | | 19.09% | | 9.67% | | 2.41% |
|
| Ratios and supplemental data | | | | | | | | | | | | | | | | |
| Net assets, end of period (thousands) | | $20,249 | | $19,216 | | $26,711 | | $13,406 | | $1,779 | | $1,584 |
| Ratios to average net assets | | | | | | | | | | | | | | | | |
| Expenses including waivers/reimbursements | | | | | | | | | | | | | | | | |
| but excluding expense reductions | | | | 0.86%4 | | 0.82% | | 0.91% | | | | 0.94% | | 0.98% | | 0.62% |
| Expenses excluding waivers/reimbursements | | | | | | | | | | | | | | | | |
| and expense reductions | | | | 0.86%4 | | 0.82% | | 0.91% | | | | 0.94% | | 0.98% | | 0.99% |
| Net investment income (loss) | | | | 4.70%4 | | 5.33% | | 5.42% | | | | 6.75% | | 6.27% | | 8.30% |
| Portfolio turnover rate | | | | 69% | | 130% | | 129% | | | | 129% | | 304% | | 322% |
|
1 Effective at the close of business on May 11, 2001, Class Y shares were renamed as Institutional shares (Class I).
2 As required, effective May 1, 2001, the Fund has adopted the provisions of the AICPA Audit and Accounting Guide, Audits of Investment Companies, and began amortizing premium on its fixed-income securities. The effects of this change for the year ended April 30, 2002 were a decrease in net investment income per share of $0.03; an increase in net realized gains or losses pe r share of $0.03; and a decrease to the ratio of net investment income to average net assets of 0.45%. The above per share information, ratios and supplemental data for the periods prior to May 1, 2001 have not been restated to reflect this change in presentation.
3 Net investment income (loss) per share is based on average shares outstanding during the period.
4 Annualized
See Notes to Financial Statements
10
SCHEDULE OF INVESTMENTS
October 31, 2005 (unaudited)
| | | Principal | | | | |
| | | Amount | | | | Value |
|
| |
| AGENCY COMMERCIAL MORTGAGE-BACKED SECURITIES 2.9% | | | | | | |
| FIXED-RATE 1.9% | | | | | | |
| FNMA: | | | | | | |
| 4.44%, 04/01/2014 | | $ 415,852 | | $ | | 397,247 |
| 6.18%, 06/01/2013 | | 1,418,244 | | | | 1,500,885 |
| 7.50%, 07/01/2010 | | 782,998 | | | | 857,736 |
| Ser. 2002-M1, Class C, 6.17%, 02/25/2016 | | 1,875,000 | | | | 2,005,875 |
| Ser. 2003-M1, Class B, 4.91%, 07/25/2020 ## | | 3,000,000 | | | | 3,001,500 |
| |
|
| | | | | | | 7,763,243 |
| |
|
| FLOATING-RATE 1.0% | | | | | | |
| FNMA: | | | | | | |
| 5.24%, 07/01/2035 ## | | 3,190,205 | | | | 3,189,439 |
| 6.70%, 04/01/2011 | | 69,496 | | | | 73,540 |
| 7.85%, 11/01/2014 ## | | 527,333 | | | | 575,788 |
| |
|
| | | | | | | 3,838,767 |
| |
|
| Total Agency Commercial Mortgage-Backed Securities (cost $11,684,428) | | | | | | 11,602,010 |
| |
|
| AGENCY MORTGAGE-BACKED COLLATERALIZED MORTGAGE OBLIGATIONS 3.2% | | | | | | |
| FIXED-RATE 0.2% | | | | | | |
| FNMA: | | | | | | |
| Ser. 2004-W2, Class 2A2, 7.00%, 02/25/2044 | | 376,962 | | | | 396,885 |
| Ser. 2004-W2, Class 5A, 7.50%, 03/25/2044 | | 267,483 | | | | 283,599 |
| |
|
| | | | | | | 680,484 |
| |
|
| FLOATING-RATE 3.0% | | | | | | |
| FHLMC: | | | | | | |
| Ser. 1699, Class FB, 4.81%, 03/15/2024 | | 1,176,961 | | | | 1,200,097 |
| Ser. 2710, Class FY, 4.17%, 10/15/2018 | | 373,352 | | | | 374,816 |
| FNMA: | | | | | | |
| Ser. 2002-67, Class FA, 4.83%, 11/25/2032 ## | | 2,811,524 | | | | 2,880,575 |
| Ser. 2002-77, Class F, 4.43%, 12/25/2032 ## | | 3,464,390 | | | | 3,524,995 |
| Ser. 2002-77, Class FA, 4.79%, 10/18/2030 ## | | 4,031,470 | | | | 4,128,467 |
| |
|
| | | | | | | 12,108,950 |
| |
|
| Total Agency Mortgage-Backed Collateralized Mortgage Obligations | | | | | | |
| (cost $12,759,845) | | | | | | 12,789,434 |
| |
|
| AGENCY MORTGAGE-BACKED PASS THROUGH SECURITIES 14.2% | | | | | | |
| FIXED-RATE 13.7% | | | | | | |
| FHLMC: | | | | | | |
| 5.50%, TBA # | | 17,600,000 | | | | 17,496,274 |
| 6.00%, TBA # | | 5,920,000 | | | | 5,979,200 |
| FNMA: | | | | | | |
| 4.50%, TBA # | | 5,500,000 | | | | 5,319,534 |
| 5.50%, TBA # | | 12,500,000 | | | | 12,352,338 |
| 6.00%, TBA # | | 8,000,000 | | | | 8,070,000 |
| 6.07%, 09/01/2013 ## | | 1,456,968 | | | | 1,537,437 |
| 6.50%, 04/01/2017 | | 702,728 | | | | 775,705 |
| 6.50%, TBA # | | 2,465,000 | | | | 2,530,475 |
See Notes to Financial Statements
11
SCHEDULE OF INVESTMENTS continued
October 31, 2005 (unaudited)
| | | | | Principal | | | | |
| | | | | Amount | | | | Value |
|
| |
| AGENCY MORTGAGE-BACKED PASS THROUGH SECURITIES continued | | | | | | | | |
| FIXED-RATE continued | | | | | | | | |
| GNMA: | | | | | | | | |
| 6.00%, 06/15/2031 - 09/15/2031 | | $ | | 118,764 | | $ | | 120,926 |
| 7.50%, 12/15/2030 | | | | 55,011 | | | | 58,285 |
| 8.00%, 10/15/2030 | | | | 2,404 | | | | 2,571 |
| |
|
| | | | | | | | | 54,242,745 |
| |
|
| FLOATING-RATE 0.5% | | | | | | | | |
| FNMA: | | | | | | | | |
| 3.94%, 07/01/2044 | | | | 1,018,798 | | | | 1,034,345 |
| 4.99%, 05/01/2035 | | | | 1,211,139 | | | | 1,194,946 |
| |
|
| | | | | | | | | 2,229,291 |
| |
|
Total Agency Mortgage-Backed Pass Through Securities
(cost $56,885,719) | | | | | | | | 56,472,036 |
| |
|
| ASSET-BACKED SECURITIES 1.6% | | | | | | | | |
| C-Bass, Ltd., Ser. 11A, Class C, FRN, 5.22%, 09/15/2039 144A | | | | 4,315,000 | | | | 4,350,060 |
| Ocean Star plc, Ser. 2004-A, Class C, FRN, 5.03%, 11/12/2018 144A | | | | 1,040,000 | | | | 1,049,256 |
| Trapeza CDO, LLC, Ser. 2004-7A, Class B1, FRN, 5.20%, 01/25/2035 144A | | | | 875,000 | | | | 900,296 |
| |
|
| Total Asset-Backed Securities (cost $6,230,000) | | | | | | | | 6,299,612 |
| |
|
| COMMERCIAL MORTGAGE-BACKED SECURITIES 0.6% | | | | | | | | |
| FIXED-RATE 0.6% | | | | | | | | |
| First Union National Bank Comml. Mtge., Ser. 2000-C1, Class F, 8.51%, | | | | | | | | |
| 05/17/2032 (cost $2,635,981) | | | | 2,249,000 | | | | 2,598,193 |
| |
|
| CORPORATE BONDS 30.1% | | | | | | | | |
| CONSUMER DISCRETIONARY 9.5% | | | | | | | | |
| Auto Components 0.6% | | | | | | | | |
| Dura Operating Corp., Ser. B, 8.625%, 04/15/2012 | | | | 375,000 | | | | 319,688 |
| HLI Operating Co., Inc., 10.50%, 06/15/2010 | | | | 400,000 | | | | 330,000 |
| Tenneco Automotive, Inc., 8.625%, 11/15/2014 | | | | 1,675,000 | | | | 1,608,000 |
| |
|
| | | | | | | | | 2,257,688 |
| |
|
| Diversified Consumer Services 0.4% | | | | | | | | |
| Carriage Services, Inc., 7.875%, 01/15/2015 | | | | 425,000 | | | | 437,750 |
| Service Corporation International, 6.75%, 04/01/2016 | | | | 1,000,000 | | | | 987,500 |
| |
|
| | | | | | | | | 1,425,250 |
| |
|
| Hotels, Restaurants & Leisure 2.2% | | | | | | | | |
| Ameristar Casinos, Inc., 10.75%, 02/15/2009 | | | | 1,000,000 | | | | 1,070,000 |
| Herbst Gaming, Inc., 7.00%, 11/15/2014 | | | | 850,000 | | | | 843,625 |
| Isle of Capri Casinos, Inc., 7.00%, 03/01/2014 | | | | 850,000 | | | | 807,500 |
| La Quinta Corp., 8.875%, 03/15/2011 | | | | 1,000,000 | | | | 1,072,500 |
| Las Vegas Sands Corp., 6.375%, 02/15/2015 | | | | 750,000 | | | | 714,375 |
| Mandalay Resort Group, Ser. B, 10.25%, 08/01/2007 | | | | 1,000,000 | | | | 1,070,000 |
| MGM MIRAGE, Inc., 5.875%, 02/27/2014 | | | | 525,000 | | | | 493,500 |
| MTR Gaming Group, Inc., 9.75%, 04/01/2010 | | | | 1,200,000 | | | | 1,269,000 |
See Notes to Financial Statements
12
SCHEDULE OF INVESTMENTS continued
October 31, 2005 (unaudited)
| | | | | | | Principal | | | | |
| | | | | | | Amount | | | | Value |
|
| |
| CORPORATE BONDS continued | | | | | | | | |
| CONSUMER DISCRETIONARY continued | | | | | | | | |
| Hotels, Restaurants & Leisure continued | | | | | | | | |
| Station Casinos, Inc.: | | | | | | | | | | |
| 6.50%, 02/01/2014 | | | | $ | | 425,000 | | $ | | 426,062 |
| 6.875%, 03/01/2016 | | | | | | 1,100,000 | | | | 1,113,750 |
| |
|
| | | | | | | | | | | 8,880,312 |
| |
|
| Household Durables 0.7% | | | | | | | | | | |
| Amscan Holdings, Inc., 8.75%, 05/01/2014 | | | | 1,000,000 | | | | 805,000 |
| Jarden Corp., 9.75%, 05/01/2012 | | | | | | 1,525,000 | | | | 1,547,875 |
| Meritage Homes Corp., 6.25%, 03/15/2015 | | | | 500,000 | | | | 437,500 |
| |
|
| | | | | | | | | | | 2,790,375 |
| |
|
| Leisure Equipment & Products 0.2% | | | | | | | | |
| Riddell Bell Holdings, Inc., 8.375%, 10/01/2012 | | | | 760,000 | | | | 729,600 |
| |
|
| Media 2.9% | | | | | | | | | | |
| AMC Entertainment, Inc., Ser. B, 8.625%, 08/15/2012 | | | | 1,250,000 | | | | 1,265,625 |
| Cablevision Systems Corp., Ser. B, 8.00%, 04/15/2012 | | | | 1,400,000 | | | | 1,344,000 |
| CCO Holdings, LLC, 8.75%, 11/15/2013 | | | | 850,000 | | | | 822,375 |
| Cinemark USA, Inc., 9.00%, 02/01/2013 | | | | 700,000 | | | | 726,250 |
| CSC Holdings, Inc., 7.625%, 04/01/2011 | | | | 835,000 | | | | 841,262 |
| Dex Media East, LLC, 9.875%, 11/15/2009 | | | | 850,000 | | | | 928,625 |
| Dex Media West, LLC, 5.875%, 11/15/2011 | | | | 725,000 | | | | 730,438 |
| Emmis Communications Corp.: | | | | | | | | | | |
| 6.875%, 05/15/2012 | | | | | | 800,000 | | | | 794,000 |
| FRN, 9.75%, 06/15/2012 | | | | | | 400,000 | | | | 403,000 |
| Mediacom Communications Corp., 9.50%, 01/15/2013 | | | | 1,850,000 | | | | 1,817,625 |
| Sinclair Broadcast Group, Inc., 8.00%, 03/15/2012 | | | | 750,000 | | | | 774,375 |
| Sirius Satellite Radio, Inc., 9.625%, 08/01/2013 144A | | | | 1,175,000 | | | | 1,117,719 |
| |
|
| | | | | | | | | | | 11,565,294 |
| |
|
| Multi-line Retail 0.4% | | | | | | | | | | |
| J.C. Penney Co., Inc., 7.375%, 08/15/2008 | | | | 1,650,000 | | | | 1,736,625 |
| |
|
| Specialty Retail 1.5% | | | | | | | | | | |
| CSK Auto, Inc., 7.00%, 01/15/2014 | | | | 1,500,000 | | | | 1,410,000 |
| FTD, Inc., 7.75%, 02/15/2014 | | | | | | 1,944,000 | | | | 1,934,280 |
| PETCO Animal Supplies, Inc., 10.75%, 11/01/2011 | | | | 1,100,000 | | | | 1,197,625 |
| United Auto Group, Inc., 9.625%, 03/15/2012 | | | | 1,300,000 | | | | 1,356,875 |
| |
|
| | | | | | | | | | | 5,898,780 |
| |
|
| Textiles, Apparel & Luxury Goods 0.6% | | | | | | | | |
| Levi Strauss & Co., 9.75%, 01/15/2015 | | | | 750,000 | | | | 761,250 |
| Norcross Safety Products, LLC, Ser. B, 9.875%, 08/15/2011 | | | | 700,000 | | | | 749,000 |
| Oxford Industries, Inc., 8.875%, 06/01/2011 | | | | 400,000 | | | | 412,000 |
| Warnaco Group, Inc., 8.875%, 06/15/2013 | | | | 385,000 | | | | 416,762 |
| |
|
| | | | | | | | | | | 2,339,012 |
| |
|
See Notes to Financial Statements
13
SCHEDULE OF INVESTMENTS continued
October 31, 2005 (unaudited)
| | | | | | | Principal | | | | |
| | | | | | | Amount | | | | Value |
|
| |
| CORPORATE BONDS continued | | | | | | | | |
| CONSUMER STAPLES 0.7% | | | | | | | | |
| Food Products 0.4% | | | | | | | | | | |
| Del Monte Foods Co.: | | | | | | | | | | |
| 6.75%, 02/15/2015 144A | | $ | | 190,000 | | $ | | 185,487 |
| 8.625%, 12/15/2012 | | | | 400,000 | | | | 428,000 |
| Michael Foods, Inc., 8.00%, 11/15/2013 | | | | 900,000 | | | | 918,000 |
| |
|
| | | | | | | | | | | 1,531,487 |
| |
|
| Personal Products 0.3% | | | | | | | | |
| Playtex Products, Inc., 8.00%, 03/01/2011 | | | | 1,250,000 | | | | 1,310,938 |
| |
|
| ENERGY 3.9% | | | | | | | | | | |
| Energy Equipment & Services 0.9% | | | | | | | | |
| Dresser, Inc., 9.375%, 04/15/2011 | | | | 775,000 | | | | 806,000 |
| GulfMark Offshore, Inc., 7.75%, 07/15/2014 | | | | 525,000 | | | | 553,875 |
| Hornbeck Offshore Services, Inc., 6.125%, 12/01/2014 144A | | | | 620,000 | | | | 607,600 |
| Parker Drilling Co.: | | | | | | | | | | |
| 9.625%, 10/01/2013 | | | | 450,000 | | | | 510,750 |
| 9.625%, 10/01/2013 144A | | | | 950,000 | | | | 1,078,250 |
| |
|
| | | | | | | | | | | 3,556,475 |
| |
|
| Oil, Gas & Consumable Fuels 3.0% | | | | | | | | |
| Chesapeake Energy Corp.: | | | | | | | | |
| 6.875%, 01/15/2016 | | | | 1,620,000 | | | | 1,648,350 |
| 7.75%, 01/15/2015 | | | | | | 400,000 | | | | 426,000 |
| Clayton Williams Energy, Inc., 7.75%, 08/01/2013 144A | | | | 725,000 | | | | 703,250 |
| El Paso Corp., 7.875%, 06/15/2012 | | | | 1,575,000 | | | | 1,614,375 |
| El Paso Production Holding Co., 7.75%, 06/01/2013 | | | | 1,225,000 | | | | 1,267,875 |
| Encore Acquisition Co., 6.25%, 04/15/2014 | | | | 535,000 | | | | 521,625 |
| Exco Resources, Inc., 7.25%, 01/15/2011 | | | | 225,000 | | | | 228,375 |
| Overseas Shipholding Group, Inc., 8.25%, 03/15/2013 | | | | 750,000 | | | | 805,312 |
| Peabody Energy Corp.: | | | | | | | | | | |
| 5.875%, 04/15/2016 | | | | 500,000 | | | | 486,250 |
| 6.875%, 03/15/2013 | | | | 440,000 | | | | 456,500 |
| Plains Exploration & Production Co., 8.75%, 07/01/2012 | | | | 1,300,000 | | | | 1,394,250 |
| Targa Resources, Inc., 8.50%, 11/01/2013 144A | | | | 250,000 | | | | 255,000 |
| Williams Cos.: | | | | | | | | | | |
| 7.50%, 01/15/2031 | | | | | | 775,000 | | | | 809,875 |
| 8.125%, 03/15/2012 | | | | 1,125,000 | | | | 1,220,625 |
| |
|
| | | | | | | | | | | 11,837,662 |
| |
|
| FINANCIALS 2.0% | | | | | | | | | | |
| Consumer Finance 0.9% | | | | | | | | |
| General Motors Acceptance Corp.: | | | | | | | | |
| 5.625%, 05/15/2009 | | | | 1,525,000 | | | | 1,443,089 |
| 6.125%, 09/15/2006 | | | | 675,000 | | | | 673,165 |
| FRN, 4.51%, 01/16/2007 | | | | 700,000 | | | | 690,499 |
See Notes to Financial Statements
14
SCHEDULE OF INVESTMENTS continued
October 31, 2005 (unaudited)
| | | | | Principal | | | | |
| | | | | Amount | | | | Value |
|
| |
| CORPORATE BONDS continued | | | | | | | | |
| FINANCIALS continued | | | | | | | | |
| Consumer Finance continued | | | | | | | | |
| Northern Telecom Capital Corp., 7.875%, 06/15/2026 | | $ | | 700,000 | | $ | | 689,500 |
| |
|
| | | | | | | | | 3,496,253 |
| |
|
| Diversified Financial Services 0.4% | | | | | | | | |
| Borden US Finance Corp., 9.00%, 07/15/2014 144A | | | | 250,000 | | | | 247,188 |
| Qwest Capital Funding, Inc., 7.00%, 08/03/2009 | | | | 1,450,000 | | | | 1,428,250 |
| |
|
| | | | | | | | | 1,675,438 |
| |
|
| Insurance 0.3% | | | | | | | | |
| Crum & Forster Holdings Corp., 10.375%, 06/15/2013 | | | | 1,300,000 | | | | 1,397,500 |
| |
|
| Real Estate 0.4% | | | | | | | | |
| Crescent Real Estate Equities Co., REIT, 9.25%, 04/15/2009 | | | | 750,000 | | | | 795,000 |
| Omega Healthcare Investors, Inc., REIT, 7.00%, 04/01/2014 | | | | 725,000 | | | | 732,250 |
| |
|
| | | | | | | | | 1,527,250 |
| |
|
| HEALTH CARE 1.3% | | | | | | | | |
| Health Care Equipment & Supplies 0.3% | | | | | | | | |
| Universal Hospital Services, Inc., 10.125%, 11/01/2011 | | | | 1,050,000 | | | | 1,057,875 |
| |
|
| Health Care Providers & Services 1.0% | | | | | | | | |
| HCA, Inc., 6.375%, 01/15/2015 | | | | 850,000 | | | | 838,306 |
| IASIS Healthcare Corp., 8.75%, 06/15/2014 | | | | 1,090,000 | | | | 1,122,700 |
| Select Medical Corp., 7.625%, 02/01/2015 | | | | 950,000 | | | | 885,875 |
| Tenet Healthcare Corp., 9.875%, 07/01/2014 | | | | 1,215,000 | | | | 1,181,587 |
| |
|
| | | | | | | | | 4,028,468 |
| |
|
| INDUSTRIALS 2.6% | | | | | | | | |
| Aerospace & Defense 0.5% | | | | | | | | |
| Aviall, Inc., 7.625%, 07/01/2011 | | | | 1,500,000 | | | | 1,530,000 |
| Moog, Inc., 6.25%, 01/15/2015 | | | | 540,000 | | | | 540,000 |
| |
|
| | | | | | | | | 2,070,000 |
| |
|
| Commercial Services & Supplies 0.5% | | | | | | | | |
| Allied Waste Industries, Inc., 6.375%, 04/15/2011 | | | | 125,000 | | | | 121,250 |
| Allied Waste North America, Inc., 5.75%, 02/15/2011 | | | | 780,000 | | | | 731,250 |
| American Color Graphics, Inc., 10.00%, 06/15/2010 | | | | 850,000 | | | | 567,375 |
| TriMas Corp., 9.875%, 06/15/2012 | | | | 850,000 | | | | 692,750 |
| |
|
| | | | | | | | | 2,112,625 |
| |
|
| Machinery 1.1% | | | | | | | | |
| Case New Holland, Inc., 9.25%, 08/01/2011 | | | | 1,675,000 | | | | 1,771,313 |
| Douglas Dynamics, LLC, 7.75%, 01/15/2012 144A | | | | 325,000 | | | | 315,250 |
| Dresser Rand Group, Inc., 7.375%, 11/01/2014 144A | | | | 692,000 | | | | 712,760 |
| Terex Corp., 7.375%, 01/15/2014 | | | | 1,440,000 | | | | 1,440,000 |
| |
|
| | | | | | | | | 4,239,323 |
| |
|
See Notes to Financial Statements
15
SCHEDULE OF INVESTMENTS continued
October 31, 2005 (unaudited)
| | | Principal | | | | |
| | | Amount | | | | Value |
|
| |
| CORPORATE BONDS continued | | | | | | |
| INDUSTRIALS continued | | | | | | |
| Trading Companies & Distributors 0.5% | | | | | | |
| United Rentals, Inc., 7.75%, 11/15/2013 | | $1,875,000 | | $ | | 1,790,625 |
| |
|
| INFORMATION TECHNOLOGY 0.5% | | | | | | |
| IT Services 0.5% | | | | | | |
| Stratus Technologies, Inc., 10.375%, 12/01/2008 | | 675,000 | | | | 685,125 |
| SunGard Data Systems, Inc.: | | | | | | |
| 9.125%, 08/15/2013 144A | | 1,000,000 | | | | 1,020,000 |
| 10.25%, 08/15/2015 144A | | 400,000 | | | | 398,500 |
| |
|
| | | | | | | 2,103,625 |
| |
|
| MATERIALS 4.9% | | | | | | |
| Chemicals 1.5% | | | | | | |
| Ethyl Corp., 8.875%, 05/01/2010 | | 250,000 | | | | 260,000 |
| Huntsman Advanced Materials, LLC, 11.00%, 07/15/2010 | | 750,000 | | | | 836,250 |
| Huntsman International, LLC, 11.50%, 07/15/2012 | | 924,000 | | | | 1,049,895 |
| Lyondell Chemical Co.: | | | | | | |
| 9.50%, 12/15/2008 | | 1,750,000 | | | | 1,841,875 |
| 10.50%, 06/01/2013 | | 800,000 | | | | 911,000 |
| PQ Corp., 7.50%, 02/15/2013 144A | | 885,000 | | | | 818,625 |
| |
|
| | | | | | | 5,717,645 |
| |
|
| Containers & Packaging 0.6% | | | | | | |
| Graham Packaging Co., 9.875%, 10/15/2014 | | 675,000 | | | | 634,500 |
| Graphic Packaging International, Inc., 8.50%, 08/15/2011 | | 475,000 | | | | 460,750 |
| Owens-Brockway Glass Containers, Inc., 8.25%, 05/15/2013 | | 1,335,000 | | | | 1,368,375 |
| |
|
| | | | | | | 2,463,625 |
| |
|
| Metals & Mining 2.0% | | | | | | |
| Alaska Steel Corp., 7.75%, 06/15/2012 | | 1,600,000 | | | | 1,448,000 |
| Foundation Pennsylvania Coal Co., 7.25%, 08/01/2014 | | 1,100,000 | | | | 1,130,250 |
| Freeport-McMoRan Copper & Gold, Inc.: | | | | | | |
| 6.875%, 02/01/2014 | | 1,325,000 | | | | 1,311,750 |
| 10.125%, 02/01/2010 | | 1,680,000 | | | | 1,856,400 |
| Oregon Steel Mills, Inc., 10.00%, 07/15/2009 | | 1,300,000 | | | | 1,400,750 |
| United States Steel Corp., 10.75%, 08/01/2008 | | 750,000 | | | | 836,250 |
| |
|
| | | | | | | 7,983,400 |
| |
|
| Paper & Forest Products 0.8% | | | | | | |
| Boise Cascade, LLC: | | | | | | |
| 6.47%, 10/15/2012 | | 425,000 | | | | 412,250 |
| 7.125%, 10/15/2014 | | 400,000 | | | | 358,000 |
| Bowater, Inc., 6.50%, 06/15/2013 | | 850,000 | | | | 752,250 |
| Georgia Pacific Corp., 8.125%, 05/15/2011 | | 1,600,000 | | | | 1,744,000 |
| |
|
| | | | | | | 3,266,500 |
| |
|
See Notes to Financial Statements
16
SCHEDULE OF INVESTMENTS continued
October 31, 2005 (unaudited)
| | | Principal | | | | |
| | | Amount | | | | Value |
|
| |
| CORPORATE BONDS continued | | | | | | |
| TELECOMMUNICATION SERVICES 2.3% | | | | | | |
| Diversified Telecommunication Services 0.8% | | | | | | |
| Citizens Communications Co., 6.25%, 01/15/2013 | | $1,550,000 | | $ | | 1,476,375 |
| Level 3 Communications Corp., 6.375%, 10/15/2015 144A | | 800,000 | | | | 794,000 |
| Qwest Communications International, Inc., 7.875%, 09/01/2011 | | 1,000,000 | | | | 1,052,500 |
| |
|
| | | | | | | 3,322,875 |
| |
|
| Wireless Telecommunication Services 1.5% | | | | | | |
| Alamosa Holdings, Inc., 8.50%, 01/31/2012 | | 425,000 | | | | 443,063 |
| Centennial Communications Corp., 8.125%, 02/01/2014 | | 650,000 | | | | 676,000 |
| Dobson Communications Corp., 8.875%, 10/01/2013 | | 725,000 | | | | 712,312 |
| Horizon PCS, Inc., 11.375%, 07/15/2012 | | 550,000 | | | | 621,500 |
| Rural Cellular Corp.: | | | | | | |
| 8.25%, 03/15/2012 | | 450,000 | | | | 470,250 |
| 9.75%, 01/15/2010 | | 1,450,000 | | | | 1,450,000 |
| Sprint Nextel Corp., Inc., Ser. D, 7.375%, 08/01/2015 | | 480,000 | | | | 508,474 |
| UbiquiTel, Inc., 9.875%, 03/01/2011 | | 400,000 | | | | 439,000 |
| US Unwired, Inc., Ser. B, 10.00%, 06/15/2012 | | 400,000 | | | | 457,000 |
| |
|
| | | | | | | 5,777,599 |
| |
|
| UTILITIES 2.4% | | | | | | |
| Electric Utilities 0.8% | | | | | | |
| Edison Mission Energy, 10.00%, 08/15/2008 | | 675,000 | | | | 744,187 |
| Reliant Energy, Inc.: | | | | | | |
| 6.75%, 12/15/2014 | | 975,000 | | | | 911,625 |
| 9.25%, 07/15/2010 | | 1,300,000 | | | | 1,371,500 |
| |
|
| | | | | | | 3,027,312 |
| |
|
| Gas Utilities 0.3% | | | | | | |
| SEMCO Energy, Inc., 7.75%, 05/15/2013 | | 1,350,000 | | | | 1,398,580 |
| |
|
| Independent Power Producers & Energy Traders 1.3% | | | | | | |
| AES Corp., 7.75%, 03/01/2014 | | 1,350,000 | | | | 1,407,375 |
| Dynegy, Inc., 10.125%, 07/15/2013 144A | | 1,100,000 | | | | 1,215,500 |
| NRG Energy, Inc., 8.00%, 12/15/2013 | | 937,000 | | | | 1,026,015 |
| Texas Genco, Inc., 6.875%, 12/15/2014 144A | | 1,575,000 | | | | 1,693,125 |
| |
|
| | | | | | | 5,342,015 |
| |
|
| Total Corporate Bonds (cost $120,344,655) | | | | | | 119,658,031 |
| |
|
| FOREIGN BONDS - CORPORATE (PRINCIPAL AMOUNT DENOMINATED IN | | | | |
| CURRENCY INDICATED) 18.2% | | | | | | |
| CONSUMER DISCRETIONARY 0.7% | | | | | | |
| Automobiles 0.3% | | | | | | |
| Renault SA, 6.125%, 06/26/2009 EUR | | 720,000 | | | | 948,079 |
| |
|
| Hotels, Restaurants & Leisure 0.2% | | | | | | |
| Sodexho Alliance SA, 5.875%, 03/25/2009 EUR | | 720,000 | | | | 933,581 |
| |
|
See Notes to Financial Statements
17
SCHEDULE OF INVESTMENTS continued
October 31, 2005 (unaudited)
| | | Principal | | | | |
| | | Amount | | | | Value |
|
| |
| FOREIGN BONDS - CORPORATE (PRINCIPAL AMOUNT DENOMINATED IN | | | | | | |
| CURRENCY INDICATED) continued | | | | | | |
| CONSUMER DISCRETIONARY continued | | | | | | |
| Specialty Retail 0.2% | | | | | | |
| LVMH Moet Hennessy-Louis Vuitton SA, 6.125%, 06/25/2008 EUR | | 650,000 | | $ | | 839,699 |
| |
|
| CONSUMER STAPLES 1.0% | | | | | | |
| Food & Staples Retailing 0.2% | | | | | | |
| Tesco plc, 4.75%, 04/13/2010 EUR | | 750,000 | | | | 957,107 |
| |
|
| Food Products 0.4% | | | | | | |
| Cadbury Schweppes plc, MTN, 4.875%, 12/20/2010 GBP | | 800,000 | | | | 1,402,203 |
| |
|
| Tobacco 0.4% | | | | | | |
| British American Tobacco plc, 4.875%, 02/25/2009 EUR | | 1,220,000 | | | | 1,531,814 |
| |
|
| ENERGY 0.3% | | | | | | |
| Oil, Gas & Consumable Fuels 0.3% | | | | | | |
| Transco plc, 7.00%, 12/15/2008 AUD | | 1,500,000 | | | | 1,150,880 |
| |
|
| FINANCIALS 15.7% | | | | | | |
| Capital Markets 1.1% | | | | | | |
| Deutsche Bank AG, FRN, 2.86%, 08/09/2007 CAD | | 1,900,000 | | | | 1,609,109 |
| Goldman Sachs Group, Inc., MTN, 5.25%, 12/15/2015 GBP | | 1,000,000 | | | | 1,780,524 |
| Morgan Stanley, Sr. Disc. Note, Step Bond, 5.33%, 11/14/2013 GBP † | | 460,000 | | | | 830,189 |
| |
|
| | | | | | | 4,219,822 |
| |
|
| Commercial Banks 7.8% | | | | | | |
| Australia & New Zealand Banking Group, Ltd.: | | | | | | |
| 4.875%, 12/22/2008 GBP | | 450,000 | | | | 800,002 |
| 6.00%, 03/01/2010 AUD | | 2,500,000 | | | | 1,868,628 |
| Banco Santander Central Hispano SA, 4.00%, 09/10/2010 EUR | | 3,700,000 | | | | 4,613,735 |
| Bank Nederlandse Gemeenten NV, 3.25%, 10/29/2009 EUR | | 1,000,000 | | | | 1,212,255 |
| BOS International Australia, Ltd., 3.50%, 01/22/2007 CAD | | 1,890,000 | | | | 1,594,880 |
| BSCH Issuances, Ltd., 5.125%, 07/06/2009 EUR | | 1,350,000 | | | | 1,729,427 |
| DnB NOR ASA, MTN, 3.07%, 12/08/2008 CAD | | 1,000,000 | | | | 847,916 |
| Eurofima: | | | | | | |
| 5.50%, 09/15/2009 AUD | | 55,000 | | | | 40,733 |
| MTN, 6.50%, 08/22/2011 AUD | | 1,500,000 | | | | 1,161,231 |
| European Investment Bank: | | | | | | |
| 4.00%, 04/15/2009 SEK | | 5,000,000 | | | | 654,146 |
| 4.25%, 12/07/2010 GBP | | 590,000 | | | | 1,029,794 |
| MTN: | | | | | | |
| 5.75%, 09/15/2009 AUD | | 100,000 | | | | 74,973 |
| 6.50%, 09/10/2014 NZD | | 4,992,000 | | | | 3,459,473 |
| 8.00%, 10/21/2013 ZAR | | 15,000,000 | | | | 2,260,629 |
| Kreditanstalt Fuer Wiederaufbau, MTN, 4.75%, 12/07/2010 GBP | | 1,152,000 | | | | 2,055,138 |
| Landwirtschaftliche Rentenbank, 6.00%, 09/15/2009 AUD | | 1,550,000 | | | | 1,167,405 |
See Notes to Financial Statements
18
SCHEDULE OF INVESTMENTS continued
October 31, 2005 (unaudited)
| | | Principal | | | | |
| | | Amount | | | | Value |
|
| |
| FOREIGN BONDS - CORPORATE (PRINCIPAL AMOUNT DENOMINATED IN | | | | | | |
| CURRENCY INDICATED) continued | | | | | | |
| FINANCIALS continued | | | | | | |
| Commercial Banks continued | | | | | | |
| Nationwide Building Society: | | | | | | |
| FRN, 2.25%, 11/01/2008 EUR | | 975,000 | | $ | | 1,169,502 |
| MTN, FRN, 3.04%, 11/18/2009 CAD | | 1,400,000 | | | | 1,189,156 |
| Rabobank Australia, Ltd., MTN, 6.25%, 11/22/2011 NZD | | 1,400,000 | | | | 956,736 |
| Rabobank Nederland, FRN, 3.02%, 06/18/2007 CAD | | 1,500,000 | | | | 1,270,095 |
| Royal Bank of Canada, FRN, 4.74%, 04/08/2010 GBP | | 1,036,000 | | | | 1,833,368 |
| |
|
| | | | | | | 30,989,222 |
| |
|
| Consumer Finance 1.9% | | | | | | |
| Deutsche Bahn Finance BV, 4.875%, 07/06/2009 EUR | | 750,000 | | | | 956,927 |
| General Electric Capital Corp.: | | | | | | |
| 6.50%, 09/28/2015 NZD | | 2,930,000 | | | | 2,000,775 |
| FRN, 2.20%, 03/31/2008 EUR | | 500,000 | | | | 599,325 |
| MTN, 5.25%, 12/10/2013 GBP | | 570,000 | | | | 1,030,930 |
| HSBC Finance Corp., 5.125%, 06/24/2009 EUR | | 1,000,000 | | | | 1,282,793 |
| Toyota Credit Canada, 4.75%, 12/30/2008 CAD | | 2,150,000 | | | | 1,860,694 |
| |
|
| | | | | | | 7,731,444 |
| |
|
| Diversified Financial Services 1.5% | | | | | | |
| British American Tobacco International Finance plc, MTN, | | | | | | |
| 5.75%, 12/09/2013 GBP | | 1,000,000 | | | | 1,809,819 |
| Cedulas TDA, 3.25%, 06/19/2010 EUR | | 2,600,000 | | | | 3,144,968 |
| Network Rail Finance plc, FRN, 2.13%, 02/27/2007 EUR | | 800,000 | | | | 959,495 |
| |
|
| | | | | | | 5,914,282 |
| |
|
| Insurance 0.2% | | | | | | |
| AIG SunAmerica, Inc., MTN, 3.50%, 03/11/2009 EUR | | 500,000 | | | | 607,416 |
| |
|
| Thrifts & Mortgage Finance 3.2% | | | | | | |
| Canada Housing Trust No. 1, 3.70%, 09/15/2008 CAD | | 4,550,000 | | | | 3,842,261 |
| Totalkredit, FRN, 2.51%, 01/01/2015 DKK | | 55,577,582 | | | | 8,993,497 |
| |
|
| | | | | | | 12,835,758 |
| |
|
| TELECOMMUNICATION SERVICES 0.3% | | | | | | |
| Diversified Telecommunication Services 0.3% | | | | | | |
| Telecom Italia SpA, 5.00%, 02/09/2009 EUR | | 1,000,000 | | | | 1,268,471 |
| |
|
| UTILITIES 0.2% | | | | | | |
| Electric Utilities 0.2% | | | | | | |
| International Endesa BV, 4.375%, 06/18/2009 EUR | | 700,000 | | | | 877,274 |
| |
|
| Total Foreign Bonds - Corporate (Principal Amount Denominated in | | | | | | |
| Currency Indicated) (cost $72,898,278) | | | | | | 72,207,052 |
| |
|
See Notes to Financial Statements
19
SCHEDULE OF INVESTMENTS continued
October 31, 2005 (unaudited)
| | | Principal | | | | |
| | | Amount | | | | Value |
|
| |
| FOREIGN BONDS - GOVERNMENT (PRINCIPAL AMOUNT DENOMINATED | | | | | | |
| IN CURRENCY INDICATED) 12.6% | | | | | | |
| Australia: | | | | | | |
| 7.50%, 09/15/2009 AUD | | 1,328,000 | | $ | | 1,064,452 |
| FRN, 5.39%, 08/20/2015 AUD | | 4,980,000 | | | | 5,634,501 |
| France, 1.63%, 07/25/2015 EUR | | 1,000,000 | | | | 1,239,108 |
| Hungary, 6.25%, 06/12/2007 HUF | | 766,000,000 | | | | 3,648,061 |
| IBRD, MTN, 12.50%, 05/14/2012 ZAR | | 950,000 | | | | 168,531 |
| Jamaica, 11.00%, 07/27/2012 EUR | | 180,000 | | | | 252,510 |
| Mexico: | | | | | | |
| 8.00%, 12/24/2008 MXN | | 13,500,000 | | | | 1,236,151 |
| 8.00%, 12/19/2013 MXN | | 7,950,000 | | | | 699,716 |
| 9.00%, 12/20/2012 MXN | | 5,500,000 | | | | 512,850 |
| 10.50%, 07/14/2011 MXN | | 12,500,000 | | | | 1,293,613 |
| Norway, 6.00%, 05/16/2011 NOK | | 34,798,000 | | | | 5,980,279 |
| Ontario Province, 6.50%, 12/01/2005 CAD | | 66,000 | | | | 56,021 |
| Poland, 8.50%, 05/12/2006 PLN | | 11,750,000 | | | | 3,623,829 |
| South Africa: | | | | | | |
| 5.25%, 05/16/2013 EUR | | 385,000 | | | | 500,614 |
| 7.00%, 04/10/2008 EUR | | 750,000 | | | | 980,166 |
| 13.00%, 08/31/2010 ZAR | | 7,000,000 | | | | 1,253,604 |
| Spain, 4.00%, 01/31/2010 EUR | | 3,440,000 | | | | 4,301,831 |
| Sweden: | | | | | | |
| 3.82%, 12/01/2015 SEK | | 36,255,000 | | | | 5,936,431 |
| 5.25%, 03/15/2011 SEK | | 36,500,000 | | | | 5,108,714 |
| Turkey, 5.50%, 09/21/2009 EUR | | 405,000 | | | | 508,613 |
| United Kingdom: | | | | | | |
| 5.00%, 03/07/2012 GBP | | 1,250,000 | | | | 2,294,267 |
| 6.39%, 08/23/2011 GBP | | 500,000 | | | | 2,365,041 |
| FRN, 5.34%, 08/16/2013 GBP | | 300,000 | | | | 1,205,489 |
| |
|
| Total Foreign Bonds - Government (Principal Amount Denominated in | | | | | | |
| Currency Indicated) (cost $51,088,086) | | | | | | 49,864,392 |
| |
|
| U.S. TREASURY OBLIGATIONS 4.6% | | | | | | |
| U.S. Treasury Bonds, 5.375%, 02/15/2031 ## | | $ 8,050,000 | | | | 8,782,051 |
| U.S. Treasury Notes, 4.00%, 02/15/2015 ## | | 9,885,000 | | | | 9,455,240 |
| |
|
| Total U.S. Treasury Obligations (cost $18,679,085) | | | | | | 18,237,291 |
| |
|
| WHOLE LOAN MORTGAGE-BACKED COLLATERALIZED MORTGAGE | | | | | | |
| OBLIGATIONS 2.8% | | | | | | |
| FIXED-RATE 0.7% | | | | | | |
| Credit Suisse First Boston, Ser. 2002-26, Class 4A1, 7.00%, 10/25/2017 | | 594,786 | | | | 599,561 |
| Structured Asset Securities Corp., Ser. 2004-20, Class 5A-1, 6.25%, 11/25/2034 | | 2,218,062 | | | | 2,243,709 |
| |
|
| | | | | | | 2,843,270 |
| |
|
| FLOATING-RATE 2.1% | | | | | | |
| Countrywide Home Loans: | | | | | | |
| Ser. 2004-HYB8, Class 1-M1, 5.23%, 01/20/2035 | | 5,325,847 | | | | 5,370,784 |
| Ser. 2004-R1, Class 1-AF, 2.24%, 10/25/2034 144A | | 573,233 | | | | 574,122 |
See Notes to Financial Statements
20
SCHEDULE OF INVESTMENTS continued
October 31, 2005 (unaudited)
| | | | | Principal | | | | |
| | | | | Amount | | | | Value |
|
| WHOLE LOAN MORTGAGE-BACKED COLLATERALIZED MORTGAGE | | | | | | |
| OBLIGATIONS continued | | | | | | | | |
| FLOATING-RATE continued | | | | | | | | |
| MASTR Adjustable Rate Mtge. Trust, Ser. 2005-1, Class 7A3, 4.98%, 02/25/2035 | | $1,426,493 | | $ | | 1,410,075 |
| William Street Funding Corp., Ser. 2004-3, Class A, 4.28%, 09/23/2009 144A | | 750,000 | | | | 750,817 |
| |
|
| | | | | | | | | 8,105,798 |
| |
|
| Total Whole Loan Mortgage-Backed Collateralized Mortgage Obligations | | | | | | |
| (cost $11,121,220) | | | | | | | | 10,949,068 |
| |
|
| WHOLE LOAN MORTGAGE-BACKED PASS THROUGH SECURITIES 0.5% | | | | | | |
| FLOATING-RATE 0.5% | | | | | | | | |
| Bear Stearns Adjustable Rate Mtge. Trust, Ser. 2004-10, Class 12A3, 4.63%, | | | | | | |
| 01/25/2035 | | | | 781,018 | | | | 771,379 |
| Structured Asset Securities Corp., Ser. 2005-RM1, Class A, IO, 5.00%, 03/25/2045 | | | | | | |
| 144A | | | | 4,825,476 | | | | 1,132,479 |
| |
|
| Total Whole Loan Mortgage-Backed Pass Through Securities | | | | | | |
(cost $1,924,456) | | | | | | | | 1,903,858 |
| |
|
| WHOLE LOAN SUBORDINATE COLLATERALIZED MORTGAGE | | | | | | |
| OBLIGATIONS 0.6% | | | | | | | | |
| FIXED-RATE 0.4% | | | | | | | | |
| MASTR Resecuritization Trust: | | | | | | | | |
| Ser. 2004-3, 5.00%, 03/25/2034 | | 717,806 | | | | 682,364 |
| Ser. 2005-2, 4.75%, 03/28/2034 | | 828,629 | | | | 788,493 |
| |
|
| | | | | | | | | 1,470,857 |
| |
|
| FLOATING-RATE 0.2% | | | | | | | | |
| Harborview Mtge. Loan Trust, Ser. 2005-8, Class 2B3, 5.37%, 02/19/2035 (h) | | 1,003,740 | | | | 1,009,385 |
| |
|
| Total Whole Loan Subordinate Collateralized Mortgage Obligations | | | | | | |
| (cost $2,532,563) | | | | | | | | 2,480,242 |
| |
|
| YANKEE OBLIGATIONS - CORPORATE 5.2% | | | | | | |
| CONSUMER DISCRETIONARY 0.6% | | | | | | |
| Hotels, Restaurants & Leisure 0.2% | | | | | | |
| Intrawest Corp., 7.50%, 10/15/2013 | | 825,000 | | | | 843,562 |
| |
|
| Media 0.4% | | | | | | | | |
| IMAX Corp., 9.625%, 12/01/2010 | | | | 1,300,000 | | | | 1,397,500 |
| |
|
| CONSUMER STAPLES 0.5% | | | | | | | | |
| Food & Staples Retailing 0.5% | | | | | | |
| The Jean Coutu Group (PJC), Inc., 8.50%, 08/01/2014 | | 2,000,000 | | | | 1,865,000 |
| |
|
| ENERGY 0.4% | | | | | | | | |
| Energy Equipment & Services 0.4% | | | | | | |
| Petroleum Geo-Services ASA, 10.00%, 11/05/2010 | | 1,425,000 | | | | 1,581,750 |
| |
|
| FINANCIALS 0.5% | | | | | | | | |
| Consumer Finance 0.1% | | | | | | | | |
| Calpine Canada Energy Finance, 8.50%, 05/01/2008 | | 525,000 | | | | 286,125 |
| |
|
See Notes to Financial Statements
21
SCHEDULE OF INVESTMENTS continued
October 31, 2005 (unaudited)
| | | | | | | Principal | | | | |
| | | | | | | Amount | | | | Value |
|
| |
| YANKEE OBLIGATIONS - CORPORATE continued | | | | | | | | |
| FINANCIALS continued | | | | | | | | | | |
| Diversified Financial Services 0.4% | | | | | | | | | | |
| Preferred Term Securities, Ltd., FRN: | | | | | | | | | | |
| 5.46%, 06/24/2034 144A | | | | $ | | 220,000 | | $ | | 224,862 |
| 5.51%, 12/24/2033 144A | | | | | | 500,000 | | | | 511,055 |
| Ship Finance International, Ltd., 8.50%, 12/15/2013 | | | | 865,000 | | | | 829,319 |
| |
|
| | | | | | | | | | | 1,565,236 |
| |
|
| INDUSTRIALS 0.5% | | | | | | | | | | |
| Marine 0.3% | | | | | | | | | | |
| CP Ships, Ltd., 10.375%, 07/15/2012 | | | | | | 1,090,000 | | | | 1,237,150 |
| |
|
| Transportation Infrastructure 0.2% | | | | | | | | | | |
| Sea Containers, Ltd., 10.50%, 05/15/2012 | | | | | | 960,000 | | | | 952,800 |
| |
|
| INFORMATION TECHNOLOGY 0.5% | | | | | | | | | | |
| Electronic Equipment & Instruments 0.5% | | | | | | | | |
| Celestica, Inc.: | | | | | | | | | | |
| 7.625%, 07/01/2013 | | | | | | 1,050,000 | | | | 1,026,375 |
| 7.875%, 07/01/2011 | | | | | | 900,000 | | | | 895,500 |
| |
|
| | | | | | | | | | | 1,921,875 |
| |
|
| MATERIALS 1.0% | | | | | | | | | | |
| Chemicals 0.2% | | | | | | | | | | |
| Nova Chemicals Corp., 6.50%, 01/15/2012 | | | | | | 750,000 | | | | 720,000 |
| |
|
| Containers & Packaging 0.4% | | | | | | | | | | |
| Crown European Holdings SA: | | | | | | | | | | |
| 9.50%, 03/01/2011 | | | | | | 500,000 | | | | 550,000 |
| 10.875%, 03/01/2013 | | | | | | 1,000,000 | | | | 1,177,500 |
| |
|
| | | | | | | | | | | 1,727,500 |
| |
|
| Metals & Mining 0.4% | | | | | | | | | | |
| Novelis, Inc., 7.25%, 02/15/2015 144A | | | | | | 1,740,000 | | | | 1,596,450 |
| |
|
| TELECOMMUNICATION SERVICES 0.4% | | | | | | | | |
| Wireless Telecommunication Services 0.4% | | | | | | | | | | |
| Rogers Wireless, Inc.: | | | | | | | | | | |
| 6.375%, 03/01/2014 | | | | | | 465,000 | | | | 466,163 |
| 7.50%, 03/15/2015 | | | | | | 450,000 | | | | 484,875 |
| 9.625%, 05/01/2011 | | | | | | 745,000 | | | | 858,612 |
| |
|
| | | | | | | | | | | 1,809,650 |
| |
|
| UTILITIES 0.8% | | | | | | | | | | |
| Electric Utilities 0.4% | | | | | | | | | | |
| Enersis SA, 7.375%, 01/15/2014 | | | | | | 1,260,000 | | | | 1,329,953 |
| |
|
| Gas Utilities 0.3% | | | | | | | | | | |
| Gazprom, 9.625%, 03/01/2013 144A | | | | | | 1,000,000 | | | | 1,203,750 |
| |
|
See Notes to Financial Statements
22
SCHEDULE OF INVESTMENTS continued
October 31, 2005 (unaudited)
| | | | | | | | | Principal | | | | |
| | | | | | | | | Amount | | | | Value |
|
| |
| YANKEE OBLIGATIONS - CORPORATE continued | | | | | | | | | | |
| UTILITIES continued | | | | | | | | | | | | |
| Multi-Utilities 0.1% | | | | | | | | | | | | |
| National Power Corp., FRN, 8.07%, 08/23/2011 | | | | $ | | 500,000 | | $ | | 511,040 |
| |
|
| Total Yankee Obligations - Corporate (cost $20,315,365) | | | | | | | | 20,549,341 |
| |
|
| YANKEE OBLIGATIONS - GOVERNMENT 4.9% | | | | | | | | | | |
| Brazil: | | | | | | | | | | | | |
| 9.25%, 10/22/2010 | | | | | | | | 1,000,000 | | | | 1,100,500 |
| 10.50%, 07/14/2014 | | | | | | | | 1,250,000 | | | | 1,468,125 |
| Colombia: | | | | | | | | | | | | |
| 9.75%, 04/09/2011 | | | | | | | | 995,749 | | | | 1,140,133 |
| 10.00%, 01/23/2012 | | | | | | | | 1,000,000 | | | | 1,182,500 |
| 10.50%, 07/09/2010 | | | | | | | | 1,000,000 | | | | 1,181,000 |
| Egypt, 8.75%, 07/11/2011 | | | | | | | | 750,000 | | | | 885,187 |
| Jamaica, 11.75%, 05/15/2011 | | | | | | | | 395,000 | | | | 496,843 |
| Korea, 4.25%, 06/01/2013 | | | | | | | | 750,000 | | | | 707,657 |
| Mexico, 8.375%, 01/14/2011 | | | | | | | | 1,130,000 | | | | 1,288,200 |
| Mexico, MTN, 6.375%, 01/16/2013 | | | | | | | | 1,200,000 | | | | 1,260,000 |
| Panama, 9.625%, 02/08/2011 | | | | | | | | 700,000 | | | | 808,500 |
| Peru: | | | | | | | | | | | | |
| 9.125%, 01/15/2008 | | | | | | | | 1,265,000 | | | | 1,372,525 |
| 9.125%, 02/21/2012 | | | | | | | | 1,000,000 | | | | 1,161,000 |
| Russia: | | | | | | | | | | | | |
| 11.00%, 07/24/2018 | | | | | | | | 800,000 | | | | 1,171,734 |
| Sr. Disc. Note, Step Bond, 5.00%, 03/31/2030 † | | | | | | 1,000,000 | | | | 1,111,200 |
| Turkey, 9.00%, 06/30/2011 | | | | | | | | 1,000,000 | | | | 1,135,000 |
| Ukraine, 7.65%, 06/11/2013 | | | | | | | | 700,000 | | | | 754,250 |
| Venezuela, 10.75%, 09/19/2013 | | | | | | | | 1,000,000 | | | | 1,222,500 |
| |
|
| Total Yankee Obligations - Government (cost $18,720,050) | | | | | | | | 19,446,854 |
| |
|
| CONVERTIBLE DEBENTURES 0.2% | | | | | | | | | | | | |
| UTILITIES 0.2% | | | | | | | | | | | | |
| Independent Power Producers & Energy Traders 0.2% | | | | | | | | |
| Calpine Corp., 7.75%, 06/01/2015 (cost $900,000) | | | | | | 900,000 | | | | 702,000 |
| | |
|
|
| | | | | | | | | Shares | | | | Value |
|
| |
| COMMON STOCKS 0.2% | | | | | | | | | | | | |
| CONSUMER DISCRETIONARY 0.1% | | | | | | | | | | | | |
| Media 0.1% | | | | | | | | | | | | |
| IMAX Corp. * | | | | | | | | 27,389 | | | | 248,418 |
| |
|
| MATERIALS 0.1% | | | | | | | | | | | | |
| Chemicals 0.1% | | | | | | | | | | | | |
| Huntsman Corp. * | | | | | | | | 19,570 | | | | 389,052 |
| |
|
| Total Common Stocks (cost $312,154) | | | | | | | | | | 637,470 |
| |
|
See Notes to Financial Statements
23
SCHEDULE OF INVESTMENTS continued
October 31, 2005 (unaudited)
| | | Shares | | | | Value |
|
| WARRANTS 0.0% | | | | | | |
| FINANCIALS 0.0% | | | | | | |
| Diversified Financial Services 0.0% | | | | | | |
| Ono Finance plc: | | | | | | |
| Expiring 03/16/2011 144A * + | | 2,000 | | $ | | 20 |
| Expiring 05/31/2009 * (h) + | | 2,000 | | | | 0 |
| |
|
Total Warrants (cost $244,882) | | | | | | 20 |
| | |
|
| |
| | | Principal | | | | |
| | | Amount | | | | Value |
|
| |
| SHORT-TERM INVESTMENTS 9.6% | | | | | | |
| COMMERCIAL PAPER 5.9% | | | | | | |
| Check Point Charlie, Inc., 3.43%, 11/14/2005 | | $ 4,960,000 | | | | 4,953,050 |
| Lockhart Funding, LLC, 3.92%, 11/14/2005 | | 1,810,000 | | | | 1,807,484 |
| Neptune Funding Corp., 3.79%, 11/14/2005 | | 4,960,000 | | | | 4,953,033 |
| Ranger Funding Co., LLC, 3.90%, 11/14/2005 | | 1,815,000 | | | | 1,812,490 |
| Thornburg Mortgage Capital Resources, LLC, 3.98%, 11/14/2005 | | 4,960,000 | | | | 4,952,997 |
| Three Crowns Funding Corp., 3.84%, 11/14/2005 | | 4,960,000 | | | | 4,953,050 |
| |
|
| | | | | | | 23,432,104 |
| | |
|
|
| | | Shares | | | | Value |
|
| |
| MUTUAL FUND SHARES 3.7% | | | | | | |
| Evergreen Institutional Money Market Fund ø ## | | 14,705,677 | | | | 14,705,677 |
| |
|
| Total Short-Term Investments (cost $38,137,781) | | | | | | 38,137,781 |
| |
|
| Total Investments (cost $447,414,548) 112.0% | | | | | | 444,534,685 |
| Other Assets and Liabilities (12.0%) | | | | | | (47,538,881) |
| |
|
| Net Assets 100.0% | | | | $ | | 396,995,804 |
| |
|
| ## | | All or a portion of this security has been segregated for when-issued or delayed delivery securities. |
| # | | When-issued or delayed delivery security |
| 144A | | Security that may be sold to qualified institutional buyers under Rule 144A of the Securities Act of 1933, as amended. |
| | | This security has been determined to be liquid under guidelines established by the Board of Trustees, unless otherwise |
| | | noted. |
| † | | Security initially issued in zero coupon form which converts to coupon form at a specified rate and date. An effective |
| | | interest rate is applied to recognize interest income daily for the bond. This rate is based on total expected interest to |
| | | be earned over the life of the bond which consists of the aggregate coupon-interest payments and discount at |
| | | acquisition. The rate shown is the stated rate at the current period end. |
| (h) | | Security is valued at fair value as determined by the investment advisor in good faith, according to procedures approved |
| | | by the Board of Trustees. |
| * | | Non-income producing security |
| + | | Security is deemed illiquid and is valued using market quotations when readily available. |
| ø | | Evergreen Investment Management Company, LLC is the investment advisor to both the Fund and the money market |
| | | fund. |
See Notes to Financial Statements
24
SCHEDULE OF INVESTMENTS continued
October 31, 2005 (unaudited)
| Summary of Abbreviations |
| AUD | | Australian Dollar |
| CAD | | Canadian Dollar |
| CDO | | Collateralized Debt Obligation |
| DKK | | Danish Krone |
| EUR | | Euro |
| FHLMC | | Federal Home Loan Mortgage Corp. |
| FNMA | | Federal National Mortgage Association |
| FRN | | Floating Rate Note |
| GBP | | Great British Pound |
| GNMA | | Government National Mortgage Association |
| IBRD | | International Bank for Reconstruction & Development |
| IO | | Interest Only |
| HUF | | Hungarian Forint |
| MASTR | | Mortgage Asset Securitization Transactions, Inc. |
| MTN | | Medium Term Note |
| MXN | | Mexican Peso |
| NOK | | Norwegian Krone |
| NZD | | New Zealand Dollar |
| PLN | | Polish Zloty |
| REIT | | Real Estate Investment Trust |
| SEK | | Swedish Krona |
| TBA | | To Be Announced |
| ZAR | | South African Rand |
The following table shows the percent of total investments (excluding equity positions) by credit quality based on Moody’s and Standard & Poor’s ratings as of October 31, 2005:
| AAA | | 49.1% |
| AA | | 4.1% |
| A | | 7.0% |
| BBB | | 5.4% |
| BB | | 11.9% |
| B | | 20.4% |
| CCC | | 2.1% |
| |
|
| | | 100.0% |
| | |
|
The following table shows the percent of total investments (excluding equity positions) by maturity as of October 31, 2005:
| Less than 1 year | | 12.3% |
| 1 to 3 year(s) | | 6.9% |
| 3 to 5 years | | 20.5% |
| 5 to 10 years | | 53.1% |
| 10 to 20 years | | 5.1% |
| 20 to 30 years | | 2.1% |
| |
|
| | | 100.0% |
| | |
|
See Notes to Financial Statements
25
STATEMENT OF ASSETS AND LIABILITIES
October 31, 2005 (unaudited)
| Assets | | | | |
| Investments in securities, at value (cost $432,708,871) | | $ | | 429,829,008 |
| Investments in affiliated money market fund, at value (cost $14,705,677) | | | | 14,705,677 |
|
| Total investments | | | | 444,534,685 |
| Cash | | | | 672,168 |
| Foreign currency, at value (cost $441,478) | | | | 431,100 |
| Receivable for securities sold | | | | 610,960 |
| Principal paydown receivable | | | | 58,875 |
| Receivable for Fund shares sold | | | | 539,775 |
| Interest receivable | | | | 6,497,406 |
| Unrealized gains on forward foreign currency exchange contracts | | | | 92,117 |
| Prepaid expenses and other assets | | | | 90,200 |
|
| Total assets | | | | 453,527,286 |
|
| Liabilities | | | | |
| Dividends payable | | | | 492,833 |
| Payable for securities purchased | | | | 54,566,535 |
| Payable for Fund shares redeemed | | | | 496,268 |
| Unrealized losses on forward foreign currency exchange contracts | | | | 883,611 |
| Advisory fee payable | | | | 7,386 |
| Distribution Plan expenses payable | | | | 5,384 |
| Due to other related parties | | | | 1,087 |
| Accrued expenses and other liabilities | | | | 78,378 |
|
| Total liabilities | | | | 56,531,482 |
|
| Net assets | | $ | | 396,995,804 |
|
| Net assets represented by | | | | |
| Paid-in capital | | $ | | 444,414,414 |
| Undistributed net investment income | | | | 4,493,408 |
| Accumulated net realized losses on investments | | | | (48,181,644) |
| Net unrealized losses on investments | | | | (3,730,374) |
|
| Total net assets | | $ | | 396,995,804 |
|
| Net assets consists of | | | | |
| Class A | | $ | | 214,556,006 |
| Class B | | | | 87,671,965 |
| Class C | | | | 74,519,198 |
| Class I | | | | 20,248,635 |
|
| Total net assets | | $ | | 396,995,804 |
|
| Shares outstanding (unlimited number of shares authorized) | | | | |
| Class A | | | | 33,805,376 |
| Class B | | | | 13,772,256 |
| Class C | | | | 11,722,758 |
| Class I | | | | 3,240,964 |
|
| Net asset value per share | | | | |
| Class A | | $ | | 6.35 |
| Class A — Offering price (based on sales charge of 4.75%) | | $ | | 6.67 |
| Class B | | $ | | 6.37 |
| Class C | | $ | | 6.36 |
| Class I | | $ | | 6.25 |
|
See Notes to Financial Statements
26
STATEMENT OF OPERATIONS
Six Months Ended October 31, 2005 (unaudited)
| Investment income | | | | |
| Interest (net of foreign withholding taxes of $10,755) | | $ | | 11,080,923 |
| Income from affiliate | | | | 350,416 |
|
| Total investment income | | | | 11,431,339 |
|
| Expenses | | | | |
| Advisory fee | | | | 882,620 |
| Distribution Plan expenses | | | | |
| Class A | | | | 328,185 |
| Class B | | | | 474,124 |
| Class C | | | | 393,740 |
| Administrative services fee | | | | 204,890 |
| Transfer agent fees | | | | 448,715 |
| Trustees’ fees and expenses | | | | 5,786 |
| Printing and postage expenses | | | | 34,253 |
| Custodian and accounting fees | | | | 126,779 |
| Registration and filing fees | | | | 35,073 |
| Professional fees | | | | 17,370 |
| Other | | | | 10,321 |
|
| Total expenses | | | | 2,961,856 |
| Less: Expense reductions | | | | (5,218) |
| Expense reimbursements | | | | (824) |
|
| Net expenses | | | | 2,955,814 |
|
| Net investment income | | | | 8,475,525 |
| |
| Net realized and unrealized gains or losses on investments | | | | |
| Net realized gains or losses on: | | | | |
| Securities | | | | 4,142,661 |
| Foreign currency related transactions | | | | (1,087,611) |
|
| Net realized gains on investments | | | | 3,055,050 |
| Net change in unrealized gains or losses on investments | | | | (14,025,666) |
|
| Net realized and unrealized gains or losses on investments | | | | (10,970,616) |
|
| Net decrease in net assets resulting from operations | | $ | | (2,495,091) |
|
See Notes to Financial Statements
27
STATEMENTS OF CHANGES IN NET ASSETS
| | | Six Months Ended | | | | |
| | | October 31, 2005 | | Year Ended |
| | | (unaudited) | | April 30, 2005 |
|
| Operations | | | | | | | | |
| Net investment income | | | | $ 8,475,525 | | | | $ 19,658,650 |
| Net realized gains on investments | | | | 3,055,050 | | | | 11,013,015 |
| Net change in unrealized gains or losses | | | | | | | | |
| on investments | | | | (14,025,666) | | | | 942,567 |
|
| Net increase (decrease) in net assets | | | | | | | | |
| resulting from operations | | | | (2,495,091) | | | | 31,614,232 |
|
| Distributions to shareholders from | | | | | | | | |
| Net investment income | | | | | | | | |
| Class A | | | | (5,185,741) | | | | (11,021,445) |
| Class B | | | | (1,914,514) | | | | (4,861,302) |
| Class C | | | | (1,590,613) | | | | (3,819,193) |
| Class I | | | | (484,010) | | | | (1,350,463) |
| Net realized gains | | | | | | | | |
| Class A | | | | 0 | | | | (467,235) |
| Class B | | | | 0 | | | | (231,303) |
| Class C | | | | 0 | | | | (183,256) |
| Class I | | | | 0 | | | | (52,197) |
|
| Total distributions to shareholders | | | | (9,174,878) | | | | (21,986,394) |
|
| | | Shares | | | | Shares | | |
| Capital share transactions | | | | | | | | |
| Proceeds from shares sold | | | | | | | | |
| Class A | | 3,556,694 | | 23,138,378 | | 6,307,048 | | 41,432,078 |
| Class B | | 970,058 | | 6,329,052 | | 2,284,706 | | 15,044,683 |
| Class C | | 964,235 | | 6,279,398 | | 1,974,634 | | 13,016,637 |
| Class I | | 571,700 | | 3,604,335 | | 586,221 | | 3,820,552 |
|
| | | | | 39,351,163 | | | | 73,313,950 |
|
| Net asset value of shares issued in | | | | | | | | |
| reinvestment of distributions | | | | | | | | |
| Class A | | 576,030 | | 3,737,083 | | 1,213,973 | | 7,954,122 |
| Class B | | 166,525 | | 1,083,939 | | 441,246 | | 2,897,973 |
| Class C | | 130,345 | | 847,088 | | 331,818 | | 2,176,653 |
| Class I | | 33,938 | | 216,750 | | 98,635 | | 634,960 |
|
| | | | | 5,884,860 | | | | 13,663,708 |
|
| Automatic conversion of Class B shares | | | | | | | | |
| to Class A shares | | | | | | | | |
| Class A | | 393,065 | | 2,559,150 | | 745,934 | | 4,900,250 |
| Class B | | (391,861) | | (2,559,150) | | (743,600) | | (4,900,250) |
|
| | | | | 0 | | | | 0 |
|
| Payment for shares redeemed | | | | | | | | |
| Class A | | (3,595,558) | | (23,359,985) | | (7,064,524) | | (46,098,782) |
| Class B | | (2,057,939) | | (13,419,436) | | (4,575,911) | | (29,821,678) |
| Class C | | (1,526,950) | | (9,930,891) | | (4,120,746) | | (26,755,342) |
| Class I | | (351,161) | | (2,242,805) | | (1,952,434) | | (12,626,152) |
|
| | | | | (48,953,117) | | | | (115,301,954) |
|
| Net decrease in net assets resulting from | | | | | | | | |
| capital share transactions | | | | (3,717,094) | | | | (28,324,296) |
|
| Total decrease in net assets | | | | (15,387,063) | | | | (18,696,458) |
| Net assets | | | | | | | | |
| Beginning of period | | | | 412,382,867 | | | | 431,079,325 |
|
| End of period | | $ 396,995,804 | | $ 412,382,867 |
|
| Undistributed net investment income | | | | $ 4,493,408 | | | | $ 5,870,529 |
|
See Notes to Financial Statements
28
NOTES TO FINANCIAL STATEMENTS (unaudited)
1. ORGANIZATION
Evergreen Strategic Income Fund (the “Fund”) is a diversified series of Evergreen Fixed Income Trust (the “Trust”), a Delaware statutory trust organized on September 18, 1997. The Trust is an open-end management investment company registered under the Investment Company Act of 1940, as amended (the “1940 Act”).
The Fund offers Class A, Class B, Class C and Institutional (“Class I”) shares. Class A shares are sold with a front-end sales charge. However, Class A share investments of $1 million or more are not subject to a front-end sales charge but will be subject to a contingent deferred sales charge of 1.00% upon redemption within one year. Class B shares are sold without a front-end sales charge but are subject to a contingent deferred sales charge that is payable upon redemption and decreases depending on how long the shares have been held. Class C shares are sold without a front-end sales charge but are subject to a contingent deferred sales charge that is payable upon redemption within one year. Class I shares are sold without a front-end sales charge or contingent deferred sales charge. Each class of shares, except Class I shares, pays an ongoing distribution fee.
2. SIGNIFICANT ACCOUNTING POLICIES
The following is a summary of significant accounting policies consistently followed by the Fund in the preparation of its financial statements. The policies are in conformity with generally accepted accounting principles in the United States of America, which require management to make estimates and assumptions that affect amounts reported herein. Actual results could differ from these estimates.
a. Valuation of investments
Portfolio debt securities acquired with more than 60 days to maturity are fair valued using matrix pricing methods determined by an independent pricing service which takes into consideration such factors as similar security prices, yields, maturities, liquidity and ratings. Securities for which valuations are not readily available from an independent pricing service may be valued by brokers which use prices provided by market makers or estimates of market value obtained from yield data relating to investments or securities with similar characteristics.
Listed equity securities are usually valued at the last sales price or official closing price on the national securities exchange where the securities are principally traded.
Short-term securities with remaining maturities of 60 days or less at the time of purchase are valued at amortized cost, which approximates market value.
Investments in other mutual funds are valued at net asset value. Securities for which market quotations are not readily available or not reflective of current market value are valued at fair value as determined by the investment advisor in good faith, according to procedures approved by the Board of Trustees.
b. Foreign currency translation
All assets and liabilities denominated in foreign currencies are translated into U.S. dollar amounts at the date of valuation. Purchases and sales of portfolio securities and income items denominated
29
NOTES TO FINANCIAL STATEMENTS (unaudited) continued
in foreign currencies are translated into U.S. dollar amounts on the respective dates of such transactions. The Fund does not separately account for that portion of the results of operations resulting from changes in foreign exchange rates on investments and the fluctuations arising from changes in market prices of securities held. Such fluctuations are included with the net realized and unrealized gains or losses on investments.
c. Forward foreign currency contracts
A forward foreign currency contract is an agreement between two parties to purchase or sell a specific currency for an agreed-upon price at a future date. The Fund enters into forward foreign currency contracts to facilitate transactions in foreign-denominated securities and to attempt to minimize the risk to the Fund from adverse changes in the relationship between currencies. Forward foreign currency contracts are recorded at the forward rate and marked-to-market daily. When the contracts are closed, realized gains and losses arising from such transactions are recorded as realized gains or losses on foreign currency related transactions. The Fund could be exposed to risks if the counterparties to the contracts are unable to meet the terms of their contracts or if the value of the foreign currency changes unfavorably.
d. When-issued and delayed delivery transactions
The Fund records when-issued or delayed delivery securities as of trade date and maintains security positions such that sufficient liquid assets will be available to make payment for the securities purchased. Securities purchased on a when-issued or delayed delivery basis are marked-to-market daily and begin earning interest on the settlement date. Losses may occur on these transactions due to changes in market conditions or the failure of counterparties to perform under the contract.
e. Securities lending
The Fund may lend its securities to certain qualified brokers in order to earn additional income. The Fund receives compensation in the form of fees or interest earned on the investment of any cash collateral received. The Fund also continues to receive interest and dividends on the securities loaned. The Fund receives collateral in the form of cash or securities with a market value at least equal to the market value of the securities on loan, including accrued interest. In the event of default or bankruptcy by the borrower, the Fund could experience delays and costs in recovering the loaned securities or in gaining access to the collateral. The Fund has the right under the lending agreement to recover the securities from the borrower on demand.
f. Dollar roll transactions
The Fund may enter into dollar roll transactions with respect to mortgage-backed securities. In a dollar roll transaction, the Fund sells mortgage-backed securities to financial institutions and simultaneously agrees to accept substantially similar (same type, coupon and maturity) securities at a later date at an agreed upon price. The Fund will use the proceeds generated from the transactions to invest in short-term investments, which may enhance the Fund’s current yield and total return. The Fund accounts for dollar roll transactions as purchases and sales. The Fund could be exposed to risks if the counterparty defaults on its obligation to perform under the terms of the agreement, if the Fund receives inferior securities in comparison to what was sold to the
30
NOTES TO FINANCIAL STATEMENTS (unaudited) continued
counterparty at redelivery or if there are variances in paydown speed between the mortgage-related pools.
g. Security transactions and investment income
Security transactions are recorded on trade date. Realized gains and losses are computed using the specific cost of the security sold. Interest income is recorded on the accrual basis and includes accretion of discounts and amortization of premiums. Foreign income and capital gains realized on some securities may be subject to foreign taxes, which are accrued as applicable.
h. Federal taxes
The Fund intends to continue to qualify as a regulated investment company and distribute all of its taxable income, including any net capital gains (which have already been offset by available capital loss carryovers). Accordingly, no provision for federal taxes is required.
i. Distributions
Distributions to shareholders from net investment income are accrued daily and paid monthly. Distributions from net realized gains, if any, are recorded on the ex-dividend date. Such distributions are determined in conformity with income tax regulations, which may differ from generally accepted accounting principles.
j. Class allocations
Income, common expenses and realized and unrealized gains and losses are allocated to the classes based on the relative net assets of each class. Distribution fees, if any, are calculated daily at the class level based on the appropriate net assets of each class and the specific expense rates applicable to each class.
3. ADVISORY FEE AND OTHER TRANSACTIONS WITH AFFILIATES
Evergreen Investment Management Company, LLC (“EIMC”), an indirect, wholly-owned subsidiary of Wachovia Corporation (“Wachovia”), is the investment advisor to the Fund and is paid a fee at an annual rate of 2% of the Fund’s gross investment income plus an amount determined by applying percentage rates to the average daily net assets of the Fund, starting at 0.31% and declining to 0.16% as average daily net assets increase.
Evergreen International Advisors, an indirect, wholly-owned subsidiary of Wachovia, is the investment sub-advisor to the fixed income portion of the Fund and is paid by EIMC for its services to the Fund.
From time to time, EIMC may voluntarily or contractually waive its fee and/or reimburse expenses in order to limit operating expenses. During the six months ended October 31, 2005, EIMC reimbursed Distribution Plan expenses (see Note 4) relating to Class A shares in the amount of $824.
Evergreen Investment Services, Inc. (“EIS”), an indirect, wholly-owned subsidiary of Wachovia, is the administrator to the Fund. As administrator, EIS provides the Fund with facilities, equipment and personnel and is paid an annual rate determined by applying percentage rates to the
31
NOTES TO FINANCIAL STATEMENTS (unaudited) continued
aggregate average daily net assets of the Evergreen funds (excluding money market funds), starting at 0.10% and declining to 0.05% as the aggregate average daily net assets of the Evergreen funds (excluding money market funds) increase.
Evergreen Service Company, LLC (“ESC”), an indirect, wholly-owned subsidiary of Wachovia, is the transfer and dividend disbursing agent for the Fund. ESC receives account fees that vary based on the type of account held by the shareholders in the Fund. For the six months ended October 31, 2005, the transfer agent fees were equivalent to an annual rate of 0.22% of the Fund’s average daily net assets.
4. DISTRIBUTION PLANS
EIS also serves as distributor of the Fund’s shares. The Fund has adopted Distribution Plans, as allowed by Rule 12b-1 of the 1940 Act, for each class of shares, except Class I. Under the Distribution Plans, distribution fees are paid at an annual rate of 0.30% of the average daily net assets for Class A shares and 1.00% of the average daily net assets for each of Class B and Class C shares.
For the six months ended October 31, 2005, EIS received $15,187 from the sale of Class A shares and $127,696 and $1,903 in contingent deferred sales charges from redemptions of Class B and Class C shares, respectively.
5. SECURITIES TRANSACTIONS
Cost of purchases and proceeds from sales of investment securities (excluding short-term securities and mortgage dollar roll transactions) were as follows for the six months ended October 31, 2005:
| | Cost of Purchases | | | | Proceeds from Sales |
|
| | U.S. | | Non-U.S. | | | | U.S. | | Non-U.S. |
| | Government | | Government | | | | Government | | Government |
|
| $ 68,998,347 | | $ 135,335,273 | | $ 64,058,839 | | $ 122,037,284 |
|
At October 31, 2005, the Fund had forward foreign currency exchange contracts outstanding as follows:
Forward Foreign Currency Exchange Contracts to Sell:
| Exchange | | Contracts | | U.S. Value at | | In Exchange | | Unrealized |
| Date | | to Deliver | | October 31, 2005 | | for U.S. $ | | Gain (Loss) |
|
| 12/12/2005 | | 8,280,000 AUD | | $ 6,176,423 | | $ 6,268,540 | | $ 92,117 |
| 1/5/2006 | | 4,660,000 NZD | | 3,242,080 | | 3,190,236 | | (51,844) |
|
| Exchange | | Contracts to | | | U.S. Value at | | | | U.S. Value at | | Unrealized |
| Date | | Deliver | | October 31, 2005 | | In Exchange for | | October 31, 2005 | | Loss |
|
| 1/10/2006 | | 39,447,645 EUR | | $ 47,469,613 | | 5,382,000,000 JPY | | $ 46,637,846 | | $ 831,767 |
|
32
NOTES TO FINANCIAL STATEMENTS (unaudited) continued
On October 31, 2005, the aggregate cost of securities for federal income tax purposes was $448,434,171. The gross unrealized appreciation and depreciation on securities based on tax cost was $4,993,913 and $8,893,399, respectively, with a net unrealized depreciation of $3,899,486.
As of April 30, 2005, the Fund had $51,140,188 in capital loss carryovers for federal income tax purposes with $6,306,504 expiring in 2008, $14,759,243 expiring in 2009 and $30,074,441 expiring in 2010. These losses are subject to certain limitations prescribed by the Internal Revenue Code.
6. INTERFUND LENDING
Pursuant to an Exemptive Order issued by the SEC, the Fund may participate in an interfund lending program with certain funds in the Evergreen fund family. This program allows the Fund to borrow from, or lend money to, other participating funds. During the six months ended October 31, 2005, the Fund did not participate in the interfund lending program.
7. EXPENSE REDUCTIONS
Through expense offset arrangements with ESC and the Fund’s custodian, a portion of fund expenses has been reduced.
8. DEFERRED TRUSTEES’ FEES
Each Trustee of the Fund may defer any or all compensation related to performance of their duties as Trustees. The Trustees’ deferred balances are allocated to deferral accounts, which are included in the accrued expenses for the Fund. The investment performance of the deferral accounts is based on the investment performance of certain Evergreen funds. Any gains earned or losses incurred in the deferral accounts are reported in the Fund’s Trustees’ fees and expenses. At the election of the Trustees, the deferral account will be paid either in one lump sum or in quarterly installments for up to ten years.
9. FINANCING AGREEMENT
The Fund and certain other Evergreen funds share in a $150 million unsecured revolving credit commitment for temporary and emergency purposes, including the funding of redemptions, as permitted by each participating fund’s borrowing restrictions. Borrowings under this facility bear interest at 0.50% per annum above the Federal Funds rate. All of the participating funds are charged an annual commitment fee of 0.09% of the unused balance, which is allocated pro rata. During the six months ended October 31, 2005, the Fund had no borrowings under this agreement.
10. REGULATORY MATTERS AND LEGAL PROCEEDINGS
Since September 2003, governmental and self-regulatory authorities have instituted numerous ongoing investigations of various practices in the mutual fund industry, including investigations relating to revenue sharing, market-timing, late trading and record retention, among other things.
33
NOTES TO FINANCIAL STATEMENTS (unaudited) continued
The investigations cover investment advisors, distributors and transfer agents to mutual funds, as well as other firms. EIMC, EIS and ESC (collectively, “Evergreen”) have received subpoenas and other requests for documents and testimony relating to these investigations, are endeavoring to comply with those requests, and are cooperating with the investigations. Evergreen is continuing its own internal review of policies, practices, procedures and personnel, and is taking remedial action where appropriate.
In connection with one of these investigations, on July 28, 2004, the staff of the Securities and Exchange Commission (“SEC”) informed Evergreen that the staff intends to recommend to the SEC that it institute an enforcement action against Evergreen. The SEC staff’s proposed allegations relate to (i) an arrangement pursuant to which a broker at one of EIMC’s affiliated broker-dealers had been authorized, apparently by an EIMC officer (no longer with EIMC), to engage in short-term trading, on behalf of a client, in Evergreen Mid Cap Growth Fund (formerly Evergreen Emerging Growth Fund and prior to that, known as Evergreen Small Company Growth Fund) during the period from December 2000 through April 2003, in excess of the limitations set forth in the fund’s prospectus, (ii) short-term trading from September 2001 through January 2003, by a former Evergreen portfolio manager, of Evergreen Precious Metals Fund, a fund he managed at the time, (iii) the sufficiency of systems for monitoring exchanges and enforcing exchange limitations as stated in the fund’s prospectuses, and (iv) the adequacy of e-mail retention practices. In connection with the activity in Evergreen Mid Cap Growth Fund, EIMC reimbursed the fund $378,905, plus an additional $25,242, representing what EIMC calculated at that time to be the client’s net gain and the fees earned by EIMC and the expenses incurred by this fund on the client’s account. In connection with the activity in Evergreen Precious Metals Fund, EIMC reimbursed the fund $70,878, plus an additional $3,075, representing what EIMC calculated at that time to be the portfolio manager’s net gain and the fees earned by EIMC and expenses incurred by the fund on the portfolio manager’s account. Evergreen is currently engaged in discussions with the staff of the SEC concerning its recommendation.
The staff of the National Association of Securities Dealers (“NASD”) had notified EIS that it has made a preliminary determination to recommend that disciplinary action be brought against EIS for certain violations of the NASD’s rules. The recommendation relates principally to allegations that EIS (i) arranged for fund portfolio trades to be directed to broker-dealers (including Wachovia Securities, LLC, an affiliate of EIS) that sold Evergreen fund shares during the period of January 2001 to December 2003 and (ii) provided non-cash compensation by sponsoring offsite meetings attended by Wachovia Securities, LLC brokers during that period. EIS is cooperating with the NASD staff in its review of these matters.
Any resolution of these matters with regulatory authorities may include, but not be limited to, sanctions, penalties or injunctions regarding Evergreen, restitution to mutual fund shareholders and/or other financial penalties and structural changes in the governance or management of Evergreen’s mutual fund business. Any penalties or restitution will be paid by Evergreen and not by the Evergreen funds.
34
NOTES TO FINANCIAL STATEMENTS (unaudited) continued
In addition, the Evergreen funds and EIMC and certain of its affiliates are involved in various legal actions, including private litigation and class action lawsuits. EIMC does not expect that any of such legal actions currently pending or threatened will have a material adverse impact on the financial position or operations of any of the Evergreen funds or on EIMC’s ability to provide services to the Evergreen funds.
Although Evergreen believes that neither the foregoing investigations nor any pending or threatened legal actions will have a material adverse impact on the Evergreen funds, there can be no assurance that these matters and any publicity surrounding or resulting from them will not result in reduced sales or increased redemptions of Evergreen fund shares, which could increase Evergreen fund transaction costs or operating expenses, or have other adverse consequences on the Evergreen funds.
35
ADDITIONAL INFORMATION (unaudited)
INFORMATION ABOUT THE REVIEW AND APPROVAL OF THE FUND’S INVESTMENT
ADVISORY AGREEMENT
Each year, the Fund’s Board of Trustees is required to consider whether to continue in place the Fund’s investment advisory agreement with EIMC and its sub-advisory agreement with EIMC’s affiliate, First International Advisors, Inc. d/b/a Evergreen International Advisors (“EIA”) (the investment advisory agreement and the sub-advisory agreement are sometimes referred to herein as the “Agreements”). In September 2005, the Trustees, including a majority of the Trustees who are not interested persons (as that term is defined in the 1940 Act) of the Fund or of EIMC, approved the continuation of the Agreements.
At the same time, the Trustees considered the continuation of the investment advisory agreements for all of the Evergreen funds, and the description below refers in many cases to the Trustees’ process and conclusions in connection with their consideration of this matter for all of the Evergreen funds. In all of its deliberations, the Board of Trustees and the disinterested Trustees were advised by independent counsel to the disinterested Trustees and counsel to the Funds.
The review process. The 1940 Act requires that the Board of Trustees request and evaluate, and that EIMC furnish, such information as may reasonably be necessary to evaluate the terms of the Agreements. The review process began formally in spring 2005, when a committee of the Board (the “Committee”), working with EIMC management, determined generally the types of information the Board would review and set a timeline for the review process. In late spring, counsel to the disinterested Trustees sent to EIMC a formal request for information to be furnished to the Trustees. In addition, the independent data provider Lipper Inc. (“Lipper”) was engaged to provide Fund-specific and industry-wide data to the Board containing information of a nature and in a format generally prescribed by the Committee.
The Trustees reviewed EIMC’s responses to the request for information, with the assistance of counsel for the disinterested Trustees and for the Funds and an independent industry consultant retained by the disinterested Trustees, and requested and received additional information following that review. The Committee met in person with the representatives of EIMC in early September. At a meeting of the full Board of Trustees later in September, the Committee reported the results of its discussions with EIMC, and the full Board met with representatives of EIMC, engaged in further review of the materials provided to them, and approved the continuation of each of the advisory and sub-advisory agreements.
The disinterested Trustees discussed the continuation of the Fund’s Agreements with representatives of EIMC and in multiple private sessions with legal counsel at which no personnel of EIMC were present. In considering the continuation of the Agreements, the Trustees did not identify any particular information or consideration that was all-important or controlling, and each Trustee attributed different weights to various factors. The Trustees evaluated information provided to them both in terms of the Evergreen mutual funds generally and in respect of the Fund specifically as they considered appropriate; although the Trustees considered the continuation of the agreement as part of the larger process of considering the continuation of the advisory
36
ADDITIONAL INFORMATION (unaudited) continued
contracts for all of the Evergreen funds, their determination to continue the advisory agreement for each of the funds was ultimately made on a fund-by-fund basis.
This summary describes the most important, but not necessarily all, of the factors considered by the Board and the disinterested Trustees.
Information reviewed. The Board of Trustees and committees of the Board of Trustees meet periodically during the course of the year. At those meetings, the Board receives a wide variety of information regarding the services performed by EIMC, the investment performance of the Fund and the other Evergreen funds, and other aspects of the business and operations of the funds. At those meetings, and in the process of considering the continuation of the agreements, the Trustees considered information regarding, for example, the Fund’s investment results; the portfolio management team for the Fund and the experience of the members of that team, and any recent changes in the membership of the team; portfolio trading practices; compliance by the Fund and EIMC with applicable laws and regulations and with the Fund’s and EIMC’s compliance policies and procedures; services provided by affiliates of EIMC to the Fund and shareholders of the Fund; and other information relating to the nature, extent, and quality of services provided by EIMC. The Trustees considered the rates at which the Fund pays investment advisory fees, the total expense ratio of the Fund, and the efforts generally by EIMC and its affiliates as sponsors of the Fund and the fees paid by EIMC under the sub-advisory agreement with EIA. The data provided by Lipper showed the fees paid by the Fund and the Fund’s total expense ratio in comparison to other similar mutual funds, in addition to data regarding the investment performance by the funds in comparison to other similar mutual funds. The Trustees were assisted by the independent industry consultant in reviewing the information presented to them.
The Board also considered that EIS serves as administrator to the Fund and receives a fee for its services as administrator. In their comparison of the advisory fee paid by the Fund with those paid by other mutual funds, the Board took into account administrative fees paid by the Fund and those other mutual funds. The Board considered that affiliates of EIMC serve as transfer agent and distributor to the Fund and receive fees from the Fund for those services, and received information regarding recent reductions in the transfer agency fees paid by the Fund. They considered other so-called “fall-out” benefits to EIMC and its affiliates due to their other relationships with the Evergreen funds, including, for example, soft-dollar services received by EIMC attributable to transactions entered into by EIMC for the benefit of the funds and brokerage commissions received by Wachovia Securities LLC, an affiliate of EIMC, from transactions effected by it for the funds.
Nature and quality of the services provided. The Trustees considered that EIMC and its affili-ates provide a comprehensive investment management service to the Fund. They noted that EIMC and EIA formulate and implement an investment program for the Fund. They noted that EIMC makes its personnel available to serve as officers of the Evergreen funds, and concluded that the reporting and management functions provided by EIMC with respect to the Fund and the Evergreen funds overall were generally satisfactory. The Trustees considered the investment
37
ADDITIONAL INFORMATION (unaudited) continued
philosophy of the Fund’s portfolio management teams, and considered the in-house research capabilities of EIMC and its affiliates, as well as other resources available to EIMC and EIA, including research services available to it from third parties. The Board considered the managerial and financial resources available to EIMC, and the commitment that the Wachovia organization has made to the Fund and the Evergreen funds generally. On the basis of these factors, they determined that the nature and scope of the services provided by EIMC and EIA were consistent with their duties under the Agreements and appropriate and consistent with the investment programs and best interests of the Fund.
The Trustees noted the commitment and resources EIMC and its affiliates have committed to the regulatory, compliance, accounting, tax and tax reporting, and shareholder servicing functions, and the number and quality of staff committed to those functions, which they concluded were appropriate and generally in line with EIMC’s responsibilities to the Fund and to the Evergreen funds generally. They noted that EIMC had enhanced a number of these functions in recent periods and continued to do so, in light of regulatory developments in the investment management and mutual fund industries generally and in light of regulatory matters involving EIMC and its affiliates. They concluded that those enhancements appeared generally appropriate, but considered that the enhancement process is an on-going one and determined to continue to monitor developments in these functions in coming periods for appropriateness and consistency with regulatory and industry developments. The Board and the disinterested Trustees concluded, within the context of their overall conclusions regarding the Fund’s Agreements, that they were satisfied with the nature, extent, and quality of the services provided by EIMC and EIA, including services provided by EIS under its administrative services agreement with the Fund.
Investment performance. The Trustees considered the investment performance of each of the Evergreen funds, both by comparison to other comparable mutual funds and to broad market indices. The Trustees emphasized that the continuation of the investment advisory agreement for a fund should not be taken as any indication that the Trustees did not believe investment performance for any specific fund might not be improved, and they noted that they would continue to monitor closely the investment performance of the funds going forward. Specifically with respect to the Fund, the Trustees noted that the Class A shares of the Fund performed in the fifth quin-tile over the recently completed one-year period, performed in the third quintile over the recently completed three-year period, and performed in the second quintile over the recently completed five-year period. The Trustees noted that the Fund’s assets are principally invested in lower-rated debt securities, and that EIMC generally maintains a relatively high-quality bias in that asset class. EIMC reported to the Trustees that, in recent periods, funds with a high-quality bias like the Fund’s had generally underperformed other investment products investing in lower-quality issuers, contributing substantially to the Fund’s relative underperformance; EIMC said that it expected the Fund’s relative performance to improve as market conditions change to favor that bias.
38
ADDITIONAL INFORMATION (unaudited) continued
Advisory and administrative fees. The Trustees recognized that EIMC does not seek to provide the lowest cost investment advisory service, but to provide a high quality, full-service investment management product at a reasonable price. They also noted that EIMC has generally attempted to make its investment advisory fees consistent with industry norms. The Trustees noted that, from the materials presented, it appeared that the combination of investment advisory and administrative fees paid by the Fund to EIMC and EIS with respect to Class A shares was below the median of fees paid by comparable funds.
The Trustees noted that EIMC does not provide services to other clients using the same investment strategy as it uses in managing the Fund.
Economies of scale. The Trustees noted that economies of scale would likely be achieved by EIMC in managing the Evergreen funds as the funds grow. The Trustees noted that the Fund had implemented breakpoints in its advisory fee structure. The Trustees undertook to continue to review the appropriate levels of breakpoints in the future, but concluded that the breakpoints as implemented appeared to be a reasonable step toward the realization of economies of scale by the funds.
Profitability. The Trustees considered information provided to them regarding the profitability to the EIMC organization of the investment advisory, administration, and transfer agency fees paid to EIMC and its affiliates by each of the funds. They considered that the information provided to them was necessarily estimated. They noted that the levels of profitability of the funds to EIMC varied widely, depending on among other things the size and type of Fund. They noted that all of the estimates provided to them were calculated on a pre-tax basis. They considered the profitability of the funds in light of such factors as, for example, the information they had received regarding the relation of the fees paid by the funds to those paid by other mutual funds, the investment performance of the funds, and the amount of revenues involved. In light of these factors, the Trustees did not consider that the profitability of any of the funds, individually or in the aggregate, was such as to prevent their approving the continuation of the agreements.
In connection with their review of the Fund’s investment advisory and administrative fees, the Trustees also considered the transfer agency fees paid by the funds to an affiliate of EIMC. They reviewed information presented to them showing generally that the transfer agency fees charged to the funds were generally consistent with industry norms, and that transfer agency fees for a number of funds had recently declined, or were expected to in the near future.
39
TRUSTEES AND OFFICERS
| TRUSTEES1 | | |
| Charles A. Austin III | | Principal occupations: Investment Counselor, Anchor Capital Advisors, Inc. (investment advice); |
| Trustee | | Director, The Andover Companies (insurance); Trustee, Arthritis Foundation of New England; |
| DOB: 10/23/1934 | | Former Director, The Francis Ouimet Society; Former Director, Health Development Corp. |
| Term of office since: 1991 | | (fitness-wellness centers); Former Director, Mentor Income Fund, Inc.; Former Trustee, |
| Other directorships: None | | Mentor Funds and Cash Resource Trust; Former Investment Counselor, Appleton Partners, Inc. |
| | | (investment advice); Former Director, Executive Vice President and Treasurer, State Street |
| | | Research & Management Company (investment advice) |
|
| |
| Shirley L. Fulton | | Principal occupations: Partner, Tin, Fulton, Greene & Owen, PLLC (law firm); Former Partner, |
| Trustee | | Helms, Henderson & Fulton, P.A. (law firm); Retired Senior Resident Superior Court Judge, |
| DOB: 1/10/1952 | | 26th Judicial District, Charlotte, NC |
| Term of office since: 2004 | | |
| Other directorships: None | | |
|
| |
| K. Dun Gifford | | Principal occupations: Chairman and President, Oldways Preservation and Exchange Trust |
| Trustee | | (education); Trustee, Treasurer and Chairman of the Finance Committee, Cambridge College; |
| DOB: 10/23/1938 | | Former Chairman of the Board, Director, and Executive Vice President, The London Harness |
| Term of office since: 1974 | | Company (leather goods purveyor); Former Director, Mentor Income Fund, Inc.; Former Trustee, |
| Other directorships: None | | Mentor Funds and Cash Resource Trust |
|
| |
| Dr. Leroy Keith, Jr. | | Principal occupations: Partner, Stonington Partners, Inc. (private equity firm); Trustee, |
| Trustee | | The Phoenix Group of Mutual Funds; Director, Obagi Medical Products Co.; Director, |
| DOB: 2/14/1939 | | Diversapack Co.; Former Director, Lincoln Educational Services; Former Chairman of the Board |
| Term of office since: 1983 | | and Chief Executive Officer, Carson Products Company (manufacturing); Former Director, |
| Other directorships: Trustee, The | | Mentor Income Fund, Inc.; Former Trustee, Mentor Funds and Cash Resource Trust |
| Phoenix Group of Mutual Funds | | |
|
| |
| Gerald M. McDonnell | | Principal occupations: Manager of Commercial Operations, SMI Steel Co. – South Carolina |
| Trustee | | (steel producer); Former Sales and Marketing Manager, Nucor Steel Company; Former Director, |
| DOB: 7/14/1939 | | Mentor Income Fund, Inc.; Former Trustee, Mentor Funds and Cash Resource Trust |
| Term of office since: 1988 | | |
| Other directorships: None | | |
|
| |
| William Walt Pettit | | Principal occupations: Vice President, Kellam & Pettit, P.A. (law firm); Director, Superior |
| Trustee | | Packaging Corp.; Director, National Kidney Foundation of North Carolina, Inc.; Former Director, |
| DOB: 8/26/1955 | | Mentor Income Fund, Inc.; Former Trustee, Mentor Funds and Cash Resource Trust |
| Term of office since: 1984 | | |
| Other directorships: None | | |
|
| |
| David M. Richardson | | Principal occupations: President, Richardson, Runden LLC (executive recruitment business |
| Trustee | | development/consulting company); Consultant, Kennedy Information, Inc. (executive |
| DOB: 9/19/1941 | | recruitment information and research company); Consultant, AESC (The Association of |
| Term of office since: 1982 | | Executive Search Consultants); Director, J&M Cumming Paper Co. (paper merchandising); |
| Other directorships: None | | Former Trustee, NDI Technologies, LLP (communications); Former Vice Chairman, DHR |
| | | International, Inc. (executive recruitment); Former Director, Mentor Income Fund, Inc.; |
| | | Former Trustee, Mentor Funds and Cash Resource Trust |
|
| |
| Dr. Russell A. Salton III | | Principal occupations: President/CEO, AccessOne MedCard; Former Medical Director, |
| Trustee | | Healthcare Resource Associates, Inc.; Former Medical Director, U.S. Health Care/Aetna Health |
| DOB: 6/2/1947 | | Services; Former Director, Mentor Income Fund, Inc.; Former Trustee, Mentor Funds and |
| Term of office since: 1984 | | Cash Resource Trust |
| Other directorships: None | | |
|
40
TRUSTEES AND OFFICERS continued
| Michael S. Scofield | | Principal occupations: Director and Chairman, Branded Media Corporation (multi-media |
| Trustee | | branding company); Attorney, Law Offices of Michael S. Scofield; Former Director, Mentor |
| DOB: 2/20/1943 | | Income Fund, Inc.; Former Trustee, Mentor Funds and Cash Resource Trust |
| Term of office since: 1984 | | |
| Other directorships: None | | |
|
| |
| Richard J. Shima | | Principal occupations: Independent Consultant; Director, Trust Company of CT; Trustee, |
| Trustee | | Saint Joseph College (CT); Director, Hartford Hospital; Trustee, Greater Hartford YMCA; |
| DOB: 8/11/1939 | | Former Director, Enhance Financial Services, Inc.; Former Director, Old State House Association; |
| Term of office since: 1993 | | Former Director of CTG Resources, Inc. (natural gas); Former Director, Mentor Income Fund, Inc.; |
| Other directorships: None | | Former Trustee, Mentor Funds and Cash Resource Trust |
|
| |
| Richard K. Wagoner, CFA2 | | Principal occupations: Member and Former President, North Carolina Securities Traders |
| Trustee | | Association; Member, Financial Analysts Society; Former Consultant to the Boards of Trustees |
| DOB: 12/12/1937 | | of the Evergreen funds; Former Trustee, Mentor Funds and Cash Resource Trust |
| Term of office since: 1999 | | |
| Other directorships: None | | |
|
| |
| |
| OFFICERS | | |
| |
| Dennis H. Ferro3 | | Principal occupations: President and Chief Executive Officer, Evergreen Investment Company, |
| President | | Inc. and Executive Vice President, Wachovia Bank, N.A.; former Chief Investment Officer, |
| DOB: 6/20/1945 | | Evergreen Investment Company, Inc. |
| Term of office since: 2003 | | |
|
| |
| Kasey Phillips4 | | Principal occupations: Senior Vice President, Evergreen Investment Services, Inc.; Former Vice |
| Treasurer | | President, Evergreen Investment Services, Inc.; Former Assistant Vice President, Evergreen |
| DOB: 12/12/1970 | | Investment Services, Inc. |
| Term of office since: 2005 | | |
|
| |
| Michael H. Koonce4 | | Principal occupations: Senior Vice President and General Counsel, Evergreen Investment |
| Secretary | | Services, Inc.; Senior Vice President and Assistant General Counsel, Wachovia Corporation |
| DOB: 4/20/1960 | | |
| Term of office since: 2000 | | |
|
| |
| James Angelos4 | | Principal occupations: Chief Compliance Officer and Senior Vice President, Evergreen Funds; |
| Chief Compliance Officer | | Former Director of Compliance, Evergreen Investment Services, Inc. |
| DOB: 9/2/1947 | | |
| Term of office since: 2004 | | |
|
1 Each Trustee serves until a successor is duly elected or qualified or until his/her death, resignation, retirement or removal from office. Each Trustee oversees 89 Evergreen funds. Correspondence for each Trustee may be sent to Evergreen Board of Trustees, P.O. Box 20083, Charlotte, NC 28202.
2 Mr. Wagoner is an “interested person” of the Fund because of his ownership of shares in Wachovia Corporation, the parent to the Fund’s investment advisor.
3 The address of the Officer is 401 S. Tryon Street, 20th Floor, Charlotte, NC 28288.
4 The address of the Officer is 200 Berkeley Street, Boston, MA 02116.
Additional information about the Fund’s Board of Trustees and Officers can be found in the Statement of Additional Information (SAI) and is available upon request without charge by calling 800.343.2898.
41
564358 rv1 12/2005
Evergreen U.S. Government Fund

| table of contents |
| 1 | | LETTER TO SHAREHOLDERS |
| 4 | | FUND AT A GLANCE |
| 6 | | ABOUT YOUR FUND’S EXPENSES |
| 7 | | FINANCIAL HIGHLIGHTS |
| 11 | | SCHEDULE OF INVESTMENTS |
| 17 | | STATEMENT OF ASSETS AND LIABILITIES |
| 18 | | STATEMENT OF OPERATIONS |
| 19 | | STATEMENTS OF CHANGES IN NET ASSETS |
| 20 | | STATEMENT OF CASH FLOWS |
| 21 | | NOTES TO FINANCIAL STATEMENTS |
| 27 | | ADDITIONAL INFORMATION |
| 32 | | TRUSTEES AND OFFICERS |
This semiannual report must be preceded or accompanied by a prospectus of the Evergreen fund contained herein. The prospectus contains more complete information, including fees and expenses, and should be read carefully before investing or sending money.
The fund will file its complete schedule of portfolio holdings with the SEC for the first and third quarters of each fiscal year on Form N-Q. The fund’s Form N-Q will be available on the SEC’s Web site at http://www.sec.gov. In addition, the fund’s Form N-Q may be reviewed and copied at the SEC’s Public Reference Room in Washington, D.C. Information on the operation of the Public Reference Room may be obtained by calling 800.SEC.0330.
A description of the fund’s proxy voting policies and procedures, as well as information regarding how the fund voted proxies relating to portfolio securities during the most recent 12-month period ended June 30, is available by visiting our Web site at EvergreenInvestments.com or by visiting the SEC’s Web site at http://www.sec.gov. The fund’s proxy voting policies and procedures are also available without charge, upon request, by calling 800.343.2898.
| Mutual Funds: | | | | |
| NOT FDIC INSURED | | MAY LOSE VALUE | | NOT BANK GUARANTEED |
Evergreen InvestmentsSM is a service mark of Evergreen Investment Management Company, LLC.
Copyright 2005, Evergreen Investment Management Company, LLC.
Evergreen Investment Management Company, LLC is a subsidiary of Wachovia
Corporation and is an affiliate of Wachovia Corporation's other Broker Dealer subsidiaries.
Evergreen mutual funds are distributed by Evergreen Investment Services, Inc.
200 Berkeley Street, Boston, MA 02116
LETTER TO SHAREHOLDERS
December 2005

Dennis H. Ferro
President and Chief Executive Officer
Dear Shareholder,
We are pleased to provide the semiannual report for the Evergreen U.S. Government Fund, which covers the six-month period ended October 31, 2005.
Fixed income investors had to endure a variety of challenges over the past six months. Moderating economic growth, surging energy prices and tighter monetary policy led the list of concerns, while the terrorist bombings in London and credit downgrades in the auto sector further pressured market sentiment. In addition, Hurricane Katrina devastated much of the gulf region and inflation fears grew with the prospect of more government spending. While the importance of asset allocation becomes increasingly evident during times of uncertainty, we believe it is crucial for long-term investors to extend the diversification process further, to include several strategies within an asset class, such as the bond fund offerings within Evergreen’s Fixed Income Trust and Select Fixed Income Trust.
The investment period began with a trend for slower growth in the U.S. economy. After experiencing the rapid pace of growth typical in economic recovery, Gross Domestic Product had moderated to a pace of growth normally associated with economic expansion. While the growth in overall output was still good, it was no longer considered great, and market interest rates initially declined on the perceived weakness. Yet energy prices continued to soar throughout the summer months amid rising levels for employment, housing and production. The post-Katrina federal spending plans exacerbated these pricing concerns and long-term interest rates began to crawl higher.
Having already anticipated a bout of inflation fears, the Federal Reserve (Fed) maintained its “measured
1
LETTER TO SHAREHOLDERS continued
removal of policy accommodation.” While the paradox of moderating economic growth and tighter monetary policy often rattled the fixed income markets, Evergreen’s Investment Strategy Committee concluded that since rates were low for such a lengthy period, the central bank was simply removing excess stimulus to prevent pricing from becoming a long-term problem. Although Chairman Greenspan had been very transparent in his public statements about the direction of monetary policy, market interest rates persisted lower into the summer months. This “flattening” of the yield curve caused many in the fixed income markets to debate its message. Did it signal the end of the expansion? Or was it just confidence in the Fed’s inflation-fighting capabilities? Considering our forecast for moderating global growth, mild wages, and solid productivity, we determined that long-term pricing pressures, despite energy, were insufficient to halt the expansion. In addition, we believed that a combination of excess global savings, an increased “flight to quality,” and growing demand for longer-duration investments by under-funded pensions accelerated this trend.
Throughout this timeframe, our fixed income teams attempted to capitalize on trends within the bond market. For example, Evergreen’s high yield teams emphasized exposure within media and telecom, while the lack of airline exposure benefited their portfolios. Our government bond teams needed to be very agile in their decision-making, for despite the Fed’s monetary policy stance, the yield curve continued to flatten. The mortgage market benefited from the mostly positive economic data, yet the combination of the hurricanes
2
LETTER TO SHAREHOLDERS continued
and rising energy costs pressured yields in September and October. Finally, some of our “core” strategies included going short on duration in anticipation of the rise in market yields. All told, it was a challenging environment to be tied to any one specific area within the bond market, and we believe those portfolios fully diversified within fixed income were best positioned for the long-term.
We continue to recommend that investors maintain their diversified, long-term strategies within their fixed income portfolios.
Please visit our Web site, EvergreenInvestments.com, for more information about our funds and other investment products available to you. Thank you for your continued support of Evergreen Investments.
Sincerely,

Dennis H. Ferro
President and Chief Executive Officer
Evergreen Investment Company, Inc.
Special Notice to Shareholders:
Please visit our Web site at EvergreenInvestments.com for a statement from President and Chief Executive Officer, Dennis Ferro, addressing NASD actions involving Evergreen Investment Services, Inc. (EIS), Evergreen’s mutual fund distributor or statements from Dennis Ferro and Chairman of the Board of the Evergreen Funds, Michael S. Scofield, addressing SEC actions involving the Evergreen Funds.
3
FUND AT A GLANCE
as of October 31, 2005
MANAGEMENT TEAM
Investment Advisor:
• Evergreen Investment Management Company, LLC
Portfolio Managers:
• Lisa Brown-Premo
• Karen DiMeglio
• Andrew Zimmerman
CURRENT INVESTMENT STYLE
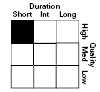
Source: Morningstar, Inc.
Morningstar’s style box is based on a portfolio date as of 9/30/2005.
The Fixed income style box placement is based on a fund’s average effective maturity or duration and the average credit rating of the bond portfolio.
PERFORMANCE AND RETURNS
Portfolio inception date: 1/11/1993
| | | Class A | | Class B | | Class C | | Class I |
| Class inception date | | 1/11/1993 | | 1/11/1993 | | 9/2/1994 | | 9/2/1993 |
|
| Nasdaq symbol | | EUSAX | | EUSBX | | EUSCX | | EUSYX |
|
| 6-month return with sales charge | | -4.76% | | -5.30% | | -1.38% | | N/A |
|
| 6-month return w/o sales charge | | -0.04% | | -0.39% | | -0.39% | | 0.11% |
|
| Average annual return* | | | | | | | | |
|
| 1-year with sales charge | | -3.75% | | -4.50% | | -0.58% | | N/A |
|
| 1-year w/o sales charge | | 1.10% | | 0.39% | | 0.39% | | 1.40% |
|
| 5-year | | 3.96% | | 3.88% | | 4.23% | | 5.27% |
|
| 10-year | | 4.75% | | 4.49% | | 4.49% | | 5.54% |
|
| Maximum sales charge | | 4.75% | | 5.00% | | 1.00% | | N/A |
| | | Front-end | | CDSC | | CDSC | | |
|
* Adjusted for maximum applicable sales charge, unless noted.
Past performance is no guarantee of future results. The performance quoted represents past performance and current performance may be lower or higher. The investment return and principal value of an investment will fluctuate so that investors’ shares, when redeemed, may be worth more or less than their original cost. To obtain performance information current to the most recent month-end for Classes A, B, C or I, please go to EvergreenInvestments.com/fundperformance. The performance of each class may vary based on differences in loads, fees and expenses paid by the shareholders investing in each class. Performance includes the reinvestment of income dividends and capital gain distributions. Performance shown does not reflect the deduction of taxes that a shareholder would pay on fund distributions or the redemption of fund shares.
The fund incurs a 12b-1 fee of 0.30% for Class A and 1.00% for Classes B and C. Class I does not pay a 12b-1 fee.
The advisor is reimbursing a portion of the 12b-1 fee for Class A. Had the fee not been reimbursed, returns for Class A would have been lower. Returns reflect expense limits previously in effect for all classes, without which returns would have been lower.
4
| FUND AT A GLANCE continued |
| |
| LONG-TERM GROWTH |
| |
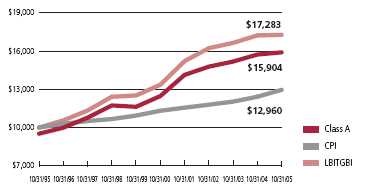
Comparison of a $10,000 investment in the Evergreen U.S. Government Fund Class A shares, versus a similar investment in the Lehman Brothers Intermediate Term Government Bond Index (LBITGBI) and the Consumer Price Index (CPI).
The LBITGBI is an unmanaged market index and does not include transaction costs associated with buying and selling securities, any mutual fund expenses or any taxes. The CPI is a commonly used measure of inflation and does not represent an investment return. It is not possible to invest directly in an index.
Class I shares are only offered in the following manner: (1) to investment advisory clients of Evergreen Investment Management Company, LLC (or its advisory affiliates) when purchased by such advisor(s) on behalf of its clients, (2) through arrangements entered into on behalf of the Evergreen funds with certain financial services firms, (3) to certain institutional investors and (4) to persons who owned Class Y shares in registered name in an Evergreen fund on or before December 31, 1994 or who owned shares of any SouthTrust fund in registered name as of March 18, 2005 or shares of Vestaur Securities Fund as of May 20, 2005.
Class I shares are only available to institutional shareholders with a minimum of $1 million investment, which may be waived in certain situations.
The fund’s investment objective is nonfundamental and may be changed without a vote of the fund’s shareholders.
The return of principal is not guaranteed due to fluctuation in the NAV of the fund caused by changes in the price of the individual bonds held by the fund and the buying and selling of bonds by the fund. Bond funds have the same inflation, interest rate and credit risks that are associated with the individual bonds held by the fund. Generally, the value of bond funds rise when prevailing interest rates fall and fall when interest rates rise.
U.S. government guarantees apply only to certain securities held in the fund’s portfolio and not to the fund’s shares.
All data is as of October 31, 2005, and subject to change.
5
ABOUT YOUR FUND’S EXPENSES
The Example below is intended to describe the fees and expenses borne by shareholders and the impact of those costs on your investment.
Example
As a shareholder of the fund, you incur two types of costs: (1) transaction costs, including sales charges (loads), redemption fees and exchange fees; and (2) ongoing costs, including management fees, distribution (12b-1) fees and other fund expenses. This Example is intended to help you understand your ongoing costs (in dollars) of investing in the fund and to compare these costs with the ongoing costs of investing in other mutual funds. The Example is based on an investment of $1,000 invested at the beginning of the period and held for the entire period from May 1, 2005 to October 31, 2005.
The example illustrates your fund’s costs in two ways:
• Actual expenses
The section in the table under the heading “Actual” provides information about actual account values and actual expenses. You may use the information in these columns, together with the amount you invested, to estimate the expenses that you paid over the period. Simply divide your account value by $1,000 (for example, an $8,600 account value divided by $1,000 = 8.6), then multiply the result by the number in the appropriate column for your share class, in the column entitled “Expenses Paid During Period” to estimate the expenses you paid on your account during this period.
• Hypothetical example for comparison purposes
The section in the table under the heading “Hypothetical (5% return before expenses)” provides information about hypothetical account values and hypothetical expenses based on the fund’s actual expense ratio and an assumed rate of return of 5% per year before expenses, which is not the fund’s actual return. The hypothetical account values and expenses may not be used to estimate the actual ending account balance or expenses you paid for the period. You may use this information to compare the ongoing costs of investing in the fund and other funds. To do so, compare this 5% hypothetical example with the 5% hypothetical examples that appear in the shareholder reports of the other funds.
Please note that the expenses shown in the table are meant to highlight your ongoing costs only and do not reflect any transactional costs, such as sales charges (loads), redemption fees or exchange fees. Therefore, the section in the table under the heading “Hypothetical (5% return before expenses)” is useful in comparing ongoing costs only, and will not help you determine the relative total costs of owning different funds. In addition, if these transactional costs were included, your costs would have been higher.
| | | Beginning | | | | Ending | | |
| | | Account | | | | Account | | Expenses |
| | | Value | | | | Value | | Paid During |
| | | 5/1/2005 | | 10/31/2005 | | Period* |
|
| Actual | | | | | | | | |
| Class A | | $ 1,000.00 | | $ | | 999.58 | | $ 4.99 |
| Class B | | $ 1,000.00 | | $ | | 996.07 | | $ 8.50 |
| Class C | | $ 1,000.00 | | $ | | 996.07 | | $ 8.50 |
| Class I | | $ 1,000.00 | | $ 1,001.09 | | $ 3.48 |
| Hypothetical | | | | | | | | |
| (5% return | | | | | | | | |
| before expenses) | | | | | | | | |
| Class A | | $ 1,000.00 | | $ 1,020.21 | | $ 5.04 |
| Class B | | $ 1,000.00 | | $ 1,016.69 | | $ 8.59 |
| Class C | | $ 1,000.00 | | $ 1,016.69 | | $ 8.59 |
| Class I | | $ 1,000.00 | | $ 1,021.73 | | $ 3.52 |
|
* For each class of the Fund, expenses are equal to the annualized expense ratio of each class (0.99% for Class A, 1.69% for Class B, 1.69% for Class C and 0.69% for Class I), multiplied by the average account value over the period, multiplied by 184 / 365 days.
6
FINANCIAL HIGHLIGHTS
(For a share outstanding throughout each period)
| | | | | | | | | | | | | | | |
| | | Six Months Ended | | Year Ended April 30, |
| | October 31, 2005 | |
|
| CLASS A | | (unaudited) | | 2005 | | 2004 | | | | 2003 | | 20021 | | 2001 |
|
| Net asset value, beginning of period | | $ | | 10.09 | | $ 9.96 | | $ 10.22 | | $ | | 9.75 | | $ 9.59 | | $ 9.15 |
|
| Income from investment operations | | | | | | | | | | | | | | | | |
| Net investment income (loss) | | | | 0.152 | | 0.242 | | 0.192 | | | | 0.39 | | 0.48 | | 0.54 |
Net realized and unrealized gains
or losses on investments | | | | (0.15) | | 0.19 | | (0.16) | | | | 0.43 | | 0.16 | | 0.44 |
| |
|
| Total from investment operations | | | | 0 | | 0.43 | | 0.03 | | | | 0.82 | | 0.64 | | 0.98 |
|
| Distributions to shareholders from | | | | | | | | | | | | | | | | |
| Net investment income | | | | (0.18) | | (0.30) | | (0.29) | | | | (0.35) | | (0.48) | | (0.54) |
|
| Net asset value, end of period | | $ | | 9.91 | | $ 10.09 | | $ 9.96 | | $ | | 10.22 | | $ 9.75 | | $ 9.59 |
|
| Total return3 | | | | (0.04%) | | 4.37% | | 0.30% | | | | 8.50% | | 6.76% | | 10.98% |
|
| Ratios and supplemental data | | | | | | | | | | | | | | | | |
| Net assets, end of period (thousands) | | $86,098 | | $93,826 | | $109,172 | | $146,427 | | $141,838 | | $108,073 |
| Ratios to average net assets | | | | | | | | | | | | | | | | |
| Expenses including waivers/reimbursements | | | | | | | | | | | | | | | | |
| but excluding expense reductions | | | | 0.99%4 | | 1.00% | | 1.01% | | | | 0.95% | | 0.96% | | 1.00% |
| Expenses excluding waivers/reimbursements | | | | | | | | | | | | | | | | |
| and expense reductions | | | | 0.99%4 | | 1.00% | | 1.01% | | | | 0.95% | | 0.96% | | 1.00% |
| Net investment income (loss) | | | | 2.88%4 | | 2.38% | | 1.86% | | | | 3.81% | | 4.91% | | 5.71% |
| Portfolio turnover rate | | | | 30% | | 110% | | 55% | | | | 129% | | 121% | | 86% |
|
1 As required, effective May 1, 2001, the Fund adopted the provisions of the AICPA Audit and Accounting Guide, Audits of Investment Companies, and began amortizing premium on its fixed-income securities . The effects of this change for the year ended April 30, 2002 was a decrease in net investment income per share of $0.02; an increase in net realized gains or losses per share of $0.02; and a decrease to the ratio of net investment income to average net assets of 0.22%. The above per share information, ratios and supplemental data for the periods prior to May 1, 2001 have not been restated to reflect this change in presentation .
2 Net investment income (loss) per share is based on average shares outstanding during the period.
3 Excluding applicable sales charges
4 Annualized
See Notes to Financial Statements
7
FINANCIAL HIGHLIGHTS
(For a share outstanding throughout each period)
| | | | | | | | | | | | | | | |
| | | Six Months Ended | | Year Ended April 30, |
| | October 31, 2005 | |
|
| CLASS B | | (unaudited) | | 2005 | | 2004 | | | | 2003 | | 20021 | | 2001 |
|
| Net asset value, beginning of period | | $ | | 10.09 | | $ 9.96 | | $ 10.22 | | $ | | 9.75 | | $ 9.59 | | $ 9.15 |
|
| Income from investment operations | | | | | | | | | | | | | | | | |
| Net investment income (loss) | | | | 0.112 | | 0.172 | | 0.122 | | | | 0.31 | | 0.42 | | 0.47 |
Net realized and unrealized gains
or losses on investments | | | | (0.15) | | 0.19 | | (0.16) | | | | 0.43 | | 0.15 | | 0.44 |
| |
|
| Total from investment operations | | | | (0.04) | | 0.36 | | (0.04) | | | | 0.74 | | 0.57 | | 0.91 |
|
| Distributions to shareholders from | | | | | | | | | | | | | | | | |
| Net investment income | | | | (0.14) | | (0.23) | | (0.22) | | | | (0.27) | | (0.41) | | (0.47) |
|
| Net asset value, end of period | | $ | | 9.91 | | $ 10.09 | | $ 9.96 | | $ | | 10.22 | | $ 9.75 | | $ 9.59 |
|
| Total return3 | | | | (0.39%) | | 3.64% | | (0.40%) | | | | 7.69% | | 5.97% | | 10.15% |
|
| Ratios and supplemental data | | | | | | | | | | | | | | | | |
| Net assets, end of period (thousands) | | $21,145 | | $25,452 | | $37,270 | | $59,362 | | $47,016 | | $65,533 |
| Ratios to average net assets | | | | | | | | | | | | | | | | |
| Expenses including waivers/reimbursements | | | | | | | | | | | | | | | | |
| but excluding expense reductions | | | | 1.69%4 | | 1.70% | | 1.71% | | | | 1.70% | | 1.71% | | 1.75% |
| Expenses excluding waivers/reimbursements | | | | | | | | | | | | | | | | |
| and expense reductions | | | | 1.69%4 | | 1.70% | | 1.71% | | | | 1.70% | | 1.71% | | 1.75% |
| Net investment income (loss) | | | | 2.17%4 | | 1.67% | | 1.16% | | | | 3.04% | | 4.18% | | 4.98% |
| Portfolio turnover rate | | | | 30% | | 110% | | 55% | | | | 129% | | 121% | | 86% |
|
1 As required, effective May 1, 2001, the Fund adopted the provisions of the AICPA Audit and Accounting Guide, Audits of Investment Companies, and began amortizing premium on its fixed-income securities . The effects of this change for the year ended April 30, 2002 was a decrease in net investment income per share of $0.01; an increase in net realized gains or losses per share of $0.01; and a decrease to the ratio of net investment income to average net assets of 0.22%. The above per share information, ratios and supplemental data for the periods prior to May 1, 2001 have not been restated to reflect this change in presentation .
2 Net investment income (loss) per share is based on average shares outstanding during the period.
3 Excluding applicable sales charges
4 Annualized
See Notes to Financial Statements
8
FINANCIAL HIGHLIGHTS
(For a share outstanding throughout each period)
| | | | | | | | | | | | | | | |
| | | Six Months Ended | | Year Ended April 30, |
| | October 31, 2005 | |
|
| CLASS C | | (unaudited) | | 2005 | | 2004 | | | | 2003 | | 20021 | | 2001 |
|
| Net asset value, beginning of period | | $10.09 | | $ 9.96 | | $ 10.22 | | $ | | 9.75 | | $ 9.59 | | $ 9.15 |
|
| Income from investment operations | | | | | | | | | | | | | | |
| Net investment income (loss) | | 0.112 | | 0.172 | | 0.122 | | | | 0.31 | | 0.41 | | 0.47 |
Net realized and unrealized gains
or losses on investments | | (0.15) | | 0.19 | | (0.16) | | | | 0.43 | | 0.16 | | 0.44 |
| |
|
| Total from investment operations | | (0.04) | | 0.36 | | (0.04) | | | | 0.74 | | 0.57 | | 0.91 |
|
| Distributions to shareholders from | | | | | | | | | | | | | | |
| Net investment income | | (0.14) | | (0.23) | | (0.22) | | | | (0.27) | | (0.41) | | (0.47) |
|
| Net asset value, end of period | | $ 9.91 | | $10.09 | | $ 9.96 | | $ | | 10.22 | | $ 9.75 | | $ 9.59 |
|
| Total return3 | | (0.39%) | | 3.64% | | (0.40%) | | | | 7.69% | | 5.97% | | 10.15% |
|
| Ratios and supplemental data | | | | | | | | | | | | | | |
| Net assets, end of period (thousands) | | $8,437 | | $9,820 | | $14,207 | | $26,013 | | $14,212 | | $11,188 |
| Ratios to average net assets | | | | | | | | | | | | | | |
| Expenses including waivers/reimbursements | | | | | | | | | | | | | | |
| but excluding expense reductions | | 1.69%4 | | 1.70% | | 1.71% | | | | 1.70% | | 1.71% | | 1.74% |
| Expenses excluding waivers/reimbursements | | | | | | | | | | | | | | |
| and expense reductions | | 1.69%4 | | 1.70% | | 1.71% | | | | 1.70% | | 1.71% | | 1.74% |
| Net investment income (loss) | | 2.18%4 | | 1.67% | | 1.17% | | | | 2.99% | | 4.15% | | 4.90% |
| Portfolio turnover rate | | 30% | | 110% | | 55% | | | | 129% | | 121% | | 86% |
|
1 As required, effective May 1, 2001 the Fund adopted the provisions of the AICPA Audit and Accounting Guide, Audits of Investment Companies, and began amortizing premium on its fixed-income securities . The effects of this change for the year ended April 30, 2002 was a decrease in net investment income per share of $0.02; an increase in net realized gains or losses per share of $0.02; and a decrease to the ratio of net investment income to average net assets of 0.22%. The above per share information, ratios and supplemental data for the periods prior to May 1, 2001 have not been restated to reflect this change in presentation .
2 Net investment income (loss) per share is based on average shares outstanding during the period.
3 Excluding applicable sales charges
4 Annualized
See Notes to Financial Statements
9
FINANCIAL HIGHLIGHTS
(For a share outstanding throughout each period)
| | | | | | | | | | | | | | | |
| | | Six Months Ended | | Year Ended April 30, |
| | October 31, 2005 | |
|
| CLASS I1 | | (unaudited) | | 2005 | | 2004 | | | | 2003 | | 20022 | | 2001 |
|
| Net asset value, beginning of period | | $ | | 10.09 | | $ 9.96 | | $ 10.22 | | $ | | 9.75 | | $ 9.59 | | $ 9.15 |
|
| Income from investment operations | | | | | | | | | | | | | | | | |
| Net investment income (loss) | | | | 0.163 | | 0.273 | | 0.223 | | | | 0.41 | | 0.50 | | 0.56 |
Net realized and unrealized gains
or losses on investments | | | | (0.15) | | 0.19 | | (0.16) | | | | 0.43 | | 0.16 | | 0.44 |
| |
|
| Total from investment operations | | | | 0.01 | | 0.46 | | 0.06 | | | | 0.84 | | 0.66 | | 1.00 |
|
| Distributions to shareholders from | | | | | | | | | | | | | | | | |
| Net investment income | | | | (0.19) | | (0.33) | | (0.32) | | | | (0.37) | | (0.50) | | (0.56) |
|
| Net asset value, end of period | | $ | | 9.91 | | $ 10.09 | | $ 9.96 | | $ | | 10.22 | | $ 9.75 | | $ 9.59 |
|
| Total return | | | | 0.11% | | 4.68% | | 0.60% | | | | 8.77% | | 7.02% | | 11.25% |
|
| Ratios and supplemental data | | | | | | | | | | | | | | | | |
| Net assets, end of period (thousands) | | $437,955 | | $436,431 | | $427,356 | | $489,565 | | $327,753 | | $263,619 |
| Ratios to average net assets | | | | | | | | | | | | | | | | |
| Expenses including waivers/reimbursements | | | | | | | | | | | | | | | | |
| but excluding expense reductions | | | | 0.69%4 | | 0.70% | | 0.71% | | | | 0.70% | | 0.71% | | 0.75% |
| Expenses excluding waivers/reimbursements | | | | | | | | | | | | | | | | |
| and expense reductions | | | | 0.69%4 | | 0.70% | | 0.71% | | | | 0.70% | | 0.71% | | 0.75% |
| Net investment income (loss) | | | | 3.18%4 | | 2.69% | | 2.15% | | | | 4.02% | | 5.16% | | 5.97% |
| Portfolio turnover rate | | | | 30% | | 110% | | 55% | | | | 129% | | 121% | | 86% |
|
1 Effective at the close of business on May 11, 2001, Class Y shares were renamed as Institutional shares (Class I).
2 As required, effective May 1, 2001, the Fund adopted the provisions of the AICPA Audit and Accounting Guide, Audits of Investment Companies, and began amortizing premium on its fixed-income securities . The effects of this change for the year ended April 30, 2002 was a decrease in net investment income per share of $0.02; an increase in net realized gains or losses per share of $0.02; and a decrease to the ratio of net investment income to average net assets of 0.22%. The above per share information, ratios and supplemental data for the periods prior to May 1, 2001 have not been restated to reflect this change in presentation .
3 Net investment income (loss) per share is based on average shares outstanding during the period.
4 Annualized
See Notes to Financial Statements
10
SCHEDULE OF INVESTMENTS
October 31, 2005 (unaudited)
| | | | | Principal | | | | |
| | | | | Amount | | | | Value |
|
| AGENCY COMMERCIAL MORTGAGE-BACKED SECURITIES 1.9% | | | | | | |
| Fixed-Rate 1.9% | | | | | | | | |
| FNMA: | | | | | | | | |
| 6.18%, 06/01/2013 ## | | | | $ 4,483,570 | | $ | | 4,744,827 |
| 6.22%, 08/01/2012 ## | | | | 4,112,363 | | | | 4,356,514 |
| Ser. 2002-M1, Class C, 6.17%, 02/25/2016 | | | | 1,460,000 | | | | 1,561,908 |
| |
|
| Total Agency Commercial Mortgage-Backed Securities | | | | | | | | |
| (cost $10,929,763) | | | | | | | | 10,663,249 |
| |
|
| AGENCY MORTGAGE-BACKED COLLATERALIZED | | | | | | | | |
| MORTGAGE OBLIGATIONS 18.8% | | | | | | | | |
| Fixed-Rate 3.6% | | | | | | | | |
| FHLMC: | | | | | | | | |
| Ser. 2262, Class Z, 7.50%, 10/15/2030 | | | | 186,263 | | | | 188,961 |
| Ser. 2359, Class PC, 6.00%, 07/15/2015 | | | | 81,776 | | | | 81,811 |
| Ser. 2367, Class BC, 6.00%, 04/15/2016 | | | | 119,790 | | | | 120,357 |
| Ser. H012, Class A2, 2.50%, 11/15/2008 | | | | 2,706,116 | | | | 2,582,581 |
| Ser. SF1, Class A2, 2.38%, 11/15/2008 | | | | 879,521 | | | | 874,652 |
| FNMA, Ser. 2002-W5, Class A7, 6.25%, 08/25/2030 ## | | | | 15,755,954 | | | | 15,915,681 |
| |
|
| | | | | | | | | 19,764,043 |
| |
|
| Floating-Rate 15.2% | | | | | | | | |
| FHLMC: | | | | | | | | |
| Ser. 1370, Class JA, 5.15%, 09/15/2022 | | | | 293,842 | | | | 296,810 |
| Ser. 1498, Class I, 5.15%, 04/15/2023 | | | | 257,121 | | | | 261,006 |
| Ser. 1533, Class FA, 5.10%, 06/15/2023 | | | | 69,095 | | | | 70,478 |
| Ser. 1616, Class FB, 3.77%, 11/15/2008 ## | | | | 1,752,018 | | | | 1,747,392 |
| Ser. 1671, Class TA, 4.50%, 02/15/2024 | | | | 1,194,630 | | | | 1,201,119 |
| Ser. 2005-S001, Class 1A2, 4.19%, 09/25/2035 (h) ## | | | | 7,893,940 | | | | 7,892,706 |
| Ser. 2005-S001, Class 2A2, 4.19%, 09/25/2035 (h) ## | | | | 11,902,712 | | | | 11,900,852 |
| Ser. 2030, Class F, 4.47%, 02/15/2028 | | | | 1,307,660 | | | | 1,319,652 |
| Ser. 2181, Class PF, 4.37%, 05/15/2029 | | | | 623,669 | | | | 627,268 |
| Ser. 2380, Class FL, 4.57%, 11/15/2031 ## | | | | 5,428,792 | | | | 5,500,886 |
| Ser. 2395, Class FD, 4.57%, 05/15/2029 ## | | | | 1,939,670 | | | | 1,965,448 |
| Ser. 2481, Class FE, 4.97%, 03/15/2032 ## | | | | 3,388,728 | | | | 3,459,823 |
| Ser. 2691, Class FC, 4.67%, 10/15/2033 ## | | | | 3,546,065 | | | | 3,555,852 |
| FNMA: | | | | | | | | |
| Ser. 1993-221, Class FH, 5.16%, 12/25/2008 ## | | | | 4,095,646 | | | | 4,141,460 |
| Ser. 1997-34, Class F, 4.71%, 10/25/2023 ## | | | | 4,442,261 | | | | 4,512,760 |
| Ser. 1997-49, Class F, 4.50%, 06/17/2027 | | | | 715,636 | | | | 721,580 |
| Ser. 1999-49, Class F, 4.44%, 05/25/2018 | | | | 1,366,864 | | | | 1,374,480 |
| Ser. 2000-32, Class FM, 4.43%, 10/18/2030 | | | | 728,067 | | | | 733,859 |
| Ser. 2001-53, Class CF, 4.44%, 10/25/2031 | | | | 222,712 | | | | 223,128 |
| Ser. 2002-13, Class FE, 4.94%, 02/27/2031 | | | | 1,797,230 | | | | 1,837,866 |
| Ser. 2002-67, Class FA, 5.04%, 11/25/2032 ## | | | | 9,616,833 | | | | 9,853,022 |
| Ser. 2002-77, Class F, 4.64%, 12/25/2032 ## | | | | 8,083,575 | | | | 8,224,989 |
| Ser. 2002-77, Class FA, 4.98%, 10/18/2030 ## | | | | 9,406,764 | | | | 9,633,091 |
| Ser. G93, Class FH, 5.21%, 04/25/2023 | | | | 221,720 | | | | 227,358 |
See Notes to Financial Statements
11
SCHEDULE OF INVESTMENTS continued
October 31, 2005 (unaudited)
| | | | | Principal | | | | |
| | | | | Amount | | | | Value |
|
| AGENCY MORTGAGE-BACKED COLLATERALIZED | | | | | | | | |
| MORTGAGE OBLIGATIONS continued | | | | | | | | |
| Floating-Rate continued | | | | | | | | |
| GNMA: | | | | | | | | |
| Ser. 1999-40, Class FL, 4.57%, 02/17/2029 | | | | $ 334,395 | | $ | | 338,023 |
| Ser. 2000-36, Class FG, 4.50%, 11/20/2030 | | | | 652,867 | | | | 657,516 |
| Ser. 2001-22, Class FG, 4.32%, 05/16/2031 | | | | 972,125 | | | | 977,101 |
| Ser. 2002-15, Class F, 4.52%, 02/16/2032 | | | | 1,043,219 | | | | 1,054,334 |
| |
|
| | | | | | | | | 84,309,859 |
| |
|
| Total Agency Mortgage-Backed Collateralized Mortgage Obligations | | | | | | |
| (cost $104,200,866) | | | | | | | | 104,073,902 |
| |
|
| AGENCY MORTGAGE-BACKED PASS THROUGH SECURITIES 67.3% | | | | | | |
| Fixed-Rate 44.8% | | | | | | | | |
| FHLMC: | | | | | | | | |
| 5.50%, TBA # | | | | 90,055,000 | | | | 89,686,928 |
| 6.00%, TBA # | | | | 49,795,000 | | | | 50,292,950 |
| 6.50%, 04/01/2022 - 09/01/2028 | | | | 1,641,773 | | | | 1,690,478 |
| 7.50%, 05/01/2027 - 08/01/2028 | | | | 1,161,699 | | | | 1,231,164 |
| 8.00%, 08/01/2023 - 11/01/2028 | | | | 356,215 | | | | 380,435 |
| 9.00%, 01/01/2017 | | | | 128,050 | | | | 138,448 |
| 9.50%, 09/01/2020 | | | | 76,069 | | | | 83,441 |
| 10.50%, 12/01/2019 | | | | 233,332 | | | | 262,330 |
| FNMA: | | | | | | | | |
| 4.50%, TBA # | | | | 10,000,000 | | | | 9,671,880 |
| 5.50%, TBA # | | | | 44,900,000 | | | | 44,802,427 |
| 5.55%, 09/01/2019 | | | | 7,351,559 | | | | 7,434,999 |
| 6.00%, 02/01/2008 - 09/01/2013 | | | | 715,913 | | | | 732,790 |
| 6.50%, 01/01/2024 | | | | 210,667 | | | | 217,456 |
| 6.50%, TBA # | | | | 27,190,000 | | | | 27,912,221 |
| 7.00%, 11/01/2026 - 02/01/2032 | | | | 303,529 | | | | 317,762 |
| 7.50%, 07/01/2023 - 05/01/2027 | | | | 818,019 | | | | 865,952 |
| 8.00%, 10/01/2026 - 09/01/2028 | | | | 467,961 | | | | 500,634 |
| 8.50%, 07/01/2029 - 08/01/2029 | | | | 78,486 | | | | 85,265 |
| 9.50%, 02/01/2023 | | | | 75,219 | | | | 82,359 |
| 11.00%, 01/01/2016 | | | | 115,638 | | | | 126,380 |
| 11.25%, 02/01/2016 | | | | 145,367 | | | | 159,472 |
| GNMA: | | | | | | | | |
| 6.00%, 02/15/2009 - 08/20/2034 | | | | 7,487,857 | | | | 7,614,679 |
| 6.50%, 12/15/2025 - 09/20/2033 | | | | 1,029,353 | | | | 1,065,915 |
| 7.00%, 12/15/2022 - 05/15/2032 | | | | 948,879 | | | | 999,926 |
| 7.34%, 10/20/2021 - 09/20/2022 | | | | 712,599 | | | | 750,843 |
| 7.50%, 02/15/2022 - 06/15/2032 | | | | 813,000 | | | | 864,262 |
| 8.00%, 09/15/2009 | | | | 15,338 | | | | 16,117 |
| 10.00%, 12/15/2018 | | | | 85,697 | | | | 95,664 |
| |
|
| | | | | | | | | 248,083,177 |
| |
|
See Notes to Financial Statements
12
SCHEDULE OF INVESTMENTS continued
October 31, 2005 (unaudited)
| | | Principal | | | | |
| | | Amount | | | | Value |
|
| AGENCY MORTGAGE-BACKED PASS THROUGH SECURITIES continued | | | | | | |
| Floating-Rate 22.5% | | | | | | |
| FNMA: | | | | | | |
| 3.84%, 11/01/2033 | | $ 12,060,724 | | $ | | 12,144,033 |
| 4.00%, 07/01/2032 | | 6,433,090 | | | | 6,470,436 |
| 4.07%, 10/01/2041 ## | | 9,195,360 | | | | 9,300,369 |
| 4.11%, 06/01/2030 | | 4,804,135 | | | | 4,813,422 |
| 4.22%, 02/01/2032 - 07/01/2044 | | 30,498,422 | | | | 30,892,898 |
| 4.27%, 09/01/2041 ## | | 15,140,935 | | | | 15,336,955 |
| 4.38%, 11/01/2030 | | 903,633 | | | | 910,106 |
| 4.42%, 06/01/2040 - 01/01/2041 | | 20,123,366 | | | | 20,360,161 |
| 5.00%, 03/27/2025 # | | 5,362,639 | | | | 5,359,287 |
| SBA, 4.16%, 11/29/2029 (h) | | 8,878,274 | | | | 8,898,250 |
| SBA, 4.16%, 10/25/2029 (h) | | 9,987,110 | | | | 10,012,078 |
| |
|
| | | | | | | 124,497,995 |
| |
|
| Total Agency Mortgage-Backed Pass Through Securities | | | | | | |
| (cost $373,823,018) | | | | | | 372,581,172 |
| |
|
| AGENCY REPERFORMING MORTGAGE-BACKED PASS | | | | | | |
| THROUGH SECURITIES 4.5% | | | | | | |
| Fixed-Rate 4.5% | | | | | | |
| FNMA: | | | | | | |
| Ser. 2002-T1, Class A3, 7.50%, 11/25/2031 | | 3,747,857 | | | | 3,921,985 |
| Ser. 2002-T16, Class A1, 6.50%, 07/25/2042 | | 5,578,773 | | | | 5,697,229 |
| Ser. 2002-W3, Class A5, 7.50%, 01/25/2028 | | 704,608 | | | | 737,712 |
| Ser. 2002-W8, Class A4, 7.00%, 06/25/2017 | | 3,651,308 | | | | 3,721,449 |
| Ser. 2003-W1, Class 1A-1, 6.50%, 12/25/2042 | | 1,650,806 | | | | 1,689,985 |
| Ser. 2003-W6, Class 3A, 6.50%, 09/25/2032 ## | | 8,700,962 | | | | 8,956,422 |
| |
|
| Total Agency Reperforming Mortgage-Backed Pass Through Securities | | | | | | |
| (cost $25,475,018) | | | | | | 24,724,782 |
| |
|
| ASSET-BACKED SECURITIES 0.9% | | | | | | |
| SLMA: | | | | | | |
| Ser. 1997-4, Class A2, FRN, 4.69%, 10/25/2010 | | 2,055,483 | | | | 2,074,996 |
| Ser. 1998-1, Class A2, FRN, 4.70%, 10/25/2011 | | 2,853,252 | | | | 2,882,783 |
| |
|
| Total Asset-Backed Securities (cost $4,943,250) | | | | | | 4,957,779 |
| |
|
| COMMERCIAL MORTGAGE-BACKED SECURITIES 0.6% | | | | | | |
| Fixed-Rate 0.6% | | | | | | |
| Commercial Mtge. Pass-Through Certificates, Ser. 2001-ZC1A, Class A, 6.36%, | | | | | | |
| 06/12/2006 144A | | 3,295,030 | | | | 3,314,899 |
| LB-UBS Comml. Mtge. Trust, Ser. 2000-C4, Class A1, 7.18%, 09/15/2019 | | 193,205 | | | | 197,650 |
| Morgan Stanley Capital I, Ser. 1998-XL1, Class A2, 6.45%, 06/03/2030 | | 98,740 | | | | 98,766 |
| |
|
| Total Commercial Mortgage-Backed Securities (cost $3,614,546) | | | | | | 3,611,315 |
| |
|
See Notes to Financial Statements
13
SCHEDULE OF INVESTMENTS continued
October 31, 2005 (unaudited)
| | | Principal | | | | |
| | | Amount | | | | Value |
|
| CORPORATE BONDS 2.3% | | | | | | |
| FINANCIALS 2.3% | | | | | | |
| Capital Markets 1.6% | | | | | | |
| Goldman Sachs Capital I, 6.35%, 02/15/2034 (p) | | $ 5,000,000 | | $ | | 5,030,295 |
| JPMorgan Chase Capital XV, Ser. O, 5.875%, 03/15/2035 | | 4,000,000 | | | | 3,804,176 |
| |
|
| | | | | | | 8,834,471 |
| |
|
| Commercial Banks 0.7% | | | | | | |
| Westpac Capital Trust IV, 5.26%, 12/29/2049 144A | | 4,000,000 | | | | 3,869,412 |
| |
|
| Total Corporate Bonds (cost $13,159,783) | | | | | | 12,703,883 |
| |
|
| U.S. GOVERNMENT & AGENCY OBLIGATIONS 21.7% | | | | | | |
| FHLB: | | | | | | |
| 3.625%, 06/20/2007 - 11/14/2008 (p) | | 21,250,000 | | | | 20,785,199 |
| 3.875%, 06/15/2008 (p) | | 7,500,000 | | | | 7,356,758 |
| 4.10%, 06/13/2008 | | 5,000,000 | | | | 4,906,245 |
| 4.50%, 02/18/2015 | | 5,000,000 | | | | 4,849,195 |
| 5.125%, 03/06/2006 ## | | 14,000,000 | | | | 14,040,082 |
| FHLMC: | | | | | | |
| 2.85%, 02/23/2007 | | 8,000,000 | | | | 7,827,368 |
| 4.125%, 10/18/2010 (p) | | 12,000,000 | | | | 11,664,972 |
| 5.25%, 01/15/2006 | | 4,000,000 | | | | 4,007,576 |
| 5.50%, 07/15/2006 ## | | 8,000,000 | | | | 8,059,440 |
| 5.80%, 09/02/2008 | | 2,000,000 | | | | 2,058,436 |
| FNMA: | | | | | | |
| 4.375%, 03/15/2013 ## | | 5,000,000 | | | | 4,851,830 |
| 4.375%, 10/15/2015 (p) | | 9,500,000 | | | | 9,085,610 |
| 4.625%, 10/15/2013 (p) | | 6,000,000 | | | | 5,895,186 |
| 6.08%, 01/01/2019 ## | | 9,996,126 | | | | 10,242,230 |
| TVA, Ser. B, 4.375%, 06/15/2015 | | 5,000,000 | | | | 4,817,460 |
| |
|
| Total U.S. Government & Agency Obligations (cost $122,662,209) | | | | | | 120,447,587 |
| |
|
| U.S. TREASURY OBLIGATIONS 5.3% | | | | | | |
| U.S. Treasury Bonds, 5.375%, 02/15/2031 (p) | | 2,000,000 | | | | 2,181,876 |
| U.S. Treasury Notes: | | | | | | |
| 1.875%, 07/15/2015 (p) | | 10,090,600 | | | | 9,991,278 |
| 4.125%, 08/15/2010 (p) | | 12,500,000 | | | | 12,314,463 |
| 4.25%, 08/15/2015 (p) | | 5,000,000 | | | | 4,880,470 |
| |
|
| Total U.S. Treasury Obligations (cost $29,934,332) | | | | | | 29,368,087 |
| |
|
| WHOLE LOAN MORTGAGE-BACKED COLLATERALIZED | | | | | | |
| MORTGAGE OBLIGATIONS 2.7% | | | | | | |
| Fixed-Rate 2.7% | | | | | | |
| Countrywide Alternative Loan Trust: | | | | | | |
| Ser. 2004-1T1, Class A6, 5.75%, 02/25/2034 | | 5,000,000 | | | | 5,026,074 |
| Ser. 2005-46CB, Class A14, 5.50%, 10/25/2035 | | 10,000,000 | | | | 10,012,000 |
| |
|
| Total Whole Loan Mortgage-Backed Collateralized Mortgage Obligations | | | | | | |
| (cost $15,143,164) | | | | | | 15,038,074 |
| |
|
See Notes to Financial Statements
14
SCHEDULE OF INVESTMENTS continued
October 31, 2005 (unaudited)
| | | | | | | Principal | | | | |
| | | | | | | Amount | | | | Value |
|
| WHOLE LOAN SUBORDINATE COLLATERALIZED | | | | | | |
| MORTGAGE OBLIGATIONS 2.1% | | | | | | |
| Fixed-Rate 2.1% | | | | | | | | | | |
| Countrywide Alternative Loan Trust, Ser. 2004-2CB, Class M, 5.66%, 03/25/2034 | | | | | | |
| (cost $11,584,779) | | $ 11,619,274 | | $ | | 11,435,573 |
| |
|
| SHORT-TERM INVESTMENTS 27.3% | | | | | | |
| U.S. GOVERNMENT & AGENCY OBLIGATIONS 1.4% | | | | | | |
| FNMA 3.71%, 11/01/2005 † | | | | | | 7,766,000 | | | | 7,766,000 |
| | |
|
|
| | | | | | | Shares | | | | Value |
|
| MUTUAL FUND SHARES 25.9% | | | | | | | | |
| Evergreen Institutional Money Market Fund ø ## | | | | 60,366,120 | | | | 60,366,120 |
| Navigator Prime Portfolio (pp) | | | | | | 82,782,246 | | | | 82,782,246 |
| |
|
| | | | | | | | | | | 143,148,366 |
| |
|
| Total Short-Term Investments (cost $150,914,366) | | | | | | 150,914,366 |
| |
|
| Total Investments (cost $866,385,094) 155.4% | | | | | | 860,519,769 |
| Other Assets and Liabilities (55.4%) | | | | | | (306,884,573) |
| |
|
| Net Assets 100.0% | | | | | | | | $ | | 553,635,196 |
| |
|
| ## | | All or a portion of this security has been segregated for when-issued or delayed delivery securities. |
| (h) | | Security is valued at fair value as determined by the investment advisor in good faith, according to procedures approved |
| | | by the Board of Trustees. |
| # | | When-issued or delayed delivery security |
| 144A | | Security that may be sold to qualified institutional buyers under Rule 144A of the Securities Act of 1933, as amended. |
| | | This security has been determined to be liquid under guidelines established by the Board of Trustees, unless otherwise |
| | | noted. |
| (p) | | All or a portion of this security is on loan. |
| † | | Rate shown represents the yield to maturity at date of purchase. |
| ø | | Evergreen Investment Management Company, LLC is the investment advisor to both the Fund and the money market |
| | | fund. |
| (pp) | | Represents investment of cash collateral received from securities on loan. |
| Summary of Abbreviations |
| FHLB | | Federal Home Loan Bank |
| FHLMC | | Federal Home Loan Mortgage Corp. |
| FNMA | | Federal National Mortgage Association |
| FRN | | Floating Rate Note |
| GNMA | | Government National Mortgage Association |
| SBA | | Small Business Administration |
| SLMA | | Student Loan Marketing Association |
| TBA | | To Be Announced |
| TVA | | Tennessee Valley Authority |
See Notes to Financial Statements
15
SCHEDULE OF INVESTMENTS continued
October 31, 2005 (unaudited)
| The following table shows the percent of total investments by credit quality based on Moody’s and Standard & Poor’s ratings as |
| of October 31, 2005: | | | |
| AAA | | 95.0% | |
| AA | | 2.1% | |
| A | | 2.9% | |
| |
| |
| | | 100.0% | |
| | |
| |
| |
| The following table shows the percent of total investments by maturity as of October 31, 2005: |
| Less than 1 year | | 12.6% | |
| 1 to 3 year(s) | | 19.3% | |
| 3 to 5 years | | 23.7% | |
| 5 to 10 years | | 39.7% | |
| 10 to 20 years | | 2.1% | |
| 20 to 30 years | | 2.1% | |
| Greater than 30 years | | 0.5% | |
| |
| |
| | | 100.0% | |
| | |
| |
See Notes to Financial Statements
16
STATEMENT OF ASSETS AND LIABILITIES
October 31, 2005 (unaudited)
| Assets | | | | |
| Investments in securities, at value (cost $806,018,974) including $81,186,109 of | | | | |
| securities loaned | | $ | | 800,153,649 |
| Investments in affiliated money market fund, at value (cost $60,366,120) | | | | 60,366,120 |
|
| Total investments | | | | 860,519,769 |
| Principal paydown receivable | | | | 1,996,958 |
| Receivable for Fund shares sold | | | | 793,807 |
| Interest receivable | | | | 3,331,761 |
| Receivable for securities lending income | | | | 8,678 |
| Prepaid expenses and other assets | | | | 109,606 |
|
| Total assets | | | | 866,760,579 |
|
| Liabilities | | | | |
| Dividends payable | | | | 424,687 |
| Payable for securities purchased | | | | 229,637,217 |
| Payable for Fund shares redeemed | | | | 191,085 |
| Payable for securities on loan | | | | 82,782,246 |
| Advisory fee payable | | | | 6,142 |
| Distribution Plan expenses payable | | | | 1,188 |
| Due to other related parties | | | | 2,288 |
| Accrued expenses and other liabilities | | | | 80,530 |
|
| Total liabilities | | | | 313,125,383 |
|
| Net assets | | $ | | 553,635,196 |
|
| Net assets represented by | | | | |
| Paid-in capital | | $ | | 571,647,246 |
| Overdistributed net investment income | | | | (4,036,677) |
| Accumulated net realized losses on investments | | | | (8,110,048) |
| Net unrealized losses on investments | | | | (5,865,325) |
|
| Total net assets | | $ | | 553,635,196 |
|
| Net assets consists of | | | | |
| Class A | | $ | | 86,097,574 |
| Class B | | | | 21,145,179 |
| Class C | | | | 8,437,084 |
| Class I | | | | 437,955,359 |
|
| Total net assets | | $ | | 553,635,196 |
|
| Shares outstanding (unlimited number of shares authorized) | | | | |
| Class A | | | | 8,688,253 |
| Class B | | | | 2,133,775 |
| Class C | | | | 851,378 |
| Class I | | | | 44,194,625 |
|
| Net asset value per share | | | | |
| Class A | | $ | | 9.91 |
| Class A — Offering price (based on sales charge of 4.75%) | | $ | | 10.40 |
| Class B | | $ | | 9.91 |
| Class C | | $ | | 9.91 |
| Class I | | $ | | 9.91 |
|
See Notes to Financial Statements
17
STATEMENT OF OPERATIONS
Six Months Ended October 31, 2005 (unaudited)
| Investment income | | | | |
| Interest | | $ | | 10,273,477 |
| Income from affiliate | | | | 583,244 |
| Securities lending | | | | 70,675 |
|
| Total investment income | | | | 10,927,396 |
|
| Expenses | | | | |
| Advisory fee | | | | 1,146,735 |
| Distribution Plan expenses | | | | |
| Class A | | | | 136,059 |
| Class B | | | | 115,961 |
| Class C | | | | 46,026 |
| Administrative services fee | | | | 281,610 |
| Transfer agent fees | | | | 350,625 |
| Trustees’ fees and expenses | | | | 8,596 |
| Printing and postage expenses | | | | 22,322 |
| Custodian and accounting fees | | | | 87,412 |
| Registration and filing fees | | | | 21,571 |
| Professional fees | | | | 16,255 |
| Other | | | | 6,983 |
|
| Total expenses | | | | 2,240,155 |
| Less: Expense reductions | | | | (4,996) |
| Expense reimbursements | | | | (332) |
|
| Net expenses | | | | 2,234,827 |
|
| Net investment income | | | | 8,692,569 |
|
| Net realized and unrealized gains or losses on investments | | | | |
| Net realized losses on investments | | | | (711,364) |
| Net change in unrealized gains or losses on investments | | | | (7,471,340) |
|
| Net realized and unrealized gains or losses on investments | | | | (8,182,704) |
|
| Net increase in net assets resulting from operations | | $ | | 509,865 |
|
See Notes to Financial Statements
18
STATEMENTS OF CHANGES IN NET ASSETS
| | | Six Months Ended | | | | |
| | | October 31, 2005 | | Year Ended |
| | | (unaudited) | | April 30, 2005 |
|
| Operations | | | | | | | | |
| Net investment income | | $ | | 8,692,569 | | $ | | 14,251,284 |
| Net realized gains or losses on investments | | | | (711,364) | | | | 3,159,369 |
| Net change in unrealized gains or losses | | | | | | | | |
| on investments | | | | (7,471,340) | | | | 7,118,825 |
|
| Net increase in net assets resulting from | | | | | | | | |
| operations | | | | 509,865 | | | | 24,529,478 |
|
| Distributions to shareholders from | | | | | | | | |
| Net investment income | | | | | | | | |
| Class A | | | | (1,582,985) | | | | (2,965,158) |
| Class B | | | | (323,018) | | | | (704,088) |
| Class C | | | | (128,286) | | | | (266,828) |
| Class I | | | | (8,395,608) | | | | (13,622,059) |
|
| Total distributions to shareholders | | | | (10,429,897) | | | | (17,558,133) |
|
| | | Shares | | | | Shares | | |
| Capital share transactions | | | | | | | | |
| Proceeds from shares sold | | | | | | | | |
| Class A | | 282,661 | | 2,845,286 | | 765,453 | | 7,679,760 |
| Class B | | 55,461 | | 559,149 | | 189,529 | | 1,894,320 |
| Class C | | 21,874 | | 220,595 | | 76,240 | | 764,033 |
| Class I | | 4,141,987 | | 41,688,809 | | 9,710,308 | | 97,626,122 |
|
| | | | | 45,313,839 | | | | 107,964,235 |
|
| Net asset value of shares issued in | | | | | | | | |
| reinvestment of distributions | | | | | | | | |
| Class A | | 117,949 | | 1,185,366 | | 216,905 | | 2,178,168 |
| Class B | | 22,458 | | 225,712 | | 49,250 | | 494,475 |
| Class C | | 9,052 | | 90,974 | | 18,317 | | 183,925 |
| Class I | | 635,043 | | 6,381,102 | | 1,072,774 | | 10,774,687 |
|
| | | | | 7,883,154 | | | | 13,631,255 |
|
| Automatic conversion of Class B shares | | | | | | | | |
| to Class A shares | | | | | | | | |
| Class A | | 80,212 | | 808,666 | | 201,243 | | 2,018,070 |
| Class B | | (80,212) | | (808,666) | | (201,243) | | (2,018,070) |
|
| | | | | 0 | | | | 0 |
|
| Payment for shares redeemed | | | | | | | | |
| Class A | | (1,094,854) | | (11,016,725) | | (2,843,943) | | (28,505,120) |
| Class B | | (387,349) | | (3,896,513) | | (1,256,644) | | (12,576,689) |
| Class C | | (153,117) | | (1,540,964) | | (547,658) | | (5,485,159) |
| Class I | | (3,851,910) | | (38,716,510) | | (10,428,161) | | (104,475,823) |
|
| | | | | (55,170,712) | | | | (151,042,791) |
|
| Net decrease in net assets resulting from | | | | | | | | |
| capital share transactions | | | | (1,973,719) | | | | (29,447,301) |
|
| Total decrease in net assets | | | | (11,893,751) | | | | (22,475,956) |
| Net assets | | | | | | | | |
| Beginning of period | | | | 565,528,947 | | | | 588,004,903 |
|
| End of period | | $ 553,635,196 | | $ 565,528,947 |
|
| Overdistributed net investment income | | $ | | (4,036,677) | | $ | | (366,631) |
|
See Notes to Financial Statements
19
STATEMENT OF CASH FLOWS
Six Months Ended October 31, 2005 (unaudited)
| Increase in Cash | | | | |
| Cash Flows from Operating Activities: | | | | |
| Net increase in net assets from operations | | $ | | 509,865 |
| Adjustments to reconcile net increase in net assets from operations to net cash | | | | |
| provided by operating activities: | | | | |
| Purchase of investment securities (including mortgage dollar rolls) | | | | (1,574,261,686) |
| Proceeds from disposition of investment securities (including mortgage dollar rolls) | | | | 1,549,884,987 |
| Purchase of short-term investment securities | | | | 58,660,412 |
| Decrease in interest receivable | | | | 332,603 |
| Decrease in receivable for securities sold | | | | 49,167,815 |
| Decrease in receivable for Fund shares sold | | | | 722,567 |
| Increase in other assets | | | | (17,639) |
| Decrease in payable for securities purchased | | | | (80,701,354) |
| Decrease in payable for Fund shares redeemed | | | | (34,361) |
| Decrease in accrued expenses | | | | (78,800) |
| Unrealized depreciation on investments | | | | 7,471,340 |
| Net realized loss from investments | | | | 711,364 |
|
| Net cash provided by operating activities | | | | 12,367,113 |
|
| Cash Flows from Financing Activities: | | | | |
| Decrease in additional paid-in capital | | | | (9,856,873) |
| Cash distributions paid | | | | (2,510,240) |
|
| Net cash used in financing activities | | | | (12,367,113) |
|
| Net increase in cash | | $ | | 0 |
|
| Cash: | | | | |
| Beginning of period | | $ | | 0 |
|
| End of period | | $ | | 0 |
|
See Notes to Financial Statements
20
NOTES TO FINANCIAL STATEMENTS (unaudited)
1. ORGANIZATION
Evergreen U.S. Government Fund (the “Fund”) is a diversified series of Evergreen Fixed Income Trust (the “Trust”), a Delaware statutory trust organized on September 18, 1997. The Trust is an open-end management investment company registered under the Investment Company Act of 1940, as amended (the “1940 Act”).
The Fund offers Class A, Class B, Class C and Institutional (“Class I”) shares. Class A shares are sold with a front-end sales charge. However, Class A share investments of $1 million or more are not subject to a front-end sales charge but will be subject to a contingent deferred sales charge of 1.00% upon redemption within one year. Class B shares are sold without a front-end sales charge but are subject to a contingent deferred sales charge that is payable upon redemption and decreases depending on how long the shares have been held. Class C shares are sold without a front-end sales charge but are subject to a contingent deferred sales charge that is payable upon redemption within one year. Class I shares are sold without a front-end sales charge or contingent deferred sales charge. Each class of shares, except Class I shares, pays an ongoing distribution fee.
2. SIGNIFICANT ACCOUNTING POLICIES
The following is a summary of significant accounting policies consistently followed by the Fund in the preparation of its financial statements. The policies are in conformity with generally accepted accounting principles in the United States of America, which require management to make estimates and assumptions that affect amounts reported herein. Actual results could differ from these estimates.
a. Valuation of investments
Portfolio debt securities acquired with more than 60 days to maturity are fair valued using matrix pricing methods determined by an independent pricing service which takes into consideration such factors as similar security prices, yields, maturities, liquidity and ratings. Securities for which valuations are not readily available from an independent pricing service may be valued by brokers which use prices provided by market makers or estimates of market value obtained from yield data relating to investments or securities with similar characteristics.
Short-term securities with remaining maturities of 60 days or less at the time of purchase are valued at amortized cost, which approximates market value.
Investments in other mutual funds are valued at net asset value. Securities for which market quotations are not readily available or not reflective of current market value are valued at fair value as determined by the investment advisor in good faith, according to procedures approved by the Board of Trustees.
b. When-issued and delayed delivery transactions
The Fund records when-issued or delayed delivery securities as of trade date and maintains security positions such that sufficient liquid assets will be available to make payment for the securities purchased. Securities purchased on a when-issued or delayed delivery basis are marked-to-market daily and begin earning interest on the settlement date. Losses may occur on these transactions due to changes in market conditions or the failure of counterparties to perform under the contract.
21
NOTES TO FINANCIAL STATEMENTS (unaudited) continued
c. Securities lending
The Fund may lend its securities to certain qualified brokers in order to earn additional income. The Fund receives compensation in the form of fees or interest earned on the investment of any cash collateral received. The Fund also continues to receive interest and dividends on the securities loaned. The Fund receives collateral in the form of cash or securities with a market value at least equal to the market value of the securities on loan, including accrued interest. In the event of default or bankruptcy by the borrower, the Fund could experience delays and costs in recovering the loaned securities or in gaining access to the collateral. The Fund has the right under the lending agreement to recover the securities from the borrower on demand.
d. Dollar roll transactions
The Fund may enter into dollar roll transactions with respect to mortgage-backed securities. In a dollar roll transaction, the Fund sells mortgage-backed securities to financial institutions and simultaneously agrees to accept substantially similar (same type, coupon and maturity) securities at a later date at an agreed upon price. The Fund will use the proceeds generated from the transactions to invest in short-term investments, which may enhance the Fund’s current yield and total return. The Fund accounts for dollar roll transactions as purchases and sales. The Fund could be exposed to risks if the counterparty defaults on its obligation to perform under the terms of the agreement, if the Fund receives inferior securities in comparison to what was sold to the coun-terparty at redelivery or if there are variances in paydown speed between the mortgage-related pools.
e. Security transactions and investment income
Security transactions are recorded on trade date. Realized gains and losses are computed using the specific cost of the security sold. Interest income is recorded on the accrual basis and includes accretion of discounts and amortization of premiums.
f. Federal taxes
The Fund intends to continue to qualify as a regulated investment company and distribute all of its taxable income, including any net capital gains (which have already been offset by available capital loss carryovers). Accordingly, no provision for federal taxes is required.
g. Distributions
Distributions to shareholders from net investment income are accrued daily and paid monthly. Distributions from net realized gains, if any, are recorded on the ex-dividend date. Such distributions are determined in conformity with income tax regulations, which may differ from generally accepted accounting principles.
h. Class allocations
Income, common expenses and realized and unrealized gains and losses are allocated to the classes based on the relative net assets of each class. Distribution fees, if any, are calculated daily at the class level based on the appropriate net assets of each class and the specific expense rates applicable to each class.
22
NOTES TO FINANCIAL STATEMENTS (unaudited) continued
3. ADVISORY FEE AND OTHER TRANSACTIONS WITH AFFILIATES
Evergreen Investment Management Company, LLC (“EIMC”), an indirect, wholly-owned subsidiary of Wachovia Corporation (“Wachovia”), is the investment advisor to the Fund and is paid an annual fee starting at 0.42% and declining to 0.35% as average daily net assets increase.
From time to time, EIMC may voluntarily or contractually waive its fee and/or reimburse expenses in order to limit operating expenses. During the six months ended October 31, 2005, EIMC reimbursed Distribution Plan expenses (see Note 4) relating to Class A shares in the amount of $332.
Evergreen Investment Services, Inc. (“EIS”), an indirect, wholly-owned subsidiary of Wachovia, is the administrator to the Fund. As administrator, EIS provides the Fund with facilities, equipment and personnel and is paid an annual rate determined by applying percentage rates to the aggregate average daily net assets of the Evergreen funds (excluding money market funds), starting at 0.10% and declining to 0.05% as the aggregate average daily net assets of the Evergreen funds (excluding money market funds) increase.
Evergreen Service Company, LLC (“ESC”), an indirect, wholly-owned subsidiary of Wachovia, is the transfer and dividend disbursing agent for the Fund. ESC receives account fees that vary based on the type of account held by the shareholders in the Fund. For the six months ended October 31, 2005, the transfer agent fees were equivalent to an annual rate of 0.12% of the Fund’s average daily net assets.
4. DISTRIBUTION PLANS
EIS also serves as distributor of the Fund’s shares. The Fund has adopted Distribution Plans, as allowed by Rule 12b-1 of the 1940 Act, for each class of shares, except Class I. Under the Distribution Plans, distribution fees are paid at an annual rate of 0.30% of the average daily net assets for Class A shares and 1.00% of the average daily net assets for each of Class B and Class C shares.
For the six months ended October 31, 2005, EIS received $1,064 from the sale of Class A shares and $35,094 and $1,116 in contingent deferred sales charges from redemptions of Class B and Class C shares, respectively.
5. SECURITIES TRANSACTIONS
Cost of purchases and proceeds from sales of investment securities (excluding short-term securities and mortgage dollar roll transactions) were as follows for the six months ended October 31, 2005:
| Cost of Purchases | | Proceeds from Sales |
|
| U.S. | | Non-U.S. | | U.S. | | Non-U.S. |
| Government | | Government | | Government | | Government |
|
| $ 287,081,103 | | $ 30,008,203 | | $ 198,632,355 | | $ 21,712,462 |
|
23
NOTES TO FINANCIAL STATEMENTS (unaudited) continued
During the six months ended October 31, 2005, the Fund loaned securities to certain brokers. At October 31, 2005, the value of securities on loan and the value of collateral (including accrued interest) amounted to $81,186,109 and $82,782,246, respectively.
On October 31, 2005, the aggregate cost of securities for federal income tax purposes was $868,404,643. The gross unrealized appreciation and depreciation on securities based on tax cost was $513,586 and $8,398,460, respectively, with a net unrealized depreciation of $7,884,874.
As of April 30, 2005, the Fund had $6,570,885 in capital loss carryovers for federal income tax purposes expiring as follows:
| Expiration |
|
| 2007 | | 2008 | | | | 2009 | | 2010 |
|
| $ 1,278,383 | | $ 4,853,705 | | | | $ 437,595 | | $ 1,202 |
|
For income tax purposes, capital losses incurred after October 31 within the Fund’s fiscal year are deemed to arise on the first business day of the following fiscal year. As of April 30, 2005, the Fund incurred and elected to defer post-October losses of $737,596.
6. INTERFUND LENDING
Pursuant to an Exemptive Order issued by the SEC, the Fund may participate in an interfund lending program with certain funds in the Evergreen fund family. This program allows the Fund to borrow from, or lend money to, other participating funds. During the six months ended October 31, 2005, the Fund did not participate in the interfund lending program.
7. EXPENSE REDUCTIONS
Through expense offset arrangements with ESC and the Fund’s custodian, a portion of fund expenses has been reduced.
8. DEFERRED TRUSTEES’ FEES
Each Trustee of the Fund may defer any or all compensation related to performance of their duties as Trustees. The Trustees’ deferred balances are allocated to deferral accounts, which are included in the accrued expenses for the Fund. The investment performance of the deferral accounts is based on the investment performance of certain Evergreen funds. Any gains earned or losses incurred in the deferral accounts are reported in the Fund’s Trustees’ fees and expenses. At the election of the Trustees, the deferral account will be paid either in one lump sum or in quarterly installments for up to ten years.
9. FINANCING AGREEMENT
The Fund and certain other Evergreen funds share in a $150 million unsecured revolving credit commitment for temporary and emergency purposes, including the funding of redemptions, as permitted by each participating fund’s borrowing restrictions. Borrowings under this facility bear interest at 0.50% per annum above the Federal Funds rate. All of the participating funds are
24
NOTES TO FINANCIAL STATEMENTS (unaudited) continued
charged an annual commitment fee of 0.09% of the unused balance, which is allocated pro rata. During the six months ended October 31, 2005, the Fund had no borrowings under this agreement.
10. REGULATORY MATTERS AND LEGAL PROCEEDINGS
Since September 2003, governmental and self-regulatory authorities have instituted numerous ongoing investigations of various practices in the mutual fund industry, including investigations relating to revenue sharing, market-timing, late trading and record retention, among other things. The investigations cover investment advisors, distributors and transfer agents to mutual funds, as well as other firms. EIMC, EIS and ESC (collectively, “Evergreen”) have received subpoenas and other requests for documents and testimony relating to these investigations, are endeavoring to comply with those requests, and are cooperating with the investigations. Evergreen is continuing its own internal review of policies, practices, procedures and personnel, and is taking remedial action where appropriate.
In connection with one of these investigations, on July 28, 2004, the staff of the Securities and Exchange Commission (“SEC”) informed Evergreen that the staff intends to recommend to the SEC that it institute an enforcement action against Evergreen. The SEC staff’s proposed allegations relate to (i) an arrangement pursuant to which a broker at one of EIMC’s affiliated broker-dealers had been authorized, apparently by an EIMC officer (no longer with EIMC), to engage in short-term trading, on behalf of a client, in Evergreen Mid Cap Growth Fund (formerly Evergreen Emerging Growth Fund and prior to that, known as Evergreen Small Company Growth Fund) during the period from December 2000 through April 2003, in excess of the limitations set forth in the fund’s prospectus, (ii) short-term trading from September 2001 through January 2003, by a former Evergreen portfolio manager, of Evergreen Precious Metals Fund, a fund he managed at the time, (iii) the sufficiency of systems for monitoring exchanges and enforcing exchange limitations as stated in the fund’s prospectuses, and (iv) the adequacy of e-mail retention practices. In connection with the activity in Evergreen Mid Cap Growth Fund, EIMC reimbursed the fund $378,905, plus an additional $25,242, representing what EIMC calculated at that time to be the client’s net gain and the fees earned by EIMC and the expenses incurred by this fund on the client’s account. In connection with the activity in Evergreen Precious Metals Fund, EIMC reimbursed the fund $70,878, plus an additional $3,075, representing what EIMC calculated at that time to be the portfolio manager’s net gain and the fees earned by EIMC and expenses incurred by the fund on the portfolio manager’s account. Evergreen is currently engaged in discussions with the staff of the SEC concerning its recommendation.
The staff of the National Association of Securities Dealers (“NASD”) had notified EIS that it has made a preliminary determination to recommend that disciplinary action be brought against EIS for certain violations of the NASD’s rules. The recommendation relates principally to allegations that EIS (i) arranged for fund portfolio trades to be directed to broker-dealers (including Wachovia Securities, LLC, an affiliate of EIS) that sold Evergreen fund shares during the period
25
NOTES TO FINANCIAL STATEMENTS (unaudited) continued
of January 2001 to December 2003 and (ii) provided non-cash compensation by sponsoring offsite meetings attended by Wachovia Securities, LLC brokers during that period. EIS is cooperating with the NASD staff in its review of these matters.
Any resolution of these matters with regulatory authorities may include, but not be limited to, sanctions, penalties or injunctions regarding Evergreen, restitution to mutual fund shareholders and/or other financial penalties and structural changes in the governance or management of Evergreen’s mutual fund business. Any penalties or restitution will be paid by Evergreen and not by the Evergreen funds.
In addition, the Evergreen funds and EIMC and certain of its affiliates are involved in various legal actions, including private litigation and class action lawsuits. EIMC does not expect that any of such legal actions currently pending or threatened will have a material adverse impact on the financial position or operations of any of the Evergreen funds or on EIMC’s ability to provide services to the Evergreen funds.
Although Evergreen believes that neither the foregoing investigations nor any pending or threatened legal actions will have a material adverse impact on the Evergreen funds, there can be no assurance that these matters and any publicity surrounding or resulting from them will not result in reduced sales or increased redemptions of Evergreen fund shares, which could increase Evergreen fund transaction costs or operating expenses, or have other adverse consequences on the Evergreen funds.
26
ADDITIONAL INFORMATION (unaudited)
INFORMATION ABOUT THE REVIEW AND APPROVAL OF THE FUND’S INVESTMENT
ADVISORY AGREEMENT
Each year, the Fund’s Board of Trustees is required to consider whether to continue in place the Fund’s investment advisory agreement. In September 2005, the Trustees, including a majority of the Trustees who are not interested persons (as that term is defined in the 1940 Act) of the Fund or of EIMC, approved the continuation of the Fund’s investment advisory agreement.
At the same time, the Trustees considered the continuation of the investment advisory agreements for all of the Evergreen funds, and the description below refers in many cases to the Trustees’ process and conclusions in connection with their consideration of this matter for all of the Evergreen funds. In all of its deliberations, the Board of Trustees and the disinterested Trustees were advised by independent counsel to the disinterested Trustees and counsel to the Funds.
The review process. The 1940 Act requires that the Board of Trustees request and evaluate, and that EIMC furnish, such information as may reasonably be necessary to evaluate the terms of the Fund’s advisory agreement. The review process began formally in spring 2005, when a committee of the Board (the “Committee”), working with EIMC management, determined generally the types of information the Board would review and set a timeline for the review process. In late spring, counsel to the disinterested Trustees sent to EIMC a formal request for information to be furnished to the Trustees. In addition, the independent data provider Lipper Inc. (“Lipper”) was engaged to provide Fund-specific and industry-wide data to the Board containing information of a nature and in a format generally prescribed by the Committee.
The Trustees reviewed EIMC’s responses to the request for information, with the assistance of counsel for the disinterested Trustees and for the Funds and an independent industry consultant retained by the disinterested Trustees, and requested and received additional information following that review. The Committee met in person with the representatives of EIMC in early September. At a meeting of the full Board of Trustees later in September, the Committee reported the results of its discussions with EIMC, and the full Board met with representatives of EIMC, engaged in further review of the materials provided to them, and approved the continuation of each of the advisory and sub-advisory agreements.
The disinterested Trustees discussed the continuation of the Fund’s advisory agreement with representatives of EIMC and in multiple private sessions with legal counsel at which no personnel of EIMC were present. In considering the continuation of the agreement, the Trustees did not identify any particular information or consideration that was all-important or controlling, and each Trustee attributed different weights to various factors. The Trustees evaluated information provided to them both in terms of the Evergreen mutual funds generally and in respect of the Fund specifically as they considered appropriate; although the Trustees considered the continuation of the agreement as part of the larger process of considering the continuation of the advisory contracts for all of the Evergreen funds, their determination to continue the advisory agreement for each of the funds was ultimately made on a fund-by-fund basis.
27
ADDITIONAL INFORMATION (unaudited) continued
This summary describes the most important, but not necessarily all, of the factors considered by the Board and the disinterested Trustees.
Information reviewed. The Board of Trustees and committees of the Board of Trustees meet periodically during the course of the year. At those meetings, the Board receives a wide variety of information regarding the services performed by EIMC, the investment performance of the Fund and the other Evergreen funds, and other aspects of the business and operations of the funds. At those meetings, and in the process of considering the continuation of the agreements, the Trustees considered information regarding, for example, the Fund’s investment results; the portfolio management team for the Fund and the experience of the members of that team, and any recent changes in the membership of the team; portfolio trading practices; compliance by the Fund and EIMC with applicable laws and regulations and with the Fund’s and EIMC’s compliance policies and procedures; services provided by affiliates of EIMC to the Fund and shareholders of the Fund; and other information relating to the nature, extent, and quality of services provided by EIMC. The Trustees considered the rates at which the Fund pays investment advisory fees, the total expense ratio of the Fund, and the efforts generally by EIMC and its affiliates as sponsors of the Fund. The data provided by Lipper showed the fees paid by the Fund and the Fund’s total expense ratio in comparison to other similar mutual funds, in addition to data regarding the investment performance by the funds in comparison to other similar mutual funds. The Trustees were assisted by the independent industry consultant in reviewing the information presented to them.
The Board also considered that EIS serves as administrator to the Fund and receives a fee for its services as administrator. In their comparison of the advisory fee paid by the Fund with those paid by other mutual funds, the Board took into account administrative fees paid by the Fund and those other mutual funds. The Board considered that affiliates of EIMC serve as transfer agent and distributor to the Fund and receive fees from the Fund for those services, and received information regarding recent reductions in the transfer agency fees paid by the Fund. They considered other so-called “fall-out” benefits to EIMC and its affiliates due to their other relationships with the Evergreen funds, including, for example, soft-dollar services received by EIMC attributable to transactions entered into by EIMC for the benefit of the funds and brokerage commissions received by Wachovia Securities LLC, an affiliate of EIMC, from transactions effected by it for the funds.
Nature and quality of the services provided. The Trustees considered that EIMC and its affili-ates provide a comprehensive investment management service to the Fund. They noted that EIMC formulates and implements an investment program for the Fund. They noted that EIMC makes its personnel available to serve as officers of the Evergreen funds, and concluded that the reporting and management functions provided by EIMC with respect to the Fund and the Evergreen funds overall were generally satisfactory. The Trustees considered the investment philosophy of the Fund’s portfolio management team, and considered the in-house research capabilities of EIMC and its affiliates, as well as other resources available to EIMC, including research services available to it from third parties. The Board considered the managerial and financial
28
ADDITIONAL INFORMATION (unaudited) continued
resources available to EIMC, and the commitment that the Wachovia organization has made to the Fund and the Evergreen funds generally. On the basis of these factors, they determined that the nature and scope of the services provided by EIMC were consistent with their duties under the investment advisory agreements and appropriate and consistent with the investment programs and best interests of the Fund.
The Trustees noted the commitment and resources EIMC and its affiliates have committed to the regulatory, compliance, accounting, tax and tax reporting, and shareholder servicing functions, and the number and quality of staff committed to those functions, which they concluded were appropriate and generally in line with EIMC’s responsibilities to the Fund and to the Evergreen funds generally. They noted that EIMC had enhanced a number of these functions in recent periods and continued to do so, in light of regulatory developments in the investment management and mutual fund industries generally and in light of regulatory matters involving EIMC and its affiliates. They concluded that those enhancements appeared generally appropriate, but considered that the enhancement process is an on-going one and determined to continue to monitor developments in these functions in coming periods for appropriateness and consistency with regulatory and industry developments. The Board and the disinterested Trustees concluded, within the context of their overall conclusions regarding the Fund’s advisory agreement, that they were satisfied with the nature, extent, and quality of the services provided by EIMC, including services provided by EIS under its administrative services agreement with the Fund.
Investment performance. The Trustees considered the investment performance of each of the Evergreen funds, both by comparison to other comparable mutual funds and to broad market indices. The Trustees emphasized that the continuation of the investment advisory agreement for a fund should not be taken as any indication that the Trustees did not believe investment performance for any specific fund might not be improved, and they noted that they would continue to monitor closely the investment performance of the funds going forward. Specifically with respect to the Fund, the Trustees noted that the Class A shares of the Fund performed in the second quin-tile over the recently completed one-year period and performed in the third quintile over recently completed three- and five-year periods.
Advisory and administrative fees. The Trustees recognized that EIMC does not seek to provide the lowest cost investment advisory service, but to provide a high quality, full-service investment management product at a reasonable price. They also noted that EIMC has generally attempted to make its investment advisory fees consistent with industry norms. The Trustees noted that, from the materials presented, it appeared that the combination of investment advisory and administrative fees paid by the Fund to EIMC and EIS with respect to Class A shares was below the median of fees paid by comparable funds.
The Trustees noted that EIMC does not provide services to other clients using the same investment strategy as it uses in managing the Fund.
Economies of scale. The Trustees noted that economies of scale would likely be achieved by EIMC in managing the Evergreen funds as the funds grow. The Trustees noted that the Fund had implemented breakpoints in its advisory fee structure. The Trustees undertook to continue to
29
ADDITIONAL INFORMATION (unaudited) continued
review the appropriate levels of breakpoints in the future, but concluded that the breakpoints as implemented appeared to be a reasonable step toward the realization of economies of scale by the funds.
Profitability. The Trustees considered information provided to them regarding the profitability to the EIMC organization of the investment advisory, administration, and transfer agency fees paid to EIMC and its affiliates by each of the funds. They considered that the information provided to them was necessarily estimated. They noted that the levels of profitability of the funds to EIMC varied widely, depending on among other things the size and type of Fund. They noted that all of the estimates provided to them were calculated on a pre-tax basis. They considered the profitability of the funds in light of such factors as, for example, the information they had received regarding the relation of the fees paid by the funds to those paid by other mutual funds, the investment performance of the funds, and the amount of revenues involved. In light of these factors, the Trustees did not consider that the profitability of any of the funds, individually or in the aggregate, was such as to prevent their approving the continuation of the agreements.
In connection with their review of the Fund’s investment advisory and administrative fees, the Trustees also considered the transfer agency fees paid by the funds to an affiliate of EIMC. They reviewed information presented to them showing generally that the transfer agency fees charged to the funds were generally consistent with industry norms, and that transfer agency fees for a number of funds had recently declined, or were expected to in the near future.
30
This page left intentionally blank
31
TRUSTEES AND OFFICERS
TRUSTEES1
| Charles A. Austin III | | Principal occupations: Investment Counselor, Anchor Capital Advisors, Inc. (investment advice); |
| Trustee | | Director, The Andover Companies (insurance); Trustee, Arthritis Foundation of New England; |
| DOB: 10/23/1934 | | Former Director, The Francis Ouimet Society; Former Director, Health Development Corp. |
| Term of office since: 1991 | | (fitness-wellness centers); Former Director, Mentor Income Fund, Inc.; Former Trustee, |
| | | Mentor Funds and Cash Resource Trust; Former Investment Counselor, Appleton Partners, Inc. |
| Other directorships: None | | (investment advice); Former Director, Executive Vice President and Treasurer, State Street |
| | | Research & Management Company (investment advice) |
|
| Shirley L. Fulton | | Principal occupations: Partner, Tin, Fulton, Greene & Owen, PLLC (law firm); Former Partner, |
| Trustee | | Helms, Henderson & Fulton, P.A. (law firm); Retired Senior Resident Superior Court Judge, |
| DOB: 1/10/1952 | | 26th Judicial District, Charlotte, NC |
| Term of office since: 2004 | | |
| Other directorships: None | | |
|
| K. Dun Gifford | | Principal occupations: Chairman and President, Oldways Preservation and Exchange Trust |
| Trustee | | (education); Trustee, Treasurer and Chairman of the Finance Committee, Cambridge College; |
| DOB: 10/23/1938 | | Former Chairman of the Board, Director, and Executive Vice President, The London Harness |
| Term of office since: 1974 | | Company (leather goods purveyor); Former Director, Mentor Income Fund, Inc.; Former Trustee, |
| | | Mentor Funds and Cash Resource Trust |
| Other directorships: None | | |
|
| Dr. Leroy Keith, Jr. | | Principal occupations: Partner, Stonington Partners, Inc. (private equity firm); Trustee, |
| Trustee | | The Phoenix Group of Mutual Funds; Director, Obagi Medical Products Co.; Director, |
| DOB: 2/14/1939 | | Diversapack Co.; Former Director, Lincoln Educational Services; Former Chairman of the Board |
| Term of office since: 1983 | | and Chief Executive Officer, Carson Products Company (manufacturing); Former Director, |
| | | Mentor Income Fund, Inc.; Former Trustee, Mentor Funds and Cash Resource Trust |
| Other directorships: Trustee, The | | |
| Phoenix Group of Mutual Funds | | |
|
| Gerald M. McDonnell | | Principal occupations: Manager of Commercial Operations, SMI Steel Co. – South Carolina |
| Trustee | | (steel producer); Former Sales and Marketing Manager, Nucor Steel Company; Former Director, |
| DOB: 7/14/1939 | | Mentor Income Fund, Inc.; Former Trustee, Mentor Funds and Cash Resource Trust |
| Term of office since: 1988 | | |
| Other directorships: None | | |
|
| William Walt Pettit | | Principal occupations: Vice President, Kellam & Pettit, P.A. (law firm); Director, Superior |
| Trustee | | Packaging Corp.; Director, National Kidney Foundation of North Carolina, Inc.; Former Director, |
| DOB: 8/26/1955 | | Mentor Income Fund, Inc.; Former Trustee, Mentor Funds and Cash Resource Trust |
| Term of office since: 1984 | | |
| Other directorships: None | | |
|
| David M. Richardson | | Principal occupations: President, Richardson, Runden LLC (executive recruitment business |
| Trustee | | development/consulting company); Consultant, Kennedy Information, Inc. (executive |
| DOB: 9/19/1941 | | recruitment information and research company); Consultant, AESC (The Association of |
| Term of office since: 1982 | | Executive Search Consultants); Director, J&M Cumming Paper Co. (paper merchandising); |
| | | Former Trustee, NDI Technologies, LLP (communications); Former Vice Chairman, DHR |
| Other directorships: None | | International, Inc. (executive recruitment); Former Director, Mentor Income Fund, Inc.; |
| | | Former Trustee, Mentor Funds and Cash Resource Trust |
|
| Dr. Russell A. Salton III | | Principal occupations: President/CEO, AccessOne MedCard; Former Medical Director, |
| Trustee | | Healthcare Resource Associates, Inc.; Former Medical Director, U.S. Health Care/Aetna Health |
| DOB: 6/2/1947 | | Services; Former Director, Mentor Income Fund, Inc.; Former Trustee, Mentor Funds and |
| Term of office since: 1984 | | Cash Resource Trust |
| Other directorships: None | | |
|
32
TRUSTEES AND OFFICERS continued
| Michael S. Scofield | | Principal occupations: Director and Chairman, Branded Media Corporation (multi-media |
| Trustee | | branding company); Attorney, Law Offices of Michael S. Scofield; Former Director, Mentor |
| DOB: 2/20/1943 | | Income Fund, Inc.; Former Trustee, Mentor Funds and Cash Resource Trust |
| Term of office since: 1984 | | |
| Other directorships: None | | |
|
| Richard J. Shima | | Principal occupations: Independent Consultant; Director, Trust Company of CT; Trustee, |
| Trustee | | Saint Joseph College (CT); Director, Hartford Hospital; Trustee, Greater Hartford YMCA; |
| DOB: 8/11/1939 | | Former Director, Enhance Financial Services, Inc.; Former Director, Old State House Association; |
| Term of office since: 1993 | | Former Director of CTG Resources, Inc. (natural gas); Former Director, Mentor Income Fund, Inc.; |
| Other directorships: None | | Former Trustee, Mentor Funds and Cash Resource Trust |
|
| Richard K. Wagoner, CFA2 | | Principal occupations: Member and Former President, North Carolina Securities Traders |
| Trustee | | Association; Member, Financial Analysts Society; Former Consultant to the Boards of Trustees |
| DOB: 12/12/1937 | | of the Evergreen funds; Former Trustee, Mentor Funds and Cash Resource Trust |
| Term of office since: 1999 | | |
| Other directorships: None | | |
|
| OFFICERS | | |
| Dennis H. Ferro3 | | Principal occupations: President and Chief Executive Officer, Evergreen Investment Company, |
| President | | Inc. and Executive Vice President, Wachovia Bank, N.A.; former Chief Investment Officer, |
| DOB: 6/20/1945 | | Evergreen Investment Company, Inc. |
| Term of office since: 2003 | | |
|
| Kasey Phillips4 | | Principal occupations: Senior Vice President, Evergreen Investment Services, Inc.; Former Vice |
| Treasurer | | President, Evergreen Investment Services, Inc.; Former Assistant Vice President, Evergreen |
| DOB: 12/12/1970 | | Investment Services, Inc. |
| Term of office since: 2005 | | |
|
| Michael H. Koonce4 | | Principal occupations: Senior Vice President and General Counsel, Evergreen Investment |
| Secretary | | Services, Inc.; Senior Vice President and Assistant General Counsel, Wachovia Corporation |
| DOB: 4/20/1960 | | |
| Term of office since: 2000 | | |
|
| James Angelos4 | | Principal occupations: Chief Compliance Officer and Senior Vice President, Evergreen Funds; |
| Chief Compliance Officer | | Former Director of Compliance, Evergreen Investment Services, Inc. |
| DOB: 9/2/1947 | | |
| Term of office since: 2004 | | |
|
1 Each Trustee serves until a successor is duly elected or qualified or until his/her death, resignation, retirement or removal from office. Each Trustee oversees 89 Evergreen funds. Correspondence for each Trustee may be sent to Evergreen Board of Trustees, P.O. Box 20083, Charlotte, NC 28202.
2 Mr. Wagoner is an “interested person” of the Fund because of his ownership of shares in Wachovia Corporation, the parent to the Fund’s investment advisor.
3 The address of the Officer is 401 S. Tryon Street, 20th Floor, Charlotte, NC 28288.
4 The address of the Officer is 200 Berkeley Street, Boston, MA 02116.
Additional information about the Fund’s Board of Trustees and Officers can be found in the Statement of Additional Information (SAI) and is available upon request without charge by calling 800.343.2898.
33
564359 rv3 12/2005
Item 2 - Code of Ethics
Not required for this semi-annual filing.
Item 3 - Audit Committee Financial Expert
Not required for this semi-annual filing.
Items 4 – Principal Accountant Fees and Services
Not required for this semi-annual filing.
Items 5 – Audit Committee of Listed Registrants
Not applicable.
Item 6 – Schedule of Investments
Please see schedule of investments contained in the Report to Stockholders included under Item 1 of this Form N-CSR.
Item 7 – Disclosure of Proxy Voting Policies and Procedures for Closed-End Management Investment Companies.
Not applicable.
Item 8 – Portfolio Managers of Closed-End Management Investment Companies.
Not applicable.
Item 9 – Purchases of Equity Securities by Closed-End Management Investment Company and Affiliated Purchasers.
Not applicable.
Item 10 – Submission of Matters to a Vote of Security Holders
There have been no material changes to the procedures by which shareholders may recommend nominees to the Registrant’s board of trustees that have been implemented since the Registrant last provided disclosure in response to the requirements of this Item.
Item 11 - Controls and Procedures
(a) The Registrant's principal executive officer and principal financial officer have evaluated the Registrant's disclosure controls and procedures (as defined in Rule 30a-3(c) under the Investment Company Act of 1940) within 90 days of this filing and have concluded that the Registrant's disclosure controls and procedures were effective, as of that date, in ensuring that information required to be disclosed by the Registrant in this Form N-CSR was recorded, processed, summarized, and reported timely.
(b) There has been no changes in the Registrant's internal controls over financial reporting (as defined in Rule 30a-3(d) under the Investment Company Act of 1940) that occurred during the second fiscal quarter of the period covered by this report that has materially affected, or is reasonable likely to affect, the Registrant’s internal control over financial reporting .
Item 12 - Exhibits
File the exhibits listed below as part of this Form. Letter or number the exhibits in the sequence indicated.
(a) Any code of ethics, or amendment thereto, that is the subject of the disclosure required by Item 2, to the extent that the Registrant intends to satisfy the Item 2 requirements through filing of an exhibit.
(b)(1) Separate certifications for the Registrant's principal executive officer and principal financial officer, as required by Section 302 of the Sarbanes-Oxley Act of 2002 and Rule 30a-2(a) under the Investment Company Act of 1940, are attached as EX99.CERT.
(b)(2) Separate certifications for the Registrant's principal executive officer and principal financial officer, as required by Section 1350 of Title 18 of United States Code, as adopted pursuant to Section 906 of the Sarbanes-Oxley Act of 2002, and Rule 30a-2(b) under the Investment Company Act of 1940, are attached as EX99.906CERT. The certifications furnished pursuant to this paragraph are not deemed to be "filed" for purposes of Section 18 of the Securities Exchange Act of 1934, or otherwise subject to the liability of that section. Such certifications are not deemed to be incorporated by reference into any filing under the Securities Act of 1933 or the Securities Exchange Act of 1934, except to the extent that the Registrant specifically incorporates them by reference.
Pursuant to the requirements of the Securities Exchange Act of 1934 and the Investment Company Act of 1940, the Registrant has duly caused this report to be signed on its behalf by the undersigned, thereunto duly authorized.
Evergreen Fixed Income Trust
By: _______________________
Dennis H. Ferro,
Principal Executive Officer
Date: October 28, 2005
Pursuant to the requirements of the Securities Exchange Act of 1934 and the Investment Company Act of 1940, this report has been signed below by the following persons on behalf of the Registrant and in the capacities and on the dates indicated.
By: _______________________
Dennis H. Ferro,
Principal Executive Officer
Date: October 28, 2005
By: ________________________
Kasey Phillips
Principal Financial Officer
Date: October 28, 2005