| OMB APPROVAL |
OMB Number: 3235-0570 Expires: September 30, 2007 Estimated average burden hours per response: 19.4 |
UNITED STATES
SECURITIES AND EXCHANGE COMMISSION
Washington, D.C. 20549
FORM N-CSRS
CERTIFIED SHAREHOLDER REPORT OF REGISTERED MANAGEMENT INVESTMENT COMPANIES
Investment Company Act file number 811-08415
[Evergreen Fixed Income Trust]
_____________________________________________________________
(Exact name of registrant as specified in charter)
200 Berkeley Street Boston, Massachusetts 02116
_____________________________________________________________
(Address of principal executive offices) (Zip code)
Michael H. Koonce, Esq. 200 Berkeley Street Boston, Massachusetts 02116
____________________________________________________________
(Name and address of agent for service)
Registrant's telephone number, including area code: (617) 210-3200
Date of fiscal year end: Registrant is making a semi-annual filing for one of its series, Evergreen Ultra Short Opportunities Fund, for the six months ended December 31, 2005. This one series has a June 30 fiscal year end.
Date of reporting period: December 31, 2005
Item 1 - Reports to Stockholders.
Evergreen Ultra Short Opportunities Fund

| table of contents |
| 1 | | LETTER TO SHAREHOLDERS |
| 4 | | FUND AT A GLANCE |
| 6 | | ABOUT YOUR FUND’S EXPENSES |
| 7 | | FINANCIAL HIGHLIGHTS |
| 11 | | SCHEDULE OF INVESTMENTS |
| 19 | | STATEMENT OF ASSETS AND LIABILITIES |
| 20 | | STATEMENT OF OPERATIONS |
| 21 | | STATEMENTS OF CHANGES IN NET ASSETS |
| 22 | | NOTES TO FINANCIAL STATEMENTS |
| 28 | | ADDITIONAL INFORMATION |
| 32 | | TRUSTEES AND OFFICERS |
This semiannual report must be preceded or accompanied by a prospectus of the Evergreen fund contained herein. The prospectus contains more complete information, including fees and expenses, and should be read carefully before investing or sending money.
The fund will file its complete schedule of portfolio holdings with the SEC for the first and third quarters of each fiscal year on Form N-Q. The fund’s Form N-Q will be available on the SEC’s Web site at http://www.sec.gov. In addition, the fund’s Form N-Q may be reviewed and copied at the SEC’s Public Reference Room in Washington, D.C. Information on the operation of the Public Reference Room may be obtained by calling 800.SEC.0330.
A description of the fund’s proxy voting policies and procedures, as well as information regarding how the fund voted proxies relating to portfolio securities during the most recent 12-month period ended June 30, is available by visiting our Web site at EvergreenInvestments.com or by visiting the SEC’s Web site at http://www.sec.gov. The fund’s proxy voting policies and procedures are also available without charge, upon request, by calling 800.343.2898.
| Mutual Funds: | | | | |
| NOT FDIC INSURED | MAY LOSE VALUE | NOT BANK GUARANTEED |
Evergreen InvestmentsSM is a service mark of Evergreen Investment Management Company, LLC.
Copyright 2006, Evergreen Investment Management Company, LLC.
Evergreen Investment Management Company, LLC is a subsidiary of Wachovia Corporation
and is an affiliate of Wachovia Corporation's other Broker Dealer subsidiaries.
Evergreen mutual funds are distributed by Evergreen Investment Services, Inc.
200 Berkeley Street, Boston, MA 02116
LETTER TO SHAREHOLDERS
February 2006

Dennis H. Ferro
President and Chief
Executive Officer
Dear Shareholder,
We are pleased to provide the semiannual report for the Evergreen Ultra Short Opportunities Fund, which covers the six-month period ended December 31, 2005.
Over the past six months, investors in the fixed income markets had to overcome a variety of hurdles. Questions about the sustainability of economic growth, surging energy prices and tighter monetary policy led the list of concerns, while hurricanes devastated much of the Gulf region and inflation fears grew with the prospect of increased federal spending. During this period of uncertainty, the importance of asset allocation became increasingly evident, and we believed exposure to Evergreen’s short and intermediate term bond funds enabled investors to contribute to their fully diversified, long-term portfolios.
The investment period began with expectations for a moderation in U.S. economic growth. The rapid pace of growth experienced during the economic recovery had transitioned to the more normalized rate of Gross Domestic Product (“GDP”) growth typically associated with economic expansion. Yet energy prices continued to soar throughout the summer months amid rising levels for employment, housing and production. The post-Katrina federal spending plans
1
LETTER TO SHAREHOLDERS continued
exacerbated these pricing concerns and long-term interest rates began to crawl higher. Despite these events, the U.S. consumer kept spending and businesses were investing some of their record cash balances, enabling the economy to overcome some extremely challenging obstacles in the second half of 2005.
The Federal Reserve (“Fed”) maintained its “measured removal of policy accommodation” throughout the investment period. Since rates had been low for such a lengthy period, Evergreen’s Investment Strategy Committee concluded that the Fed was trying to be less stimulative, rather than more restrictive, for the U.S. economy. Fed Chairman Alan Greenspan remained transparent in his public statements about the direction of monetary policy and long-term market interest rates responded once again by moving lower. This “flattening” of the yield curve caused many in the fixed income markets to debate its message, yet given our forecast for a moderation in global growth, we determined that long-term pricing pressures, were insufficient to halt the expansion. Moreover, we attributed the extent of yield curve flattening to a combination of excess global savings and rising demand from under-funded pensions.
In this environment, the portfolio management teams of Evergreen’s short and intermediate term bond funds attempted to capitalize on trends within the fixed income market. Security selection was critical, as income proved to be the largest contributor to total return. Indeed, rising yields was the dominant theme for our short and intermediate term bond funds during the period, as our portfolio teams endeavored to maximize yield while preserving capital for our investors.
2
LETTER TO SHAREHOLDERS continued
We continue to recommend that investors maintain their diversified, long-term strategies, including the consideration of exposure to short and intermediate term bond funds, within their fixed income portfolios.
Please visit our Web site, EvergreenInvestments.com, for more information about our funds and other investment products available to you. Thank you for your continued support of Evergreen Investments.
Sincerely,

Dennis H. Ferro
President and Chief Executive Officer
Evergreen Investment Company, Inc.
Notice to Shareholders:
The Fund’s Board of Trustees approved a proposal to change the Fund’s concentration policy to state the following:
Ultra Short Opportunities Fund will normally invest more than 25% of its total assets in mortgage-backed and other mortgage-related securities (which may include securities that are issued or guaranteed by the U.S. government or its agencies or instrumentalities).
This proposal requires shareholder approval and has been mailed via proxy on February 17, 2006 to all shareholders of record as of January 31, 2006. A Meeting of Shareholders will be held on March 31, 2006 and if approved the change will be effective April 1, 2006.
Special Notice to Shareholders:
Please visit our Web site at EvergreenInvestments.com for a statement from President and Chief Executive Officer, Dennis Ferro, addressing NASD actions involving Evergreen Investment Services, Inc. (EIS), Evergreen’s mutual fund distributor or statements from Dennis Ferro and Chairman of the Board of the Evergreen funds, Michael S. Scofield, addressing SEC actions involving the Evergreen funds.
3
FUND AT A GLANCE
as of December 31, 2005
MANAGEMENT TEAM
Investment Advisor:
• Evergreen Investment Management Company, LLC
Portfolio Managers:
• Lisa Brown-Premo
• Robert Rowe
CURRENT INVESTMENT STYLE
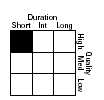
Source: Morningstar, Inc.
Morningstar’s style box is based on a portfolio date as of 12/31/2005.
The Fixed income style box placement is based on a fund’s average effective maturity or duration and the average credit rating of the bond portfolio.
PERFORMANCE AND RETURNS
Portfolio inception date: 5/29/2003
| | | Class A | | Class B | | Class C | | Class I |
| Class inception date | | 5/29/2003 | | 5/29/2003 | | 5/29/2003 | | 5/29/2003 |
|
| Nasdaq symbol | | EUBAX | | EUBBX | | EUBCX�� | | EUBIX |
|
| 6-month return with sales charge | | -2.21% | | -4.26% | | -0.31% | | N/A |
|
| 6-month return w/o sales charge | | 1.03% | | 0.68% | | 0.68% | | 1.19% |
|
| Average annual return* | | | | | | | | |
|
| 1-year with sales charge | | -0.38% | | -2.72% | | 1.22% | | N/A |
|
| 1-year w/o sales charge | | 2.92% | | 2.21% | | 2.21% | | 3.23% |
|
| Since portfolio inception | | 1.72% | | 1.23% | | 2.33% | | 3.35% |
|
| Maximum sales charge | | 3.25% | | 5.00% | | 1.00% | | N/A |
| | | Front-end | | CDSC | | CDSC | | |
|
* Adjusted for maximum applicable sales charge, unless noted.
Past performance is no guarantee of future results. The performance quoted represents past performance and current performance may be lower or higher. The investment return and principal value of an investment will fluctuate so that investors’ shares, when redeemed, may be worth more or less than their original cost. To obtain performance information current to the most recent month-end for Classes A, B, C or I, please go to EvergreenInvestments.com/fundperformance. The performance of each class may vary based on differences in loads, fees and expenses paid by the shareholders investing in each class. Performance includes the reinvestment of income dividends and capital gain distributions. Performance shown does not reflect the deduction of taxes that a shareholder would pay on fund distributions or the redemption of fund shares.
The fund incurs a 12b-1 fee of 0.30% for Class A and 1.00% for Classes B and C. Class I does not pay a 12b-1 fee.
The advisor is waiving a portion of its advisory fee and reimbursing a portion of the 12b-1 fee for Class A. Had the fees not been waived or reimbursed, returns would have been lower.
4
FUND AT A GLANCE continued
LONG-TERM GROWTH
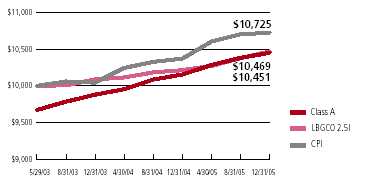
Comparison of a $10,000 investment in the Evergreen Ultra Short Opportunities Fund Class A shares, versus a similar investment in the Lehman Government Credit 0-2.5 Index (LBGC0-2.5I) and the Consumer Price Index (CPI).
The LBGC0-2.5I is an unmanaged market index and does not include transaction costs associated with buying and selling securities, any mutual fund expenses or any taxes. The CPI is a commonly used measure of inflation and does not represent an investment return. It is not possible to invest directly in an index.
Class I shares are only offered in the following manner: (1) to investment advisory clients of Evergreen Investment Management Company, LLC (or its advisory affiliates) when purchased by such advisor(s) on behalf of its clients, (2) through arrangements entered into on behalf of the Evergreen funds with certain financial services firms, (3) to certain institutional investors and (4) to persons who owned Class Y shares in registered name in an Evergreen fund on or before December 31, 1994 or who owned shares of any SouthTrust fund in registered name as of March 18, 2005 or shares of Vestaur Securities Fund as of May 20, 2005.
Class I shares are only available to institutional shareholders with a minimum of $1 million investment, which may be waived in certain situations.
The fund’s investment objective is nonfundamental and may be changed without a vote of the fund’s shareholders.
Asset-backed and mortgage-backed securities are generally subject to higher prepayment risks than other types of debt securities, which can limit the potential for gain in a declining interest rate environment and increase the potential for loss in a rising interest rate environment. Mortgage-backed securities may also be structured so that they are particularly sensitive to interest rates.
The return of principal is not guaranteed due to fluctuation in the NAV of the fund caused by changes in the price of the individual bonds held by the fund and the buying and selling of bonds by the fund. Bond funds have the same inflation, interest rate and credit risks that are associated with the individual bonds held by the fund. Generally, the value of bond funds rise when prevailing interest rates fall and fall when interest rates rise.
Foreign investments may contain more risk due to the inherent risks associated with changing political climates, foreign market instability and foreign currency fluctuations.
U.S. government guarantees apply only to certain securities held in the fund’s portfolio and not to the fund’s shares.
All data is as of December 31, 2005, and subject to change.
5
ABOUT YOUR FUND’S EXPENSES
The Example below is intended to describe the fees and expenses borne by shareholders and the impact of those costs on your investment.
Example
As a shareholder of the fund, you incur two types of costs: (1) transaction costs, including sales charges (loads), redemption fees and exchange fees; and (2) ongoing costs, including management fees, distribution (12b-1) fees and other fund expenses. This Example is intended to help you understand your ongoing costs (in dollars) of investing in the fund and to compare these costs with the ongoing costs of investing in other mutual funds. The Example is based on an investment of $1,000 invested at the beginning of the period and held for the entire period from July 1, 2005 to December 31, 2005.
The example illustrates your fund’s costs in two ways:
• Actual expenses
The section in the table under the heading “Actual” provides information about actual account values and actual expenses. You may use the information in these columns, together with the amount you invested, to estimate the expenses that you paid over the period. Simply divide your account value by $1,000 (for example, an $8,600 account value divided by $1,000 = 8.6), then multiply the result by the number in the appropriate column for your share class, in the column entitled “Expenses Paid During Period” to estimate the expenses you paid on your account during this period.
• Hypothetical example for comparison purposes
The section in the table under the heading “Hypothetical (5% return before expenses)” provides information about hypothetical account values and hypothetical expenses based on the fund’s actual expense ratio and an assumed rate of return of 5% per year before expenses, which is not the fund’s actual return. The hypothetical account values and expenses may not be used to estimate the actual ending account balance or expenses you paid for the period. You may use this information to compare the ongoing costs of investing in the fund and other funds. To do so, compare this 5% hypothetical example with the 5% hypothetical examples that appear in the shareholder reports of the other funds.
Please note that the expenses shown in the table are meant to highlight your ongoing costs only and do not reflect any transactional costs, such as sales charges (loads), redemption fees or exchange fees. Therefore, the section in the table under the heading “Hypothetical (5% return before expenses)” is useful in comparing ongoing costs only, and will not help you determine the relative total costs of owning different funds. In addition, if these transactional costs were included, your costs would have been higher.
| | | Beginning | | Ending | | |
| | | Account | | Account | | Expenses |
| | | Value | | Value | | Paid During |
| | | 7/1/2005 | | 12/31/2005 | | Period* |
|
| Actual | | | | | | |
| Class A | | $ 1,000.00 | | $ 1,010.33 | | $ 4.21 |
| Class B | | $ 1,000.00 | | $ 1,006.78 | | $ 7.74 |
| Class C | | $ 1,000.00 | | $ 1,006.78 | | $ 7.74 |
| Class I | | $ 1,000.00 | | $ 1,011.85 | | $ 2.69 |
| Hypothetical | | | | | | |
| (5% return | | | | | | |
| before expenses) | | | | | | |
| Class A | | $ 1,000.00 | | $ 1,021.02 | | $ 4.23 |
| Class B | | $ 1,000.00 | | $ 1,017.49 | | $ 7.78 |
| Class C | | $ 1,000.00 | | $ 1,017.49 | | $ 7.78 |
| Class I | | $ 1,000.00 | | $ 1,022.53 | | $ 2.70 |
|
* For each class of the Fund, expenses are equal to the annualized expense ratio of each class (0.83% for Class A, 1.53% for Class B, 1.53% for Class C and 0.53% for Class I), multiplied by the average account value over the period, multiplied by 184 / 365 days.
6
FINANCIAL HIGHLIGHTS
(For a share outstanding throughout each period)
| | | Six Months Ended | | Year Ended June 30, |
| | December 31, 2005 | |
|
| CLASS A | | (unaudited) | | 2005 | | 2004 | | 20031 |
|
| Net asset value, beginning of period | | $ 9.93 | | $ 9.96 | | $ 10.05 | | $ 10.00 |
|
| Income from investment operations | | | | | | | | | | | | |
| Net investment income (loss) | | | | 0.22 | | 0.35 | | | | 0.26 | | 0.02 |
Net realized and unrealized gains
or losses on investments | | | | (0.11) | | 0.01 | | | | (0.03) | | 0.05 |
| | |
|
| Total from investment operations | | | | 0.11 | | 0.36 | | | | 0.23 | | 0.07 |
|
| Distributions to shareholders from | | | | | | | | | | | | |
| Net investment income | | | | (0.23) | | (0.39) | | | | (0.32) | | (0.02) |
|
| Net asset value, end of period | | $ 9.81 | | $ 9.93 | | $ 9.96 | | $ 10.05 |
|
| Total return2 | | | | 1.03% | | 3.73% | | | | 2.35% | | 0.75% |
|
| Ratios and supplemental data | | | | | | | | | | | | |
| Net assets, end of period (thousands) | | $106,706 | | $124,221 | | $104,999 | | $17,872 |
| Ratios to average net assets | | | | | | | | | | | | |
Expenses including waivers/reimbursements
but excluding expense reductions | | | | 0.83%3 | | 0.77% | | | | 0.92% | | 0.32%3 |
Expenses excluding waivers/reimbursements
and expense reductions | | | | 0.86%3 | | 0.87% | | | | 0.98% | | 2.93%3 |
| Net investment income (loss) | | | | 4.36%3 | | 3.46% | | | | 2.58% | | 2.76%3 |
| Portfolio turnover rate | | | | 19% | | 25% | | | | 44% | | 0% |
|
1 For the period from May 29, 2003 (commencement of class operations), to June 30, 2003.
2 Excluding applicable sales charges
3 Annualized
See Notes to Financial Statements
7
FINANCIAL HIGHLIGHTS
(For a share outstanding throughout each period)
| | | Six Months Ended | | Year Ended June 30, |
| | December 31, 2005 | |
|
| CLASS B | | (unaudited) | | 2005 | | | | 2004 | | 20031 |
|
| Net asset value, beginning of period | | $ 9.93 | | $ 9.96 | | $ 10.05 | | $10.00 |
|
| Income from investment operations | | | | | | | | | | | | |
| Net investment income (loss) | | | | 0.182 | | 0.272 | | | | 0.192 | | 0.02 |
Net realized and unrealized gains
or losses on investments | | | | (0.10) | | 0.02 | | | | (0.03) | | 0.05 |
| |
|
| Total from investment operations | | | | 0.08 | | 0.29 | | | | 0.16 | | 0.07 |
|
| Distributions to shareholders from | | | | | | | | | | | | |
| Net investment income | | | | (0.20) | | (0.32) | | | | (0.25) | | (0.02) |
|
| Net asset value, end of period | | $ 9.81 | | $ 9.93 | | $ 9.96 | | $10.05 |
|
| Total return3 | | | | 0.68% | | 3.01% | | | | 1.65% | | 0.70% |
|
| Ratios and supplemental data | | | | | | | | | | | | |
| Net assets, end of period (thousands) | | $19,536 | | $20,052 | | $16,029 | | $3,213 |
| Ratios to average net assets | | | | | | | | | | | | |
Expenses including waivers/reimbursements
but excluding expense reductions | | | | 1.53%4 | | 1.47% | | | | 1.62% | | 1.12%4 |
Expenses excluding waivers/reimbursements
and expense reductions | | | | 1.56%4 | | 1.57% | | | | 1.68% | | 5.19%4 |
| Net investment income (loss) | | | | 3.66%4 | | 2.75% | | | | 1.90% | | 1.76%4 |
| Portfolio turnover rate | | | | 19% | | 25% | | | | 44% | | 0% |
|
1 For the period from May 29, 2003 (commencement of class operations), to June 30, 2003.
2 Net investment income (loss) per share is based on average shares outstanding during the period.
3 Excluding applicable sales charges
4 Annualized
See Notes to Financial Statements
8
FINANCIAL HIGHLIGHTS
(For a share outstanding throughout each period)
| | | Six Months Ended | | Year Ended June 30, |
| | December 31, 2005 | |
|
| CLASS C | | (unaudited) | | 2005 | | 2004 | | 20031 |
|
| Net asset value, beginning of period | | $ 9.93 | | $ 9.96 | | $ 10.05 | | $ 10.00 |
|
| Income from investment operations | | | | | | | | | | | | |
| Net investment income (loss) | | | | 0.18 | | 0.27 | | | | 0.192 | | 0.02 |
Net realized and unrealized gains
or losses on investments | | | | (0.10) | | 0.02 | | | | (0.03) | | 0.05 |
| |
|
| Total from investment operations | | | | 0.08 | | 0.29 | | | | 0.16 | | 0.07 |
|
| Distributions to shareholders from | | | | | | | | | | | | |
| Net investment income | | | | (0.20) | | (0.32) | | | | (0.25) | | (0.02) |
|
| Net asset value, end of period | | $ 9.81 | | $ 9.93 | | $ 9.96 | | $ 10.05 |
|
| Total return3 | | | | 0.68% | | 3.01% | | | | 1.65% | | 0.70% |
|
| Ratios and supplemental data | | | | | | | | | | | | |
| Net assets, end of period (thousands) | | $99,160 | | $115,248 | | $135,412 | | $17,820 |
| Ratios to average net assets | | | | | | | | | | | | |
Expenses including waivers/reimbursements
but excluding expense reductions | | | | 1.53%4 | | 1.47% | | | | 1.62% | | 1.02%4 |
Expenses excluding waivers/reimbursements
and expense reductions | | | | 1.56%4 | | 1.57% | | | | 1.68% | | 3.69%4 |
| Net investment income (loss) | | | | 3.66%4 | | 2.73% | | | | 1.88% | | 2.09%4 |
| Portfolio turnover rate | | | | 19% | | 25% | | | | 44% | | 0% |
|
1 For the period from May 29, 2003 (commencement of class operations), to June 30, 2003.
2 Net investment income (loss) per share is based on average shares outstanding during the period.
3 Excluding applicable sales charges
4 Annualized
See Notes to Financial Statements
9
FINANCIAL HIGHLIGHTS
(For a share outstanding throughout each period)
| | | Six Months Ended | | Year Ended June 30, |
| | December 31, 2005 | |
|
| CLASS I | | (unaudited) | | 2005 | | 2004 | | 20031 |
|
| Net asset value, beginning of period | | $ 9.93 | | $ 9.96 | | $ 10.05 | | $10.00 |
|
| Income from investment operations | | | | | | | | | | | | |
| Net investment income (loss) | | | | 0.23 | | 0.382 | | | | 0.292 | | 0.03 |
Net realized and unrealized gains
or losses on investments | | | | (0.10) | | 0.01 | | | | (0.03) | | 0.05 |
| |
|
| Total from investment operations | | | | 0.13 | | 0.39 | | | | 0.26 | | 0.08 |
|
| Distributions to shareholders from | | | | | | | | | | | | |
| Net investment income | | | | (0.25) | | (0.42) | | | | (0.35) | | (0.03) |
|
| Net asset value, end of period | | $ 9.81 | | $ 9.93 | | $ 9.96 | | $10.05 |
|
| Total return | | | | 1.19% | | 4.05% | | | | 2.67% | | 0.77% |
|
| Ratios and supplemental data | | | | | | | | | | | | |
| Net assets, end of period (thousands) | | $384,669 | | $381,760 | | $215,930 | | $2,343 |
| Ratios to average net assets | | | | | | | | | | | | |
Expenses including waivers/reimbursements
but excluding expense reductions | | | | 0.53%3 | | 0.47% | | | | 0.62% | | 0.07%3 |
Expenses excluding waivers/reimbursements
and expense reductions | | | | 0.56%3 | | 0.57% | | | | 0.68% | | 3.89%3 |
| Net investment income (loss) | | | | 4.66%3 | | 3.80% | | | | 2.91% | | 2.95%3 |
| Portfolio turnover rate | | | | 19% | | 25% | | | | 44% | | 0% |
|
1 For the period from May 29, 2003 (commencement of class operations), to June 30, 2003.
2 Net investment income (loss) per share is based on average shares outstanding during the period.
3 Annualized
See Notes to Financial Statements
10
SCHEDULE OF INVESTMENTS
December 31, 2005 (unaudited)
| | | | | Principal | | | | |
| | | | | Amount | | | | Value |
|
| |
| AGENCY MORTGAGE-BACKED COLLATERALIZED | | | | | | | | |
| MORTGAGE OBLIGATIONS 1.8% | | | | | | | | |
| FIXED-RATE 0.7% | | | | | | | | |
| FHLMC: | | | | | | | | |
| Ser. 1650, Class J, 6.50%, 06/15/2023 | | | | $ 1,913,029 | | $ | | 1,946,131 |
| Ser. 2106, Class ZD, 6.00%, 12/15/2028 | | | | 1,620,924 | | | | 1,673,763 |
| Ser. 2480, Class EH, 6.00%, 11/15/2031 | | | | 889,682 | | | | 892,490 |
| | | | | | | |
|
| | | | | | | | | 4,512,384 |
| | | | | | | |
|
| FLOATING-RATE 1.1% | | | | | | | | |
| FHLMC: | | | | | | | | |
| Ser. 1476, Class F, 3.82%, 02/15/2008 | | | | 33,769 | | | | 33,494 |
| Ser. 1607, Class FA, 3.62%, 10/15/2013 | | | | 16,667 | | | | 16,314 |
| Ser. 1625, Class FC, 3.97%, 12/15/2008 | | | | 84,479 | | | | 83,219 |
| Ser. 2395, Class FA, 4.97%, 06/15/2029 | | | | 394,571 | | | | 397,366 |
| Ser. 2431, Class F, 4.87%, 03/15/2032 | | | | 4,622 | | | | 4,678 |
| Ser. 2826, Class SC, 6.26%, 06/15/2034 | | | | 1,476,996 | | | | 1,475,165 |
| Ser. T-62, Class 1A1, 4.53%, 10/25/2044 | | | | 4,192,676 | | | | 4,220,012 |
| FNMA, Ser. 1993-179, Class FB, 4.42%, 10/25/2023 | | | | 209,680 | | | | 210,346 |
| | | | | | | |
|
| | | | | | | | | 6,440,594 |
| | | | | | | |
|
| Total Agency Mortgage-Backed Collateralized Mortgage Obligations | | | | | | |
| (cost $11,073,903) | | | | | | | | 10,952,978 |
| | | | | | | |
|
| AGENCY MORTGAGE-BACKED PASS THROUGH SECURITIES 9.3% | | | | | | |
| FIXED-RATE 5.6% | | | | | | | | |
| FHLMC 15 year, 5.50%, TBA # | | | | 12,625,000 | | | | 12,699,967 |
| FHLMC 30 year, 6.00%, TBA # | | | | 6,250,000 | | | | 6,312,500 |
| FNMA: | | | | | | | | |
| 7.00%, 08/01/2033 - 11/01/2033 | | | | 4,844,732 | | | | 5,082,560 |
| 7.50%, 01/01/2031 - 08/01/2033 ## | | | | 3,263,218 | | | | 3,433,659 |
| 8.00%, 12/01/2008 | | | | 8,330 | | | | 8,524 |
| 10.00%, 02/01/2031 | | | | 91,667 | | | | 103,267 |
| FNMA 15 year, 5.50%, TBA # | | | | 3,125,000 | | | | 3,144,531 |
| FNMA 30 year, 6.50%, TBA # | | | | 3,085,000 | | | | 3,165,019 |
| GNMA | | | | | | | | |
| 4.625%, 01/20/2019 | | | | 270,431 | | | | 275,794 |
| 7.50%, 03/15/2007 - 04/15/2007 | | | | 67,684 | | | | 68,997 |
| | | | | | | |
|
| | | | | | | | | 34,294,818 |
| | | | | | | |
|
| FLOATING-RATE 3.7% | | | | | | | | |
| FHLMC: | | | | | | | | |
| 5.23%, 04/01/2032 ## | | | | 4,353,204 | | | | 4,464,106 |
| 5.28%, 12/01/2033 ## | | | | 6,802,191 | | | | 6,935,513 |
| FNMA: | | | | | | | | |
| 4.65%, 03/01/2035 | | | | 1,423,455 | | | | 1,471,127 |
| 4.77%, 01/01/2018 | | | | 11,921 | | | | 12,055 |
| 5.85%, 10/01/2032 µ | | | | 9,352,071 | | | | 9,582,931 |
| | | | | | | |
|
| | | | | | | | | 22,465,732 |
| | | | | | | |
|
| Total Agency Mortgage-Backed Pass Through Securities | | | | | | | | |
| (cost $56,976,824) | | | | | | | | 56,760,550 |
| | | | | | | |
|
See Notes to Financial Statements
11
SCHEDULE OF INVESTMENTS continued
December 31, 2005 (unaudited)
| | | Principal | | | | |
| | | Amount | | | | Value |
|
| |
| AGENCY REPERFORMING MORTGAGE-BACKED PASS | | | | | | |
| THROUGH SECURITIES 2.6% | | | | | | |
| FIXED-RATE 2.6% | | | | | | |
| FNMA: | | | | | | |
| Ser. 2001-T4, Class A1, 7.50%, 07/25/2041 | | $ 1,984,753 | | $ | | 2,099,512 |
| Ser. 2002-W8, Class A4, 7.00%, 06/25/2017 | | 122,978 | | | | 126,993 |
| Ser. 2003-W2, Class 1A3, 7.50%, 07/25/2042 | | 1,302,264 | | | | 1,342,114 |
| Ser. 2003-W6, Class 3A, 6.50%, 09/25/2042 ## | | 7,333,938 | | | | 7,600,820 |
| Ser. 2005-S001, Class 1B2, 5.23%, 09/25/2035 ## | | 1,999,908 | | | | 2,003,248 |
| Ser. 2005-S001, Class 1B3, 5.58%, 09/25/2035 | | 2,999,862 | | | | 2,947,394 |
| | | | | |
|
| Total Agency Reperforming Mortgage-Backed Pass Through Securities | | | | | | |
| (cost $16,259,479) | | | | | | 16,120,081 |
| | | | | |
|
| ASSET-BACKED SECURITIES 16.8% | | | | | | |
| Altius I Funding, Ltd., Ser. 2005, Class B, FRN, 4.94%, 12/10/2040 144A | | 10,000,000 | | | | 9,978,723 |
| C-Bass, Ltd.: | | | | | | |
| Ser. 11A, Class D, FRN, 7.19%, 09/15/2039 144A - | | 4,112,500 | | | | 4,145,914 |
| Ser. 13A, Class C, FRN, 5.58%, 03/17/2040 144A | | 1,500,000 | | | | 1,485,000 |
| Ser. 13A, Class D, FRN, 6.85%, 03/17/2040 144A | | 3,850,000 | | | | 3,773,000 |
| Emergent Home Equity Loan Trust, Ser. 1997-4, Class A-5, 7.08%, 12/15/2028 | | 527,479 | | | | 526,883 |
| Empire Funding Home Loan Owner Trust, Ser. 1998-2, Class M2, 7.93%, | | | | | | |
| 06/25/2024 | | 260,812 | | | | 257,810 |
| Long Beach Asset Holdings Corp.: | | | | | | |
| Ser. 2005-WL1, Class N1, 5.19%, 06/25/2045 144A | | 190,360 | | | | 190,033 |
| Ser. 2005-WL1, Class N2, 7.39%, 06/25/2046 144A - | | 7,000,000 | | | | 6,990,156 |
| Meritage Asset Holdings Net Interest Mtge.: | | | | | | |
| Ser. 2004-1, Class N2, 6.41%, 07/24/2034 144A | | 2,500,000 | | | | 2,505,078 |
| Ser. 2004-2, Class N4, 6.90%, 01/25/2035 144A | | 3,700,000 | | | | 3,717,922 |
| Nautilus RMBS CDO, Ltd.: | | | | | | |
| Ser. 2005-1A, Class A3, FRN, 5.60%, 05/24/2035 144A | | 9,342,670 | | | | 9,341,210 |
| Ser. 2005-2A, Class A3, FRN, 6.08%, 11/05/2040 144A | | 18,000,000 | | | | 17,978,906 |
| Newcastle Investment Corp., Ser. 3A, Class 2FL, FRN, 5.63%, | | | | | | |
| 09/24/2038 144A - | | 10,000,000 | | | | 10,070,000 |
| Ocean Star plc: | | | | | | |
| Ser. 2004-A, Class C, FRN, 5.58%, 11/12/2018 144A | | 5,800,000 | | | | 5,856,260 |
| Ser. 2005, Class C, FRN, 5.05%, 11/12/2012 144A | | 8,000,000 | | | | 7,976,800 |
| Ser. 2005, Class D, FRN, 5.80%, 11/12/2012 144A | | 1,400,000 | | | | 1,396,080 |
| Option One CTS ARM Trust, Ser. 1996-1, Class A1, 6.90%, 04/25/2026 | | 261,754 | | | | 261,118 |
| Option One Mtge. Securities Corp. Net Interest Mtge. Trust, Ser. 2004-2A, | | | | | | |
| Class N2, 6.41%, 11/25/2034 144A | | 3,600,000 | | | | 3,608,438 |
| Trapeza CDO, LLC, Ser. 2004-7A, Class B1, FRN, 5.75%, 01/25/2035 144A | | 12,000,000 | | | | 12,267,960 |
| | | | | |
|
| Total Asset-Backed Securities (cost $102,108,692) | | | | | | 102,327,291 |
| | | | | |
|
See Notes to Financial Statements
12
SCHEDULE OF INVESTMENTS continued
December 31, 2005 (unaudited)
| | | | | Principal | | | | |
| | | | | Amount | | | | Value |
|
| |
| COMMERCIAL MORTGAGE-BACKED SECURITIES 7.0% | | | | | | | | |
| FIXED-RATE 3.7% | | | | | | | | |
| Banc of America Structural Security Trust, Ser. 2002-X1, Class A3, 5.44%, | | | | | | | | |
| 10/11/2033 144A | | $ | | 500,000 | | $ | | 506,834 |
| GE Capital Mall Fin. Corp., Ser. 1998-1A, Class B2, 7.25%, 09/13/2028 144A | | | | 5,500,000 | | | | 5,784,790 |
| GS Mtge. Securities Corp., Ser. 2003-3F, Class 2A1, 4.50%, 04/25/2033 | | | | 1,003,108 | | | | 992,391 |
| PaineWebber Mtge. Acceptance Corp., Ser. 1996-M1, Class E, 7.66%, 01/02/2012 | | | | | | |
| 144A | | | | 7,550,000 | | | | 7,737,260 |
| Sawgrass Mills Trust, Ser. 2001-SGMA, Class E, 6.71%, 07/11/2011 144A | | | | 7,500,000 | | | | 7,556,038 |
| | | | | | | |
|
| | | | | | | | | 22,577,313 |
| | | | | | | |
|
| FLOATING-RATE 3.3% | | | | | | | | |
| Capital Trust, Ltd., Ser. 2005-1A, Class C, 5.12%, 03/20/2050 144A | | | | 3,000,000 | | | | 3,000,000 |
| Credit Suisse First Boston Mtge. Securities Corp.: | | | | | | | | |
| Ser. 2003-1, Class DB3, 6.56%, 02/25/2033 | | | | 3,189,276 | | | | 3,179,198 |
| Ser. 2005-CN2A, Class C, 4.90%, 11/15/2019 144A | | | | 4,000,000 | | | | 3,999,984 |
| Ser. 2005-TFLA, Class E, 5.27%, 08/15/2018 144A | | | | 4,825,228 | | | | 4,825,199 |
| GMAC Comml. Mtge. Asset Corp., Ser. 2003-SNFA, Class A, 5.17%, | | | | | | | | |
| 01/01/2018 144A | | | | 4,863,069 | | | | 4,872,138 |
| | | | | | | |
|
| | | | | | | | | 19,876,519 |
| | | | | | | |
|
| Total Commercial Mortgage-Backed Securities (cost $42,968,296) | | | | | | | | 42,453,832 |
| | | | | | | |
|
| CORPORATE BONDS 0.8% | | | | | | | | |
| FINANCIALS 0.8% | | | | | | | | |
| Diversified Financial Services 0.8% | | | | | | | | |
| Emigrant Capital Trust I, FRN, 6.83%, 12/10/2033 144A (cost $5,012,408) | | | | 5,000,000 | | | | 5,076,150 |
| | | | | | | |
|
| REPERFORMING MORTGAGE-BACKED PASS THROUGH SECURITIES 2.3% | | | | | | |
| GS Mtge. Securities Corp.: | | | | | | | | |
| Ser. 2001-2, Class A, 7.50%, 06/19/2032 144A | | | | 4,703,280 | | | | 4,915,680 |
| Ser. 2004-4, Class 1A2, 7.50%, 10/25/2044 144A | | | | 4,828,257 | | | | 4,994,831 |
| Nomura Asset Acceptance Corp. Reperforming Loan Trust, Ser. 2004-R2, Class A2, | | | | | | |
| 7.00%, 10/25/2034 144A | | | | 4,051,737 | | | | 4,198,248 |
| | | | | | | |
|
| Total Reperforming Mortgage-Backed Pass Through Securities | | | | | | | | |
| �� (cost $14,616,214) | | | | | | | | 14,108,759 |
| | | | | | | |
|
| WHOLE LOAN MORTGAGE-BACKED COLLATERALIZED | | | | | | | | |
| MORTGAGE OBLIGATIONS 2.8% | | | | | | | | |
| FIXED-RATE 1.3% | | | | | | | | |
| DLJ Mtge. Acceptance Corp.: | | | | | | | | |
| Ser. 1993-19, Class A7, 6.75%, 01/25/2024 | | | | 3,147,641 | | | | 3,139,468 |
| Ser. 1997-CF2, Class B1, 7.14%, 10/15/2030 144A | | | | 2,900,000 | | | | 2,987,785 |
| Structured Asset Securities Corp., Ser. 2003-8, Class 2A3, 5.00%, 04/25/2033 | | | | 368,818 | | | | 367,438 |
| Washington Mutual Mtge. Securities Corp., Ser. 2003-MS4, Class LLA3, 5.00%, | | | | | | |
| 02/25/2033 | | | | 1,637,342 | | | | 1,620,016 |
| | | | | | | |
|
| | | | | | | | | 8,114,707 |
| | | | | | | |
|
See Notes to Financial Statements
13
SCHEDULE OF INVESTMENTS continued
December 31, 2005 (unaudited)
| | | | | Principal | | | | |
| | | | | Amount | | | | Value |
|
| |
| WHOLE LOAN MORTGAGE-BACKED COLLATERALIZED | | | | | | | | |
| MORTGAGE OBLIGATIONS continued | | | | | | | | |
| FLOATING-RATE 1.5% | | | | | | | | |
| Countrywide Home Loans, Ser. 2004-29, Class 3A1, 4.72%, 02/25/2035 | | $ | | 1,517,985 | | $ | | 1,556,254 |
| GSR Mtge. Loan Trust, Ser. 2004-3F, Class 2A10, 5.83%, 02/25/2035 | | | | 1,973,068 | | | | 1,919,401 |
| IndyMac Index Mtge. Loan Trust, Ser. 2004-AR14, Class AX2, IO, 0.73%, | | | | | | | | |
| 01/25/2035 | | | | 127,515,185 | | | | 4,901,365 |
| Residential Accredit Loans, Inc., Ser. 2002, Class A7A, 4.78%, 09/25/2017 | | | | 357,210 | | | | 355,602 |
| | | | | | | |
|
| | | | | | | | | 8,732,622 |
| | | | | | | |
|
| Total Whole Loan Mortgage-Backed Collateralized Mortgage Obligations | | | | | | | | |
| (cost $17,873,091) | | | | | | | | 16,847,329 |
| | | | | | | |
|
| WHOLE LOAN MORTGAGE-BACKED PASS THROUGH SECURITIES 20.3% | | | | | | | | |
| FIXED-RATE 0.0% | | | | | | | | |
| MASTR Alternative Loan Trust, Ser. 2003-5, Class 1A1, 6.50%, 07/25/2033 | | | | 35,440 | | | | 35,570 |
| | | | | | | |
|
| FLOATING-RATE 20.3% | | | | | | | | |
| Bear Stearns Alternative Loan Trust: | | | | | | | | |
| Ser. 2003-5, Class 42A2, 4.43%, 12/25/2033 | | | | 2,267,897 | | | | 2,237,802 |
| Ser. 2003-6, Class 4A, 5.58%, 01/25/2034 | | | | 2,952,535 | | | | 2,945,685 |
| Countrywide Home Loans: | | | | | | | | |
| Ser. 2004-2, Class 2A1, 5.32%, 02/25/2034 | | | | 4,013,136 | | | | 4,003,826 |
| Ser. 2004-23, Class A, 6.08%, 11/25/2034 | | | | 13,818,181 | | | | 14,103,527 |
| Ser. 2004-HYB8, Class 5A1, 5.19%, 01/20/2035 | | | | 8,285,873 | | | | 8,480,010 |
| Credit Suisse First Boston Mtge. Securities Corp.: | | | | | | | | |
| Ser. 2002-AR17, Class 2A1, 4.92%, 12/19/2039 | | | | 151,236 | | | | 152,115 |
| Ser. 2002-AR33, Class 4A1, 5.26%, 12/25/2032 | | | | 9,677,747 | | | | 9,644,262 |
| Ser. 2003-AR20, Class A4, 4.64%, 08/25/2033 | | | | 3,839,847 | | | | 3,804,408 |
| Ser. 2004-AR2, Class 3A1, 5.16%, 03/25/2034 | | | | 2,261,296 | | | | 2,245,620 |
| DSLA Mtge. Loan Trust: | | | | | | | | |
| Ser. 2005-AR1, Class X2, IO, 0.62%, 03/19/2045 | | | | 105,403,958 | | | | 5,039,627 |
| Ser. 2005-AR2, Class X2, IO, 0.60%, 03/19/2045 | | | | 220,052,517 | | | | 10,521,261 |
| Guardian Savings & Loan Assn., Ser. 1990-4W, Class A, 6.64%, 05/25/2020 | | | | 115,827 | | | | 115,879 |
| Housing Securities, Inc., Ser. 92-Sl, Class A2, 6.02%, 05/25/2016 | | | | 232,466 | | | | 231,764 |
| IndyMac Index Mtge. Loan Trust: | | | | | | | | |
| Ser. 2005-AR3, Class 4A1, 5.53%, 04/25/2035 | | | | 2,300,880 | | | | 2,300,436 |
| Ser. 2005-AR8, Class AX2, IO, 0.84%, 04/25/2035 | | | | 160,413,857 | | | | 5,915,261 |
| MASTR Adjustable Rate Mtge. Trust: | | | | | | | | |
| Ser. 2003-1, Class 2A3, 4.65%, 12/25/2032 | | | | 269,136 | | | | 266,177 |
| Ser. 2004-1, Class 4A1, 6.21%, 01/25/2034 | | | | 4,362,008 | | | | 4,395,625 |
| Ser. 2004-8, Class 7A1, 5.45%, 09/25/2034 | | | | 5,200,755 | | | | 5,176,052 |
| Merrill Lynch Mtge. Investors, Inc., Ser. 2003-A4, Class 4A, 5.45%, 06/25/2033 | | | | 4,612,454 | | | | 4,595,158 |
| Structured Adjustable Rate Mtge. Loan Trust, Ser. 2005-7, Class 7AX, IO, 0.97%, | | | | | | | | |
| 03/25/2035 | | | | 100,882,543 | | | | 1,796,970 |
See Notes to Financial Statements
14
SCHEDULE OF INVESTMENTS continued
December 31, 2005 (unaudited)
| | | Principal | | | | |
| | | Amount | | | | Value |
|
| |
| WHOLE LOAN MORTGAGE-BACKED PASS THROUGH | | | | | | |
| SECURITIES continued | | | | | | |
| FLOATING-RATE continued | | | | | | |
| Structured Asset Securities Corp.: | | | | | | |
| Ser. 2003-15, Class 4A, 5.44%, 04/25/2033 | | $ 11,209,684 | | $ | | 11,180,315 |
| Ser. 2003-34A, Class 3A1, 4.83%, 11/25/2033 | | 1,885,100 | | | | 1,874,849 |
| Ser. 2003-34A, Class 6A, 5.14%, 11/25/2033 | | 6,979,789 | | | | 6,896,730 |
| Ser. 2003-37A, Class 5A, 5.07%, 12/25/2033 | | 6,989,937 | | | | 6,945,737 |
| Ser. 2003-37A, Class 7A, 4.86%, 12/25/2033 | | 192,079 | | | | 191,850 |
| Ser. 2003-40A, Class 5A, 5.56%, 01/25/2034 | | 6,249,719 | | | | 6,261,218 |
| Ser. 2005-RM1, Class A, IO, 5.00%, 03/25/2045 144A | | 11,288,612 | | | | 2,628,130 |
| | | | | |
|
| | | | | | | 123,950,294 |
| | | | | |
|
| Total Whole Loan Mortgage-Backed Pass Through Securities | | | | | | |
| (cost $128,987,809) | | | | | | 123,985,864 |
| | | | | |
|
| WHOLE LOAN SUBORDINATE COLLATERALIZED MORTGAGE | | | | | | |
| OBLIGATIONS 36.6% | | | | | | |
| FIXED-RATE 9.1% | | | | | | |
| Argent Net Interest Mtge. Trust, Ser. 2004-WN10, Class B, 7.39%, | | | | | | |
| 11/25/2034 144A | | 2,400,000 | | | | 2,415,383 |
| Countrywide Alternative Loan Trust: | | | | | | |
| Ser. 2002-07, Class M, 7.00%, 08/25/2032 | | 4,635,412 | | | | 4,670,780 |
| Ser. 2002-16, Class B1, 6.00%, 12/25/2032 | | 2,577,946 | | | | 2,574,879 |
| Ser. 2002-18, Class M, 6.00%, 02/25/2033 | | 4,644,763 | | | | 4,690,050 |
| Countrywide Funding Corp., Ser. 2002-28, Class M, 6.50%, 10/25/2032 | | 373,546 | | | | 379,654 |
| Countrywide Home Loans, Ser. 2002-22, Class M, 6.25%, 10/25/2032 | | 2,869,516 | | | | 2,866,393 |
| MASTR Resecuritization Trust: | | | | | | |
| Ser. 2004-1, 4.75%, 07/01/2033 144A | | 5,252,401 | | | | 4,952,850 |
| Ser. 2004-2, 5.25%, 03/25/2034 144A | | 10,774,030 | | | | 10,147,789 |
| Ser. 2004-3, 5.00%, 03/25/2034 144A | | 7,369,344 | | | | 6,936,395 |
| Ser. 2005-2, 4.75%, 03/28/2034 144A | | 8,468,754 | | | | 7,992,387 |
| Structured Asset Securities Corp.: | | | | | | |
| Ser. 2002-17, Class B1, 6.08%, 09/25/2032 | | 1,679,536 | | | | 1,684,855 |
| Ser. 2002-17, Class B2, 6.08%, 09/25/2032 | | 3,437,828 | | | | 3,438,088 |
| Ser. 2003-08, Class 1B1, 5.00%, 04/25/2018 | | 520,038 | | | | 514,804 |
| Washington Mutual Mtge. Securities Corp., Ser. 2002-S5, Class B3, 6.39%, | | | | | | |
| 09/25/2032 | | 1,845,825 | | | | 1,880,176 |
| | | | | |
|
| | | | | | | 55,144,483 |
| | | | | |
|
| FLOATING-RATE 27.5% | | | | | | |
| Banc of America Mtge. Securities, Inc.: | | | | | | |
| Ser. 2002-G, Class 2B3, 5.95%, 07/20/2032 | | 998,938 | | | | 996,581 |
| Ser. 2002-K, Class B4, 6.10%, 10/20/2032 144A | | 545,587 | | | | 543,897 |
| Ser. 2004-G, Class B3, 4.58%, 08/25/2034 | | 4,515,924 | | | | 4,318,674 |
| Ser. 2004-H, Class B2, 4.47%, 09/25/2034 | | 3,866,796 | | | | 3,735,375 |
| Ser. 2004-H, Class B3, 4.47%, 09/25/2035 | | 2,081,587 | | | | 1,997,325 |
| Ser. 2004-I, Class B3, 4.55%, 10/25/2035 | | 1,934,478 | | | | 1,857,041 |
See Notes to Financial Statements
15
SCHEDULE OF INVESTMENTS continued
December 31, 2005 (unaudited)
| | | Principal | | | | |
| | | Amount | | | | Value |
|
| |
| WHOLE LOAN SUBORDINATE COLLATERALIZED MORTGAGE | | | | | | |
| OBLIGATIONS continued | | | | | | |
| FLOATING-RATE continued | | | | | | |
| Countrywide Home Loans: | | | | | | |
| Ser. 2004-HYB8, Class 1B1, 5.55%, 01/20/2035 | | $ 4,208,864 | | $ | | 4,153,622 |
| Ser. 2004-HYB8, Class 1B2, 5.55%, 01/20/2035 | | 3,218,896 | | | | 3,086,116 |
| Ser. 2004-HYB8, Class 1M2, 5.55%, 01/20/2035 | | 2,446,921 | | | | 2,469,861 |
| Credit Suisse First Boston Mtge. Securities Corp.: | | | | | | |
| Ser. 2003-AR05, Class 1A2, 5.03%, 01/25/2033 | | 151,506 | | | | 151,825 |
| Ser. 2003-AR05, Class 2A3, 5.19%, 01/25/2033 | | 442,192 | | | | 433,717 |
| Ser. 2003-AR09, Class 1A3, 4.99%, 03/25/2033 | | 193,239 | | | | 194,915 |
| Ser. 2003-AR15, Class 2A2, 4.81%, 06/25/2033 | | 1,431,142 | | | | 1,411,268 |
| Ser. 2003-AR18, Class 2A4, 4.75%, 07/25/2033 | | 631,700 | | | | 627,036 |
| Ser. 2003-AR24, Class 2A4, 5.38%, 09/25/2033 | | 4,660,800 | | | | 4,736,864 |
| Ser. 2003-AR26, Class 9M1, 5.23%, 10/25/2033 | | 4,648,500 | | | | 4,740,680 |
| Ser. 2003-AR28, Class 6M1, 5.23%, 12/25/2033 | | 8,281,000 | | | | 8,447,779 |
| First Franklin Mtge. Loan Net Interest Mtge.: | | | | | | |
| Ser. 2003-FFH2, Class N3, 8.50%, 03/25/2034 144A | | 2,308,475 | | | | 2,325,789 |
| Ser. 2004-FFH1, Class N3, 10.00%, 04/25/2034 144A | | 2,500,000 | | | | 2,516,797 |
| Ser. 2004-FFH3, Class N2, 5.93%, 12/25/2034 144A | | 2,000,000 | | | | 2,000,000 |
| Ser. 2004-FFH3, Class N3, 8.00%, 12/25/2034 144A | | 3,200,000 | | | | 3,232,000 |
| Harborview Mtge. Loan Trust: | | | | | | |
| Ser. 2004-7, Class B2, 5.25%, 11/19/2034 | | 2,239,138 | | | | 2,281,435 |
| Ser. 2004-7, Class B3, 5.25%, 11/19/2034 | | 5,787,433 | | | | 5,786,218 |
| Ser. 2005-8, Class 2B3, 5.68%, 02/19/2035 | | 6,986,969 | | | | 6,986,550 |
| Ser. 2005-8, Class 2B4, 5.68%, 02/19/2035 | | 5,779,222 | | | | 5,551,925 |
| IMPAC Secured Assets Corp., Ser. 2005-1, Class B3, 5.70%, 07/25/2035 | | 8,871,635 | | | | 8,735,278 |
| Lehman Structured Securities Corp.: | | | | | | |
| Ser. 2004-2, Class M-2, 5.90%, 02/28/2033 144A | | 7,482,459 | | | | 7,447,278 |
| Ser. 2004-2, Class M-3, 5.90%, 02/28/2033 144A | | 9,379,059 | | | | 9,268,255 |
| MASTR Adjustable Rate Mtge. Trust: | | | | | | |
| Ser. 2004-1, Class B3, 5.66%, 02/25/2034 | | 3,770,621 | | | | 3,756,570 |
| Ser. 2004-15, Class B3, 4.99%, 12/25/2034 | | 4,243,894 | | | | 4,119,081 |
| MortgageIT Trust: | | | | | | |
| Ser. 2005-4, Class B1, 5.48%, 10/25/2035 | | 960,521 | | | | 950,765 |
| Ser. 2005-4, Class B2, 6.13%, 10/25/2035 (h) | | 960,521 | | | | 948,364 |
| Ser. 2005-4, Class M3, 4.95%, 10/25/2035 (h) | | 2,881,562 | | | | 2,877,960 |
| Ser. 2005-4, Class M4, 5.03%, 10/25/2035 (h) | | 1,542,596 | | | | 1,538,499 |
| Structured Adjustable Rate Mtge. Loan Trust: | | | | | | |
| Ser. 2004-14, Class B6, 4.88%, 10/25/2034 | | 6,354,016 | | | | 6,098,267 |
| Ser. 2004-16, Class B6, 5.28%, 11/25/2034 | | 7,506,928 | | | | 7,274,363 |
| Ser. 2005-12, Class B4, 5.57%, 06/25/2035 | | 2,729,718 | | | | 2,700,892 |
| Ser. 2005-12, Class B6, 5.57%, 06/25/2035 | | 2,862,607 | | | | 2,771,977 |
| Structured Asset Mtge. Investments, Inc., Ser. 2003-AR2, Class B1, 5.37%, | | | | | | |
| 12/19/2033 | | 2,928,204 | | | | 2,959,647 |
See Notes to Financial Statements
16
SCHEDULE OF INVESTMENTS continued
December 31, 2005 (unaudited)
| | | Principal | | | | |
| | | Amount | | | | Value |
|
| |
| WHOLE LOAN SUBORDINATE COLLATERALIZED MORTGAGE | | | | | | |
| OBLIGATIONS continued | | | | | | |
| FLOATING-RATE continued | | | | | | |
| Structured Asset Securities Corp.: | | | | | | |
| Ser. 2002-8A, Class B1, 6.08%, 05/25/2032 | | $ 4,732,995 | | $ | | 4,833,081 |
| Ser. 2003-22A, Class B1, 5.09%, 06/25/2033 | | 11,355,449 | | | | 11,289,309 |
| Washington Mutual Mtge. Securities Corp.: | | | | | | |
| Ser. 2004-AR2, Class B1, 4.73%, 04/25/2044 | | 8,051,767 | | | | 8,061,590 |
| Ser. 2004-AR2, Class B2, 4.73%, 04/25/2044 | | 6,977,266 | | | | 6,961,707 |
| Wells Fargo Mtge. Backed Securities Trust, Ser. 2003-B, Class B1, 5.14%, | | | | | | |
| 02/25/2033 | | 748,971 | | | | 744,057 |
| | | | | |
|
| | | | | | | 167,920,230 |
| | | | | |
|
| ` Total Whole Loan Subordinate Collateralized Mortgage Obligations | | | | | | |
| (cost $225,186,633) | | | | | | 223,064,713 |
| | | | | |
|
| YANKEE OBLIGATIONS-CORPORATE 4.3% | | | | | | |
| FINANCIALS 4.3% | | | | | | |
| Diversified Financial Services 4.3% | | | | | | |
| Preferred Term Securities, Ltd., FRN: | | | | | | |
| 6.07%, 03/24/2034 144A | | 1,000,000 | | | | 1,021,950 |
| 6.07%, 06/24/2034 144A | | 10,000,000 | | | | 10,220,300 |
| 6.12%, 12/24/2033 144A | | 14,900,000 | | | | 15,228,098 |
| | | | | |
|
| Total Yankee Obligations-Corporate (cost $25,917,954) | | | | | | 26,470,348 |
| | | | | | |
|
| |
|
| | | Shares | | | | Value |
|
| |
| PREFERRED STOCKS 1.6% | | | | | | |
| FINANCIALS 1.6% | | | | | | |
| Thrifts & Mortgage Finance 1.6% | | | | | | |
| Fannie Mae, Ser. O (cost $10,106,500) | | 180,000 | | | | 9,855,000 |
| | | | | |
|
| SHORT-TERM INVESTMENTS 0.2% | | | | | | |
| MUTUAL FUND SHARES 0.2% | | | | | | |
| Evergreen Institutional Money Market Fund ø ## (cost $1,016,702) | | 1,016,702 | | | | 1,016,702 |
| | | | | |
|
| Total Investments (cost $658,104,505) 106.4% | | | | | | 649,039,597 |
| Other Assets and Liabilities (6.4%) | | | | | | (38,968,940) |
| | | | | |
|
| Net Assets 100.0% | | | | $ | | 610,070,657 |
| | | | | |
|
| # | | When-issued or delayed delivery security |
| ## | | All or a portion of this security has been segregated for when-issued or delayed delivery securities. |
| µ | | All or a portion of this security has been segregated as collateral for reverse repurchase agreements. |
| 144A | | Security that may be sold to qualified institutional buyers under Rule 144A of the Securities Act of 1933, as amended. |
| | | This security has been determined to be liquid under guidelines established by the Board of Trustees, unless otherwise |
| | | noted. |
| (h) | | Security is valued at fair value as determined by the investment advisor in good faith, according to procedures approved |
| | | by the Board of Trustees. |
| ø | | Evergreen Investment Management Company, LLC is the investment advisor to both the Fund and the money market |
| | | fund. |
| |
| See Notes to Financial Statements |
17
SCHEDULE OF INVESTMENTS continued
December 31, 2005 (unaudited)
| Summary of Abbreviations |
| CDO | | Collateralized Debt Obligation |
| FHLMC | | Federal Home Loan Mortgage Corp. |
| FNMA | | Federal National Mortgage Association |
| FRN | | Floating Rate Note |
| GNMA | | Government National Mortgage Association |
| IO | | Interest Only |
| MASTR | | Mortgage Asset Securitization Transactions, Inc. |
| TBA | | To Be Announced |
The following table shows the percent of total investments (excluding equity positions) by credit quality based on Moody’s and Standard & Poor’s ratings as of December 31, 2005:
| AAA | | 39.4% |
| AA | | 15.4% |
| A | | 20.9% |
| BBB | | 24.3% |
| |
|
| | | 100.0% |
The following table shows the percent of total investments (excluding equity positions) by maturity as of December 31, 2005:
| Less than 1 year | | 9.6% |
| 1 to 3 year(s) | | 51.7% |
| 3 to 5 years | | 21.4% |
| 5 to 10 years | | 15.1% |
| 10 to 20 years | | 0.6% |
| 20 to 30 years | | 0.2% |
| Greater than 30 years | | 1.4% |
| |
|
| | | 100.0% |
| | |
|
See Notes to Financial Statements
18
STATEMENT OF ASSETS AND LIABILITIES
December 31, 2005 (unaudited)
| Assets | | | | |
| Investments in securities, at value (cost $657,087,803) | | $ | | 648,022,895 |
| Investments in affiliated money market fund, at value (cost $1,016,702) | | | | 1,016,702 |
|
| Total investments | | | | 649,039,597 |
| Principal paydown receivable | | | | 1,410,264 |
| Receivable for Fund shares sold | | | | 294,931 |
| Dividends and interest receivable | | | | 3,388,402 |
| Prepaid expenses and other assets | | | | 63,058 |
|
| Total assets | | | | 654,196,252 |
|
| Liabilities | | | | |
| Dividends payable | | | | 796,777 |
| Payable for securities purchased | | | | 34,305,453 |
| Payable for Fund shares redeemed | | | | 2,552,390 |
| Payable for reverse repurchase agreements | | | | 6,361,991 |
| Advisory fee payable | | | | 21,664 |
| Distribution Plan expenses payable | | | | 15,530 |
| Due to other related parties | | | | 24,042 |
| Accrued expenses and other liabilities | | | | 47,748 |
|
| Total liabilities | | | | 44,125,595 |
|
| Net assets | | $ | | 610,070,657 |
|
| Net assets represented by | | | | |
| Paid-in capital | | $ | | 624,747,427 |
| Overdistributed net investment income | | | | (506,246) |
| Accumulated net realized losses on investments | | | | (5,105,616) |
| Net unrealized losses on investments | | | | (9,064,908) |
|
| Total net assets | | $ | | 610,070,657 |
|
| Net assets consists of | | | | |
| Class A | | $ | | 106,705,791 |
| Class B | | | | 19,536,041 |
| Class C | | | | 99,159,582 |
| Class I | | | | 384,669,243 |
|
| Total net assets | | $ | | 610,070,657 |
|
| Shares outstanding (unlimited number of shares authorized) | | | | |
| Class A | | | | 10,882,273 |
| Class B | | | | 1,992,360 |
| Class C | | | | 10,112,951 |
| Class I | | | | 39,230,410 |
|
| Net asset value per share | | | | |
| Class A | | $ | | 9.81 |
| Class A — Offering price (based on sales charge of 3.25%) | | $ | | 10.14 |
| Class B | | $ | | 9.81 |
| Class C | | $ | | 9.81 |
| Class I | | $ | | 9.81 |
|
See Notes to Financial Statements
19
STATEMENT OF OPERATIONS
Six Months Ended December 31, 2005 (unaudited)
| Investment income | | | | |
| Interest | | $ | | 16,451,555 |
| Dividends | | | | 315,000 |
| Income from affiliate | | | | 127,275 |
|
| Total investment income | | | | 16,893,830 |
|
| Expenses | | | | |
| Advisory fee | | | | 1,168,676 |
| Distribution Plan expenses | | | | |
| Class A | | | | 180,419 |
| Class B | | | | 99,505 |
| Class C | | | | 545,487 |
| Administrative services fee | | | | 324,196 |
| Transfer agent fees | | | | 113,488 |
| Trustees’ fees and expenses | | | | 4,855 |
| Printing and postage expenses | | | | 17,406 |
| Custodian and accounting fees | | | | 96,804 |
| Registration and filing fees | | | | 31,783 |
| Professional fees | | | | 21,810 |
| Interest expense | | | | 38,743 |
| Other | | | | 17,116 |
|
| Total expenses | | | | 2,660,288 |
| Less: Expense reductions | | | | (10,054) |
| Fee waivers and expense reimbursements | | | | (103,147) |
|
| Net expenses | | | | 2,547,087 |
|
| Net investment income | | | | 14,346,743 |
|
| Net realized and unrealized gains or losses on investments | | | | |
| Net realized losses on investments | | | | (904,452) |
| Net change in unrealized gains or losses on investments | | | | (6,586,567) |
|
| Net realized and unrealized gains or losses on investments | | | | (7,491,019) |
|
| Net increase in net assets resulting from operations | | $ | | 6,855,724 |
|
See Notes to Financial Statements
20
STATEMENTS OF CHANGES IN NET ASSETS
| | | Six Months Ended | | | | |
| | | December 31, 2005 | | Year Ended |
| | | (unaudited) | | June 30, 2005 |
|
| Operations | | | | | | | | |
| Net investment income | | $ | | 14,346,743 | | $ | | 18,836,791 |
| Net realized gains or losses on | | | | | | | | |
| investments | | | | (904,452) | | | | 765,933 |
| Net change in unrealized gains or | | | | | | | | |
| losses on investments | | | | (6,586,567) | | | | (296,054) |
|
| Net increase in net assets resulting | | | | | | | | |
| from operations | | | | 6,855,724 | | | | 19,306,670 |
|
| Distributions to shareholders from | | | | | | | | |
| Net investment income | | | | | | | | |
| Class A | | | | (2,757,799) | | | | (4,529,823) |
| Class B | | | | (387,000) | | | | (572,533) |
| Class C | | | | (2,118,819) | | | | (3,910,056) |
| Class I | | | | (9,837,738) | | | | (12,096,314) |
|
| Total distributions to shareholders | | | | (15,101,356) | | | | (21,108,726) |
|
| | | Shares | | | | Shares | | |
| Capital share transactions | | | | | | | | |
| Proceeds from shares sold | | | | | | | | |
| Class A | | 2,225,511 | | 21,982,791 | | 10,168,264 | | 101,301,333 |
| Class B | | 296,019 | | 2,915,850 | | 816,669 | | 8,132,532 |
| Class C | | 1,116,789 | | 11,027,680 | | 3,656,985 | | 36,416,945 |
| Class I | | 9,558,760 | | 94,361,062 | | 23,442,505 | | 233,352,317 |
|
| | | | | 130,287,383 | | | | 379,203,127 |
|
| Net asset value of shares issued in | | | | | | | | |
| reinvestment of distributions | | | | | | | | |
|
| Class A | | 182,126 | | 1,794,664 | | 309,451 | | 3,081,012 |
| Class B | | 25,534 | | 251,554 | | 38,389 | | 382,225 |
| Class C | | 139,082 | | 1,370,490 | | 277,200 | | 2,760,478 |
| Class I | | 741,289 | | 7,302,286 | | 813,534 | | 8,096,406 |
|
| | | | | 10,718,994 | | | | 14,320,121 |
|
| Automatic conversion of Class B shares | | | | | | | | |
| to Class A shares | | | | | | | | |
| Class A | | 14,084 | | 139,280 | | 15,438 | | 153,523 |
| Class B | | (14,084) | | (139,280) | | (15,438) | | (153,523) |
|
| | | | | 0 | | | | 0 |
|
| Payment for shares redeemed | | | | | | | | |
| Class A | | (4,045,627) | | (39,904,613) | | (8,528,675) | | (84,924,438) |
| Class B | | (333,873) | | (3,291,723) | | (430,060) | | (4,282,038) |
| Class C | | (2,745,807) | | (27,092,682) | | (5,925,618) | | (59,018,056) |
| Class I | | (9,505,807) | | (93,682,238) | | (7,497,656) | | (74,585,140) |
|
| | | | | (163,971,256) | | | | (222,809,672) |
|
| Net increase (decrease) in net assets | | | | | | | | |
| resulting from capital share | | | | | | | | |
| transactions | | | | (22,964,879) | | | | 170,713,576 |
|
| Total increase (decrease) in net assets | | | | (31,210,511) | | | | 168,911,520 |
| Net assets | | | | | | | | |
| Beginning of period | | | | 641,281,168 | | | | 472,369,648 |
|
| End of period | | $ 610,070,657 | | $ 641,281,168 |
|
| Undistributed (overdistributed) net | | | | | | | | |
| investment income | | $ | | (506,246) | | $ | | 248,367 |
|
See Notes to Financial Statements
21
NOTES TO FINANCIAL STATEMENTS (unaudited)
1. ORGANIZATION
Evergreen Ultra Short Opportunities Fund (the “Fund”) is a diversified series of Evergreen Fixed Income Trust (the “Trust”), a Delaware statutory trust organized on September 18, 1997. The Trust is an open-end management investment company registered under the Investment Company Act of 1940, as amended (the “1940 Act”).
The Fund offers Class A, Class B, Class C and Institutional (“Class I”) shares. Class A shares are sold with a front-end sales charge. However, Class A share investments of $1 million or more are not subject to a front-end sales charge but will be subject to a contingent deferred sales charge of 1.00% upon redemption within one year. Class B shares are sold without a front-end sales charge but are subject to a contingent deferred sales charge that is payable upon redemption and decreases depending on how long the shares have been held. Class C shares are sold without a front-end sales charge but are subject to a contingent deferred sales charge that is payable upon redemption within one year. Class I shares are sold without a front-end sales charge or contingent deferred sales charge. Each class of shares, except Class I shares, pays an ongoing distribution fee.
2. SIGNIFICANT ACCOUNTING POLICIES
The following is a summary of significant accounting policies consistently followed by the Fund in the preparation of its financial statements. The policies are in conformity with generally accepted accounting principles in the United States of America, which require management to make estimates and assumptions that affect amounts reported herein. Actual results could differ from these estimates.
a. Valuation of investments
Portfolio debt securities acquired with more than 60 days to maturity are fair valued using matrix pricing methods determined by an independent pricing service which takes into consideration such factors as similar security prices, yields, maturities, liquidity and ratings. Securities for which valuations are not readily available from an independent pricing service may be valued by brokers which use prices provided by market makers or estimates of market value obtained from yield data relating to investments or securities with similar characteristics.
Listed equity securities are usually valued at the last sales price or official closing price on the national securities exchange where the securities are principally traded.
Short-term securities with remaining maturities of 60 days or less at the time of purchase are valued at amortized cost, which approximates market value.
Investments in other mutual funds are valued at net asset value. Securities for which market quotations are not readily available or not reflective of current market value are valued at fair value as determined by the investment advisor in good faith, according to procedures approved by the Board of Trustees.
22
NOTES TO FINANCIAL STATEMENTS (unaudited) continued
b. Reverse repurchase agreements
To obtain short-term financing, the Fund may enter into reverse repurchase agreements with banks and other financial institutions, which are deemed by the investment advisor to be creditworthy. At the time the Fund enters into a reverse repurchase agreement, it will establish a segregated account with the custodian containing qualified assets having a value not less than the repurchase price, including accrued interest. If the counterparty to the transaction is rendered insolvent, the Fund may be delayed or limited in the repurchase of the collateral securities.
c. When-issued and delayed delivery transactions
The Fund records when-issued or delayed delivery securities as of trade date and maintains security positions such that sufficient liquid assets will be available to make payment for the securities purchased. Securities purchased on a when-issued or delayed delivery basis are marked-to-market daily and begin earning interest on the settlement date. Losses may occur on these transactions due to changes in market conditions or the failure of counterparties to perform under the contract.
d. Dollar roll transactions
The Fund may enter into dollar roll transactions with respect to mortgage-backed securities. In a dollar roll transaction, the Fund sells mortgage-backed securities to financial institutions and simultaneously agrees to accept substantially similar (same type, coupon and maturity) securities at a later date at an agreed upon price. The Fund will use the proceeds generated from the transactions to invest in short-term investments, which may enhance the Fund’s current yield and total return. The Fund accounts for dollar roll transactions as purchases and sales. The Fund could be exposed to risks if the counterparty defaults on its obligation to perform under the terms of the agreement, if the Fund receives inferior securities in comparison to what was sold to the coun-terparty at redelivery or if there are variances in paydown speed between the mortgage-related pools.
e. Security transactions and investment income
Security transactions are recorded on trade date. Realized gains and losses are computed using the specific cost of the security sold. Interest income is recorded on the accrual basis and includes accretion of discounts and amortization of premiums. Dividend income is recorded on the ex-dividend date.
f. Federal taxes
The Fund intends to continue to qualify as a regulated investment company and distribute all of its taxable income, including any net capital gains (which have already been offset by available capital loss carryovers). Accordingly, no provision for federal taxes is required.
g. Distributions
Distributions to shareholders from net investment income are accrued daily and paid monthly. Distributions from net realized gains, if any, are recorded on the ex-dividend date. Such distributions are determined in conformity with income tax regulations, which may differ from generally accepted accounting principles.
23
NOTES TO FINANCIAL STATEMENTS (unaudited) continued
h. Class allocations
Income, common expenses and realized and unrealized gains and losses are allocated to the classes based on the relative net assets of each class. Distribution fees, if any, are calculated daily at the class level based on the appropriate net assets of each class and the specific expense rates applicable to each class.
3. ADVISORY FEE AND OTHER TRANSACTIONS WITH AFFILIATES
Evergreen Investment Management Company, LLC (“EIMC”), an indirect, wholly-owned subsidiary of Wachovia Corporation (“Wachovia”), is the investment advisor to the Fund and is paid an annual fee starting at 0.40% and declining to 0.25% as average daily net assets increase.
From time to time, EIMC may voluntarily or contractually waive its fee and/or reimburse expenses in order to limit operating expenses. During the six months ended December 31, 2005, EIMC waived its advisory fee in the amount of $100,802 and reimbursed Distribution Plan expenses (see Note 4) relating to Class A shares in the amount of $2,345.
Evergreen Investment Services, Inc. (“EIS”), an indirect, wholly-owned subsidiary of Wachovia, is the administrator to the Fund. As administrator, EIS provides the Fund with facilities, equipment and personnel and is paid an annual rate determined by applying percentage rates to the aggregate average daily net assets of the Evergreen funds (excluding money market funds), starting at 0.10% and declining to 0.05% as the aggregate average daily net assets of the Evergreen funds (excluding money market funds) increase.
Evergreen Service Company, LLC (“ESC”), an indirect, wholly-owned subsidiary of Wachovia, is the transfer and dividend disbursing agent for the Fund. ESC receives account fees that vary based on the type of account held by the shareholders in the Fund.
4. DISTRIBUTION PLANS
EIS also serves as distributor of the Fund’s shares. The Fund has adopted Distribution Plans, as allowed by Rule 12b-1 of the 1940 Act, for each class of shares, except Class I. Under the Distribution Plans, distribution fees are paid at an annual rate of 0.30% of the average daily net assets for Class A shares and 1.00% of the average daily net assets for each of Class B and Class C shares.
For the six months ended December 31, 2005, EIS received $3,758 from the sale of Class A shares and $50,952 and $11,426 in contingent deferred sales charges from redemptions of Class B and Class C shares, respectively.
24
NOTES TO FINANCIAL STATEMENTS (unaudited) continued
5. SECURITIES TRANSACTIONS
Cost of purchases and proceeds from sales of investment securities (excluding short-term securities and mortgage dollar roll transactions) were as follows for the six months ended December 31, 2005:
| Cost of Purchases | | Proceeds from Sales |
|
| | | Non-U.S. | | | | Non-U.S. |
| U.S. Government | | Government | | U.S. Government | | Government |
|
| $ 19,329,067 | | $ 145,293,836 | | $ 32,466,887 | | $ 92,506,721 |
|
On December 31, 2005, the aggregate cost of securities for federal income tax purposes was $658,208,790. The gross unrealized appreciation and depreciation on securities based on tax cost was $1,895,686 and $11,064,879, respectively, with a net unrealized depreciation of $9,169,193.
As of June 30, 2005, the Fund had $2,786,026 in capital loss carryovers for federal income tax purposes with $452,371 expiring in 2012 and $2,333,655 expiring in 2013.
For income tax purposes, capital losses incurred after October 31 within the Fund’s fiscal year are deemed to arise on the first business day of the following fiscal year. As of June 30, 2005, the Fund incurred and elected to defer post-October losses of $1,415,138.
6. INTERFUND LENDING
Pursuant to an Exemptive Order issued by the SEC, the Fund may participate in an interfund lending program with certain funds in the Evergreen fund family. This program allows the Fund to borrow from, or lend money to, other participating funds. During the six months ended December 31, 2005, the Fund did not participate in the interfund lending program.
7. EXPENSE REDUCTIONS
Through expense offset arrangements with ESC and the Fund’s custodian, a portion of fund expenses has been reduced.
8. DEFERRED TRUSTEES’ FEES
Each Trustee of the Fund may defer any or all compensation related to performance of their duties as Trustees. The Trustees’ deferred balances are allocated to deferral accounts, which are included in the accrued expenses for the Fund. The investment performance of the deferral accounts is based on the investment performance of certain Evergreen funds. Any gains earned or losses incurred in the deferral accounts are reported in the Fund’s Trustees’ fees and expenses. At the election of the Trustees, the deferral account will be paid either in one lump sum or in quarterly installments for up to ten years.
9. FINANCING AGREEMENT AND OTHER BORROWINGS
The Fund and certain other Evergreen funds share in a $150 million unsecured revolving credit commitment for temporary and emergency purposes, including the funding of redemptions, as permitted by each participating fund’s borrowing restrictions. Borrowings under this facility bear
25
NOTES TO FINANCIAL STATEMENTS (unaudited) continued
interest at 0.50% per annum above the Federal Funds rate. All of the participating funds are charged an annual commitment fee of 0.09% of the unused balance, which is allocated pro rata. During the six months ended December 31, 2005, the Fund had no borrowings under this agreement.
During the six months ended December 31, 2005, the Fund entered into reverse repurchase agreements with an average daily balance outstanding of $933,633 (on an annualized basis) at a weighted average interest rate of 4.15% and paid interest of $38,743. The maximum amount outstanding under reverse repurchase agreements during the six months ended December 31, 2005 was $9,379,511 (including accrued interest). At December 31, 2005, reverse repurchase agreements outstanding were as follows:
| Repurchase | | | | | | Maturity |
| Amount | | Counterparty | | Interest Rate | | Date |
|
| $6,363,541 | | Deutsche Bank | | 4.38% | | 01/05/2006 |
|
10. REGULATORY MATTERS AND LEGAL PROCEEDINGS
Since September 2003, governmental and self-regulatory authorities have instituted numerous ongoing investigations of various practices in the mutual fund industry, including investigations relating to revenue sharing, market-timing, late trading and record retention, among other things. The investigations cover investment advisors, distributors and transfer agents to mutual funds, as well as other firms. EIMC, EIS and ESC (collectively, “Evergreen”) have received subpoenas and other requests for documents and testimony relating to these investigations, are endeavoring to comply with those requests, and are cooperating with the investigations. Evergreen is continuing its own internal review of policies, practices, procedures and personnel, and is taking remedial action where appropriate.
In connection with one of these investigations, on July 28, 2004, the staff of the Securities and Exchange Commission (“SEC”) informed Evergreen that the staff intends to recommend to the SEC that it institute an enforcement action against Evergreen. The SEC staff’s proposed allegations relate to (i) an arrangement pursuant to which a broker at one of EIMC’s affiliated broker-dealers had been authorized, apparently by an EIMC officer (no longer with EIMC), to engage in short-term trading, on behalf of a client, in Evergreen Mid Cap Growth Fund (formerly Evergreen Emerging Growth Fund and prior to that, known as Evergreen Small Company Growth Fund) during the period from December 2000 through April 2003, in excess of the limitations set forth in the fund’s prospectus, (ii) short-term trading from September 2001 through January 2003, by a former Evergreen portfolio manager, of Evergreen Precious Metals Fund, a fund he managed at the time, (iii) the sufficiency of systems for monitoring exchanges and enforcing exchange limitations as stated in the fund’s prospectuses, and (iv) the adequacy of e-mail retention practices. In connection with the activity in Evergreen Mid Cap Growth Fund, EIMC reimbursed the fund $378,905, plus an additional $25,242, representing what EIMC calculated at that time to be the client’s net gain and the fees earned by EIMC and the expenses incurred by this fund on the client’s account. In connection with the activity in Evergreen
26
NOTES TO FINANCIAL STATEMENTS (unaudited) continued
Precious Metals Fund, EIMC reimbursed the fund $70,878, plus an additional $3,075, representing what EIMC calculated at that time to be the portfolio manager’s net gain and the fees earned by EIMC and expenses incurred by the fund on the portfolio manager’s account. Evergreen is currently engaged in discussions with the staff of the SEC concerning its recommendation.
The staff of the National Association of Securities Dealers (“NASD”) had notified EIS that it has made a preliminary determination to recommend that disciplinary action be brought against EIS for certain violations of the NASD’s rules. The recommendation relates principally to allegations that EIS (i) arranged for fund portfolio trades to be directed to broker-dealers (including Wachovia Securities, LLC, an affiliate of EIS) that sold Evergreen fund shares during the period of January 2001 to December 2003 and (ii) provided non-cash compensation by sponsoring offsite meetings attended by Wachovia Securities, LLC brokers during that period. EIS is cooperating with the NASD staff in its review of these matters.
Any resolution of these matters with regulatory authorities may include, but not be limited to, sanctions, penalties or injunctions regarding Evergreen, restitution to mutual fund shareholders and/or other financial penalties and structural changes in the governance or management of Evergreen’s mutual fund business. Any penalties or restitution will be paid by Evergreen and not by the Evergreen funds.
In addition, the Evergreen funds and EIMC and certain of its affiliates are involved in various legal actions, including private litigation and class action lawsuits. EIMC does not expect that any of such legal actions currently pending or threatened will have a material adverse impact on the financial position or operations of any of the Evergreen funds or on EIMC’s ability to provide services to the Evergreen funds.
Although Evergreen believes that neither the foregoing investigations nor any pending or threatened legal actions will have a material adverse impact on the Evergreen funds, there can be no assurance that these matters and any publicity surrounding or resulting from them will not result in reduced sales or increased redemptions of Evergreen fund shares, which could increase Evergreen fund transaction costs or operating expenses, or have other adverse consequences on the Evergreen funds.
27
ADDITIONAL INFORMATION (unaudited)
INFORMATION ABOUT THE REVIEW AND APPROVAL OF THE FUND’S INVESTMENT
ADVISORY AGREEMENT
Each year, the Fund’s Board of Trustees is required to consider whether to continue in place the Fund’s investment advisory agreement. In September 2005, the Trustees, including a majority of the Trustees who are not interested persons (as that term is defined in the 1940 Act) of the Fund or of EIMC, approved the continuation of the Fund’s investment advisory agreement.
At the same time, the Trustees considered the continuation of the investment advisory agreements for all of the Evergreen funds, and the description below refers in many cases to the Trustees’ process and conclusions in connection with their consideration of this matter for all of the Evergreen funds. In all of its deliberations, the Board of Trustees and the disinterested Trustees were advised by independent counsel to the disinterested Trustees and counsel to the Evergreen funds.
The review process. The 1940 Act requires that the Board of Trustees request and evaluate, and that EIMC furnish, such information as may reasonably be necessary to evaluate the terms of the Fund’s advisory agreement. The review process began formally in spring 2005, when a committee of the Board (the “Committee”), working with EIMC management, determined generally the types of information the Board would review and set a timeline for the review process. In late spring, counsel to the disinterested Trustees sent to EIMC a formal request for information to be furnished to the Trustees. In addition, the independent data provider Lipper Inc. (“Lipper”) was engaged to provide fund-specific and industry-wide data to the Board containing information of a nature and in a format generally prescribed by the Committee.
The Trustees reviewed EIMC’s responses to the request for information, with the assistance of counsel for the disinterested Trustees and for the Evergreen funds and an independent industry consultant retained by the disinterested Trustees, and requested and received additional information following that review. The Committee met in person with the representatives of EIMC in early September. At a meeting of the full Board of Trustees later in September, the Committee reported the results of its discussions with EIMC, and the full Board met with representatives of EIMC, engaged in further review of the materials provided to them, and approved the continuation of each of the advisory and sub-advisory agreements.
The disinterested Trustees discussed the continuation of the Fund’s advisory agreement with representatives of EIMC and in multiple private sessions with legal counsel at which no personnel of EIMC were present. In considering the continuation of the agreement, the Trustees did not identify any particular information or consideration that was all-important or controlling, and each Trustee attributed different weights to various factors. The Trustees evaluated information provided to them both in terms of the Evergreen mutual funds generally and with respect to the Fund specifically as they considered appropriate; although the Trustees considered the continuation of the agreement as part of the larger process of considering the continuation of the advisory contracts for all of the Evergreen funds, their determination to continue the advisory agreement for each of the Evergreen funds was ultimately made on a fund-by-fund basis.
28
ADDITIONAL INFORMATION (unaudited) continued
This summary describes the most important, but not necessarily all, of the factors considered by the Board and the disinterested Trustees.
Information reviewed. The Board of Trustees and committees of the Board of Trustees meet periodically during the course of the year. At those meetings, the Board receives a wide variety of information regarding the services performed by EIMC, the investment performance of the Fund and the other Evergreen funds, and other aspects of the business and operations of the Evergreen funds. At those meetings, and in the process of considering the continuation of the agreements, the Trustees considered information regarding, for example, the Fund’s investment results; the portfolio management team for the Fund and the experience of the members of that team, and any recent changes in the membership of the team; portfolio trading practices; compliance by the Fund and EIMC with applicable laws and regulations and with the Fund’s and EIMC’s compliance policies and procedures; services provided by affiliates of EIMC to the Fund and shareholders of the Fund; and other information relating to the nature, extent, and quality of services provided by EIMC. The Trustees considered the rates at which the Fund pays investment advisory fees, the total expense ratio of the Fund, and the efforts generally by EIMC and its affiliates as sponsors of the Fund. The Board also considered information regarding the rates at which other clients of EIMC or its affiliates pay advisory fees for comparable services. The data provided by Lipper showed the fees paid by the Fund and the Fund’s total expense ratio in comparison to other similar mutual funds, in addition to data regarding the investment performance by the Fund in comparison to other similar mutual funds. The Trustees also considered information regarding the investment performance of other investment accounts managed by EIMC and its affiliates with comparable investment programs to those of one or more funds. The Trustees were assisted by the independent industry consultant in reviewing the information presented to them.
The Board also considered that EIS serves as administrator to the Fund and receives a fee for its services as administrator. In their comparison of the advisory fee paid by the Fund with those paid by other mutual funds, the Board took into account administrative fees paid by the Fund and those other mutual funds. The Board considered that affiliates of EIMC serve as transfer agent and distributor to the Fund and receive fees from the Fund for those services, and received information regarding recent reductions in the transfer agency fees paid by the Fund. They considered other so-called “fall-out” benefits to EIMC and its affiliates due to their other relationships with the Evergreen funds, including, for example, soft-dollar services received by EIMC attributable to transactions entered into by EIMC for the benefit of the Evergreen funds and brokerage commissions received by Wachovia Securities LLC, an affiliate of EIMC, from transactions effected by it for the Evergreen funds.
Nature and quality of the services provided. The Trustees considered that EIMC and its affiliates provide a comprehensive investment management service to the Fund. They noted that EIMC formulates and implements an investment program for the Fund. They noted that EIMC makes its personnel available to serve as officers of the Evergreen funds, and concluded that the reporting and management functions provided by EIMC with respect to the Fund and the Evergreen funds overall were generally satisfactory. The Trustees considered the investment
29
ADDITIONAL INFORMATION (unaudited) continued
philosophy of the Fund’s portfolio management team, and considered the in-house research capabilities of EIMC and its affiliates, as well as other resources available to EIMC, including research services available to it from third parties. The Board considered the managerial and financial resources available to EIMC, and the commitment that the Wachovia organization has made to the Fund and the Evergreen funds generally. On the basis of these factors, they determined that the nature and scope of the services provided by EIMC were consistent with their duties under the investment advisory agreements and appropriate and consistent with the investment programs and best interests of the Fund.
The Trustees noted the commitment and resources EIMC and its affiliates have committed to the regulatory, compliance, accounting, tax and tax reporting, and shareholder servicing functions, and the number and quality of staff committed to those functions, which they concluded were appropriate and generally in line with EIMC’s responsibilities to the Fund and to the Evergreen funds generally. They noted that EIMC had enhanced a number of these functions in recent periods and continued to do so, in light of regulatory developments in the investment management and mutual fund industries generally and in light of regulatory matters involving EIMC and its affiliates. They concluded that those enhancements appeared generally appropriate, but considered that the enhancement process is an on-going one and determined to continue to monitor developments in these functions in coming periods for appropriateness and consistency with regulatory and industry developments. The Board and the disinterested Trustees concluded, within the context of their overall conclusions regarding the Fund’s advisory agreement, that they were satisfied with the nature, extent, and quality of the services provided by EIMC, including services provided by EIS under its administrative services agreement with the Fund.
Investment performance. The Trustees considered the investment performance of each of the Evergreen funds, both by comparison to other comparable mutual funds and to broad market indices. The Trustees emphasized that the continuation of the investment advisory agreement for an Evergreen fund should not be taken as any indication that the Trustees did not believe investment performance for any specific fund might not be improved, and they noted that they would continue to monitor closely the investment performance of the Evergreen funds going forward. Specifically with respect to the Fund, the Trustees noted that the Class A shares of the Fund performed at the top of the first quintile over the recently completed one-year period.
Advisory and administrative fees. The Trustees recognized that EIMC does not seek to provide the lowest cost investment advisory service, but to provide a high quality, full-service investment management product at a reasonable price. They also noted that EIMC has generally attempted to make its investment advisory fees consistent with industry norms. The Trustees noted that, from the materials presented, it appeared that the combination of investment advisory and administrative fees paid by the Fund to EIMC and EIS with respect to Class A shares was above the median of fees paid by comparable funds.
The Trustees considered information regarding the fees paid to EIMC by other clients, including, where applicable, mutual funds advised by EIMC or an affiliate, or private accounts or pools managed by EIMC. Fees charged by EIMC to those other clients were generally lower than those
30
ADDITIONAL INFORMATION (unaudited) continued
charged to the Fund. EIMC explained that compliance, reporting, and other legal burdens of providing investment advice to mutual funds exceed those required to provide advisory services to non-mutual fund clients such as retirement or pension plans. In addition, EIMC pointed out that there is substantially greater legal and other risk to EIMC and its affiliates from managing public mutual funds than in managing private accounts. The Trustees also considered the investment performance of those other accounts managed by EIMC and its affiliates and noted that the composite for those other accounts, computed on a gross basis compared with the Fund’s gross return, was lower than the investment return of the Fund.
Economies of scale. The Trustees noted that economies of scale would likely be achieved by EIMC in managing the Evergreen funds as the funds grow. The Trustees noted that the Fund had implemented breakpoints in its advisory fee structure. The Trustees undertook to continue to review the appropriate levels of breakpoints in the future, but concluded that the breakpoints as implemented appeared to be a reasonable step toward the realization of economies of scale by the Fund.
Profitability. The Trustees considered information provided to them regarding the profitability to the EIMC organization of the investment advisory, administration, and transfer agency fees paid to EIMC and its affiliates by each of the Evergreen funds. They considered that the information provided to them was necessarily estimated. They noted that the levels of profitability of the Evergreen funds to EIMC varied widely, depending on among other things the size and type of fund. They noted that all of the estimates provided to them were calculated on a pre-tax basis. They considered the profitability of the Evergreen funds in light of such factors as, for example, the information they had received regarding the relation of the fees paid by the Evergreen funds to those paid by other mutual funds, the investment performance of the Evergreen funds, and the amount of revenues involved. In light of these factors, the Trustees did not consider that the profitability of any of the Evergreen funds, individually or in the aggregate, was such as to prevent their approving the continuation of the agreements.
In connection with their review of the Fund’s investment advisory and administrative fees, the Trustees also considered the transfer agency fees paid by the Evergreen funds to an affiliate of EIMC. They reviewed information presented to them showing generally that the transfer agency fees charged to the Evergreen funds were generally consistent with industry norms, and that transfer agency fees for a number of Evergreen funds had recently declined, or were expected to in the near future.
31
TRUSTEES AND OFFICERS
TRUSTEES1
| Charles A. Austin III | | Investment Counselor, Anchor Capital Advisors, Inc. (investment advice); Director, The Andover |
| Trustee | | Companies (insurance); Trustee, Arthritis Foundation of New England; Former Director, The |
| DOB: 10/23/1934 | | Francis Ouimet Society; Former Trustee, Mentor Funds and Cash Resource Trust; Former |
| Term of office since: 1991 | | Investment Counselor, Appleton Partners, Inc. (investment advice); Former Director, Executive |
| Other directorships: None | | Vice President and Treasurer, State Street Research & Management Company (investment |
| | | advice) |
|
| |
| Shirley L. Fulton | | Partner, Tin, Fulton, Greene & Owen, PLLC (law firm); Former Partner, Helms, Henderson & |
| Trustee | | Fulton, P.A. (law firm); Retired Senior Resident Superior Court Judge, 26th Judicial District, |
| DOB: 1/10/1952 | | Charlotte, NC |
| Term of office since: 2004 | | |
| Other directorships: None | | |
|
| |
| K. Dun Gifford | | Chairman and President, Oldways Preservation and Exchange Trust (education); Trustee, |
| Trustee | | Treasurer and Chairman of the Finance Committee, Cambridge College; Former Trustee, Mentor |
| DOB: 10/23/1938 | | Funds and Cash Resource Trust |
| Term of office since: 1974 | | |
| Other directorships: None | | |
|
| |
| Dr. Leroy Keith, Jr. | | Partner, Stonington Partners, Inc. (private equity fund); Trustee, Phoenix Funds Family; Director, |
| Trustee | | Diversapack Co.; Director, Obagi Medical Products Co.; Former Director, Lincoln Educational |
| DOB: 2/14/1939 | | Services; Former Trustee, Mentor Funds and Cash Resource Trust |
| Term of office since: 1983 | | |
| Other directorships: Trustee, The | | |
| Phoenix Group of Mutual Funds | | |
|
| |
| Gerald M. McDonnell | | Manager of Commercial Operations, SMI Steel Co. – South Carolina (steel producer); Former |
| Trustee | | Sales and Marketing Manager, Nucor Steel Company; Former Trustee, Mentor Funds and Cash |
| DOB: 7/14/1939 | | Resource Trust |
| Term of office since: 1988 | | |
| Other directorships: None | | |
|
| |
| William Walt Pettit | | Vice President, Kellam & Pettit, P.A. (law firm); Director, Superior Packaging Corp.; Director, |
| Trustee | | National Kidney Foundation of North Carolina, Inc.; Former Trustee, Mentor Funds and Cash |
| DOB: 8/26/1955 | | Resource Trust |
| Term of office since: 1984 | | |
| Other directorships: None | | |
|
| |
| David M. Richardson | | President, Richardson, Runden LLC (executive recruitment business development/consulting |
| Trustee | | company); Consultant, Kennedy Information, Inc. (executive recruitment information and |
| DOB: 9/19/1941 | | research company); Consultant, AESC (The Association of Executive Search Consultants); |
| Term of office since: 1982 | | Director, J&M Cumming Paper Co. (paper merchandising); Former Trustee, NDI Technologies, LLP |
| Other directorships: None | | (communications); Former Trustee, Mentor Funds and Cash Resource Trust |
|
| |
| Dr. Russell A. Salton III | | President/CEO, AccessOne MedCard; Former Medical Director, Healthcare Resource Associates, |
| Trustee | | Inc.; Former Medical Director, U.S. Health Care/Aetna Health Services; Former Trustee, Mentor |
| DOB: 6/2/1947 | | Funds and Cash Resource Trust |
| Term of office since: 1984 | | |
| Other directorships: None | | |
|
32
TRUSTEES AND OFFICERS continued
| Michael S. Scofield | | Director and Chairman, Branded Media Corporation (multi-media branding company); Attorney, |
| Trustee | | Law Offices of Michael S. Scofield; Former Trustee, Mentor Funds and Cash Resource Trust |
| DOB: 2/20/1943 | | |
| Term of office since: 1984 | | |
| Other directorships: None | | |
|
| |
| Richard J. Shima | | Independent Consultant; Trustee, Saint Joseph College (CT); Director, Hartford Hospital; Trustee, |
| Trustee | | Greater Hartford YMCA; Former Director, Trust Company of CT; Former Director, Enhance |
| DOB: 8/11/1939 | | Financial Services, Inc.; Former Director, Old State House Association; Former Trustee, Mentor |
| Term of office since: 1993 | | Funds and Cash Resource Trust |
| Other directorships: None | | |
|
| |
| Richard K. Wagoner, CFA2 | | Member and Former President, North Carolina Securities Traders Association; Member, Financial |
| Trustee | | Analysts Society; Former Consultant to the Boards of Trustees of the Evergreen funds; Former |
| DOB: 12/12/1937 | | Trustee, Mentor Funds and Cash Resource Trust |
| Term of office since: 1999 | | |
| Other directorships: None | | |
|
| |
| |
| OFFICERS | | |
| |
| Dennis H. Ferro3 | | Principal occupations: President and Chief Executive Officer, Evergreen Investment Company, |
| President | | Inc. and Executive Vice President, Wachovia Bank, N.A.; former Chief Investment Officer, |
| DOB: 6/20/1945 | | Evergreen Investment Company, Inc. |
| Term of office since: 2003 | | |
|
| |
| Kasey Phillips4 | | Principal occupations: Senior Vice President, Evergreen Investment Services, Inc.; Former Vice |
| Treasurer | | President, Evergreen Investment Services, Inc.; Former Assistant Vice President, Evergreen |
| DOB: 12/12/1970 | | Investment Services, Inc. |
| Term of office since: 2005 | | |
|
| |
| Michael H. Koonce4 | | Principal occupations: Senior Vice President and General Counsel, Evergreen Investment |
| Secretary | | Services, Inc.; Senior Vice President and Assistant General Counsel, Wachovia Corporation |
| DOB: 4/20/1960 | | |
| Term of office since: 2000 | | |
|
| |
| James Angelos4 | | Principal occupations: Chief Compliance Officer and Senior Vice President, Evergreen Funds; |
| Chief Compliance Officer | | Former Director of Compliance, Evergreen Investment Services, Inc. |
| DOB: 9/2/1947 | | |
| Term of office since: 2004 | | |
|
1 Each Trustee serves until a successor is duly elected or qualified or until his/her death, resignation, retirement or removal from office. Each Trustee oversees 90 Evergreen funds. Correspondence for each Trustee may be sent to Evergreen Board of Trustees, P.O. Box 20083, Charlotte, NC 28202.
2 Mr. Wagoner is an “interested person” of the Fund because of his ownership of shares in Wachovia Corporation, the parent to the Fund’s investment advisor.
3 The address of the Officer is 401 S. Tryon Street, 20th Floor, Charlotte, NC 28288.
4 The address of the Officer is 200 Berkeley Street, Boston, MA 02116.
Additional information about the Fund’s Board of Trustees and Officers can be found in the Statement of Additional Information (SAI) and is available upon request without charge by calling 800.343.2898.
33
568639 rv2 2/2006
Item 2 - Code of Ethics
Not required for this semi-annual filing.
Item 3 - Audit Committee Financial Expert
Not required for this semi-annual filing.
Items 4 – Principal Accountant Fees and Services
Not required for this semi-annual filing.
Items 5 – Audit Committee of Listed Registrants
Not applicable.
Item 6 – Schedule of Investments
Please see schedule of investments contained in the Report to Stockholders included under Item 1 of this Form N-CSR.
Item 7 – Disclosure of Proxy Voting Policies and Procedures for Closed-End Management Investment Companies.
Not applicable.
Item 8 – Portfolio Managers of Closed-End Management Investment Companies.
Not applicable.
Item 9 – Purchases of Equity Securities by Closed-End Management Investment Company and Affiliated Purchasers.
Not applicable.
Item 10 – Submission of Matters to a Vote of Security Holders
There have been no material changes to the procedures by which shareholders may recommend nominees to the Registrant’s board of trustees that have been implemented since the Registrant last provided disclosure in response to the requirements of this Item.
Item 11 - Controls and Procedures
(a) The Registrant's principal executive officer and principal financial officer have evaluated the Registrant's disclosure controls and procedures (as defined in Rule 30a-3(c) under the Investment Company Act of 1940) within 90 days of this filing and have concluded that the Registrant's disclosure controls and procedures were effective, as of that date, in ensuring that information required to be disclosed by the Registrant in this Form N-CSR was recorded, processed, summarized, and reported timely.
(b) There has been no changes in the Registrant's internal controls over financial reporting (as defined in Rule 30a-3(d) under the Investment Company Act of 1940) that occurred during the second fiscal quarter of the period covered by this report that has materially affected, or is reasonable likely to affect, the Registrant’s internal control over financial reporting .
Item 12 - Exhibits
File the exhibits listed below as part of this Form. Letter or number the exhibits in the sequence indicated.
(a) Any code of ethics, or amendment thereto, that is the subject of the disclosure required by Item 2, to the extent that the Registrant intends to satisfy the Item 2 requirements through filing of an exhibit.
(b)(1) Separate certifications for the Registrant's principal executive officer and principal financial officer, as required by Section 302 of the Sarbanes-Oxley Act of 2002 and Rule 30a-2(a) under the Investment Company Act of 1940, are attached as EX99.CERT.
(b)(2) Separate certifications for the Registrant's principal executive officer and principal financial officer, as required by Section 1350 of Title 18 of United States Code, as adopted pursuant to Section 906 of the Sarbanes-Oxley Act of 2002, and Rule 30a-2(b) under the Investment Company Act of 1940, are attached as EX99.906CERT. The certifications furnished pursuant to this paragraph are not deemed to be "filed" for purposes of Section 18 of the Securities Exchange Act of 1934, or otherwise subject to the liability of that section. Such certifications are not deemed to be incorporated by reference into any filing under the Securities Act of 1933 or the Securities Exchange Act of 1934, except to the extent that the Registrant specifically incorporates them by reference.
Pursuant to the requirements of the Securities Exchange Act of 1934 and the Investment Company Act of 1940, the Registrant has duly caused this report to be signed on its behalf by the undersigned, thereunto duly authorized.
Evergreen Fixed Income Trust
By: _______________________
Dennis H. Ferro,
Principal Executive Officer
Date: March 6, 2006
Pursuant to the requirements of the Securities Exchange Act of 1934 and the Investment Company Act of 1940, this report has been signed below by the following persons on behalf of the Registrant and in the capacities and on the dates indicated.
By: _______________________
Dennis H. Ferro,
Principal Executive Officer
Date: March 6, 2006
By: ________________________
Kasey Phillips,
Principal Financial Officer
Date: March 6, 2006